Embed Size (px)
Citation preview

ORIGINAL PAPER
Rural avenues as dispersal corridors for the vulnerable saproxylicbeetle Elater ferrugineus in a fragmented agricultural landscape
Andrzej Oleksa1• Igor J. Chybicki1 • Mattias C. Larsson2
•
Glenn P. Svensson3• Robert Gawronski4
Received: 7 November 2014 / Accepted: 14 May 2015
� The Author(s) 2015. This article is published with open access at Springerlink.com
Abstract Understanding factors that limit gene flow
through the landscape is crucial for conservation of or-
ganisms living in fragmented habitats. We analysed pat-
terns of gene flow in Elater ferrugineus, an endangered
click beetle living in old-growth, hollow trees in a network
of rural avenues surrounded by inhospitable arable land.
Using amplified fragment length polymorphism (AFLP)
data, we aimed to evaluate if the landscape features im-
portant for the beetle’s development are also important for
its dispersal. By dividing the sampling area into 30 9 30 m
cells, with each cell categorised into one of four classes
according to its putative permeability for dispersing bee-
tles, and by correlating matrices of genetic and landscape
resistance distances, we evaluated which of the landscape
models had the best fit with the observed kinship structure.
Significant correlations between genetic and Euclidean
distances were detected, which indicated that restricted
dispersal is the main constraint driving differentiation be-
tween populations of E. ferrugineus. Out of 81 landscape
models in total, 54 models yielded significantly weaker
correlation between matrices of pairwise kinship and ef-
fective distances than the null model. Regression analysis
pointed to avenues as having the highest and positive im-
pact on the concordance between matrices of kinship and
landscape distances, while open arable land had the op-
posite effect. Our study thus shows that tree avenues can
function as efficient dispersal corridors for E. ferrugineus,
highlighting the importance of saving such avenues to in-
crease the connectivity among suitable habitat patches,
thereby reducing the risk of local extinctions of E. fer-
rugineus as well as other saproxylic organisms.
Keywords Isolation-by-resistance � Isolation-by-
distance � Gene flow � Landscape genetics � Spatial genetic
structure
Introduction
Habitat fragmentation, with its often detrimental genetic
consequences, is considered one of the greatest threats to
biodiversity (Fahrig 2003). The task of maintaining bio-
diversity is especially challenging in modern agricultural
landscapes, where most of the available space has been
occupied for cultivation of crops and infrastructure related
to this activity (Batary et al. 2011). Only a minor surface in
such landscapes (mainly on field borders and road verges)
is not converted into arable land and can support flora and
fauna (Dover et al. 2000; Ouin and Burel 2002; Walker
et al. 2006; Ockinger and Smith 2006; Skorka et al. 2013).
Unfortunately, the probability of local extinction increases
as patch area decreases and the probability of colonization
decreases as patch connectivity decreases (Moilanen and
Hanski 1998). Therefore, the main challenges facing con-
servation biology in agricultural areas are to maintain the
Electronic supplementary material The online version of thisarticle (doi:10.1007/s10841-015-9778-1) contains supplementarymaterial, which is available to authorized users.
& Andrzej Oleksa
1 Department of Genetics, Kazimierz Wielki University,
Chodkiewicza 30, 85-064 Bydgoszcz, Poland
2 Department of Crop Protection Biology, Swedish University
of Agricultural Sciences, PO Box 102, 230 53 Alnarp,
Sweden
3 Department of Biology, Lund University, 223 62 Lund,
Sweden
4 Kasprowicza 8, 14-300 Morag, Poland
123
J Insect Conserv
DOI 10.1007/s10841-015-9778-1

quality of existing habitat patches and to increase the
connectivity between patches through the creation of eco-
logical corridors (Barrett and Peles 1994). Designing ef-
fective systems of ecological corridors, however, requires
an understanding about how the landscape structure affects
the movement of individuals of different species (Dover
and Settele 2009; Spear et al. 2010). Habitat corridors are
generally believed to increase dispersal, i.e. the exchange
of individuals (and genes) between isolated demes
(Tewksbury et al. 2002). Nonetheless, empirical data and
methods to analyse which structural characteristics of the
agricultural landscape could affect its connectivity are
needed for different organisms. Evaluation of landscape
features important for dispersal in a particular animal
species can be achieved by examination of how the land-
scape configuration translates into movement of indi-
viduals. Since it is difficult to measure dispersal directly at
large spatial scales, genetic data are often used instead
(Lowe and Allendorf 2010). It should be noted however
that genetic methods only allow the measurement of ef-
fective dispersal, i.e. those dispersal events that contribute
to gene flow (Guerriero et al. 2011). The influence of
landscape structure on effective dispersal could be deter-
mined by developing resistance surfaces—spatial models,
in which specific landscape features are translated into
likely costs of dispersal for the organism under study
(Spear et al. 2010; Zeller et al. 2012; Baguette et al. 2013).
Habitat models can be used to calculate the among-indi-
viduals distances corrected for dispersal costs (the so-
called ‘effective distances’), and tested by correlating cal-
culated distances with genetic similarity between indi-
viduals (Spear et al. 2010).
For measurement of effective distances, a variety of
methods have been proposed (see Kool et al. 2012 for
a review). Straight-line distance, the simplest measure of
the cost of movement between two individuals or sampling
sites, does not consider how landscape constraints affect
the movement of an organism. Since elements in a land-
scape mosaic may differ in their resistance to movement,
measures taking into account diversified viscosity of the
different landscape components seem to be superior.
Among them, the isolation-by-resistance approach, based
on the theory of electrical circuits and graph theory
(Chandra et al. 1996; McRae 2006), is gaining increasing
popularity. This approach takes into account the effect of
all alternative pathways between habitat patches, which is
especially appropriate when the specific aim is to assess
gene flow across a landscape over many generations.
Several studies indicated that resistance distances may al-
low for better assessment of genetic isolation-by-distance
than the usual Euclidean or least-cost-path distance be-
cause the metric is based on assumptions about the impact
of many alternative routes in the entire landscape on the
dispersal of individuals, and consequently on the chances
of gene flow (McRae and Beier 2007; Schwartz et al. 2009;
Lozier et al. 2013). Despite the theoretical superiority of
isolation-by-resistance approach over distance measures
assuming a single optimal path, the performance of the
these approaches have rarely been evaluated with empirical
data sets at finer spatial scales (Row et al. 2010).
In this work, we aimed to assess the impact of
habitat continuity on dispersal and gene flow of Elater
ferrugineus—an endangered beetle associated with old-
growth, hollow trees, using Amplified Fragment Poly-
morphism (AFLP, Vos et al. 1995) data. In agricultural
landscapes of Europe, the species often inhabits avenues
(i.e. rows of trees planted along roads) and other tree
habitats (village parks, wood pastures or remnant forest
patches), being dependent mainly on larger trees (Musa
et al. 2013). Therefore, E. ferrugineus could serve as an
umbrella species for protection of old-growth trees and
their associated fauna of saproxylic organsims (Andersson
et al. 2014). As yet it is not known whether this species,
being extremely dependent on old-growth trees, is able to
disperse through treeless areas. The study was designed to
cope with this question by assessing genetic relatedness of
beetles and comparing it with effective distances in the
landscape, i.e. the distances corrected in terms of costs
resulting from the movement between habitat patches in
the landscape. We expected that the observed gene flow at
the landscape level could be better explained by landscape
resistance distances than simple Euclidian distances.
Up to now little is known about the population genetics
of E. ferrugineus, partly due to the cryptic nature of this
species. We hypothesised that, given habitat fragmentation
at the landscape level, both genetic drift and restricted
dispersal can take place in the study species, causing, in
turn, population substructuring. We expect that our results
will shed light on the dispersal and population biology of
E. ferrugineus and provide effective conservation strategies
for this threatened beetle.
Materials and methods
Studied species
The red click beetle E. ferrugineus Linnaeus, 1758, is one
of the largest of the Central European click beetles (family
Elateridae). It develops in the hollows of old, deciduous
trees, which are inhabited by larvae of scarab beetles, such
as species of the genera Osmoderma, Protaetia and
Gnorimus (Burakowski et al. 1985). Larval E. ferrugineus
are facultatively carnivorous. It is believed that their main
prey are larvae of the large scarabs listed above, given that
adult E. ferrugineus are attracted by the sex pheromone of
J Insect Conserv
123

Osmoderma (kairomone effect, Svensson et al. 2004;
Larsson and Svensson 2009). However, larvae can also
feed on wood mould alone (Tolasch et al. 2007). As a
result of massive habitat loss during the last centuries,
E. ferrugineus is today considered a rare and vulnerable
species throughout its distribution (Nieto and Alexander
2010), which ranges from Spain to the Caucasus and from
Italy to the south of Sweden. In Poland the red click beetle
is protected by national law and placed in the red book of
animals and on the red list of endangered species as vul-
nerable (Pawłowski et al. 2002). Before the pheromone
lures became available for monitoring (Tolasch et al. 2007;
Svensson and Larsson 2008; Svensson et al. 2011) it was
considered extremely rare. Much of the available data on
the occurrence of E. ferrugineus in Poland concerns the
nineteenth and first half of the twentieth century (Bu-
rakowski et al. 1985). Over the last 50 years this species
has been recorded from only about 25 localities (Buchholz
and Ossowska 2004). Recently, rural avenues were rec-
ognized as the most important habitat for this highly pro-
tected species in Poland (Oleksa et al. unpubl.) which may
be valid also for other European countries. Due to the ease
of pheromone trapping (Kadej et al. 2015), E. ferrugineus
has the potential to become a convenient umbrella species
for the rich community of saproxylic species, i.e. organ-
isms dependent on dead wood habitats (Andersson et al.
2014).
Area under study
The study was conducted in the municipality of Rychliki in
northern Poland (Warmia and Masuria Province, N53� 590
E19� 310, Figure 1). Due to fertile soils, the landscape of
the area under study is dominated by farmland, occupying
74 % of the surface. Forests cover only 17 % of the area,
which is significantly lower than the Polish national aver-
age (29 %). Woodlands are retained mainly in gorges and
swamps, which are difficult to cultivate. Forests are usually
composed of deciduous species, mainly beech Fagus
sylvatica, oak Quercus robur, hornbeam Carpinus betulus
and—on wet soils—alder Alnus glutinosa. In the studied
area, due to intensive management, most forest trees are
too young to be a suitable habitat for E. ferrugineus. De-
spite the high share of farmland in the general area of the
municipality and the young age of the forests, the organ-
isms associated with old trees have numerous suitable
habitats in the form of roadside avenues of trees and village
parks. The avenue network was established in the form
similar to the present day in the eighteenth and nineteenth
centuries, as shown by maps from that period (von
Schrotter 1812). After a habitat inventory in the summer
2011 (Oleksa A., unpublished), we recognized ca. 70 km
of rural avenues as suitable habitat for E. ferrugineus and
its main prey Osmoderma barnabita. We also found ca.
1500 hollow and thick (DBH C 60 cm) trees potentially
inhabited by both species.
Sampling of beetles for molecular analyses
For DNA sampling, beetles were caught with pheromone
traps (Tolasch et al. 2007) in the summer 2011. Since the
pheromone is attractive only for males, only beetles of this
sex were included in the study. Self-made traps baited with
the pheromone (Figure 2) were fixed to branches of trees at
3–5 m above ground. Due to the very fast response of
males to pheromone exposure and to avoid attracting
beetles from long distances, traps were exposed for no
more than 1.5 h at a site. At one time, a series of 20 traps
were set along a road at 250–500 m intervals (depending
on tree density). After checking and emptying the traps,
they were moved to the next road section. All catches were
conducted during the day (between 11:00 and 18:00), in
fine weather (air temperature [20 �C, no rainfall). Sam-
pling covered the entire territory of the municipality of
Rychliki, where beetles were trapped in places with
abundant mature trees, i.e. along tree-lined roads (av-
enues). A simulation study by Oyler-McCance et al. (2013)
found that linear and systematic sampling regimes per-
formed well in order to detect the effects of landscape
pattern on gene flow.
For collection of beetle tissue, the tarsus of one middle
leg was cut off with scissors and stored in absolute ethanol.
After amputation of tarsi, the beetles were released on the
vegetation close to the pheromone trap they were captured
in. Altogether, samples from 287 beetles were collected
and stored at -20 �C until DNA extraction.
DNA extraction and AFLP genotyping
Genomic DNA was extracted using the Insect Easy DNA
Kit (EZNA) (Omega Bio-Tek, Norcross, GA, USA) fol-
lowing the manufacturer’s protocol. The AFLP analysis
followed the original protocol by Vos et al. (1995).
Restriction-ligation reactions were carried out in a total
volume of 10 ll. A single reaction contained 500 ng of
genomic DNA, 5 U EcoRI (MBI Fermentas, Vilnius,
Lithuania) and 5 U TruI (MseI isoschizomer) (Fermentas),
1.5 U T4 DNA Ligase (Fermentas), 19 T4 DNA Ligase
buffer (Fermentas), 0.05 % BSA, 50 mM NaCl, 0.5 pmol/
ll E-Adaptor and 5 pmol/ll M-Adaptor. Reactions were
carried out at room temperature overnight and then diluted
59 with H2O in order to obtain PCR matrices (pre-matrix
DNA) for pre-selective amplification. Pre-selective ampli-
fications were carried out in 10 ll total volume. A pre-
selective PCR mixture contained 2 ll pre-matrix DNA,
J Insect Conserv
123
19 Qiagen Master Mix (Qiagen Taq PCR Master Mix Kit;
Qiagen, Hilden, Germany), 0.5 lM E-primer (E ? A) and
0.5 lM M-primer (M ? C). Amplification was carried out
using the following program: 72 �C for 2 min, 20 cycles of
94 �C for 20 s, 56 �C for 30 s and 72 �C for 2 min, and
finally 60 �C for 30 min. A product of pre-selective PCR
was diluted 20 times in order to obtain a PCR matrix for
selective amplification (sel-matrix DNA).
Selective amplification was carried out in 10 ll total vol-
umes, consisting of 3 ll sel-matrix DNA, 19 Qiagen Master
Mix, 0.5 lM FAM-labelled E-primer (E ? ACA or E ?
ACG) and 0.5 lM M-primer (M ? CAC or M ? CAG).
Three combinations of primers were used: E_ACA 9
M_CAC, E_ACA 9 M_CAG, E_ACG 9 M_CAC. PCR
reaction was performed with the following program: 94 �C for
2 min, 10 cycles of 94 �C for 20 s, 66 �C (-1� per cycle) for
30 s and 72 �C for 2 min, 20 cycles of 94 �C for 30 s, 56 �Cfor 30 s and 60 �C for 30 min. Both pre-selective and selec-
tive amplifications were carried out using a PTC200 thermo-
cycler (BioRad, Hercules, CA, USA).
The products of selective amplifications were sized us-
ing an ABI3130XL automated capillary sequencer (Ap-
plied Biosystems, Foster City, CA, USA) and the
manufacturer’s Genescan 3.7 software. AFLP profiles were
then subjected to visual assessment in order to eliminate
outlier samples using the Genotyper 3.7 software (Applied
Biosystems). Then, all peaks in a profile within the range
60–400 bp were automatically labelled and bins were
created based on all labelled peaks. Automatically created
bins were visually checked to ensure that the bin was
centred on the distribution of peaks within the bin. Bins
with low polymorphism (5 % \frequency of dominant
haplotype \95 %) were omitted from further study. To
reduce the occurrence of homoplasy (Vekemans et al.
2002) bins with fragment-length distributions that over-
lapped with adjacent bins were also removed. Raw peak
intensity data output from Genotyper was subsequently
transformed into a binary data matrix with AFLPScore
R-script (Whitlock et al. 2008). Given that our main ob-
jective was to investigate spatial genetic structure and it
may arise both due to isolation-by-distance or due to spatial
variation of selective forces affecting the distribution of
alleles of specific loci (Beaumont and Balding 2004), only
neutral loci were selected for the analyses. For this pur-
pose, we used Mcheza (Antao and Beaumont 2011) to
identify outlier loci in terms of their heterozygosity versus
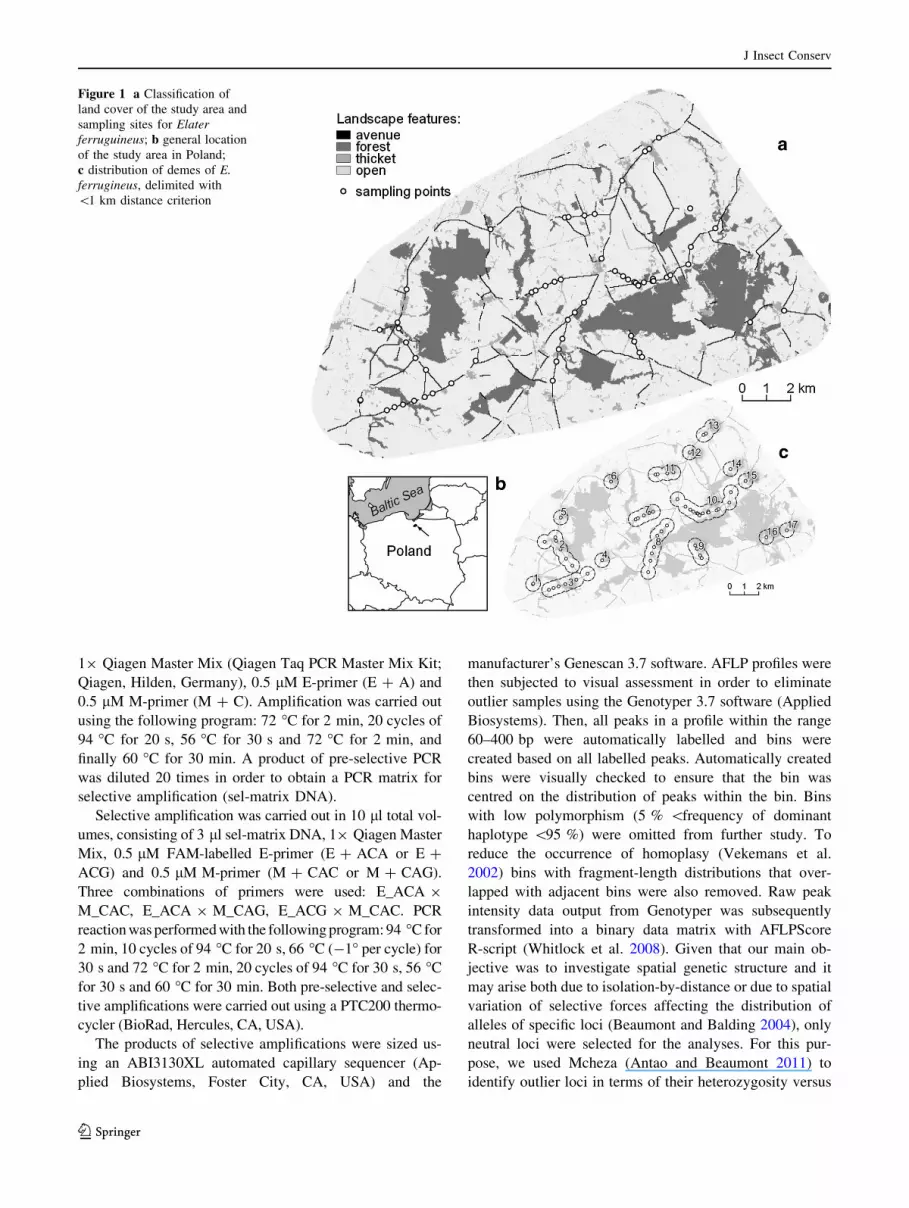
Figure 1 a Classification of
land cover of the study area and
sampling sites for Elater
ferruguineus; b general location
of the study area in Poland;
c distribution of demes of E.
ferrugineus, delimited with
\1 km distance criterion
J Insect Conserv
123

FST, i.e. the loci considered to be candidates for directional
or stabilizing selection. Locus-specific FST values were
estimated from a simulated distribution of 50,000 iterations
using an infinite alleles model. The resulting distribution
was used to find outliers. Outlier loci falling above the 0.95
quantile were considered putatively under directional se-
lection, while under stabilizing selection when falling un-
der 0.05. These markers were omitted from further
analyses.
Genetic variation
In the studied landscape, beetles are distributed more or
less continuously, mainly in avenues along roads (Fig-
ure 1). However, for the assessment of genetic variation we
assumed that the beetles isolated by more than 1 km from
other sampling sites formed a distinct group of individuals
(deme). To avoid bias resulting from small sample size, for
estimation of variation we included only sites where at
least five individuals were sampled (Figure 1; Table 1).
For each deme, after estimating allelic frequencies with a
Bayesian method, assuming a non-uniform prior distribu-
tion of allele frequencies (AFLP-SURV ver.1.0, Vekemans
et al. 2002), the following statistics were computed:
number and proportion of polymorphic loci at the 5 %
level; expected heterozygosity or Nei’s gene diversity (Hj)
and Wright’s FST.
Relationship between genetic and Euclidean
distances
The relationship between pairwise genetic and geographic
distances could be examined at two levels, i.e. for
populations and for individuals (Manel et al. 2003). The
first approach assumes a discrete population subdivision,
while the analysis based on individuals is free of assump-
tions about the spatial scale of structuring in populations
and could be more adequate if individuals are distributed
continuously across the landscape and/or the borders be-
tween populations are unknown, as it was in the studied
system.
The relationship between matrices of Euclidean dis-
tances and genetic similarities was tested by Mantel cor-
relation with 10,000 permutations (computed with ecodist
version 1.2.9 in R version 3.1.0, Goslee and Urban 2007).
Additionally, we applied analysis of spatial genetic struc-
ture (SGS) based on pairwise kinship coefficients (Hardy
2003) between individuals using the software SPAGeDi
ver. 1.3 (Hardy and Vekemans 2002). To visualize the
strength of SGS, average pair-wise kinship coefficients
(Fij) were plotted against distance classes (dij). The number
of distance classes was determined following Sturge’s rule
(Sturges 1926) based on the number of all pairwise com-
parisons and the mean distance per distance class was used
to draw the plot. Confidence intervals around observed
average kinship coefficients for a given distance class were
obtained from standard errors by jackknifing data over loci
(20,000 permutations).
Figure 2 A pheromone-baited funnel trap used for collecting Elater
ferrugineus; a two black PCV sheets (25 9 20 cm), properly cut and
connected crosswise; b plastic funnel (diameter 25 cm); c container
for holding captured insects until their release. Arrow indicate the
placement of a 200 lL PCR-tube baited with 2 lL 7-methyloctyl (Z)-
4-decenoate, the female-produced sex pheromone of E. ferrugineus
Table 1 Proportion of polymorphic loci (PLP) at the 5 % level and
expected heterozygosities under Hardy–Weinberg genotypic propor-
tions (Hj) within demes of E. ferrugineus, delimited with \1 km
distance criterion
Deme n PLP Hj (SE)
2 44 79 0.254 (0.020)
3 36 72.4 0.257 (0.017)
6 6 74.3 0.305 (0.021)
7 26 75.2 0.268 (0.017)
8 31 83.8 0.275 (0.016)
9 10 97.1 0.331 (0.013)
10 50 90.5 0.273 (0.014)
11 14 95.2 0.307 (0.016)
16 7 82.9 0.334 (0.018)
17 5 80 0.326 (0.018)
Mean 22.9 83.0 0.293 (0.017)
The numbering of the demes is the same as in Figure 1
J Insect Conserv
123

Under isolation-by-distance, given drift-dispersal equi-
librium, kinship is a linear function of the logarithm of
distance between individuals (Rousset 2000). Therefore, in
order to illustrate the intensity of the spatial genetic
structure, we used the formula Sp = -b1/(1 - f(1))
(Vekemans and Hardy 2004) where b1 is a slope of a log-
linear regression between observed kinship and a distance
between individuals, and f(1) is the average kinship for the
first distance class. Given that Sp is inversely proportional
to the effective size of the Wright’s neighbourhood (Nb),
the latter parameter was also calculated. The confidence
intervals were estimated using the standard error calculated
by jackknifing over loci. Finally, the square root of the
axial variance of dispersal (r) was approximated using an
iterative procedure implemented in SPAGeDi, based on the
regression restricted to a distance range from r to 20r(Rousset 1997). As the effective density (De, expressed as
number of individuals per area) remains unknown, a series
of guesses on De were used in the estimation.
Relationship between genetic and landscape
(resistance) distances
To evaluate if the landscape features important for the
beetle’s development are also used for its dispersal, we
developed spatial (raster) models, in which landscape
features were translated into likely costs of dispersal for the
red click beetle. The area used for the analyses was the
minimum convex polygon enclosing all of the sample
points, with a 2 km buffer surrounding this polygon added
to minimize the increase of resistance values due to the
grid boundary (Koen et al. 2010). We assigned a ‘no data’
value to cells outside of this area and excluded them from
all calculations.
Our raster models were based on freely available
Landsat data with the resolution of 30 m (http://landsat.
usgs.gov, years 2010–2012). Although the resolution of the
adapted grid can obviously affect the estimation of effec-
tive landscape distances, we believe that the adopted grid
resolution was appropriate because it is much smaller than
the putative dispersal distances of the study organism,
as recommended by Anderson et al. (2010). Because
E. ferrugineus is considered to be a relatively good flier,
movements of several hundred meters are highly possible
in this species.
Raster cells were classified according to their putative
suitability for E. ferrugineus. We distinguished four grid
cell classes, differing in the quantity of old growth-trees:
(1) cells containing avenue stretches (hereafter, called
‘‘avenues’’), (2) cells containing forest patches (‘‘forest’’),
(3) cells containing a landscape mosaic with thickets or
smaller trees but without avenues or forest (‘‘thicket’’), and
(4) land without any trees (usually arable fields, meadows
and water bodies; ‘‘open land’’). Cells were classified as
‘‘avenues’’ if any fragment of an avenue was placed within
the cell; other cells were classified according to the
dominant land cover type. Classification of raster cells was
performed in two steps. First, using the SAGA software we
classified Landsat images into two classes: (1) containing
tree cover (forest, thickets or linear plantings of trees), (2)
open areas. Next, raster was converted into shape format
and classification of polygons was verified in Quantum GIS
(QGIS Development Team 2012) based on more detailed
aerial images from Google Earth and geoportal.gov.pl. In
this step, areas with woody vegetation cover were cate-
gorised as forests, avenues and areas that do not fit into any
of these classes (‘‘thicket’’). The categorization was done
independently by two authors (A.O. and R.G.), then—in
doubtful cases—its accuracy was examined directly in the
field.
In the next step, we elaborated a number of models in
which these four cell classes were assigned values
describing their permeability for dispersing beetles (the
so-called cell conductances, McRae 2006). To minimize
subjectivity in assigning conductance values, we assumed
that each class could have one of three conductance values
(weak—1, moderate—50, or high—100) and created
models with all possible combinations of the three con-
ductance values for the four cell classes. As a result we
obtained 81 (i.e. 34) landscape grid models, describing all
possible conductance surfaces for beetles moving through
the landscape (Supplementary data). Subsequently, we
computed matrices of pairwise distances between local
populations or individuals for each landscape conductance
surface, using resistance distance, as implemented in the R
package ‘gdistance’ ver. 1.1-5 (van Etten 2014) in the R
version 3.1.0 (R Development Core Team 2013). The re-
sistance distance is computed as the random-walk com-
mute time between points (Chandra et al. 1996; McRae
2006). During calculations, we used a connection scheme
where movement was allowed between the nearest 16 cells.
This scheme is the most realistic scenario, because it as-
sumes that the narrow linear structures with a width of one
cell (for example, avenues) do not constitute a strong
barrier for movement if their conductance is set to low
value.
Because the probability of moving through the cell
system is not dependent on the absolute cell values but on
the relative differences between them, three combinations
of conductance values (when conductance values for all
four cell types were set equally to 1, 50 or 100), gave the
same model representing the homogeneous landscape, i.e.
the analogue of the pure isolation-by-distance model
(Wright 1943), which could be regarded as the null model.
To evaluate which of the proposed landscape models
had the best fit with the observed pattern of gene flow, we
J Insect Conserv
123
calculated Mantel correlation between the matrix of pair-
wise genetic similarity coefficients and matrices of effec-
tive landscape distances. The genetic similarity matrix was
computed using kinship coefficients between pairs of in-
dividuals (computed with SPAGeDi version 1.4, Hardy and
Vekemans 2002), because the individual level better cor-
responds to the resolution of the landscape rasters. On the
other hand, using discrete demes as data units would lead
to data loss and ambiguity, e.g. in determining distances
between demes. Mantel tests with 10,000 permutations
were calculated using the package ‘ecodist’ version 1.2.7
(Goslee and Urban) in the R version 3.1.0 (R Development
Core Team 2013).
To get insight into which land use categories have the
most influence on the observed pattern of isolation-by-
distance, we performed multiple linear regression with the
square of the estimated Mantel correlation coefficient (rM2 )
as a response variable and conductances of the four land-
scape types as explanatory variables. We considered all
possible (i.e. 15) candidate models that emerged from all
combinations of explanatory variables, and these were
ranked according to the relative strength of support for
each model using Akaike’s information criterion adjusted
for small sample sizes (AICc). We used AICc weights (xi)
to generate weighted model-averaged parameter estimates.
We also estimated the relative importance of the predictor
variables by summing the AICc weights over all the
models in which the variable was contained. Parameter
estimates and AICc for all models were calculated using
the package ‘MuMIn’ version 1.10.0 (Barton 2013) in the
R version 3.1.0 (R Development Core Team 2013).
Results
Marker polymorphism and genetic variation
Successful amplification was obtained in 247 samples of E.
ferrugineus. Three combinations of primers yielded am-
plification of 297 putative loci (peaks visible in the elec-
tropherogram). From this number, 181 were omitted from
further analyses either because of the difficulty to distin-
guish between two or more fragments of a similar mass or
due to a vague amplification. For further examination
we used 116 loci (E_ACA 9 M_CAC—35, E_ACA 9
M_CAG—27 and E_ACG 9 M_CAC—54 loci), but the
FST-outlier method revealed that 11 loci were positively
exceeding neutral expectations, leaving 105 putatively
neutral loci for final analyses (E_ACA 9 M_CAC—34,
E_ACA 9 M_CAG—27 and E_ACG 9 M_CAC—44
loci).
Demes distinguished with the 1 km-distance criterion
showed similar levels of expected heterozygosities, ranging
from 0.254 to 0.334 (Table 1). On average, gene diversity
within populations amounted to 0.294 (SE 0.009). The
proportion of polymorphic loci ranged from 72.4 to
97.1 %. The average pairwise FST across all populations
was equal to 0.067 and ranged from 0 to 0.133.
Relationship between genetic and Euclidean
distances
Mantel tests showed that matrices of kinship and Euclidean
distances between sampled individuals were significantly
correlated [rM = -0.263, 95 % CL (-0.281; -0.246),
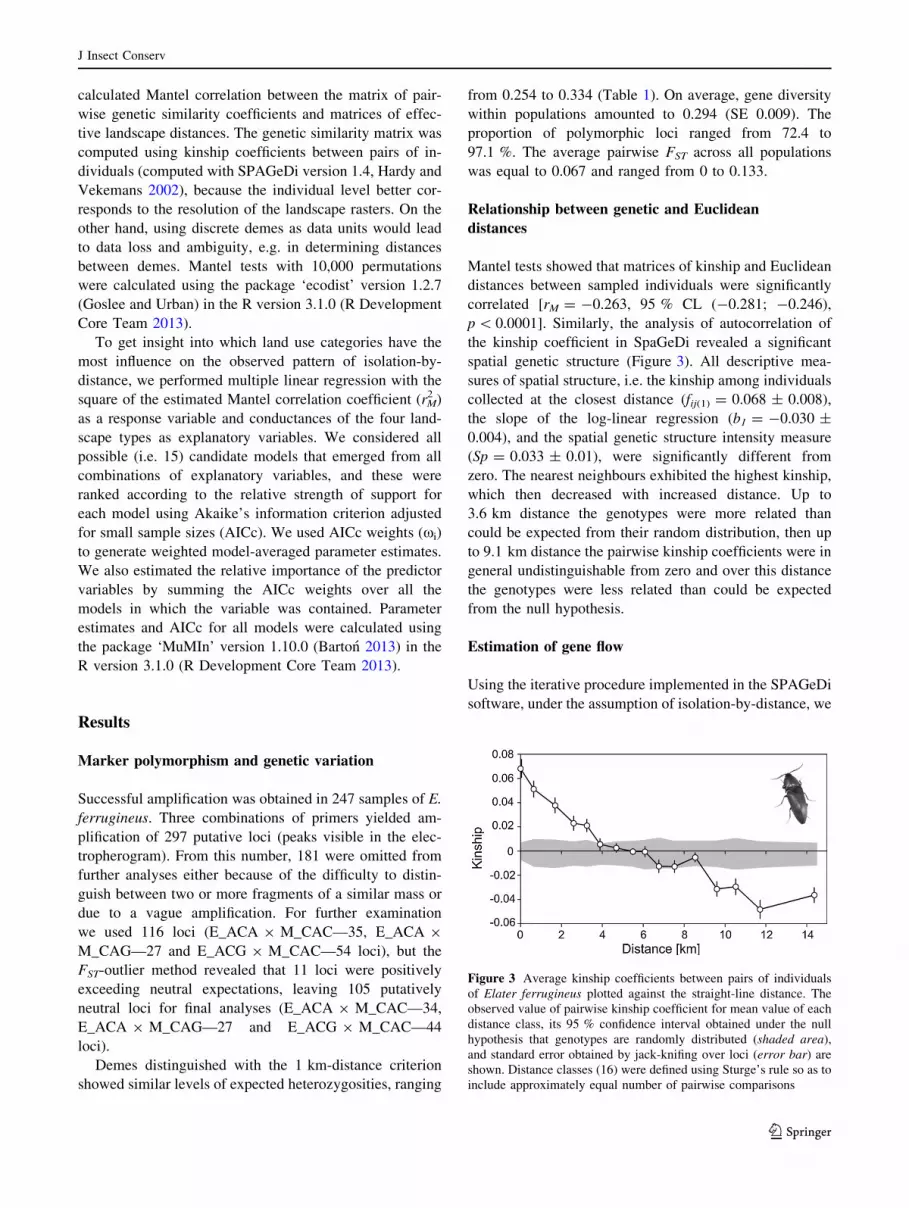
p\ 0.0001]. Similarly, the analysis of autocorrelation of
the kinship coefficient in SpaGeDi revealed a significant
spatial genetic structure (Figure 3). All descriptive mea-
sures of spatial structure, i.e. the kinship among individuals
collected at the closest distance (fij(1) = 0.068 ± 0.008),
the slope of the log-linear regression (b1 = -0.030 ±
0.004), and the spatial genetic structure intensity measure
(Sp = 0.033 ± 0.01), were significantly different from
zero. The nearest neighbours exhibited the highest kinship,
which then decreased with increased distance. Up to
3.6 km distance the genotypes were more related than
could be expected from their random distribution, then up
to 9.1 km distance the pairwise kinship coefficients were in
general undistinguishable from zero and over this distance
the genotypes were less related than could be expected
from the null hypothesis.
Estimation of gene flow
Using the iterative procedure implemented in the SPAGeDi
software, under the assumption of isolation-by-distance, we
Figure 3 Average kinship coefficients between pairs of individuals
of Elater ferrugineus plotted against the straight-line distance. The
observed value of pairwise kinship coefficient for mean value of each
distance class, its 95 % confidence interval obtained under the null
hypothesis that genotypes are randomly distributed (shaded area),
and standard error obtained by jack-knifing over loci (error bar) are
shown. Distance classes (16) were defined using Sturge’s rule so as to
include approximately equal number of pairwise comparisons
J Insect Conserv
123

estimated the two characteristics of gene flow intensity: the
Wright’s neighbourhood size (Nb) and the axial variance of
dispersal (r), the latter being a measure similar to the mean
dispersal distance. The results from the analysis are shown
in Table 2. Generally, the presence of convergence for the
most realistic values of assumed effective density (De)
suggests a good agreement between the observed cor-
relograms and the theory of isolation-by-distance in E.
ferrugineus. The axial variance of dispersal in the species
was estimated to 110–651 m and neighbourhood size to
26–76 individuals for the moderate values of effective
density (0.1–10 individual * ha-1).
Relationship between genetic and landscape
distances
Mantel correlation between resistance distances between
pairs of individuals of E. ferrugineus and their kinship
coefficients ranged between -0.031 and -0.254 (all cor-
relation coefficients significant at p\ 0.0001, Figure 4).
Resistance distances measured over null landscape models
(i.e. homogenous landscapes, in which isolation is only due
to distance) yielded a correlation coefficient of -0.247
(95 % CL from -0.264 to -0.233). There were six land-
scape models in which resistance distances showed slightly
stronger correlation with kinship than in these null models
(rM between -0.249 and -0.254). However, taking into
account 95 % confidence limits (from -0.271 to -0.234),
none of them were significantly better than the homoge-
nous (null) model.
On the other hand, 54 raster models showed significantly
weaker correlation than the null homogenous model. When
comparing models of lower fit with models better matched to
the observed pattern of gene flow, it turned out that models
equivalent to the null model were characterized by a higher
average conductance of avenues than inferior models (re-
spectively, 83.33 and 36.67; the difference was significant
when assessed with the Mann–Whitney test, p\ 0.0001). In
line with this observation, multiple regression (Tables 3, 4)
pointed to avenues as a habitat type that have the highest
positive impact on landscape connectivity forE. ferrugineus,
i.e. the concordance between matrices of pairwise kinship
and resistance landscape distances increased with increasing
conductance of avenues (relative variable importance equal
to 1, b = 0.684, p\ 0.001). A similar but weaker effect was
evident for the thickets (relative variable importance 0.999,
b = 0.304, p\ 0.001). In contrast, open land had the op-
posite effect (relative variable importance 0.864,
b = -0.177, p\ 0.05), while the effect of forest was not
statistically significant (relative variable importance 0.313,
b = -0.062, n.s.).
Discussion
In our study, any assumption about conductivity of land-
scape features for dispersing E. ferrugineus gave better fit
between genetic and landscape distances than the simplest
homogenous models, in which isolation results from the
distance only. Although six models (all but one assuming
the highest conductance of avenues and low to moderate
conductance of open field) showed slightly stronger cor-
relation with kinship than homogenoues null models, the
difference was not significant. On the other hand, models
with the opposite setup (low conductance of avenues and
higher conductance of open areas) were significantly less
correlated with the observed pattern of kinship between
individuals. It indicates that the arrangement and relative
proportions of habitat and non-habitat patches significantly
affect the phenomenon of gene flow in E. ferrugineus. In
fact, for many pairwise comparisons it was impossible to
differentiate straight-line gene flow from gene flow through
the linear habitat, because both distances were virtually the
same. Therefore, for shorter distances (within a single av-
enue) isolation-by-resistance could be reduced to isolation
by the Euclidean distance. This is probably the reason why
the models of gene flow through the avenues and along
straight lines are equally well correlated with the observed
pattern of kinship.
The results presented here are in line with the hypothesis
that avenues may constitute important landscape feature
supporting gene movement in E. ferrugineus. Recently,
plantings of trees along roads were recognized as an im-
portant habitat for several vulnerable, tree-dependent in-
sects in cultural landscapes (Oleksa et al. 2006, 2007,
Table 2 Estimated gene dispersal parameters for an assumed effec-
tive population density (number of individuals per hectare) in a
2-dimensional population at drift-dispersal equilibrium under
isotropic dispersal
De (individuals * ha-1) Nb (individuals) r (m)
0.0001 NA NA
0.001 19.0 (5.4) 5498.9 (762.2)
0.01 23.9 (3.8) 1949.4 (155.6)
0.1 26.6 (3.8) 651.2 (45.4)
1 39.3 (5.2) 250.1 (16.6)
10 76.3 (41.4) 110.1 (29.8)
100 162.9 (379.4) 49.5 (46.1)
1000 NA NA
10,000 NA NA
Estimation based on the regression slope between sigma and 20.0
sigma following an iterative procedure implemented in the SPAGeDi
software. Values in the parentheses indicate standard errors
De assumed effective population density, Nb neighbourhood size, rhalf the mean square parent-offspring distance, NA not estimated due
to lack of convergence
J Insect Conserv
123

2013b; Horak et al. 2010; Michalcewicz and Ciach 2012).
However, it remained unclear whether avenues can be
considered exclusively as their habitat or could also serve
as effective dispersal corridors. Although we were not able
to prove that the pattern of gene flow was better fitted with
effective landscape distances than with straight-line
Figure 4 Results from Mantel
test showing correlations
between matrix of pairwise
kinship coefficients and
matrices of landscape resistance
distances, computed for 81
combinations of the three
assumed conductance values
(either 1, 50 or 100) for the four
landscape features. Bars
indicate 95 % confidence
intervals
Table 3 Results for the model
selection procedure, sorted by
Akaike information criterion
(AICc)
Variables in the model df r2 logLik AICc DAICc AICc weight
134 5 0.592 243.02 -475.25 0 0.593
1234 6 0.596 243.41 -473.68 1.571 0.27
13 4 0.561 240.03 -471.54 3.705 0.093
123 5 0.565 240.39 -469.98 5.269 0.043
14 4 0.5 234.76 -460.99 14.263 \0.001
124 5 0.503 235.07 -459.33 15.915 \0.001
1 3 0.468 232.3 -458.29 16.956 \0.001
12 4 0.472 232.59 -456.66 18.585 \0.001
34 4 0.124 212.06 -415.6 59.648 \0.001
3 3 0.092 210.64 -414.98 60.272 \0.001
234 5 0.127 212.24 -413.68 61.567 \0.001
23 4 0.096 210.81 -413.1 62.144 \0.001
4 3 0.031 208 -409.69 65.554 \0.001
24 4 0.035 208.16 -407.8 67.448 \0.001
2 3 0.004 206.87 -407.43 67.816 \0.001
Response variable is the square of Mantel correlation (rM2 ) between matrices of pairwise kinship and
landscape resistance distances. Explanatory variables are: 1—avenue, 2—forest, 3—thicket, 4—open
Table 4 Parameter estimates
averaged across 15 regression
models, using Akaike weights
(see Table 3)
Variable Importance Coeff. Std Coeff. Std Error t p
Constant – 0.021 0 0.004 5.828 ***
Avenue 1 \0.001 0.684 \0.001 9.356 ***
Forest 0.313 \0.001 -0.062 \0.001 -2.698 n.s.
Thicket 0.999 \0.001 0.304 \0.001 4.16 ***
Open 0.864 \0.001 -0.177 \0.001 -2.808 *
*** p\ 0.001; * p\ 0.05
J Insect Conserv
123

distances, our results indicate that avenues alone are suf-
ficient to ensure relatively high levels of gene exchange.
Since the models with high conductance of avenues and
lower conductance of other landscape features were as
good as the models assuming homogenous space in ex-
plaining the observed pattern of kinship, we may conclude
that a network of avenues is sufficient to maintain
relatively high level of gene flow, even if a large proportion
of the landscape is composed of areas in which dispersal is
costly.
Our regression analysis pointed to avenues as the main
landscape feature increasing the concordance between ge-
netic and effective landscape distances, while the effect of
open (mostly arable) land was the opposite. These effects
are consistent with what can be expected in a species
strictly dependent on the old-growth tree habitats. How-
ever, the impact of forest and thickets needs further ex-
planation. It could be surprising that forests had no
significant effect on gene flow in a hollow-dwelling spe-
cies. Nonetheless, this may result from the fact that forests
in the studied area have a long history of management for
timber production, which lowered the average age of trees
and caused a drastic reduction in the density of mature
hollow trees. In contrast to the forests, timber production
has never been the primary function of avenues, which
were mainly planted in order to protect roads from winds
and winter snow (Pradines 2009). Thus, rural avenues have
become the main place where mature trees are abundant.
Similarly to avenues, our regression analysis identified
thickets as one more type of land use which increased the
compliance between matrices of kinship and effective
landscape distances. In fact, the landscape features which
we defined as ‘‘thicket’’ (i.e. raster cells containing a
landscape mosaic with thickets or smaller trees but without
avenues or forest) were heterogeneous in terms of their
composition and/or origin. Nevertheless, a substantial part
of this landscape class has developed as a result of
degradation of historical avenues through cutting of trees
along minor roads, mainly due to intensification of agri-
culture in the last decades of the twentieth century. Taking
into account that the observed spatial genetic structure is a
result of historical process of gene dispersal (Hardy and
Vekemans 1999), it is therefore possible that the positive
effect of thickets is a reflection of the former gene flow,
which took place in the past.
Our conclusion is consistent with several previous
studies dealing with the role of linear tree or bush habitats
as ecological corridors for diverse groups of organisms,
including snails (Arnaud 2003), ground beetles (Jopp and
Reuter 2005; Jordan et al. 2007), crickets (Berggren et al.
2002; Eriksson et al. 2013) and birds (Gillies and St Clair
2008). In contrast, some other studies did not provide
evidence for a beneficial effect of corridors (Haddad et al.
2003; Ockinger and Smith 2008; Astrom and Part 2013).
Results from these studies demonstrate that the effects of
corridors may be influenced by the quality of the adjacent
matrix and could differ between organisms and landscapes,
depending on conditions to which species or local
populations are adapted (Dennis et al. 2013). Usually, the
movement between habitats is higher if the organism does
not perceive the border as distinct (e.g. between two open
habitats) and animals are less likely to move through sharp
borders (e.g. between meadow and forest), which could
direct the movement along the boundary (Ries and De-
binski 2001; Kuefler et al. 2010; Eycott et al. 2012; Ber-
toncelj and Dolman 2012). Therefore, it may be expected
that corridors are more important for organisms living in
landscapes composed of contrasting types of environments,
which is the case in the studied system, where tree habitats
are embedded in the inhospitable matrix and the beetle is
strictly associated with a narrow ecological niche.
It could also be anticipated that the presence of corridors
should direct populations toward evolution of higher dis-
persal rates. Theoretical models (Travis and Dytham 1999;
Stamps et al. 2005) as well as empirical studies (Merckx
et al. 2003; Bonelli et al. 2013) indicate that in highly
fragmented landscapes there may be selection against dis-
persal because dispersing individuals may experience high
costs of finding suitable habitat patches. If this is the case
for E. ferrugineus in the studied landscape, it is possible
that arrangement of suitable habitat as a highly continuous
network of tree avenues could increase the exchange of
individuals between occupied trees, which in turn should
result in less intensive spatial genetic structure and a
weaker spatial genetic structure compared to the situation
when trees are more scattered in the landscape. Previous
studies (Musa et al. 2013) showed that the probability of
patch occupancy by E. ferrugineus increased with in-
creasing amount of large trees. Our results indicate that
also the spatial configuration of trees in the landscape may
contribute to the likelihood of the species’ occurrence. The
question whether populations of E. ferrugineus living in
more fragmented landscapes show weaker dispersal ca-
pacity, stronger spatial genetic structure or more elevated
inbreeding levels, opens interesting perspectives for further
comparative research. Such a pattern was recently found in
the beetles of the genus Osmoderma, a main prey of E.
ferrugineus larvae, where differences in dispersal distances
between populations from different geographic regions of
Europe were detected (Ranius and Hedin 2001; Hedin and
Ranius 2002; Dubois et al. 2010; Oleksa et al. 2013a;
Chiari et al. 2013; Le Gouar et al. 2014). Since the dis-
persal in poikilotherms is strictly dependent on tem-
perature, these differences may be the result of climatic
factors, as observed in other insects (Cormont et al. 2011;
Delattre et al. 2013); however, it is also possible that
J Insect Conserv
123

differences in dispersal capacities could be explained by
various selective pressures acting on the beetles in land-
scapes of different connectivity and habitat size.
In addition to assessing the impact of the landscape on
gene flow in E. ferrugineus, we aimed to estimate the ex-
tent of gene flow in this species. We have demonstrated
that the axial variance of dispersal, a measure very close to
the average distance of dispersal, amounted to several
hundred meters (110–651 m for moderate values of ef-
fective density). Although our estimates are imprecise due
to the lack of knowledge about the effective density and
(possibly) its variability over the studied area, dispersal of
several hundred meters is highly possible in this species.
Zauli et al. (2014) found that males of E. ferrugineus
moved from the site of first capture covering a median
distance of 214 m and approximately 50 % of individuals
disperse not further than 250 m. Observed movement dis-
tances of other saproxylic beetles could comprise more
than 700 m in a species which is believed to be poor flier
(Dubois et al. 2010; Oleksa et al. 2013a) and even more
than 10 km for species with high dispersal capacities
(Jonsson 2003; Williams and Robertson 2008; Drag et al.
2011). In this respect, E. ferrugineus can be regarded as a
species with lower dispersal abilities, for which habitat
continuity plays an important role.
The data presented here allow us to conclude that av-
enues should be protected as valuable dispersal corridors
for organisms dependent on mature trees. Unfortunately,
the current need for traffic safety improvement and in-
frastructure development has caused large-scale cutting of
roadside trees (Pradines 2009), and their decline poses the
most serious threat for the whole community of arboreal
organisms in farmland areas. We believe that understand-
ing the factors affecting the chances of gene flow in E.
ferrugineus would be a step forward in developing effec-
tive conservation measures to mitigate the impact of its
habitat decline. Taking into account the rapid loss of ma-
ture trees in modern European landscapes, we recommend
strict protection of existing avenues and planting new ones
in places of disturbed continuity.
Acknowledgments The study was supported by the National Sci-
ence Centre (Grant No. UMO-2011/03/B/NZ9/03103) and by the
Municipality of Rychliki. The samples were collected held with the
permission of the General Directorate for Environmental Protection
(permission no. DOPozgiz-4200/I-105/2674/10/JRO). The authors
would like to thank Katarzyna Meyza and Ewa Sztupecka for their
help with laboratory work.
Open Access This article is distributed under the terms of the
Creative Commons Attribution 4.0 International License (http://
creativecommons.org/licenses/by/4.0/), which permits unrestricted
use, distribution, and reproduction in any medium, provided you give
appropriate credit to the original author(s) and the source, provide a
link to the Creative Commons license, and indicate if changes were
made.
References
Anderson CD, Epperson BK, Fortin M-J, Holderegger R, James
PMA, Rosenberg MS, Scribner KT, Spear S (2010) Considering
spatial and temporal scale in landscape-genetic studies of gene
flow. Mol Ecol 19:3565–3575. doi:10.1111/j.1365-294X.2010.
04757.x
Andersson K, Bergman KO, Andersson F, Hedenstrom E, Jansson N,
Burman J, Winde I, Larsson MC, Milberg P (2014) High-
accuracy sampling of saproxylic diversity indicators at regional
scales with pheromones: the case of Elater ferrugineus
(Coleoptera, Elateridae). Biol Conserv 171:156–166. doi:10.1016/
j.biocon.2014.01.007
Antao T, Beaumont MA (2011) Mcheza: a workbench to detect
selection using dominant markers. Bioinformatics 27:1717–1718.
doi:10.1093/bioinformatics/btr253
Arnaud JF (2003) Metapopulation genetic structure and migration
pathways in the land snail Helix aspersa: influence of landscape
heterogeneity. Landsc Ecol 18:333–346. doi:10.1023/a:10244
09116214
Astrom J, Part T (2013) Negative and matrix-dependent effects of
dispersal corridors in an experimental metacommunity. Ecology
94:72–82. doi:10.1890/11-1795.1
Baguette M, Blanchet S, Legrand D, Stevens VM, Turlure C (2013)
Individual dispersal, landscape connectivity and ecological
networks. Biol Rev Camb Philos Soc 88:310–326. doi:10.1111/
brv.12000
Barrett GGW, Peles JDJ (1994) Optimizing habitat fragmentation: an
agrolandscape perspective. Landsc Urban Plan 28:99–105.
doi:10.1016/0169-2046(94)90047-7
Barton K (2013) MuMIn: Multi-model inference. R package version
1.10.0. Vienna, Austria: R Foundation for Statistical Computing.
http://CRAN.R-project.org/package=MuMIn
Batary P, Baldi A, Kleijn D, Tscharntke T (2011) Landscape-
moderated biodiversity effects of agri-environmental manage-
ment: a meta-analysis. Proc Biol Sci 278:1894–1902. doi:10.
1098/rspb.2010.1923
Beaumont MA, Balding DJ (2004) Identifying adaptive genetic
divergence among populations from genome scans. Mol Ecol
13:969–980. doi:10.1111/j.1365-294X.2004.02125.x
Berggren A, Birath B, Kindvall O (2002) Effect of corridors and
habitat edges on dispersal behavior, movement rates, and
movement angles in Roesel’s bush-cricket (Metrioptera roeseli).
Conserv Biol 16:1562–1569. doi:10.1046/j.1523-1739.2002.
01203.x
Bertoncelj I, Dolman PM (2012) The matrix affects trackway corridor
suitability for an arenicolous specialist beetle. J Insect Conserv
17:503–510. doi:10.1007/s10841-012-9533-9
Bonelli S, Vrabec V, Witek M, Barbero F, Patricelli D, Nowicki P
(2013) Selection on dispersal in isolated butterfly metapopula-
tions. Popul Ecol 55:469–478. doi:10.1007/s10144-013-0377-2
Buchholz L, Ossowska M (2004) Elater ferrugineus Linnaeus, 1758,
Tegosz rdzawy. In: Głowacinski Z, Nowacki J (eds) Polish red
data book of animals, invertebrates. Instytut Ochrony Przyrody
PAN, Akademia Rolnicza im. A. Cieszkowskiego, Krakow-
Poznan, p 119–120
Burakowski B, Mroczkowski M, Stefanska J (1985) Chrzaszcze
Coleoptera: Buprestoidea, Elateroidea i Cantharoidea. Katalogi
Fauny Pol 23:1–401
Chandra AK, Raghavan P, Ruzzo WL, Smolensky R, Tiwari P (1996)
The electrical resistance of a graph captures its commute and
cover times. Comput Complex 6:312–340. doi:10.1007/BF01
270385
Chiari S, Carpaneto GM, Zauli A, Zirpoli GM, Audisio P, Ranius T
(2013) Dispersal patterns of a saproxylic beetle, Osmoderma
J Insect Conserv
123

eremita, in Mediterranean woodlands. Insect Conserv Divers
6:309–318. doi:10.1111/j.1752-4598.2012.00215.x
Cormont A, Malinowska AH, Kostenko O, Radchuk V, Hemerik L,
WallisDeVries MF, Verboom J (2011) Effect of local weather on
butterfly flight behaviour, movement, and colonization: sig-
nificance for dispersal under climate change. Biodivers Conserv
20:483–503. doi:10.1007/s10531-010-9960-4
Delattre T, Baguette M, Burel F, Stevens VM, Quenol H, Vernon P
(2013) Interactive effects of landscape and weather on dispersal.
Oikos 122:1576–1585. doi:10.1111/j.1600-0706.2013.00123.x
Dennis RLH, Dapporto L, Dover JW, Shreeve TG (2013) Corridors and
barriers in biodiversity conservation: a novel resource-based habitat
perspective for butterflies. Biodivers Conserv 22:2709–2734.
doi:10.1007/s10531-013-0540-2
Dover J, Settele J (2009) The influences of landscape structure on
butterfly distribution and movement: a review. J Insect Conserv
13:3–27. doi:10.1007/s10841-008-9135-8
Dover J, Sparks T, Clarke S, Gobbett K, Glossop S (2000) Linear
features and butterflies: the importance of green lanes. Agric
Ecosyst Environ 80:227–242. doi:10.1016/S0167-8809(00)
00149-3
Drag L, Hauck D, Pokluda P, Zimmermann K, Cizek L (2011)
Demography and dispersal ability of a threatened saproxylic
beetle: a mark-recapture study of the Rosalia Longicorn (Rosalia
alpina). PLoS ONE 6:e21345. doi:10.1371/journal.pone.0021
345
Dubois GF, Gouar PJ, Delettre YR, Brustel H, Vernon P (2010) Sex-
biased and body condition dependent dispersal capacity in the
endangered saproxylic beetle Osmoderma eremita (Coleoptera:
Cetoniidae). J Insect Conserv 14:679–687. doi:10.1007/s10841-
010-9296-0
Eriksson A, Low M, Berggren A (2013) Influence of linear versus
network corridors on the movement and dispersal of the bush-
cricket Metrioptera roeseli (Orthoptera: Tettigoniidae) in an
experimental landscape. Eur J Entomol 110:81–86. doi:10.14411/
eje.2013.010
Eycott AE, Stewart GB, Buyung-Ali LM, Bowler DE, Watts K, Pullin
AS (2012) A meta-analysis on the impact of different matrix
structures on species movement rates. Landsc Ecol 27:1263–1278.
doi:10.1007/s10980-012-9781-9
Fahrig L (2003) Effects of habitat fragmentation on biodiversity.
Annu Rev Ecol Evol Syst 34:487–515. doi:10.1146/annurev.
ecolsys.34.011802.132419
Gillies CS, St Clair CC (2008) Riparian corridors enhance movement
of a forest specialist bird in fragmented tropical forest. Proc Natl
Acad Sci USA 105:19774–19779. doi:10.1073/pnas.0803530105
Goslee S, Urban D (2007) The ecodist package: dissimilarity-based
functions for ecological analysis. J Stat Softw 22:1–19
Guerriero V, Vitale S, Ciarcia S, Mazzoli S (2011) Improved
statistical multi-scale analysis of fractured reservoir analogues.
Tectonophysics 504:14–24. doi:10.1016/j.tecto.2011.01.003
Haddad NM, Bowne DR, Cunningham A, Danielson BJ, Levey DJ,
Sargent S, Spira T (2003) Corridor use by diverse taxa. Ecology
84:609–615. doi:10.1890/0012-9658(2003)084[0609:CUBDT]2.
0.CO;2
Hardy OJ (2003) Estimation of pairwise relatedness between
individuals and characterization of isolation-by-distance pro-
cesses using dominant genetic markers. Mol Ecol 12:1577–1588
Hardy OJ, Vekemans X (1999) Isolation by distance in a continuous
population: reconciliation between spatial autocorrelation ana-
lysis and population genetics models. Heredity (Edinb)
83:145–154. doi:10.1046/j.1365-2540.1999.00558.x
Hardy OJ, Vekemans X (2002) SPAGeDi: a versatile computer
program to analyse spatial genetic structure at the individual or
population levels. Mol Ecol Notes 2:618–620. doi:10.1046/j.
1471-8278
Hedin J, Ranius T (2002) Using radio telemetry to study dispersal of the
beetle Osmoderma eremita, an inhabitant of tree hollows. Comput
Electron Agric 35:171–180. doi:10.1016/S0168-1699(02)00017-0
Horak J, Vavrova E, Chobot K (2010) Habitat preferences influencing
populations, distribution and conservation of the endangered
saproxylic beetle Cucujus cinnaberinus (Coleoptera: Cucujidae)
at the landscape level. Eur J Entomol 107:81–88. doi:10.14411/
eje.2010.011
Jonsson M (2003) Colonisation ability of the threatened tenebrionid
beetle Oplocephala haemorrhoidalis and its common relative
Bolitophagus reticulatus. Ecol Entomol 28:159–167. doi:10.
1046/j.1365-2311.2003.00499.x
Jopp F, Reuter H (2005) Dispersal of carabid beetles—emergence of
distribution patterns. Ecol Model 186:389–405. doi:10.1016/j.
ecolmodel.2005.02.009
Jordan F, Magura T, Tothmeresz B, Vasas V, Kodobocz V (2007)
Carabids (Coleoptera: Carabidae) in a forest patchwork: a
connectivity analysis of the Bereg Plain landscape graph. Landsc
Ecol 22:1527–1539. doi:10.1007/s10980-007-9149-8
Kadej M, Zajac K, Ruta R, Gutowski JM, Tarnawski D, Smolis A,
Olbrycht T, Malkiewicz A, Myskow E, Larsson MC, Andersson
F, Hedenstrom E (2015) Sex pheromones as a tool to overcome
the Wallacean shortfall in conservation biology: a case of Elater
ferrugineus Linnaeus, 1758 (Coleoptera: Elateridae). J Insect
Conserv 19:25–32. doi:10.1007/s10841-014-9735-4
Koen EL, Garroway CJ, Wilson PJ, Bowman J (2010) The effect of
map boundary on estimates of landscape resistance to animal
movement. PLoS ONE 5:8. doi:10.1371/journal.pone.0011785
Kool JT, Moilanen A, Treml EA (2012) Population connectivity:
recent advances and new perspectives. Landsc Ecol 28:165–185.
doi:10.1007/s10980-012-9819-z
Kuefler D, Hudgens B, Haddad NM, Morris WF, Thurgate N (2010)
The conflicting role of matrix habitats as conduits and barriers
for dispersal. Ecology 91:944–950. doi:10.1890/09-0614.1
Larsson MC, Svensson GP (2009) Pheromone monitoring of rare and
threatened insects: exploiting a pheromone-kairomone system to
estimate prey and predator abundance. Conserv Biol
23:1516–1525. doi:10.1111/j.1523-1739.2009.01263.x
Le Gouar PJ, Dubois GF, Vignon V, Brustel H, Vernon P (2014)
Demographic parameters of sexes in an elusive insect: implica-
tions for monitoring methods. Popul Ecol. doi:10.1007/s10144-
014-0453-2
Lowe WH, Allendorf FW (2010) What can genetics tell us about
population connectivity? Mol Ecol 19:3038–3051. doi:10.1111/j.
1365-294X.2010.04688.x
Lozier JD, Strange JP, Koch JB (2013) Landscape heterogeneity
predicts gene flow in a widespread polymorphic bumble bee,
Bombus bifarius (Hymenoptera: Apidae). Conserv Genet
14:1099–1110. doi:10.1007/s10592-013-0498-3
Manel S, Schwartz MK, Luikart G, Taberlet P (2003) Landscape genetics:
combining landscape ecology and population genetics. Trends Ecol
Evol 18:189–197. doi:10.1016/S0169-5347(03)00008-9
McRae BH (2006) Isolation by resistance. Evolution 60:1551–1561.
doi:10.1554/05-321.1
McRae BH, Beier P (2007) Circuit theory predicts gene flow in plant and
animal populations. Proc Natl Acad Sci USA 104:19885–19890.
doi:10.1073/pnas.0706568104
Merckx T, Van Dyck H, Karlsson B, Leimar O (2003) The evolution
of movements and behaviour at boundaries in different land-
scapes: a common arena experiment with butterflies. Proc Biol
Sci 270:1815–1821. doi:10.1098/rspb.2003.2459
Michalcewicz J, Ciach M (2012) Rosalia longicorn Rosalia alpina
(L.) (Coleoptera: Cerambycidae) uses roadside European ash
trees Fraxinus excelsior L.—an unexpected habitat of an
endangered species. Pol J Entomol 81:49–56. doi:10.2478/
v10200-011-0063-7
J Insect Conserv
123

Moilanen A, Hanski I (1998) Metapopulation dynamics: effects of
habitat quality and landscape structure. Ecology 79:2503–2515.
doi:10.1890/0012-9658(1998)079[2503:Mdeohq]2.0.Co;2
Musa N, Andersson K, Burman J, Andersson F, Hedenstrom E,
Jansson N, Paltto H, Westerberg L, Winde I, Larsson MC,
Bergman K-O, Milberg P (2013) Using sex pheromone and a
multi-scale approach to predict the distribution of a rare
saproxylic beetle. PLoS ONE 8:e66149. doi:10.1371/journal.
pone.0066149
Nieto A, Alexander KNA (2010) European red list of saproxylic
beetles. Publications Office of the European Union, Luxembourg
Ockinger E, Smith HG (2006) Semi-natural grasslands as population
sources for pollinating insects in agricultural landscapes. J Appl
Ecol 44:50–59. doi:10.1111/j.1365-2664.2006.01250.x
Ockinger E, Smith HG (2008) Do corridors promote dispersal in
grassland butterflies and other insects? Landsc Ecol 23:27–40.
doi:10.1007/s10980-007-9167-6
Oleksa A, Ulrich W, Gawronski R (2006) Occurrence of the marbled
rose-chafer (Protaetia lugubris Herbst, Coleoptera, Cetoniidae)
in rural avenues in northern Poland. J Insect Conserv 10:
241–247. doi:10.1007/s10841-005-4830-1
Oleksa A, Ulrich W, Gawronski R (2007) Host tree preferences of
hermit beetles (Osmoderma eremita Scop., Coleoptera:
Scarabaeidae) in a network of rural avenues in Poland. Pol J
Ecol 55:315–323
Oleksa A, Chybicki IJ, Gawronski R, Svensson GP, Burczyk J
(2013a) Isolation by distance in saproxylic beetles may increase
with niche specialization. J Insect Conserv. doi:10.1007/s10841-
012-9499-7
Oleksa A, Tofilski A, Gawronski R, Tofilski A (2013b) Rural avenues
as a refuge for feral honey bee population. J Insect Conserv
17:465–472. doi:10.1007/s10841-012-9528-6
Ouin A, Burel F (2002) Influence of herbaceous elements on butterfly
diversity in hedgerow agricultural landscapes. Agric Ecosyst
Environ 93:45–53. doi:10.1016/S0167-8809(02)00004-X
Oyler-McCance SJ, Fedy BC, Landguth EL (2013) Sample design
effects in landscape genetics. Conserv Genet 14:275–285.
doi:10.1007/s10592-012-0415-1
Pawłowski J, Kubisz D, Mazur M (2002) Coleoptera—chrzaszcze. In:
Głowacinski Z (ed) Czerwona lista zwierzat ginacych i za-
gro _zonych w Polsce. Instytut Ochrony Przyrody PAN, Krakow
Pradines C (2009) Road infrastructures: tree avenues in the landscape.
5th Council of europe conference on the european landscape
convention. Document CEP-CDPATEP (2009) 15E. Council of
Europe, Strasbourg
R Developement Core Team R (2013) R: a language and environment
for statistical computing. R Foundation for Statistical Comput-
ing, Vienna
Ranius T, Hedin J (2001) The dispersal rate of a beetle, Osmoderma
eremita, living in tree hollows. Oecologia 126:363–370. doi:10.
1007/s004420000529
Ries L, Debinski DM (2001) Butterfly responses to habitat edges in
the highly fragmented prairies of Central Iowa. J Anim Ecol
70:840–852. doi:10.1046/j.0021-8790.2001.00546.x
Rousset F (1997) Genetic differentiation and estimation of gene flow
from F-statistics under isolation by distance. Genetics 145:
1219–1228
Rousset F (2000) Genetic differentiation between individuals. J Evol
Biol 13:58–62. doi:10.1046/j.1420-9101.2000.00137.x
Row JR, Blouin-Demers G, Lougheed SC (2010) Habitat distribution
influences dispersal and fine-scale genetic population structure of
eastern foxsnakes (Mintonius gloydi) across a fragmented
landscape. Mol Ecol 19:5157–5171. doi:10.1111/j.1365-294X.
2010.04872.x
Schwartz MK, Copeland JP, Anderson NJ, Squires JR, Inman RM,
McKelvey KS, Pilgrim KL, Waits LP, Cushman SA (2009)
Wolverine gene flow across a narrow climatic niche. Ecology
90:3222–3232. doi:10.1890/08-1287.1
Skorka P, Lenda M, Moron D, Kalarus K, Tryjanowski P (2013)
Factors affecting road mortality and the suitability of road verges
for butterflies. Biol Conserv 159:148–157. doi:10.1016/j.biocon.
2012.12.028
Spear SF, Balkenhol N, Fortin M-J, McRae BH, Scribner K (2010)
Use of resistance surfaces for landscape genetic studies:
considerations for parameterization and analysis. Mol Ecol
19:3576–3591. doi:10.1111/j.1365-294X.2010.04657.x
Stamps JA, Krishnan VV, Reid ML (2005) Search costs and habitat
selection by dispersers. Ecology 86:510–518. doi:10.1890/04-
0516
Sturges H (1926) The choice of a class interval. J Am Stat Assoc
21:65–66
Svensson GP, Larsson MC (2008) Enantiomeric specificity in a
pheromone-kairomone system of two threatened saproxylic
beetles, Osmoderma eremita and Elater ferrugineus. J Chem
Ecol 34:189–197. doi:10.1007/s10886-007-9423-x
Svensson GP, Larsson MC, Hedin J (2004) Attraction of the larval predator
Elater ferrugineus to the sex pheromone of its prey, Osmoderma
eremita, and its implication for conservation biology. J Chem Ecol
30:353–363. doi:10.1023/B:JOEC.0000017982.51642.8c
Svensson GP, Sahlin U, Brage B, Larsson MC (2011) Should I stay or
should I go? Modelling dispersal strategies in saproxylic insects
based on pheromone capture and radio telemetry: a case study on
the threatened hermit beetle Osmoderma eremita. Biodivers
Conserv 20:2883–2902. doi:10.1007/s10531-011-0150-9
QGIS Development Team (2012) QGIS geographic information
system. Open Source Geospatial Foundation Project. http://qgis.
osgeo.org.qgisorg
Tewksbury JJ, Levey DJ, Haddad NM, Sargent S, Orrock JL, Weldon
A, Danielson BJ, Brinkerhoff J, Damschen EI, Townsend P (2002)
Corridors affect plants, animals, and their interactions in frag-
mented landscapes. Proc Natl Acad Sci USA 99:12923–12926.
doi:10.1073/pnas.202242699
Tolasch T, Von Fragstein M, Steidle JLM (2007) Sex pheromone of
Elater ferrugineus L. (Coleoptera: Elateridae). J Chem Ecol
33:2156–2166. doi:10.1007/s10886-007-9365-3
Travis JMJ, Dytham C (1999) Habitat persistence, habitat availability
and the evolution of dispersal. Proc R Soc B Biol Sci 266:723.
doi:10.1098/rspb.1999.0696
van Etten J (2014) gdistance: distances and routes on grids. R package
version 3.1.0. http://CRAN.R-project.org/package=gdistance
Vekemans X, Hardy OJ (2004) New insights from fine-scale spatial
genetic structure analyses in plant populations. Mol Ecol
13:921–935. doi:10.1046/j.1365-294X.2004.02076.x
Vekemans X, Beauwens T, Lemaire M, Roldan-Ruiz I (2002) Data
from amplified fragment length polymorphism (AFLP) markers
show indication of size homoplasy and of a relationship between
degree of homoplasy and fragment size. Mol Ecol 11:139–151.
doi:10.1046/j.0962-1083.2001.01415.x
von Schrotter FL (1812) Karte von Ost-Preussen nebst Preussisch
Litthauen und West-Preussen nebst dem Netzdistrict. S. Schropp
& Company, Berlin
Vos P, Hogers R, Bleeker M, Reijans M, Van De Lee T, Hornes M,
Frijters A, Pot J, Peleman J, Kuiper M (1995) AFLP: a new
technique for DNA fingerprinting. Nucleic Acids Res
23:4407–4414. doi:10.1093/nar/23.21.4407
Walker MP, Dover JW, Sparks TH, Hinsley SA (2006) Hedges and
green lanes: vegetation composition and structure. Biodivers
Conserv 15:2595–2610. doi:10.1007/s10531-005-4879-x
Whitlock R, Hipperson H, Mannarelli M, Butlin RK, Burke T (2008)
An objective, rapid and reproducible method for scoring AFLP
peak-height data that minimizes genotyping error. Mol Ecol
Resour 8:725–735. doi:10.1111/j.1471-8286.2007.02073.x
J Insect Conserv
123

Williams WI, Robertson IC (2008) Using automated flight mills to
manipulate fat reserves in Douglas-fir beetles (Coleoptera:
Curculionidae). Environ Entomol 37:850–856. doi:10.1603/
0046-225X(2008)37[850:UAFMTM]2.0.CO;2
Wright S (1943) Isolation by distance. Genetics 28:114–138
Zauli A, Chiari S, Hedenstrom E, Svensson GP, Carpaneto GM
(2014) Using odour traps for population monitoring and
dispersal analysis of the threatened saproxylic beetles Osmoder-
ma eremita and Elater ferrugineus in central Italy. J Insect
Conserv 18:801–813. doi:10.1007/s10841-014-9687-8
Zeller KA, McGarigal K, Whiteley AR (2012) Estimating landscape
resistance to movement: a review. Landsc Ecol 27:777–797.
doi:10.1007/s10980-012-9737-0
J Insect Conserv
123


