Embed Size (px)
Citation preview
ARTICLE
Chemical tools for epichaperome-mediatedinteractome dysfunctions of the centralnervous systemAlexander Bolaender1,11, Danuta Zatorska1,11, Huazhong He1,11, Suhasini Joshi1,11, Sahil Sharma1,11,
Chander S. Digwal1,11, Hardik J. Patel1, Weilin Sun1, Brandon S. Imber 1, Stefan O. Ochiana1, Maulik R. Patel1,
Liza Shrestha1, Smit. K. Shah1, Shuo Wang1, Rashad Karimov 1, Hui Tao1, Pallav D. Patel1,
Ananda Rodilla Martin1, Pengrong Yan 1, Palak Panchal1, Justina Almodovar1, Adriana Corben2,
Andreas Rimner 3, Stephen D. Ginsberg 4,5, Serge Lyashchenko6, Eva Burnazi6, Anson Ku7, Teja Kalidindi7,
Sang Gyu Lee7, Milan Grkovski 8, Bradley J. Beattie8, Pat Zanzonico8, Jason S. Lewis 6,7, Steve Larson7,
Anna Rodina1,12, Nagavarakishore Pillarsetty 7,12, Viviane Tabar9, Mark P. Dunphy 7, Tony Taldone1,12,
Fumiko Shimizu 1,9✉ & Gabriela Chiosis 1,10,12✉
Diseases are a manifestation of how thousands of proteins interact. In several diseases, such
as cancer and Alzheimer’s disease, proteome-wide disturbances in protein-protein interac-
tions are caused by alterations to chaperome scaffolds termed epichaperomes.
Epichaperome-directed chemical probes may be useful for detecting and reversing defective
chaperomes. Here we provide structural, biochemical, and functional insights into the dis-
covery of epichaperome probes, with a focus on their use in central nervous system diseases.
We demonstrate on-target activity and kinetic selectivity of a radiolabeled epichaperome
probe in both cells and mice, together with a proof-of-principle in human patients in an
exploratory single group assignment diagnostic study (ClinicalTrials.gov Identifier:
NCT03371420). The clinical study is designed to determine the pharmacokinetic parameters
and the incidence of adverse events in patients receiving a single microdose of the radi-
olabeled probe administered by intravenous injection. In sum, we introduce a discovery
platform for brain-directed chemical probes that specifically modulate epichaperomes and
provide proof-of-principle applications in their use in the detection, quantification, and
modulation of the target in complex biological systems.
https://doi.org/10.1038/s41467-021-24821-2 OPEN
1 Program in Chemical Biology, Sloan Kettering Institute, New York, NY, USA. 2Department of Pathology, Memorial Sloan Kettering Cancer Center, New York,NY, USA. 3 Department of Radiation Oncology, Memorial Sloan Kettering Cancer Center, New York, NY, USA. 4 Center for Dementia Research, Nathan KlineInstitute, Orangeburg, NY, USA. 5Departments of Psychiatry, Neuroscience & Physiology and the NYU Neuroscience Institute, NYU Grossman School ofMedicine, New York, NY, USA. 6 Radiochemistry and Molecular Imaging Probes Core, Sloan Kettering Institute, New York, NY, USA. 7Department ofRadiology, Memorial Sloan Kettering Cancer Center, New York, NY, USA. 8Department of Medical Physics, Memorial Sloan Kettering Cancer Center, NewYork, NY, USA. 9Department of Neurosurgery, Memorial Sloan Kettering Cancer Center, New York, NY, USA. 10 Breast Cancer Medicine Service, MemorialSloan Kettering Cancer Center, New York, NY, USA. 11These authors contributed equally: Alexander Bolaender, Danuta Zatorska, Huazhong He, Suhasini Joshi,Sahil Sharma, Chander S. Digwal. 12These authors jointly supervised this work: Anna Rodina, Nagavarakishore Pillarsetty, Tony Taldone, Gabriela Chiosis.✉email: [email protected]; [email protected]
NATURE COMMUNICATIONS | (2021) 12:4669 | https://doi.org/10.1038/s41467-021-24821-2 | www.nature.com/naturecommunications 1
1234
5678
90():,;
Most proteins do not act alone – they interact with othersin the cellular milieu and it is the architecture of thesecombined interactions that defines the activity of pro-
tein pathways, and in turn the cellular phenotype1. Detecting andmodulating aberrant protein–protein interactions (PPIs) in thecontext of disease is therefore of critical importance as it may leadto biomarkers and drugs that detect and target dysfunctions inproteome-wide connectivity (i.e., edgetic perturbations withininteractome networks) rather than individual gene or proteindefects2–5.
The chaperome, a large assembly of >300 chaperones, co-chaperones, and related factors6, is considered a safeguard ofproteome function and a regulator of protein assembly7. Throughlow affinity and transient interactions, chaperome membersinteract with components of the proteome with the end goal offolding proteins, transporting them to a proper cellular locationor facilitating their assembly into protein complexes8–11. Thechaperome is one of the most abundant protein assemblies inhuman cells and in turn in the human body, also prevalent in allcell types and tissues12. Cellular stressors appear to disturb thedynamic nature of such interactions, and stabilized oligomericchaperone species, later dubbed as epichaperomes, were reportedon Native PAGE in cells exposed to stressors such as heat stress,glucose deprivation, or a toxin such as antimycin A7. Such stableand soluble heterooligomeric chaperome pools, also identified intumors, Parkinson’s disease (PD) neurons, and Alzheimer’s dis-ease (AD) brain tissues, work as scaffolding platforms rather thanin folding7. Heat shock protein 90 (HSP90) and heat shockcognate 70 (HSC70) chaperones play a central role in the for-mation of these epichaperome structures, yet it should be notedthere is a fundamental – structural, dynamic and functional –difference between the epichaperome and chaperones7,13–17.Epichaperomes are scaffolds – they rewire the connectivity andfunction of protein networks by remodeling how thousands ofproteins interact in conditions of chronic cellular stress (i.e. forexample in diseases such as cancers, AD, and PD)7,14,16. Con-versely, chaperones, co-chaperones, and their complexes interactwith a protein to process it through the chaperone foldingcycle18,19. Epichaperomes are long-lived oligomers of chaperomemembers7,13–17. Conversely, chaperones interact dynamicallywith one another and with client proteins on the millisecond tosecond timescale to make folding versus degradation decisionsthrough transient PPIs within the context of the proteostasisnetwork that are central to maintaining the cellular proteome.Epichaperomes are specific to cells exposed to specificstressors7,13–17. Conversely, chaperones are highly abundant andubiquitous proteins12. The fraction of HSP90 and HSC70 incor-porated into epichaperomes is minor when compared to the poolinvolved in folding functions7,13–17. In addition, and unlike theubiquitous chaperones, epichaperomes are localized to diseasedcells and tissues20,21.
A causal link between epichaperome formation and proteome-wide connectivity dysfunction was demonstrated in cancer, PD,and AD13,14,16,17. Through their scaffolding function, epicha-peromes pathologically rewire PPIs in these diverse diseases at theproteome-wide level. They cause thousands of proteins toimproperly organize inside cells, aberrantly affecting cellularphenotypes7. This realization posits epichaperomes as pathologicregulators of cellular stress of high significance in disease biology,and as surrogates for aberrant molecular interactions in disease.Therefore, the availability of chemical probes to study the func-tion of these assemblies as well as drug candidates to dismantlethem are of high significance.
Protein structure, dynamics, and function are interdependent,and in this sense, the chaperones HSP90 and HSC70 becomedistinct entities when part of the epichaperome. In their folding
function, chaperones form short-lived dynamic complexes withindividual proteins. Conversely, epichaperomes are stabilizedcomplexes comprising multiple chaperones and co-chaperones.These features provide an opportunity for the specific interactionof small molecules through kinetic selectivity22,23 to discriminatethe epichaperomes from the more abundant chaperomeproteins15,21. One such small molecule is PU-H71 (1). Whileinitially discovered as an HSP90 inhibitor24, later studies sug-gested it kinetically prefers a tumor enriched pool25–28 that wassubsequently identified to be the epichaperome21. It dissociatesfrom epichaperomes much slower (koff of several hours) thanfrom other cellular pools of HSP90 (koff of minutes)13,15. PU-H71and associated probes have therefore played an important role indeciphering the causative link between disease-inducing stressors,epichaperome formation, and proteome-wide interactome net-work dysfunction14,17,21. PU-H71 however does not permeate theblood–brain barrier (BBB) rendering it of limited use in the studyand treatment of diseases of the central nervous system (CNS).
The BBB plays an important role in maintaining homeostasisin the CNS by restricting the transport of potentially toxicmolecules. The ability to deliver agents into the CNS is thereforeseverely hindered by the BBB, often resulting in minimal bioa-vailability of drugs and presents as a major obstacle to detectingand treating CNS disorders29. The BBB is composed of a singlelayer of endothelial cells connected by tight junctions. Brainmicrovascular endothelial cells lack fenestrations, have fewpinocytotic vesicles, and express a variety of metabolic enzymesand membrane efflux transporters, such as P-glycoprotein(Pgp)30. These features make the BBB a formidable barrier thatsmall molecules must overcome to reach the brain parenchyma,and it is estimated that >98% of organic small molecules do notcross the BBB31.
To overcome such limitations, we here introduce a discoveryplatform – from structural and biochemical insights to in vivotesting – for the discovery of BBB-permeable epichaperomeprobes. We provide proof-of-principle both in mice and humansthat the platform may yield a toolset consisting of probes to study,detect, and treat epichaperome-mediated interactome dysfunc-tions of the CNS. We here identify PU-HZ151 and radiolabeledPU-HZ151 for which we provide cellular and organismal levelevidence for their selectivity for epichaperomes over the individualchaperome members, and for their ability to productively engagethe target in cells, mice, and humans. We also provide proof-of-principle showcasing the use of the toolset in disease study, usingbrain cancer as a model. In addition to classical models of disease,the toolset is applicable to human patients, defining them astranslational agents. Supportive of their significance, these probesare now studied in clinical trials in human patients to detect andtreat diseases of the CNS (NCT03371420, NCT03935568,NCT04311515, NCT04505358, and NCT04782609).
ResultsEpichaperome probe design. HSP90 is a key component ofepichaperomes and PU-H71 interacts with epichaperomesthrough insertion into the N-terminal domain pocket of theHSP9013. This pocket is highly flexible and in its free state existsin different conformations32. Crystal structures of HSP90 with avariety of small molecule ligands also show a high plasticity inbinding, particularly in helix 3. For example, PU-H71 bound toHSP90α unveils a subpocket in this region, with the 8-aryl moietyof PU-H71 exposing a lipophilic cavity whereby the phenyl ringbecomes stacked between Phe138 and Leu107 (PDB:2FWZ)33.This so-called ‘helix’ conformation binding mechanism (Fig. 1a)was observed for some but not all HSP90-ligands32. For example,geldanamycin (2) prefers a so-called ‘loop’ pocket conformation
ARTICLE NATURE COMMUNICATIONS | https://doi.org/10.1038/s41467-021-24821-2
2 NATURE COMMUNICATIONS | (2021) 12:4669 | https://doi.org/10.1038/s41467-021-24821-2 | www.nature.com/naturecommunications
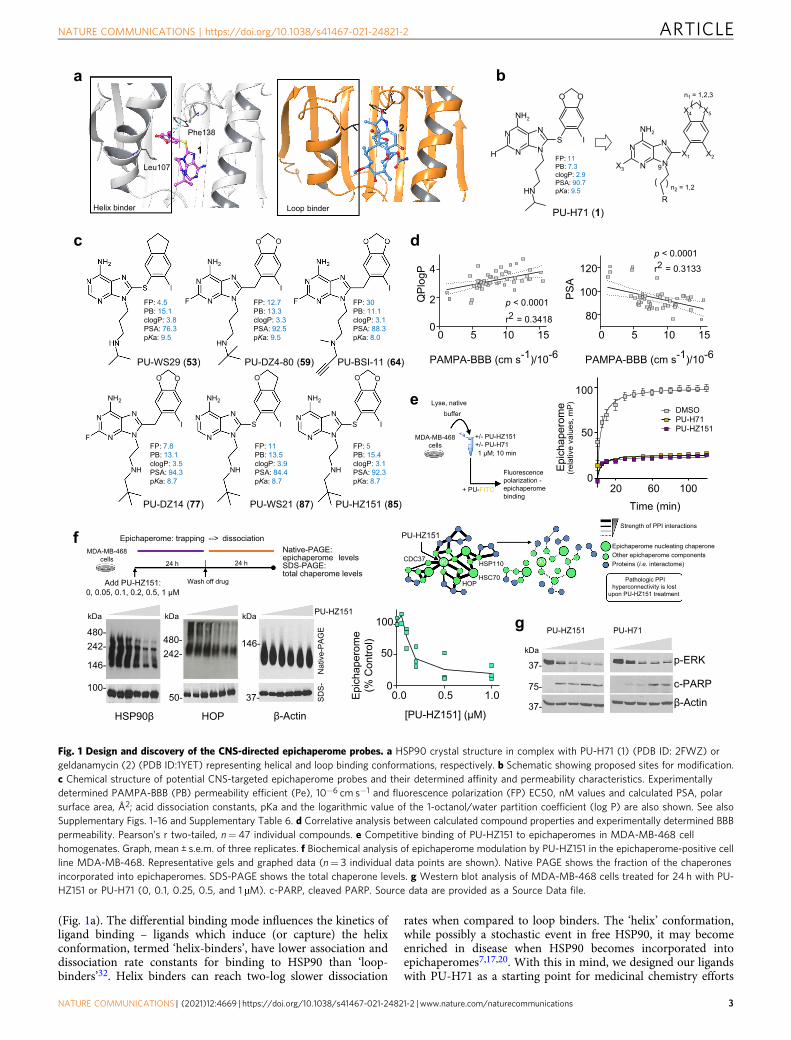
(Fig. 1a). The differential binding mode influences the kinetics ofligand binding – ligands which induce (or capture) the helixconformation, termed ‘helix-binders’, have lower association anddissociation rate constants for binding to HSP90 than ‘loop-binders’32. Helix binders can reach two-log slower dissociation
rates when compared to loop binders. The ‘helix’ conformation,while possibly a stochastic event in free HSP90, it may becomeenriched in disease when HSP90 becomes incorporated intoepichaperomes7,17,20. With this in mind, we designed our ligandswith PU-H71 as a starting point for medicinal chemistry efforts
a
Loop binderHelix binder
Phe138
Leu107
1
2
N
NN
N
NH2
S
NH
I
O
N
NN
N
NH2
HN
I
O
OOOO
O
F
b
c
N
NN
N
NH2
NH
I
F
N
NN
N
NH2
S
NH
I
PU-WS29 (53) PU-DZ4-80 (59)
PU-HZ151 (85)PU-WS21 (87)
N
NN
N
NH2
S
HN
I
H
OO
N
NN
N
NH2
X1
R
X2
X4 X5
X3
n1 = 1,2,3
9
n2 = 1,2
PU-H71 (1)
PU-BSI-11 (64)
PU-DZ14 (77)
FP: 5PB: 15.4clogP: 3.1PSA: 92.3pKa: 8.7
FP: 11PB: 13.5clogP: 3.9PSA: 84.4pKa: 8.7
FP: 7.8PB: 13.1clogP: 3.5PSA: 94.3pKa: 8.7
FP: 4.5PB: 15.1clogP: 3.8PSA: 76.3pKa: 9.5
FP: 12.7PB: 13.3clogP: 3.3PSA: 92.5pKa: 9.5
FP: 30PB: 11.1clogP: 3.1PSA: 88.3pKa: 8.0
FP: 11PB: 7.3clogP: 2.9PSA: 90.7pKa: 9.5
QPl
ogP
PSA
p < 0.0001r2 = 0.3133
p < 0.0001
r2 = 0.3418
120
100
80
0 150
2
4
f
Pathologic PPI hyperconnectivity is lost
upon PU-HZ151 treatment
MDA-MB-468 cells 24 h 24 h
Native-PAGE: epichaperome levels SDS-PAGE: total chaperome levels
Add PU-HZ151: 0, 0.05, 0.1, 0.2, 0.5, 1 μM
100-
HOPHSP90β β-Actin
146-
242- 480-
SDS-
N
ativ
e-PA
GE
PU-HZ151
5 10
Strength of PPI interactions
Epichaperome nucleating chaperoneOther epichaperome components Proteins (i.e. interactome)
d
Epic
hape
rom
e(%
Con
trol)
Wash off drug
Epichaperome: trapping --> dissociation
CDC37 90 HSP110 90
HSC70HOP
e
+ PU-FITC
Lyse, native buffer
+/- PU-HZ151
Fluorescence polarization - epichaperome binding
Epic
hape
rom
e(re
lativ
e va
lues
, mP)
MDA-MB-468 cells +/- PU-H71
1 μM; 10 min
0
50
100
20Time (min)
60 100
DMSOPU-H71PU-HZ151
PU-HZ151
β-Actin
p-ERK
c-PARP
37-
75-
37-
PU-HZ151 PU-H71g
0.0
[PU-HZ151] (μM)
1.00
50
100
0
PAMPA-BBB (cm s-1)/10-6
155 10
PAMPA-BBB (cm s-1)/10-6
242- 480-
50- 37-
146-
0.5
kDa kDa kDa
kDa
Fig. 1 Design and discovery of the CNS-directed epichaperome probes. a HSP90 crystal structure in complex with PU-H71 (1) (PDB ID: 2FWZ) orgeldanamycin (2) (PDB ID:1YET) representing helical and loop binding conformations, respectively. b Schematic showing proposed sites for modification.c Chemical structure of potential CNS-targeted epichaperome probes and their determined affinity and permeability characteristics. Experimentallydetermined PAMPA-BBB (PB) permeability efficient (Pe), 10−6 cm s−1 and fluorescence polarization (FP) EC50, nM values and calculated PSA, polarsurface area, Å2; acid dissociation constants, pKa and the logarithmic value of the 1-octanol/water partition coefficient (log P) are also shown. See alsoSupplementary Figs. 1–16 and Supplementary Table 6. d Correlative analysis between calculated compound properties and experimentally determined BBBpermeability. Pearson’s r two-tailed, n= 47 individual compounds. e Competitive binding of PU-HZ151 to epichaperomes in MDA-MB-468 cellhomogenates. Graph, mean ± s.e.m. of three replicates. f Biochemical analysis of epichaperome modulation by PU-HZ151 in the epichaperome-positive cellline MDA-MB-468. Representative gels and graphed data (n= 3 individual data points are shown). Native PAGE shows the fraction of the chaperonesincorporated into epichaperomes. SDS-PAGE shows the total chaperone levels. g Western blot analysis of MDA-MB-468 cells treated for 24 h with PU-HZ151 or PU-H71 (0, 0.1, 0.25, 0.5, and 1 µM). c-PARP, cleaved PARP. Source data are provided as a Source Data file.
NATURE COMMUNICATIONS | https://doi.org/10.1038/s41467-021-24821-2 ARTICLE
NATURE COMMUNICATIONS | (2021) 12:4669 | https://doi.org/10.1038/s41467-021-24821-2 | www.nature.com/naturecommunications 3
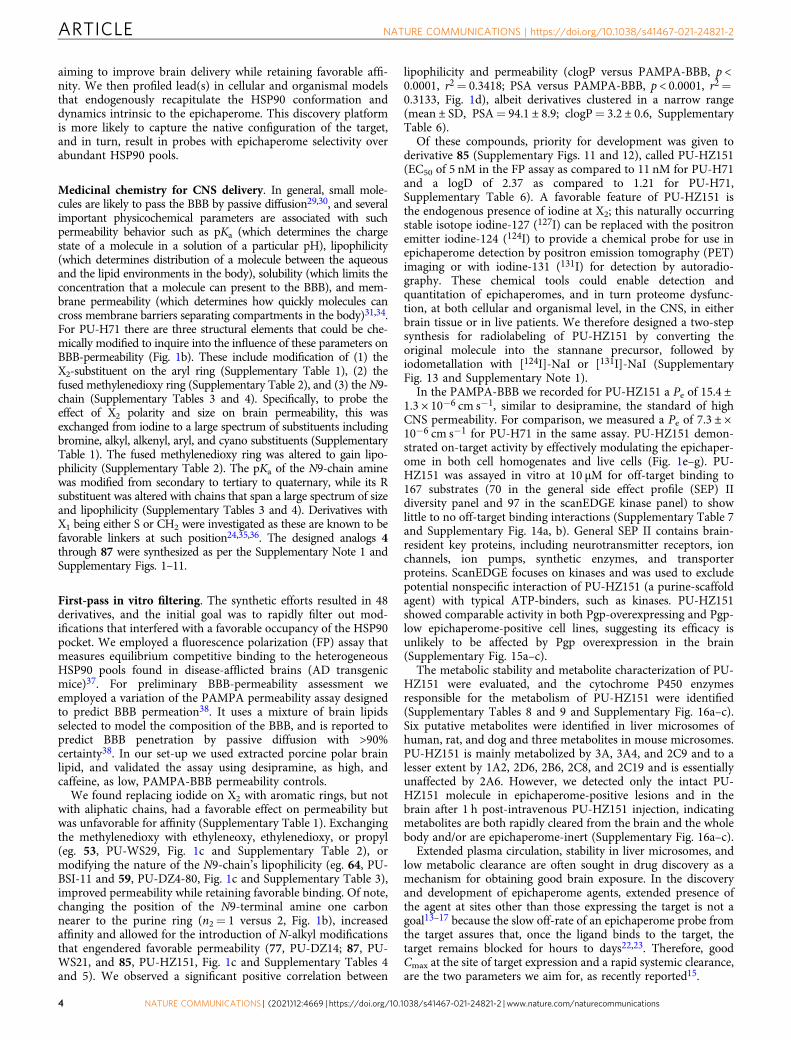
aiming to improve brain delivery while retaining favorable affi-nity. We then profiled lead(s) in cellular and organismal modelsthat endogenously recapitulate the HSP90 conformation anddynamics intrinsic to the epichaperome. This discovery platformis more likely to capture the native configuration of the target,and in turn, result in probes with epichaperome selectivity overabundant HSP90 pools.
Medicinal chemistry for CNS delivery. In general, small mole-cules are likely to pass the BBB by passive diffusion29,30, and severalimportant physicochemical parameters are associated with suchpermeability behavior such as pKa (which determines the chargestate of a molecule in a solution of a particular pH), lipophilicity(which determines distribution of a molecule between the aqueousand the lipid environments in the body), solubility (which limits theconcentration that a molecule can present to the BBB), and mem-brane permeability (which determines how quickly molecules cancross membrane barriers separating compartments in the body)31,34.For PU-H71 there are three structural elements that could be che-mically modified to inquire into the influence of these parameters onBBB-permeability (Fig. 1b). These include modification of (1) theX2-substituent on the aryl ring (Supplementary Table 1), (2) thefused methylenedioxy ring (Supplementary Table 2), and (3) the N9-chain (Supplementary Tables 3 and 4). Specifically, to probe theeffect of X2 polarity and size on brain permeability, this wasexchanged from iodine to a large spectrum of substituents includingbromine, alkyl, alkenyl, aryl, and cyano substituents (SupplementaryTable 1). The fused methylenedioxy ring was altered to gain lipo-philicity (Supplementary Table 2). The pKa of the N9-chain aminewas modified from secondary to tertiary to quaternary, while its Rsubstituent was altered with chains that span a large spectrum of sizeand lipophilicity (Supplementary Tables 3 and 4). Derivatives withX1 being either S or CH2 were investigated as these are known to befavorable linkers at such position24,35,36. The designed analogs 4through 87 were synthesized as per the Supplementary Note 1 andSupplementary Figs. 1–11.
First-pass in vitro filtering. The synthetic efforts resulted in 48derivatives, and the initial goal was to rapidly filter out mod-ifications that interfered with a favorable occupancy of the HSP90pocket. We employed a fluorescence polarization (FP) assay thatmeasures equilibrium competitive binding to the heterogeneousHSP90 pools found in disease-afflicted brains (AD transgenicmice)37. For preliminary BBB-permeability assessment weemployed a variation of the PAMPA permeability assay designedto predict BBB permeation38. It uses a mixture of brain lipidsselected to model the composition of the BBB, and is reported topredict BBB penetration by passive diffusion with >90%certainty38. In our set-up we used extracted porcine polar brainlipid, and validated the assay using desipramine, as high, andcaffeine, as low, PAMPA-BBB permeability controls.
We found replacing iodide on X2 with aromatic rings, but notwith aliphatic chains, had a favorable effect on permeability butwas unfavorable for affinity (Supplementary Table 1). Exchangingthe methylenedioxy with ethyleneoxy, ethylenedioxy, or propyl(eg. 53, PU-WS29, Fig. 1c and Supplementary Table 2), ormodifying the nature of the N9-chain’s lipophilicity (eg. 64, PU-BSI-11 and 59, PU-DZ4-80, Fig. 1c and Supplementary Table 3),improved permeability while retaining favorable binding. Of note,changing the position of the N9-terminal amine one carbonnearer to the purine ring (n2= 1 versus 2, Fig. 1b), increasedaffinity and allowed for the introduction of N-alkyl modificationsthat engendered favorable permeability (77, PU-DZ14; 87, PU-WS21, and 85, PU-HZ151, Fig. 1c and Supplementary Tables 4and 5). We observed a significant positive correlation between
lipophilicity and permeability (clogP versus PAMPA-BBB, p <0.0001, r2= 0.3418; PSA versus PAMPA-BBB, p < 0.0001, r2=0.3133, Fig. 1d), albeit derivatives clustered in a narrow range(mean ± SD, PSA= 94.1 ± 8.9; clogP= 3.2 ± 0.6, SupplementaryTable 6).
Of these compounds, priority for development was given toderivative 85 (Supplementary Figs. 11 and 12), called PU-HZ151(EC50 of 5 nM in the FP assay as compared to 11 nM for PU-H71and a logD of 2.37 as compared to 1.21 for PU-H71,Supplementary Table 6). A favorable feature of PU-HZ151 isthe endogenous presence of iodine at X2; this naturally occurringstable isotope iodine-127 (127I) can be replaced with the positronemitter iodine-124 (124I) to provide a chemical probe for use inepichaperome detection by positron emission tomography (PET)imaging or with iodine-131 (131I) for detection by autoradio-graphy. These chemical tools could enable detection andquantitation of epichaperomes, and in turn proteome dysfunc-tion, at both cellular and organismal level, in the CNS, in eitherbrain tissue or in live patients. We therefore designed a two-stepsynthesis for radiolabeling of PU-HZ151 by converting theoriginal molecule into the stannane precursor, followed byiodometallation with [124I]-NaI or [131I]-NaI (SupplementaryFig. 13 and Supplementary Note 1).
In the PAMPA-BBB we recorded for PU-HZ151 a Pe of 15.4 ±1.3 × 10⁻⁶ cm s−1, similar to desipramine, the standard of highCNS permeability. For comparison, we measured a Pe of 7.3 ± ×10−6 cm s−1 for PU-H71 in the same assay. PU-HZ151 demon-strated on-target activity by effectively modulating the epichaper-ome in both cell homogenates and live cells (Fig. 1e–g). PU-HZ151 was assayed in vitro at 10 µM for off-target binding to167 substrates (70 in the general side effect profile (SEP) IIdiversity panel and 97 in the scanEDGE kinase panel) to showlittle to no off-target binding interactions (Supplementary Table 7and Supplementary Fig. 14a, b). General SEP II contains brain-resident key proteins, including neurotransmitter receptors, ionchannels, ion pumps, synthetic enzymes, and transporterproteins. ScanEDGE focuses on kinases and was used to excludepotential nonspecific interaction of PU-HZ151 (a purine-scaffoldagent) with typical ATP-binders, such as kinases. PU-HZ151showed comparable activity in both Pgp-overexpressing and Pgp-low epichaperome-positive cell lines, suggesting its efficacy isunlikely to be affected by Pgp overexpression in the brain(Supplementary Fig. 15a–c).
The metabolic stability and metabolite characterization of PU-HZ151 were evaluated, and the cytochrome P450 enzymesresponsible for the metabolism of PU-HZ151 were identified(Supplementary Tables 8 and 9 and Supplementary Fig. 16a–c).Six putative metabolites were identified in liver microsomes ofhuman, rat, and dog and three metabolites in mouse microsomes.PU-HZ151 is mainly metabolized by 3A, 3A4, and 2C9 and to alesser extent by 1A2, 2D6, 2B6, 2C8, and 2C19 and is essentiallyunaffected by 2A6. However, we detected only the intact PU-HZ151 molecule in epichaperome-positive lesions and in thebrain after 1 h post-intravenous PU-HZ151 injection, indicatingmetabolites are both rapidly cleared from the brain and the wholebody and/or are epichaperome-inert (Supplementary Fig. 16a–c).
Extended plasma circulation, stability in liver microsomes, andlow metabolic clearance are often sought in drug discovery as amechanism for obtaining good brain exposure. In the discoveryand development of epichaperome agents, extended presence ofthe agent at sites other than those expressing the target is not agoal13–17 because the slow off-rate of an epichaperome probe fromthe target assures that, once the ligand binds to the target, thetarget remains blocked for hours to days22,23. Therefore, goodCmax at the site of target expression and a rapid systemic clearance,are the two parameters we aim for, as recently reported15.
ARTICLE NATURE COMMUNICATIONS | https://doi.org/10.1038/s41467-021-24821-2
4 NATURE COMMUNICATIONS | (2021) 12:4669 | https://doi.org/10.1038/s41467-021-24821-2 | www.nature.com/naturecommunications
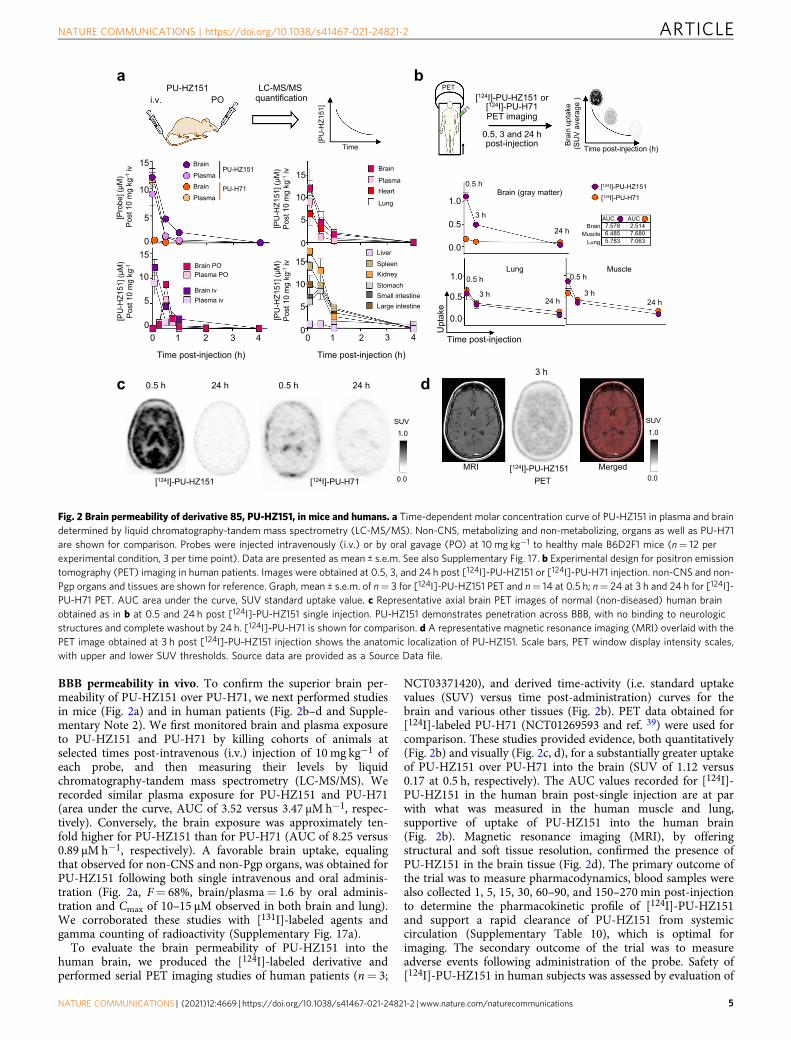
BBB permeability in vivo. To confirm the superior brain per-meability of PU-HZ151 over PU-H71, we next performed studiesin mice (Fig. 2a) and in human patients (Fig. 2b–d and Supple-mentary Note 2). We first monitored brain and plasma exposureto PU-HZ151 and PU-H71 by killing cohorts of animals atselected times post-intravenous (i.v.) injection of 10 mg kg−1 ofeach probe, and then measuring their levels by liquidchromatography-tandem mass spectrometry (LC-MS/MS). Werecorded similar plasma exposure for PU-HZ151 and PU-H71(area under the curve, AUC of 3.52 versus 3.47 µM h−1, respec-tively). Conversely, the brain exposure was approximately ten-fold higher for PU-HZ151 than for PU-H71 (AUC of 8.25 versus0.89 µM h−1, respectively). A favorable brain uptake, equalingthat observed for non-CNS and non-Pgp organs, was obtained forPU-HZ151 following both single intravenous and oral adminis-tration (Fig. 2a, F= 68%, brain/plasma= 1.6 by oral adminis-tration and Cmax of 10–15 µM observed in both brain and lung).We corroborated these studies with [131I]-labeled agents andgamma counting of radioactivity (Supplementary Fig. 17a).
To evaluate the brain permeability of PU-HZ151 into thehuman brain, we produced the [124I]-labeled derivative andperformed serial PET imaging studies of human patients (n= 3;
NCT03371420), and derived time-activity (i.e. standard uptakevalues (SUV) versus time post-administration) curves for thebrain and various other tissues (Fig. 2b). PET data obtained for[124I]-labeled PU-H71 (NCT01269593 and ref. 39) were used forcomparison. These studies provided evidence, both quantitatively(Fig. 2b) and visually (Fig. 2c, d), for a substantially greater uptakeof PU-HZ151 over PU-H71 into the brain (SUV of 1.12 versus0.17 at 0.5 h, respectively). The AUC values recorded for [124I]-PU-HZ151 in the human brain post-single injection are at parwith what was measured in the human muscle and lung,supportive of uptake of PU-HZ151 into the human brain(Fig. 2b). Magnetic resonance imaging (MRI), by offeringstructural and soft tissue resolution, confirmed the presence ofPU-HZ151 in the brain tissue (Fig. 2d). The primary outcome ofthe trial was to measure pharmacodynamics, blood samples werealso collected 1, 5, 15, 30, 60–90, and 150–270 min post-injectionto determine the pharmacokinetic profile of [124I]-PU-HZ151and support a rapid clearance of PU-HZ151 from systemiccirculation (Supplementary Table 10), which is optimal forimaging. The secondary outcome of the trial was to measureadverse events following administration of the probe. Safety of[124I]-PU-HZ151 in human subjects was assessed by evaluation of
a b
c d
Fig. 2 Brain permeability of derivative 85, PU-HZ151, in mice and humans. a Time-dependent molar concentration curve of PU-HZ151 in plasma and braindetermined by liquid chromatography-tandem mass spectrometry (LC-MS/MS). Non-CNS, metabolizing and non-metabolizing, organs as well as PU-H71are shown for comparison. Probes were injected intravenously (i.v.) or by oral gavage (PO) at 10mg kg−1 to healthy male B6D2F1 mice (n= 12 perexperimental condition, 3 per time point). Data are presented as mean ± s.e.m. See also Supplementary Fig. 17. b Experimental design for positron emissiontomography (PET) imaging in human patients. Images were obtained at 0.5, 3, and 24 h post [124I]-PU-HZ151 or [124I]-PU-H71 injection. non-CNS and non-Pgp organs and tissues are shown for reference. Graph, mean ± s.e.m. of n= 3 for [124I]-PU-HZ151 PET and n= 14 at 0.5 h; n= 24 at 3 h and 24 h for [124I]-PU-H71 PET. AUC area under the curve, SUV standard uptake value. c Representative axial brain PET images of normal (non-diseased) human brainobtained as in b at 0.5 and 24 h post [124I]-PU-HZ151 single injection. PU-HZ151 demonstrates penetration across BBB, with no binding to neurologicstructures and complete washout by 24 h. [124I]-PU-H71 is shown for comparison. d A representative magnetic resonance imaging (MRI) overlaid with thePET image obtained at 3 h post [124I]-PU-HZ151 injection shows the anatomic localization of PU-HZ151. Scale bars, PET window display intensity scales,with upper and lower SUV thresholds. Source data are provided as a Source Data file.
NATURE COMMUNICATIONS | https://doi.org/10.1038/s41467-021-24821-2 ARTICLE
NATURE COMMUNICATIONS | (2021) 12:4669 | https://doi.org/10.1038/s41467-021-24821-2 | www.nature.com/naturecommunications 5
the incidence, nature, and severity of adverse events andserious adverse events (Supplementary Note 2). No radio-iodinated probe-related toxicity was evident clinically or bylaboratory assay.
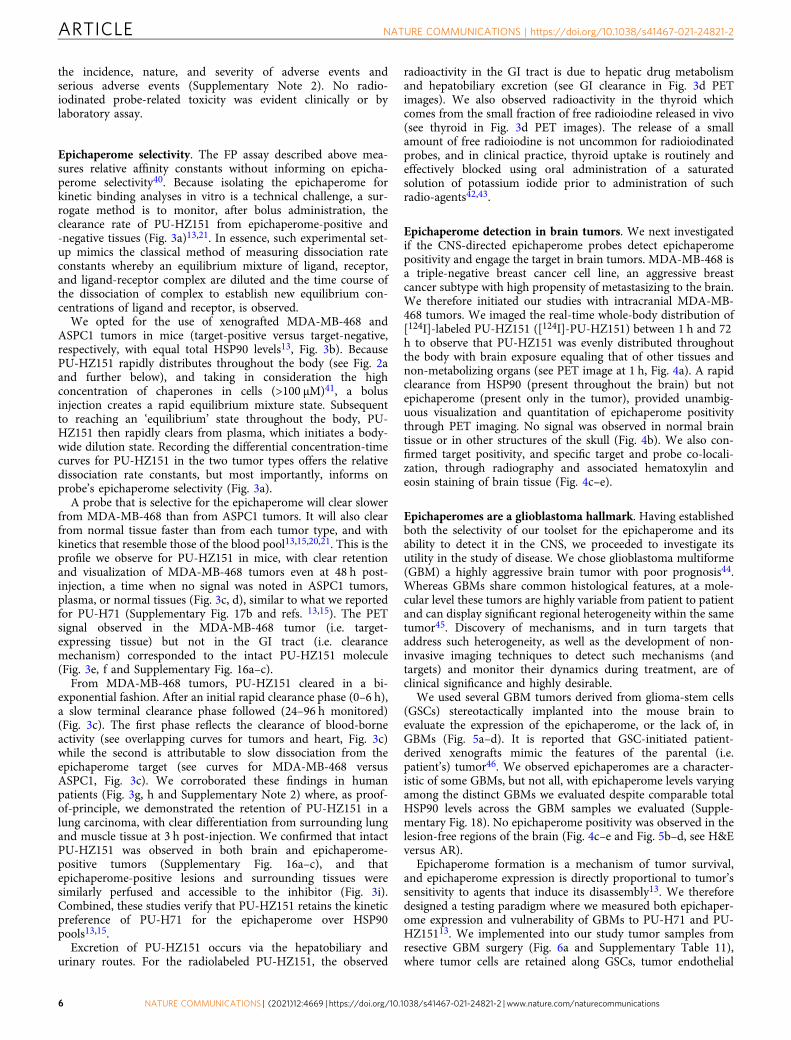
Epichaperome selectivity. The FP assay described above mea-sures relative affinity constants without informing on epicha-perome selectivity40. Because isolating the epichaperome forkinetic binding analyses in vitro is a technical challenge, a sur-rogate method is to monitor, after bolus administration, theclearance rate of PU-HZ151 from epichaperome-positive and-negative tissues (Fig. 3a)13,21. In essence, such experimental set-up mimics the classical method of measuring dissociation rateconstants whereby an equilibrium mixture of ligand, receptor,and ligand-receptor complex are diluted and the time course ofthe dissociation of complex to establish new equilibrium con-centrations of ligand and receptor, is observed.
We opted for the use of xenografted MDA-MB-468 andASPC1 tumors in mice (target-positive versus target-negative,respectively, with equal total HSP90 levels13, Fig. 3b). BecausePU-HZ151 rapidly distributes throughout the body (see Fig. 2aand further below), and taking in consideration the highconcentration of chaperones in cells (>100 µM)41, a bolusinjection creates a rapid equilibrium mixture state. Subsequentto reaching an ‘equilibrium’ state throughout the body, PU-HZ151 then rapidly clears from plasma, which initiates a body-wide dilution state. Recording the differential concentration-timecurves for PU-HZ151 in the two tumor types offers the relativedissociation rate constants, but most importantly, informs onprobe’s epichaperome selectivity (Fig. 3a).
A probe that is selective for the epichaperome will clear slowerfrom MDA-MB-468 than from ASPC1 tumors. It will also clearfrom normal tissue faster than from each tumor type, and withkinetics that resemble those of the blood pool13,15,20,21. This is theprofile we observe for PU-HZ151 in mice, with clear retentionand visualization of MDA-MB-468 tumors even at 48 h post-injection, a time when no signal was noted in ASPC1 tumors,plasma, or normal tissues (Fig. 3c, d), similar to what we reportedfor PU-H71 (Supplementary Fig. 17b and refs. 13,15). The PETsignal observed in the MDA-MB-468 tumor (i.e. target-expressing tissue) but not in the GI tract (i.e. clearancemechanism) corresponded to the intact PU-HZ151 molecule(Fig. 3e, f and Supplementary Fig. 16a–c).
From MDA-MB-468 tumors, PU-HZ151 cleared in a bi-exponential fashion. After an initial rapid clearance phase (0–6 h),a slow terminal clearance phase followed (24–96 h monitored)(Fig. 3c). The first phase reflects the clearance of blood-borneactivity (see overlapping curves for tumors and heart, Fig. 3c)while the second is attributable to slow dissociation from theepichaperome target (see curves for MDA-MB-468 versusASPC1, Fig. 3c). We corroborated these findings in humanpatients (Fig. 3g, h and Supplementary Note 2) where, as proof-of-principle, we demonstrated the retention of PU-HZ151 in alung carcinoma, with clear differentiation from surrounding lungand muscle tissue at 3 h post-injection. We confirmed that intactPU-HZ151 was observed in both brain and epichaperome-positive tumors (Supplementary Fig. 16a–c), and thatepichaperome-positive lesions and surrounding tissues weresimilarly perfused and accessible to the inhibitor (Fig. 3i).Combined, these studies verify that PU-HZ151 retains the kineticpreference of PU-H71 for the epichaperome over HSP90pools13,15.
Excretion of PU-HZ151 occurs via the hepatobiliary andurinary routes. For the radiolabeled PU-HZ151, the observed
radioactivity in the GI tract is due to hepatic drug metabolismand hepatobiliary excretion (see GI clearance in Fig. 3d PETimages). We also observed radioactivity in the thyroid whichcomes from the small fraction of free radioiodine released in vivo(see thyroid in Fig. 3d PET images). The release of a smallamount of free radioiodine is not uncommon for radioiodinatedprobes, and in clinical practice, thyroid uptake is routinely andeffectively blocked using oral administration of a saturatedsolution of potassium iodide prior to administration of suchradio-agents42,43.
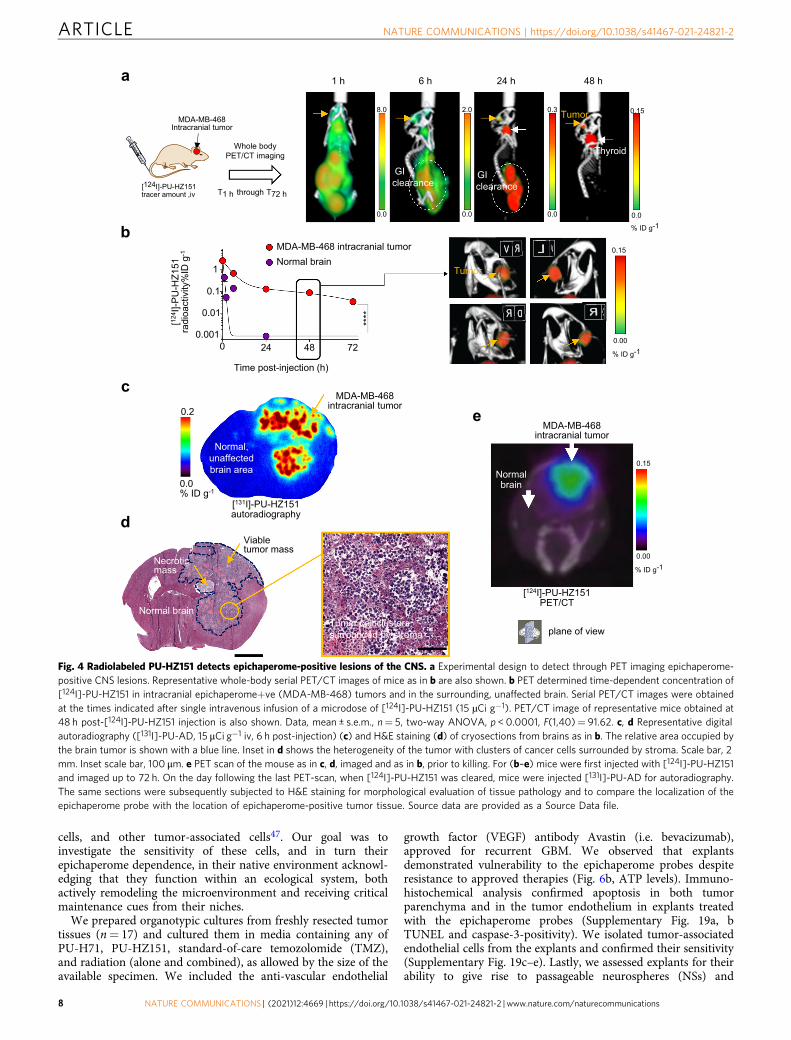
Epichaperome detection in brain tumors. We next investigatedif the CNS-directed epichaperome probes detect epichaperomepositivity and engage the target in brain tumors. MDA-MB-468 isa triple-negative breast cancer cell line, an aggressive breastcancer subtype with high propensity of metastasizing to the brain.We therefore initiated our studies with intracranial MDA-MB-468 tumors. We imaged the real-time whole-body distribution of[124I]-labeled PU-HZ151 ([124I]-PU-HZ151) between 1 h and 72h to observe that PU-HZ151 was evenly distributed throughoutthe body with brain exposure equaling that of other tissues andnon-metabolizing organs (see PET image at 1 h, Fig. 4a). A rapidclearance from HSP90 (present throughout the brain) but notepichaperome (present only in the tumor), provided unambig-uous visualization and quantitation of epichaperome positivitythrough PET imaging. No signal was observed in normal braintissue or in other structures of the skull (Fig. 4b). We also con-firmed target positivity, and specific target and probe co-locali-zation, through radiography and associated hematoxylin andeosin staining of brain tissue (Fig. 4c–e).
Epichaperomes are a glioblastoma hallmark. Having establishedboth the selectivity of our toolset for the epichaperome and itsability to detect it in the CNS, we proceeded to investigate itsutility in the study of disease. We chose glioblastoma multiforme(GBM) a highly aggressive brain tumor with poor prognosis44.Whereas GBMs share common histological features, at a mole-cular level these tumors are highly variable from patient to patientand can display significant regional heterogeneity within the sametumor45. Discovery of mechanisms, and in turn targets thataddress such heterogeneity, as well as the development of non-invasive imaging techniques to detect such mechanisms (andtargets) and monitor their dynamics during treatment, are ofclinical significance and highly desirable.
We used several GBM tumors derived from glioma-stem cells(GSCs) stereotactically implanted into the mouse brain toevaluate the expression of the epichaperome, or the lack of, inGBMs (Fig. 5a–d). It is reported that GSC-initiated patient-derived xenografts mimic the features of the parental (i.e.patient’s) tumor46. We observed epichaperomes are a character-istic of some GBMs, but not all, with epichaperome levels varyingamong the distinct GBMs we evaluated despite comparable totalHSP90 levels across the GBM samples we evaluated (Supple-mentary Fig. 18). No epichaperome positivity was observed in thelesion-free regions of the brain (Fig. 4c–e and Fig. 5b–d, see H&Eversus AR).
Epichaperome formation is a mechanism of tumor survival,and epichaperome expression is directly proportional to tumor’ssensitivity to agents that induce its disassembly13. We thereforedesigned a testing paradigm where we measured both epichaper-ome expression and vulnerability of GBMs to PU-H71 and PU-HZ15113. We implemented into our study tumor samples fromresective GBM surgery (Fig. 6a and Supplementary Table 11),where tumor cells are retained along GSCs, tumor endothelial
ARTICLE NATURE COMMUNICATIONS | https://doi.org/10.1038/s41467-021-24821-2
6 NATURE COMMUNICATIONS | (2021) 12:4669 | https://doi.org/10.1038/s41467-021-24821-2 | www.nature.com/naturecommunications
ba
dc
e
g h
i
f
Fig. 3 PU-HZ151 kinetically selects for the epichaperome over HSP90. a Design of a surrogate method to determine epichaperome selectivity in vivo. iv,intravenous. b Native gels indicate epichaperome enrichment in MDA-MB-468 despite comparable total levels of HSP90 in both MDA-MB-468 andASPC1 cells (as shown by denaturing gels). Epichaperomes appear as multiple high-molecular weight complexes in Native PAGE (see brackets).Conversely, HSP90 complexes, highly dynamic, and short lived, are detected as a band, putatively a homodimer (see arrow). β-Actin, loading control. c PETdetermined time-dependent concentration of [124I]-PU-HZ151 in xenografted epichaperome +ve (MDA-MB-468) and –ve (ASPC1) tumors. Muscle andheart are shown for comparison. Serial PET images were obtained at the times indicated after single intravenous infusion of a microdose of [124I]-PU-HZ151. Data are presented as mean ± s.e.m., two-way ANOVA with Sidak’s post-hoc, n= 5 mice per tumor type. 24 h, p < 0.0048, 48 h, p < 0.0002, 72 h,p < 0.0173, 96 h, p < 0.0120; F(1.009, 8.075)= 98.30. d PET image of representative mice as in c obtained at 48 h post single [124I]-PU-HZ151 injection(250 µCi; 12.5 µCi g−1). e LC/MS-MS determined molar concentration of PU-HZ151 in the indicated tissues and organs at 48 h after single-doseintraperitoneal (i.p.) administration of 75mg kg−1 PU-HZ151. Graph, violin plot shows the distribution of individual mice with center line, median; box limits,upper and lower quartiles; whiskers, 1.5× interquartile range of n= 4. f Radio-HPLC of tumor extracts shows intact PU-HZ151 in MDA-MB-468 tumors(representative of n= 4) at 24 h post-single iv injection of 1 mCi [131I]-PU-HZ151. See also Supplementary Fig. 16. g PET determined time-dependentconcentration of [124I]-PU-HZ15 (10 mCi) in a lung cancer patient. Serial PET images were obtained at the times indicated after single intravenous infusionof a microdose of [124I]-PU-HZ151. h Representative axial PET/CT image obtained at 3 h as in g. i A 3-D maximum intensity projection (MIP) PET image ofthe chest, obtained at 0.5 h after iv injection of [124I]-PU-HZ151 as in g, is shown to demonstrate the homogeneous distribution of the probe into tumor andsurrounding tissues. Tumor’s relative circumference is shown with a blue circle. Source data are provided as a Source Data file.
NATURE COMMUNICATIONS | https://doi.org/10.1038/s41467-021-24821-2 ARTICLE
NATURE COMMUNICATIONS | (2021) 12:4669 | https://doi.org/10.1038/s41467-021-24821-2 | www.nature.com/naturecommunications 7
cells, and other tumor-associated cells47. Our goal was toinvestigate the sensitivity of these cells, and in turn theirepichaperome dependence, in their native environment acknowl-edging that they function within an ecological system, bothactively remodeling the microenvironment and receiving criticalmaintenance cues from their niches.
We prepared organotypic cultures from freshly resected tumortissues (n= 17) and cultured them in media containing any ofPU-H71, PU-HZ151, standard-of-care temozolomide (TMZ),and radiation (alone and combined), as allowed by the size of theavailable specimen. We included the anti-vascular endothelial
growth factor (VEGF) antibody Avastin (i.e. bevacizumab),approved for recurrent GBM. We observed that explantsdemonstrated vulnerability to the epichaperome probes despiteresistance to approved therapies (Fig. 6b, ATP levels). Immuno-histochemical analysis confirmed apoptosis in both tumorparenchyma and in the tumor endothelium in explants treatedwith the epichaperome probes (Supplementary Fig. 19a, bTUNEL and caspase-3-positivity). We isolated tumor-associatedendothelial cells from the explants and confirmed their sensitivity(Supplementary Fig. 19c–e). Lastly, we assessed explants for theirability to give rise to passageable neurospheres (NSs) and
a
b
c
d
e
Fig. 4 Radiolabeled PU-HZ151 detects epichaperome-positive lesions of the CNS. a Experimental design to detect through PET imaging epichaperome-positive CNS lesions. Representative whole-body serial PET/CT images of mice as in b are also shown. b PET determined time-dependent concentration of[124I]-PU-HZ151 in intracranial epichaperome+ve (MDA-MB-468) tumors and in the surrounding, unaffected brain. Serial PET/CT images were obtainedat the times indicated after single intravenous infusion of a microdose of [124I]-PU-HZ151 (15 µCi g−1). PET/CT image of representative mice obtained at48 h post-[124I]-PU-HZ151 injection is also shown. Data, mean ± s.e.m., n= 5, two-way ANOVA, p < 0.0001, F(1,40)= 91.62. c, d Representative digitalautoradiography ([131I]-PU-AD, 15 μCi g−1 iv, 6 h post-injection) (c) and H&E staining (d) of cryosections from brains as in b. The relative area occupied bythe brain tumor is shown with a blue line. Inset in d shows the heterogeneity of the tumor with clusters of cancer cells surrounded by stroma. Scale bar, 2mm. Inset scale bar, 100 μm. e PET scan of the mouse as in c, d, imaged and as in b, prior to killing. For (b–e) mice were first injected with [124I]-PU-HZ151and imaged up to 72 h. On the day following the last PET-scan, when [124I]-PU-HZ151 was cleared, mice were injected [131I]-PU-AD for autoradiography.The same sections were subsequently subjected to H&E staining for morphological evaluation of tissue pathology and to compare the localization of theepichaperome probe with the location of epichaperome-positive tumor tissue. Source data are provided as a Source Data file.
ARTICLE NATURE COMMUNICATIONS | https://doi.org/10.1038/s41467-021-24821-2
8 NATURE COMMUNICATIONS | (2021) 12:4669 | https://doi.org/10.1038/s41467-021-24821-2 | www.nature.com/naturecommunications
identified five for which we also had data on their sensitivity toepichaperome probes (#2, #3, #5, #19, and #30). We observed NSeradication in 3 out of 5 explants, indicative of theirepichaperome dependence (Fig. 6c). Vulnerability of GSCs toepichaperome probes and standard-of-care did not overlap, withTMZ and Avastin ineffective in specimen #30 that was vulnerableto epichaperome impairment (Fig. 6d). Thus, several cellpopulations that are important for GBM tumorigenesis, includingtumor cells and tumor-associated cells, may form epichaperomes,and in turn, depend on epichaperomes for their survival, as werecently found in other malignancies48.
While each population warrants further in-depth investigation,we focused initially on the GSCs, which are a source of tumorinitiation. GSCs possess properties that make them resistant toboth radiation and TMZ chemotherapy, the standard-of-care inGBM along with surgical resection. They also serve as arepository for GBM, leading inevitably to recurrence49. It istherefore believed that treatments targeting GSCs are of highsignificance in GBM and could extend patient survival, andpossibly result in cures50. For several GBMs, and in addition tothose evaluated at the explant level, we were able to establish GSCcell lines. We used these cultured GSCs to profile each specimen
a
b
c d
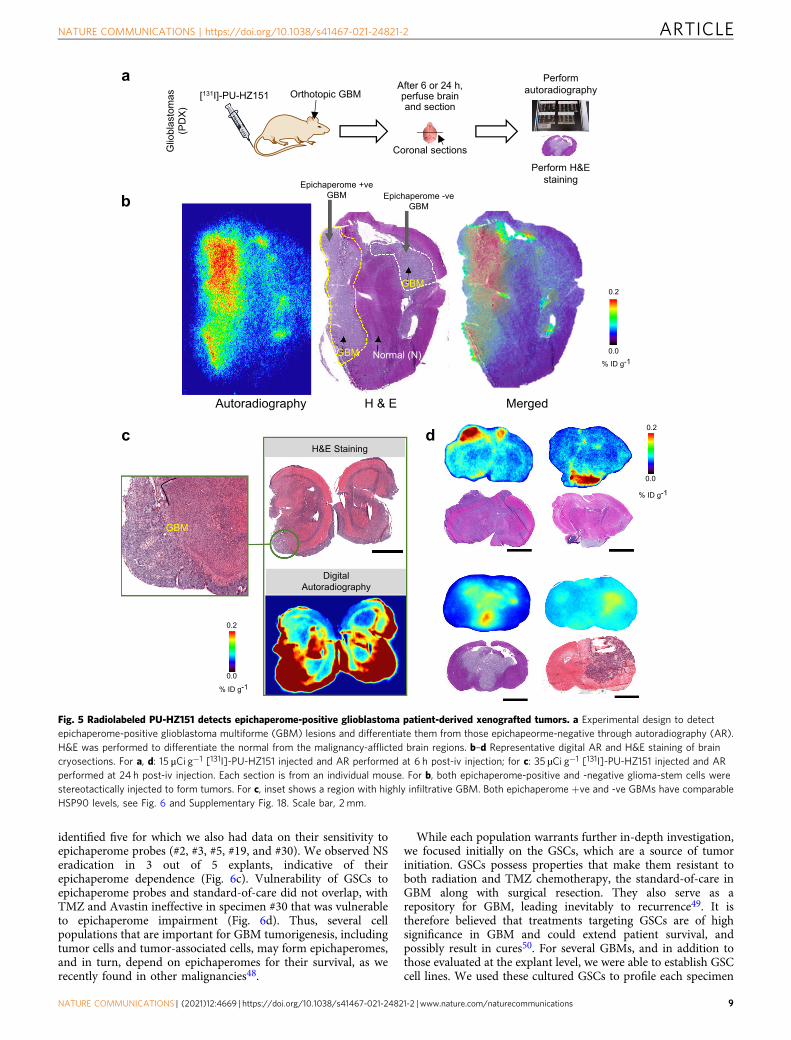
Fig. 5 Radiolabeled PU-HZ151 detects epichaperome-positive glioblastoma patient-derived xenografted tumors. a Experimental design to detectepichaperome-positive glioblastoma multiforme (GBM) lesions and differentiate them from those epichapeorme-negative through autoradiography (AR).H&E was performed to differentiate the normal from the malignancy-afflicted brain regions. b–d Representative digital AR and H&E staining of braincryosections. For a, d: 15 μCi g−1 [131I]-PU-HZ151 injected and AR performed at 6 h post-iv injection; for c: 35 µCi g−1 [131I]-PU-HZ151 injected and ARperformed at 24 h post-iv injection. Each section is from an individual mouse. For b, both epichaperome-positive and -negative glioma-stem cells werestereotactically injected to form tumors. For c, inset shows a region with highly infiltrative GBM. Both epichaperome +ve and -ve GBMs have comparableHSP90 levels, see Fig. 6 and Supplementary Fig. 18. Scale bar, 2 mm.
NATURE COMMUNICATIONS | https://doi.org/10.1038/s41467-021-24821-2 ARTICLE
NATURE COMMUNICATIONS | (2021) 12:4669 | https://doi.org/10.1038/s41467-021-24821-2 | www.nature.com/naturecommunications 9
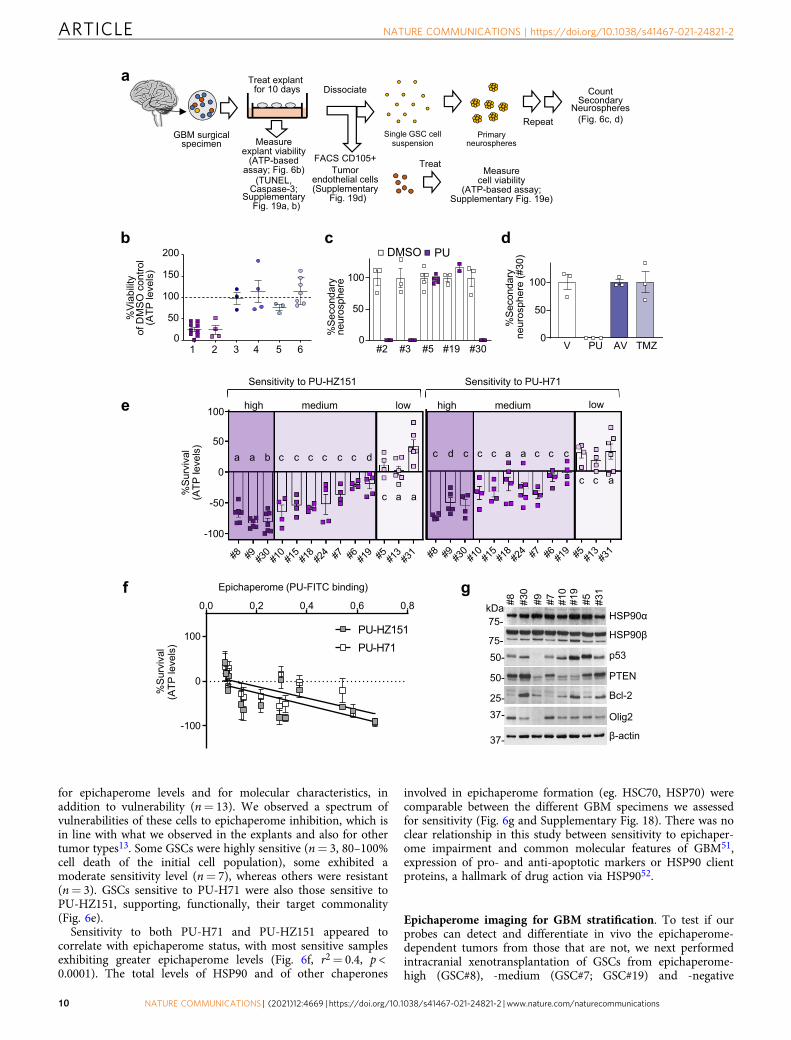
for epichaperome levels and for molecular characteristics, inaddition to vulnerability (n= 13). We observed a spectrum ofvulnerabilities of these cells to epichaperome inhibition, which isin line with what we observed in the explants and also for othertumor types13. Some GSCs were highly sensitive (n= 3, 80–100%cell death of the initial cell population), some exhibited amoderate sensitivity level (n= 7), whereas others were resistant(n= 3). GSCs sensitive to PU-H71 were also those sensitive toPU-HZ151, supporting, functionally, their target commonality(Fig. 6e).
Sensitivity to both PU-H71 and PU-HZ151 appeared tocorrelate with epichaperome status, with most sensitive samplesexhibiting greater epichaperome levels (Fig. 6f, r2= 0.4, p <0.0001). The total levels of HSP90 and of other chaperones
involved in epichaperome formation (eg. HSC70, HSP70) werecomparable between the different GBM specimens we assessedfor sensitivity (Fig. 6g and Supplementary Fig. 18). There was noclear relationship in this study between sensitivity to epichaper-ome impairment and common molecular features of GBM51,expression of pro- and anti-apoptotic markers or HSP90 clientproteins, a hallmark of drug action via HSP9052.
Epichaperome imaging for GBM stratification. To test if ourprobes can detect and differentiate in vivo the epichaperome-dependent tumors from those that are not, we next performedintracranial xenotransplantation of GSCs from epichaperome-high (GSC#8), -medium (GSC#7; GSC#19) and -negative
a
b
e
f g
c d
ARTICLE NATURE COMMUNICATIONS | https://doi.org/10.1038/s41467-021-24821-2
10 NATURE COMMUNICATIONS | (2021) 12:4669 | https://doi.org/10.1038/s41467-021-24821-2 | www.nature.com/naturecommunications
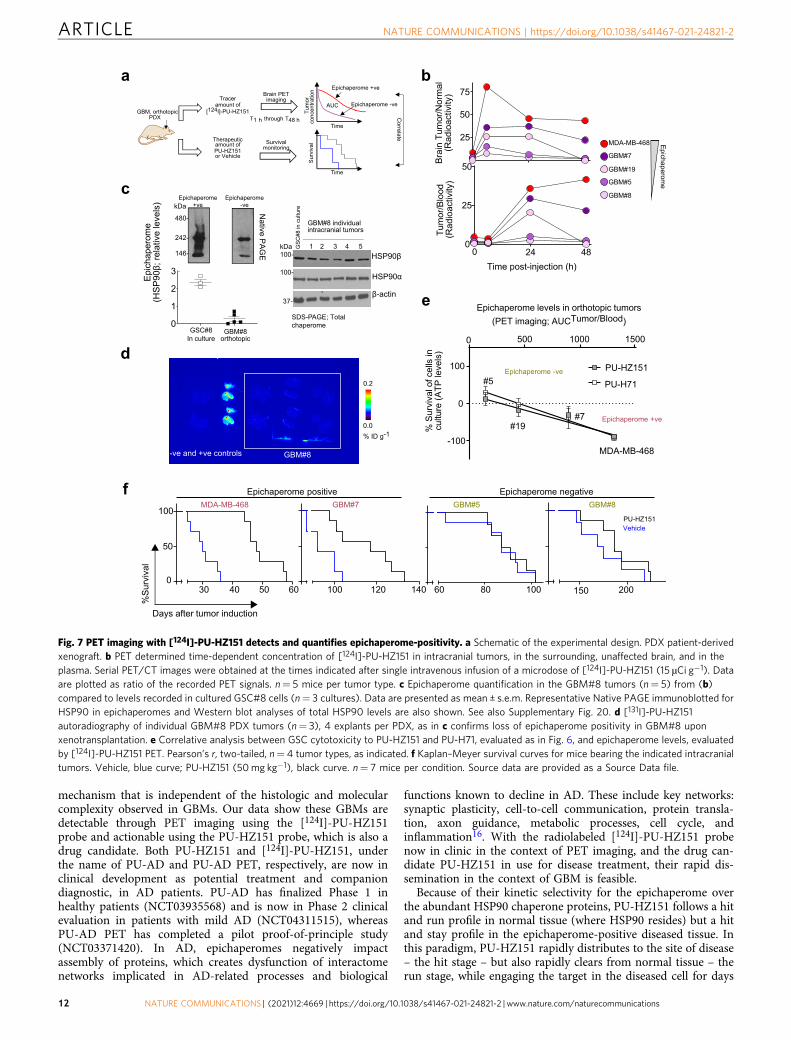
(GSC#5) specimens. For comparison we used intracraniallyxenotransplanted MDA-MB-468 tumors (Fig. 7a).
We performed PET imaging using [124I]-labeled PU-HZ151 toevaluate the epichaperome status of the GSC-derived GBM tumors(Fig. 7b, see AUCtumor/blood and AUCbrain tumor/normal brain). Weobserved that GBM#7, GBM#19 and GBM#5 retained themolecular feature of the parental GSC, in that GBM#7 hadepichaperome levels closer to the MDA-MB-468 tumors (AUCtu-
mor/blood= 893 and 1303, respectively), GBM#5 was low to negative(AUCtumor/blood= 143), whereas GBM#19 placed in between(AUCtumor/blood= 444).
Interestingly, GBM#8, which was a high-epichaperome/high-sensitivity GSC in culture, became an epichaperome-negativeGBM tumor upon transplantation (Fig. 7b, AUCtumor/blood= 80).We confirmed this change in molecular features by analyzingboth GSC#8 cells and GBM#8 tumors by native gels, western blot(Fig. 7c and Supplementary Fig. 20) and [131I]-PU-HZ151autoradiography (Fig. 7d). In GSC#8, we observed a number ofdistinct and indistinct high-molecular weight HSP90 specieswhich as reported, is the biochemical signature of stable,oligomeric HSP90 incorporated into epichaperomes13,14. InGBM#8, Native PAGE captured mainly the HSP90 dimer andmonomer, supportive of epichaperome-loss and the switch to atumor mechanism that is epichaperome independent. Theparental tumor and the GSC#8 population were characterizedby EGFR overexpression (see Supplementary Table 10, EGFRamplification and Supplementary Figs. 18 and 20, high EGFRlevels on western blot), a feature also lost in the GBM#8.
There was a positive correlation between epichaperome expres-sion determined by [124I]-PU-HZ151 PET and the vulnerability ofthese GSCs as determined in culture (for PU-HZ151 r2= 0.8697,p < 0.0001; for PU-H71 r2= 0.8812, p < 0.0001) (Fig. 7d). This wasalso reflected in their sensitivity to epichaperome inhibitortreatment in vivo (Fig. 7e). We observed that PU-HZ151significantly improved the survival of epichaperome-positiveGBM#7 (χ2= 7.51, P= 0.0061) and MDA-MB-468 (χ2= 14.51,P= 0.0001) but not of epichaperome-negative GBM#5 (χ2= 0.03,P= 0.86) and GBM#8 (χ2= 1.57, P= 0.21) bearing mice.
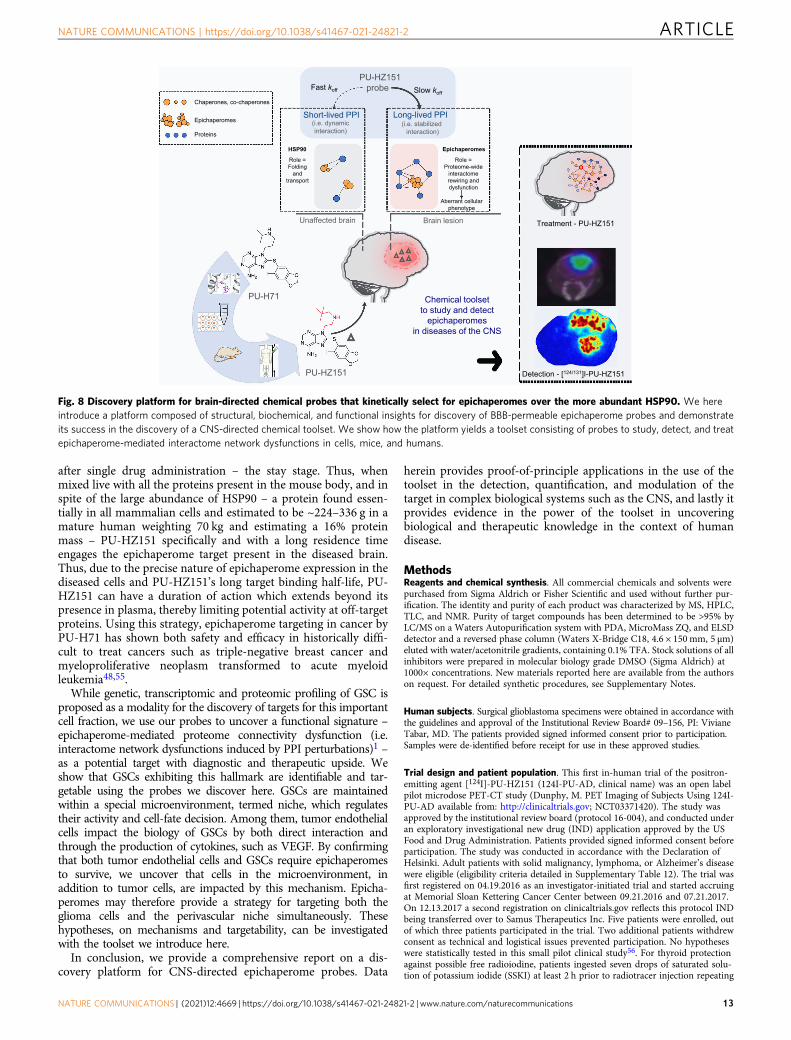
These findings combined, are confirmatory of the probes’selectivity for the epichaperome over HSP90 and their ability todetect, engage, and modulate epichaperomes in the CNS (Fig. 8).
DiscussionDiscovery of CNS-directed epichaperome probes is encumberedby a lack of clear information on the structure and conformationadapted by HSP90 and other chaperome members in the context
of the epichaperome. To overcome this limitation, our studymakes use of HSP90 pocket architecture captured by PU-H71 todesign ligands with properties that may improve brain delivery. Itthen implements a battery of tests designed to probe epichaper-ome engagement, specificity, and selectivity at the cellular andorganismal level, including mice and humans.
In addition to probes, our study introduces methods andprotocols for the use of the toolset in cellular models as well as inmice, with proof-of-principle provided for their use in humanpatients. We show that detection and quantitation of epichaper-omes is achievable with these agents and our protocols throughPET imaging or through radiography.
Our extensive data clearly demonstrate the molecular specifi-city of the probe. There are three key parameters that combineddetermine brain uptake and target engagement in the CNS: 1. thePK and the exposure of the brain lesions to the chemical probe(to understand brain delivery); 2. the ratio of probe’s presence intarget-positive lesions over normal brain and target-negativelesions (to understand selectivity and specificity, i.e. no binding totarget-negative brain structures) and 3. the functional engage-ment of the target-positive lesions over the target-negative lesions(to demonstrate productive target engagement). Though uptakedetermines technically if a compound enters brain tissue, thisparameter alone is inadequate to determine if such brain pene-tration results in ligand–target interaction53. Our strategy coversall three aspects, to show desirable PK, specific exposure of thetarget, and functional engagement of the target in the target-positive lesions over the normal brain and target-negative lesions.
In solid tumors, the enhanced permeability and retention(EPR) effect could confound nonspecific vascular leakage andspecific binding54. Although EPR mostly concerns high-molecular weight compounds and not small molecules such asPU-HZ151, we used in our study both target-positive and-negative tumors in our animal models to exclude the possibleimplication of the EPR in the observed retention of the probe inepichaperome-positive lesions. This is in addition to a multitudeof biochemical, analytical, and functional assays in vitro andin vivo, including proof-of-principle imaging studies in humans,that conclusively demonstrate retention of the probe in target-expressing brain lesions with minimal/no retention in the non-target-expressing brain lesions and normal brain.
Our study also has important therapeutic significance thatcannot be underestimated in terms of its treatment potential formultiple, diverse disease states in the cancer field and within theCNS. Our findings propose epichaperome formation is amechanism for the survival of some GBMs and GBM-associatedcell populations (eg. GSCs and tumor endothelial cells), a
Fig. 6 Human GBM express variable levels of epichaperomes, with epichaperome-positivity portending vulnerability to agents that induceepichaperome disassembly. a Schematic representation of explant treatment, viability assessment and serial neurosphere (NS) formation assay.Cytotoxicity of agents on GBM explants was determined through gross evaluation of ATP levels and also by co-staining of explants with markers of cellidentity and cell death. Explant tissue was also dissociated to obtain a single cell suspension. The self-renewal capacity of the glioma-stem cells (GSCs)was evaluated by performing serial NS formation assays. Lastly, dissociated explant tissue was sorted by FACS to isolate tumor endothelial cells, which wethen cultured in the presence or absence of the agents. Surgically derived human GBM explants were treated for 10 days, and then were dissociated intosingle cell suspensions to analyze the self-renewal capacity of the cells. Treatments include: PU-HZ151 (1 µM), PU-H71 (1 µM), Avastin (AV) (1 µM),temozolomide (TMZ) (250 nM), a single dose of radiation (XRT) (10 Gy on day 5) or DMSO, and control vehicle (V). b Viability of GBM explants as in a to1, PU-H71 (n= 9); 2, PU-HZ151 (n= 4); 3, AV (n= 3); 4, TMZ (n= 4); 5, XRT (n= 3); and 6, TMZ+ XRT (n= 7). n, individual GBMs as in a. See alsoSupplementary Fig. 19. c, d Secondary neurosphere formation as in a. #2, #3, #19, #30, n= 3 and #5, n= 5 biological replicates from independent NSs ofindividual patients. Both PU-H71 and PU-HZ151 were used as in a, with similar results. e Cell viability assessed by an ATP-based assay in patient-derivedGSCs cultured adherently in a serum-free stem cell culture condition and incubated for 48 h with PU-HZ151 or PU-H71 (1 µM). Negative values represent adecrease of cell numbers compared to the initial cell population. Each bar represents an individual GSC, a, n= 6; b, n= 7; c, n= 4; d, n= 5 experimentalrepeats. f Correlative analysis between cytotoxicity evaluated as in e and epichaperome levels evaluated by flow cytometry (see methods). Pearson’s r,two-tailed, n= 13 individual GSCs as in e. g Western blot analysis of molecular markers characterizing each GSC. β-actin, loading control. See alsoSupplementary Fig. 18. All graphs, data are presented as mean ± s.e.m. Source data are provided as a Source Data file.
NATURE COMMUNICATIONS | https://doi.org/10.1038/s41467-021-24821-2 ARTICLE
NATURE COMMUNICATIONS | (2021) 12:4669 | https://doi.org/10.1038/s41467-021-24821-2 | www.nature.com/naturecommunications 11
mechanism that is independent of the histologic and molecularcomplexity observed in GBMs. Our data show these GBMs aredetectable through PET imaging using the [124I]-PU-HZ151probe and actionable using the PU-HZ151 probe, which is also adrug candidate. Both PU-HZ151 and [124I]-PU-HZ151, underthe name of PU-AD and PU-AD PET, respectively, are now inclinical development as potential treatment and companiondiagnostic, in AD patients. PU-AD has finalized Phase 1 inhealthy patients (NCT03935568) and is now in Phase 2 clinicalevaluation in patients with mild AD (NCT04311515), whereasPU-AD PET has completed a pilot proof-of-principle study(NCT03371420). In AD, epichaperomes negatively impactassembly of proteins, which creates dysfunction of interactomenetworks implicated in AD-related processes and biological
functions known to decline in AD. These include key networks:synaptic plasticity, cell-to-cell communication, protein transla-tion, axon guidance, metabolic processes, cell cycle, andinflammation16. With the radiolabeled [124I]-PU-HZ151 probenow in clinic in the context of PET imaging, and the drug can-didate PU-HZ151 in use for disease treatment, their rapid dis-semination in the context of GBM is feasible.
Because of their kinetic selectivity for the epichaperome overthe abundant HSP90 chaperone proteins, PU-HZ151 follows a hitand run profile in normal tissue (where HSP90 resides) but a hitand stay profile in the epichaperome-positive diseased tissue. Inthis paradigm, PU-HZ151 rapidly distributes to the site of disease– the hit stage – but also rapidly clears from normal tissue – therun stage, while engaging the target in the diseased cell for days
a b
c
d
f
e
Fig. 7 PET imaging with [124I]-PU-HZ151 detects and quantifies epichaperome-positivity. a Schematic of the experimental design. PDX patient-derivedxenograft. b PET determined time-dependent concentration of [124I]-PU-HZ151 in intracranial tumors, in the surrounding, unaffected brain, and in theplasma. Serial PET/CT images were obtained at the times indicated after single intravenous infusion of a microdose of [124I]-PU-HZ151 (15 µCi g−1). Dataare plotted as ratio of the recorded PET signals. n= 5 mice per tumor type. c Epichaperome quantification in the GBM#8 tumors (n= 5) from (b)compared to levels recorded in cultured GSC#8 cells (n= 3 cultures). Data are presented as mean ± s.e.m. Representative Native PAGE immunoblotted forHSP90 in epichaperomes and Western blot analyses of total HSP90 levels are also shown. See also Supplementary Fig. 20. d [131I]-PU-HZ151autoradiography of individual GBM#8 PDX tumors (n= 3), 4 explants per PDX, as in c confirms loss of epichaperome positivity in GBM#8 uponxenotransplantation. e Correlative analysis between GSC cytotoxicity to PU-HZ151 and PU-H71, evaluated as in Fig. 6, and epichaperome levels, evaluatedby [124I]-PU-HZ151 PET. Pearson’s r, two-tailed, n= 4 tumor types, as indicated. f Kaplan–Meyer survival curves for mice bearing the indicated intracranialtumors. Vehicle, blue curve; PU-HZ151 (50mg kg−1), black curve. n= 7 mice per condition. Source data are provided as a Source Data file.
ARTICLE NATURE COMMUNICATIONS | https://doi.org/10.1038/s41467-021-24821-2
12 NATURE COMMUNICATIONS | (2021) 12:4669 | https://doi.org/10.1038/s41467-021-24821-2 | www.nature.com/naturecommunications
after single drug administration – the stay stage. Thus, whenmixed live with all the proteins present in the mouse body, and inspite of the large abundance of HSP90 – a protein found essen-tially in all mammalian cells and estimated to be ~224–336 g in amature human weighting 70 kg and estimating a 16% proteinmass – PU-HZ151 specifically and with a long residence timeengages the epichaperome target present in the diseased brain.Thus, due to the precise nature of epichaperome expression in thediseased cells and PU-HZ151’s long target binding half-life, PU-HZ151 can have a duration of action which extends beyond itspresence in plasma, thereby limiting potential activity at off-targetproteins. Using this strategy, epichaperome targeting in cancer byPU-H71 has shown both safety and efficacy in historically diffi-cult to treat cancers such as triple-negative breast cancer andmyeloproliferative neoplasm transformed to acute myeloidleukemia48,55.
While genetic, transcriptomic and proteomic profiling of GSC isproposed as a modality for the discovery of targets for this importantcell fraction, we use our probes to uncover a functional signature –epichaperome-mediated proteome connectivity dysfunction (i.e.interactome network dysfunctions induced by PPI perturbations)1 –as a potential target with diagnostic and therapeutic upside. Weshow that GSCs exhibiting this hallmark are identifiable and tar-getable using the probes we discover here. GSCs are maintainedwithin a special microenvironment, termed niche, which regulatestheir activity and cell-fate decision. Among them, tumor endothelialcells impact the biology of GSCs by both direct interaction andthrough the production of cytokines, such as VEGF. By confirmingthat both tumor endothelial cells and GSCs require epichaperomesto survive, we uncover that cells in the microenvironment, inaddition to tumor cells, are impacted by this mechanism. Epicha-peromes may therefore provide a strategy for targeting both theglioma cells and the perivascular niche simultaneously. Thesehypotheses, on mechanisms and targetability, can be investigatedwith the toolset we introduce here.
In conclusion, we provide a comprehensive report on a dis-covery platform for CNS-directed epichaperome probes. Data
herein provides proof-of-principle applications in the use of thetoolset in the detection, quantification, and modulation of thetarget in complex biological systems such as the CNS, and lastly itprovides evidence in the power of the toolset in uncoveringbiological and therapeutic knowledge in the context of humandisease.
MethodsReagents and chemical synthesis. All commercial chemicals and solvents werepurchased from Sigma Aldrich or Fisher Scientific and used without further pur-ification. The identity and purity of each product was characterized by MS, HPLC,TLC, and NMR. Purity of target compounds has been determined to be >95% byLC/MS on a Waters Autopurification system with PDA, MicroMass ZQ, and ELSDdetector and a reversed phase column (Waters X-Bridge C18, 4.6 × 150 mm, 5 µm)eluted with water/acetonitrile gradients, containing 0.1% TFA. Stock solutions of allinhibitors were prepared in molecular biology grade DMSO (Sigma Aldrich) at1000× concentrations. New materials reported here are available from the authorson request. For detailed synthetic procedures, see Supplementary Notes.
Human subjects. Surgical glioblastoma specimens were obtained in accordance withthe guidelines and approval of the Institutional Review Board# 09–156, PI: VivianeTabar, MD. The patients provided signed informed consent prior to participation.Samples were de-identified before receipt for use in these approved studies.
Trial design and patient population. This first in-human trial of the positron-emitting agent [124I]-PU-HZ151 (124I-PU-AD, clinical name) was an open labelpilot microdose PET-CT study (Dunphy, M. PET Imaging of Subjects Using 124I-PU-AD available from: http://clinicaltrials.gov; NCT03371420). The study wasapproved by the institutional review board (protocol 16-004), and conducted underan exploratory investigational new drug (IND) application approved by the USFood and Drug Administration. Patients provided signed informed consent beforeparticipation. The study was conducted in accordance with the Declaration ofHelsinki. Adult patients with solid malignancy, lymphoma, or Alzheimer’s diseasewere eligible (eligibility criteria detailed in Supplementary Table 12). The trial wasfirst registered on 04.19.2016 as an investigator-initiated trial and started accruingat Memorial Sloan Kettering Cancer Center between 09.21.2016 and 07.21.2017.On 12.13.2017 a second registration on clinicaltrials.gov reflects this protocol INDbeing transferred over to Samus Therapeutics Inc. Five patients were enrolled, outof which three patients participated in the trial. Two additional patients withdrewconsent as technical and logistical issues prevented participation. No hypotheseswere statistically tested in this small pilot clinical study56. For thyroid protectionagainst possible free radioiodine, patients ingested seven drops of saturated solu-tion of potassium iodide (SSKI) at least 2 h prior to radiotracer injection repeating
Unaffected brain Brain lesion
Role = Proteome-wide
interactome rewiring and dysfunction
Aberrant cellular phenotype
Detection - [124/131]I-PU-HZ151
Chemical toolset to study and detect
epichaperomesin diseases of the CNS
Treatment - PU-HZ151
Short-lived PPI (i.e. dynamic interaction)
Long-lived PPI (i.e. stabilized
interaction)
PU-HZ151 probe Slow koff
Fast koff
Role =Folding
and transport
Epichaperomes HSP90
Chaperones, co-chaperones
Epichaperomes
Proteins
PU-HZ151
PU-H71
Fig. 8 Discovery platform for brain-directed chemical probes that kinetically select for epichaperomes over the more abundant HSP90. We hereintroduce a platform composed of structural, biochemical, and functional insights for discovery of BBB-permeable epichaperome probes and demonstrateits success in the discovery of a CNS-directed chemical toolset. We show how the platform yields a toolset consisting of probes to study, detect, and treatepichaperome-mediated interactome network dysfunctions in cells, mice, and humans.
NATURE COMMUNICATIONS | https://doi.org/10.1038/s41467-021-24821-2 ARTICLE
NATURE COMMUNICATIONS | (2021) 12:4669 | https://doi.org/10.1038/s41467-021-24821-2 | www.nature.com/naturecommunications 13
SSKI dose daily for 2 weeks post-injection. To detect thyroid injury, serum thyroid-stimulating hormone (TSH) assay was obtained <1-week pre-injection, as baseline;with follow-up TSH assay 6–12 months post-injection. Patients were monitored forsigns and symptoms of toxicity at each imaging time point. Patients reported anyadverse symptoms experienced in the following 30 days to study investigators.Primary outcome measures were: Pharmacokinetic profile of 124I-PU-AD: areaunder the curve (AUC) [Time Frame: 1 week]; Pharmacokinetic profile of 124I-PU-AD: maximum plasma concentration (Cmax) [Time Frame: 1 week]; Pharma-cokinetic profile of 124I-PU-AD: trough plasma concentration (Cmin) [TimeFrame: 1 week]; Pharmacokinetic profile of 124I-PU-AD: plasma half-life (T1/2)[Time Frame: 1 week]; Pharmacokinetic profile of 124I-PU-AD: time to maximumplasma concentration (Tmax) [Time Frame: 1 week]. The results are reported inSupplementary Table 10. Secondary outcome measures were: incidence of adverseevents [Time Frame: 30 days]. The [124I]-PU-HZ151 probe was synthesized in-house by the institutional cyclotron core facility at high specific activity. For thePET study, two intravenous catheters (heparin-locked) were placed in the subjectfor radiopharmaceutical administration and for blood sampling. After [124I]-PU-HZ151 tracer injection, PET scans were performed at the following time-points:immediately post-injection; 2.5–4.5 (±30 mins) h post-injection; and 1–2 days post-injection. Optionally, in willing patients, an additional PET scan was obtained3–7 days post-injection. At each time-point, a 30–60 min axial body image(spanning from skull vertex to proximal thigh regions) was acquired on a state-of-the-art PET-CT scanner. A low-dose CT was obtained immediately-prior to PETimaging, at each timepoint. A 30–60 min scanning time-period is typical forclinical nuclear medicine diagnostic imaging studies. Subjects were monitoredvisually, and communication maintained directly between the patient and theradiology investigators, except during the CT, when communication is maintainedvia a speaker system. The radiology investigator evaluated patients during the earlytime-period, post-injection. See section below Epichaperome detection in humanpatients. Serial blood samples were obtained at approximately 1, 5, 15 ± 5, 30 ± 5,60–90 (±30) minutes; and 2.5–4.5 (±30 mins) hours, post-injection. See sectionbelow on Plasma pharmacokinetics assays in human patients. Subjects were eval-uated to ensure that there are no clinically significant ongoing adverse effects priorto discharge. The microdose study NCT0126959339, PET Imaging of CancerPatients Using 124I-PUH71; A pilot study, was conducted as previously reported39.
Mouse models. All animal studies were conducted in compliance with MSKCC’sguidelines and under Institutional Animal Care and Use Committee (IACUC)approved protocols #05-11-024 and #04-03-009. Athymic nude mice (Hsd:Athy-mic Nude-Foxn1nu, female, 20–25 g, 6 weeks old; RRID:MGI:5652489) andB6D2F1 mice (male, 4–5 weeks, Jackson Laboratory; RRID:IMSR_JAX:100006)were allowed to acclimatize at the MSKCC vivarium for 1 week prior to experi-ments. Mice were housed in groups of 4–5 mice per individually ventilated cage ina 12-h light/dark cycle (6:00 a.m./6:00 p.m.), with controlled room temperature(22 ± 1 °C) and humidity (30–70%). Mice were provided with food and water adlibitum. All mice in all studies were observed for clinical signs at least once daily.
Cell lines and culture conditions. The MDA-MB-468 (HTB-132; RRID:CVCL_0419), Kasumi-1 (CRL-2724; RRID:CVCL_0589), HepG2 (HB-8056; RRID:CVCL_0027), ASPC1 (CRL-1682; RRID:CVCL_0512), and HEK-193 (CRL-1573;RRID:CVCL_0045) human cancer cell lines were obtained from the AmericanType Culture Collection and cultured in Dulbecco’s Modified Eagle’s medium-highglucose (DME-HG) supplemented with 10% FBS, 1% L-glutamine, 1% penicillin,and streptomycin. Cells were authenticated using short tandem repeat profiling andtested for mycoplasma.
Fluorescence polarization. For the binding studies, fluorescence polarization (FP)assays were performed similarly as was previously reported37. Briefly, FP measurementswere performed on an Analyst GT instrument (Molecular Devices, Sunnyvale, CA).Measurements were taken in black 96-well microtiter plates (Corning # 3650) whereboth the excitation and the emission occurred from the top of the well. A stock of 10µM cy3B-GM was prepared in DMSO and diluted with HFB buffer (20mMHepes (K),pH 7.3, 50mM KCl, 2mM DTT, 5mM MgCl2, 20mM Na2MoO4, and 0.01% NP40with 0.1mgmL−1 BGG). The test compounds were dissolved in DMSO and added atseveral concentrations to the HFB assay buffer containing both 6 nM cy3B-GM andmouse brain lysate (6 µg JNPL3 mouse brain lysate) in a final volume of 100 µL. Drugswere added to triplicate wells. Free cy3B-GM (6 nM cy3B-GM), bound cy3B-GM (6 nMcy3B-GM+ lysate, as indicated above), and buffer only containing wells (background)were included as controls in each plate. Plates were incubated on a shaker at 4 °C, andpolarization values measured at 24 h. Percentage inhibition was calculated as follows: (%Control)= 100–((mPc –mPf)/(mPb –mPf)) × 100, where mPc is the recorded mP fromcompound wells, mPf is the average recorded mP from cy3B-GM–only wells, and mPbis the average recorded mP from wells containing both cy3B-GM and lysate, andplotted against values of competitor concentrations. The inhibitor concentration atwhich 50% of bound cy3B-GM was displaced was obtained by fitting the data using anonlinear regression analysis as implemented in Prism 7.0 (Graphpad Software).
Competitive binding assay. A stock of 10 μM PU-FITC57 was prepared in Feltsbuffer (20 mM Hepes (K), pH 7.3, 50 mM KCl, 2 mM DTT, 5 mM MgCl2, 20 mMNa2MoO4, and 0.01% NP40). In all, 200 μg of protein lysates prepared from theMDA-MB-468 cells were added into 96-well microplates (Greiner MicrolonFluotrac 200) and treated with vehicle or PU-H71 and PU-HZ151 (1 µM) at roomtemperature for 10 min. PU-FITC (10 nM) was added to each well in a final volumeof 100 μL Felts buffer. To account for background signal, buffer and PU-FITC onlycontrols were included in each assay. The FP values in mP were measured every5–10 min. The assay window was calculated as the difference between the FP valuerecorded for the bound fluorescent tracer and the FP value recorded for the freefluorescent tracer (defined as mP − mPf). Measurements were performed on aMolecular Devices SpectraMax Paradigm instrument (Molecular Devices, Sunny-vale, CA), and data were imported into SoftMaxPro6 and analyzed in GraphPadPrism 7.
General side effect profile II diversity panel. PU-HZ151’s binding to each of the70 key receptor, enzyme, and ion channel proteins comprising the diversity panelscreen (General SEP II) was performed by Caliper Life Sciences (now Perki-nElmer). Binding was expressed as a mean percent of the reference control (n= 2measurements) collected at a single, high (10 μM) concentration of PU-HZ151.NOVASCREEN suggests these guidelines for interpretation of the data presented:Baseline, −20% to +20% inhibition: In most assays, the standard baseline rangeruns from −20% to +20% inhibition of binding or enzyme activity. NOVASC-REEN considers compounds showing results in this range inactive at this site.Compounds which show negative inhibition (< 20%): NOVASCREEN’s assays aredesigned to test for inhibition of binding or enzyme activity. Occasionally, com-pounds will demonstrate high negative inhibition (i.e., resulting from the extractionprocedure used) and may, at the discretion of the client, warrant retesting at lowerconcentrations. Compounds which show inhibition in the range of 20–49%:Compounds exhibiting these results show marginal activity at the receptor site andgenerally do not warrant further examination unless otherwise directed by theclient.
scanEDGE off-target screen. Because PU-type ligands are based on a purinescaffold, there is the misconception that they may nonspecifically interact withATP-binding pockets, such as those of kinases. PU-HZ151 was tested at 10 µMagainst the scanEDGE 97 kinase panel. This panel contains a set of kinasescovering AGC, CAMK, CMGC, CK1, STE, TK, TKL, lipid, and atypical kinasefamilies, plus important mutant forms. Developed by Ambit Biosciences, itemploys proprietary active-site-dependent competition binding assays todetermine how compounds bind to kinases. It is based on a competition bindingassay that quantitatively measures the ability of a compound to compete with animmobilized, active-site-directed ligand and can be used in detection of mul-tiple inhibitor types (e.g., type I, type II, and non-ATP competitive). For mostassays, kinase-tagged T7 phage strains were grown in parallel in 24-well blocksin an Escherichia coli host derived from the BL21 strain. E. coli cells were grownto log-phase and infected with T7 phage from a frozen stock (multiplicity ofinfection= 0.4) and incubated with shaking at 32 °C until lysis (90–150 min).The lysates were centrifuged (6000×g) and filtered (0.2 μm) to remove celldebris. The remaining kinases were produced in HEK-293 cells and subse-quently tagged with DNA for qPCR detection. Streptavidin-coated magneticbeads were treated with biotinylated small molecule ligands for 30 min at roomtemperature to generate affinity resins for kinase assays. The liganded beadswere blocked with excess biotin and washed with blocking buffer [SeaBlock(Pierce), 1% BSA, 0.05% Tween 20, 1 mM DTT] to remove unbound ligand andto reduce nonspecific phage binding. Binding reactions were assembled bycombining kinases, liganded affinity beads, and test compounds in 1× bindingbuffer (20% SeaBlock, 0.17× PBS, 0.05% Tween 20, 6 mM DTT). Test com-pounds were prepared as 40× stocks in 100% DMSO and directly diluted intothe assay. All reactions were performed in polypropylene 384-well plates in afinal volume of 0.04 mL. The assay plates were incubated at room temperaturewith shaking for 1 h, and the affinity beads were washed with wash buffer (1×PBS, 0.05% Tween 20). The beads were then resuspended in elution buffer (1×PBS, 0.05% Tween 20, 0.5 μM nonbiotinylated affinity ligand) and incubated atroom temperature with shaking for 30 min. The kinase concentration in theeluates was measured by qPCR. Results for the primary screen binding inter-actions were reported as ‘% Ctrl’, where lower numbers indicate stronger hits inthe matrix. Selectivity Score or S-score is a quantitative measure of compoundselectivity. It is calculated by dividing the number of kinases that compoundsbind to by the total number of distinct kinases tested, excluding mutant var-iants. S= number of hits/number of assays and this value is calculated using %Ctrl as a potency threshold (below) and provides a quantitative method ofdescribing compound selectivity to facilitate comparison of different com-pounds. S(35)= (number of non-mutant kinases with %Ctrl <35)/(number ofnon-mutant kinases tested); S(10)= (number of non-mutant kinases with %Ctrl<10)/(number of non-mutant kinases tested), and S(1)= (number of non-mutant kinases with %Ctrl <1)/(number of non-mutant kinases tested).
ARTICLE NATURE COMMUNICATIONS | https://doi.org/10.1038/s41467-021-24821-2
14 NATURE COMMUNICATIONS | (2021) 12:4669 | https://doi.org/10.1038/s41467-021-24821-2 | www.nature.com/naturecommunications
Radioactivity metabolite characterization. MDA-MB-468 tumor xenograftswere established on the forelimbs of female athymic nude mice (Hsd:AthymicNude-Foxn1nu; Envigo; 6 weeks old; RRID:MGI:5652489) by subcutaneous (s.c.)injection of 5 × 10⁶ cells in a 200 µl cell suspension of a 1:1 v/v mixture of PBS withreconstituted basement membrane (BD MatrigelTM, Collaborative BiomedicalProducts Inc., Bedford, MA). When the tumors reached approximate size of150 mm3 (~4 weeks), [131I]-PU-HZ151 (1000 µCi in 150 µL of 5% ethanol insaline, Hospira, 0.9% sodium chloride in water) was injected intravenously intomice. After 24 h, tumors were harvested and weighed prior to homogenization inacetonitrile/H2O (3:7) using Bullet Blender Tissue Homogenizer (Next AdvanceInc.). Tumor-associated radioactivity was extracted in methylene chloride, and theorganic layer was separated and dried under vacuum. Samples were reconstitutedin 10% CH3CN in 0.1% HCOOH in water were analyzed using Shimadzu(Columbia, Maryland USA) HPLC system equipped with binary pumps LC-20AB,UV detector and sodium iodide radioactivity detector connected to flow-ram (LabLogic, Tampa, FL) and 250 × 4.6 mm Phenomenex Luna (Torrance, CA) C-18HPLC column (10 µM, 100 A). The solvent system consisted of 0.1% Tri-fluoroacetic acid in water (A), and acetonitrile (B) at a flow rate of 1 mLmin−1)and the gradient of 5–60% B from start −23 min A tracer standard ([131I]-PU-HZ151) co-injected with cold standard of PU-HZ151 was assayed by radioHPLC toconfirm the PU-HZ151 elution time. Intact [131I]-PU-HZ151 elutes with retentiontime of ~16.1 min. Tumor extract analysis confirmed that only [131I]-PU-HZ151contributed to tumor-associated radioactivity.
Metabolic stability. PU-HZ151 (1 and 10 µM) was incubated with human, CD-1mouse, Sprague Dawley rat, and beagle dog liver microsomes (0.5 mg protein/ml)and appropriate cofactors (2.5 mM NADPH and 3.3 mM MgCl2) in 100 mMphosphate buffer, pH 7.4, in a 37 °C shaking water bath. The incubation containeda final organic solvent concentration of 0.1% DMSO. Reactions were started withthe addition of NADPH/magnesium chloride mix and stopped by removing 100 µLaliquots at selected time points (15, 30, and 60 min) and mixing with 200 µl ofacetonitrile containing 100 ng/ml haloperidol (internal standard). Following briefvortexing and centrifugation, an aliquot of the supernatant was transferred to a 96-well plate and further diluted 2-fold (for 1 µM, using 10% acetonitrile containinginternal standard) or 20-fold (for 10 µM, using 37% acetonitrile containing internalstandards) for subsequent LC-MS/MS analysis. Experimental controls consisted of:a) incubation with 1 or 5 µM propranolol as a positive control for metabolism, andb) incubation of 1 and 10 µM PU-HZ151 with heat-inactivated microsomes (0.5mg protein mL−1) for 0 and 60 min. All samples were assayed in duplicate. Todetermine metabolic stability of PU-HZ151, the percent remaining at each timepoint was calculated by dividing the peak area ratio of PU-HZ151 /internal stan-dard at each time point by the mean peak area ratio at 0 min, multiplied by 100.
Metabolite characterization. Preparation of samples. In order to detect andcharacterize metabolites of PU-HZ151 formed in selected microsomal incubationsamples, the following procedures were used to prepare the samples: (1) micro-somal incubation samples generated in the metabolic stability experiments (1 and10 µM PU-HZ151, duplicate replicates per timepoint) were initially processed byaddition of 2 parts acetonitrile containing the internal standard haloperidol, to 1part sample, followed by vortexing, centrifugation, and transfer of the supernatantto a 1.5 mL microcentrifuge tube. Samples were stored at −80 °C prior to analysisfor metabolites. (2) Samples were thawed to room temperature, vortexed, cen-trifuged, and a volume of the supernatant diluted 1:1 with 5% acetonitrile, toreduce the percent acetonitrile in the final sample. Samples were then transferred toHPLC vials with glass inserts for subsequent LC-MS analysis.
Cytochrome P450 enzymes metabolizing PU-HZ151. To identify cytochromeP450 enzymes responsible for PU-HZ151’s metabolism in human liver microsomesthe following procedure was followed. Phosphate buffer (100 mM, pH 7.4) wasprepared monthly and stored at 4 °C. Frozen stock solutions of human livermicrosomes (Life Technologies; Cat# HMMCPL) were used once after thawing andwere not refrozen. NADPH stock solution (50 mM) in distilled water was preparedfresh daily. Stock solutions of PU-HZ151 (1 mM in DMSO) and CYP inhibitors,furafylline (10 mM) for CYP1A2, tranylcypromine (2 mM) for CYP2A6, ketoco-nazole (1 mM) for CYP3A, troleandomycin (20 mM) for CYP3A4, orphenadrine(50 mM) for CYP2B6, montelukast (3 mM) for CYP2C8, sulfaphenazole (10 mM)for CYP2C9, benzylnirvanol (1 mM) for CYP2C19, quinidine (1 mM) for CYP2D6,and 1-aminobenzotriazole (1 mM) for all the P450 enzymes were stored at −20 °C.The stock solutions of these P450 inhibitors were prepared in DMSO. Generalprocedure: PU-HZ151 (1 µM) was incubated with human liver microsomes (0.5 mgprotein mL−1), 2.5 mM NADPH, 3.3 mM magnesium chloride, and chemicalinhibitors (various concentrations) in phosphate buffer (100 mM, pH 7.4) at 37 °Cfor up to 60 min. The incubation contained a final organic solvent concentration of0.1% DMSO. The concentration of the chemical inhibitors used in the assay werefurafylline (10 μM), tranylcypromine (2 μM), ketoconazole (1 μM), troleandomycin(20 μM), orphenadrine (50 μM), montelukast (3 μM), sulfaphenazole (10 μM),benzylnirvanol (1 μM), quinidine (1 μM), and 1-aminobenzotriazole (1 mM) for allthe P450 enzymes. Timing of the reactions was started following the addition ofNADPH/magnesium chloride mix and PU-HZ151. Time-dependent chemical
inhibitors (furafylline, troleandomycin, orphenadrine, and 1-aminobenzotriazole)were preincubated with human microsomes in the presence of NADPH andmagnesium chloride for 15 min before the addition of PU-HZ151 and timing ofreactions was started after addition of PU-HZ151. The reactions were stopped byremoving 100 µL aliquots at selected time points (0, 15, 30, and 60 min) and mixingwith 200 µL of cold acetonitrile. Following brief vortexing and centrifugation, a200 µL aliquot of the supernatant was transferred to a tube, and 10 µL of halo-peridol (1 µg mL−1) as internal standard was added. Following brief vortexing andcentrifugation, 50 µL of supernatant was added to a 96-well plate for subsequentLC-MS/MS analysis. PU-HZ151 was similarly tested as above in the absence ofCYP inhibitors for comparative purposes. All samples were assayed in duplicate.To determine the effect of each CYP inhibitor on the metabolic stability of PU-HZ151, the percent PU-HZ151 remaining at each time point was calculated bydividing the peak area ratio of PU-HZ151/internal standard at each time point bythe mean peak area ratio at 0 min, multiplied by 100. This was similarly performedfor incubations of PU-HZ151 performed in the absence of CYP inhibitor.
LC-MS methods for metabolite characterization. Samples were analyzed by LC-MS using positive-ion electrospray ionization and reverse-phase chromatographyin full-scan mode with MS/MS product-ion spectra generated for detected meta-bolite masses. This was performed using the MS2 scan mode of the G6410B massspectrometer to produce MS/MS product-ion spectra for masses detected at suf-ficient intensities. Chromatography was performed using a ZORBAX Eclipse XDB-C18 4.6 × 50 mm, 5 µm, column, with gradient elution at 1 mLmin−1. Mobilephase was comprised of A=MilliQ Water with 0.1% formic acid, B= acetonitrile.Six metabolites were detected (M1, M2, M3a, M3b, M4, M5) and chromatographyresolved.
PAMPA-BBB. Each well of a 96-well Teflon tray acceptor plate (Millipore, MA,USA) was filled with 300 μL universal PBS buffer (pH 7.4)38. The 96-well PVDFdonor plate (0.45 μm pore size) was applied 4 μL of porcine polar brain lipid (PBL)in dodecane (20 mgmL−1). Immediately after the lipid wetted the membrane,250 μL of test compound solution (50 μM) in triplicate was added to the wells ofthe donor plate. The donor and acceptor plates were assembled into a sandwichand incubated at room temperature for 16 h. The donor plate was carefullyremoved and 200 μL of the solution in the acceptor plate was placed on a 96-wellUV-transparent Microplate. The absorbance was measured by UV spectroscopy onthe GT Analyst (Molecular Devices) plate reader at 260 nm. A reference solutionwas prepared at the same concentration as the sample solution without membrane.The permeability coefficient was calculated using the following equation: Pe= C ×(−)ln(1− [drug]acceptor/[drug]reference); C=Vd × Va/(Vd+Va) × area × time(where Va: volume of acceptor plate; Vd: volume of donor plate; area: membranearea (0.266 cm2); time: incubation time). Desipramine was used as a CNS-highpermeability standard (Pe= /12 × 10−6 cm s−1, reported value; 16.4 ± 2.2 × 10⁻⁶
cm s−1 determined in our hands) and caffeine was used as low CNS-permeabilitystandard (Pe= /1.3 x/10−6 cm s−1 reported value; 4.7 ± 0.1 × 10⁻⁶ cm s−1 deter-mined in our hands). Each drug was tested in triplicate.
In silico prediction of molecular properties. Calculated physicochemical prop-erties were obtained using standard commercial and freeware packages: Schrö-dinger software suite release 2018-1 (QikProp and Epik), ChemAxon Marvin suite(MarvinSketch 20.19) and VCCLAB (ALOGPS 2.1). The 2D structures of all thetitle compounds were generated by using ChemBioDraw Ultra 12.0. LigPrepmodule implemented in Schrödinger was used to generate energy minimized 3Dstructures. Partial atomic charges were computed using the OPLS_2005 force fieldand all compounds were prepared in neutralized form for the calculation ofmolecular properties58. The molecular weight (mol_MW), polar surface area(PSA), hydrogen bond donor (HBD) and octanol/water partitioning coefficient(QPlogPo/w) were calculated using QikProp in Schrödinger’s Maestro 11.559. Forthe most basic pKa calculations (CpKa), the 3D structures (neutral form) were thensubjected to pKa prediction at pH 7.4 (solvent=water) using the sequential modeof the Epik program version 4.301160,61. The water-octanol distribution coefficientat pH 7.4 (ClogD7.4) was calculated using the ChemAxon method of MarvinSketch20.19 (Budapest, Hungary)62–64. The Web site of VCCLAB provides free onlinechemoinformatics tools for the calculation of various physiochemical properties.The ALOGPS 2.1 software was used for the online prediction of log P (AlogP) andwater solubility (logS)65–67. The Central Nervous System Multiparameter Opti-mization (CNS MPO) scores were calculated using the reported template34,68.
Organotypic explant culture of GBM. GBM tumor specimens were obtained fromthe surgical suite under an approved protocol (IRB # 09-156, PI: Viviane Tabar,MD). GBM explants were prepared as described previously47,69. Briefly, GBMtumor specimens were collected from the surgical suite and placed on ice. Thetumor tissue was treated with red blood cell (RBC) lysis buffer (eBioscience, SanDiego, CA) and washed with ice-cold sterile phosphate buffered saline (PBS, pH7.4) containing 3X penicillin (300 IUmL−1) and 3X streptomycin (300 µg mL−1).After removing necrotic tissue, the tumor tissue was carefully cut into smallexplants (~2 mm3) using a pair of sterile scalpels. Explants were placed atopMillicell inserts (up to six explants per insert) (Millipore, Billerica, MA) pretreated
NATURE COMMUNICATIONS | https://doi.org/10.1038/s41467-021-24821-2 ARTICLE
NATURE COMMUNICATIONS | (2021) 12:4669 | https://doi.org/10.1038/s41467-021-24821-2 | www.nature.com/naturecommunications 15
with 1 µg mL−1 fibronectin (BD Biosciences, Franklin Lakes, NJ), and cultured in35 mm dishes containing 1 mL N2 medium consisting of F12-DMEM withN2 supplements (Life Technologies, Carlsbad, CA), 1.55 mgmL−1 glucose and 2mgmL−1 sodium bicarbonate. The medium was changed every other day. Agentsused to treat the explants include: PU-H71, PU-HZ151, temozolomide (TMZ)(Sigma Aldrich, St. Louis, MO) and bevacizumab (Genentech/Roche, Mahwah, NJ).Radiation (10 Gy) was delivered via X-RAD 225 C irradiator (Precision X-Ray Inc.,North Branford, CT). The explants were harvested at 10 days after start of treat-ment with the drugs. For radiation, the explants were treated on day 5, and har-vested on day 10.
Western blotting. Protein extracts were prepared in 50 mM Tris-HCl, pH 7.4, 150mM NaCl, 1% NP40 buffer supplemented with protease inhibitors cocktail(Roche). The samples were resolved by SDS-PAGE, transferred onto nitrocellulosemembrane and probed with primary-, followed by horseradish peroxidase-conjugated secondary antibody. Primary antibodies used: HSP90β (H90-10) (SMC-107; RRID:AB_854214; 1:3000) and HSP110 (SPC-195; RRID:AB_2119373;1:2000) were purchased from StressMarq; HSP90α (ab2928; RRID:AB_303423;1:6000) and Olig2 (ab109186; RRID:AB_10861310; 1:1000) from Abcam; β-actin(A1978; RRID:AB_476692; 1:3000) from Sigma-Aldrich; p53 (2524; RRID:AB_331743; 1:2000), PTEN (9188; RRID:AB_2253290; 1:1000), Bcl-2 (15071;RRID:AB_2744528; 1:1000), EGFR (2085; RRID:AB_1903953; 1:1000), PDGFRα(3174; RRID:AB_2162345; 1:1000), p-AKT (Ser473) (4060; RRID:AB_2315049;1:1000), p-AKT (Thr308) (13038; RRID:AB_2629447; 1:1000), AKT (4691; RRID:AB_915783; 1:2000), p-ERK1/2 (Thr202/Tyr204) (4370; RRID:AB_2315112;1:2000), ERK 1/2 (9102; RRID:AB_330744; 1:4000), Bim (2933; RRID:AB_1030947; 1:1000), Bad (9268; RRID:AB_10695002; 1:1000), Bid (2002; RRID:AB_10692485; 1:1000), Bcl-xL (2764; RRID:AB_2228008; 1:1000), Bcl-w (2724;RRID:AB_10691557; 1:1000), Mcl-1 (5453; RRID:AB_10694494; 1:1000), GAPDH(5174; RRID:AB_10622025; 1:5000), RB (9309; RRID:AB_823629; 1:1000), p-RB(Ser807/811) (8516; RRID:AB_11178658; 1:1000), NF1 (14623; RRID:AB_2798543;1:1000), HOP (5670; RRID:AB_10828378; 1:2000), EGFR (4267; RRID:AB_2246311; 1:1000), Pgp, also called multi-drug resistance protein 1 (MDR1)(12683; RRID:AB_2715689; 1:1000) and CDC37 (4793; RRID:AB_10695539;1:2,000) from Cell Signaling Technology; HSP70 (ADI-SPA-810; RRID:AB_10616513; 1:2,000), HOP (ADI-SRA-1,500; RRID:AB_10618972; 1:2000) andHSC70 (ADI-SPA-815; RRID:AB_10617277; 1:4,000) from Enzo and cleavedPARP, and p85 fragment (G7341; RRID:AB_430876; 1:1000) from PromegaBlotswere visualized by enhanced chemiluminescence (GE). ImageJ (versions 1.4 and1.52) was used for western blot quantification.
Glioma stem-like cell culture and neurosphere assay. Single cell suspension ofGBM tumor cells was prepared as described previously46. Briefly, tumor tissue wastreated with RBC lysis buffer and washed with ice-cold sterile PBS containing 3Xantibiotics. The tissue was then minced into small pieces (<1 mm3) with a pair ofsterile scalpels, and then incubated in Hank’s balanced salt solution without Ca2+
and Mg2+ (CMF-HBSS) for 5 min at 37 °C, and then in 1X Accumax (InnovativeCell Technologies Inc., San Diego, CA) for 10 min at room temperature. The tissuewas resuspended in ice-cold CMF-HBSS, and the tumor cells were released fromthe tissue by gentle pipetting. The cells were cultured in low-attachment cultureplates (Corning, Corning, NY) with EGF and FGF (20 ng mL−1 each) andB27 supplement (1:50; Gibco, Carlsbad, CA) in N2 medium to form NSs. Toestablish an adherent GSC culture70, NSs were plated on culture dishes treated with15 µg mL−1 polyornithine (PO), 4 µg mL−1 mouse laminin 1, and 2 µg mL−1
fibronectin, and cultured in N2 medium containing EGF and FGF. For serial NSassays, primary NSs were dissociated with Accumax, and plated at 500–1000 cellsper well in a low-attachment six-well plate in N2 medium containing EGF, FGF,B27 supplement, and 0.15 % methylcellulose to minimize cell aggregation.
Immunohistochemistry and TUNEL assay. GBM explants were fixed in ice cold4% paraformaldehyde (pH 7.4) overnight at 4 °C, washed twice with PBS, thentransferred to 30% sucrose in PBS and incubated at 4 °C overnight. The explantswere embedded in Tissue-Tek Optimal Cutting Temperature (OCT) compound(Sakura Finetek, Torrance, CA) and sectioned at 10 µm on a cryostat (Leica,Deerfield, IL). After washing in PBS, sections were blocked in PBS containing 10%normal goat serum, 1% bovine serum albumin, and 0.1% Triton X-100 for onehour. The sections were then incubated with primary antibodies at 4 °C overnight,washed three times with PBS, incubated with the appropriate secondary antibodies(1:400, Alexa conjugates, Molecular Probes, Invitrogen) for two hours at roomtemperature, counterstained with DAPI (4′,6-diamidino-2-phenylindole, MolecularProbes) and mounted in 70% glycerol. Primary antibodies included: Ki67 (1:100Dako) (GA62661-2; RRID:AB_2687921), CD105 (1:100, Dako) (M3527; RRID:AB_2099044), CD31 (1:100, BD Biosciences) (550274; RRID:AB_393571), cleavedCaspase-3 (9661; RRID:AB_2070042) (1:100, Cell Signaling Technology). Apop-totic cells were detected by a subsequent TUNEL (Terminal deoxynucleotidyltransferase dUTP nick end labeling) using In Situ Cell Death Detection Kit,Fluorescein (Roche Applied Sciences, Indianapolis, IN), after the DAPIstaining step.
Viability assay. GSCs were adherently cultured in PO/laminin/fibronectin-coated96 or 48-well plates, and treated with various concentrations of inhibitors in N2medium containing EGF and FGF in duplicates. At 0 h and 48 h post treatment,cells were harvested in CellTiter-Glo lysis buffer, and viability (based on ATP level)was measured according to the manufacturer’s instruction for CellTiter-Glo cellviability assay (Promega, Madison, WI). Percentage of growth inhibition was cal-culated by comparing luminescence values obtained from treated versus controlcells, accounting for initial cell population at time zero. To measure GBM explanttissue viability, each explant was homogenized in a buffer consisting of PBS/CellTiter-Glo lysis buffer (1:1) and was mixed with an equal volume of CellTiter-Glo reagent to measure viability. Viability from at least three explants was mea-sured for each treatment group. MDA-MB-468 and HepG2 cells were plated in 96-well black plates at 8000 cells per well. The compounds were added to the cells intriplicates by serial dilutions and incubated for 72 h. Cell viability was measured byCellTiter-Glo luminescent cell viability assay (Promega, Madison, WI) and ana-lyzed as described above.
Tumor-derived endothelial cell culture. Single cell suspension was prepared froma freshly resected GBM tumor as described above, and CD105+ tumor endothelialcells were isolated by a MoFlo cell sorter (Beckman Coulter, Pasadena, CA) using aFITC-conjugated CD105 antibody (1:20, BD Biosciences) (561443; RRID:AB_10714629). The acquired data was saved into a flow cytometry standard fileand analyzed using Flow Jo v10.7 software (FlowJo LLC.). Cells were resuspendedin endothelial growth medium consisting of endothelial basal medium-2 (EBM-2)(Lonza, Allendale, NJ), 2.5% FBS, 10 ng mL−1 FGF2, and 100 µgmL−1 gentana-micin, and plated on 96-well plates pretreated with rat tail collagen type I. After4 days, the medium was switched to an endothelial differentiation medium con-sisting of EBM-2, 0.25 % FBS, 100 nM hydrocortisone, and 100 µg mL−1 genta-namicin, and cultured for another 4 days. The cells were then treated with variousconcentrations of inhibitor in the endothelial differentiation medium for 6 daysbefore they were harvested for viability assay, as described above.
Tumor establishment. For subcutaneous xenografts, mice were anesthetized with2% isoflurane (Baxter Healthcare) (2 l min−1 medical air). MDA-MB-469 and ASPC-1 cells were implanted subcutaneously (5 × 10⁶ cells in 150 µL 1:1 PBS/matrigel® (BDBiosciences, San Jose, CA) in the right shoulder or flank and allowed to grow for~2 weeks until the tumors reached 5–10mm in diameter. For orthotopic xenografts,mice were anesthetized with 2% isoflurane (2 Lmin−1 medical air) (Baxter Health-care), and Boreholes were made in the skull using a small hand drill. Patient-derivedglioma-stem cells and MDA-MB-468 cells (5 × 10⁵ cells in 2 µL PBS) were stereo-tactically injected into the striatum (2mm lateral and 1mm anterior to the bregma;2.7 mm deep) using a Stoelting Digital New Standard Stereotaxic Device and a 5 µLHamilton syringe. Cells were allowed to grow for 3–6 weeks.
Small-Animal PET imaging. Orthotopic GBM xenografts in mice were establishedby injection of 5 × 10⁵ cells in 2 μL PBS. For PET analyses, GSCs were injected intothe striatum. Boreholes were made using a small hand drill. Mice were imaged withMRI (typically ~ 2–3 weeks after injection), and – if tumors were visible on MRI –they were imaged by micro-PET using the [124I]-radiolabeled PU-HZ151. Whenmice started showing symptoms of progressing GBM, they received a microdose of[124I]-PU-HZ151 and serial PET scans were performed at 20 mins, 6, 24, 48, 72,and 96 h post tracer administration using a dedicated small-animal PET scanner(Focus 120 microPET; Siemens Medical Solutions, USA, formerly ConcordeMicrosystems, Knoxville, TN). Mice were maintained under 2% isoflurane (BaxterHealthcare, Deerfield, IL) anesthesia in oxygen at 2 L min−1 during the entirescanning period. To reduce the thyroid uptake of free iodide arising from meta-bolism of tracer, mice received 0.01% potassium iodide solution in their drinkingwater starting 48 h prior to tracer administration. For PET imaging, each mousewas administered [124I]-PU-HZ151 (15 µCi g−1, 3 µCi µL−1 in in saline, Hospira,0.9% sodium chloride in water) via the tail vein or ip. Approximately 5 min prior toPET acquisition, mice were anesthetized by inhalation of a mixture of isoflurane(Baxter Healthcare, Deerfield, IL, USA; 2% isoflurane, 2 L min−1 medical air) andpositioned on the scanner bed. Anesthesia was maintained using a 1% isoflurane-O2 mixture. PET data for each mouse was recorded using static scans of 15 min andacquired at the indicated times post injection. Quantification and %ID g−1 valueswere calculated by manually drawing regions of interests in three different framesand determining the average values using ASI Pro VM™ MicroPET Analysissoftware (Siemens Medical Solutions, Knoxville, TX).
In vivo biodistribution. For acute in vivo biodistribution studies, mice withxenografts on forelimbs were injected intravenously in the tail vein with 25–50 µCiof [131I]-PU-HZ151 in 200 µL of saline, Hospira, 0.9% sodium chloride in water.Activity in the syringe before and after administration was assayed in a dosecalibrator (CRC-15R; Capintec) to determine by difference the actual activityadministered to each animal. Animals were euthanized by CO2 asphyxiation atdifferent time points post-administration of the tracer and organs including tumorswere harvested and weighed. I-131 was measured in a scintillation g-counter(Perkin Elmer 1480 Wizard 3 Auto Gamma counter, Waltham, MA) using a260–340 keV energy window. Count data were background and decay-corrected to
ARTICLE NATURE COMMUNICATIONS | https://doi.org/10.1038/s41467-021-24821-2
16 NATURE COMMUNICATIONS | (2021) 12:4669 | https://doi.org/10.1038/s41467-021-24821-2 | www.nature.com/naturecommunications
the time of injection, and the percent injected dose per gram (%ID g−1) for eachtissue sample was calculated by using a measured calibration factor to convertcount rate to activity and the activity was normalized to the activity injected andthe mass of sample assayed to yield the activity concentration in %ID g−1.
Pharmacokinetic studies in mice. Pharmacokinetic studies were performed inmale B6D2F1 mice (Harlan Laboratories) following oral (po) or intravenous (iv)administration of PU-HZ151. Blood and brain tissue were collected followingeuthanasia at the scheduled time points of 5, 30 min, 1, 4, and 8 h following ivdosing and of 30 min, 1, 4, and 8 h following po dosing. Brain samples wereimmediately flash frozen in liquid nitrogen following collection and stored at−80 °C until analysis. Blood samples were collected into an EDTA tube by heartpuncture and centrifuged at 17,000×g for 5 min at 4 °C to separate the plasma andimmediately frozen on dry ice and stored at −80 °C until analysis. The plasmasample (50 µL) was added with 250 µL of acetonitrile and 10 µL of internal stan-dard (PU-HZ151-d4), and then thoroughly vortexed to precipitate plasma proteinand centrifuged at 17,000×g for 5 min at 4 °C. The supernatant was evaporated on aGeneVac and the residue was taken up into 100 µL of mobile phase (65% H2O: 35%acetonitrile+ 0.1% FA), applied to a 96-well plate and analyzed by LC-MS/MS(6410, Agilent Technologies) to measure concentrations of PU-HZ151. A ZorbaxEclipse XDB-C18 column (4.6 × 50 mm, 5 μm) was used for the LC separation, andthe analyte was eluted under an isocratic condition (65% H2O+ 0.1% HCOOH:35% CH3CN) for 5 min at a flow rate of 0.4 mL/min. Concentration in plasma wasdetermined by comparison to a standard curve prepared by spiking untreatedplasma samples to appropriate concentration of PU-HZ151 (1–2000 ng mL−1),processed and analyzed in the same manner as treated samples specified above.Frozen brain tissue was dried, weighed, and added with 750 µL of water/acetonitrile(7:3) and 10 µL of internal standard (PU-HZ151-d4) solution. This was homo-genized, extracted with methylene chloride, and evaporated on a GeneVac. Theresidue was taken up into 100 µL of mobile phase (65% H2O: 35% acetonitrile+0.1% FA) and analyzed by LC-MS/MS (6410, Agilent Technologies) to measureconcentrations of PU-HZ151. A Zorbax Eclipse XDB-C18 column (4.6 × 50 mm,5 μm) was used for the LC separation, and the analyte was eluted under an isocraticcondition (65% H2O+ 0.1% HCOOH: 35% CH3CN) for 5 min at a flow rate of0.4 mLmin−1. Concentrations in tissues were determined by comparison to astandard curve of PU-HZ151 (1–2000 ng mL−1). Drug concentration (μM) in thebrain was then modified to account for an average water space of 0.8 mL g−1.
Epichaperome detection in human patients. [124I]-PU-HZ151 and [124I]-PU-H71 were synthesized in-house by the institutional cyclotron core facility at highspecific activity. Analyses of the epichaperome by positron emission tomography(PET-CT) were performed as previously reported13. In brief, research PET-CT wasperformed using an integrated PET-CT scanner (Discovery DSTE, GE Healthcare).CT scans for attenuation correction and anatomic coregistration were performedbefore tracer injection. Patients received 5 mCi of [124I]-PU-HZ151 or [124I]-PU-H71 by peripheral vein over 2 min. PET data were reconstructed using a standardordered subset expected maximization iterative algorithm. Emission data werecorrected for scatter, attenuation, and decay. PET scans were performed 0.5, 3, and24 h after tracer administration. Numbers in the scale bar indicate upper and lowerstandardized uptake value (SUV) thresholds that define pixel intensity on PETimages. SUV is a pixel value, derived from PET measurements of in vivo radio-activity, quantified as the fraction of the radioactive dose injected found in a cubiccentimeter of measured tissue multiplied (ie, normalized) by patient body weight(grams). Maximum Intensity Projection (MIP) 3D images were constructed fromthe voxels with maximum intensity that fell in the way of parallel rays traced fromthe viewpoint to the plane of projection. At each pixel the highest data valueencountered along the corresponding viewing ray was determined. MRI scans wereobtained as part of routine clinical care using hardware and standard data acqui-sition and processing methods. MRI was obtained using a 1.5T magnet (SignaHDxt, GE Healthcare, Milwaukee, WI). Images were acquired using 5mm slicethickness with no interslice gap. axial fast spin-echo T2-weighted (repetition time[TR]/echo time [TE]= 4000/100 msec, matrix 256 × 256); axial fluid-attenuatedinversion recovery (FLAIR; TR/TE/inversion time [TI]= 10,000/160/2200 msec,matrix 256 × 256); sagittal and axial T1-weighted; and contrast coronal, sagittal, andaxial T1-weighted images (TR/TE= 500/10msec, matrix 256 × 256) were obtained.Gadopentetate dimeglumine (Magnevist, HealthCare Pharmaceuticals Inc.) wasinjected though a peripheral angiocatheter at a standard dose (0.2mL kg−1 bodyweight, 40 mL, 2 cc s−1). For precise localization of tracer uptake to specific neu-roanatomical structures, PET brain images were fused to MRI brain images usingthe Integrated Registration application of the AW Suite software package (GEHealthcare, Milwaukee, Wisconsin, USA).
Plasma pharmacokinetics assays in human patients. All patient blood sampleshad a valid chain of custody from venipuncture through onsite specimen analysisand disposal. For [124I]-PU-HZ151 injection and blood sampling, separate per-ipheral intravenous lines were placed. Blood samples were collected 1, 5, 15, 30,60–90, and 150–270 min post injection. For quantification of radioprobe clearanceand metabolism, plasma samples were radioassayed by well counter andradioHPLC using standard techniques. Activity in whole blood and plasma
specimens was radioassayed by well counter (1480 WIZARD® 3” AutomaticGamma Counter, PerkinElmer, Shelton, Connecticut USA), after separating bloodand plasma by centrifuge (3000×g for 10 min at 4 °C). Well counting obtained aminimum of 10,000 counts per specimen correcting for background activity andradioactive decay from time of tracer injection. An I-124 standard was assayed onthe well counter to obtain a calibration factor for converting sample scintillationcount rates (in cpm) to millicurie (mCi) of activity. Dividing sample activity by thesample volume and intravenously administered patient dose (mCi) quantified thesample activity in terms of fraction-of-injected-dose (expressed as a decimal) permL (ID mL−1); multiplying this quantity by 100% yields the percent of the injecteddose per ml (%ID mL−1). This value was multiplied by the patient body weight (g)to convert to standard uptake values (SUV) for comparison with tissue SUV valuesmeasured by PET, also calculated as the ID per mL tissue volume, normalized topatient body weight (g). Blood and plasma concentration data were separatelyplotted versus time. A bi-exponential mathematical function was fit to theexperimental data by a least-squares approach, with goodness-of-fit assessed byconventional graphic and coefficient analyses. From the patient-specific fitted curveformulae, individual blood and plasma clearance half-times and other pharmaco-kinetic parameters were determined. The software used for the fits and to derive thePK parameters was EXCEL 365 (Microsoft Corp, Redmon, WA).
Digital autoradiography and H&E staining. For epichaperome detection viaautoradiography, tumor bearing mice were administered with [131I]-PU-HZ151(15 µCi g−1, 3 µCi µL−1 in saline, Hospira, 0.9% sodium chloride in water) via tailvein injection. Prior to brain excision, mice were perfused with 20 mL PBS. Brainswere excised at the indicated time post injection and fixed in Tissue-Tek O.C.T.compound (Sakura Finetek, Torrance, CA) and flash frozen in liquid nitrogen andcut into 10 µm sections using a Vibratome UltraPro 5000 Cryostat (Vibratome, St.Louis, MO). A storage phosphor autoradiography plate (Fujifilm, BAS-MS2325,Fiji Photo Film, Japan) was exposed to the tissue slices overnight at −20 °C andread the following day. Relative count intensity of the sections in each image wasquantified using ImageJ 1.47u processing software. The same sections were sub-sequently subjected to hematoxylin-eosin (H&E) staining for morphological eva-luation of tissue pathology and to compare the localization of the epichaperomeprobe with the location of tumor tissue.
Epichaperome detection by native gel. Cultured cells and orthotopic tumorswere collected and lysed in 20 mM Tris pH 7.4, 20 mM KCl, 5 mM MgCl2, 0.01%NP40 buffer containing protease, and phosphatase inhibitors. Protein extracts wereloaded onto 4–10% native gradient gel and resolved at 4 °C. Samples were trans-ferred onto nitrocellulose membrane in 0.1% SDS-containing transfer buffer for1 h. The membranes were immunoblotted with the following antibodies: HOP(SRA-1500, Enzo; RRID:AB_10618972; 1:2000); HSP90α (ab2928, Abcam; RRID:AB_303423; 1:6000); HSP90β (SMC-107, StressMarq; RRID:AB_854214; 1:3000)and β-actin (A5316, Sigma; RRID:AB_476743; 1:3000).
Survival studies in mice. Following intracranial xenotransplantation of the GSCs,and 7 days after tumor transplantation (5 × 10⁵ cells in 2 μL PBS) mice were treatedwith PU-HZ151 (50 mg kg−1 of PU-HZ151 in 5 mM citrate buffer+ 15% captisol,iv on a Monday-Wednesday-Friday schedule) or vehicle three times per week.Survival of the animals was followed until the mice became morbid (physical and/or neurological symptoms), at which point, the animals were killed. Typically, micebecame symptomatic several weeks to a few months after GSC implantation. Log-rank tests were used to compare the distribution of time to killing across groupsand Kaplan–Meier curves were produced.
Statistics and reproducibility. Statistics were performed and graphs generatedusing Prism 8 or 9 software (GraphPad). Statistical significance was determinedusing either Student’s t-tests (2-group comparisons) or ANOVA (multiple com-parisons). The survival benefit was determined using a log-rank (Mantel–Cox) test.Pearson’s coefficient was determined to measure the statistical relationship betweenvariables. Means and standard errors were reported for all results unless otherwisespecified. Effects achieving 95% probability (i.e., p < 0.05) were interpreted as sta-tistically significant. No statistical methods were used to pre-determine samplesizes, but these are similar to those generally employed in the field. Unlessotherwise indicated, experiments were repeated three times with similar results.
Reporting summary. Further information on research design is available in the NatureResearch Reporting Summary linked to this article.
Data availabilityThe source data underlying all main and supplementary figures are provided as a SourceData file. All data generated or analyzed during this study are included in this publishedarticle (and its supplementary information files). For the pilot feasibility clinical study,the supplementary information contains the Study protocol. De-identified raw data fromindividual patients enrolled on the pilot feasibility clinical study can be obtained from M.P.D. ([email protected]) upon reasonable request. These data include time-dependent biodistribution of [124I]-PU-AD in blood, major organs, tissues-of–interest,
NATURE COMMUNICATIONS | https://doi.org/10.1038/s41467-021-24821-2 ARTICLE
NATURE COMMUNICATIONS | (2021) 12:4669 | https://doi.org/10.1038/s41467-021-24821-2 | www.nature.com/naturecommunications 17
and excreta, including blood-based characterization of tracer metabolism. Source data areprovided with this paper.
Received: 3 August 2020; Accepted: 7 July 2021;
References1. Sahni, N. et al. Widespread macromolecular interaction perturbations in
human genetic disorders. Cell 161, 647–660 (2015).2. Bojadzic, D. & Buchwald, P. Toward small-molecule inhibition of protein-
protein interactions: general aspects and recent progress in targetingcostimulatory and coinhibitory (immune checkpoint) interactions. Curr. Top.Med. Chem. 18, 674–699 (2018).
3. Ran, X. & Gestwicki, J. E. Inhibitors of protein-protein interactions (PPIs): ananalysis of scaffold choices and buried surface area. Curr. Opin. Chem. Biol.44, 75–86 (2018).
4. Paladino, A. et al. Chemical perturbation of oncogenic protein folding: fromthe prediction of locally unstable structures to the design of disruptors ofHsp90–client interactions. Chem. Eur. J. 26, 9459–9465 (2020).
5. Serapian, S. A. & Colombo, G. Designing molecular spanners to throw in theprotein networks. Chem. Eur. J. 26, 4656–4670 (2020).
6. Hadizadeh Esfahani, A., Sverchkova, A., Saez-Rodriguez, J., Schuppert, A. A. &Brehme, M. A systematic atlas of chaperome deregulation topologies acrossthe human cancer landscape. PLoS Comput. Biol. 14, e1005890 (2018).
7. Joshi, S. et al. Adapting to stress - chaperome networks in cancer. Nat. Rev.Cancer 18, 562–575 (2018).
8. Lindquist, S. L. & Kelly, J. W. Chemical and biological approaches for adaptingproteostasis to ameliorate protein misfolding and aggregation diseases:progress and prognosis. Cold Spring Harb. Perspect. Biol. 3, a004507 (2011).
9. Lackie, R. E. et al. The Hsp70/Hsp90 chaperone machinery inneurodegenerative diseases. Front. Neurosci. 11, 254 (2017).
10. Sala, A. J., Bott, L. C. & Morimoto, R. I. Shaping proteostasis at the cellular,tissue, and organismal level. J. Cell Biol. 216, 1231–1241 (2017).
11. Jayaraj, G. G., Hipp, M. S. & Hartl, F. U. Functional modules of theproteostasis network. Cold Spring Harb. Perspect. Biol. 12, a033951 (2020).
12. Finka, A. & Goloubinoff, P. Proteomic data from human cell cultures refinemechanisms of chaperone-mediated protein homeostasis. Cell StressChaperones 18, 591–605 (2013).
13. Rodina, A. et al. The epichaperome is an integrated chaperome network thatfacilitates tumour survival. Nature 538, 397–401 (2016).
14. Kishinevsky, S. et al. HSP90-incorporating chaperome networks as biosensorfor disease-related pathways in patient-specific midbrain dopamine neurons.Nat. Commun. 9, 4345 (2018).
15. Pillarsetty, N. et al. Paradigms for precision medicine in epichaperome cancertherapy. Cancer Cell 36, 559–573.e7 (2019).
16. Inda, M. C. et al. The epichaperome is a mediator of toxic hippocampal stressand leads to protein connectivity-based dysfunction. Nat. Commun. 11, 319(2020).
17. Yan, P. et al. Molecular stressors engender protein connectivity dysfunctionthrough aberrant N-glycosylation of a chaperone. Cell Rep. 31, 107840 (2020).
18. Buchner, J. Molecular chaperones and protein quality control: an introductionto the JBC Reviews thematic series. J. Biol. Chem. 294, 2074–2075 (2019).
19. Mayer, M. P. & Gierasch, L. M. Recent advances in the structural andmechanistic aspects of Hsp70 molecular chaperones. J. Biol. Chem. 294,2085–2097 (2019).
20. Wang, T. et al. Chaperome heterogeneity and its implications for cancer studyand treatment. J. Biol. Chem. 294, 2162–2179 (2019).
21. Taldone, T. et al. A chemical biology approach to the chaperome in cancer-HSP90 and beyond. Cold Spring Harb. Perspect. Biol. 12, a034116 (2020).
22. Schuetz, D. A. et al. Kinetics for Drug Discovery: an industry-driven effort totarget drug residence time. Drug. Discov. Today 22, 896–911 (2017).
23. Tonge, P. J. Drug-target kinetics in drug discovery. ACS Chem. Neurosci. 9,29–39 (2018).
24. He, H. et al. Identification of potent water soluble purine-scaffold inhibitors ofthe heat shock protein 90. J. Med. Chem. 49, 381–390 (2006).
25. Moulick, K. et al. Affinity-based proteomics reveal cancer-specific networkscoordinated by Hsp90. Nat. Chem. Biol. 7, 818–826 (2011).
26. Nayar, U. et al. Targeting the Hsp90-associated viral oncoproteome ingammaherpesvirus-associated malignancies. Blood 122, 2837–2847 (2013).
27. Kucine, N. et al. Tumor-specific HSP90 inhibition as a therapeutic approachin JAK-mutant acute lymphoblastic leukemias. Blood 126, 2479–2483 (2015).
28. Zong, H. et al. A hyperactive signalosome in acute myeloid leukemia drivesaddiction to a tumor-specific Hsp90 species. Cell Rep. 13, 2159–2173 (2015).
29. Abbott, N. J. & Romero, I. A. Transporting therapeutics across the blood-brain barrier. Mol. Med. Today 2, 106–113 (1996).
30. Mahar Doan, K. M. et al. Passive permeability and P-glycoprotein-mediatedefflux differentiate central nervous system (CNS) and non-CNS marketeddrugs. J. Pharmacol. Exp. Ther. 303, 1029–1037 (2002).
31. Geldenhuys, W. J., Mohammad, A. S., Adkins, C. E. & Lockman, P. R.Molecular determinants of blood-brain barrier permeation. Ther. Deliv. 6,961–971 (2015).
32. Amaral, M. et al. Protein conformational flexibility modulates kinetics andthermodynamics of drug binding. Nat. Commun. 8, 2276 (2017).
33. Immormino, R. M., Kang, Y., Chiosis, G. & Gewirth, D. T. Structural andquantum chemical studies of 8-aryl-sulfanyl adenine class Hsp90 inhibitors. J.Med. Chem. 49, 4953–4960 (2006).
34. Wager, T. T., Hou, X., Verhoest, P. R. & Villalobos, A. Central nervous systemmultiparameter optimization desirability: application in drug discovery. ACSChem. Neurosci. 7, 767–775 (2016).
35. Chiosis, G., Lucas, B., Shtil, A., Huezo, H. & Rosen, N. Development of apurine-scaffold novel class of Hsp90 binders that inhibit the proliferation ofcancer cells and induce the degradation of Her2 tyrosine kinase. Bioorg. Med.Chem. 10, 3555–3564 (2002).
36. Llauger, L. et al. Evaluation of 8-arylsulfanyl, 8-arylsulfoxyl, and 8-arylsulfonyladenine derivatives as inhibitors of the heat shock protein 90. J. Med. Chem.48, 2892–2905 (2005).
37. Du, Y. et al. High-throughput screening fluorescence polarization assay fortumor-specific Hsp90. J. Biomol. Screen. 12, 915–924 (2007).
38. Di, L., Kerns, E. H., Fan, K., McConnell, O. J. & Carter, G. T. High throughputartificial membrane permeability assay for blood-brain barrier. Eur. J. Med.Chem. 38, 223–232 (2003).
39. Dunphy, M. P. S. et al. First-in-human trial of epichaperome-targeted PET inpatients with cancer. Clin. Cancer Res. 26, 5178–5187 (2020).
40. Taldone, T. et al. Experimental and structural testing module to analyzeparalogue-specificity and affinity in the Hsp90 inhibitors series. J. Med. Chem.56, 6803–6818 (2013).
41. Karagoz, G. E. et al. N-terminal domain of human Hsp90 triggers binding tothe cochaperone p23. Proc. Natl Acad. Sci. USA 108, 580–585 (2011).
42. Sternthal, E. et al. Suppression of thyroid radioiodine uptake by various dosesof stable iodide. N. Engl. J. Med. 303, 1083–1088 (1980).
43. Friedman, N. C., Hassan, A., Grady, E., Matsuoka, D. T. & Jacobson, A. F.Efficacy of thyroid blockade on thyroid radioiodine uptake in 123I-mIBGimaging. J. Nucl. Med. 55, 211–215 (2014).
44. Holland, E. C. Glioblastoma multiforme: the terminator. Proc. Natl Acad. Sci.USA 97, 6242–6244 (2000).
45. Parker, N. R., Khong, P., Parkinson, J. F., Howell, V. M. & Wheeler, H. R.Molecular heterogeneity in glioblastoma: potential clinical implications. Front.Oncol. 5, 55 (2015).
46. da Hora, C. C., Schweiger, M. W., Wurdinger, T. & Tannous, B. A. Patient-derived glioma models: from patients to dish to animals. Cells 8, 1177(2019).
47. Shimizu, F., Hovinga, K. E., Metzner, M., Soulet, D. & Tabar, V. Organotypicexplant culture of glioblastoma multiforme and subsequent single-cellsuspension. Curr. Protoc. Stem Cell Biol. Chapter 3, Unit 3.5 (2011).
48. Sugita, M. et al. Targeting the epichaperome as an effective precision medicineapproach in a novel PML-SYK fusion acute myeloid leukemia. NPJ Precis.Oncol. 5, 44 (2021).
49. Auffinger, B., Spencer, D., Pytel, P., Ahmed, A. U. & Lesniak, M. S. The role ofglioma stem cells in chemotherapy resistance and glioblastoma multiformerecurrence. Expert Rev. Neurother. 15, 741–752 (2015).
50. Liebelt, B. D. et al. Glioma stem cells: signaling, microenvironment, andtherapy. Stem Cells Int. 2016, 7849890 (2016).
51. Brennan, C. W. et al. The somatic genomic landscape of glioblastoma. Cell155, 462–477 (2013).
52. Canella, A. et al. Efficacy of onalespib, a long-acting second-generation HSP90inhibitor, as a single agent and in combination with temozolomide againstmalignant gliomas. Clin. Cancer Res. 23, 6215–6226 (2017).
53. de Lange, E. C. M., van den Brink, W., Yamamoto, Y., de Witte, W. E. A. &Wong, Y. C. Novel CNS drug discovery and development approach: model-based integration to predict neuro-pharmacokinetics and pharmacodynamics.Expert. Opin. Drug Discov. 12, 1207–1218 (2017).
54. Wang, A. Z. EPR or no EPR? The billion-dollar question. Sci. Transl. Med. 7,294ec112 (2015).
55. Jhaveri, K. et al. Measuring tumor epichaperome expression using [124I] PU-H71 PET (PU-PET) as a biomarker of response for PU-H71 plus Nab-paclitaxel in HER2 negative (HER2-) metastatic breast cancer (MBC). JCOPrecis. Oncol. 4, 1414–1424 (2020).
56. Leon, A. C., Davis, L. L. & Kraemer, H. C. The role and interpretation of pilotstudies in clinical research. J. Psychiatr. Res. 45, 626–629 (2011).
57. Merugu, S. et al. Chemical probes and methods for single-cell detection andquantification of epichaperomes in hematologic malignancies. MethodsEnzymol. 639, 289–311 (2020).
58. Schrödinger. Schrödinger Release 2018-1: LigPrep (LLC, 2018).
ARTICLE NATURE COMMUNICATIONS | https://doi.org/10.1038/s41467-021-24821-2
18 NATURE COMMUNICATIONS | (2021) 12:4669 | https://doi.org/10.1038/s41467-021-24821-2 | www.nature.com/naturecommunications
59. Schrödinger. Schrödinger Release 2018-1: QikProp (LLC, 2018).60. Schrödinger. Schrödinger Release 2018-1: Epik (LLC, 2018).61. Shelley, J. C. et al. Epik: a software program for pK(a) prediction and
protonation state generation for drug-like molecules. J. Comput. Aided Mol.Des. 21, 681–691 (2007).
62. ChemAxon. Software Solutions And Services For Chemistry & Biology http://www.chemaxon.com (2020).
63. Viswanadhan, V. N., Ghose, A. K., Revankar, G. R. & Robins, R. K. Atomicphysicochemical parameters for three dimensional structure directedquantitative structure-activity relationships. 4. Additional parameters forhydrophobic and dispersive interactions and their application for anautomated superposition of certain naturally occurring nucleoside antibiotics.J. Chem. Inf. Comput. Sci. 29, 163–172 (1989).
64. Klopman, G., Li, J.-Y., Wang, S. & Dimayuga, M. Computer automated log Pcalculations based on an extended group contribution approach. J. Chem. Inf.Comput. Sci. 34, 752–781 (1994).
65. Virtual Computational Chemistry Laboratory (VCCLAB). http://www.vcclab.org/ (2020).
66. Tetko, I. V., Tanchuk, V. Y. & Villa, A. E. P. Prediction of n-octanol/waterpartition coefficients from PHYSPROP database using artificial neuralnetworks and E-state indices. J. Chem. Inf. Comput. Sci. 41, 1407–1421(2001).
67. Tetko, I. V. & Tanchuk, V. Y. Application of associative neural networks forprediction of lipophilicity in ALOGPS 2.1 program. J. Chem. Inf. Comput. Sci.42, 1136–1145 (2002).
68. Wager, T. T., Hou, X., Verhoest, P. R. & Villalobos, A. Moving beyond rules:the development of a central nervous system multiparameter optimization(CNS MPO) approach to enable alignment of druglike properties. ACS Chem.Neurosci. 1, 435–449 (2010).
69. Hovinga, K. E. et al. Inhibition of notch signaling in glioblastoma targetscancer stem cells via an endothelial cell intermediate. Stem Cells 28,1019–1029 (2010).
70. Lee, J. et al. Tumor stem cells derived from glioblastomas cultured in bFGFand EGF more closely mirror the phenotype and genotype of primary tumorsthan do serum-cultured cell lines. Cancer Cell 9, 391–403 (2006).
AcknowledgementsWe thank Michael Metzner for his help with establishing tumor tissue cultures and RajMathews for his help with immunohistochemistry. This work was supported by the U01AG032969, R56 AG061869, R56 AG072599, R01 AG067598, R01 CA172546, R01AG067598, Coins for Alzheimer’s Research, ADDF, the Mr. William H. Goodwin andMrs. Alice Goodwin and the Commonwealth Foundation for Cancer Research and theExperimental Therapeutics Center of the Memorial Sloan Kettering Cancer Center, theMSKCC Brain Tumor Center, P30 CA008748 (NCI Core Facility Grant) and U54OD020355. Technical services provided by the MSKCC Small-Animal Imaging CoreFacility, supported in part by NIH Small-Animal Imaging Research Program Grant NoR24 CA83084 are gratefully acknowledged. The sponsor of the pilot clinical study, SamusTherapeutics, Inc. (Samus), has reviewed this manuscript and agrees with the findings ofthis study, supporting the public disclosure of the study results. Samus was not involvedwith the design of the study protocol, the collection of study data, the analysis of studydata or the writing of this manuscript.
Author contributionsA.B. and K.P. designed and performed the imaging probe discovery and synthesis, theepichaperome detection by PET and autoradiography, and the survival studies. D.Z.,H.H., H.J.P., S.O.O., M.R.P., L.S., W.S., B.S.I., S.S., C.S.D., R.K., H.T., and T.T. designedand performed the medicinal chemistry studies. F.S. performed the GBM studies. M.P.D.and A.Rimner were investigators of the PET imaging clinical trial study. P.Z., M.G., andB.J.B. performed clinical data analyses. S.L. and E.B. performed radiotracer synthesis forthe human PET imaging studies. S.J., S.K.S., S.W., A.Rodina, P.D.P., A.R.M., P.Y., P.P.,J.A., A.C., A.K., T.K., and S.G.L. performed experiments. T.T., M.G., J.S.L., S.L., and V.T.participated in the design and analysis of various experiments, and G.C., T.T., S.D.G., andF.S. wrote the paper.
Competing interestsMemorial Sloan Kettering Cancer Center holds the intellectual rights to this portfolio(PCT/US2007/072671, Treatment of neurodegenerative diseases through inhibition ofHSP90 and WO2013/009655, Uses of labeled HSP90 inhibitors). Samus TherapeuticsInc, of which G.C. has partial ownership, and is a member of its board of directors,has licensed this portfolio. G.C., T.T., H.H., D.Z., A.R., N.P., S.L., and J.L. areinventors on the licensed intellectual property. All other authors declare no com-peting interests.
Additional informationSupplementary information The online version contains supplementary materialavailable at https://doi.org/10.1038/s41467-021-24821-2.
Correspondence and requests for materials should be addressed to F.S. or G.C.
Peer review information Nature Communications thanks Young-Tae Chang and theother, anonymous, reviewer(s) for their contribution to the peer review of this work. Peerreviewer reports are available.
Reprints and permission information is available at http://www.nature.com/reprints
Publisher’s note Springer Nature remains neutral with regard to jurisdictional claims inpublished maps and institutional affiliations.
Open Access This article is licensed under a Creative CommonsAttribution 4.0 International License, which permits use, sharing,
adaptation, distribution and reproduction in any medium or format, as long as you giveappropriate credit to the original author(s) and the source, provide a link to the CreativeCommons license, and indicate if changes were made. The images or other third partymaterial in this article are included in the article’s Creative Commons license, unlessindicated otherwise in a credit line to the material. If material is not included in thearticle’s Creative Commons license and your intended use is not permitted by statutoryregulation or exceeds the permitted use, you will need to obtain permission directly fromthe copyright holder. To view a copy of this license, visit http://creativecommons.org/licenses/by/4.0/.
© The Author(s) 2021
NATURE COMMUNICATIONS | https://doi.org/10.1038/s41467-021-24821-2 ARTICLE
NATURE COMMUNICATIONS | (2021) 12:4669 | https://doi.org/10.1038/s41467-021-24821-2 | www.nature.com/naturecommunications 19