Embed Size (px)
Citation preview

1

2
This Release / Communication, except for the historical information, may contain statements, including the words orphrases such as ‘expects, anticipates, intends, will, would, undertakes, aims, estimates, contemplates, seeks to,objective, goal, projects, should’ and similar expressions or variations of these expressions or negatives of these termsindicating future performance or results, financial or otherwise, which are forward looking statements. These forwardlooking statements are based on certain expectations, assumptions, anticipated developments and other factors whichare not limited to, risk and uncertainties regarding fluctuations in earnings, market growth, intense competition and thepricing environment in the market, consumption level, ability to maintain and manage key customer relationship andsupply chain sources and those factors which may affect our ability to implement business strategies successfully,namely changes in regulatory environments, political instability, change in international oil prices and input costs andnew or changed priorities of the trade. The Company, therefore, cannot guarantee that the forward looking statementsmade herein shall be realized. The Company, based on changes as stated above, may alter, amend, modify or makenecessary corrective changes in any manner to any such forward looking statement contained herein or make writtenor oral forward looking statements as may be required from time to time on the basis of subsequent developments andevents. The Company does not undertake any obligation to update forward looking statements that may be made fromtime to time by or on behalf of the Company to reflect the events or circumstances after the date hereof.
SAFE HARBOUR STATEMENT
3
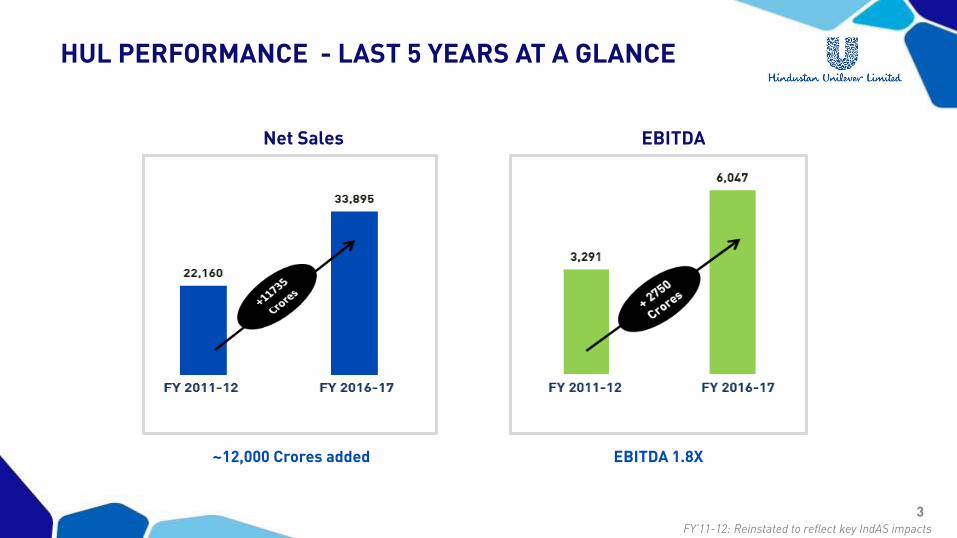
Net Sales EBITDA
~12,000 Crores added EBITDA 1.8X
FY’11-12: Reinstated to reflect key IndAS impacts
HUL PERFORMANCE - LAST 5 YEARS AT A GLANCE
4
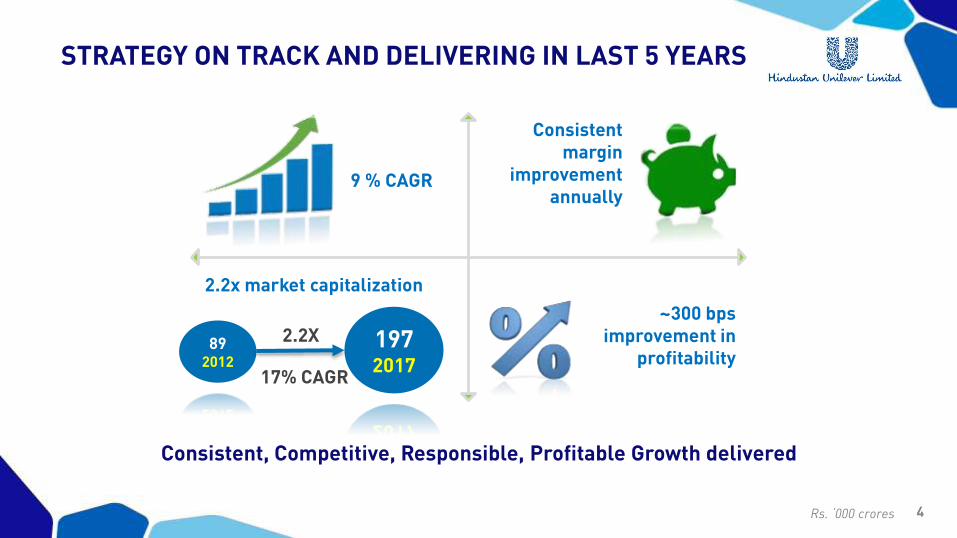
9 % CAGR
Consistent margin
improvement annually
~300 bps improvement in
profitability89
2012
1972017
2.2X
17% CAGR
2.2x market capitalization
Rs. ‘000 crores
Consistent, Competitive, Responsible, Profitable Growth delivered
STRATEGY ON TRACK AND DELIVERING IN LAST 5 YEARS
5
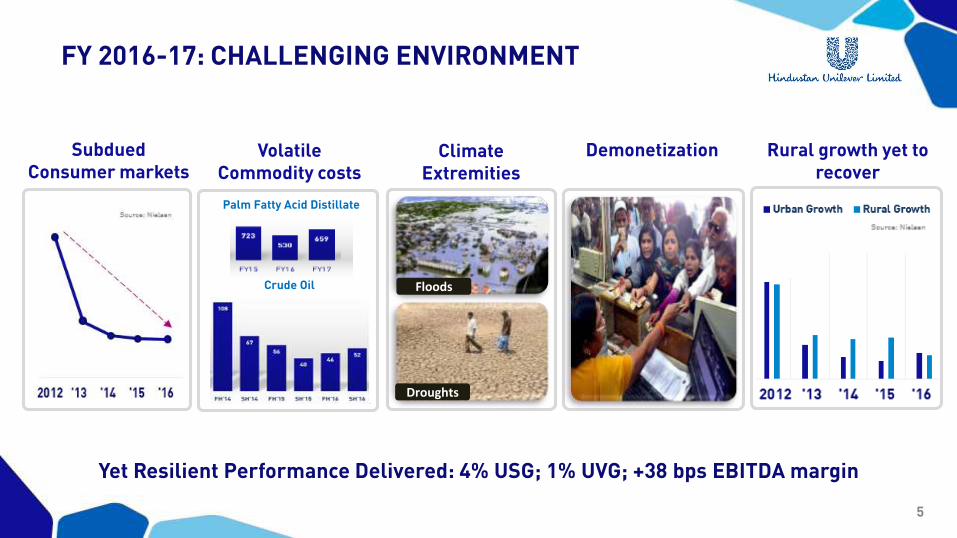
Climate Extremities
Subdued Consumer markets
Volatile Commodity costs
Demonetization
Droughts
Floods
Rural growth yet to recover
Palm Fatty Acid Distillate
Crude Oil
Yet Resilient Performance Delivered: 4% USG; 1% UVG; +38 bps EBITDA margin
FY 2016-17: CHALLENGING ENVIRONMENT
6
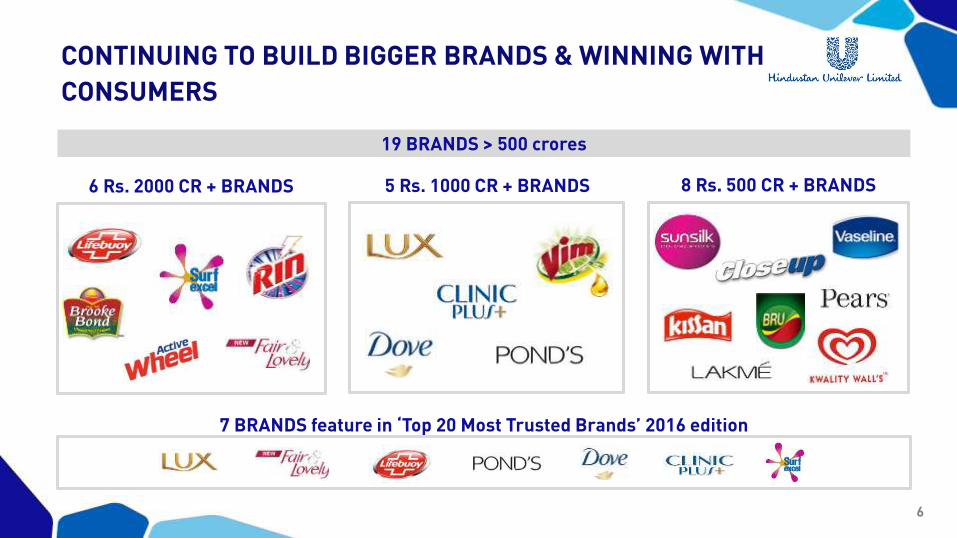
6 Rs. 2000 CR + BRANDS 5 Rs. 1000 CR + BRANDS 8 Rs. 500 CR + BRANDS
7 BRANDS feature in ‘Top 20 Most Trusted Brands’ 2016 edition
19 BRANDS > 500 crores
CONTINUING TO BUILD BIGGER BRANDS & WINNING WITH
CONSUMERS
7
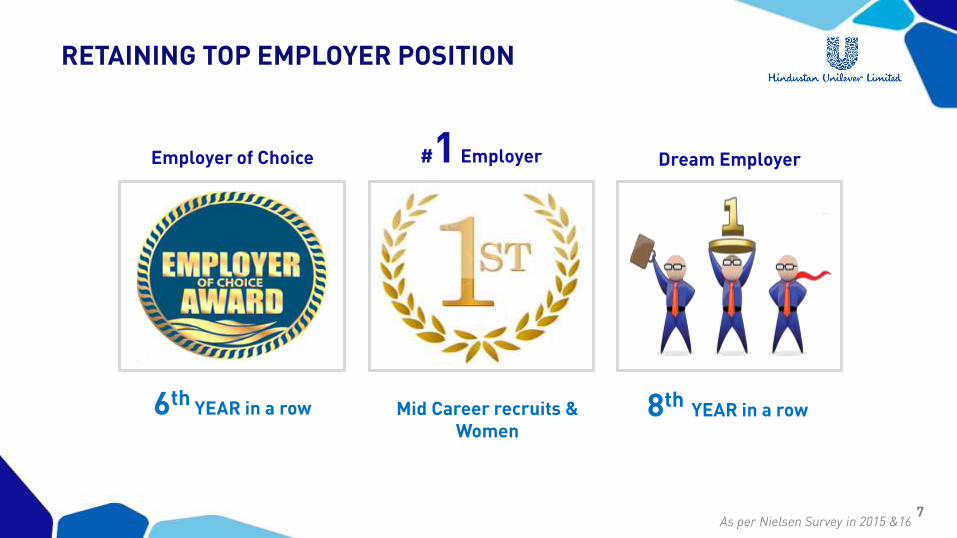
6thYEAR in a row 8th
YEAR in a row
Employer of Choice Dream Employer
Mid Career recruits & Women
#1 Employer
As per Nielsen Survey in 2015 &16
RETAINING TOP EMPLOYER POSITION
8
9
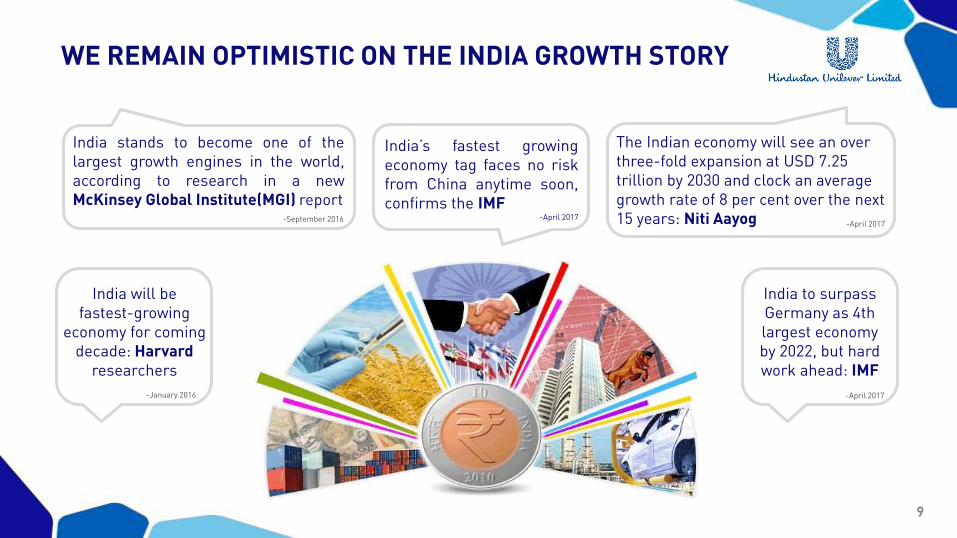
India stands to become one of thelargest growth engines in the world,according to research in a newMcKinsey Global Institute(MGI) report
India’s fastest growingeconomy tag faces no riskfrom China anytime soon,confirms the IMF
-April 2017
The Indian economy will see an over three-fold expansion at USD 7.25 trillion by 2030 and clock an average growth rate of 8 per cent over the next 15 years: Niti Aayog -April 2017
India will be fastest-growing
economy for coming decade: Harvard
researchers
-January 2016
India to surpass Germany as 4th largest economy by 2022, but hard work ahead: IMF
-April 2017
-September 2016
WE REMAIN OPTIMISTIC ON THE INDIA GROWTH STORY
10
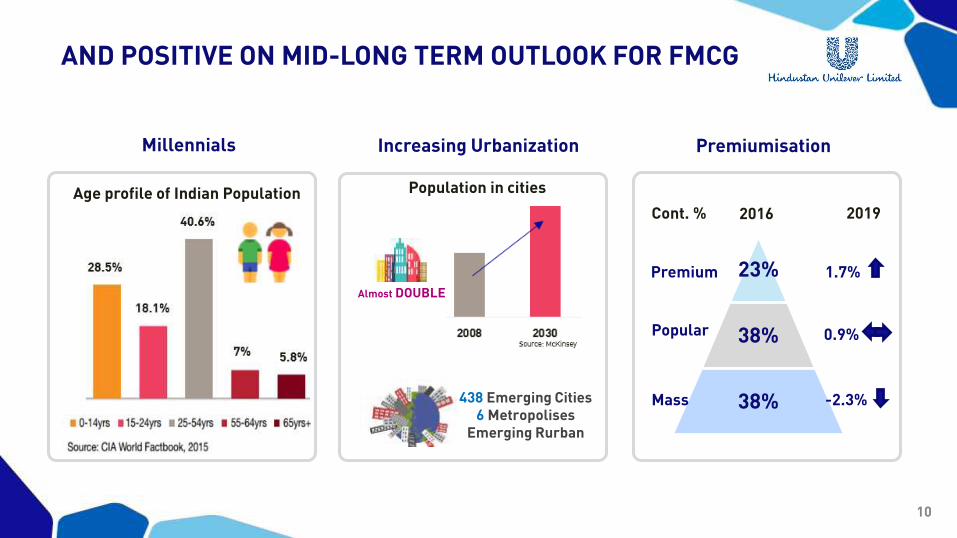
AND POSITIVE ON MID-LONG TERM OUTLOOK FOR FMCG
PremiumisationMillennials
Population in cities
Almost DOUBLE
Increasing Urbanization
438 Emerging Cities6 Metropolises
Emerging Rurban
Age profile of Indian Population
23%
38%
38%
Premium
Popular
Mass
Cont. % 2016 2019
1.7%
0.9%
-2.3%
11
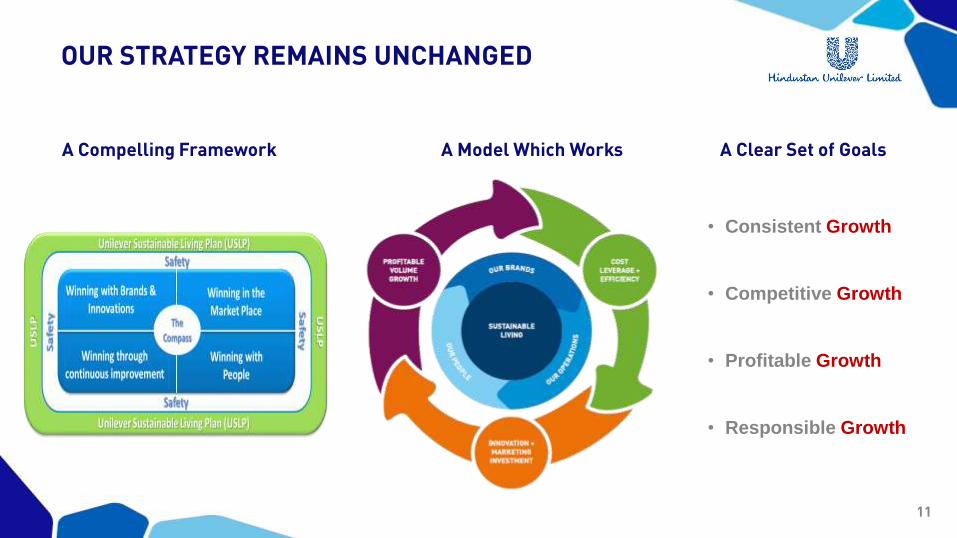
• Consistent Growth
• Competitive Growth
• Profitable Growth
• Responsible Growth
A Compelling Framework A Model Which Works A Clear Set of Goals
OUR STRATEGY REMAINS UNCHANGED

12
Winning with brands and innovation1
4
3
2
5
Winning in the marketplace
Winning through continuous improvement
Winning with people
Unilever Sustainable Living Plan
WINNING DECISIVELY
13
WINNING WITH BRANDS & INNOVATION
14
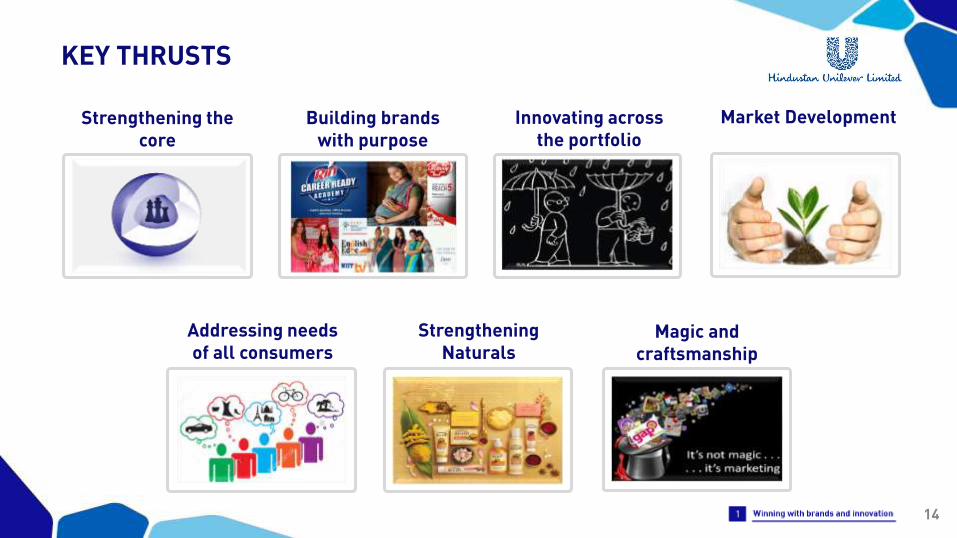
Innovating across the portfolio
Strengthening the core
Magic and craftsmanship
Building brands with purpose
Addressing needs of all consumers
Strengthening Naturals
KEY THRUSTS
Market Development
15
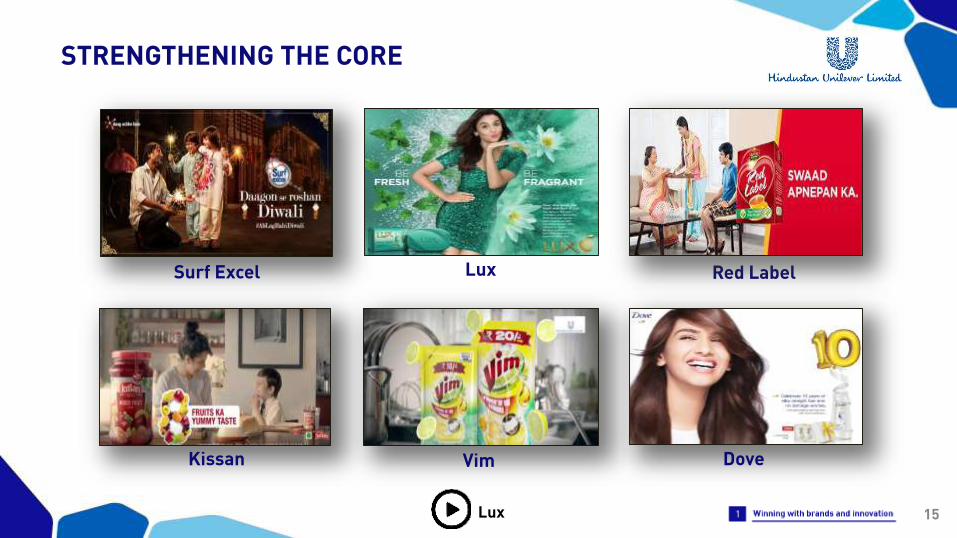
Surf Excel Lux Red Label
Kissan Vim Dove
Lux
STRENGTHENING THE CORE
16
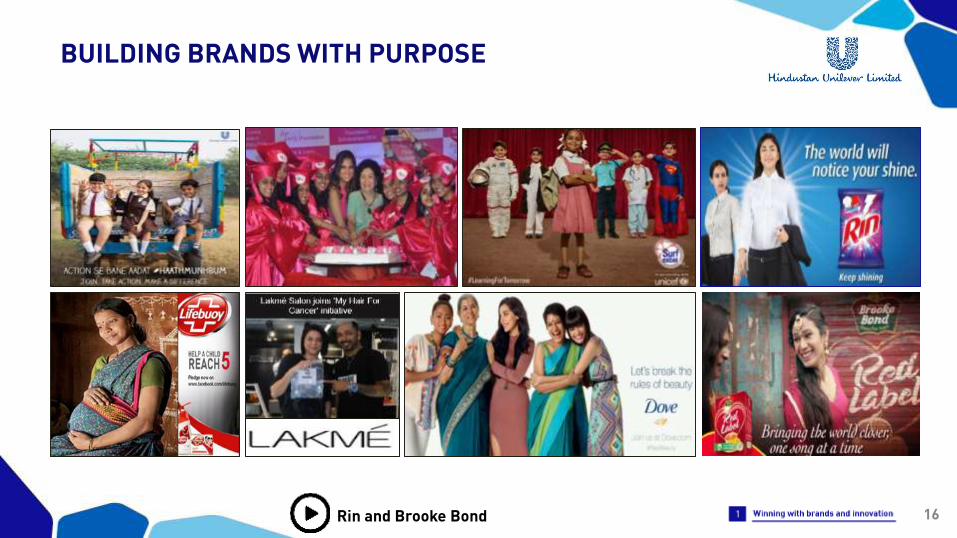
BUILDING BRANDS WITH PURPOSE
Rin and Brooke Bond
17
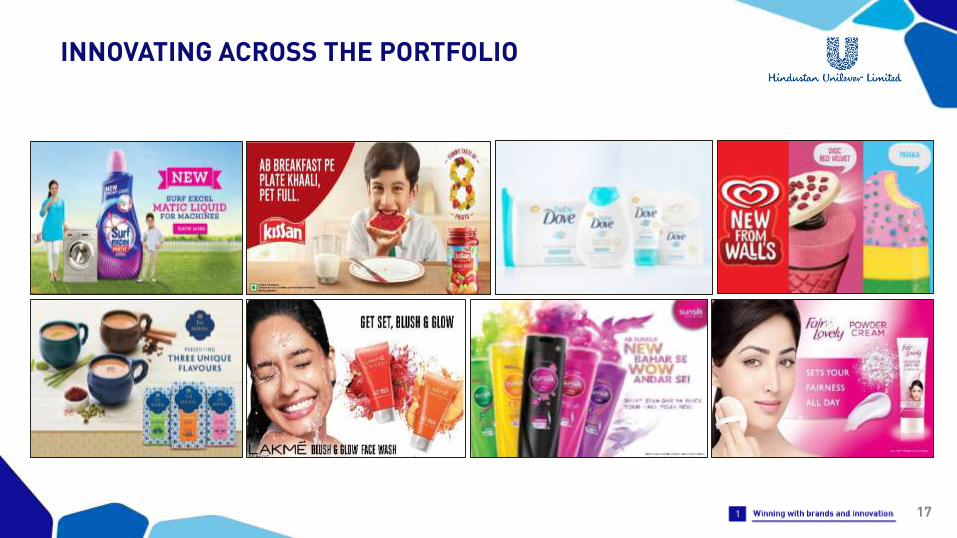
INNOVATING ACROSS THE PORTFOLIO
18
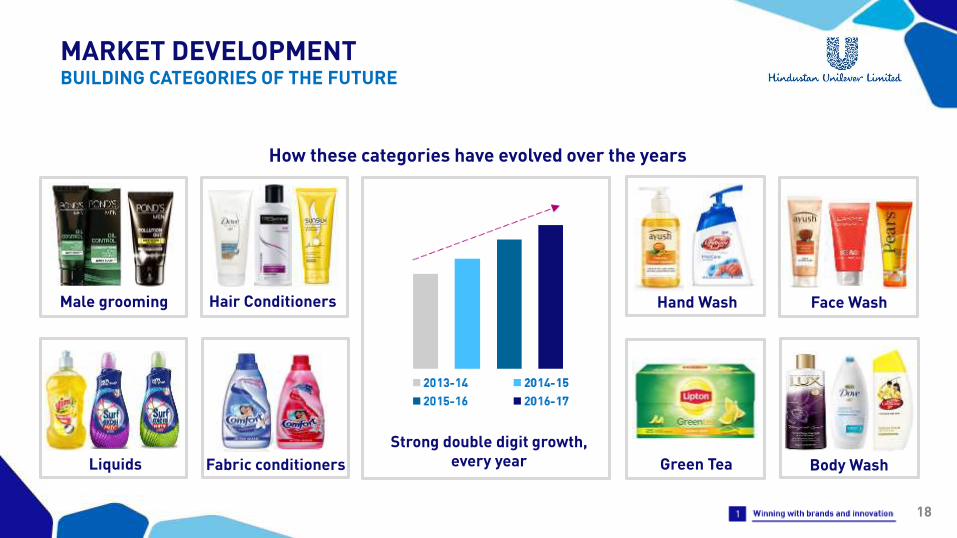
Fabric conditioners Green Tea
Hair Conditioners Hand Wash Face Wash
Liquids
Male grooming
Body Wash
How these categories have evolved over the years
Strong double digit growth, every year
MARKET DEVELOPMENTBUILDING CATEGORIES OF THE FUTURE
19
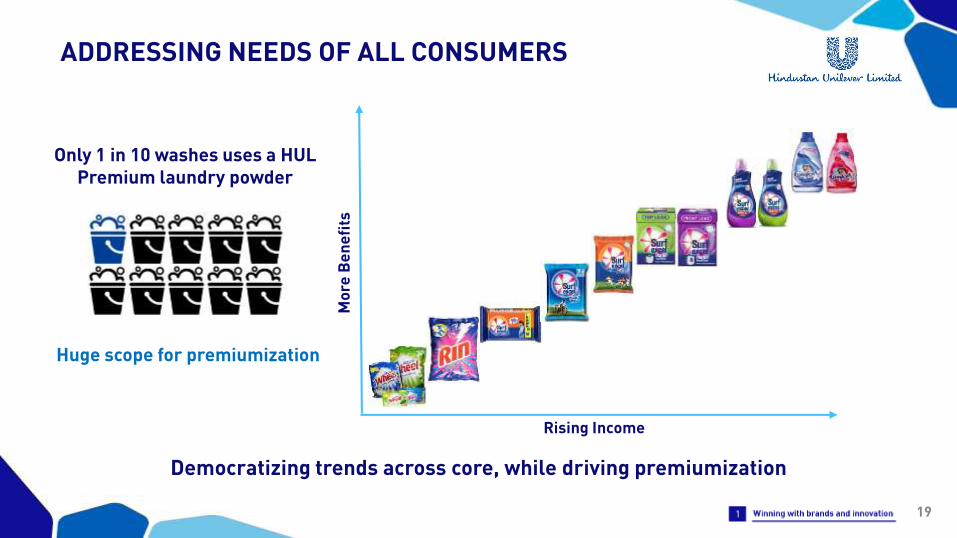
Democratizing trends across core, while driving premiumization
Rising Income
Mo
re B
en
efi
ts
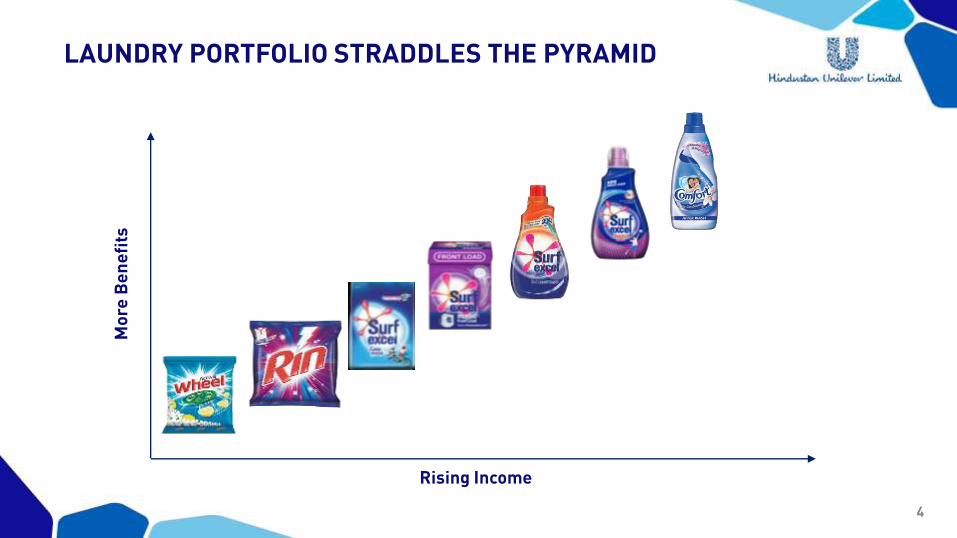
Only 1 in 10 washes uses a HUL Premium laundry powder
Huge scope for premiumization
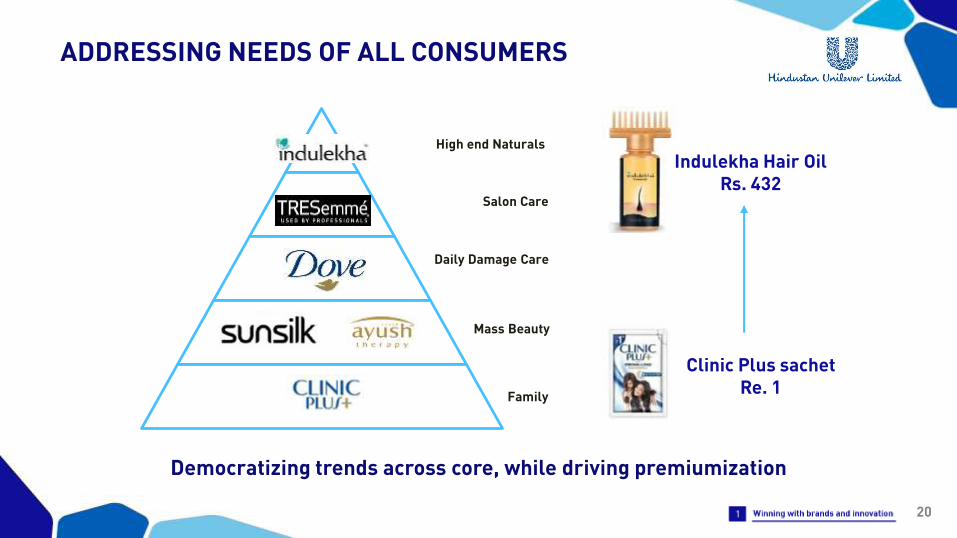
ADDRESSING NEEDS OF ALL CONSUMERS
20
Indulekha Hair OilRs. 432
Clinic Plus sachetRe. 1
Democratizing trends across core, while driving premiumization
High end Naturals
Salon Care
Daily Damage Care
Mass Beauty
Family
ADDRESSING NEEDS OF ALL CONSUMERS
21
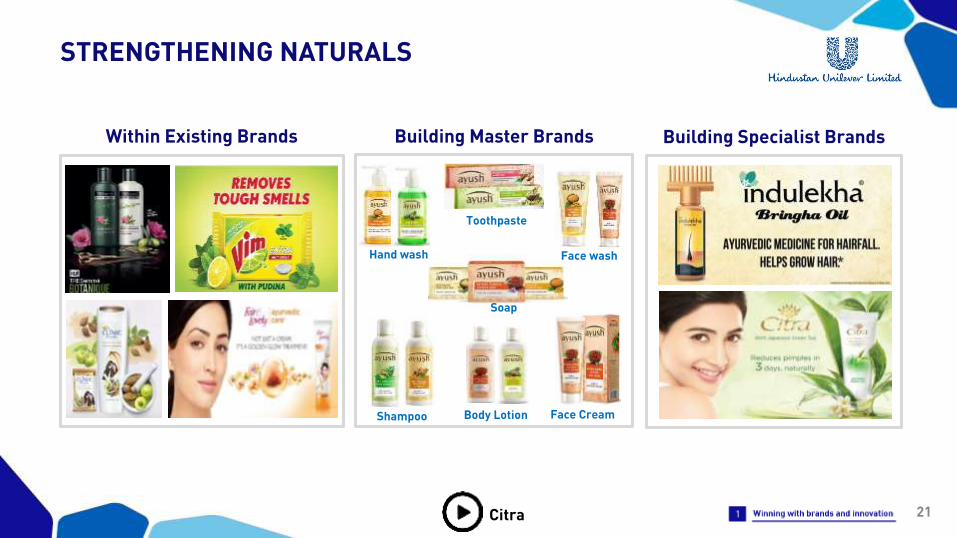
Building Master Brands Building Specialist BrandsWithin Existing Brands
Hand wash
Toothpaste
Face wash
Soap
Shampoo Body Lotion Face Cream
Citra
STRENGTHENING NATURALS
22
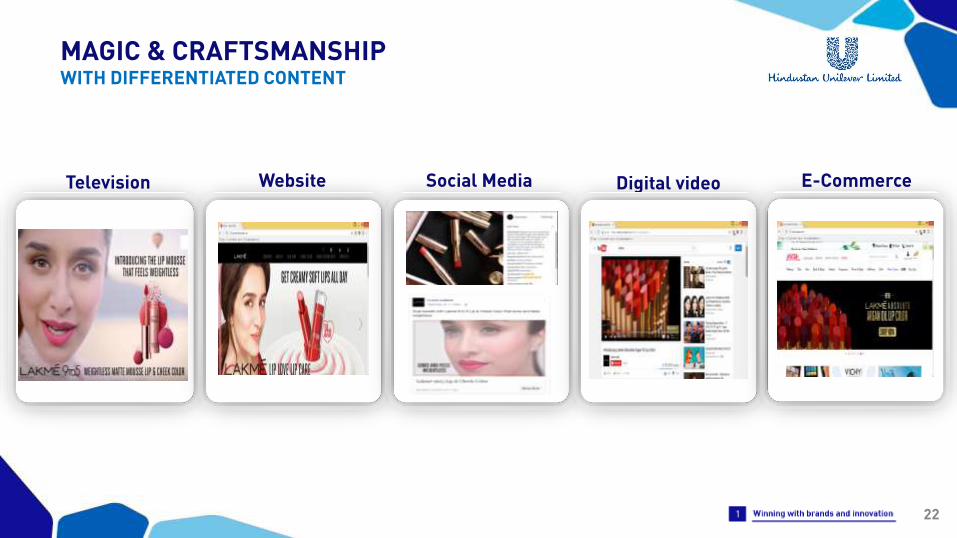
Television Website E-CommerceDigital videoSocial Media
MAGIC & CRAFTSMANSHIPWITH DIFFERENTIATED CONTENT
23
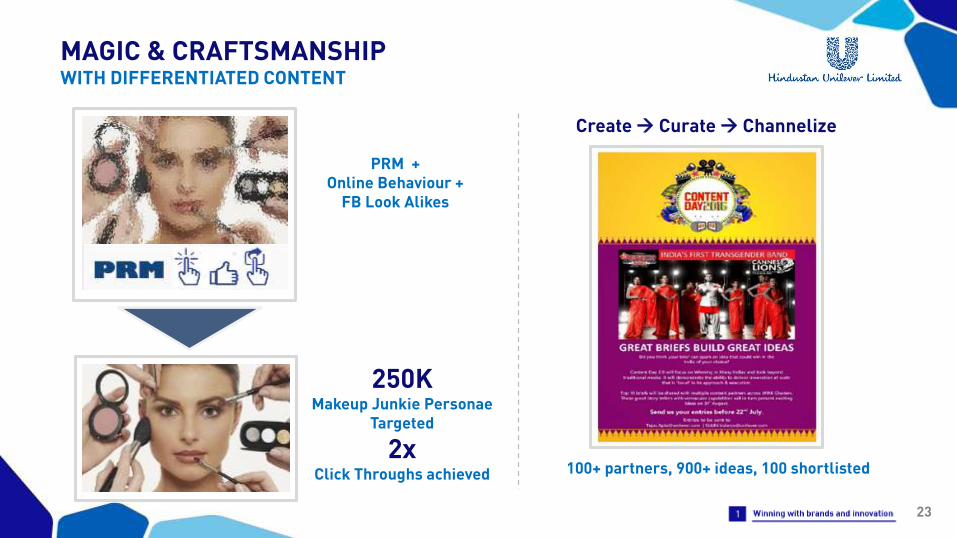
Create Curate Channelize
100+ partners, 900+ ideas, 100 shortlisted
PRM + Online Behaviour +
FB Look Alikes
250KMakeup Junkie Personae
Targeted
2x Click Throughs achieved
MAGIC & CRAFTSMANSHIPWITH DIFFERENTIATED CONTENT
24
WINNING IN THE MARKET PLACE
25
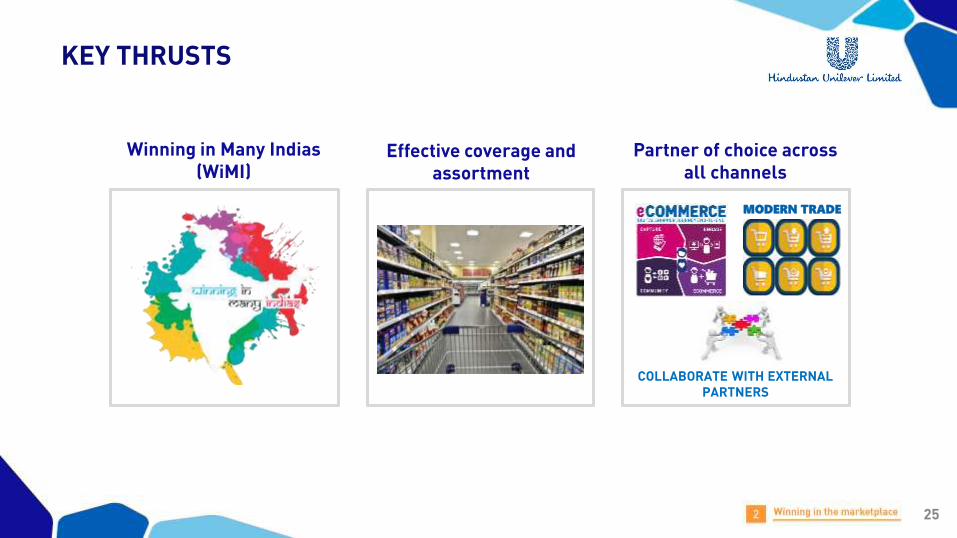
Winning in Many Indias(WiMI)
Partner of choice across all channels
COLLABORATE WITH EXTERNAL PARTNERS
MODERN TRADE
Effective coverage and assortment
KEY THRUSTS
26
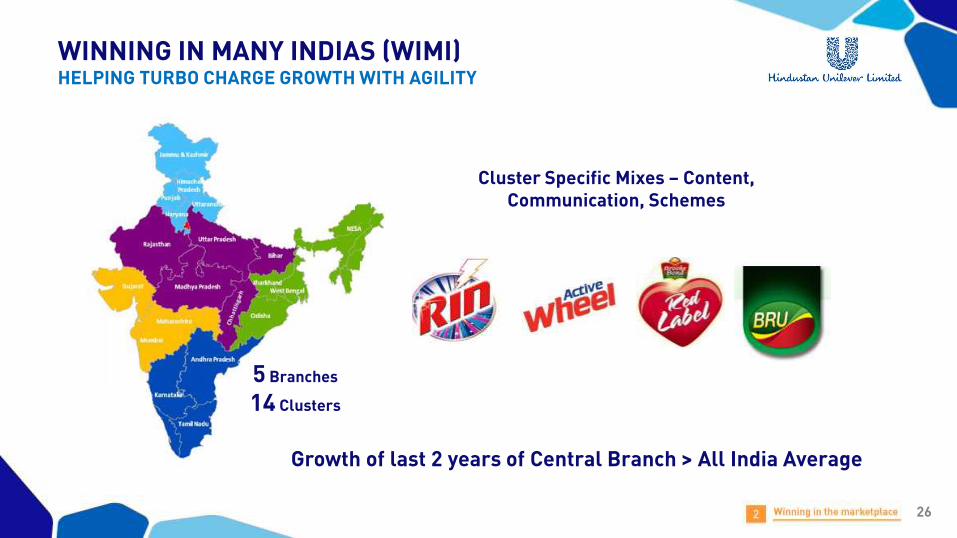
WINNING IN MANY INDIAS (WIMI)HELPING TURBO CHARGE GROWTH WITH AGILITY
5 Branches
14 Clusters
Growth of last 2 years of Central Branch > All India Average
Cluster Specific Mixes – Content, Communication, Schemes
27
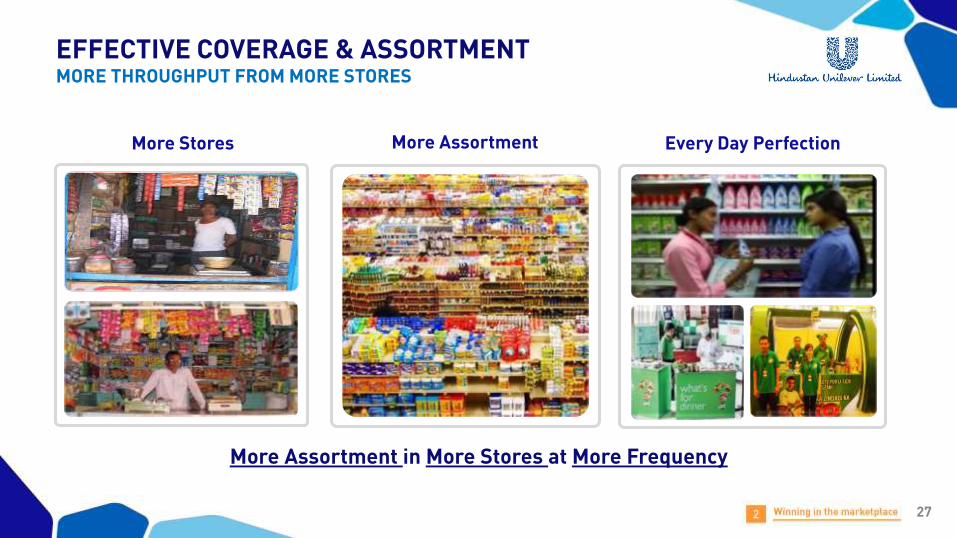
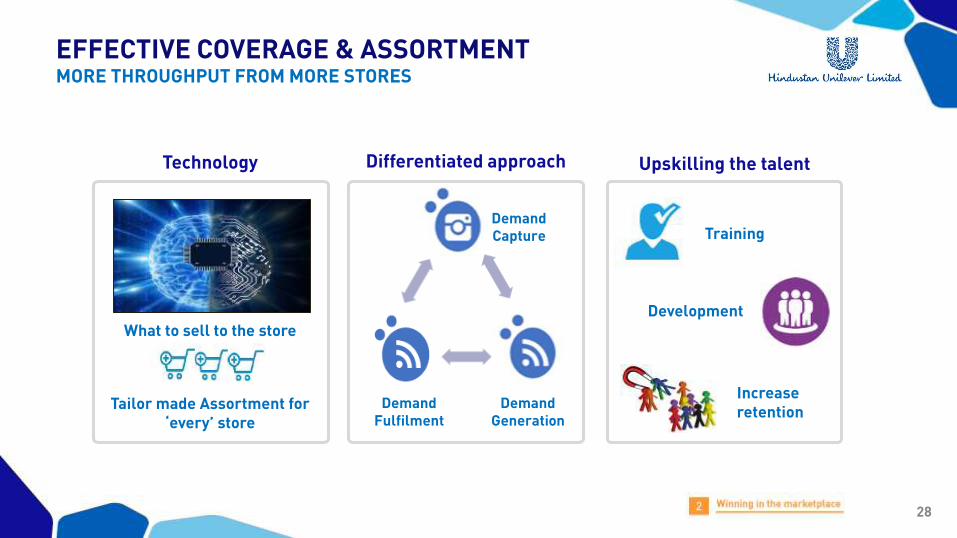
EFFECTIVE COVERAGE & ASSORTMENTMORE THROUGHPUT FROM MORE STORES
More AssortmentMore Stores Every Day Perfection
More Assortment in More Stores at More Frequency
28
Differentiated approachTechnology Upskilling the talent
Demand Capture
Demand Generation
Demand Fulfilment
Training
Development
Increase retention
Tailor made Assortment for ‘every’ store
What to sell to the store
EFFECTIVE COVERAGE & ASSORTMENTMORE THROUGHPUT FROM MORE STORES
29
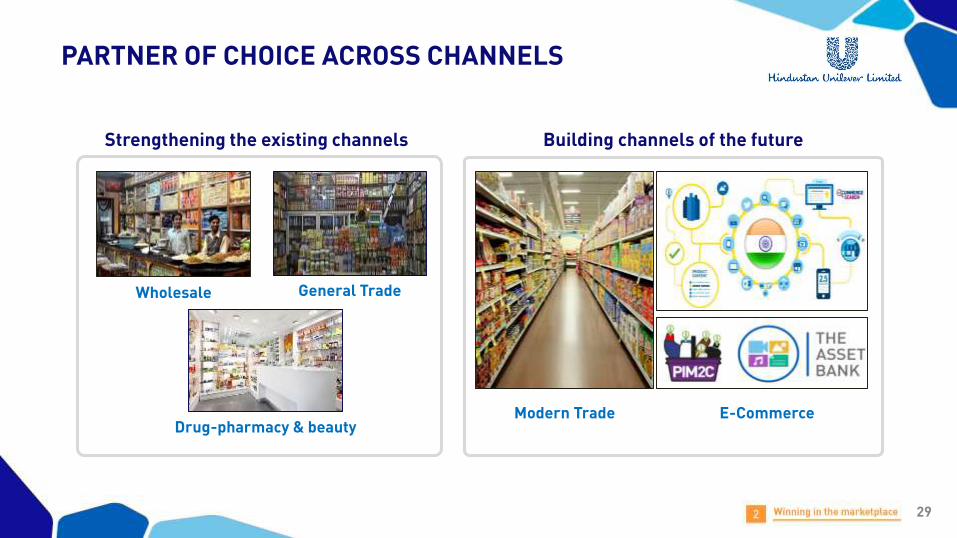
Building channels of the future
Modern Trade E-Commerce
Wholesale
Drug-pharmacy & beauty
General Trade
Strengthening the existing channels
PARTNER OF CHOICE ACROSS CHANNELS
30
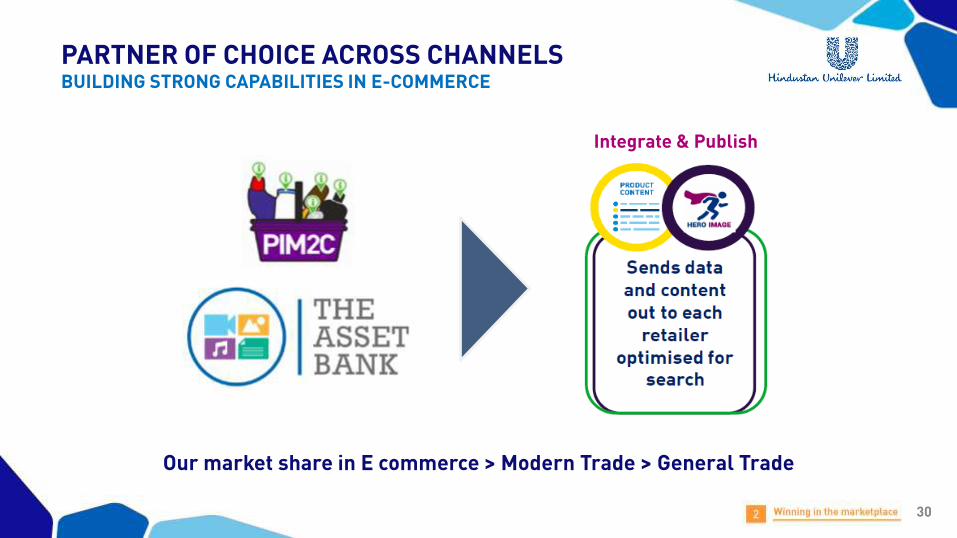
Integrate & Publish
Our market share in E commerce > Modern Trade > General Trade
PARTNER OF CHOICE ACROSS CHANNELSBUILDING STRONG CAPABILITIES IN E-COMMERCE
31
WINNING THROUGH CONTINUOUS IMPROVEMENT
32
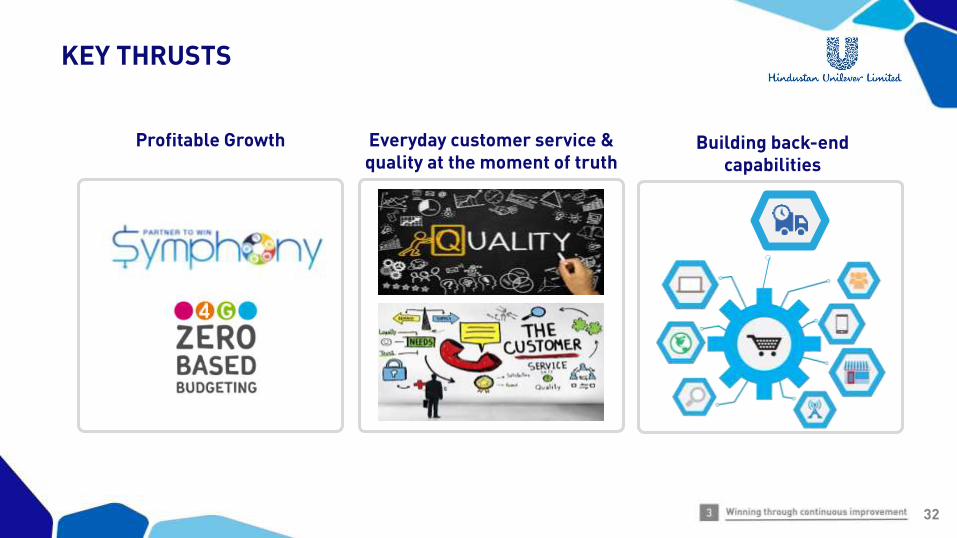
Profitable Growth Everyday customer service & quality at the moment of truth
Building back-end capabilities
KEY THRUSTS
33
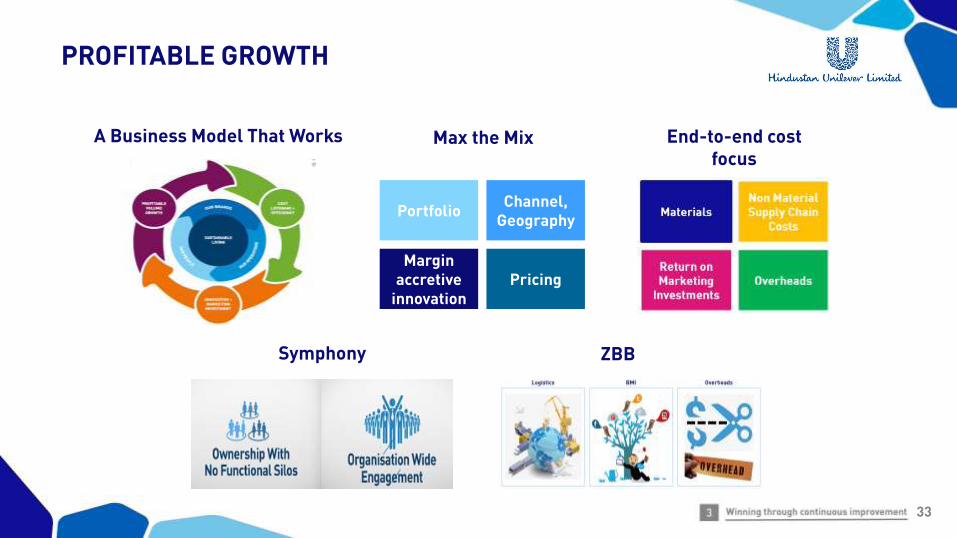
A Business Model That Works End-to-end cost focus
PortfolioChannel,
Geography
Margin accretive
innovationPricing
Max the Mix
ZBBSymphony
PROFITABLE GROWTH
34
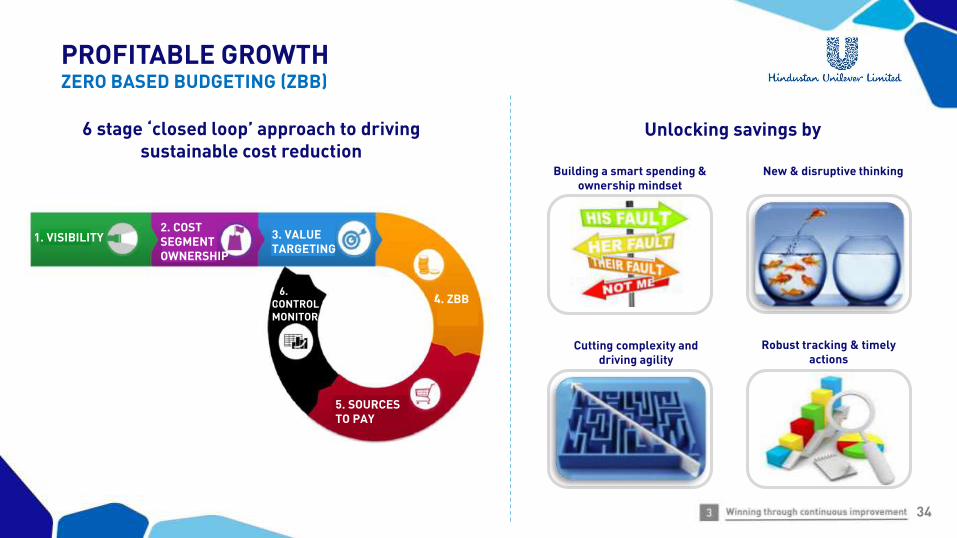
6 stage ‘closed loop’ approach to driving sustainable cost reduction
Building a smart spending & ownership mindset
New & disruptive thinking
Cutting complexity and driving agility
Robust tracking & timely actions
1. VISIBILITY2. COST SEGMENT OWNERSHIP
3. VALUE TARGETING
4. ZBB
5. SOURCES TO PAY
6.CONTROL & MONITOR
Unlocking savings by
PROFITABLE GROWTHZERO BASED BUDGETING (ZBB)
35
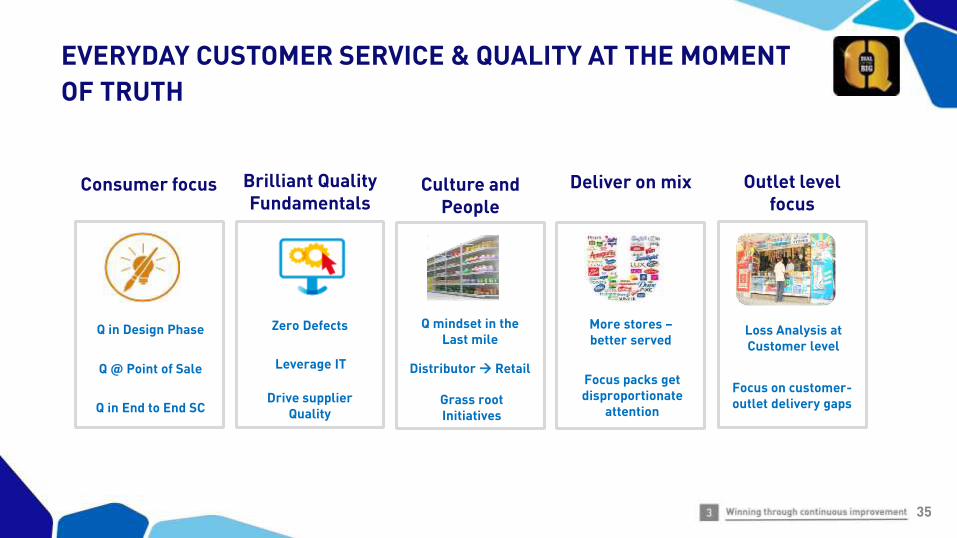
Q @ Point of Sale
Q in End to End SC
Q in Design Phase Zero Defects
Leverage IT
Drive supplier Quality
Q mindset in the Last mile
Distributor Retail
Grass root Initiatives
Consumer focus Brilliant Quality Fundamentals
Culture and People
Focus packs get disproportionate
attention
More stores –better served
Loss Analysis at Customer level
Focus on customer-outlet delivery gaps
Deliver on mix Outlet level focus
EVERYDAY CUSTOMER SERVICE & QUALITY AT THE MOMENT
OF TRUTH
36
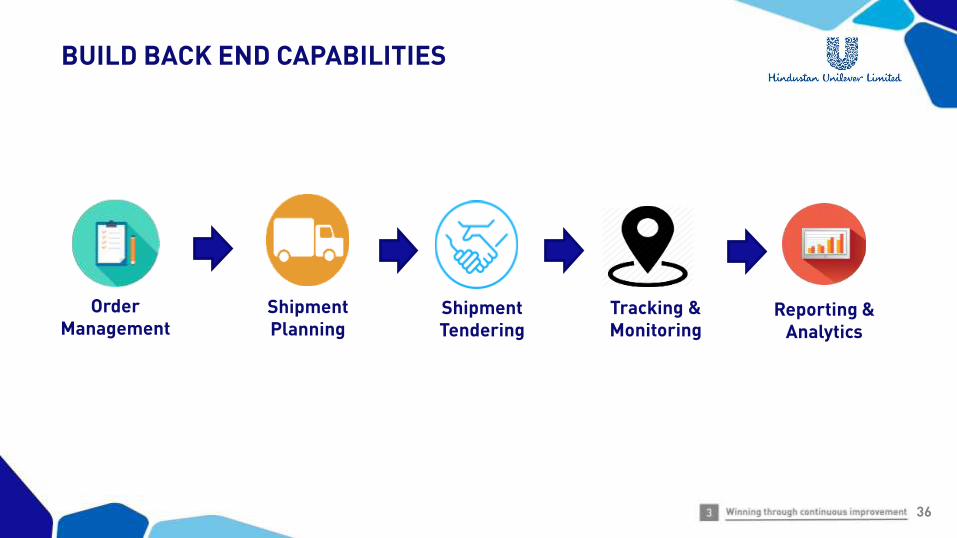
Order Management
Shipment Planning
Shipment Tendering
Tracking & Monitoring
Reporting & Analytics
BUILD BACK END CAPABILITIES
37
WINNING WITH PEOPLE
38
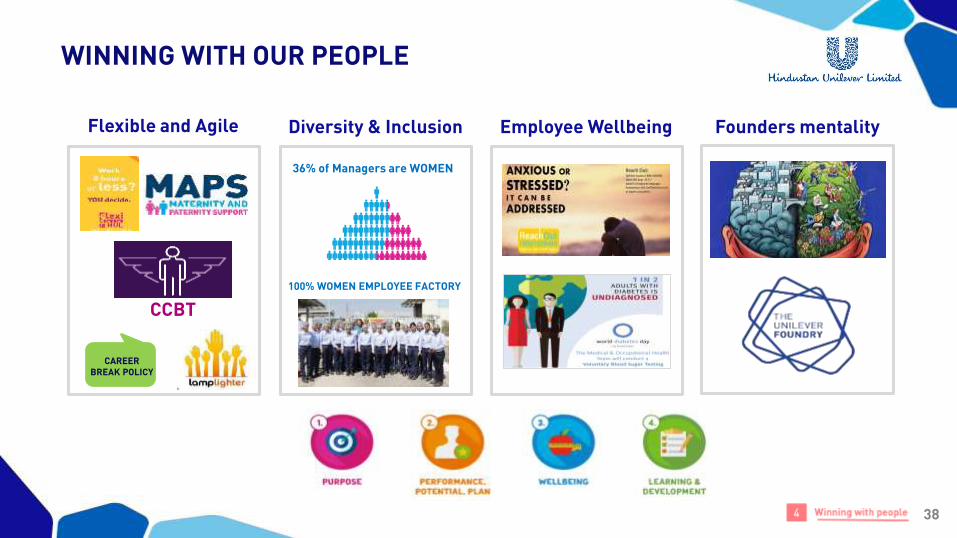
Flexible and Agile Diversity & Inclusion Employee Wellbeing
CAREER BREAK POLICY
100% WOMEN EMPLOYEE FACTORY
CCBT
36% of Managers are WOMEN
Founders mentality
WINNING WITH OUR PEOPLE
39
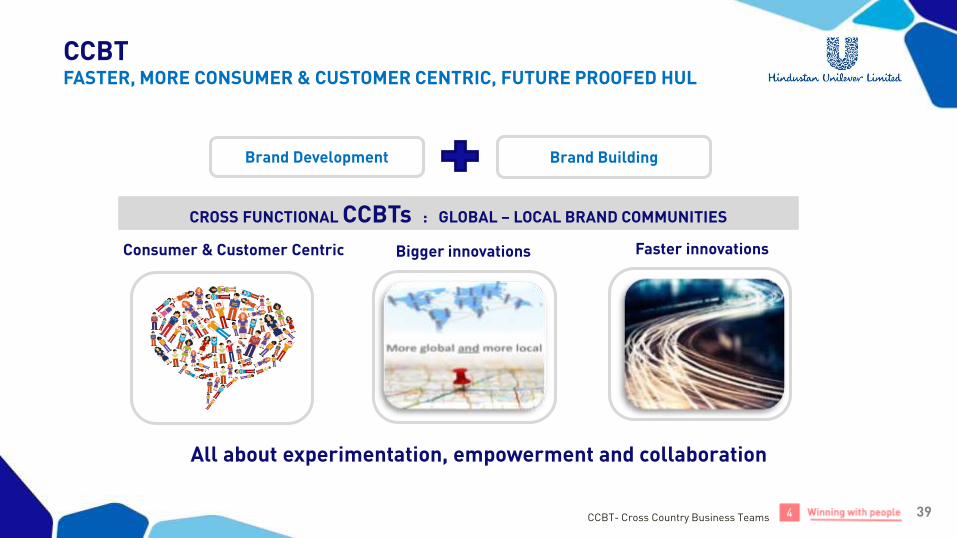
CCBTFASTER, MORE CONSUMER & CUSTOMER CENTRIC, FUTURE PROOFED HUL
Cross-functional CCBTs
Faster innovationsConsumer & Customer Centric
All about experimentation, empowerment and collaboration
CCBT- Cross Country Business Teams
CROSS FUNCTIONAL CCBTs : GLOBAL – LOCAL BRAND COMMUNITIES
Bigger innovations
Brand Development Brand Building
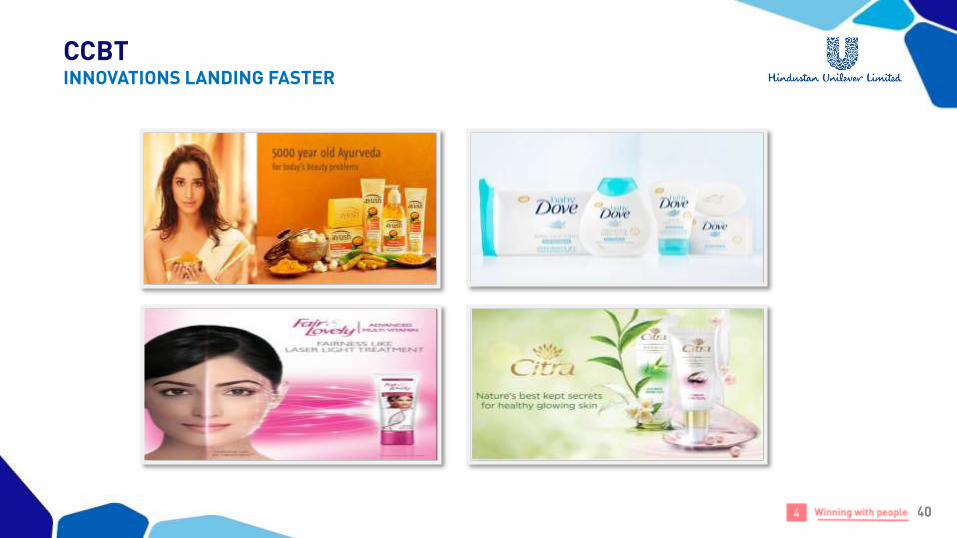
40
CCBTINNOVATIONS LANDING FASTER
41
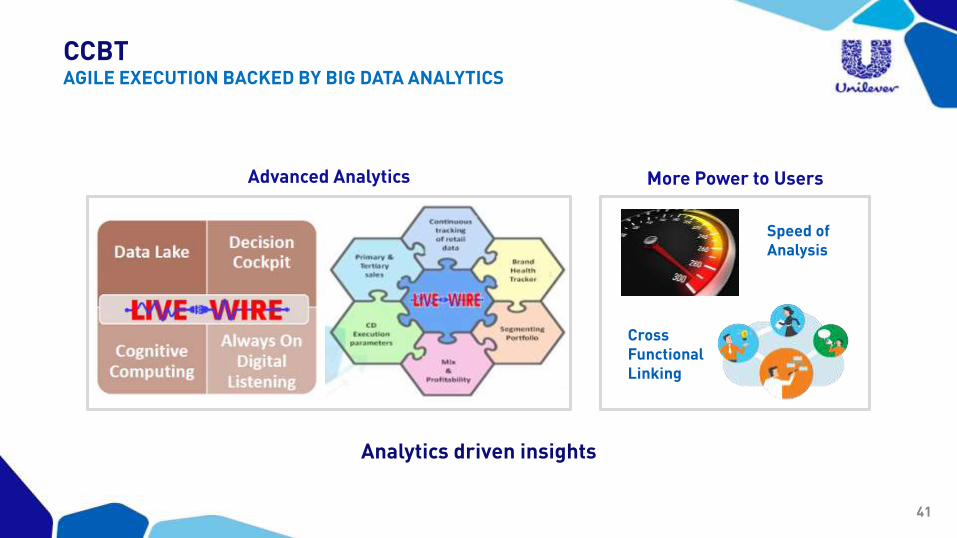
Analytics driven insights
CCBTAGILE EXECUTION BACKED BY BIG DATA ANALYTICS
Advanced Analytics
Speed of Analysis
Cross Functional Linking
More Power to Users
42
UNILEVER SUSTAINABLE LIVING PLAN
43
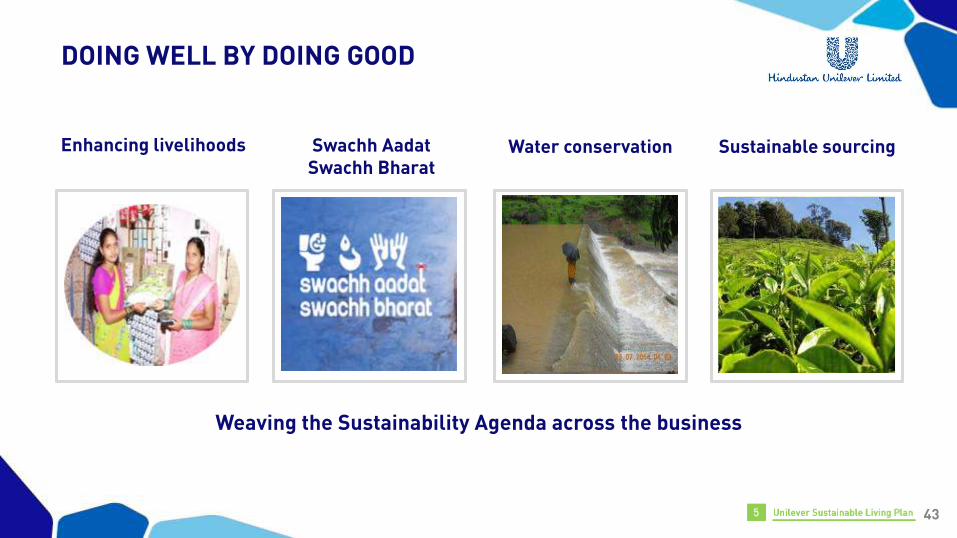
Swachh AadatSwachh Bharat
Sustainable sourcingEnhancing livelihoods Water conservation
Weaving the Sustainability Agenda across the business
DOING WELL BY DOING GOOD
44
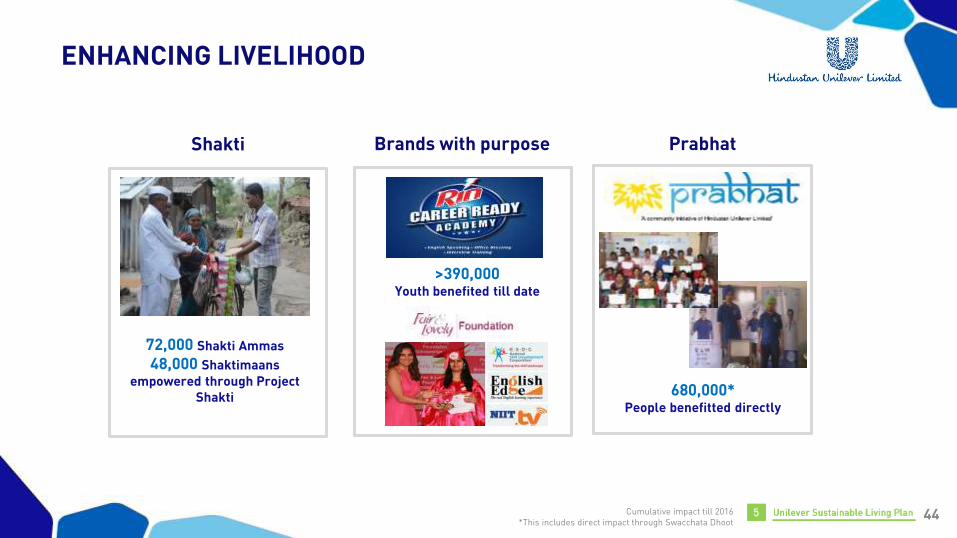
Shakti Prabhat
72,000 Shakti Ammas
48,000 Shaktimaansempowered through Project
Shakti
>390,000Youth benefited till date
680,000*People benefitted directly
Brands with purpose
Cumulative impact till 2016*This includes direct impact through Swacchata Dhoot
ENHANCING LIVELIHOOD
45
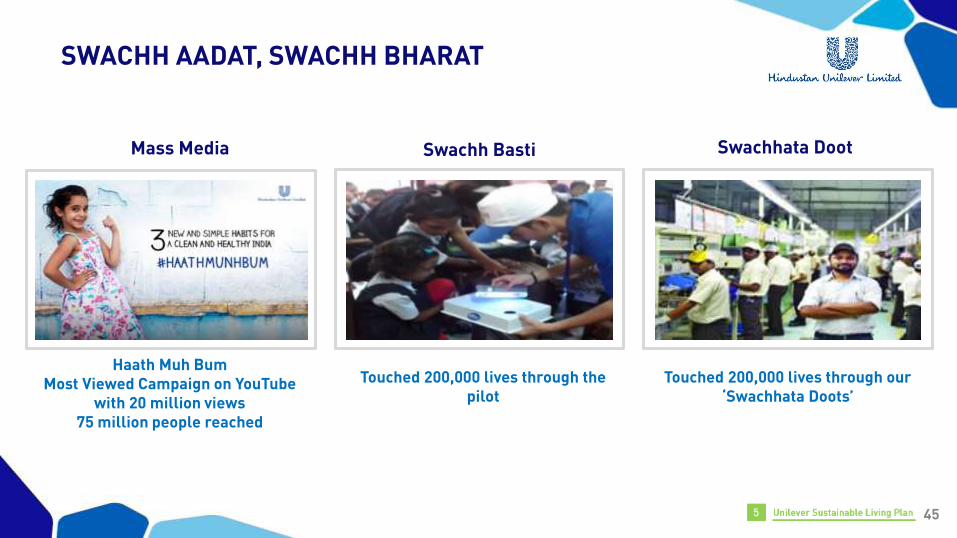
Swachh BastiMass Media Swachhata Doot
Touched 200,000 lives through the pilot
Touched 200,000 lives through our ‘Swachhata Doots’
Haath Muh Bum Most Viewed Campaign on YouTube
with 20 million views75 million people reached
SWACHH AADAT, SWACHH BHARAT
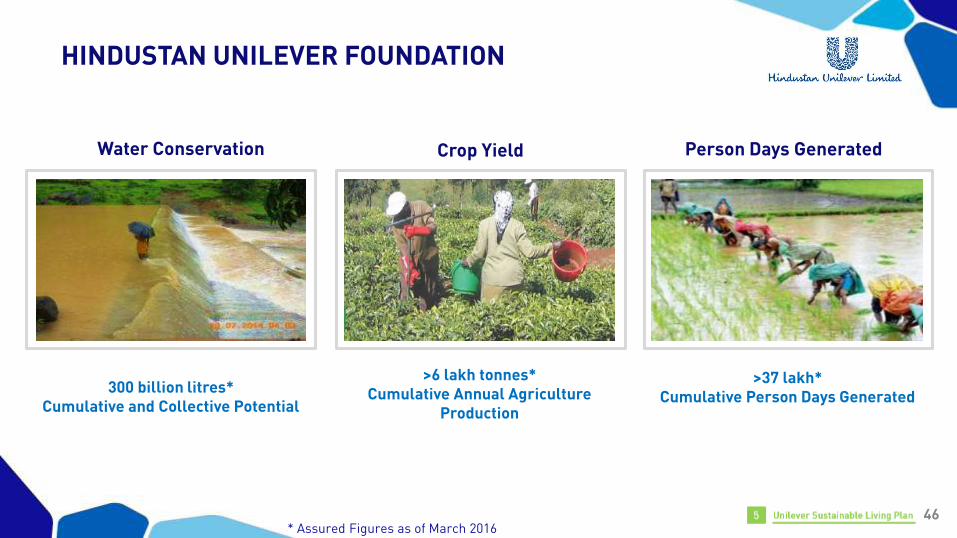
46* Assured Figures as of March 2016
Crop YieldWater Conservation Person Days Generated
>6 lakh tonnes*Cumulative Annual Agriculture
Production
>37 lakh*Cumulative Person Days Generated
300 billion litres*Cumulative and Collective Potential
HINDUSTAN UNILEVER FOUNDATION
47
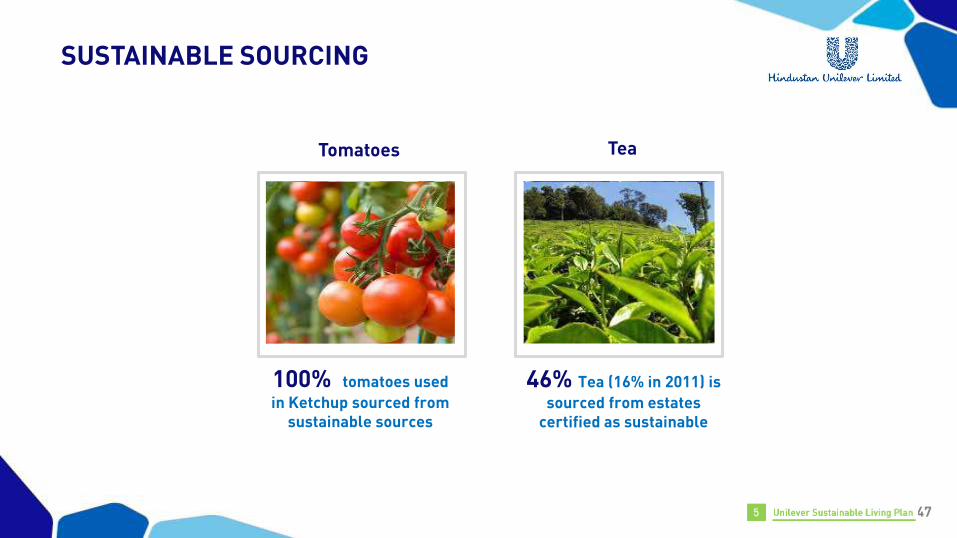
Tomatoes Tea
100% tomatoes used
in Ketchup sourced from sustainable sources
46% Tea (16% in 2011) is
sourced from estates certified as sustainable
SUSTAINABLE SOURCING
48
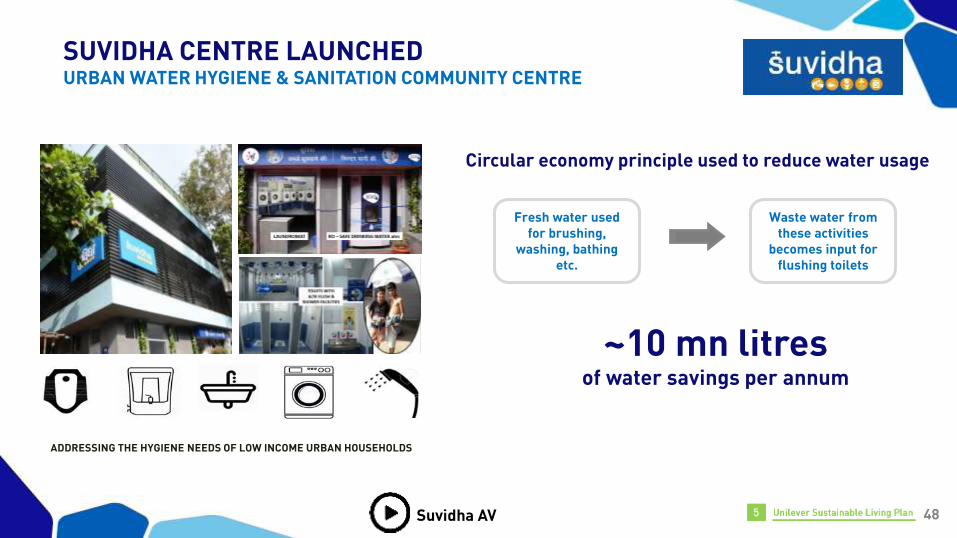
ADDRESSING THE HYGIENE NEEDS OF LOW INCOME URBAN HOUSEHOLDS
Fresh water used for brushing,
washing, bathing etc.
Waste water from these activities
becomes input for flushing toilets
Circular economy principle used to reduce water usage
~10 mn litresof water savings per annum
Suvidha AV
SUVIDHA CENTRE LAUNCHEDURBAN WATER HYGIENE & SANITATION COMMUNITY CENTRE
49
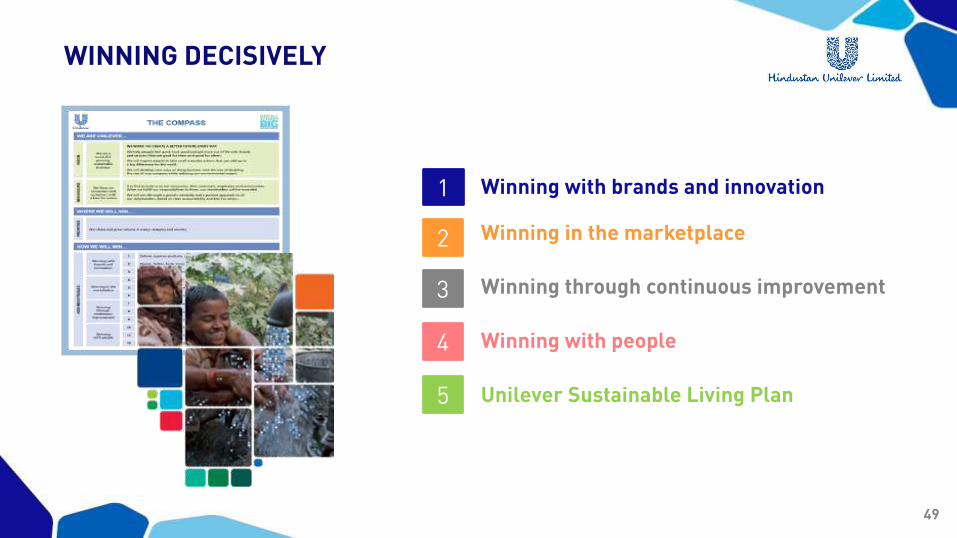
WINNING DECISIVELY
Winning with brands and innovation1
4
3
2
5
Winning in the marketplace
Winning through continuous improvement
Winning with people
Unilever Sustainable Living Plan

50
For more information & updatesTHANK YOUFor More Information
ANNUAL INVESTOR MEET | 2 JUNE 2017
GST
P.B. Balaji
2
This Release / Communication, except for the historical information, may contain statements, including the words orphrases such as ‘expects, anticipates, intends, will, would, undertakes, aims, estimates, contemplates, seeks to,objective, goal, projects, should’ and similar expressions or variations of these expressions or negatives of these termsindicating future performance or results, financial or otherwise, which are forward looking statements. These forwardlooking statements are based on certain expectations, assumptions, anticipated developments and other factors whichare not limited to, risk and uncertainties regarding fluctuations in earnings, market growth, intense competition and thepricing environment in the market, consumption level, ability to maintain and manage key customer relationship andsupply chain sources and those factors which may affect our ability to implement business strategies successfully,namely changes in regulatory environments, political instability, change in international oil prices and input costs andnew or changed priorities of the trade. The Company, therefore, cannot guarantee that the forward looking statementsmade herein shall be realized. The Company, based on changes as stated above, may alter, amend, modify or makenecessary corrective changes in any manner to any such forward looking statement contained herein or make written ororal forward looking statements as may be required from time to time on the basis of subsequent developments andevents. The Company does not undertake any obligation to update forward looking statements that may be made fromtime to time by or on behalf of the Company to reflect the events or circumstances after the date hereof.
SAFE HARBOUR STATEMENT
3
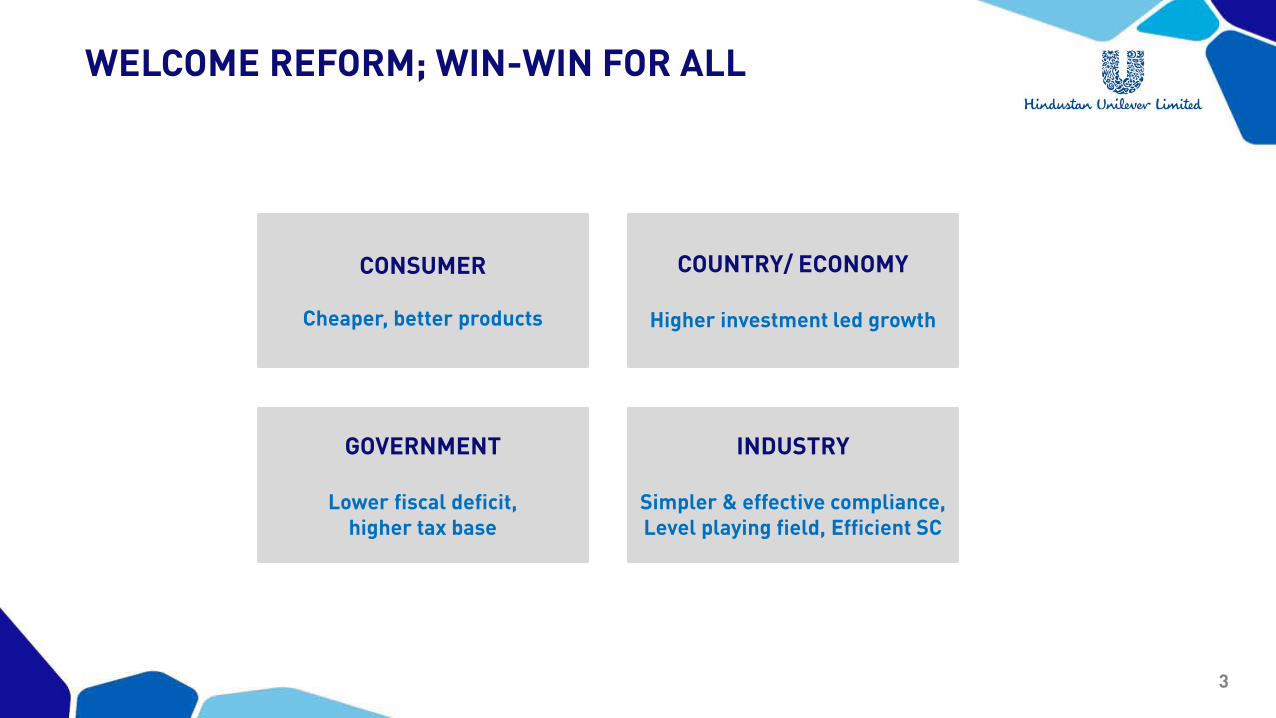
WELCOME REFORM; WIN-WIN FOR ALL
CONSUMER
Cheaper, better products
COUNTRY/ ECONOMY
Higher investment led growth
GOVERNMENT
Lower fiscal deficit, higher tax base
INDUSTRY
Simpler & effective compliance, Level playing field, Efficient SC
4
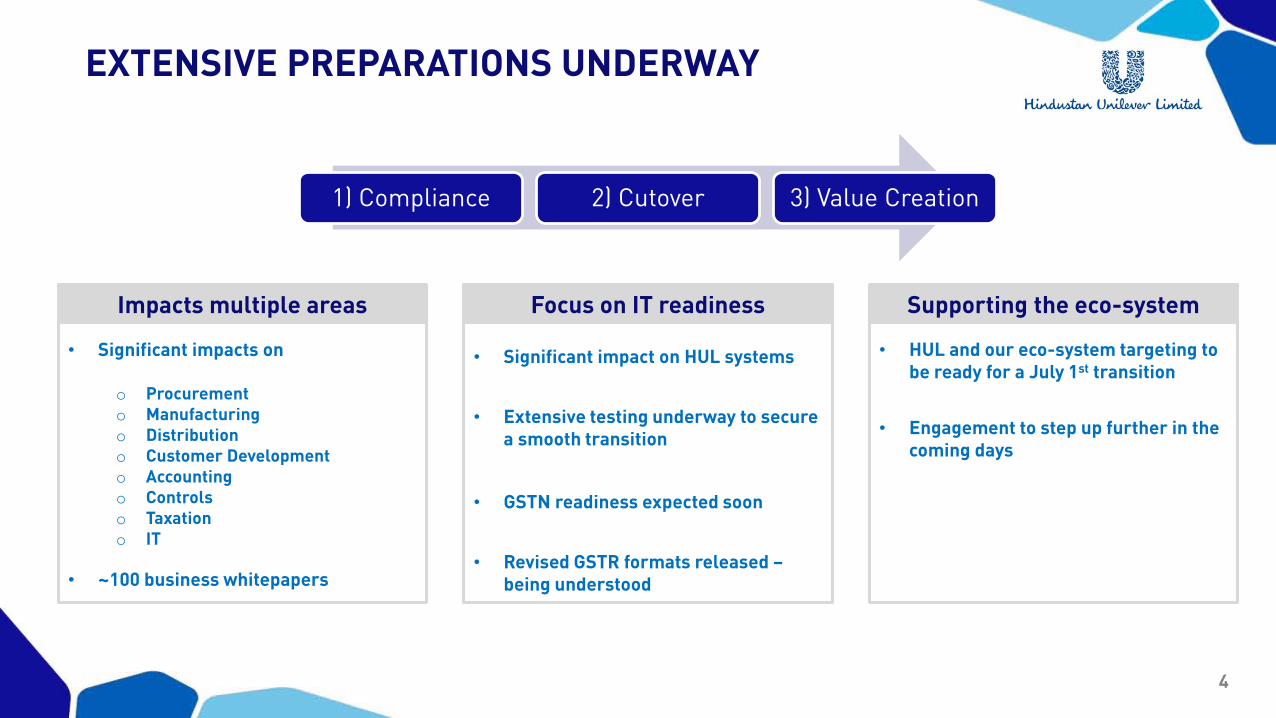
• Significant impact on HUL systems
• Extensive testing underway to secure a smooth transition
• GSTN readiness expected soon
• Revised GSTR formats released –being understood
EXTENSIVE PREPARATIONS UNDERWAY
Impacts multiple areas Focus on IT readiness
• Significant impacts on
o Procuremento Manufacturingo Distributiono Customer Developmento Accountingo Controls o Taxationo IT
• ~100 business whitepapers
Supporting the eco-system
• HUL and our eco-system targeting to be ready for a July 1st transition
• Engagement to step up further in the coming days
1) Compliance 2) Cutover 3) Value Creation
5
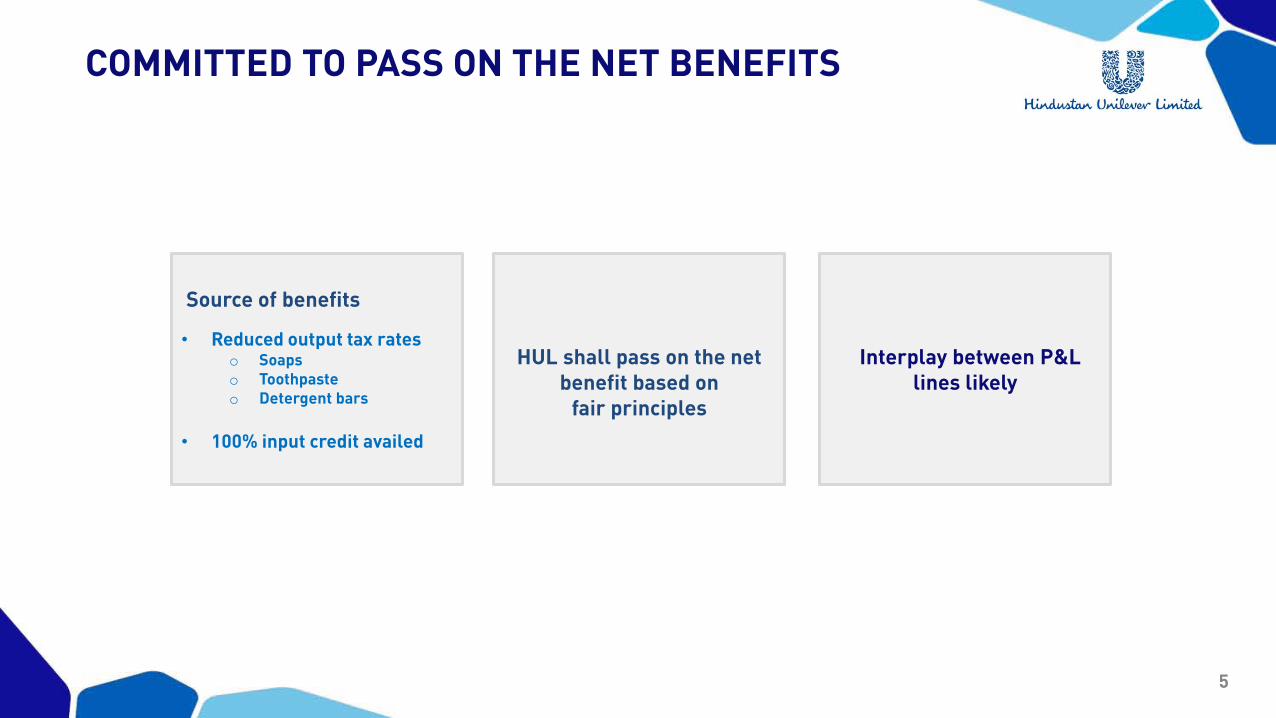
COMMITTED TO PASS ON THE NET BENEFITS
Source of benefits
• Reduced output tax rateso Soapso Toothpasteo Detergent bars
• 100% input credit availed
HUL shall pass on the net benefit based on
fair principles
Interplay between P&L lines likely
6
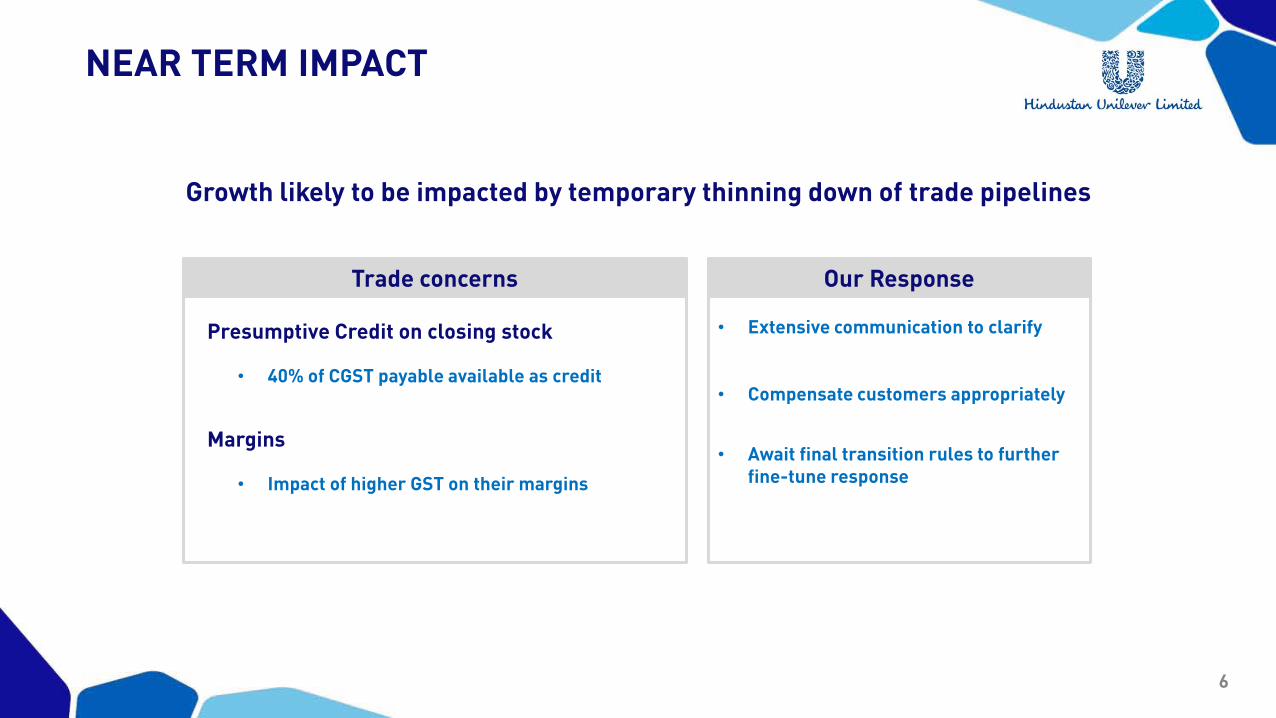
NEAR TERM IMPACT
• 40% of CGST payable available as credit
• Impact of higher GST on their margins
Presumptive Credit on closing stock
Margins
Trade concerns
• Extensive communication to clarify
• Compensate customers appropriately
• Await final transition rules to further fine-tune response
Growth likely to be impacted by temporary thinning down of trade pipelines
Our Response
7
IN SUMMARY
Win- win for everyone in the long run
In the near term –
Temporary thinning down of trade pipelines likely
Net Benefit on tax rates to be passed on
Interplay between P&L lines likely
8
For more information & updatesTHANK YOUFOR MORE INFORMATION

1
HOME CARE
Priya Nair
2
This Release / Communication, except for the historical information, may contain statements, including the words orphrases such as ‘expects, anticipates, intends, will, would, undertakes, aims, estimates, contemplates, seeks to,objective, goal, projects, should’ and similar expressions or variations of these expressions or negatives of these termsindicating future performance or results, financial or otherwise, which are forward looking statements. These forwardlooking statements are based on certain expectations, assumptions, anticipated developments and other factors whichare not limited to, risk and uncertainties regarding fluctuations in earnings, market growth, intense competition and thepricing environment in the market, consumption level, ability to maintain and manage key customer relationship andsupply chain sources and those factors which may affect our ability to implement business strategies successfully,namely changes in regulatory environments, political instability, change in international oil prices and input costs andnew or changed priorities of the trade. The Company, therefore, cannot guarantee that the forward looking statementsmade herein shall be realized. The Company, based on changes as stated above, may alter, amend, modify or makenecessary corrective changes in any manner to any such forward looking statement contained herein or make writtenor oral forward looking statements as may be required from time to time on the basis of subsequent developments andevents. The Company does not undertake any obligation to update forward looking statements that may be made fromtime to time by or on behalf of the Company to reflect the events or circumstances after the date hereof.
SAFE HARBOUR STATEMENT
3
2016 PERFORMANCE HIGHLIGHTSCOMPETITIVE, PROFITABLE, SUSTAINABLE GROWTH
Of HUL’s Size
30%
In All Key Sub Categories
No 1 Position
Delta Margin 2013-16
450+ bps
Our Consumer Franchise
9/10 Indians
4
LAUNDRY PORTFOLIO STRADDLES THE PYRAMID
Mo
re B
en
efi
ts
Rising Income
5
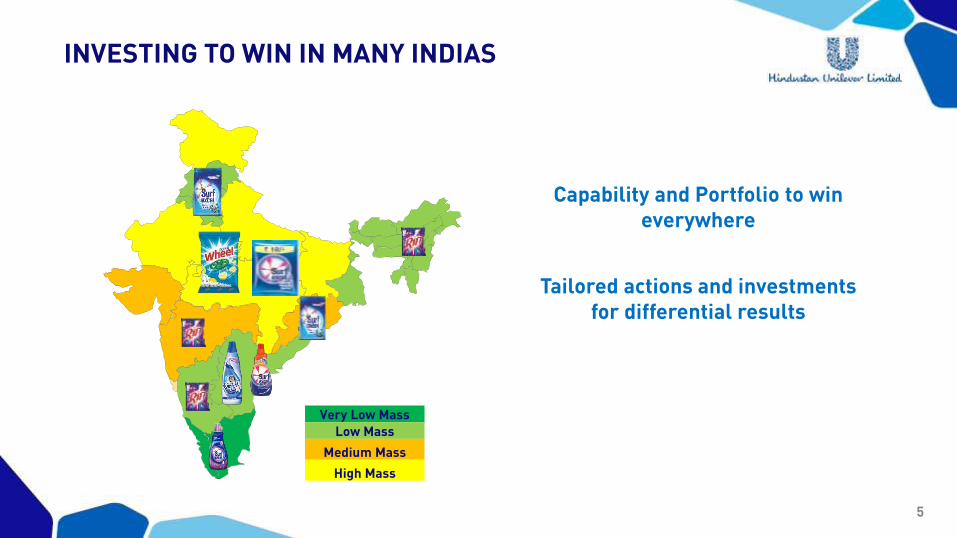
INVESTING TO WIN IN MANY INDIAS
Capability and Portfolio to win everywhere
Very Low Mass
Low Mass
Medium Mass
High Mass
Tailored actions and investments for differential results
6
OUR STRATEGY
7
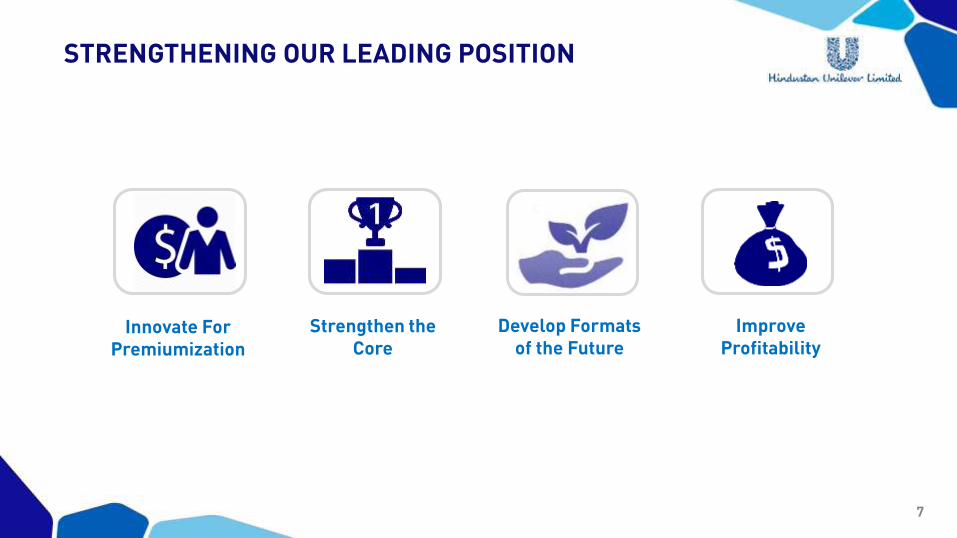
STRENGTHENING OUR LEADING POSITION
Innovate For Premiumization
Strengthen the Core
Develop Formats of the Future
Improve Profitability
8
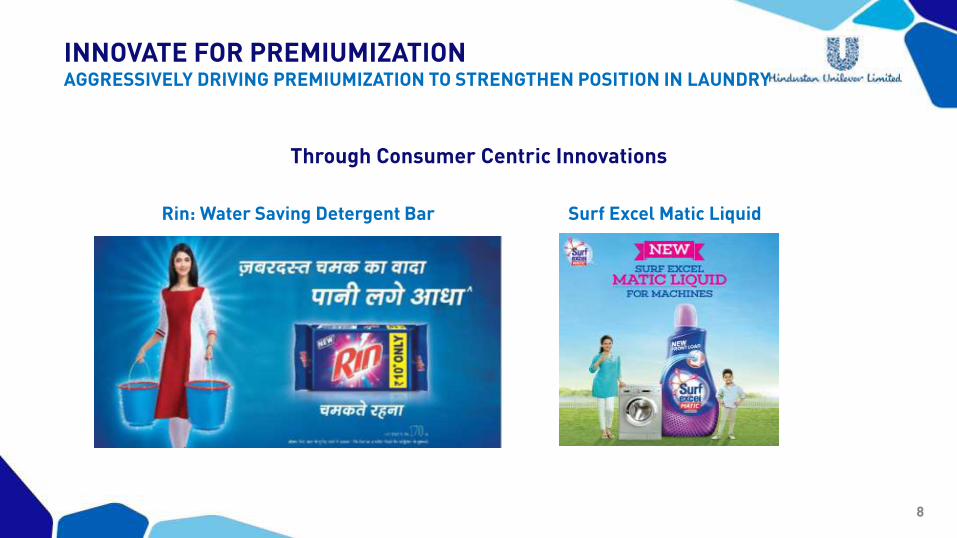
INNOVATE FOR PREMIUMIZATIONAGGRESSIVELY DRIVING PREMIUMIZATION TO STRENGTHEN POSITION IN LAUNDRY
Through Consumer Centric Innovations
Rin: Water Saving Detergent Bar Surf Excel Matic Liquid
9
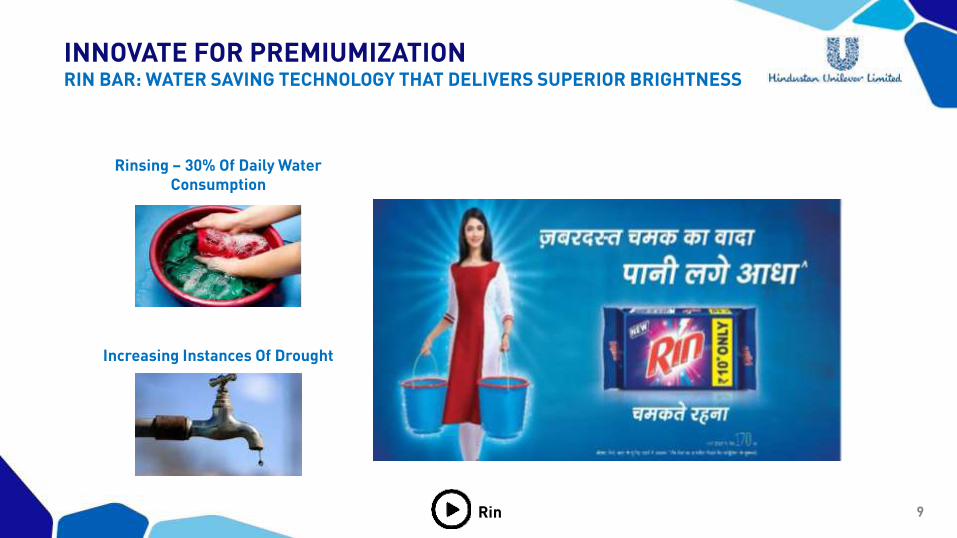
INNOVATE FOR PREMIUMIZATIONRIN BAR: WATER SAVING TECHNOLOGY THAT DELIVERS SUPERIOR BRIGHTNESS
Rinsing – 30% Of Daily Water Consumption
Increasing Instances Of Drought
Rin
10
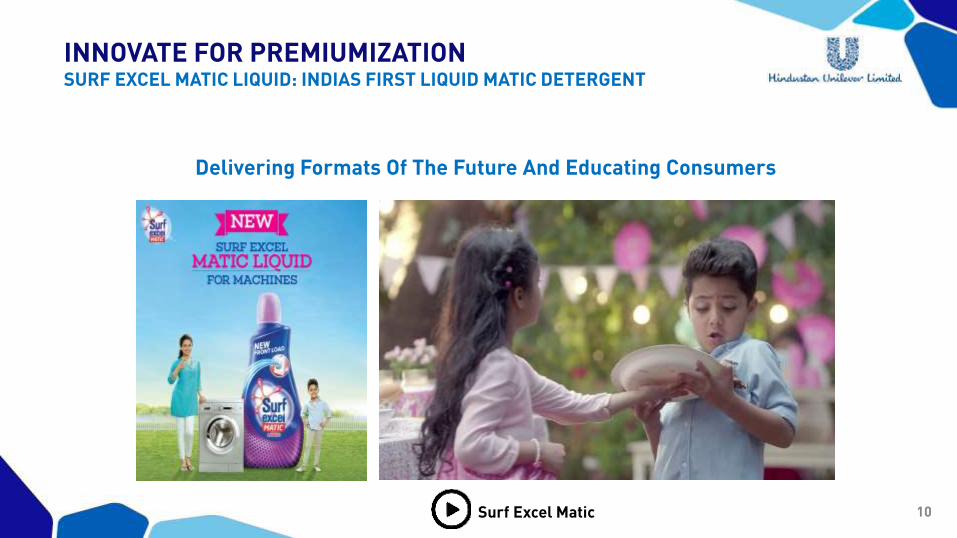
INNOVATE FOR PREMIUMIZATIONSURF EXCEL MATIC LIQUID: INDIAS FIRST LIQUID MATIC DETERGENT
Delivering Formats Of The Future And Educating Consumers
Surf Excel Matic
11
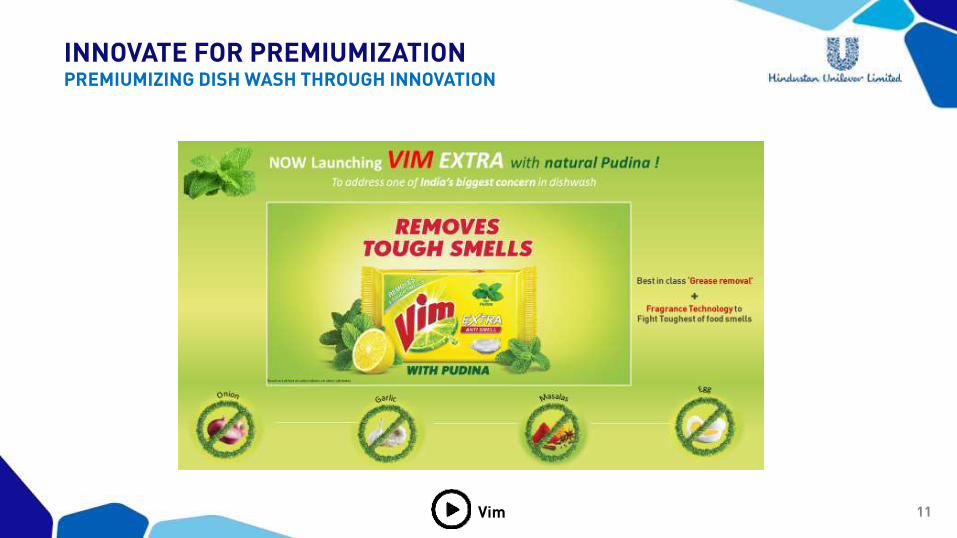
INNOVATE FOR PREMIUMIZATIONPREMIUMIZING DISH WASH THROUGH INNOVATION
Vim
12
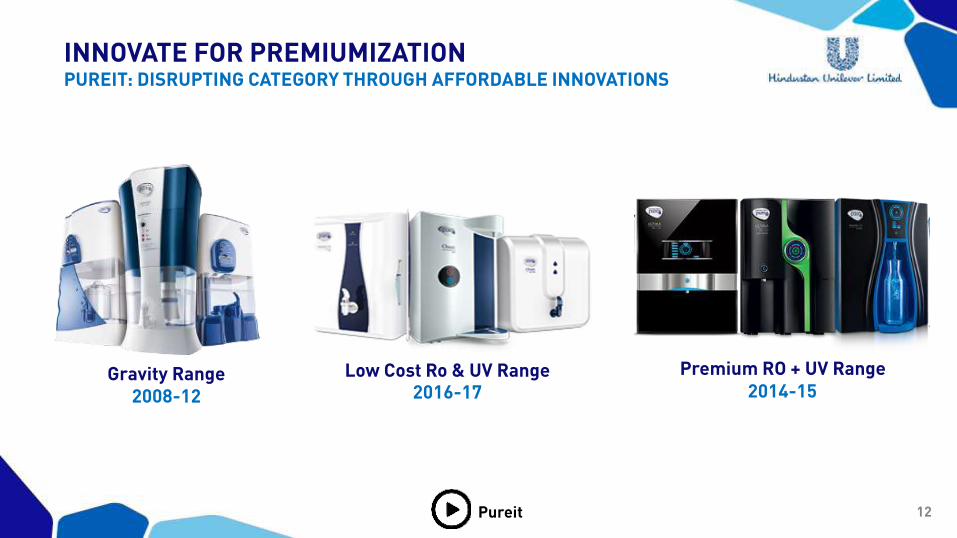
INNOVATE FOR PREMIUMIZATIONPUREIT: DISRUPTING CATEGORY THROUGH AFFORDABLE INNOVATIONS
Pureit
Gravity Range2008-12
Low Cost Ro & UV Range2016-17
Premium RO + UV Range2014-15
13
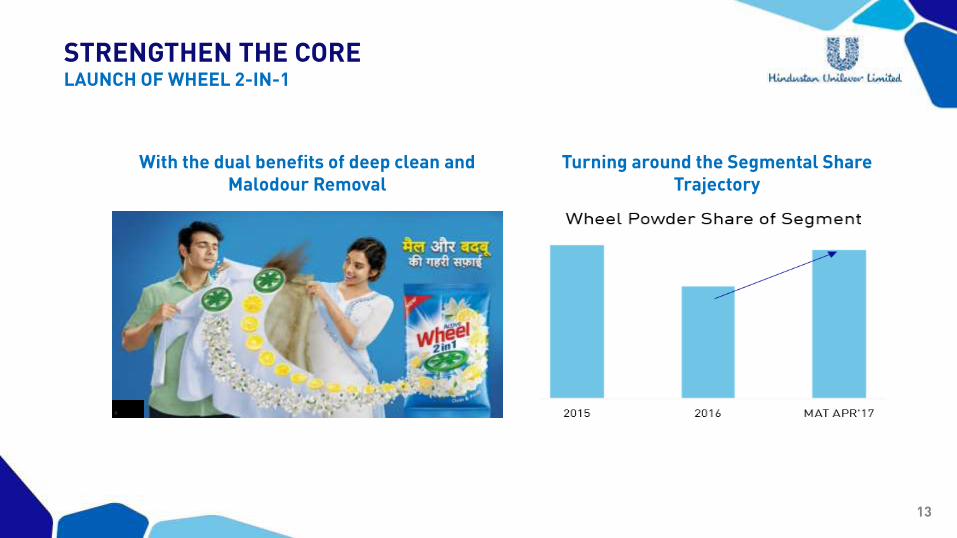
STRENGTHEN THE CORELAUNCH OF WHEEL 2-IN-1
With the dual benefits of deep clean and Malodour Removal
Turning around the Segmental Share Trajectory
14
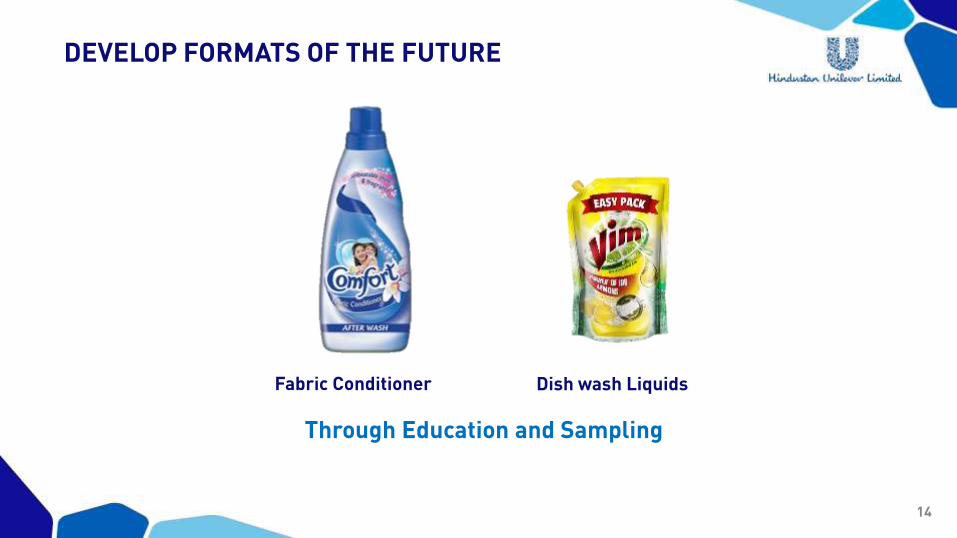
DEVELOP FORMATS OF THE FUTURE
Fabric Conditioner Dish wash Liquids
Through Education and Sampling
15
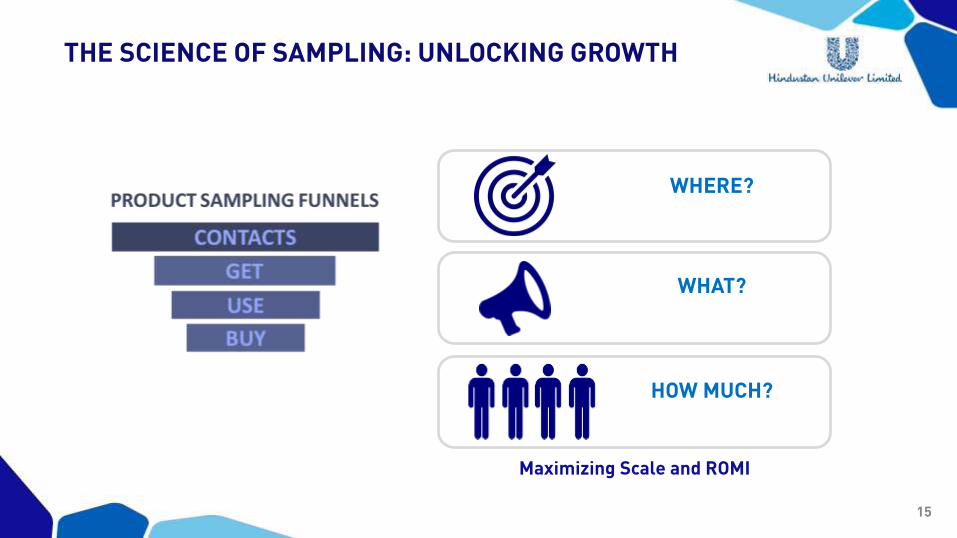
THE SCIENCE OF SAMPLING: UNLOCKING GROWTH
WHERE?
WHAT?
HOW MUCH?
Maximizing Scale and ROMI
16
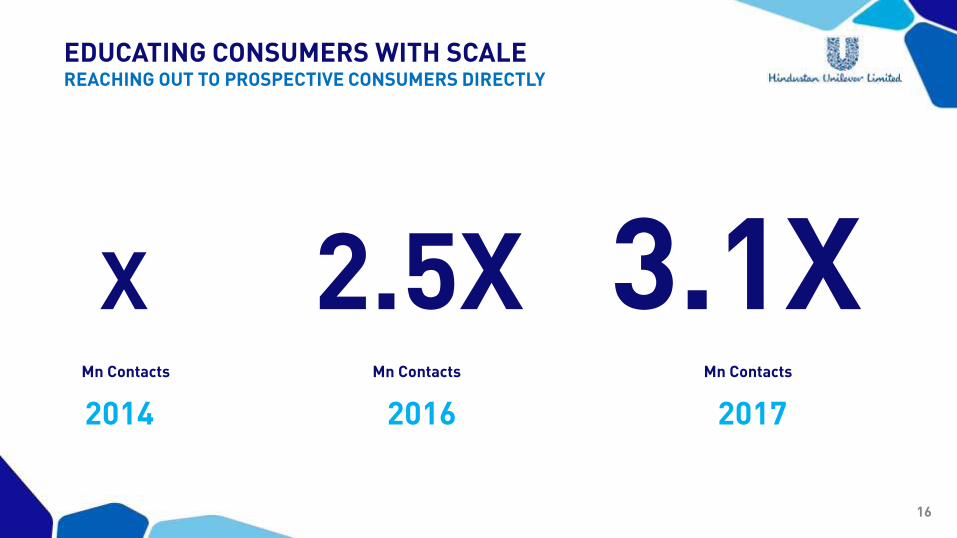
EDUCATING CONSUMERS WITH SCALEREACHING OUT TO PROSPECTIVE CONSUMERS DIRECTLY
X 2.5X 3.1XMn Contacts Mn Contacts Mn Contacts
2014 2016 2017
17
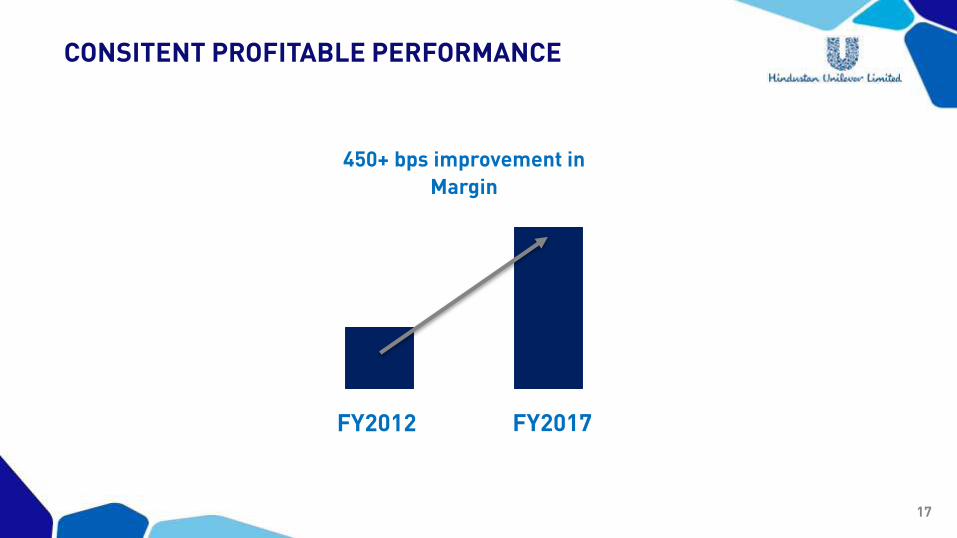
CONSITENT PROFITABLE PERFORMANCE
450+ bps improvement in
Margin
FY2012 FY2017
18
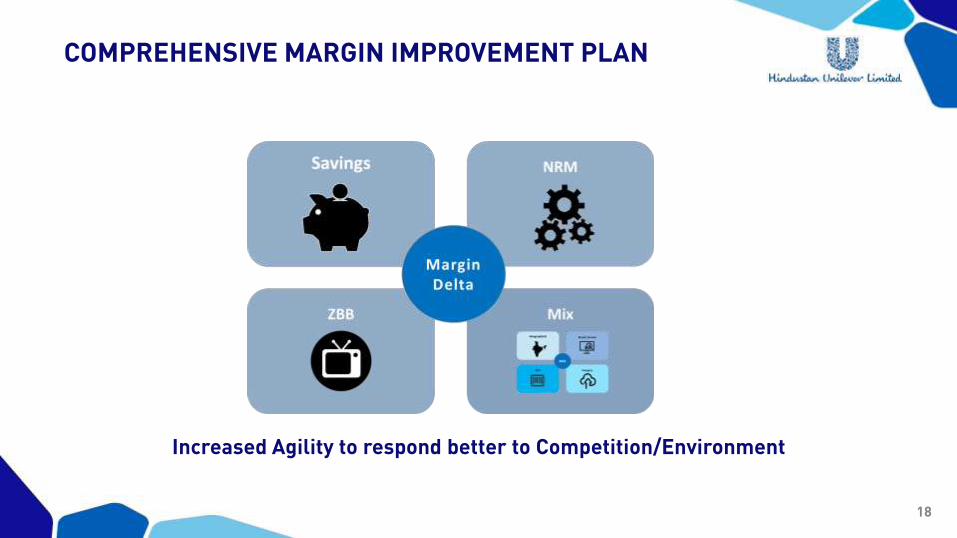
COMPREHENSIVE MARGIN IMPROVEMENT PLAN
Increased Agility to respond better to Competition/Environment

19
THANK YOU

20
REFRESHMENT
Sudhir Sitapati
21
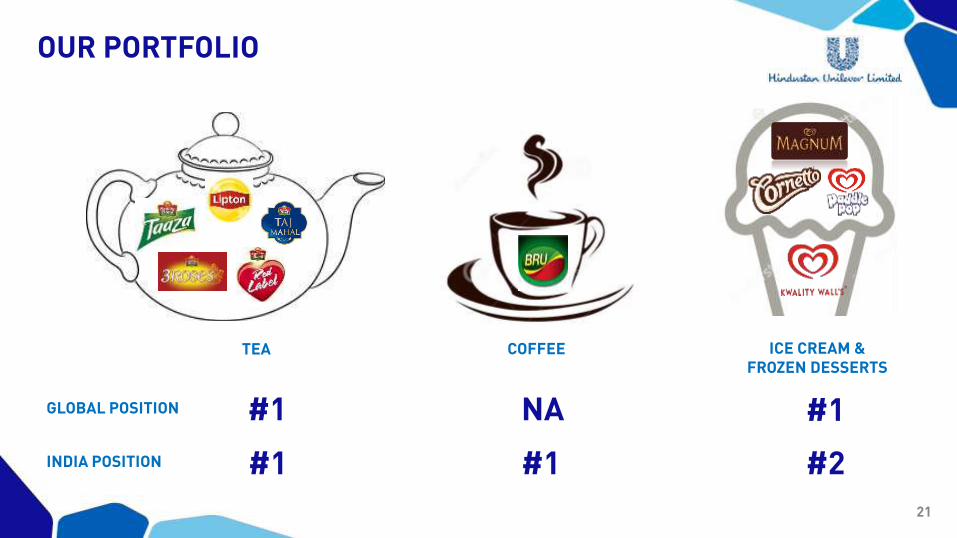
OUR PORTFOLIO
TEA COFFEE ICE CREAM & FROZEN DESSERTS
GLOBAL POSITION
INDIA POSITION
#1
#1#1
#1NA
#2
22
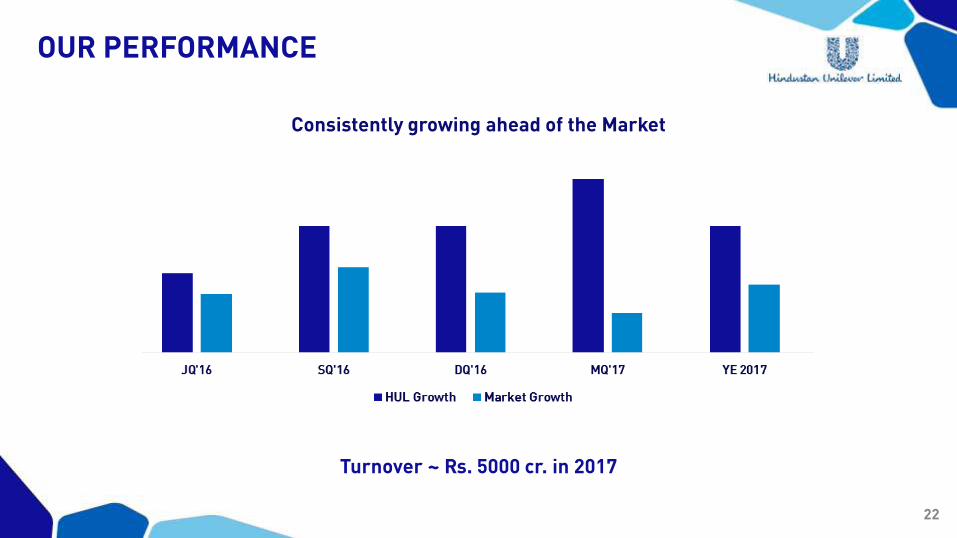
OUR PERFORMANCE
Turnover ~ Rs. 5000 cr. in 2017
Consistently growing ahead of the Market
23
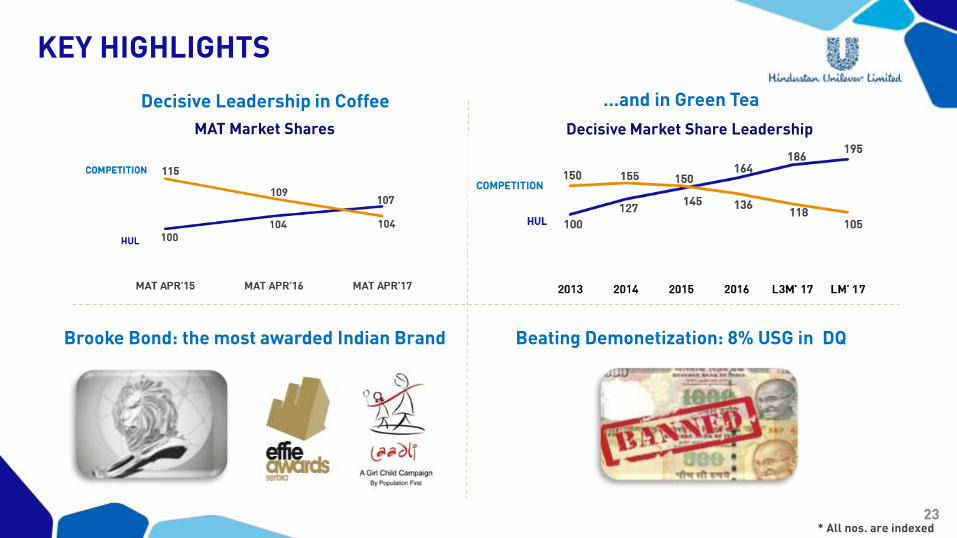
KEY HIGHLIGHTS
Decisive Leadership in Coffee …and in Green Tea
Brooke Bond: the most awarded Indian Brand Beating Demonetization: 8% USG in DQ
* All nos. are indexed
MAT Market Shares Decisive Market Share Leadership
24
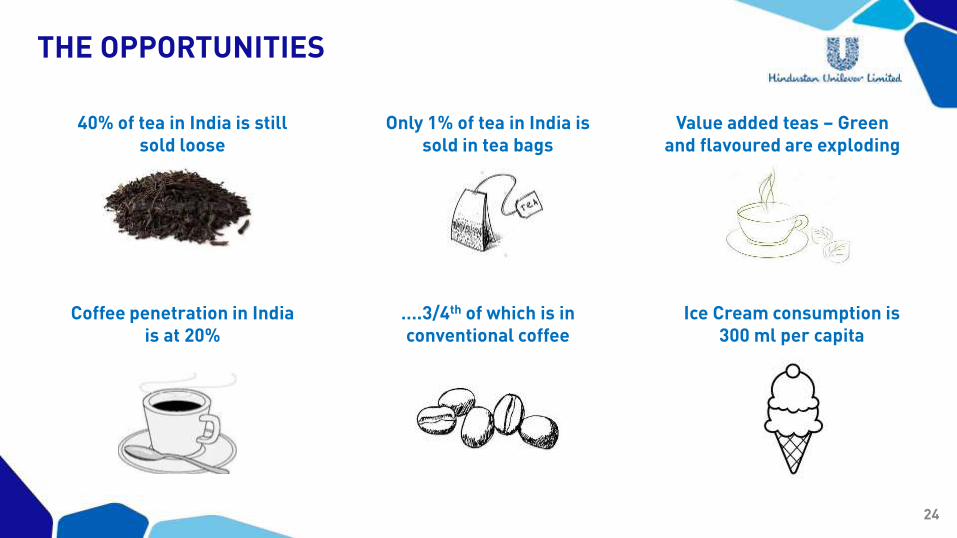
40% of tea in India is still sold loose
Only 1% of tea in India is sold in tea bags
Value added teas – Green and flavoured are exploding
Coffee penetration in India is at 20%
….3/4th of which is in conventional coffee
Ice Cream consumption is 300 ml per capita
THE OPPORTUNITIES
25
OUR STRATEGY

26
THE STRATEGY
Win in the core Create high margin new categories
Allow Consumers to access big brands
Core Market development Accessibility
27
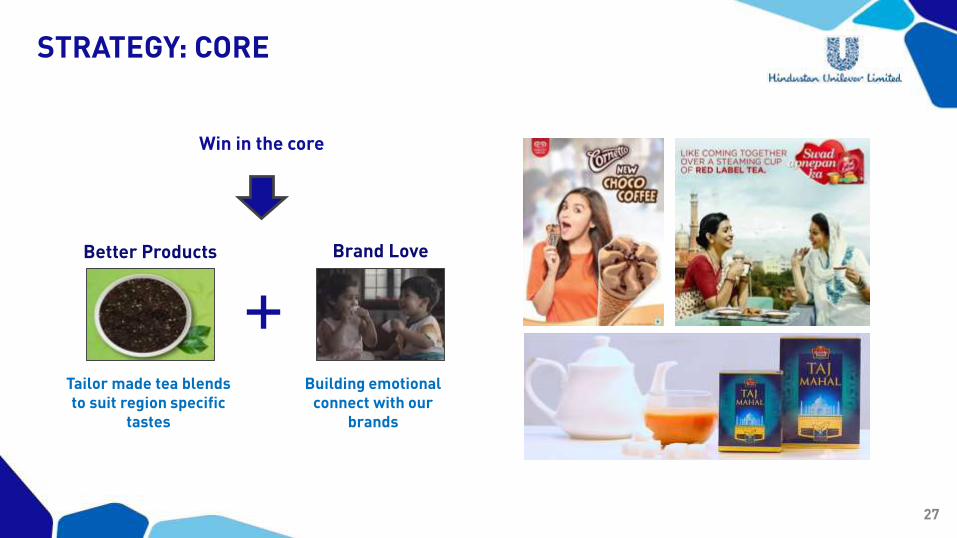
STRATEGY: CORE
Win in the core
+Better Products Brand Love
Tailor made tea blends to suit region specific
tastes
Building emotional connect with our
brands
28
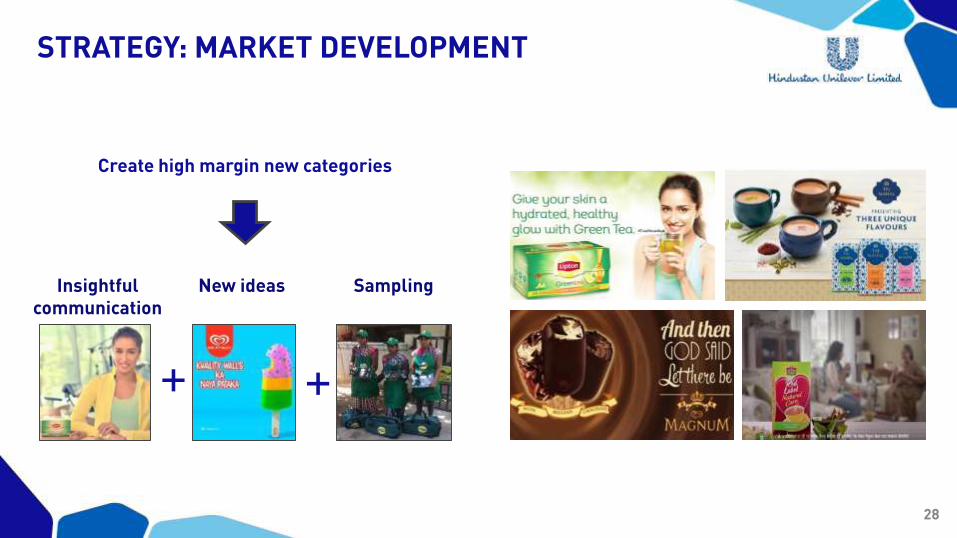
STRATEGY: MARKET DEVELOPMENT
Create high margin new categories
+
New ideas Sampling
+
Insightful communication
29
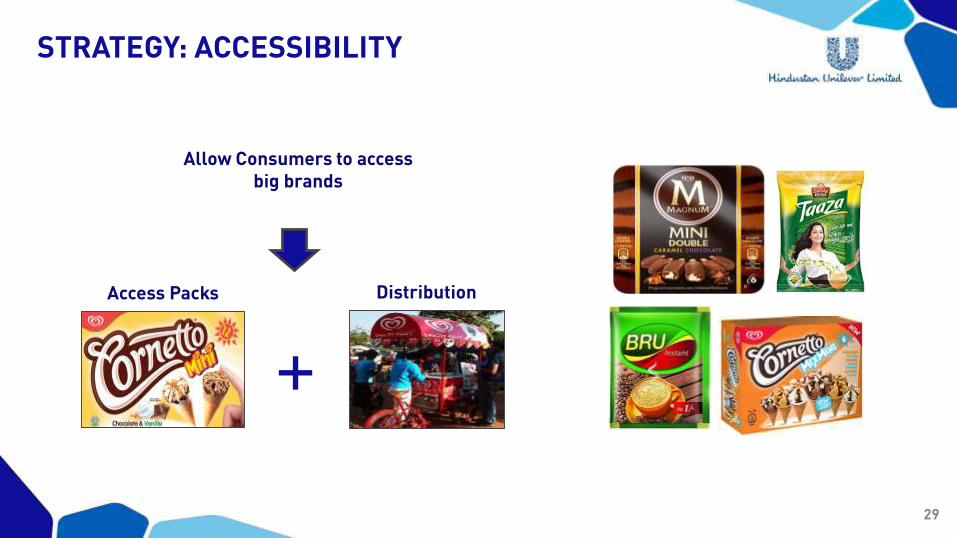
STRATEGY: ACCESSIBILITY
Allow Consumers to access big brands
Access Packs Distribution
+
30
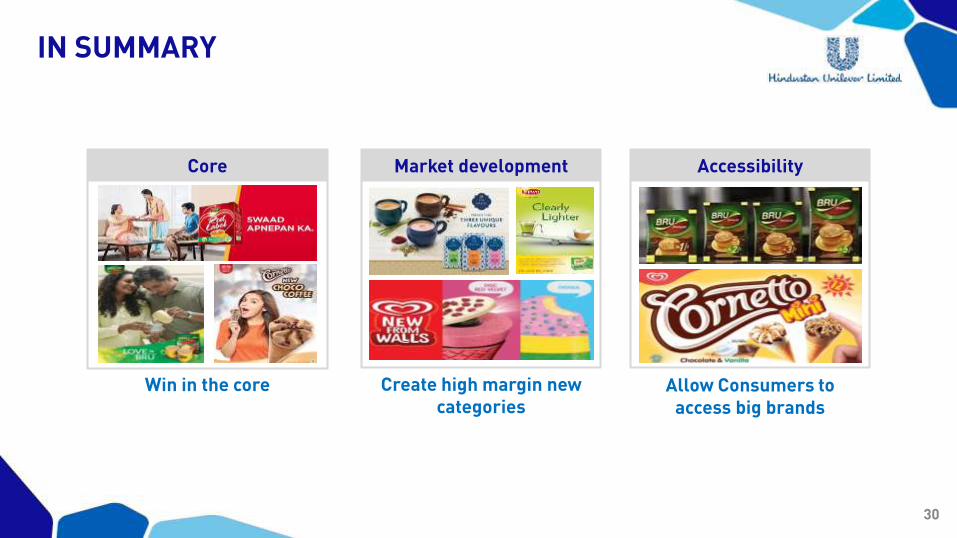
IN SUMMARY
Win in the core Create high margin new categories
Allow Consumers to access big brands
Core Market development Accessibility
31
THANK YOU

32
PERSONAL CARE
Sandeep Kohli
33
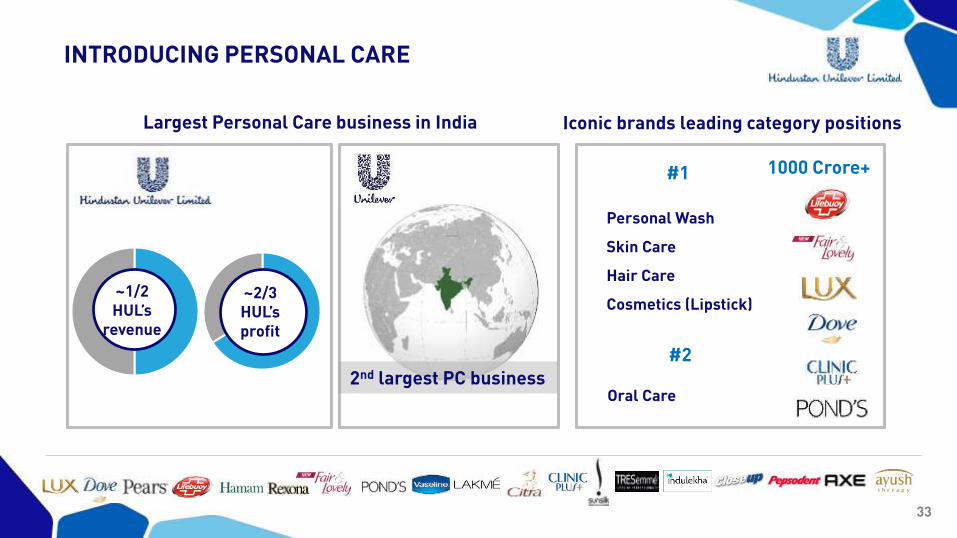
INTRODUCING PERSONAL CARE
#1 A
Personal Wash
Skin Care
Hair Care
Cosmetics (Lipstick)
#2
Oral Care2nd largest PC business
Largest Personal Care business in India Iconic brands leading category positions
~1/2 HUL’s
revenue
~2/3 HUL’s profit
1000 Crore+
34
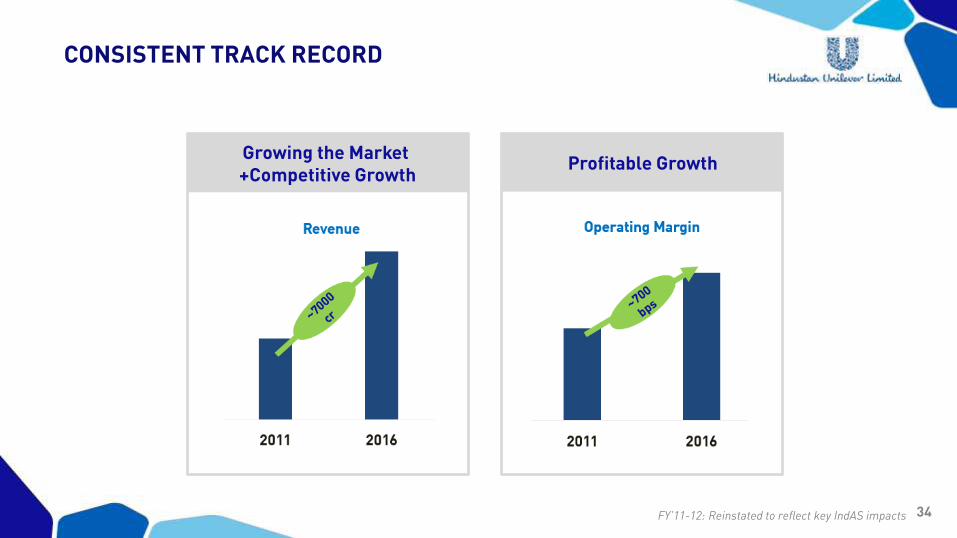
CONSISTENT TRACK RECORD
Growing the Market +Competitive Growth
Profitable Growth
FY’11-12: Reinstated to reflect key IndAS impacts
35
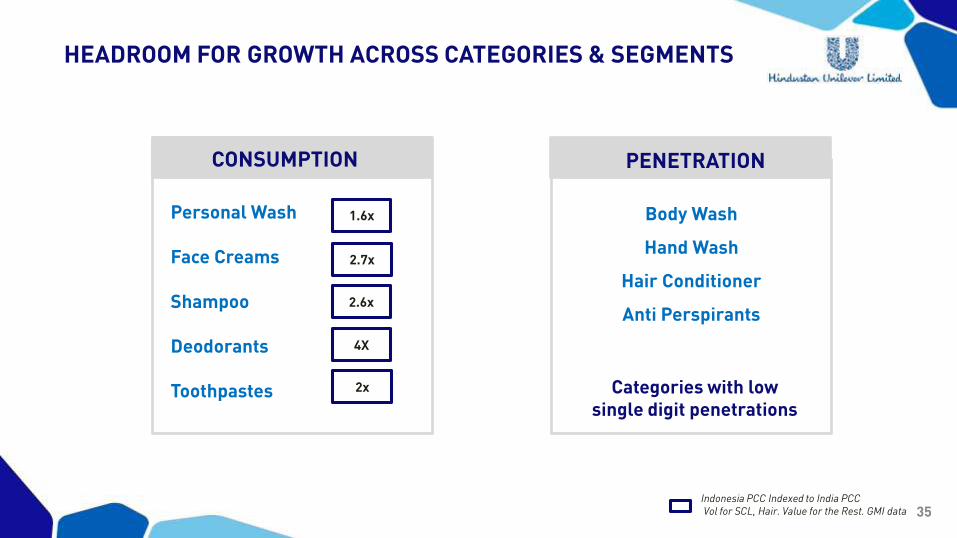
HEADROOM FOR GROWTH ACROSS CATEGORIES & SEGMENTS
Indonesia PCC Indexed to India PCCVol for SCL, Hair. Value for the Rest. GMI data
1.6x
2.6x
2x
4X
Personal Wash
Face Creams
Shampoo
Deodorants
Toothpastes
Body Wash
Hand Wash
Hair Conditioner
Anti Perspirants
2.7x
CONSUMPTION PENETRATION
Categories with low single digit penetrations
36
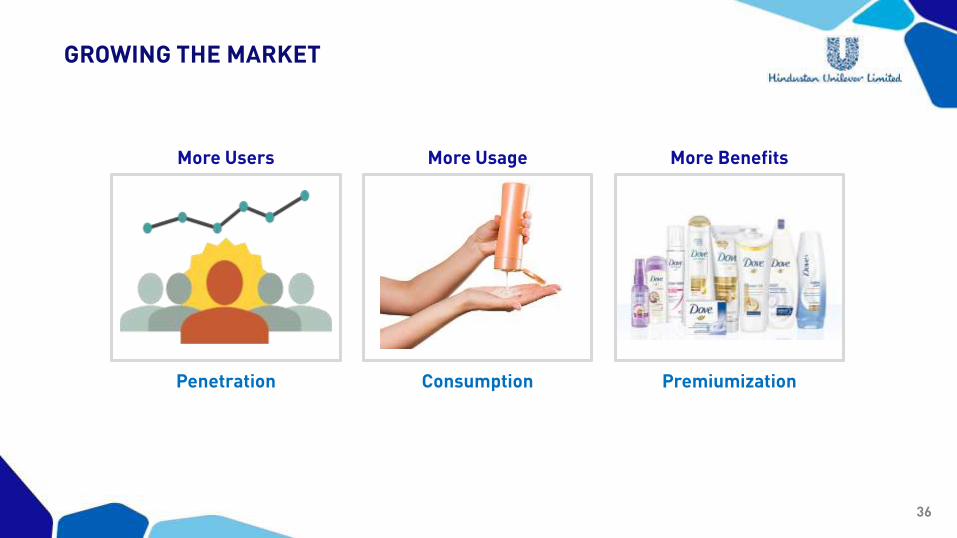
GROWING THE MARKET
More Users
Penetration Consumption
More Benefits
Premiumization
More Usage
37
OUR STRATEGY
38
MISSION
INSPIRE A BILLION INDIANS TO TAKE MORECARE OF THEIR PERSONAL CARE
39
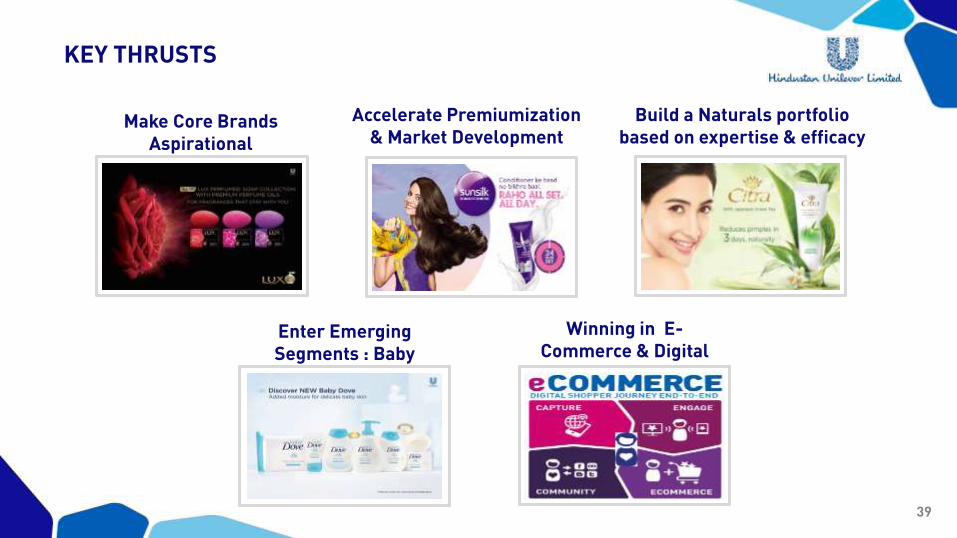
KEY THRUSTS
Make Core Brands Aspirational
Accelerate Premiumization & Market Development
Build a Naturals portfolio based on expertise & efficacy
Enter Emerging Segments : Baby
Winning in E-Commerce & Digital
40
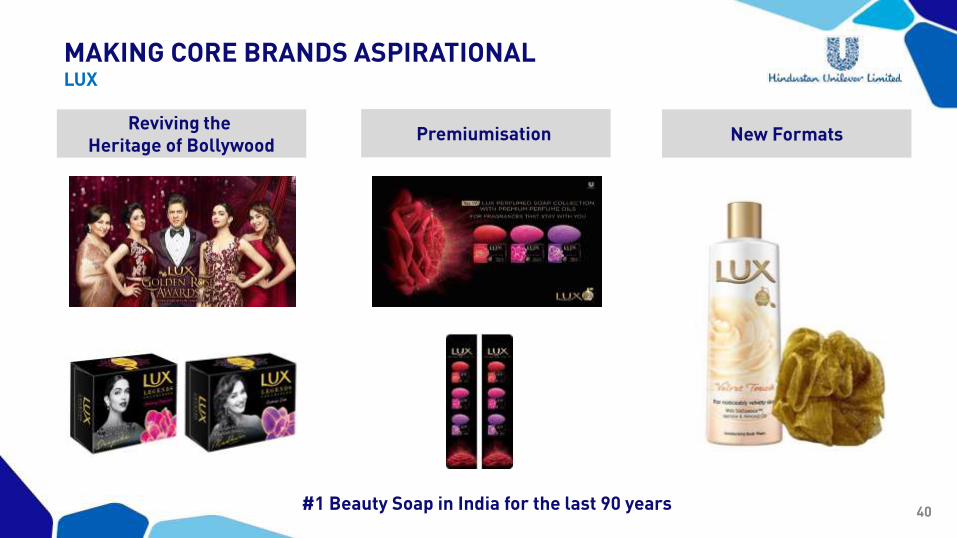
MAKING CORE BRANDS ASPIRATIONALLUX
Reviving the Heritage of Bollywood
Premiumisation New Formats
#1 Beauty Soap in India for the last 90 years
41
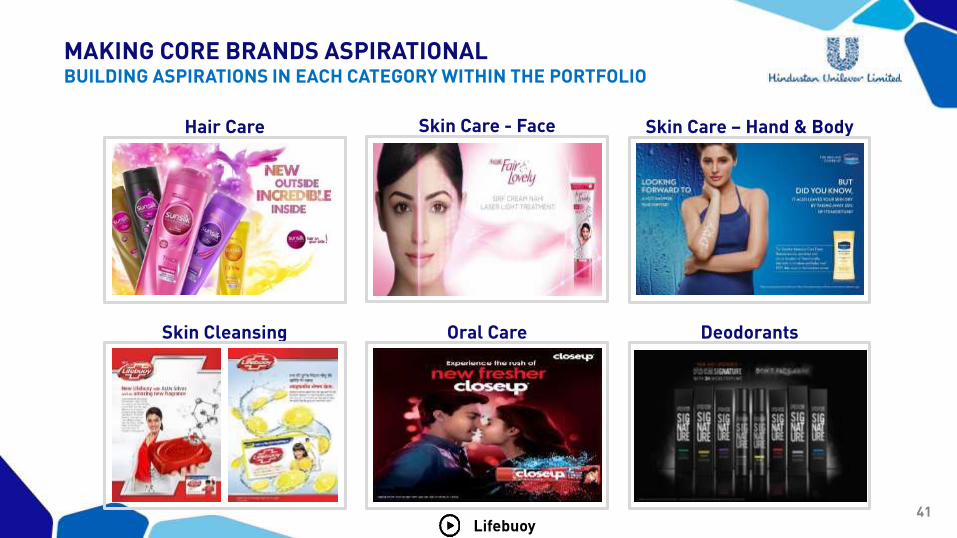
MAKING CORE BRANDS ASPIRATIONALBUILDING ASPIRATIONS IN EACH CATEGORY WITHIN THE PORTFOLIO
Hair Care Skin Care - Face Skin Care – Hand & Body
Skin Cleansing Oral Care Deodorants
Lifebuoy
42
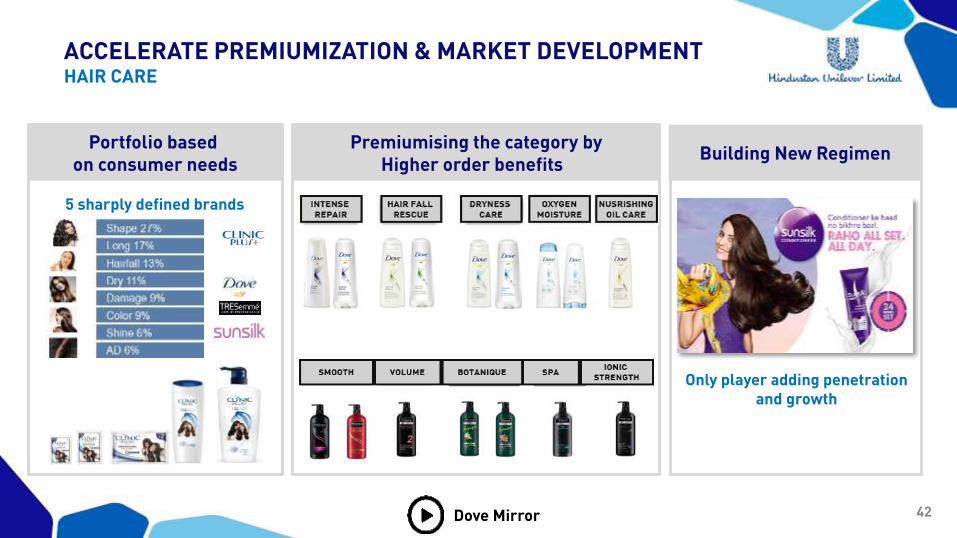
ACCELERATE PREMIUMIZATION & MARKET DEVELOPMENTHAIR CARE
Building New RegimenPortfolio based
on consumer needsPremiumising the category by
Higher order benefits
Only player adding penetration and growth
5 sharply defined brands
Dove Mirror

43
ACCELERATE PREMIUMIZATION & MARKET DEVELOPMENTSKIN CARE
Leading TrendsBuilding Premium Brands New Benefits & Sensorial
HUL has ~40% of the overall Premium Skin Lightening market
44
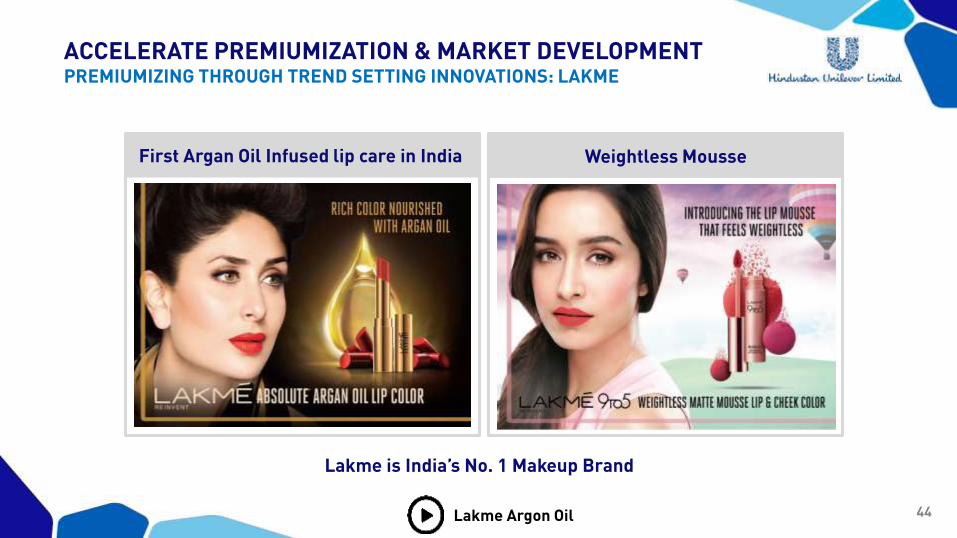
ACCELERATE PREMIUMIZATION & MARKET DEVELOPMENTPREMIUMIZING THROUGH TREND SETTING INNOVATIONS: LAKME
First Argan Oil Infused lip care in India Weightless Mousse
Lakme is India’s No. 1 Makeup Brand
Lakme Argon Oil
45
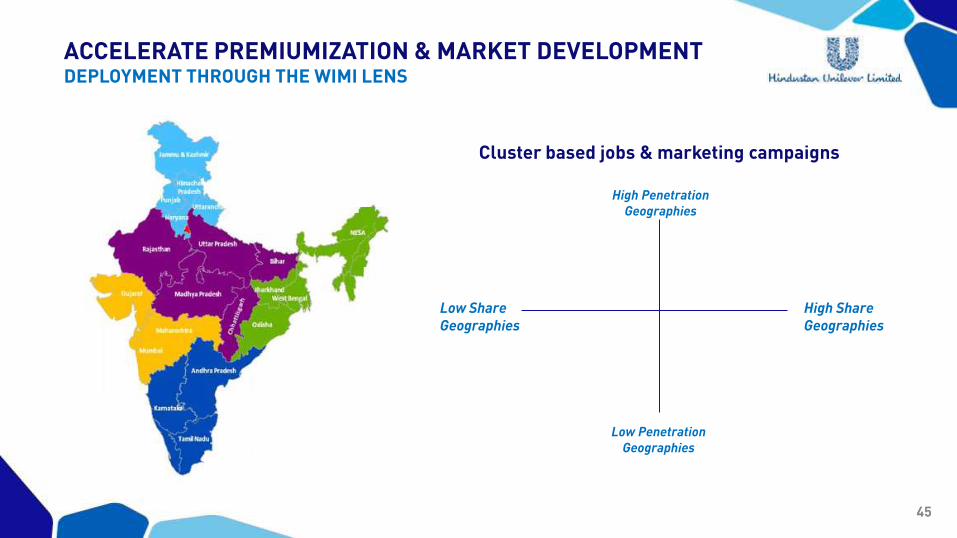
ACCELERATE PREMIUMIZATION & MARKET DEVELOPMENTDEPLOYMENT THROUGH THE WIMI LENS
High Penetration Geographies
Low PenetrationGeographies
Low ShareGeographies
High ShareGeographies
Cluster based jobs & marketing campaigns
46
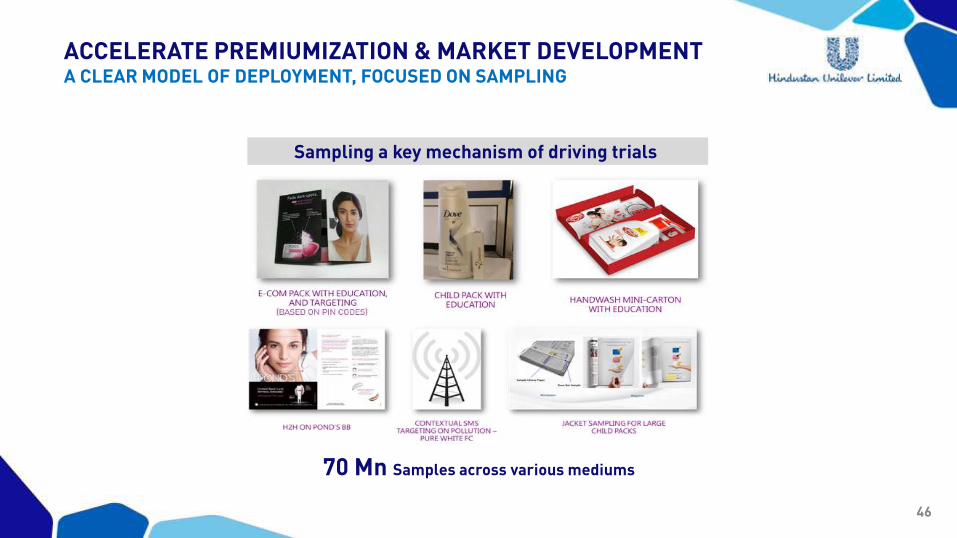
Sampling a key mechanism of driving trials
70 Mn Samples across various mediums
ACCELERATE PREMIUMIZATION & MARKET DEVELOPMENTA CLEAR MODEL OF DEPLOYMENT, FOCUSED ON SAMPLING
47
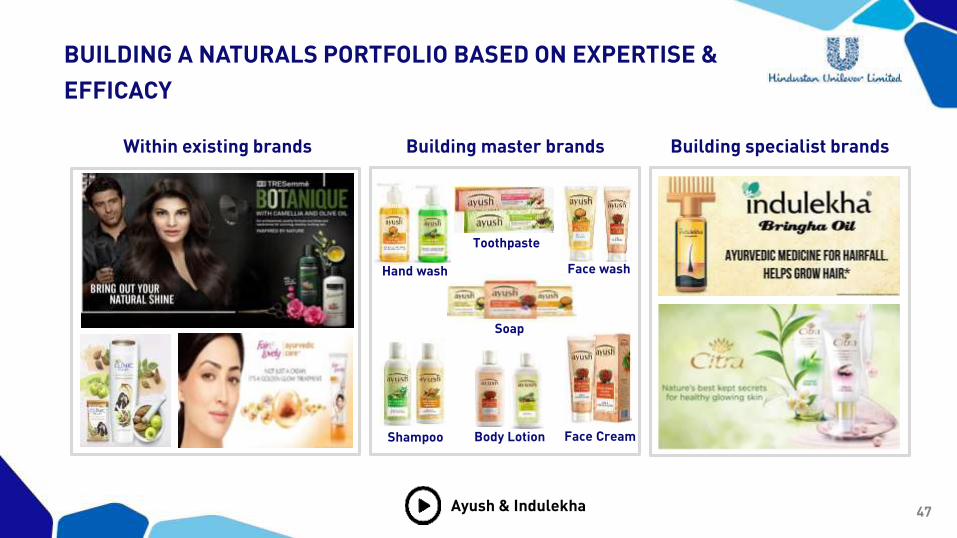
BUILDING A NATURALS PORTFOLIO BASED ON EXPERTISE &
EFFICACY
Building master brands Building specialist brandsWithin existing brands
Hand wash
Toothpaste
Face wash
Soap
Shampoo Body Lotion Face Cream
Ayush & Indulekha
48
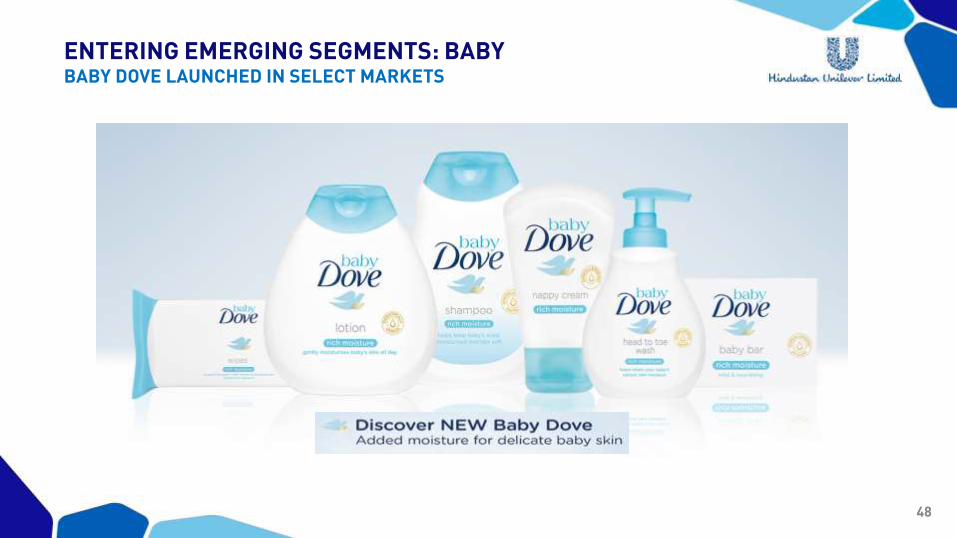
ENTERING EMERGING SEGMENTS: BABYBABY DOVE LAUNCHED IN SELECT MARKETS
49
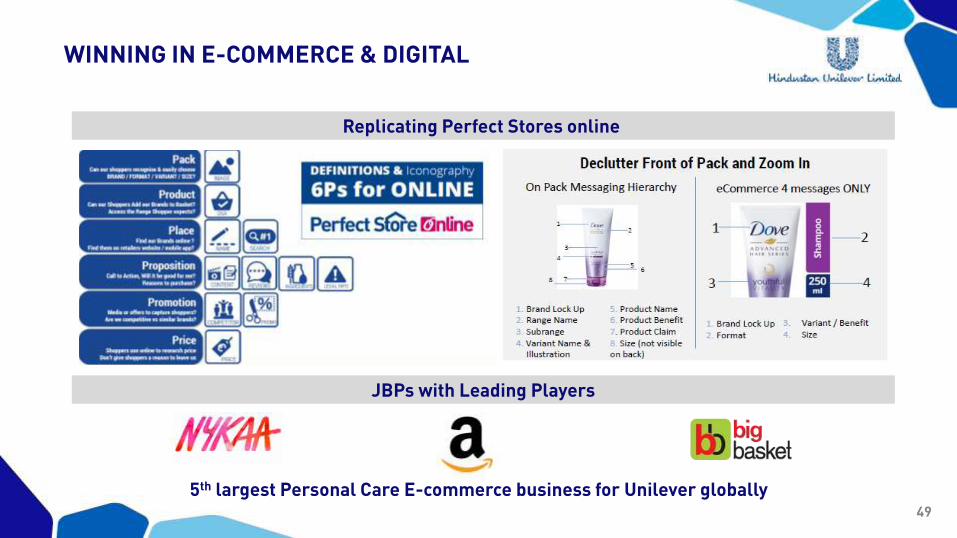
WINNING IN E-COMMERCE & DIGITAL
Replicating Perfect Stores online
JBPs with Leading Players
5th largest Personal Care E-commerce business for Unilever globally
50
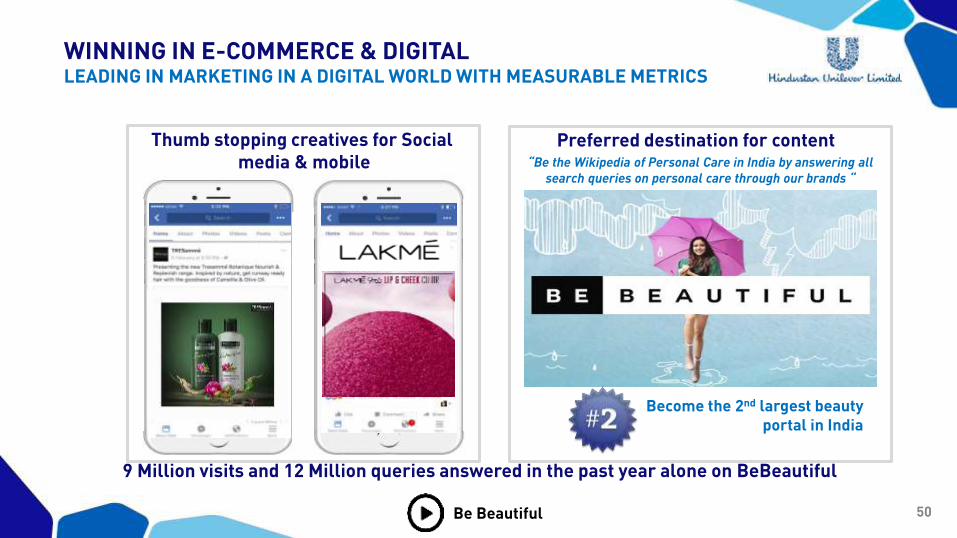
WINNING IN E-COMMERCE & DIGITALLEADING IN MARKETING IN A DIGITAL WORLD WITH MEASURABLE METRICS
Thumb stopping creatives for Social media & mobile
Preferred destination for content
Become the 2nd largest beauty portal in India
“Be the Wikipedia of Personal Care in India by answering all search queries on personal care through our brands “
9 Million visits and 12 Million queries answered in the past year alone on BeBeautiful
Be Beautiful
51
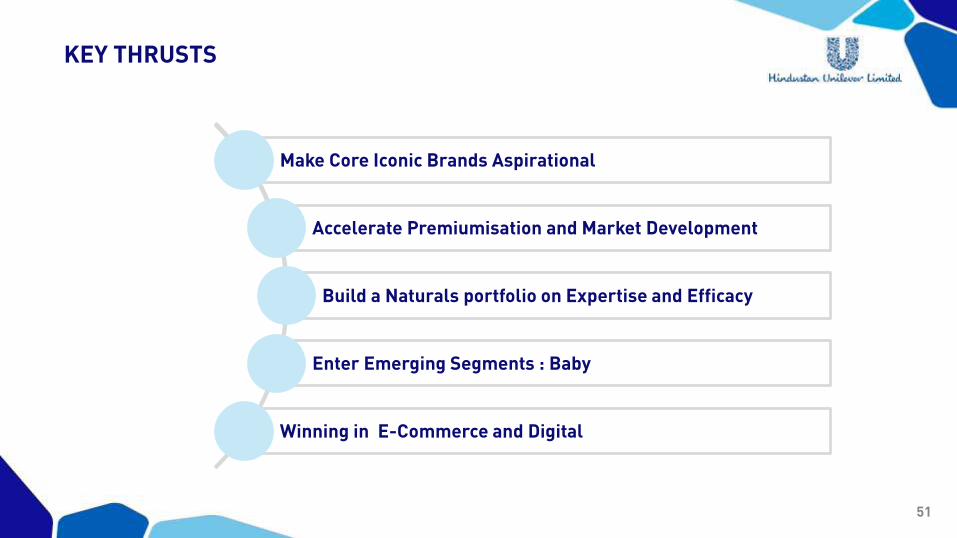
KEY THRUSTS
Make Core Iconic Brands Aspirational
Accelerate Premiumisation and Market Development
Build a Naturals portfolio on Expertise and Efficacy
Enter Emerging Segments : Baby
Winning in E-Commerce and Digital

52
PERSONAL CARE
Sandeep Kohli

53
FOODS
Geetu Verma
54
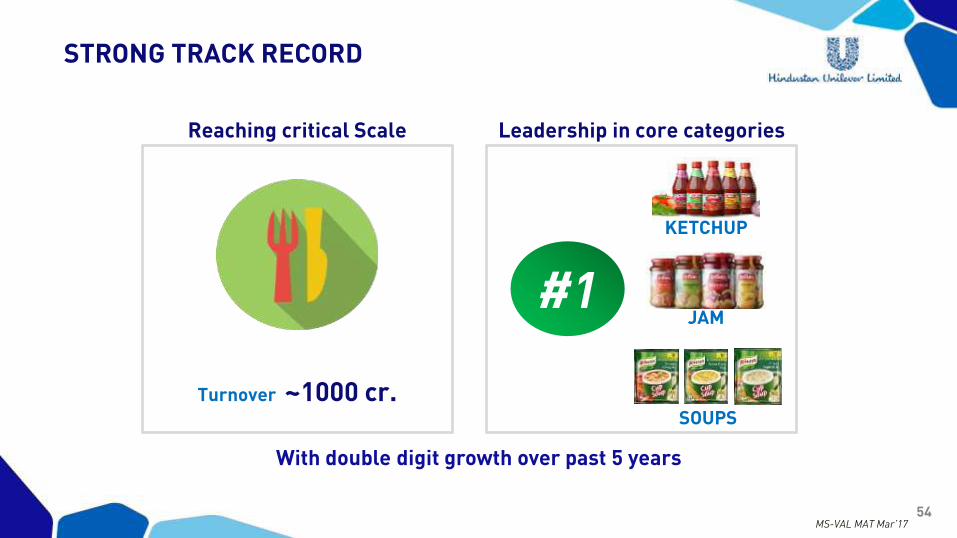
STRONG TRACK RECORD
Reaching critical Scale Leadership in core categories
Turnover ~1000 cr.
#1
KETCHUP
JAM
SOUPS
MS-VAL MAT Mar’17
With double digit growth over past 5 years
55
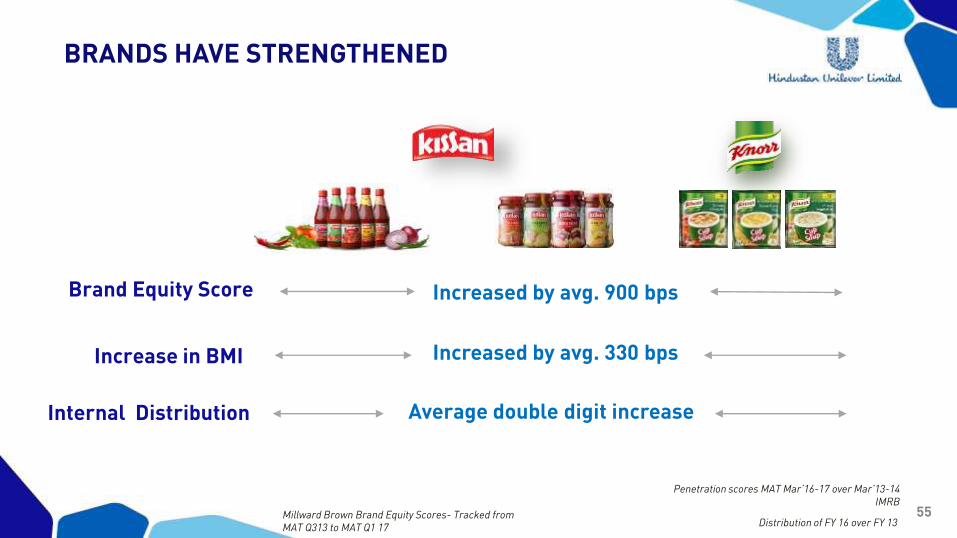
BRANDS HAVE STRENGTHENED
Increased by avg. 900 bps
Millward Brown Brand Equity Scores- Tracked from MAT Q313 to MAT Q1 17
Penetration scores MAT Mar’16-17 over Mar’13-14 IMRB
Brand Equity Score
Distribution of FY 16 over FY 13
Internal Distribution
Increased by avg. 330 bps
Average double digit increase
Increase in BMI
56
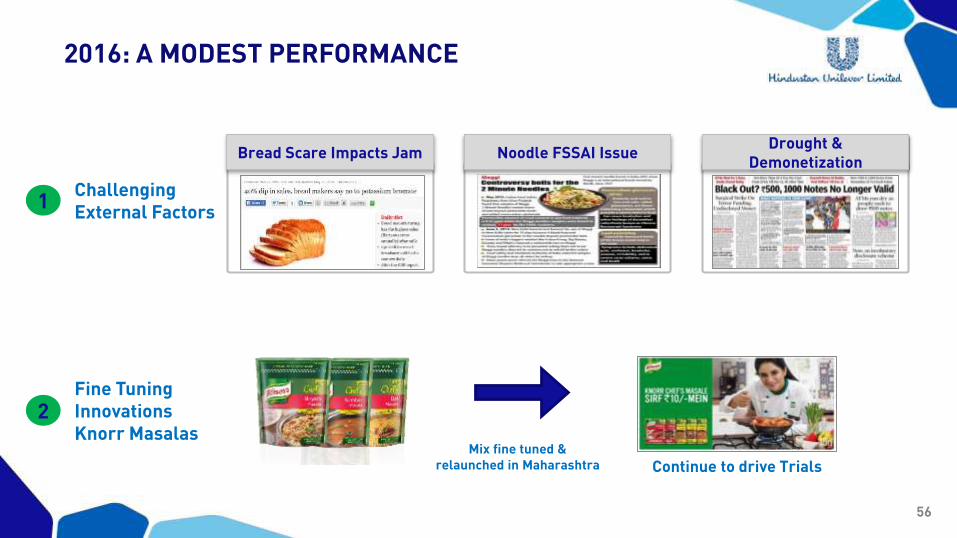
2016: A MODEST PERFORMANCE
Challenging External Factors
1
Fine Tuning InnovationsKnorr Masalas
2
Bread Scare Impacts Jam Noodle FSSAI IssueDrought &
Demonetization
Mix fine tuned & relaunched in Maharashtra Continue to drive Trials
57
OUR STRATEGY
58
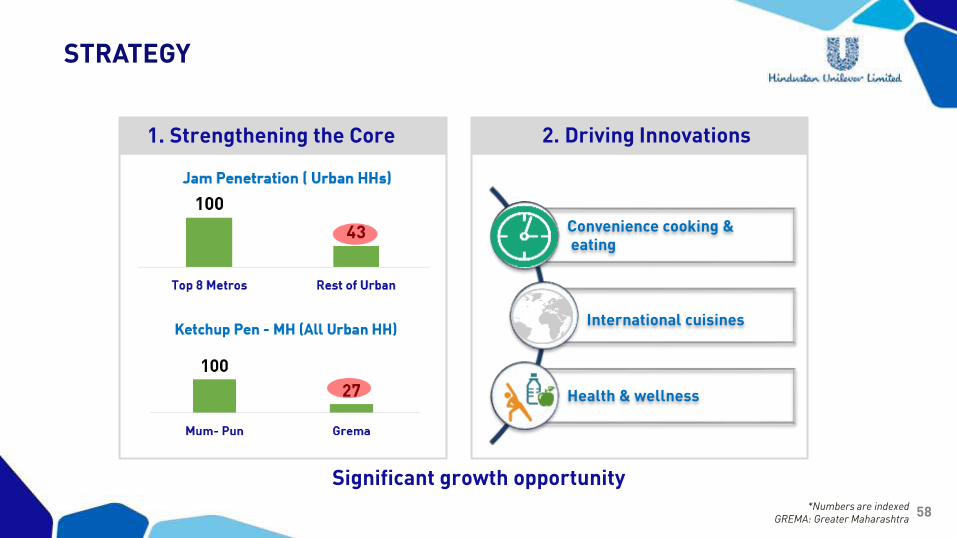
STRATEGY
1. Strengthening the Core 2. Driving Innovations
Convenience cooking &eating
International cuisines
Health & wellness
Significant growth opportunity*Numbers are indexed
GREMA: Greater Maharashtra
59
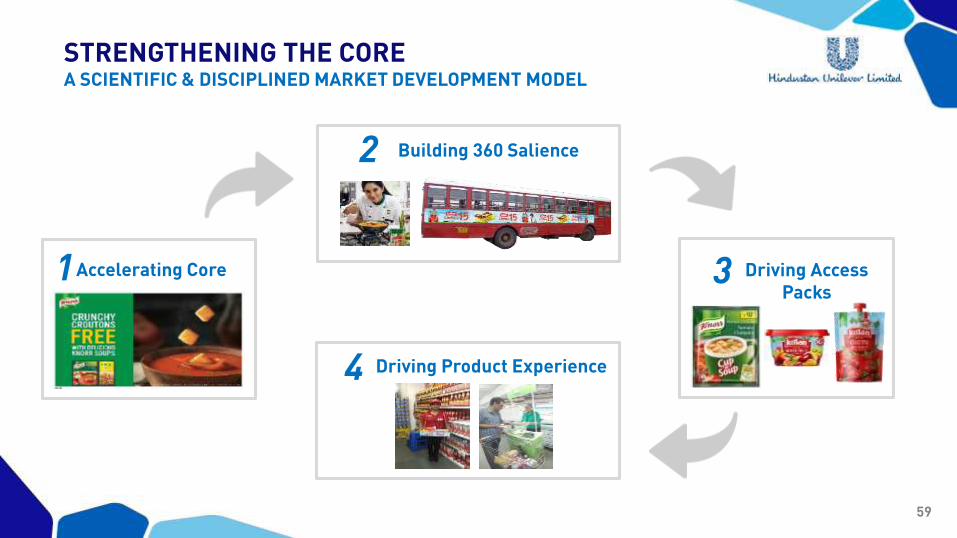
STRENGTHENING THE COREA SCIENTIFIC & DISCIPLINED MARKET DEVELOPMENT MODEL
Accelerating Core
Building 360 Salience
Driving Product Experience
2
4
1 Driving Access Packs
3
60
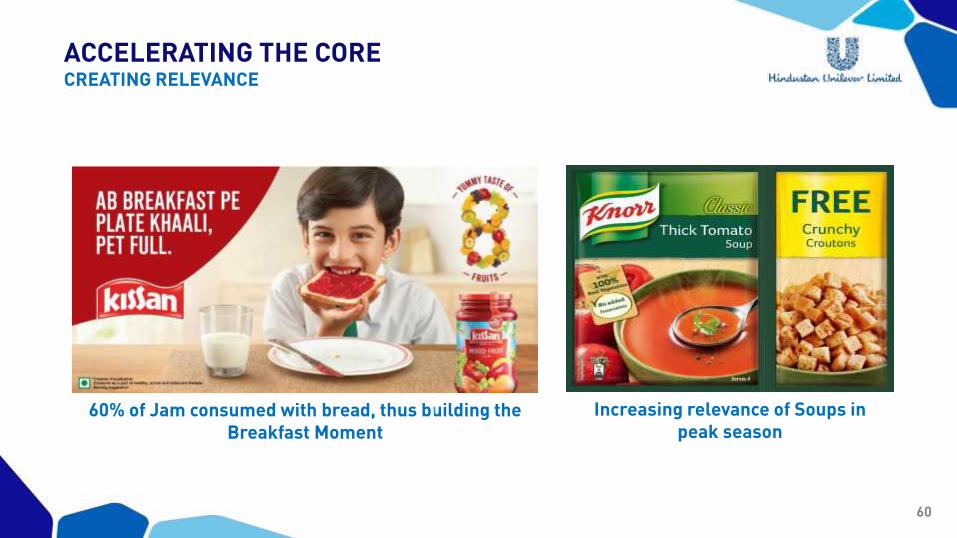
60% of Jam consumed with bread, thus building the Breakfast Moment
Increasing relevance of Soups in peak season
ACCELERATING THE CORECREATING RELEVANCE
61
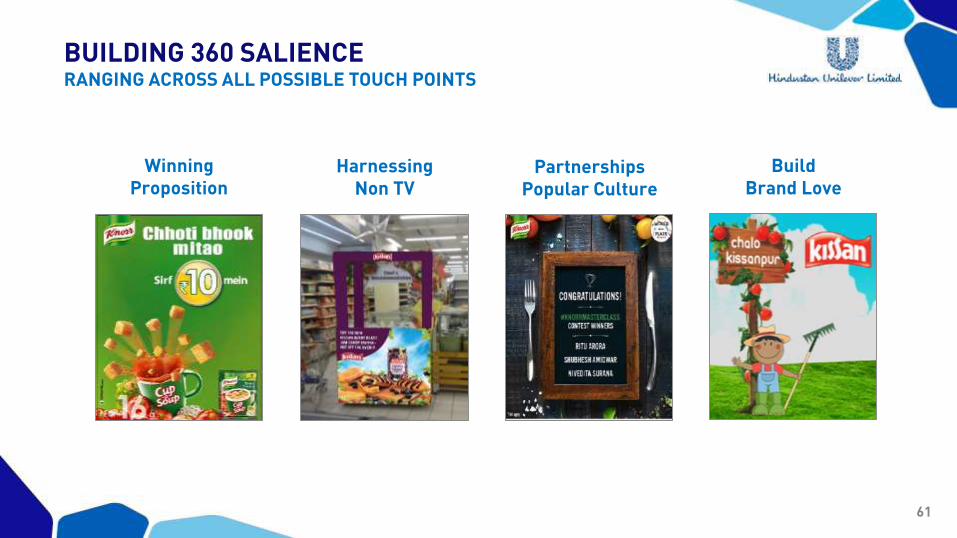
WinningProposition
HarnessingNon TV
PartnershipsPopular Culture
Build Brand Love
BUILDING 360 SALIENCERANGING ACROSS ALL POSSIBLE TOUCH POINTS
62
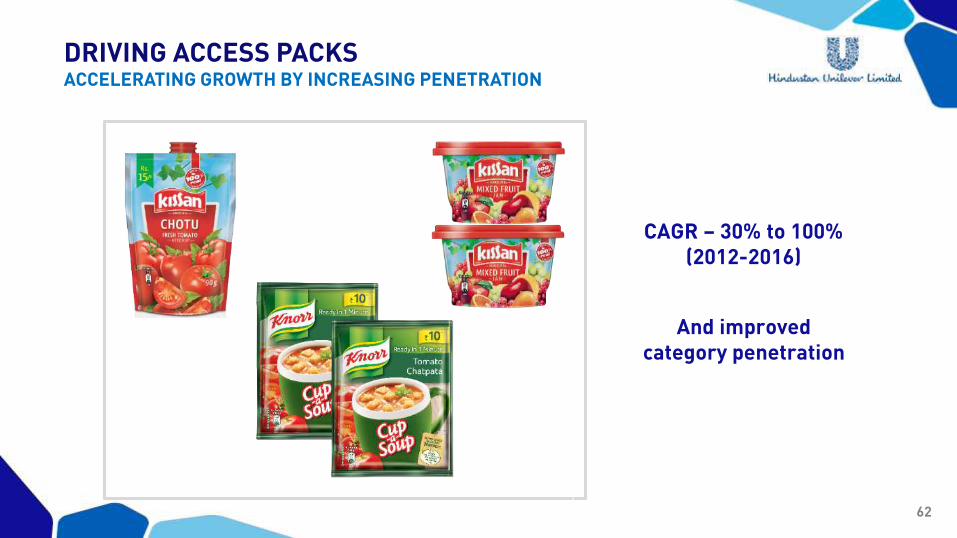
CAGR – 30% to 100%(2012-2016)
And improved category penetration
DRIVING ACCESS PACKSACCELERATING GROWTH BY INCREASING PENETRATION
63
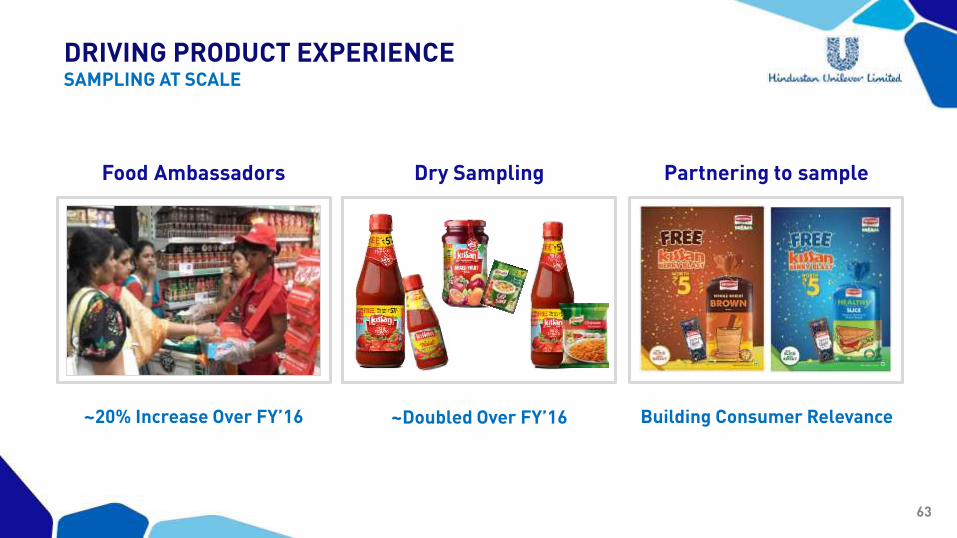
DRIVING PRODUCT EXPERIENCESAMPLING AT SCALE
Food Ambassadors Dry Sampling Partnering to sample
~20% Increase Over FY’16 ~Doubled Over FY’16 Building Consumer Relevance
64
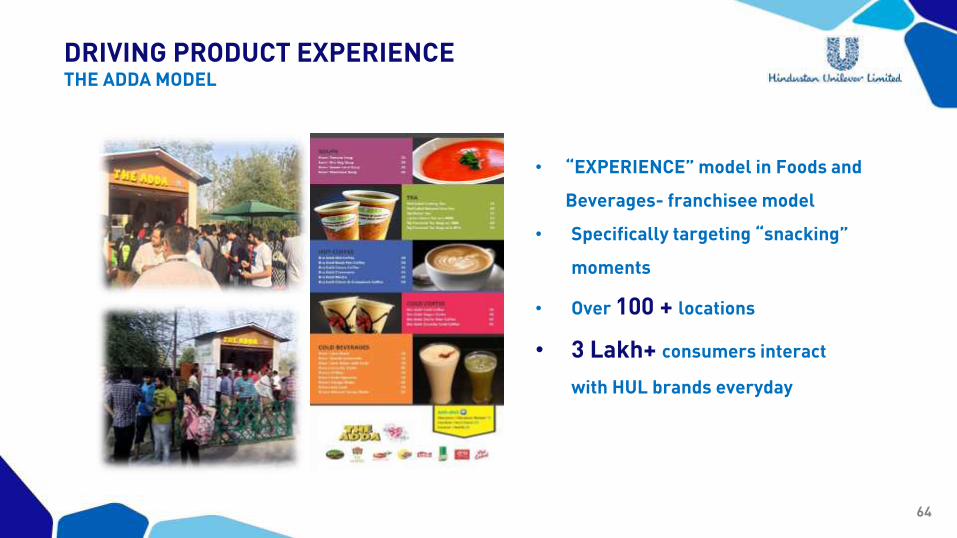
DRIVING PRODUCT EXPERIENCETHE ADDA MODEL
• “EXPERIENCE” model in Foods and
Beverages- franchisee model
• Specifically targeting “snacking”
moments
• Over 100 + locations
• 3 Lakh+ consumers interact
with HUL brands everyday
65
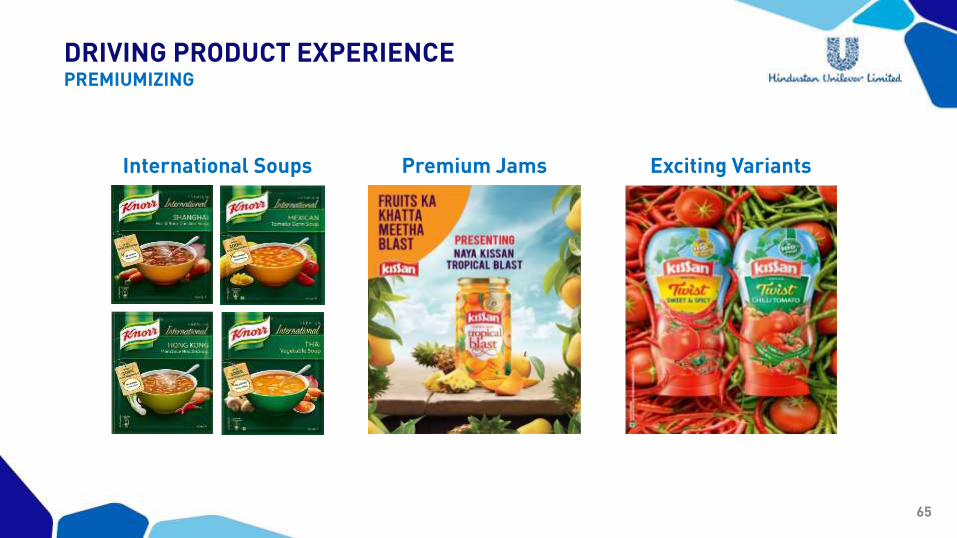
DRIVING PRODUCT EXPERIENCEPREMIUMIZING
International Soups Premium Jams Exciting Variants
66
THANK YOU
67
For more information & updatesFor More Information
THANK YOU
1

2
This Release / Communication, except for the historical information, may contain statements, including the words orphrases such as ‘expects, anticipates, intends, will, would, undertakes, aims, estimates, contemplates, seeks to,objective, goal, projects, should’ and similar expressions or variations of these expressions or negatives of these termsindicating future performance or results, financial or otherwise, which are forward looking statements. These forwardlooking statements are based on certain expectations, assumptions, anticipated developments and other factors whichare not limited to, risk and uncertainties regarding fluctuations in earnings, market growth, intense competition and thepricing environment in the market, consumption level, ability to maintain and manage key customer relationship andsupply chain sources and those factors which may affect our ability to implement business strategies successfully,namely changes in regulatory environments, political instability, change in international oil prices and input costs andnew or changed priorities of the trade. The Company, therefore, cannot guarantee that the forward looking statementsmade herein shall be realized. The Company, based on changes as stated above, may alter, amend, modify or makenecessary corrective changes in any manner to any such forward looking statement contained herein or make writtenor oral forward looking statements as may be required from time to time on the basis of subsequent developments andevents. The Company does not undertake any obligation to update forward looking statements that may be made fromtime to time by or on behalf of the Company to reflect the events or circumstances after the date hereof.
SAFE HARBOUR STATEMENT
3
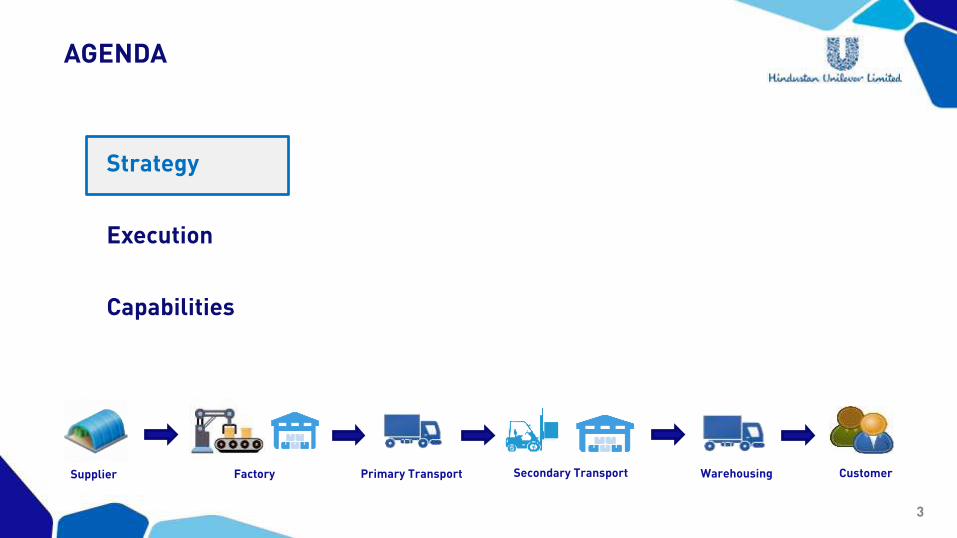
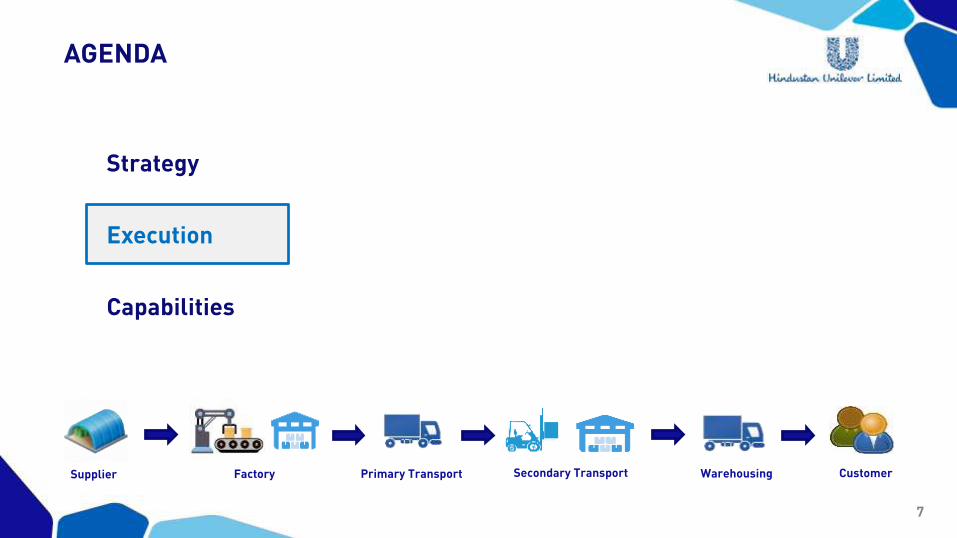
AGENDA
Strategy
Execution
Capabilities
Primary Transport CustomerFactorySupplier Secondary Transport Warehousing
4
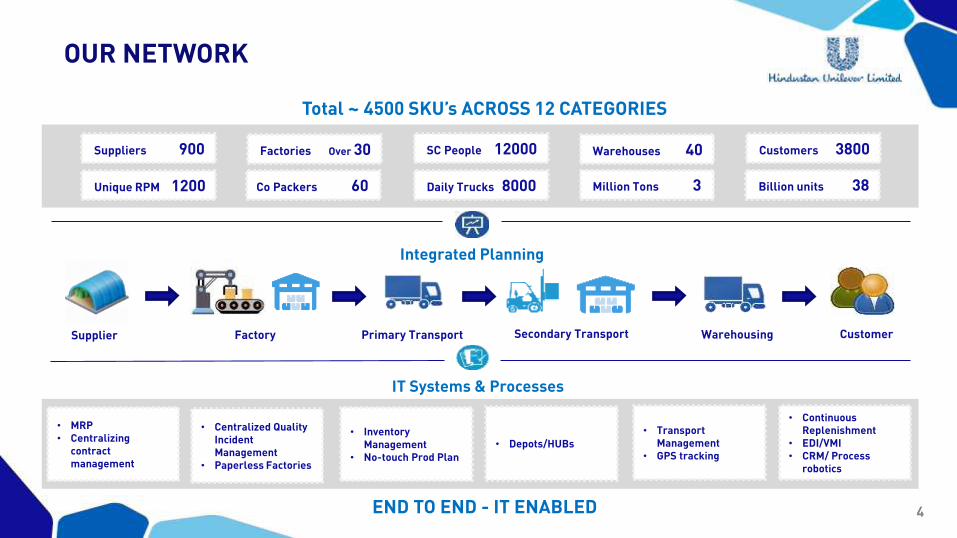
OUR NETWORK
Primary Transport
Integrated Planning
CustomerFactorySupplier
• MRP• Centralizing
contract management
• Centralized Quality Incident Management
• Paperless Factories
• Inventory Management
• No-touch Prod Plan
• Depots/HUBs
• Transport Management
• GPS tracking
• Continuous Replenishment
• EDI/VMI• CRM/ Process
robotics
IT Systems & Processes
END TO END - IT ENABLED
Total ~ 4500 SKU’s ACROSS 12 CATEGORIES
Suppliers 900
Secondary Transport Warehousing
Unique RPM 1200
Factories Over 30
Co Packers 60
SC People 12000
Daily Trucks 8000
Warehouses 40
Million Tons 3
Customers 3800
Billion units 38
5
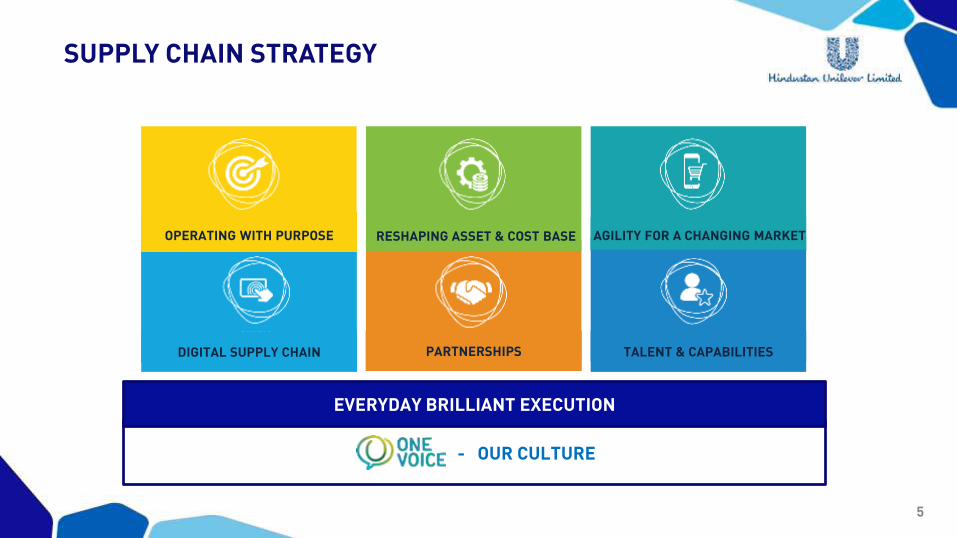
SUPPLY CHAIN STRATEGY
- OUR CULTURE
EVERYDAY BRILLIANT EXECUTION
DIGITAL SUPPLY CHAIN PARTNERSHIPS TALENT & CAPABILITIES
RESHAPING ASSET & COST BASE AGILITY FOR A CHANGING MARKETOPERATING WITH PURPOSE
6
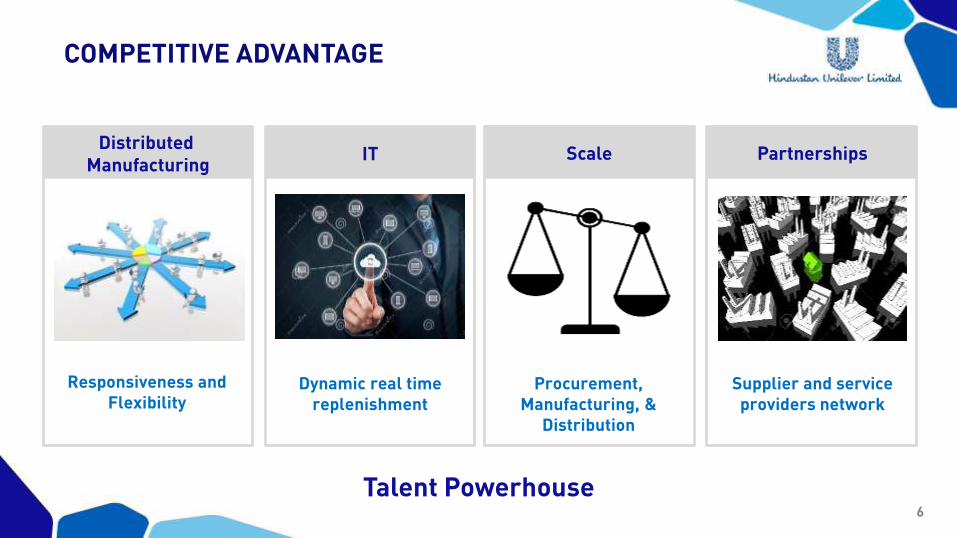
COMPETITIVE ADVANTAGE
N
A
V
I
G
A
T
O
R
Distributed Manufacturing
IT Scale Partnerships
Responsiveness and Flexibility
Dynamic real time replenishment
Procurement, Manufacturing, &
Distribution
Supplier and service providers network
Talent Powerhouse
7
AGENDA
Strategy
Execution
Capabilities
Primary Transport CustomerFactorySupplier Secondary Transport Warehousing
8
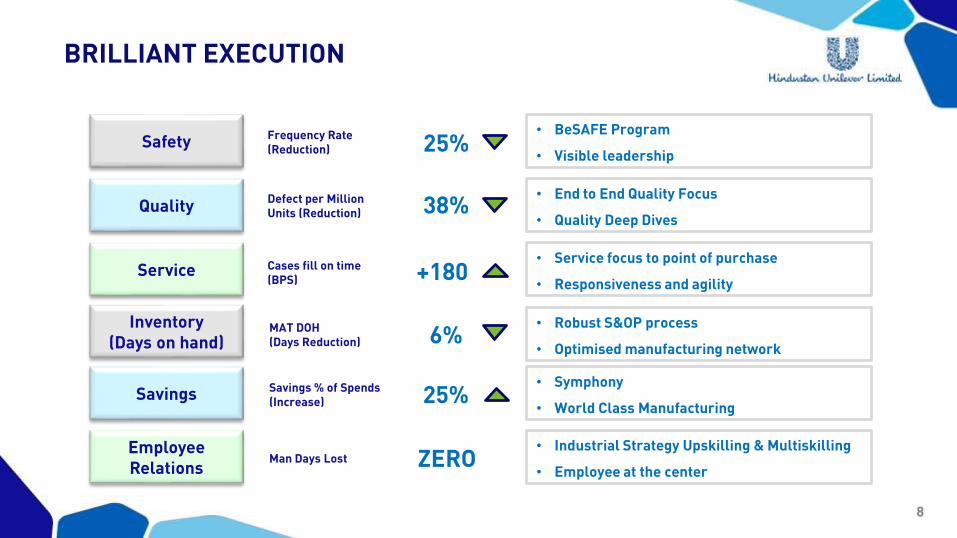
BRILLIANT EXECUTION
Safety
Quality
Service
Inventory (Days on hand)
Savings
Frequency Rate(Reduction)
Defect per Million Units (Reduction)
Cases fill on time(BPS)
MAT DOH(Days Reduction)
Savings % of Spends (Increase)
+180
6%
• BeSAFE Program
• Visible leadership
• End to End Quality Focus
• Quality Deep Dives
• Service focus to point of purchase
• Responsiveness and agility
• Robust S&OP process
• Optimised manufacturing network
• Symphony
• World Class Manufacturing
Employee Relations
Man Days Lost ZERO• Industrial Strategy Upskilling & Multiskilling
• Employee at the center
38%
25%
25%
9
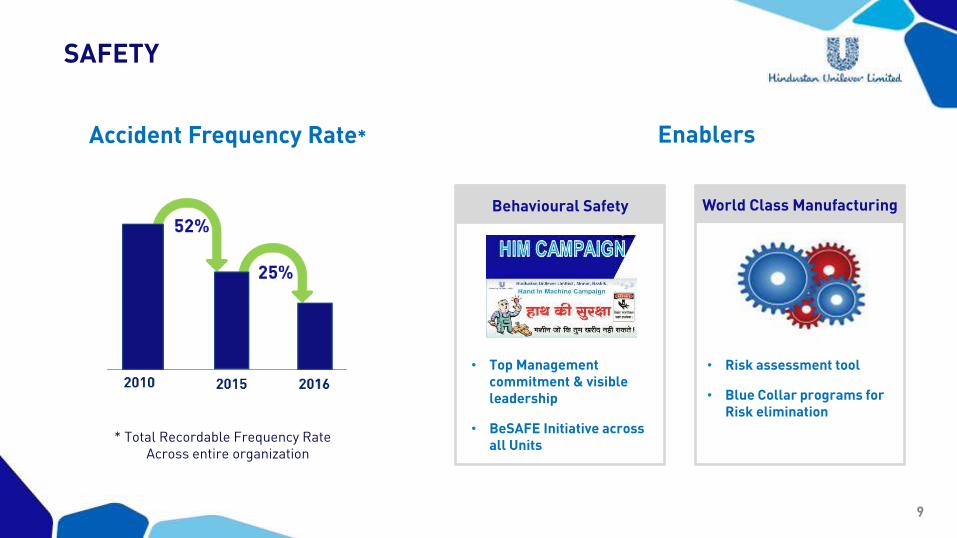
SAFETY
Accident Frequency Rate*
* Total Recordable Frequency RateAcross entire organization
Enablers
Behavioural Safety
• Top Management commitment & visible leadership
• BeSAFE Initiative across all Units
World Class Manufacturing
• Risk assessment tool
• Blue Collar programs for Risk elimination
10
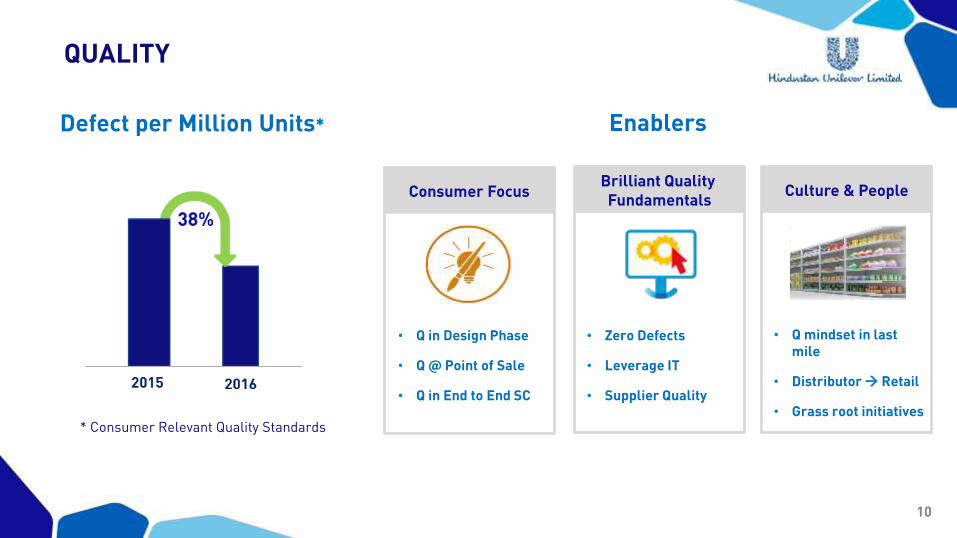
QUALITY
Defect per Million Units*
* Consumer Relevant Quality Standards
Enablers
Consumer Focus
• Q in Design Phase
• Q @ Point of Sale
• Q in End to End SC
Brilliant Quality Fundamentals
• Zero Defects
• Leverage IT
• Supplier Quality
Culture & People
• Q mindset in last mile
• Distributor Retail
• Grass root initiatives
11
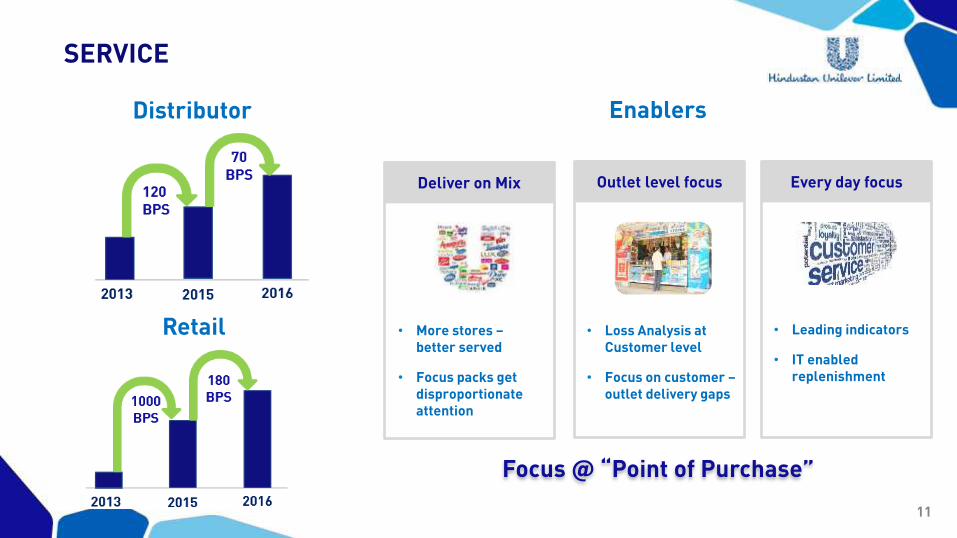
SERVICE
Distributor Enablers
Deliver on Mix
• More stores –better served
• Focus packs get disproportionate attention
Outlet level focus
• Loss Analysis at Customer level
• Focus on customer –outlet delivery gaps
Every day focus
• Leading indicators
• IT enabled replenishment
Retail
Focus @ “Point of Purchase”
12
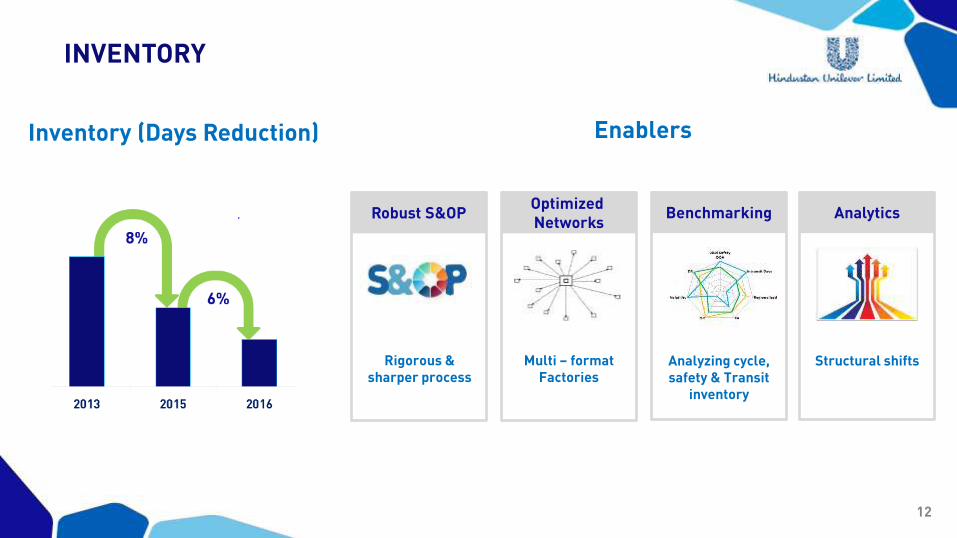
INVENTORY
Inventory (Days Reduction) Enablers
Robust S&OP
Rigorous & sharper process
Optimized Networks
Multi – format Factories
Benchmarking
Analyzing cycle, safety & Transit
inventory
Analytics
Structural shifts
13
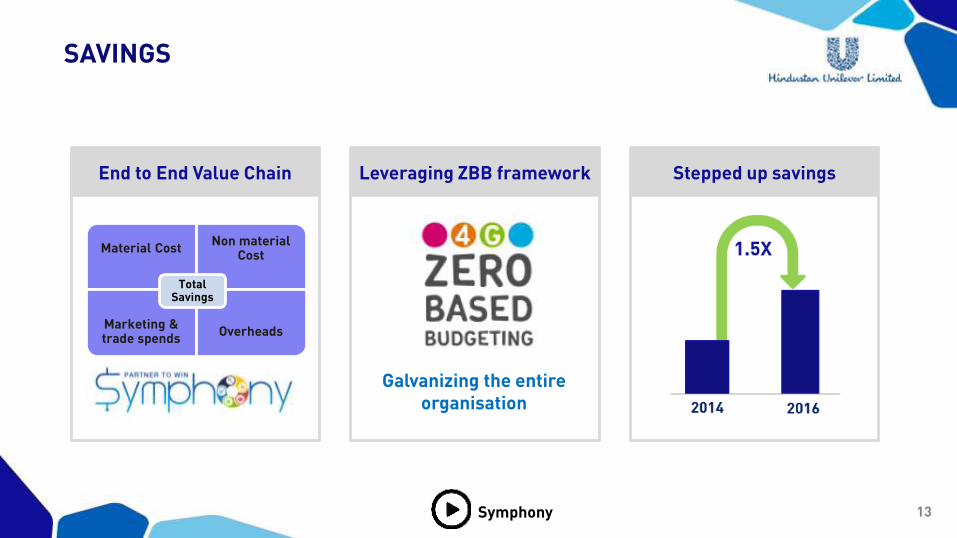
SAVINGS
End to End Value Chain Leveraging ZBB framework Stepped up savings
Material CostNon material
Cost
Marketing & trade spends
Overheads
Total Savings
Galvanizing the entire organisation
Symphony
14
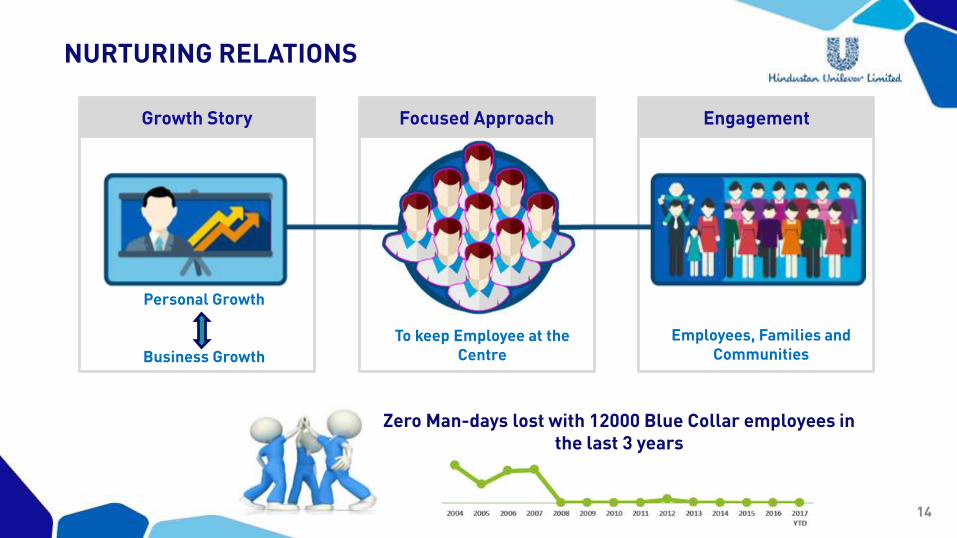
NURTURING RELATIONS
Growth Story Engagement
Personal Growth
Business Growth
To keep Employee at the Centre
Employees, Families and Communities
Zero Man-days lost with 12000 Blue Collar employees in the last 3 years
Focused Approach
15
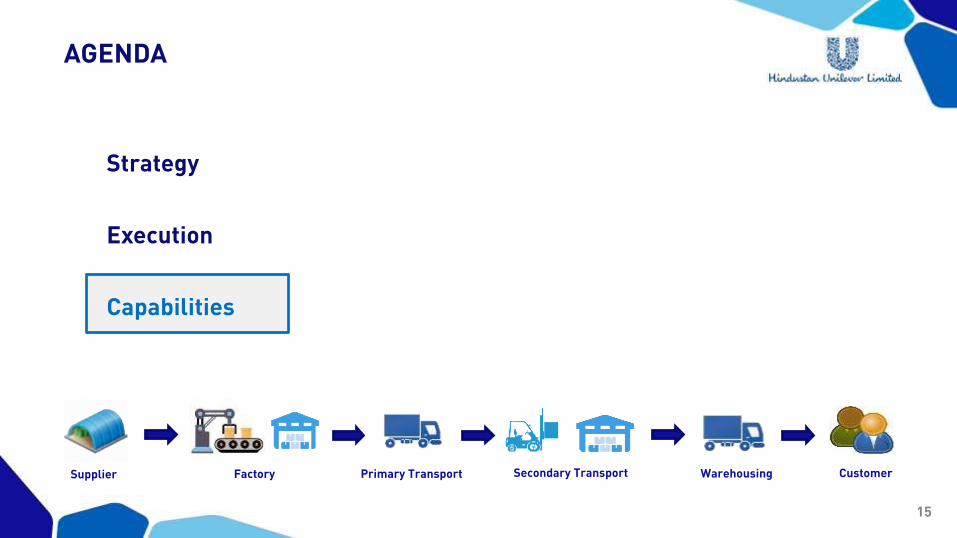
AGENDA
Strategy
Execution
Capabilities
Primary Transport CustomerFactorySupplier Secondary Transport Warehousing
16
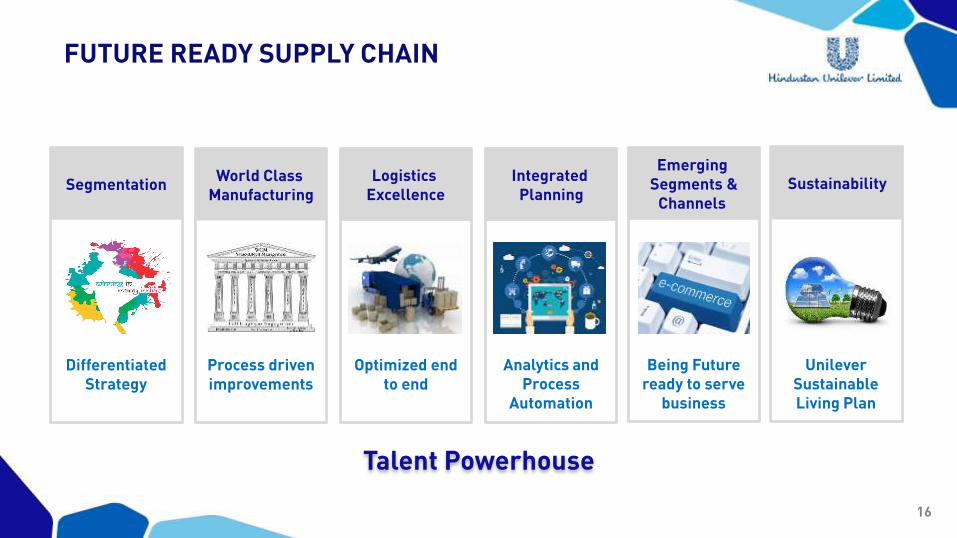
FUTURE READY SUPPLY CHAIN
SegmentationWorld Class
ManufacturingLogistics
ExcellenceIntegrated
Planning
Emerging Segments &
Channels Sustainability
Differentiated Strategy
Optimized end to end
Analytics and Process
Automation
Unilever Sustainable Living Plan
Process driven improvements
Being Future ready to serve
business
Talent Powerhouse
17
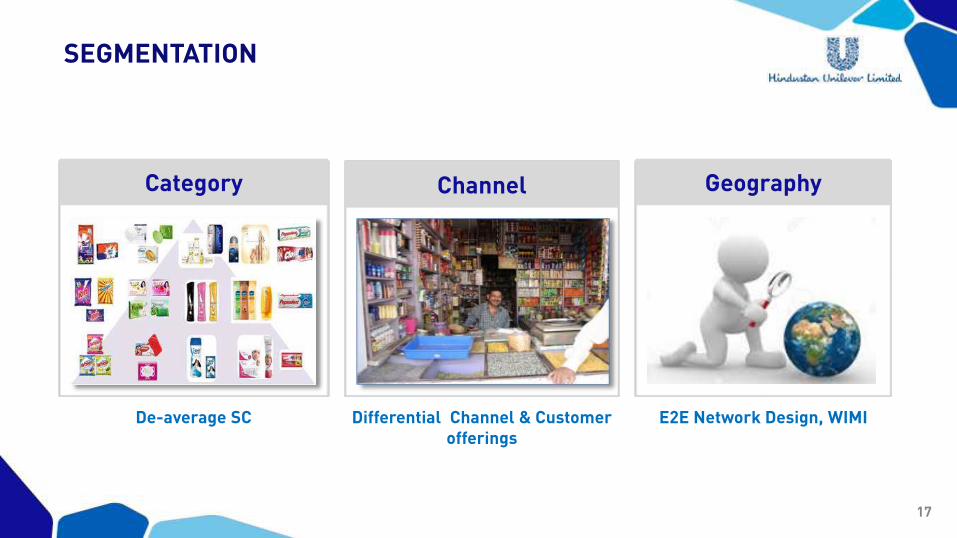
SEGMENTATION
De-average SC E2E Network Design, WIMIDifferential Channel & Customer offerings
Category Channel Geography
18
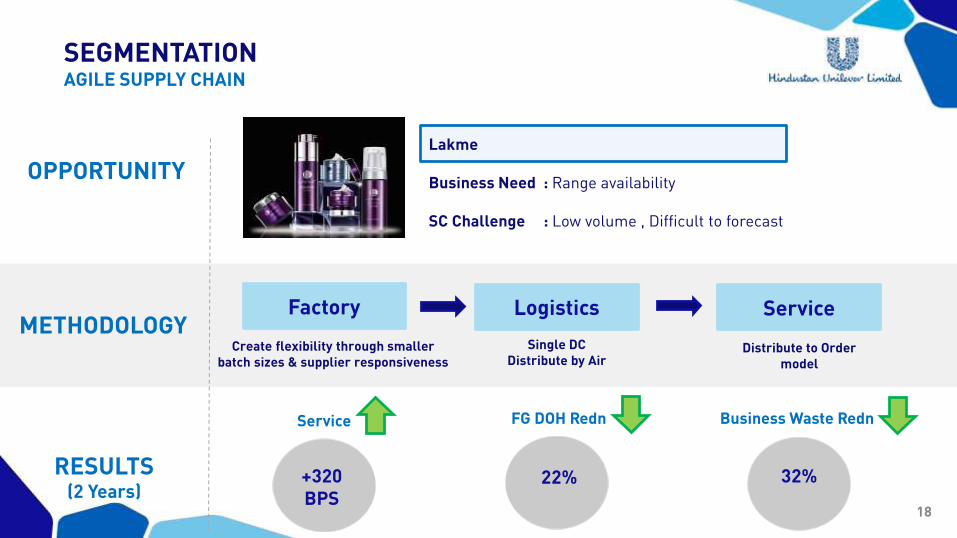
SEGMENTATIONAGILE SUPPLY CHAIN
Create flexibility through smaller batch sizes & supplier responsiveness
Single DC Distribute by Air
Distribute to Order model
+320BPS
Service
22%
FG DOH Redn
32%
Business Waste Redn
OPPORTUNITY
METHODOLOGY
RESULTS (2 Years)
Lakme
Business Need : Range availability
SC Challenge : Low volume , Difficult to forecast
Factory Logistics Service
19
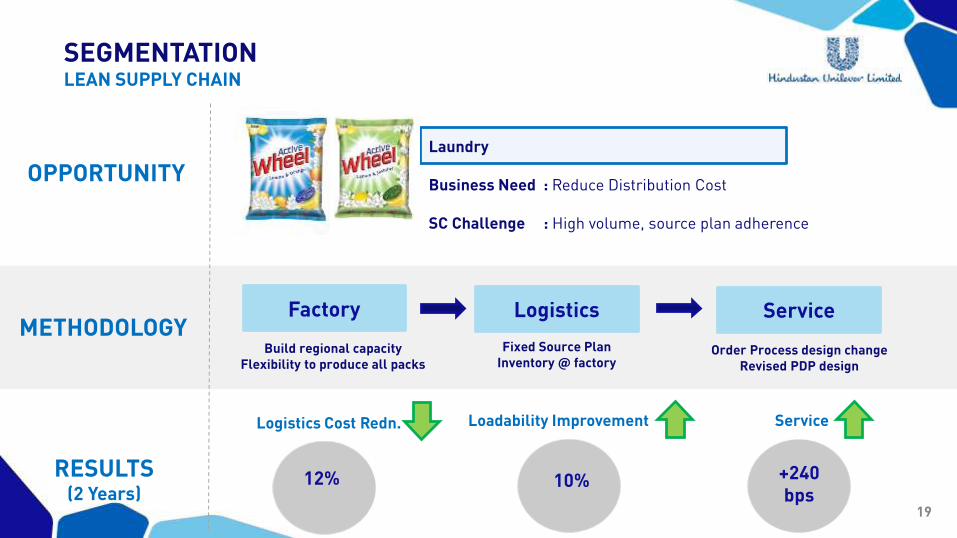
SEGMENTATIONLEAN SUPPLY CHAIN
Build regional capacityFlexibility to produce all packs
Fixed Source PlanInventory @ factory
Order Process design changeRevised PDP design
12%
Logistics Cost Redn.
10%
Loadability Improvement
+240 bps
Service
OPPORTUNITY
METHODOLOGY
RESULTS (2 Years)
Laundry
Business Need : Reduce Distribution Cost
SC Challenge : High volume, source plan adherence
Factory Logistics Service
20
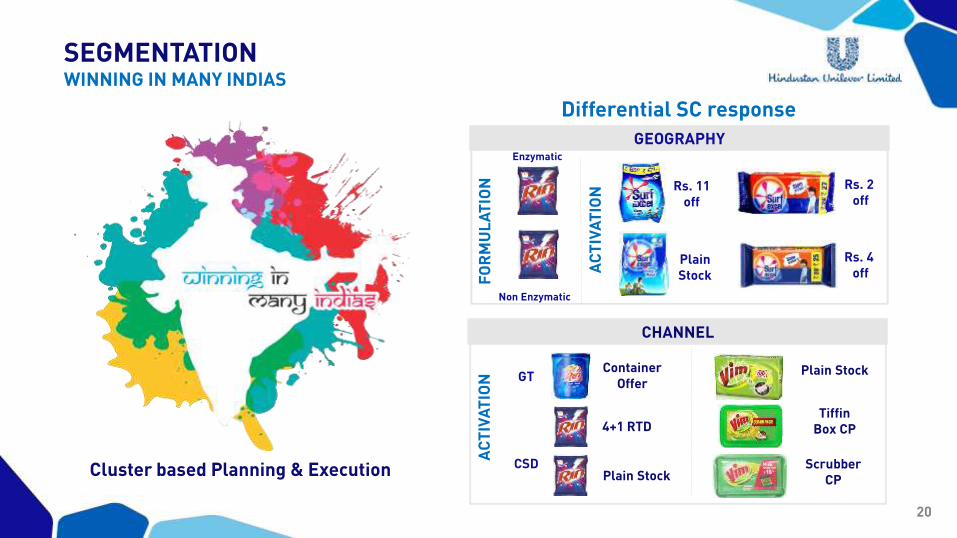
SEGMENTATIONWINNING IN MANY INDIAS
Cluster based Planning & Execution
Enzymatic
GEOGRAPHY
Non Enzymatic
Rs. 11 off
Plain StockF
OR
MU
LA
TIO
N
AC
TIV
AT
ION
Rs. 2off
Rs. 4off
Differential SC response
CHANNEL
AC
TIV
AT
ION
Container Offer
4+1 RTD
Plain Stock
GT
CSD
Plain Stock
Scrubber CP
Tiffin Box CP
21
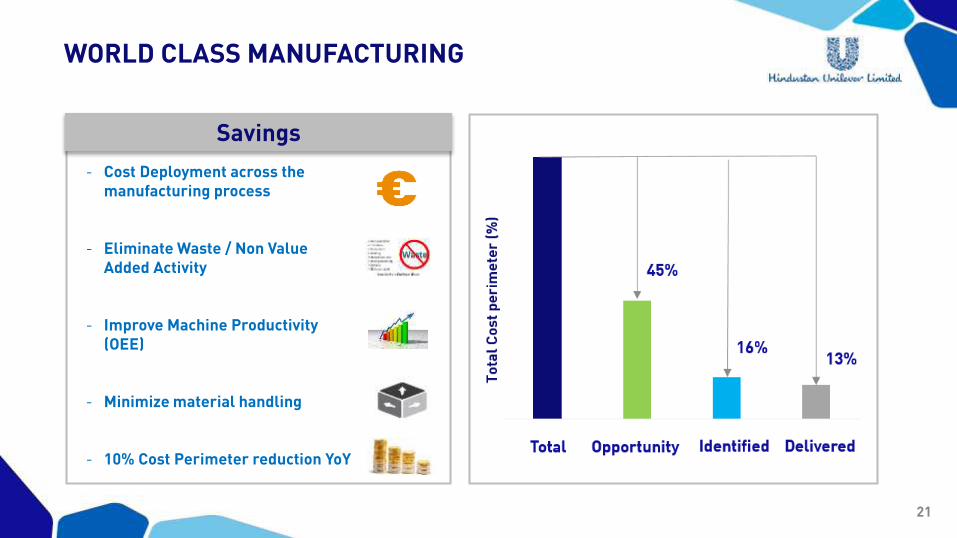
WORLD CLASS MANUFACTURING
Savings
- Cost Deployment across the manufacturing process
- Eliminate Waste / Non Value Added Activity
- Improve Machine Productivity (OEE)
- Minimize material handling
- 10% Cost Perimeter reduction YoY
22
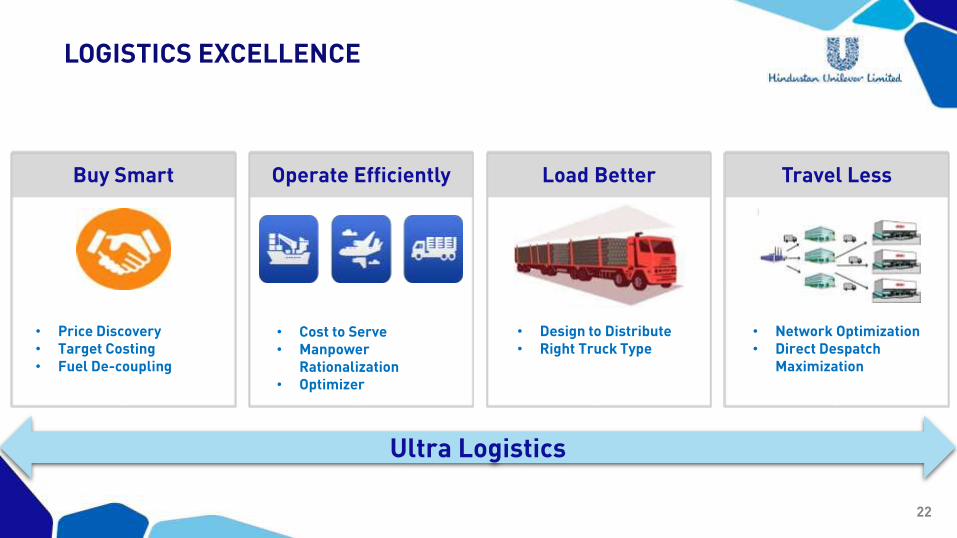
LOGISTICS EXCELLENCE
Buy Smart Operate Efficiently Load Better Travel Less
• Cost to Serve• Manpower
Rationalization• Optimizer
• Price Discovery• Target Costing• Fuel De-coupling
• Design to Distribute• Right Truck Type
• Network Optimization• Direct Despatch
Maximization
Ultra Logistics
23
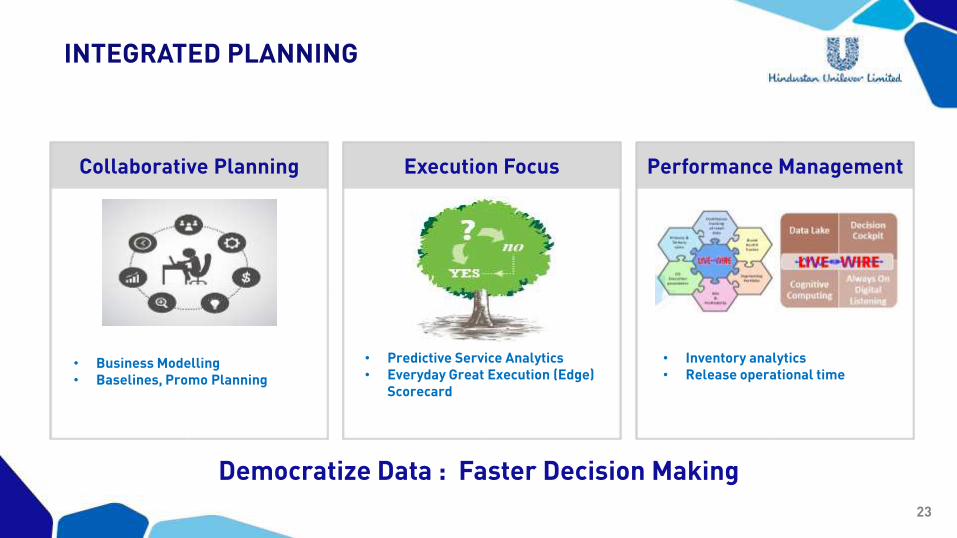
INTEGRATED PLANNING
Collaborative Planning Execution Focus Performance Management
• Business Modelling • Baselines, Promo Planning
• Predictive Service Analytics• Everyday Great Execution (Edge)
Scorecard
• Inventory analytics• Release operational time
Democratize Data : Faster Decision Making
24
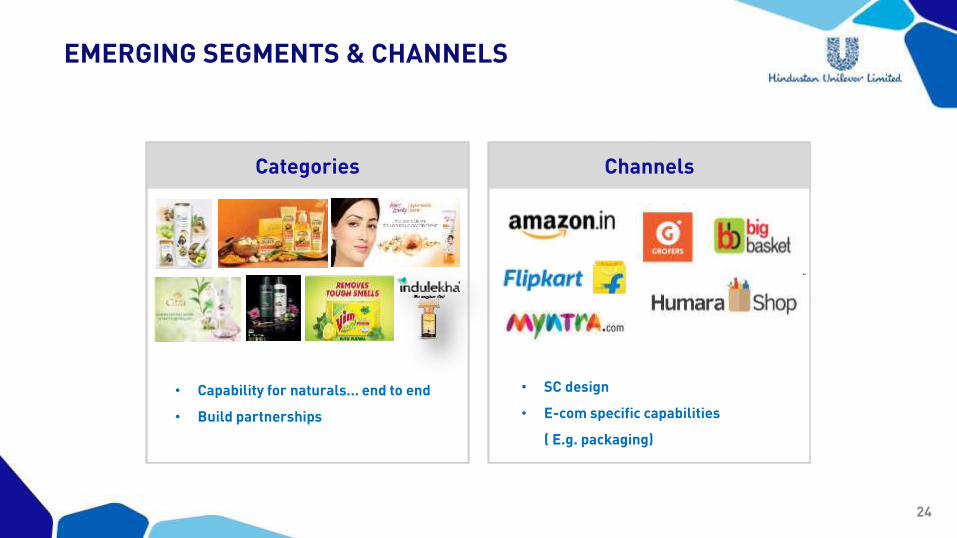
EMERGING SEGMENTS & CHANNELS
Categories Channels
• SC design
• E-com specific capabilities
( E.g. packaging)
• Capability for naturals… end to end
• Build partnerships
25
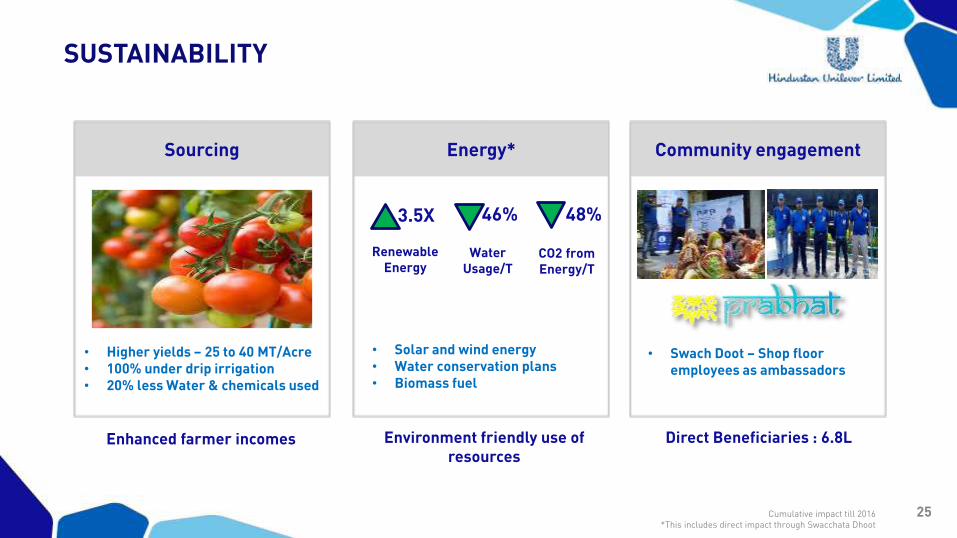
SUSTAINABILITY
Sourcing Energy* Community engagement
Renewable Energy
3.5X
Water Usage/T
46% 48%
CO2 from Energy/T
• Solar and wind energy• Water conservation plans• Biomass fuel
• Higher yields – 25 to 40 MT/Acre• 100% under drip irrigation• 20% less Water & chemicals used
• Swach Doot – Shop floor employees as ambassadors
Enhanced farmer incomes Environment friendly use of resources
Direct Beneficiaries : 6.8L
Cumulative impact till 2016*This includes direct impact through Swacchata Dhoot
26
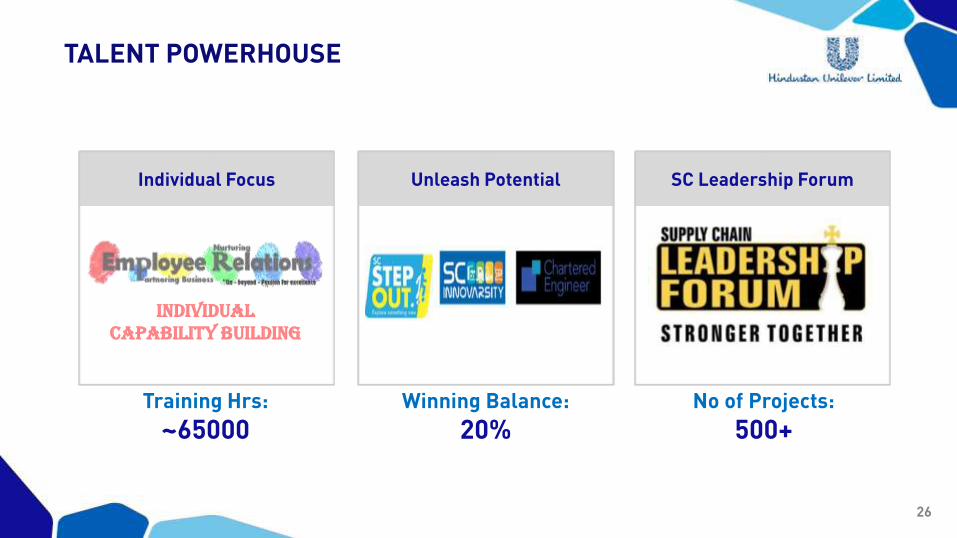
TALENT POWERHOUSE
Individual Focus Unleash Potential SC Leadership Forum
Individual Capability Building
No of Projects:
500+Winning Balance:
20%Training Hrs:
~65000
27
For more information & updatesTHANK YOUFor More Information


![Proceedings.] PALMER ON FREMANTLE HARBOUR-WORKS](https://img.pdfslide.net/doc/110x75/635470ac2f45713c8a071edf/proceedings-palmer-on-fremantle-harbour-works.jpg)