Embed Size (px)
Citation preview
SAFETY ASSESSMENT OF SKIN-LIGHTENING FORMULATIONS COMMONLY AVAILABLE IN THE
NIGERIAN MARKET
by
ABDULKADIR IBRAHIM MAHMOUD
Submitted in fulfilment of the academic requirements for the degree of
Master of Science in the School of Chemistry and Physics,
University of KwaZulu-Natal
Durban
December 2016

i
ABSTRACT
The use of skin-lightening products (SLPs) in an attempt to lighten the skin is a common
practice among most African countries, with Nigeria making up the largest population in
terms of sheer numbers. These products are aimed at modulating melanogenesis through
their active ingredients by acting on the tyrosinase enzyme in order to control unwanted
skin pigmentation. This in turn results in several health complications especially after
their prolonged use. The major concern is that most of these SLPs contain active
ingredients that are either banned or exceed regulation limits and do not comply with
labelling requirements. This has resulted in the Nigerian Food and Drug Agency
(NAFDAC) prohibiting all forms of bleaching agents in cosmetics and toiletries sold in
Nigeria. Nevertheless, products containing skin-lightening agents are still widely
available.
In this project, 35 skin-lightening formulations were sourced from Ilorin State in Nigeria.
They were analysed in order to identify and quantify the organic active ingredients and
heavy metals present in them.
All of the 35 skin-lightening formulations were investigated for the presence of some
selected organic active ingredients. An appropriate extraction method was developed for
these active ingredients, which included hydroquinone, benzoquinone, kojic acid,
niacinamide, arbutin, clobetasol propionate, betamethasone dipropionate and
clotrimazole. The extracts were analysed by reversed-phase high performance liquid
chromatography (HPLC) with photodiode array detection in an isocratic mode.
Of the total samples analysed, 32 of the products were found to contain at least one or
more of the active ingredients. Hydroquinone was detected in 15 samples in
concentrations ranging from 0.017 to 7.096% (m/m). Some of the samples containing
hydroquinone were also found to contain benzoquinone. Hydroquinone is unstable in
some formulations and hydrolyses to benzoquinone. Of the six samples found to contain
benzoquinone, its concentration ranged from 0.005 to 0.015% (m/m). Kojic acid was
detected in nine samples in the range of 0.017 to 1.412% (m/m). Four samples were found
to contain niacinamide. The concentration of niacinamide in the samples ranged from

ii
0.029 to 1.827% (m/m). Arbutin was not detected in any of the products. Steroid
compounds were detected in 13 of the studied samples. Eight samples were found to
contain clobetasol propionate, two samples were found to contain both clobetasol
propionate and clotrimazole, and three samples were found to contain betamethasone
dipropionate. The concentrations of clobetasol propionate, betamethasone dipropionate
and clotrimazole were found in the range of 0.007 to 0.035, 0.019 to 0.027 and 0.007 to
0.012% (m/m) respectively.
The HPLC methods developed were validated by intra-day and inter-day reproducibility
of standards, linearity of calibration lines, limits of detection and quantification, and
recovery tests. The linear correlation coefficients were found to be greater than 0.995,
the acceptable recovery values ranged from 84.23 to 110.33%, and the percent relative
standard deviation (%R.S.D.) for the intra-day precision ranged from 0.17 to 8.16% while
that of the inter-day precision ranged from 0.14 to 4.78%. This shows that the methods
developed are reproducible with good precision.
The second part of the study involved the analysis of the heavy metal content of the same
products and also the assessment of the possible exposure risk due to the use of these
products. The heavy metals investigated included As, Al, Cd, Co, Cr, Co, Fe, Mn, Ni,
Pb, Zn and Hg. These elements were extracted into solution by acid-assisted microwave
digestion. The extracts were analysed for the metallic elements by inductively coupled
plasma-optical emission spectrometry and cold-vapour atomic absorption spectrometry
for Hg. As, Cd and Co were not detected in any of the formulated SLPs. Al was detected
in all the samples and the maximum concentration found was 0.354 µg g-1. Fe, Mn, and
Cu were detected in most of the samples at levels not exceeding 1.252 µg g-1, 0.053 µg g-
1, and 0.056 µg g-1 respectively. Zn was detected in all the samples but was relatively
high in SLP 33 (76.33 µg g-1). Cr was found in 21 samples at a maximum concentration
of 0.217 µg g-1. Pb was detected in all samples with concentrations not exceeding 0.026
µg g-1 and nickel was detected in 26 samples at a maximum concentration of 0.433 µg g-
1. One sample (SLP 6) was found to have a relatively high level of mercury (69.86 µg g-
1). This level of mercury in a skin-lightening cream is alarming due to its high toxicity
and that the presence of mercury in cosmetics is banned.

iii
The systemic exposure dosage and margin of safety values for the studied SLPs show that
the level of metal contents detected in these products are safe for use except in the case
of one of the samples containing a relatively high level of Hg with a systemic exposure
dosage of 2.07 × 10⁻² mg kg-1 bw day-1 and a margin of safety value of 2.41. The World
Health Organization proposed the provisional tolerable daily intake for mercury to be
7.14 × 10⁻⁴ mg kg-1 bw day-1 and the minimum margin of safety value of 100 for any
heavy metal to be safe for use in skin-lightening products.
It is evident from the results of the present study that banned and toxic ingredients, such
as hydroquinone, mercury and very potent steroids, like clobetasol propionate and
betamethasone dipropionate, are still found in skin-lightening products in the Nigerian
market in spite of the NAFDAC prohibition. This is worrisome as it can expose users to
serious health issues considering the chronic use of such products by unsuspecting
consumers.

iv
PREFACE
The experimental work described in this dissertation was carried out in the School of
Chemistry and Physics, University of KwaZulu-Natal, Durban, from February 2015 to
December 2016, under the supervision of Professor Bice S. Martincigh.
These studies represent original work by the author and have not otherwise been
submitted in any form for any degree or diploma to any tertiary institution. Where use
has been made of the work of others it is duly acknowledged in the text.
v
DECLARATION 1: PLAGIARISM
I, Abdulkadir Ibrahim Mahmoud, declare that
1. The research reported in this dissertation, except where otherwise indicated,
is my original research.
2. This dissertation has not been submitted for any degree or examination at any
other university.
3. This dissertation does not contain other persons’ data, pictures, graphs or other
information, unless specifically acknowledged as being sourced from other
persons.
4. This dissertation does not contain other persons' writing, unless specifically
acknowledged as being sourced from other researchers. Where other written
sources have been quoted, then:
a. Their words have been re-written but the general information attributed to
them has been referenced.
b. Where their exact words have been used, then their writing has been placed
in italics and inside quotation marks, and referenced.
5. This dissertation does not contain text, graphics or tables copied and pasted
from the Internet, unless specifically acknowledged, and the source being
detailed in the thesis and in the References sections.
Signed: …………………………………………………………

vi
DECLARATION 2: CONFERENCE PRESENTATION
The following poster was presented at a conference:
Abdulkadir Mahmoud and Bice S. Martincigh, A rapid HPLC method for the
simultaneous determination of steroids in skin-lightening creams, 42nd National
Convention of the South African Chemical Institute (SACI), Durban, South Africa, 29th
November – 4th December 2015.

vii
DEDICATION
I dedicate this work to my beloved mother, Late Hajiya Muslimat Mahmoud.

viii
ACKNOWLEDGEMENTS
I am thankful to God whom by his will made this work possible.
I am very grateful to my supervisor Professor Bice Martincigh for her countless support
and guidance throughout this degree. It took me no time to realise what a special
supervisor I got when I came on board.
I am also grateful to Mrs Anita Naidoo and Miss Unathi Bongoza for the instrumentation
training and other technical assistance they gave me. I was amazed by their kind
treatment. I am equally thankful to Mr Kishore Singh for his uncountable assistance and
Mr Ajay Bissessur for helping with the AA lamp I used for the mercury determination.
I am indebted to a host of my research group members whose help was invaluable during
my study. The brotherly treatment and laboratory guidance given to me by Dr Oluwaseun
Oyetade and Dr Ovokeroye Abafe will always be remembered. I am equally grateful to
Dr Moses Ollengo for explaining some aspects of my work. I extend my gratitude to
every other member of my research group for the wonderful times and the kindly advice.
I must sincerely say thank you to Mr Isaac Ofori for his useful suggestions and assistance.
I owe special gratitude to my parents, Professor I.S. Mahmoud and, in particular, my
beloved mother Late Hajiya Muslimat Mahmoud for giving meaning to my life with her
endless support. I pray that God may continue to have mercy on her soul. I am also
grateful to my grandmother whose prayers and words of wisdom have kept me going. I
am so indebted to my wonderful siblings Captain Ahmad Mahmoud, Habibullah
Mahmoud and Safinat Onipede for their unconditional support. To my uncles and aunties,
I say a big thank you, particularly Hajiya Nurat Arebge for her motherly guidance.
I am grateful to my cousins Al-amin and Jamila and my good friends Ibrahim Akinbo,
Kazeem Abdulazeez and Ibrahim Sani for checking on me all the time during this degree.
Finally, I would like to thank the National Research Foundation (NRF) and the University
of KwaZulu-Natal for financial support for the duration of my degree.

ix
TABLE OF CONTENTS
ABSTRACT i
PREFACE iv
DECLARATION 1: PLAGIARISM v
DECLARATION 2: CONFERENCE PRESENTATION vi
DEDICATION vii
ACKNOWLEDGMENTS viii
TABLE OF CONTENTS ix
LIST OF FIGURES xiii
LIST OF TABLES xv
Chapter 1 1
INTRODUCTION AND LITERATURE REVIEW 1
1.1 A general overview of skin-lightening practices 2
1.2 The human skin 4
1.2.1 Variation in skin color 5
1.3 Melanin and pigmentation 7
1.3.1 Biosynthesis of melanin 8
1.3.2 Melanin pathway inhibitors (Tyrosinase inhibitors) 10
1.4 Skin-lightening agents 12
1.4.1 Hydroquinone 13
1.4.2 Benzoquinone 15
1.4.3 Kojic acid 16
1.4.4 Niacinamide 18
1.4.5 Arbutin 18

x
1.4.6 Glycolic acid 18
1.4.7 Mequinol 19
1.4.8 Azelaic acid 19
1.4.9 Retinoids (Topical) 19
1.4.10 Resorcinol 20
1.4.11 Aleosin 20
1.4.12 Soy proteins 21
1.4.13 Flavonoids 21
1.4.14 Steroids 21
1.4.15 Mercury 23
1.5 Clotrimazole 24
1.6 Heavy metals in cosmetics and their health complications 26
1.7 Dermatological effects of skin-lightening products 28
1.8 Methods of analysis of skin-lightening agents 29
1.9 Methods of analysis of heavy metals 30
1.10 Quantitation methods 32
1.11 Problem statement 33
1.12 Motivation 33
1.13 Aim and objectives 34
Chapter 2 35
EXPERIMENTAL 35
2.1 Materials 35
2.2 Equipment 35
2.3 HPLC analysis of skin-lightening agents 47
2.3.1 Theory of HPLC 47
2.3.2 Components of an HPLC system 48
2.3.3 Identification of skin-lightening agents 50
2.3.3.1 Theory and instrumentation for UV-visble spectrophotometry 50

xi
2.3.3.2 Determination of UV absorbance of skin-lightening agents 53
2.3.4 HPLC method development 58
2.3.4.1 Determination of optimum separation method 59
2.3.4.2 Determination of optimum extraction method 60
2.3.4.3 Standard solution preparation and analysis 61
2.3.4.4 Sample preparation and analysis 62
2.3.4.5 Recovery analysis 63
2.3.4.6 Inter-day and intra-day analysis 64
2.4 Analysis of heavy metal content 64
2.4.1 Extraction of heavy metals 65
2.4.1.1 Microwave-assisted digestion 66
2.4.2 Inductive coupled plasma-optical emission spectrometry 67
2.4.2.1 Preparation of standard solutions of heavy metal 69
2.4.2.2 Determination of heavy metals 69
2.4.3 Cold-vapour atomic absorption spectrometry 71
2.4.3.1 Preparation of reagents and standard solutions 72
2.4.3.2 Determination of mercury 73
2.4.4 Validation of heavy metal and mercury analyses 74
2.5 Data analysis 76
Chapter 3 80
RESULTS AND DISCUSSION 80
3.1 HPLC method development for the determination of organic skin-lightening agents 80
3.1.1 Optimum detection wavelengths 80
3.1.2 Identification of skin-lightening agents 81
3.1.3 Optimum separation conditions 82
3.1.4 Optimum extraction solvent for sample preparation 90

xii
3.2 Validation of HPLC analytical method 91
3.2.1 Linearity of calibration curves and limits of detection and quantitation 91
3.2.2 Accuracy 94
3.2.3 Precision 95
3.3 Amount of skin-lightening agents detected in skin-lightening products 98
3.4 Validation of ICP-OES and CV-AAS methods 105
3.4.1 Linearity of calibration plots for heavy metal analysis 105
3.4.2 Accuracy 107
3.5 Levels of mercury and heavy metals detected in skin-lightening products 109
3.6 Sytemic exposure dosage and margin of safety 111
Chapter 4 119
CONCLUSIONS AND RECOMMENDATIONS 119
REFERENCES 124
APPENDIX A: MATERIALS 141
APPENDIX B: EQUIPMENT 143
APPENDIX C: CALIBRATION DATA FOR SKIN-LIGHTENING AGENTS 145
APPENDIX D: CALIBRATION GRAPHS AND RESIDUAL PLOTS FOR SKIN-LIGHTENING AGENTS 149
APPENDIX E: HPLC CHROMATOGRAMS OF STANDARD MIXTURES OF SKIN-LIGHTENING AGENTS AND SKIN-LIGHTENING PRODUCTS 157
APPENDIX F: RAW DATA FOR SKIN-LIGHTENING PRODUCTS 179
APPENDIX G: CALIBRATION DATA FOR HEAVY METALS 182
APPENDIX H: CALIBRATION CURVES AND RESIDUAL PLOTS FOR
HEAVY METALS 186

xiii
LIST OF FIGURES
Figure 1.1. Synthesis of melanins
Figure 1.2: Chemical structures of common skin-lightening agents
Figure 1.3: Chemical structures of topical steroids mostly present in skin-lightening
products
Figure 1.4: Chemical structures of some imidazole fungicides
Figure 1.5: Photographs of patients diagnosed with various skin conditions arising from
the improper use of skin-lightening products
Figure 2.1: Components of an HPLC instrument
Figure 2.2: Relative energies of orbitals and the types of electronic transitions
Figure 2.3: Schematic of a double-beam UV-visible spectrophotometer
Figure 2.4: A photograph of the PerkinElmer Lambda 25 double-beam UV-visible
spectrophotometer used for measuring the UV spectra of the selected SLAs
Figure 2.5: UV spectrum of 5 mg L-1 clobetasol propionate (CP) dissolved in methanol
Figure 2.6: UV spectrum of 5 mg L-1 betamethasone dipropionate (BD) dissolved in
methanol
Figure 2.7: UV spectrum of 10 mg L-1 clotrimazole (CT) dissolved in methanol
Figure 2.8: UV spectrum of 5 mg L-1 hydroquinone (HQ) dissolved in methanol
Figure 2.9: UV spectrum of 5 mg L-1 benzoquinone (BQ) dissolved in methanol
Figure 2.10: UV spectrum of 5 mg L-1 kojic acid (KA) dissolved in methanol
Figure 2.11: UV spectrum of 5 mg L-1 niacinamide (NC) dissolved in methanol
Figure 2.12: UV spectrum of 5 mg L-1 arbutin (ARB) dissolved in methanol

xiv
Figure 2.13: A photograph of the Shimadzu Prominence UFLCXR instrument used for
the determination of skin-lightening agents in this study
Figure 2.14: A photograph of the Mars 6 microwave digestion device and the XP-1500
TFM reaction vessels used for digestion of skin-lightening samples in this
study
Figure 2.15: Schematic of an ICP-OES instrument
Figure 2.16: A photograph of the PerkinElmer Optical 5300 DV Simultaneous ICP-OES
device used for determination of heavy metals in this study
Figure 2.17: Schematic of the PerkinElmer MHS 15 mercury hydride pneumatic system
Figure 2.18: A photograph of the PerkinElmer MHS 15 mercury hydride system
connected to the PerkinElmer Analyst 200 atomic absorption spectrometer
instrument and gas supply during mercury determination in this study
Figure 3.1: Chromatogram for the separation of active ingredients CP, BD and CT
Figure 3.2: Comparison of the UV–visible spectra of other SLAs with those of the
unknown analytes
Figure 3.3: Chromatogram for the separation of active ingredients NC, KA, HQ, BQ and
ARB
Figure 3.4: Optimisation of four different solvents for the extraction of CP, BD, CT, HQ,
BQ, KA, NC, and ARB
Figure 3.5: Prevalence of skin-lighting agents detected in the investigated products
Figure 3.6: Levels of SLAs detected in the studied SLPs compared to their cost

xv
LIST OF TABLES
Table 1.1: Fitzpatrick sun-reactive Skin Types
Table 1.2: Some tyrosinase inhibitors derived from synthetic and natural sources
Table 2.1: List of skin-lightening products investigated in this study
Table 2.2: The wavelength of maximum absorption for each skin-lightening agent
obtained by UV-visible spectrophotometry
Table 2.3: Emission wavelengths used for analysis of heavy metals by ICP-OES
Table 2.4: Details of the solution preparation in 50 mL volumetric flasks for validation of
heavy metal and mercury analyses
Table 3.1: Retention times and detection wavelengths for the skin-lightening agents
Table 3.2: Results of the linear regression analysis of the calibration curves for the
skin-lightening active ingredients analysed by HPLC
Table 3.3: Percentage recoveries of skin-lightening active ingredients
Table 3.4: Determination of precision for intra-day and inter-day variability
Table 3.5: Levels of active ingredients detected
Table 3.6: Results from the linear regression analysis of the calibration data for heavy
metals
Table 3.7: Results from the linear regression analysis of the calibration data for the
determination of mercury
Table 3.8: Recovery data for heavy metal quantification in skin-lightening products
Table 3.9: Levels of heavy metals detected in different samples of skin-lightening
products analysed in this study
Table 3.10: Systemic exposure dosage values of metals in skin-lightening products for
100% dermal absorption

xvi
Table 3.11: Margin of safety values of metals in skin-lightening products for 100%
dermal absorption

Chapter 1
INTRODUCTION AND LITERATURE REVIEW
Skin-lightening, or in other words, skin-whitening, or skin-bleaching, has become a
global concern. Among the possible ways of achieving a lighter skin is through the use
of cosmetic skin-lightening products (SLPs), which can take many forms, including
creams, ointments, solutions, and gels. The active ingredients in these products act on
the tyrosinase enzyme to prevent melanin formation. Melanin, a major dark pigment
found in the skin, hair and eyes, serves to provide protection against harmful ultraviolet
radiation capable of causing photoaging and photocarcinogenesis (1, 2). Consequently,
these products are aimed at modulating melanogenesis in order to control unwanted skin
pigmentation such as freckles, melasma, age spots, acne, scars, or discoloration related to
hormones, and most of all to lighten naturally dark skin. However, the use of SLPs does
come with some risk. Several active ingredients in SLPs have been shown to be effective
and non-detrimental, while some have proven to be toxic or have a questionable safety
profile, adding to the controversy surrounding their use and impact on certain ethnic
groups.
In Nigeria, the use of SLPs to lighten skin is common especially among women. The
perception of a light skin signifying beauty, grace and high social ranking, encourages
most women to indulge in the use of SLPs. The use of these products cuts across all
sociodemographic characteristics, including religious groups, rich or poor, single or
married, literate or illiterate. But, unfortunately, most of these women end up indulging
in SLPs that bleach the skin, and they neglect any form of injury to their bodies or threat
to their health. A myriad of these products contain different kinds of skin-lightening
agents (SLAs) that after prolonged use may eventually affect the users’ health through
dermal absorption. These include formulations containing mercury, corticosteroids, and
hydroquinone. However, the list of SLAs has now expanded as a result of some
manufacturers introducing new chemicals of unknown safety profile such as kojic acid,
niacinamide, arbutin, triethanolamine and many more. In addition, there have been
reports (3-6) on the presence of heavy metals, such as Cd, Cr, Cu, Ni, and Pb, in a variety

2
of cosmetic products including SLPs. Since heavy metals bioaccumulate, they too can
exert toxic health effects.
The source of danger arises as a result of over exposure to certain chemicals.
Hydroquinone, the gold standard in skin-lightening, is known to cause contact dermatitis,
exogenous ochronosis and dyschromia (7-9). Prolonged use of corticosteroids is
associated with cutaneous, ophthalmologic and endocrinologic complications (10-13).
Continuous exposure to mercury can lead to neurological damage (14). Moreover, it has
been established that diverse health effects, such as kidney, blood vessel and nervous
system damage, miscarriage, infertility in men and women, hormonal changes and
behavioural problems, can be induced by exposure to toxic metals (15).
The cosmetic safety regulations of the European Union (EU) have prohibited the use of
hydroquinone in cosmetics, while the United States Food and Drug Administration (US
FDA) proposed a maximum of 1.5-2.0% hydroquinone as an active ingredient in over-
the-counter cosmetics (16). In addition, the US FDA have also stated that mercury should
be less than 1 µg g-1 under good production practice resulting from unavoidable impurities
(16). In spite of several efforts made by various health bodies to increase awareness of
the dangers of skin-bleaching and governmental bans of harmful ingredients, the practice
of skin bleaching and the use of potentially harmful ingredients in SLPs does not seem to
slow down, rather it is ongoing and growing in most African countries and around the
world.
In this study, a number of SLPs were investigated and analysed in an attempt to identify
and quantify the active organic SLAs and heavy metals in them.
1.1 A general overview of skin-lightening practices
From time immemorial and among the different races of people, and in various places
around the world, a myriad of concoctions have been used to lighten the skin. According
to Blay (17), the practice of skin-lightening actually began in Europe and stems from
Queen Elizabeth I’s efforts to make her skin appear ghostly white, and nearly transparent.
This extremely pale skin became known as the Elizabethan ideal of beauty. These ideals
were later carried over to the Americans by female European settlers.

3
Another common propaganda that lead to the practice of skin-lightening was based on the
dichotomy of white versus black and light versus dark as they were, and are still, viewed
as pure and opposite to each other. Glenn (18) explains that the concept of colourism in
southern Africa is among the negative inheritance of European colonialism. The white
supremacy ideology that the European colonists brought associated blackness in natives
with primitiveness, lack of civilisation, unrestrained sexuality, pollution and dirt. This
served as a potent type of threat against black people and also the group of darker skinned
or brown people around the world (18). In order to escape these negative associations in
the form of discrimination and concrete oppression, ill-informed black people strived to
attain a light skin through bleaching and various other ways.
Blay (17) gives the most common reasons provided by Ghanaian and Tanzanian women
for using SLPs. They include to get rid of blemishes and to mitigate the effects of the
sun, to appear and feel clean, to look beautiful, white and European, to please a partner,
grab attention, or attract potential mates, and to impress peers, to appear sophisticated and
modern and to gain economic and social mobility.
With the rise of the internet, companies involved in the skin-bleaching market have
become even more connected and have new easy ways for marketing and distribution of
their products to their consumers via informational networks. Mostly, skin-lighteners are
manufactured in some countries and exported or smuggled into others. For instance, the
distribution of mercury soap has been illegal in the EU since 1989, but its manufacture
has remained legal as long as it is for export only. Although, the government and
manufacturers in those countries know the dangers of mercury, they only focus on making
a quick profit at the expense of people’s health in other nations (18).
According to studies carried out by medical researchers on the prevalence of skin-
lightening practices among African women, they estimate that 25% of women in Bamaki,
Mali; 35% in Pretoria, South Africa; 52% in Dakar, Senegal; and a staggering 77% of
women traders in Lagos, Nigeria (12, 19-21) intentionally use SLPs for cosmetic reasons.
In Asia, India is reported to consume the highest tonnage of bleaching products and in
terms of sheer numbers, Indians make up the largest skin bleaching market. In the
Philippines, 50% of the population are reported to use skin-lighteners, and in places like
Japan, China, Taiwan, and Korea users of skin-lighteners are reported to be within 20 -

4
50%. Likewise, in some parts of Latin America and in the USA, women of all races,
including Europeans, have long legacies of skin-lightening practices (18). These statistics
reiterate that the practice of skin-lightening is not a regional problem, but rather a global
issue of significant concern.
1.2 The human skin
The skin is a complex organ, which covers the entire body surface as a flexible shield
with the primary function to protect the organism and act as a permeability barrier to the
external environment. In terms of chemical composition the skin is made up from about
70% water, 25% proteins and 3% lipids. The remainder includes minerals, nucleic acids,
glycosamines, proteoglycans and other chemicals (22). The skin serves numerous
protective functions (23):
Ø A chemical barrier in two directions: controlling the loss of water, electrolytes,
and other body constituents while barring the entry of harmful or unwanted
compounds from the environment.
Ø A radiation barrier against ultraviolet (UV) light as a result of the production of
melanin by the melanocytes in the basal layer upon ultraviolet light stimulation.
Ø A microbiological barrier preventing the penetration of microorganisms through
the intact stratum corneum.
Ø The skin is responsible for regulating the temperature of the body at
approximately 37°C.
The skin is made up of two layers: the outer epidermis and the underlying dermis. They
form a barrier that ranges in thickness from 0.8 mm on the palms and soles to 0.06 mm
on the eyelids (23). The basement membrane is what separates the epidermis and the
dermis.
The epidermis, as the outermost layer of the skin, provides the initial barrier of protection
from the invasion of foreign substances into the body (24). The epidermis consists of a
stratified squamous epithelium with an underlying basement membrane. The most

5
important cells of the epidermis are the keratinocytes. Other constituents of the normal
epidermis are Langerhans cells, melanocytes, Markel cells and sporadic T-lymphocytes.
The dermis, which is 2-3 mm thick, contains numerous structures including blood vessels,
nerves, hair follicles, smooth muscle, glands and lymphatic tissue. The main cell types
of the dermis are fibroblasts, macrophages, and mast cells. Fibroblasts are responsible for
secreting collagen, elastin, and proteoglycans that give the support and elasticity of the
skin. Both the cells and the matrix have an influence on the rate and extent of
differentiation of the keratinocytes and the formation of the epidermal layer (25, 26).
Below the dermis is a subcutaneous layer, which is the third layer and composed mainly
of adipocytes (fat cells) arranged in lobules, fibroblasts, lymphocytes and mast cells.
Although this layer is not technically part of the skin, it plays an integral role by acting as
a heat insulator, mechanical cushion and stores readily available high energy
chemicals(23, 26).
1.2.1 Variation in skin colour
The human skin ranges in variety from the darkest brown to the lightest pinkish-white
hues. Primarily, the evolvement of skin pigmentation in humans is to regulate the amount
of ultraviolet radiation (UVR) penetrating the skin and, thus, modify its biochemical
effects (27). There is a direct correlation between the geographical distribution of UVR
and the distribution of indigenous skin pigmentation around the world. Areas that receive
a higher amount of UVR, generally located closer to the equator, tend to have a darker-
skinned population. Areas that are far from the tropics and closer to the poles have a
lower intensity of UVR, which is reflected in the lighter skinned population (28).
A person’s natural skin colour has an impact on their reaction to the sun. Generally, darker
skin colour burns less and has a better ability to tan, whereas pale skin or white skin burns
easily and tans slowly and poorly (29). The biggest difference resulting from sun
exposure is visible in moderately brown skin, the change is dramatically visible as tan
lines, where part of the skin which is tanned is delineated from unexposed skin (30). The
Fitzpatrick classification of skin-photo types based on sunlight sensitivity is shown in
Table 1.1.

6
Table 1.1: Fitzpatrick sun-reactive skin types (31).
Skin type Natural skin colour
Skin reaction to solar radiation
Examples
I Pale white Always burns, peels and never tans.
People with blue eyes, often freckled. Northern European/British.
II Fair white Burns easily, peels and tans minimally.
People with red or blonde hair, blue eyes. European/Scandinavian.
II Light brown Burns moderately, tans uniformly.
People with brown eyes, dark hair. Southern or central European.
IV Moderate brown Burns minimally, tans easily.
People with dark brown hair, dark eyes. Mediterranean, Asian or Latino.
V Dark brown Rarely burns, tans easily and substantially.
People with dark eyes, dark hair. East Indian, Native American, Latino or Africa.
VI Black Almost never burns, tans readily and profusely.
Dark eyes, dark hair. African or Aboriginal ancestry.
Skin-types I-III are melanocompromized. These skin types have a risk of developing skin
cancer following sun exposure. On the other hand, skin types IV-VI, which are
melanocompetent, have a tendency to an overactive production of melanin following sun
exposure, which can lead to melasma. Therefore, all skin-types advisedly should use
appropriate sunscreens to protect themselves from harmful UV rays due to the serious
damage induced by extreme sun exposure, such as uneven skin tone, premature ageing,
and possible skin cancers.
Other skin classification systems are based on factors such as lipid content and hydration
of the skin, rather than the sensitivity to sunlight or the effect of UV radiation. In the
report by Mercurio et al. (32), they scientifically classify skin into six types based on
secretory characteristics. These include eudermic (healthy skin), oily, alipic, hydrated

7
and combination. Skin-types can change over time. An instance is younger people being
more likely to have a normal skin than older people.
1.3 Melanin and pigmentation
Melanin is a large bio-aggregate composed of subunits of different pigment species
formed by oxidation and cyclisation of the amino acid tyrosine. Skin complexion and
UV-sensitivity is determined by the amount and type of epidermal melanin (33-35).
Melanin exists in two main chemical forms, eumelanin, a dark pigment found abundantly
in the skin of heavily pigmented individuals, and pheomelanin, a light-coloured sulfated
pigment resulting from the incorporation of cysteines into melanin precursors (36). The
efficiency of eumelanin to block UV photons is greater than that of pheomelanin,
therefore the more eumelanin in the skin, the less UV-permeable is the epidermis (37).
The levels of pheomelanin are similar between dark-skinned and light-skinned
individuals, and it is the amount of epidermal eumelanin that determines skin complexion,
UV sensitivity and cancer risk (38).
Over production or too little production of melanin brings about uneven pigmentation
known as skin pigmentation disorder. Overproduction of melanin brings about
hyperpigmentation, often referred to as melasma, chloasma or solar lentigines (39).
Melasma is a general term describing darkening of the skin. Chloasma is generally used
to describe skin discolouration caused by hormones. These hormonal changes are usually
the result of pregnancy, birth control pills or oestrogen replacement therapy. Solar
lentigines are the technical term for darkened spots on the skin caused by the sun. Solar
refers to sunlight and lentigines describes a darkened area of skin. These spots are most
common in adults with a long history of unprotected sun exposure. Hyperpigmentation,
aside from sun exposure and hormones, can also be trigged by skin damage such as
remnants of blemishes, wounds or rashes. This is usually observed with darker skin tones
(40).
The inability of melanocytes to produce melanin or properly transport melanosomes
results in hypopigmentation. Vitiligo is an example of hypopigmentation, which is
characterised by patches of unpigmented skin (often surrounded by a heavily pigmented

8
border). Vitiligo affects all skin types and is generally considered a cosmetic condition,
but it can cause significant psychological distress, particularly to some black patients (41).
Despite the controversy surrounding the use of SLPs, they have shown to effectively
correct specific zones of abnormal high pigmentation on the skin. Thus, SLPs can help
remove a tan or discoloration due to some pigments in the top layer of the skin, but cannot
make a dark person fair (42).
1.3.1 Biosynthesis of melanin
The initial step of melanin biosynthesis begins from either the hydroxylation of L-
phenylalanine to L-tyrosine (noncompulsory step, operative in vivo) or directly from L-
tyrosine which is then hydroxylated to L-dihydroxyphenylalanine (L-DOPA), which is an
obligatory step both in vitro and vivo. L-DOPA serves as a precursor to both melanins
and catecholamines, acting along separate pathways (Figure 1.1). Oxidation of L-DOPA
to dopaquinone, represents the next step, which is common to both eu- and
pheomelanogenic pathways (43).
Further transformation of dopaquinone to leukodopachrome, followed by a series of
oxidoreduction reactions with the production of the intermediates dihydroxyindole (DHI)
and DHI carboxylic acid (DHICA), that undergo polymerization to form eumelanin, is
referred to as eumelanogenesis (44, 45). Pheomelanogenesis also begins with dopaquine;
this is conjugated to cysteine or glutathione to yield cysteinyldopa and glutathionyldopa,
which further transform into pheomelanin (43, 44). Eu- and pheomelanin are contained
in mixed melanin. L-DOPA generation of catecholamines requires its enzymatic
decarboxylation, hydroxylation, and methylation to produce dopamine, norepinephrine,
and epinephrine, respectively. All of these catecholamines can potentially convert into
neuromelanin through several oxidation/reduction reactions in vitro (Figure 1.1) (35). In
vivo, the only primary precursors to pigment are dopamine and cysteinyldopamine (46-
48). Thus, melanin pigments have a similar arrangement of several units linked by
carbon-carbon bonds, but the chemical composition, structural and physical properties
differ from each other (43, 44).

9
Figure 1.1. Synthesis of melanins. Adapted from (35).
GSH, glutathione; Cys, cysteine. 1: phenylalanine hydroxylation; 2: tyrosine hydroxylation; 3: DOPA oxidation; 4: dopachrome tautomerization; 5a: DHICA oxidation; 5b: DHI oxidation; a: hydrolysis of glutathionyldopa; b: oxidation of cysteinyldopa; c: intramolecular cyclization of cysteinyldopaquinone; I: DOPA decarboxylation; II: hydroxylation of dopamine; III: methylation of norepinephrine.
b
a
c
1
2
5b 5a
4
3
CO2
I
III
II OH
CH3
CO2
+Cys
+GSH
NH2
COOH
NH2
COOH
OH
NH2
COOH
OH
OH
O
ONH2
COOH
N
OH
OHN
OH
OH
COOH
NH
O
O
NH
O
O COOH
PHEOMELANIN MIXEDMELANIN EUMELANIN
COOH
NH2
OH
OH
SG
COOH
NH2
OH
OH
SG
O
ONH2
COOH
SNH2
COOH
O
ONH2
COOH
S NH2
COOH
COOH
NH2
OH
OH
SNH2
COOH
COOH
NH2
OH
OH
S NH2
COOH
NH2
COOH
N
S
COOH
NH2
COOHN
S
COOH
OH
OH NH2
OH
OH NH2
OH
OH
OH NHCH3
OH
NEUROMELANIN

10
1.3.2 Melanin pathway inhibitors (tyrosinase inhibitors)
Different steps of the melanin pathway can be interrupted, depending on the mechanistic
reaction of the inhibitors involved (49). The most common approach in skin-lightening
is the inhibition of the enzymatic reaction of tyrosinase (49, 50). The active compounds
used in cosmetic products and traditional preparations to inhibit melanin production are
either of synthetic, natural or botanic sources.
SLAs can be classified into four types depending on the mechanism of tyrosinase
inhibition. These include competitive inhibitors, uncompetitive inhibitors, mixed type
(competitive/uncompetitive) inhibitors and non-competitive inhibitors (51). Table 1.2
lists several tyrosinase inhibitors and gives their classification. A competitive inhibitor
tends to combine with a free tyrosinase and therefore hinders substrate binding. A
competitive inhibitor could be tyrosinase-substrate analogues, copper ion chelators, or
derivatives of L-tyrosinase or L-Dopa. An uncompetitive inhibitor binds only to the
tyrosinase-substrate complex. The mixed-type inhibitor binds with both a free tyrosinase
and the tyrosinase-substrate complex. The equilibrium binding constants for free
tyrosinase and the tyrosinase-substrate complex differ for most mixed-type inhibitors.
For non-competitive inhibitors, the free tyrosinase and the tyrosinase-substrate complex
can bind with the same equilibrium constant (51).

11
Table 1.2: Some tyrosinase inhibitors derived from synthetic and natural sources.*
Synthetic sources Natural sources Inhibitor Type of
inhibition Inhibitor Type of
inhibition
Benzoic acid Mixed Arbutin Competitive
Benzaldehyde Noncompetitive Aloesin Noncompetitive
Cupferron Competitive Anacardic acid Competitive
Cinnamaldehyde Noncompetitive Anisaldehyde Noncompetitive
Cinnamic acid Mixed Anisic acid Uncompetitive
Captopril Noncompetitive Agaritine Uncompetitive
Citral Noncompetitive Cumic acid Noncompetitive
Dimethyl sulfide Competitive Cuminaldehyde Noncompetitive
Methimazole Mixed p-Coumaric acid Mixed
Kojic acid Mixed (-) Epicatechin-3-O-gallate (ECG)
Competitive
L-Mimosine Competitive (-) Epigallocatechin-3-O-gallate (EGCG)
Competitive
Tiron Competitive 3,4-Dihydroxycinnamic acid
Noncompetitive
Tropolone Competitive Oxyresveratrol Noncompetitive
2-Methoxycinnamic acid
Noncompetitive Kaempferol Competitive
3-Methoxycinnamic acid
Noncompetitive Trans-cinnamaldehyde
Competitive
4-Methoxycinnamic acid
Noncompetitive 4-Hydroxy-3- methoxycinnamic acid
Noncompetitive
4-Substituted benzaldehydes
Competitive 9-Hydroxy-4-methoxypsoraln
Noncompetitive
4-Substituted resorcinol
Competitive 5-Hydroxymethyl-2-furfural
Noncompetitive
p-Hydroxybenzaldehyde
Competitive
*Adapted from (52).

12
However, competitive inhibitors of tyrosinase are the most commonly used skin-
lightening agents. They include phenolic compounds, non-phenolic compounds and the
combination formula (53). Phenolic compounds consist of compounds such as
hydroquinone and its derivatives, for example, monobenzyl ether of hydroquinone,
phenol and its compounds such as 4-methoxyphenol, 4-isopropylcatechol, 4-
hydroxyanisol, and N-acetyl-4-S-cystaininylphenol. Kojic acid, azelaic acid, N-
acetylcysteine, tretinoin, and L-ascorbic acid represent the non-phenolic compounds. The
combination of hydroquinone and various other active lightening agents in different
concentrations often describe the combination formula. The combination formulas often
used are Kligman’s formula (hydroquinone 5%, tretinoin 0.05–0.1%, dexamethasone or
betamethasone valerate 0.1% in hydro-alcoholic base cream or ointment base), Pathak’s
formula (2% hydroquinone, tretinoin 0.05–0.1% in hydro-alcoholic base cream or
ointment base) and Westerhofs formula (N-acetylcysteine 3%, hydroquinone 2%,
hydrocortisone 1% in ointment base) (53). Other active compounds that have proven to
have a strong inhibitory effect on melanin synthesis include resorcinol and its derivatives
(4-butylresorcinol, 4-phenyl-ethylresorcinol), steroids and mercury (10, 50, 52, 54).
Furthermore, a myriad of plant extracts contain active compounds mainly flavonoids,
gentisic acid, niacinamide, licorice, arbutin, aleosin and polyphenols, that have shown to
inhibit melanogenesis, without melanocyte cytotoxicity or mutagenicity (55).
1.4 Skin-lightening agents
Currently, there are a plethora of skin depigmentation formulations available
commercially which contain one or several active compounds. They may serve as
prescription drugs and over-the-counter products. Others tend to be uncontrolled,
traditional or prohibited products. Most skin-lightening formulations contain a
combination of compounds in order to provide better potency via supplementary or
synergistic actions. These include compounds like hydroquinone, mercury,
corticosteroids, kojic acid, arbutin and many more. These agents expose users to certain
additional health risks since the comparative clinical efficacy and safety regulations of
the agents are not usually met (9). The following is a review of the most used and popular

13
SLAs reported in the literature, their known mechanism of action and potential side-
effects. The structures of these compounds are shown in Figure 1.2.
1.4.1 Hydroquinone
Hydroquinone (structure shown in Figure 1.2) is known to be a dihydric phenol with two
derivatives, viz. monobenzyl and monomethyl ether of hydroquinone (40). It is also
known under different synonyms such as benzohydroquinone, p-benzenediol, 1,4-
dihydroxybenzene, β-quinol, 1,4-diol/quinol, 1,4-benzenediol, p-hydroxyphenol, p-
dioxobenzene, hydrochinone or tecquinol. Hydroquinone occurs naturally in tea, red
wine, coffee beans, wheat and leaves of berries. Despite the inconsistent effects and
safety concern of hydroquinone, it is still the most prescribed SLA worldwide and is the
gold standard for skin-lightening (31, 56-59). Hydroquinone was initially believed to act
mainly by inhibition of tyrosinase due to its structural analogy to melanin precursors (60).
But, the inhibition of DNA and RNA synthesis, degradation of melanosomes and
destruction of melanocytes, are other putative mechanisms of hydroquinone action (61).
The clinical efficacy of hydroquinone is gauged based on its concentration, nature of the
vehicle and stability of the formulation. It is mostly used at a concentration of 1.5-5%
(9). Several clinical studies have established the beneficial therapeutic effect of
hydroquinone in the treatment of melasma and other pigmentary disorders. In a report,
2% of hydroquinone was found to produce a decrease in hyperpigmentation, which was
as good to excellent in 14-17% of treated patients (62-64). Hydroquinone at high
concentration showed more effectiveness but there were associated augmented side-
effects, consisting mainly of irritation at the sites of application (53). The inclusion of
antioxidants, in the form of sodium bisulfate or ascorbic acid, enhance the stability of
hydroquinone by minimising its oxidation (53). Hydroquinone undergoes oxidation to
benzoquinone. Both hydroquinone and benzoquinone are metabolites of each other, these
makes the toxicity observed with one of the two also relevant for the other, although it
may vary in potency (65). Hence, SLPs which contain hydroquinone may very likely
contain benzoquinone as a result of auto-oxidation when exposed to air or dissolved in
aqueous solution.

14
In Europe, most available commercial formulations contain 2% hydroquinone, which is
considered safe and effective (53). High concentrations of hydroquinone are highly
discouraged due to its side-effects (9). The US FDA proposed a maximum of 1.5-2.0%
hydroquinone as an active ingredient in over-the-counter cosmetics, while the National
Food and Drug Agency of Nigeria (NAFDAC) had initially allowed a maximum of 2%
hydroquinone in lightening creams in Nigeria, but later banned hydroquinone due to the
side-effects associated with prolonged usage and non-compliance with safety regulations
(40). Likewise, the use of hydroquinone in over-the-counter SLPs is also completely
banned in South Africa (66)
Prolonged and high concentrations of hydroquinone usage have proven to cause multiple
cutaneous and systemic-side effects (67). Irritant contact dermatitis is the most common
acute complication of hydroquinone, followed by post-inflammatory hyperpigmentation,
hypopigmentation, and allergic contact dermatitis (67-69). Chronic exposure to
hydroquinone results in nail discolouration (70-72), or pseudo yellow nail syndrome (40).
Other side-effects include conjunctival pigmentation (73), corneal melanosis and
degeneration (7, 73, 74), decreased skin elasticity (40), peripheral neuropathy (75),
impaired wound healing, and wound dehiscence (40, 76), specifically after abdominal
surgeries such as caesarian section or hysterectomy. Trimethylaminuria or fish odour
syndrome is another unique side-effect of chronic hydroquinone use. It is characterised
by a rotten fish body odour caused by excretion of trimethylamine in the saliva, sweat,
urine, and vagina (77).
The most severe complication of chronic hydroquinone use is known as exogenous
ochronosis (67, 78), with at least 789 reported cases, 756 of which occurred in Africa
(79). Ochronosis can exist both in the form of endogenous and exogenous. Endogenous
ochronosis is related to alkaptonuria, an autosomal recessive disorder which is
characterised by the absence of homogentisic acid oxidase in 1 out of 25,000 of the
population (80), while exogenous ochronosis is attributed typically to hydroquinone-
containing compounds (67, 78). Pick (81) reported the first case of exogenous ochronosis
in 1901, in a patient with prolonged exposure to phenols. The first cases of hydroquinone
induced exogenous ochronosis were reported in 1975 by Findlay and colleagues (78), in
35 South African Bantu women with high hydroquinone exposure (3.5-7%) for many
years. Exogenous ochronosis is characterised by grey-brown or blue-black macules

15
coalescing into patches, accompanied occasionally by pinpoint, dark brown, and caviar-
like papules (78, 82, 83). Although, several attempts have been made experimentally to
treat exogenous ochronosis, the results have not been satisfactory (84). Occasionally,
hydroquinone discontinuation might undo hyperpigmentation, but this can take several
years (78, 85).
Concern exists on the possible carcinogenicity of hydroquinone but studies need to be
carried out to determine the risk of skin cancer in hydroquinone users (86, 87).
1.4.2 Benzoquinone
Benzoquinone is a poorly water soluble crystalline substance which can be produced in
large amounts by oxidation of aniline or phenol (88). It can also occur naturally in small
amounts in a variety of arthropods as it is excreted and synthesised by many insects (89).
Other synonyms for benzoquinone include cyclohexa-2,5-diene-1,4-dione, 1,4-
benzoquinone, p-benzoquinone, p-quinone or quinone. When present in aqueous
solution, benzoquinone is susceptible to both redox and acid-based transformation,
resulting in the formation of hydroquinone, semiquinone and reactive oxygen species (88,
90, 91).
Studies have shown benzoquinone to be readily absorbed from the gastrointestinal tract
and subcutaneous tissue and excreted partly unchanged and partly as hydroquinone. Most
of it is eliminated as its conjugates (88, 92). Results emanating from various animal
studies described benzoquinone to be a skin sensitizer. It was reported to induce skin
lesions and irritation when injected subcutaneously in guinea pigs (93). The acute toxicity
carried out on animals indicates various neurological symptoms, including loss of
reflexes, writhing and paralysis of the hind limbs (94, 95). In humans, high level exposure
of benzoquinone in air may result in irritation of the eyes (94, 96) while dermal exposure
may result in discolouration, dermatitis, severe irritation, erythema, swelling, and the
formation of papules and vesicles (97, 98). The carcinogenicity studies of benzoquinone
still remain unsatisfactory, although benzoquinone is classified in category 3B for
carcinogenicity and cell germ mutagenicity in Germany (65). The America Conference
of Governmental Industry Hygienists (ACGIH) established in 2001 a threshold limit

16
value (TLV) for exposure to benzoquinone of 0.44 mg m-3 as the 8 hours time weighted
average (94).
1.4.3 Kojic acid
Kojic acid is a hydrophilic fungal derivative obtained from aspergillus and penicillium
species, and is chemically known as 5-hydroxymethyl-4H-pyrane-4-one. It is used as an
antioxidant by the cosmetics industry and is the second most effective over-the-counter
SLA used as an alternative to hydroquinone in skin-lightening. It is also a popular agent
used for the treatment of melasma (99). Despite being purported to have skin-lightening
credentials, it is not currently approved by the US FDA for such use in over-the-counter
pharmaceutical products (100).
Kojic acid is found to be a skin sensitizer and has proven to be mutagenic in cell culture
studies (54). It is characterised by the ability to prevent tyrosinase activity by binding to
copper (101). According to a survey conducted by the Personal Care Products Council
of the United States, kojic acid is used at a concentration ranging from 0.1 to 2%, with
the maximum concentration found in face and neck creams, lotions, and powders. In a
report submitted by Health Canada’s Cosmetics Notification System, 148 products were
found to contain kojic acid, with uses in skin care products (100). It summarized the
concentration ranges for kojic acid use in Canada to be 0.1% or less in 37 products, 0.1
to 0.3% in 11 products, 0.3 to 1% in 34 products, 1 to 3% in 45 products, 3 to 10% in 14
products, and 10 to 30% in 3 products. However, it is widely reported to be used in a
concentration of 1 to 4% in Asia (102).
Based on a margin of safety calculation, the European Commission’s Scientific
Committee on Consumer Products (SCCP) concluded that the use of kojic acid at a
maximum concentration of 1% in skin care formulations poses a risk to human health due
to its potential systemic effects (100).

17
Hydroquinone Retinol
Benzoquinon Tretinoin
Kojic acid Tazarotene
Niacinamide Resorcinol
Arbutin Aleosin
Mequinol Soy protein
Glycolic acid Flavonoid
Azelaic acid Monobenzyl ether of hydroquinone
Figure 1.2: Chemical structures of common skin-lightening agents. Adapted from http://www.chemicalbook.com/ (Accessed on 28 June 2016).
OH
HO
O
S
N
OO
HO
OH
O
O
HOOH
O
O
OH
OH
OH
O
HO
HO
N
O
NH2
OOH
HOO
OO
OHOH
OHHO
O OH
OHOHOOH
H3C
O
OH
O CH3
O
OHO
HO
R2R1
OHO
OB
A C
OHO
18
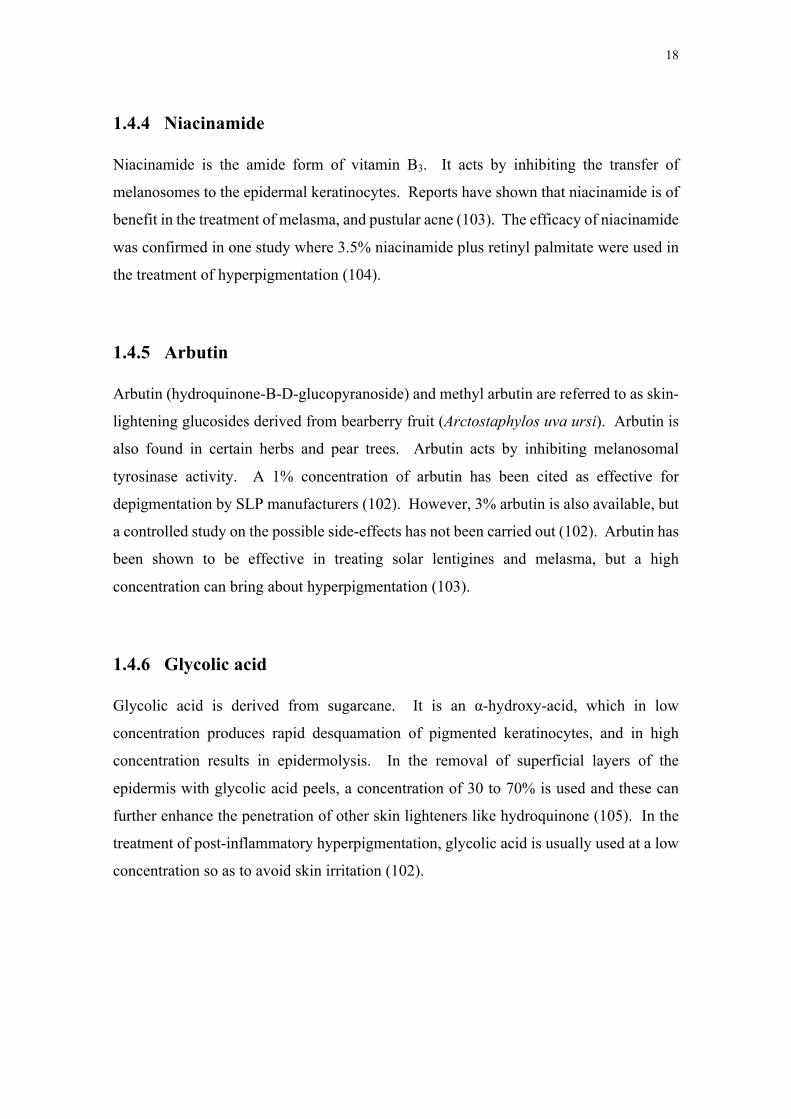
1.4.4 Niacinamide
Niacinamide is the amide form of vitamin B3. It acts by inhibiting the transfer of
melanosomes to the epidermal keratinocytes. Reports have shown that niacinamide is of
benefit in the treatment of melasma, and pustular acne (103). The efficacy of niacinamide
was confirmed in one study where 3.5% niacinamide plus retinyl palmitate were used in
the treatment of hyperpigmentation (104).
1.4.5 Arbutin
Arbutin (hydroquinone-B-D-glucopyranoside) and methyl arbutin are referred to as skin-
lightening glucosides derived from bearberry fruit (Arctostaphylos uva ursi). Arbutin is
also found in certain herbs and pear trees. Arbutin acts by inhibiting melanosomal
tyrosinase activity. A 1% concentration of arbutin has been cited as effective for
depigmentation by SLP manufacturers (102). However, 3% arbutin is also available, but
a controlled study on the possible side-effects has not been carried out (102). Arbutin has
been shown to be effective in treating solar lentigines and melasma, but a high
concentration can bring about hyperpigmentation (103).
1.4.6 Glycolic acid
Glycolic acid is derived from sugarcane. It is an α-hydroxy-acid, which in low
concentration produces rapid desquamation of pigmented keratinocytes, and in high
concentration results in epidermolysis. In the removal of superficial layers of the
epidermis with glycolic acid peels, a concentration of 30 to 70% is used and these can
further enhance the penetration of other skin lighteners like hydroquinone (105). In the
treatment of post-inflammatory hyperpigmentation, glycolic acid is usually used at a low
concentration so as to avoid skin irritation (102).

19
1.4.7 Mequinol
Mequinol is chemically known as 4-hydroxyanisole, methoxyphenol, or monomethyl
ether of hydroquinone. It is a substrate for tyrosinase; it acts as a competitive inhibitor in
the formation of melanin precursors but the exact mechanism of action accounting for its
skin-lightening attributes is unknown. It is the primary lightening alternative to
hydroquinone approved for use in Europe and the United States. In the United States,
mequinol is available at 2% concentration and can only be sold as a prescribed skin-
lightener in combination with 0.01% tretinoin. Unlike hydroquinone, mequinol does not
damage the melanocyte but has been noticed to cause longstanding depigmentation,
though, this longstanding depigmentation generally repigments with time (54).
1.4.8 Azelaic acid
Azelaic acid is regarded as a naturally occurring non-phenolic, saturated, 9-carbon
dicarboxylic acid. It is isolated from cultures of pityrosporum ovale and is associated
with the hypomelanosis seen in tinea versicolor (53). In vitro, azelaic acid interferes with
the function of tyrosinase and may also inhibit DNA synthesis and mitochondrial
oxidoreductase (106), but does not seem to affect normal melanocytes (107).
Therapeutically, azelaic acid has shown to have beneficial effects in acne and vulgaris
and certain pigmentary disorders, such as melasma and lentigo maligna (53). In the
treatment of melasma and post-inflammatory hyperpigmentation, azelaic acid is used at
a concentration of 15 to 20% (108). At these concentrations, azelaic acid is tolerated in
humans, but mild pruritus, transient erythema, irritation and scaling tend to be its adverse
reactions (107, 102).
1.4.9 Retinoids (Topical)
Retinoids such as tretinoin and retinol are obtained from vitamin A. The efficacy of these
products has been proven in the treatment of melasma, post-inflammatory
hyperpigmentation, and other pigmentation disorders (102). Retinoids have been used as
pigment lightening agents both directly and indirectly. For direct improvement in skin

20
pigmentation, the prescribed retinoids are tretinoin and tazarotene (109, 110). Retinol
compared to tretinoin or tazarotene is less effective and less irritating. Retinol is mostly
found in a variety of moisturisers and anti-aging products sold over the counter (102).
Retinol has been shown to convert to retinoic acid in the skin in a two-step oxidation
process (111). The main challenge to retinol formulations is its lack of stability at high
concentration (54) .
Retinoids when use indirectly to lighten dyspigmentation serve as penetration enhancers.
A side-effect of retinoids is irritant dermatitis which is characterised by erythema,
dryness, and scaling (112, 113). These cutaneous changes damage the skin barrier,
allowing easy penetration of other pigment-lightening agents such as hydroquinone and
mequinol, to the melanocytes.
1.4.10 Resorcinol
Resorcinol and its derivates, such as rucinol (4-n-butylresorcinol), are known tyrosinase
and TRP-1 inhibitors (50). They are considered as antibacterial, anti-acne and potent
topical disinfectants in a concentration of 1 - 3%. In the treatment of moderate to severe
facial dyschromia, acne, oily skin, texturally rough skin, fine wrinkle and
pseudofolliculitis, 14% resorcinol is often combined with 14% salicylic acid and 14%
lactic acid (114). A prolonged exposure to resorcinol can lead to thyroid dysfunction
(115). Resorcinol is banned in over-the-counter SLPs in South Africa (66).
1.4.11 Aleosin
Aleosin, a low-molecular-weight glycoprotein, is derived from the aloe vera plant. It acts
by inhibiting tyrosinase by competitive inhibition at the dihydroxyphenylalanine
oxidation site (116, 117). Unlike hydroquinone, it is not characterised by cell
cytotoxicity. Due to its hydrophilic nature, it has limited ability to penetrate the skin.
Aleosin is commonly used in combination with arbutin or deoxyarbutin, and, these
combinations have shown to decrease tyrosinase activity through several different
mechanisms (54).

21
1.4.12 Soy proteins
Soy protein is a commonly used SLA in cosmeceutical moisturisers (54). It contains
small serine proteases such as Bowman Brik inhibitor (BBI) and Soybean trypsin
inhibitor (STI) which inhibit the protease activated receptor-2 (PAR-2) pathway
expressed on keratinocytes (118). The PAR-2 pathway, can be inhibited after 3 weeks of
raw soy milk application (54), resulting in diminished melanin transfer (119, 120). Thus
far, soy extract has been shown to have minimal side-effects and has an excellent safety
profile (54).
1.4.13 Flavonoids
Flavonoids belong to the group of plant polyphenols. They are classified into six major
groups, which include flavanols, flavones, flavonols, flavanones, isoflavones, and
anthocyanidins. Reports have shown flavonoids to inhibit enzymes due to their ability to
chelate copper at the active site (121). In a recent fluorescence quenching study, the
dihydroxy substitutions in both the A and B rings of flavonoids (see Figure 1.2) have been
shown to be crucial in inhibiting tyrosinase activity (122).
1.4.14 Steroids
In dermatology, steroid preparations are pharmaceutical products usually prescribed for
the treatment of inflammatory conditions. They are also called corticosteroids,
glucocorticoids, or “cortisone”. Steroids are referred to as “systemic” if taken by mouth
or given by intramuscular injection, or “topical” if absorbed through the skin. Topical
steroids are categorised as mild, moderate, potent and very potent. Both mild and
moderate topical steroids rarely cause side-effects, while potent and very potent topical
steroids are very toxic as they are more absorbed through the skin and into the blood
system. Betamethasone, clobetasol, fluocinonide, and triamcinolone acetonide are among
the strongest topical steroids found in bleaching creams. They exert their depigmenting
effects by inhibiting epidemic melanogenesis (123). Steroid formulations have been
found to improve therapy for psoriasis conditions when prescribed in a concentration of

22
0.025 to 0.5% (m/m) (124). Sometimes, the efficacy of steroids is increased when
combined with other SLAs. The chemical structures of commonly used topical steroids
are shown in Figure 1.3.
Figure 1.3: Chemical structures of topical steroids mostly present in skin-lightening products. Adapted from http://www.chemicalbook.com/ (Accessed on 28 June 2016).
Betamethasone dipropionate 0.05% Clobetasol propionate 0.05%
Fluocinonide 0.05% Triamcinolone acetonide 0.05%
Betamethasone valerate 0.1% Hydrocortisone valerate 2%
Dexamethasone 0.1% Hydrocortisone 0.05%-2.5%
HHO
H
O
OO
Cl
F
O
HHO
HO
F
OOO
O
O
F
HHO
HO
F
OO
HOO
HHO
HO
F
OOH
O
O
HHO
H
O
F
OHOOH
HHO
H
O
F
O
OO
O
O
HHO
HO
H
O
HOO
O
HHO
H
O
H
OH
OH
O

23
The use of topical steroids is associated with multiple dermatological and systemic side-
effects, especially when used incorrectly (123, 40, 76, 125, 126). Acne vulgaris (12, 76),
allergic contact dermatitis (127, 128), hypertrichosis (76, 126), skin atrophy (129, 11,
130), perioral dermatitis (130), rosacea (40), striae atrophica (12, 11), and telangiectasias
(126, 129), are among the common cutaneous complications associated with topical
steroid application. Topical steroid use is also known to cause systemic complications
such as hypothalamic-pituitary-adrenal (HPA) axis suppression, Cushing syndrome (76,
131, 132), diabetes mellitus (126), and hypertension (133).
Steroid addiction syndrome is the adverse effect from the chronic daily use of a potent
topical steroid, which is associated with intense burning and potentially permanent
erythema due to the withdrawal of vasodilatation. Ophthalmological conditions such as
cataracts and glaucoma, also fall among complications associated with chronic topical
steroid use (40).
1.4.15 Mercury
Mercury is a known melanotoxin. Mercury exists primarily in elemental, or in organic
and inorganic forms. Elemental mercury is mostly used as a liquid metal in thermometers
and is also still used in dental amalgams. Organic mercury compounds like thiomersal,
methylmercury, and ethylmercury are used as preservatives. Mercury salts such as
mercuric amidochloride or ammoniated mercury, mercuric chloride, and mercurous
chloride or calomel are the kind of mercury commonly added to SLPs (134). Mercury is
a highly volatile element with a long atmospheric half-life. As a result of these physical
properties, it is present in every environment and exposure is not an isolated concern but
rather a global concern to human health. In recent years, research has shown that even
chronic exposure to very low concentrations has the ability to cause long-lasting
neurological and kidney impairment (135).
Mercury compounds, when used to lighten skin pigment, have recorded varying success.
The mercury ion is thought to act by inhibiting the synthesis of melanin (136). Inhibiting
melanin production makes the skin more susceptible to skin cancer (137). When mercury
is applied to the skin, it reacts with ultra-violet light and reoxidizes. This leads to more

24
pigmentation and premature ageing. However, further application of mercury in an
attempt to correct the skin will lead to a darker blotchy appearance (40).
Chronic usage of mercury-containing skin-lightening preparations has led to the
deposition of mercury in the body after absorption through the skin, especially in the
tubular region of the kidney, giving rise to the occurrence of severe reactions (138-140).
Studies have shown increased accumulation of mercury in the brain, kidney and liver
tissues of both albino and pigmented mice when absorbed through the skin (141), and it
was found to be highest in the kidney and lowest in the brain (142). Research has also
shown that women using mercury-containing soaps and creams tend to attain mercury
concentrations from 0.03 to 0.15 mg L-1 in their urine. At this concentration, the central
nervous system, and kidneys are at major risk of negative effects, since such effects have
been shown at a concentration of 0.02 to 0.5 mg L-1 (143).
The common cutaneous complications of mercury use are allergic contact dermatitis,
flushing, erythroderma, purpura, nail discolouration, and gingivostomatitis (144, 145,
59). Paradoxic hyperpigmentation is a consequence of the chronic use of mercurial skin
lighteners, which might be caused by dermal deposition of mercury-containing granules
(123). The use of mercury cosmetics during pregnancy has also been shown to result in
prenatal and postnatal intoxication, as mercury can cross the placenta (59). The amount
of mercury applied to the skin is proportional to the amount excreted by the kidney as
shown by Cole and colleagues (146).
1.5 Clotrimazole
Clotrimazole is a broad-spectrum topical antifungal drug which belongs to the azole class.
The azole class can be further subdivided into two classes, namely, imidazole and
triazoles (147). Clotrimazole and other class members, econazole and miconazole (see
Figure 1.4), fall into the imidazole sub-class and can be used for the topical treatment of
tinea pedis (athlete’s foot), tinea cruris and tinea corporis (148). It is also popularly used
in the topical treatment of vulvovaginal and oropharyngeal candidiasis (147).
The mono-preparations of clotrimazole are generally available over-the-counter, but if
present in a combined preparation will necessitate prescription. Clotrimazole is usually

25
at 1% (m/m) in a combined formulation (147). Treatment with a clotrimazole formulation
does not usually exceed one week of application, especially if found in combination with
topical steroids so as to avoid unwanted side-effects. The addition of clotrimazole to
SLPs is very unconventional and should be a cause for concern since SLPs are used over
a long period of time.
The side-effects resulting from clotrimazole application include burning, stinging,
swelling, irritation, redness, pimple-like bumps, tenderness or flaking of the skin (149).
Serious allergic reactions of clotrimazole-containing creams include rash,
itching/swelling (especially of the face, tongue or throat), severe dizziness and troubled
breathing (149).
Clotrimazole Econazole
Miconazole
Figure 1.4: Chemical structures of some imidazole fungicides. Adopted from https://www.google.co.za. (Accessed on 9th December 2016).
N
N
Cl
O
Cl
N
N
Cl
Cl
ClCl
O N
Cl
N
Cl

26
1.6 Heavy metals in cosmetics and their health complications
Heavy metals are any metallic chemical elements that have a relatively higher density of
at least five times greater than that of water (1 g cm-3). They are naturally occurring in
the environment, in rocks, soil, and water. They may also be found in pigments and other
raw materials in all industries with no exception to the cosmetics industry. Examples of
metals considered as heavy metals include antimony, arsenic, bismuth, cadmium,
chromium, cobalt, copper, gallium, gold, iron, lead, manganese, mercury, nickel,
platinum, selenium, silver, tellurium, thallium, tin, uranium, vanadium, and zinc (150).
Heavy metals are naturally occurring in the environment and make their way in trace
quantities into raw materials and finally end up in the finished products we use and
consume every day. These substances enter into the human body mainly through diet,
inhalation, and skin exposure to soil and/or medication. Dermal exposure represents the
most significant route for cosmetic products, as most of the cosmetics are applied directly
on the skin (4, 151).
The intentional use of heavy metals and their compounds as active ingredients in cosmetic
products has been banned by the US FDA unless they occur as impurities (150). Their
presence in products is therefore a cause for concern if not well controlled. Annex 11 of
Directive 76/7681/EEC of the European Union lists more than 1000 chemical substances
that must not be included in the composition of cosmetic products due to their toxicity
(152). In that list, heavy metals such as antimony (Sb), arsenic (As), cadmium (Cd),
chromium (Cr), cobalt (Co), mercury (Hg), nickel (Ni) and lead (Pb) in cosmetics are
banned as they are considered unsafe.
Long-term exposure to heavy metals can result in their accumulation in organisms as they
are difficult to metabolise. From studies, metal ions, when bound to proteins, enzymes,
and nucleic acids, are absorbed and form complexes with the carboxylic acid (-COOH),
amine (-NH2), and thiol (-SH) groups of proteins resulting in malfunctioning or death of
cells (153, 154).
The use of cosmetic products often represents a possible source of long-term exposure to
a myriad of chemicals (155). Some of these ingredients in cosmetic products can
penetrate the skin and reach vital internal organs via the systemic circulation, as they are

27
applied to the skin (156). Unlike other cosmetic products that are applied to restricted
parts of the body, the application of body creams is over the entire body surface, and
hence, exposure to contaminants in these products is much greater (152).
Low-level exposure to Pb can result in disorders such as behavioural abnormalities,
permanent neurological damage, decreased learning and hearing, and may also have
diverse effects on the reproductive, hepatic and renal systems. Cadmium is a cell poison.
It causes several damages, including cell death or an increase in cell proliferation. Due
to the toxic nature of cadmium, it has been categorised as a group 2A carcinogen by the
International Agency for Research in Cancer (IARC) (157).
Arsenic has a pronounced affinity for skin and keratinizing structures including the hair
and nail. Acute overexposure to arsenic can bring about skin eruptions, alopecia and
characteristic striation of the nails (158). Overexposure to antimony and it compounds
can also adversely affect the skin, liver, lungs and cardiovascular system (159).
Other heavy metals such as Cu, Cr, Fe, Ni, Mn and Zn are not completely harmful to
humans as they are involved in many biological processes, even though Cr still has some
controversies surrounding it. For instance, iron plays a vital role in oxygen transport and
storage, and electron transport, in hydrogenase and other redox active enzymes.
Manganese is present in superoxide dismutases and also in catalases. Cobalt, a vitamin
B12 component, is essential in various rearrangement and methylation reactions. Copper
is important in electron transfer (azurin and plastocyanin), oxygen atom transfer
(oxygenases), and also respiration (cytochrome C oxidase). Nickel is required for the
function of acetyl coenzyme synthesis, ureas, and various hydrogenases. Zinc plays an
essential role in many enzymes including anhydrase and a group of proteases, such as
carboxypeptidase A. Zinc is also involved in the transfer of genetic information via the
zinc finger protein. Despite the essential nature of some of these heavy metals to humans
and other organisms, they still can cause serious health challenges when present in
cosmetics products, one of which is an allergy. Chromium, cobalt, and nickel are well-
known allergens, while copper, manganese and zinc are referred to as weak allergens
(152).
In the present study, 12 elements: As, Al, Cd, Co, Cr, Cu, Fe, Hg, Mn, Ni, Pb, and Zn
were investigated for their presence in the studied SLPs.

28
1.7 Dermatological effects of skin-lightening products
The occurring side-effects associated with skin bleaching depend on the nature and
concentration of the SLPs used (15, 11). This is complicated when the actual
concentrations of the active ingredients listed on the product labels are not consistent
(160). Further contributing factors include the concurrent use of several depigmenting
products, application of products over a wide spread of the body, and longtime use of the
products (123). The most reported side-effects include exogenous ochronosis, allergic
contact dermatitis, skin atrophy or thinning, acne, erythema, pigmented colloid milia,
straie atrophicans, nail discoloration, skin peeling and redness, patchy hyperpigmentation
and hypopigmentation, cushing syndrome, pityriasis, bleached panda effect, eczema,
wrinkles, rosacea, and tinea (59). Thus, a knowledge of the concentration of SLAs in
SLPs is essential. In Figure 1.5 are shown some photographs of patients diagnosed with
various skin conditions by dermatologists, arising from the improper use of SLPs.
Figure 1.5: Photographs of patients diagnosed with various skin conditions arising from the improper use of skin-lightening products. (Source: Prof N Dlova, Nelson Mandela School of Medicine).
Permanent ochronosis Acne vulgaris
Patchy pigmentation Permanent stretch marks

29
1.8 Methods of analysis of skin-lightening agents
Before now, mercury and hydroquinone were the most frequently analysed SLAs found
in lightening creams since their side-effects where recorded first. Currently, a myriad of
SLPs containing newly introduced SLAs are available in the market. This development
has led to the constant demand of new analytical procedures capable of quantifying such
compounds. Methods that have been used over time to analyse SLAs include thin layer
chromatography (TLC), capillary electrophoresis (CE), capillary electrochromatography
(CEC), micellar electrokinetic chromatography (MEKC), electrochemistry, differential
pulse voltammetry (DPV), gas chromatography (GC) and high performance liquid
chromatography (HPLC) (161-163). Mass spectrometry coupled with either HPLC or
GC is also used for the analysis of SLAs (162).
Among the methods listed above, the HPLC method was chosen in this study to analyse
the selected SLAs present in the studied SLPs. HPLC represents one of the most reliable
techniques regularly used in the analysis of SLAs since it can handle a wide range of
target compounds. For instance, Gaudiano et al. reported an isocratic HPLC method for
the determination of six glucocorticoids in whitening creams. The method employed a
C18 column, a mobile phase of water/acetonitrile (50:50) and detection was done at a
wavelength of 240 nm. The method was reported to be robust, linear, accurately sufficient
and precise (161).
Huang et al. developed an HPLC method for the simultaneous determination of five
whitening agents (magnesium ascorbyl phosphate, ascorbyl glucoside, kojic acid, arbutin
and hydroquinone decomposed from arbutin in cosmetics). The method used a Cosmosil
C18-AR-II column, a mobile phase of 0.05 M KH2PO4 buffer solution (pH 2.5) and
methanol (99:1), with detection wavelength set at 280 nm (164).
Balaquer et al. developed a HPLC method referred to as environmental friendly for the
determination of ascorbic acid (vitamin C) and its derivatives (ascorbyl phosphate (as
magnesium or sodium salts), ascorbyl palmitate, and ascorbyl glucoside) in skin-
whitening cosmetics. The method made use of a C18 column and a mobile phase gradient
of ethanol:50 mM phosphate buffer at different pHs (containing 0.1 M NaCl). Detection
was carried out with a UV-visible detector set at different wavelengths. The method was
reported to be robust (165).

30
Reepmeyer et al. developed a reversed-phase and a normal phase HPLC method for the
detection of clobetasol propionate in some formulations. A NOVA-Pak C18 column and
a mobile phase of acetonitrile-water (1:1) was used for the reversed phase
chromatography, while a Chromegasphere SI 60 column and a mobile phase of
isopropanol-heptane (1:4) was used for the normal phase chromatography. The
chromatogram was monitored at 240 nm and the signal was scanned from 200 to 350 nm
in order to record the UV spectra (166).
More studies have employed HPLC when investigating SLPs due to the complex matrices
that require a variety of ingredients to be separated and quantified.
1.9 Methods of analysis of heavy metals
Typical examples of instrumentation methods used for heavy metal analysis include
atomic absorption spectrometry (AAS), inductively coupled plasma-optical emission
spectrometry (ICP-OES), inductively coupled plasma-mass spectrometry (ICP-MS),
neutron activation analysis (NAA), X-ray fluorescence (XRF), and ion chromatography
(IC) (167-171). However, the AAS, ICP-OES and ICP-MS are the most common
instrumentation methods used when analysing the heavy metal content in cosmetic
products.
For instance, Iwegbue et al. evaluated the levels of heavy metals present in commonly
used moisturising and skin-lightening creams in Nigeria by means of AAS. The metals
quantified included Al, Cd, Cr, Cu, Co, Fe, Mn, Pb and Zn (152). Similarly, Al-Salah et
al. used the AAS method to investigate the presence of trace metals such as As, Cd, Cr,
Hg, Ni, and Sb in lipsticks (172). Nnorom also used the AAS method to determine the
presence of metals such as Pb, Cd, Co, and Cr in talcum powders (173). More studies
have used the AAS technique when measuring the content of heavy metals in cosmetics
products (4, 150). The AAS technique is easy to use, fast and cheap, but the technique is
disadvantaged with moderate detection limits, element limitations and lack of screening
ability.
The ICP-OES and ICP-MS are the most favoured techniques for heavy metal analysis.
They have the advantage of multi-element analysis, high productivity, economical for

31
many samples and/or elements, few chemical interferences, excellent screening abilities,
total dissolved solids and can handle both inorganic and organic samples (174).
Al-Qutob et al. reported the use of ICP-MS for the determination of heavy metals such as
Ag, Al, Ba, Bi, Cd, Cr, Co, Cu, Mn, Mo, Ni, Pb and Zn in cosmetics products (168).
Similarly, Bocca et al. used the ICP-MS to determine the presence of metals such as Cd,
Co, Cr, Cu, Hg, Ir, Mn, Ni, Pb, Pd, Pt, Rh, and V in commercial body creams (175). Zeo
et al. also used the ICP-MS for measurement of metals like Cr, Cd, Pb, Hg, As, Se, and
Sb in cosmetic products such as lipsticks, nail polishes and skin creams (176).
Alquadami et al. used the ICP-OES to determine the presence of heavy metals such as
As, Bi, Cd, Hg, Pb and Ti in some skin-whitening cosmetic creams (167). Likewise,
Mayildurai et al. used the ICP-OES to investigate the presence of metals such as As, Cd,
Cr, Hg, Ni, Pb, Co, Cu, in a deodorant, eyeshadows, a face cream, a hair dye, kohl, soap
and talcum powder (177). Sabah et al. also used ICP-OES to quantify metals such as As,
Cd, Pb, and Hg in face make-ups (178).
Furthermore, Emad et al. used both the ICP-MS and ICP-OES for the determination of
elements in cosmetic products like eye-shadow, lipsticks, lip-gloss, eye-liners, mascaras,
fairness products, kohl, hair dyes, foundations and hennas. Twenty three trace elements
(Ag, As, Ba, Be, Cd, Co, Cr, Cu, Mn, Mo, Ni, Pb, Sn, Sr, Ti,Tl, U, Zn, Zr, Nb, Rb, Sb,
and Se) were studied by using ICP-MS and twenty two elements (Al, Ba, Bi, Ca, Cd, Co,
Cr, Cu, Fe, K, Mg, Mn, Na, Ni, P, Pb, Si, Sr, Th, Ti, U, and V) were studied by using
ICP-OES (179).
Both the ICP-OES and ICP-MS are an excellent choice when analysing the heavy metal
content of cosmetic products as they can measure a wide range of elements with good to
excellent detection limits, but are associated with possible limitations of spectral
interferences (174).
For mercury determination in cosmetic products, the cold vapour atomic absorption
spectroscopy (CV-AAS) technique is one of the most widely used techniques and has
been reported in a number of studies (137, 180).
In this study, the CV-AAS and ICP-OES methods were used to quantify the levels of
mercury and other heavy metals respectively.

32
1.10 Quantitation methods
Basically, there are three different calibration methods that can be utilised in quantitative
analysis; namely, external standard, internal standard and the standard addition method.
The external standard method is the basic quantification method in which both the
calibration solutions and unknown samples are analysed under the same conditions. The
accuracy of this method is affirmed when there is reproducibility of the injection volume.
The external standard method is performed by preparing calibration standard solutions of
known concentration of the analyte of interest, and making sure the concentration of
unknown samples fall within the range bracket of the calibration solutions. A fixed
amount of the calibration solutions and unknown samples are injected, and the peak
heights or areas obtained for the calibration solutions are then plotted against the
concentration of the analyte, giving a linear calibration plot passing through the origin.
The resulting peak heights or areas from the unknown samples are then related to those
of the calibration solutions, by using the calibration plot to estimate the amount of the
unknown (181, 182).
The internal standard method is performed by adding a known amount of a compound
different from the analyte of interest to the unknown sample and the calibration standards.
The internal standard chosen must be chemically similar to the analyte of interest. The
accuracy of this method is dependent on the stability of the internal standard and it must
not in any way interfere with any of the sample components. With this method extraction
efficiency can be evaluated if the internal standard is added before preparation of the
sample. Quantification by using the internal standard method is achieved by using the
ratio of peak height or area of the standard solution to the internal standard to calculate a
response factor.(181). This response factor is then used to calculate the concentration of
the unknown.
The standard addition method is most useful for samples with complex matrices and with
potential to cause adverse effects to the signal (matrix effect), making it unreliable to
relate the signal between the sample and standard by using the traditional calibration plot
approach. In the standard addition method, known quantities are added directly to an
unknown and the analyte concentration is determined from the increased signal (183).

33
In this study, the external standard method was employed to carry out quantitative
analysis of the selected SLAs and heavy metals. When analysing samples with complex
matrices like SLPs, which require a variety of ingredients to be quantified, the external
standard approach is more suitable so as to avoid introduction of further interferences in
the samples. The external standard method helps to calibrate the instrument and can be
applied to a wide variety of methods.
1.11 Problem statement
The problem to be addressed in this research is the fact that some SLPs contain
compounds which are illegal and harmful to the skin. Another problem area is that the
active SLAs present in the products may be present at concentrations greater than allowed
by regulatory control limits. All SLPs should have the active ingredients listed on the
package labels and the actual contents should be consistent with those listed on the
product labels. It is a concern that not all SLPs available on the market specify the
composition and active ingredients in detail as would be informative to the end-user.
Some products are labelled in a language that is confusing or difficult to understand. It
is therefore of great importance for public health that the contents of commonly used
SLPs be known.
1.12 Motivation
Considering the toxic effects of some SLAs, such as hydroquinone, mercury, and steroids,
the practice of skin-lightening in an attempt to beautify and accomplish a light
complexion, is worrisome. The NAFDAC had initially allowed a maximum of 2%
hydroquinone in lightening creams in Nigeria, but due to the side-effects associated with
prolonged use of hydroquinone and also the lack of compliance with content and labelling
requirements, all forms of bleaching agents were prohibited in cosmetics and toiletries
(40). In view of the increasing incidents of undesirable side-effects such as exogenous
ochronosis, contact dermatitis, hyperpigmentation and hypopigmentation, nail
discoloration, nephrotic syndrome and other health complications reported to be
associated with the practice skin-lightening, it is necessary to investigate whether
34
prohibited additives such as hydroquinone and other toxic elements and compounds are
still among the ingredients found in commercial SLPs on the Nigerian market. This work
is of great importance for public awareness and safety.
1.13 Aim and objectives
The aim of this research work was to identify and quantify commonly used organic SLAs
and heavy metals present in some selected SLPs sampled from Ilorin State in Nigeria.
This study had the following specific objectives:
I. To develop an extraction method for the selected SLAs.
II. To develop and validate a high-performance liquid chromatography (HPLC)
method for the identification and quantification of the selected SLAs in the studied
SLPs.
III. To extract trace amounts of heavy metals present from the SLPs by means of
microwave-assisted digestion.
IV. To quantitatively determine the presence of mercury in the studied SLPs by means
of cold vapour atomic absorption spectroscopy (CV-AAS).
V. To quantitatively determine the presence of other heavy metals in the studied
SLPs by means of inductively coupled plasma-optical emission spectroscopy
(ICP-OES).
VI. To evaluate the exposure risk derived from the heavy metal content in these
products.
Chapter 2 of this dissertation provides the experimental procedures undertaken to achieve
these objectives. The results of these experiments are presented and discussed in Chapter
3. The conclusions derived from this research are explicitly stated in Chapter 4.

35
Chapter 2
EXPERIMENTAL
This chapter describes the analytical techniques used for the analysis of some commonly
used skin-lightening products (SLPs) in Nigeria. It also provides the materials and
instruments used to carry out these analyses.
2.1 Materials
A total of 35 products were purchased from various stores in Ilorin, Nigeria. All the
samples were stored at room temperature away from sunlight. The samples were stored
in the refrigerator after extraction and before analysis. All samples were investigated for
both the presence of organic active skin-lightening ingredients and heavy metals. A list
of all the products investigated including their brand names, cost, ingredients listed on the
label, company of production, and country of manufacture, can be found in Table 2.1.
The list of chemicals used are provided in Appendix A, together with their chemical
grades and manufacturers. The reagents used were all of analytical grade. The solvents
used, for example, methanol and acetonitrile, were of HPLC grade. The water used was
purified with a Millipore Elix 5 UV water purification system.
2.2 Equipment
A list of all the equipment used to carry out this research can be found in Appendix B.

36
Table 2.1: List of skin-lightening products investigated in this study.
Code Price (Naira) Brand name Ingredients listed on packaging Company of production
Country of manufacture
SLP 1
4000 Anivat Lightening Lotion
Aqua (water), Glyceryl Stearate, Parafinum, Liquidum (mineral oil), Isopropyl Myristate, Cetostearyl Alcohol, Cetearch 20 & 25, Triethanolamine Puriss, Sodium Lauryl Sulfate, Butyrospermum parkii, Glycyrrhiza Globra, Murus Alba, Ascorbic Acid, Citric Acid, Methyl Paraben, Parfum (Fragrance), Psropyl Paraben, BHT.
Shinesarod Limited
USA
SLP 2
3500 Make Me White Fade Milk
Various Vitamins and Protein Herbal Extractions.
Shinesarod Limited
USA
SLP 3
3500 Nature White Whitening Milk
Water (Aqua), Cetearyl Alcohol, Cetearesth 20, Canola oil, Glycerin Glycol Stearate, PEG-4, Lactic Acid, Kojic Acid, Propylene Glycom, Mulberry (Morou Bom Bycis) Root Extract, Bearberry (Arctostaphylos Uvayrsil) Extract, Licorice 1 (Glycyrrhiza Galabra) Extract,
France

37
Dimethicone, Phenoxyethanol Isobutylparaben, N-Butylparaben, Fragrance, Ethylhexyl Methoxycinnamate, Tocopheryl Acetate (Vitamin E).
SLP 4
3500 Crystal White UV Lightening Milk
Aqua, Polysorbate 60, Glycerine, A.H.A, Glyceryl Monostearate, Cetyl Alcohol, Vitamin C, Stearic Acid, Paraben Complex, Carbomer, Triethanolamine, Vitamin E, Acetate, Fruity Fragrance, Eggyolk Mineral oil, Sodium EDTA.
Young and Beautiful Cosmetics
Phillipines
SLP 5
2500 Glutathione Whitening Lotion
SLP 6
1800 Sure White Maxi Tona
Aqua (Water), ParaffinumLiquidum (Mineral oil), Glycerin, Cetearyl Alcohol and Ceteth-20 Phosphate and Dicetyl Phosphate, Di-PPG-2 Myreth-10 Adipate, Cetearyl Alcohol, Phenoxy-ethanol and methylparaben and ethylparaben, and propylparaben and butylparaben and Iso
Switzerland

38
butylparaben, Lanolin Alcohol, Carbomer, Parfum (fragrance), Sodium Hydroxide, Caprylic/Capric Triglyceride Diacetyl Boldine, Disodium EDTA, CI 45430, Alpha-Hexyl Cinnamic Aldehyde (HCA), Benzl Benzoate, Citral, Limonene, Geraniol, Hydroxyisohexyl3-Cyclohexane Carboxaldehyde, Linalool.
SLP 7
300 Clair Express Aqua, Plant Extracts, Paraffinum Liquidum, Glycerin, Refined Palm, Stearin, Fragrances, Carbomer, Methylparaben, Propyl Paraben, stearic Acid, Lmidalidinyl Ure.
Hekin Inc.
Paris
SLP 8
900 Clearasil Lightening Lotion
Aqua (water), Glycerystearate, Parafinum Liquidum (mineral oil, Isopropyl Myristate, Cetosearyl Alcohol, Cetearch 20 & 25, Triethanolamine Puriss, Sodium Lauryl Sulfate, Butyrospermum Parkii, Glycyrthiza Globra, Murus Alba, Ascorbic Acid, Citric Acid, Methylparaben, Parfum (Fragrance), Propyl Paraben, BHT.
Xandas Ind. Limited
Nigeria

39
SLP 9
750 White Express
Eau Purfiee BP, Parafine Oil USP, Dimethicone BP, Isopropyl Myristate BP, Propylene Glycol BP, Methyl Paraben BP, Propyl Paraben BP, Clobetasol Propionate USP 0.05%w/w, Clotrimazole BP 1.00%w/w
Kremoint Pharma P. Limited
India
SLP 10
700 Hi White Exclusive Whitenizer Lotion
Deionised Water, Isopropyl Palmitate, Ceteareth-6 (and) Stearyl Alcohol, Stearic Acid, Glycerol, Cetostearyl Alcohol, Lanolin, Hydroquinone (2.0%), Hydrogenated Castor Oil, Fragrance, Silicon Fluid, Carboxy Methyl Cellulose, Octyl Methoxy Cinamate, Aloe Vera, Collagen, Allantoin, Vitamin c, Citric Acid, Triclosan, Vitamin E, Methyl Paraben, Propyl Paraben, Sodium Sulphite, Sodium Metabisulphite.
Skin Beauty Limited
Nigeria
SLP 11
650 Looking Good Skin Tone Lotion
Deionised Water, Cetostearyl Alcohol, Isopropyl Palmitate, Stearic Acid, Glycerol, Lanolin, Hydroquinone, Hydrogenated Castor Oil, Fragrance, Silicon Fluid, Carboxy Methyl Cellulose, Benzophenone-3, Sodium Lauryl Sulphate, Aloe Vera, Collegen, Allantoin, Citric Acid, Vitamin C,
Skin Beauty Limited
Nigeria
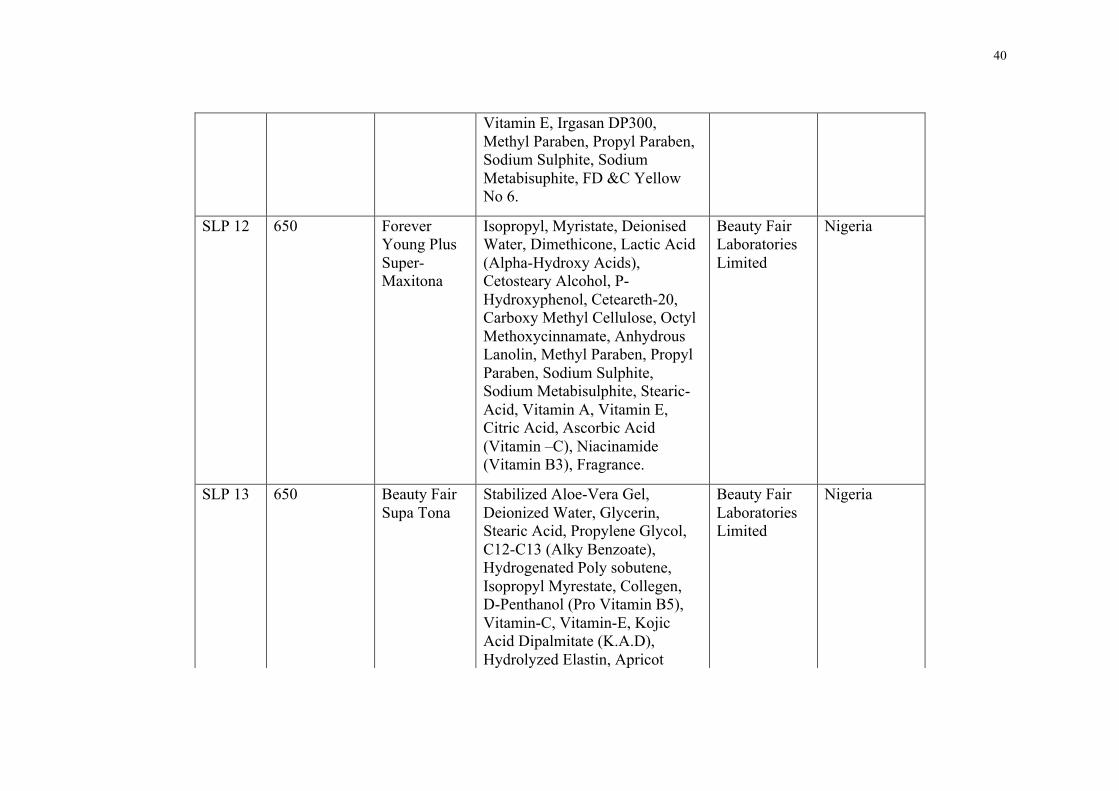
40
Vitamin E, Irgasan DP300, Methyl Paraben, Propyl Paraben, Sodium Sulphite, Sodium Metabisuphite, FD &C Yellow No 6.
SLP 12
650 Forever Young Plus Super-Maxitona
Isopropyl, Myristate, Deionised Water, Dimethicone, Lactic Acid (Alpha-Hydroxy Acids), Cetosteary Alcohol, P-Hydroxyphenol, Ceteareth-20, Carboxy Methyl Cellulose, Octyl Methoxycinnamate, Anhydrous Lanolin, Methyl Paraben, Propyl Paraben, Sodium Sulphite, Sodium Metabisulphite, Stearic- Acid, Vitamin A, Vitamin E, Citric Acid, Ascorbic Acid (Vitamin –C), Niacinamide (Vitamin B3), Fragrance.
Beauty Fair Laboratories Limited
Nigeria
SLP 13
650 Beauty Fair Supa Tona
Stabilized Aloe-Vera Gel, Deionized Water, Glycerin, Stearic Acid, Propylene Glycol, C12-C13 (Alky Benzoate), Hydrogenated Poly sobutene, Isopropyl Myrestate, Collegen, D-Penthanol (Pro Vitamin B5), Vitamin-C, Vitamin-E, Kojic Acid Dipalmitate (K.A.D), Hydrolyzed Elastin, Apricot
Beauty Fair Laboratories Limited
Nigeria

41
Kernel Oil, Sodium Metabisulfite, Sodium Sulfite, Propyl Paraben, Methyl Paraben, Cetyl Alcohol, EDTA, Fragrance.
SLP 14
600 Ken Perfect Action White
Deionized Water, Cosmowax, Cetyl Alcohol, Stearic Acid, Glycerin, Mineral Oil, Isopropyl Myristate, Alph Hydroxy Acid with Kolic Acid (AHA-K), Citric Acid, Propyl Paraben and Methyl Paraben.
Blueworld Cosmetics Nig. Limited
Nigeria
SLP 15
600 Diva Maxima Maxitone
Water, Mineral Oil, Petrolatum, Lanolin, Stearic Acid, Cetyl-Stearylic Alcohol, Isopropyl Myristate, Tocopheryl Acetate, BHT, Methyl Paraben, Propyl Paraben, Sodium Lauryl Sulfate, Sodium Metabisulfite, Sodium Ssulfite, Citric Acid, Propylene Glycol, AHA (Alpha-Hydroxyacid), Allantoin, Lecithin Cholesterol, Ascorbic Acid, Fragrance.
N.P. Gandour
Côte d’Ivoire
SLP 16
600 Skin Magnet Whitening Lotion
Aqua (water), Glyceryl Stearate, Cetostearyl, Alcohol, Avocado Oil, Isopropyl Myristate, Glycerine, Allantoin, Ascorbic Acid, Sodium Metabisulphite,
Anochemical Cosmetic Industries Limited
Nigeria

42
Sodium Sulphite, Fragrance, Sunscreen, Arbutin, Carrot Extract Alpha Hydroxyl Acid (AHA).
SLP 17
600 Body White Paris
Water, Carbomer, Methylparaben, Propylparaben, Triethanolamine, Dimethicone, Peg-7 Glycerylcacoate, Bearberry Extracts, Mulberry Extracts, Licorice Extracts, Lemon Extracts, Kojic Acid, PPG-1-PEG-9 Lauryl Ether, Fragrance.
N.P. Gandour Côte d’Ivoire
SLP 18
500 So White Skin Perfector Gel
Propylene Glycol, Cetearyl Alcohol, Hydroxy Phenol,Castor (Ricinus Communis) Oil, Carnauba Wax, Polyacrylamide/C13-14, Isoparaffin/Laureth-7, Parfum (Fragrance), Sodium Sulfite, Sodium Metabisulfite, CI14700.
Fair & White Paris
France
SLP 19
500 Perfect White Lightening Beauty Lotion
Vaseline, Huile De Vaseline, Acide Stearique, Glycerine, Acides De Fruits (AHA), Acide Kojique, Allantoine, Huile De Silicone, BHT, Lorol C16, Lorol C18, Parfum, EAU.
Dream Cosmetics
Côte d’Ivoire

43
SLP 20
450 Rapid Clair Gel Cream Plus
Eau Purfiee BP, Parrafine Oil USP, Dimethicone BP, Isopropyl Myristate BP, Propylene Glycol BP, Sorbic Acid BP, Clobetasol Propionate USP 0.05%w/w, Clotrimazole BP 1.00%w/w.
Laboratoires Biopharma S.A.
India
SLP 21
400 Swiss Collagen Toning Formula
Deionosed Water, Ceteareth-6 (and) Stearyl Alcohol, Cetostearyl Alcohol, Isopropyl Palmitate, Glycerol, Stearic Acid, Lanolin, Hydroquinone (2%), Hydrogenated Castor Oil, Fragrance, Sillicon Oil, Escalol 557, Aloe Vera, Collegen, D-Panthenol, Citric Acid, Vitamin E, Vitamin C, Methyl Paraben, Propyl Paraben, Sodium Sulphite, Sodium Metabisulphite, FD & C Red No.2.
Skin Beauty Limited
Nigeria
SLP 22
400 Caro White Lightening Beauty Lotion
Petrolatum, Mineral Oil, Stearic Acid, Cetearyl Alcohol, Isopropyl Myristate, Glycerin, Methyl & Propyl Paraben, Huile De Carotte, Vitamin E(0.2%), Hydroquinone (Max. 2%), Aqua (EAU), Fragrance.
Dream Cosmetics
Côte d’Ivoire
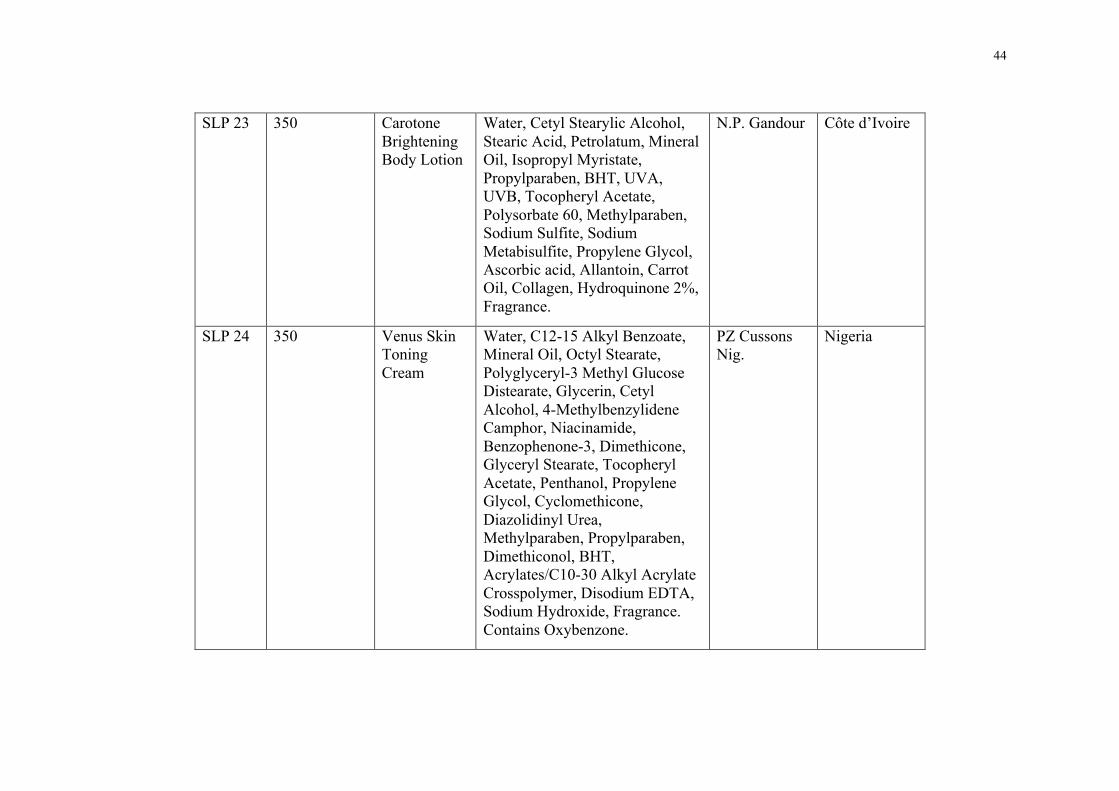
44
SLP 23
350 Carotone Brightening Body Lotion
Water, Cetyl Stearylic Alcohol, Stearic Acid, Petrolatum, Mineral Oil, Isopropyl Myristate, Propylparaben, BHT, UVA, UVB, Tocopheryl Acetate, Polysorbate 60, Methylparaben, Sodium Sulfite, Sodium Metabisulfite, Propylene Glycol, Ascorbic acid, Allantoin, Carrot Oil, Collagen, Hydroquinone 2%, Fragrance.
N.P. Gandour Côte d’Ivoire
SLP 24
350 Venus Skin Toning Cream
Water, C12-15 Alkyl Benzoate, Mineral Oil, Octyl Stearate, Polyglyceryl-3 Methyl Glucose Distearate, Glycerin, Cetyl Alcohol, 4-Methylbenzylidene Camphor, Niacinamide, Benzophenone-3, Dimethicone, Glyceryl Stearate, Tocopheryl Acetate, Penthanol, Propylene Glycol, Cyclomethicone, Diazolidinyl Urea, Methylparaben, Propylparaben, Dimethiconol, BHT, Acrylates/C10-30 Alkyl Acrylate Crosspolymer, Disodium EDTA, Sodium Hydroxide, Fragrance. Contains Oxybenzone.
PZ Cussons Nig.
Nigeria

45
SLP 25 250 Euro White Cream
100g Contain Clobetasol Propionate 0.05 g Excipients q.s.
Pink Rose Cosmetics Limited
SLP 26 250 Labidjanaise Carrot Cream
100 g Contiennet Clobetasol Propionate 0.05 g Excipients c.s.
H. Cosmetiques CI
Italy
SLP 27 250 Applevet Lightening Cream
Clobetasol Propionate B.P 0.05 % w/w Cream Base q.s.
Applefield Int’l Limited
Italy
SLP 28 250 Xtra White Gel
100 g Contiennet Betamethasone Dipropionate 0.065 g- Excipients c.s.
Stanelvis Pharmaceuticals Limited
Italy
SLP 29 250 Amos White Gel
Clobetasol Propionate 0.05 % w/w.
PT. Tempo Scan Pacific TBK
Indonesia
SLP 30 200 Janet Gel Plus
100 g Contain Clobetasol Propionate 0.05 g Excipient q.s.
H Cosmetiques CI
Italy
SLP 31 200 Tempovate Gel
Clobetasol Propionate 0.05 % w/w
PT. Tempo Scan Pacific TBK
Indonesia
SLP 32 200 Visible Difference Cream
Clobetasol Propionate 0.05 % w/w
Vinco Pharmaceuticals
Italy

46
SLP 33 200 Clear White Moon
Clobetasol Propionate U.S.P. 0.05 % w/w Excipient q.s.
India
SLP 34 150 Esapharma Movate Cream
100 g Contiennet: Clobetasol Propionate 0.05 g, Excipient: 1,2- Propandiol, Dyoxyde De Titane, Carbomer, Eau purifiee q.s.
Esapharma SRL Pharmaceutical Laboratory
Italy
SLP 35 150 Beneks’ Fashion Fair Gel Plus
100 g Contient: Betamethasone Dipropionate 0.065 g, Excipient q.s.
Beltapharm S.P.A.
Italy
47
2.3 HPLC analysis of skin-lightening agents
Chromatography still represents the most commonly used technique for the determination
of SLAs in cosmetic products including SLPs. It is categorised by the type of mobile
phase used, as liquid, gas, or supercritical chromatography. A number of reports describe
various HPLC methods used for the qualitative and quantitative determination of SLAs
in SLPs. These were discussed in Section 1.8.
In this study, a reversed-phase HPLC technique was employed to separate, identify, and
quantify the SLAs present in the studied SLPs. Reversed-phase HPLC is far superior to
other HPLC modes in the variety of target compounds it can handle. The HPLC technique
has a unique advantage in terms of the column and mobile phase interaction, or
mechanism of separation, and the selectivity. It allows for the separation of high
molecular mass and high polarity compounds and also gives one liberty to accomplish
very difficult separations at low levels of detection, with high precision and accuracy.
2.3.1 Theory of HPLC
Chromatography is based on the partitioning of solutes between two phases and is,
therefore, related to simple liquid–liquid extraction. In HPLC, however, one phase (the
mobile phase) is in constant movement relative to the other one (the stationary phase).
The sample molecules are partitioned between the phases; those in the stationary phase
are retained, whereas those in the mobile phase move. The interaction between the solutes
and the stationary phase is most often based on adsorption. During an HPLC separation,
a solute normally partitions between the phases many thousand times. The basis of
separation is that different kinds of molecules on average spend different amounts of time
in the stationary phase. Due to a large number of partitioning steps, chromatography has
enormous resolving power and can separate mixtures of components with very similar
physical properties. In the common HPLC format, the stationary phase is a highly porous
solid material packed inside a cylindrical column, whereas the mobile phase is a liquid.
If a successful separation has been made of a binary sample, this will in the ideal case
result in the elution of two Gaussian-shaped concentration peaks (184).

48
2.3.2 Components of an HPLC system
A typical HPLC instrument has five main units. These are the mobile phase reservoir,
pump, column, injector system, and detector (Figure 2.1). A recorder and a waste unit
are also required as they help complete a proper HPLC system.
Figure 2.1: Components of an HPLC instrument (185).
The mobile phase reservoir is an inert container for mobile phase storage and transport.
Generally, transparent glass bottles are used so as to facilitate visual inspection of the
mobile phase level inside the container. Stainless steel particulate filters are placed inside
the containers for removal of particulate impurities in the mobile phase, if any.
The column is a stainless steel tube packed with stationary phase, with the option of
different lengths, bore sizes and packing materials, and is held in place by the column
hardware.Columns are available in different dimensions including preparative, normal-,
micro- and mini-bore, and capillary columns. The most widely used packing materials
for HPLC separations are silica-based. The most popular material is octadecyl-silica
(ODS-silica), which contains C18 coating, but materials with C1, C2, C4, C6, C8 and
C22 coatings are also available. Other types of substances used as column packing
materials include zirconia, polymer-based and monolithic columns. The right choice of
column length combined with the correct packing material in correlation with the
appropriate mobile phase is what determines an effective separation in HPLC. The two
most commonly used modes of separation in HPLC are the reversed-phase and normal-
phase. Reversed-phase columns contain a non-polar stationary phase (such as C18) and

49
are mostly used for non- or mildly polar organic compounds, and are typically paired with
a polar mobile phase. Normal-phase columns contain a polar stationary phase and are
mostly used to separate polar molecules in combination with a non-polar mobile phase.
An injector or auto-sampler is used to provide a constant volume injection of the sample
into the mobile phase stream. Inertness and reproducibility of injection are necessary to
maintain a high level of accuracy.
The detector measures either the absorbance, fluorescence, conductivity or refractive
index of the mobile phase. When a compound elutes from the column, a peak is observed.
The retention time of the peak is used to identify the compound. The peak height (or
area) is proportional to the amount of the compound in the sample. Some detectors
provide the ability to obtain a spectrum of the eluting species. Detector choice depends
on the properties of the compound being analysed. A UV detector or photodiode array
(PDA), fluorescence detector and refractive index detector (RI) are the most widely
available detectors for use in HPLC. When analysing a wide variety of substances that
can absorb light within the ultraviolet to visible region (190-900 nm) a PDA detector is
commonly used. The PDA detector allows simultaneous monitoring of more than one
absorbing component at different wavelengths which is an advantage in terms of less
solvent usage and time-saving. A mass spectrometer is the ultimate detector for liquid
chromatography (LC-MS). It significantly enhances the application range for HPLC in
terms of sensitivity and selectivity and its detection pattern is based on fragmentation of
a molecule by an electric field and separation on the basis of mass to charge ratio of the
fragmented molecule.
The pump or solvent delivery system serves to provide a pulse-free flow of the mobile
phase through the column under constant pressure. Variations in the flow rates of the
mobile phase affect the elution time of sample components and result in errors. The
composition of the mobile phase can be kept constant during the separation (isocratic
mode) or can be changed during the gradient separation mode. Gradient elution is
employed when trying to resolve components which do not separate and elute under
isocratic conditions. There are two options for gradient operation: high-pressure mixing
(which requires a pump for each solvent) and low pressure mixing (which requires one
pump). A control program is required for gradient operation.

50
The recorder reads out information from the detector. It interprets and records detected
compounds by means of peaks and produces chromatograms as relevant. The analysed
solutions flowing from the detector output make their way to the waste unit. Tubing lines
and fittings serve to interconnect the pump, injector, column, and detector components in
order to form an entire channel for the mobile phase, sample, and separated compounds.
Modern HPLC systems are computer-based and software controls the operational
parameters and also the acquisition and treatment of data.
2.3.3 Identification of skin-lightening agents
Identification of selected SLAs in the analysed products was done by comparing the UV
spectra and retention times of pure analytes with those of the sample analytes. The HPLC
detector used in this study was a photodiode array detector which has the ability to provide
a UV spectrum for each individual peak in the chromatogram. With the help of UV-
visible spectrophotometry, the wavelength of maximum absorption for each of the
selected SLAs was obtained. By using these wavelengths that the selected SLAs absorb,
one can differentiate the components separated based on their UV spectra and retention
times with HPLC. The wavelengths of maximum absorption are also used to select
appropriate detection wavelengths for collection of the chromatograms so that all analytes
can be detected. Below is a brief introduction on UV-visible spectrophotometry and the
spectral information of the selected SLAs detected in the analysed products.
2.3.3.1 Theory and instrumentation for UV-visible spectrophotometry
Ultraviolet and visible (UV-Vis) absorption spectroscopy is the measurement of the
attenuation of a beam of light after it passes through a sample or after reflection from a
sample surface. It measures the intensity of light as a function of its wavelength. Single-
beam and double-beam are the two major classes of spectrophotometers. In single-beam
spectrophotometers, all the light passes through the sample. To measure the intensity of
the incident light the sample must be removed so that all the light can pass through. In a
double-beam spectrophotometer, before the light reaches the sample, the light source is
split into two separate beams. One beam passes through the sample and the second one

51
is used for reference. This gives an advantage because the reference reading and sample
reading can take place at the same time.
Different analytes, such as transition metal ions, biological macromolecules, and highly
conjugated organic compounds, can be analysed by UV-Vis spectroscopy. Organic
compounds absorb light in the UV or visible region of the electromagnetic spectrum.
Compounds that absorb visible light (400-780 nm) are coloured, whereas those that
absorb UV light (190-400 nm) do not need to be coloured, which is in our case.
The wavelength at which an organic compound absorbs depends on how its electrons are
tightly held in a molecule, but the wavelength of this light is inversely proportional to the
energy of the radiation as explained by the equation below:
E = hc/λ.
E is the energy of electromagnetic radiation being absorbed, h is Plank’s constant, c is the
speed of light and λ is the wavelength of absorption.
As energy is absorbed in the UV region, there occur changes in the electronic energy of
the molecule. Once a molecule absorbs energy, an electron is promoted from an occupied
molecular orbital (usually a non-bonding n or bonding π orbital) to an unoccupied
molecular orbital (an antibonding π∗ or σ* orbital) of greater potential energy. The lowest-
energy occupied molecular orbitals for most molecule are σ orbitals (see Figure 2.2),
which correspond to σ bonds and the π orbitals lie at relatively higher energy levels than
σ orbitals. The non-bonding orbitals that hold unshared pairs of electrons lie at even
higher energies. The antibonding orbitals (π* and σ*) are orbitals of highest energy.
Figure 2.2: Relative energies of orbitals and the types of electronic transitions.
Ener
gy
σ* (antibonding)
π* (antibonding)
n (non-bonding)
π (bonding)
σ (bonding)
σ → σ* π → σ* n → π *
π → π*
n → σ*
σ → π*

52
To determine the concentration of an absorbing species in a solution with a fixed path
length by UV-visible spectroscopy, the Beer-Lambert law comes into play. It states that
the absorbance of a solution is directly proportional to the concentration of the absorbing
substances in the solution and the path length, which is written symbolically as
A = log Іₒ ⁄ І = log 100 ⁄ T = ε c b
where A is the absorbance (no unit of measurement), ε is the molar absorptivity (dm3 mol-
1 cm-1), c is the molar concentration (mol dm-3), and b is the path length (cm). The
concentration of the samples must be low in order to obey the Beer-Lambert law.
The minimum requirements of an instrument to study absorption spectra (a
spectrophotometer) include a source, a monochromator, sample compartment and a
detector (see Figure 2.3). The commonly used light sources, such as a tungsten halogen
lamp (˃ 350 nm) and a deuterium lamp (˂ 350 nm), are required to be stable during the
measurement period, i.e. the intensity of the emitted radiation should not fluctuate, and
that there should be adequate intensity over as large a wavelength region as possible.
Figure 2.3: Schematic of a double-beam UV-visible spectrophotometer (186).
The function of a monochromator is to produce a beam of monochromatic (single
wavelength) radiation that can be selected from a wide range of wavelengths. The
essential components are the entrance slit, collimating device (to produce parallel light),
a wavelength selection or dispersing system, a focus lens or mirror, and an exit slit. The

53
sample compartment serves to accommodate the cuvette that carries the sample solution.
The detector, which servers to measures the absorbance of samples, is usually a
photomultiplier, silicon diode, or diode array.
In this study, a PerkinElmer Lambda 25 double-beam UV-visible spectrophotometer
(Figure 2.4) was used to measure the maximum absorbance of the selected SLAs.
Figure 2.4: A photograph of the PerkinElmer Lambda 25 double-beam UV-visible spectrophotometer used for measuring the UV spectra of the selected SLAs.
2.3.3.2 Determination of UV absorbance of skin-lightening agents
In order to carry out the UV analysis, pure standards of selected SLAs, which included
clobetasol propionate, betamethasone dipropionate, clotrimazole, hydroquinone,
benzoquinone, kojic acid, niacinamide and arbutin, were dissolved in methanol. The UV
analysis of the SLAs was done by using 1 cm path length quartz cuvettes and methanol
as the blank in the reference beam. Their UV absorption bands were obtained over the
wavelength range of 190 nm to 400 nm. The spectra of the SLAs are shown in Figures
2.5 to 2.12 and their wavelengths of maximum absorption are listed in Table 2.2.
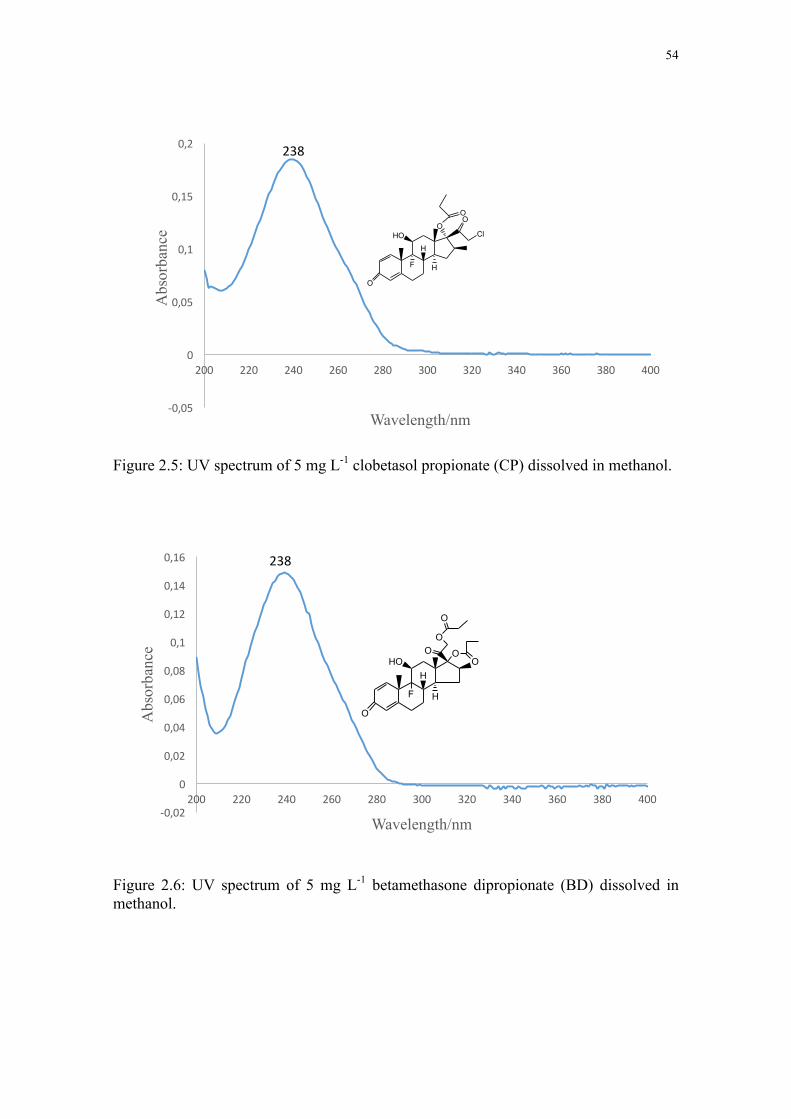
54
-0,05
0
0,05
0,1
0,15
0,2
200 220 240 260 280 300 320 340 360 380 400
Abs
orba
nce
Wavelength/nm
238
-0,02
0
0,02
0,04
0,06
0,08
0,1
0,12
0,14
0,16
200 220 240 260 280 300 320 340 360 380 400
Abs
orba
nce
Wavelength/nm
Figure 2.5: UV spectrum of 5 mg L-1 clobetasol propionate (CP) dissolved in methanol.
Figure 2.6: UV spectrum of 5 mg L-1 betamethasone dipropionate (BD) dissolved in methanol.
238
HHO
H
O
OO
Cl
F
O
HHO
H
O
F
O
OO
O
O

55
-0,2
0
0,2
0,4
0,6
0,8
1
1,2
1,4
1,6
1,8
190 240 290 340 390
Abs
orba
nce
Wavelength/nm
-0,05
0
0,05
0,1
0,15
0,2
0,25
0,3
0,35
0,4
0,45
200 250 300 350 400
Abs
orba
nce
Wavelength/nm
Figure 2.7: UV spectrum of 10 mg L-1 clotrimazole (CT) dissolved in methanol.
Figure 2.8: UV spectrum of 5 mg L-1 hydroquinone (HQ) dissolved in methanol.
204
223
293
N
N
Cl
OHOH

56
-0,05
0
0,05
0,1
0,15
0,2
0,25
0,3
0,35
0,4
0,45
0,5
200 220 240 260 280 300 320 340 360 380 400
Abs
orba
nce
Wavelength/nm
Figure 2.9: UV spectrum of 5 mg L-1 benzoquinone (BQ) dissolved in methanol.
Figure 2.10: UV spectrum of 5 mg L-1 kojic acid (KA) dissolved in methanol.
0
0,1
0,2
0,3
0,4
0,5
0,6
200 220 240 260 280 300 320 340 360 380 400
Abs
orba
nce
Wavelength/nm
242
218
269
OO
OOH
HOO

57
-0,05
0
0,05
0,1
0,15
0,2
0,25
0,3
0,35
0,4
0,45
200 220 240 260 280 300 320 340 360 380 400
Abs
orba
nce
Wavelength/nm
-0,02
0
0,02
0,04
0,06
0,08
0,1
0,12
0,14
0,16
0,18
200 220 240 260 280 300 320 340 360 380 400
Abs
orba
nce
Wavelength/nm
Figure 2.11: UV spectrum of 5 mg L-1 niacinamide (NC) dissolved in methanol.
Figure 2.12: UV spectrum of 5 mg L-1 arbutin (ARB) dissolved in methanol.
213
262
286
223
N
O
NH2
O
OH
OH
OH
O
HO
HO

58
Table 2.2: The wavelength of maximum absorption for each skin-lightening agent obtained by UV-visible spectrophotometry.
Active ingredients Wavelength of maximum absorption/nm
Clobetasol propionate (CP) 238
Betamethasone dipropionate (BD) 238
Clotrimazole (CT) 204
Hydroquinone (HQ) 293
Benzoquinone (BQ) 242
Kojic acid (KA) 269
Niacinamide (NC) 262
Arbutin (ARB) 286
2.3.4 HPLC method development
The selection of the appropriate HPLC column and mobile phase, and optimisation of
other operational parameters are what defines the method development. The process is
typically influenced by the nature of the sample and analytes involved.
However, certain precautions need to be taken during the HPLC method development so
as to consistently obtain reproducible results. This includes the use of HPLC-grade
solvents and ultrapure water obtained from a Milli-Q unit for preparation of all solutions
including the mobile phase. The mobile phase is one of the most important factors in
HPLC method development and if it contains water it should be prepared fresh daily. It
must be filtered through Millipore 0.45 µm HV organic aqueous filters for removal of any
particulates before degassing with high purity helium at a rate of 100 mL min-1 for 5
minutes prior to use. The process of degassing serves to prevent a change in PDA signal
to noise ratio caused by light scattering which can be due to air bubbles in the eluent.
When using acidic or basic mobile phases, the column must be confirmed to be
compatible with the pH range and should be immediately flushed out thoroughly after use
with the appropriate solvent so as to avoid precipitation of salts that could damage and
score the moving parts of the pump.

59
In order to clear the entire system lines of air bubbles and previously used solvent, the
HPLC pumps should be left over a long time to pump at a rate of 0.2 ml min-1 with the
mobile phase of interest. This is referred to as purging and is done without the column
so as to avoid its contamination. Before use, the column should be equilibrated by
allowing at least ten column volumes of mobile phase to pass through the column with
the pressure of the pumps not exceeding the maximum pressure allowed for the
instrument. This reduces the problems of pressure fluctuations and noisy baseline which
can result in inconsistent retention times. The lamp of the PDA detector should be
warmed-up for a period of 30 minutes before use.
In order to avoid the introduction of any particulate matter onto the column all samples
must be filtered through 0.45 µm Millex HV solvent resistant syringe filters. Carry-over
of samples between injections is checked with blank injections in between samples.
2.3.4.1 Determination of optimum separation method
Separation in HPLC is dependent upon the physical and chemical interactions between
the analyte and the mobile and stationary phases. Each of these factors may be altered in
order to change or optimise the selectivity of an HPLC separation.
To achieve optimum separation by isocratic elution, the studied SLAs were grouped into
two so as to avoid co-elution. The first group consisted mainly of steroid compounds
such as clobetasol propionate, betamethasone dipropoinate and clotrimazole. The test
separations were performed on the mixed standard solutions on a Brownlee analytical
C18 (100 × 4.6 mm, 3 µm) column. Several mobile phases were tested in order to find
the best separation. The mobile phases included a mixture of methanol and water (50:50,
v/v), methanol and water (60:40 v/v), methanol and 0.2% acetic acid in water (70:30, v/v),
and methanol and water (80:20, v/v). The mobile phase flow rate was altered between
0.5, 0.8, and 1.0 mL min-1 while the injection volume was 10 µL. The column
temperature was kept at ambient throughout.
The second group of SLAs, which included hydroquinone, benzoquinone, kojic acid,
niacinamide and arbutin, were separated under different liquid chromatographic
conditions since the method chosen for the first group of SLAs proved unsuccessful for

60
these analytes. Just like for the first group of SLAs, trial separation experiments were
done by using pure standard solutions. Here the stationary phase used was an SGE C18
(250 × 4.6 mm, 5 µm) column, as it is known that a change in column is one of the most
popular ways to alter the selectivity of a separation. The mobile phases which were tried
included a mixture of methanol and 0.05 M KH2PO4 at a pH of 2.5 (70:30, v/v), methanol
and 0.05 M K2HPO4.3H2O at a pH of 3.0 (80:20, v/v), methanol and 0.2% acetic acid in
water (90:10, v/v), and 0.5% orthophosphoric acid in methanol and 0.5% orthophosphoric
acid in water (5:95, v/v). The mobile phase flow rate was varied between 0.3, 0.5, 0.8,
1.0, and 1.2 mL min-1 and the injection volume of the studied analytes was 10 µL. The
column temperature was varied between 25 °C and 35 °C. The result of these various
trials are presented and discussed in Section 3.1.3.
2.3.4.2 Determination of optimum extraction method
The extraction of SLAs in the studied SLPs is an important factor for their quantitative
analysis. The extraction method must be good enough to extract the maximum amount
of SLAs in the SLPs. This required a preliminary extraction test so as to determine the
best solvent to be used. Four solvents were tested as the extractant, namely, methanol,
acetonitrile, 50% methanol in water, and a mixture of 50% acetonitrile and 50% methanol.
The extraction method for the sample preparation was studied with eight SLA standards
and the analysis was done by HPLC with the columns described in Section 2.3.4.1 for the
two groups of SLAs.
In order to optimise extraction of SLAs from the cream formulations, 0.05 g of a SLP
containing none of the studied SLAs was weighed into a glass flask, after which a known
amount of a mixture containing the same concentration of each of the SLAs was
immediately added and then diluted with 4 mL of the extraction solvent. The solution
was stirred for a few minutes to allow for proper mixing before being placed in an
ultrasonic water bath at 40 °C for 20 minutes. After ultrasonication, the solution was
allowed to cool down and was then quantitatively transferred into a 10 mL volumetric
flask and made up to the mark with the extractant. This method was repeated for each of
the four extractants on both groups of SLAs. The resulting solutions were analysed by
HPLC with the folowing chromatographic conditions: a Brownlee analytical C18 (100 ×

61
4.6 mm, 3 µm) column, mobile phase of methanol and water (80:20, v/v), injection
volume of 10 µL, flow rate of 0.8 mL min-1, and ambient column temperature for the first
group of SLAs and an SGE C18 (250 × 4.6mm, 5 µm) column, mobile phase of 0.5%
orthophosphoric acid in methanol and 0.5% orthophosphoric acid in water (5:95, v/v),
injection volume of 10 µL, flow rate of 1.0 mL min-1 and a column temperature of 35 °C
for the second group of SLAs. The results of the extraction test are presented and
discussed in Section 3.1.4.
2.3.4.3 Standard solution preparation and analysis
A 1000 mg L-1 standard stock solution was prepared for each of the SLAs by dissolving
0.025 g of the pure materials with methanol in 25 mL volumetric flasks. The solutions
were then placed in an ultrasonic bath for 10 minutes so as to completely solubilise the
solutes present in them. The solutions were subsequently made up to the mark with
methanol. For each SLA, the standard stock solutions were prepared in triplicate, from
which a 100 mg L-1 multi-standard working stock solution was prepared for clobetasol
propionate, betamethasone dipropionate, clotrimazole, and a 400 mg L-1 multi-standard
working stock solution for hydroquinone, benzoquinone, kojic acid and niacinamide. In
the case of arbutin, a 100 mg L-1 standard working stock solution was prepared separately
as it always co-elutes with kojic acid.
From these working stock solutions of standards, another set of dilute working standard
solutions was prepared by serial dilution with methanol. For clobetasol propionate,
betamethasone propionate and clotrimazole, eight different concentrations of working
standard solutions were prepared in the range of 0.2 – 60.0 mg L-1. In the case of
hydroquinone, benzoquinone, kojic acid, niacinamide and arbutin seven different
concentrations of working standard solutions were prepared in the range of 0.5 – 400 mg
L-1, 0.2 – 20 mg L-1, 0.5 – 90 mg L-1, 0.8 – 110 mg L-1, and 1.0 – 20 mg L-1 respectively.
Aliquots of each of the standard solutions were subjected to HPLC analysis so as to
generate calibration curves for quantification of the SLAs.
Certain chromatographic conditions were set during the analysis. The autosampler was
set to perform three injections per standard solution, with a blank injection of methanol
62
in between each injection so as to avoid any carry-over from the previous injection into
the column. The injection volume was 10 µL throughout and the flow rate was set at 0.8
mL min-1 for the first group of SLAs and 1.0 mL min-1 for the second group of SLAs.
The column temperature was room temperature for the first group of SLAs and 35 °C for
the second group of SLAs. Chromatograms were collected at detection wavelengths of
225 nm, 240 nm, 270 nm and 289 nm so as to observe all SLAs optimally and the
maximum run time was 20 minutes.
2.3.4.4 Sample preparation and analysis
A mass of 0.05 g of each SLP was accurately weighed into a glass flask in which 4 ml of
methanol was added and properly shaken for 5 minutes. The flask was then placed in an
ultrasonic water bath set at 40 °C for 20 minutes. After ultrasonication, the sample was
allowed to cool to room temperature and then quantitatively transferred into a 10 mL
volumetric flask and made up to volume with methanol. The sample was filtered through
a 0.45 µm Millipore syringe filter to remove all particulate matter that could clog the
column before being transferred into the HPLC injection vials. Three replicates were
prepared for each of the SLPs for HPLC analysis. The analysis was carried out by using
the same precautions and chromatographic conditions as described in Section 2.3.4.3.
Both samples and standard solutions were analysed on a Brownlee analytical C18 (100 ×
4.6 mm, 3 µm) column for the first group of SLAs and a SGE C18 (250 × 4.6 mm, 5 µm)
column for the second group of SLAs with a mobile phase composed of methanol : water
(80:20, v/v) and 0.5% orthophosphoric acid in methanol : 0.5% orthophosphoric acid in
water (5:95, v/v) for the first and second groups of SLAs respectively.
All HPLC analyses were carried out on a Shimadzu Prominence UFLCXR instrument (see
Figure 2.13) (Shimadzu Corporation, Japan) with the following components: a DGU-
20A3 degasser, LC-20AD XR binary pumps, SIL-20A XR autosampler, SPD-M20A
diode array detector, CTO-20A column oven, CBM-20A communicator bus module,
FRC-10A fraction collector and LC/Lab solution system software.

63
Figure 2.13: A photograph of the Shimadzu Prominence UFLCXR instrument used for the determination skin-lightening agents in this study.
2.3.4.5 Recovery analysis
Recoveries were performed in order to determine the accuracy of the methods developed.
This was done by spiking samples with a known amount of the SLA standards. The
samples used were previously analysed to ensure that they did not contain any of the
SLAs under investigation. Two spiked solutions of different concentration were prepared
for each of the studied SLAs. This was done by pipetting 1 mL and 5 mL of clobetasol
propionate, 1 mL and 5 mL of betamethasone propionate, 1 mL and 5 mL of clotrimazole,
1 mL and 2 mL of hydroquinone, 1.5 mL and 2 mL of benzoquinone, 0.8 mL and 2 mL
of kojic acid, 1 mL and 2 mL of arbutin, and 1.5 mL and 2 mL of niacinamide from a 100
mg L-1 of their respective standard stock solutions to a mass of 0.05 g of the SLA-free
sample and made up to volume with methanol in a 10 mL volumetric flask. The spiked
sample solutions were then shaken vigorously for 5 minutes and placed in an ultrasonic
water bath at 40°C for 20 minutes. After this, the spiked sample solutions were allowed
to cool and filtered through a 0.45 µm Millipore syringe filter into an HPLC injection vial
for analysis. The entire procedure was performed in triplicate and analyses were carried
out following the methods described in Sections 2.3.4.3 and 2.3.4.4. The results obtained
from the recovery analysis are presented and discussed in Section 3.2.2.
64
2.3.4.6 Intra-day and inter-day analysis
Intra-day and inter-day analyses were carried out in order to determine the precision of
the method. This was done by a repeated analysis of the studied SLA standards. Three
different standard solutions were prepared for each of the SLAs, which included 2, 10,
and 20 mg L-1 for hydroquinone; 2, 8, and 20 mg L-1 for benzoquinone; 1, 10, and 20 mg
L-1 for kojic acid; 5, 10, and 20 mg L-1 for niacinamide; 2, 12, and 20 mg L-1 for arbutin
and the same concentrations of 1, 4, and 8 mg L-1 for clobetasol propionate,
betamethasone dipropionate, and clotrimazole. The entire procedure was completed in
triplicate. The HPLC methods described in Sections 2.3.4.3 and 2.3.4.4 were used to
analyse the standards.
The intra-day analysis was done by repeated analysis of the three standards three times a
day over a time interval of three hours, while the inter-day analysis was done by repeated
analysis of the three standards over a period of 24 hours for three consecutive days. The
results of the intra-day and inter-day analyses are given and discussed in Section 3.2.3.
2.4 Analysis of heavy metal content
The qualitative and quantitative analysis of heavy metals in various types of samples has
been carried out by using different analytical techniques. These were discussed in Section
1.9. Usually, the choice of technique is dependent on cost, run-time, sensitivity (LOD),
physical state of the matrix and instrument availability.
In the present study, ICP-OES was employed as it was the best available option at our
disposal. This technique allows multi-element determination and also permits the
scanning of liquid samples in order to obtain overall information on the inorganic
composition of the sample under study. The technique involves short-run times, has high
sensitivity and is relatively free from complex matrices. For mercury determination, cold
vapour atomic absorption spectroscopy (CV-AAS) was used, since mercury is volatile.

65
2.4.1 Extraction of heavy metals
An acid digestion procedure was employed in this study for the extraction of heavy metals
in the studied SLPs. This was achieved by dissolving the samples in a mixture of acids
and heating until complete decomposition of the matrix, while avoiding loss or
contamination of the analytes before introduction into the ICP-OES or CV-AAS in liquid
form for analysis.
Open acid digestion and closed acid digestion are the two types of acid digestion
procedure. Both are carried out with the aid of a wide variety of reagents. Aside from
mineral acids, such as nitric acid, hydrochloric acid, nitro-hydrochloric acid, hydrofluoric
acid, or sulfuric acid, other reagents, such as hydrogen peroxide, potassium peroxide
sulfate, boric acid and many more, are also employed. However, the selection of specific
reagents or the preparation of the reagent mixture depends on the sample to be digested.
The open acid digestion method is carried out either with a reflux system or in a beaker
on a laboratory hot plate. This method is challenged with temperature limitations as a
consequence of the solution boiling point and the risk of contamination from the air. A
volatile element like mercury may be lost during the digestion process, leading to lower
results. Generally, the quality of digestion is mostly unsatisfactory despite the long
digestion times of 2 – 15 hours.
For the present study, the closed acid digestion method was used. With this method, the
temperature limitation can be overcome by working with a closed pressure vessel since it
allows temperatures in the range of 200 – 260 °C to be reached. This results in a dramatic
increase in the reaction kinetics, allowing acid digestion to be carried out in a matter of
20 – 40 minutes if microwave heating is employed. However, one can conclude that
temperature represents what is actually the most important reaction parameter. It is the
ultimate determinant of digestion quality, but also results in a pressure increase in the
vessel as the reaction between the acid and sample takes place, making it a potential safety
hazard. Thus, the pressure must ultimately be closely monitored. Section 2.4.1.1
describes the closed acid digestion method used in this study with the help of a microwave
digester.
66
2.4.1.1 Microwave-assisted digestion
Microwave-assisted digestion involves irradiation of the sample with microwave
electromagnetic radiation of a high-frequency electric field to achieve fast heating of the
sample through the direct absorption of microwave radiation. This allows for an
extremely rapid, simultaneous heating of about 8-12 sample solutions which represents
another advantage of microwave heating. Once the setpoint temperature is reached, the
decomposition reaction of the sample solutions proceeds at the same rate.
As mentioned earlier, the combination of acids during digestion depends on the matrix of
the sample. A combination of nitric acid, hydrochloric acid, and/or hydrofluoric acid has
been reported to provide better recoveries for digestion of some cosmetics such as
lipsticks, eye shadows and eyeliners in a closed system (187). Such a reagent mixture
was not suitable for use for SLP digestion as it would explode (188). Thus, nitric acid
alone was chosen for the digestion of SLPs in this study as it is known to be a strong
oxidising agent.
A sample of each SLP of a mass of a 0.250 g was placed into a high-pressure resistant
TFM-vessel to which 10 mL of conc. nitric acid was added. The samples were allowed
to pre-digest for 30 minutes in the fume hood uncovered, after which the vessels were
sealed and subjected to microwave irradiation in a Mars 6 microwave digestion system
(see Figure 2.14). The temperature was gradually increased from room temperature to
200 °C in a time frame of 15 minutes before the vessels were held at this temperature for
a period 20 minutes and then cooled down to ± 65 °C over a period of 15 minutes. After
cooling to room temperature, the vessel modules were disassembled and both the lids and
vessels were rinsed with double distilled water and the rinse solutions collected with the
digest. The samples were subsequently filtered through a 11 µm grade one Whatman
filter paper into 50 mL volumetric flasks and then made up to mark with double distilled
water. Filtration of samples was necessary in order to avoid any residue that could clog
the instrument lines or result in data fluctuation. Both the samples and blanks were
digested in triplicate and the resulting solutions were stored in plastic bottles.

67
Figure 2.14: A photograph of the Mars 6 microwave digestion device and the XP-1500 TFM reaction vessels used for digestion of skin-lightening samples in this study.
2.4.2 Inductively coupled plasma-optical emission spectrometry
Inductively coupled plasma-optical emission spectrometry (ICP-OES) is one of the most
powerful and popular analytical tools for the determination of metals in a variety of
different sample matrices. The technique is based on the spontaneous emission of
photons from atoms and ions that have been excited in a radio-frequency discharge. Thus,
the wavelength of the photons emitted is used to identify the elements from which they
originated. The total number of photons is directly proportional to the concentration of
the originating element in the sample.
The ICP-OES instrument has two main parts: the torch, and the optical spectrometer
(Figure 2.15). The ICP torch is made up of three concentric quartz glass tubes. Part of
this quartz torch is surrounded by the work coil of the radio-frequency generator. Argon
gas typically serves in creating the plasma. When the torch is turned on, an intense
electromagnetic field is created within the coil by the high power radio-frequency signal
flowing in the coil. This radio-frequency signal is created by the radio-frequency
generator which is, effectively, a high power radio-transmitter driving the work coil the
same way as a typical radio transmitter drives a transmitting antenna. Typical ICP-OES
instruments run at either 27 or 40 MHz. The argon gas flowing through the torch is ignited

68
with a Tesla unit that creates a brief discharge arc through the argon flow to initiate the
ionisation process. Once the plasma is "ignited", the Tesla unit is turned off. The argon
gas is ionised in the intense electromagnetic field and flows in a particular rotationally
symmetrical pattern towards the magnetic field of the radio-frequency coil. A stable,
high-temperature plasma of about 7000 K is then generated as the result of the inelastic
collisions created between the neutral argon atoms and the charged particles.
Figure 2.15: Schematic of an ICP-OES instrument (189).
A peristaltic pump delivers an aqueous or organic sample into the analytical nebuliser
where the sample is changed into mist and introduced directly inside the plasma
discharge. The sample components immediately collide with the electrons and charged
ions in the plasma and are broken down into charged ions. The various molecules break
up into their respective atoms, which then lose electrons and recombine repeatedly in the
plasma, giving off radiation at the characteristic wavelengths of the elements involved.
In this work a PerkinElmer Optima 5300 DV simultaneous ICP-OES spectrometer (see
Figure 2.16) was used for the determination of heavy metals in SLP samples.

69
2.4.2.1 Preparation of standard solutions of heavy metals
All standard solutions were prepared from 1000 mg L-1 analytical grade stock solutions
of the respective metals. From the stock solutions, a multi-element working standard
solution of 5 mg L-1 for each component was prepared for Al, Cr, Cu, Fe, Mn, Ni, Pb, and
Zn in a 100 mL volumetric flask. This was done by first placing 10 mL of concentrated
nitric acid in the volumetric flask and then transferring an aliquot of 0.5 mL of each metal
ion into the flask before making it up to the mark with double distilled water. The essence
of the nitric acid was to minimise matrix effects. From here, further dilution was made
with double distilled water to prepare nine different concentrations for each of the metals
and these more dilute solutions were used for the construction of calibration curves. The
concentration range was 0.01 – 1.6 mg L-1 for all the metals.
Standard solutions were not prepared for As, Cd and Co since the rough scan run on all
the samples did not indicate their presence.
2.4.2.2 Determination of heavy metals
All samples were analysed for As, Al, Cd, Co, Cr, Cu, Fe, Mn, Ni, Pb, and Zn. Certain
operational conditions were set on the ICP-OES instrument before the analysis began,
which included generator power, 1000 W; plasma gas flow rate, 12 L min-1; nebuliser
pressure, 3 bars; and sample flow rate, 1 mL min-1.
A scan run was initially performed on all the sample solutions to confirm the presence or
absence of the targeted elements. This was helpful in knowing what metal standards to
prepare and their concentration ranges. Also, three different analytical wavelengths were
preselected for each element out of which one of these wavelengths with high intensity,
low detection limits and minimal impact on the background of an emission line were
chosen for each element for further quantitative determinations. The wavelengths chosen
for use in this study for each metal ion analysed are listed in Table 2.3. To begin the
analysis, standard solutions and samples were allowed to aspirate for 60 seconds before
sampling and the instrument was set for sampling each solution five times and the average
was recorded.

70
Figure 2.16: A photograph of the PerkinElmer Optical 5300 DV simultaneous ICP-OES device used for the determination of heavy metals in this study.
Table 2.3: Emission wavelengths used for analysis of heavy metals by ICP-OES.
Element Wavelength/nm
Arsenic (As) 188.979
Aluminium (Al) 396.153
Cadmium (Cd) 214.440
Cobalt (Co) 228.6116
Chromium (Cr) 267.716
Copper (Cu) 324.752
Iron (Fe) 259.939
Manganese (Mn) 257.610
Nickel (Ni) 231.604
Lead (Pb) 217.000
Zinc (Zn) 213.857

71
2.4.3 Cold-vapour atomic absorption spectrometry
Atomic absorption spectrometry is an analytical technique used to determine the presence
and concentration of metals in liquid samples. Samples are atomised by a flame or
graphite furnace and light of a specific wavelength, from a hollow cathode lamp or an
electrodeless discharge lamp, is passed through the atomic vapour of the element of
interest, and measurement is made of the attenuation of the intensity of the light as a result
of absorption by free ground-state atoms of the element in the sample. In the case of
mercury, free mercury atoms can exist at room temperature and consequently this metal
can be analysed by atomic absorption spectrometry without employing a flame or graphite
furnace. The technique used for the analysis of mercury is what is referred to as cold-
vapour atomic absorption spectrometry (CV-AAS).
In the cold vapour technique, mercury is reduced chemically to the free atomic state with
a strong reducing agent solution like stannous chloride (SnCl2) or sodium borohydride
(NaBH4) in a closed reaction system. The reaction quantitatively releases mercury from
the sample solution and the mercury atoms are carried by a stream of air, nitrogen or
argon through a quartz absorption cell placed in the light path of the spectrometer. A
manually operated accessory, such as the MHS 15 mercury hydride system, is required
for vapour generation when carrying out mercury analysis with an atomic absorption
spectrometer. The pneumatic system of the MHS 15 accessory is described by Figure
2.17. The MHS 15 unit is composed of a reaction assembly (a reaction flask, reservoir
bottle and carrier gas pipelines) and a quartz tube atomiser (QTA) assembly. Hence, the
efficacy of this technique is dependent upon the proper connection of the MHS 15 unit to
the gas supply and the spectrometer.
When SnCl2 is used as the reductant during the analysis of mercury, the inert gas from
the pressure reducer comes via restrictor F2 and line b to the changeover valve, and then
travels via line e to the reaction flask. The gas pressure applied by means of ports 1 to 4
and then through line g, forces the transfer of SnCl2 reductant solution through line h into
the reaction flask. The mercury vapour is then transported by the combined gas streams
through the transfer tube f to the QTA, where its atomic absorption is measured.

72
Figure 2.17: Schematic of the PerkinElmer MHS 15 mercury hydride pneumatic system (190).
2.4.3.1 Preparation of reagents and standard solutions
A 5% (m/v) SnCl2·2H2O (reductant solution) solution was prepared by dissolving 50 g of
the salt in 100 mL of hot conc. HCl and then diluted to 1 L with double distilled water.
A dilute nitric acid solution of 1.5% was also prepared which served as the diluent
throughout the analysis. To prepare a stock solution of 1000 mg L-1 mercury, a mass of
0.135 g mercury chloride (HgCl2) was accurately weighed and dissolved in 25 mL of
double distilled water and the solution was diluted to 100 mL in a volumetric flask with
double distilled water. After this a 1 mg L-1 mercury working standard solution was
prepared. This was done by pipetting a volume of 100 µL of the 100 mg L-1 stock solution
into a 100 mL volumetric flask and then diluted to the mark with double distilled water.
From here, lower concentrations of mercury working standards were prepared for
construction of calibration curves as described in Section 2.4.3.2.

73
2.4.3.2 Determination of mercury
Mercury determination was carried out with a PerkinElmer Analyst 200 atomic
absorption spectrometer fitted with a mercury (Hg) lamp at a wavelength of 253.7 nm and
a PerkinElmer MHS 15 system was also connected to the instrument for vapour
generation. The instrument set-up is shown in Figure 2.18.
Figure 2.18: A photograph of the PerkinElmer MHS 15 mercury hydride system connected to the PerkinElmer Analyst 200 atomic absorption spectrometer instrument and gas supply during mercury determination in this study.
During analysis, 10 mL of the diluent (1.5% HNO3) was transferred into the reaction
flask, to which aliquots of 100, 200, 300, 400, 500, 600, 700, and 800 µL of a 1 mg L-1
mercury working stock solution were added sequentially to generate mercury calibration
curves by mass. These aliquots correspond to 100, 200, 300, 400, 500, 600, 700, and 800
ng of mercury respectively. Once the reagent reservoir and reaction flask were attached
to the reactor assembly, the extractor was then switched on and the argon gas was allowed
to flow through the immersion tube placed into the reaction flask. While the plunger
(multipath valve) is manually depressed and held between 20 to 30 seconds, an argon
stream transports the reducing agent (SnCl2) from the reagent reservoir into the reaction

74
flask to reduce mercury either in the standard or sample resulting in mercury vapour
which is driven out through the immersion tube to the QTA. The special conical form of
the immersion tube and reaction flask provides excellent mixing of the standard or sample
and SnCl2, guaranteeing a spontaneous reaction. As the mercury vapour passes into the
QTA, the measured absorbance gradually increases and then decreases as the mercury
diminishes. It was ensured that the reaction flask and the outside of the immersion tube
were rinsed with the diluent after every single measurement. The maximum absorbance
detected for each measurement was recorded and the absorbance for the standard
solutions was used to plot the calibration curve. Both standard solutions and digested
samples were analysed in triplicate.
2.4.4 Validation of heavy metal and mercury analyses
The accuracy of both the analytical techniques, namely, ICP-OES and CV-AAS, was
verified by using spike recovery methods. A known amount of each element under study
was introduced into an already analysed sample and the sample reanalyzed. Two spiked
solutions were prepared for each of the metals by spiking a sample mass of 0.250 g with
aliquots from two different standard solutions as indicated in Table 2.4. Thereafter, 10
mL of concentrated nitric acid was added to the solution and the mixture allowed to
predigest. The digest was completely solubilized by the microwave procedure described
in Section 2.4.1.1. After microwave-assisted digestion, the digest was filtered, diluted
into a 50 mL volumetric flask with double distilled water and analysed according to the
analysis conditions of the parent sample.

75
Table 2.4: Details of the solution preparation in 50 mL volumetric flasks for validation of heavy metal and mercury analyses.
Metal Standard solution/mg L-1
Aliquot pipetted from standard solution/mL
Spiked concentration in sample solution/mg L-1
Al 10 0.25 0.05
20 3.0 1.20
Cr 10 0.1 0.02
20 0.5 0.20
Cu 10 0.1 0.02
20 0.175 0.07
Fe 10 0.4 0.08
20 2.75 1.10
Mn 10 0.1 0.02
20 0.1 0.04
Ni 10 0.1 0.02
20 0.75 0.30
Pb 10 0.25 0.05
20 2.5 1.00
Zn 10 0.4 0.08
20 3.75 1.50
Hg 1.0 1.25 250 ng
1.0 2.25 450 ng

76
2.5 Data analysis
The data obtained in this study were evaluated by using the Microsoft Excel Analysis
Tool Pak. Calibration curves were determined by using the linear least-squares regression
equation given as:
y = mϰ + c (2.1)
where y is the HPLC peak area or corrected intensity or absorbance, ϰ is the concentration
of analyte, m is the slope, and c is the intercept. By assuming that c = 0 at the 95%
confidence level, only m needs to be determined to establish the calibration line taking
into account the error in each yo c and m, and thereby to produce an estimated standard
deviation SDϰo for the point estimate ϰo = (yo - c)/m. The correlation coefficient (R2)
measures the degree of linear association between the peak area, or corrected intensity or
absorbance, and the concentration of each analyte.
The slope and standard error (SE) of the calibration line (for each analyte) was used to
calculate the limit of detection (LOD) and the limit of quantitation (LOQ). This is given
by the equation:
LOD = 3#$ % (2.2)
(SE is the standard error of the slope and m is the slope of the calibration line) and the
limit of quantitation was calculated as:
LOQ = 10#$ % (2.3)

77
The accuracy of the method developed is expressed in terms of the percent recovery and
estimated by using equation (2.4):
% Recovery = ()*+-..-/+01-+1)+23*24-+5647)01-+1)+23*24-+
×100 (2.4)
The precision of the method developed is expressed in terms of percent relative standard
deviation and estimated by using the following equations:
% R.S.D. = 52*+0*300)94*24-+()*+1-+1)+23*24-+
×100 (2.5)
% Accuracy = ()*+-..-/+01-+1)+23*24-+2:)-3)241*;*(-/+2
×100 (2.6)
The percentage of the analyte in the product was estimated by using the formula
% = <=×>=×?@A=
×100 (2.7)
where Cs is the concentration of an analyte of interest from the standard curve (mg L-1),
Vs is the volume of sample extract, Df is the dilution factor (where applicable), and Ws is
the mass of the cream sample.
78
The risk of human exposure to heavy metals contained in the SLPs was estimated by
using the uncertainty factor called the Margin of Safety (MoS) in accordance with the
Scientific Committee on Consumer Safety (SCCS) (191). This is given by the equation:
MoS = BC D EF
GE? (2.8)
NO(A)EL is the no-observed-adverse-effect-level of the contaminant and can be
estimated by using the formula:
NO(A)EL = RFD × UF × MF (2.9)
UF and MF are the uncertainty factor and the modifying factor with default values of 100
and 1 respectively. RFD is the oral reference dose, which is an estimate of daily exposure
of the metals to the human population, including sensitive sub-groups. The RFD values
(in mg g-1 day-1) for each metal are as follows: Al (1.0 × 10⁻¹) (192), Cr (3.0 × 10⁻³), Cu
(4.0 × 10⁻²), Fe (7.0 × 10⁻¹), Mn (1.4 × 10⁻¹), Ni (2.0× 10⁻²), Pb (4.0 × 10⁻³), Zn (3.0 × 10-
1) (193), and Hg (5.0 × 10⁻⁴) (194).
A minimum MoS value of 100 has been proposed by the World Health Organization
(WHO) as acceptably safe for the product to be used on the human body (191).
SED is the systemic exposure dosage. Certain factors need to be considered in order to
obtain information on the SED for cosmetics. This includes the amount of cosmetic
applied to the body per day, the applied surface area, the concentration of the metal in the
cosmetic under investigation, the dermal absorption of the particular contaminant and a
human body weight value (191). Thus, SED can be estimated by using equation (2.10):
SED (mg kg-1 bw day-1) = ?Dа×GGD×I
JA×10-3 (2.10)

79
DAa is the dermal absorption reported as µg/cm2. It is the amount of ingredient absorbed
per square centimeter, resulting from an assay under an in-use mimicking condition. In
case no dermal absorption data is available, 100% dermal absorption is used (191). DAa
can be estimated by using the equation:
DAa = <=×DDGGD
(2.11)
Cs is the concentration of the particular metal in the product (mg kg-1); AA is the amount
of cosmetic product applied per day (7.82 g for body cream); SSA is the surface area of
the skin onto which the cosmetic is applied (15670 cm2 for body cream); F is the
frequency of application (2.28/day for body cream); BW is the body weight (60 kg for
default body weight) and 10-3 is the unit conversion factor (191).
The results obtained following the procedures described in this chapter are presented and
discussed in Chapter 3.

80
Chapter 3
RESULTS AND DISCUSSION
The results of the experiments described in Chapter 2 are presented and discussed in this
chapter. This chapter is divided into two main parts as described below.
The first part discusses the results obtained for the identification and quantification of the
organic SLAs such as clobetasol propionate (CP), betamethasone propionate (BD),
clotrimazole (CT), hydroquinone (HQ), benzoquinone (BQ), kojic acid (KA),
niacinamide (NC), and arbutin (ARB) in the 35 Nigerian commercially available SLPs.
The second part of the chapter present the results obtained for the heavy metal content of
these same products and also provides an assessment of the possible exposure risk through
the use of these products from the heavy metal content.
3.1 HPLC method development for the determination of organic skin-
lightening agents
In order to determine the active organic ingredients in the studied samples, a suitable
HPLC method was developed for the separation, identification, and quantification of the
selected SLAs. The HPLC instrument (Shimadzu Prominence) used for the analysis
consisted of a binary solvent manager, autosampler, and a PDA detector. Separation was
performed in an isocratic mode with a Brownlee analytical C18 column (100 × 4.6 mm,
3 µm) and a SGE C18 column (250 × 4.6mm, 5 µm) for the two groups of SLAs as
described in Section 2.3.4.1.
3.1.1 Optimum detection wavelengths
For skin-lightening active ingredients to be detected by an HPLC instrument equipped
with a PDA detector, optimum detection wavelengths must be set. The UV spectra and
the wavelength of maximum absorption for each of the SLAs were first obtained by means
81
of UV-visible spectrophotometry. The optimum wavelength for detection was selected
based on the wavelength that gives the highest sensitivity. The wavelength of maximum
absorption identified for each SLA was provided in Table 2.2. The UV spectrum for each
SLA obtained from a UV-visible spectrophotometer (provided in Section 2.3.3.2) was
used to confirm the UV spectra generated by the PDA detector in HPLC.
The PDA detector was set to acquire chromatograms at 225 nm for CT, 240 nm for CP,
BD and BQ, 270 nm for KA and NC, and 289 nm for HQ and ARB, as their highest
sensitivity was observed at or close to these wavelengths and these would enhance the
quantitation of the SLAs. For CT its wavelength of maximum absorption of 204 nm could
not be used since many other analytes as well as the solvent absorb close to this
wavelength. Hence, four UV absorption wavelengths (225, 240, 270 and 289 nm) were
selected for the SLA analysis in this study and the HPLC chromatograms were acquired
simultaneously at these wavelengths with the PDA detector.
3.1.2 Identification of skin-lightening agents
Since each component has its own distinct UV-visible spectrum and retention time at
which it elutes, identification of the SLAs in all samples was achieved by comparing the
HPLC-UV-visible spectra and retention times of the pure analytes (standards) with those
of the sample analytes. It must be borne in mind that there is a slight variability in the
retention time for each of the SLAs as indicated in Table 3.1 but an acceptable range is
0.1 – 0.3 minutes.

82
Table 3.1: Retention times and detection wavelengths for the skin-lightening agents
Active ingredient Retention time/min
Detection wavelength/nm
Clobetasol propionate 2.80-3.00 240
Betamethasone dipropionate 3.50-3.70 240
Clotrimazole 4.50-4.80 225
Hydroquinone 7.90-8.10 289
Benzoquinone 15.45-15.70 240
Kojic acid 6.15-6.30 270
Niacinamide 2.60-2.70 270
Arbutin 6.0-6.15 289
3.1.3 Optimum separation conditions
Obtaining optimum resolution and separation in a minimum time is the most important
aspect in HPLC . This is achieved by first knowing the chemistry of the analytes in
question, and also the use of the best mobile phase combination and stationary phase.
Since most of the studied SLAs are relatively polar molecules, the use of polar solvents
such as methanol and acetonitrile as constituents of the mobile phase and a non-polar
stationary phase in a reversed phase HPLC separation seems appropriate. Therefore, in
order to obtain a good separation for the simultaneous analysis of the studied SLAs,
mobile phases with different compositions of methanol, acids, buffers and water, with
flow rates varying between 0.3-1.2 mL min-1 on a Brownlee analytical C18 column (100
× 4.6 mm, 3 µm) and a SGE C18 column (250 × 4.6 mm, 5 µm) were tried in an isocratic
mode.
The pure standards of each SLA were first analysed individually to obtain the retention
times. These were then mixed to prepare a multicomponent standard solution that could
be used to check for proper resolution and separation of the compounds. Two
multicomponent standard solutions were prepared. The first included steroid compounds,
such as CP, BD and CT, and their separation was effected on a Brownlee analytical C18
column (100 × 4.6 mm, 3 µm). When a mobile phase consisting of either 50 or 60% (v/v)

83
methanol in water was used at flow rates of 0.5, 0.8 and 1.0 mL min-1, all three SLAs
were separated but the peak for CT was very broad. In an attempt to correct the CT
broadened peak, 70% methanol in water containing 0.2% acetic acid at flow rates of 0.5,
0.8 and 1.0 mL min-1 was used. The introduction of acetic acid was meant to change the
pH of the mobile phase which in turn would alter the degree of ionisation of some analytes
by affecting their hydrophobicity. Nevertheless, it was observed that all three SLA peaks
clustered together at flow rates of 0.8 and 1.0 mL min-1. However, with a lower flow rate
of 0.5 mL min-1, all three SLA peaks were separated but the CT peak still remained broad.
With the first group of SLA, it was generally observed that an increase in the percentage
of methanol in the mobile phase caused the analytes to elute faster with well resolved
peaks but the peaks co-eluted or broadened when the wrong flow rate was chosen. The
three SLAs were finally well resolved and separated when 80% (v/v) methanol in water
was used at a flow rate of 0.8 mL min-1. The total run time was 10 minutes and the column
temperature was kept at ambient. Figure 3.1 shows the optimum chromatogram for the
separation of the first group of SLAs which includes CP, BD and CT. The first two
chromatograms (A and B) shown in Figure 3.1 clearly show the effect of the detection
wavelength, particularly for CT. The peak for CT is much more prominent when detected
at 225 nm which is close to its wavelength of maximum absorption, namely 204 nm, than
in the case of detection at 240 nm. The third chromatogram (C) shows an example of one
of the steroid SLAs separated in one of the samples.
(A)

84
(B)
(C)
Figure 3.1: Chromatogram for the separation of active ingredients CP, BD and CT, obtained at detection wavelengths of (A) 240 nm, (B) 225 nm and (C) 240 nm. The chromatographic separation was achieved on a Brownlee analytical C18 column (100 × 4.6 mm, 3 µm), with a mobile phase of MeOH-H2O 80:20 (v/v), an injection volume of 10 µL, a flow rate of 0.8 mL min-1, and ambient column temperature.
CP
240 nm

85
As seen in chromatogram (C) of Figure 3.1, there is good resolution and separation of the
peak of the steroid compound (CP) at a retention time of 2.908 minutes when the optimum
conditions used for separating the steroid standard mixture were applied on the sample.
It can also be observed that there are peaks of other analytes on the chromatogram which
are not of interest. These peaks can be found, if not all, but at least some, in all the steroid
containing samples analysed. They have consistent retention times of approximately 0.8,
1.3, 1.6 and 2.0 minutes as shown in Appendix E, Figures E25 – E37. The peaks of these
undesired analytes were confirmed not to belong to any of the other SLAs investigated in
this study when comparison of their UV–visible spectra was made (see Figure 3.2).
However, these peaks are suspected to be those of paraben preservatives (methyl, propyl,
ethyl and butyl paraben) judging from their UV–visible spectra. Just like most of the
SLAs investigated in this study, paraben preservatives are also polar compounds and
could easily have been extracted from the samples during the extraction process of the
SLAs with 100% methanol. Moreover, separation of parabens have been reported to be
carried out in a reversed-phase HPLC with a similar mobile phase combination (methanol
: water) and column (C18) to this study (195, 196).
Hydroquinone Unknown
Benzoquinone Unkown

86
Kojic acid Unkown
Niacinamide Unknown
Arbutin
Figure 3.2: Comparison of the UV–visible spectra of other SLAs investigated in this study with those of the unknown analytes.

87
The second group of SLAs, which included HQ, BQ, KA, NC and ARB were separated
on a SGE C18 column (250 × 4.6 mm, 5 µm). When the column and conditions used to
separate the first group of SLAs was used for these analytes, a poor separation resulted.
This then led to a change in the stationary phase, which is one of the effective ways of
altering the selectivity of the separation in HPLC. When a mobile phase consisting of
either 70% methanol with 0.05 M KH2PO4 at a pH of 2.5, or 80% methanol with 0.05 M
K2HPO4 at a pH of 3.0, was used at flow rates of 0.3, 0.5, 0.8, 1.0 and 1.2 mL min-1, the
peak for NC was separated, but the peaks for HQ and BQ co-eluted and likewise for KA
and ARB. By using 90% methanol in water containing 0.2% acetic acid as the mobile
phase, at different flow rates, all the SLAs were found to elute earlier than before but the
peaks were clustered at very close retention times. With the second group of SLAs, it
was generally observed that an increase in the percentage of methanol in the mobile phase
led to early elution of all the analytes at flow rates above 0.8 mL min-1, causing the
analytes to co-elute. Whereas with flow rates ranging between 0.3 to 0.8 mL min-1, the
elution times of all analytes are increased and the separation improved but the peaks were
broadened. This indicated that a mobile phase containing far less methanol was needed
for optimal separation.
Separation of the second group of SLAs was best achieved when 5% methanol containing
0.5% orthophosphoric acid and 95% water containing 0.5% orthophosphoric acid was
used as a mobile phase. The flow rate was set at 1.0 mL min-1 and the total run time was
20 minutes. Figure 3.3 shows the chromatograms for the separation of the second group
of SLAs, which included NC, KA, HQ, BQ and ARB. ARB was removed from the
standard mixture and was analysed separately with the same optimum conditions used for
these SLAs as it co-eluted with KA. Moreover, the column temperature was set at 35 °C.
An increase in temperature was observed to reduce tailing in some of the analyte peaks.
Again the effect of detection wavelength is particularly evident in the case of NC and BQ
in their chromatograms acquired at different detection wavelengths of 270 and 240 nm
respectively in Figure 3.3. Chromatogram (E) of the same figure shows the separation of
some of these SLAs effected on a sample.

88
(A)
(B)

89
(C)
(D)

90
(E)
Figure 3.3: Chromatograms for the separation of active ingredients NC, KA, HQ, BQ and ARB obtained at detection wavelengths of (A) 289 nm, (B) 270 nm, (C) 240 nm (D) 289 nm and (E) 270 nm. The chromatographic separation was achieved on a SGE C18 column (250 × 4.6 mm, 5 µm) with a mobile phase of 0.5% orthophosphoric acid in methanol and 0.5% orthophosphoric acid in water 5:95 (v/v), an injection volume of 10 µL, a flow rate of 1.0 mL min-1 and a column temperature of 35 °C.
3.1.4 Optimum extraction solvent for sample preparation
In order to determine the optimum extraction method for the studied SLAs, four different
solvents were examined. This was done following the experimental method described in
Section 2.3.2.4. The peak areas of the SLAs obtained were plotted and served as a direct
reflection of the solvent extraction strength.
When solutions of the SLAs were ultra-sonicated in a water bath at 40 °C for 20 minutes,
the best extraction solvent was found to be 100% methanol. When 100% acetonitrile and
a 1:1 (v/v) mixture of methanol and acetonitrile were used, a similar extraction result was
obtained for both solvents but with less efficacy than 100% methanol. A 1:1 (v/v) mixture
of methanol and water was found to be the solvent with the least extraction strength
among those examined as shown in Figure 3.4. Thus, 100% methanol was used in this
study for the extraction of the studied SLAs in our sample products
HQ
KA
NC
270 nm

91
Figure 3.4: Optimisation of four different solvents for the extraction of CP, BD, CT, HQ, BQ, KA, NC, and ARB: a) methanol (100%), b) acetonitrile (100%), c) methanol:acetonitrile (1:1, v/v), and d) methanol:water (1:1, v/v). The optimum HPLC conditions described in Section 3.1.3 were used to obtain the peak areas.
3.2 Validation of HPLC analytical method
Analytical method validation is an important requirement in any HPLC analysis. The
validation of an analytical method must demonstrate the fulfilment of all the analytical
conditions required to ensure the reliability of the results. For this reason, the
adequateness of the HPLC method developed in this study was tested for linearity,
accuracy, precision, and limits of detection and quantitation.
3.2.1 Linearity of calibration curves and limits of detection and
quantitation
An external standard calibration method was used to assess the linearity of the calibration
curves used for quantitation of the SLAs identified in the sample products. A minimum
of seven different concentrations in three replicates were prepared for each of the active
ingredients and the calibration curves were determined in triplicate. Linear regression
analysis (at the 95% confidence level) of the calibration data for each SLA was performed
by using Microsoft Excel 2013 Analysis Tool Pak. The calibration curves were
0
50000
100000
150000
200000
250000
300000
350000
a b c d a b c d a b c d a b c d a b c d a b c d a b c d a b c d
CP BD CT HQ BQ KA NC ARB
Peakarea
92
constructed by plotting a graph of the HPLC peak areas against concentration. Moreover,
equation (2.1) given in Section 2.5 was used for the quantitation of the studied SLAs in
the sample products. The calibration data used to construct the linear regression curves
are given in Appendix C while the corresponding calibration curves and residual plots for
each of the studied SLAs are shown in Appendix D.
Good linearity was observed for all the SLA standards over the concentration range tested
and was confirmed from the correlation coefficient R2 values which were greater than
0.990. Table 3.2 gives the results of the linear regression analysis, and the limits of
detection and limits of quantitation. The lowest correlation coefficient value for the
studied SLAs was found to be 0.9942 and the highest value was 0.9995. The LOD values
were found to be in the range of 0.007 – 0.029 mg L-1 and the LOQ values ranged from
0.025 – 0.097 mg L-1.

93
Table 3.2: Results of the linear regression analysis of the calibration curves for the skin-lightening active ingredients analysed by HPLC.
Parameters CP BD CT HQ BQ KA NC ARB
Maximum absorption/nm 239 238 205 293 242 269 262 286
Detection wavelength/nm 240 240 225 289 240 270 270 289
Calibration range/mg L-1 0.2-60 0.2-60 0.2-60 0.5-400 0.2-20 0.5-90 0.8-110 1.0-20
Slope/L mg-1 22293 20003 27456 11708 38293 27397 11327 2310.5
Standard error of slope 63.099 52.915 69.235 113.883 326.682 124.798 58.988 9.047
Correlation Coefficient (R2) 0.9994 0.9995 0.9995 0.9942 0.9955 0.9987 0.9983 0.9991
LOD/mg L-1 0.008 0.007 0.007 0.029 0.026 0.014 0.016 0.012
LOQ/mg L-1 0.028 0.026 0.025 0.097 0.085 0.046 0.052 0.039
Limit of Detection (LOD)/mg L-1 = (3 × standard error of slope)/slope. Limit of quantitation (LOQ)/mg L-1 = (10 × standard error of slope)/slope.

94
3.2.2 Accuracy
The accuracy of the quantitation method was examined by performing a recovery test.
By using a sample free of the active ingredients, two solutions of different concentration
were prepared with known amounts of the pure active ingredients added. These were
extracted and the extracts injected in triplicate on the HPLC. The percent recoveries of
the spiked active ingredient were then calculated. No interferences were observed
throughout the test. The results of the accuracy studies are summarised in Table 3.3 and
it is evident that the method is accurate within the acceptable recovery range of 80 to
120% (197). The percent recoveries obtained ranged from 84.23 to 110.33% and the
percent relative standard deviation (%R.S.D.) ranged from 0.11 to 3.93%.
Table 3.3: Percentage recoveries of skin-lightening active ingredients (n = 3).
Active ingredients
Spiked amount/mg L-1
Found/mg L-1 %Recovery %R.S.D.
CP 10 8.42±0.03 84.23 0.41 50 49.58±0.21 99.17 0.44
BD 10 9.33±0.04 93.36 0.44 50 47.09±0.08 94.19 0.18
CT 10 9.35±0.07 93.49 0.80 50 49.03±0.14 98.07 0.28
HQ 10 11.03�0.20 110.33 1.84
20 20.15�0.48 100.73 2.39
BQ 15 14.86�0.58 99.09 3.93
20 19.63�0.02 98.15 0.11
KA 8.0 7.27�0.02 90.83 0.21
20 19.16�0.07 95.80 0.37
NC 15 14.33�0.36 95.56 2.49
20 19.13�0.12 95.67 0.62
ARB 10 10.03�0.28 100.29 2.84
20 19.61�0.26 98.07 1.37
Recovery (%) = (mean of found concentration/spiked concentration) × 100. R.S.D. (%) = (S.D./mean concentration) × 100.
95
3.2.3 Precision
The precision of analysis measures the degree of repeatability of an analytical method
and is normally expressed as the percent relative standard deviation for a significant
number of samples with different ranges of concentration. The precision of the method
was determined from the intra-day (same day) and inter-day (over a period of three days)
analysis. Three different standard solutions were prepared for each of the active
ingredients and analysed following the method described in Section 2.3.4.6.
The results obtained from the intra-day and inter-day precision analysis are summarised
in Table 3.4. The percent relative standard deviation (%R.S.D.) for the intra-day precision
ranged from 0.17 to 8.16% while that of the inter-day precision ranged from 0.14 to
4.78%. Likewise, the % accuracies obtained from the precision analysis fell within an
acceptable range. The intra-day analysis % accuracy ranged from 83.1 to 114.2% and the
inter-day analysis % accuracy ranged from 84.2 to 114.4%.

96
Table 3.4: Determination of precision for intra-day and inter-day variability.
Active ingredients
Retention time/min
Concentration/mg L-1
Intra-day (n = 9) Inter-day (n = 9)
Found/mg L-1 R.S.D./%
Accuracy/%
Found/mg L-1 R.S.D./%
Accuracy/%
CP 2.80-3.00 1.0 0.94�0.004 0.39 94.1 0.94±0.007 0.79 94.3
4.0 3.74�0.025 0.67 93.5 3.76±0.023 0.61 93.9
8.0 7.82�0.042 0.54 97.7 7.95�0.033 0.41 99.4
BD 3.50-3.70 1.0 0.92�0.005 0.59 91.9 0.92±0.012 1.27 91.7
4.0 3.72�0.006 0.17 93.1 3.73±0.019 0.52 93.2
8.0 7.83�0.098 1.25 97.9 7.92�0.038 0.48 99.0
CT 4.50-4.80 1.0 0.83�0.029 3.55 83.1 0.84±0.024 2.81 84.2
4.0 3.65�0.137 3.76 91.1 3.74±0.026 0.69 93.5
8.0 7.96�0.024 0.29 99.5 7.98�0.011 0.14 99.7
HQ 7.90-8.10 2.0 2.18�0.112 5.15 109.2 2.14�0.100 4.69 106.9
10 11.48�0.087 0.76 114.2 11.4�0.087 0.76 114.4
20 18.71�0.191 1.02 93.5 18.83�0.227 1.21 94.2
BQ 15.45-15.70 2.0 1.91�0.066 3.46 95.7 1.96�0.026 1.35 97.8
8.0 7.74�0.064 0.83 96.8 7.72�0.091 1.18 96.5

97
20 19.17�0.067 0.35 95.8 19.19�0.069 0.36 95.9
KA 6.15-6.30 1.0 0.94�0.077 8.16 94.4 0.94�0.045 4.78 93.9
10 10.13�0.054 0.53 101.3 11.15�0.111 0.99 111.5
20 18.08�0.126 0.69 90.4 18.16�0.064 0.35 90.8
NC 2.60-2.70 5.0 4.57�0.078 1.71 91.5 4.59�0.042 0.93 91.9
10 9.66�0.129 1.34 96.6 11.0�0.093 0.85 110.1
20 19.81�0.066 0.33 99.1 19.9�0.063 0.32 99.6
ARB 6.0-6.15 2.0 1.93�0.116 5.99 96.4 1.96�0.091 4.63 97.9
12 12.05�0.245 2.03 100.4 12.19�0.216 1.77 101.6
20 19.32�0.147 0.76 96.6 19.42�0.322 1.66 97.1
Accuracy (%) = (mean of found concentration/theoretical amount) × 100.

98
3.3 Amount of skin-lightening agents detected in skin-lightening
products
A total of 35 cream samples were prepared and quantitatively analysed for the presence
of SLAs, such as CP, BD, CT, HQ, BQ, KA, NC, and ARB, following the HPLC method
developed. It was found that out of the 35 cream samples analysed, 32 contained at least
one of these eight agents (see Table 3.5). The HPLC chromatograms of these cream
samples are shown in Appendix E and the peak areas obtained for the detected SLAs are
given in Appendix F.
Fifteen out of the thirty-five cream samples analysed contained HQ in the range of 0.017
– 7.096% (m/m). Of these, only five cream samples listed HQ in the ingredients with
four stating the content percentage to be 2%. Two more cream samples (SLP 12 and 18)
were found to indicate HQ in the list of ingredients but as p-hydroxyphenol. This can be
perceived as deliberately misleading since this is an unpopular name for HQ among users
of skin bleaching creams. As seen in Table 3.5, two cream samples contain HQ below
1.0% (m/m) (0.017 – 0.924% m/m), nine cream samples have HQ above 1% (m/m) (1.024
– 1.916% m/m) and four cream samples have HQ above 2% (m/m) (2.429 – 7.096% m/m)
which counters the proposed US FDA ruling of 2% HQ in marketing over-the-counter
skin-lightening creams. Six cream samples containing HQ were found to also contain
BQ. This can be attributed to the hydrolysis of HQ into BQ as it is usually unstable in
some formulations. The BQ concentration in our cream samples was found to be in the
range of 0.005 – 0.015% (m/m).
For the purpose of dermatological therapy, HQ was one of the most prescribed agents for
treating hyperpigmentation until 2006 when the US FDA placed a ban on over-the-
counter HQ products due to its toxicity (16). Currently, products containing HQ above
2% are only sold by prescription in the US. Reports have revealed the health risks
associated with the use of high concentrations of HQ and its long-term exposure. They
include irritant contact dermatitis, allergic contact dermatitis, nail discolouration,
decreased skin elasticity, trimethylaminuria, exogenous ochronosis and much more (59).
In contrast to the US FDA, the Nigerian Food and Drug Agency (NAFDAC) and the
South Africa government have placed a total ban on any amount of HQ in over-the-
counter products (40, 198). This is also the case in the UK and EU (16). Of great concern

99
is that the cream sample (SLP 18) with the highest amount of HQ (7.096% m/m) was
found to be manufactured in one of the EU countries which could imply that the inclusion
of HQ as an active ingredient in over-the-counter SLPs is permitted for export only in
some EU countries. From the results obtained, it shows that despite the bans, products
containing high concentrations of HQ are still available and sold illegally in the Nigerian
market. Regulations on the quality of import products is weak or not there at all.
KA was found in nine cream samples ranging from 0.017 – 1.412% (m/m), with only
three of the creams indicating KA among their ingredients. Only one of the nine cream
samples (SLP 15) was found to contain KA above 1% (m/m). The allowed amount of
KA is still not unanimously agreed on but according to reports from the Personal Care
Product Council (100), KA is commonly used at a concentration of 0.1 – 2.0 %. However,
based on the margin of safety calculation, KA at a maximum concentration of 1% is
considered unsafe (100). Nevertheless, KA is still to be approved by the US FDA in over-
the-counter products (100) and has been reported to be banned in Japan due to its
mutagenicity concerns (9). Thus, going by the afore-mentioned reports, it is safer to avoid
over-the-counter SLPs with KA as the active ingredient.
NC was also identified in four cream samples ranging from 0.029 – 1.827% (m/m). Only
one of the four cream samples (SPL 24) indicated NC in the list of ingredients. NC was
also listed in another of the cream samples (SLP 12) but was not detected from the
analysis. The amount of NC allowed in SLPs is still to be established and this could be
the reason why some manufacturers introduce the use of NC and some other bleaching
agents with unknown safety profiles in over-the-counter SLPs.
One cream sample (SLP 16) was indicated to contain ARB in the list of ingredients but
upon analysis, this agent could not be detected. However, ARB has been shown to be a
safer SLA in comparison with HQ (102).
Steroid compounds, such as CP, BD and CT, were detected in 13 cream samples with two
of the samples (SLP 9 and 20) containing both CP and CT. The steroid compounds were
all indicated in the list of ingredients, stating their content percentage (see Table 2.1).
Although one of the cream samples (SLP 25) claimed to contain CP, it was found to
contain BD instead. Ten of the cream samples contain CP in the range of 0.007 – 0.035%
(m/m), three contained BD in the range of 0.019 – 0.027% (m/m) and two contained CT

100
in the range of 0.007 – 0.012% (m/m). Hence, all the steroid compounds contained in the
cream samples do not exceed the allowed limits of 0.05% (m/m) CP, 0.065% (m/m) BD
and 1.0% (m/m) CT for medical use. However, these cream samples are all sold as over-
the-counter products for skin bleaching purposes. Ideally, any cream containing steroid
compounds should be considered a pharmaceutical product and should only be sold as a
prescription drug or when sold as an over-the-counter product should only be used within
seven days under medical supervision. Failure to observe this can be very detrimental to
the users’ health. The addition of steroid compounds in skin bleaching creams has been
seriously warned against by the US FDA irrespective of the potency or amount due to
their severe side-effects (16). Steroids can be absorbed systematically and result in
several detrimental health effects such as acne vulgaris, allergic contact dermatitis,
Cushing syndrome, diabetes mellitus, steroid addiction syndrome, ophthalmological
conditions such as cataracts and glaucoma, and many more (59).
Samples 6, 7 and 16 were found to contain none of the studied SLAs in this study. Thus,
in this selection of Nigerian SLPs, the most prevalent SLAs were HQ, BQ, KA, NC, CP,
BD and CT as shown in Figure 3.5. As shown in bar graph (A) it can be observed that
HQ, the gold standard for skin-bleaching, is the most detected SLA in the studied SLPs
followed by KA, BQ and then NC. Whereas in SLPs containing steroid compounds (see
bar graph B), CP is the most detected SLA followed by BD and then CT.

101
Figure 3.5: Prevalence of skin-lightening agents detected in the investigated products.
Each of the SLPs analysed in this study has its own purchase price (see Table 2.1) and
these can actually be a deciding factor on their sales. Looking at the price range (4000-
150 Naira) of the studied SLPs, it is only ideal for one to assume that the more expensive
products might be the safer products to use in terms of the type or level of SLAs they
contained. Figure 3.6 relates the cost of each of the studied SLPs to the level of their
detected SLAs in order to confirm if the most expensive products are actually safer in
comparison with the cheaper products.
0
0,005
0,01
0,015
0,02
0,025
0,03
0,035
0,04
Con
cent
ratio
n/%
(m/m
)(B)
CP
CT
BD

102
Figure 3.6: Levels of SLAs detected in the studied SLPs compared to their cost.
For the purpose of this study, SLPs above 1000 Naira are considered expensive, those
above 500 Naira are considered moderately cheap and those below 500 Naira are
considered cheap since most of the population can afford SLPs at this cost.
As shown in bar graph (A) of Figure 3.6, the cost of the SLPs ranged from the most
expensive sample (4000 Naira) to the cheapest sample (350 Naira). It can be observed
that all the expensive SLPs have HQ below the 2% proposed limit by the US FDA.
Nevertheless, the expensive SLPs were observed to contain more than one SLA. This
can be HQ combined with either KA or NC or all the three SLAs together. There are no
established guide-lines for KA and NC, but KA is still to be approved by the US FDA for
use in over-the-counter products due to its mutagenic concerns (100). In assessing other
SLPs that fall in the range of moderately cheap to cheap it can be observed that most of
these samples have HQ in line with the proposed US FDA regulations too, except in the
case of some samples (SLP 14, 18, 22, and 23) containing HQ above 2%. Another notable
observation with SLPs in this range is the unstable nature of HQ in them. The presence
of BQ in some of these cheaper products proves that HQ has been oxidised. This means
HQ is unstable in the formulation.
As observed in bar graph (B) of Figure 3.6, only SLPs containing steroid compounds were
compared for their cost relative to the level of SLAs detected. The price ranged from
0
0,01
0,02
0,03
0,04
0,05
750 SLP9
450 SLP20
250 SLP27
250 SLP26
250 SLP29
250 SLP25
250 SLP28
200 SLP32
200 SLP33
200 SLP31
200 SLP30
150 SLP34
150 SLP35
Con
cent
ratio
n/%
(m/m
)
Cost/Naira
(B)
CP CT BD

103
750-150 Naira. It can be seen that the sample that cost most contained the highest amount
of CP. Here, there is no significant difference in relation to the levels of SLAs detected
and the purchase price of the SLPs except in the case of SLP 30 with a lower level of CP.
Judging from the results of this study, there is no convincing proof to show that the more
expensive SLPs are actually safer than the cheaper SLPs. One can only make reference
to some of the moderately cheap and cheap SLPs (SLP 14, 18, 22, and 23) as the most
unsafe products in this study since many other cheaper SLPs have similar levels of
detected SLAs as the expensive ones. It is also important to note that most of the so called
‘expensive SLPs’ analysed in this study declared none of the SLAs detected or false
ingredients on their labels. However, some of the investigated SLAs were positively
detected. This is a clear tactic of luring users to buy the expensive products.
Table 3.5: Levels of active ingredients detected (n = 3).
Sample code Sample label claim
Active ingredient detected
Mean concentration /%(m/m) ± confidence interval
SLP 1 —— HQ 1.205±0.228
—— KA 0.442±0.025 —— NC 0.029±0.035
SLP 2 —— HQ 0.924±0.227 —— KA 0.245±0.025 —— NC 0.063±0.035
SLP 3 KA KA 0.530±0.025 —— HQ 1.741±0.229 —— NC 0.049±0.035
SLP 4 —— HQ 1.024±0.227 —— KA 0.476±0.025
SLP5 —— HQ 1.916±0.229 —— KA 0.155±0.025
SLP 8 —— HQ 0.017±0.226 —— KA 0.786±0.026
SLP 9 CP CP 0.035±0.008 CT CT 0.012±0.007

104
SLP 10 HQ HQ 1.635�0.229 SLP 11 HQ HQ 1.592�0.228 SLP 12 HQ HQ 1.111�0.227
—— BQ 0.015�0.011 SLP 13 —— HQ 1.729�0.229
—— BQ 0.007�0.011 SLP 14 —— HQ 2.429�0.231
—— BQ 0.009�0.011 SLP 15 —— KA 1.412�0.028 SLP 17 KA KA 0.017�0.025 SLP 18 HQ HQ 7.096�0.265
—— BQ 0.006�0.011 SLP 19 KA KA 0.663�0.025 SLP 20 CP CP 0.029±0.008
CT CT 0.007±0.007 SLP 21 HQ HQ 1.889�0.229 SLP 22 HQ HQ 4.129�0.240
—— BQ 0.005�0.011 SLP 23 HQ HQ 3.700�0.238
—— BQ 0.009�0.011 SLP 24 NC NC 1.827�0.039 SLP 25 CP BD 0.019±0.007 SLP 26 CP CP 0.032±0.008 SLP 27 CP CP 0.033±0.008 SLP 28 BD BD 0.026±0.007 SLP 29 CP CP 0.021±0.008 SLP 30 CP CP 0.007±0.008 SLP 31 CP CP 0.024±0.008 SLP 32 CP CP 0.032±0.008 SLP 33 CP CP 0.027±0.008 SLP 34 CP CP 0.019±0.008 SLP 35 BD BD 0.027±0.007

105
3.4 Validation of ICP-OES and CV-AAS methods
The MHS 15 mercury hydride system together with a PerkinElmer Analyst 200 AAS and
a PerkinElmer Optical 5300 DV ICP-OES were used to determine the levels of mercury
and other heavy metals in the studied SLPs respectively. The linearity and accuracy of
the techniques used were determined by using the external standard calibration method
and recovery studies. The results of these validations are provided in Sections 3.4.1 and
3.4.2 respectively. The problem of spectral interference which usually occurs for
elemental analysis with ICP-OES was well minimised by choosing detection wavelengths
where minimal interference occurred.
3.4.1 Linearity of calibration plots for heavy metal analysis
An external standard method was used to obtain nine-point calibration curves for each of
the metals. The curves were plotted by using the data generated from the standard
solutions. The standard solutions were prepared in three replicates for each of the metals
following the procedure described in Section 2.4.2.1 and were measured in the same way
to obtain three data points. The calibration data for the metals is given in Appendix G
and the calibration curves with their corresponding residual plots are shown in Appendix
H.
Linear regression analysis (at the 95% confidence level) of the calibration data for the
metals was performed by using Microsoft Excel 2013 Analysis Tool Pak. The LOD and
LOQ of each metal was estimated from the slope and standard error of the calibration
curves by using equation (2.2) and (2.3) given in Section 2.5 respectively. As seen in
Table 3.6, the method had LODs in the range of 0.007 – 0.011 mg L-1 and LOQs in the
range of 0.025 – 0.088 mg L-1. Likewise, acceptable correlation coefficient (R2) values
greater than 0.995 were obtained for the calibration curves of all the metals.

106
Table 3.6: Results from the linear regression analysis of the calibration data for heavy metals.
Parameters Al Cr Cu Fe Mn Ni Pb Zn
Calibration range/mg L-1 0.01-1.6 0.01-1.6 0.01-1.6 0.01-1.6 0.01-1.6 0.01-1.6 0.01-1.6 0.01-1.6
Slope/L mg-1 59756 38901 219185 59962 285242 19683 1165.3 36679
Standard error of slope 215.7 91.6 1170.7 526.1 1154.5 62.9 4.2 92.1
Correlation Coefficient (R2) 0.9997 0.9999 0.9993 0.9980 0.9996 0.9997 0.9997 0.9998
LOD/mg L-1 0.011 0.007 0.016 0.026 0.012 0.009 0.011 0.008
LOQ/mg L-1 0.036 0.024 0.053 0.088 0.040 0.032 0.036 0.025

107
The results of the linear regression analysis for mercury are given in Table 3.7. An
acceptable correlation coefficient, R2, value of 0.9989 was obtained from the calibration
curve of mercury and the LOD and LOQ values were less than 0.025 and 0.08 ng
respectively.
Table 3.7: Results from the linear regression analysis of the calibration data for the determination of mercury.
Parameters Value Calibration range/ng 100-800
Slope/ng 7.334 � 10-4
Standard error of slope 5.184 � 10-6
Correlation Coefficient (R2) 0.9989
LOD/ng 0.022
LOQ/ng 0.074
3.4.2 Accuracy
Recovery tests were carried out so as to check the accuracy of the methods used for
quantitation of metals. This was done by spiking cream samples with known amounts of
the element of interest as described in Section 2.4.4. The results obtained from the
recovery tests are summarised in Table 3.8. The mean percentage recovery for all the
metals analysed ranged from 95.6 – 112.7% and the percent relative standard deviation
(%R.S.D.) ranged from 0.12 to 5.64%.

108
Table 3.8: Recovery data for heavy metal quantification in skin-lightening products (n = 3).
Element Spiked amount /µg g-1
Found/µg g-1 Recovery % Standard deviation
%R.S.D.
Al 0.05 0.049 98.14 0.0004 0.89
1.20 1.181 98.39 0.0092 0.78
Cr 0.02 0.020 100.24 0.0002 0.99
0.20 0.219 109.51 0.0091 4.17
Cu 0.02 0.019 99.3 0.0009 4.89
0.07 0.068 98.28 0.0018 2.62
Fe 0.08 0.079 99.07 0.0007 0.88
1.10 1.083 98.43 0.0013 0.12
Hg 0.25 0.282 112.76 2.974 1.05
0.45 0.496 110.26 2.182 0.44
Mn 0.02 0.019 99.17 0.0011 5.64
0.04 0.038 95.63 0.0005 1.23
Ni 0.02 0.019 98.07 0.0002 1.22
0.30 0.299 99.87 0.0023 0.76
Pb 0.05 0.049 97.43 0.0008 1.59
1.0 0.978 97.83 0.0023 0.23
Zn 0.08 0.078 97.75 0.0008 1.08
1.50 1.485 98.99 0.0119 0.80

109
3.5 Levels of mercury and heavy metals detected in skin-lightening
products
A total of 35 SLPs were investigated for the presence of 12 heavy metals (As, Al, Cd, Co,
Cr, Cu, Fe, Mn, Ni, Pb, Zn and Hg) in this study. As seen in Table 3.9, only nine of the
metals (Al, Cr, Cu, Fe, Mn, Ni, Pb, Zn and Hg) were detected in the studied SLPs.
Arsenic, cadmium and cobalt could not be detected.
Aluminium was detected in all the cream samples investigated at concentrations ranging
from 0.039 to 0.354 µg g-1. Among the cream samples analysed, SLP 12 was found to
contain the highest level of Al but this value is much lower than the level found in
Brazilian make-up products (199). Although, no guideline has yet been established for
Al in cosmetic products, studies have shown it to cause changes in some biological
processes. It is suggested that Al at high concentration can result in a decreased rate of
DNA synthesis, an increase in DNA replication errors and affinity of linker histones for
DNA (200).
Chromium was detected in 21 cream samples. The concentration of Cr found ranged
from 0.010 to 0.217 µg g-1. The levels of Cr found in the cream samples were similar to
some of those found in body creams from Dubai, India, and Pakistan (201), and some
personal care products in Nigeria (4). The level of Cr in the cream samples was found to
be lower than the reported value capable of inducing immediate side-effects. This could
imply that continued or long-term exposure to cosmetic products with a low level of Cr
is unsafe too. Side-effects, such as skin rashes, kidney and liver damage, lung cancer,
and respiratory problems, have been reported to be associated with chromium exposure
(4). However, complications associated with chromium exposure are dependent upon its
oxidation state. In accordance with the IARC classification, Cr(VI) compounds are
considered carcinogenic to humans while metallic Cr and Cr(III) compounds were not
classifiable as human carcinogens due to lack of reassuring evidence in humans (202).
Reports have also shown that Cr(VI) can diffuse through the skin more easily than Cr(III)
due to its higher solubility (203, 204), with the contact time, sweat at low pH and the
application of a cleanser being contributing factors (205).

110
Lead was detected in all the studied cream samples, however, at low concentration. The
concentration of Pb ranged from 0.012 to 0.026 µg g-1. The concentrations of Pb in the
cream samples are lower than the concentrations found in some cosmetic products in
Nigeria (150). Pb concentrations in the cream samples were below the 10 µg g-1 limit
that was established for Pb in specified cosmetics by Health Canada (206) and the 20 µg
g-1 limit established as an impurity in colour additives in cosmetics for external use (207).
However, even at low concentration, Pb has been indicated as a cause for concern since
it can be absorbed through the skin especially after long-term exposure (208). Hence, the
concentrations of Pb in the studied cream samples do not indicate an immediate health
concern.
Nickel was detected in 26 cream samples with concentrations ranging from 0.010 to 0.433
µg g-1. The levels of Ni in the studied cream samples were similar to those found in
moisturising and skin-lightening creams in Nigeria (152). Ni with other metals, such as
Cr and Co, are known inducers of allergic contact dermatitis both at occupational and
environmental levels (175). However, the levels of Ni in our cream samples were below
the 5 µg g-1 limit proposed by scientific literature as a good manufacturing practice and
an ultimate target level of 1 µg g-1 in order to minimise the risk of sensitization for very
sensitive individuals (209).
The copper concentrations ranged from 0.017 to 0.050 µg g-1 and copper was detected in
all the studied cream samples. The level of Cu in the cream samples is very low to cause
any immediate health concerns. However, cases of immune reactions, as a result of Cu
exposure from intra-uterine devices or handling of euro coins, have been reported (152).
Iron and manganese are two essential elements involved in a number of biological
processes. They are both reported to have relatively low toxicity. Neurological disorders,
such as anger, aggression, and criminality, are said to be associated with Mn exposure
(210) and the cumulative effect of long-term exposure to low levels of Fe may result in
cellular death or colorectal cancer (211, 212). The concentration of Fe in the studied
cream samples ranged from 0.112 to 1.252 µg g-1 which is lower than those reported in
moisturising and skin-lightening creams in Nigeria (152). Fe was detected in all the
cream samples. Low levels of Mn were detected in 22 of the studied cream samples. The
concentrations of Mn in the cream samples ranged from 0.012 to 0.053 µg g-1.

111
Zinc was detected in all the studied cream samples, with SLP 14 (1.535 µg g-1) and SLP
33 (76.33 µg g-1) having the highest concentrations of Zn. The concentrations of Zn in
the cream samples ranged from 0.018 to 76.33 µg g-1. High levels of Zn have been
reported in body creams in Dubai, India, and Pakistan (201) and in personal care products
in Nigeria (4). Cream samples found to have a high concentration of Zn may serve in the
form of ZnO as a broad spectrum inorganic ultraviolet (UV) radiation filter in creams.
Despite the importance of Zn to the body, cumulative effects of high concentration
dosages can cause brittle nails, neurological abnormalities, as well as gastrointestinal
disorders and convulsions (152).
Mercury was detected in only one of the studied cream samples (SLP 6) at a concentration
of 69.86 µg g-1. Under conditions of good manufacturing practice, trace amounts of
mercury in cosmetics are unavoidable and it has been established by the US FDA that
mercury in cosmetics should be less than 1 µg g-1 (213). The concentration of Hg in
cream sample SLP 6 is far above the allowed limit of 1 µg g-1 by the World Health
Organization (WHO) (214) and the 3.0 µg g-1 limit allowed by Health Canada (206).
High concentrations of Hg have been reported in skin-lightening creams in Syria and
extremely high concentrations of Hg in Mexican facial whitening creams (215). Hg can
be absorbed through the skin and can accumulate in the brain, kidney, and liver tissues
(141). This may result in several health issues such as psychological, neurological, and
immunological conditions and much more (137). Cream SLP 6 was not found to contain
any other SLA (see Section 3.3). Thus, the high amount of Hg found here is indicative
that it was not an impurity from the manufacturing process but that it was added as the
active SLA. It is well known that mercury salts bleach the skin (16). The use of Hg as a
SLA is banned and should not be found present in SLPs.
3.6 Systemic exposure dosage and margin of safety for metals
The systemic exposure dosage (SED) and margin of safety (MoS) in this study were
estimated by using equations 2.10 and 2.8, respectively, as given in Section 2.5. The
values of SED and MoS obtained from the use of the studied SLPs are displayed in Tables
3.10 and 3.11 for 100% dermal absorption respectively. A minimum MoS value of 100

112
has been proposed by the World Health Organization (WHO) as acceptably safe for a
product to be used on the human body (191).
The estimated SED for Al in this study ranged from 1.16 × 10⁻⁵ to 1.05 × 10⁻⁴ mg kg-1 bw
day-1. This does not exceed the provisional tolerable daily intake (PTDI) of 1.43 × 10⁻¹
mg kg-1 bw day-1 set by the WHO (216). The estimated SED of Pb from the use of the
studied SLPs ranged from 3.57 × 10⁻⁶ to 1.93 × 10⁻⁵ mg kg-1 bw day-1. A PTDI of 3.6 ×
10-3 mg kg-1 bw day-1 was used as the indicative value for comparing the results, even
though the existing PTDI has been withdrawn by the combined FOA/WHO in 2011 as it
could not be considered health protective (217). The estimated SED values for Ni, Cr
and Cu of the investigated SLPs ranged from 2.97 × 10⁻⁶ to 1.29 × 10⁻⁴, 3.86 × 10⁻⁶ to 6.45
× 10-5 and 5.05 × 10⁻⁶ to 2.59 × 10⁻⁵ mg kg-1 bw day-1, respectively. They are all below
their respective recommended daily intake/tolerable intake values of 1.2 × 10⁻², 3.3 × 10-
3 and 8.33 × 10⁻² mg kg-1 bw day-1 (217). The recommended daily intake (RDI) for Mn,
Zn and Fe is set at 1.5 × 10⁻¹ (218), 12.0 and 12.5 mg kg-1 bw day-1, respectively (217).
Their respective SEDs in the current study ranged from 3.57 × 10⁻⁶ to 1.57 × 10⁻⁵, 5.65 ×
10-6 to 2.27 × 10⁻² and 1.93 × 10⁻⁶ to 3.72 × 10⁻⁴ mg kg-1 bw day-1. The SED of Hg in
sample SLP 6 was 2.07 × 10⁻² mg kg-1 bw day-1. This is above the established WHO
PTDI value of 7.14 × 10⁻⁴ mg kg-1 bw day-1 (194, 219), making the product unsafe for
use. The estimated SED for other metals studied were within their respective
recommended PTDI or RDI values.
As shown in Table 3.11, the MoS value of Hg (2.4085) in sample SLP 6 is far less than
the minimum value of 100 proposed by WHO to guarantee product safety. This should
be a cause for concern since the safety of the product cannot be guaranteed. All other
metals examined in the studied SLPs have MoS values greater than 100. This makes the
level of the metal contents detected in other SLPs safe.

113
Table 3.9: Levels of heavy metals detected in different samples of skin-lightening products analysed in this study (n = 3).
Sample codes
Mean concentration ± SD/µg g-1 Al Cr Cu Fe Hg Mn Ni Pb Zn
SLP 1 0.137±0.0005 0.010±0.0003 0.022±0.0003 0.209±0.0059 - 0.013±0.0001 0.017±0.0011 0.022±0.0099 0.030±0.0006
SLP 2 0.132±0.0008 0.019±0.0006 0.043±0.0001 0.243±0.0021 - 0.012±0.0001 0.064±0.0005 0.014±0.0024 0.023±0.0001
SLP 3 0.122±0.0031 0.217±0.0016 0.051±0.0010 1.252±0.0108 - 0.053±0.0001 0.433±0.0018 0.020±0.0120 0.023±0.0003
SLP 4 0.137±0.0009 0.032±0.0001 0.056±0.0005 0.304±0.0010 - 0.015±0.0001 0.069±0.0005 0.020±0.0073 0.018±0.0004
SLP 5 0.117±0.0014 0.013±0.0002 0.025±0.0003 0.169±0.0003 - <LOD 0.032±0.0001 0.016±0.0016 0.021±0.0005
SLP 6 0.089±0.0005 <LOD 0.022±0..0001 0.149±0.0001 69.86±0.8921 <LOD 0.018±0.0007 0.020±0.0113 0.021±0.0003
SLP 7 0.196±0.0010 0.171±0.0009 0.046±0.0004 0.458±0.0016 - 0.026±0.0001 0.166±0.0016 0.022±0.0033 0.145±0.0005
SLP 8 0.091±0.0047 0.013±0.0007 0.034±0.0034 0.160±0.0060 - 0.012±0.0004 0.061±0.0031 0.017±0.0011 0.070±0.0005
SLP 9 0.173±0.0025 0.064±0.0003 0.051±0.0003 0.298±0.0009 - 0.017±0.0001 0.059±0.0004 0.024±0.0058 0.113±0.0003
SLP 10 0.050±0.0001 0.043±0.00004 0.034±0.0001 0.280±0.0003 - 00.023±0.0001 0.145±0.0013 0.025±0.0108 0.019±0.0003
SLP 11 0.074±0.0003 0.013±0.0005 0.053±0.0002 0.207±0.0007 - 0.017±0.0002 0.035±0.0007 0.024±0.0092 0.032±0.0003
SLP 12 0.354±0.0019 <LOD 0.035±0.0003 0.150±0.0006 - 0.022±0.0001 0.010±0.0006 0.025±0.0016 0.042±0.0003
SLP 13 0.118±0.0002 0.033±0.0005 0.018±0.0003 0.252±0.0002 - 0.021±0.0001 0.097±0.0013 0.018±0.0069 0.061±0.0007
SLP 14 0.243±0.0022 0.021±0.0006 0.037±0.0004 0.135±0.0005 - 0.013±0.0001 0.041±0.0009 0.025±0.0100 1.535±0.0140
SLP 15 0.073±0.0024 0.032±0.0006 0.024±0.0012 0.147±0.0021 - <LOD 0.010±0.0004 0.018±0.0146 0.059±0.0007
SLP 16 0.049±0.0010 0.036±0.0002 0.033±0.0002 0.175±0.0007 - 0.015±0.0002 0.059±0.0008 0.012±0.0070 0.030±0.0006
SLP 17 0.043±0.0003 <LOD 0.026±0.0002 0.127±0.0002 - <LOD <LOD 0.017±0.0088 0.022±0.0002
SLP 18 0.046±0.0010 <LOD 0.031±0.0001 0.122±0.0006 - <LOD <LOD 0.022±0.0027 0.026±0.0001
SLP 19 0.061±0.0019 0.030±0.0009 0.035±0.0026 0.315±0.0136 - 0.020±0.0004 0.080±0.0014 0.019±0.0020 0.028±0.0003
SLP 20 0.075±0.0005 0.115±0.0013 0.047±0.0005 0.218±0.0029 - 0.013±0.0002 0.099±0.0012 0.024±0.0055 0.052±0.0001
SLP 21 0.104±0.0005 0.017±0.0003 0.050±0.0003 0.225±0.0010 - 0.020±0.0001 0.073±0.0014 0.021±0.0038 0.038±0.0001

114
SLP 22 0.039±0.0008 0.041±0.0004 0.022±0.0002 0.151±0.0008 - 0.012±0.0001 0.030±0.0008 0.023±0.0060 0.019±0.0003
SLP 23 0.051±0.0007 <LOD 0.019±0.0002 0.120±0.0002 - <LOD 0.032±0.0004 0.023±0.0088 0.026±0.0001
SLP 24 0.062±0.0008 <LOD 0.018±0.0002 0.124±0.0009 - <LOD <LOD 0.014±0.0037 0.032±0.0004
SLP 25 0.258±0.0045 0.121±0.0004 0.017±0.0001 0.373±0.0026 - 0.012±0.0001 0.050 ±0.0006 0.015±0.0149 0.041±0.0003
SLP 26 0.141±0.0081 <LOD 0.023±0.0026 0.122±0.0066 - <LOD <LOD 0.019±0.0018 0.063±0.0003
SLP 27 0.106±0.0250 <LOD 0.020±0.0017 0.112±0.0051 - <LOD 0.010±0.0004 0.017±0.0026 0.020±0.0002
SLP 28 0.068±0.0009 <LOD 0.048±0.0005 0.065±0.0004 - <LOD <LOD 0.022±0.0082 0.239±0.0002
SLP 29 0.304±0.0028 <LOD 0.024±0.0006 0.122±0.0003 - 0.012±0.0001 <LOD 0.019±0.0031 0.074±0.0004
SLP 30 0.095±0.0027 <LOD 0.035±0.0013 0.139±0.0035 - 0.013±0.0003 0.013±0.0006 0.026±0.0081 0.052±0.0003
SLP 31 0.302±0.0053 0.090±0.0006 0.051±0.0003 0.285 ±0.0013 - 0.012±0.0001 0.025±0.0012 0.019±0.0062 0.020±0.0001
SLP 32 0.162±0.0001 <LOD 0.031±0.0002 0.114±0.0002 - <LOD <LOD 0.021±0.0054 0.067±0.0002
SLP 33 0.050±0.0013 0.014±0.0004 0.024±0.0013 0.136±0.0003 - 0.012±0.0001 0.014±0.0005 0.065±0.0029 76.33±0.3055
SLP 34 0.060±0.0007 <LOD 0.087±0.0007 0.120±0.0002 - <LOD <LOD 0.013±0.0016 0.035±0.0003
SLP 35 0.093±0.0066 <LOD 0.023±0.0032 0.122±0.0062 - <LOD <LOD 0.017±0.0054 0.083±0.0008

115
Table 3.10: Systemic exposure dosage values of metals in skin-lightening products for 100% dermal absorption.
Sample codes
Systemic Exposure Dosage/mg kg-1 bw day-1
Al Cr Cu Fe Hg Mn Ni Pb Zn
SLP 1 4.07 × 10⁻⁵ 2.97 × 10⁻⁶ 6.54 × 10⁻⁶ 6.21 × 10⁻⁵ 0.00 3.86 × 10⁻⁶ 5.05 × 10⁻⁶ 6.54 × 10⁻⁶ 8.91 × 10⁻⁶
SLP 2 3.92 × 10⁻⁵ 5.65 × 10⁻⁶ 1.28 × 10⁻⁵ 7.22 × 10⁻⁵ 0.00 3.57 × 10⁻⁶ 1.90 × 10⁻⁵ 4.16 × 10⁻⁶ 6.83 × 10⁻⁶
SLP 3 3.63 × 10⁻⁵ 6.45 × 10⁻⁵ 1.52 × 10⁻⁵ 3.72 × 10⁻⁴ 0.00 1.57 × 10⁻⁵ 1.29× 10⁻⁴ 5.94 × 10⁻⁶ 6.83 × 10⁻⁶
SLP 4 4.07 × 10⁻⁵ 9.51 × 10⁻⁶ 1.66 × 10⁻⁵ 9.03 × 10⁻⁵ 0.00 4.46 × 10⁻⁶ 2.05 × 10⁻⁵ 5.94 × 10⁻⁶ 5.35 × 10⁻⁶
SLP 5 3.48 × 10⁻⁵ 3.86 × 10⁻⁶ 7.43 × 10⁻⁶ 5.02 × 10⁻⁵ 0.00 0.00 9.51 × 10⁻⁶ 4.75 × 10⁻⁶ 6.24 × 10⁻⁶
SLP 6 2.64 × 10⁻⁵ 0.00 6.54 × 10⁻⁶ 4.43 × 10⁻⁵ 2.08 × 10⁻² 0.00 5.35 × 10⁻⁶ 5.94 × 10⁻⁶ 6.24 × 10⁻⁶
SLP 7 5.82 × 10⁻⁵ 5.08 × 10⁻⁵ 1.37 × 10⁻⁵ 1.36 × 10⁻⁴ 0.00 7.73 × 10⁻⁶ 4.93 × 10⁻⁵ 6.54 × 10⁻⁶ 4.31 × 10⁻⁵
SLP 8 2.70 × 10⁻⁵ 3.86 × 10⁻⁶ 1.01 × 10⁻⁵ 4.75 × 10⁻⁵ 0.00 3.57 × 10⁻⁶ 1.81 × 10⁻⁵ 5.05 × 10⁻⁶ 2.08 × 10⁻⁵
SLP 9 5.14 × 10⁻⁵ 1.90 × 10⁻⁵ 1.52 × 10⁻⁵ 8.86 × 10⁻⁵ 0.00 5.05 × 10⁻⁶ 1.75 × 10⁻⁵ 7.13 × 10⁻⁶ 3.36 × 10⁻⁵
SLP 10 1.49 × 10⁻⁵ 1.28 × 10⁻⁵ 1.01 × 10⁻⁵ 8.32 × 10⁻⁵ 0.00 6.83 × 10⁻⁶ 4.31 × 10⁻⁵ 7.43 × 10⁻⁶ 5.65 × 10⁻⁶
SLP 11 2.19 × 10⁻⁵ 3.86 × 10⁻⁶ 1.57 × 10⁻⁵ 6.15 × 10⁻⁵ 0.00 5.05 × 10⁻⁶ 1.04 × 10⁻⁵ 7.13 × 10⁻⁶ 9.51 × 10⁻⁶
SLP 12 1.05 × 10⁻⁴ 0.00 1.04 ×10⁻⁵ 4.46 × 10⁻⁵ 0.00 6.54 × 10⁻⁶ 2.97 × 10⁻⁶ 7.43 × 10⁻⁶ 1.25 × 10⁻⁵
SLP 13 3.51 × 10⁻⁵ 9.81 × 10⁻⁶ 5.35 × 10⁻⁶ 7.49 × 10⁻⁵ 0.00 6.24 × 10⁻⁶ 2.88 × 10⁻⁵ 5.35 × 10⁻⁶ 1.81 × 10⁻⁵
SLP 14 7.22 × 10⁻⁵ 6.24 × 10⁻⁶ 1.09 × 10⁻⁵ 4.01 × 10⁻⁵ 0.00 3.86 × 10⁻⁶ 1.22 × 10⁻⁵ 7.43 × 10⁻⁶ 4.56× 10⁻⁴
SLP 15 2.17 × 10⁻⁵ 9.51 × 10⁻⁶ 7.13 × 10⁻⁶ 4.37 × 10⁻⁵ 0.00 0.00 2.97 × 10⁻⁶ 5.35 × 10⁻⁶ 1.75 × 10⁻⁵
SLP 16 1.46 × 10⁻⁵ 1.07 × 10⁻⁵ 9.81 × 10⁻⁶ 5.20 × 10⁻⁵ 0.00 4.46 × 10⁻⁶ 1.75 × 10⁻⁵ 3.57 × 10⁻⁶ 8.91 × 10⁻⁶
SLP 17 1.28 × 10⁻⁵ 0.00 7.73 × 10⁻⁶ 3.77 × 10⁻⁵ 0.00 0.00 0.00 5.05 × 10⁻⁶ 6.54 × 10⁻⁶
SLP 18 1.37 × 10⁻⁵ 0.00 9.21 × 10⁻⁶ 3.63 × 10⁻⁵ 0.00 0.00 0.00 6.54 × 10⁻⁶ 7.73 × 10⁻⁶
SLP 19 1.81 × 10⁻⁵ 8.91 × 10⁻⁶ 1.04 × 10⁻⁵ 9.36 × 10⁻⁵ 0.00 5.94 × 10⁻⁶ 2.38 × 10⁻⁵ 5.65 × 10⁻⁶ 8.32 × 10⁻⁶

116
SLP 20 2.23 × 10⁻⁵ 3.42 × 10⁻⁵ 1.39 × 10⁻⁵ 6.48 × 10⁻⁵ 0.00 3.86 × 10⁻⁶ 2.94 × 10⁻⁵ 7.13 × 10⁻⁶ 1.55 × 10⁻⁵
SLP 21 3.09 × 10⁻⁵ 5.05 × 10⁻⁶ 1.49 × 10⁻⁵ 6.69 × 10⁻⁵ 0.00 5.94 × 10⁻⁶ 2.17 × 10⁻⁵ 6.24 × 10⁻⁶ 1.13 × 10⁻⁵
SLP 22 1.16 × 10⁻⁵ 1.22 × 10⁻⁵ 6.54 × 10⁻⁶ 4.49 × 10⁻⁵ 0.00 3.57 × 10⁻⁶ 8.91 × 10⁻⁶ 6.83 × 10⁻⁶ 5.65 × 10⁻⁶
SLP 23 1.52 × 10⁻⁵ 0.00 5.65 × 10⁻⁶ 3.57 × 10⁻⁵ 0.00 0.00 9.51 × 10⁻⁶ 6.83 × 10⁻⁶ 7.73 × 10⁻⁶
SLP 24 1.84 × 10⁻⁵ 0.00 5.35 × 10⁻⁶ 3.68 × 10⁻⁵ 0.00 0.00 0.00 4.16 × 10⁻⁶ 9.51 × 10⁻⁶
SLP 25 7.67 × 10⁻⁵ 3.59 × 10⁻⁵ 5.05 × 10⁻⁶ 1.11 × 10⁻⁴ 0.00 3.57 × 10⁻⁶ 1.49 × 10⁻⁵ 4.46 × 10⁻⁶ 1.22 × 10⁻⁶
SLP 26 4.19 × 10⁻⁵ 0.00 6.83 × 10⁻⁶ 3.63 × 10⁻⁵ 0.00 0.00 0.00 5.65 × 10⁻⁶ 1.87 × 10⁻⁵
SLP 27 3.15 × 10⁻⁵ 0.00 5.94 × 10⁻⁶ 3.33 × 10⁻⁵ 0.00 0.00 2.97 × 10⁻⁶ 5.05 × 10⁻⁶ 5.94 × 10⁻⁶
SLP 28 2.02 × 10⁻⁵ 0.00 1.43 × 10⁻⁵ 1.93 × 10⁻⁵ 0.00 0.00 0.00 6.54 × 10⁻⁶ 7.10 × 10⁻⁵
SLP 29 9.03 × 10⁻⁵ 0.00 7.13 × 10⁻⁶ 3.63 × 10⁻⁵ 0.00 3.57 × 10⁻⁶ 0.00 5.65 × 10⁻⁶ 2.19 × 10⁻⁵
SLP 30 2.82 × 10⁻⁵ 0.00 1.04 × 10⁻⁵ 4.13 × 10⁻⁵ 0.00 3.86 × 10⁻⁶ 3.86 × 10⁻⁶ 7.73 × 10⁻⁶ 1.55 × 10⁻⁵
SLP 31 8.97 × 10⁻⁵ 2.67 × 10⁻⁵ 1.52 × 10⁻⁵ 8.47 × 10⁻⁵ 0.00 3.57 × 10⁻⁶ 7.43 × 10⁻⁶ 5.65 × 10⁻⁶ 5.94 × 10⁻⁶
SLP 32 4.81 × 10⁻⁵ 0.00 9.21 × 10⁻⁶ 3.39 × 10⁻⁵ 0.00 0.00 0.00 6.24 × 10⁻⁶ 1.99 × 10⁻⁵
SLP 33 1.49 × 10⁻⁵ 4.16 × 10⁻⁶ 7.13 × 10⁻⁶ 4.04 × 10⁻⁵ 0.00 3.57 × 10⁻⁶ 4.16 × 10⁻⁶ 1.93 × 10⁻⁵ 2.27 × 10⁻²
SLP 34 1.78 × 10⁻⁵ 0.00 2.59 × 10⁻⁵ 3.57 × 10⁻⁵ 0.00 0.00 0.00 3.86 × 10⁻⁶ 1.04 × 10⁻⁵
SLP 35 2.76 × 10⁻⁵ 0.00 6.83 × 10⁻⁶ 3.63 × 10⁻⁵ 0.00 0.00 0.00 5.05 × 10⁻⁶ 2.47 × 10⁻⁵

117
Table 3.11: Margin of safety values of metals in skin-lightening products for 100% dermal absorption.
Sample codes
Margin of Safety
Al Cr Cu Fe Hg Mn Ni Pb Zn
SLP 1 245634.3 100955.7 611852.8 1127097.1 0.00 3624051.3 395904.8 61185.3 3365190.5
SLP 2 254938.7 53134.6 313040.9 969396.4 0.00 3926055.5 105162.2 96148.3 4389378.9
SLP 3 275835.3 4652.3 263936.5 188149.6 0.00 888918.2 15543.6 67303.8 4389378.9
SLP 4 245634.3 31548.7 240370.7 774879.4 0.00 3140844.4 97541.8 67303.8 5608650.8
SLP 5 287623.1 77658.2 538430.5 1393865.9 0.00 0.00 210324.4 84129.8 4807414.9
SLP 6 378111.3 0.00 611852.8 1580961.9 2.4085 0.00 373910.1 67303.8 4807414.9
SLP 7 171693.4 5903.8 292625.3 514330.4 0.00 1812025.6 40544.5 61185.3 696246.3
SLP 8 369801.2 77658.2 395904.8 1472270.8 0.00 3926055.5 110334.1 79180.9 1442224.5
SLP 9 194519.7 15774.3 263936.5 790480.9 0.00 2771333.3 114074.3 56086.5 893413.4
SLP 10 673038.1 23478.1 395904.8 841297.6 0.00 2048376.8 46416.4 53843.0 5313458.6
SLP 11 454755.5 77658.2 253976.6 1137987.1 0.00 2771333.3 192296.6 56086.5 3154866.1
SLP 12 95061.9 0.00 384593.2 1570422.2 0.00 2141484.8 673038.1 53843.0 2403707.5
SLP 13 285185.6 30592.6 747820.1 934775.1 0.00 2243460.3 69385.4 74782.0 1655011.7
SLP 14 138485.2 48074.1 363804.4 1744913.6 0.00 3624051.3 164155.6 53843.0 65769.2
SLP 15 460984.9 31548.7 560865.1 1602471.7 0.00 0.00 673038.1 74782.0 1711113.8
SLP 16 686773.6 28043.3 407901.9 1346076.2 0.00 3140844.4 114074.3 112173.0 3365190.5
SLP 17 782602.4 0.00 517721.6 1854829.4 0.00 0.00 0.00 79180.9 4588896.1
SLP 18 731563.1 0.00 434218.1 1930846.9 0.00 0.00 0.00 61185.3 3882912.1
SLP 19 551670.6 33651.9 384593.2 747820.1 0.00 2355633.3 84129.8 70846.1 3605561.2

118
SLP 20 448692.1 8778.8 286399.2 1080565.7 0.00 3624051.3 67983.6 56086.5 1941456.0
SLP 21 323576.0 59385.7 269215.2 1046948.1 0.00 2355633.3 92196.9 64098.9 2656729.3
SLP 22 862869.4 24623.3 611852.8 1560022.1 0.00 3926055.5 224346.0 58525.1 5313458.6
SLP 23 659841.3 0.00 708461.2 1963027.8 0.00 0.00 210324.4 58525.1 3882912.1
SLP 24 542772.7 0.00 747820.1 1899704.3 0.00 0.00 0.00 96148.3 3154866.1
SLP 25 130433.7 8343.4 791809.5 631537.1 0.00 3926055.5 134607.6 89738.4 2462334.5
SLP 26 238665.9 0.00 585250.5 1930846.9 0.00 0.00 0.00 70846.1 1602471.7
SLP 27 317470.8 0.00 673038.1 2103244.0 0.00 0.00 673038.1 79180.9 5047785.7
SLP 28 494880.9 0.00 280432.5 3624051.1 0.00 0.00 0.00 61185.3 422408.8
SLP 29 110697.1 0.00 560865.1 1930846.9 0.00 3926055.5 0.00 70846.1 1364266.4
SLP 30 354230.6 0.00 384593.2 1694700.2 0.00 3624051.3 517721.6 51772.2 1941456.0
SLP 31 111430.1 11217.3 263936.5 826538.0 0.00 3926055.5 269215.2 70846.1 5047785.7
SLP 32 207727.8 0.00 434218.1 2066345.0 0.00 0.00 0.00 64098.9 1506801.7
SLP 33 673038.1 72111.2 560865. 1732083.3 0.00 3926055.5 480741.5 20708.9 1322.6
SLP 34 560865.1 0.00 154721.1 1963027.8 0.00 0.00 0.00 103544.3 2884448.9
SLP 35 361848.4 0.00 585250.5 1930846.9 0.00 0.00 0.00 79180.9 1216333.9

119
Chapter 4
CONCLUSIONS AND RECOMMENDATIONS
A number of skin-lightening formulations commonly available in the Nigerian market
were investigated in this study. Only 28% of the sample products were manufactured in
Nigeria. The remaining 72% of the sample products were either manufactured in
America, Europe, Asia or other African Countries.
A total of 35 skin-lightening formulations were analysed for the quantitative
determination of some selected organic active ingredients and heavy metals. The organic
active ingredients were quantified by means of HPLC and the heavy metals were
quantified by means of ICP-OES and/or CV-AAS. All analytical methods employed in
this study were fully validated in terms of precision, detection and quantification limits,
linearity and recovery.
Determination of skin-lightening agents by means of HPLC
The active ingredients investigated in our sample products by means of HPLC included
clobetasol propionate, betamethasone dipropionate, clotrimazole, hydroquinone,
benzoquinone, kojic acid, niacinamide and arbutin.
An external standard method was used to prepare a calibration curve for each active
ingredient. The correlation coefficients of all the calibration curves were in the acceptable
range of a value greater than 0.95. The hydroquinone standard had the lowest correlation
coefficient of 0.9942, while both betamethasone dipropionate and clotrimazole had the
highest correlation coefficient values of 0.9995. The limits of detection obtained for
hydroquinone, benzoquinone, kojic acid, niacinamide, arbutin, clobetasol propionate,
betamethasone dipropionate and clotrimazole were 0.029, 0.026, 0.014, 0.016, 0.012,
0.008, 0.007 and 0.007 mg L-1 respectively and the limits of quantitation were 0.097,
0.085, 0.046, 0.052, 0.039, 0.028, 0.026 and 0.025 respectively.
Intra-day and inter-analyses were used to test the precision of the method. The percent
relative standard deviation (%R.S.D.) for the intra-day precision ranged from 0.17 to
8.16% while that of the inter-day precision ranged from 0.14 to 4.78%. A recovery

120
analysis was used to test the accuracy of the method. The calculated recoveries for all the
active ingredient were within an acceptable range. The obtained percent recoveries
ranged from 84.23 to 110.33%.
Arbutin was not detected in any of the products. A total number of 32 samples (92%)
were found to contain at least one or more of the other active ingredients. Hydroquinone
was detected in 15 samples with only five of the samples properly labelled. The
concentration of hydroquinone in the samples ranged from 0.017 to 7.096%. Some of the
samples containing hydroquinone were found to contain benzoquinone. Hydroquinone
is usually unstable in some formulations and hydrolyses to benzoquinone. The six
samples found to contain benzoquinone ranged from 0.005 to 0.015%. Kojic acid was
detected in nine samples in the range of 0.017 to 1.412%. However, only three samples
specified kojic acid as an ingredient in the formulations. Four samples were found to
contain niacinamide, with only one listing niacinamide on the label. Although, one more
sample listed niacinamide among its ingredients, it was not detected after analysis. The
concentration of niacinamide in the samples ranged from 0.029 to 1.827%. Arbutin was
indicated to be present in one of the sample products but, upon analysis, it was not
detected. Steroid compounds were detected in 13 of the studied samples with all the
samples properly labelled. Although one sample claimed to contain clobetasol
propionate, after analysis it was found to contain betamethasone dipropionate. Eight
samples were found to contain clobetasol propionate alone, two samples were found to
contain both clobetasol propionate and clotrimazole, and three samples were found to
contain betamethasone dipropionate only. The concentrations of clobetasol propionate,
betamethasone dipropionate and clotrimazole were found in the range of 0.007 to 0.035,
0.019 to 0.027 and 0.007 to 0.012% (m/m) respectively.
Determination of heavy metals by means of ICP-OES and/or CV-AAS
All skin-lightening formulations were screened for the presence of arsenic, aluminium,
cadmium, cobalt, chromium, copper, iron, manganese, nickel, lead, and zinc by means of
ICP-OES and mercury was screened for by means of CV-AAS.
The correlation coefficients for all the different metal calibration curves ranged from
0.9980 to 0.9999. The limits of detection and quantitation of the different metals varied

121
from 0.007 to 0.026 and 0.024 to 0.088 mg L-1 respectively. The methods were found to
have good recovery values ranging from 95.6 to 112.7%.
Arsenic, cadmium and cobalt were not detected in any of the sample products.
Aluminium was detected in all the samples and the maximum concentration detected was
0.354 µg g-1. There is no established guideline for aluminium, but certain health concerns
have been reported from its high dosage. Iron, manganese, and copper were detected in
most of the samples at levels not exceeding 1.252, 0.053, and 0.056 µg g-1, respectively.
This should not be a threat to the health of users of the products since these are essential
elements required in a number of biological processes at low concentration. However,
cumulative effects of long-term exposure to these elements even at low concentration is
unsafe. Zinc was detected in all the samples but was relatively high in one of the samples
(76.33 µg g-1). It may have been present in this sample as a sunscreen filter to protect the
user against the harmful effects derived from solar ultraviolet exposure. This is
particularly important in SLPs where the formation of the natural UV filter, melanin, is
being prevented. Zinc is a vital element to the body but not required at high concentration.
Chromium was found in twenty-one samples at a maximum concentration (0.217 µg g-1)
that cannot induce allergenic contact dermatitis.
Lead was detected in all samples with concentrations not exceeding 0.026 µg g-1 and
nickel was detected in 26 samples at a maximum concentration of 0.433 µg g-1. The levels
detected for both metals do not exceed the maximum limits allowed as impurities in
colour additives in cosmetics for external use. One sample (SLP 6) was found to have a
relatively high level of mercury (69.86 µg g-1). This level of mercury in a skin-lightening
cream is alarming due to its high toxicity. The severe health implications of mercury are
why it is completely banned in cosmetics.
The values of SED and MoS obtained for the studied SLPs show that the level of the
metal contents detected in these products are safe for use except in the case of the sample
SLP 6 containing a relatively high level of Hg, where it’s SED and MoS values are outside
the WHO limits.
As gathered from the results of this study, the initial concern of some skin-lightening
formulations commonly available in the Nigerian market containing either banned
ingredients or exceeding imposed limits of allowed ingredients and improper labelling of

122
these products was justified. The findings in this study further expose the continued
inclusion of banned and toxic ingredients, such as hydroquinone, mercury and very potent
steroids like clobetasol propionate and betamethasone dipropionate, in SLPs. These
ingredients are known to be detrimental and pose a serious health risk if the frequency of
application, the surface area of the body applied, and the duration of practice are
considered. Severe and permanent side-effects such as exogenous ochronosis, decreased
skin elasticity, trimethylaminuria, Cushing syndrome, diabetes mellitus, steroid addiction
syndrome, gingivostomatitis, paradoxical hyperpigmentation and many more have been
reported from using SLPs containing these toxic ingredients (59).
Often, users are advised to double check the labelling of any skin-care product or any
other cosmetics products before purchase. However, it is worrisome to know that even
when users double check the labelling, one cannot be certain of the actual contents of
these products as evident from some of the findings in this study. We, therefore,
discourage the use of these products for skin-lightening purposes. For skin conditions
that do require treatment with such products, appropriate consultation from a medical
practitioner is recommended.
Furthermore, regulating agencies, especially in a country like Nigeria where skin-
bleaching is fashionable, must establish and enforce more stringent regulations restricting
the use of banned and harmful ingredients in commercial skin-lightening products. Such
regulations should extend to importation or smuggling of skin-lightening or any other
cosmetic products containing banned or toxic ingredients since 72% of the cream samples
investigated in this study were found to be manufactured in other countries but are in
circulation in the study area. Efforts must also be made by appropriate authorities to
enlighten users and the general public on the possible dangers associated with skin-
bleaching practices.
Future work can investigate some newly used plant extracts as active ingredients in skin-
lightening formulations. Manufacturers have now opted for the inclusion of some plant
extracts with unknown safety profiles in skin-lightening products not minding the amount
added as far as the desired effects of skin-lightening are achieved. Examples of such
extracts include mulberry root extracts, licorice extracts, lemon extracts, and more.
Moreover, parabens used as preservatives in skin-lightening products also need to be

123
investigated. Most of the studied cream samples in this study were found to contain one
or more of these parabens (methyl, ethyl, propyl, and butyl parabens). Toxicity concerns
of preservatives at high concentration have been reported (220, 221).

124
REFERENCES
1. Brenner, M. and V. J. Hearing (2008) Modifying skin pigmentation–approaches through intrinsic biochemistry and exogenous agents. Drug Discovery Today: Disease Mechanisms 5, e189-e199.
2. Carsberg, C., H. Warenius and P. Friedmann (1994) Ultraviolet radiation-induced melanogenesis in human melanocytes. Effects of modulating protein kinase C. Journal of Cell Science 107, 2591-2597.
3. Al-Saleh, I., S. Al-Enazi and N. Shinwari (2009) Assessment of lead in cosmetic products. Regulatory Toxicology and Pharmacology 54, 105-113.
4. Ayenimo, J., A. Yusuf, A. Adekunle and O. Makinde (2010) Heavy metal exposure from personal care products. Bulletin of Environmental Contamination and Toxicology 84, 8-14.
5. Nnorom, I., J. Igwe and C. Oji-Nnorom (2005) Trace metal contents of facial (make-up) cosmetics commonly used in Nigeria. African Journal of Biotechnology 4, 1133-1138.
6. Nourmoradi, H., M. Foroghi, M. Farhadkhani and M. Vahid Dastjerdi (2013) Assessment of lead and cadmium levels in frequently used cosmetic products in Iran. Journal of Environmental and Public Health 2013, 1-5.
7. DeCaprio, A. P. (1999) The toxicology of hydroquinone—relevance to occupational and environmental exposure. Critical reviews in toxicology 29, 283-330.
8. Findlay, G. and H. De Beer (1980) Chronic hydroquinone poisoning of the skin from skin-lightening cosmetics. South Africa Medical Journal 57, 187-190.
9. Petit, L. and G. Pierard (2003) Skin-lightening products revisited. International journal of cosmetic science 25, 169-181.
10. Gillbro, J. and M. Olsson (2011) The melanogenesis and mechanisms of skin-lightening agents–existing and new approaches. International Journal of Cosmetic Science 33, 210-221.
11. Ly, F., A. S. Soko, D. A. Dione, S. O. Niang, A. Kane, T. I. Bocoum, M. T. Dieng and B. Ndiaye (2007) Aesthetic problems associated with the cosmetic use of bleaching products. International Journal of Dermatology 46, 15-17.
12. Mahe, A., F. Ly, G. Aymard and J. M. Dangou (2003) Skin diseases associated with the cosmetic use of bleaching products in women from Dakar, Senegal. British Journal of Dermatology 148, 493-500.
13. Panusa, A., M. Ottaviani, M. Picardo, E. Camera, L. Gagliardi, P. Chimenti, A. Granese and D. Tonelli (2004) Analysis of corticosteroids by high performance liquid chromatography–electrospray mass spectrometry. Analyst 129, 719-723.

125
14. Halder, R. and G. Richards (2006) In Photoaging in pigmented skins. Dermatology and dermatological therapy of pigmented skins, Boca Raton, 211-220.
15. Mahé, A., F. Ly and J. L. Perret (2005) Systemic complications of the cosmetic use of skin-bleaching products. International Journal of Dermatology 44, 37-38.
16. Al-Saleh, I., R. Elkhatib, R. Al-Rouqi, S. Al-Enazi and N. Shinwari (2012) The dangers of skin-lightening creams. Toxicological & Environmental Chemistry 94, 195-219.
17. Blay, Y. A. (2011) Skin bleaching and global white supremacy: By way of introduction. Journal of Pan African Studies 4, 4-46.
18. Glenn, E. N. (2008) Yearning for lightness: Transnational circuits in the marketing and consumption of skin lighteners. Gender & Society, 1-22.
19. Adebajo, S. (2002) An epidemiological survey of the use of cosmetic skin lightening cosmetics among traders in Lagos, Nigeria. Mercury 5, 43-48.
20. Del Giudice, P. and P. Yves (2002) The widespread use of skin lightening creams in Senegal: a persistent public health problem in West Africa. International Journal of Dermatology 41, 69-72.
21. Malangu, N. and G. Ogunbanjo (2006) Predictors of topical steroid misuse among patrons of pharmacies in Pretoria. South African Family Practice 48, 14-14e.
22. Kandarova, H. (2006) Evaluation and validation of reconstructed human skin models as alternatives to animal tests in regulatory toxicology. PhD thesis, Freie Universität Berlin.
23. Wagner, H., N. Zghoul, C.-M. Lehr and U. F. Schäfer (2002) Human skin and skin equivalents to study dermal penetration and permeation. Cell culture models of biological barriers: in vitro test systems for drug absorption and delivery, 289-309.
24. Snell, R. (1967) An electron microscopic study of the human epidermal keratinocyte. Zeitschrift für Zellforschung und Mikroskopische Anatomie 79, 492-506.
25. Eckert, R. L. (1989) Structure, function, and differentiation of the keratinocyte. Physiological Reviews 69, 1316-1346.
26. Schaefer, H. and T. Redelmeier (1996) Composition and structure of the stratum corneum. Principles of Percutaneous Absorption, 43-86.
27. Muehlenbein, M. P. (2010) Human Evolutionary Biology. Cambridge University Press, New York.
28. Webb, A. R. (2006) Who, what, where and when—influences on cutaneous vitamin D synthesis. Progress in Biophysics and Molecular Biology 92, 17-25.

126
29. Mosher, D., T. Fitzpatrick, J. Ortonne and Y. Hori (1999) Normal skin color and general considerations of pigmentary disorders. Dermatology in General Medicine. New York, Mcgraw-Hill, pp 936-944.
30. Jablonski, N. G. (2012) Living color: the biological and social meaning of skin color. University of California Press.
31. Fitzpatrick, T. B. (1988) The validity and practicality of sun-reactive skin types I through VI. Archives of Dermatology 124, 869-871.
32. Mercurio, D., J. Segura, M. Demets and P. Maia Campos (2013) Clinical scoring and instrumental analysis to evaluate skin types. Clinical and Experimental Dermatology 38, 302-309.
33. Meredith, P. and T. Sarna (2006) The physical and chemical properties of eumelanin. Pigment Cell Research 19, 572-594.
34. Riley, P. A. (1997) Melanin. The International Journal of Biochemistry & Cell Biology 29, 1235-1239.
35. Slominski, A., D. J. Tobin, S. Shibahara and J. Wortsman (2004) Melanin pigmentation in mammalian skin and its hormonal regulation. Physiological Reviews 84, 1155-1228.
36. Ito, S., K. Wakamatsu and H. Ozeki (2000) Chemical analysis of melanins and its application to the study of the regulation of melanogenesis. Pigment Cell Research 13, 103-109.
37. Vincensi, M., A. Napolitano, E. Procaccini, G. Riccio, G. Monfrecola, P. Santoianni and G. Prota (1998) Phaeomelanin versus eumelanin as a chemical indicator of ultraviolet sensitivity in fair-skinned subjects at high risk for melanoma: a pilot study. Melanoma Research 8, 53-58.
38. D'Orazio, J., S. Jarrett, A. Amaro-Ortiz and T. Scott (2013) UV radiation and the skin. International Journal of Molecular Sciences 14, 12222-12248.
39. Dyall-Smith, D. J. and J. P. Scurry (1990) Mercury pigmentation and high mercury levels from the use of a cosmetic cream. The Medical Journal of Australia 153, 409-410, 414-405.
40. Olumide, Y. M., A. O. Akinkugbe, D. Altraide, T. Mohammed, N. Ahamefule, S. Ayanlowo, C. Onyekonwu and N. Essen (2008) Complications of chronic use of skin lightening cosmetics. International Journal Of Dermatology 47, 344-353.
41. Plensdorf, S. and J. Martinez (2009) Common pigmentation disorders. American Family Physician 79, 109-116.
42. Al-Saleh, I. and I. Al-Doush (1997) Mercury content in skin-lightening creams and potential hazards to the health of Saudi women. Journal of Toxicology and Environmental Health 51, 123-130.

127
43. Prota, G. (1995) The chemistry of melanins and melanogenesis. In Fortschritte der Chemie organischer Naturstoffe/Progress in the Chemistry of Organic Natural Products. pp. 93-148. Springer.
44. Ito, S. (2003) A chemist's view of melanogenesis. Pigment Cell Research 16, 230-236.
45. Pawelek, J. M. (1991) After dopachrome? Pigment Cell Research 4, 53-62.
46. Carstam, R., C. Brinck, A. Hindemith-Augustsson, H. Rorsman and E. Rosengren (1991) The neuromelanin of the human substantia nigra. Biochimica et Biophysica Acta (BBA)-Molecular Basis of Disease 1097, 152-160.
47. Double, K., L. Zecca, P. Costi, M. Mauer, C. Griesinger, S. Ito, D. Ben-Shachar, G. Bringmann, R. Fariello and P. Riederer (2000) Structural characteristics of human substantia nigra neuromelanin and synthetic dopamine melanins. Journal of Neurochemistry 75, 2583-2589.
48. Zecca, L., D. Tampellini, M. Gerlach, P. Riederer, R. Fariello and D. Sulzer (2001) Substantia nigra neuromelanin: structure, synthesis, and molecular behaviour. Molecular Pathology 54, 414.
49. Kolbe, L., T. Mann, W. Gerwat, J. Batzer, S. Ahlheit, C. Scherner, H. Wenck and F. Stäb (2013) 4-n-butylresorcinol, a highly effective tyrosinase inhibitor for the topical treatment of hyperpigmentation. Journal of the European Academy of Dermatology and Venereology 27, 19-23.
50. Chang, T.-S. (2012) Natural melanogenesis inhibitors acting through the down-regulation of tyrosinase activity. Materials 5, 1661-1685.
51. Tsong-Min, C. (2012) Tyrosinase and tyrosinase inhibitors. Journal of Biocatalysis & Biotransformation 1, 1-2.
52. Parvez, S., M. Kang, H. S. Chung, C. Cho, M. C. Hong, M. K. Shin and H. Bae (2006) Survey and mechanism of skin depigmenting and lightening agents. Phytotherapy Research 20, 921-934.
53. Katsambas, A. D. and A. J. Stratigos (2001) Depigmenting and bleaching agents: coping with hyperpigmentation. Clinics in Dermatology 19, 483-488.
54. Draelos, Z. D. (2007) Skin lightening preparations and the hydroquinone controversy. Dermatologic Therapy 20, 308-313.
55. Kamagaju, L., R. Morandini, E. Bizuru, P. Nyetera, J. B. Nduwayezu, C. Stévigny, G. Ghanem and P. Duez (2013) Tyrosinase modulation by five Rwandese herbal medicines traditionally used for skin treatment. Journal of Ethnopharmacology 146, 824-834.

128
56. Dooley, T. (1997) Topical skin depigmentation agents: current products and discovery of novel inhibitors of melanogenesis. Journal of Dermatological Treatment 8, 275-283.
57. Jimbow, K. and Y. Minamitsuji (2001) Topical therapies for melasma and disorders of hyperpigmentation. Dermatologic Therapy 14, 35-45.
58. Xiaoying, R. C. W. J. M., H. R. C. S. S. Hongbo and Z. D. Q. H. I. Maibach (1998) Human in vivo and in vitro hydroquinone topical bioavailability, metabolism, and disposition. Journal of Toxicology and Environmental Health Part A 54, 301-317.
59. Ladizinski, B., N. Mistry and R. V. Kundu (2011) Widespread use of toxic skin lightening compounds: medical and psychosocial aspects. Dermatologic Clinics 29, 111-123.
60. Smith, C. J., K. B. O'hare and J. C. Allen (1988) Selective cytotoxicity of hydroquinone for melanocyte-derived cells is mediated by tyrosinase activity but independent of melanin content. Pigment Cell Research 1, 386-389.
61. Palumbo, A., M. d'Ischia, G. Misuraca and G. Prota (1991) Mechanism of inhibition of melanogenesis by hydroquinone. Biochimica et Biophysica Acta-General Subjects 1073, 85-90.
62. Pathak, M. A., T. B. Fitzpatrick and E. W. Kraus (1986) Usefulness of retinoic acid in the treatment of melasma. Journal of the American Academy of Dermatology 15, 894-899.
63. Glenn, M., P. Grimes, M. Chalet, E. Pitts and A. Kelly (1991) Evaluation of clinical and light microscopic effects of various concentrations of hydroquinone. Clinical Research 39, A83-A83.
64. Garcia-Lopez, M. (1989) Double-blind comparison of azelaic acid and hydroquinone in the treatment of melasma. Acta Derm Venereol (Stockh) 143, 58-61.
65. Health-Council-of-the-Netherlands (2012) Hydroquinone and benzoquinone. Healthbased recommended occupational exposure limit. The Hague: Health Council of the Netherlands.
66. Government Gazette no. R2892; (1988) ‘Ban of Hydroquinone and Other Harmful Ingredients in Skin Lighteners’ in South Africa.
67. Nordlund, J., P. Grimes and J. P. Ortonne (2006) The safety of hydroquinone. Journal of the European Academy of Dermatology and Venereology 20, 781-787.
68. Baliña, L. M. and K. Graupe (1991) The treatment of melasma 20% azelaic acid versus 4% hydroquinone cream. International Journal of Dermatology 30, 893-895.

129
69. Grimes, P. E. (2004) A microsponge formulation of hydroquinone 4% and retinol 0.15% in the treatment of melasma and postinflammatory hyperpigmentation. Cutis 74, 362-368.
70. Garcia, R. L., J. W. White Jr and W. F. Willis (1978) Hydroquinone nail pigmentation. Archives of Dermatology 114, 1402.
71. Arndt, K. A. and T. B. Fitzpatrick (1965) Topical use of hydroquinone as a depigmenting agent. Jama 194, 965-967.
72. Mann, R. and R. Harman (1983) Nail staining due to hydroquinone skin-lightening creams. British Journal of Dermatology 108, 363-365.
73. Anderson, B. (1947) Corneal and conjunctival pigmentation among workers engaged in manufacture of hydroquinone. Archives of Ophthalmology 38, 812-826.
74. Naumann, G. (1966) Corneal damage in hydroquinone workers: a clinicopathologic study. Archives of Ophthalmology 76, 189-194.
75. Karamagi, C., E. Owino and E. Katabira (2001) Hydroquinone neuropathy following use of skin bleaching creams: case report. East African Medical Journal 78, 223-224.
76. Ajose, F. O. (2005) Consequences of skin bleaching in Nigerian men and women. International Journal of Dermatology 44, 41-43.
77. Ruocco, V. and M. Florio (1995) Fish-odor syndrome: An olfactory diagnosis. International Journal of Dermatology 34, 92-93.
78. Findlay, G. H., J. Morrison and I. Simson (1975) Exogenous ochronosis and pigmented colloid milium from hydroquinone bleaching creams. British Journal of Dermatology 93, 613-622.
79. Levitt, J. (2007) The safety of hydroquinone: a dermatologist's response to the 2006 Federal Register. Journal of the American Academy of Dermatology 57, 854-872.
80. Phornphutkul, C., W. J. Introne, M. B. Perry, I. Bernardini, M. D. Murphey, D. L. Fitzpatrick, P. D. Anderson, M. Huizing, Y. Anikster and L. H. Gerber (2002) Natural history of alkaptonuria. New England Journal of Medicine 347, 2111-2121.
81. Pick, L. (1906) Uber die ochronosis klin. Wochenschr 43, 478-480.
82. Dogliotti, M. and M. Leibowitz (1979) Granulomatous ochronosis--a cosmetic-induced skin disorder in Blacks. South African Medical Journal 56, 757-760.
83. Charlín, R., C. B. Barcaui, B. K. Kac, D. B. Soares, R. Rabello-Fonseca and L. Azulay-Abulafia (2008) Hydroquinone-induced exogenous ochronosis: a report of four cases and usefulness of dermoscopy. International Journal of Dermatology 47, 19-23.

130
84. Levin, C. Y. and H. Maibach (2001) Exogenous ochronosis. American Journal of Clinical Dermatology 2, 213-217.
85. Hoshaw, R. A., K. G. Zimmerman and A. Menter (1985) Ochronosislike pigmentation from hydroquinone bleaching creams in American blacks. Archives of Dermatology 121, 105-108.
86. Ly, F., A. Kane, A. Déme, N. Ngom, S. Niang, R. Bello, L. Rethers, J. Dangou, M. Dieng and P. Diousse (2010) First cases of squamous cell carcinoma associated with cosmetic use of bleaching compounds. Annales de Dermatologie et de Venereologie 137, 128-131.
87. Addo, H. (2000) Squamous cell carcinoma associated with prolonged bleaching. Ghana Medical Journal 34.
88. IARC (1999) 1,4-Benzoquinone (para-quinone). In: Re-evaluation of some organic chemicals, hydrazine and hydrogen peroxide. Proceedings of the IARC Working Group on the Evaluation of Carcinogenic Risks to Humans. International Agency for Research on Cancer, Lyon, France.
89. Omaye, S., R. Wirtz and J. Fruin (1980) Toxicity of substituted p-benzoquinones found in the secretion of tenebrionid flour beetles. Proceedings of the Western Pharmacology Society 24, 169-171.
90. Iskander, K. and A. K. Jaiswal (2005) Quinone oxidoreductases in protection against myelogenous hyperplasia and benzene toxicity. Chemico-Biological Interactions 153, 147-157.
91. Joseph, P. and A. Jaiswal (2000) A unique cytosolic activity related but distinct from NQO1 catalyses metabolic activation of mitomycin C. British Journal of Cancer 82, 1305-1311.
92. IARC (1977) Hydroquinone and benzoquinone. In: IARC Monographs on the Evaluation of Carcinogenic Risks to Humans, Some fumigants, the herbicides 2,4-D and 2,4,5-T, chlorinated dibenzodioxins and miscellaneous industrial chemicals. International Agency for Research on Cancer, Lyon, France 15.
93. Rajka, G. and S. Blohm (1970) The allergenicity of paraphenylendiamine. II. Acta Dermato-Venereologica 50, 51-54.
94. ACGIH (2001) Quinone. In: Documentation of the Threshold Limit Values and Biological Exposure Indices. American Conference of Governmental Industrial Hygienists, Cincinnati, Ohio, USA.
95. Serif, G. S. and L. Seymour (1963) Catabolism and excretion of the antithyroid substance, diacetyl-2, 6-diiodohydroquinone. Biochemical Pharmacology 12, 885-889.

131
96. ACGIH (2008) In: Documentation of the Threshold Limit Values and Biological Exposure Indices. American Conference of Governmental Industrial Hygienists, Cincinnati, Ohio, USA.
97. US.EPA (2008) Quinone (p-benzoquinone) (CAS 106-51-4) US Environmental Protection Agency,Washington DC, USA; 2000. http://www.epa.gov/ttn/atw/hlthef/quinone.html (Accessed 25th October 2016).
98. NIOSH (2005) Hydroquinone US Department of Health and Human Services, National Institute for Occupational Safety and Health, Washington DC, USA. http://www.cdc.gov/niosh/npg/npgd0338.html (Accessed 25th October 2016).
99. Lim, J. T. E. (1999) Treatment of melasma using kojic acid in a gel containing hydroquinone and glycolic acid. Dermatologic Surgery 25, 282-284.
100. Burnett, C. L., W. F. Bergfeld, D. V. Belsito, R. A. Hill, C. D. Klaassen, D. C. Liebler, J. G. Marks, R. C. Shank, T. J. Slaga and P. W. Snyder (2010) Final report of the safety assessment of kojic acid as used in cosmetics. International journal of toxicology 29, 244S-273S.
101. Garcia, A. and J. E. Fulton (1996) The combination of glycolic acid and hydroquinone or kojic acid for the treatment of melasma and related conditions. Dermatologic surgery 22, 443-447.
102. Rendon, M. I. and J. I. Gaviria (2005) Review of skin-lightening agents. Dermatologic Durgery 31, 886-890.
103. Dlova, N. C., N. E. Hendricks and B. S. Martincgh (2012) Skin-lightening creams used in Durban, South Africa. International journal of dermatology 51, 51-53.
104. Hakozaki, T., L. Minwalla, J. Zhuang, M. Chhoa, A. Matsubara, K. Miyamoto, A. Greatens, G. Hillebrand, D. Bissett and R. Boissy (2002) The effect of niacinamide on reducing cutaneous pigmentation and suppression of melanosome transfer. British Journal of Dermatology 147, 20-31.
105. Sarkar, R., M. Bhalla and A. J. Kanwar (2002) A comparative study of 20% azelaic acid cream monotherapy versus a sequential therapy in the treatment of melasma in dark-skinned patients. Dermatology 205, 249-254.
106. Schallreuter, K. U. and J. Wood (1987) Azelaic acid as a competitive inhibitor of thioredoxin reductase in human melanoma cells. Cancer letters 36, 297-305.
107. Robins, E., A. Breathnach, D. Bennett, B. Ward, Y. Bhasin, L. Ethridge, M. Nazzaro-porro, S. Passi and M. Picardo (1985) Ultrastructural observations on the effect of azelaic acid on normal human melanocytes and a human melanoma cell line in tissue culture. British Journal of Dermatology 113, 687-697.
108. Breathnach, A. C., M. Nazzaro-Porro, S. Passi and G. Zina (1989) Azelaic acid therapy in disorders of pigmentation. Clinics in dermatology 7, 106-119.
132
109. Kligman, A. M., G. L. Grove, R. Hirose and J. J. Leyden (1986) Topical tretinoin for photoaged skin. Journal of the American Academy of Dermatology 15, 836-859.
110. Kligman, A. M. (1989) The treatment of photoaged human skin by topical tretinoin. Drugs 38, 1-8.
111. Duell, E. A., S. Kang and J. J. Voorhess (1997) Unoccluded retinol penetrates human skin in vivo more effectively than unoccluded retinyl palmitate or retinoic acid. Journal of investigative dermatology 109, 301-305.
112. Weinstein, G. D., T. P. Nigra, P. E. Pochi, R. C. Savin, A. Allan, K. Benik, E. Jeffes, L. Lufrano and E. G. Thorne (1991) Topical tretinoin for treatment of photodamaged skin: a multicenter study. Archives of dermatology 127, 659-665.
113. Kimbrough-Green, C. K., C. E. Griffiths, L. J. Finkel, T. A. Hamilton, S. M. Bulengo-Ransby, C. N. Ellis and J. J. Voorhees (1994) Topical retinoic acid (tretinoin) for melasma in black patients: a vehicle-controlled clinical trial. Archives of dermatology 130, 727-733.
114. Kim, Y.-J. and H. Uyama (2005) Tyrosinase inhibitors from natural and synthetic sources: structure, inhibition mechanism and perspective for the future. Cellular and Molecular Life Sciences 62, 1707-1723.
115. Bennett, M. L. and R. L. Henderson (2003) Introduction to cosmetic dermatology. Current Problems in Dermatology 15, 43-83.
116. Choi, S., Y. I. Park, S. K. Lee, J. E. Kim and M. H. Chung (2002) Aloesin inhibits hyperpigmentation induced by UV radiation. Clinical and experimental dermatology 27, 513-515.
117. Jones, K., J. Hughes, M. Hong, Q. Jia and S. Orndorff (2002) Modulation of melanogenesis by aloesin: a competitive inhibitor of tyrosinase. Pigment cell research 15, 335-340.
118. Lin, J.-W., H.-M. Chiang, Y.-C. Lin and K.-c. Wen (2008) Natural products with skin-whitening effects. Journal of Food and Drug Analysis 16, 1-10.
119. Seiberg, M., C. Paine, E. Sharlow, P. Andrade-Gordon, M. Costanzo, M. Eisinger and S. S. Shapiro (2000) Inhibition of melanosome transfer results in skin lightening. Journal of Investigative Dermatology 115, 162-167.
120. Minwalla, L., Y. Zhao, J. Cornelius, G. F. Babcock, R. R. Wickett, I. C. Le Poole and R. E. Boissy (2001) Inhibition of melanosome transfer from melanocytes to keratinocytes by lectins and neoglycoproteins in an in vitro model system. Pigment Cell Research 14, 185-194.
121. Kubo, I., I. Kinst-Hori, S. K. Chaudhuri, Y. Kubo, Y. Sánchez and T. Ogura (2000) Flavonols from Heterotheca inuloides: tyrosinase inhibitory activity and structural criteria. Bioorganic & medicinal chemistry 8, 1749-1755.

133
122. Kim, D., J. Park, J. Kim, C. Han, J. Yoon, N. Kim, J. Seo and C. Lee (2006) Flavonoids as mushroom tyrosinase inhibitors: a fluorescence quenching study. Journal of agricultural and food chemistry 54, 935-941.
123. Dadzie, O. and A. Petit (2009) Skin bleaching: highlighting the misuse of cutaneous depigmenting agents. Journal of the European Academy of Dermatology and Venereology 23, 741-750.
124. Guillot, B. (2013) Glucocorticoid-induced cutaneous adverse events. La Revue de medecine interne/fondee... par la Societe nationale francaise de medecine interne 34, 310-314.
125. Ly, F. (2006) Skin diseases associated with the use of skin-bleaching products in Africa. Annales de dermatologie et de venereologie 133, 899-906.
126. Nnoruka, E. and O. Okoye (2006) Topical steroid abuse: its use as a depigmenting agent. Journal of the National Medical Association 98, 934.
127. Boyle, J. and R. Peachey (1984) Allergic contact dermatitis to Dermovate® and Eumovate®. Contact dermatitis 11, 50-50.
128. Lutz, M. E. and R. A. El-Azhary (1997) Allergic contact dermatitis due to topical application of corticosteroids: review and clinical implications. Mayo Clinic Proceedings 72, 1141-1144.
129. Keane, F., S. Munn, N. Taylor and A. Du Vivier (2001) Unregulated use of clobetasol propionate. British journal of dermatology 144, 1095-1096.
130. Otley, C. C. and A. Sober (1994) Over-the-counter clobetasol propionate. Archives of dermatology 130, 121-121.
131. Staughton, R. and P. August (1975) Cushing's syndrome and pituitary-adrenal suppression due to clobetasol propionate. British Medical Journal 2, 419-421.
132. May, P., E. J. Stein, R. J. Ryter, F. S. Hirsh, B. Michel and R. P. Levy (1976) Cushing syndrome from percutaneous absorption of triamcinolone cream. Archives of internal medicine 136, 612-613.
133. Bwomda, P., E. Sermijn, P. Lacor and B. Velkeniers (2014) Glucocorticoid hypertension due to the use of bleaching skin cream, a case report. Acta Clinica Belgica>International Journal of Clinical and Laboratory Medicine 60, 146-149.
134. Hamann, C. R., W. Boonchai, L. Wen, E. N. Sakanashi, C.-Y. Chu, K. Hamann, C. P. Hamann, K. Sinniah and D. Hamann (2014) Spectrometric analysis of mercury content in 549 skin-lightening products: Is mercury toxicity a hidden global health hazard? Journal of the American Academy of Dermatology 70, 281-287.e283.
135. Hutson, D., B. Dean, T. Brooks and G. Hudson-Walker (1999) Genetic Toxicology testing of 41 Industrial Chemicals. Research 153, 57-77.

134
136. Giunta, F., D. Di Landro, M. Chiaranda, L. Zanardi, A. Dal Palu, G. Giron, G. Bressa and L. Cima (1983) Severe acute poisoning from the ingestion of a permanent wave solution of mercuric chloride. Human toxicology 2, 243-246.
137. Amponsah, D. (2010) Levels of mercury and hydroquinone in some skin-lightening creams and their potential risk to the health of consumers in Ghana. Department of Chemistry, Kwame Nkrumah University of Science and Technology.
138. Marzulli, F. and W. Brown (1972) Potential systemic hazards of topically applied mercurials. Journal of the Society of Cosmetic Chemists 23, 875-886.
139. Barr, R., B. Woodger and P. Rees (1973) Levels of mercury in urine correlated with the use of skin lightening creams. American journal of clinical pathology 59, 36-40.
140. Bourgeois, M., A. Dooms-Goossens, D. Knockaert, D. Sprengers, M. Van Boven and T. Van Tittelboom (1986) Mercury intoxication after topical application of a metallic mercury ointment. Dermatology 172, 48-51.
141. Al-Saleh, I., N. Shinwari, I. El-Doush, G. Billedo, M. Al-Amodi and F. Khogali (2004) Comparison of mercury levels in various tissues of albino and pigmented mice treated with two different brands of mercury skin-lightening creams. Biometals 17, 167-175.
142. Al-Saleh, I., I. El-Doush, N. Shinwari, R. Al-Baradei, F. Khogali and M. Al-Amodi (2005) Does low mercury containing skin-lightening cream (fair & lovely) affect the kidney, liver, and brain of female mice? Cutaneous and ocular toxicology 24, 11-29.
143. Glahder, C. M., P. W. Appel and G. Asmund (1999) Mercury in soap in Tanzania. National Environmental Research Institute 306, 1-19.
144. de la Cuadra, J. (1992) Cutaneous sensitivity to mercury and its compounds. Annales de Dermatologie et de Venereologie 120, 37-42.
145. Böckers, M., R. Wagner and O. Oster (1985) Nail dyschromia as the leading symptom in chronic mercury poisoning caused by a cosmetic bleaching preparation. Zeitschrift fur Hautkrankheiten 60, 821-829.
146. Cole, H., N. Schreiber and T. Sollmann (1930) Mercurial ointments in the treatment of syphilis: their absorption as measured by studies on excretion. Archives of Dermatology and Syphilology 21, 372-393.
147. Crowley, P. and H. Gallagher (2014) Clotrimazole as a pharmaceutical: past, present and future. Journal of applied microbiology 117, 611-617.
148. Remington, J. P., D. B. Troy and P. Beringer (2006) Remington: The science and practice of pharmacy. Lippincott Williams & Wilkins.

135
149. http://www.webmd.com/drugs/2/drug-4316/clotrimazole-topical/details (Accessed on 7th December 2016).
150. Umar, M. and H. Caleb (2013) Analysis of metals in some cosmetic products in FCT-Abuja, Nigeria. International Journal of Research in Cosmetic Science 3, 14-18.
151. Polefka, T., R. Bianchini and S. Shapiro (2012) Interaction of mineral salts with the skin: a literature survey. International journal of cosmetic science 34, 416-423.
152. Iwegbue, C. M., F. I. Bassey, G. O. Tesi, S. O. Onyeloni, G. Obi and B. S. Martincigh (2015) Safety evaluation of metal exposure from commonly used moisturizing and skin-lightening creams in Nigeria. Regulatory Toxicology and Pharmacology 71, 484-490.
153. Sainio, E. L., R. Jolanki, E. Hakala and L. Kanerva (2000) Metals and arsenic in eye shadows. Contact Dermatitis 42, 5-10.
154. Caito, S., L. G. Costa and M. Aschner Toxicology of Metals. Proceedings of the Elsevier Inc.2014.
155. Piccinini, P., M. Piecha and S. F. Torrent (2013) European survey on the content of lead in lip products. Journal of pharmaceutical and biomedical analysis 76, 225-233.
156. Gondal, M., Z. Seddigi, M. Nasr and B. Gondal (2010) Spectroscopic detection of health hazardous contaminants in lipstick using laser induced breakdown spectroscopy. Journal of Hazardous Materials 175, 726-732.
157. WHO (2004) Water Sanitation:Guidelines for drinking-water quality. Vol. 1, Recommendations.
158. Guy, R. H. (1999) Metals and the skin: topical effects and systemic absorption. CRC Press.
159. Sundar, S. and J. Chakravarty (2010) Antimony toxicity. International journal of environmental research and public health 7, 4267-4277.
160. Boyle, J. and C. Kennedy (1986) Hydroquinone concentrations in skin lightening creams. British Journal of Dermatology 114, 501-504.
161. Gaudiano, M. C., D. Lucente, E. Antoniella, P. Bertocchi, N. Muleri, L. Manna, M. Bartolomei, S. Alimonti, L. Valvo and A. L. Rodomonte (2010) "For export only" medicines come back to Europe: A RP-LC method for the screening of six glucocorticoids in illegal and counterfeit anti-inflammatory and lightening creams. Journal of Pharmaceutical and Biomedical Analysis 53, 158-164.
162. Görög, S. (2004) Recent advances in the analysis of steroid hormones and related drugs. Analytical sciences 20, 767-782.

136
163. Wang, L.-H. (1995) Simultaneous determination of hydroquinone ethers in cosmetics after preconcentration at a carbon paste electrode. Analyst 120, 2241-2244.
164. Huang, S.-C., C.-C. Lin, M.-C. Huang and K.-C. Wen (2004) Simultaneous determination of magnesium ascorbyl phosphate, ascorbyl glucoside, kojic acid, arbutin and hydroquinone in skin whitening cosmetics by HPLC. Journal of Food and Drug Analysis 12.
165. Balaguer, A., A. Chisvert and A. Salvador (2008) Environmentally friendly LC for the simultaneous determination of ascorbic acid and its derivatives in skin-whitening cosmetics. Journal of separation science 31, 229-236.
166. Reepmeyer, J. C., L. K. Revelle and I. Vidavsky (1998) Detection of clobetasol propionate as an undeclared steroid in zinc pyrithione formulations by high-performance liquid chromatography with rapid-scanning ultraviolet spectroscopy and mass spectrometry. Journal of Chromatography A 828, 239-246.
167. ALqadami, A. A., M. A. Abdalla, Z. A. ALOthman and K. Omer (2013) Application of solid phase extraction on multiwalled carbon nanotubes of some heavy metal ions to analysis of skin whitening cosmetics using ICP-AES. International journal of environmental research and public health 10, 361-374.
168. Al-Qutob, M. A., H. M. Alatrash and S. Abol-Ola (2013) Determination of different heavy metals concentrations in cosmetics purchased from the Palestinian markets by ICP/MS. Advances in Environmental Sciences 5, 287-293.
169. Lee, S.-M., H.-J. Jeong and H.-K. Kim (2008) Simultaneous Determination of Heavy Metals in Cosmetic Products by Ion Chromatography. Journal of the Society of Cosmetic Scientists of Korea 34, 57-62.
170. Somervaille, L. J., D. R. Chettle and M. C. Scott (1985) In vivo measurement of lead in bone using x-ray fluorescence. Physics in medicine and biology 30, 929.
171. Steinnes, E. (1980) Atmospheric deposition of heavy metals in Norway studied by the analysis of moss samples using neutron activation analysis and atomic absorption spectrometry. Journal of Radioanalytical Chemistry 58, 387-391.
172. Al-Saleh, I. and S. Al-Enazi (2011) Trace metals in lipsticks. Toxicological & Environmental Chemistry 93, 1149-1165.
173. Nnorom, I. (2011) Trace metals in cosmetic facial talcum powders marketed in Nigeria. Toxicological & Environmental Chemistry 93, 1135-1148.
174. Elemental, T. (2001) ICP or ICP-MS? Which technique should I use? An elementary overview of elemental analysis.
175. Bocca, B., G. Forte, F. Petrucci and A. Cristaudo (2007) Levels of nickel and other potentially allergenic metals in Ni-tested commercial body creams. Journal of pharmaceutical and biomedical analysis 44, 1197-1202.

137
176. Zoe Grosser, Lee Davidowski and L. Thompson (2012) The Determination of Metals in Cosmetics. (Edited by I. PerkinElmer).
177. Rajagopal Mayildurai, A. R., Nanjan Velmani (2015) ICP – OES investigations of heavy metal contents in cosmetic products. Journal of Pharmacy Research 9, 27-30.
178. Eltegani, S. E., H. M. Ali and A. Y. Hammad (2013) The Hazards of Hidden Heavy Metals in Face Make-ups. British Journal of Pharmacology and Toxicology 4, 188-193.
179. Farrag, E. A., A. Sei'leek, H. Mohammed, A. Al-Sayyed and I. Mohammed (2015) Study of heavy metals concentration in cosmetics purchased from Jordan markets by ICP-MS and ICP-OES. Advances in Environmental Sciences 7.
180. Peregrino, C. P., M. V. Moreno, S. V. Miranda, A. D. Rubio and L. O. Leal (2011) Mercury levels in locally manufactured Mexican skin-lightening creams. International Journal of Environmental Research and Public Health 8, 2516-2523.
181. Kupiec, T. (2004) Quality-Control Analytical Methods:High-Performance Liquid Chromatography. International Journal of Pharmaceutical Compounding 8, 223-227.
182. Chromacademy (2016) Quantitative & Qualitative HPLC. http://www.chromacademy.com/ (Accessed on 14th October 2016).
183. Daniel, H. C. (2003) Qantitative chemical analysis. 6th Edition. New York: W.H. Freeman.
184. Fornstedt, T., P. Forssén and D. Westerlund (2015) Basic HPLC Theory and Definitions: Retention, Thermodynamics, Selectivity, Zone Spreading, Kinetics, and Resolution. pp. 1-24.
185. https://www.google.co.za/search?q=component+of+an+hplc+system (Accessed 22nd July, 2016).
186. https://www.google.co.za/search?q=component+of+uv-vis+spectrophotometer (Accessed 22nd July, 2016).
187. Sukender, K., S. Jaspreet, D. Sneha and G. Munish (2012) AAS estimation of heavy metals and trace elements in Indian herbal cosmetic preparations. Research Journal of Chemical Sciences 2, 46-51.
188. Niyibizi, C. (2014) An investigation of commonly used skin-ligthening creams. M.Sc. Dissertation, University of KwaZulu-Natal, South Africa.
189. https://www.google.co.za/search?q=THEORY+OF+ICP-OES (Accessed 25th August 2016).

138
190. PerkinElmer (2000) Mercury hydride system (MHS) 15 user guide.
191. SCCS (2012) Scientific Committee on Consumer Safety (SCCS/1501/12). The sccs's notes of guidance for the testing of cosmetic substances and their safety evaluation. 8th revision. The SCCS adopted this opinion at its 17th plenary meeting of 11 December 2012.
192. RAIS. The Risk Assessment Information System. Toxicity Profiles. RAGs A Format for Aluminum - CAS Number 7429905. https://rais.ornl.gov/tox/profiles/Aluminum_ragsa.html. (Accessed 17th November 2106).
193. Iwegbue, C. M., O. S. Emakunu, G. E. Nwajei, F. I. Bassey and B. S. Martincigh (2016) Evaluation of human exposure to metals from some commonly used bathing soaps and shower gels in Nigeria. Regulatory Toxicology and Pharmacology 83, 38-45.
194. Storelli, M. (2008) Potential human health risks from metals (Hg, Cd, and Pb) and polychlorinated biphenyls (PCBs) via seafood consumption: estimation of target hazard quotients (THQs) and toxic equivalents (TEQs). Food and Chemical Toxicology 46, 2782-2788.
195. Barbas, C., J. Rupérez, A. Dams and R. Majors (2005) Separation of Paraben Preservatives by Reversed-Phase HPLC. Agilent Technologies, Inc, 1-3.
196. Kumar, S., S. Mathkar, C. Romero and A. Rustum (2011) Development and validation of a single RP-HPLC assay method for analysis of bulk raw material batches of four parabens that are widely used as preservatives in pharmaceutical and cosmetic products. Journal of chromatographic science 49, 405-411.
197. Shabib, G. A. (2004) A Practical Approach to Validation of HPLC Methods Under Current Good Manufacturing Practices. Journal of Validation Technology, 29-37.
198. Thomas, L. M. Feature: race, bodies and beauty Skin Lighteners, Black Consumers and Jewish Entrepreneurs in South Africa. pp. 259-283. Oxford University Press, Proceedings of the History Workshop Journal 2012.
199. Dalmázio, I. and M. Â. de BC Menezes (2011) Multi-elemental Profile of some Brazilian Make-up Products by Instrumental Neutron Activation Analysis. In International Nuclear Atlantic Conference. pp. 24-28, Brazil.
200. Laussac, J.-P. and G. Commenges (1983) 1H, 13C, 31P and 27Al NMR study of aluminium-ATP complexes. A possible relation with its biological application. Nouveau journal de chimie 7, 579-585.
201. Ullah, H., S. Noreen, A. Rehman, A. Waseem, S. Zubair, M. Adnan and I. Ahmad (2013) Comparative study of heavy metals content in cosmetic products of different countries marketed in Khyber Pakhtunkhwa, Pakistan. Arabian Journal of Chemistry http://dx.doi.org/10.1016/j.arabjc.2013.09.021, 1-9.
139
202. IARC (1990) Chromium, nickel and welding. IARC Monographs on the Evaluation of Carcinogenic Risks to Humans.
203. Larese, F., A. Gianpietro, M. Venier, G. Maina and N. Renzi (2007) In vitro percutaneous absorption of metal compounds. Toxicology letters 170, 49-56.
204. Van Lierde, V., C. C. Chéry, N. Roche, S. Monstrey, L. Moens and F. Vanhaecke (2006) In vitro permeation of chromium species through porcine and human skin as determined by capillary electrophoresis–inductively coupled plasma–sector field mass spectrometry. Analytical and bioanalytical chemistry 384, 378-384.
205. Filon, F. L., F. D’Agostin, M. Crosera, G. Adami, M. Bovenzi and G. Maina (2008) In vitro percutaneous absorption of chromium powder and the effect of skin cleanser. Toxicology in Vitro 22, 1562-1567.
206. Health.Canada (2011) Consumer product safety: Draft guidance on heavy metal impurities in cosmetics. http://www.hcsc.gc.ca/cpsspc/legislation/consultation/_cosmt./metalmtaux-consultengphp (Accessed 23rd September 2016).
207. US.FDA (2007) Summary of color additives listed for use in the United State in foods, drugs/cosmetics and medical devices, color additives approved for use in cosmetic Part 73, subpart C: color additive exempt from batch certification. Available from: http://www.cfsan.fda.gov/dms/opa_col2.html (Accessed 23rd September 2016).
208. Filon, F. L., M. Boeniger, G. Maina, G. Adami, P. Spinelli and A. Damian (2006) Skin absorption of inorganic lead (PbO) and the effect of skin cleansers. Journal of occupational and environmental medicine 48, 692-699.
209. Basketter, D. A., G. Angelini, A. Ingber, P. S. Kern and T. Menné (2003) Nickel, chromium and cobalt in consumer products: revisiting safe levels in the new millennium. Contact Dermatitis 49, 1-7.
210. Ababneh, F. A., K. A. Abu-Sbeih and I. F. Al-Momani (2013) Evaluation of allergenic metals and other trace elements in personal care products. Jordan Journal of Chemistry 8, 179-190.
211. Miyajima, H., S. Kono, Y. Takahashi and M. Sugimoto (2002) Increased lipid peroxidation and mitochondrial dysfunction in aceruloplasminemia brains. Blood Cells, Molecules, and Diseases 29, 433-438.
212. Senesse, P., S. Méance, V. Cottet, J. Faivre and M.-C. Boutron-Ruault (2004) High dietary iron and copper and risk of colorectal cancer: a case-control study in Burgundy, France. Nutrition and cancer 49, 66-71.
213. US.FDA (1992) Cosmetics Hand-book. U.S. Department of Health and Human Services. Public Health Service, Food and Drug Administration. .
214. WHO (1991) Environmental Health Criteria 118: Inorganic mercury, Geneva.

140
215. Al-Saleh I and E.-D. I (1997) Mercury content in skin lightening creams and potential hazards to the health of Saudi women. Toxicol Environ Health 51, 131–148.
216. WHO (2007) Joint FAO/WHO Expert Committee on Food Additives. Meeting (67th : 2006 : Rome, Italy). Evaluation of certain food additives and contaminants : sixty-seventh report of the Joint FAO/WHO Expert Committee on Food Additives.
217. Iwegbue, C. M., O. S. Emakunu, G. Obi, G. E. Nwajei and B. S. Martincigh (2016) Evaluation of human exposure to metals from some commonly used hair care products in Nigeria. Toxicology Reports 3, 796-803.
218. http://www.popstoolkit.com/tools/HHRA/TDI_HealthCanada.aspx (Accessed 2nd December 2016).
219. US.EPA (1997) Mercury study report to Congress Health Effects of Mercury and Mercury Compounds, volume. V. Environmental Protection agency, Washington (DC), United States, EPA-452/R-97-007.
220. Cashman, A. L. and E. M. Warshaw (2005) Parabens: a review of epidemiology, structure, allergenicity, and hormonal properties. Dermatitis 16, 57-66.
221. Darbre, P., A. Aljarrah, W. Miller, N. Coldham, M. Sauer and G. Pope (2004) Concentrations of parabens in human breast tumours. Journal of applied toxicology 24, 5-13.

141
Appendix A
MATERIALS
This appendix contains the list of chemicals used during the course of this study.
A1 Chemicals used during the analysis of skin-lightening agents by HPLC
Chemical Supplier Acetonitrile (HPLC grade) Sigma-Aldrich
Methanol (HPLC grade) Sigma-Aldrich
Millipore water Millipore Elix 5 UV water purification unit
Betamethasone dipropionate Sigma Life Science
Clobetasol propionate (98%) Sigma-Aldrich
Clotrimazole Sigma-Aldrich
Hydroquinone (99.09%) Fluka
Benzoquinone (99.5%) Fluka
Kojic acid (98%) Fluka
Niacinamide (99.9%) Supelco Analytical
Arbutin (96%) Sigma-Aldrich
Acetic acid (99.9%) BDH Chemicals Limited
Orthophosphoric acid (98%) Rochelle Chemicals
Dipotassium hydrogen phosphate BDH Laboratory Supplies
Potassium dihydrogen phosphate BDH Laboratory Supplies

142
A2 Chemicals used during the analysis of heavy metals by ICP-OES and CV-AAS
Chemical Supplier Tin chloride dihydrate BDH Laboratory Supplies
Mercury chloride (HgCl2) Sigma-Aldrich
Analytical grade nitric acid (69%) Emparta ACS
Analytical grade hydrochloric acid (32%) B & M Scientific
Analytical grade, aluminum (Al) 1000 ppm Fluka Chemicals
Analytical grade, chromium (Cr) 1000 ppm Fluka Chemicals
Analytical grade, copper (Cu) 1000 ppm Fluka Chemicals
Analytical grade, iron (Fe) 1000 ppm Fluka Chemicals
Analytical grade, manganese (Mn) 1000 ppm Fluka Chemicals
Analytical grade, nickel (Ni) 1000 ppm Fluka Chemicals
Analytical grade, lead (Pb) 1000 ppm Fluka Chemicals
Analytical grade, zinc (Zn) 1000 ppm Fluka Chemicals

143
Appendix B
EQUIPMENT
This appendix contains the list of instruments and equipment used during the course of
this study.
B1 Instruments
Shimadzu Prominence HPLC equipped with:
DGU-20A3 Prominence degasser,
LC-20AD XR Prominence binary pumps,
SIL-20A XR Prominence autosampler,
SPD-M20A Prominence diode array detector,
CTO-20A Prominence column oven,
CBM-20A Prominence communicator bus module,
FRC-10A Prominence fraction collector and
LC/Lab solution system software.
PerkinElmer Lambda 25 UV-VIS dual-beam spectrophotometer
PerkinElmer Optima 5300 DV ICP-OES
PerkinElmer Analyst 200 atomic spectrometer coupled with MHS 15 mercury hydride
system
144
B2 Equipment
CEM Mars 6 microwave digester with a turntable containing 12 reaction vessels (XP-
1500)
Brownlee HPLC column; C18 (100 × 4.6 mm, 3 µm)
SGE HPLC column; C18 (250 × 4.6mm, 5 µm)
Ultrasonic bath (Ultra Manufacturing Company)
Helium degasser (Sp8700 XR)
Millipore Elix 5 UV water purification system
Ministart RC 25 hydrophilic 0.45 µm single use syringe filters
Millipore Durapore 0.45 µm membrane solvent filters

145
Appendix C
CALIBRATION DATA FOR SKIN-LIGHTENING AGENTS
The calibration data for all skin-lightening agents analysed is given in this section.
Table C1: Calibration data for the determination of clobetasol propionate (CP).
Concentration/ mg L-1
0.2
0.5
2.0
6.0
10
15
25
60
1
4536 4747 4436
10789 10505 10490
41035 41166 41072
120086 120274 121111
231943 229865 225699
355800 355766 357276
563897 560181 556997
1359590 1347034 1334156
2
4613 4682 4577
10754 10447 11304
41098 41006 41553
120469 121076 121399
229100 235115 228312
359494 358454 361845
561059 564270 556528
1352021 1335777 1325635
3
4516 4521 4476
10647 10686 10603
41631 41994 41740
123159 123089 121582
220243 220730 221664
363496 367185 367366
553125 545843 547637
1316128 1308212 1309439
Mean 4567.1 10691.7 41366.1 121360.6 226963.4 360742.4 556615.2 1331999 Std Dev 99.3 258.3 366.9 1118.9 5241.1 4502.5 6643.3 18622.18 RSD% 2.2 2.4 0.9 0.9 2.3 1.2 1.2 1.4
Table C2: Calibration data for the determination of betamethasone dipropionate (BD).
Concentration/ mg L-1
0.2
0.5
2.0
6.0
10
15 25
60
1
4317 4195 4060
9795 9577 9510
36901 36714 37316
107677 107699 108173
205433 203793 201815
317332 318832 317993
504338 500463 499561
1220964 1206853 1200922
2
3963 4158 4097
9535 9393 9415
36800 37014 37017
107449 107798 110488
202658 204690 200788
319932 319869 320734
502447 501796 497112
1214803 1201043 1191210
3
4250 4269 4207
9453 9613 9393
37609 37726 37721
108370 109425 109460
196911 197499 198290
326104 327538 326811
494210 489803 489855
1182946 1175806 1176594
Mean 4168.4 9520.4 37202 108504.3 201319.7 321682.8 497731.7 1196793 Std Dev 111.9 130.2 400.4 1046.9 3160.1 4000.9 5372.3 16264.5 RSD% 2.7 1.4 1.1 1.0 1.6 1.2 1.1 1.4

146
Table C3: Calibration data for the determination of clotrimazole (CT).
Concentration/ mg L-1
0.2
0.5
2.0
6.0
10 15
25
60
1
4955 5259 4912
12512 13075 12442
48404 47451 49601
143404 142451 142909
280668 280618 278063
434332 436414 436607
692762 687259 685055
1661478 1646585 1641680
2
5440 5277 5362
12977 12886 12817
48296 48887 48534
141709 142341 138152
280697 280121 277909
429958 439054 438071
687877 683043 683256
1653851 1641229 1641101
3
5162 5110 5071
12933 12812 12885
49303 51968 48545
141156 142472 141581
278482 278926 277773
445679 443579 445960
667432 664049 663059
1639308 1640503 1642042
Mean 5172 12815.4 48998.8 141797.2 279250.8 438850.4 679310.2 1645309 Std Dev 178.7 208.8 1272.3 1530.9 1265.8 5369.4 11281.2 7527.8 RSD% 3.5 1.6 2.6 1.1 0.5 1.2 1.7 0.5
Table C4: Calibration data for the determination of hydroquinone (HQ).
Concentration/ mg L-1
0.5
20
80
150
250
300
400
1
5058 5078 4317
196307 198875 194085
841082 839943 834169
1572541 1608575 1557722
2744875 2757385 2728820
3310542 3306661 3304408
5074334 5084454 5070686
2
4598 4543 4450
192351 193345 192112
832839 834164 836750
1565425 1563204 1599316
2719200 2718679 2714615
3292200 3292619 3277468
5055476 5060818 5057442
3
4268 4151 4201
191216 191767 192843
839432 836431 831855
1597967 1617219 1591295
2712364 2693866 2716994
3289059 3275839 3285176
5061405 5052795 5036873
Mean 4518.2 193655.7 836296.1 1585918 2722978 3292664 5061587 Std Dev 345.4 2470.2 3297.9 21669.5 18695.3 12433.5 13745.0 RSD% 7.6 1.3 0.4 1.4 0.7 0.4 0.3

147
Table C5: Calibration data for the determination of benzoquinone (BQ).
Concentration/ mg L-1
0.2
1.0
5.0
10
15
18
20
1
1221 1280 1265
12092 12448 12726
135317 138276 138475
334185 336403 334037
582125 581318 584290
724154 726876 725326
767714 767977 764435
2
1135 1184 1197
13883 13320 13445
139823 140297 140919
339660 330229 336633
568514 565736 566205
719540 719691 719667
759702 760894 758319
3
1483 1459 1439
14022 14657 14682
145498 145415 145007
339933 339371 334056
581400 580335 583895
739302 740081 740762
770865 773210 771128
Mean 1295.9 13475 141003 336056.3 577090.9 728377.7 766027.1 Std Dev 130.9 926.9 3601.4 3259.5 7837.6 9141.4 5431.1 RSD% 10.1 6.9 2.6 0.9 1.4 1.3 0.7
Table C6: Calibration data for the determination of kojic acid (KA).
Concentration/ mg L-1
0.5
10
25
40
55
70
90
1
13070 13052 12954
241327 242670 240741
697749 695263 701177
1045285 1054650 1039749
1458728 1447199 1451643
1900416 1904541 1895457
2584462 2549813 2560902
2
12538 12544 12324
238300 237199 236378
690050 691463 691740
1031024 1040369 1037203
1433120 1443531 1435473
1890323 1886321 1903344
2547224 2554898 2535975
3
13468 12916 13425
236934 236439 235818
696373 695980 690306
1035302 1041636 1034138
1428666 1434019 1428066
1879521 1885786 1878179
2546847 2540858 2558017
Mean 12921.2 238422.9 694455.7 1039928 1440049 1891543 2553222 Std Dev 393.5 2511.9 3801.9 6983.9 10753.2 9920.2 14138.9 RSD% 3.0 1.1 0.5 0.7 0.7 0.5 0.6

148
Table C7: Calibration data for the determination of niacinamide (NC).
Concentration/ mg L-1
0.8
10
30
50
70
90
110
1
11399 11026 10995
95559 96529 98104
308690 307957 303646
540514 540930 540344
768367 770116 769845
1037663 1065898 1035897
1284557 1281038 1274572
2
10753 11476 11425
97278 95634 95470
300992 300275 300797
537865 537295 533058
759042 760110 761316
1018334 1019420 1018560
1324506 1321825 1327996
3
11314 11466 11543
99668 97816 98154
306871 303240 305645
537193 540850 537330
756003 758707 759439
1001649 1004059 1002936
1255602 1258282 1250562
Mean 11266.3 97134.7 304234.8 538375.4 762549.4 1022713 1286549 Std Dev 273.9 1447.1 3201.4 2580.9 5378.1 20893.6 30888.1 RSD% 2.4 1.5 1.1 0.5 0.7 2.0 2.4
Table C8: Calibration data for the determination of arbutin (ARB).
Concentration/ mg L-1
1.0
4.0
6.0
10
15
18
20
1
1946 1942 1954
9716 9179 9506
13205 13586 13295
23441 23199 23468
33852 33828 33923
41278 41443 41882
48830 48686 48181
2
1944 1956 1964
9268 9768 9803
13705 13331 13045
21646 21847 22169
33173 33588 32446
42426 42014 42910
47046 46905 46471
3
1922 1940 1981
9417 9217 9809
13710 13951 13774
22458 22511 22402
33987 33085 32747
41094 42453 42492
46323 46110 45514
Mean 1949.9 9520.3 13511.3 22571.2 33403.2 41999.1 47118.4 Std Dev 16.6 261.2 303.2 665.4 562.1 624.8 1183.7 RSD% 0.9 2.7 2.2 2.9 1.7 1.5 2.5

149
Appendix D
CALIBRATION GRAPHS AND RESIDUAL PLOTS FOR SKIN-
LIGHTENING AGENTS
The calibration curves and residual plots of all skin-lightening agents analysed by HPLC
are presented here.
Figure D1: Calibration graph for the determination of clobetasol propionate at 240 nm.
Figure D2: Residual plot for the calibration graph of clobetasol propionate.
-40000
-30000
-20000
-10000
0
10000
20000
30000
40000
0 10 20 30 40 50 60 70Res
idua
ls
[CP]/mg L-1
y = 22293xR² = 0.9994
0
200000
400000
600000
800000
1000000
1200000
1400000
1600000
0 10 20 30 40 50 60 70
Peak
Are
a
[CP]/mg L-1

150
Figure D3: Calibration graph for the determination of betamethasone dipropionate at 240 nm.
Figure D4: Residual plot for the calibration graph of betamethasone dipropionate.
y = 20003xR² = 0.9995
0
200000
400000
600000
800000
1000000
1200000
1400000
0 10 20 30 40 50 60 70
Peak
Are
a
[BD]/mg L-1
-30000
-20000
-10000
0
10000
20000
30000
40000
0 10 20 30 40 50 60 70Res
idua
ls
[BD]/mg L-1
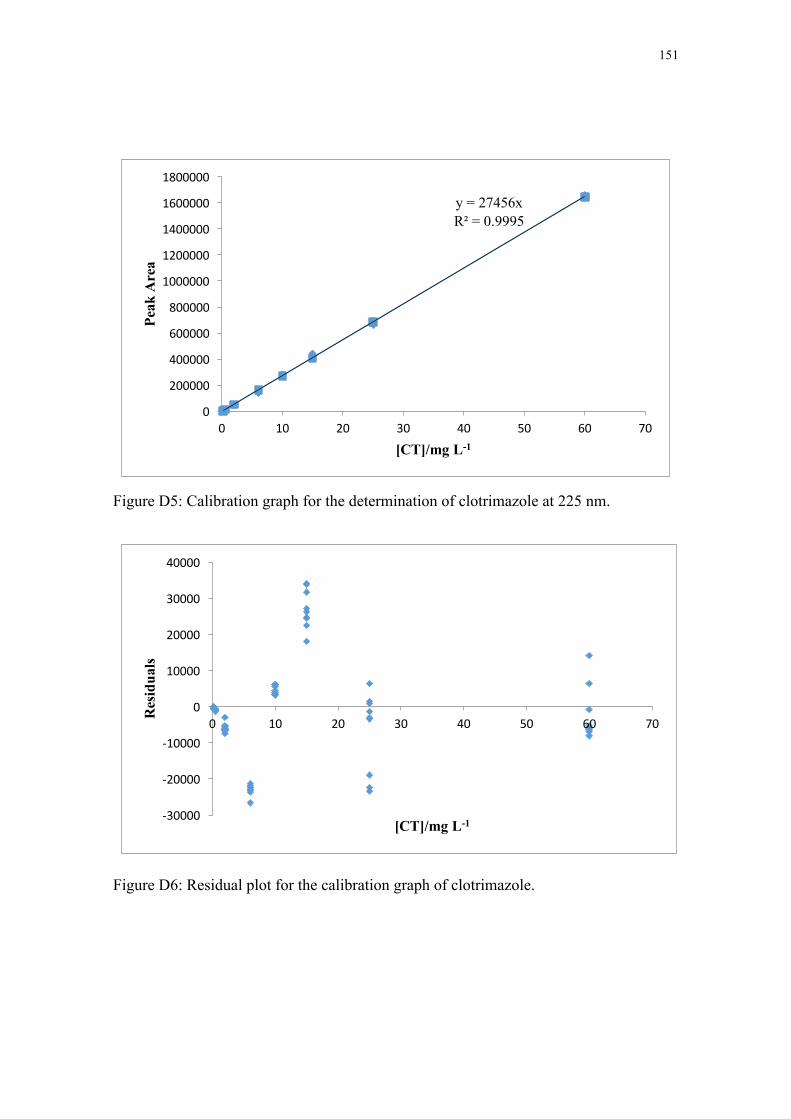
151
Figure D5: Calibration graph for the determination of clotrimazole at 225 nm.
Figure D6: Residual plot for the calibration graph of clotrimazole.
y = 27456xR² = 0.9995
0
200000
400000
600000
800000
1000000
1200000
1400000
1600000
1800000
0 10 20 30 40 50 60 70
Peak
Are
a
[CT]/mg L-1
-30000
-20000
-10000
0
10000
20000
30000
40000
0 10 20 30 40 50 60 70
Res
idua
ls
[CT]/mg L-1

152
Figure D7: Calibration graph for the determination of hydroquinone at 289 nm.
Figure D8: Residual plot for the calibration graph of hydroquinone.
y = 11708xR² = 0.9942
0
1000000
2000000
3000000
4000000
5000000
6000000
0 50 100 150 200 250 300 350 400 450
Peak
Are
a
[HQ]/mg L-1
-300000
-200000
-100000
0
100000
200000
300000
400000
500000
0 50 100 150 200 250 300 350 400 450
Res
idua
ls
[HQ]/mg L-1

153
Figure D9: Calibration graph for the determination of benzoquinone at 240 nm.
Figure D10: Residual plot for the calibration graph of benzoquinone.
y = 38293xR² = 0.9955
0
100000
200000
300000
400000
500000
600000
700000
800000
900000
0 5 10 15 20 25
Peak
Are
a
[BQ]/mg L-1
-80000
-60000
-40000
-20000
0
20000
40000
60000
0 5 10 15 20 25
Res
idua
ls
[BQ]/mg L-1

154
Figure D11: Calibration graph for the determination of kojic acid at 270 nm.
Figure D12: Residual plot for the calibration graph of kojic acid.
y = 27397xR² = 0.9987
0
500000
1000000
1500000
2000000
2500000
3000000
0 20 40 60 80 100
Peak
Are
a
[KA]/mg L-1
-100000
-50000
0
50000
100000
150000
0 20 40 60 80 100Res
idua
ls
[KA]/mg L-1

155
Figure D13: Calibration graph for the determination of niacinamide at 270 nm.
Figure D14: Residual plot for the calibration graph of niacinamide.
y = 11327xR² = 0.9983
0
200000
400000
600000
800000
1000000
1200000
1400000
0 20 40 60 80 100 120
Peak
Are
a
[NC]/mg L-1
-60000
-40000
-20000
0
20000
40000
60000
80000
100000
0 20 40 60 80 100 120
Res
idua
ls
[NC]/mg L-1

156
Figure D15: Calibration graph for the determination of arbutin at 289 nm.
Figure D16: Residual plot for the calibration graph of arbutin.
y = 2310.5xR² = 0.99901
0
10000
20000
30000
40000
50000
60000
0 5 10 15 20 25
Peak
Are
a
[ARB]/mg L-1
-3000
-2000
-1000
0
1000
2000
3000
0 5 10 15 20 25Res
idua
ls
[ARB]/mg L-1

157
Appendix E
HPLC CHROMATOGRAMS OF STANDARD MIXTURES OF
SKIN-LIGHTENING AGENTS AND SKIN-LIGHTENING
PRODUCTS
I. Chromatograms for the separation of standard mixtures of skin-lightening agents
Figure E1: Chromatogram for the separation of CP, BD and CT at 240 nm. The retention times were 2.974, 3.702, and 4.766 minutes respectively. The chromatographic conditions used were: Brownlee analytical C18 (100 × 4.6 mm, 3 µm) column; mobile phase: MeOH-H2O 80:20 (v/v); injection volume: 10 µL; flow rate: 0.8 mL min-1; and column temperature: ambient.
CP
BD
CT
240 nm

158
Figure E2: Chromatogram for the separation of CP, BD and CT at 225 nm. The retention times were 2.974, 3.702, and 4.766 minutes respectively. The chromatographic conditions used were: Brownlee analytical C18 (100 × 4.6 mm, 3 µm) column; mobile phase: MeOH-H2O 80:20 (v/v); injection volume: 10 µL; flow rate: 0.8 mL min-1; and column temperature: ambient.
CP
BD
CT
225 nm

159
Figure E3: Chromatogram for the separation of NC, KA, HQ, and BQ at 289 nm. The retention times were 2.663, 6.192, 7.926 and 15.432 minutes respectively. The chromatographic conditions used were: SGE C18 (250 × 4.6mm, 5 µm) column; mobile phase: 0.5% orthophosphoric acid in methanol and 0.5% orthophosphoric acid in water 5:95 (v/v); injection volume: 10 µL; flow rate: 1.0 mL min-1; and column temperature: 35 °C.
BQ
HQ KA
NC
289 nm

160
Figure E4: Chromatogram for the separation of NC, KA, HQ, and BQ at 270 nm. The retention times were 2.657, 6.191, 7.926 and 15.458 minutes respectively. The chromatographic conditions used were: SGE C18 (250 × 4.6mm, 5 µm) column; mobile phase: 0.5% orthophosphoric acid in methanol and 0.5% orthophosphoric acid in water 5:95 (v/v); injection volume: 10 µL; flow rate: 1.0 mL min-1; and column temperature: 35 °C.
BQ HQ
KA
NC 270 nm

161
Figure E5: Chromatogram for the separation of NC, KA, HQ, and BQ at 240 nm. The retention times were 2.657, 6.191, 7.923 and 15.462 minutes respectively. The chromatographic conditions used were: SGE C18 (250 × 4.6mm, 5 µm) column; mobile phase: 0.5% orthophosphoric acid in methanol and 0.5% orthophosphoric acid in water 5:95 (v/v); injection volume: 10 µL; flow rate: 1.0 mL min-1; and column temperature: 35 °C.
BQ
NC 240 nm
HQ
KA

162
II. Chromatograms for the determination of HQ, KA, NC, and BQ in skin-lightening products at detection wavelengths of 289, 270, 270 and 240 nm respectively. The chromatographic conditions used were: SGE C18 (250 × 4.6mm, 5 µm) column; mobile phase: 0.5% orthophosphoric acid in methanol and 0.5% orthophosphoric acid in water 5:95 (v/v); injection volume: 10 µL; flow rate: 1.0 mL min-1; and column temperature: 35 °C.
Figure E6: Chromatogram of SLP 1. The active ingredients detected are NC, KA, and HQ. The retention times were 2.643, 6.268 and 8.036 minutes respectively.
HQ
KA
NC
270 nm

163
Figure E7: Chromatogram of SLP 2. The active ingredients detected are NC, KA, and HQ. The retention times were 2.647, 6.260 and 8.026 minutes respectively.
Figure E8: Chromatogram of SLP 3. The active ingredients detected are NC, KA, and HQ. The retention times were 2.650, 6.266 and 8.030 minutes respectively.
HQ
KA
NC
270 nm
HQ
KA
NC
270 nm

164
Figure E9: Chromatogram of SLP 4. The active ingredients detected are KA and HQ. The retention times were 6.2376 and 8.001 minutes respectively.
Figure E10: Chromatogram of SLP 5. The active ingredients detected are KA and HQ. The retention times were 6.234 and 8.000 minutes respectively.
HQ
KA
270 nm
HQ
KA
270 nm

165
Figure E11: Chromatogram of SLP 8. The active ingredients detected are KA and HQ. The retention times were 6.236 and 8.004 minutes respectively.
Figure E12: Chromatogram of SLP 10. The active ingredient detected is HQ. The retention time is 8.005 minutes.
HQ
KA 270 nm
HQ 289 nm

166
Figure E13: Chromatogram of SLP 11. The active ingredient detected is HQ. The retention time is 8.004 minutes.
Figure E14: Chromatogram of SLP 12. The active ingredients detected are HQ and BQ. The retention times were 7.988 and 15.486 minutes respectively.
HQ 289 nm
BQ
HQ 240 nm

167
Figure E15: Chromatogram of SLP 13. The active ingredients detected are HQ and BQ. The retention times were 7.972 and 15.463 minutes respectively.
Figure E16: Chromatogram of SLP 14. The active ingredients detected are HQ and BQ. The retention times were 7.975 and 15.501 minutes respectively.
BQ
HQ 240 nm
BQ
HQ 240 nm
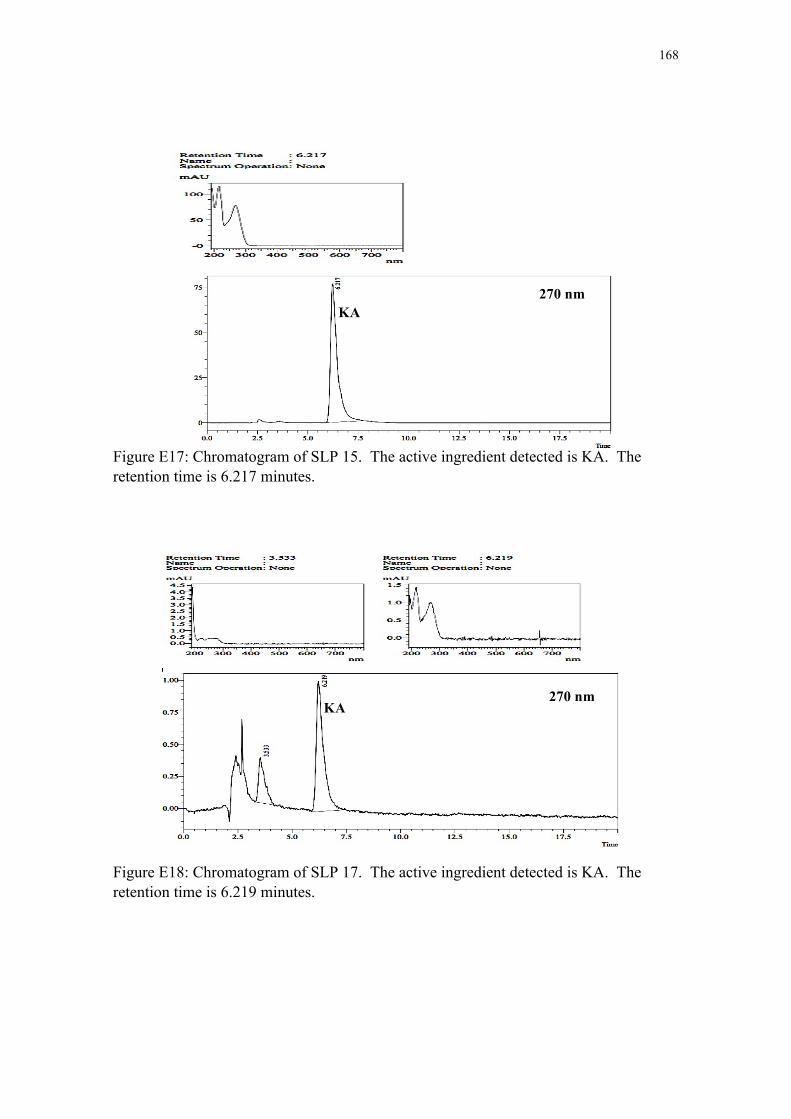
168
Figure E17: Chromatogram of SLP 15. The active ingredient detected is KA. The retention time is 6.217 minutes.
Figure E18: Chromatogram of SLP 17. The active ingredient detected is KA. The retention time is 6.219 minutes.
KA 270 nm
KA 270 nm
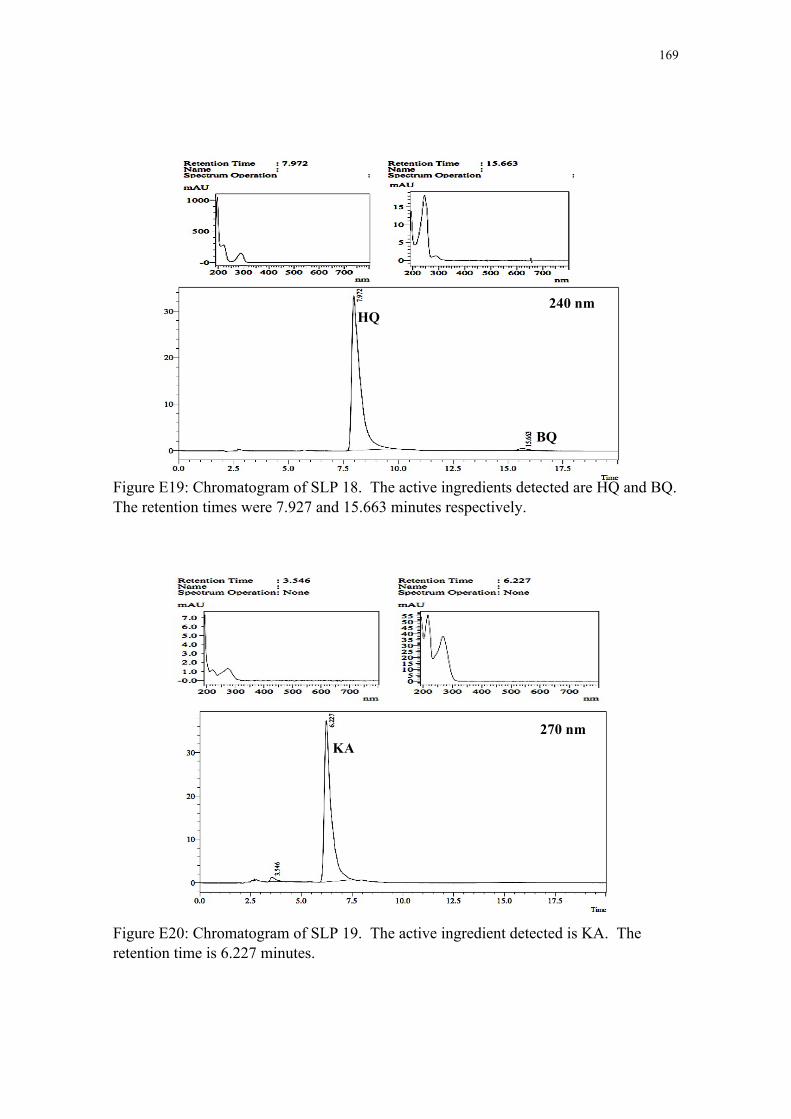
169
Figure E19: Chromatogram of SLP 18. The active ingredients detected are HQ and BQ. The retention times were 7.927 and 15.663 minutes respectively.
Figure E20: Chromatogram of SLP 19. The active ingredient detected is KA. The retention time is 6.227 minutes.
BQ
HQ 240 nm
KA 270 nm

170
Figure E21: Chromatogram of SLP 21. The active ingredient detected is HQ. The retention time is 7.980 minutes.
Figure E22: Chromatogram of SLP 22. The active ingredients detected are HQ and BQ. The retention times were 7.974 and 15.572 minutes respectively.
HQ 289 nm
HQ
BQ
240 nm
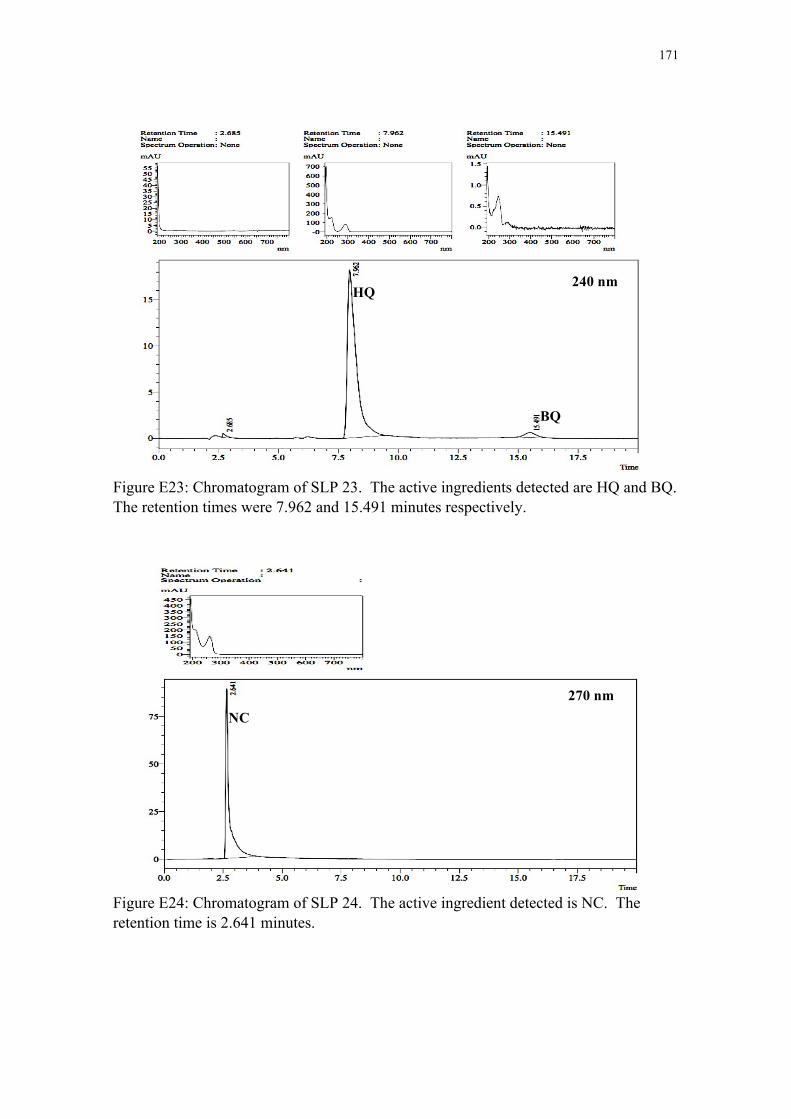
171
Figure E23: Chromatogram of SLP 23. The active ingredients detected are HQ and BQ. The retention times were 7.962 and 15.491 minutes respectively.
Figure E24: Chromatogram of SLP 24. The active ingredient detected is NC. The retention time is 2.641 minutes.
BQ
HQ 240 nm
NC 270 nm

172
III. Chromatograms for the determination of CP, BD, and CT in skin-lightening products at detection wavelengths of 240, 240, and 225 nm respectively. The chromatographic conditions used were: Brownlee analytical C18 (100 × 4.6 mm, 3 µm) column; mobile phase: MeOH-H2O 80:20 (v/v); injection volume: 10 µL; flow rate: 0.8 mL min-1; and column temperature: ambient.
Figure E25: Chromatogram of SLP 9. The active ingredients detected are CP and CT. The retention times were 2.929 and 4.619 minutes respectively.
CT CP
225 nm

173
Figure E26: Chromatogram of SLP 20. The active ingredients detected are CP and CT. The retention times are 2.928 and 4.595 minutes respectively.
Figure E27: Chromatogram of SLP 25. The active ingredient detected is BD. The retention time is 3.584 minutes.
CP CT
225 nm
BD
240 nm

174
Figure E28: Chromatogram of SLP 26. The active ingredient detected is CP. The retention time is 2.904 minutes.
Figure E29: Chromatogram of SLP 27. The active ingredient detected is CP. The retention time is 2.904 minutes.
CP
240 nm
CP
240 nm

175
Figure E30: Chromatogram of SLP 28. The active ingredient detected is BD. The retention time is 3.543 minutes.
Figure E31: Chromatogram of SLP 29. The active ingredient detected is CP. The retention time is 2.903 minutes.
BD 240 nm
CP
240 nm

176
Figure E32: Chromatogram of SLP 30. The active ingredient detected is CP. The retention time is 2.877 minutes.
Figure E33: Chromatogram of SLP 31. The active ingredient detected is CP. The retention time is 2.908 minutes.
CP
240 nm
CP
240 nm
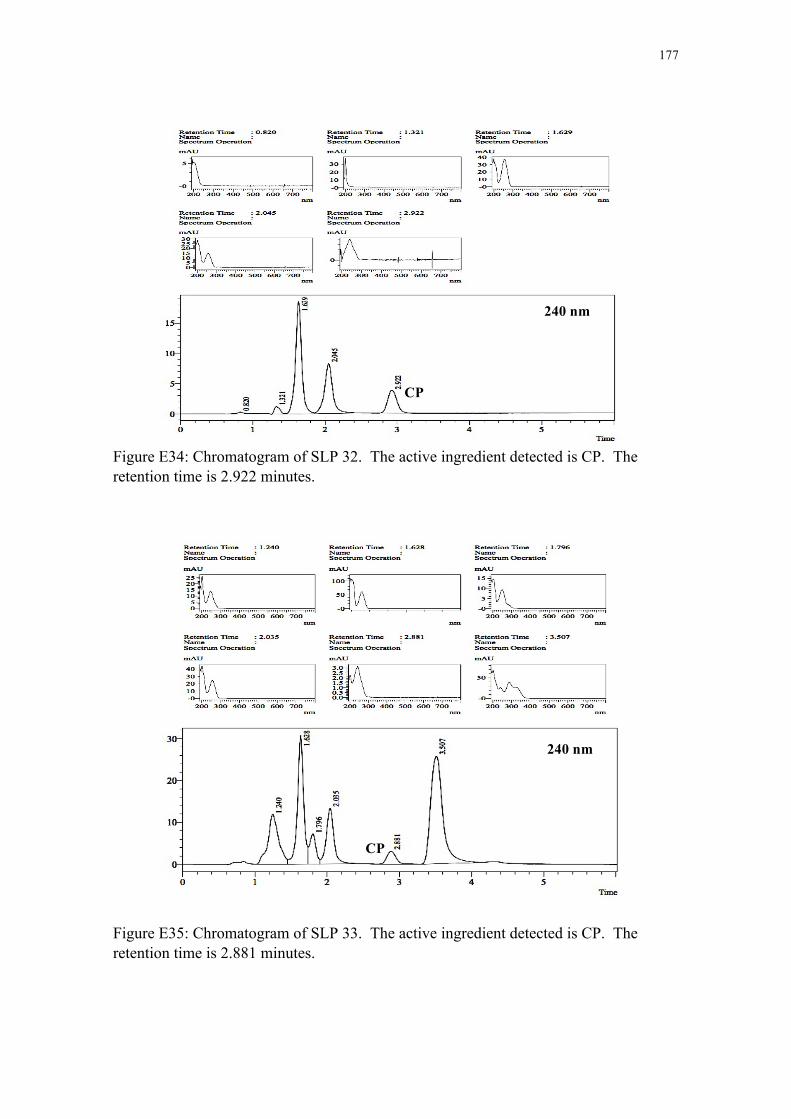
177
Figure E34: Chromatogram of SLP 32. The active ingredient detected is CP. The retention time is 2.922 minutes.
Figure E35: Chromatogram of SLP 33. The active ingredient detected is CP. The retention time is 2.881 minutes.
CP
240 nm
CP
240 nm

178
Figure E36: Chromatogram of SLP 34. The active ingredient detected is CP. The retention time is 2.934 minutes.
Figure E37: Chromatogram of SLP 35. The active ingredient detected is BD. The retention time is 3.631 minutes.
CP 240 nm
BD 240 nm

179
Appendix F
RAW DATA FOR SKIN-LIGHTENING PRODUCTS
This following tables gives the HPLC peak areas of the detected active ingredients in
skin-lightening products. The mass of each product analysed was 0.05 g.
SLP1 HQ SLP1 KA SLP1 NC SLP2 HQ SLP2 KA SLP3 NC SLP3 HQ 721838 706539 709943 702431 713853 699164 698544 697907 696650
618803 610842 608294 605418 602316 606199 598238 601286 601840
15241 15629 14872 17892 18573 17629 16880 16950 16994
555600 555472 555678 542029 548604 547966 522027 523133 516341
344515 340478 338366 335507 334959 334798 330715 330094 327272
36548 34687 34787 37310 35523 35472 35111 35449 35493
1020158 1026687 1026687 1017666 1016093 1021539 1019342 1012430 1013760
SLP3 KA SLP3 NC SLP4 HQ SLP4 KA SLP5 HQ SLP5 KA SLP8 HQ 736145 736900 730189 722006 723306 732888 718429 718187 717849
26444 27881 26872 28092 27838 27951 28831 29163 27294
617787 613291 616319 599520 596606 596427 584134 587775 585271
660678 659710 658861 650878 649159 650997 648930 648159 645492
1105280 1107130 1108778 1084052 1078371 1070224 1071570 1069604 1072695
209905 212475 213340 215091 213889 213127 211729 209156 209087
10768 9938 10170 9937 9829 9916 10209 9892 9997
SLP8 KA SLP9 CP SLP9 CT SLP10 HQ
SLP11 HQ
SLP12 HQ
SLP12 BQ
1060520 1059959 1054661 1116260 1110279 1115774 1060127
39317 39106 40268 38617 40453 40110 39622
17263 17050 17369 18166 16687 17823 16381
974992 970614 974102 958888 954675 957208 940544
944473 945941 945771 929479 925394 928039 923914
657681 654640 656533 647841 644763 649535 648497
30859 29504 30357 27378 27700 27370 26507

180
1054867 1061047
39640 38978
16444 16808
943519 941446
921504 922835
644461 647537
27583 28076
SLP13 HQ
SLP13 BQ
SLP14 HQ
SLP14 BQ
SLP15 KA
SLP17 KA
SLP18 HQ
1031006 1051079 1039586 1008018 1005811 1009152 987991 996372 982152
15628 14977 15314 13700 13891 13409 13448 13449 13745
1453277 1443216 1444007 1430744 1429711 1430644 1389701 1388655 1386605
20573 19989 19090 18198 18649 18046 14523 14313 14649
1946580 1966659 1948886 1927769 1926448 1923683 1921777 1922439 1919654
24489 23830 23262 23534 23454 23425 24029 23480 23212
4301542 4291433 4298915 4084166 4089610 4062487 4120771 4069215 4067305
SLP18 BQ
SLP19 KA
SLP20 CP
SLP20 CT
SLP21 HQ
SLP22 HQ
SLP22 BQ
9452 9400 9708 9006 8287 9692 13010 13059 14098
930544 925890 926029 904426 887731 889094 913321 897890 899171
33674 33014 33071 32990 33122 33220 33110 33098 33128
9114 9019 10956 8876 8791 9067 8755 8959 8361
1164657 1140037 1146627 1090789 1066674 1058817 1100825 1090397 1095979
2413728 2416790 2417796 2409746 2407573 2397989 2436873 2424235 2427706
10154 9625 9690 9392 9523 9075 10380 10385 10418
SLP23 HQ
SLP23 BQ
SLP24 NC
SLP25 BD
SLP26 CP
SLP27 CP
SLP28 BD
2237655 2199600 2191544 2148236 2143456 2133775 2150146 2147944 2143602
18534 18948 19555 18399 15047 15291 16614 15122 15865
1039284 1033020 1047378 1044395 1052379 972911 1043345 1040507 1039984
19147 18939 18805 19203 19183 19283 19478 19833 19664
34827 35970 35820 34955 35137 35949 35129 35490 35803
34080 35323 37797 34879 38948 36985 36474 38028 36461
26930 25904 25718 25530 27038 25854 25998 25142 26257

181
SLP29 CP
SLP30 CP
SLP31 CP
SLP32 CP
SLP33 CP
SLP34 CP
SLP35 BD
23339 23532 23274 23441 23328 23319 23639 23531 23693
8662 8484 8382 8441 8244 8425 8164 8159 8202
26586 26628 26310 26354 26553 26512 26211 26405 26762
34980 36555 35096 36587 34009 34138 35226 34010 35788
27813 27274 32086 33814 29998 37967 28232 26805 28565
21332 21221 21110 21573 21372 21376 20971 21591 21360
26691 27946 27829 26699 27798 28134 26886 27580 27473

182
Appendix G
CALIBRATION DATA FOR HEAVY METALS
The calibration data for all the heavy metals analysed is given in this section.
Table G1: Calibration data for the determination of aluminum (Al).
Concentration/mg L-1 0.01 0.04 0.07 0.10 0.40 0.70 1.00 1.30 1.60 1 2 3
409.8 348.4 396.4
1749.0 1701.5 1813.2
3723.0 3843.7 3829.9
6009.0 6050.9 5984.2
24626.4 24631.7 24765.2
41544.6 41208.0 40354.6
57591.6 57944.6 59113.2
79374.5 76937.5 77358.8
96096.7 97026.6 96642.0
Mean 384.9 1754.6 3798.9 6014.7 24674.4 41035.7 58216.6 77890.3 96588.4 Std Dev 32.3 56.1 66.1 33.7 78.7 613.4 796.4 1302.5 467.3 RSD% 8.4 3.2 1.7 0.6 0.3 1.5 1.4 1.7 0.5
Table G2: Calibration data for the determination of chromium (Cr).
Concentration/mg L-1 0.01 0.04 0.07 0.10 0.40 0.70 1.00 1.30 1.60 1 2 3
276.5 299.8 286.8
1320.6 1336.9 1333.5
2552.4 2575.1 2630.6
4017.8 3986.9 3984.1
15507.6 15382.0 15227.0
27471.2 27498.9 27479.7
39027.7 39120.7 39314.2
51219.1 51203.1 50971.1
62213.5 61427.1 61067.0
Mean 287.7 1330.3 2586.0 3996.3 15372.2 27483.3 39154.2 51131.1 61569.2 Std Dev 11.7 8.6 40.2 18.7 140.6 14.2 146.2 138.8 586.3 RSD% 4.1 0.6 1.6 0.5 0.9 0.1 0.4 0.3 0.9

183
Table G3: Calibration data for the determination of copper (Cu).
Concentration/mg L-1 0.01 0.04 0.07 0.10 0.40 0.70 1.00 1.30 1.60 1 2 3
2687.3 2594.5 3031.0
11743 12011 12622
18471 18260 17974
27934 27724 28047
91752 91057 92346
155008.0 154177.9 151557.3
212363.7 212447.9 214919.0
295999.2 292484.5 291580.5
347650.8 345815.2 344257.3
Mean 2770.9 12125 18235 27901 91718 153581.1 213243.5 293354.7 345907.8 Std Dev 229.9 450.5 249.4 163.9 645.2 1801.1 1451.6 2334.4 1698.6 RSD% 8.3 3.7 1.4 0.6 0.7 1.2 0.7 0.8 0.5
Table G4: Calibration data for the determination of iron (Fe).
Concentration/mg L-1 0.01 0.04 0.07 0.10 0.40 0.70 1.00 1.30 1.60 1 2 3
80.0 88.0 82.6
786.0 816.3 815.0
2016.7 2055.2 2119.0
3542.5 3537.5 3557.6
20055.5 20082.1 20059.7
40330.1 39957.8 39656.6
58242.3 58070.6 58401.8
79905.7 79695.5 79210.3
98769.7 97555.3 97118.4
Mean 83.5 805.8 2063.6 3545.9 20065.8 39981.5 58238.2 79603.8 97814.5 Std Dev 4.1 17.1 51.7 10.5 14.3 337.4 165.6 356.6 855.6 RSD% 4.9 2.1 2.5 0.3 0.1 0.8 0.3 0.4 0.9
Table G5: Calibration data for the determination of manganese (Mn).
Concentration/mg L-1 0.01 0.04 0.07 0.10 0.40 0.70 1.00 1.30 1.60 1 2 3
1676 1602 1738
10790 10952 10949
18065 18038 18084
25764 25865 25873
113357 112903 114252
200232 198842 196395
280982 281022 282266
383087 382282 380837
454975 450026 446693
Mean 1672 10897 18062.3 25834 113504 198489 281423 382068 450564 Std Dev 68.1 92.7 23.1 60.8 686.4 1942.6 730.0 1140.1 4167.2 RSD% 4.1 0.9 0.1 0.2 0.6 0.9 0.3 0.3 0.9

184
Table G6: Calibration data for the determination of nickel (Ni).
Concentration/mg L-1 0.01 0.04 0.07 0.10 0.40 0.70 1.00 1.30 1.60 1 2 3
129.0 116.2 121.8
721.4 726.5 753.7
1240.8 1243.3 1265.7
1939.5 1925.5 1992.5
7534.5 7511.9 7429.1
13370.2 13363.5 13365.9
19241.9 19348.3 19538.3
25910.6 25881.8 25918.1
31754.3 31789.3 31597.1
Mean 122.3 733.9 1249.9 1952.5 7491.8 13366.5 19376.2 25903.5 31713.6 Std Dev 6.4 17.5 13.7 35.3 55.5 3.4 150.2 19.2 102.4 RSD% 5.2 2.4 1.1 1.8 0.7 0.03 0.8 0.1 0.3
Table G7: Calibration data for the determination of lead (Pb).
Concentration/mg L-1 0.01 0.04 0.07 0.10 0.40 0.70 1.00 1.30 1.60 1 2 3
25.1 25.1 25.1
32.4 42.5 36.4
74.4 78.1 53.1
114.8 112.3 130.6
498.2 489.9 489.9
815.5 818.4 809.3
1127.3 1155.3 1137.2
1538.8 1539.2 1511.2
1849.2 1869.6 1869.4
Mean 25.1 37.1 68.5 119.2 492.7 814.4 1139.9 1529.7 1862.7 Std Dev 4.4×10⁻¹⁵ 5.1 13.5 9.9 4.8 4.6 14.2 16.1 11.7 RSD% 1.7×10⁻¹⁴ 13.7 19.7 8.3 0.9 0.6 1.2 1.0 0.6
Table G8: Calibration data for the determination of zinc (Zn).
Concentration/mg L-1 0.01 0.04 0.07 0.10 0.40 0.70 1.00 1.30 1.60 1 2 3
391.4 377.1 371.0
1567.5 1546.4 1530.9
2343.9 2342.3 2327.2
3720.4 3712.6 3779.5
14375.3 14353.2 14390.5
25345.0 25329.8 25434.8
35827.4 36679.6 36045.0
48458.0 48516.5 48388.6
58951.0 58413.3 58379.5
Mean 379.8 1548.3 2337.8 3737.5 14373 25369.9 36184 48454.4 58581.3 Std Dev 10.5 18.4 9.2 36.6 18.8 56.7 442.8 64 320.6 RSD% 2.8 1.2 0.4 0.9 0.1 0.2 1.2 0.1 0.5

185
Table G9: Calibration data for the determination of mercury (Hg).
Mass /ng
100
200 300 400
500
600
700
800
1 2 3
0.078 0.080 0.081
0.145 0.144 0.149
0.235 0.237 0.232
0.307 0.309 0.313
0.384 0.38
0.379
0.448 0.447 0.442
0.508 0.505 0.501
0.567 0.565 0.569
Mean 0.079 0.146 0.235 0.309 0.381 0.446 0.505 0.567 Std Dev 0.0015 0.0026 0.0025 0.0031 0.0026 0.0032 0.0035 0.0020 RSD% 1.9 1.8 1.1 0.9 0.7 0.7 0.7 0.4

186
Appendix H
CALIBRATION CURVES AND RESIDUAL PLOTS FOR HEAVY
METALS
The calibration curves and residual plots for all the heavy metals analysed by ICP-OES
and CV-AAS are provided in this Appendix.
Figure H1: Calibration graph for the determination of aluminium at 396.153 nm.
Figure H2: Residual plot for the calibration graph of aluminium.
y=59756xR²=0.9997
0
20000
40000
60000
80000
100000
120000
0 0,2 0,4 0,6 0,8 1 1,2 1,4 1,6 1,8Em
issi
on co
unts
per
seco
nd
[Al]/mg L-1
-2500-2000-1500-1000-500
0500100015002000
0 0,2 0,4 0,6 0,8 1 1,2 1,4 1,6 1,8
Res
idua
ls
[Al]/mg L-1

187
Figure H3: Calibration graph for the determination of chromium at 267.716 nm.
Figure H4: Residual plot for the calibration graph chromium.
y=38901xR²=0.9999
0
10000
20000
30000
40000
50000
60000
70000
0 0,5 1 1,5 2
Em
issi
on co
unts
per
seco
nd
[Cr]/mg L-1
-1500
-1000
-500
0
500
1000
0 0,2 0,4 0,6 0,8 1 1,2 1,4 1,6 1,8
Res
idua
ls
[Cr]/mg L-1
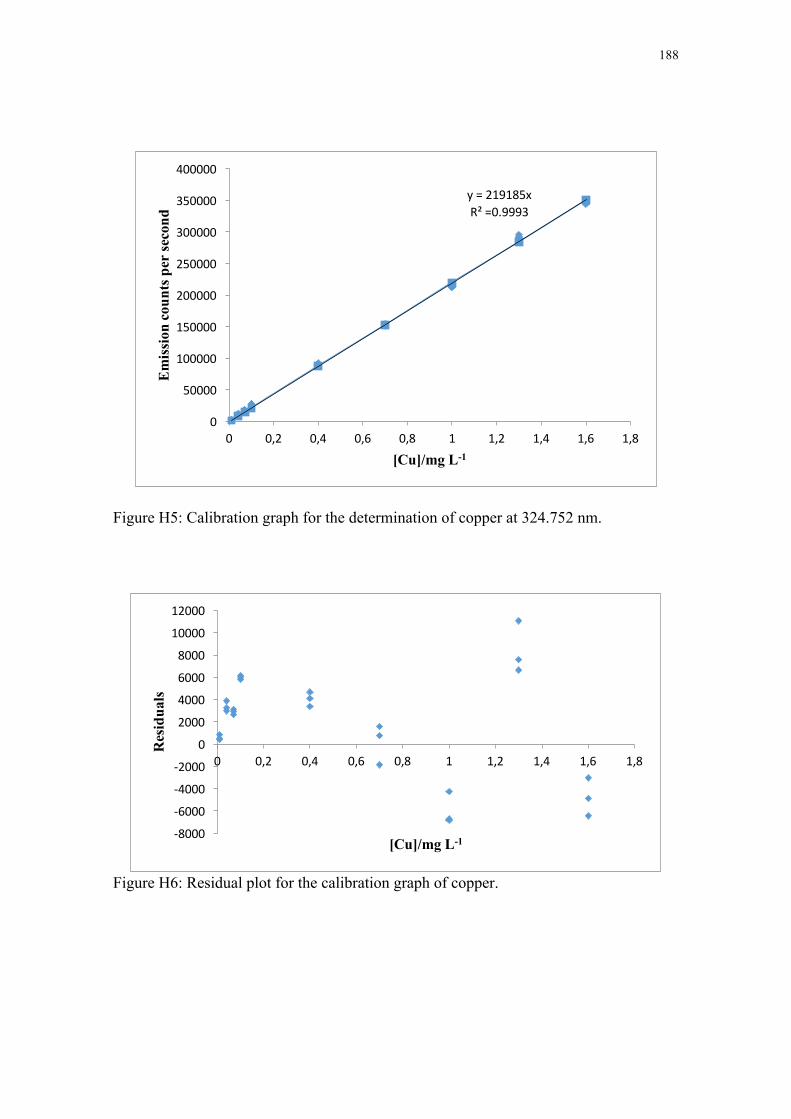
188
Figure H5: Calibration graph for the determination of copper at 324.752 nm.
Figure H6: Residual plot for the calibration graph of copper.
y=219185xR²=0.9993
0
50000
100000
150000
200000
250000
300000
350000
400000
0 0,2 0,4 0,6 0,8 1 1,2 1,4 1,6 1,8
Em
issi
on co
unts
per
seco
nd
[Cu]/mg L-1
-8000-6000-4000-2000
020004000600080001000012000
0 0,2 0,4 0,6 0,8 1 1,2 1,4 1,6 1,8
Res
idua
ls
[Cu]/mg L-1

189
Figure H7: Calibration graph for the determination of iron at 259.939 nm.
Figure H8: Residual plot for the calibration graph of iron.
y=59962xR²=0.9980
0
20000
40000
60000
80000
100000
120000
0 0,2 0,4 0,6 0,8 1 1,2 1,4 1,6 1,8
Em
issi
on co
unts
per
seco
nd
[Fe]/mg L-1
-5000
-4000
-3000
-2000
-1000
0
1000
2000
3000
4000
0 0,2 0,4 0,6 0,8 1 1,2 1,4 1,6 1,8
Res
idua
ls
[Fe]/mg L-1

190
Figure H9: Calibration graph for the determination of manganese at 257.610 nm.
Figure H10: Residual plot for the calibration graph of manganese.
y=285242xR²=0.9996
0
50000
100000
150000
200000
250000
300000
350000
400000
450000
500000
0 0,2 0,4 0,6 0,8 1 1,2 1,4 1,6 1,8
Em
issi
on co
unts
per
seco
nd
[Mn]/mg L-1
-15000
-10000
-5000
0
5000
10000
15000
0 0,2 0,4 0,6 0,8 1 1,2 1,4 1,6 1,8Res
idua
ls
[Mn]/mg L-1

191
Figure H11: Calibration graph for the determination of nickel at 231.604 nm.
Figure H12: Residual plot for the calibration graph of nickel.
y=19683xR²=0.9997
0
5000
10000
15000
20000
25000
30000
35000
0 0,2 0,4 0,6 0,8 1 1,2 1,4 1,6 1,8
Em
issi
on co
unts
per
seco
nd
[Ni]/mg L-1
-500
-400
-300
-200
-100
0
100
200
300
400
0 0,2 0,4 0,6 0,8 1 1,2 1,4 1,6 1,8
Res
idua
ls
[Ni]/mg L-1

192
Figure H13: Calibration graph for the determination of lead at 217.000 nm.
Figure H14: Residual plot for the calibration graph of lead.
y=1165.3xR²=0.9997
0
200
400
600
800
1000
1200
1400
1600
1800
2000
0 0,2 0,4 0,6 0,8 1 1,2 1,4 1,6 1,8
Em
issi
on co
unts
per
seco
nd
[Pb]/mg L-1
-50
-40
-30
-20
-10
0
10
20
30
40
0 0,2 0,4 0,6 0,8 1 1,2 1,4 1,6 1,8
Res
idua
ls
[Pb]/mg L-1

193
Figure H15: Calibration graph for the determination of zinc at 213.857 nm.
Figure H16: Residual plot for the calibration graph of zinc.
y=36679xR²=0.9998
0
10000
20000
30000
40000
50000
60000
70000
0 0,2 0,4 0,6 0,8 1 1,2 1,4 1,6 1,8
Em
issi
on co
unts
per
seco
nd
[Zn]/mg L-1
-1000
-800
-600
-400
-200
0
200
400
600
800
1000
0 0,2 0,4 0,6 0,8 1 1,2 1,4 1,6 1,8Res
idua
ls
[Zn]/mg L-1

194
Figure H17: Calibration graph for the determination of mercury at 253.7 nm.
Figure H18: Residual plot for the calibration graph of mercury.
y=0.0007xR²=0.9989
0
0,1
0,2
0,3
0,4
0,5
0,6
0,7
0 100 200 300 400 500 600 700 800 900
Abs
orba
nce
[Hg] /ng
-0,025
-0,02
-0,015
-0,01
-0,005
0
0,005
0,01
0,015
0,02
0,025
0 100 200 300 400 500 600 700 800 900Res
idua
ls
[Hg] /ng


