Embed Size (px)
Citation preview
WHO FOOD ADDITIVES SERIES: 80
Prepared by the eighty-ninth meeting of the Joint FAO/WHO Expert Committee
on Food Additives (JECFA)
Safety evaluation of certain food additives

WHO FOOD ADDITIVES SERIES: 80
Prepared by the eighty-ninth meeting of theJoint FAO/WHO Expert Committee
on Food Additives (JECFA)
Safety evaluation of certain food additives
World Health Organization, Geneva, 2022
The summaries and evaluations contained in this book are, in most cases, based on unpublished proprietary data submitted for the purpose of the JECFA assessment. A registration authority should not grant a registration on the basis
of an evaluation unless it has first received authorization for such use from the owner who submitted the data for JECFA review or has received the data on which the summaries are based, either from the owner of the data or from a second
party that has obtained permission from the owner of the data for this purpose.
Safety evaluation of certain food additives: prepared by the eighty-ninth meeting of the Joint FAO/WHO Expert Committee on Food Additives (JECFA)
(WHO Food Additives Series, No. 80)
ISBN (WHO) 978-92-4-003844-8 (electronic version)
ISBN (WHO) 978-92-4-003845-5 (print version)
ISBN (FAO) 978-92-5-136214-3 [Print and online]
ISSN 0300-0923
© World Health Organization and Food and Agriculture Organization of the United Nations, 2022Some rights reserved. This work is available under the Creative Commons Attribution-NonCommercial-ShareAlike 3.0 IGO licence (CC BY-NC-SA 3.0 IGO; https://creativecommons.org/licenses/by-nc-sa/3.0/igo/).
Under the terms of this licence, you may copy, redistribute and adapt the work for non-commercial purposes, provided the work is appropriately cited, as indicated below. In any use of this work, there should be no suggestion that the World Health Organization (WHO) or the Food and Agriculture Organization of the United Nations (FAO) endorse any specific organization, products or services. The use of the WHO or FAO logo is not permitted. If you adapt the work, then you must license your work under the same or equivalent Creative Commons licence. If you create a translation of this work, you should add the following disclaimer along with the suggested citation: “This translation was not created by the World Health Organization (WHO) or the Food and Agriculture Organization of the United Nations (FAO). WHO and FAO are not responsible for the content or accuracy of this translation. The original English edition shall be the binding and authentic edition”.
Any mediation relating to disputes arising under the licence shall be conducted in accordance with the mediation rules of the World Intellectual Property Organization http://www.wipo.int/amc/en/mediation/rules.
Suggested citation. Safety evaluation of certain food additives: prepared by the eighty-ninth meeting of the Joint FAO/WHO Expert Committee on Food Additives (JECFA). Geneva: World Health Organization and Food and Agriculture Organization of the United Nations; 2022 (WHO Food Additives Series, No. 80). Licence: CC BY-NC-SA 3.0 IGO.
Cataloguing-in-Publication (CIP) data. CIP data are available at http://apps.who.int/iris.
Sales, rights and licensing. To purchase WHO publications, see http://apps.who.int/bookorders. To submit requests for commercial use and queries on rights and licensing, see https://www.who.int/copyright.
Third-party materials. If you wish to reuse material from this work that is attributed to a third party, such as tables, figures or images, it is your responsibility to determine whether permission is needed for that reuse and to obtain permission from the copyright holder. The risk of claims resulting from infringement of any third-party-owned component in the work rests solely with the user.
WHO Photographs. WHO photographs are copyrighted and are not to be reproduced in any medium without obtaining prior written permission. Requests for permission to reproduce WHO photographs should be addressed to: http://www.who.int/copyright.
The designations employed and the presentation of the material in this publication do not imply the expression of any opinion whatsoever on the part of WHO or FAO concerning the legal or development status of any country, territory, city or area or of its authorities, or concerning the delimitation of its frontiers or boundaries. Dotted lines on maps represent approximate border lines for which there may not yet be full agreement.
The mention of specific companies or of certain manufacturers’ products, whether or not these have been patented, does not imply that they are endorsed or recommended by WHO or FAO in preference to others of a similar nature that are not mentioned. Errors and omissions excepted, the names of proprietary products are distinguished by initial capital letters.
All reasonable precautions have been taken by WHO and FAO to verify the information contained in this publication. However, the published material is being distributed without warranty of any kind, either expressed or implied. The responsibility for the interpretation and use of the material lies with the reader. In no event shall WHO and FAO be liable for damages arising from its use.
This publication contains the collective views of an international group of experts and does not necessarily represent the decisions or the policies of WHO or FAO.
iii
CONTENTS
Preface v
Safety evaluation of specific food additives (other than flavouring agents) 1
Adenosine 5´-monophosphate deaminase from Streptomyces murinus 3D-Allulose 3-epimerase from Arthrobacter globiformis expressed in Escherichia coli 17Jagua (genipin-glycine) blue (addendum) 29Lipase from Mucor javanicus 45Phosphatidylinisotol-specific phospholipase C expressed in Pseudomonas fluorescens 57
Safety evaluation of groups of related flavouring agents 71
Amino acids and related substances (addendum) 73Phenol and phenol derivatives (addendum) 153
Exposure assessment 185
Sucrose esters of fatty acids (INS 473) and sucrose oligoesters type I and type II (INS 473a) 187
Annex 1 Reports and other documents resulting from previous meetings of the Joint FAO/WHO Expert Committee on Food Additives 201
Annex 2 Abbreviations and acronyms used in the monographs 213
Annex 3 Participants in the eighty-ninth meeting of the Joint FAO/WHO Expert Committee onFood Additives 215
Annex 4 Toxicological and dietary exposure information and information on specifications 219
Annex 5 Summary of the safety evaluation of secondary components of flavouring agent with minimum assay values of less than 95% 223
Annex 6 Corrigenda 225

v
PREFACE
The monographs contained in this volume were prepared at the eighty-ninth meeting of the Joint Food and Agriculture Organization of the United Nations (FAO)/World Health Organization (WHO) Expert Committee on Food Additives (JECFA), which met virtually on 2–11 June 2020. These monographs summarize the data on selected food additives and groups of flavouring agents reviewed by the Committee.
The eighty-ninth report of JECFA has been published by WHO as WHO Technical Report No. 1027. Reports and other documents resulting from previous meetings of JECFA are listed in Annex 1, and the participants in the meeting are listed in Annex 3. A summary of the conclusions of the Committee with respect to the food additives discussed at the meeting is given in Annex 4.
JECFA serves as a scientific advisory body to FAO, WHO, their Member States and the Codex Alimentarius Commission, primarily through the Codex Committee on Food Additives, the Codex Committee on Contaminants in Food and the Codex Committee on Residues of Veterinary Drugs in Foods, regarding the safety of food additives, residues of veterinary drugs, naturally occurring toxicants and contaminants in food. Committees accomplish this task by preparing reports of their meetings and publishing specifications or residue monographs and dietary exposure and toxicological monographs, such as those contained in this volume, on substances that they have considered.
The monographs contained in this volume are based on working papers that were prepared by WHO and FAO experts. An acknowledgement is given at the beginning of each monograph to those who prepared the working papers. The monographs were edited by E. Heseltine, Saint Léon-sur-Vézère, France.
The monographs are based on evaluations of original studies and the dossiers provided by the sponsor(s) of the compound, of the relevant published scientific literature and of data submitted by Codex members. When consistent with the data from the original study, the monographs may contain parts of the text and tables of the dossier submitted by the sponsor(s), but not the sponsor(s)’ conclusions. The monographs and their conclusions are based on independent reviews of the available data and do not constitute endorsement of the sponsor(s)’ position.
Any comments or new information on the biological or toxicological properties of or dietary exposure to the compounds evaluated in this publication should be addressed to: WHO Joint Secretary of the Joint FAO/WHO Expert Committee on Food Additives, Department of Food Safety and Zoonoses, World Health Organization, 20 Avenue Appia, 1211 Geneva 27, Switzerland ([email protected]).

vi
1
SAFETY EVALUATION OF SPECIFIC FOOD ADDITIVES (OTHER THAN FLAVOURING AGENTS)

3
Adenosine 5´-monophosphate deaminase from Streptomyces murinus
First draft prepared byJ. Rotstein,1 T. Hambridge,2 U. Mueller,3 J.R. Srinivasan4 and S.G. Walch5
1 Food Directorate, Health Canada, Ottawa, Canada2 Food Standards Australia New Zealand, Canberra, Australia3 Yarralumla, Australian Capital Territory, Australia4 Food and Drug Administration, College Park, MD, USA5 Chemisches und Veterinäruntersuchungsamt Karlsruhe, Karlsruhe, Germany
1. Explanation 31.1 Genetic background 41.2 Chemical and technical considerations 4
2. Biological data 52.1 Biotransformation 52.2 Assessment of potential allergenicity 52.3 Toxicological studies 6
2.3.1 Acute toxicity 62.3.2 Short-term studies of toxicity 62.3.3 Long-term studies of toxicity and carcinogenicity 102.3.4 Genotoxicity 102.3.5 Reproductive and developmental toxicity 10
2.4 Observations in humans 103. Dietary exposure 10
3.1 Introduction 103.2 Dietary exposure assessment 11
4. Comments 125. Evaluation 136. References 13
1. ExplanationAt the request of the CCFA at its Forty-ninth Session (1),1 the Committee evaluated the safety of adenosine 5′-monophosphate deaminase (AMP deaminase; Enzyme Commission No. 3.5.4.6) from Streptomyces murinus, which it had not previously considered. By promoting the conversion of AMP into inosine 5′-monophosphate,
1 Amano Enzyme Inc. requested evaluation of this enzyme at the Forty-ninth Session of the Codex Committee on Food Additives (Macao SAR, China, 20–24 March 2017); however, it was included in the call for data for the 89th JECFA meeting by the Codex Committee at its Fifty-first session (2).
4
WH
O F
ood
Addi
tives
Ser
ies N
o. 8
0, 2
022
Safety evaluation of certain food additives Eighty-ninth JECFA
the enzyme enhances flavour in foods. AMP deaminase enzyme preparation is intended for use in the processing of yeast and yeast-like products, as well as in the production of flavourings.
In this report, the expression “AMP deaminase” refers to the enzyme and its amino acid sequence; the expression “AMP deaminase concentrate” refers to the enzyme concentrate used in the toxicity studies; and the expression “AMP deaminase preparation” refers to the enzyme preparation formulated for commercial use.
At the present meeting, the Committee considered the submitted data and conducted a literature search in Google Scholar with the linked search terms “adenosine 5´-monophosphate deaminase” and “Streptomyces murinus”, which resulted in 47 references; however, none was considered relevant for this toxicological evaluation.
1.1 Genetic backgroundS. murinus is an actinobacterium found in soil. Strains of S. murinus have been deposited in several public culture collections, including the American Type Culture Collection (3) and the German Collection of Microorganisms and Cell Cultures (4). Streptomyces species are generally not pathogenic, and there is no evidence or indication of pathogenicity of S. murinus (5). It is not included on the list of pathogens in Annex III of Directive 2000/54/EC on the protection of workers from risks related to exposure to biological agents at work or on the list of pathogens in Belgium (6, 7). No reports have been published of any potential toxigenicity of S. murinus for use in industrial production (8).
Streptomyces species are recognized for use in food applications (9), including as a source organism in the production of glucose isomerase used in food processing (10–12). In Japan, S. murinus is permitted as a source of an AMP deaminase preparation intended for use as a food additive or processing aid.
S. murinus AE-DNTS, the production strain, was obtained by chemical mutagenesis followed by selection of individual colonies of the parent strain, S. murinus (NBRC14802). The phylogenetic relation of the production strain was verified as S. murinus based on gyrB gene sequence analysis and BLAST homology searches.
1.2 Chemical and technical considerations AMP deaminase is manufactured by controlled aerobic batch fermentation of a pure culture of S. murinus AE-DNTS carrying the AMP deaminase gene. The enzyme is secreted into the culture medium and separated in a series of filtration steps. The liquid filtered enzyme is concentrated and purified and formulated as the commercial AMP deaminase preparation by the addition of dextrin. The
5
Adenosine 5´-monophosphate deaminase from Streptomyces murinus
entire production of AMP deaminase is conducted in accordance with good manufacturing practice and the principles of hazard analysis and critical control points, with raw materials that are appropriate for food use. The AMP deaminase preparation is free of the production organism and of antibiotic activity and conforms to the General Specifications for Enzyme Preparations used in Food Processing (13).
AMP deaminase catalyses the hydrolysis of AMP to inosine monophosphate, with the release of ammonia. AMP deaminase promotes the conversion of AMP (which lacks flavour) to inosine 5′-monophosphate (umami) in certain foods. AMP deaminase is intended for use in yeast processing for cereals and in the production of flavourings of vegetable, animal or microbiological origin. Foods containing flavourings may include soups, sauces, stocks, dressings, snack foods, meat-derived foods, bread, crackers and beverages. The AMP deaminase preparation is used at concentrations of 1–100 mg TOS per kilogram raw material.
AMP deaminase activity is determined spectrophotometrically by treating AMP substrate with AMP deaminase and measuring the difference in absorbance at 265 nm after incubation for 15 min. AMP deaminase activity is expressed in deaminase activity units (U), and 1000 U is defined as the amount of the enzyme required to decrease the absorbance by 0.1 when measured at 265 nm for 60 min. The mean activity of AMP deaminase from three batches of concentrate provided was 144 000 000 U/g, and the percentage mean TOS was 7.0%. TOS include the enzyme of interest and residues of organic materials such as proteins, peptides and carbohydrates derived from the production organism during the manufacturing process. In order to obtain a commercial preparation, the AMP deaminase concentrate is formulated with food-grade dextrin. The activity of the commercial enzyme preparation is approximately 60 000 000 U/g or approximately 3.5% TOS. AMP deaminase is expected to be inactivated during processing.
2. Biological data
2.1 BiotransformationNo information was available.
2.2 Assessment of potential allergenicity AMP deaminase was assessed for allergenicity by bioinformatics consistent with the criteria recommended by FAO/WHO and others (14–16). The amino acid sequence of the enzyme (491 amino acids; about 60 kDa) was compared
6
WH
O F
ood
Addi
tives
Ser
ies N
o. 8
0, 2
022
Safety evaluation of certain food additives Eighty-ninth JECFA
with the sequence of known allergens present in the AllergenOnline (http://www.allergenonline.org/databasefasta.shtml; version 19; accessed 10 February 2019) and Allermatch (http://allermatch.org/; version 4 July 2019; accessed 20 November 2019) databases. The two databases were searched for matches with > 35% identity in a sliding window of 80 amino acids and for sequence identity of eight contiguous amino acids. No matches were found. A full-length FASTA sequence search was conducted (with an E-value cut-off of 0.12), and no matches were found. This information indicates the enzyme is not anticipated to pose an allergenic risk.
2.3 Toxicological studiesThe toxicological studies described below were conducted with an AMP deaminase concentrate (batch no. AE-DNTS 61-002$; TOS, 13.8%).
2.3.1 Acute toxicityNo information was available.
2.3.2 Short-term toxicityA 13-week study of oral toxicity in rats was conducted according to guidelines of the Japanese Ministry of Health, Labour and Welfare (17–19) and in compliance with GLP. The study was based on the results of a 2-week dose range-finding study conducted in Sprague-Dawley SPF Crl:CD(SD) rats, 6 weeks old at the start of treatment (20). Groups of six animals of each sex received AMP deaminase concentrate mixed in water as a single gavage dose of 0, 500, 1000 or 2000 mg/kg bw per day, equal to 0, 69, 138 and 275 mg TOS/kg bw per day, respectively, for 14 days. Clinical parameters were monitored three times daily, and body weights and food consumption were measured before treatment and on days 1, 4, 5, 10 and 14 of treatment. Haematology and clinical chemistry were conducted at the end of treatment, and animals were necropsied. Macroscopic examination was performed and selected organs (adrenal glands, spleen, heart, lungs, liver, kidneys, testes and ovaries) from all animals were weighed.
During treatment, one male rat at the high dose died about 1 h after administration of the test material on day 3. Necropsy indicated that the death was due to an error in administration. Increased white blood cell counts were observed in animals at the highest dose, which was statistically significant in males (P ≤ 0.05; Dunnett test) but not in females when compared with their
2 Comparisons between highly homologous proteins yield expectation (E) values approaching zero, indicating a very low probability that such matches would occur by chance. A large E value indicates a lower degree of similarity.
7
Adenosine 5´-monophosphate deaminase from Streptomyces murinus
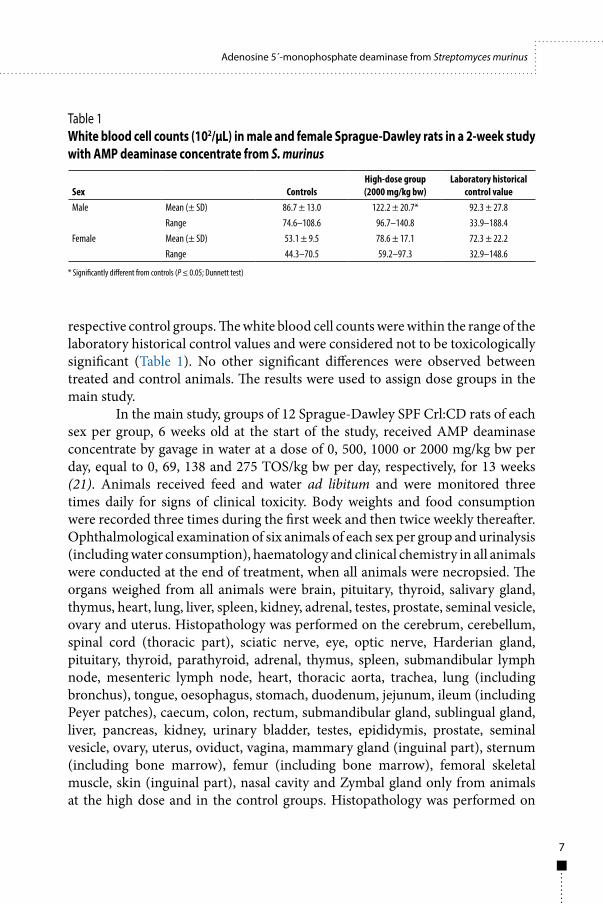
respective control groups. The white blood cell counts were within the range of the laboratory historical control values and were considered not to be toxicologically significant (Table 1). No other significant differences were observed between treated and control animals. The results were used to assign dose groups in the main study.
In the main study, groups of 12 Sprague-Dawley SPF Crl:CD rats of each sex per group, 6 weeks old at the start of the study, received AMP deaminase concentrate by gavage in water at a dose of 0, 500, 1000 or 2000 mg/kg bw per day, equal to 0, 69, 138 and 275 TOS/kg bw per day, respectively, for 13 weeks (21). Animals received feed and water ad libitum and were monitored three times daily for signs of clinical toxicity. Body weights and food consumption were recorded three times during the first week and then twice weekly thereafter. Ophthalmological examination of six animals of each sex per group and urinalysis (including water consumption), haematology and clinical chemistry in all animals were conducted at the end of treatment, when all animals were necropsied. The organs weighed from all animals were brain, pituitary, thyroid, salivary gland, thymus, heart, lung, liver, spleen, kidney, adrenal, testes, prostate, seminal vesicle, ovary and uterus. Histopathology was performed on the cerebrum, cerebellum, spinal cord (thoracic part), sciatic nerve, eye, optic nerve, Harderian gland, pituitary, thyroid, parathyroid, adrenal, thymus, spleen, submandibular lymph node, mesenteric lymph node, heart, thoracic aorta, trachea, lung (including bronchus), tongue, oesophagus, stomach, duodenum, jejunum, ileum (including Peyer patches), caecum, colon, rectum, submandibular gland, sublingual gland, liver, pancreas, kidney, urinary bladder, testes, epididymis, prostate, seminal vesicle, ovary, uterus, oviduct, vagina, mammary gland (inguinal part), sternum (including bone marrow), femur (including bone marrow), femoral skeletal muscle, skin (inguinal part), nasal cavity and Zymbal gland only from animals at the high dose and in the control groups. Histopathology was performed on
Table 1 White blood cell counts (102/μL) in male and female Sprague-Dawley rats in a 2-week study with AMP deaminase concentrate from S. murinus
Sex ControlsHigh-dose group (2000 mg/kg bw)
Laboratory historical control value
Male Mean (± SD) 86.7 ± 13.0 122.2 ± 20.7* 92.3 ± 27.8Range 74.6–108.6 96.7–140.8 33.9–188.4
Female Mean (± SD) 53.1 ± 9.5 78.6 ± 17.1 72.3 ± 22.2Range 44.3–70.5 59.2–97.3 32.9–148.6
* Significantly different from controls (P ≤ 0.05; Dunnett test)
8
WH
O F
ood
Addi
tives
Ser
ies N
o. 8
0, 2
022
Safety evaluation of certain food additives Eighty-ninth JECFA
samples of lung, trachea, caecum and colon from animals at the low and middle doses.
All animals survived to termination, and no clinical signs of toxicity were observed. Body weights, and food consumption were not significantly different between the treated and control groups. Ophthalmological examination showed no treatment-related effect. Despite similar water consumption, the osmolality (or concentration) of urine was significantly decreased (P ≤ 0.05, Dunnett test) in high-dose males relative to controls (mOsm/kg ± SD, 1621 ± 409 and 2010 ± 298, respectively), accompanied by a significant decrease in the excretion of potassium in males at the middle (P < 0.05, Dunnett test) and high doses (P < 0.01, Dunnett test) relative to controls (mmol/24 h ± SD; low dose, 4.2 ± 0.8; middle dose, 3.4 ± 0.7; high dose, 3.2 ± 0.6; control, 4.4 ± 0.9). The changes in urine potassium were not reflected in plasma potassium levels, were reported to be consistent with normal physiological variation and were considered not to be toxicologically significant (Table 2).
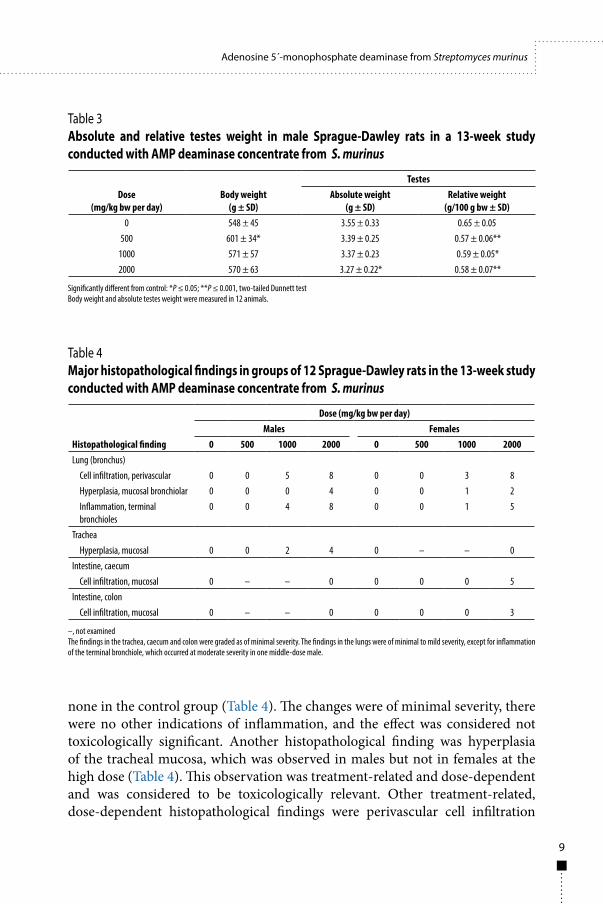
The haematological and clinical chemistry assessments showed no significant treatment-related effects. The absolute weights of the lungs of high-dose females were increased over those of controls, but, as the relative weights were not increased, the change was considered not to be toxicologically significant. Significant decreases were noted in the absolute testis weights in high-dose males and in the relative testis weights in low-, middle- and high-dose males when compared with the control group (Table 3). These were also considered not toxicologically significant, as histopathological examination showed no anomalies in the testes. The histopathological findings included changes in intestinal tissue, where cellular infiltrate was observed in the caecal (5/12 rats) and colon mucosa (3/12 rats) only in females at the high dose, with
Table 2 Urinary osmotic pressure and potassium output in male Sprague-Dawley rats in a 13-week study with AMP deaminase concentrate from S. murinus
Urinary parameter ControlsMid-dose
(1000 mg/kg bw)High dose
(2000 mg/kg bw)Laboratory historical
control valuesOsmotic pressure (mOsm/kg)
Mean (± SD) 2010 ± 298 Not applicable 1621 ± 409* 1836 ± 424Range 1252–2388 Not applicable 1178–2464 454–3062
Potassium output (mmol/24 h)Mean (± SD) 4.4 ± 0.9 3.4 ± 0.7* 3.2 ± 0.6** 3.49 ± 1.08Range 2.7–5.8 2.2–4.2 2.2–4.2 0.60–6.57
* Significantly different (P ≤ 0.05; Dunnett test) from controls** Significantly different (P ≤ 0.01; Dunnett test) from controls
9
Adenosine 5´-monophosphate deaminase from Streptomyces murinus
none in the control group (Table 4). The changes were of minimal severity, there were no other indications of inflammation, and the effect was considered not toxicologically significant. Another histopathological finding was hyperplasia of the tracheal mucosa, which was observed in males but not in females at the high dose (Table 4). This observation was treatment-related and dose-dependent and was considered to be toxicologically relevant. Other treatment-related, dose-dependent histopathological findings were perivascular cell infiltration
Table 3 Absolute and relative testes weight in male Sprague-Dawley rats in a 13-week study conducted with AMP deaminase concentrate from S. murinus
Table 4 Major histopathological findings in groups of 12 Sprague-Dawley rats in the 13-week study conducted with AMP deaminase concentrate from S. murinus
Dose (mg/kg bw per day)
Body weight (g ± SD)
TestesAbsolute weight
(g ± SD)Relative weight
(g/100 g bw ± SD)0 548 ± 45 3.55 ± 0.33 0.65 ± 0.05
500 601 ± 34* 3.39 ± 0.25 0.57 ± 0.06**1000 571 ± 57 3.37 ± 0.23 0.59 ± 0.05*2000 570 ± 63 3.27 ± 0.22* 0.58 ± 0.07**
Significantly different from control: *P ≤ 0.05; **P ≤ 0.001, two-tailed Dunnett testBody weight and absolute testes weight were measured in 12 animals.
Histopathological finding
Dose (mg/kg bw per day)Males Females
0 500 1000 2000 0 500 1000 2000Lung (bronchus)
Cell infiltration, perivascular 0 0 5 8 0 0 3 8Hyperplasia, mucosal bronchiolar 0 0 0 4 0 0 1 2Inflammation, terminal bronchioles
0 0 4 8 0 0 1 5
TracheaHyperplasia, mucosal 0 0 2 4 0 – – 0
Intestine, caecumCell infiltration, mucosal 0 – – 0 0 0 0 5
Intestine, colonCell infiltration, mucosal 0 – – 0 0 0 0 3
–, not examinedThe findings in the trachea, caecum and colon were graded as of minimal severity. The findings in the lungs were of minimal to mild severity, except for inflammation of the terminal bronchiole, which occurred at moderate severity in one middle-dose male.
10
WH
O F
ood
Addi
tives
Ser
ies N
o. 8
0, 2
022
Safety evaluation of certain food additives Eighty-ninth JECFA
and hyperplasia of the bronchiolar mucosa, with inflammation of the terminal bronchioles (Table 4). These effects were observed in both males and females and were considered toxicologically relevant.
The Committee considered the possibility that the lesions in the trachea and bronchus were due to gavage-related reflux in unfasted rats (22). The Committee concluded, however, that there was insufficient information on the potential of the AMP deaminase concentrate to cause mucosal irritation (e.g. osmolality, pH) and, in the absence of any nasal cavity lesions, could not confidently apply this interpretation to the findings.
On the basis of the dose-dependent histopathological findings in the lung in both males and females at ≥ 1000 mg/kg bw per day, the Committee identified a no-observed-effect level (NOAEL) of 500 mg/kg bw per day, equal to 69 mg TOS/kg bw per day.
2.3.3 Long-term toxicity and carcinogenicityNo information was available.
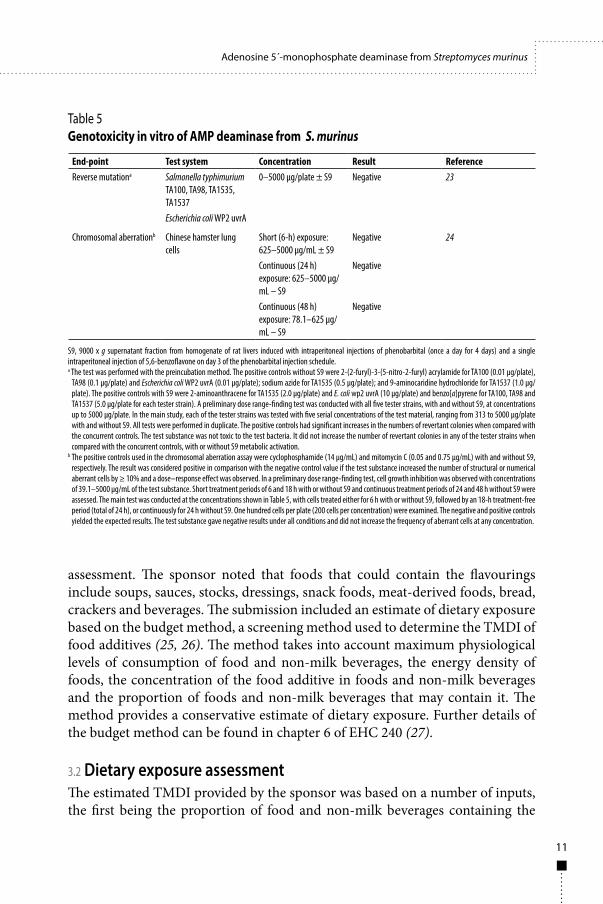
2.3.4 Genotoxicity GLP-compliant genotoxicity studies were conducted according to guidelines of the Japanese Ministry of Health, Labour, and Welfare (18, 19). The powdered form of AMP deaminase concentrate was mixed in water and tested in the bacterial reverse mutation test and the in vitro chromosomal aberration test in cultured Chinese hamster lung cells. The results of these studies were negative (Table 5), indicating that the AMP deaminase concentrate is unlikely to be genotoxic.
2.3.5 Reproductive and developmental toxicityNo information was available.
2.4 Observations in humansNo information was available.
3. Dietary exposure
3.1 IntroductionThe Committee evaluated one submission from the sponsor on dietary exposure to AMP deaminase from S. murinus. The enzyme is intended for use in yeast processing for cereals and in the production of flavourings of vegetable, animal or microbial origin; therefore, these uses were considered for the dietary exposure
11
Adenosine 5´-monophosphate deaminase from Streptomyces murinus
assessment. The sponsor noted that foods that could contain the flavourings include soups, sauces, stocks, dressings, snack foods, meat-derived foods, bread, crackers and beverages. The submission included an estimate of dietary exposure based on the budget method, a screening method used to determine the TMDI of food additives (25, 26). The method takes into account maximum physiological levels of consumption of food and non-milk beverages, the energy density of foods, the concentration of the food additive in foods and non-milk beverages and the proportion of foods and non-milk beverages that may contain it. The method provides a conservative estimate of dietary exposure. Further details of the budget method can be found in chapter 6 of EHC 240 (27).
3.2 Dietary exposure assessmentThe estimated TMDI provided by the sponsor was based on a number of inputs, the first being the proportion of food and non-milk beverages containing the
Table 5 Genotoxicity in vitro of AMP deaminase from S. murinus
End-point Test system Concentration Result ReferenceReverse mutationa Salmonella typhimurium
TA100, TA98, TA1535, TA1537
0–5000 µg/plate ± S9 Negative 23
Escherichia coli WP2 uvrA
Chromosomal aberrationb Chinese hamster lung cells
Short (6-h) exposure: 625–5000 µg/mL ± S9
Negative 24
Continuous (24 h) exposure: 625–5000 µg/mL – S9
Negative
Continuous (48 h) exposure: 78.1–625 µg/mL – S9
Negative
S9, 9000 x g supernatant fraction from homogenate of rat livers induced with intraperitoneal injections of phenobarbital (once a day for 4 days) and a single intraperitoneal injection of 5,6-benzoflavone on day 3 of the phenobarbital injection schedule.a The test was performed with the preincubation method. The positive controls without S9 were 2-(2-furyl)-3-(5-nitro-2-furyl) acrylamide for TA100 (0.01 µg/plate),
TA98 (0.1 µg/plate) and Escherichia coli WP2 uvrA (0.01 µg/plate); sodium azide for TA1535 (0.5 µg/plate); and 9-aminocaridine hydrochloride for TA1537 (1.0 µg/plate). The positive controls with S9 were 2-aminoanthracene for TA1535 (2.0 µg/plate) and E. coli wp2 uvrA (10 µg/plate) and benzo[a]pyrene for TA100, TA98 and TA1537 (5.0 µg/plate for each tester strain). A preliminary dose range-finding test was conducted with all five tester strains, with and without S9, at concentrations up to 5000 µg/plate. In the main study, each of the tester strains was tested with five serial concentrations of the test material, ranging from 313 to 5000 µg/plate with and without S9. All tests were performed in duplicate. The positive controls had significant increases in the numbers of revertant colonies when compared with the concurrent controls. The test substance was not toxic to the test bacteria. It did not increase the number of revertant colonies in any of the tester strains when compared with the concurrent controls, with or without S9 metabolic activation.
b The positive controls used in the chromosomal aberration assay were cyclophosphamide (14 µg/mL) and mitomycin C (0.05 and 0.75 µg/mL) with and without S9, respectively. The result was considered positive in comparison with the negative control value if the test substance increased the number of structural or numerical aberrant cells by ≥ 10% and a dose–response effect was observed. In a preliminary dose range-finding test, cell growth inhibition was observed with concentrations of 39.1–5000 µg/mL of the test substance. Short treatment periods of 6 and 18 h with or without S9 and continuous treatment periods of 24 and 48 h without S9 were assessed. The main test was conducted at the concentrations shown in Table 5, with cells treated either for 6 h with or without S9, followed by an 18-h treatment-free period (total of 24 h), or continuously for 24 h without S9. One hundred cells per plate (200 cells per concentration) were examined. The negative and positive controls yielded the expected results. The test substance gave negative results under all conditions and did not increase the frequency of aberrant cells at any concentration.
12
WH
O F
ood
Addi
tives
Ser
ies N
o. 8
0, 2
022
Safety evaluation of certain food additives Eighty-ninth JECFA
enzyme preparation. EHC 240 refers to commonly used default proportions of 12.5% for foods and 25% for non-milk beverages. Food ingredients processed with the specified AMP deaminase preparation are proposed to be added to a variety of foods intended to be consumed by the general population. The proportion of solid foods and non-milk beverages used in the budget method by the sponsor was 25%. This was higher than the commonly used default stated in EHC 240 because of the proposed use in flavourings, which the sponsor noted would result in a broader range of foods potentially containing the enzyme preparation.
The maximum level of the enzyme present in final food and non-milk beverages was based on the maximum use level of the ingredient (≤ 100 mg TOS/kg ingredient for both food and non-milk beverages) and the maximum amount of the ingredient in the final foods (2% of both food and non-milk beverages). This resulted in a maximum level of the enzyme in the final foods and non-milk beverages of 2 mg TOS/kg for all intended uses (i.e. cereals, flavourings in food and beverages). The resulting TMDIs of 5´-deaminase were estimated to be 0.025 mg TOS/kg bw per day for solid foods and 0.05 mg TOS/kg bw per day for non-milk beverages, for a total of 0.075 mg TOS/kg bw per day.
For the dietary exposure assessment, it was assumed that the enzyme is not removed and/or denatured during final processing of ingredients or foods and that 100% of the enzyme remains in the ingredient and final food. In reality, the enzyme is inactivated by high temperatures during processing of food ingredients such that it will have no technological function in the final food.
4. CommentsAMP deaminase was assessed as a potential allergen by bioinformatics, consistent with the criteria recommended by FAO/WHO and others. Searches for matches with > 35% identity over a sliding window of 80 amino acids and for sequence identity of eight contiguous amino acids were conducted in the AllergenOnline and Allermatch databases. No matches were found. AMP deaminase is not expected to pose a risk of allergenicity.
In a 13-week study of oral toxicity in rats, AMP deaminase enzyme concentrate (TOS content, 13.8%) was mixed in water and administered by gavage at doses up to 2000 mg/kg bw per day, equal to 275 mg TOS/kg bw per day. Treatment-related, dose-dependent histopathological findings were observed in the lungs of both males and females and in the tracheas of males at ≥ 1000 mg/kg bw per day. The Committee considered the possibility that these observations were due to gavage-related reflex but concluded that there was insufficient information to accept this interpretation of the findings. The Committee identified an NOAEL of 500 mg/kg bw per day, equal to 69 mg TOS/kg bw per day.
13
Adenosine 5´-monophosphate deaminase from Streptomyces murinus
The enzyme concentrate was not genotoxic in a bacterial reverse mutation assay or in a chromosomal aberration assay.
The Committee evaluated an estimate of the TMDI of the AMP deaminase enzyme preparation conducted with the budget method. The enzyme is intended for use in yeast processing for cereals and in the production of flavourings. The TMDI was based on the level of TOS in the deaminase enzyme preparation and its maximum proposed use levels (≤ 100 mg TOS/kg ingredient, equivalent to ≤ 2 mg TOS/kg in the final food) and an assumption that 25% of the food supply contains the enzyme preparation. The resulting TMDI was 0.075 mg TOS/kg bw per day from both solid food and non-milk beverages. The Committee noted that the enzyme will be inactivated during the processing of food ingredients and will have no function in the final food.
5. EvaluationNegative results were obtained with AMP deaminase derived from of S. murinus in genotoxicity tests, and an NOAEL of 500 mg/kg bw per day (equal to 69 mg TOS/kg bw per day) was identified in a 13-week study of oral toxicity. A comparison of the estimated dietary exposure of 0.075 mg TOS/kg bw per day with the NOAEL of 69 mg TOS/kg bw per day shows a margin of exposure of 920. The Committee concluded that AMP deaminase enzyme preparation from S. murinus is not a health concern when used in the applications specified, at the levels specified and in accordance with good manufacturing practice.
6. References1. Report of the Forty-ninth Session of the Codex Committee on Food Additives, Macao SAR, China,
20–24 March 2017. Rome: Food and Agriculture Organization of the United Nations; Geneva: World Health Organization; 2017 (http://www.fao.org/fao-who-codexalimentarius/sh-proxy/it/?lnk=1&url=https%253A%252F%252Fworkspace .fao.org%252Fsites%252Fcodex%252FMeetings%252FCX-711-49%252FReport%252FREP17_FAe.pdf, accessed 28 February 2020).
2. Report of the Fifty-first Session of the Codex Committee on Food Additives, Jinan, China, 25–29 March 2019 (REP19/FA). Rome: Food and Agriculture Organization of the United Nations; Geneva: World Health Organization; 2019 (http://www.fao.org/fao-who-codexalimentarius/sh-proxy/en/?lnk=1&url=https%253A%252F%252Fworkspace.fao.org%252Fsites%252Fcodex%252FMeetings%252FCX-711-51%252FReport%252FREP19_FAe.pdf).
3. Streptomyces murinus Frommer (ATCC® 19788™). Manassas (VA): American Type Culture Collection; 2016 (http://www.atcc.org/Search_Results.aspx?dsNav=Ntk:PrimarySearch%7cStreptomyces+-murinus%7c3%7c,Ny:True,Ro:0,N:1000552&searchTerms=Streptomyces+murinus&redir=1).
14
WH
O F
ood
Addi
tives
Ser
ies N
o. 8
0, 2
022
Safety evaluation of certain food additives Eighty-ninth JECFA
4. Streptomyces murinus. Braunschweig: Deutsche Sammlung von Mikroorganismen und Zellkulturen GmbH; 2020 (https://www.dsmz.de/search/bacteria?tx_kesearch_pi1%5Bsword%5D=Streptomy-ces%20murinus&cHash=ecd82f77125b438a4d893e223f1e1f63).
5. Stavnsbjerg, M. Evaluation of the pathogenic potential of Streptomyces murinus. Internal report, file number F-860144; Bagsvaerd: Novo Industri A/S; 1986.
6. Directive 2000/54/EC of the European Parliament and of the Council of 18 September 2000 on the protection of workers from risks related to exposure to biological agents at work (seventh individual directive within the meaning of Article 16(1) of Directive 89/391/EEC). Off J. 2000;L262:21–45.
7. List of bacteria and similar organisms presenting at the wild state a biological risk for immunocompetent humans and/or animals and corresponding maximum biological risk. Brussels: Belgian Biosafety Server, Division of Biosafety and Biotechnology, Scientific Institute of Public Health; 2018 (https://www.biosafety.be/sites/default/files/h_a_bacteries.pdf).
8. de Benito A, Ibáñez C, Moncho W, Martínez D, Vettorazzi A, de Lopez Cerain A. Database on the taxonomical characterisation and potential toxigenic capacities of microorganisms used for the industrial production of food enzymes and feed additives, which do not have a recommendation for Qualified Presumption of Safety. EFSA supporting publication 2017;14(7):EN‐1274 (https://doi.org/10.2903/sp.efsa.2016.en-1274).
9. Bourdichon F, Casaregola S, Farrokh C, Frisvad JC, Gerds ML, Hammes J, et al. Food fermentations: microorganisms with technological beneficial use. Int J Food Microbiol. 2012;154(3):87–97.
10. Pariza MW, Johnson EA. Evaluating the safety of microbial enzyme preparations used in food processing: update for a new century. Regul Toxicol Pharmacol. 2001;33(2):173–86.
11. AMP deaminase. In: Inventory of substances used as processing aids (IPA), updated list (information document). Joint FAO/WHO Food Standards Programme Codex Committee on Food Additives, Forty-fourth Session, 12–16 March 2012, Hangzhou, China. Rome: Food and Agriculture Organization of the United Nations; 2012 (Codex Alimentarius 42; FA/44/ INF/03) (http://www.fao.org/tempref/codex/Meetings/CCFA/ccfa44/fa44_inf3e.pdf).
12. List of permitted food enzymes. Ottawa: Health Canada; 2020 (Lists of permitted food additives, No. 5) (https://www.canada.ca/en/health-canada/services/food-nutrition/food-safety/food-additives/lists-permitted/5-enzymes.html).
13. General specifications and considerations for enzymes used in food processing. In: Combined compendium of food additive specifications, Joint FAO/WHO Expert Committee on Food Additives, 67th meeting, 20–29 June 2006, Rome. Rome: Food and Agriculture Organization of the United Nations; Geneva: World Health Organization; 2006:63–7 (FAO JECFA Monograph 3; http://www.fao.org/3/a-a0675e.pdf).
14. Evaluation of allergenicity of genetically modified foods. Report of a Joint FAO/WHO Expert Consultation on Allergenicity of Foods Derived from Biotechnology, 22–25 January 2001. Rome: Food and Agriculture Organization of the United Nations; Geneva: World Health Organization; 2001 (http://www.who.int/foodsafety/publications/gmo-allergenicity/en, accessed 28 February 2020).
15. Codex Alimentarius. Foods derived from modern biotechnology, 2nd edition. Geneva: World Health Organization; Rome: Food and Agriculture Organization of the United Nations; 2009 (http://www.fao.org/3/a-a1554e.pdf).
16. 2.4.1. Potential allergenicity of enzymes: change to the number of amino acids in segments used in allergen database searches. In: Evaluation of certain food additives and contaminants. Eightieth
15
Adenosine 5´-monophosphate deaminase from Streptomyces murinus
report of the Joint FAO/WHO Expert Committee on Food Additives, 1–25 June 2015. Rome: Food and Agriculture Organization of the United Nations; Geneva: World Health Organization; 2016:9 (WHO Technical Report Series, No. 995; https://www.who.int/docs/default-source/foodsafety/food-genetically-modified/9789240695405-eng.pdf?sfvrsn=6eeac771_2).
17. Guidelines for toxicity studies on drugs (Notification no. 24, 11 September 1989). Tokyo: Ministry of Health, Labour and Welfare, Pharmaceuticals and Cosmetics Division, Pharmaceuticals Affairs Bureau; 1989 (in Japanese).
18. Guidelines for designation of food additives and for revision of standards for use of food additives (Notification no. 29, 22 March 1996). Tokyo: Ministry of Health, Labour and Welfare, Standards and Evaluation Division, Department of Food Safety, Pharmaceutical and Food Safety Bureau; 1996 (http://www.mhlw.go.jp/topics/bukyoku/iyaku/syokuten/960322/; http://www.mhlw.go.jp/topics/bukyoku/iyaku/syokuten/960322/betu.html (in Japanese).
19. Partial revision of guidelines for repeated-dose toxicity studies (Notification no. 655, 5 April 1999). Tokyo: Ministry of Health, Labor and Welfare, Pharmaceutical and Medical Safety Bureau; 1999 (in Japanese).
20. Katsumata T. 2-week repeated dose of deaminase in rats (preliminary study). Study No. CB-438. Final report [English translation]. Unpublished study conducted by Bozo Research Center Inc., Shibuya-ku, Tokyo, Japan. Submitted to WHO by Amano Enzyme Inc., Kitanagoya-shi, Aichi, Japan; 2009.
21. Katsumata T. A 13-week oral study of deaminase (Streptomycs murinus) in rats. Study No. B6527. Final report [English translation]. Unpublished study conducted by Bozo Research Center Inc., Gotemba-shi, Shinozuoka, Japan. Submitted to WHO by Amano Enzyme Inc. Naka-ku, Nagoya, Japan; 2009.
22. Damsch S, Eichenbaum G, Tonelli A, Lammens L, Van den Bulck K, Feyen B, et al. Gavage-related reflux in rats: identification, pathogenesis, and toxicological implications (review). Toxicol Pathol. 2011;39:348–60.
23. Oguma Y. Bacterial reverse mutation test of deaminase (Streptomyces murinus) (study no. T-0266). Final report (English translation). Unpublished study conducted at Bozo Research Center Inc., Tokyo, Japan. Submitted to WHO by Amano Enzyme Inc., Naka-ku, Nagoya, Japan; 2008.
24. Sono A. Chromosome aberration test in cultured Chinese hamster cells treated with deaminase (Streptomyces murinus) in rats (study no. M-1332). Final report (English translation). Unpublished study conducted at Bozo Research Center Inc. Tokyo, Japan. Submitted to WHO by Amano Enzyme Inc., Naka-ku, Nagoya, Japan; 2009.
25. Hansen SC. Acceptable daily intake of food additives and ceiling on levels of use. Food Cosmet Toxicol. 1966;4:427–32.
26. Hansen SC. Conditions for use of food additives based on a budget method for an acceptable daily intake. J Food Protect. 1979;42:429–34.
27. Principles and methods for the risk assessment of chemicals in food. Chapter 6. Dietary exposure assessment of chemicals in food (Environmental Health Criteria 240). Rome: Food and Agriculture Organization of the United Nations; Geneva: World Health Organization; 2009 (http://www.inchem.org/documents/ehc/ehc/ehc240_chapter6.pdf).

16
17
D-Allulose 3-epimerase from Arthrobacter globiformis M30 expressed in Escherichia coli K-12 W3110
First draft prepared byJ. Rotstein1, T. Hambridge2, U. Mueller3, S. G. Walch4, K. Laurvick5
1 Food Directorate, Health Canada, Ottawa, Ontario, Canada2 Food Standards Australia New Zealand, Canberra, Australia3 Yarralumla, Australian Capital Territory, Australia4 Chemisches und Veterinäruntersuchungsamt Karlsruhe, Karlsruhe, Germany5 Food Standards, US Pharmacopeia, Rockville, MD, USA
1. Explanation 171.1. Genetic background 18
1.1.1 Production strain 181.1.2 Donor strain 19
1.2 Chemical and technical considerations 192. Biological data 20
2.1 Biotransformation 202.2 Assessment of potential allergenicity 212.3 Toxicological studies 21
2.3.1 Acute toxicity 212.3.2 Short-term toxicity 212.3.3 Long-term toxicity 222.3.4 Genotoxicity 222.3.5 Reproductive and developmental toxicity 22
2.4 Observations in humans 223. Dietary exposure 23
3.1 Introduction 233.2 Dietary exposure assessment 24
3.2.1 Estimated dietary exposure provided by the sponsor 243.2.2 Dietary exposure estimated by the Committee 243.2.3 Assumptions made in the dietary exposure assessments 25
4. Comments 255. Evaluation 276. References 27
1. ExplanationAt the request of the CCFA at its Forty-eighth Session (1), the Committee evaluated the safety of D-allulose 3-epimerase (Enzyme Commission No. 5.1.3.30;
18
WH
O F
ood
Addi
tives
Ser
ies N
o. 8
0, 2
022
Safety evaluation of certain food additives Eighty-ninth JECFA
Chemical Abstract Services No. 1618683-38-7) from Arthrobacter globiformis M30 expressed in Escherichia coli K-12 W3110. The enzyme epimerizes D-fructose at the C3 position to form D-allulose, a low-calorie sweetener. The intended use of the enzyme preparation is as a processing aid in the production of D-allulose. The Committee has not previously evaluated this enzyme preparation.
In this monograph, the expression “D-allulose 3-epimerase” refers to the enzyme itself and its amino acid sequence, the expression “D-allulose 3-epimerase concentrate” refers to the test material used in the toxicity studies evaluated, and the expression “D-allulose 3-epimerase preparation” refers to the preparation formulated for commercial use.
At the present meeting, the Committee considered the submitted data and conducted a literature search in Google Scholar with the linked search terms “D-allulose 3-epimerase” and “Arthrobacter globiformis”, which generated 49 references. No relevant published studies on toxicological aspects were found.
The Committee noted that it evaluated the safety of D-allulose 3-epimerase and not of the food additive D-allulose (also referred to as D-psicose). The Committee has not previously evaluated D-allulose.
1.1 Genetic background1.1.1 Production strainThe genus Escherichia was first described by Castellani and Chalmers in 1919 (2). E. coli is commonly found in the lower intestine of warm-blooded organisms (endotherms). Certain strains can cause a wide spectrum of intestinal and extra-intestinal diseases, such as urinary tract infection, septicaemia, meningitis and pneumonia, in humans and animals. Non-pathogenic strains of E. coli are not included on the list of pathogens in Annex III of Directive 2000/54/EC on the protection of workers from risks related to exposure to biological agent at work (3) or on the list of pathogens in Belgium (4). Descendant non-pathogenic E. coli K-12 strains, including wild-type E. coli W3110, have been used routinely in molecular biology as both a tool and a model organism (5, 6) and have a history of safe use in the food and pharmaceutical industries (7). Wild-type E. coli K-12 W3110 has been well characterized, with an accurate genomic sequence (8).
The E. coli K-12 W3110 production strain pWKLP was prepared by transforming the E. coli recipient strain with an expression plasmid carrying the structural D-allulose 3-epimerase gene from A. globiformis M30 donor, a D-allulose 3-epimerase gene transcription promoter, a repressor and its regulatory region important for the function of the promoter, a terminator and an antibiotic selection marker. Transformation was performed by the calcium chloride method, followed by selection of the final production strain. The final production strain was tested for the absence of antibiotics. The transformation
19
D-Allulose 3-epimerase from Arthrobacter globiformis M30 expressed in Escherichia coli K-12 W3110
of E. coli K-12 W3110, the stability of the expression plasmid and the absence of any transformable rDNA were confirmed by DNA sequencing. Checks of the reading frames for toxic proteins (Mvir Database Virulence Blast Interface) and allergens (GENTYX gene information software) were negative. The degradability of β-lactamase, an enzyme that provides resistance to β-lactam antibiotics, was examined by simulation with the ExPAsy PeptideCutter for pepsin, trypsin and chymotrypsin. The acquired data suggest that β-lactamase is broken down as far as oligopeptide structures. The presence of an antimicrobial resistance gene in the finished product was tested by polymerase chain reaction targeting β-lactamase gene fragments specific to the production strain. As no such products were detected, it can be reasonably assumed that no recombinant DNA is present in the final product. The transformation of the intended genes was tested by DNA sequencing of the expression plasmid. The stability of the expression plasmid and the absence of any transformable rDNA were also confirmed.
1.1.2 Donor strainThe wild-type A. globiformis strain was isolated from soil and by strain improvement with classical colony isolation and selection techniques. The gene encoding the D-allulose epimerase was isolated from A. globiformis strain M30, which was deposited in the National Institute of Technology and Evaluation in Japan under accession number P-1111 (9).
1.2 Chemical and technical considerations D-Allulose epimerase is manufactured by controlled aerobic batch fermentation of a pure culture of a genetically modified strain of E. coli containing the D-allulose 3-epimerase gene from A. globiformis. After the main fermentation has been stopped by bacteriolysis (heat and lysozyme for 18 h), the enzyme is extracted from the cell material. After a series of filtration steps, the liquid enzyme is concentrated and purified and formulated into the commercial D-allulose 3-epimerase preparation by the addition of water and D-sorbitol. The powdered product is freeze-dried. The entire production of the D-allulose 3-epimerase preparation is carried out in accordance with good manufacturing practice and the principles of hazard analysis and critical control points, with raw materials that are appropriate for food use. Any major food allergens used in the fermentation medium are expected to be removed during processing and from the final enzyme preparation. The D-allulose 3-epimerase preparation is free of antibiotic activity. It conforms to the General Specifications for Enzyme Preparations used in Food Processing (10), and the enzyme preparation is free of the production organism.
20
WH
O F
ood
Addi
tives
Ser
ies N
o. 8
0, 2
022
Safety evaluation of certain food additives Eighty-ninth JECFA
D-Allulose 3-epimerase belongs to the subcategory of epimerases that hydrolyse carbohydrates and derivates. The enzyme is highly specific for D-allulose and epimerizes D-fructose at the C3 position (BRENDA Comprehensive Enzyme Information System). It has very low activity for epimerization of other D and L forms of keto-hexoses, keto-pentoses and keto-tetroses. The D-allulose 3-epimerase preparation is intended for use as a processing aid at levels of up to 35 g of total organic solids per kilogram of raw material (g TOS/kg) to convert D-fructose to D-allulose.
D-Allulose 3-epimerase activity is determined by measuring the production of fructose that results from epimerization of allulose as a substrate. After a 10-min reaction, D-allulose 3-epimerase activity is measured as the amount of fructose produced. One unit of D-allulose 3-epimerase activity is defined as the quantity of enzyme required to produce 1 μmol D-fructose per minute under the specified conditions. The percentage totoal organic solids (TOS) in a batch of the D-allulose 3-epimerase concentrate provided is 91.5%. TOS include the enzyme of interest and residues of organic materials, such as proteins, peptides and carbohydrates derived from the production organism during manufacture. The mean activity of three batches of commercial D-allulose 3-epimerase liquid preparation was 405 U/g, and the mean TOS was 4.7%. D-Allulose 3-epimerase is expected to be inactivated during processing.
2. Biological data
2.1 Biotransformation D-Allulose 3-epimerase concentrate was tested in simulated gastric and intestinal fluids in vitro (11, 12). The enzyme concentrate (TOS, 91.5%) was dissolved in water (0.01 g/2 mL). The simulated gastric fluid (pH 1.1) consisted of pepsin (0.32 g), sodium chloride (0.2 g), hydrochloric acid (0.7 mL) and water (≤ 80 mL), and the simulated intestinal fluid (pH 6.9) consisted of pancreatin (1 g), potassium dihydrogen phosphate (0.64 g), sodium hydroxide (0.2 M, 11.8 mL) and water (≤ 80 mL). The digestion assays were initiated by mixing the enzyme solution (0.005 mL) with the simulated gastric or intestinal fluid (0.2 mL) and incubated at 37 oC. At timed intervals (0, 0.25, 0.5, 1, 2, 5, 10 and 30 min for simulated gastric fluid digestion and 0, 1, 10, 30, 60 120 and 180 min for simulated intestinal fluid digestion), enzymatic proteolysis was stopped by raising the pH to 10 with a sodium hydroxide mixture (1.875 g glycine, 1.460 g sodium chloride, ≤ 50 mL water, adjusted to a pH of 10 with sodium hydroxide). The resulting protein hydrolysates were analysed by stain-free SDS-PAGE with a fluorescent detection system.
21
D-Allulose 3-epimerase from Arthrobacter globiformis M30 expressed in Escherichia coli K-12 W3110
In simulated gastric fluid, the protein band of D-allulose 3-epimerase (about 31 kDa) was hydrolysed entirely within 1 min, and smaller protein bands (< 10 kDa) appeared on the gel. The positive control enzyme, ribulose-bisphosphate carboxylase (EC 4.1.1.39) from spinach, showed a slightly slower rate of hydrolysis, requiring about 2 min to achieve a similar pattern on SDS-PAGE. In simulated intestinal fluid, the native enzyme was partially hydrolysed to shorter peptides within 30 min and absent from SDS-PAGE within 60 min; no bands other than the pancreatin proteins appeared on the gel.
In silico analysis was used to examine the susceptibility of the amino acid sequence of the D-allulose 3-epimerase enzyme to digestion by pepsin, trypsin and chymotrypsin. The analysis was conducted by computer simulation (peptide cutter), a modelling tool of the Expert Protein Analysis System (Swiss Institute of Bioinformatics). The results with pepsin showed 68–83 digestion sites, which would generate peptides ≤ 2 kDa; trypsin and chymotrypsin were predicted to generate peptides ≤ 0.6 kDa. Further digestion by specific peptidases of these peptides would be expected.
D-Allulose 3-epimerase would be digested like other dietary proteins if ingested.
2.2 Assessment of potential allergenicityD-Allulose 3-epimerase was assessed as a potential allergen by bioinformatics, consistent with the criteria recommended by FAO/WHO (13, 14). The amino acid sequence of the enzyme was compared with the sequence of known allergens in the Allergen Database for Food Safety (http://allergen.nihs.go.jp/ADFS/index.jsp). A search for matches with > 35% identity over a sliding window of 80 amino acids and a search for sequence identity of eight contiguous amino acids produced no matches. This indicates that the amino acid sequence of the enzyme is unlikely to share any epitopes with known food allergens (15).
2.3 Toxicological studiesThe studies described below were conducted with a dried powder form of D-allulose 3-epimerase concentrate (batch no. 3T-2; TOS, 91.5%).
2.3.1 Acute toxicityNo information was available.
2.3.2 Short-term toxicityA 13-week oral toxicity study was conducted in Wistar RccHan™ rats (6 weeks old at the start of treatment) according to OECD guideline 408 and compliant with
22
WH
O F
ood
Addi
tives
Ser
ies N
o. 8
0, 2
022
Safety evaluation of certain food additives Eighty-ninth JECFA
GLP (16). The test material, a powdered D-allulose 3-epimerase concentrate, was mixed into animal feed at a concentration of 0, 0.5, 1.0 or 2.0%, corresponding to overall mean intakes of 0, 300, 600 and 1100 and 1300 mg TOS/kg bw per day for males and females. Groups of 10 animals of each sex per dose consumed their diets for 13 weeks. Feed and water were permitted ad libitum, except for overnight fasting for scheduled blood sampling and urine collection. All animals were necropsied at the end of the study.
No deaths were observed in any group. No treatment-related changes were found in any of the parameters measured, including general health, clinical signs of toxicity, neurobehaviour, ophthalmoscopy, body weights, feed intake, feed conversion efficiency, water consumption, haematology, blood chemistry, urinalysis, absolute organ weights or organ weights relative to body weights or macroscopic or microscopic examination. Differences between treated and control groups were rare, minimal and not dose-related and were therefore considered not toxicologically significant. In the absence of adverse effects, the Committee identified an NOAEL of 1100 mg/kg bw per day, the highest dose tested.
2.3.3 Long-term studies of toxicityNo information was available.
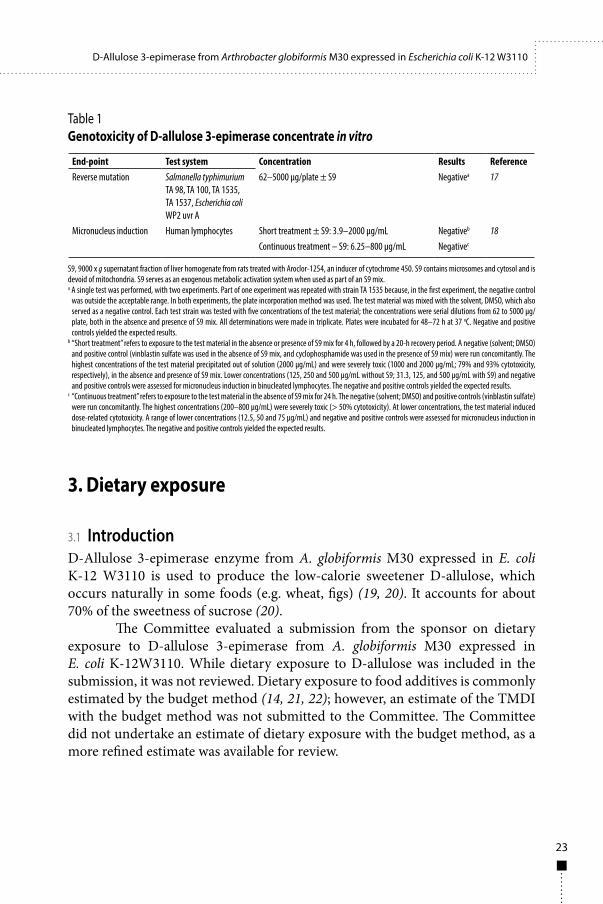
2.3.4 GenotoxicityA dried powder form of D-allulose 3-epimerase concentrate dissolved in DMSO was tested for genotoxicity in the bacterial reverse mutation test (17) and in an in vitro micronucleus test in cultured human lymphocytes (18). Both studies complied with GLP and were conducted in accordance with OECD test guidelines (471 and 487, respectively). The results of these studies were negative, indicating that the enzyme concentrate is unlikely to be genotoxic (Table 1).
2.3.5 Reproductive and developmental toxicityNo information was available.
2.4 Observations in humansNo information was available.
23
D-Allulose 3-epimerase from Arthrobacter globiformis M30 expressed in Escherichia coli K-12 W3110
3. Dietary exposure
3.1 IntroductionD-Allulose 3-epimerase enzyme from A. globiformis M30 expressed in E. coli K-12 W3110 is used to produce the low-calorie sweetener D-allulose, which occurs naturally in some foods (e.g. wheat, figs) (19, 20). It accounts for about 70% of the sweetness of sucrose (20).
The Committee evaluated a submission from the sponsor on dietary exposure to D-allulose 3-epimerase from A. globiformis M30 expressed in E. coli K-12W3110. While dietary exposure to D-allulose was included in the submission, it was not reviewed. Dietary exposure to food additives is commonly estimated by the budget method (14, 21, 22); however, an estimate of the TMDI with the budget method was not submitted to the Committee. The Committee did not undertake an estimate of dietary exposure with the budget method, as a more refined estimate was available for review.
Table 1Genotoxicity of D-allulose 3-epimerase concentrate in vitro
End-point Test system Concentration Results ReferenceReverse mutation Salmonella typhimurium
TA 98, TA 100, TA 1535, TA 1537, Escherichia coli WP2 uvr A
62–5000 µg/plate ± S9 Negativea 17
Micronucleus induction Human lymphocytes Short treatment ± S9: 3.9–2000 µg/mL Negativeb 18Continuous treatment – S9: 6.25–800 µg/mL Negativec
S9, 9000 x g supernatant fraction of liver homogenate from rats treated with Aroclor-1254, an inducer of cytochrome 450. S9 contains microsomes and cytosol and is devoid of mitochondria. S9 serves as an exogenous metabolic activation system when used as part of an S9 mix.a A single test was performed, with two experiments. Part of one experiment was repeated with strain TA 1535 because, in the first experiment, the negative control
was outside the acceptable range. In both experiments, the plate incorporation method was used. The test material was mixed with the solvent, DMSO, which also served as a negative control. Each test strain was tested with five concentrations of the test material; the concentrations were serial dilutions from 62 to 5000 µg/plate, both in the absence and presence of S9 mix. All determinations were made in triplicate. Plates were incubated for 48–72 h at 37 oC. Negative and positive controls yielded the expected results.
b “Short treatment” refers to exposure to the test material in the absence or presence of S9 mix for 4 h, followed by a 20-h recovery period. A negative (solvent; DMSO) and positive control (vinblastin sulfate was used in the absence of S9 mix, and cyclophosphamide was used in the presence of S9 mix) were run concomitantly. The highest concentrations of the test material precipitated out of solution (2000 µg/mL) and were severely toxic (1000 and 2000 µg/mL; 79% and 93% cytotoxicity, respectively), in the absence and presence of S9 mix. Lower concentrations (125, 250 and 500 µg/mL without S9; 31.3, 125, and 500 µg/mL with S9) and negative and positive controls were assessed for micronucleus induction in binucleated lymphocytes. The negative and positive controls yielded the expected results.
c “Continuous treatment” refers to exposure to the test material in the absence of S9 mix for 24 h. The negative (solvent; DMSO) and positive controls (vinblastin sulfate) were run concomitantly. The highest concentrations (200–800 µg/mL) were severely toxic (> 50% cytotoxicity). At lower concentrations, the test material induced dose-related cytotoxicity. A range of lower concentrations (12.5, 50 and 75 µg/mL) and negative and positive controls were assessed for micronucleus induction in binucleated lymphocytes. The negative and positive controls yielded the expected results.
24
WH
O F
ood
Addi
tives
Ser
ies N
o. 8
0, 2
022
Safety evaluation of certain food additives Eighty-ninth JECFA
3.2 Dietary exposure assessment3.2.1 Estimated dietary exposure provided by the sponsorThe dietary exposure to TOS in the enzyme preparation estimated by the sponsor was reviewed by the Committee. First, dietary exposures to D-allulose were estimated for each food category on the basis of the levels of use of D-allulose in 14 food categories. D-Allulose may be used in a wide range of food products as a full or partial substitute for sugar. The food uses may include beverages, cereals, confectionary (including chewing-gum), frostings, frozen dairy desserts, yoghurts, gelatins and puddings, jams and jellies, sauces and dressings, sugar and sugar substitutes. Dietary exposures to D-allulose were derived from 2-day average food consumption data for each respondent in the US National Health and Nutrition Examination Survey 2007–2010. The sponsor used the dietary exposures to D-allulose in calculating the 90th percentile only for consumers of each food category. Then, the sponsor calculated the amount of the enzyme preparation required to make that amount of D-allulose according to the sponsor’s production method for each food category. The amount of TOS in each food category was then estimated from the sponsor’s information on the components of the enzyme preparation. Exposure to the TOS in each food category was then summed to obtain total dietary exposure to the TOS in the range of proposed food uses. The Committee noted that summation of 90th percentile exposures for consumers only of many food categories leads to overestimation, which will therefore result in overestimation of dietary exposure to the TOS in the enzyme preparation.
The estimated dietary exposures provided by the sponsor as mg TOS/kg bw per day for infants and children < 2 years of age ranged from 0.9 to 1.7 (specifically, 1.2 for infants and young children < 2 years of age, 1.7 for children 2–12 years and 0.9 for children 13–18 years), and those for adults aged ≥ 19 years ranged from 1.1 to 1.5 (the lower end of the range being for females and the upper end for males).
3.2.2 Dietary exposure estimated by the CommitteeThe Committee also estimated dietary exposure to the TOS in the 3-epimerase enzyme preparation. Total dietary exposure to D-allulose from its use in all proposed food categories was estimated at the mean and 90th percentile for consumers only on a body weight basis. Dietary exposure was derived by distributing individual exposure of consumers only based on the specific food consumption of each respondent averaged over 2 days, which was provided in the submission and was available for each population group assessed. The amount of the enzyme preparation used to make each total amount of D-allulose and the amount of TOS in the amount of enzyme preparation were determined.
25
D-Allulose 3-epimerase from Arthrobacter globiformis M30 expressed in Escherichia coli K-12 W3110
The Committee used the same conversion factors as the sponsor, which were based on their formulation and production methods. Use of summary D-allulose exposures derived from a distribution of individual exposures as the starting point results in more realistic estimates of daily total exposure and better reflects long-term exposure to the enzyme preparation.
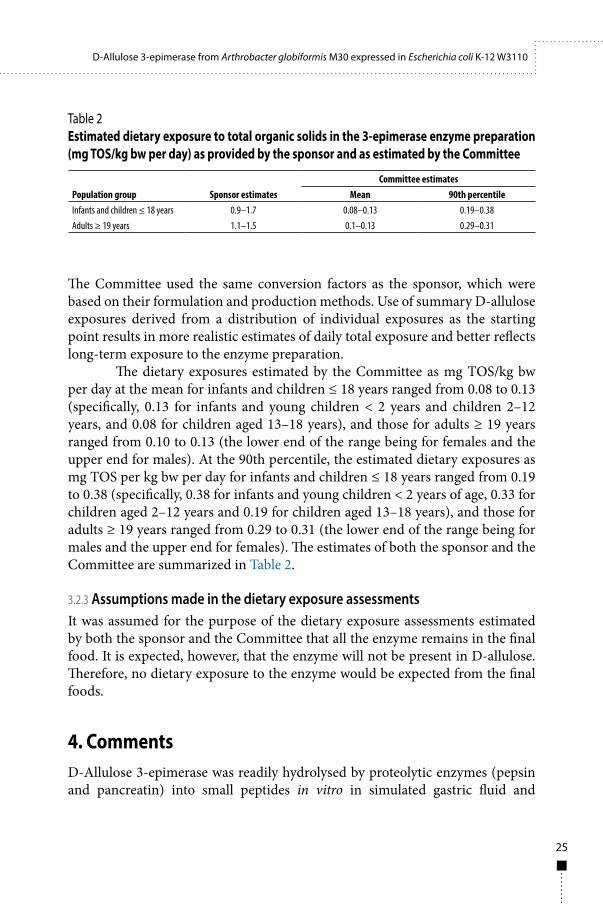
The dietary exposures estimated by the Committee as mg TOS/kg bw per day at the mean for infants and children ≤ 18 years ranged from 0.08 to 0.13 (specifically, 0.13 for infants and young children < 2 years and children 2–12 years, and 0.08 for children aged 13–18 years), and those for adults ≥ 19 years ranged from 0.10 to 0.13 (the lower end of the range being for females and the upper end for males). At the 90th percentile, the estimated dietary exposures as mg TOS per kg bw per day for infants and children ≤ 18 years ranged from 0.19 to 0.38 (specifically, 0.38 for infants and young children < 2 years of age, 0.33 for children aged 2–12 years and 0.19 for children aged 13–18 years), and those for adults ≥ 19 years ranged from 0.29 to 0.31 (the lower end of the range being for males and the upper end for females). The estimates of both the sponsor and the Committee are summarized in Table 2.
3.2.3 Assumptions made in the dietary exposure assessmentsIt was assumed for the purpose of the dietary exposure assessments estimated by both the sponsor and the Committee that all the enzyme remains in the final food. It is expected, however, that the enzyme will not be present in D-allulose. Therefore, no dietary exposure to the enzyme would be expected from the final foods.
4. CommentsD-Allulose 3-epimerase was readily hydrolysed by proteolytic enzymes (pepsin and pancreatin) into small peptides in vitro in simulated gastric fluid and
Table 2Estimated dietary exposure to total organic solids in the 3-epimerase enzyme preparation (mg TOS/kg bw per day) as provided by the sponsor and as estimated by the Committee
Population group Sponsor estimatesCommittee estimates
Mean 90th percentileInfants and children ≤ 18 years 0.9–1.7 0.08–0.13 0.19–0.38Adults ≥ 19 years 1.1–1.5 0.1–0.13 0.29–0.31
26
WH
O F
ood
Addi
tives
Ser
ies N
o. 8
0, 2
022
Safety evaluation of certain food additives Eighty-ninth JECFA
simulated intestinal fluid. It is expected that D-allulose 3-epimerase would be digested like other dietary proteins if ingested.
D-Allulose 3-epimerase was assessed for potential immunological cross-reactivity with known allergens by bioinformatics, consistent with the criteria recommend by FAO/WHO. A search for matches with > 35% identity over a sliding window of 80 amino acids and a search for sequence identity of eight contiguous amino acids produced no matches. Additionally, the enzyme is anticipated to be degraded or removed during purification of D-allulose. If ingested, the enzyme is expected to be degraded by digestive enzymes. On the basis of the intended use and available information, the Committee concluded that dietary exposure to D-allulose 3-epimerase would not pose an allergenic risk.
In a 13-week oral toxicity study in rats, no treatment-related adverse effects were observed when a dried powdered D-allulose 3-epimerase concentrate was mixed into animal feed at a concentration of up to 2.0%, the highest concentration tested. This concentration corresponded to a dose of 1100 and 1300 mg TOS/kg bw per day for males and females, respectively. An NOAEL was identified at 1100 mg TOS/kg bw per day. In a bacterial reverse mutation test and an in vitro micronucleus test with cultured human lymphocytes, a powder form of D-allulose 3-epimerase concentrate gave negative results. The Committee concluded that the D-allulose 3-epimerase enzyme preparation is unlikely to be genotoxic.
D-Allulose 3-epimerase from A. globiformis M30 expressed in E. coli K-12 W3110 is to be used to produce the low-calorie sweetener D-allulose. Although the sponsor provided estimates, the Committee undertook its own dietary exposure assessment. Dietary exposure to TOS in the enzyme preparation was calculated from exposure to D-allulose in food to determine the amount of enzyme preparation used to produce that amount of D-allulose and then applying the proportion of TOS in the preparation. The dietary exposures estimated by the sponsor were considered by the Committee to be overestimates because of the method used to estimate the starting D-allulose dietary exposure. The Committee chose to use its own estimates of dietary exposure for the evaluation. The dietary exposures estimated by the Committee as mg TOS/kg bw per day at the mean were ≤ 0.13 for infants, children and adults, and those at the 90th percentile were ≤ 0.38 for infants and children and ≤ 0.31 for adults.
The Committee noted that the enzyme is expected to be removed during production of D-allulose and that therefore no enzyme preparation would be introduced into final foods.
27
D-Allulose 3-epimerase from Arthrobacter globiformis M30 expressed in Escherichia coli K-12 W3110
5. EvaluationNegative results were observed in genotoxicity tests, and no treatment-related adverse effects were seen at the highest dose tested (1100 mg TOS /kg bw per day) in a 13-week oral toxicity study. Comparison of the dietary exposure estimate for the highest consumers (90th percentile for infants and children) of 0.38 mg TOS/kg bw per day with the highest dose tested in the short-term (90-day) oral toxicity study of 1100 mg TOS/kg bw per day provides a margin of exposure of nearly 3000. The Committee established an acceptable daily intake (ADI) “not specified”1 for D-allulose 3-epimerase from A. globiformis M30 expressed in E. coli K-12 W3110 when the enzyme is used in the applications specified, at the levels specified and in accordance with good manufacturing practice.
6. References1. Report of the Forty-eighth Session of the Codex Committee on Food Additives, Xi’an, China, 13–18 March
2016. Rome: Food and Agriculture Organization of the United Nations; Geneva: World Health Organization, Joint FAO/WHO Standards Programme, Codex Alimentarius Commission; 2016 (http://www.fao.org/fao-who-codexalimentarius/sh-proxy/en/?lnk=1&url=https%253A%252F%252Fworkspace.fao.org%252Fsites%252Fcodex%252FMeetings%252FCX-711-48%252FReport%252FREP16_FAe.pdf)
2. Castellani A, Chalmers AJ. Manual of tropical medicine, 3rd edition. New York City (NY): Williams Wood & Co.; 1919 (https://lpsn.dsmz.de/species/escherichia-coli).
3. Directive 2000/54/EC of the European Parliament and of the Council of 18 September 2000 on the protection of workers from risks related to exposure to biological agents at work (seventh individual directive within the meaning of Article 16(1) of Directive 89/391/EEC). Off J. 2000;L262:21–45.
4. List of bacteria and similar organisms presenting at the wild state a biological risk for immunocompetent humans and/or animals and corresponding maximum biological risk. Brussels: Belgian Biosafety Server, Division of Biosafety and Biotechnology, Scientific Institute of Public Health; 2018 (https://www.biosafety.be/sites/default/files/h_a_bacteries.pdf).
5. Bachmann B. Pedigrees of some mutant strains of Escherichia coli K-12. Bacteriol Rev. 1972;36(4):525–57.
6. Jensen KF. The Escherichia coli K-12 "wild types" W3110 and MG1655 have an rph frameshift mutation that leads to pyrimidine starvation due to low pyrE expression levels. J Bacteriol. 1993;175:3401–7.
7. Olempska-Beer ZS, Merker RI, Ditto MD, DiNovi MJ. Food-processing enzymes from recombinant microorganisms – a review. Regul Toxicol Pharmacol. 2006;45:144–58.
8. Hayashi K, Morooka N, Yamamoto Y, Fujita K, Isono K, Choi S, et al. Highly accurate genome sesquences of Escherichia coli K-12 strains MG1655 and W3110. Mol Syst Biol. 2006;2006:2007.
1 In the context of enzymes as food additives, the term ADI "not specified" means that, on the basis of the available data (chemical, biochemical, toxicological and other), the total daily intake of the substance arising from its use at the levels necessary to achieve the desired technical effect and in accordance with good manufacturing practice does not, in the opinion of the Committee, represent a hazard to health.
28
WH
O F
ood
Addi
tives
Ser
ies N
o. 8
0, 2
022
Safety evaluation of certain food additives Eighty-ninth JECFA
9. Yoshihara A, Kozakai T Shintani T, Matsutani R, Ohtani K Iida T, et al. Purification and characterization of d-allulose 3-epimerase derived from Arthrobacter globiformis M30, a GRAS microorganism. J Biosci Bioeng. 2017;123(2):170–6.
10. General specifications and considerations for enzyme preparations used in food processing. Rome: Food and Agriculture Organization of the United Nations; 2006 (http://www.fao.org/3/a-a0675e.pdf, accessed 24 June, 2019).
11. Analysis of the digestibility of d-allulose 3-epimerase. Unpublished study conducted by Nagase ChemteX Corporation, Biochemicals Department, 2016. Submitted to WHO by Nagase ChemteX Corporation Matsutani Chemical Industry Co., Ltd, Japan.
12. Simulation of D-alluose 3-epimerase digestibility. Unpublished study conducted by Nagase ChemteX Corporation, Biochemicals Department, 2016. Submitted to WHO by Matsutani Chemical Industry Co., Ltd, Japan.
13. Evaluation of allergenicity of genetically modified foods. Report of a Joint FAO/WHO Expert Consultation on Allergenicity of Foods Derived from Biotechnology, 22–25 January 2001. Rome: Food and Agriculture Organization of the United Nations; Geneva: World Health Organization; 2001 (http://www.who.int/foodsafety/publications/biotech/en/ec_jan2001.pdf).
14. Foods derived from modern biotechnology. Annex 1. Assessment of possible allergenicity. Rome: Food and Agriculture Organization of the United Nations; Geneva: World Health Organization, Joint FAO/WHO Food Standards Programme, Codex Alimentarius Commission; 2019 (http://www.fao.org/docrep/011/a1554e/a1554e00.htm).
15. D-Allulose 3-epimerase allergen assessment. Unpublished study conducted by Matsutani Chemical Industry Co., Ltd, Research & Development Center, 2017. Submitted to WHO by Nagase ChemteX Corporation Matsutani Chemical Industry Co., Ltd, Japan.
16. van Acker FAA, Lina BAR. Sub-chronic (13-week) oral toxicity study with Matsurase FE in rats, 2015. Unpublished report submitted to WHO by Matsutani Chemical Industry Co.
17. van den Wijngaard MJM. Bacterial reverse mutation test with Matsurase FE (Study code v20657), 2015. Unpublished report submitted to WHO by Matsutani Chemical Industry Co.
18. Usta B. In vitro micronucleus test with Matsurase FE in cultured human lymphocytes (Study code v20717/01), 2015. Unpublished report submitted to WHO by Matsutani Chemical Industry Co.
19. Mooradian AD, Smith M, Tokuda M. The role of artificial and natural sweeteners in reducing the consumption of table sugar: a narrative review. Clin Nutr ESPEN. 2017;18:1–8.
20. Degenhardt AG, Haesser T, Koch TJ. From bulk good to speciality sugar: the biotechnological development of sucrose to allulose. Sugar Industry/Zuckerindustrie. 2019;144(6):323.
21. Hansen SC. Acceptable daily intake of food additives and ceiling on levels of use. Food Cosmet Toxicol. 1966;4:427–32.
22. Hansen SC. Conditions for use of food additives based on a budget method for an acceptable daily intake. J Food Prot. 1979;42:429–34.
29
Jagua (genipin–glycine) blue (addendum)First draft prepared byYu Janet Zang1, Diane Benford2, Polly E. Boon3, Eugenia Dessipri4, Maria José Frutos-Fernandez5, Jannavi Srinivasan1 and Hae Jung Yoon6
1 Office of Food Additive Safety, Center for Food Safety and Applied Nutrition, Food and Drug Administration, College Park (MD), United States of America
2 Leighton Buzzard, England, United Kingdom3 National Institute for Public Health and the Environment, Bilthoven, Netherlands4 General Chemical State Laboratory, Athens, Greece5 Miguel Hernández University, Elche, Spain6 Food Standard Division, Ministry of Food and Drug Safety, Seoul, Republic of Korea
1. Explanation 291.1 Chemical and technical considerations 30
2. Biological data 312.1 Biochemical aspects 31
2.1.1 Absorption, distribution, excretion: 312.1.2 Biotransformation 31
2.2 Toxicological studies 312.2.1 Acute toxicity 312.2.2 Short-term studies 322.2.3 Long-term studies 322.2.4 Genotoxicity studies 342.2.5 Reproductive and developmental toxicity 342.2.6 Special studies 35
2.3 Observations in humans 363. Dietary exposure 36
3.1 Assessments based on the FAO/WHO CIFOCOss and EFSA Comprehensivedatabases 36
3.2 Assessments based on national dietary records 384. Comments 39
4.1 Biochemical aspects 394.2 Toxicological studies 40
5. Evaluation 426. References 43
1. Explanation Jagua (genipin–glycine) blue, hereafter referred to as Jagua blue, is a water-soluble blue colorant. It is obtained by reacting genipin, present in the extract of unripe Genipa americana L. (Rubiaceae) fruit, with stoichiometric equivalents of glycine. The main colouring component in Jagua blue is the genipin–glycine polymer (CAS
30
WH
O F
ood
Addi
tives
Ser
ies N
o. 8
0, 2
022
Safety evaluation of certain food additives Eighty-ninth JECFA
No. 1314879-21-4). Additionally, low-molecular-weight components, specifically three genipin–glycine dimers, which are also blue, are present at low levels.
Jagua blue was previously evaluated by JECFA at its 84th meeting, in 2017 (Annex 1, reference 234). The NOAELs in two 90-day toxicological studies in rats and dogs were 330 and 338 mg/kg bw per day on a blue polymer basis, respectively, which were both the highest doses tested. On the basis of these NOAELs and a conservative exposure estimate of 11 mg/kg bw per day, the margin of exposure for Jagua blue was approximately 30. In view of the limited biochemical and toxicological database and the low margin of exposure, the Committee at its 84th meeting was unable to complete the evaluation of Jagua blue and did not establish an ADI. The Committee was concerned about the potential toxicity of the low-molecular-weight fraction of the total colouring matter in Jagua blue and recommended that additional biochemical and toxicological information (e.g. studies on absorption, distribution, metabolism and excretion and on long-term toxicity, carcinogenicity and reproductive and developmental toxicity) be made available, including at higher doses of the blue polymer, with the dimers, so that an evaluation of the safety of Jagua blue could be completed. Additional information was also requested on: characterization of the low-molecular-weight components of the blue polymer, a validated method for determination of dimers and the concentrations of dimers in five batches of the commercial product.
In response to these requests, the sponsor provided a dossier to the current Committee containing a new 12-month toxicological study with in-utero exposure of rats, an updated dietary exposure assessment and additional chemical and technical data. A literature search in PubMed and Embase for literature published between January 2017 and May 2020 with the search terms “Jagua blue”, “genipin-glycine”, “Genipa americana” and “Gardenia blue” (a genipin–amino acid/peptide polymer with a structure similar to that of Jagua blue) resulted in five additional publications. None of the publications provided relevant information for the current evaluation.
1.1 Chemical and technical considerationsGenipa americana L. is a small to medium-sized tree (1) belonging to the Rubiaceae family and native to central and tropical South America (2). The fruit of the plant is edible and is a popular source of beverages (3). It is referred to as jagua fruit, chipara, guayatil, maluco, caruto or huito in Spanish (4) and as genipap in English.
Jagua fruit contains high levels of a cyclopentan-[C]-pyranskeleton class of compounds called iridoids (5,6). Three iridoids have been reported in this fruit (genipin, geniposidic acid and geniposide). Of these, genipin is present at the highest concentrations in unripe fruit (7) and is responsible for the bluish-purple
31
Jagua (genipin–glycine) blue (addendum)
colour formed upon exposure of the white pulp to air. Formation of the colour has been attributed to the ability of genipin to cross-link with primary amines present in amino acids and proteins, in the presence of oxygen, to produce water-soluble blue pigments (8–14).
Jagua blue is obtained by reacting genipin in the filtered aqueous extract of the unripe fruit with stoichiometric amounts of glycine and heating at 70 °C for 2 h. When the reaction is complete, the product is centrifuged and concentrated and/or dried. The blue colour is due to both the polymer (average molecular weight, 6000 Da), which is composed of repeating dimers ((C27H25O8N2)n), and minor quantities of three dimers. The polymer and the dimers have been quantified and characterized by high-performance liquid chromatography, nuclear magnetic resonance spectroscopy (1H, 13C), infrared spectroscopy and mass spectroscopy. The molecular formulae of the three identified dimers are C28H28N2O8 (CAS No. 1313734-13-2), C27H25N2O8 (CAS No. 1313734-14-3) and C27H24N2O8 (CAS No. 104359-67-3).
The product of commerce is obtained by concentrating, mixing with a food-grade carrier such as modified starch or maltodextrin, spray-drying and sieving. The product is standardized on the basis of genipin–glycine blue polymer. Unreacted genipin is not detectable in the final product. The product consists of a blue polymer (30–40%), sugars (25-30%), modified starch (20–22%), protein (approximately 7%) and water (approximately 5%). On the basis of a study with Jagua blue in solution at pH 3.6 in the dark for 50 days at 20 ºC, the solution was predicted to have a half-life of 86–105 days (15).
2. Biological data
2.1 Biochemical aspects2.1.1 Absorption, distribution, excretion No new toxicokinetics study has been published since the previous evaluation.
2.1.2 BiotransformationNo data were available.
2.2 Toxicological studies 2.2.1 Acute toxicityNo new information has been published since the Committee’s previous evaluation.
32
WH
O F
ood
Addi
tives
Ser
ies N
o. 8
0, 2
022
Safety evaluation of certain food additives Eighty-ninth JECFA
2.2.2 Short-term studiesNo new information has been published since the Committee’s previous evaluation.
2.2.3 Long-term studiesA new long-term toxicological study of a solid form of Jagua blue, corresponding to the commercial product (16), was submitted to the Committee. This GLP-compliant 12-month dietary study in rats with an in-utero exposure phase was conducted according to the US FDA’s Redbook guidance for this particular design (17). The long-term toxicity end-points are discussed in this section, while the reproductive and developmental end-points are discussed in section 2.2.5.
The test material (batches Nos 5317002 and 5317011) contained 36.4% active component, i.e. the blue polymer, and low levels of genipin–glycine dimers. The total amounts of the dimers in the test articles were 0.110% in batch No. 5317002 and 0.259% in No. 5317011. Fresh diet formulations were prepared every 4 weeks, as available analytical data demonstrated that the diet was stable for at least 8 weeks at room temperature (16). The concentration and homogeneity of each diet formulation were verified. Batch No. 5317002 was used in the palatability study (see below) and in the main study up to month 10, and batch No. 5317011 was used from month 10 up to the end of the study.
A 14-day palatability study was conducted before the main toxicity study in three female Wistar rats given Jagua blue at 50 000 mg/kg mixed in the feed. No clinical signs, deaths or effects on body weight, body weight gain or food consumption related to the test item were observed in the group given Jagua blue extract. Therefore, 50 000 mg/kg of feed was the highest test concentration used for the main study.
In the main study, Jagua blue at 0, 2500 (low), 12 500 (middle) or 50 000 (high) mg/kg feed was administered in the diet to groups of 20 male and 20 female Wistar rats of the parental generation, starting 10 and 4 weeks before mating, respectively, and continuing until termination after weaning. Two pups of each sex per litter in each group were selected at weaning and randomized to groups of only 25 F1 animals of each sex. The F1 animals were exposed to the test material in the diet at the beginning of weaning and continuously throughout the study for approximately 52 weeks. The average intake of the test item, calculated per body weight and food consumption measured at various intervals, were reported to be 0, 162, 772 and 3095 mg/kg bw per day for F0 males; 0, 295, 1487 and 5634 mg/kg bw per day for F0 females; 0, 168, 831 and 3385 mg/kg bw per day for F1 males; and 0, 187, 889 and 3750 mg/kg bw per day for F1 females, expressed as Jagua blue.
33
Jagua (genipin–glycine) blue (addendum)
Examinations performed on F0 and F1 animals included body weight measurements (weekly for 13 weeks and monthly thereafter until sacrifice), food consumption (weekly except for the mating period) and clinical signs (daily). Functional observational battery tests were conducted in F0 (once before the first exposure, once every fourth week and once in the last week of treatment) and F1 animals (once before the first exposure, once every fourth week for the first 13 weeks, once in months 6 and 9 and once in the last week of treatment). All F0 and F1 animals were sacrificed at the end of the treatment and subjected to necropsy. Gross and histological pathology were examined, and the organ weights were recorded.
Additionally, F1 animals underwent ophthalmological examinations before treatment and at 3, 6, 9 and 12 months; and haematological parameters, clinical biochemistry and urine parameters were analysed in 10 selected male and female animals per group on postnatal day 21 (among those not selected for F1), at week 5 (among selected pups not used for F1) and at 3, 6, 12 months and at terminal sacrifice (among those selected for F1). Developmental and reproductive outcomes are described in section 2.2.5.
One F1 female at the low concentration and one female at the middle concentration died before termination of the study from causes that were not related to treatment. Transient changes in body weight and food consumption were observed in male and female F1 rats at various concentrations; however, none of the changes was consistent or concentration dependent, and they were therefore considered not toxicologically relevant. No adverse or biologically relevant treatment-related effects were observed in any measured toxicological parameter in either F0 or F1 animals. The predominant clinical sign observed in the treated animals during most of the study period was discoloured faeces, attributed to the colour of the test item.
On examination for gross and histopathology, blue discoloration of the kidneys was observed in most F0 animals at the high concentration. This effect was not observed in F1 animals, and there were no corresponding histological findings, changes in kidney weight or clinical chemistry indicative of renal toxicity. Therefore, the blue discoloration of the kidneys was considered not to be an adverse effect. Blue discoloration in the gastrointestinal segments was observed in one F1 male at the middle concentration and in four F1 males at the high concentration but not in any F0 animals. This was considered likely to be due to Jagua blue in the faeces, and, as there were no histopathological changes in corresponding tissues, was also considered by the Committee not to be adverse.
Neoplastic lesions found in Jagua blue-treated animals were within the range of background lesions reported in Wistar rats of these ages (18). No gross or histopathological lesions were noted in F0 or F1 animals that could be correlated with treatment with the test item.
34
WH
O F
ood
Addi
tives
Ser
ies N
o. 8
0, 2
022
Safety evaluation of certain food additives Eighty-ninth JECFA
Green coloration of the urine (reported as greenish, green or blue) was observed in some treated animals primarily in the high-concentration group. Although the presence of dimeric Jagua blue was not confirmed in any of the green urine samples, the possibility that the dimers were absorbed and excreted could not be excluded. The Committee noted, however, that rats excreted green urine only sporadically and transiently and that the effect might be explained by faecal contamination or an unclean periurethral area at the time of urine collection rather than by absorption of the coloured material. The change in urine colour was considered not to be an adverse effect as there were no treatment-related changes in urinalysis, biochemistry or histopathology.
Overall, repeated and in-utero exposure to Jagua blue in the diet was not toxic in F0 or F1 generation animals at any of the concentrations tested. The Committee identified an NOAEL of 50 000 mg/kg feed, the highest concentration tested, equal to doses of 3095 and 5634 mg/kg bw per day in F0 males and females and 3385 and 3750 mg/kg bw per day in F1 males and females, respectively, expressed as Jagua blue.
2.2.4 Genotoxicity studiesNo new genotoxicity study on Jagua blue had become available since the Committee’s previous evaluation. The literature search identified a new publication (19) that reported negative results in genotoxicity testing of Gardenia blue, a genipin–protein polymer with a structure similar to that of Jagua blue.
2.2.5 Reproductive and developmental toxicityA GLP-compliant, 12-month dietary study with an in-utero exposure phase was conducted in rats with a solid form of Jagua blue, corresponding to the commercial product (16). The results of the long-term toxicity end-points are discussed in section 2.2.3. Jagua blue at 0, 2 500, 12 500 or 50 000 mg/kg feed was administered to groups of F0 20 male and 20 female Wistar rats, starting 10 and 4 weeks before mating, respectively, and continued after weaning until termination. Two pups of each sex per litter in each group were selected at weaning and randomized to select only 25 F1 animals of each sex per group. The F1 animals were exposed to the test material in the diet at the beginning of weaning and continuously throughout the study for approximately 52 weeks. The duration of gestation was recorded, calculated from day 0 of pregnancy. Each litter was examined as soon as possible. Live pups were counted and sexed, and litters weighed within 24 h of parturition (day 0 post partum) and on days 4, 7, 14 and 21 post partum.
In F0 females, no treatment-related adverse effects were observed in any reproductive index evaluated, comprising percentage copulation, fertility, delivery, duration of precoital interval, duration of gestation, number of corpora
35
Jagua (genipin–glycine) blue (addendum)
lutea, number of implantation sites and percentages of pre- and post-implantation loss. No differences were found between the treated and the control groups in measured fetal parameters during postnatal days 0–21, comprising the total number of pups born, number of male pups, number of female pups, sex ratio, number of live pups, stillbirths and runts on postnatal day 0 and appropriate litter parameters on postnatal days 4, 7, 14 and 21. The viability index of pups during postnatal days 0–4 remained unaffected and within the range of biological variation in treated as compared with control groups.
No treatment-related effects were observed on the developmental outcomes, pup mean weight, total litter weight, male and female litter weight and mortality of pups between postnatal days 0 and 21. No gross external abnormalities of toxicological relevance due to the test item were observed in the pups. Several findings, including dark snout, oedema on the neck and absent tail tip, observed in a few pups in various concentration groups were considered to be spontaneous and not related to treatment.
Males and females of the F1 generation in some treated groups showed changes in several functional parameters post weaning, such as supported or unsupported rearing, urination, defaecation and body temperature. These statistically significant results varied in time of observation and concentration group, with no identifiable pattern. The Committee concluded that the changes were either transient or independent of concentration and considered them to be biologically irrelevant. No consistent or concentration-dependent effect was observed on body weight gain among F1 offspring post-weaning. The overall body weight gain in all treatment groups was comparable with that of the controls.
The Committee identified the NOAEL in the study to be 50 000 mg/kg feed for both the F0 and F1 generations, the highest concentration tested, equal to doses of 3095 and 5634 mg/kg bw per day in F0 males and females, respectively, and 3385 and 3750 mg/kg bw per day in F1 males and females, respectively, expressed as Jagua blue.
2.2.6 Special studiesThe literature search identified a study (20) in which a genipin–tyrosine derivative was tested for antidepressant-like activity in murine models of chemically or environmentally induced stress. The Committee, however, questioned the chemical characteristics of the test article and noted that the study was not designed for assessing toxicity. The study was therefore not considered for the current evaluation.
36
WH
O F
ood
Addi
tives
Ser
ies N
o. 8
0, 2
022
Safety evaluation of certain food additives Eighty-ninth JECFA
2.3 Observations in humansNo reports were found on food allergies or food intolerance to Jagua blue. Three cases of allergic contact dermatitis were reported after application of temporary tattoo materials containing Genipa americana as the colouring ingredient (21–23). Patch testing indicated that the allergen was genipin (21,22). The Committee considered that these case reports were not relevant to a safety evaluation of Jagua blue as a food additive.
3. Dietary exposureJagua blue has not been adopted by the Codex Alimentarius Commission and is therefore not included in the GSFA.
The sponsor submitted updated proposed maximum use levels of Jagua blue in 22 food groups that reflect possible uses in the global market. The sponsor withdrew use in soft drinks, energy drinks, sports drinks, chocolate-flavoured products, chocolate confectionery or the chocolate portion of confectionery from the previous JECFA submission. The maximum use levels in 22 food groups proposed by the sponsor were matched with the CIFOCOss food groups (Table 1). No actual use levels were presented or found in the literature.
3.1 Assessments based on the FAO/WHO CIFOCOss and EFSA Comprehensive databases The assessments were based on data from the EFSA Comprehensive database from 51 surveys in 23 European countries and on the dietary exposure estimates of five non-European countries (Bangladesh, Burkina Faso, Indonesia, Lao People’s Democratic Republic and Uganda) in the FAO/WHO CIFOCOss database, a compilation of data from individual food consumption surveys from 28 countries (24). It was assumed that all foods in the proposed 22 food groups were coloured with Jagua blue at the proposed maximum use levels. The mean exposure levels were estimated by adding the estimates of mean consumption levels of the 22 food groups multiplied by the corresponding proposed maximum use levels of Jagua blue. High-level exposure was calculated by adding the 95th percentile of exposure to the food group with the highest value to the estimated mean exposure to the other food groups. The sponsor used the consumption estimates from CIFOCOss in g/day and the default body weights of 15 kg for infants, 20 kg for toddlers (< 35 months), 30 kg for children (6–14 years), 45 kg for adolescents (> 14 years) and those of adults and the elderly (> 14 years)
37
Jagua (genipin–glycine) blue (addendum)
Food group proposed by the sponsor CIFOCOss food group
At 84th JECFA (mg/kg) a
At 89th JECFA (mg/kg) a
Flavoured milk Fermented milks (plain) (120) 400 (160) Milk shakes Milk shakes 400 (160) Milk substitutes Almond drink, milk imitations, rice milk, rice drink, spelt drink 400 (160) Other dairy drinks Other dairy drinks (240) 210 (84) Yogurt, regular and Greek
Dairy-based desserts (e.g. pudding, fruit and flavoured yoghurt), tzatziki, yoghurt
(180) 300 (120)
Yogurt, dairy alternative Dairy imitations other than milks; imitation yoghurt 500 (200)Ice cream, frozen dairy and alternative dairy desserts
Edible ices, including sherbet and sorbet; dairy ice creams and similar; frozen yoghurt; “spoonable” desserts and ice creams (generic)
(240) 1000 (400)
Puddings Custard, “spoonable” dairy desserts, rice pudding, starchy pudding 210 (84)Gelatins, ices, sorbets Gelatin, gelatin dessert 300 (120)Ready-to-eat cereal, multi-coloured
Cereal flakes and similar 5000 (2000)
Potato crisps, flavoured Chips or crisps; potato crisps from dough; potato crisps from potato slices; potato crisps or sticks
1540 (616)
Tortilla, corn and other chips
Corn chips, corn curls, tortilla, tortilla chips 3000 (1200)
Confectionery containing chocolate
Chocolate coated confectionery - 2000 (800)
Confectionery not containing chocolate
Brittle mass, soft and hard confectionery, Florentine biscuit mass, foamed sugar products (marshmallows), fondant mass, liquorice confectionery, loukoumi, marzipan, marzipan raw mass, nougat, nougat raw mass, nut mass, nut seed-based halva, soft confectionery and analogues, sweet bars and other formed sweet masses, toffee, white nougat mass
(120) 2000 (800)
Chewing gum Chewing gum 2000 (800)Fruit-based drinks (including fruit-flavoured drinks)
Liquid drink bases (including concentrates and home-made preparations) (40) 200 (80)
Nutritional beverages (ready-to-use and powders)
Nutritionally complete formulae and nutritionally incomplete formulae 160 (64)
Smoothies Fruit smoothies, mixed juices with added ingredients 160 (64)Cream cheese-based spread, flavoured
Cream cheese, processed cheese and spreads 110 (44)
Icing and frosting 300 (120)Fruit toppings fillings and jam
Caramel, choux pastry, fruit jelly, fruit preparations for fillings and/or flavouring, fruit and vegetable jams, mango chutney, marmalade
(120) 300 (120)
Syrups and toppings for beverages, desserts and breakfast syrups
Corn syrup, dessert sauces and toppings, sugar beet molasses, sugar beet syrup, sugar cane molasses, syrups, molasses and other syrups
300 (120)
Table 1Proposed maximum use levels of Jagua blue based on CIFOCOss food groups
a PML as blue polymer based on the maximum level of 40% in Jagua blue per specifications
38
WH
O F
ood
Addi
tives
Ser
ies N
o. 8
0, 2
022
Safety evaluation of certain food additives Eighty-ninth JECFA
when necessary. The Committee noted that the estimate for “adults” included application of a lower default value. High levels from the EFSA Comprehensive database were estimated by using the “high exposures from summary statistics” model (25) based on total population intake, which corresponds to exposure to Jagua blue at the 96th–99th percentiles for infants, the 95th–99th percentiles for the elderly and the 97th percentile for the other subpopulations.
The estimated mean and high levels of dietary exposure to Jagua blue are presented in Table 2, which were ≤ 20.7 and 28.7 mg/kg bw/day for infants and toddlers and 9.8 and 20.3 mg/kg bw/day for children and adolescents, respectively. The corresponding dietary exposure estimates on a blue polymer basis were calculated by multiplying the estimates as Jagua blue by 0.4, which is the maximum level per the specifications. The mean and high-level exposures to blue polymer were 0.3–8.3 and 2.7–11.5 mg/kg bw per day for infants and toddlers and 0.2–3.9 and 0.2–8.1 mg/kg bw per day for children and adolescents, respectively.
3.2 Assessments based on national dietary records The sponsor submitted estimates of dietary exposure in Brazil, the United Kingdom and the USA based on consumption of 22 food groups (26–28) and the proposed maximum use levels for Jagua blue. On the basis of research on representative products in the USA, the proposed maximum use levels were
Table 2Estimated dietary exposure to Jagua blue and to blue polymer based on the CIFOCOss and EFSA Comprehensive databases combined with maximum use levels proposed by the sponsor
Population group Age
Exposure (mg/kg bw per day)Mean High-levela
Jagua blue Blue polymer Jagua blue Blue polymerInfants and toddlers ~ 35 monthsb 15.9–20.7 6.4–8.3 16.7–24.4 6.7–9.8
~11 months 0.8–4.1 0.3–1.6 6.7–26.7 2.7–10.71–3 years 3.1–7.4 1.2–3.0 11.2–28.7 4.5–11.5
Children and adolescents 3–14 yearsb 0.4–9.8 0.2–3.9 0.5–19.9 0.2–8.03–9 years 1.5–5.4 0.6–2.2 7.7–20.3 3.1–8.1
10–17 years 0.8–2.5 0.3–1.0 4.0–11.1 1.6–4.4Adults and elderly ≥ 18 yearsc 0.1–3.0 0.04–1.2 0.1–4.9 0.04–2.0
Exposure to blue polymer was estimated by multiplying exposure to Jagua blue by 0.4, which is the maximum level specified.a 95th percentile general consumer population in non-European countries based on CIFOCOss and 95th–99th percentile general consumer populations available from
the EFSA Comprehensive databaseb General consumer population in non-European countries based on CIFOCOssc Population > 15 years in non-European countries included
39
Jagua (genipin–glycine) blue (addendum)
adjusted for the other countries by applying weighted use levels and applicable portions of foods that could be coloured (e.g. coated confectionery) to the proposed maximum use levels. A seasonal adjustment factor was also applied. Flavoured milk was considered a seasonal food, as it is considered to be consumed on holidays such as Christmas and Easter, and an adjustment factor of 0.5 was applied to its proposed maximum use level.
Exposure to Jagua blue was estimated for four population groups: children aged 2–5 years, children aged 6–12 years, adolescents aged 13–18 years and adults aged ≥ 18 years. The means and 95th percentiles of the estimated Jagua blue intake by each population group are presented in Table 3.
4. Comments
4.1 Biochemical aspectsThe Committee at its 84th meeting (Annex 1, reference 234) concluded that the main colouring component of Jagua blue, the blue polymer, is unlikely to be absorbed intact from the gastrointestinal tract because of its high molecular weight (~6000 Da). This conclusion was supported by a study in which the blue polymer was not detectable in plasma of dogs given Jagua blue at doses up to 338 mg/kg bw per day for 90 days and a study with the Caco-2 intestinal barrier model in vitro, which demonstrated that the blue polymer was poorly passively absorbed. The Committee noted at its 84th meeting that some evidence, such as green urine observed in dogs given Jagua blue, suggested that a small proportion of Jagua blue, “possibly the smallest coloured molecular species (such as genipin–
Table 3Estimated dietary exposure to Jagua blue and blue polymer from proposed maximum use levels, based on dietary records in Brazil, the United Kingdom and the USA
Population
Exposure to Jagua blue (blue polymer) (mg/kg bw per day)Brazil United Kingdom USA
Mean 95th percentile Mean 95th percentile Mean 95th percentileChildren (2–5 years) No data No data 1.2 (0.5) 3.1 (1.2) 2.0 (0.8) 5.8 (2.3)Children (6–12 years)a 0.6 (0.2) 2.3 (0.9) 0.8 (0.3) 1.9 (0.8) 1.3 (0.5) 4.0 (1.6)Adolescents (13–18 years)
0.4 (0.2) 1.5 (0.6) 0.4 (0.2) 1.3 (0.5) 0.6 (0.2) 1.9 (0.8)
Adults (≥ 18 years) 0.3 (0.1) 1.0 (0.4) 0.3 (0.1) 1.1 (0.4) 0.4 (0.2) 1.3 (0.5)
Values in parentheses are estimates for blue polymer, calculated by multiplying exposure to Jagua blue by 0.4, which is the maximum level specified.a Children aged 10–12 years
40
WH
O F
ood
Addi
tives
Ser
ies N
o. 8
0, 2
022
Safety evaluation of certain food additives Eighty-ninth JECFA
glycine dimers or other coloured low molecular weight components), could be absorbed”. In the newly available long-term toxicity study, green urine was observed in a few Jagua blue-treated rats, primarily in the high-concentration group. Although the presence of dimeric Jagua blue was not confirmed in any of the green urine samples, the possibility that dimers were absorbed and excreted could not be excluded. The Committee noted, however, that rats excreted green urine only sporadically and transiently, which might be explained by faecal contamination or an unclean periurethral area at the time of urine collection rather than by absorption of the coloured material. There was no indication of bioaccumulation.
4.2 Toxicological studiesThe Committee at its 84th meeting discussed an oral gavage acute toxicity test in rats that showed no adverse effects at the highest tested dose of 660 mg/kg bw. They also discussed two short-term studies, in rats and in dogs. When Jagua blue was administered by gavage to rats for 90 days, no deaths or treatment-related toxicological effects were reported. The NOAEL was identified as 330 mg/kg bw per day on a blue polymer basis, the highest dose tested. In the second study, Jagua blue was administered to beagle dogs by gavage for 90 days. No deaths or treatment-related toxicological effects were reported. The NOAEL was identified as the highest dose tested, 338 mg/kg per day on a blue polymer basis.
A GLP-compliant 12-month study in rats exposed in utero in the diet was available to the Committee at the current meeting. A Jagua blue product was administered at 0, 2500 (low), 12 500 (medium) or 50 000 (high) mg/kg feed to rats from before mating until weaning in the parental generation and up to about 52 weeks in the F1 generation. The test article contained 36.4% of the blue polymer and 0.11–0.26% of the dimers. No adverse or biologically relevant treatment-related effects were reported in a comprehensive set of observations, including target organ toxicity, a functional observational battery of tests, reproductive indices and developmental outcomes at concentrations up to 50 000 mg/kg feed. Discoloured faeces, attributed to the colour of the test item, were observed in all treated animals. Gross pathology showed blue discoloration of the kidneys in most F0 animals given the high concentration but not in F1 animals. Blue discoloration in gastrointestinal segments was reported in five F1 animals but not in F0 animals. As there were no histopathological changes associated with these macroscopic findings, the Committee did not consider the tissue discoloration to be toxicologically relevant.
The study was conducted with a longer exposure time and higher concentrations of Jagua blue than in the short-term studies in rats and dogs evaluated by the Committee at its 84th meeting, as recommended. Overall, the
41
Jagua (genipin–glycine) blue (addendum)
Committee concluded that the new long-term toxicity study demonstrated lack of chronic toxicity and reproductive and developmental toxicity after prenatal and 1 year of exposure to Jagua blue at concentrations up to 50 000 mg/kg in feed. The NOAEL was identified as 50 000 mg/kg feed, the highest concentration tested, equal to doses of 3095 and 5634 mg/kg bw per day for F0 males and females, respectively, and 3385 and 3750 mg/kg bw per day for F1 males and females, respectively, expressed as Jagua blue. The Committee identified the lowest body weight-based NOAEL, 3095 mg/kg bw per day, as the basis for establishing an ADI. This NOAEL corresponds to 1127 mg/kg bw per day on a blue polymer basis.
Because of inadequate characterization of the test article and the relatively low doses administered to the animals in the short-term studies available at the 84th meeting, the previous Committee raised concern about the composition and potential toxicity of the low-molecular-weight fraction of the total colouring matter in Jagua blue. At the current meeting, chemical characterization of the dimers indicated that the three genipin–glycine dimers accounted for only 0.11–0.26% of the test article used in the long-term study.
At the 84th meeting, three genotoxicity studies on Jagua blue were available to the Committee: a bacterial reverse mutation assay, an in vitro mouse lymphoma assay and an in vivo mammalian micronucleus induction assay. No genotoxic potential of Jagua blue was identified. No new genotoxicity studies with Jagua blue were available at the current meeting. In the absence of genotoxicity and the lack of treatment-related neoplastic or preneoplastic histopathological lesions in rats exposed in utero and for 1 year postnatally in the new study, the current Committee concluded that a 2-year carcinogenicity study was not required.
The Committee reviewed estimates of dietary exposure to Jagua blue on a blue polymer basis from the CIFOCOss and the EFSA Comprehensive European Food Consumption databases and proposed maximum use levels for 22 food categories. The sponsor updated the proposed maximum use levels from those provided to the 84th JECFA meeting. A fixed fraction (40%) was applied to estimates of Jagua blue in order to derive the corresponding exposure levels on a blue polymer basis. For infants and toddlers (≤ 3 years), the mean and high (95th percentile) dietary exposure estimates for Jagua blue on a blue polymer basis were 0.3–8.3 mg/kg bw per day and 2.7–11.5 mg/kg bw per day, respectively.
Dietary exposure estimates prepared by the sponsor from data in national food consumption surveys in Brazil, the United Kingdom and the USA and adjusted use levels were available to the Committee. The adjusted use levels were derived by applying factors for the assumptions that only a portion of a food category or food would be expected to be coloured (e.g. coated confectionery) or a seasonal adjustment factor (e.g. flavoured milk) to the proposed maximum
42
WH
O F
ood
Addi
tives
Ser
ies N
o. 8
0, 2
022
Safety evaluation of certain food additives Eighty-ninth JECFA
use levels. The highest 95th percentile exposure to Jagua blue on a blue polymer basis based on adjusted use levels for children aged 2–5 years in the USA was 2.3 mg/kg bw per day. This estimate is lower than those based on the CIFOCOss and EFSA databases and proposed maximum use levels but was not considered by the Committee. The Committee noted that it was not clear how well the adjusted levels reflect actual use levels in foods available on the market, as Jagua blue has not yet been marketed globally.
The Committee concluded that the conservative estimates of the range of high-level exposure, 2.7–11.5 mg/kg bw per day for infants and toddlers (≤ 3 years), should be considered in the safety assessment of Jagua blue on a blue polymer basis.
5. EvaluationThe Committee considered that the new toxicological data and additional characterization of the test compound provided adequate information for completing the safety evaluation of Jagua blue. The new 12-month study of rats with an in-utero exposure phase was conducted for a longer exposure time and at higher concentrations of Jagua blue, as recommended by the Committee at its 84th meeting. Although no new toxicokinetics study was available, newly developed analytical methods for the dimers provided acceptable characterization of the test article, thus reducing the uncertainty of the safety assessment due to limited biochemical (absorption, distribution, metabolism and excretion) information.
An ADI of 0–11 mg/kg bw was established by the Committee for Jagua blue, on a blue polymer basis. This ADI was based on the absence of treatment-related long-term toxicity and of reproductive and developmental toxicity in the 12-month dietary study in rats with an in-utero exposure phase, in which the NOAEL was equal to 1127 mg/kg bw per day of the blue polymer, the highest dose tested. The ADI was established by applying an uncertainty factor of 100 to the NOAEL to allow for inter- and intra-species differences.
The Committee noted that the upper end of the high-level dietary exposure estimate for Jagua blue, on a blue polymer basis, for infants and toddlers of 11.5 mg/kg bw per day is in the region of the upper bound of the ADI. In view of the conservative nature of the dietary exposure assessments, in which it was assumed that all foods contained Jagua blue on a blue polymer basis at the maximum use level, and because the ADI was based on a NOAEL that was the highest dose tested, the Committee concluded that the estimated dietary exposure to Jagua blue, on a blue polymer basis, does not represent a health concern.
The Committee revised the specifications for Jagua blue and removed their tentative status. The chemical and technical assessment was updated.
43
Jagua (genipin–glycine) blue (addendum)
6. References1. World Investment Report 2005. Geneva: United Nations Conference on Trade and Development; 2005.
2. Ono M, Ishimatsu N, Masuoka C, Yoshimitsu H, Tsuchihashi R, Okawa M, et al. Three new monoterpenoids from the fruit of Genipa americana. Chem Pharm Bull. 2007;55(4):632–4.
3. Ueda S, Iwahashi Y, Tokuda H. Production of anti-tumor-promoting iridoid glucosides in Genipa americana and its cell cultures. J Nat Prod. 1990;54(6):1677–80.
4. Ramos-de-la-Peña AM, Montañez JC, de la Luz Reyes-Vega M, Hendrickx ME, Contreras-Esquivel JC. Recovery of genipin from genipap fruit by high pressure processing. LWT-Food Sci Technol. 2015;63(2):1347–50.
5. Dinda B, Debnath S, Harigaya Y. Naturally occurring iridoids. A review. Part 1. Chem Pharmaceut Bull. 2007;55(2):159–222.
6. Dinda B, Debnath S, Harigaya Y. Naturally occurring secoiridoids and bioactivity of naturally occurring iridoids and secoiridoids. A review, part 2. Chem Pharmaceut Bull. 2007;55(5):689–728.
7. Neri-Numa IA, Gabriel-Pessôa M, Silvano Arruda H, Araujo Pereira G, NIcolau Paulino B, Figueiredo Angolini CF, et al. Genipap (Genipa americana L.) fruit extract as a source of antioxidant and antiproliferative iridoids. Food Res Int. 2020;134:109–252.
8. Touyama R, Takeda Y, Inoue K, Kawamura I, Yatsuzuka M, Ikumoto T, et al. Studies on the blue pigments produced from genipin and methylamine. I. Structures of the brownish-red pigments, intermediates leading to the blue pigments. Chem Pharmaceut Bull. 1994;42(3):668–73.
9. Touyama R, Inoue K, Takeda Y, Yatsuzuka M, Ikumoto T, Moritome N, et al. Studies on the blue pigments produced from genipin and methylamine. II. On the formation mechanisms of brownish-red intermediates leading to the blue pigment formation. Chem Pharmaceut Bull. 1994;42(8):1571–8.
10. Fujikawa S, Fukui Y, Koga K, Kumada J. Brilliant skyblue pigment formation from gardenia fruits. J Ferment Technol. 1987;65:419–24.
11. Paik YS, Lee CM, Cho MH, Hahn TR. Physical stability of the blue pigments formed from geniposide of gardenia fruits: effects of pH, temperature, and light. J Agric Food Chem. 2001;49:430–2.
12. Park JE, Lee JY, Kim HG, Hahn TR, Paik YS. Isolation and characterization of water-soluble intermediates of blue pigments transformed from geniposide of Gardenia jasminoides. Agric Food Chem. 2002;50:6511–4.
13. Cho YJ, Kim SY, Kim J, Choe EK, Kim SI, Shin HJ. One-step enzymatic synthesis of blue pigments from geniposide for fabric dyeing. Biotechnol Bioprocess Eng. 2006;11:230–4.
14. Lee JH, Lee DU, Jeong CS. Gardenia jasminoides Ellis ethanol extract and its constituents reduce the risks of gastritis and reverse gastric lesions in rats. Food Chem Toxicol. 2009;47:1127–31.
15. Brauch JE, Zapata-Porras SP, Buchweitz M, Aschoff JK, Carle R. Jagua blue derived from Genipa americana L. fruit: a natural alternative to commonly used blue food colorants? Food Res Int. 2016;89(1):391–8.
16. Takawale P, et al. 12 months repeated dose toxicity study including in-utero exposure in Wistar rats with jagua extract. Study No. 171414. Unpublished report by BSL Bioservice, Planegg, Germany; 2019. Submitted to WHO by Ecoflora SAS, Colombia.
44
WH
O F
ood
Addi
tives
Ser
ies N
o. 8
0, 2
022
Safety evaluation of certain food additives Eighty-ninth JECFA
17. Redbook 2000: IV.C.8 in-utero exposure phase for addition to carcinogenicity studies or chronic toxicity with rodents, toxicological principles for the safety assessment of food ingredients. Washington DC: Food and Drug Administration; 2007.
18. Weber K. Differences in types and incidence of neoplasms in Wistar Han and Sprague-Dawley rats. Toxicol Pathol. 2017;45(1):64–75.
19. Hobbs CA, Koyangi M, Swartz C, Davis J, Maronpot D, Recio L, et al. Genotoxicity evaluation of the naturally-derived food colorant, gardenia blue, and its precursor, genipin. Food Chem Toxicol. 2018;118:695–708.
20. Li KD, Yan K, Wang QS, Tian JS, Xu D, Zhang WY, et al. Antidepressant-like effects of dietary gardenia blue pigment derived from genipin and tyrosine. Food Function. 2019;10(8):4533–45.
21. Bircher AJ, Sigg R, Scherer Hofmeier K, Schegel U, Hauti U. Allergic contact dermatitis caused by a new temporary blue–black tattoo dye – sensitization to genipin from jagua (Genipa americana L.) fruit extract. Contact Dermatitis. 2017;77(6):374–8.
22. Bircher AJ, Sigg R, Scherer Hofmeier K, Schegel U, Hauti U. Genipin in temporary jagua tattoos – black dye causing severe allergic dermatitis. Dermatitis. 2019;30(6):375–6.
23. Wilmot MC, Wakelin SH. The dangers of “natural” temporary tattoos: a case report and literature review (abstract only). J Am Acad Dermatol. 2019; 81(4, Suppl 1):AB130.
24. Chronic Individual Food Consumption database. Food safety. Databases. Geneva: World Health Organization; 2020 (https://www.who.int/foodsafety/databases/en/, accessed 18 November 2019).
25. Demsey P. High Exposure from Summary Statistics (HESS): application to the EFSA comprehensive European food consumption database. Food Addit Contam A Chem Anal Control Expo Risk Assess. 2018;35(1):20–8.
26. Consumer expenditure survey 2008–2009. Rio de Janeiro: Brazilian Institute of Geography and Statistics.
27. National Diet and Nutrition Survey rolling programme, years 1–8. London: Public Health England; 2018.
28. National Health and Nutrition Examination Survey. Atlanta (GA): Centers for Disease Control and Prevention; 2016, 2017.
45
Lipase from Mucor javanicusFirst draft prepared byS.M.F. Jeurissen,1 M. DiNovi,2 T. Hambridge,3 K. Laurvick,4 J. Schlatter5 and J.R. Srinivasan2
1 Department for Food Safety, Centre for Nutrition, Prevention and Health Services, National Institute for Public Health and the Environment, Bilthoven, The Netherlands
2 Office of Food Additive Safety, Center for Food Safety and Applied Nutrition, Food and Drug Administration, College Park (MD), USA
3 Food Standards Australia New Zealand, Majura Park, Australian Capital Territory, Australia
4 Food Standards, United States Pharmacopeia, Rockville (MD), USA5 Zurich, Switzerland
1. Explanation 451.1 Genetic background 461.2 Chemical and technical considerations 47
2. Biological data 482.1 Biotransformation 482.2 Assessment of potential allergenicity 482.3 Toxicological studies 48
2.3.1 Acute toxicity 482.3.2 Short-term toxicity 482.3.3 Long-term toxicity and carcinogenicity 502.3.4 Genotoxicity 502.3.5 Reproductive and developmental toxicity 51
2.4 Observations in humans 513. Dietary exposure 51
3.1 Introduction 513.2 Dietary exposure assessment 52
4. Comments 535. Evaluation 546. References 54
1. ExplanationAt the request of the CCFA at its Forty-ninth Session (1), the Committee evaluated the safety of lipase (triacylglycerol lipase; Enzyme Commission No. 3.1.1.3) from Mucor javanicus (also known as M. circinelloides), which it has not previously evaluated. Lipase from animal tissues (forestomach of calves, caprine kids and lambs or animal pancreatic tissue) was evaluated at its 15th meeting
46
WH
O F
ood
Addi
tives
Ser
ies N
o. 8
0, 2
022
Safety evaluation of certain food additives Eighty-ninth JECFA
(Annex 1, reference 26), and an ADI “not limited”1 was allocated. Besides its use as a processing aid in cheese-making and modification of lipids, lipase from animal tissues is also used as a flavour enhancer (INS 1104). The Committee evaluated lipase from Aspergillus oryzae var. at its 18th meeting and established an ADI “not specified” (Annex 1, reference 35). At its 55th meeting, however, the Committee removed the tentative specifications for this enzyme preparation because the requested data had not been submitted (Annex 1, reference 149). The consequences of the withdrawal of specifications for lipase from A. oryzae var. on its ADI were not addressed during that meeting. Lipase from Fusarium heterosporum expressed in Ogatae polymorpha was evaluated by the Committee at its 80th meeting, which established an ADI “not specified” for its use in the manufacture of bakery products, pasta and noodles, in egg yolk and in the degumming of edible oil (Annex 1, reference 82).
In this report, the expression “lipase” refers to the lipase enzyme and its amino acid sequence, the expression “liquid enzyme concentrate” refers to the test material used in the toxicity studies evaluated, and the expression “enzyme preparation” refers to the product formulated for commercial use.
The Committee at the present meeting considered the submitted data and conducted a literature search in the PubMed database with the linked search terms “lipase” and “mucor” or “javanicus”. The search yielded 188 references, but no relevant published studies on biochemical or toxicological aspects were found.
1.1 Genetic backgroundThe production organism, M. javanicus, is a filamentous fungus often found in soil, plants and decaying fruits and vegetables. The taxonomy of Mucor species was confirmed by its macroscopic and microscopic characteristics. The M. javanicus production strain was further verified as a strain of M. javanicus by phylogenetic analysis of the internal transcribed spacer rDNA sequence from the results of a homology search with BLAST. Mucor species are recognized for their use in food applications (2), including as source organisms in the production of lipase used in food processing (3). M. javanicus is considered an occasional opportunistic human pathogen and has been known rarely to cause acute and rapidly developing mucormycoses in susceptible populations, including those with acidotic diabetes, malnourished children, severely burnt patients, patients undergoing immunosuppressive therapy and patients with leukaemia, lymphoma or AIDS (4,5). As no viable organisms are present in the enzyme preparation,
1 The term ADI “not limited” is no longer used by JECFA. It has the same meaning as ADI “not specified”. The reader is referred to the footnote on p. 46 for a definition, for clarification of ADI “not specified”.
47
Lipase from Mucor javanicus
however, the Committee concluded that there is no concern regarding the potential human pathogenicity of the production strain M. javanicus.
The M. javanicus production strain was obtained by chemical mutagenesis followed by selection of individual colonies of the parent strain, M. javanicus IAM 6018. The parent strain was originally housed at the Institute of Applied Microbiology Culture Collection; it is presently held at the Japan Collection of Microorganisms under M. javanicus JCM 22477.
1.2 Chemical and technical considerations The lipase is produced by controlled aerobic batch fermentation of a pure culture of a selected strain of M. javanicus (AE-LM). The enzyme is secreted into the fermentation broth and is separated from the biomass by a series of filtration steps. The filtrate containing the enzyme is further concentrated. Filtration is performed at various stages throughout the recovery process to control against microbial contamination. The liquid enzyme concentrate is spray-dried with dextrin to produce the powdered enzyme preparation. The entire process is performed in accordance with current good manufacturing practice with food-grade raw materials. The final lipase enzyme preparation is free of the production strain and other insoluble substances. The enzyme preparation conforms to the General Specifications and Considerations for Enzyme Preparations Used in Food Processing (Annex 1, reference 185).
Lipase catalyses the hydrolysis of mono-, di- and triglycerides containing short-, medium- and long-chain fatty acid moieties. It is intended for use in the processing of food ingredients containing naturally occurring fats and oils, including flour, cheese, egg whites and flavourings of vegetable, animal or microbiological origin. The use of lipase in food processing increases the fatty acid content for the purpose of improving the organoleptic (flavour and texture) and/or physical properties (consistency and texture) of the ingredients or final food. Lipase activity is measured in units per gram (U/g) based on the release of fatty acids from a triglyceride-containing substrate. One unit is defined as the amount of enzyme that liberates 1 μmol of free fatty acid from an olive oil substrate per minute under the assay conditions. The mean activity of lipase from three batches of the enzyme concentrate was 31 100 U/g.
The mean TOS content of the enzyme concentrate is 410 mg/g. The TOS include the enzyme of interest and residues of organic materials, such as proteins, peptides and carbohydrates, derived from the production organism during the manufacturing process. Lipase enzyme preparation is used at concentrations up to 1357 mg TOS/kg raw material, depending on the proposed food application. Lipase is heat-denatured and inactivated during processing at high temperatures (> 60 °C), such that the enzyme will have no technological effect in the final food.
48
WH
O F
ood
Addi
tives
Ser
ies N
o. 8
0, 2
022
Safety evaluation of certain food additives Eighty-ninth JECFA
2. Biological data
2.1 BiotransformationNo information was available.
2.2 Assessment of potential allergenicity Lipase from M. javanicus consists of 395 amino acids and the molecular weight is approximately 43.4 kDa. Lipase from M. javanicus was evaluated for potential allergenicity using the bioinformatics criteria recommended by FAO/WHO (6,7) modified at the eightieth meeting of the Committee (Annex 1, reference 223). A homology search was conducted where the amino acid sequence of lipase from M. javanicus was compared with the amino acid sequences of known allergens in the AllergenOnline database (http://www.allergenonline.org/databasefasta.shtml; version 19, February 2019) and in the Allermatch database (http://allermatch.org/; last update July 2019). A search for matches with > 35% identity in a sliding window of 80 amino acids and a search for exact matches in an 8-amino acid window produced no matches. Additionally, a full-length FASTA sequence search was conducted with an E-value cut off of 0.1.2 No sequences were considered homologous with known allergens. Therefore, the Committee considered that dietary exposure to lipase from M. javanicus is not anticipated to pose a risk of allergenicity.
2.3 Toxicological studiesThe toxicological studies described below were performed with a lipase liquid enzyme concentrate (batch no. LMH66-013P; TOS: 3.92%; specific gravity 1.02 g/mL), with no stabilization or standardization. The liquid enzyme concentrate had an activity of 2550 U/mL.
2.3.1 Acute toxicityNo information was available.
2.3.2 Short-term toxicityRatsIn a dose range-finding study, groups of five male and five female Sprague-Dawley rats were given lipase liquid enzyme concentrate at a dose of 0, 200, 400 or 800
2 Comparisons between highly homologous proteins yield expectation values (E-values) approaching zero, indicating a very low probability that such matches would occur by chance. A larger E-value indicates a lower degree of similarity.
49
Lipase from Mucor javanicus
mg TOS/kg bw per day orally by gavage for 14 days (8). The study was certified for compliance with the Japanese “Reliability Standards of Application Data” and quality assurance. Rats were observed for deaths, clinical signs, body weight and feed consumption. Blood samples were collected at the end of the treatment period for haematology and clinical chemistry. At study termination, selected organs (adrenal glands, spleen, heart, lungs, liver, kidneys, testes and ovaries) from all animals were weighed and macroscopic examination was performed.
No deaths, clinical signs or effects on haematological or blood chemistry were observed. No changes were observed in body weight or feed consumption, except for a statistically significant decrease in feed consumption and body weight on day 7 in females at the middle dose. This transient change was considered not to be related to treatment. Female rats showed statistically significant decreases in absolute liver weight (–15% and –13% at the middle and high doses, respectively) and in relative liver weights (–8%, –6% and –7% at the low, middle and high doses, respectively). In the absence of a dose–response relation and of changes in related clinical chemistry, these changes were considered not to be toxicologically relevant. The macroscopic changes observed were limited to dark-red lesions in the glandular stomach of one control female and in one male and one female at the middle dose and a small severe lesion (no further details provided) in the left side of the thyroid in one high-dose female. Given the sporadic nature of these changes, they were considered unrelated to administration of the test article. In the absence of adverse effects, the same dose levels were selected for the subsequent 90-day study.
In the subsequent study, groups of 10 male and 10 female 6-week-old Sprague-Dawley rats were given liquid lipase concentrate at a dose of 0, 200, 400 or 800 mg TOS/kg bw per day orally by gavage for 13 weeks (9). The study was certified for compliance with good laboratory practice and quality assurance and was performed according to Japanese guidelines for toxicity testing. The study protocol was comparable with OECD test guideline 408 (repeated dose 90-day oral toxicity study in rodents, 1998), except that no functional observational tests were performed. Food and water were provided ad libitum. Animals were observed for clinical signs at least twice a day. Body weights were measured twice in the first week and weekly thereafter. On the day of necropsy, final body weights were measured after the animals had been deprived of food for 16 h. Feed consumption was recorded twice in the first week, and weekly thereafter. Ophthalmoscopic examinations were performed before the start of the study (all animals) and in week 13 (six animals/group). In week 13, urine was collected for 4 h with deprivation of food but free access to water; thereafter, urine was collected for 20 h with free access to food and water. One-day water consumption from individual water bottles was measured on the day before urine samples were collected. At necropsy, blood samples were collected from the abdominal
50
WH
O F
ood
Addi
tives
Ser
ies N
o. 8
0, 2
022
Safety evaluation of certain food additives Eighty-ninth JECFA
aorta for haematology and blood chemistry, and then all animals were killed by exsanguination via the abdominal aorta. The external appearance and all organs and tissues in the cranial, thoracic and abdominal cavities were carefully examined macroscopically. Organ weights were determined for brain, pituitary, thyroid including parathyroid, adrenal, thymus, spleen, heart, lung including bronchus, salivary gland, liver, kidney, testis, prostate, seminal vesicle, ovary and uterus. Histopathology was performed on approximately 50 tissues from all animals in the control and high-dose group and on gross lesions in the other treatment groups.
No treatment-related deaths or clinical signs were observed. No effects were observed on body weight or feed and water intake. No treatment-related changes in haematology or clinical chemistry or urine analyses were noted. Ophthalmoscopic evaluations revealed no treatment-related effects. No statistically significant changes in organ weights were observed, except for a small but statistically significant decrease in relative heart weight in males at the high dose (0.27 g/100 g bw, as compared with 0.29 g/100 g bw in the control group). As the change was small and observed in one sex only and the individual values were within the range of historical control data, this observation was considered not to be treatment related. Macroscopic examination revealed unilateral pelvic dilatation in one male at the low dose, which was confirmed by histopathology and classified as mild. No histological changes were observed in the kidneys of other treated rats, and this finding was considered not to be treatment related. No treatment-related histopathological findings were observed in the organs and tissues studied.
In view of the absence of adverse effects in this study, the Committee identified a NOAEL of 800 mg TOS/kg bw per day, the highest dose tested.
2.3.3 Long-term toxicity and carcinogenicityNo information was available.
2.3.4 Genotoxicity The results of two studies of genotoxicity in vitro with the liquid lipase concentrate are summarized in Table 1. The studies were performed according to Japanese guidelines for toxicity testing. The protocol of the first study was comparable to OECD test guideline 471 (bacterial reverse mutation test, 1997), except that only a single experiment was performed. The protocol of the second study differed in some aspects from OECD test guideline 473 (in vitro mammalian chromosome aberration test, 2016). No statistical analyses were performed, historical control data were not provided and 200 instead of 300 metaphases were analysed per dose. Both studies were certified for compliance with good laboratory practice
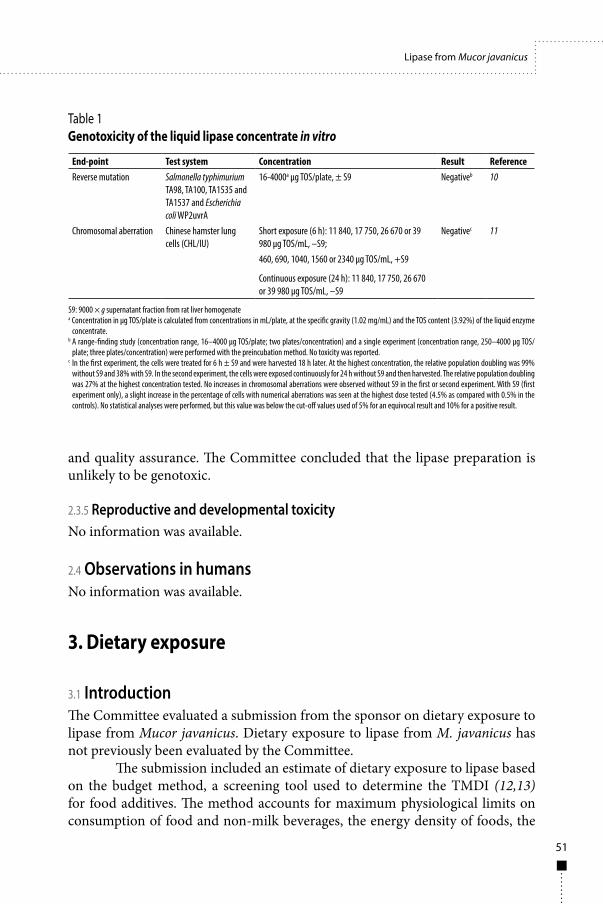
51
Lipase from Mucor javanicus
and quality assurance. The Committee concluded that the lipase preparation is unlikely to be genotoxic.
2.3.5 Reproductive and developmental toxicityNo information was available.
2.4 Observations in humansNo information was available.
3. Dietary exposure
3.1 IntroductionThe Committee evaluated a submission from the sponsor on dietary exposure to lipase from Mucor javanicus. Dietary exposure to lipase from M. javanicus has not previously been evaluated by the Committee.
The submission included an estimate of dietary exposure to lipase based on the budget method, a screening tool used to determine the TMDI (12,13) for food additives. The method accounts for maximum physiological limits on consumption of food and non-milk beverages, the energy density of foods, the
Table 1Genotoxicity of the liquid lipase concentrate in vitro
End-point Test system Concentration Result ReferenceReverse mutation Salmonella typhimurium
TA98, TA100, TA1535 and TA1537 and Escherichia coli WP2uvrA
16-4000a µg TOS/plate, ± S9 Negativeb 10
Chromosomal aberration Chinese hamster lung cells (CHL/IU)
Short exposure (6 h): 11 840, 17 750, 26 670 or 39 980 µg TOS/mL, –S9;
Negativec 11
460, 690, 1040, 1560 or 2340 µg TOS/mL, +S9
Continuous exposure (24 h): 11 840, 17 750, 26 670 or 39 980 µg TOS/mL, –S9
S9: 9000 × g supernatant fraction from rat liver homogenate a Concentration in µg TOS/plate is calculated from concentrations in mL/plate, at the specific gravity (1.02 mg/mL) and the TOS content (3.92%) of the liquid enzyme
concentrate. b A range-finding study (concentration range, 16–4000 µg TOS/plate; two plates/concentration) and a single experiment (concentration range, 250–4000 µg TOS/
plate; three plates/concentration) were performed with the preincubation method. No toxicity was reported.c In the first experiment, the cells were treated for 6 h ± S9 and were harvested 18 h later. At the highest concentration, the relative population doubling was 99%
without S9 and 38% with S9. In the second experiment, the cells were exposed continuously for 24 h without S9 and then harvested. The relative population doubling was 27% at the highest concentration tested. No increases in chromosomal aberrations were observed without S9 in the first or second experiment. With S9 (first experiment only), a slight increase in the percentage of cells with numerical aberrations was seen at the highest dose tested (4.5% as compared with 0.5% in the controls). No statistical analyses were performed, but this value was below the cut-off values used of 5% for an equivocal result and 10% for a positive result.
52
WH
O F
ood
Addi
tives
Ser
ies N
o. 8
0, 2
022
Safety evaluation of certain food additives Eighty-ninth JECFA
concentration of the food additive in foods and non-milk beverages and the proportion of foods and non-milk beverages that may contain it. The method provides a conservative estimate of dietary exposure. Further details of the budget method can be found in EHC 240, chapter 6 (14).
3.2 Dietary exposure assessmentThe dietary exposure assessment submitted by the sponsor included the intended food uses of lipase from M. javanicus (flour, cheese, egg whites and flavourings of vegetable, animal or microbiological origin) and of lipase from F. heterosporum (bakery products, pasta, noodles, egg yolks and in the degumming of edible oils) that were considered by the Committee at its 80th meeting (Annex 1, reference 82).
The estimate of the TMDI was based on a number of different inputs to the budget method, the first being the proportion of food and non-milk beverages that contain the enzyme preparation. In the budget method calculation, this proportion is assigned according to the extent of its use. EHC 240 (14) provides commonly used default proportions of 12.5% for foods and 25% for non-milk beverages. Food ingredients processed with the lipase preparation from M. javanicus are proposed to be added to a variety of foods intended to be consumed by the general population. Because of the potential broad use of lipase, the sponsor assigned a proportion of both solid foods and non-milk beverages for the budget method calculation of 25%. This proportion for foods is higher than the commonly used default value given in EHC 240 because of the proposed use in flavourings, which the sponsor noted would result in a broader range of foods potentially containing the enzyme preparation.
The sponsor calculated the maximum level of the enzyme present in final foods and non-milk beverages on the basis of the maximum use level of enzyme in the ingredient (use levels ranged from 1.4 to 1357 mg TOS/kg ingredient for solid foods, depending on the food, and from 10 to 1000 mg TOS/kg ingredient for non-milk beverages), and the maximum amount of the ingredient in final foods (2–75% in solid foods, depending on the food; 2% for non-milk beverages). The highest maximum level of lipase from M. javanicus and F. heterosporum from any use in solid foods was selected for the calculations. Only one level of lipase from M. javanicus was noted in non-milk beverages. The maximum levels of the enzyme in the final foods used to calculate the TMDI were 66 mg TOS/kg for solid food and 20 mg TOS/kg for non-milk beverages. The resulting TMDI of lipase (from two sources) was estimated by the sponsor to be 0.83 mg TOS/kg bw per day for solid foods and 0.5 mg TOS/kg bw per day for non-milk beverages, or a total of 1.33 mg TOS/kg bw per day.
53
Lipase from Mucor javanicus
For the current evaluation of lipase from M. javanicus, the Committee considered only exposure to lipase from M. javanicus to be of relevance and assessed dietary exposure only to lipase from M. javanicus. The Committee calculated dietary exposure to the enzyme with the budget method and found a maximum concentration of 27.1 mg TOS/kg from solid foods and 20 mg TOS/kg from non-milk beverages. A proportion of 25% of both solid foods and non-milk beverages was used in the calculation. The resulting TMDI of lipase from M. javanicus as estimated by the Committee was 0.34 mg TOS/kg bw per day for solid foods and 0.5 mg TOS/kg bw per day for non-milk beverages, for a total of 0.84 mg TOS/kg bw per day.
In the dietary exposure assessments conducted by both the sponsor and the Committee, it was assumed that the enzyme is not removed and/or denatured during final processing of ingredients or foods and that 100% of the enzyme remains in the ingredient and final food. In reality, the enzyme is heat-denatured during processing by high temperatures, such that it is inactivated and has no technological effect in the final food.
4. CommentsLipase from M. javanicus was evaluated for potential allergenicity with the bioinformatics criteria recommended by FAO/WHO and modified by the Committee at its 80th meeting (Annex 1, reference 223). The amino acid sequence of lipase from M. javanicus was compared with the amino acid sequences of known allergens in publicly available databases. A search for matches with > 35% identity in a sliding window of 80 amino acids, a search for sequence identity of eight contiguous amino acids and a full-length FASTA sequence search produced no matches. Therefore, the Committee considered that dietary exposure to lipase from M. javanicus is not anticipated to pose a risk of allergenicity.
In a 13-week study of oral toxicity in rats, no treatment-related adverse effects were seen when the liquid lipase concentrate was administered by gavage at doses up to 800 mg TOS/kg bw per day, the highest dose tested. The liquid lipase concentrate was not genotoxic in a bacterial reverse mutation assay or in an in vitro chromosomal aberration assay. The Committee had no concern with respect to the genotoxicity of the lipase preparation.
The Committee evaluated two estimates of dietary exposure, the first submitted by the sponsor based on exposure to two lipase enzymes and one estimated by the Committee. The estimate of dietary exposure calculated by the Committee for lipase from M. javanicus was deemed appropriate for use in the evaluation. The estimate was derived with the budget method and was based on maximum use levels of 27.1 mg TOS/kg for solid foods and 20 mg TOS/kg
54
WH
O F
ood
Addi
tives
Ser
ies N
o. 8
0, 2
022
Safety evaluation of certain food additives Eighty-ninth JECFA
for non-milk beverages and an assumption that 25% of the food supply would contain the enzyme preparation. The theoretical maximum daily intake was estimated to be 0.84 mg TOS/kg bw per day.
5. EvaluationNegative results were obtained in genotoxicity tests, and no treatment-related adverse effects were seen at the highest dose tested (800 mg TOS/kg bw per day) in a 13-week study of oral toxicity in rats. A comparison of the estimated dietary exposure of 0.84 mg TOS/kg bw per day with the highest dose tested of 800 mg TOS/kg bw per day gives an MOE of at least 900. On this basis the Committee established an ADI “not specified”3 for the lipase enzyme preparation from M. javanicus, used in the applications specified and in accordance with good manufacturing practice.
6. References1. FAO, WHO. Report of the Forty-eighth Session of the Codex Committee on Food Additives,
Xián, China, 14–18 March 2016. Rome: Food and Agriculture Organization of the United Nations; 2016 (REP16/FA) (http://www.fao.org/fao-who-codexalimentarius/sh-proxy/en/?lnk=1&url=https%253A%252F%252Fworkspace.fao.org%252Fsites%252Fcodex%252FMeetings%252FCX-711-48%252FReport%252FREP16_FAe.pdf).
2. Bourdichon F, Casaregola S, Farrokh C, Frisvad JC, Gerds ML, Hammes WP, et al. Food fermentations: microorganisms with technological beneficial use. Int J Food Microbiol. 2012;154(3):87–97.
3. Pariza MW, Johnson EA. Evaluating the safety of microbial enzyme preparations used in food processing: update for a new century. Regul Toxicol Pharmacol. 2001;33(2):173–86.
4. Rippon JW. Chapter 23. Aspergillosis. In: Medical mycology, third edition. Philadelphia (PA): WB Saunders Co; 1988:618–50.
5. Ellis DH. Clinical mycology: the human opportunistic mycoses. Underdale: Gillingham; 1994.
6. FAO, WHO. Evaluation of allergenicity of genetically modified foods. Report of a Joint FAO/WHO Expert Consultation on Allergenicity of Foods Derived from Biotechnology, 22–25 January 2001. Rome: Food and Agriculture Organization of the United Nations; 2001 (http://www.who.int/foodsafety/publications/biotech/en/ec_jan2001.pdf).
7. FAO, WHO. Foods derived from modern biotechnology. Annex 1. Assessment of possible allergenicity. Rome: Food and Agriculture Organization of the United Nations; 2009 (http://www.fao.org/docrep/011/a1554e/a1554e00.htm).
8. Okazaki S. 2-week repeated oral dose toxicity study of lipase in rats (preliminary study) [English translation]. Unpublished report (Study No. C-B714) from Gotemba Laboratory, Bozo Research Center Inc., Gotemba, Japan, 2014. Submitted to WHO by Amano Enzyme Inc., Nagoya, Japan.
3 The reader is referred to the footnote on p. 24 for a definition of the term “ADI not specified”.
55
Lipase from Mucor javanicus
9. Okazaki S. A 13-week oral gavage toxicity study of lipase concentrate in rats [English translation]. Unpublished study (No. B-7655) from Gotemba Laboratory, Bozo Research Center Inc., Gotemba-shi, Japan, 2014. Submitted to WHO by Amano Enzyme Inc., Nagoya, Japan.
10. Oguma Y. A bacterial reverse mutation test of triacylglycerol lipase [English translation]. Unpublished report (Study No. T-1725) from Tokyo Laboratory, Bozo Research Center Inc., Tokyo, Japan, 2015. Submitted to WHO by Amano Enzyme Inc., Nagoya, Japan.
11. Fugiwara S. Chromosome aberration test of lipase cong. in cultured Chinese hamster (CHL/IU) cells [English translation]. Unpublished report (Study No. T-G162) from Tokyo Laboratory, Bozo Research Center Inc., Tokyo, Japan, 2015. Submitted to WHO by Amano Enzyme Inc., Nagoya, Japan.
12. Hansen SC. Acceptable daily intake of food additives and ceiling on levels of use. Food Cosmet. Toxicol, 1966;4:427–32.
13. Hansen SC. Conditions for use of food additives based on a budget method for an acceptable daily intake. J Food Protect. 1979;42:429–34.
14. FAO, WHO. Principles and methods for the risk assessment of chemicals in food. Chapter 6. Dietary exposure assessment of chemicals in food. Geneva: World Health Organization; 2009 (https://www.who.int/publications/i/item/principles-and-methods-for-the-risk-assessment-of-chemicals-in-food, accessed September 2020).

56
57
Phosphatidylinositol-specific phospholipase C expressed in Pseudomonas fluorescens
First draft prepared byS.M.F. Jeurissen,1 M. DiNovi,2 T. Hambridge,3 K. Laurvick,4. J. Schlatter5 and J.R. Srinivasan2
1 Department for Food Safety, Centre for Nutrition, Prevention and Health Services, National Institute for Public Health and the Environment, Bilthoven, The Netherlands
2 Office of Food Additive Safety, Center for Food Safety and Applied Nutrition, United States Food and Drug Administration, College Park (MD), USA
3 Food Standards Australia New Zealand, Majura Park, Australian Capital Territory, Australia
4 Food Standards, United States Pharmacopeia, Rockville (MD), USA5 Zurich, Switzerland
1. Explanation 571.1 Genetic background 581.2 Chemical and technical considerations 59
2. Biological data 602.1 Biotransformation 602.2 Assessment of potential allergenicity 602.3 Toxicological studies 61
2.3.1 Acute toxicity 612.3.2 Short-term toxicity 612.3.3 Long-term toxicity and carcinogenicity 632.3.4 Genotoxicity 632.3.5 Reproductive and developmental toxicity 632.3.6 Other studies 64
2.4 Observations in humans 653. Dietary exposure 65
3.1 Introduction 653.2 Dietary exposure assessment 65
4. Comments 665. Evaluation 676. References 68
1. ExplanationAt the request of the CCFA at its Forty-eighth Session (1), the Committee evaluated the safety of phosphatidylinositol-specific phospholipase C (1-phosphatidyl-1D-myo-inositol-4,5-bisphosphate inositol trisphospho-hydrolase, Enzyme Commission No. 3.1.4.11) expressed in Pseudomonas fluorescens. The Committee has not previously evaluated this enzyme preparation. The Committee evaluated
58
WH
O F
ood
Addi
tives
Ser
ies N
o. 8
0, 2
022
Safety evaluation of certain food additives Eighty-ninth JECFA
phospholipase C expressed in Pichia pastoris1 at its 69th meeting and established an ADI “not specified” for its use in refining vegetable oils intended for human consumption (Annex 1, reference 191).
In this monograph, the expression “phosphatidylinositol-specific phospholipase C” (PI-PLC) refers to the PI-PLC enzyme and its amino acid sequence; the expression “liquid enzyme concentrate” refers to the test material used in the toxicity studies evaluated; and the expression “enzyme preparation” refers to the preparation formulated for commercial use.
The Committee at its present meeting considered the submitted data and conducted a literature search in the PubMed database with the linked search terms “phospholipase” and “pseudomonas” and “fluorescens”. This yielded 39 references, but no relevant published studies on biochemical or toxicological aspects were found.
1.1 Genetic backgroundP. fluorescens is a common Gram-negative, aerobic, saprophytic, rod-shaped bacterium, widely distributed in the environment (3). It can be found in soils, water, plants, animals, the hospital environment and human clinical specimens and is a normal inhabitant of the plant rhizosphere or phyllosphere (4). It can grow on a range of organic substrates and can remain viable for long periods in a wide variety of habitats. Strains of Pseudomonas are ubiquitous saprophytes, with low virulence (5). P. fluorescens is a non-pathogenic microorganism with a long history of safe use in food.
The P. fluorescens production strain BD27719 was prepared by transforming the P. fluorescens recipient strain with an expression plasmid carrying a synthetic, codon-optimized modified PI-PLC gene for thermal stability and a pyrF gene selective marker. The donor organism of the parent PI-PLC is unknown; however, the amino acid sequence of the PI-PLC has > 95% similarity to phospholipases from Bacillus species. The P. fluorescens recipient strain was obtained from the parent P. fluorescens MB101 (ATCC PTA-7841) by deletion of the orotidine-5´-phosphate decarboxylase gene (pyrF), followed by introduction of the lacI gene from Escherichia coli K-12 (ATCC 4707). The expression plasmid was transformed to carry the modified PI-PLC gene under regulation of the tac promoter and was transferred into the recipient P. fluorescens strain. The insertion of the modified PI-PLC gene and the absence of antibiotic resistance genes in the P. fluorescens production strain were confirmed by DNA sequence analysis. The stability of the expression plasmid was confirmed by quantitative polymerase chain reaction and restriction digestion. The mobilization potential
1 In 2019, the European Food Safety Agency issued a scientific opinion on phospholipase C, updating the name of the microorganism from Pichia pastoris to Komagataella phaffii (2).
59
Phosphatidylinisotol-specific phospholipase C expressed in Pseudomonas fluorescens
and transferability of the expression plasmid were characterized and confirmed to be poor.
The sponsor submitted three studies with P. fluorescens in mice (6–8). As no viable production organism is expected to be present in the enzyme preparation, these studies were not considered in the evaluation.
1.2 Chemical and technical considerations PI-PLC is produced by controlled submerged aerobic fed-batch fermentation of a pure culture of the P. fluorescens production strain. During fermentation, isopropyl β-D-thiogalactopyranoside (IPTG) is added to induce enzyme production. The enzyme is recovered from the fermentation broth after a heat lysis step and separated from the cell debris by filtration. The supernatant containing the enzyme is filtered, followed by concentration and stabilization. The liquid enzyme concentrate, free of the production strain, is formulated into a liquid enzyme preparation by the addition of glycerol. The entire process is performed in accordance with current good manufacturing practice with raw materials of food-grade quality. The final enzyme preparation is not expected to contain any major food allergens from the fermentation medium. Additionally, IPTG is present in the final enzyme preparation at a maximum level of 400 µg/g of enzyme preparation. The enzyme preparation conforms to the General specifications for enzyme preparations used in food processing (Annex 1, reference 185).
PI-PLC catalyses the hydrolysis of phosphatidylinositol to inositol monophosphate and diacylglycerol. It is intended for use as a processing aid in refining edible vegetable oils containing phospholipids to improve their stability and quality. Phosphatidylinositol negatively affects the taste, colour and stability of vegetable oil, while the hydrolytic products do not. The enzyme can be combined as a liquid preparation with two other phospholipases (phospholipase C from Pichia pastoris and phospholipase A2 from Aspergillus niger) to promote conversion of phospholipids found in crude vegetable oils. The enzyme’s activity is determined spectrophotometrically; the assay allows quantification of the hydrolysis of 4-methylumbelliferyl myo-inositol-1-phosphate substrate by PI-PLC and the liberation of 4-methylumbelliferone at 380 nm after a 5-min reaction. Enzyme activity is expressed in inositol phosphate releasing units; one unit is the quantity of enzyme that liberates 1 µmol of 4-methylumbelliferone from 4-methylumbelliferyl myo-inositol-1-phosphate per minute at pH 7.5 and 37 °C. The mean activity of PI-PLC from three batches of enzyme concentrate was 15 128 inositol phosphate releasing units per gram.
The mean TOS content of the enzyme concentrate is 143 mg/g. The TOS include the enzyme of interest and residues of organic materials, such as proteins, peptides and carbohydrates derived from the production organism
60
WH
O F
ood
Addi
tives
Ser
ies N
o. 8
0, 2
022
Safety evaluation of certain food additives Eighty-ninth JECFA
during the manufacturing process. The enzyme preparation is intended for use as a processing aid at a maximum level of 15 µg TOS per gram of edible vegetable oil. PI-PLC is expected to be removed from the oil during processing, and any remaining enzyme will be inactivated. On the basis of this level, the maximum content of IPTG from the enzyme preparation in processed vegetable oil amounts to 120 µg/kg of oil. IPTG is expected to be removed with the water phase during degumming of vegetable oil.
2. Biological data
2.1 BiotransformationThe sponsor submitted the results of studies on the digestibility of PI-PLC (batch 27719-PL030B) under simulated gastric and intestinal conditions (9). Simulated gastric fluid was prepared by dissolving 1.0 g of NaCl and 3.2 g of pepsin in 500 mL water, adjusted to pH 1.2 with HCl. Simulated intestinal fluid was prepared by dissolving 3.4 g KH2PO4 and 0.625 g pancreatin in 500 mL water, adjusted to pH 11 with NaOH. Tubes containing 1.52 mL of simulated gastric or intestinal fluid were preheated for 5 min at 37 °C before addition of 0.08 mL of enzyme solution (protein content ~7 and ~20 mg/mL, respectively). The resulting protein concentration in the incubations was 0.35 and 1 mg/mL. The tubes were immediately vortexed and placed back in the water bath at 37 °C. Samples of 200 µL were taken 15, 30 and 60 min after initiation of the incubation. Each 200-µL sample was quenched by the addition of 200 µL of 200 mM NaHCO3, pH 11, and subsequently heated for 5 min at 95 °C. Samples were stored frozen until analysis. The protein band intensity was assessed on SDS-PAGE. The enzyme PI-PLC was fully degraded in simulated gastric fluid within 15 min at 37 °C, with no degradation products visible on the gel. Degradation also occurred in simulated intestinal fluid, but the degradation products were still visible on the gel after 60 min of incubation. These results indicate that PI-PLC can be expected to be fully degraded in the gastrointestinal tract in vivo.
2.2 Assessment of potential allergenicityPI-PLC from a genetically modified strain of P. fluorescens consists of 298 amino acids, and its molecular weight is approximately 34 kDa. It was evaluated for potential allergenicity by the bioinformatics criteria recommended by FAO/WHO (10, 11) modified at the eightieth meeting of the Committee (Annex 1, reference 223). A search for homology was conducted, in which the amino acid sequence of the enzyme was compared with those of known allergens in the
61
Phosphatidylinisotol-specific phospholipase C expressed in Pseudomonas fluorescens
AllergenOnline database (http://www.allergenonline.org/databasefasta.shtml; version 19, February 2019). A search for matches with > 35% identity in a sliding window of 80 amino acids and a search for exact matches in an eight-amino acid window produced no matches. Additionally, a full-length FASTA sequence search was conducted; no matches with an E-value2 < 0.01 were found. No sequences were considered homologous with known allergens. Therefore, the Committee considered that dietary exposure to PI-PLC from a genetically modified strain of P. fluorescens would not pose a risk of allergenicity. This consideration supported by the finding from the in vitro study of digestibility that the enzyme can be expected to be fully degraded in the gastrointestinal tract.
2.3 Toxicological studiesThe toxicological studies summarized below were performed with a PI-PLC enzyme concentrate with batch no. Pi-PLC-27719-PL030B, a dry matter content of 97.0% by weight, a TOS content of 93.53% by weight, omitting stabilization and standardization based on the revised Certificate of Analysis for this batch issued on 11 July 2013. In the original Certificate of Analysis, a dry matter content of 95.71% by weight and a TOS content of 91.92% were reported. The concentrations reported in this monograph are corrected for the revised TOS content.
2.3.1 Acute toxicityNo information was available.
2.3.2 Short-term toxicityRatsA dose range-finding study was performed in which groups of six male and six female Wistar rats were given PI-PLC liquid enzyme concentrate at a dose of 0, 468, 935 or 1871 mg TOS/kg bw per day by oral gavage for 14 days (12). The study was certified for compliance with good laboratory practice and quality assurance. Rats were observed for deaths, clinical signs, physical abnormalities, body weight and feed consumption. Blood samples were collected for haematological and clinical chemistry at study termination. All rats were necropsied, and 13 organs were weighted. The stomach and gross lesions from all rats were examined by histopathology.
No treatment-related deaths or clinical signs were observed. Body weight and feed consumption were not affected. At the highest dose, a small but statistically significant increase (+4%) in mean platelet volume was
2 Comparisons between highly homologous proteins yield expectation values (E-values) approaching zero, indicating a very low probability that such matches would occur by chance. A larger E-value indicates a smaller degree of similarity.
62
WH
O F
ood
Addi
tives
Ser
ies N
o. 8
0, 2
022
Safety evaluation of certain food additives Eighty-ninth JECFA
observed in males and females. As this change was small, it was considered not to be of toxicological relevance. Clinical chemistry revealed a dose-related increase in globulin concentrations in males and females and a decrease in the albumin:globulin ratio, which reached statistical significance only in males at the highest dose (–20%). In males at the middle and high doses, statistically significant decreases in calcium concentration (–8% and –10%, respectively) were observed. No related clinical effects were seen, and, as these findings were not observed in the subsequent 90-day study (see below), they were considered not to be of toxicological relevance. At necropsy, a hepatodiaphragmatic nodule was observed in the liver of one female at the highest dose, but no abnormalities were observed in the liver upon microscopic observation.
In the subsequent 90-day study, groups of 10 male and 10 female 7–8-week old Wistar rats were given PI-PLC liquid enzyme concentrate at a dose of 0, 468, 935 or 1871 mg TOS/kg bw per day orally by gavage for 13 weeks (13). The study was certified for compliance with good laboratory practice and quality assurance and was performed according to OECD test guideline 408 (repeated dose 90-day oral toxicity study in rodents, 1998). The observations included clinical signs, body weight, feed consumption, ophthalmoscopy, a functional observation battery, haematology, clinical chemistry, urinalysis, and macroscopic and microscopic pathology (the latter only in control and high-dose animals and gross lesions).
No treatment-related effects were observed on deaths, clinical signs, ophthalmoscopy, urinalysis or feed intake. Statistically significantly lower net weight gain was observed in males at the middle dose at week 5 and in those at the high dose in week 3 and 11. In females, statistically significantly lower net weight gain was observed at the middle and high doses in week 3 and in those at the high dose at week 7. Statistically significantly higher net weight gain was observed in females at the middle dose in week 11. No statistically significant changes were observed in mean body weights in any group. As the effects on body weight gain were small, transient and not dose-related, they were considered not to be related to treatment. Statistically significantly lower forelimb grip strength values were observed in males at the middle dose (–6%), and lower hind limb grip strength values were observed in females at all doses tested (–12% in those at the low and middle doses and –18% in those at the high dose) when compared with controls. In the absence of a dose–response relationship and of any associated changes in related parameters, this was considered an incidental finding.
Several statistically significant changes were observed in haematological and coagulation parameters. The changes were small, observed only in animals at the low or middle dose and/or showed no dose–response relationship; therefore, they were considered to be unrelated to treatment. The only statistically significant change in clinical chemistry values was an increase (+21%) in alanine
63
Phosphatidylinisotol-specific phospholipase C expressed in Pseudomonas fluorescens
transaminase activity in females at the high dose; however, as the increase was small and there were no related histopathological findings, the effect was considered not to be adverse. In contrast to the range-finding study, no effects were observed on globulin concentrations, the albumin:globulin ratio or calcium concentration. An increase in heart weight relative to body weight was noted in males at the middle dose (+6%), whereas a decrease in absolute heart weight was observed in males at the high dose (–10%). Males at the middle dose also had an increased testis weight relative to brain weight (+7%). These changes in organ weights were considered not to be of toxicological relevance, as they were not correlated with histopathological findings.
Macroscopic examination revealed some incidental findings that were also considered not to be related to treatment. These included a small seminal vesicle with coagulating glands in one male rat in the control group, alopecia in one female at the low dose and one male at the middle dose, kidney pelvis dilatation in one male at the middle dose and uterus dilatation in one control female and one female at the low dose. Dilatation of the pelvis and uterus were confirmed microscopically. The latter was considered to be a physiological change related to the oestrus cycle. Histopathological findings in the lungs included alveolar macrophages in two females and two males at the high dose and in one control female, osseous metaplasia in two males at the high dose and two control females, and mineralization of blood vessels in three females and seven males at the high dose group and two females and three males in the control group. The microscopic findings in the lungs were considered incidental findings.
In the absence of adverse effects, the Committee identified an NOAEL of 1871 mg/kg bw per day, the highest dose tested.
2.3.3 Long-term toxicity and carcinogenicityNo information was available.
2.3.4 Genotoxicity The results of two studies of genotoxicity in vitro with the PI-PLC liquid enzyme concentrate are summarized in Table 1. The studies were performed according to OECD test guideline 471 (bacterial reverse mutation test, 1997) and OECD test guideline 473 (in vitro mammalian chromosome aberration test, 1997), respectively. The Committee concluded that the PI-PLC enzyme preparation is unlikely to be genotoxic.
2.3.5 Reproductive and developmental toxicityNo information was available.
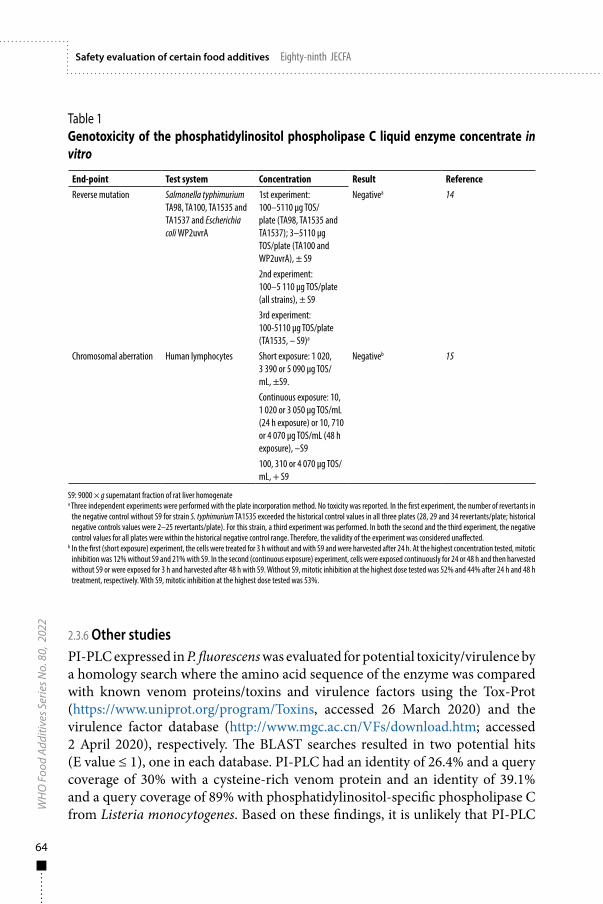
64
WH
O F
ood
Addi
tives
Ser
ies N
o. 8
0, 2
022
Safety evaluation of certain food additives Eighty-ninth JECFA
2.3.6 Other studiesPI-PLC expressed in P. fluorescens was evaluated for potential toxicity/virulence by a homology search where the amino acid sequence of the enzyme was compared with known venom proteins/toxins and virulence factors using the Tox-Prot (https://www.uniprot.org/program/Toxins, accessed 26 March 2020) and the virulence factor database (http://www.mgc.ac.cn/VFs/download.htm; accessed 2 April 2020), respectively. The BLAST searches resulted in two potential hits (E value ≤ 1), one in each database. PI-PLC had an identity of 26.4% and a query coverage of 30% with a cysteine-rich venom protein and an identity of 39.1% and a query coverage of 89% with phosphatidylinositol-specific phospholipase C from Listeria monocytogenes. Based on these findings, it is unlikely that PI-PLC
Table 1Genotoxicity of the phosphatidylinositol phospholipase C liquid enzyme concentrate in vitro
End-point Test system Concentration Result ReferenceReverse mutation Salmonella typhimurium
TA98, TA100, TA1535 and TA1537 and Escherichia coli WP2uvrA
1st experiment: 100–5110 µg TOS/plate (TA98, TA1535 and TA1537); 3–5110 µg TOS/plate (TA100 and WP2uvrA), ± S9
Negativea 14
2nd experiment: 100–5 110 µg TOS/plate (all strains), ± S93rd experiment: 100-5110 µg TOS/plate (TA1535, – S9)a
Chromosomal aberration Human lymphocytes Short exposure: 1 020, 3 390 or 5 090 µg TOS/mL, ±S9.
Negativeb 15
Continuous exposure: 10, 1 020 or 3 050 µg TOS/mL (24 h exposure) or 10, 710 or 4 070 µg TOS/mL (48 h exposure), –S9100, 310 or 4 070 µg TOS/mL, + S9
S9: 9000 × g supernatant fraction of rat liver homogenate a Three independent experiments were performed with the plate incorporation method. No toxicity was reported. In the first experiment, the number of revertants in
the negative control without S9 for strain S. typhimurium TA1535 exceeded the historical control values in all three plates (28, 29 and 34 revertants/plate; historical negative controls values were 2–25 revertants/plate). For this strain, a third experiment was performed. In both the second and the third experiment, the negative control values for all plates were within the historical negative control range. Therefore, the validity of the experiment was considered unaffected.
b In the first (short exposure) experiment, the cells were treated for 3 h without and with S9 and were harvested after 24 h. At the highest concentration tested, mitotic inhibition was 12% without S9 and 21% with S9. In the second (continuous exposure) experiment, cells were exposed continuously for 24 or 48 h and then harvested without S9 or were exposed for 3 h and harvested after 48 h with S9. Without S9, mitotic inhibition at the highest dose tested was 52% and 44% after 24 h and 48 h treatment, respectively. With S9, mitotic inhibition at the highest dose tested was 53%.
65
Phosphatidylinisotol-specific phospholipase C expressed in Pseudomonas fluorescens
is structurally related to any of the validated toxins or virulence factors that are currently present in these databases. The Committee noted the limited value of these data for the safety evaluation of an enzyme preparation.
2.4 Observations in humansNo information was available.
3. Dietary exposure
3.1 IntroductionThe Committee evaluated one submission on dietary exposure to PI-PLC from a genetically modified strain of P. fluorescens provided by the sponsor. As PI-PLC is intended for use as a processing aid in refining edible vegetable oils, this use formed the basis of the dietary exposure assessment.
Dietary exposure to food additives is commonly estimated by the budget method (16–18); however, no estimate of the TMDI with this method was submitted to the Committee. The Committee did not undertake an estimate of dietary exposure with the budget method as a more refined estimate was available for review.
Dietary exposure to IPTG was also considered by the Committee.
3.2 Dietary exposure assessmentThe dietary exposure assessment provided by the sponsor for PI-PLC was based on per capita consumption of all vegetable oils in five regional diets (19). The consumption data were based on food balance sheets or food available for consumption. Consumption of “total vegetable oils and fats” in each region were 40.7 g/person per day in the Middle Eastern diet, 14.2 g/person per day in the Far Eastern diet, 23.2 g/person per day in the African diet, 21.9 g/person per day in the Latin American diet and 38.8 g/person per day in the European diet. The highest of the five consumptions was used by the sponsor to assess “worst case” dietary exposure, combined with a concentration of 0.015 mg TOS/g oil or fat. This resulted in an estimated dietary exposure of 0.01 mg TOS/kg bw per day based on a 60-kg body weight.
The Committee estimated dietary exposure to PI-PLC using the more recent GEMS/Food cluster diets (20), which provide per capita consumption based on food balance sheets in 17 international diets. The level 2 food group, “plant origin fat”, was used in the calculation. The lowest and highest consumption values in the 17 diets were selected to provide a range of estimated dietary
66
WH
O F
ood
Addi
tives
Ser
ies N
o. 8
0, 2
022
Safety evaluation of certain food additives Eighty-ninth JECFA
exposures. The lowest consumption was 10.7 g/person per day in cluster G14 countries, which include Comoros, Sri Lanka and Pacific Ocean countries, and the highest was 59.7 g/person per day in cluster G10 countries, which include some countries categorized as being in Asia (e.g. Japan, Russian Federation), some in Europe (e.g. Italy), New Zealand and countries in North America. With the same concentration of 0.015 mg TOS/g oil or fat, the estimated dietary exposures were 0.003–0.01 mg TOS/kg bw per day for a 60-kg body weight.
It was assumed for the purpose of the dietary exposure assessment that all the enzyme is retained in the final refined vegetable oil. The enzyme is added to the oils in a water-in-oil emulsion. After degumming, the water phase containing the enzyme is removed from the oil, and further refining is expected to remove any remaining enzyme residues; thus, the enzyme has no function in the final food. Denatured, inactive enzyme may be present, if at all, in the refined oil below the limit of detection of the analytical method. Therefore, no or negligible dietary exposure is expected.
Estimated dietary exposure to IPTG was also considered by the Committee. The estimate was based on the concentration of IPTG of 120 μg/kg and the highest reported per capita consumption of “plant origin fat” of 59.7 g/person per day from the GEMS/Food cluster diets (20). Dietary exposure to IPTG was estimated to be 7.2 μg/day. IPTG is expected to be removed with the water phase during degumming of vegetable oil. Even if it is assumed that the concentration of IPTG in vegetable oil is 120 μg/kg, dietary exposure would be at least 10 times lower than the threshold of toxicological concern of 90 μg/day for IPTG (Cramer class III; according to ToxTree version 3.1.0.1851, there were no structural alerts for genotoxicity). The Committee noted that dietary exposure to IPTG used in the manufacture of the enzyme would not be a safety concern.
4. CommentsOn the basis of in vitro digestibility studies with simulated gastric fluid and simulated intestinal fluid, it can be expected that the enzyme is fully degraded in the gastrointestinal tract.
PI-PLC from a genetically modified strain of P. fluorescens was evaluated for allergenicity by the bioinformatics criteria recommended by FAO/WHO, modified by the Committee at its 80th meeting (Annex 1, reference 223). The amino acid sequence of the enzyme was compared with the amino acid sequences of known allergens in a publicly available database. A search for matches with > 35% identity in a sliding window of 80 amino acids, a search for sequence identity of eight contiguous amino acids and a full-length FASTA sequence search produced no matches. Therefore, the Committee considered that dietary
67
Phosphatidylinisotol-specific phospholipase C expressed in Pseudomonas fluorescens
exposure to PI-PLC from a genetically modified strain of P. fluorescens would not pose a risk of allergenicity. This consideration is further supported by the finding in the in vitro digestibility study that the enzyme is fully degraded in the gastrointestinal tract.
In a 13-week study of oral toxicity in rats, no treatment-related adverse effects were seen when the PI-PLC liquid enzyme concentrate was administered by gavage at doses up to 1871 mg TOS/kg bw per day, the highest dose tested. The PI-PLC enzyme concentrate was not genotoxic in a bacterial reverse mutation assay or in an in vitro chromosomal aberration assay. The Committee had no concern with respect to the genotoxicity of the PI-PLC enzyme preparation.
Two estimates of dietary exposure were available, one from the sponsor and the other calculated by the Committee. Both estimates were based on per capita consumption data (derived from food balance sheets) for plant-based (vegetable) oils in regional and in cluster diets, respectively. The maximum use level of 0.015 mg TOS/g fat or oil was used in the calculations. The estimated dietary exposures to IP-PLC ranged from 0.003 to 0.01 mg TOS/kg bw per day. The Committee noted that the enzyme would be removed during processing of the oil and that any remaining enzyme would become denatured and inactive; therefore, no or negligible dietary exposure to the enzyme would be expected from the final food. In addition, the Committee noted that dietary exposure to IPTG used in the manufacturing process of the enzyme would not be a safety concern.3
5. EvaluationNegative results were obtained in genotoxicity tests, and no treatment-related adverse effects were seen with PI-PLC enzyme concentrate at the highest dose tested (1871 mg TOS/kg bw per day) in the 13-week study of oral toxicity in rats. A comparison of the highest estimated dietary exposure of 0.01 mg TOS/kg bw per day with the highest dose tested of 1871 mg TOS/kg bw per day gives an MOE of at least 187 100. On this basis, the Committee established an ADI “not specified”4 for the PI-PLC enzyme preparation expressed in P. fluorescens, used in the applications specified and in accordance with good manufacturing practice.
3 Even if it is assumed that the concentration in vegetable oil is 120 µg/kg, the dietary exposure would be at least 10 times lower than the threshold of toxicological concern of 90 µg/day for IPTG (Cramer class III; according to ToxTree version 3.1.0.1851, there were no structural alerts for genotoxicity). This exposure estimate is based on the highest reported per capita consumption of “plant origin fat” of 59.7 g/person per day from the GEMS/Food cluster diets.
4 The reader is referred to the footnote on p. 24 for definition of an ADI “not specified”.
68
WH
O F
ood
Addi
tives
Ser
ies N
o. 8
0, 2
022
Safety evaluation of certain food additives Eighty-ninth JECFA
6. References1. FAO, WHO. Report of the Forty-eighth Session of the Codex Committee on Food Additives,
Xián, China, 14–18 March 2016. Rome: Food and Agriculture Organization of the United Nations; 2016 (REP16/FA; http://www.fao.org/fao-who-codexalimentarius/sh-proxy/en/?lnk=1&url=https%253A%252F%252Fworkspace.fao.org%252Fsites%252Fcodex%252FMeetings%252FCX-711-48%252FReport%252FREP16_FAe.pdf).
2. CEP Panel. Scientific opinion on the safety evaluation of the food enzyme phospholipase C from a genetically modified Komagataella phaffii (strain PRF). EFSA J. 2019;17(4):5682.
3. Bradbury JF. Guide to plant pathogenic bacteria. Kew (Surrey): CAB International Mycological Institute; 1986.
4. Consensus document on information used in the assessment of environmental applications Involving Pseudomonas (Series on Harmonization of Regulatory Oversight in Biotechnology No. 6). Paris: Organization for Economic Co-operation and Development; 1997 (http://www.oecd.org/officialdocuments/publicdisplaydocumentpdf/?cote=OCDE/GD(97)22&docLanguage=En).
5. Palleroni N. Human and animal pathogenic Pseudomonas. In: Balows A, Truper HG, Dworkin M, Harder W, Schleifer KH, editors. The prokarytoes, Vol. III, 2nd edition. Berlin: Springer-Verlag;1992:3086–103.
6. George SE, Nelson GM, Kohan MJ, Brooks LR, Boyd C. Colonization and clearance of environmental microbial agents upon intranasal exposure of strain C3H/HeJ mice. J Toxicol Environ Health A. 1999;56(6):419–31.
7. George SE, Nelson GM, Boyd C, Kohan MJ, Brooks LR. Survival of environmental microbial agents in CD-1 mice following oral exposure. Microbiol Ecol Health Dis. 2000;12(2):92–8.
8. Landry TD, Chew L, Davis JW, Frawley N, Foley HH, Stelman SJ, et al. Safety evaluation of an α-amylase enzyme preparation derived from the archaeal order Thermococcales as expressed in Pseudomonas fluorescens biovar I. Regul Toxicol Pharmacol. 2003;37(1):149–68.
9. De Bruine A, Farres-Mendez M, Den Hartog J. Digestibility of PI-PLC under simulated gastric and intestinal conditions. Unpublished report, 2019. Submitted to WHO by DSM Food Specialties, Delft, The Netherlands.
10. FAO, WHO. Evaluation of allergenicity of genetically modified foods. Report of a Joint FAO/WHO Expert Consultation on Allergenicity of Foods Derived from Biotechnology, 22–25 January 2001. Rome: Food and Agriculture Organization of the United Nations; 2001 (http://www.who.int/foodsafety/publications/biotech/en/ec_jan2001.pdf).
11. FAO, WHO. Foods derived from modern biotechnology. Annex 1. Assessment of possible allergenicity. Rome: Food and Agriculture Organization of the United Nations; 2009 (http://www.fao.org/docrep/011/a1554e/a1554e00.htm).
12. Sathish PM. Repeated dose (14-day) oral toxicity study by gavage with enzyme preparation of Pseudomonas fluorescens containing Pi-PLC activity in Wistar rats. Unpublished study (number G8546) from Advinus Therapeutics Ltd, Bangalore, India, 2013. Submitted to WHO by DSM Food Specialties, Delft, The Netherlands.
13. Sathish PM. Repeated dose (90-day) oral toxicity study by gavage with enzyme preparation of Pseudomonas fluorescens containing Pi-PLC activity in Wistar rats. Unpublished study (number G8635)
69
Phosphatidylinisotol-specific phospholipase C expressed in Pseudomonas fluorescens
from Advinus Therapeutics Ltd, Bangalore, India, 2013. Submitted to WHO by DSM Food Specialties, Delft, The Netherlands.
14. Verspeek-Rip CM. Evaluation of mutagenic activity of enzyme preparation of Pseudomonas fluorescens containing Pi-PLC activity in the Salmonella typhimurium reverse mutation assay and the Escherichia coli reverse mutation assay (with independent repeat). Unpublished report (project number 502549) from WIL Research Europe BV, ‘s-Hertogenbosch, The Netherlands, 2013. Submitted to WHO by DSM Food Specialties, Delft, The Netherlands.
15. Buskens CAF. Evaluation of the ability of enzyme preparation of Pseudomonas fluorescens containing Pi-PLC activity to induce chromosome aberrations in cultured peripheral human lymphocytes (with repeat experiment). Unpublished report (project number 502550) from WIL Research Europe BV, ‘s-Hertogenbosch, The Netherlands, 2013. Submitted to WHO by DSM Food Specialties, Delft, The Netherlands.
16. Hansen SC. Acceptable daily intake of food additives and ceiling on levels of use. Food Cosmet Toxicol. 1966;4:427–32.
17. Hansen SC. Conditions for use of food additives based on a budget method for an acceptable daily intake. J Food Protect. 1979;42:429–34.
18. Principles and methods for the risk assessment of chemicals in food. Chapter 6. Dietary exposure assessment of chemicals in food. Geneva: World Health Organization; 2009 (https://www.who.int/publications/i/item/principles-and-methods-for-the-risk-assessment-of-chemicals-in-food).
19. Global Environmental Monitoring System/Food Contamination Monitoring and Assessment Programme. GEMS/Food regional diets: regional per capita consumption of raw and semi-processed agricultural commodities. Geneva: World Health Organization; 2003 (https://apps.who.int/iris/handle/10665/42833).
20. Global Environmental Monitoring System/Food Contamination Monitoring and Assessment Programme. GEMS/Food cluster diets 2012 [online database]. Geneva: World Health Organization; 2012 (https://www.who.int/foodsafety/databases/en).

70
71
SAFETY EVALUATION OF GROUPS OF RELATED FLAVOURING AGENTS

72
73
Amino acids and related substances (addendum)First draft prepared by Szabina Stice,1 Jack Bend,2 Michael DiNovi,1 Maria Beatriz de AbreuGloria3 and Daniel Folmer1
1 Office of Food Additive Safety, Center for Food Safety and Applied Nutrition, Food and Drug Administration, College Park (MD), USA
2 Department of Pathology and Laboratory Medicine, Schulich School of Medicine and Dentistry, Western University, London, Ontario, Canada
3 Department of Agro Food Technology, Universidad Miguel Hernández, Elche, Spain
1. Evaluation 731.1 Introduction 731.2 Assessment of dietary exposure 741.3 Absorption, distribution, metabolism and elimination 741.4 Application of the revised procedure for the safety evaluation of
flavouring agents 781.5 Consideration of combined intakes from use as flavouring agents 791.6 Consideration of additional data on previously evaluated
flavouring agents 801.7 Conclusion 80
2. Relevant background information 802.1 Explanation 802.2 Additional considerations on exposure 812.3 Biological data 81
2.3.1 Biochemical data: hydrolysis, absorption, distribution, metabolism andexcretion 81
2.3.2 Toxicological studies 843. References 144
1. Evaluation
1.1 IntroductionThe Committee evaluated an additional six flavouring agents in the group of amino acids and related substances for the first time. In addition, the Committee considered new data for 20 previously evaluated flavouring agents in this group and data on L-cystine, a structurally related substance.
The Committee previously evaluated 20 members of this group of flavouring agents at its sixty-third meeting (Annex 1, reference 173) and six members of the group at its seventy-sixth meeting (Annex 1, reference 211). The
74
WH
O F
ood
Addi
tives
Ser
ies N
o. 8
0, 2
022
Safety evaluation of certain food additives Eighty-ninth JECFA
Committee concluded that none of the 26 flavouring agents was of safety concern at the estimated dietary exposures.
The additional flavouring agents in this group are betaine (No. 2265), N-acetyl-glutamate (No. 2269), L-cysteine methyl ester hydrochloride (No. 2270), two dipeptides, glutamyl-2-aminobutyric acid and glutamyl-norvaline (Nos 2266 and 2268) and one tripeptide, glutamyl-norvalyl-glycine (No. 2267). Three of the flavouring agents in this group (Nos 2266–2268) are reported to be flavour modifiers. Betaine (No. 2265) has been reported to occur naturally in sugar beet molasses, wheat, mushrooms, seafood and red and white wines (1–5).
The Committee noted at its sixty-third meeting (Annex 1, reference 173) that amino acids may react with other food constituents upon heating. The mixtures formed are commonly referred to as “process flavours”. The safety of process flavours has not been reviewed by the Committee. The safety evaluation of the flavouring agents in this group of amino acids and related substances is therefore conducted on the basis that these flavouring agents are present in an unchanged form at the time of consumption.
The six additional members of this group were evaluated according to the Revised Procedure for the Safety Evaluation of Flavouring Agents (Annex 1, reference 230).
1.2 Assessment of dietary exposureThe total annual volume of production of the six additional flavouring agents in the group of amino acids and related substances is 420 kg in Latin America and 11 000 kg in the USA (6, 7). More than 99% of the annual production volume in the USA and 62% in Latin America is accounted for by betaine (No. 2265).
Dietary exposures were estimated with both the single portion exposure technique (SPET) and the maximized survey-derived intake (MSDI) method; the higher of the two values for each flavouring agent is reported in Table 1. The values with the SPET and MSDI method ranged from 1800 to 300 000 μg/day and 0.01 to 1142 μg/day, respectively. The estimated daily dietary exposure was highest for betaine (No. 2265) (300 000 μg/day, SPET value for non-alcoholic soft beverages).
Annual volumes of production of this group of flavouring agents and the daily dietary exposures calculated with both the MSDI method and SPET are summarized in Table 2.
1.3 Absorption, distribution, metabolism and elimination Information on the absorption, distribution, metabolism and elimination of the flavouring agents in the group of amino acids and related substances is provided in monographs from the sixty-third and seventy-sixth meetings (Annex 1,
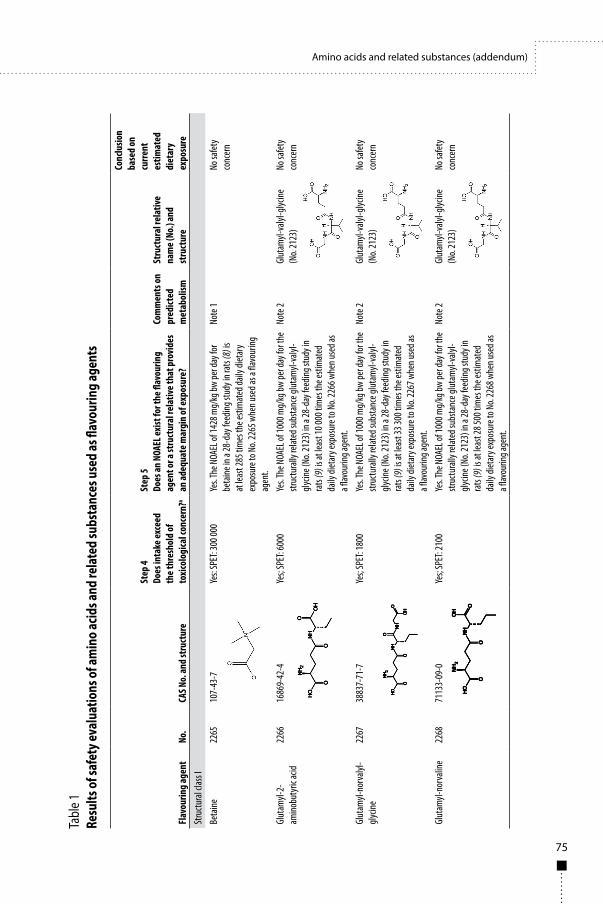
75
Amino acids and related substances (addendum)
Flav
ourin
g ag
ent
No.
CAS N
o. an
d st
ruct
ure
Step
4Do
es in
take
exce
ed
the t
hres
hold
of
toxi
colo
gica
l con
cern
?a
Step
5Do
es an
NOA
EL ex
ist fo
r the
flav
ourin
g ag
ent o
r a st
ruct
ural
rela
tive t
hat p
rovi
des
an ad
equa
te m
argi
n of
expo
sure
?
Com
men
ts on
pr
edict
edm
etab
olism
Stru
ctur
al re
lativ
e na
me (
No.)
and
stru
ctur
e
Conc
lusio
n ba
sed
on
curre
nt
estim
ated
di
etar
y ex
posu
reSt
ructu
ral c
lass I
Beta
ine22
6510
7-43
-7Ye
s: SP
ET: 3
00 00
0Ye
s. The
NOA
EL of
1428
mg/
kg bw
per d
ay fo
r be
taine
in a
28-d
ay fe
eding
stud
y in r
ats (
8) is
at
leas
t 285
tim
es th
e esti
mat
ed da
ily di
etar
y ex
posu
re to
No.
2265
whe
n use
d as a
flavo
uring
ag
ent.
Note
1No
safet
y co
ncer
n
Glut
amyl-
2-am
inobu
tyric
acid
2266
1686
9-42
-4Ye
s; SP
ET: 6
000
Yes. T
he N
OAEL
of 10
00 m
g/kg
bw pe
r day
for t
he
struc
tura
lly re
lated
subs
tanc
e glut
amyl-
valyl
-gly
cine (
No. 2
123)
in a
28-d
ay fe
eding
stud
y in
rats
(9) i
s at l
east
10 00
0 tim
es th
e esti
mat
ed
daily
diet
ary e
xpos
ure t
o No.
2266
whe
n use
d as
a flav
ourin
g age
nt.
Note
2Gl
utam
yl-va
lyl-g
lycine
(N
o. 21
23)
No sa
fety
conc
ern
Glut
amyl-
norv
alyl-
glycin
e22
6738
837-
71-7
Yes;
SPET
: 180
0Ye
s. The
NOA
EL of
1000
mg/
kg bw
per d
ay fo
r the
str
uctu
rally
relat
ed su
bsta
nce g
lutam
yl-va
lyl-
glycin
e (No
. 212
3) in
a 28
-day
feed
ing st
udy i
n ra
ts (9
) is a
t lea
st 33
300 t
imes
the e
stim
ated
da
ily di
etar
y exp
osur
e to N
o. 22
67 w
hen u
sed a
s a fl
avou
ring a
gent
.
Note
2Gl
utam
yl-va
lyl-g
lycine
(N
o. 21
23)
No sa
fety
conc
ern
Glut
amyl-
norv
aline
2268
7113
3-09
-0Ye
s; SP
ET: 2
100
Yes. T
he N
OAEL
of 10
00 m
g/kg
bw pe
r day
for t
he
struc
tura
lly re
lated
subs
tanc
e glut
amyl-
valyl
-gly
cine (
No. 2
123)
in a
28-d
ay fe
eding
stud
y in
rats
(9) i
s at l
east
28 50
0 tim
es th
e esti
mat
ed
daily
diet
ary e
xpos
ure t
o No.
2268
whe
n use
d as
a flav
ourin
g age
nt.
Note
2Gl
utam
yl-va
lyl-g
lycine
(N
o. 21
23)
No sa
fety
conc
ern
Tabl
e 1Re
sults
of s
afet
y eva
luat
ions
of a
min
o ac
ids a
nd re
late
d su
bsta
nces
use
d as
flav
ourin
g ag
ents
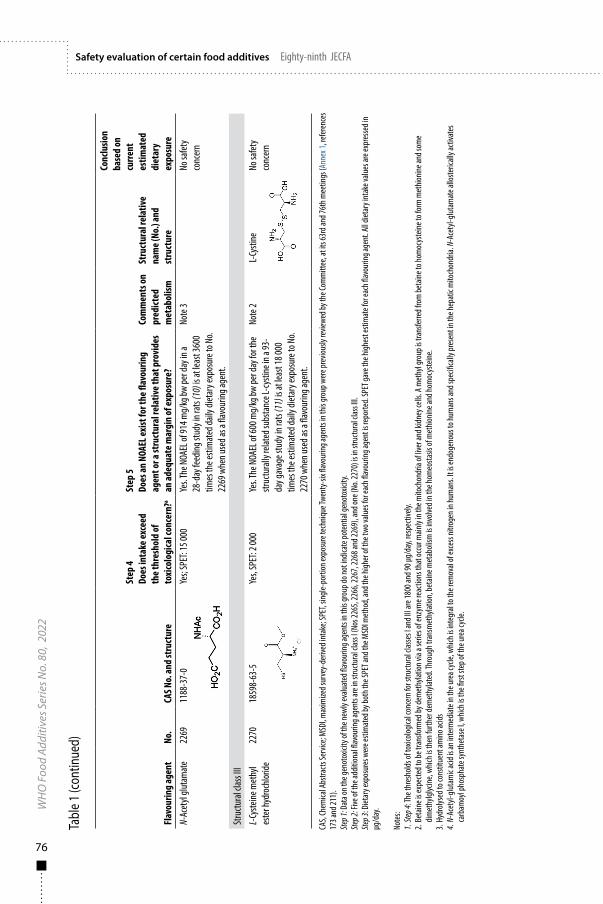
76
WH
O F
ood
Addi
tives
Ser
ies N
o. 8
0, 2
022
Safety evaluation of certain food additives Eighty-ninth JECFA
Flav
ourin
g ag
ent
No.
CAS N
o. an
d st
ruct
ure
Step
4Do
es in
take
exce
ed
the t
hres
hold
of
toxi
colo
gica
l con
cern
?a
Step
5Do
es an
NOA
EL ex
ist fo
r the
flav
ourin
g ag
ent o
r a st
ruct
ural
rela
tive t
hat p
rovi
des
an ad
equa
te m
argi
n of
expo
sure
?
Com
men
ts on
pr
edict
edm
etab
olism
Stru
ctur
al re
lativ
e na
me (
No.)
and
stru
ctur
e
Conc
lusio
n ba
sed
on
curre
nt
estim
ated
di
etar
y ex
posu
reN-
Acet
yl glu
tam
ate
2269
1188
-37-
0Ye
s; SP
ET: 1
5 000
Yes. T
he N
OAEL
of 91
4 mg/
kg bw
per d
ay in
a 28
-day
feed
ing st
udy i
n rat
s (10
) is a
t lea
st 36
00
times
the e
stim
ated
daily
diet
ary e
xpos
ure t
o No.
2269
whe
n use
d as a
flavo
uring
agen
t.
Note
3No
safet
y co
ncer
n
Stru
ctura
l clas
s III
L-Cy
steine
met
hyl
este
r hyd
roch
loride
2270
1859
8-63
-5Ye
s, SP
ET: 2
000
Yes. T
he N
OAEL
of 60
0 mg/
kg bw
per d
ay fo
r the
str
uctu
rally
relat
ed su
bsta
nce L
-cys
tine i
n a 93
-da
y gav
age s
tudy
in ra
ts (1
1) is
at le
ast 1
8 000
tim
es th
e esti
mat
ed da
ily di
etar
y exp
osur
e to N
o. 22
70 w
hen u
sed a
s a fla
vour
ing ag
ent.
Note
2 L-
Cysti
neNo
safet
y co
ncer
n
CAS,
Chem
ical A
bstra
cts Se
rvice
; MSD
I, max
imize
d sur
vey-
deriv
ed in
take
; SPE
T, sin
gle-p
ortio
n exp
osur
e tec
hniqu
e Twe
nty-
six fla
vour
ing ag
ents
in th
is gr
oup w
ere p
revio
usly
revie
wed b
y the
Com
mitt
ee, a
t its
63rd
and 7
6th m
eetin
gs (A
nnex
1, re
feren
ces
173 a
nd 21
1).
Step 1
: Dat
a on t
he ge
noto
xicity
of th
e new
ly ev
aluat
ed fla
vour
ing ag
ents
in th
is gr
oup d
o not
indic
ate p
oten
tial g
enot
oxici
ty.Ste
p 2: F
ive of
the a
dditi
onal
flavo
uring
agen
ts ar
e in s
tructu
ral c
lass I
(Nos
2265
, 226
6, 22
67, 2
268 a
nd 22
69),
and o
ne (N
o. 22
70) i
s in s
tructu
ral c
lass I
II.Ste
p 3: D
ietar
y exp
osur
es w
ere e
stim
ated
by bo
th th
e SPE
T and
the M
SDI m
etho
d, an
d the
high
er of
the t
wo va
lues f
or ea
ch fla
vour
ing ag
ent i
s rep
orte
d. SP
ET ga
ve th
e high
est e
stim
ate f
or ea
ch fla
vour
ing ag
ent.
All d
ietar
y int
ake v
alues
are e
xpre
ssed i
n μg
/day
.
Note
s:1.
Step 4
: The
thre
shold
s of t
oxico
logica
l con
cern
for s
tructu
ral c
lasse
s I an
d III a
re 18
00 an
d 90 μ
g/da
y, re
spec
tively
.2.
Beta
ine is
expe
cted t
o be t
rans
form
ed by
dem
ethy
lation
via a
serie
s of e
nzym
e rea
ction
s tha
t occ
ur m
ainly
in th
e mito
chon
dria
of liv
er an
d kidn
ey ce
lls. A
met
hyl g
roup
is tr
ansfe
rred f
rom
beta
ine to
hom
ocys
teine
to fo
rm m
ethio
nine a
nd so
me
dimet
hylgl
ycine
, whic
h is t
hen f
urth
er de
met
hylat
ed. T
hrou
gh tr
ansm
ethy
lation
, bet
aine m
etab
olism
is in
volve
d in t
he ho
meo
stasis
of m
ethio
nine a
nd ho
moc
yste
ine.
3. Hy
droly
sed t
o con
stitu
ent a
mino
acids
4. N-
Acet
yl-glu
tam
ic ac
id is
an in
term
ediat
e in t
he ur
ea cy
cle, w
hich i
s int
egra
l to t
he re
mov
al of
exce
ss nit
roge
n in h
uman
s. It
is en
doge
nous
to hu
man
s and
spec
ifica
lly pr
esen
t in t
he he
patic
mito
chon
dria.
N-A
cety
l-glut
amat
e allo
steric
ally a
ctiva
tes
carb
amoy
l pho
spha
te sy
nthe
tase
I, wh
ich is
the fi
rst st
ep of
the u
rea c
ycle.
Tabl
e 1 (c
ontin
ued)
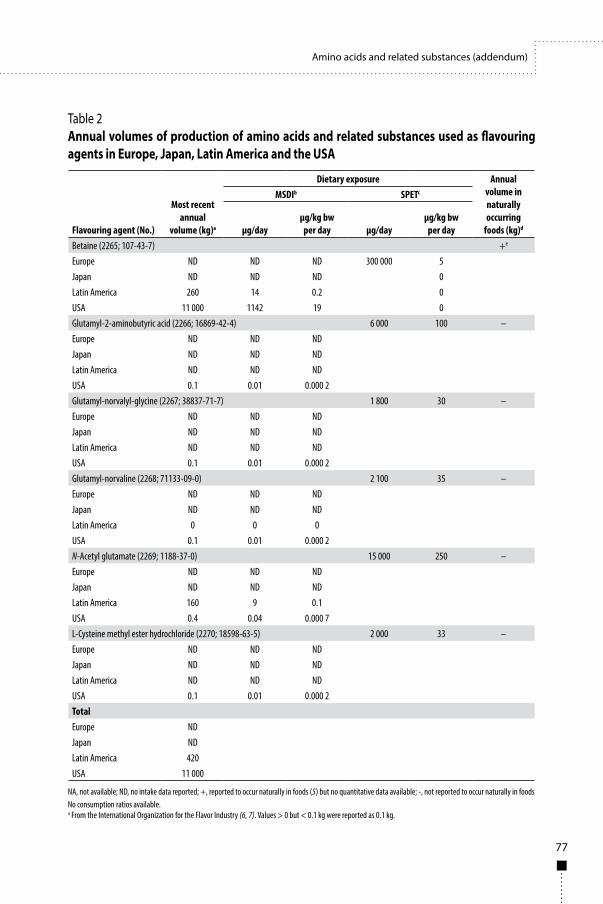
77
Amino acids and related substances (addendum)
Table 2Annual volumes of production of amino acids and related substances used as flavouring agents in Europe, Japan, Latin America and the USA
Flavouring agent (No.)
Most recent annual
volume (kg)a
Dietary exposure Annual volume in naturally occurring
foods (kg)d
MSDIb SPETc
μg/dayμg/kg bw
per day μg/dayμg/kg bw
per dayBetaine (2265; 107-43-7) +e
Europe ND ND ND 300 000 5Japan ND ND ND 0Latin America 260 14 0.2 0USA 11 000 1142 19 0Glutamyl-2-aminobutyric acid (2266; 16869-42-4) 6 000 100 –Europe ND ND NDJapan ND ND NDLatin America ND ND NDUSA 0.1 0.01 0.000 2Glutamyl-norvalyl-glycine (2267; 38837-71-7) 1 800 30 –Europe ND ND NDJapan ND ND NDLatin America ND ND NDUSA 0.1 0.01 0.000 2Glutamyl-norvaline (2268; 71133-09-0) 2 100 35 –Europe ND ND NDJapan ND ND NDLatin America 0 0 0USA 0.1 0.01 0.000 2N-Acetyl glutamate (2269; 1188-37-0) 15 000 250 –Europe ND ND NDJapan ND ND NDLatin America 160 9 0.1USA 0.4 0.04 0.000 7L-Cysteine methyl ester hydrochloride (2270; 18598-63-5) 2 000 33 –Europe ND ND NDJapan ND ND NDLatin America ND ND NDUSA 0.1 0.01 0.000 2TotalEurope NDJapan NDLatin America 420USA 11 000
NA, not available; ND, no intake data reported; +, reported to occur naturally in foods (5) but no quantitative data available; -, not reported to occur naturally in foodsNo consumption ratios available.a From the International Organization for the Flavor Industry (6, 7). Values > 0 but < 0.1 kg were reported as 0.1 kg.
78
WH
O F
ood
Addi
tives
Ser
ies N
o. 8
0, 2
022
Safety evaluation of certain food additives Eighty-ninth JECFA
references 174 and 212). Additional information on three new flavouring agents (Nos 2266, 2267 and 2268) evaluated at this meeting and additional studies on a previously reviewed material (No. 1435) have become available.
The “amino acids and related substances” used as flavouring agents include amino acids, modified L-amino acids that are endogenous (e.g. N-acetylglutamate, No. 2269) or exogenous (e.g. L-cysteine methyl ester hydrochloride, No. 2270) and dipeptides (e.g. glutamyl-norvaline, No. 2268) and tripeptides (e.g. glutamyl-norvalyl-glycine, No. 2267). The most frequent initial metabolic reaction of modified amino acids is hydrolysis to generate the parent amino acid(s), which usually occurs in either the stomach or the small intestine. Amino acids are absorbed readily through the intestinal mucosa and distributed via the blood; their entry into mammalian cells is facilitated by multiple amino acid transport systems. D-Amino acid stereoisomers and those L-amino acids that are not required for protein synthesis undergo catabolism, primarily in the liver. Amino acids are not stored in the liver in humans but are catabolized by oxidative deamination, in which they are deaminated to yield α-ketoacids, which are either completely oxidized to CO2 and water or provide three or four carbon units that are converted via gluconeogenesis to glucose or undergo ketogenesis to yield ketone bodies.
1.4 Application of the revised procedure for the safety evaluation of flavouring agentsStep 1. There are no structural alerts for genotoxicity for the additional six flavouring agents (Nos 2265–2270) in this group. Chemical-specific genotoxicity data on previously evaluated flavouring agents in this group and on the newly added agents do not indicate any genotoxic potential.
Step 2. In applying the revised procedure for the safety evaluation of flavouring agents to the additional six flavouring agents, the Committee assigned five agents (Nos 2265–2269) to structural class I and one (No. 2270) to structural class III (16).
Table 2 (continued)b Intake (μg/person per day) calculated as follows:
[[(annual volume, kg) x (1 x 10⁹ μg/kg)]/[population x survey correction factor x 365 days]], where population (10%, “eaters only”) = 45 x 106 for Europe, 13 x 106 for Japan, 62 x 106 for Latin America and 33 x 106 for the USA, with correction factor = 0.8 from IOFI Global Poundage Survey and the IOFI Interim Poundage and Use Levels Survey only 80% of the annual flavour volume, respectively, was reported in the poundage surveys (6, 7).Intake (μg/kg bw per day) calculated as follows:[(μg/person per day)/body weight], where body weight = 60 kg. Slight variations are due to rounding.
c SPET (μg/person per day) calculated as follows:(USFDA standard food portion, g/day) x (highest usual use level) (6)[(μg/person per day)/body weight], where body weight = 60 kg. Slight variations are due to rounding.
d Quantitative data for the USA reported by Stofberg & Grundschober (12)e References 1–5
79
Amino acids and related substances (addendum)
Step 3. Dietary exposures were estimated with both the MSDI method and the SPET and are presented in Table 2.
Step 4. The highest estimated dietary exposures to the five flavouring agents in structural class I are above the threshold of toxicological concern for the class (i.e. 1800 μg/person per day). The highest estimated dietary exposure to the one flavouring agent in structural class III is above the threshold of toxicological concern for the class (i.e. 90 μg/person per day). Evaluation of these flavouring agents therefore proceeded to Step 5.
Step 5. For betaine (No. 2256), the NOAEL of 1428 mg/kg bw per day in a 28-day dietary study in male and female rats (8) provides an adequate MOE (285) relative to the SPET estimate of 300 000 μg/day.
For glutamyl-2-aminobutryic acid (No. 2266), the NOAEL of 1000 mg/kg bw per day in a 28-day dietary study in male and female rats for the structurally related substance glutamyl-valyl-glycine (No. 2123) (9) provides an adequate MOE (10 000) in relation to the SPET estimate of 6000 μg/day. This NOAEL is appropriate for the structurally related flavouring agents glutamyl-norvalyl-glycine (No. 2267) and glutamyl-norvaline (No. 2268), as they are di- and tripeptide derivatives and are expected to follow the same metabolic pathways, and provides MOEs of 33 300 for glutamyl-norvalyl-glycine (No. 2267) and 28 500 for glutamyl-norvaline (No. 2268) relative to their SPET estimates of 1800 and 2100 μg/day, respectively.
For N-acetyl-glutamate (No. 2269), the NOAEL of 914 mg/kg bw per day in a 28-day dietary study in rats (10) provides an adequate MOE (3600) relative to its SPET estimate of 15 000 μg/day.
For L-cysteine methyl ester hydrochloride (No. 2270), the NOAEL of 600 mg/kg bw per day for the structurally related substance L-cystine in a 93-day gavage study in rats (11) provides an adequate MOE (18 000) relative to its SPET estimate of 2000 μg/day.
Table 1 summarizes the evaluations of the six flavouring agents in the group of amino acids and related substances that were considered at the present meeting (Nos 2265, 2266, 2267, 2268, 2269 and 2270).
1.5 Consideration of combined intakes from use as flavouring agentsThe Committee previously considered the potential combined intake of this group of amino acids and related substances and identified no safety concern. Five of the additional flavouring agents in this group (Nos 2266, 2267, 2268, 2269 and 2270) have low MSDI values (0.01–0.04 μg/day) and would therefore make a negligible contribution to the combined intake of this group. Exposure to betaine (No. 2265) from its use as a flavouring agent, 1142 μg/day, is not significant in
80
WH
O F
ood
Addi
tives
Ser
ies N
o. 8
0, 2
022
Safety evaluation of certain food additives Eighty-ninth JECFA
comparison with its intake from other dietary sources; for example, 100 g of spinach contains > 600 mg betaine (5).
1.6 Consideration of additional data on previously evaluated flavouring agentsThe Committee considered additional data on 20 of the 26 previously evaluated flavouring agents in this group. Studies of absorption, distribution, metabolism and elimination (No. 1435), of short-term toxicity (Nos 1419–1424, 1426, 1428–1430, 1434, 1435, 1437–1439, 2119, 2120 and 2123), long-term toxicity (Nos 1420 and 1422), reproductive and developmental toxicity (Nos 1420, 1422, 1424, and 1435) and genotoxicity (Nos 1420, 1421, 1424, 1427–1431, 1434, 1438, 2120 and 2123) were available. The results support the conclusions of the previous evaluations.
1.7 ConclusionStudies of absorption, distribution, metabolism and elimination, acute toxicity, short-term and long-term toxicity and genotoxicity were available for the 26 substances in this group of amino acids and related substances evaluated previously (Annex 1, reference 174 and 212). None raised safety concerns. Studies of absorption, distribution, metabolism and elimination (Nos 2266–2268), short-term toxicity (Nos 2265 and 2269) and genotoxicity (Nos 2265 and 2269) were available for the six additional flavouring agents, and a short-term toxicity study was available on L-cystine, a structurally related substance.
At its present meeting, the Committee concluded that the six additional flavouring agents (Nos 2265–2270) would not give rise to safety concerns at the current estimated dietary exposures.
The Committee also concluded that the additional data presented in this addendum do not give rise to safety concerns and further support the safety of the 26 previously evaluated flavours in this group.
2. Relevant background information
2.1 ExplanationThis addendum summarizes the key data relevant to the safety evaluation of a group of amino acids and related substances used as flavouring agents (Table 1), none of which has been evaluated previously. Twenty other flavouring agents in this group were evaluated at the sixty-third meeting and six at the seventy-sixth meeting (Annex 1, references 173 and 211).
81
Amino acids and related substances (addendum)
2.2 Additional considerations on exposureAnnual volumes of production and dietary exposures estimated both as the MSDI and with use of SPET for each flavouring agent are reported in Table 2.
2.3 Biological data2.3.1 Biochemical data: hydrolysis, absorption, distribution, metabolism and excretionSeveral studies on the absorption, distribution, metabolism and elimination of amino acids were described in the previous monograph and addendum (Annex 1, references 174 and 212). Studies on three new flavouring agents evaluated at this meeting and additional studies on a previously reviewed agent (No. 1435) are described below.
(a) γ-Glutamyl-2-aminobutyric acid (No. 2266)γ-Glutamyl-2-aminobutyric acid (No. 2266) is readily hydrolysed to the corresponding amino acids, as demonstrated in a microsomal fraction of human small intestinal mucosa (14). The starting concentration of the material in the reaction mixture was 10 ppm (43.1 µM) or 40 ppm (172.2 µM), and hydrolysis was monitored at 0 (compound only), 15, 30, 60 and 180 min by high-performance liquid chromatography with tandem mass spectrometry (LC/MS/MS). When the starting concentration was 10 ppm, approximately 29% remained in the microsomal fraction after 15 min, 8% after 30 min and below the limit of quantification (LOQ) of the parent compound after 60 min. When the starting concentration was 40 ppm, approximately 41%, 1.5% and below the LOQ remained in the microsomal fraction after 15 min, 60 min and 180 min, respectively. The concentrations of glutamic acid and α-aminobutyric acid, the hydrolysis products of γ-glutamyl-2-aminobutyric acid, increased in a time-dependent manner during incubation.
Two studies were performed on the hydrolysis of γ-glutamyl-2-aminobutyric acid at 10 ppm or 40 ppm in simulated gastric and intestinal fluids (14). γ-Glutamyl-2-aminobutyric acid was hydrolysed to a much lesser extent in gastric fluid than in intestinal mucosa homogenate. In simulated intestinal fluid, the proportion of unchanged γ-glutamyl-2-aminobutyric acid was 50% after 4 h and 27% after 8-h reaction of 10 ppm starting concentration and 61% after 4 h and 41% after 8-h reaction of 40 ppm.
(b) γ-Glutamyl-L-norvaline (No. 2268)γ-Glutamyl-L-norvaline (No. 2268) was hydrolysed to the corresponding free amino acids after incubation with a human small intestinal mucosa homogenate
82
WH
O F
ood
Addi
tives
Ser
ies N
o. 8
0, 2
022
Safety evaluation of certain food additives Eighty-ninth JECFA
(15). The starting concentration of the compound was 5 ppm (20.3 µM) or 20 ppm (81.2 µM), and hydrolysis was monitored at 0 (compound only), 30, 60, 120 and 240 min by LC/MS/MS. At a starting concentration of 5 ppm, 17%, 4% and below the LOQ of the compound remained in the reaction mixture after 60 min, 120 min and 240 min, respectively. At a starting concentration of 20 ppm, approximately 25%, 7% and 0.4% of γ-glutamyl-L-norvaline remained in the reaction mixture after 60 min, 120 min and 240 min, respectively. The concentrations of free glutamic acid and L-norvaline, the expected hydrolysis products, increased during incubation in a time-dependent manner.
Two further studies were performed on the hydrolysis of γ-glutamyl-L-norvaline in simulated gastric and intestinal fluids (15). The compound was not readily hydrolysed in simulated gastric fluid, while the proportions of γ-glutamyl-L-norvaline that remained detectable after incubation in simulated intestinal fluid was 37% after 4 h and 13% after 8 h at a 5-ppm starting concentration and 48% after 4 h and 22% after 8 h at a 20-ppm starting concentration. These results indicate that orally ingested γ-glutamyl-L-norvaline is readily hydrolysed in the gastrointestinal tract to its corresponding amino acids.
(c) γ-Glutamyl-L-norvalyl-glycine (No. 2267)γ-Glutamyl-L-norvalyl-glycine (No. 2267) was hydrolysed to the corresponding amino acids when incubated with a homogenate of human small intestinal mucosa (16). The compound was incubated at a starting concentration of 5 ppm (16.5 µM) or 20 ppm (66 µM), and the concentrations of the parent compound and its hydrolysis products (γ-glutamyl-L-norvalyl-glycine, γ-glutamyl-norvaline and norvalyl-glycine) were monitored at 0 (compound only), 15, 30, 60 and 120 min by LC/MS/MS. At a concentration of 5 ppm, approximately 3.5% and below the LOQ of γ-glutamyl-L-norvalyl-glycine remained in the reaction mixture after 15 min and 30 min, respectively. At a starting concentration of 20 ppm, approximately 26%, 6% and below the LOQ of the compound remained in the reaction mixture after 15 min, 30 min and 60 min, respectively. The concentrations of the hydrolysis products norvalyl-glycine, glutamic acid, L-norvaline and glycine increased in a time-dependent manner during the reaction.
In a separate study, hydrolysis of γ-glutamyl-L-norvalyl-glycine (No. 2267) to the corresponding amino acids was monitored after incubation with a microsomal fraction of human small intestinal mucosa at a concentration of 5 ppm (16.5 µM) or 20 ppm (66 µM) (16). The concentrations of γ-glutamyl-L-norvalyl-glycine, γ-glutamyl-norvaline and norvalyl-glycine were monitored at 0 (compound), 5, 10, 30 and 60 min by LC/MS/MS. At a starting concentration of 5 ppm, approximately 1% of the parent compound remained detectable after 5 min; the amount remaining after 10 min was below the LOQ. At a starting
83
Amino acids and related substances (addendum)
concentration of 20 ppm, approximately 23% remained detectable after 5 min and 3% after 10 min; the amount was below the LOQ after 30 min. The amounts of γ-glutamyl-norvaline, norvalyl-glycine, glutamic acid, L-norvaline and glycine formed by hydrolysis of γ-glutamyl-L-norvalyl-glycine increased with time during the reaction.
Two separate studies were conducted of the hydrolysis of γ-glutamyl-L-norvalyl-glycine in simulated gastric and small intestinal fluid (16). The compound was not readily hydrolysed in simulated gastric fluid. In simulated intestinal fluid, the proportion of γ-glutamyl-L-norvalyl-glycine that remained detectable in the reaction mix was 15% after both 4 h and 8 h at 5 ppm and 16% after 4 h and 5% after 8 h at 20 ppm. Detectable levels of γ-glutamyl-norvaline and norvalyl-glycine were formed by hydrolysis. These results indicate that orally ingested γ-glutamyl-L-norvalyl-glycine is readily hydrolysed in the gastrointestinal tract.
(d) Taurine (No. 1435)To determine the metabolic fate of taurine (No. 1435), groups of 12 male and 12 female Sprague-Dawley rats were given a single oral dose of 30 or 300 mg/kg bw of [1,2-14C]-taurine (purity 99.1%) or unlabelled taurine (purity 99.9%) in three studies (17). In the first study, groups of three Sprague-Dawley rats of each sex were killed 1, 4, 24 and 168 h (7 days) after a single administration of 14C-taurine by oral gavage of 30 or 300 mg/kg bw. Blood and numerous tissue samples were collected from each animal. Urine was collected at 0–6-, 6–12- and 12–24-h intervals and then once daily up to 168 h after dosing. Faeces were collected at 0–12 h, 12–24 h and then once daily up to 168 h after dosing. 14C-Taurine was rapidly absorbed, distributed and excreted unchanged, primarily in the urine, within the first 6 h, accounting for 36% and 48% in males and females, respectively, of the low dose and 58% and 67%, respectively, of the high dose. Approximately 90% of 14C-taurine was accounted for in male and female rats at both doses, suggesting rapid uptake and equilibration with endogenous taurine pools. Distribution to the liver, adrenals, bone, pituitary, kidney, lung, pancreas, skin, spleen, thymus and thyroid peaked by 24 h and had decreased by 168 h, while heart, brain, eyes, fat and muscle showed slower increases during the first 24 h and little decrease by 168 h. The half-life in plasma was 107 h in males and 96 h in females, respectively, at the low dose and 130 h and 65 h, respectively, at the high dose, while the ratio between the area under the curve with the low and high dose indicated non-linear kinetics (< 10 times difference).
In a study to investigate possible enzyme induction, groups of 18 rats of each sex were given 30 or 300 mg/kg bw per day of unlabelled taurine (purity 99%) for 14 days, followed by a single oral dose of 14C-taurine at 30 or 300 mg/kg bw (17). Blood was collected from three rats of each sex 1, 4, 24, 168,
84
WH
O F
ood
Addi
tives
Ser
ies N
o. 8
0, 2
022
Safety evaluation of certain food additives Eighty-ninth JECFA
196 and 672 h after administration of 14C-taurine. Elimination of taurine in urine accounted for 46% and 51% in males and females, respectively, of the low dose and 78% and 72%, respectively, of the high dose. No taurine metabolites were detected in the urine in either study. Recovery of 14C-taurine was 88–100% of the administered dose. The half-life in plasma in the 24–168 h period was similar to that in the first study (78 h and 74 h in males and females, respectively, at the low dose and 63 h and 82 h, respectively, at the high dose); however, higher half-lives were estimated from data for the period 168–672 h (240 h and 479 h in males and females, respectively, at the low dose and 302 h and 225 h, respectively, at the high dose). Therefore, daily pretreatment with unlabelled taurine for 2 weeks did not significantly affect the metabolic fate of 14C-taurine. As in the first study, significantly higher urinary excretion and lower tissue retention of 14C-taurine were observed at the higher than the lower dose, indicating saturation of renal tubular reabsorption.
In a study of the concentrations of taurine in tissues, groups of nine rats of each sex were given 30 or 300 mg/kg bw per day of unlabelled taurine, and three animals of each sex per group were killed 1, 7 and 14 days after administration (17). Blood, brain, heart, kidney, liver and skeletal muscle samples were collected from three controls of each sex per group and from all test animals. The tissue concentrations were similar in control and treated animals, regardless of dose, except that higher levels of taurine were found in the kidney and plasma, even after repeated doses. The taurine concentration increased in the livers of males and females and in the muscle of male rats after repeated dosing. Although slower decreases in 14C-taurine levels in brain tissue were seen in the first and second studies, the levels did not show a trend towards accumulation with repeated doses in the third study. These results suggest that exogenous taurine is rapidly absorbed in the gastrointestinal tract, distributed to tissues and excreted unchanged in the urine.
The pharmacokinetics of taurine (No. 1435) was studied after oral administration of 4 g of taurine to eight healthy male volunteers with a median body weight of 79.5 kg (18). After administration, the maximum serum taurine concentration was 86.1 mg/L on average and was reached 1.5 h after ingestion. Taurine had a short plasma half-life, with a mean of 1.0 h, and rapid clearance, with a mean ratio of clearance to bioavailability of 21.1 L/h.
2.3.2 Toxicological studiesInformation related to short-term (Nos 1419–1424, 1426, 1428–1430, 1434, 1435, 1437–1439, 2119, 2120 and 2123) and long-term toxicity (Nos 1420 and 1422) and to reproductive and developmental toxicity (Nos 1420, 1422, 1424 and 1435) and genotoxicity (Nos 1420, 1421, 1424, 1427-1431, 1434, 1438, 2120
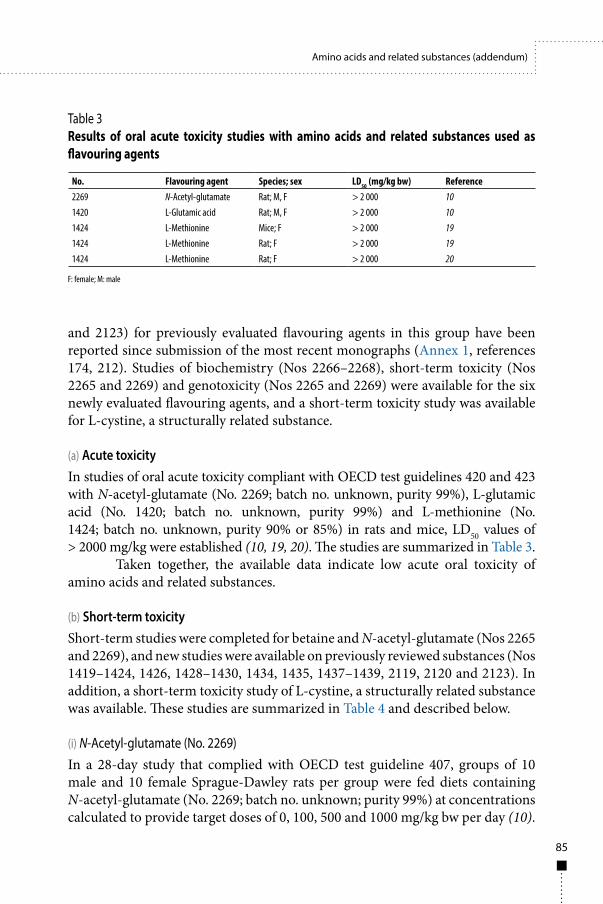
85
Amino acids and related substances (addendum)
and 2123) for previously evaluated flavouring agents in this group have been reported since submission of the most recent monographs (Annex 1, references 174, 212). Studies of biochemistry (Nos 2266–2268), short-term toxicity (Nos 2265 and 2269) and genotoxicity (Nos 2265 and 2269) were available for the six newly evaluated flavouring agents, and a short-term toxicity study was available for L-cystine, a structurally related substance.
(a) Acute toxicityIn studies of oral acute toxicity compliant with OECD test guidelines 420 and 423 with N-acetyl-glutamate (No. 2269; batch no. unknown, purity 99%), L-glutamic acid (No. 1420; batch no. unknown, purity 99%) and L-methionine (No. 1424; batch no. unknown, purity 90% or 85%) in rats and mice, LD50 values of > 2000 mg/kg were established (10, 19, 20). The studies are summarized in Table 3.
Taken together, the available data indicate low acute oral toxicity of amino acids and related substances.
(b) Short-term toxicityShort-term studies were completed for betaine and N-acetyl-glutamate (Nos 2265 and 2269), and new studies were available on previously reviewed substances (Nos 1419–1424, 1426, 1428–1430, 1434, 1435, 1437–1439, 2119, 2120 and 2123). In addition, a short-term toxicity study of L-cystine, a structurally related substance was available. These studies are summarized in Table 4 and described below.
(i) N-Acetyl-glutamate (No. 2269)In a 28-day study that complied with OECD test guideline 407, groups of 10 male and 10 female Sprague-Dawley rats per group were fed diets containing N-acetyl-glutamate (No. 2269; batch no. unknown; purity 99%) at concentrations calculated to provide target doses of 0, 100, 500 and 1000 mg/kg bw per day (10).
No. Flavouring agent Species; sex LD50 (mg/kg bw) Reference2269 N-Acetyl-glutamate Rat; M, F > 2 000 101420 L-Glutamic acid Rat; M, F > 2 000 101424 L-Methionine Mice; F > 2 000 191424 L-Methionine Rat; F > 2 000 191424 L-Methionine Rat; F > 2 000 20
Table 3Results of oral acute toxicity studies with amino acids and related substances used as flavouring agents
F: female; M: male
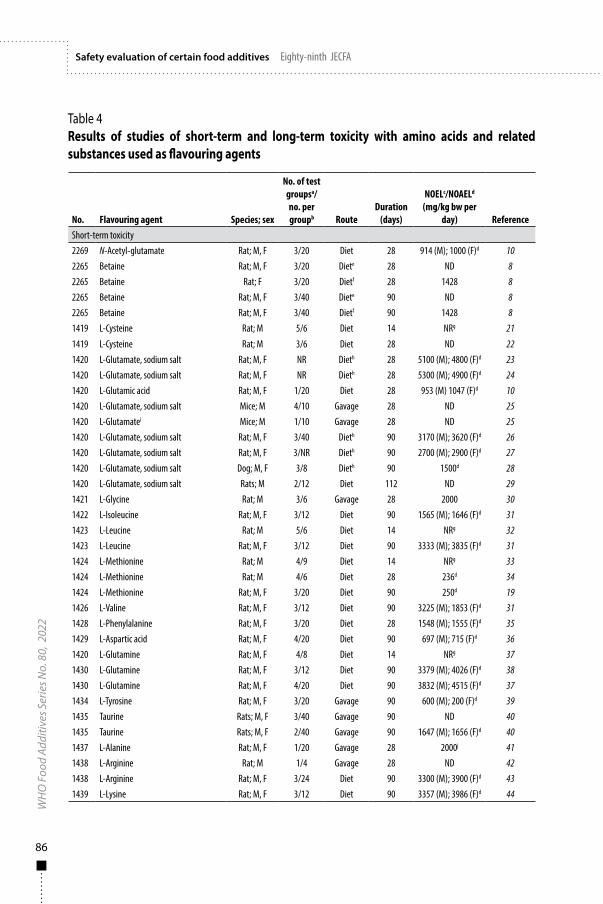
86
WH
O F
ood
Addi
tives
Ser
ies N
o. 8
0, 2
022
Safety evaluation of certain food additives Eighty-ninth JECFA
Table 4Results of studies of short-term and long-term toxicity with amino acids and related substances used as flavouring agents
No. Flavouring agent Species; sex
No. of test groupsa/no. per groupb Route
Duration (days)
NOELc/NOAELd (mg/kg bw per
day) ReferenceShort-term toxicity2269 N-Acetyl-glutamate Rat; M, F 3/20 Diet 28 914 (M); 1000 (F)d 102265 Betaine Rat; M, F 3/20 Diete 28 ND 82265 Betaine Rat; F 3/20 Dietf 28 1428 82265 Betaine Rat; M, F 3/40 Diete 90 ND 82265 Betaine Rat; M, F 3/40 Dietf 90 1428 81419 L-Cysteine Rat; M 5/6 Diet 14 NRg 21
1419 L-Cysteine Rat; M 3/6 Diet 28 ND 221420 L-Glutamate, sodium salt Rat; M, F NR Dieth 28 5100 (M); 4800 (F)d 231420 L-Glutamate, sodium salt Rat; M, F NR Dieth 28 5300 (M); 4900 (F)d 241420 L-Glutamic acid Rat; M, F 1/20 Diet 28 953 (M) 1047 (F)d 101420 L-Glutamate, sodium salt Mice; M 4/10 Gavage 28 ND 251420 L-Glutamatei Mice; M 1/10 Gavage 28 ND 251420 L-Glutamate, sodium salt Rat; M, F 3/40 Dieth 90 3170 (M); 3620 (F)d 261420 L-Glutamate, sodium salt Rat; M, F 3/NR Dieth 90 2700 (M); 2900 (F)d 271420 L-Glutamate, sodium salt Dog; M, F 3/8 Dieth 90 1500d 281420 L-Glutamate, sodium salt Rats; M 2/12 Diet 112 ND 291421 L-Glycine Rat; M 3/6 Gavage 28 2000 301422 L-Isoleucine Rat; M, F 3/12 Diet 90 1565 (M); 1646 (F)d 311423 L-Leucine Rat; M 5/6 Diet 14 NRg 321423 L-Leucine Rat; M, F 3/12 Diet 90 3333 (M); 3835 (F)d 311424 L-Methionine Rat; M 4/9 Diet 14 NRg 331424 L-Methionine Rat; M 4/6 Diet 28 236d 341424 L-Methionine Rat; M, F 3/20 Diet 90 250d 191426 L-Valine Rat; M, F 3/12 Diet 90 3225 (M); 1853 (F)d 311428 L-Phenylalanine Rat; M, F 3/20 Diet 28 1548 (M); 1555 (F)d 351429 L-Aspartic acid Rat; M, F 4/20 Diet 90 697 (M); 715 (F)d 361420 L-Glutamine Rat; M, F 4/8 Diet 14 NRg 371430 L-Glutamine Rat; M, F 3/12 Diet 90 3379 (M); 4026 (F)d 381430 L-Glutamine Rat; M, F 4/20 Diet 90 3832 (M); 4515 (F)d 371434 L-Tyrosine Rat; M, F 3/20 Gavage 90 600 (M); 200 (F)d 391435 Taurine Rats; M, F 3/40 Gavage 90 ND 401435 Taurine Rats; M, F 2/40 Gavage 90 1647 (M); 1656 (F)d 401437 L-Alanine Rat; M, F 1/20 Gavage 28 2000j 411438 L-Arginine Rat; M 1/4 Gavage 28 ND 421438 L-Arginine Rat; M, F 3/24 Diet 90 3300 (M); 3900 (F)d 431439 L-Lysine Rat; M, F 3/12 Diet 90 3357 (M); 3986 (F)d 44
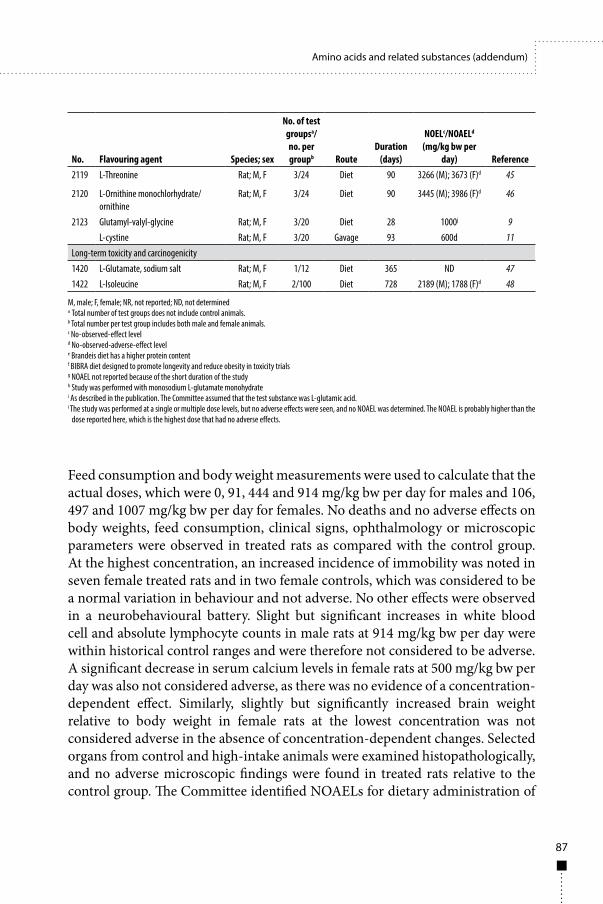
87
Amino acids and related substances (addendum)
Feed consumption and body weight measurements were used to calculate that the actual doses, which were 0, 91, 444 and 914 mg/kg bw per day for males and 106, 497 and 1007 mg/kg bw per day for females. No deaths and no adverse effects on body weights, feed consumption, clinical signs, ophthalmology or microscopic parameters were observed in treated rats as compared with the control group. At the highest concentration, an increased incidence of immobility was noted in seven female treated rats and in two female controls, which was considered to be a normal variation in behaviour and not adverse. No other effects were observed in a neurobehavioural battery. Slight but significant increases in white blood cell and absolute lymphocyte counts in male rats at 914 mg/kg bw per day were within historical control ranges and were therefore not considered to be adverse. A significant decrease in serum calcium levels in female rats at 500 mg/kg bw per day was also not considered adverse, as there was no evidence of a concentration-dependent effect. Similarly, slightly but significantly increased brain weight relative to body weight in female rats at the lowest concentration was not considered adverse in the absence of concentration-dependent changes. Selected organs from control and high-intake animals were examined histopathologically, and no adverse microscopic findings were found in treated rats relative to the control group. The Committee identified NOAELs for dietary administration of
No. Flavouring agent Species; sex
No. of test groupsa/no. per groupb Route
Duration (days)
NOELc/NOAELd (mg/kg bw per
day) Reference2119 L-Threonine Rat; M, F 3/24 Diet 90 3266 (M); 3673 (F)d 45
2120 L-Ornithine monochlorhydrate/ornithine
Rat; M, F 3/24 Diet 90 3445 (M); 3986 (F)d 46
2123 Glutamyl-valyl-glycine Rat; M, F 3/20 Diet 28 1000j 9L-cystine Rat; M, F 3/20 Gavage 93 600d 11
Long-term toxicity and carcinogenicity1420 L-Glutamate, sodium salt Rat; M, F 1/12 Diet 365 ND 471422 L-Isoleucine Rat; M, F 2/100 Diet 728 2189 (M); 1788 (F)d 48
M, male; F, female; NR, not reported; ND, not determineda Total number of test groups does not include control animals.b Total number per test group includes both male and female animals.c No-observed-effect leveld No-observed-adverse-effect levele Brandeis diet has a higher protein contentf BIBRA diet designed to promote longevity and reduce obesity in toxicity trialsg NOAEL not reported because of the short duration of the studyh Study was performed with monosodium L-glutamate monohydratei As described in the publication. The Committee assumed that the test substance was L-glutamic acid.i The study was performed at a single or multiple dose levels, but no adverse effects were seen, and no NOAEL was determined. The NOAEL is probably higher than the
dose reported here, which is the highest dose that had no adverse effects.
88
WH
O F
ood
Addi
tives
Ser
ies N
o. 8
0, 2
022
Safety evaluation of certain food additives Eighty-ninth JECFA
N-acetyl-glutamate of 1000 mg/kg bw per day of calculated doses of 914 and 1007 mg/kg bw per day for male and female rats, respectively, the highest level tested.
(ii) Betaine (No. 2265)In a series of feeding studies by the British Industrial Biological Research Association (BIBRA) to evaluate the sub-acute and sub-chronic effects of betaine (No. 2265; batch no. unknown, purity unknown), groups of five male and five female Sprague-Dawley rats were fed diets containing 0, 10 000, 20 000 or 50 000 mg/kg feed betaine (equivalent to 0, 1000, 2000 and 5000 mg/kg bw per day, respectively) in a 14-day range-finding study, and groups of 20 rats of each sex were fed the diets in a 90–93 day study of sub-chronic toxicity (8). In a separate study to assess the reversibility of observed changes, groups of 20 female Sprague-Dawley rats were fed diets containing 0, 10 000, 20 000 or 50 000 mg/kg feed betaine (equal to 0, 1147, 2298 and 5771 mg/kg bw per day, respectively) for 28 days, followed by a 28-day recovery period. Half of the animals in each group were killed and necropsied at the end of 28 days and the remainder at the end of the 28-day recovery period. The basal diet fed to the rats in these 14-, 28- and 90-day studies, referred to as the “BIBRA diet”, was designed to limit obesity and promote longer life during toxicity trials. Follow-up in the 28- and 90-day studies conducted at Brandeis University (Boston (MA), USA) with a different basal diet (“Brandeis diet”) are described separately below. Individual body weights were recorded 3 days before treatment, at the start of treatment and twice weekly until termination of each study at 14 and 28 days with recovery and at 90 days. Food consumption and clinical changes were recorded weekly.
Rats in the 14-day study were necropsied at study termination, and selected organs were weighed and evaluated macroscopically. No deaths, changes in behaviour or function or clinical toxicity and no treatment-related macroscopic findings were identified. A 10% decrease in body weights was reported in males and females at the highest dietary level of betaine on days 4 and 13 as compared with controls. Small but statistically significant increases in absolute liver weights (P < 0.05) were reported in males fed the low and the high dietary levels and in females fed the middle and high dietary levels of betaine. Absolute kidney weights were slightly higher than those of control males at the middle dietary level and in animals of each sex at the high dietary level. Pale livers associated with microscopic hepatocellular vacuolization were reported in two of five females at the high intake level.
In the 90-day study, detailed clinical observations were recorded throughout treatment. Ophthalmology, urinalysis and functional and neurobehavioural tests were performed before termination. In addition to gross
89
Amino acids and related substances (addendum)
and microscopic examinations of selected tissues (kidneys, liver, ovaries, spleen, thymus and lungs), comprehensive haematology and serum chemistry were performed on rats in the 28- and 90-day studies.
No treatment-related changes were observed in survival, general condition or behaviour in any of the treated rats. Statistically significantly reduced food intake (P < 0.05) was reported in animals fed the highest dietary level of betaine in the 90-day study, between days 0 and 24 in males and days 38 and 70 in females. Reduced food intake was also recorded at the highest dietary level of betaine in females in the 28-day study, between days 3 and 7. No treatment-related changes were reported in food conversion efficiency in any of the betaine-exposed rats. The body weights of males fed the highest dietary level were lower during weeks 0 and 4 of the 90-day study (largest reduction by day 10) but recovered and were similar to those of controls at the end of the treatment period. Lower body weights were reported in females fed the highest dietary level of betaine in the 28-day study, which returned to the control range during the 28-day recovery phase. No change in body weights was reported in females in the 90-day study. Statistically significant increases in absolute liver weights (P < 0.05) were reported in all treated animals in the 90-day study and in females fed the middle dietary level in the 28-day study. A concentration-dependent increase in absolute liver weights observed in the 28-day study recovered during the 28-day recovery period. Statistically significant increases in absolute kidney weights (P < 0.05) were reported in animals of each sex at the high dietary level in the 90-day study. Although no increases in kidney weights were reported in females fed betaine at the middle and high dietary levels in the 28-day treatment phase, a 7% increase was reported at both dietary levels after the 28-day recovery period. In the 90-day study, increased absolute ovary weights (P < 0.05) were reported in all females fed betaine, and increased absolute spleen and thymus weights (P < 0.05) were reported in female rats fed the high dietary level. The authors reported no treatment-related clinical toxicity or dose-related effect in the functional battery observations; however, they reported reduced values for mean corpuscular volume and mean corpuscular haemoglobin concentration at the high betaine intake level. Clinical chemistry indicated increases in γ-glutamyl transferase in females at the high intake level in the 90-day study and at all levels in the 28-day study, which were reversible, a reversible increase in alkaline phosphatase at the middle and high intake levels, a reversible increase in urea at the low and high intake levels and a reversible increase in bilirubin at the high intake level in the 28-day study. In males in the 90-day study, increases were recorded in alkaline phosphatase at the middle and high intake levels, in lactate dehydrogenase at the low and middle intake levels, in urea at the high level, in cholesterol at all levels and in thyroglobulin at the middle and high intake levels. A concentration-related increased incidence of hepatocyte vacuolization was
90
WH
O F
ood
Addi
tives
Ser
ies N
o. 8
0, 2
022
Safety evaluation of certain food additives Eighty-ninth JECFA
reported in all treated animals in the 90-day study, which was severe in high-intake females. Similar findings were reported in the livers of females in the 28-day study. Histopathological examination and Oil Red O staining in females in the 28-day recovery group indicated that the vacuoles were formed by fatty droplets, consistent with increased cholesterol and thyroglobulin, but the effect was reversed after the recovery period. The authors noted that the reduced energy and protein diet used in these studies supports animal maintenance but not growth, consistent with the finding of reduced body weights over the course of the 90-day study after the early growth period. The authors interpreted the observed effects as evidence of a possible interaction between betaine and the dietary protein composition, which is deficient in sulfur-containing amino acids and may present a metabolic challenge to the animals. Reduced growth rate and fat accumulation in the liver have previously been attributed to protein–energy-deficient diets (49). Both effects were reversed during the 28-day recovery phase.
In the 28- and 90-day follow-up feeding studies to determine the levels at which liver thyroglobulin accumulation appears, groups of five female Sprague-Dawley rats were fed diets containing 0, 5000, 7500, 10 000 or 50 000 mg/kg feed betaine (No. 2265; batch no. unknown; purity unknown), equal to 0, 718, 1071, 1428 and 7143 mg/kg bw per day, respectively (8). The main difference between these studies and those conducted at BIBRA (described above) was in the basal diet, which contained higher levels of energy, protein and fat for full nutritional support of animal growth, including nutritional needs during reproduction. Two additional subgroups of five rats each fed the control diet or a diet containing the highest concentration (50 000 mg/kg betaine) were used in the assay of thyroglobulin secretion rate conducted at 6 and 8 weeks in animals fasted for 16 h and 30 h, respectively. These two subgroups were subsequently maintained on the same diets for 90 days before termination. A similar series of clinical chemistry and physiological parameters were monitored in blood collected after overnight fasting at the end of the 28-day and 90-day treatments. The livers of animals in the control group and at the two highest dietary levels of betaine were examined histopathologically, including Oil Red O staining. Blood lipid profile and hepatic levels of cholesterol, thyroglobulin and total protein were determined in chloroform–methanol-extracted fractions of liver tissue. In the 28-day study, food consumption and body weight gain were similar in treated and control groups, but animals gained more weight and were larger (for their age) than the animals fed the BIBRA diets, consistent with the higher energy and nutritional intake from the follow-up Brandeis diet. No macroscopic changes were found at necropsy, except for slightly larger livers in the highest intake group. Statistically significant increases in mean absolute liver and absolute kidney weights were reported at the two highest dietary intakes; at the highest intake, each was up to 10% higher than in controls. In the 28-day study, an increase in hepatic protein
91
Amino acids and related substances (addendum)
levels and a ≤ 40% decrease in liver thyroglobulin levels at the highest intake level were concentration-dependent and statistically significant. No differences in these parameters were found after the 90-day treatment. No other significant treatment-related adverse effects of clinical importance were observed at any dietary level of betaine. Biochemical changes were not concentration dependent. A statistically significant decrease in α-tocopherol was recorded at the highest intake level in both the 28- and 90-day studies; the ratio of α-tocopherol to total cholesterol was reduced only after 28 days. The thyroglobulin secretion rate assay did not reveal any difference in thyroglobulin clearance. Although decreased mean corpuscular volume and mean corpuscular haemoglobin levels, suggestive of altered iron and/or haemoglobin homeostasis, were reported in animals at the high dietary concentration in the 28-day study, all the parameters were comparable to those in controls at 90 days. The higher food consumption and associated higher intake of betaine in these studies than in the BIBRA studies suggest that the adverse effects observed in the BIBRA studies were not attributable to betaine but to a metabolic shift toward lipid accumulation when the betaine:protein ratio is too high (60% higher in the BIBRA studies). The reduced mean corpuscular volume and mean corpuscular haemoglobin levels were found to be correlated with the betaine:protein ratio, with a threshold of non-adverse effect of 150 mg betaine to 1 g protein. The authors concluded that betaine was not toxic at the levels used in these studies when protein intake is sufficient to support growth. The Committee identified an NOAEL of 1428 mg/kg bw per day for betaine in the diet on the basis of an observed decrease in mean corpuscular volume and haemoglobin during the growth period in the 28-day study and increased absolute liver and kidney weights at the highest concentration tested.
(iii) L-Cysteine (No. 1419)No deaths were observed in groups of six male Fischer 344 fed a diet containing 0 (basal diet), 3000, 6000, 12 000, 24 000 or 48 000 mg/kg feed of L-cysteine (No. 1419; batch no. unknown; purity 99%) in place of corn starch six times over 14 days (24). These concentrations were added to a basal diet that already contained 3700 mg/kg feed. The added dietary levels are calculated to provide approximate daily doses of 0, 1285, 2571, 5143, 10 286 and 20 571 mg/kg bw per day, respectively. The body weight gain in the groups fed the two highest dietary concentrations was lower than in controls fed the basal diet. In a further study, groups of six male Fischer 344 rats were fed diets containing 0 (basal diet), 24 000, 48 000 or 72 000 mg/kg feed of L-cysteine over 5 days. Animals at the two highest concentrations had significantly less body weight gain than controls, and those at the highest concentration had a significant decrease in body weight. The survival of various numbers of rats was evaluated, ranging from 12 at the
92
WH
O F
ood
Addi
tives
Ser
ies N
o. 8
0, 2
022
Safety evaluation of certain food additives Eighty-ninth JECFA
high dose to 32 in the controls and groups fed diets containing 0, 48 000 or 72 000 mg kg feed administered five times over 14 days. No significant reduction in survival was observed under the conditions of the study.
In a 28-day study conducted according to the Japanese guidelines for toxicity studies, groups of six male Sprague-Dawley rats were given L-cysteine (No. 1419; lot numbers 105XW24 and 105XW29, purity unknown) by gavage at 0, 500, 1000 or 2000 mg/kg bw per day in aqueous methylcellulose (22). One rat at the high dose died on day 6 due to gavage error. Standard clinical observations, clinical pathology, necropsy and organ weight measurements were conducted according to the guidelines, and the authors also performed plasma protein fractionation to measure the albumin:globulin ratio, albumin, α1-globulin, α2-globulin, β-globulin and γ-globulin in an automated electrophoresis system. Histopathological examination was conducted of tissues collected from animals at all doses. No statistically significant change in body weight or food consumption was observed at any dose. Increased salivation seen in rats at the middle and high doses was probably due to oral irritation or poor palatability; the authors concluded that the finding had no toxicological significance, as no correlated histopathological changes were observed. Water intake was significantly increased in the high-dose group throughout the study, and a tendency toward increased water intake was noted at the middle and low doses. Decreased prothrombin time and activated partial thromboplastin time were observed in all treated groups, but the decreases were statistically significant only in the low and high treatment groups. Reticulocyte counts were also statistically significantly higher in the high-dose group than in controls. Significantly higher blood glucose levels were observed in animals at 1000 or 2000 mg/kg bw per day. Significantly decreased blood potassium and aspartate aminotransferase (AST) and increased creatinine phosphokinase activity were observed in the high-dose group. Urinalysis showed decreased urinary pH in all treated rats, which was attributed to the higher sulfate load and excretion; this was not considered toxicologically significant by the authors. Urinary volume was significantly higher in the high-dose than in the control group, consistent with higher water intake. A dose-related but not statistically significant trend to decreased urine specific gravity was observed. Significantly increased sodium and potassium excretion were observed in high-dose rats, and significantly increased, dose-dependent chloride excretion was observed in all treated rats. Statistically significant decreases in potassium excretion in low- and middle-dose rats were considered to be incidental findings. Increased relative liver and kidney weights were also observed in these rats and increased relative adrenal and testes weights in high-dose rats. At all dose levels, increased incidences of basophilic renal tubules and of eosinophilic material were observed in the lumina of basophilic renal tubules. The authors considered that the latter finding was of erythrocyte origin and might be related
93
Amino acids and related substances (addendum)
to damage to interstitial blood vessels, epithelial basal lamina of primal tubules or the glomeruli; however, the precise mechanism was not clear. Hyaline casts were observed in only one rat at the high dose. No necrosis, calcification of the renal papilla or hyperplasia of the transitional epithelium was seen in the renal pelvis, in contrast to such findings in rats treated with L-cysteine in the drinking-water in a previous long-term carcinogenicity study (50), presumably because of the shorter administration period. Renal lesions were correlated with increased kidney weights in rats at the middle and high doses, and increased water intake and significant changes in potassium excretion and other urinalysis parameters were seen in treated rats. At necropsy, signs of haemorrhaging were observed, with dark-red areas in the glandular stomach of one middle-dose rat and in all high-dose animals. Treatment-related focal erosion of the glandular stomach was observed in the high-dose group. The authors reported that the treatment-related gross findings in the glandular stomach of one of six rats receiving 1000 mg/kg bw per day L-cysteine and in all five rats that received 2000 mg/kg bw per day were not examined microscopically, as the lesions were small. Increased reticulocyte counts in high-dose females were associated with erythrocyte casts in the kidney and evidence of haemorrhage in the stomach and were considered to be a compensatory response to potential anaemia. The epididymis of L-cysteine-treated rats was not examined histopathologically because no gross changes were found at necropsy. In agreement with the authors of the study, the Committee identified a lowest-observed-adverse-effect level (LOAEL) for L-cysteine administered by gavage at 500 mg/kg bw per day, the lowest dose tested, on the basis of the effects observed in the kidney.
(iv) L-Glutamic acid (No. 1420)Mice
In a 28-day study, groups of 10 adult male Swiss mice were given 0 (vehicle) or 10 mg/kg bw per day of L-glutamate (No. 1420; batch no. unspecified; purity unspecified; presumed by the Committee to be L-glutamic acid from the description in the report) or 10, 20, 40 or 80 mg/kg bw per day of monosodium glutamate (No. 1420; batch no. unspecified; purity 99%) by gavage (25). Mice were killed by anaesthesia with diethyl ether, and blood samples were collected by cardiac puncture at necropsy. Brain tissues of each animal were collected for histopathological examination, and antioxidant activity was measured in plasma and brain tissue.
No differences in body weights were observed between treated and control groups. The mean relative brain weight was significantly higher in animals at 40 and 80 mg/kg bw per day than in controls. Significantly increased plasma glutamate and glutamine levels as well as brain weights relative to body
94
WH
O F
ood
Addi
tives
Ser
ies N
o. 8
0, 2
022
Safety evaluation of certain food additives Eighty-ninth JECFA
weight were observed in mice given 40 or 80 mg/kg bw per day of monosodium glutamate as compared with the vehicle control and those given L-glutamate. A statistically significant, dose-dependent decrease in superoxide dismutase activity at 20, 40 and 80 mg/kg bw per day, a statistically significant decrease in catalase activity at 40 and 80 mg/kg bw per day and significantly increased nitric oxide levels were reported in the brains of all treated animals as compared with the vehicle control and the L-glutamate-treated group. Histopathological evaluation was reported separately for three brain regions, the cerebral cortex, cerebellum and hippocampus. The findings in the cerebral cortex included degenerating pyramidal and granule cells, as indicated by loss of distinct morphology and pale-staining nuclei and glial cells at 40 mg/kg bw per day, and marked cell loss, with pyramidal and granule cells with pyknotic nuclei and vacuolation, at 80 mg/kg bw per day. Significantly decreased total cell counts for pyramidal and granule cells and increased cell size were observed in all treatment groups as compared with the vehicle controls and in the two highest-dose groups as compared with the L-glutamate-treated group. Increased numbers and increased thickness and intertwining of reactive astrocytes were observed in a dose–response manner. Histopathological findings in the cerebellum included loss of distinct cerebellar architecture, partial loss of the Purkinje cell monolayer, presence of pyknotic Purkinje cells, loss of granule cells and vacuolation and degenerative changes at 40 and 80 mg/kg bw per day. The cerebellar cell count was significantly decreased at 20, 40 and 80 mg/kg bw per day as compared with the vehicle controls and at 40 and 80 mg/kg bw per day as compared with L-glutamate-treated mice. Other changes included significantly reduced granule cell, glial cell, basket cell and Purkinje cell densities. Histopathological findings in the hippocampus included signs of mild oedema at 20 mg/kg bw per day, as evidenced by less cohesive granule cells with enlarged interstitial space, loss of normal hippocampal architecture, scattered granule cells, degenerating pyramidal cells, evidenced by neurons with pale-stained nuclei and distorted cell morphology at 40 and 80 mg/kg bw per day as compared with control and L-glutamate-treated mice. Significantly decreased granule and pyramidal cell densities and significantly increased glial cell density were also observed in the hippocampus of treated mice as compared with the vehicle control or L-glutamate treated mice. Decreased astrocyte counts in the cornu ammonis were observed with increasing doses of monosodium glutamate.
Rats
In a 16-week study, groups of 12 male Wistar rats were treated with monosodium glutamate (No. 1420; batch no. unspecified; purity 99%) in both the diet and drinking-water at 0 or 3000 mg/kg bw per day on 5 days a week (29). In addition,
95
Amino acids and related substances (addendum)
animals received drinking-water without (control) or with monosodium glutamate at a concentration of 10 000 mg/L (1%; approximately 1400 mg/kg bw per day). A separate group was fed a basal diet supplemented with 1000 mg/kg bw per day NaCl and drinking-water containing 3500 mg/L NaCl (0.35%). Body weights and feed and water intakes were measured weekly up to 5 months of age. Blood pressure was measured in conscious rats at week 14. Urine was collected from six 12-h-fasted animals per group at week 15 in individual metabolic cages, when animals received only water. At week 16, the animals were killed by intraperitoneal injection of 50 mg/kg bw pentobarbital. Urine was collected from the bladder and blood samples from the femoral arteries of six rats in each group, and the kidneys of the other six rats were removed for examination of renal histology and oxidative stress. Significantly decreased body weights and significantly increased kidney weights relative to body weight were found in rats treated with NaCl and monosodium glutamate as compared with the controls. NaCl-treated rats had significantly increased urinary sodium and potassium levels as well as significantly lower urinary potassium:sodium ratios than controls. In monosodium glutamate-treated rats, the level of urinary sodium was significantly higher than that of controls but significantly lower than that of NaCl-treated rats. Urinary potassium and the urinary potassium:sodium ratio were significantly lower than in either controls or NaCl-treated rats. A significantly lower urinary phosphorus:creatinine ratio and a significantly higher urinary calcium:creatinine ratio were found in monosodium glutamate-treated rats than in either control or NaCl-treated rats. Both treatment groups had significantly increased mean systolic and diastolic blood pressure, indicative of hypertension. In addition, significantly fewer urinary nitric oxide metabolites were observed in both NaCl- and monosodium glutamate-treated rats than in controls; however, the level of urinary nitric oxide metabolites was significantly lower in monosodium glutamate-treated than in NaCl-treated rats. Significantly increased glomerular filtration rates, cortical renal plasma flow and urinary calcium and significantly decreased fractional excretion of sodium, potassium, water and urinary phosphorus were observed in monosodium glutamate-treated rats as compared with control and NaCl-treated rats. The kidneys of monosodium glutamate-treated rats showed significantly increased mean glutathione disulfide levels and significantly decreased mean reduced glutathione, ratio of reduced glutathione:glutathione disulfide and glutathione peroxidase and glutathione reductase activities as compared with the control and NaCl-treated rats. Additionally, the kidneys of monosodium glutamate-treated rats had degenerated glomeruli, increased numbers of mesangial cells and fibrosis in Bowman’s capsule, cortical focal atrophy or dilation of tubules with loss of the brush border, displacement of nuclei into tubular lumina, cellular desquamation, dilated tubules with intratubular protein casts and interstitial tissue fibrosis in damaged tubules,
96
WH
O F
ood
Addi
tives
Ser
ies N
o. 8
0, 2
022
Safety evaluation of certain food additives Eighty-ninth JECFA
with mild accumulation of mononuclear cells as compared with both control and NaCl-treated rats. Significantly increased rates of glomerular sclerosis and tubular interstitial injuries were observed in monosodium glutamate-treated rats as compared with both control and NaCl-treated rats. The authors suggested that these results indicated monosodium glutamate-related retention of sodium, potassium and water, with the accompanying histopathological effects, which were distinct from sodium-related hypertension, renal oxidation and nitric oxide excretion. The Committee considered this study unsuitable for risk assessment, as only a single dose level was tested.
In a 28-day study, groups of four adult male albino Wistar rats were given 0 (distilled water) or 90 mg/kg bw per day of “glutamate” (the Committee assumed that the test substance was glutamic acid; No. 1420; batch no. unspecified; purity unspecified) or 15 mg/kg bw per day monosodium glutamate (No. 1420; batch no. unspecified; purity unspecified) by gavage (42). The animals were killed 24 h after the last treatment, and blood and liver samples were collected for haematology and histology. Significant increases in serum alanine aminotransferase (ALT) and AST activities and the AST:ALT ratio were observed in treated rats as compared with control rats. The authors reported moderate-to-severe vacuolar infiltration of biliary duct epithelium, mild-to-moderate infiltration of mononuclear leukocytes into the portal area and mild-to-moderate random, focally diffuse hepatocellular necrosis in glutamate-treated rats. Similar but less severe lesions were observed in monosodium glutamate-treated rats. The Committee considered that this study was unsuitable for risk assessment because only a single dose was tested in a limited number of animals.
In another 28-day study, groups of four adult male albino Wistar rats were given distilled water, 5 mg/kg bw per day of monosodium glutamate (No. 1420; batch no. unspecified; purity unspecified) or 20 mg/kg bw per day of L-arginine (No. 1438; purity unspecified) with 5 mg/kg bw per day of monosodium glutamate by gavage (51). Rats were killed 24 h after treatment, and blood was collected for haematology. Significantly lower serum alkaline phosphatase activity was observed in treated than in control rats. Significant increases in serum total acid phosphatase and AST activities and in the ratio of AST:ALT were also noted. The authors proposed that the results indicate that monosodium glutamate is destructive to organs with high metabolic activity, including the liver, although no correlated histopathological evidence was provided.
In a 28-day preliminary range-finding study compliant with OECD test guideline 407, no adverse effects were observed in groups of 10 male and 10 female Sprague-Dawley rats fed diets containing 5100 and 4800 mg/kg bw per day monosodium glutamate, respectively (23). In a follow-up 28-day feeding study, no adverse effects were reported at doses ≤ 5300 and 4900 mg/kg bw per
97
Amino acids and related substances (addendum)
day of monosodium glutamate in groups of 10 male and 10 female Sprague-Dawley rats, respectively (25).
No deaths or adverse effects were reported when L-glutamic acid (No. 1420; batch no. unknown; purity 99%) was fed in the diet to groups of 10 male and 10 female Sprague-Dawley rats in an 28-day repeated-dose study compliant with OECD test guideline 407 at a single concentration calculated to provide a target dose of 1000 mg/kg bw per day (actual doses of 953 and 1047 mg/kg bw per day for male and female rats, respectively) (10). The dietary concentration is estimated with default conversion factors to be approximately 20 000 mg/kg feed. The concentration of L-glutamic acid as a nutrient in the basal control diet was 411 µg/g feed, which is insignificant (2%) in comparison with the added L-glutamic acid. L-Glutamic acid was also fed to a control group in the study on N-acetyl-glutamate (No. 2269, discussed above). The test concentration caused no deaths, adverse clinical effects or ophthalmological changes. Slight, significant increases in white blood cell (26%) and lymphocyte counts (28%) in male rats were within the historical control ranges and were therefore considered not to be an adverse effect. No information was reported on body weight, food consumption, motor activity, clinical chemistry or histopathology of treated rats.
In a 90-day study compliant with OECD test guideline 408, groups of 20 Sprague-Dawley rats of each sex were fed 0 (basal diet), 5000, 15 000 or 50 000 mg/kg of monosodium glutamate (No. 1420; batch no. unknown; purity unknown; equal to 0, 308, 931 and 3170 mg/kg bw per day for males and 0, 354, 1066 and 3620 mg/kg bw per day for females, respectively) (26). An increase in blood urea nitrogen observed only in males at the highest concentration was not considered toxicologically significant because it was attributed to the increase in urea due to metabolism of glutamate through the urea cycle. Increased urinary sodium levels were due to the sodium in the administered glutamate salt. No other notable monosodium glutamate-related effects were observed. In agreement with the authors, the Committee identified NOAELs for administration of monosodium glutamate in feed equivalent to 3170 mg/kg bw per day for males and 3620 mg/kg bw per day for females, the highest doses tested.
In a 90-day repeated-dose toxicity study compliant with OECD test guideline 408 conducted by the Netherlands Organisation for Applied Scientific Research (27), monosodium glutamate monohydrate (No. 1420; batch no. unknown; purity > 98%) was administered in the diet at a dose of 0, 700, 1300 or 2700 mg/kg bw per day to male rats and of 0, 700, 1500 or 2900 mg/kg bw per day to female rats (strain and numbers not specified). No deaths or significant clinical signs of toxicity, changes in haematological, urinary or clinical chemistry parameters, macroscopic or microscopic changes, neurobehavioural or neurotoxic effects were observed in any treatment group as compared with the control group. A dose-dependent increase in sodium
98
WH
O F
ood
Addi
tives
Ser
ies N
o. 8
0, 2
022
Safety evaluation of certain food additives Eighty-ninth JECFA
excretion observed at week 12 in all treated groups was due to the high sodium intake from the test substance, as observed in the study described above (26) and previous studies (52, 53). The Committee identified NOAELs of 2700 and 2900 mg/kg bw per day for male and female rats, respectively.
No sodium-related urinary effects were reported in these studies that differed from those reported from previous non-OECD and non-GLP-compliant 10- and 13-week feeding studies in Fischer 344 rats and male Wistar rats, which included significant decreases in urinary creatinine and significant increases in urinary volume, changes in urine pH, precipitate formation as well as hyperplasia and cysts in the bladder and renal papilla (52, 54). In a previous long-term feeding study (34), no significant occurrence of carcinogenic urinary tract lesions was reported in treated male and female Fischer 344 rats.
Dogs
In a 90-day feeding study compliant with OECD test guideline 409, groups of four beagle dogs of each sex were fed diets containing monosodium glutamate monohydrate (No. 1420; batch no. unknown; purity unknown) at concentrations calculated to provide doses of 0 (basal diet), 150, 500 or 1500 mg/kg bw per day (28). Temporary clinical signs of loose stools, diarrhoea and vomiting were reported. Large increases in both the absolute (+100%) and relative thymus weights (+100%) were reported in high-dose females as compared with controls. The authors considered these significant increases to be non-adverse and non-specific, as they were not correlated with mitotic cells or other histopathological changes. No other adverse findings were noted at any dietary concentration in either sex. In agreement with the authors, the Committee identified an NOAEL for oral administration of monosodium glutamate monohydrate of 1500 mg/kg bw per day for both sexes, the highest level tested.
(v) L-Glycine (No. 1421)In a 28-day toxicity study, groups of six male Sprague-Dawley rats were given 0 (vehicle control), 500, 1000 or 2000 mg/kg bw per day glycine (No. 1421; lot no. M5G2082; purity 100%) by gavage (30). No treatment-related deaths, clinical signs of toxicity or significant changes in body weight, feed or water consumption, absolute or relative organ weights or gross pathological findings were seen in treated as compared with control rats during the study. Urinary pH and protein levels were slightly lower in several animals at each treatment level than in control rats. No differences were seen in haematological parameters, and no treatment-related histopathological findings were observed in any of the tissues and organs examined. While occasional minor microscopic findings were made in treated animals, their incidence was low and not dose-dependent, and
99
Amino acids and related substances (addendum)
any observed changes were also often found in control animals. Significantly higher daily urine volume, urinary chloride excretion and blood phospholipid level seen in the high-dose group than in the control group were considered not to be toxicologically relevant, as no changes were found in kidney weights or other urinary parameters, and no correlated histopathological findings were seen in the kidneys or urinary bladders of treated rats. In addition, similar effects were not observed in a previous 2-year study of carcinogenicity in rats treated with glycine in their drinking-water (55), in which decreased creatinine phosphokinase activity and increased incidences of renal papillary necrosis and of renal pelvis papilloma observed in treated rats were not seen in treated rats in this study. The authors noted some differences in study design, such as in duration and method of administration, from the earlier 2-year carcinogenicity study. In agreement with the authors of the study, the Committee identified an NOAEL for administration of glycine by gavage of 2000 mg/kg bw per day, the highest dose tested.
(vi) L-Isoleucine (No. 1422), L-leucine (No. 1423) and L-valine (No. 1426)In a 90-day feeding study compliant with GLP, groups of 12 male and 12 female Sprague-Dawley rats were fed diets containing 0, 12 500, 25 000 or 50 000 mg/kg feed of L-isoleucine or a mixture of L-leucine and L-valine (Nos 1422, 1423 and 1426; lot numbers 201EJ93, 301FKB7 and 301EL12; purity not specified) (31). The dietary concentrations correspond to approximate mean daily intakes of 0, 783, 1565 and 3008 mg/kg bw per day L-isoleucine for males and 0, 944, 1646 and 3702 mg/kg bw per day for females; 0, 833, 1660 and 3333 mg/kg bw per day L-leucine for males and 0, 961, 1905 and 3835 mg/kg bw per day for females; and 0, 823, 1604 and 3225 mg/kg bw per day L-valine for males and 0, 954, 1854 and 3721 mg/kg bw per day for females. After administration, six rats each in the control and high-dietary level groups were randomly selected for a 5-week recovery study and were fed a standard control diet.
No deaths or clinical signs of toxicity due to administration of L-isoleucine were observed during the study or recovery period. No significant overall differences in body weight, diet consumption, absolute or relative organ weights or histopathology were observed between treated and control groups throughout the study and recovery periods. Females in the high-intake group had decreased diet consumption in the first 3 weeks of the study, which was not accompanied by decreased body weights. Choroid atrophy was observed in one male and one female rat in the middle-intake group at the end of the main study. A significant decrease in activated thromboplastin in middle-intake males was not concentration-dependent and therefore not attributed to L-isoleucine. Significant increases in glutamic-oxaloacetic transaminase and glutamate-
100
WH
O F
ood
Addi
tives
Ser
ies N
o. 8
0, 2
022
Safety evaluation of certain food additives Eighty-ninth JECFA
pyruvate transaminase activities seen in high-intake females were reversed during the recovery period. Urinalysis indicated significantly decreased excreted sodium, potassium and chloride levels in male and female rats at the middle and high intake levels, which were within the ranges in the control group. An earlier 90-day feeding study resulted in significantly higher urine volume and pH in Fischer 344 rats fed 80 000 mg/kg of L-isoleucine in feed, which were attributed to strain-specific effects and the high dietary concentration (48). A unilateral, significant increase in the absolute weight of the salivary glands of high-intake males at the end of the recovery period was not observed during the administration period and was considered incidental. In agreement with the authors of the study, the Committee identified an NOAEL for oral administration of L-isoleucine at the middle concentration, equivalent to 1565 mg/kg bw per day for males and 1646 mg/kg bw per day for females, because of the electrolyte changes in urine.
Feeding of L-leucine resulted in no deaths and no significant differences in body weights, feed or water intake or in urinary, ophthalmological, haematological and histopathological parameters of control or treated rats. The clinical changes observed when the dietary consumption of middle-intake males was increased briefly on days 45 and 59 were incidental and unrelated to treatment. Significantly decreased numbers of myeloblasts in low-intake females and a significantly increased ratio of bone marrow myeloid:erythroid precursors in middle-intake females during the administration period were not observed at the end of the recovery period. Significant increases in inorganic phosphate levels and the inorganic phosphate:albumin ratio (description is unclear) and significantly lower α1-globulin ratio (presumably to albumin; description is unclear) observed in high-intake males at the end of the recovery period were deemed to be incidental, as they were not observed at the end of the administration period. Significantly increased creatine and total protein levels in high-intake females in the recovery group were not observed during the administration period. A significant increase in absolute adrenal gland weights was observed only in middle-intake female rats and was reversible. Significantly increased absolute pituitary weights in high-intake females at the end of the recovery period were not observed during the administration period and were therefore considered to be incidental. In agreement with the authors of the study, the Committee identified an NOAEL for oral administration of L-leucine at the highest dietary concentration tested, corresponding to 3333 mg/kg bw per day for males and 3835 mg/kg bw per day for females.
No deaths or ophthalmological, urinary, haematological or histopathological parameters were associated with administration of L-valine during the main and recovery study periods. A small but significant increase in the specific gravity of the urine of low-intake males was not intake-dependent.
101
Amino acids and related substances (addendum)
A significant increase in the γ-globulin fraction ratio in high-intake females was not observed at the end of the 13-week administration period and was considered non-specific. No significant changes in the body weights of treated males or of females in the low- and middle-intake groups were observed relative to the control group. High-intake females showed a significant reduction in body weight, which had recovered by the end of the recovery period, while high-intake males had significantly greater body weight gain than the control group at the end of the 5-week recovery period. No significant differences in overall dietary consumption were found between controls and low- and middle-intake males and females, except for intermittently reduced feed consumption by females in the middle-intake group. Males and females at the high concentration had significantly lower consumption than the control group on day 3, which continued thereafter. In agreement with the authors of the study, the Committee identified an NOAEL for administration of L-valine in the feed at the middle dietary concentration for female rats, equivalent to 1853 mg/kg bw per day. As no effects of valine were observed in male rats and, in agreement with the authors, the Committee identified an NOAEL for oral administration of L-valine in males at the highest dietary concentration, equivalent to 3225 mg/kg bw per day.
(vii) L-Leucine (No. 1423)L-Leucine (No. 1423; batch no. unknown; purity unknown) was fed to groups of six male Fischer 344 rats at a concentration of 0 (basal diet), 15 000, 50 000, 100 000, 150 000 or 300 000 mg/kg in feed in place of corn starch (equivalent to 0, 750, 2500, 5000, 7500 and 15 000 mg/kg bw per day, respectively) for 14 days (32). Dose-dependent decreases in body weight gain, which became statistically significant at ≥ 7500 mg/kg bw per day, were reported. Food intake and the levels of alkaline phosphatase, calcium and inorganic phosphate were significantly lower in the high-intake group than in controls. Statistically significant, concentration-dependent increases in plasma ammonia, serum ALT activity and urine volume were observed in rats fed 5000, 7500 or 15 000 mg/kg bw per day of L-leucine as compared with the control group, with concentration-dependent increases in blood urea nitrogen that became statistically significant at doses ≥ 2500 mg/kg bw per day. Concentration-dependent decreases in serum creatine levels that became statistically significant at ≥ 5000 mg/kg per day and small but statistically significant increases in serum glucose levels were noted at 5000 and 7500 mg/kg bw per day. Serum phospholipid levels were significantly greater in rats at 7500 mg/kg bw per day rats than in the control group. Biochemical analysis showed an increased load of nitrogen at doses of ≥ 5000 mg/kg bw L-leucine per day.
102
WH
O F
ood
Addi
tives
Ser
ies N
o. 8
0, 2
022
Safety evaluation of certain food additives Eighty-ninth JECFA
(viii) L-Methionine (No. 1424)In a 14-day toxicity study, groups of nine male Fischer 344 rats were fed 0 (basal diet), 3000, 6000, 12 000 or 24 000 mg/kg feed of L-methionine (No. 1424; batch no. unspecified; purity unspecified) in place of corn starch (equivalent to 0, 150, 300, 600 and 1200 mg/kg bw per day, respectively) (33). Significantly decreased body weight gain was observed in animals at 600 and 1200 mg/kg bw per day and significantly decreased food and water intakes in those at 1200 mg/kg bw per day. Concentration-dependent, statistically significant increases in total cholesterol and phospholipid were observed, which were reduced at the highest intake level. Significant decreases in alkaline phosphatase and creatinine phosphokinase activities and significant increases in bilirubin, blood urea nitrogen, chloride, urinary calcium and blood lymphocyte numbers were recorded only at the highest concentration. Significant increases in ammonia and decreases in thyroglobulin and total protein were recorded at the two highest concentrations. Significant decreases in plasma calcium were observed at ≥ 300 mg/kg bw per day. Haematology indicated anaemia, including significantly lower erythrocyte count, haemoglobin level, neutrophil count and large unstained cell count at the highest intake and significantly reduced haematocrit, mean corpuscular haemoglobin volume and platelet count at ≥ 600 mg/kg bw per day. There was evidence of significant haemolysis in the groups at 600 and 1200 mg/kg bw per day, as indicated by a statistically significant increase in non-haem splenic iron levels in both groups. This finding was corroborated by observation of enlarged spleens, increased spleen weight at the highest level and microscopic findings in the spleen, such as increased haemosiderin deposition in phagocytes and accumulation of erythrocytes in sinusoids in the group at 1200 mg/kg bw per day. Significantly increased kidney weights relative to body weight were observed at 600 mg/kg bw per day, and the weights of the thymus, liver, spleen, kidney, testes and gastrocnemius muscle relative to body weight were significantly increased at 1200 mg/kg bw per day. The authors also administered glycine (No. 1421; batch no. unspecified; purity unspecified) or serine to groups of six male Fischer 344 rats at 1200 mg/kg bw per day each, which resulted in no significant change in body weight, feed intake or splenic iron as compared with the control group. The findings of this study are consistent with the documented adverse effects of thiol compounds in rodents and other animal species (e.g. dogs) that are not relevant to humans (56–59).
In a 28-day feeding study that was not compliant with GLP, groups of six 5-week old male Fischer 344 rats were fed feed containing 0 (vehicle controls), 1000, 3000, 9000 or 27 000 mg/kg feed L-methionine (No. 1424; batch no. unknown; purity 99.0%), equal to 0, 77, 236, 705 and 1458 mg/kg bw per day (34). No treatment-related deaths occurred during the 28-day treatment
103
Amino acids and related substances (addendum)
period. Significantly decreased body weight gain and body weight were observed at the two highest dietary levels and decreased food and water intakes at the highest level. Associated toxicity at the highest intake level included evidence of haemolysis, such as splenic and hepatic accumulation of haemosiderin and indices of anaemia such as decreased erythrocyte counts, haematocrit, haemoglobin and mean corpuscular haemoglobin concentration. Additional haematological changes were decreased white blood cell, neutrophil, monocyte, eosinophil and platelet counts and decreased plasma fibrinogen at the highest dose only; no other erythrocyte-related parameters were significantly different from those in the control group. The group at the high dietary concentration also had significant changes in urinary parameters, such as decreased urine volume, higher urine specific gravity and higher urinary bilirubin and urobilinogen. Changes in clinical chemistry were also reported at the high dietary concentration, such as decreased levels of plasma alkaline phosphatase, glucose, thyroglobulin, total protein and calcium and increased levels of total bilirubin, total cholesterol, phospholipid and blood urea nitrogen. The authors reported that some of these changes and changes in other plasma enzyme activities had no histopathological correlates and attributed them to an adaptive response of the liver to non-specific toxicity corresponding to decreased body weight and dietary intake. Statistically significant increases were reported in absolute liver and pituitary weights, but not relative to body weight, and in both absolute and relative brain, heart, kidney, spleen, thymus, testis and submandibular and sublingual gland weights at the highest concentration in comparison with controls. The increases in organ weights corresponded to gross pathological and histopathological findings in the adrenal glands, liver, pancreas, spleen, sternum and testis. Macroscopic findings included decreased abdominal and subcutaneous fat, slight thymus atrophy, dark red spleen and small seminal vesicle and coagulating gland only at the highest concentration. Histopathology indicated brown pigment deposition in the zona reticularis and fatty changes in the zona fasciculata of the adrenal gland, increased single-cell necrosis in the pancreas, hepatic deposition of haemosiderin and iron at the highest concentration, with scattered fatty hepatocytes in the centrilobular region at the two highest concentrations. The authors attributed the effects on the adrenal gland to production of adrenocortical hormone as a non-specific stress response. Splenic darkening, congestion, evidence of increased haematopoiesis, increased haemosiderin and iron deposition in the spleen (confirmed by Prussian blue staining) and decreased bone marrow myeloid:erythroid ratio were indicative of haemolytic anaemia. The authors noted that the splenic effects, increased reticulocyte counts and urinary bilirubin and urobilinogen in the high-intake group are consistent with erythropoiesis in response to anaemia and with previously reported findings in methionine-feeding studies in rats (60–62). Haemolytic anaemia and splenic iron and haemosiderin deposits are
104
WH
O F
ood
Addi
tives
Ser
ies N
o. 8
0, 2
022
Safety evaluation of certain food additives Eighty-ninth JECFA
typical findings in studies in experimental animals (including rodents and dogs) with test substances containing a thiol moiety, and these findings reflect species sensitivity that is not relevant to humans (56–59). Some high-intake males also had atrophied reproductive organs, spermatocyte degeneration or necrosis and loss of elongated and round spermatids. The authors attributed the testicular findings to the lower food intake and stress response of rats fed high concentrations of L-methionine. Similar results were found in a previous 14-day dietary study in young male Fischer 344 rats (33). In agreement with the authors of the study, the Committee identified an NOAEL of 236 mg/kg bw per day in male rats on the basis of haemolytic effects at higher doses. As the basal diet contained 5000 mg/kg feed of protein-bound methionine (approximately 393 mg/kg bw per day), the Committee estimated an NOAEL for total dietary methionine of 80 000 mg/kg feed (approximately 629 mg/kg bw per day).
In a 90-day repeated-dose toxicity study that complied with GLP, L-methionine (No. 1424; purity 85%; obtained from modified E. coli K-12) was administered to groups of 10 male and 10 female Sprague-Dawley rats at 0 (vehicle), 250, 500 or 1000 mg/kg bw per day by oral gavage (equal to 0, 213, 425 and 850 mg/kg bw per day) (19). A 4-week recovery study was conducted with subgroups of the vehicle control and high-dose groups (10 of each sex per dose). Toxicokinetics was assessed for the vehicle control group (three of each sex) and for all test groups (six of each sex per dose). The highest dose tested (1000 mg/kg bw per day) was derived from the findings of a 14-day preliminary range-finding study, in which groups of five rats of each sex were given 0 (vehicle), 500, 1000 or 2000 mg/kg bw per day by gavage. No deaths or clinical signs of toxicity were observed in the preliminary study, but significantly decreased body weight gain and food consumption were observed at 2000 mg/kg bw per day. In the main study, two males in the control group and one at the high dose were found dead on days 5, 42 and 85, respectively. Two females, one in the satellite control group and one in the high-dose group of the main study, were found dead on days 56 and 86, respectively. Significantly decreased body weight gains were observed in low-dose males on days 42–91 in the main study and in high-dose males from day 14 to the start of the recovery period. Slightly decreased feed consumption was observed for low-dose males and significantly decreased feed consumption for high-dose males during weeks 4 and 5 as compared with the control group; however, a transient but significant increase in feed consumption in the controls was reported during week 5, and significantly higher feed consumption was observed in high-dose females during weeks 4 and 6. Haemolytic anaemia was observed in high-dose animals and haematological changes (lower erythrocyte count and higher total bilirubin) in middle-dose rats, which, according to the authors, might have suggested the beginning of haemolytic anaemia. This response is consistent with the findings of other studies (34, 60–62). Clinical observations
105
Amino acids and related substances (addendum)
such as chromodacryorrhoea, ptosis, increased grooming, recumbent position, lack of spontaneous motor activity and alopecia of the foreleg were considered to be incidental. The macroscopic findings included punctate appearance of the liver and dark discolouration of the spleens of treated and control rats. Adrenal cortical zona fasciculata vacuolation in middle- and high-dose males was considered not to be toxicologically significant and was attributed to a metabolic response. In agreement with the authors, the Committee identified an NOAEL of 250 mg/kg bw per day in male and female rats on the basis of findings consistent with haemolytic anaemia at higher doses.
(ix) L-Phenylalanine (No. 1428)In a 28-day feeding study that did not comply with GLP, groups of 10 Sprague-Dawley rats of each sex were fed L-phenylalanine (No. 1428; Lot no. 002NE14, purity 99.9%) at 0 (basal diet), 5000, 15 000 or 50 000 mg/kg feed, equal to 0, 523, 1548 and 4903 mg/kg bw per day for males and 0, 509, 1555 and 4701 mg/kg bw per day for females, respectively (35). No adverse ophthalmic or clinical effects and no macroscopic findings, changes in organ weights or microscopic findings were found at any dietary intake level. Significantly decreased body weights and body weight gain observed in high-intake males and females throughout the study were attributed to signs of mild toxicity related to L-phenylalanine administration. Significantly decreased body weights were also reported in females at the low intake level at the end of the study. Significant, non-concentration-dependent decreases in feed consumption observed in low- and middle-concentration female rats were considered not to be adverse. Similar decreases in body weight and feed consumption were observed in previous feeding studies with L-phenylalanine in rats (63, 64). Slight but statistically significant increases in erythrocyte counts and significant decreases in mean corpuscular haemoglobin volume and concentration and in blood glucose were observed in high-intake females. Slight but significantly increased α2-globulin and albumin levels were observed in low- and high-intake males, respectively. Slightly but statistically significantly decreased β-globulin levels were observed in middle-intake males and in middle- and high-intake females. Urinary pH was significantly decreased in middle-intake females. These changes, in addition to some significant differences in absolute and body weight-relative organ weights from high-intake males and females, were small, not related to intake and incidental. No microscopic or macroscopic pathological findings were made. In agreement with the authors of the study, the Committee identified an NOAEL for oral administration of L-phenylalanine at the middle dietary concentration, equivalent to 1548 and 1555 mg/kg bw per day for males and females, respectively.
106
WH
O F
ood
Addi
tives
Ser
ies N
o. 8
0, 2
022
Safety evaluation of certain food additives Eighty-ninth JECFA
(x) L-Aspartic acid (No. 1429)In a 90-day feeding study that complied with guidelines of the Japanese Ministry of Health, Labour and Welfare and GLP, groups of 10 Fischer 344 rats of each sex were fed diets containing 0 (basal diet), 560, 12 710, 24 900 or 51 310 mg/kg feed of L-aspartic acid (No. 1429; lot no. 0010663004; purity 100%) in place of corn starch, equal to 0, 27, 697, 1417 and 2770 mg/kg bw per day for males and 0, 29, 715, 1470, 2966 mg/kg bw per day for females (36). No deaths, clinical signs of toxicity or significant changes in body weight or food intake were observed relative to controls. The average water intakes of males at the two highest concentrations and of females at the three highest concentrations were significantly increased, which was attributed to possible poor palatability of high concentrations of L-aspartic acid. Statistically significant changes in haematological parameters were observed, including higher erythrocyte counts at 697 and 2770 mg/kg bw per day and haematocrit at 697 mg/kg per day and higher mean corpuscular haemoglobin volume and concentration in males and lower mean corpuscular haemoglobin volume and concentration in both sexes at several dietary concentrations; however, the changes were not concentration-dependent and there were no histopathological changes in corresponding organs; they were considered not to be treatment related. Statistically significant, concentration-dependent decreases in serum thyroglobulin and total cholesterol levels were observed in both sexes. The effect of L-aspartic acid on lipid metabolism was not correlated with changes in liver weights or histological alterations that would suggest hepatic lipid accumulation. Blood urea nitrogen and creatinine levels were significantly decreased in males at the two highest dietary concentrations, and uric acid levels were significantly decreased in males given 1417 mg/kg bw per day L-aspartic acid. In females, blood urea nitrogen was significantly decreased in the group at the highest concentration, and uric acid and creatinine levels were significantly decreased at the three highest concentrations. Serum chloride levels were significantly increased in males at the lowest and the highest dietary concentrations and were significantly decreased in females at the highest concentration. Serum potassium levels were significantly decreased in females at the two highest dietary concentrations. Serum AST levels were significantly reduced only in males at 697 mg/kg bw per day. Serum albumin levels were significantly reduced in females at the highest dietary concentration. Urinary ketone and protein levels were significantly higher in male rats at 697 mg/kg bw per day L-aspartic acid and in female rats at 715 and 1470 mg/kg bw per day than in the control group. The relative kidney weights were markedly increased in males at the highest dietary concentration. Histopathology of the kidneys of male rats at the two highest dietary concentrations revealed regenerative renal tubules with tubular dilation. This effect could not be attributed to increased
107
Amino acids and related substances (addendum)
α2-µ-globulin accumulation (measured by immunostaining), as no qualitative or quantitative difference was found between control and treated animals. Examination of the salivary glands revealed acinar cell hypertrophy in animals of each sex at the two highest dietary concentrations, in line with several earlier studies that reported hypertrophied salivary glands in experimental animals exposed to various test substances (65–69). The toxicological significance of the salivary gland hypertrophy induced by L-aspartic acid remains unclear. In agreement with the authors of the study, the Committee identified an NOAEL for oral administration of L-aspartic acid of 12 500 mg/kg feed, or approximately 697 and 715 mg/kg bw per day for male and female rats, respectively, on the basis of histopathological findings in the kidney and hypertrophy of salivary glands at the two highest concentrations.
(xi) L-Glutamine (No. 1430)In a 14-day dose-finding feeding study that complied with the Japanese Ministry of Agriculture and Forestry guidelines and GLP, no deaths, adverse clinical signs, changes in body weight, feed consumption, urinalysis, haematology, blood chemistry, necropsy and organ weight parameters were observed when groups of four Sprague-Dawley rats of each sex were fed a diet containing 0 (basal diet), 1000, 5000, 10 000 or 50 000 mg/kg feed of L-glutamine (No. 1430; lot no. 040224; purity 95.8%), equivalent to 0, 100, 500, 1000 and 5000 mg/kg bw per day (38).
In a 90-day feeding study compliant with US Food and Drug Administration (USFDA) guidelines and GLP, groups of 12 CRL:Sprague-Dawley CD IGS rats were fed a diet containing 0, 12 500, 25 000 or 50 000 mg/kg feed L-glutamine (No. 1430; lot no. 201AA06; purity 99.6%), equal to 0, 833, 1654 and 3379 mg/kg bw per day for males and 0, 964, 1984 and 4026 mg/kg bw per day for females, respectively (38). At the end of the study, six rats randomly selected from the control and high-intake groups in the main study had a 5-week recovery period in which they received only the standard diet. No deaths were observed during either the treatment or the recovery period. A small decrease in body weight was seen only in males at the highest dietary concentration, which was reversed during the recovery period. In the main and recovery studies, transient differences in feed consumption were seen between treated and control groups, which were not treatment-related, as they were not concentration-dependent, and no significant difference in overall feed consumption was noted among treatment groups. There were no significant, treatment-related adverse gross pathological, histopathological or ophthalmological findings at any dietary level. At the two highest dietary concentrations, increased incidences of urinary protein and ketone bodies and decreased urinary pH were reported in females during the main study; however, there was no corresponding increase in total protein in
108
WH
O F
ood
Addi
tives
Ser
ies N
o. 8
0, 2
022
Safety evaluation of certain food additives Eighty-ninth JECFA
blood, no evidence of ketosis, no histopathological changes in either the urinary tracts or kidneys and no significant changes in these urinary parameters at the end of the recovery period. High-intake females had significantly decreased total urinary potassium and chloride levels at the end of the recovery period, but, as these were not seen at the end of the main study, they were considered not to be related to L-glutamine. Significant increases in platelet counts were seen in high-intake females and in lactate dehydrogenase activity in high-intake males at the end of the main study but not at the end of the recovery period, and the values were within normal physiological ranges; they were therefore considered to be toxicologically irrelevant. Significant increases in the γ-globulin fraction in females at the two highest dietary concentrations were observed, with no corresponding changes in lymphocyte ratio, albumin:globulin ratio or total protein, and such increases were not seen at the end of the recovery period. Significant increases in blood albumin:globulin ratio and albumin fraction in females and significant decreases in thyroglobulin in males and in α1-globulin fraction in females in the high-intake groups were observed at the end of the recovery period but not at the end of the administration period. The authors speculated that some of the haematological changes could be attributed to the use of ether as the anaesthetic. Significant increases in lung weights relative to body weights in high-intake females and significant decreases in absolute brain weights in high-intake males in the recovery period were attributed to lower body weights at necropsy, as there were no significant differences in brain weights relative to body weights in high-intake males and controls in the recovery period. A minor increase in prostate weight at the end of the recovery period was considered not related to treatment, as there were no accompanying pathological or histopathological findings. Despite the lack of clear toxicological significance of the changes in urinalysis and blood chemistry observed at the two highest doses, the authors estimated an NOAEL for oral administration of L-glutamine at the lowest dietary level of 12 500 mg/kg feed, equivalent to 830 and 960 mg/kg bw per day for male and female rats, respectively. In addition to the absence of adverse effects in the groups given 25 000 and 50 000 mg/kg feed, the authors stated that no effects had been observed at 12 500 mg/kg feed; therefore, the Committee identified NOELs of 12 500 mg/kg and 50 000 mg/kg feed, corresponding to NOAELs of 3379 and 4026 mg/kg bw per day for male and female rats, respectively.
In a 90-day study that complied with guidelines of the Japanese Ministry of Agriculture and Forestry and GLP, groups of 10 Sprague-Dawley rats of each sex were fed diets containing 0, 5000, 25 000 or 50 000 mg/kg feed of L-glutamine (No. 1430; Lot no. 040224, purity 95.8%), equal to 0, 379, 1867 and 3832 mg/kg bw per day for males and 0, 439, 2234 and 4515 mg/kg bw per day for females, respectively (37). During exposure to L-glutamine in the diet, no deaths or differences in body weights, body weight gains, ophthalmic findings, behaviour,
109
Amino acids and related substances (addendum)
urinalysis parameters or organ weights were observed at any dietary intake level. Significantly decreased feed consumption was observed in low-intake females during week 9 as well as middle-intake males and females during weeks 8 and 11, respectively. No microscopic or macroscopic intake-dependent, toxicologically relevant effects were observed at any dietary intake level. Liver necrosis and microgranuloma were reported at similar rates in control and treated males and females, as were kidney findings of hyaline droplets in proximal tubular epithelium and the presence of basophilic tubules, predominantly in males. Evidence of extramedullary haematopoiesis and brown pigment deposits in the spleen were found at equal frequency in control and high-intake males and females. Haematology showed a statistically significant increase in prothrombin time at the middle-intake level, but the change was not concentration dependent and was within the historical control range in the laboratory. High-concentration males showed an increase in sodium concentrations, but these were within historical control ranges. A red area in the thymus of one low-concentration male and one middle-concentration female, small testes in two low-concentration males and hydrometra of the uterus in one high-concentration female were observed; however, the severity of these and other histopathological observations was minimal, no adverse microscopic findings were made, and no significant differences in absolute or relative organ weights were recorded. These findings support those of a previous study (38), in which changes in blood chemistry and haematology were considered not toxicologically significant. In agreement with the authors of the study (37), the Committee identified an NOAEL for oral administration of L-glutamine at the highest tested dietary concentration, corresponding to 3832 and 4515 mg/kg bw per day for male and female rats, respectively.
(xii) L-Tyrosine (No. 1434)In a 90-day oral toxicity study compliant with OECD test guideline 408, groups of 10 CRL:Sprague-Dawley CD IGS rats of each sex were given 0, 200, 600 or 2000 mg/kg bw per day L-tyrosine (No. 1434; lot no. 555012G; purity 99.9%) in water by gavage (39). During administration, no deaths were observed, and there were no clinical signs or changes in ophthalmology, body weight or water and feed consumption. Oedema was observed in the forestomach of females at the middle dose and in animals of each sex at the highest dose, possibly due to local irritation (70). Significant increases in absolute and relative liver weights were observed, with hypertrophy of centrilobular hepatocytes at the highest dose in both sexes. Corresponding increases in AST (not statistically significant) and ALT (statistically significant) were seen in males and females at the highest dose, indicating hepatic toxicity. The authors also noted statistically significant
110
WH
O F
ood
Addi
tives
Ser
ies N
o. 8
0, 2
022
Safety evaluation of certain food additives Eighty-ninth JECFA
increases in blood total cholesterol, thyroglobulin and phospholipid in both sexes at the highest dose, which the authors attributed to increased hepatic β-hydroxy β-methylglutaryl–coenzyme A reductase activity related to cholesterol synthesis, as reported in a previous 21-day feeding study with L-tyrosine given to Wistar rats at 100 000 mg/kg feed in a 20% casein diet (equivalent to 5000 mg/kg bw per day) (71). Significantly increased erythrocyte counts and potassium levels were observed in high-dose males and females, respectively. Significantly decreased reticulocyte counts seen in middle-dose females were not dose-dependent and were therefore considered incidental. Significant bilateral increases in absolute and relative kidney weights to body weight were observed in high-dose males, and significant increases in relative left kidney weights to body weight were observed in high-dose females. A statistically significant increase in hyaline droplet formation was seen in the proximal tubules of the kidneys in males at the highest dose, with increased urinary protein. Increases in calcium, potassium, total protein and α1-globulin were noted in animals of each sex at the highest dose, which the authors suggested were associated with the histopathological findings in the kidney and liver. On the basis of oedema in the forestomach of females at the middle dose and males at the highest dose and hypertrophy of centrilobular hepatocytes observed in animals of each sex at the highest dose, the Committee agreed with the authors and identified NOAELs for oral administration of L-tyrosine of 600 and 200 mg/kg bw per day for male and female rats, respectively.
(xiii) Taurine (No. 1435)In a 13-week study of oral toxicity that complied with OECD test guideline 408 and GLP, groups of 20 rats of each sex were given 0, 300, 600 or 1000 mg/kg bw per day taurine (No. 1435; lot no. unspecified; purity unspecified) dissolved in deionized water by gavage, as reported to the Scientific Committee on Food (72) and the USFDA (40). No deaths or significant changes in body weight, feed consumption or histopathology were observed in treated rats as compared with the control group. Statistically significant differences in haematology and clinical chemistry in treated rats during weeks 4, 8 and 13 were small and considered not to be due to taurine. A dose-dependent decrease in urinary pH in treated animals was attributed to excretion of unchanged acidic test substance. Slight but significant reductions in absolute organ weights and those relative to body weight were reported for the thyroid and parathyroid glands of high-dose males and all treated females and were attributed to the fact that absolute and relative thyroid and parathyroid gland weights in the control group were higher than the historical control ranges. Follow-up assessment of thyroid hormone levels showed only transient, non-dose-dependent, significantly decreased levels of serum thyroid-stimulating hormone in middle-dose males in week 4 that were considered not
111
Amino acids and related substances (addendum)
to be treatment-related. There were no deleterious histopathological findings in these or any other organs. Significant behavioural effects were reported in all treated groups, which included a dose-dependent increase in activity, especially in treated females, within 1 h of dose administration that persisted throughout the study. Chewing of forelimbs and hindlimbs was reported in middle- and high-dose males and in females at all doses, and the effect was investigated in a functional observation battery applied to the high-dose and control groups during weeks 6 and 12. Although signs of neurostimulation were observed in treated rats, especially females, as evidenced by increased alertness, cage biting, higher arousal and hyper-responsiveness, these effects were observed in single animals, and the incidence was not statistically significant. Impaired rotarod performance was seen in high-dose males and females in weeks 6 and 12, but the effect was not statistically significant because of high inter-individual variation in each group. High-dose males had decreased mean ambulatory activity in week 6 but not week 12. Behavioural changes observed 1 h after dosing coincided with peak plasma concentrations reported in toxicokinetics studies. While some of the observed behavioural changes improved later in the study, decreased rotarod performance and increased activity persisted. The study authors noted that the persistence of these effects indicated development of lack of tolerance to the potential neurological effects of taurine. An NOAEL could not be identified because of the behavioural effects found at all doses in males and females.
In a 13-week follow-up neurotoxicity assay that complied with OECD test guideline 424 and GLP, which was reported to EFSA and the USFDA, groups of 20 rats of each sex were given 0, 600 or 1000 mg/kg bw per day of taurine (No. 1435; lot no. unspecified; purity unspecified) in deionized water by gavage (40, 73). Additional groups of 20 rats of each sex were given a target dose of 0, 1000 or 1500 mg/kg bw per day of taurine (No. 1435; lot no. unspecified; purity unspecified) in the drinking-water for 13 weeks, corresponding to actual intakes of 0, 1095 and 1647 mg/kg bw per day for males and 0, 1117 and 1656 mg/kg bw per day for females. The study was conducted specifically to address the adverse effects on behaviour in the previous study and to improve the design by including blinded evaluations. Functional observation battery and locomotor tests were conducted before the start of the study to eliminate outliers of locomotor activity before treatment, and rats were randomly assigned to dose groups on the basis of rotarod performance. Functional observation battery and locomotor tests were also conducted on weeks 6 and 12 of the study. No treatment-related deaths or significant changes in body weight, feed consumption, functional observation battery or locomotor activity, clinical parameters or macroscopic effects were observed at any dose in comparison with the control groups after oral administrations or in drinking-water. Transient increases in water consumption by all males treated with taurine in the drinking-water on days 0–7 were considered
112
WH
O F
ood
Addi
tives
Ser
ies N
o. 8
0, 2
022
Safety evaluation of certain food additives Eighty-ninth JECFA
an adaptive response to the osmotic properties of the test substance and not to be an adverse effect. The Committee identified NOAELs of 1647 and 1656 mg/kg bw per day in male and female rats, respectively, in view of the absence of adverse behavioural effects at doses up to the highest.
(xiv) L-Alanine (No. 1437)In a 28-day oral toxicity study that complied with Japanese Ministry of Health, Labour and Welfare guidelines and GLP, groups of 10 Sprague-Dawley rats of each sex were given 2000 mg/kg bw per day L-alanine (No. 1437; lot no. not specified; purity not specified) in water by gavage (41). At the end of treatment, five animals of each sex had a 2-week recovery period. During administration of the test substance, no deaths and no clinical signs, changes in ophthalmology, body weight, water or food consumption, haematology or blood chemistry attributable to L-alanine were observed. Significantly increased urinary volume and increased α2-globulin in treated males in the main study were not observed in males in the recovery group, and significantly increased creatinine levels in treated females in the recovery group were not observed in the main study. Significantly decreased absolute adrenal weights and relative kidney weights to body weight were observed in treated females during the recovery period but not during the main study. Increased protein and phosphate salts were observed in the urine of animals of each sex, which were reversed after the 2-week recovery. The findings were not toxicologically significant, as there were no corresponding changes in blood chemistry that signified impairment of renal function, and histopathological examination of the kidney and the urinary tract did not reveal adverse findings. Squamous cell hyperplasia in the limited ridge on the stomach was observed in both sexes but was reduced or reversed after the recovery period. The authors did not identify an NOAEL from these experimental observations. The Committee identified 2000 mg/kg bw per day as the NOAEL for oral administration of L-alanine to male and female rats.
(xv) L-Arginine (No. 1438)In a 28-day toxicity study, groups of four adult male albino Wistar rats were given distilled water or 60 mg/kg bw per day of L-arginine (No. 1438; lot no. not specified; purity not specified) in distilled water by gavage (42). Rats were killed 24 h after the 28-day treatment, and blood and liver samples were collected for haematology and histology. Slight but significant increases in serum ALT and AST activities and in the AST:ALT ratio were observed in treated as compared with control rats. Hyperaemia, moderate sinusoidal oedema and mild mononuclear leukocyte infiltration of portal areas of the liver were observed in treated rats.
113
Amino acids and related substances (addendum)
In a 90-day feeding study that complied with Japanese Ministry of Health, Labour and Welfare guidelines and GLP, groups of 12 Sprague-Dawley rats of each sex were fed diets containing 0, (basal diet) 12 500, 25 000 or 50 000 mg/kg feed L-arginine (No. 1438; lot no. 101AB88; purity 99.8%), equal to 0, 843, 1689 and 3318 mg/kg bw per day for males and 0, 975, 200 and 3879 mg/kg bw per day for females (43). After the treatment period, a 5-week recovery period was added, in which six randomly selected rats from the control and high-intake groups were fed a standard basal diet. No deaths were observed and no treatment-related changes in diet consumption, gross pathology, organ weights, histopathology, body weights or clinical signs were seen during administration of L-arginine. The occurrence of sporadic, concentration-independent fractures of incisors, malocclusion and gryposis of the upper jaw was deemed incidental. At the two highest intake levels, minor, isolated, concentration-independent differences in the feed consumption of females were seen, which did not significantly affect total consumption during the main study. High-intake females had slightly decreased water intake during the recovery period but not at the end of the testing period. Slightly increased urinary glucose in six high-intake males, which remained within the physiological range, and significantly increased urine specific gravity in low-intake males were observed during week 5. These transient changes were concentration-independent and were not seen at the end of the main study or during the recovery period; they were therefore considered not toxicologically significant. The absence of a toxicological effect on glucose levels is consistent with the absence of an increase in blood glucose levels in humans given a high dietary level of L-arginine in a more recent study (74). Statistically significant increases in prothrombin time and in haemoglobin levels and a trend towards increased erythrocyte counts were observed in males at the highest dietary level, but, in the absence of changes in other erythroid parameters and in myelogram parameters, they were considered to be of limited toxicological significance. In females, a slight but significant decrease in the orthochromatic erythroblast ratio and a significant increase in the mast cell ratio were reported at the highest dose at the end of the administration period. There were no accompanying changes in juvenile erythroid cells, myeloid:erythroid ratio or peripheral erythroid parameters, and the change was slight and not observed at the end of the recovery period; therefore, it was considered to have no toxicological significance. Significantly decreased erythrocyte count and reticulocyte ratio in females at the highest dietary level were observed only at the end of the recovery period and were considered of limited importance. Males at the highest dietary level had significantly decreased blood urea nitrogen during the recovery period but not at the end of the testing period; the change was within the physiological range, and there were no corresponding pathological changes. Significantly decreased
114
WH
O F
ood
Addi
tives
Ser
ies N
o. 8
0, 2
022
Safety evaluation of certain food additives Eighty-ninth JECFA
ovarian weights relative to body weight in the middle-intake group as compared with the control group were not intake-dependent and were not accompanied by correlated histopathological effects. Significantly increased absolute left salivary gland weights in high-intake females as compared with the control group were observed at the end of the recovery period. In agreement with the authors, the Committee estimated an NOAEL for oral administration of L-arginine at the highest dietary level tested, corresponding to 3300 and 3900 mg/kg bw per day for male and female rats, respectively.
(xvi) L-Lysine (No. 1439) In a 90-day dietary toxicity study compliant with GLP, groups of six CRL:Sprague-Dawley CD IGS rats of each sex were fed a control standard diet or diets supplemented with 12 500, 25 000 or 50 000 mg/kg feed L-lysine hydrochloride (No. 1439; lot no. 303VKBC; purity unknown), equivalent to 0, 841, 1677 and 3357 mg/kg bw per day in males and 0, 968, 1917 and 3986 mg/kg bw per day in females, respectively (44). The administration period was followed by a 5-week recovery period, during which standard diet was fed to six rats randomly selected from each of the control and the high-dose groups. No treatment-related deaths, clinical signs of toxicity, changes in body weight, feed or water consumption or ophthalmological effects were observed during the administration and recovery periods. Significantly higher urine volume reported for high-intake males at the end of treatment was reversed by the end of the recovery period. Intake-dependent decreases in urinary pH were associated with intake-dependent increases in urinary excretion of chloride during weeks 5 and 13 and were attributed to hydrochloride intake in the test substance. In contrast, significantly decreased serum chloride levels were observed in all treated males and high-intake females as compared with the control group. The authors hypothesized that the decrease reflected a compensatory mechanism in response to increased chloride intake and was consistent with increased chloride elimination. A significant increase in the haemoglobin levels of high-intake females was observed at the end of the 13-week administration period as compared with the control group, which, however, was within concurrent and historical control values. A significant increase in total bilirubin was observed only in mid-intake females. No significant test substance-related pathological findings or differences in absolute or relative organ weights were observed in the treatment groups as compared with the control group at the end of the 13-week administration period. At the end of the 5-week recovery period, significant but incidental observations included increased absolute heart weights in high-intake males, increased unilateral kidney weights in high-intake females and males and decreased absolute bilateral adrenal gland weights in high-intake males. In agreement with the authors of the study, the Committee
115
Amino acids and related substances (addendum)
identified an NOAEL at the highest dietary level tested, corresponding to 3357 and 3986 mg/kg bw per day for male and female rats, respectively.
(xvii) L-Threonine (No. 2119)In a 90-day feeding study performed to guidelines released by the Japanese Ministry of Health, Labour and Welfare, groups of 12 Sprague-Dawley rats of each sex were fed diets containing 0 (vehicle controls), 12 500, 25 000 or 50 000 mg/kg feed L-threonine (No. 2119; lot no. O83175; purity 100.3%), corresponding to approximate mean daily intakes of 0, 812, 1615 and 3267 mg kg bw per day for males and 0, 910, 1850 and 3673 mg/kg bw per day for females, respectively (45). After the treatment period, six animals of each sex per group had a 5-week recovery period. During administration of L-threonine, there were no deaths and no treatment-related changes in feed or water consumption, ophthalmology, gross pathology, organ weights, histopathology, body weights or clinical signs, and no treatment-related changes were seen in haematology, clinical chemistry or urinalysis. Significant but transient, non-intake-dependent increases in urine specific gravity were noted in middle- and high-intake females during week 5. A significant decrease in urinary potassium levels in high-intake females and a significant but non-intake-dependent increase in urine specific gravity were observed in middle-intake females at the end of the administration period. Significant increases in lactate dehydrogenase activity seen in high-intake females and in blood sodium levels in high-intake males at the end of the recovery period were considered irrelevant, as they were not observed at the end of the treatment period. An increase in the relative but not absolute kidney weight in females at the highest concentration was not accompanied by macroscopic or histopathological evidence of kidney damage. Significant but unilateral decreases in absolute thyroid and ovarian weights and significant increases in relative ovarian weights at the end of the 5-week recovery period were considered to be incidental. In agreement with the authors of the study, the Committee identified an NOAEL of the highest dietary level tested, corresponding to 3267 and 3673 mg/kg bw per day for male and female rats, respectively.
(xviii) L-Ornithine monochlorhydrate (No. 2120)In a 90-day dietary toxicity study performed to guidelines released by the Japanese Ministry of Health, Labour and Welfare, groups of 12 Sprague-Dawley rats of each sex were fed diets containing 0 (vehicle controls), 12 500, 25 000 or 50 000 mg/kg feed L-ornithine monohydrochloride (No. 2120; batch numbers 080926 and 083019; purity 99.9%) (46). An additional group of six Sprague-Dawley rats of each sex was fed the basal diet or 50 000 mg/kg feed L-ornithine monohydrochloride for 13 weeks, followed by a 5-week recovery period. These dietary concentrations
116
WH
O F
ood
Addi
tives
Ser
ies N
o. 8
0, 2
022
Safety evaluation of certain food additives Eighty-ninth JECFA
correspond to approximate mean daily intakes of 851, 1695 and 3445 mg/kg bw per day for males and 973, 1962 and 3986 mg/kg bw per day for females, respectively. After 90 days of administration, no toxicologically significant findings were reported in haematology, histopathology, gross examination, body weights, food efficiency or ophthalmoscopy. Changes in body weight and food consumption observed in males in the recovery group were considered incidental, as they were not observed during the treatment period. A trend to increased water intake by males and females, which was statistically significant only in males at the highest intake level in week 1, and an increase in urinary volume that was statistically significant in both sexes at week 5 were interpreted by the authors as evidence of higher urea production and excretion, as ornithine is a major part of the urea cycle; however, no increase in urea levels was reported. Significant increases in reticulocyte counts in high-intake males were within historical control ranges and were not observed in the recovery group or in females; the observation was therefore considered incidental. Lymphocyte counts were significantly increased and neutrophil counts significantly decreased in high-intake males, but high-intake females had significantly decreased lymphocyte and increased neutrophil counts after recovery but not after treatment. These findings were therefore considered to be incidental. A statistically significant increase in alkaline phosphatase activity was observed in middle-intake females only. A significant decrease in α2-globulin observed in high-intake males at the end of the recovery period was deemed toxicologically irrelevant, as it was not observed during the treatment period or in females. A small decrease in serum chloride in males at all dietary concentrations and a statistically significant increase in urinary chloride excretion in males and females at the two highest dietary concentrations during the treatment period were all reversed during recovery and were attributed to chloride intake from the hydrochloride in the test substance. The decrease in serum chloride in males in all treatment groups might have been due to the higher level in control males and was no longer different from control after the recovery period. In agreement with the study authors, the Committee identified NOAELs for oral administration of L-ornithine monohydrochloride of the highest dietary concentration tested, corresponding to 3445 and 3986 mg/kg bw per day for male and female rats.
(xix) γ-Glutamyl-L-valyl-glycine (No. 2123)In a 28-day feeding study compliant with OECD test guideline 407 and GLP, groups of 10 Sprague-Dawley strain SPF rats of each sex were fed diets containing 0, 1000, 3000 or 10 000 mg/kg feed of γ-glutamyl-L-valyl-glycine (No. 2123; lot no. 100212(P); purity 96.5%) at the start of the study, adjusted weekly to provide a target dose of 0, 100, 300 or 1000 mg/kg bw per day (9). The dietary concentrations
117
Amino acids and related substances (addendum)
were adjusted according to the most recent body weight measurements. The actual mean intakes were calculated from measured body weights to be 114, 337 and 1113 mg/kg bw per day for males and 114, 328 and 1124 mg/kg bw per day for females. No deaths were recorded during the testing period, and no significant compound-related changes were observed in clinical parameters, water intake, food consumption, ophthalmology, haematology, a functional observation battery or histopathology. An intake-related increase in urinary protein was detected mainly in males; however, there were no corresponding changes in blood chemistry and no changes in histopathology indicative of kidney damage. Blood creatinine and blood urea nitrogen values were statistically significantly lower than those of controls (by 14% and 13%, respectively) in males at the highest intake; the authors considered that this small change was not toxicologically significant. Although statistically significant increases in alkaline phosphatase activity and decreases in calcium were observed in males at 300 mg/kg, they were not dose-related and were considered to be incidental and not attributable to the test article. The relative and absolute spleen weights in females at the low and high intake levels were significantly lower than those of control animals but were within the range of historical controls. Reduced absolute and relative thymus weights and increased relative lung and kidney weights in middle-intake females and decreased relative adrenal weights in low-intake males were not intake-dependent and were considered incidental changes. Examination of lymphatic and haematopoietic organs, including the spleen, revealed no changes that could be attributed to dietary administration of γ-glutamyl-valyl-glycine. In agreement with the authors of the study, the Committee identified NOAELs for dietary administration of γ-glutamyl-valyl-glycine monohydrochloride of 1113 and 1124 mg/kg bw per day for male and female rats, respectively, the highest doses tested.
(xx) L-Cystine, a structurally related substanceIn a 93-day study, groups of 10 Wistar rats of each sex were given L-cystine (Lot no. not specified; purity not specified) by gavage at a dose of 0, 100, 300, 600 or 3000 mg/kg bw per day (11). Three males and three females at the highest dose died, and reduced food intake and body weight suppression were seen, with decreased haemoglobin levels. Increases in glutamic-oxaloacetic transaminase, glutamate-pyruvate transaminase, alkaline phosphatase and total cholesterol and a decrease in glucose were found in groups at the highest dose. Slightly decreased platelet counts were reported in females at 300 and 600 mg/kg bw per day, which was not dose-related and therefore considered not related to treatment. While changes in the weights of the lungs, kidneys, spleen and pituitary gland were reported, no corresponding histopathological findings were made. The
118
WH
O F
ood
Addi
tives
Ser
ies N
o. 8
0, 2
022
Safety evaluation of certain food additives Eighty-ninth JECFA
Committee identified an NOAEL for administration of L-cystine by gavage of 600 mg/kg bw per day.
(c) Long-term toxicityThese studies are summarized in Table 4 and described below.
(i) Monosodium glutamate (No. 1420)In a 1-year feeding study, groups of six albino Wistar rats of each sex were fed a standard growers’ mash diet or a standard diet supplemented with monosodium glutamate (No. 1420; lot no. 021M1789V; purity unspecified) to provide a dose of 120 mg/kg bw per day (47). The animals were mated and bred throughout the study and were assessed for feed and water intake, fertility and mortality. Two animals were killed every 3 months. The results of a hepatic function panel, liver and renal histopathology, haematology, urinalysis and serum hormone level assessments were recorded. Two adults and 12 neonates in the treatment group died within the first 3 months of the study and one adult and eight neonates at 6 months. In the control group, three neonatal deaths were observed at 6 months. No deaths were reported in the control or treatment groups at 9 and 12 months. The authors reported that no post-mortem examinations were conducted to investigate the causes of the deaths or to determine whether they were related to treatment. They reported lower fertility, indicated by the number of deliveries per group, in treated rats at 3, 6 and 12 months as compared with controls. Changes in body weights, liver enzyme activities, serum levels of bilirubin, thyroglobulin, cholesterol, uric acid, creatinine, urea and testosterone were reported. Mild portal inflammation was reported in treated rats at 9 and 12 months. Isolated findings were reported in the kidney, including periglomerular fibrosis in one treated rat at 6 months and interstitial nephritis in one treated rat at 12 months. The authors acknowledged that the statistical significance of the results is limited by small sample sizes.
(ii) L-Isoleucine (No. 1422)In a 2-year feeding study that did not comply with GLP, groups of 50 Fischer 344/DuCrj rats of each sex were fed diets containing 0 (vehicle controls), 25 000 or 50 000 mg/kg feed of L-isoleucine (No. 1422; batch no. unknown; purity 100%), corresponding to approximate mean daily intakes of 0, 1142 and 2189 mg/kg bw per day for males and 0, 925 and 1788 mg/kg bw per day for females (48). There were no treatment-related adverse effects on survival rate, haematology, urinalysis, food consumption or clinical signs relative to the control group. Histopathological examination of rats at all treatment levels revealed no neoplastic or non-neoplastic lesions. Slight but statistically significant increases
119
Amino acids and related substances (addendum)
in the body weights of high-intake females reported in weeks 42–94 (excluding week 46), of middle-intake males in weeks 3 and 78–98 (excluding week 86) and of high-intake males in weeks 2–4, 78 and 82 were considered not toxicologically relevant. Small but significant increases in blood calcium levels in high-intake females and decreases in sodium in middle- and high-intake females were noted. High-intake males had significantly increased ALT, inorganic phosphate, total cholesterol and sodium levels, and middle- and high-intake males had increased magnesium and decreased potassium levels. Although the relative kidney weights of high-intake males were significantly higher than those of the control group, no histopathological findings suggestive of renal toxicity were seen. Significantly decreased relative testes weights were observed in middle- and high-intake males. Significantly increased testicular atrophy was observed in high-intake males, which was not intake-dependent and was noted to be inconsistent with the absence of a similar finding at a higher exposure level in a 13-week study (75). No neoplastic or non-neoplastic lesions were seen. The authors stated that dietary administration of L-isoleucine at doses ≤ 2189 and 1788 mg/kg bw per day for male and female rats, respectively, had no carcinogenic potential.
(d) Genotoxicity Studies of genotoxicity in vitro and in vivo reported for amino acids and related substances are summarized in Table 5 and described below.
(i) In vitroReverse mutation
No evidence of genotoxic potential or cytotoxicity was observed in a reverse mutation assay with five concentrations of betaine monohydrate (No. 2265) between 8 and 5000 µg/plate tested in S. typhimurium strains TA98, TA100, TA1535, TA1537 and TA1538 in the presence or absence of an Aroclor 1254-induced rat liver metabolic activation system (S9) in the plate incorporation method according to GLP standards of the United Kingdom, OECD and the US Environmental Protection Agency. Slight cytotoxicity was reported at the highest concentration in the range-finding study but not in the main studies in the absence or presence of S9. The positive and negative controls provided the appropriate responses in the tester strains (77).
In a reverse mutation assay compliant with OECD test guideline 471, no evidence of genotoxic potential was observed when S. typhimurium strains TA98, TA100, TA1535 and TA1537 or E. coli WP2uvrA were tested in triplicate with eight concentrations of L-aspartate (No. 1429) or N-acetyl-L-aspartic acid at 33.3 and 5000 µg/plate (83). In a repeat assay with five test concentrations of each substance of 333–5000 µg/plate, no evidence of genotoxicity was found. Both
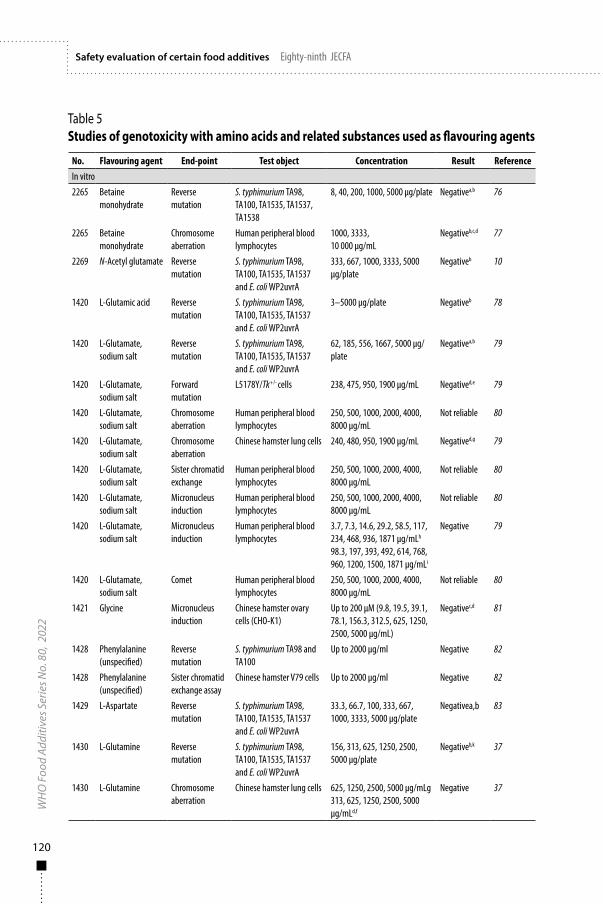
120
WH
O F
ood
Addi
tives
Ser
ies N
o. 8
0, 2
022
Safety evaluation of certain food additives Eighty-ninth JECFA
Table 5Studies of genotoxicity with amino acids and related substances used as flavouring agents
No. Flavouring agent End-point Test object Concentration Result ReferenceIn vitro2265 Betaine
monohydrateReverse mutation
S. typhimurium TA98, TA100, TA1535, TA1537, TA1538
8, 40, 200, 1000, 5000 µg/plate Negativea,b 76
2265 Betaine monohydrate
Chromosome aberration
Human peripheral blood lymphocytes
1000, 3333, 10 000 µg/mL
Negativeb,c,d 77
2269 N-Acetyl glutamate Reverse mutation
S. typhimurium TA98, TA100, TA1535, TA1537 and E. coli WP2uvrA
333, 667, 1000, 3333, 5000 µg/plate
Negativeb 10
1420 L-Glutamic acid Reverse mutation
S. typhimurium TA98, TA100, TA1535, TA1537 and E. coli WP2uvrA
3–5000 µg/plate Negativeb 78
1420 L-Glutamate, sodium salt
Reverse mutation
S. typhimurium TA98, TA100, TA1535, TA1537 and E. coli WP2uvrA
62, 185, 556, 1667, 5000 µg/plate
Negativea,b 79
1420 L-Glutamate, sodium salt
Forward mutation
L5178Y/Tk+/- cells 238, 475, 950, 1900 µg/mL Negatived,e 79
1420 L-Glutamate, sodium salt
Chromosome aberration
Human peripheral blood lymphocytes
250, 500, 1000, 2000, 4000, 8000 µg/mL
Not reliable 80
1420 L-Glutamate, sodium salt
Chromosome aberration
Chinese hamster lung cells 240, 480, 950, 1900 µg/mL Negatived,g 79
1420 L-Glutamate, sodium salt
Sister chromatid exchange
Human peripheral blood lymphocytes
250, 500, 1000, 2000, 4000, 8000 µg/mL
Not reliable 80
1420 L-Glutamate, sodium salt
Micronucleus induction
Human peripheral blood lymphocytes
250, 500, 1000, 2000, 4000, 8000 µg/mL
Not reliable 80
1420 L-Glutamate, sodium salt
Micronucleus induction
Human peripheral blood lymphocytes
3.7, 7.3, 14.6, 29.2, 58.5, 117, 234, 468, 936, 1871 µg/mLh
98.3, 197, 393, 492, 614, 768, 960, 1200, 1500, 1871 µg/mLi
Negative 79
1420 L-Glutamate, sodium salt
Comet Human peripheral blood lymphocytes
250, 500, 1000, 2000, 4000, 8000 µg/mL
Not reliable 80
1421 Glycine Micronucleus induction
Chinese hamster ovary cells (CHO-K1)
Up to 200 µM (9.8, 19.5, 39.1, 78.1, 156.3, 312.5, 625, 1250, 2500, 5000 µg/mL)
Negativec,d 81
1428 Phenylalanine (unspecified)
Reverse mutation
S. typhimurium TA98 and TA100
Up to 2000 µg/ml Negative 82
1428 Phenylalanine (unspecified)
Sister chromatid exchange assay
Chinese hamster V79 cells Up to 2000 µg/ml Negative 82
1429 L-Aspartate Reverse mutation
S. typhimurium TA98, TA100, TA1535, TA1537 and E. coli WP2uvrA
33.3, 66.7, 100, 333, 667, 1000, 3333, 5000 µg/plate
Negativea,b 83
1430 L-Glutamine Reverse mutation
S. typhimurium TA98, TA100, TA1535, TA1537 and E. coli WP2uvrA
156, 313, 625, 1250, 2500, 5000 µg/plate
Negativeb,k 37
1430 L-Glutamine Chromosome aberration
Chinese hamster lung cells 625, 1250, 2500, 5000 µg/mLg 313, 625, 1250, 2500, 5000 µg/mLd,f
Negative 37
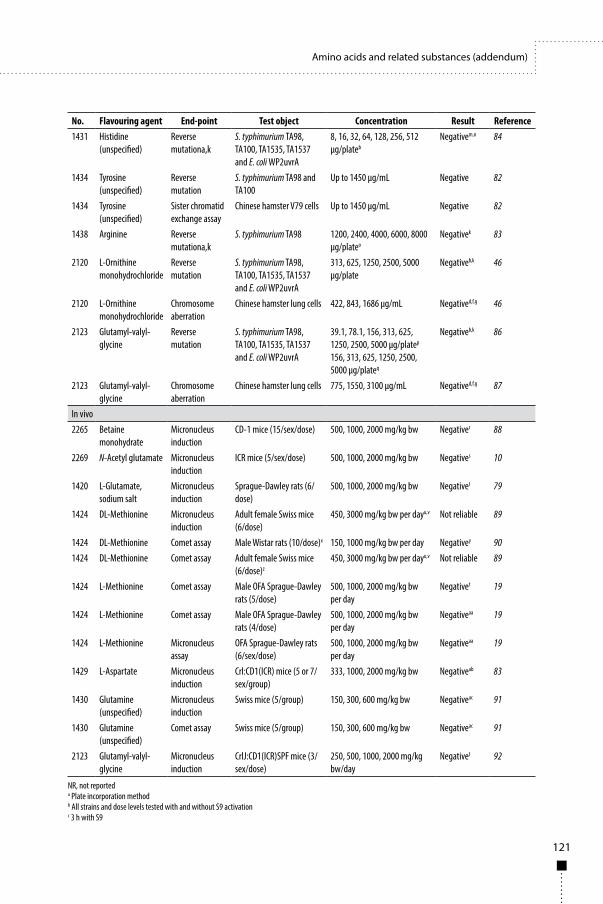
121
Amino acids and related substances (addendum)
No. Flavouring agent End-point Test object Concentration Result Reference1431 Histidine
(unspecified)Reverse mutationa,k
S. typhimurium TA98, TA100, TA1535, TA1537 and E. coli WP2uvrA
8, 16, 32, 64, 128, 256, 512 µg/plateb
Negativem,n 84
1434 Tyrosine (unspecified)
Reverse mutation
S. typhimurium TA98 and TA100
Up to 1450 µg/mL Negative 82
1434 Tyrosine (unspecified)
Sister chromatid exchange assay
Chinese hamster V79 cells Up to 1450 µg/mL Negative 82
1438 Arginine Reverse mutationa,k
S. typhimurium TA98 1200, 2400, 4000, 6000, 8000 µg/plateo
Negativek 83
2120 L-Ornithine monohydrochloride
Reverse mutation
S. typhimurium TA98, TA100, TA1535, TA1537 and E. coli WP2uvrA
313, 625, 1250, 2500, 5000 µg/plate
Negativeb,k 46
2120 L-Ornithine monohydrochloride
Chromosome aberration
Chinese hamster lung cells 422, 843, 1686 µg/mL Negatived,f,g 46
2123 Glutamyl-valyl-glycine
Reverse mutation
S. typhimurium TA98, TA100, TA1535, TA1537 and E. coli WP2uvrA
39.1, 78.1, 156, 313, 625, 1250, 2500, 5000 µg/platep
156, 313, 625, 1250, 2500, 5000 µg/plateq
Negativeb,k 86
2123 Glutamyl-valyl-glycine
Chromosome aberration
Chinese hamster lung cells 775, 1550, 3100 µg/mL Negatived,f,g 87
In vivo2265 Betaine
monohydrateMicronucleus induction
CD-1 mice (15/sex/dose) 500, 1000, 2000 mg/kg bw Negativer 88
2269 N-Acetyl glutamate Micronucleus induction
ICR mice (5/sex/dose) 500, 1000, 2000 mg/kg bw Negatives 10
1420 L-Glutamate, sodium salt
Micronucleus induction
Sprague-Dawley rats (6/dose)
500, 1000, 2000 mg/kg bw Negativet 79
1424 DL-Methionine Micronucleus induction
Adult female Swiss mice (6/dose)
450, 3000 mg/kg bw per dayu,v Not reliable 89
1424 DL-Methionine Comet assay Male Wistar rats (10/dose)x 150, 1000 mg/kg bw per day Negativey 901424 DL-Methionine Comet assay Adult female Swiss mice
(6/dose)z
450, 3000 mg/kg bw per dayu,v Not reliable 89
1424 L-Methionine Comet assay Male OFA Sprague-Dawley rats (5/dose)
500, 1000, 2000 mg/kg bw per day
Negativet 19
1424 L-Methionine Comet assay Male OFA Sprague-Dawley rats (4/dose)
500, 1000, 2000 mg/kg bw per day
Negativeaa 19
1424 L-Methionine Micronucleus assay
OFA Sprague-Dawley rats (6/sex/dose)
500, 1000, 2000 mg/kg bw per day
Negativeaa 19
1429 L-Aspartate Micronucleus induction
Crl:CD1(ICR) mice (5 or 7/sex/group)
333, 1000, 2000 mg/kg bw Negativeab 83
1430 Glutamine (unspecified)
Micronucleus induction
Swiss mice (5/group) 150, 300, 600 mg/kg bw Negativeac 91
1430 Glutamine (unspecified)
Comet assay Swiss mice (5/group) 150, 300, 600 mg/kg bw Negativeac 91
2123 Glutamyl-valyl-glycine
Micronucleus induction
CrlJ:CD1(ICR)SPF mice (3/sex/dose)
250, 500, 1000, 2000 mg/kg bw/day
Negativet 92
NR, not reporteda Plate incorporation methodb All strains and dose levels tested with and without S9 activationc 3 h with S9
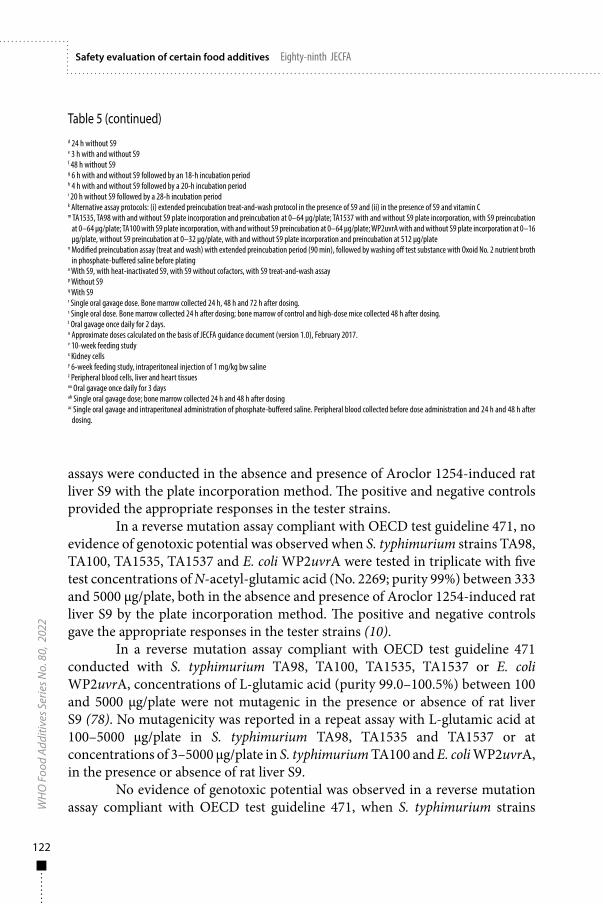
122
WH
O F
ood
Addi
tives
Ser
ies N
o. 8
0, 2
022
Safety evaluation of certain food additives Eighty-ninth JECFA
assays were conducted in the absence and presence of Aroclor 1254-induced rat liver S9 with the plate incorporation method. The positive and negative controls provided the appropriate responses in the tester strains.
In a reverse mutation assay compliant with OECD test guideline 471, no evidence of genotoxic potential was observed when S. typhimurium strains TA98, TA100, TA1535, TA1537 and E. coli WP2uvrA were tested in triplicate with five test concentrations of N-acetyl-glutamic acid (No. 2269; purity 99%) between 333 and 5000 µg/plate, both in the absence and presence of Aroclor 1254-induced rat liver S9 by the plate incorporation method. The positive and negative controls gave the appropriate responses in the tester strains (10).
In a reverse mutation assay compliant with OECD test guideline 471 conducted with S. typhimurium TA98, TA100, TA1535, TA1537 or E. coli WP2uvrA, concentrations of L-glutamic acid (purity 99.0–100.5%) between 100 and 5000 µg/plate were not mutagenic in the presence or absence of rat liver S9 (78). No mutagenicity was reported in a repeat assay with L-glutamic acid at 100–5000 µg/plate in S. typhimurium TA98, TA1535 and TA1537 or at concentrations of 3–5000 µg/plate in S. typhimurium TA100 and E. coli WP2uvrA, in the presence or absence of rat liver S9.
No evidence of genotoxic potential was observed in a reverse mutation assay compliant with OECD test guideline 471, when S. typhimurium strains
Table 5 (continued)d 24 h without S9e 3 h with and without S9f 48 h without S9g 6 h with and without S9 followed by an 18-h incubation periodh 4 h with and without S9 followed by a 20-h incubation periodi 20 h without S9 followed by a 28-h incubation periodk Alternative assay protocols: (i) extended preincubation treat-and-wash protocol in the presence of S9 and (ii) in the presence of S9 and vitamin Cm TA1535, TA98 with and without S9 plate incorporation and preincubation at 0–64 µg/plate; TA1537 with and without S9 plate incorporation, with S9 preincubation
at 0–64 µg/plate; TA100 with S9 plate incorporation, with and without S9 preincubation at 0–64 µg/plate; WP2uvrA with and without S9 plate incorporation at 0–16 µg/plate, without S9 preincubation at 0–32 µg/plate, with and without S9 plate incorporation and preincubation at 512 µg/plate
n Modified preincubation assay (treat and wash) with extended preincubation period (90 min), followed by washing off test substance with Oxoid No. 2 nutrient broth in phosphate-buffered saline before plating
o With S9, with heat-inactivated S9, with S9 without cofactors, with S9 treat-and-wash assayp Without S9q With S9r Single oral gavage dose. Bone marrow collected 24 h, 48 h and 72 h after dosing.s Single oral dose. Bone marrow collected 24 h after dosing; bone marrow of control and high-dose mice collected 48 h after dosing.t Oral gavage once daily for 2 days.u Approximate doses calculated on the basis of JECFA guidance document (version 1.0), February 2017.v 10-week feeding studyx Kidney cellsy 6-week feeding study, intraperitoneal injection of 1 mg/kg bw salinez Peripheral blood cells, liver and heart tissuesaa Oral gavage once daily for 3 daysab Single oral gavage dose; bone marrow collected 24 h and 48 h after dosingac Single oral gavage and intraperitoneal administration of phosphate-buffered saline. Peripheral blood collected before dose administration and 24 h and 48 h after
dosing.
123
Amino acids and related substances (addendum)
TA98, TA100, TA1535 and TA1537 or E. coli WP2uvrA were incubated with five test concentrations of monosodium L-glutamate monohydrate (No. 1420; purity 98.5–101.5%) between 62 and 5000 µg/plate in the presence or absence of Aroclor 1254-induced S9 by the plate incorporation method (79). The positive and negative controls provided the appropriate responses in the tester strains.
In a bacterial reverse mutation assay, phenylalanine (No. 1428) and tyrosine (No. 1434) were tested for mutagenicity in the presence and absence of S9 with S. typhimurium TA98 and TA100 at four concentrations (82). The maximum concentrations tested were 2000 and 1450 µg/mL (volume added per plate not shown) for phenylalanine and tyrosine, respectively. Dimethyl sulfoxide (1%) was evaluated as a solvent control. The results are presented as maximum fold induction for each substance in each strain, with and without Aroclor 1254-induced rat liver S9. The positive and negative controls provided the appropriate responses in the tester strains. The test materials caused no significant increase in the frequency of revertant colonies with or without metabolic activation. Phenylalanine and tyrosine were considered non-mutagenic under the conditions of this test.
In a reverse mutation assay compliant with Japanese Ministry of Agriculture and Forestry guidelines and GLP, no evidence of genotoxic potential was observed when S. typhimurium TA98, TA100, TA1535 and TA1537 or E. coli WP2uvrA were tested with five concentrations of L-glutamine (No. 1430; batch no. 040224; purity 95.8%) between 313 and 5000 µg/plate in the presence or absence of S9 with the preincubation method (data not shown) (37). The criteria for a positive response were stated to be either a two-fold or greater dose-dependent increase or a reproducible increase in the mean number of revertants relative to the negative control. The positive and negative controls provided the appropriate responses in the tester strains.
In a bacterial reverse mutation assay, histidine (No. 1431; purity unspecified) was evaluated for mutagenicity in triplicate at a concentration of 8–512 µg/plate in S. typhimurium TA98, TA100, TA1535 and TA1537 and at 512 µg/plate in E. coli WP2uvrA in the presence or absence of phenobarbital- and 5,6-benzoflavone-induced rat liver S9, with the standard plate incorporation and preincubation methods (84). As histidine is the growth-conditional amino acid for S. typhimurium strains and exogenous administration is expected to promote an overgrown lawn in the deficient strains (93–98), an additional non-OECD-compliant, modified preincubation assay was designed to reduce or eliminate false-positive results (84). The modification included an extended, 90-min preincubation of the test substance with the tester strains, followed by washing off the test substance with Oxoid No. 2 nutrient broth in phosphate-buffered saline before plating. The Oxoid No. 2 nutrient broth is composed of amino acids of protein origin, with the exception of asparagine and histidine. The authors stated that the extended preincubation period offset lack of exposure to the test
124
WH
O F
ood
Addi
tives
Ser
ies N
o. 8
0, 2
022
Safety evaluation of certain food additives Eighty-ninth JECFA
substance after plating. Results were interpreted as positive if a dose-dependent increase in revertant colony counts was at least twice that of the concurrent vehicle control (water) in all tester strains, except for strain TA100, which was evaluated for at least a 1.5-times increase in revertant counts. A significant reduction in the background lawn or the number of revertants as compared with the vehicle control (< 0.6 times increase) was interpreted as excessive toxicity. Standard positive controls outlined in OECD test guideline 471 for this test were used with all strains and in all assays.
Treatment with histidine in the standard plate incorporation and preincubation methods (without wash-out) resulted in isolated sporadic positive results in S. typhimurium strains in the absence and/or presence of S9 at concentrations up to 64 µg/plate and an overgrown lawn at ≥ 128 µg/plate, as expected (84). No increase in revertants was seen when histidine was added to E. coli WP2uvrA (non-histidine-dependent strain) at a single concentration (512 µg/plate) in the presence or absence of S9 as compared with the vehicle control or when tryptophan was added to S. typhimurium strains (also at 512 µg/plate). In the modified treat-and-wash preincubation assay, no mutagenicity was observed at 0–512 µg/plate in S. typhimurium TA98, TA100, TA1535 or TA1537 or at 512 µg/plate in E. coli WP2uvrA, in the presence or absence of S9.
In a bacterial reverse mutation assay compliant with OECD test guideline 471, arginine hydrochloride (chlorhydrate) (No. 1438; purity ≥ 98.5%) was tested for mutagenicity in the presence and absence of Aroclor 1254-induced S9, heat-treated Aroclor 1254-induced S9 (30 min at 56 ºC) or Aroclor 1254-induced S9 with no co-factors in S. typhimurium strain TA98 at 400, 1200, 2400, 4000, 6000 and 8000 µg/plate (based on 10, 30, 60, 100, 150 and 200 µL/plate of a 40 g/L solution), with the plate incorporation and preincubation methods (85). No assays for cytotoxicity were reported. In a confirmatory assay, ≤ 200 µL (8000 µg/plate) was tested in the presence and absence of S9. The authors defined a positive response as a dose-dependent increase in the average number of revertant colonies with at least three concentrations and the highest increase in revertant colonies being more than twice the number of revertant colonies in the solvent control; statistical significance alone was not the only criterion used. Statistically significant increases in the numbers of revertant colonies were observed in the presence of S9 at the highest concentration (8000 µg/plate) and at the highest three concentrations (4000–8000 µg/plate) in the first and second preincubation assays, respectively, as compared with the solvent control. No mutagenicity was observed in the preincubation assays with heat-treated S9 or S9 prepared without co-factors. The authors suggested that the increase in revertants might be due to use of L-arginine as an alternative substrate to histidine (99) or to metabolic production of nitric oxide resulting in oxidative damage and mutagenicity, as
125
Amino acids and related substances (addendum)
seen in previous studies with nitric oxide. To test the first hypothesis, Khandoudi et al. (85) used the extended preincubation treat-and-wash protocol outlined by Thompson et al. (84) to test for false-positive colony growth at concentrations of 1200, 2400, 4000, 6000 and 8000 µg/plate of arginine hydrochloride in S. typhimurium TA98 in the presence of S9. Under these conditions, no increase in the number of revertants was observed at any test concentration as compared with the solvent control. To test the second hypothesis, the authors repeated the test with L-arginine in the presence of active S9 mix and added vitamin C as an antioxidant scavenger (85). Addition of vitamin C abolished the increase in revertants in both the standard and treat-and-wash assays. The authors concluded that the negative results obtained in the alternative assay protocols characterize the mutagenic potential of arginine more appropriately and indicate the absence of mutagenicity.
L-Ornithine monohydrochloride (No. 2120; batch numbers 080926 and 083019; purity ≥ 99.9%) was not mutagenic or cytotoxic in a standard, GLP-compliant reverse mutation assay when S. typhimurium TA98, TA100, TA1535, TA1537 or E. coli WP2uvrA was incubated with five test concentrations between 313 and 5000 µg/plate, each tested in duplicate, in the presence or absence of phenobarbital–5,6-benzoflavone-induced rat liver S9 with the preincubation method. The positive and negative controls provided the appropriate responses in the tester strains (46).
No evidence of genotoxic potential was observed in a reverse mutation assay compliant with OECD test guideline 471 when S. typhimurium TA98, TA100, TA1535, TA1537 or E. coli WP2uvrA was incubated with γ-glutamyl-L-valyl-glycine (No. 2123; batch no. 100212(P); purity 96.5%) (86). Strains TA98, TA100 and TA1535 and E. coli WP2uvrA were incubated with five test concentrations between 313 and 5000 µg/plate in the presence and absence of phenobarbital–5,6-benzoflavone-induced rat liver S9 in the first and repeat assays with the preincubation method. After growth inhibition was found in the range-finding test for S. typhimurium TA1537 at 1250 µg/plate in the absence of S9 and at 5000 µg/plate in the presence of S9, strain TA1537 was tested in the main studies with six concentrations between 39.1 and 1250 µg/plate in the absence of S9 and between 156 and 5000 µg/plate in the presence of S9. No genotoxicity was observed in either assay in any tester strain under the conditions used. The positive and negative controls provided the appropriate responses in the tester strains.
Forward mutation in mouse lymphoma L5178Y/TK+/– cells
In a forward mutation assay compliant with OECD test guideline 490, monosodium L-glutamate monohydrate (No. 1420; purity 98.5–101.5%) was
126
WH
O F
ood
Addi
tives
Ser
ies N
o. 8
0, 2
022
Safety evaluation of certain food additives Eighty-ninth JECFA
assessed for mutagenicity in mouse lymphoma cells (79). Four concentrations of monosodium L-glutamate monohydrate ranging from 238 to 1900 µg/mL were incubated with L5178Y/Tk+/–-3.72c mouse lymphoma cells for 3 h in the absence or presence of S9 prepared from the livers of male rats induced with phenobarbital–5,6-benzoflavone and for 24 h in the absence of S9. Monosodium L-glutamate monohydrate did not induce a statistically significant increase in mutant frequency with or without S9 at any tested concentration and was therefore considered non-mutagenic under the experimental conditions. The positive and negative controls provided the appropriate mutant frequencies.
Chromosome aberrations
Betaine monohydrate (No. 2265) was not clastogenic when tested at 1000, 3333 or 10 000 µg/mL in human peripheral blood lymphocytes for 3 h in the presence of S9 prepared from Fischer 344 rats induced with Aroclor-1254, and without S9 for 24 h in a chromosome aberration assay that complied with GLP guidelines established by the United Kingdom, OECD, USFDA and the Japanese Ministry of Health, Labour and Welfare (77). The authors reported > 50% cytotoxicity at all selected concentrations in the range-finding assay in the presence of S9; the relative mitotic index was between 52% and 54.7% at concentrations of 1000 and 10 000 µg/mL, respectively. An increase in the mitotic index was noted in the absence of S9 at concentrations of 1000–10 000 µg/mL relative to the control, with no further explanation. The positive (mitomycin C and cyclophosphamide) and negative controls provided the appropriate responses.
In an in vitro chromosome aberration assay that was not compliant with GLP, six concentrations of monosodium glutamate (No. 1420) between 250 and 8000 μg/mL induced chromosomal aberrations after incubation with human peripheral blood lymphocytes for 24 or 48 h in the absence of metabolic activation (80). The most frequently observed aberrations were chromatid and chromosome breaks, followed by dicentric chromosomes, polyploidy, fragments, sister chromatid unions, chromatid exchanges and endoreplication. The mitotic index was decreased by 41% after 24 h and 40% after 48 h of incubation at up to 8000 µg/mL. Significant, dose-dependent increases in the mean frequency of cells with structural and numerical chromosome aberrations and in the number of aberrations per cell were observed after 24-h incubation of 500–8000 µg/mL and after 48-h incubation of 250–8000 µg/mL monosodium glutamate. The negative and positive (mitomycin C) controls gave the appropriate responses under the conditions of this assay. The Committee noted that the study has major shortcomings, which reflect significant deviations from the relevant OECD test guideline No. 473. They include the use of dose levels >1871 μg/ml, corresponding to the upper limit of 10 mM to be tested, and an inappropriate
127
Amino acids and related substances (addendum)
treatment schedule. Further, addition of 5-bromo-2´-deoxyuridine to the culture medium at a concentration of 10 µg/mL is known to induce DNA damage, although at a low level. Moreover, the osmolality and pH of the cell cultures were not measured to ensure appropriate physiological conditions, and no historical negative control data were available to evaluate the biological relevance of the results obtained. The Committee considered that this study is “not reliable” (Table 5) and was of the opinion that no conclusion could be drawn. This consideration is corroborated by the negative findings of a similar study by Takumi et al. (79), which was compliant with OECD test guideline No. 473 and in which a maximum dose level of 1871 µg/mL (10 mM) was used.
In the study of Takumi et al. (79), no evidence of clastogenicity was observed, as no statistically significant increases in the numbers of cells with structural chromosome aberrations or polyploidy cells were seen in Chinese hamster lung cells (CHL/IU) treated with 240, 480, 950 or 1900 μg/mL of monosodium L-glutamate monohydrate (No. 1420; purity 98.5–101.5%) for 24 h in the absence of S9 and for 6 h in the absence and presence of S9 prepared from the livers of phenobarbital–5,6-benzoflavone-induced male rats. The positive and negative controls provided the appropriate responses.
In an in vitro chromosome aberration assay compliant with guidelines of the Japanese Ministry of Agriculture and Forestry and GLP, no evidence of clastogenicity was observed in Chinese hamster lung cells (CHL/IU) treated with 625, 1250, 2500 or 5000 µg/mL L-glutamine (No. 1430; purity 98.5–101.5%) for 6 h in the absence and presence of S9 metabolic activation (37). After the 6-h incubation, the cells were incubated for an additional 18 h. Additional experiments with continuous exposure for 24 h and 48 h at a concentration of 313, 625, 1250, 2500 or 5000 µg/mL of L-glutamine were conducted in the absence of S9. Cytotoxicity indicated by cell-growth inhibition relative to the solvent control was evaluated at six concentrations of L-glutamine between 153 and 5000 µg/mL in the presence and absence of S9. Cytotoxicity of ≤ 64.5% and 50.5% relative to the negative control was observed at 5000 µg/mL with 24-h and 48-h treatment, respectively. The positive and negative controls provided the appropriate responses.
In an in vitro chromosome aberration assay that was compliant with the guidelines of the Japanese Ministry of Health, Labour and Welfare and GLP, no evidence of clastogenicity was observed in Chinese hamster lung cells (CHL/IU) treated with 422, 843 or 1686 µg/mL L-ornithine monohydrochloride (No. 2120; batch numbers 080926 and 083019; purity ≥ 99.9%) for 6 h in the absence and presence of phenobarbital–5,6-benzoflavone-induced rat liver S9 metabolic activation and an 18-h incubation period or for 24 h and 48 h in the absence of S9 (46). No cytotoxicity, as indicated by cell growth rate inhibition, was observed at eight concentrations of L-glutamine between 13 and 1686 µg/mL, relative to the
128
WH
O F
ood
Addi
tives
Ser
ies N
o. 8
0, 2
022
Safety evaluation of certain food additives Eighty-ninth JECFA
solvent control after a 24-h or 48-h exposure in the presence or absence of S9. The positive and negative controls provided the appropriate responses.
In an in vitro chromosome aberration assay compliant with OECD test guidelines and GLP, no significant incidence of polyploidy was detected when 775, 1550 or 3100 µg/mL of γ-glutamyl-L-valyl-glycine (No. 2123; batch no. 100212(P); purity 96.5%) was incubated with Chinese hamster lung cells (CHL/IU) for 6 h, followed by an 18-h recovery period, in the absence and presence of phenobarbital–5,6-benzoflavone-induced rat liver S9 or for 24 h and 48 h in the absence of S9, relative to the concurrent solvent control (87). The positive and negative controls provided the appropriate responses. γ-Glutamyl-valyl-glycine was considered to be non-clastogenic under the conditions tested.
Sister chromatid exchange
No sister chromatid exchanges were induced when Chinese hamster lung fibroblast V79 cells were treated with phenylalanine (No. 1428) or tyrosine (No. 1434) for 2.5 h in the absence or presence of Aroclor 1254-induced rat liver S9 (82). Although the maximum concentrations tested were not clearly described, they appear to have been 2000 μg/mL of phenylalanine and 1450 μg/mL of tyrosine. Data are presented as maximum increases in sister chromatid exchange recorded per 22 chromosomes for each substance under each condition tested. The sister chromatid exchange induction rates for both test substances were within the respective ranges of spontaneous mutation in the presence and absence of S9. Therefore, phenylalanine and tyrosine were considered to be non-mutagenic under the conditions of this test.
Slight but statistically significant induction of sister chromatid exchange was observed when monosodium glutamate (No. 1420) was incubated with human peripheral blood lymphocytes for 24 h and 48 h at six concentrations between 250 and 8000 µg/mL (80). Decreases in mitotic index were reported at all concentrations and were up to 41% after 24-h and 40% after 48-h incubation at 8000 µg/mL. No significant differences in replication index were found between any treatment group and the negative control cells. The negative and positive (mitomycin C) controls gave the appropriate responses under the conditions of this assay. The Committee noted that the study has major shortcomings, including use of dose levels > 1871 μg/mL, corresponding to the upper limit of 10 mM for testing chemicals in mammalian cells. Moreover, osmolality and pH were not measured to ensure appropriate physiological conditions in the treatment cultures, and no historical negative control data were available to evaluate the biological relevance of the results. Additionally, no replicate cultures were used to ensure a reliable statistical evaluation, as outlined in the relevant OECD test guideline, No. 479, which has, however, been withdrawn, as this test is no longer
129
Amino acids and related substances (addendum)
included in batteries of genotoxicity tests. The Committee considered the study “not reliable” and that no conclusion could be drawn.
Micronucleus induction
A significant increase in the frequency of micronuclei was observed when monosodium glutamate (No. 1420) was incubated with human peripheral blood lymphocytes for 48 h at six concentrations between 250 and 8000 µg/mL in the absence of metabolic activation; no significant increase in cytotoxicity was observed as compared with the negative control of distilled water (80). A significant increase in the frequency of micronucleated cells was observed at 1000, 2000, 4000 and 8000 µg/mL. The negative and positive (mitomycin C) controls gave the appropriate responses under the conditions of this assay. The Committee noted that the study has major shortcomings, reflecting significant deviations from the relevant OECD test guideline No. 487, as it included use of dose levels > 1871 μg/mL, corresponding to the upper limit of 10 mM to be tested, an inappropriate treatment schedule and use of a non-standard procedure (nuclear division index) that is currently considered to be inadequate to calculate induced cytotoxicity, a key aspect for selection of dose levels to be scored. In addition, the osmolality and pH of cell cultures were not measured to ensure the appropriate physiological conditions of treated cultures, and no historical negative control data were available to evaluate the biological relevance of the results. The Committee considered the study “not reliable” and that no conclusion could be drawn.
In a more recent in vitro micronucleus assay compliant with OECD test guideline 487, monosodium L-glutamate monohydrate (No. 1420; purity 98.5-101.5%,) was neither clastogenic nor aneugenic at concentrations of 468, 936 and 1871 µg/mL in human peripheral blood lymphocytes treated for 4 h in the absence or presence of Aroclor 1254-induced rat liver S9 with a 20-h recovery period (79). The cells were also treated for a longer, continuous period of 20 h with a 28-h recovery period in the absence of S9 at 1200, 1500 and 1871 µg/mL. No statistically significant difference in cytotoxicity or micronucleus induction was observed between the assessed treated groups and the vehicle control under any treatment condition. The positive and negative controls provided the appropriate responses. Monosodium L-glutamate monohydrate was considered to be neither clastogenic nor aneugenic under the conditions of this test.
An automated in vitro micronucleus assay was conducted in duplicate wells of a 96-well plate with Chinese hamster ovary cells (CHO-K1) treated with glycine (No. 1421) at 10 concentrations from 9.8 to 5000 µg/mL for 3 h in the presence of an Aroclor-induced rat liver S9 with an 18–20-h recovery period (81). The cells were also treated continuously for a longer period of 24 h with a 22–24 h
130
WH
O F
ood
Addi
tives
Ser
ies N
o. 8
0, 2
022
Safety evaluation of certain food additives Eighty-ninth JECFA
recovery period, in the absence of S9. Micronucleus induction was scored by fluorescent microscopy in 2000 binucleated cells (1000 cells/well) at the highest five concentrations after both 3-h and 24-h treatment. The cytokinesis-block proliferation index and percentage cytotoxicity were calculated; a statistically significant increase in micronucleated cells of three times or more was considered positive, an increase by two to three times as weakly positive, and an increase of less than two times was considered negative. Glycine was not genotoxic under the conditions of this test.
DNA damage in comet assays
Significant evidence of DNA damage was observed in a modified alkaline comet assay with six concentrations of monosodium glutamate (No. 1420) between 250 and 8000 µg/mL incubated with human peripheral blood lymphocytes for 1 h at 37 ºC, in comparison with a negative control (80). Three hundred comets per concentration were evaluated for DNA damage. Non-dose-dependent increases in the mean tail length (µm), percentage mean tail intensity and tail moment were observed in all treated cells. The negative and positive controls gave the appropriate responses under the conditions of the assay. The Committee noted that the study had major shortcomings, including use of dose levels > 1871 μg/mL, corresponding to the upper limit of 10 mM for testing chemicals in mammalian cells. Moreover, osmolality and pH were not measured to ensure appropriate physiological conditions in the cultures, and no historical negative control data were available to evaluate the biological relevance of the results. The Committee considered the study “not reliable” and that no conclusion could be drawn.
(ii) In vivoMicronucleus induction
Betaine monohydrate (No. 2265; batch no. 50764226; purity > 98.83%) was tested in an in vivo micronucleus assay that complied with guidelines of the United Kingdom, OECD, USFDA, the Japanese Ministry of Health, Labour and Welfare and GLP (88). In a range-finding test, single oral doses of 500, 1000, 1500 and 2000 mg/kg bw were administered in 0.9% saline to groups of 15 male and 15 female Charles River CD1 mice by oral gavage. As no deaths or clinical signs of toxicity were observed in the range-finding study, 2000 mg/kg bw was set as the maximum tolerated dose for the main study, with 500 and 1000 mg/kg bw chosen as the low and middle dose levels. After a single administration of the test substance, animals in the negative control and test groups were killed 24, 48 or 72 h later by CO2 asphyxiation; the positive control animals were killed 24 h after dosing. Micronucleus counts in the negative and positive control groups were within their respective background ranges. No dose-dependent decrease in
131
Amino acids and related substances (addendum)
the ratio of polychromatic to normochromatic erythrocytes, indicative of bone marrow toxicity, were observed at any dose. Females killed 24 h after receiving an oral dose of 500 mg/kg bw showed a statistically significant increase in micronuclei; however, this was considered by the authors not to be biologically significant, as the increases were within the acceptable background range of micronucleus counts and not dose dependent. No other statistically significant differences in micronucleated polychromatic erythrocytes were observed between the test groups and the solvent control group. The authors noted that the frequencies of micronucleated polychromatic erythrocytes decreased in all groups with progressively longer sampling time after administration of the dose. Betaine monohydrate was considered not to be genotoxic.
In an in vivo micronucleus assay that complied with OECD test guideline 474, a single oral dose of 500, 1000 or 2000 mg/kg bw of N-acetyl-glutamic acid (No. 2269; purity 99%) was administered in water to groups of five ICR mice of each sex by oral gavage, and the animals were killed 24 h after treatment (10). Two additional groups were given water or N-acetyl-glutamic acid at 2000 mg/kg bw in water and killed 48 h after treatment. Smears were prepared from femoral bone marrow and examined for micronucleated polychromatic erythrocytes. No deaths were observed under any test condition. The body weights of negative control and mice at the low and middle doses were normal throughout the study. No increase in the incidence of micronucleated polychromatic erythrocytes was observed 24 or 48 h after treatment with N-acetyl-glutamic acid over that in negative controls. Appropriate micronucleus counts were obtained in the negative and positive control groups. Under the conditions of the study, N-acetyl-glutamic acid (No. 2269) did not induce micronuclei.
Monosodium L-glutamate monohydrate (No. 1420; purity 98.5–101.5%) was tested for induction of micronuclei in bone marrow in vivo in a study that complied with OECD test guideline 474 (79). Groups of six male Sprague-Dawley rats were given 0 (distilled water), 500, 1000 or 2000 mg/kg bw per day of monosodium L-glutamate monohydrate by gavage once daily for 2 days. The rats were observed for signs of toxicity, and body weight was measured throughout the study. No deaths, adverse clinical signs or effects on body weight were observed in any group. The vehicle and positive control groups showed the appropriate micronucleus counts. No indication of bone-marrow toxicity was observed in the form of a reduced ratio of polychromatic to total erythrocytes. No significant differences from vehicle controls were seen in the number of micronucleated polychromatic erythrocytes.
In an in vivo micronucleus study compliant with OECD test guideline 474, L-aspartate (No. 1429) or N-acetyl-L-aspartic acid was administered to male and females ICR mice at a dose of 0 (0.5% methylcellulose in deionized water), 333, 1000 (five of each sex per group) or 2000 mg/kg bw (seven of each sex per
132
WH
O F
ood
Addi
tives
Ser
ies N
o. 8
0, 2
022
Safety evaluation of certain food additives Eighty-ninth JECFA
group) by a single oral gavage (83). Body weights, clinical signs of toxicity and mortality were observed from the start of dosing for 48 h. Half of the mice in each test group were killed 24 h or 48 h after the final dose. All animals in the positive control group were killed 24 h after dosing. Only mice in the control and high-dose groups killed 48 h after the last dose were evaluated for micronucleus induction. No deaths, clinical signs of toxicity or significant differences in body weights as compared with the control group (data not shown) were observed during the study. No statistically significant increase in micronucleus induction was observed in male or female mice 24 h after administration of up to 2000 mg/kg bw of L-aspartate, and no significant difference in micronucleus induction was observed between the high-dose and control groups of male and female mice killed 48 h after the last dose. There was no evidence of toxicity to the bone marrow in the form of a reduced ratio of polychromatic to total erythrocytes. Under the conditions of this study, L-aspartate (No. 1429) was neither clastogenic nor aneugenic at doses ≤ 2000 mg/kg bw.
In an in vivo micronucleus assay compliant with OECD test guideline 474, γ-glutamyl-L-valyl-glycine (No. 2123; batch no. 100212(P); purity 96.5%) was tested in ICR mice (97). In a range-finding study, γ-glutamyl-L-valyl-glycine in water was administered orally to groups of three ICR mice of each sex once daily for 2 days at 250, 500, 1000 or 2000 mg/kg bw per day, and animals were killed by CO2 asphyxiation 24 h after the final dose. No deaths or significant changes in general condition or body weight were observed in the test or control group. In the main study, γ-glutamyl-L-valyl-glycine was administered orally to groups of five male ICR mice at 500, 1000 or 2000 mg/kg bw per day by oral gavage once daily for 2 days. No significant induction of micronuclei was observed as compared with the control group. The positive and negative controls provided the appropriate micronuclei frequencies as compared with historical background ranges. Under the conditions of this study, γ-glutamyl-valyl-glycine was not clastogenic.
DNA damage in comet assays
In an in vivo alkaline comet assay, groups of 20 male Wistar rats were separated into two groups: one received a control diet containing 3000 mg/kg feed of L-methionine (No. 1424; lot no. unspecified; purity unspecified), equivalent to 150 mg/kg bw per day, and the second group received DL-methionine at 20 000 mg/kg feed, equal to 1000 mg/kg bw per day, for 6 weeks (90). Ten rats from each group were given an intraperitoneal injection of saline or 1 mg/kg bw doxorubicin (a known genotoxic agent) 24 h before euthanasia, and kidney cells were isolated and processed on slides for evaluation of comets. Percentage tail DNA, olive moment and tail length (μm) were measured. Significantly
133
Amino acids and related substances (addendum)
reduced body weights were reported in DL-methionine-treated rats; however, no difference in feed intake was observed between the treated and control groups. Decreased percentage tail DNA, olive moment and tail length were reported in animals treated with DL-methionine alone as compared with control animals. As L-methionine did not decrease the doxorubicin-induced DNA damage, the study authors concluded that L-methionine is not genotoxic and had no anti-genotoxic effect when associated with doxorubicin.
In another in vivo comet assay to evaluate DNA damage in the stomach, which was compliant with GLP, doses of 0 (control), 500, 1000 or 2000 mg/kg bw per day of L-methionine (85% purity; obtained from modified E. coli K-12) were administered to groups of five male OFA Sprague Dawley rats on 2 consecutive days (19). Four rats at each dose were evaluated; results were reported only for those at the two highest doses. No statistically significant increase in percentage tail DNA was observed at the two highest doses. No sign of toxicity, no decrease in cell viability and no statistically significant increase in necrotic cells were observed in treated rats as compared with the negative control.
Combined micronucleus induction and DNA damage in comet assays
In a combined in vivo micronucleus and comet assay that did not comply with OECD test guidelines, groups of five male Swiss mice received single doses of 150, 300 or 600 mg/kg bw of glutamine (No. 1430; lot no. unspecified, purity unspecified) by oral gavage (91). As the study was designed to evaluate additional treatments, the animals treated with glutamine also received an intraperitoneal injection of phosphate-buffered saline. A control group received phosphate-buffered saline by oral gavage. Micronucleus induction was evaluated in erythrocytes in peripheral blood collected from the tail vein of animals before administration of a dose or vehicle (T0) and at 24 h (T1) and 48 h (T2) after administration; the comet assay was conducted with peripheral blood collected 48 h after dosing. At T0, the total group frequency of micronuclei in the low- and high-dose groups was significantly lower than in the control group. A significant increase in total group micronucleus frequency was reported in the high-dose group 24 h after administration. No significant difference in the frequency of micronuclei was found between the high-dose and control groups 48 h after administration. In the comet assay, DNA damage was evaluated in 100 lysed cells per treatment based on “tail size” (length) relative to nucleoid diameter, on a scale of three levels of DNA migration (classes 1–3) or no migration (class 0). Glutamine-treated groups had significantly fewer cells with DNA damage than the vehicle control group. Most cells from glutamine-treated mice were classified in class 0, with < 5% cells in class 1; in the control group, ~16% of cells had
134
WH
O F
ood
Addi
tives
Ser
ies N
o. 8
0, 2
022
Safety evaluation of certain food additives Eighty-ninth JECFA
class-1 damage. Overall, glutamine showed no evidence of genotoxicity under the conditions of this non-standard test.
In a combined in vivo micronucleus induction and alkaline comet assay, groups of six female Swiss albino mice were given feed containing 0, 3000 or 20 000 mg/kg feed DL-methionine (No. 1424; lot no. unspecified; purity unspecified) for 10 weeks, equivalent to 0, 450 and 3000 mg/kg bw per day (89). The dietary concentrations selected corresponded to diets classified as methionine-deficient, control diets and methionine-supplemented diets, respectively. The body weights of mice fed the methionine-deficient diet were significantly (67%) lower than those of the control and supplemented diet groups, in which the body weights were similar. Induction of micronuclei was evaluated in peripheral blood, and the comet assay was performed with peripheral blood, liver and heart tissues. A significant 122% increase in the frequency of micronuclei was observed in the group fed the diet containing 3000 mg/kg bw per day methionine as compared with the control diet group. The frequency of micronuclei in the methionine-deficient group (0 mg/kg bw per day) was also higher on average than that in the control group receiving 450 mg/kg bw per day, but the difference did not reach statistical significance. In the comet analysis, the group receiving 20 000 mg/kg feed DL-methionine had a statistically significantly higher percentage tail intensity than the controls and methionine-deficient groups. No significant difference in tail intensity was observed in the heart or liver, but tail intensity in liver was significantly decreased by 49% in the group at 0 mg/kg bw per day as compared with the groups at 450 and 3000 mg/kg bw per day. The authors concluded that dietary intake of DL-methionine at approximately 3000 mg/kg bw per day for 10 weeks induces tissue-specific genotoxicity under the conditions used. They hypothesized that the effect might be associated with the role of methionine metabolism in methylation processes or with homocysteine-induced oxidative stress as a result of metabolism of methionine to homocysteine. The Committee noted shortcomings in the study, including a limited number of immature erythrocytes (1000 instead of 4000) for evaluation of induced micronuclei in peripheral blood lymphocytes, no appropriate method for assessing cytotoxicity (histopathology) and a limited number of cells scored for the comet assay. Moreover, no positive control substances were evaluated, and no historical negative control data were available to evaluate the biological relevance of the results of each test. The Committee considered the study to be “not reliable” and that no conclusion could be drawn.
In another combined in vivo micronucleus and comet assay compliant with GLP, no statistically significant induction of micronuclei was observed in the bone marrow of groups of five male and five female OFA Sprague Dawley rats, and no statistically significant increase in DNA tail size was observed in the livers of groups of four male rats treated with L-methionine (85% purity;
135
Amino acids and related substances (addendum)
obtained from modified E. coli K-12) at 0 (vehicle), 500, 1000 or 2000 mg/kg bw per day by oral gavage for 3 days (19). A preliminary assay with two animals of each sex per group and a confirmatory assay with five animals of each sex per group indicated no clinical signs of toxicity after treatment for 2 days. Four males were selected from each group for analysis of micronuclei and DNA tail; the results of the comet assay were reported only for rats at the two highest doses. No evidence of bone marrow toxicity, as indicated by a significant decrease in the ratio of polychromatic to normochromatic erythrocytes, and no increase in necrotic or apoptotic cell counts in the trypan blue exclusion assay were observed. L-Methionine was not genotoxic under the conditions of this assay. The positive and negative controls provided the appropriate responses.
(iii) Conclusions on genotoxicityAs described above and summarized in Table 5, the results of in vitro and in vivo studies on genotoxicity for substances in this group of amino acids and related substances gave predominantly negative results. Sporadic positive findings reported by some authors (e.g. Ataseven et al. (80) for monosodium L-glutamate and Aissa et al. (89) for DL-methionine) were considered by the Committee to be due to inadequate experimental procedures. Overall, the Committee concluded that the amino acids and related substances evaluated are of no genotoxic concern.
(e) Reproductive and developmental toxicity (i) L-Glutamic acid (No. 1420)In a study of prenatal development that was compliant with USFDA guidelines (similar to OECD test guideline 414), groups of 25 pregnant Sprague-Dawley rats were treated with 0 (basal diet), 5000, 15 000 or 50 000 mg/kg feed monosodium L-glutamate (equal to 0, 302, 898 and 3019 mg/kg bw per day) on days 6–20 of gestation (100). Feed intake, body weight and clinical signs were recorded regularly, and the pregnant rats underwent caesarean section, termination and necropsy on day 20 of gestation. The weights of the heart, lungs, liver, kidneys, spleen, adrenal glands, ovaries and uterus were recorded both before and after fetus removal, and the numbers of implantation sites, resorptions, live and dead fetuses, external abnormalities and fetal weight were recorded. The fetuses were also examined for skeletal and visceral abnormalities. No developmental or maternal effects were observed. In agreement with the study authors, the Committee identified an NOAEL of 50 000 mg/kg feed monosodium L-glutamate in the diet, the highest concentration tested, equal to 3019 mg/kg bw per day.
In a two-generation reproductive feeding study compliant with OECD test guideline 416 and GLP, groups of 30 Sprague-Dawley rats of each sex were fed 0 (vehicle), 5000, 15 000 or 50 000 mg/kg feed of monosodium glutamate, equal to
136
WH
O F
ood
Addi
tives
Ser
ies N
o. 8
0, 2
022
Safety evaluation of certain food additives Eighty-ninth JECFA
313, 939 and 3131 mg/kg bw per day in parental males; 346, 1039 and 3496 mg/kg bw per day in parental females; 437, 1305 and 4404 mg/kg bw per day in first filial (F1) males and 467, 1422 and 4618 mg/kg bw per day in F1 females (101). No effects were observed on the oestrus cycle or sperm parameters in the parental generation. Indices of offspring viability and reproduction were similar to those of controls. Increases in relative (from 9% in F0 males to 17.8% in F1 females) and absolute (from 9.5% in F0 females to 19.7% in F1 females) kidney weights were observed at the highest dose in both sexes in both generations. Increases in the absolute and relative ovary weights in F1 females were also observed at the highest dose. Both absolute and relative spleen weights were reduced at weaning in both sexes of the F1 generation at the highest dose but not in animals of the F2 generation. The organ weight changes were not associated with any macroscopic or histopathological findings. The authors identified the parental NOAELs as 939 and 1039 mg/kg bw per day for males and females, respectively, on the basis of changes in kidney weights, despite the absence of correlated histopathological findings. In agreement with the authors of the study, the Committee identified reproductive and developmental NOAELs of 3131 and 3496 mg/kg bw per day for males and females, respectively, corresponding to the highest dietary level tested.
(ii) L-Leucine (No. 1422)In a study to assess the reproductive and developmental toxicity of L-leucine according to guidelines released by the Japanese Ministry of Health, Labour and Welfare, groups of 20 pregnant Sprague-Dawley rats were given 0 (vehicle controls), 300 or 1000 mg/kg bw L-leucine (No. 1422; lot no. 201FKD2; purity 99.9%) in carboxymethylcellulose by gavage on days 7–17 of gestation, and the effects on embryo and fetal development were evaluated (102). Body weights and feed intake were measured throughout pregnancy (days 0–20), and placental and fetal examinations were conducted directly after delivery by caesarean section on day 20 of gestation. Limited clinical signs of maternal toxicity were observed during gestation; L-leucine had no effect on body weight; an increase in feed intake on days 14 and 18 of gestation was transient; and the intake of all groups (including controls) was comparable 3 days after the last administration of L-leucine solution. There were no effects on the weight or the number of live-born fetuses, the number of corpora lutea, the quality of the placenta or the implantation index. Fetal toxicity was also assessed in a number of external, skeletal and visceral examinations. No adverse effects were noted, and there was no effect on the sex ratio or other external abnormalities. In agreement with the authors of the study, the Committee identified an NOAEL for maternal and fetal toxicity of 1000 mg/kg bw per day, the highest dose tested.
137
Amino acids and related substances (addendum)
(iii) Taurine (No. 1435)In a developmental toxicity study, seven Wistar dams fed a standard laboratory diet were given drinking-water containing 1.5% taurine (No. 1435; lot no. unspecified; purity unspecified) (equivalent to 1500 mg/kg bw per day according to USFDA default conversion factors (103)) in a study designed to evaluate whether taurine supplementation improved outcomes associated with diets linked to obesity (“obesogenic diet”: high fat, high fructose) (104). The study design included a group of eight animals that received taurine in drinking-water at the same concentration with the “obesogenic diet”. Dams received treatments from day 1 of gestation to weaning of offspring 3 weeks after delivery in order to investigate maternal and neonatal effects. Litter sizes were adjusted to eight pups after birth, and plasma and liver samples were collected from the excluded pups after decapitation. After the lactation period, dams were fasted overnight, anaesthetized with intraperitoneal sodium pentobarbitone and killed by decapitation. Maternal body weights and feed and water intakes were recorded daily, and litter size, sex ratio and birth weights were recorded at birth. Histological analysis was conducted of the left lobe of maternal livers. Significantly increased neonatal mortality was observed in the group that received taurine in drinking-water and basal diet (7.1%) as compared with the untreated control group (1.4%). Although the body weights of dams and offspring in the taurine-treated group and the untreated control group did not differ when both received basal diet, a statistically significant interaction was reported between diet and taurine in weaning male offspring. A statistically significant interaction between diet and taurine was also reported in decreased levels of β-hydroxybutyrate in male and female pups; however, the biological significance of these observations is unclear, and they may be spurious findings in the absence of dose–response data. Similarly, the toxicological significance of the reported increase in neonatal mortality is unclear in the absence of dose–response data or a historical control range (40). No significant, taurine-related effects were found on maternal body weights, liver weights, total percentage of fat, litter birth or weaning weights, maternal or neonatal plasma lipid or glucose parameters or maternal liver histology. No differences between taurine-treated and untreated control groups were found in gene expression related to maternal hepatic lipid or glucose metabolic profile, in maternal or neonatal hepatic injury or in cytokine profile.
(iv) L-Methionine (No. 1424)L-Methionine (No. 1424; purity 85%; obtained from modified E. coli K-12) was administered to groups of pregnant Sprague-Dawley rats at 0 (vehicle controls), 125, 250 or 500 mg/kg bw per day by oral gavage on days 6–19 of gestation in a non-GLP-compliant preliminary study (seven per group) and a GLP-compliant
138
WH
O F
ood
Addi
tives
Ser
ies N
o. 8
0, 2
022
Safety evaluation of certain food additives Eighty-ninth JECFA
main (10 per group) study of embryo-fetal developmental toxicity (19). In dams and fetuses in the preliminary study, no deaths, abnormalities or significant differences in body weight gain, clinical signs of toxicity, macroscopic findings, uterine weights or litter data were observed as compared with the control group. The mean numbers of implantation sites in high-dose females were slightly lower because two dams had only two or three implantation sites. Macroscopic observation of dark areas in fetuses in all treatment groups and an instance of omphalocoele in one middle-dose fetus were considered incidental findings, and the same doses were tested in the main study. In the main study, no differences in deaths, clinical signs of toxicity or body weight were observed between treated and control groups. One female was killed on day 15 of gestation because of signs of spontaneous abortion, as evidenced by blood in the cage and near genitalia; necropsy revealed a large number of corpora lutea in the ovaries of this animal. No significant differences in body weight gain or clinical signs of toxicity were observed in treated dams. Upon necropsy, slightly lower mean uterine weight was observed in the high-dose group, attributed to one female with only three live fetuses, and significantly fewer implantation sites in middle- and high-dose dams. Fetal weights were slightly but significantly lower in all treated groups, by up to 9% at the highest dose, than in the control group. Middle- and high-dose fetuses were slightly smaller according to caudo-cranial measurements and had significantly lower placental weights than the control group. Decreased limb size, swollen and dark abdomen and missing anus and tail were observed in one high-dose fetus and dark areas of the placenta in all treatment groups. Notable inter- and intra-litter variation in ossification was observed in all groups, and slightly lower ossification was observed in low- and high-dose fetuses than in the control group, which was associated with lower fetal body weights. The Committee identified a maternal NOAEL of 500 mg/kg bw per day, the highest dose tested, and an NOAEL for embryo-fetal developmental of 250 mg/kg bw per day on the basis of slightly reduced fetal weights and slightly delayed ossification at this dose.
(f ) Special studies(i) L-Glutamic acid (No. 1420)In a 9-month study, adult male Wistar rats were treated with 0 (drinking-water; 20/group) or 2000 mg/kg bw per day (10 per group) monosodium glutamate (No. 1420; lot no. unspecified; purity 99%) in drinking-water (105, 106). The concentration in drinking-water was adjusted according to water consumption and body weights and represented 0.6–2.0% monosodium glutamate, equivalent to 6000–20 000 mg/L. The mean actual intake of monosodium glutamate was approximately 2100 mg/kg bw per day, of which sodium intake was 290 mg/kg bw
139
Amino acids and related substances (addendum)
per day. Feed intake was recorded once a week, and body weights were recorded every 2 weeks. Urine samples were collected from 12-h-fasted animals 1 week before termination. Blood samples were collected at necropsy, and kidneys were collected for histopathology. Treated rats had significantly greater water intake than controls and received more sodium through dietary administration of the test substance than controls. Kidney stones composed of calcium phosphate were observed in three of 10 treated rats. In two of the three rats, flattened, atrophic renal papillae out of proportion to the cortex were reported, indicative of hydronephrosis due to the kidney stones. Microscopic examination of kidney tissue revealed intra-luminal white crystalline deposits in two of 10 treated rats. All five of the affected rats had hyaline casts and flattening of the tubular epithelium, which the authors acknowledged could be strain- and age-specific effects. Treated rats also had significantly more interstitial fibrosis than controls. Significantly increased urinary pH, excretion volume, ionic calcium phosphate products, sodium and citrate levels as well as serum creatinine and potassium levels were reported in treated rats as compared with controls. Significantly less urinary ammonia and magnesium were reported in treated rats than in controls. The authors suggested, on the basis of cited studies, that the alkaline urine was the result of higher bicarbonate production from glutamate metabolism in kidney cells (107, 108), while the decreased ammonium excretion and increased anionic excretion were presumed to be compensatory to increased urinary pH (109, 110). Increased urinary pH and urinary sodium were also observed in previous 3-month feeding studies with up to 60 000 mg/kg monosodium glutamate in feed (27, 52, 54), in two of which bladder epithelial hyperplasia and cysts were also observed, which were attributed to the increased urinary sodium (52) or alkaline urine (54). In a 2-year carcinogenicity study with ≤ 50 000 mg/kg feed of monosodium glutamate, increased urinary pH and sodium with a corresponding decrease in urinary potassium were noted at ≥ 25 000 mg/kg feed, while bladder calculi deposits were observed in females only and were associated with diffuse papillary hyperplasia (53). Sharma et al. (105, 106) argued that the findings of their study were not the result of high sodium intake, because the kidney stones consisted of calcium phosphate deposits, and the subsequent hydronephrosis and increased serum creatinine and potassium levels were not observed in studies with high sodium intake.
Groups of 10 virgin female Charles Foster rats were treated with 0, 800, 1600 or 2400 mg/kg bw per day of monosodium glutamate (No. 1420; lot no. unspecified; purity ≤ 99%) by oral gavage for 30 or 40 days (111). Vaginal smears, serum hormone levels and ovarian tissue levels of oxidative stress enzymes were analysed. No significant change in the total duration of oestrus cycles was observed in treated rats as compared with controls; however, dose-related changes were reported in oestrus phases after administration for 30 days,
140
WH
O F
ood
Addi
tives
Ser
ies N
o. 8
0, 2
022
Safety evaluation of certain food additives Eighty-ninth JECFA
including decreased duration of pro-oestrus, oestrus and metoestrus phases and a significantly increased dioestrus phase in all treated rats. In the 40-day study, pro-oestrus and oestrus phases were significantly decreased in high-dose rats, and decreased metoestrus and increased diestrous phases were observed in all treated rats. Dose-dependent decreases in nucleated, cornified and non-nucleated epithelial cells were observed in smears from treated rats in the pro-oestrus, oestrus and metoestrus phases as compared with control rats, and significant, dose-dependent increases in leukocyte and aggregated leukocyte counts were found in smears from treated rats in the dioestrus phase as compared with controls. Significant increases were reported in serum activity of luteinizing hormone, mainly in high-dose rats, and in follicle-stimulating hormone and oestradiol levels in all treated rats in the 30-day study as compared with controls. In the 40-day study, luteinizing and follicle-stimulating hormone activities were significantly increased in rats at the middle and high doses, and oestradiol levels were significantly higher in all treated rats than in controls. Significant, dose-dependent increases in the numbers of primordial and primary follicles, in the size of Graafian follicles, granulosa and thecal cells and in granulosa and thecal cell layer diameters were observed in the ovaries of treated rats as compared with controls, with significant decreases in corpus luteum size. In the 30-day study, significant, dose-dependent increases were reported in superoxide dismutase, glutathione S-transferase and catalase activities in the ovaries of treated rats and significant decreases in glutathione peroxidase and glutathione reductase activities in all treated rats as compared with controls, while malondialdehyde levels were significantly decreased in mid- and high-dose rats. During the 40-day study, significant, dose-dependent increases in catalase and glutathione S-transferase activities and significant decreases in glutathione peroxidase, glutathione reductase activities and malondialdehyde were observed in all treated rats as compared with controls. Significantly higher superoxide dismutase activity was observed in rats at the middle and high doses than in controls. The authors suggested that the significant differences in the duration of the oestrus cycle and in ovarian tissue architecture were due to monosodium glutamate-related changes in secretion of pituitary luteinizing and follicle-stimulating hormone and of ovarian progesterone and oestrogen. They presumed that the increased antioxidant enzyme activities were an adaptive response to elevated levels of luteinizing and follicle-stimulating hormones and oestradiol. They also postulated that monosodium glutamate increased the number of ovarian follicles by reducing oxidative damage, as suggested by decreased glutathione reductase, glutathione peroxidase and malondialdehyde, and reduced the size of the corpus luteum by reducing luteinizing and follicle-stimulating hormone and oestradiol levels in the diestrous phase.
141
Amino acids and related substances (addendum)
In a 28-day study of reproductive toxicity, groups of eight male rats were treated with 0 (vehicle), 60 or 120 mg/kg bw per day monosodium glutamate (No. 1420; lot no. unspecified; purity 95%) in distilled water (112). No differences in body weights were seen between treated and control groups. Significantly increased abnormal sperm morphology and significantly decreased sperm count, motility and viability were observed at the highest intake level. Significantly lower absolute weights of the testes, epididymis, prostate and seminal vesicles were observed in treated rats than in control rats. At the highest intake, histopathology revealed missing spermatids and thinner germinal epithelium linings in the testes, degenerative alteration of epithelial cells and reduced spermatozoa mass in the epididymis, less prostatic fluid in the lumen, thinner, less folded epithelium of the prostate and smaller nuclei as well as irregular and uneven epithelium of the seminal vesicles as compared with controls. Decreased spermatid density in the seminiferous tubules, reduced spermatozoan mass in the epididymal lumen, atrophy of the prostate lumen and decreased mucosal folding of the seminal vesicles were observed in the group with middle intake as compared with controls. When antioxidant enzyme activities and oxidation products were assessed in testis tissues, significantly decreased superoxide dismutase activity and increased malondialdehyde levels were reported in treated animals as compared with control rats. A significant decrease in reduced glutathione and increased advanced oxidation protein product levels were reported only at the highest dose. Significantly lower luteinizing hormone activity was reported at the highest dose than in controls. The authors suggested that the results indicate significant oxidative stress and an adverse effect on the reproductive organs of male rats.
(ii) L-Glycine (No. 1421)L-Glycine (No. 1421; lot no. unspecified; purity unspecified) was tested in mouse embryo cultures in a study designed to assess the potential of glycine to prevent hyperglycaemia-induced embryopathy (113). Early somite mouse embryos were cultured in one of four media: a standard medium, a hyperglycaemic medium (50 mM glucose), a medium with 50 mM glucose and 1 mM glycine and the standard medium with 1 mM glycine. Addition of glycine alone to the culture medium did not affect embryonic development under these experimental conditions. Embryos cultured in hyperglycaemic medium had a higher incidence of malformations than controls. Addition of 1 mM glycine decreased the number of central nervous system malformations, and the hyperglycaemic medium reduced embryonic growth, as evidenced by a decreased yolk sac diameter, crown–rump and head lengths, DNA content and lipid peroxidation, as indicated by the whole-embryo content of malondialdehyde, a lipid oxidation product. The
142
WH
O F
ood
Addi
tives
Ser
ies N
o. 8
0, 2
022
Safety evaluation of certain food additives Eighty-ninth JECFA
authors hypothesized that the protective effects of glycine are due to its antioxidant effects, its ability to prevent antiglycation and/or other protective mechanisms.
(iii) L-Methionine (No. 1424) and taurine (No. 1435)In a study to investigate the possible hepatotoxicity of hyperhomocysteinaemia, groups of male Wistar rats were fed a diet high in methionine (No. 1424; lot no. unspecified; purity unspecified) with and without taurine (No. 1435; lot no. unspecified; purity unspecified) in drinking-water for 6 months (114). Taurine was added to determine whether it protects against hepatotoxicity induced by a high methionine diet. The rats were fed a control diet (six per group), control diet and 15 g/L taurine in drinking-water (equivalent to 300 mg/kg bw per day; six per group), a high-methionine diet (20 000 mg/kg feed; eight per group) or a high-methionine diet with taurine in drinking-water (eight per group). At the end of the treatment period, plasma and liver samples were analysed for the presence of homocysteine, lipid oxidation markers and liver injury enzymes (ALT and AST). Plasma homocysteine levels and ALT and AST activities were significantly increased in the group fed the high-methionine diet, with increases in hepatic malondialdehyde and diene conjugates and decreases in hepatic reduced glutathione levels, glutathione peroxidase and glutathione S-transferase activities but no change in superoxide dismutase activity. The authors suggested that the results indicate that a high-methionine diet induces oxidative stress in the liver. Hepatic tissue damage was assessed for markers of apoptosis and necrosis by immunohistochemistry and for changes in nitrotyrosine levels by western blotting. Histopathology showed an increase in the number of lymphocytes and in hepatocyte degeneration and microvesicular steatosis, confirming that a high-methionine diet damages the liver. The authors concluded that hepatocyte apoptosis and nitrotyrosine formation were increased in animals fed a high-methionine diet. Taurine alone was reported to have no effect on the parameters evaluated and to cause no increase in necrotic or apoptotic events in the liver but alleviated the effects of the high-methionine diet when administered concomitantly.
(iv) Taurine (No. 1435)In an 8-week study of testicular toxicity, groups of 10 Wistar rats were treated with 100 mg/kg bw per day of taurine (No. 1435; lot no. unspecified; purity unspecified) by gavage to investigate whether taurine protects against testicular and sperm toxicity induced by nandrolone decanoate, an anabolic steroid (115). There was no untreated control group, but a group that received saline by gavage with a single weekly intramuscular injection of peanut oil and benzyl alcohol (90/10 v/v) was included as a control for administration of nandrolone decanoate
143
Amino acids and related substances (addendum)
by intramuscular injection. Additional groups received intramuscular injections of 10 mg/kg per week nandrolone decanoate alone or in combination with 100 mg/kg bw per day taurine by gavage. Blood and testes were collected for analysis of serum testosterone, testicular enzyme activity, sperm characteristics, organ weight and histopathology after anaesthesia with ether. No significant difference in testis weight, sperm count, sperm viability, sperm motility, sperm abnormalities or increases in lactase dehydrogenase activity, serum testosterone, steroidogenic enzyme activity (3-β-hydroxysteroid dehydrogenase and 17-β-hydroxysteroid dehydrogenase), testicular malondialdehyde levels, nitric oxide levels or superoxide dismutase activity were observed, and no differences were found in gene expression of TNF-α, ICAM-1, MMP-9 and cytochrome c, or in the 8-hydroxy-2-deoxyguanosine content of DNA from taurine-treated rats in comparison with the control group. In rats treated with nandrolone or a combination of taurine and nandrolone, significant differences from the control group were seen in all these parameters. The authors concluded that taurine abolished the nandrolone decanoate-induced deleterious effects and protected rat sperm and testis from injury by its antioxidant, anti-inflammatory and anti-apoptotic effects. A single-cell alkaline phosphatase comet assay conducted on cells from the testes of treated rats showed no significant differences in the percentage of tailed cells, tail length, percentage of tail DNA or tail moment between taurine-treated and control rats. Rats treated with nandrolone or a combination of taurine and nandrolone showed significant increases in these parameters of DNA damage as compared with the control group.
(v) L-Arginine (No. 1438)In a 28-day study, groups of four adult male albino Wistar rats were given distilled water, 60 mg/kg bw per day of L-arginine (No. 1438; lot no. unspecified; purity unspecified), 90 mg/kg bw per day of glutamate (No. 1420; lot no. unspecified; purity unspecified), 15 mg/kg bw per day monosodium glutamate (No. 1420; lot no. unspecified; purity unspecified), 60 mg/kg bw per day of L-arginine and 90 mg/kg bw per day glutamate or 60 mg/kg bw per day of L-arginine and 15 mg/kg bw per day of monosodium glutamate by oral gavage (42). The aim of the study was to determine possible alterations in serum biochemistry and liver histology induced by arginine, glutamate or monosodium glutamine alone or arginine in combination with glutamate or monosodium glutamate. Rats were killed 24 h after the 28-day treatment, and blood and liver samples were collected for haematology and histology. Rats treated with arginine, glutamate or monosodium glutamate alone showed significantly increased ALT activity, whereas rats treated with arginine plus glutamate or monosodium glutamate showed significantly decreased ALT activity. All treated groups had significantly
144
WH
O F
ood
Addi
tives
Ser
ies N
o. 8
0, 2
022
Safety evaluation of certain food additives Eighty-ninth JECFA
higher AST activity and AST:ALT ratio than controls, although the increase was consistently lower in the group treated with arginine than in the other groups. Moderate haemorrhaging and haemosiderosis, mild-to-moderate hepatic necrosis in the periportal areas and mild fibroplasia with mononuclear leukocyte infiltration were observed in the livers of treated rats.
3. References1. Waggle DH, Lambert MA, Miller GD, Farrell EP, Devoe CW. Extensive analysis of flours and millfeeds
made from nine different wheat mixes. Cereal Chem. 1967:44:48–60.
2. Meyers SP. Aquaculture feeds and chemoattractants. Infofish Market Dig. 1987;1:35–7.
3. Clarke WC, Virtanen E, Blackburn J, Higgs DA. Effects of dietary betaine/amino acid additive on growth and seawater adaptation in yearling chinook salmon. Aquaculture. 1994;121:137–45.
4. Mar MH, Zeisel SH. Betaine in wine: answer to the French paradox? Med Hypoth. 1999;53:383–5.
5. Zeisel SH, Mar MH, Howe JC, Holden JM. Concentrations of choline-containing compounds and betaine in common foods. J Nutr. 2003;133:1302–7.
6. 2015 IOFI global poundage survey. Brussels: International Organization of the Flavor Industry; 2018. Submitted to WHO by the International Organization of the Flavor Industry, Brussels.
7. Interim inquiry on volume use and added use levels for flavoring agents to be presented at the JECFA 89th meeting. Private communication to the International Organization of the Flavor Industry Brussels; 2019. Submitted to WHO by the International Organization of the Flavor Industry, Brussels.
8. Hayes KC, Pronczuk A, Cook MW, Robbins MC. Betaine in sub-acute and sub-chronic rat studies. Food Chem Toxicol. 2003;41:1685–700.
9. Okamura T. A 28-day dietary toxicity study of L-γ-glutamyl-L-valyl-glycine (KF001) in rats. Study no. B-6880. Gotemba Laboratory, Bozo Research Center Inc., Shizuoka, Japan. Unpublished report to the Expert Panel of the Flavor and Extract Manufacturers Association, 2010. Submitted to WHO by the International Organization of the Flavor Industry, Brussels.
10. Harper MS, Shen ZA, Barnett JF Jr, Krsmanovic L, Myhre A, Delaney B. N-Acetyl-glutamic acid: evaluation of acute and 28-day repeated dose oral toxicity and genotoxicity. Food Chem Toxicol. 2009;47:2723–9.
11. Kawai Y, Okai M, Takeshita S, Tomita M, Nakagawa H, Yoshinaka T, et al. Acute and subacute toxicity of cystenosine, inosine and cystine in rats (in Japanese). Oyo Yakuri Pharmacometr. 1978;15(2):199–221.
12. Stofberg J, Grundschober F. Consumption ratio and food predominance of flavoring materials. Perfum Flavorist. 1987;12(4):27–68.
13. Cramer GM, Ford RA, Hall RL. Estimation of toxic hazard – a decision tree approach. Food Cosmet Toxicol. 1978;16(3):255–76.
14. Amino Y. Supplemental Information for L-gamma-glutamyl-L-2-aminobutyric acid: in vitro metabolism report. Unpublished report to the Expert Panel of the Flavor and Extract Manufacturers Association, 2011. Submitted to WHO by the International Organization of the Flavor Industry, Brussels.
145
Amino acids and related substances (addendum)
15. Amino Y. Supplemental Information for L-gamma-glutamyl-L-norvaline: in vitro metabolism report. Unpublished report to the Expert Panel of the Flavor and Extract Manufacturers Association, 2011. Submitted to WHO by the International Organization of the Flavor Industry, Brussels.
16. Amino Y. Supplemental Information for L-gamma-glutamyl-L-norvalyl-glycine: in vitro metabolism report. Unpublished report to the Expert Panel of the Flavor and Extract Manufacturers Association, 2011. Submitted to WHO by the International Organization of the Flavor Industry, Brussels.
17. Sved DW, Godsey JL, Ledyard SL, Mahoney AP, Stetson PL, Ho S, et al. Absorption, tissue distribution, metabolism and elimination of taurine given orally to rats. Amino Acids. 2007;32:459–66.
18. Ghandforoush-Sattari M, Mashayekhi S, Krishna CV, Thompson JP, Routledge PA. Pharmacokinetics of oral taurine in healthy volunteers. J Amino Acids. 2010;2010:1–5.
19. Generally recognized as safe (GRAS) notification for L-methionine 85% from a modified Escherichia coli K-12 (FDA AGRN 16). Washington DC: Food and Drug Administration, Center for Veterinary Medicine, Division of Animal Feeds; 2013.
20. GRAS notice: L-Methionine 90% (trade name: L-MetPro) as a source of methionine in animal diets (FDA AGRN 2). Washington DC: Food and Drug Administration, Center for Veterinary Medicine, Division of Animal Feeds; 2015.
21. Dilger RN, Toue S, Kimura T, Sakai R, Baker DH. Excess dietary L-cysteine, but not L-cystine, is lethal for chicks but not for rats or pigs. J Nutr. 2007;137:331–8.
22. Shibui Y, Sakai R, Manabe Y, Masuyama T. Comparisons of L-cysteine and D-cysteine toxicity in 4-week repeated-dose toxicity studies of rats receiving daily oral administration. J Toxicol Pathol. 2017;30:217–29.
23. 4-week toxicity study by oral administration (dietary admixture) in rats. Study no. 14458 TSR/MSG (monosodium glutamate). Miserey: Centre International de Toxicologie, 1997. Unpublished report submitted to the European Food Safety Authority, Parma, Italy. [Cited in EFSA, 2017]
24. Centre International de Toxicologie (CIT) (1997b). Complementary 4-week toxicity study by oral administration (dietary admixture) in rats. Study no. 14716 TSR/MSG (Monosodium glutamate) (RC035/01). Unpublished report submitted to the European Food Safety Authority, Parma, Italy. [Cited in EFSA, 2017].
25. Onaolapo OJ, Onaolapo AY, Akanmu MA, Gbola O (2016). Evidence of alterations in brain structure and antioxidant status following ‘low-dose’ monosodium glutamate ingestion. Pathophysiology. 23:147-56.
26. Monosodium L-glutamate monohydrate produced by a new method: 90-day repeated dose toxicity study by dietary administration in rats. Study no. 9957 (258-057). Shizuoka: Biosafety Research Center, 2007. Unpublished report submitted to the European Food Safety Authority, Parma.
27. Repeated-dose (13-week) oral toxicity study in rats with monosodium L-glutamate monohydrate produced by a GMM production strain. Netherlands Organisation for Applied Scientific Research, The Hague, 2014 (TNO project no. 093.25059).
28. Monosodium L-glutamate monohydrate produced by a new method: 90-day repeated dose toxicity study by dietary administration in dogs. Study no. 9959 (258-059). Shizuoka: Biosafety Research Center, 2007. Unpublished report submitted to the European Food Safety Authority, Parma.
146
WH
O F
ood
Addi
tives
Ser
ies N
o. 8
0, 2
022
Safety evaluation of certain food additives Eighty-ninth JECFA
29. Contini MC, Fabro A, Millen N, Benmelej A, Mahieu S. Adverse effects in kidney function, antioxidant systems and histopathology in rats receiving monosodium glutamate diet. Exp Toxicol Pathol. 2017;69:547–56.
30. Shibui Y, Miwa T, Yamashita M, Chin K, Kodama T. A 4-week repeated dose toxicity study of glycine in rats by gavage administration. J Toxicol Pathol. 2013;26:405–12.
31. Tsubuku S, Hatayama K, Katsumata T, Nishimura N, Mawatari K, Smriga M, et al. Thirteen-week oral toxicity study of branched-chain amino acids in rats. Int J Toxicol. 2004;23:119–26.
32. Matsuzaki K, Kato H, Sakai R, Toue S, Amao M, Kimura T. Transcriptomics and metabolomics of dietary leucine excess. J Nutr. 2005;135:1571–5s.
33. Toue S, Kodama R, Amao M, Kawamata Y, Kimura T, Sakai R. Screening of toxicity biomarkers for methionine excess in rats. J Nutr. 2006;136:1716–21s.
34. Chin K, Toue S, Kawamata Y, Watanabe A, Miwa T, Smriga M, et al. A 4-week toxicity study of methionine in male rats. Int J Toxicol. 2015;34:223–41.
35. Shibui Y, Miwa T, Kodama T, Gonsho A 28-Day dietary toxicity study of L-phenylalanine in rats. Fundam Toxicol Sci. 2014;1:29–38.
36. Tada Y, Yano N, Takahashi H, Yuzawa K, Ando H, Kubo Y, et al. Toxic effects of L-aspartic acid at high dose levels on kidneys and salivary glands in Fischer 344 rats detected in a 90-day feeding study. Food Chem Toxicol. 2008;46:2789–95.
37. Wong AW, Magnuson BA, Nakagawa K, Bursey RG. Oral subchronic and genotoxicity studies conducted with the amino acid, L-glutamine. Food Chem Toxicol. 2011;49:2096–101.
38. Tsubuku S, Hatayama K, Mawatari K, Smriga M, Kimura T. Thirteen-week oral toxicity study of L-glutamine in rats. Int J Toxicol. 2004;23(2):107–12.
39. Shibui Y, Manabe Y, Kodama T, Gonsho A. 13-week repeated dose toxicity study of L-tyrosine in rats by daily oral administration. Food Chem Toxicol. 2016;87:55–64.
40. GRAS exemption claim for taurine for use in enhanced water beverages (FDA GRN 586). Washington DC: Food and Drug Administration, Center for Food Safety and Applied Nutrition; 2015.
41. Aoki M, Mochizuki M, Okamura T, Hatayama K, Nakamura A, Morishita K. A 4-week oral toxicity study of L-alanine in rats with a recovery period of 2 weeks. Fundam Toxicol Sci. 2014;1(2):63–72.
42. Egbuonu ACC, Ezeanyika LUS, Ejikeme PM, Obidoa O. Histomorphologic alterations in the liver of male Wistar rats treated with L-arginine glutamate and monosodium glutamate. Res J Environ Toxicol. 2010;4(4):205–13.
43. Tsubuku S, Hatayama K, Mawatari K, Smriga M, Kimura T. Thirteen-week oral toxicity study of L-arginine in rats. Int J Toxicol. 2004;23:101–5.
44. Tsubuku S, Mochizuki M, Mawatari K, Smriga M, Kimura T. Thirteen-week oral toxicity study of L-lysine hydrochloride in rats. Int J Toxicol. 2004;23:113–8.
45. Aoki M, Ishida S, Fukuzumi H, Morishita K. A 13-week feeding toxicity study of L-threonine in rats with a recovery period of 5 weeks. Fundam Toxicol Sci. 2014;1(2):49–62.
46. Ishida S, Sarada M, Seki H, McGirr L, Lau A, Morishita K. Genotoxicity and subchronic oral toxicity of L-ornithine monohydrochloride. Regul Toxicol Pharmacol. 2013;67:360–71.
147
Amino acids and related substances (addendum)
47. Nnadozie JO, Chijioke UO, Okafor OC, Olusina DB, Oli AN, Nwonu PC, et al. Chronic toxicity of low dose monosodium glutamate in albino Wistar rats. BMC Res Notes. 2019;12:593.
48. Kawabe M, Sano M, Hagiwara A, Tamano S, Shuzuko S, Shirai T. Lack of carcinogenicity of L-isoleucine in F344/DuCrj rats. Food Chem Toxicol. 2006;44:278–85.
49. Edozien JC, Switzer BR. Influence of diet on growth in the rat. J Nutr. 1978;108:282–90.
50. Kitahori Y, Konishi N, Nakagawa Y, Cho M, Naitoh H, Yamamoto K, et al. Lack of carcinogenicity of L-cysteine monohydrochloride in Fischer 344 rats. J Toxicol Pathol. 1997;10:83–9.
51. Egbuonu ACC, Ezeokonkwo CA, Ejikeme PM, Obidoa O, Ezeanyika LUS. Some biochemical effects of sub-acute oral administration of L-arginine on monosodium glutamate-fed Wistar ablino rats 2: serum alkaline phosphatase, total acid phosphatase and aspartate aminotransferase activities. Asian J Biochem. 2010;5(2):89–95.
52. Cohen SM, Garland EM, Cano M, St John MK, Khachab M, Wehner JM, et al. Effects of sodium ascorbate, sodium saccharin and ammonium chloride on the male rat urinary bladder. Carcinogenesis. 1995;16:2743–50.
53. Shibata MA, Tanaka H, Kawabe M, Sano M, Hagiwara A, Shirai T. Lack of carcinogenicity of monosodium l-glutamate in Fischer 344 rats. Food Chem Toxicol. 1995;33:383–91.
54. de Groot AP, Feron VJ, Immel HR. Induction of hyperplasia in the bladder epithelium of rats by a dietary excess of acid or base: implications for toxicity/carcinogenicity testing. Food Chem Toxicol. 1988;26:425–34.
55. Kitahori Y, Konishi N, Hayashi I, Nakahashi K, Kitamura M, Nakamura Y, et al. Carcinogenicity study of glycine in Fischer 344 rats. J Toxicol Pathol. 1994;7:471–80.
56. Munday R, Manns E. Toxicity of aromatic disulphides. III. In vivo haemolytic activity of aromatic disulphides. J Appl Toxicol. 1985;5:414–7.
57. Munday R, Munday JS. Comparative haemolytic activity of bis(phenylmethyl)disulphide, bis(phenylethyl)disulphide and bis(phenylpropyl)disulphide in rats. Food Chem Toxicol. 2003;41:1609–15.
58. Munday R, Munday JS, Munday CM. Comparative effects of mono-, di-, tri- and tetrasulfides derived from plants of the Allium family: redox cycling in vitro and hemolytic activity and phase 2 enzyme induction in vivo. Free Radic Biol Med. 2003;34:1200–11.
59. Munday R. Harmful and beneficial effects of organic monosulfides, disulfides and polysulfides in animals and humans. Chem Res Toxicol. 2012;25:47–60.
60. Klavins JV, Kinney TD, Kaufman N. Body iron levels and hematologic findings during excess methionine feeding. J Nutr. 1963;79:101–4.
61. Klavins JV, Kinney TD, Kaufman N. Histopathologic changes in methionine excess. Arch Pathol. 1963;75:661–73.
62. Mengel CE, Klavins JV. Development of hemolytic anemia in rats fed methionine. J Nutr. 1967;92:104–10.
63. Muramatsu K, Odagiri H, Morishita S, Takeuchi H. Effect of excess levels of individual amino acids on growth of rats fed casein diets. J Nutr. 1971;101:1117–25.
148
WH
O F
ood
Addi
tives
Ser
ies N
o. 8
0, 2
022
Safety evaluation of certain food additives Eighty-ninth JECFA
64. Peng Y, Gubin J, Harper AE, Vavich MG, Kemmerer AR. Food intake regulation: amino acid toxicity and changes in rat brain and plasma amino acids. J Nutr. 1973;103:608–17.
65. Buchner A, Sreebny LM. Enlargement of salivary glands. Review of the literature. Oral Surg Oral Med Oral Pathol. 1972;34:209–22.
66. Abe K, Dawes C. The secretion of protein and of some electrolytes in response to alpha- and beta-adrenergic agonists by rat parotid and submandibular salivary glands enlarged by chronic treatment with isoproterenol. J Dent Res. 1980;59:1081–9.
67. Mehansho H, Clements S, Sheares BT, Smith S, Carlson DM. Induction of proline-rich glycoprotein synthesis in mouse salivary glands by isoproterenol and by tannins. J Biol Chem. 1985;260:4418–23.
68. Jackson CD, Blackwell BN. Subchronic studies of doxylamine in Fischer 344 rats. Fundam Appl Toxicol. 1988;10:243–53.
69. Burdock GA, Flamm WG, Carabin LG. Toxicity and mutagenicity studies of DN-50000((R)) and RP-1((R)) enzymes. Food Chem Toxicol. 2000;38:429–42.
70. Baldrick P, Richardson D, Wheeler AW. Review of L-tyrosine confirming its safe human use as an adjuvant. J Appl Toxicol. 2002;22:333–44.
71. Nagaoka S, Masaki H, Aoyama Y, Yoshida A. Effects of excess dietary tyrosine or certain xenobiotics on the cholesterogenesis in rats. J. Nutr. 1986;116:726–32.
72. Opinion of the Scientific Committee on Food on additional information on “energy” drinks, expressed on 5 March 2003 (SCF/CS/PLEN/ENDRINKS/16 Final). Brussels: European Commission, Scientific Committee on Food; 2003.
73. Scientific opinion. The use of taurine and D-glucurono-γ-lactone as constituents of so-called “energy” drinks. Scientific opinion of the Panel on Food Additives and Nutrient Sources added to Food. EFSA J. 2009;935:1–31.
74. Robinson TM, Sewell D, Greenhaff PL. L-Arginine ingestion after rest and exercise: effects on glucose disposal. Med Sci Sports Exerc. 2003;35(8):1309–15.
75. Kawabe M. Subchronic toxicity study of L-isoleucine in F344 rats. J Toxicol Environ Health Part A. 1996;47(5):499–508.
76. Asquith JC. Bacterial reverse mutation assay: betaine monohydrate. Study no. M/AMES/17027. Toxicol Laboratories Ltd, Ledbury, 1989. Unpublished report to the Expert Panel of the Flavor and Extract Manufacturers Association. Submitted to WHO by the International Organization of the Flavor Industry, Brussels.
77. Asquith JC. Metaphase analysis of human lymphocytes treated with betaine monohydrate. Study no. M/HL/17028. Toxicol Laboratories Ltd, Ledbury, 1989. Unpublished report to the Expert Panel of the Flavor and Extract Manufacturers Association. Submitted to WHO by the International Organization of the Flavor Industry, Brussels.
78. Evaluation of the mutagenicity activity of L-glutamic acid in the Salmonella typhimurium reverse mutation assay and the Escherichia coli reversed mutation assay (with independent repeat) (Notox Project 493744). Strasburg: Institut Pluridisciplinaire Hubert Curien; 2010.
79. Takumi A, Kawamata Y, Sakai R, Narita T. In vitro and in vivo genotoxicity studies on monosodium L-glutamate monohydrate. Regul Toxicol Pharmacol. 2019;107:104399.
149
Amino acids and related substances (addendum)
80. Ataseven N, Yüzbaşıoğlu D, Keskin AÇ, Ünal F. Genotoxicity of monosodium glutamate. Food Chem Toxicol. 2016;91:8–18.
81. Diaz D, Scott A, Carmichael P, Shi W, Costales C. Evaluation of an automated in vitro micronucleus assay in cholesterol-K1 cells. Mutat Res. 2007;630:1–13.
82. de Veer I, Moriske HJ, Ruden H. Photochemical decompositon of organic compounds in water after UV-irradiation: investigation of positive mutagenic effects. Toxicol Lett. 1994;72:113–9.
83. Karaman S, Myhre A, Donner EM, Munley SM, Delaney B. Mutagenicity studies with N-acetyl-L-aspartic acid. Food Chem Toxicol. 2009;47:1936–40.
84. Thompson C, Morley P, Kirkland D, Proudlock R. Modified bacterial mutation test procedures for evaluation of peptides and amino acid-containing material. Mutagenesis. 2005;20:345–50.
85. Khandoudi N, Porte P, Chtourou S, Nesslany F, Marzin D, Le Curieux F. The presence of arginine may be a source of false positive results in the Ames test. Mutat Res Genet Toxicol Environ Mutagen. 2009;679:65–71.
86. Oguma Y. A bacterial reverse mutation test of L-γ-glutamyl-L-valyl-glycine (KF001). Study no. T-0564. Tokyo Laboratory, Bozo Research Center Inc., Tokyo, 2010. Unpublished report to the Expert Panel of the Flavor and Extract Manufacturers Association. Submitted to WHO by the International Organization of the Flavor Industry, Brussels.
87. Sono A. Chromosome aberration test in cultured mammalian cells treated with L-γ-glutamyl-L-valyl-glycine (KF001). Study no. M-1437. Gotemba Laboratory, Bozo Research Center Inc., Shizuoka, 2010. Unpublished report to the Expert Panel of the Flavor and Extract Manufacturers Association. Submitted to WHO by the International Organization of the Flavor Industry, Brussels.
88. Asquith JC. Mouse micronucleus test: betaine monohydrate. Study no. M/MMN/17029. Toxicol Laboratories Ltd, Ledbury, 1989. Unpublished report to the Expert Panel of the Flavor and Extract Manufacturers Association. Submitted to WHO by the International Organization of the Flavor Industry, Brussels.
89. Aissa AF, Gomes TDUH, Almeida MR, Hernandes LC, Darin JDC, Bianchi MLP, et al. Methionine concentration in the diet has a tissue-specific effect on chromosomal stability in female mice. Food Chem Toxicol. 2013;62:456–62.
90. Amaral CLD, Bueno RBL, Burim RV, Queirzon RHC, Bianchi MLP, Antunes LMG. The effects of dietary supplementation of methionine on genomic stability and p53 gene promoter methylation in rats. Mutat Res Genet Toxicol Environ Mutagen. 2011;722:78–83.
91. Oliveira RJ, Baise E, Mauro MO, Pesarini JR, Matuo R, Silva AF, et al. Evaluation of chemopreventive activity of glutamine by the comet and the micronucleus assay in mice's peripheral blood. Environ Toxicol Pharmacol. 2009;28:120-4.
92. Ishii T. A micronucleus test of L-γ-glutamyl-L-valyl-glycine (KF001) in mice. Study no. M-1432. Gotemba Laboratory, Bozo Research Center Inc., Shizuoka, 2010. Unpublished report to the Expert Panel of the Flavor and Extract Manufacturers Association. Submitted to WHO by the International Organization of the Flavor Industry, Brussels.
93. Aeschbacher HU, Finot PA, Wolleb U. Interactions of histidine-containing test substances and extraction methods with the Ames mutagenicity test. Mutat Res. 1983;113:103–16.
94. Kazmer S, Katz M, Weinstein D. The effect of culture conditions and toxicity on the Ames Salmonella/microsome agar incorporation mutagenicity assay. Environ Mutagen. 1983;5:541–51.
150
WH
O F
ood
Addi
tives
Ser
ies N
o. 8
0, 2
022
Safety evaluation of certain food additives Eighty-ninth JECFA
95. Gruter A, Friederich U, Wurgler FE. The mutagenicity of edible mushrooms in a histidine-independent bacterial test system. Food Chem Toxicol. 1991;29:159–65.
96. Prival MJ, Simmon VF, Mortelmans KE. Bacterial mutagenicity testing of 49 food ingredients gives very few positive results. Mutat Res. 1991;260:321–9.
97. Albertini S, Gocke E. Renin inhibitors as an example of presumptive irrelevant positive findings in the Salmonella/mammalian microsome assay (Ames test). Mutat Res. 1993;298:237–46.
98. Nylund L, Einisto P. Mutagenicity testing of protein-containing and biological samples using the Ames/Salmonella plate incorporation test and the fluctuation test. Mutat Res. 1993;272:205–14.
99. Kustu SG, Ames GFL. The hisP protein, a known histidine transport component in Salmonella typhimurium, is also an arginine transport component. J Bacteriol. 1973;116:107–13.
100. Monosodium L-glutamate monohydrate produced by a new method: teratogenicity study in rats. Study no. 9958 (258-058). Unpublished report from Biosafety Research Center, Shizuoka, 2007. Submitted to the European Food Safety Authority, Parma.
101. Monosodium L-glutamate monohydrate produced by a new method: reproduction study in rats. Study no. 9976 (258-060). Unpublished report from Biosafety Research Center, Shizuoka, 2008. Submitted to the European Food Safety Authority, Parma.
102. Mawatari K, Katsumata T, Uematsu M, Katsumata T, Yoshida J, Smriga M, et al. Prolonged oral treatment with an essential amino acid L-leucine does not affect female reproductive function and embryo-fetal development in rats. Food Chem Toxicol. 2004;42:1505–11.
103. Priority based assessment of food additives (PAFA) database. Washington DC: Food and Drug Administration, Center for Food Safety and Applied Nutrition; 1983:58.
104. Li M, Reynolds CM, Sloboda DM, Gray C, Vickers MH. Effects of taurine supplementation on hepatic markers of inflammation and lipid metabolism in mothers and offspring in the setting of maternal obesity. PLoS One. 2013;8(10):1–12.
105. Sharma A, Prasongwattana V, Cha’on U, Selmi C, Hipkaeo W, Boonnate P, et al. Monosodium glutamate (MSG) consumption is associated with urolithiasis and urinary tract obstruction in rats. PLoS One. 2013;8(9):1–9.
106. Sharma A, Wongkham C, Prasongwattana V, Boonnate P, Thanan R, Reungjui S, et al. Proteomic analysis of kidney in rats chronically exposed to monosodium glutamate. PLoS One. 2014;9(12):1–11.
107. Stegink LD, Brummel MC, Boaz DP, Filer LJ Jr. Monosodium glutamate metabolism in the neonatal pig: conversion of administered glutamate into other metabolites in vivo. J Nutr. 1973;103:1146–54
108. Vinay P, Lemieux G, Gougoux A, Halperin M. Regulation of glutamine metabolism in dog kidney in vivo. Kidney Int. 1986;29:68–79.
109. Kaufman AM, Kahn T. Complementary role of citrate and bicarbonate excretion in acid–base balance in the rat. Am J Physiol. 1988;255:F182–7.
110. Cheema-Dhadli S, Lin SH, Halperin ML. Mechanisms used to dispose of progressively increasing alkali load in rats. Am J Physiol Renal Physiol. 2002;282:F1049–55.
111. Mondal M, Sarkar K, Nath PP, Paul G. Monosodium glutamate suppresses the female reproductive function by impairing the functions of ovary and uterus in rat. Environ Toxicol. 2017;33:198–208.
151
Amino acids and related substances (addendum)
112. Jubaidi FF, Mathialagan RD, Noor MM, Taib IS, Budin SB. Monosodium glutamate daily oral supplementation: study of its effects on male reproductive system on rat model. Syst Biol Reprod Med. 2019;65(3):194–204.
113. Martinez-Galero E, Paniagua-Casatro N, Perez-Pasten R, Madrigal-Bujaidar E, Chamorro-Cevallos G. Glycine decreases developmental damage induced by hyperglycaemia in mouse embryos. J Pharm Pharmacol. 2008;60(7):895–900.
114. Yalcinkaya S, Unlucerci Y, Giris M, Olgac V, Dogru-Abbasoglu S, Uysal M. Oxidative and nitrosative stress and apoptosis in the liver of rats fed on high methionine diet: Protective effect of taurine. Nutrition. 2009;25(4):436–44.
115. Ahmed MAE. Amelioration of nandrolene decanoate-induced testicular and sperm toxicity in rats by taurine: effects on steroidogenesis, redox and inflammatory cascades, and intrinsic apoptotic pathway. Toxicol Appl Pharmacol. 2015;282:285–96.

152
153
Phenol and phenol derivatives (addendum)First draft prepared bySzabina Stice,1 Jack Bend,2 Michael Dinovi,1 Maria Frutos Fernandez3
and Daniel Folmer1
1 Office of Food Additive Safety, Center for Food Safety and Applied Nutrition, Food and Drug Administration, College Park (MD), USA
2 Department of Pathology and Laboratory Medicine, Schulich School of Medicine and Dentistry, Western University, London, Ontario, Canada
3 Department of Agro Food Technology, Universidad Miguel Hernández, Elche, Spain
1. Evaluation 1531.1 Introduction 1531.2 Assessment of dietary exposure 1541.3 Absorption, distribution, metabolism and elimination 1541.4 Application of the revised procedure for the safety evaluation of
flavouring agents 1591.5 Consideration of combined intakes from use as flavouring agents 1601.6 Consideration of secondary components 1601.7 Consideration of additional data on previously evaluated
flavouring agents 1611.8 Conclusions 161
2. Relevant background information 1622.1 Additional considerations on exposure 1622.2 Biological data 162
2.2.1 Biochemical data: hydrolysis, absorption, distribution, metabolism and excretion 162
2.2.2 Toxicological studies 1643. References 180
1. Evaluation
1.1 IntroductionThe Committee evaluated an additional seven flavouring agents in the group of phenol and phenol derivatives for the first time. In addition, the Committee considered new data on four previously evaluated flavouring agents in this group and data on oregano oil with the principal constituents carvacrol (No. 710) and thymol (No. 709).
The Committee evaluated 48 members of this group of flavouring agents at its fifty-fifth meeting (Annex 1, reference 149), 13 members at its seventy-
154
WH
O F
ood
Addi
tives
Ser
ies N
o. 8
0, 2
022
Safety evaluation of certain food additives Eighty-ninth JECFA
third meeting (Annex 1, reference 202), 3 members at its seventy-sixth meeting (Annex 1, reference 211) and 4 members at its seventy-ninth meeting (Annex 1, reference 220). The Committee concluded that all 68 flavouring agents were of no safety concern at the estimated dietary exposures.
The additional flavouring agents in this group evaluated at the present meeting are (±)-homoeriodictyol sodium salt (No. 2256), (±)-naringenin (No. 2257), (2R)-3´,5-dihydroxy-4´-methoxyflavanone (No. 2258), 7,8-dihydroxyflavone (No. 2259), (2S)-3´,7-dihydroxy-8-methyl-4´-methoxyflavan (No. 2260), (R)-5-hydroxy-4-(4´-hydroxy-3´-methoxyphenyl)-7-methylchroman-2-one (No. 2261) and 3-(3-hydroxy-4-methoxyphenyl)-1-(2,4,6-trihydroxyphenyl)propan-1-one (No. 2262). Four of these agents (Nos 2256, 2257, 2258 and 2260) have been reported to occur naturally in Yerba santa, citrus juices, Sophora (Fabaceae), Dracaena cambodiana and Lycoris radiate (1–7).
Six of the seven additional members of this group were evaluated according to the revised procedure for the safety evaluation of flavouring agents (Annex 1, reference 230).
1.2 Assessment of dietary exposureThe total annual volume of production of the seven additional flavouring agents in the group of phenol and phenol derivatives is 1050 kg in Latin America and 937 kg in the USA. All of the annual production volume in Latin America is accounted for by (±)-naringenin (No. 4797), and 91.9% of the annual production volume in the USA is accounted for by 3-(3-hydroxy-4-methoxyphenyl)-1-(2,4,6-trihydroxyphenyl)propan-1-one (No. 4872).
Dietary exposures were estimated by both the single-portion exposure technique (SPET) and the maximized survey-derived intake (MSDI) method, and; the higher of the two values for each flavouring agent is reported in Table 1. The SPET and MSDI method values are in the range of 360–12000 and 0.01–89 μg/day, respectively. The estimated daily dietary exposure was highest for (±)-naringenin (No. 4797) (the SPET value obtained for non-alcoholic soft beverages).
Annual volumes of production of this group of flavouring agents and the daily dietary exposures calculated using both MSDI and SPET methods are summarized in Table 2.
1.3 Absorption, distribution, metabolism and elimination Information on the absorption, distribution, metabolism and elimination of flavouring agents in the group of phenol and phenol derivatives is provided in the monographs of the fifty-fifth, seventy-third, seventy-sixth and seventy-ninth meetings (Annex 1, references 174, 203, 212, 221). Additional information was
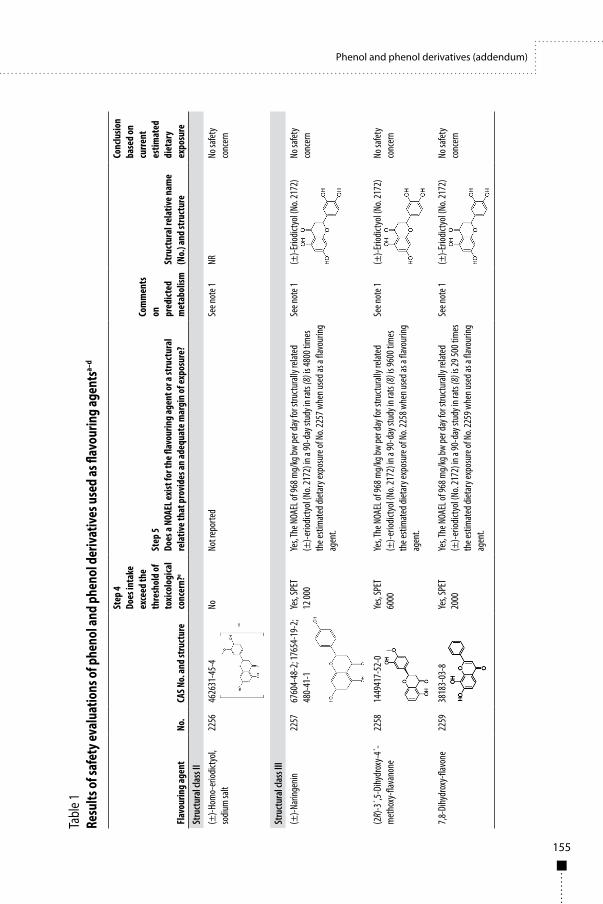
155
Phenol and phenol derivatives (addendum)
Flav
ourin
g ag
ent
No.
CAS N
o. an
d st
ruct
ure
Step
4 Do
es in
take
ex
ceed
the
thre
shol
d of
to
xico
logi
cal
conc
ern?
e
Step
5Do
es a
NOAE
L exi
st fo
r the
flav
ourin
g ag
ent o
r a st
ruct
ural
re
lativ
e tha
t pro
vide
s an
adeq
uate
mar
gin
of ex
posu
re?
Com
men
ts
on
pred
icted
m
etab
olism
Stru
ctur
al re
lativ
e nam
e (N
o.) a
nd st
ruct
ure
Conc
lusio
n ba
sed
on
curre
nt
estim
ated
di
etar
y ex
posu
reSt
ruct
ural
clas
s II
(±)-H
omo-
eriod
ictyo
l, so
dium
salt
2256
4626
31-4
5-4
NoNo
t rep
orte
dSe
e not
e 1NR
No sa
fety
conc
ern
Stru
ctur
al cl
ass I
II(±
)-Nar
ingen
in 22
5767
604-
48-2
; 176
54-1
9-2;
480-
41-1
Yes,
SPET
12
000
Yes, T
he N
OAEL
of 96
8 mg/
kg bw
per d
ay fo
r stru
ctura
lly re
lated
(±
)-erio
dicty
ol (N
o. 21
72) i
n a 90
-day
stud
y in r
ats (
8) is
4800
tim
es
the e
stim
ated
diet
ary e
xpos
ure o
f No.
2257
whe
n use
d as a
flavo
uring
ag
ent.
See n
ote 1
(±)-E
riodic
tyol
(No.
2172
)No
safet
y co
ncer
n
(2R)
-3´,5
-Dihy
drox
y-4´
-m
etho
xy-fl
avan
one
2258
1449
417-
52-0
Yes,
SPET
60
00Ye
s, The
NOA
EL of
968 m
g/kg
bw pe
r day
for s
tructu
rally
relat
ed
(±)-e
riodic
tyol
(No.
2172
) in a
90-d
ay st
udy i
n rat
s (8)
is 96
00 ti
mes
th
e esti
mat
ed di
etar
y exp
osur
e of N
o. 22
58 w
hen u
sed a
s a fla
vour
ing
agen
t.
See n
ote 1
(±)-E
riodic
tyol
(No.
2172
)No
safet
y co
ncer
n
7,8-D
ihydr
oxy-
flavo
ne
2259
3818
3-03
-8Ye
s, SP
ET
2000
Yes, T
he N
OAEL
of 96
8 mg/
kg bw
per d
ay fo
r stru
ctura
lly re
lated
(±
)-erio
dicty
ol (N
o. 21
72) i
n a 90
-day
stud
y in r
ats (
8) is
29 50
0 tim
es
the e
stim
ated
diet
ary e
xpos
ure o
f No.
2259
whe
n use
d as a
flavo
uring
ag
ent.
See n
ote 1
(±)-E
riodic
tyol
(No.
2172
)No
safet
y co
ncer
n
Tabl
e 1
Resu
lts o
f saf
ety e
valu
atio
ns o
f phe
nol a
nd p
heno
l der
ivat
ives
use
d as
flav
ourin
g ag
ents
a–d
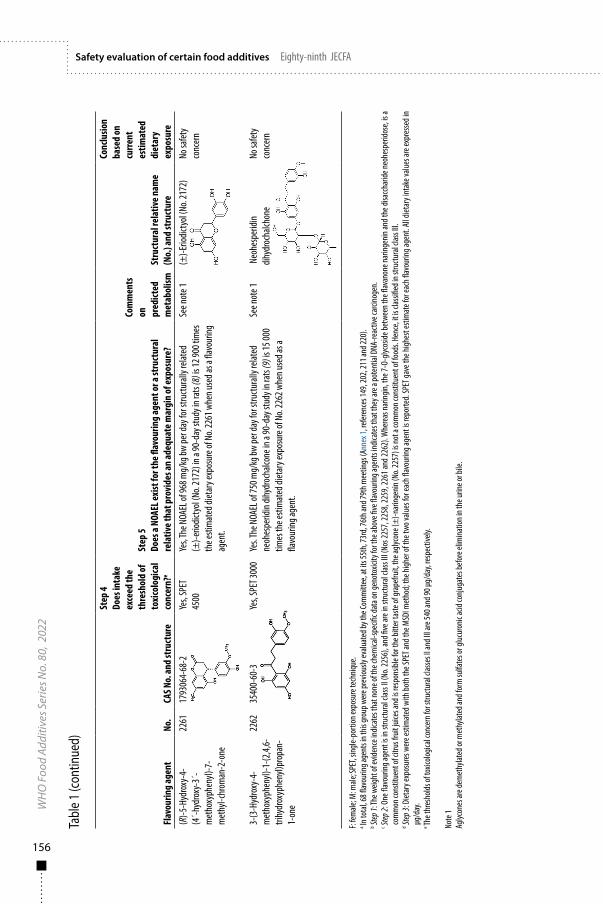
156
WH
O F
ood
Addi
tives
Ser
ies N
o. 8
0, 2
022
Safety evaluation of certain food additives Eighty-ninth JECFA
F: fem
ale; M
: male
; SPET
, sing
le-po
rtion
expo
sure
tech
nique
.a In
tota
l, 68 fl
avou
ring a
gent
s in t
his gr
oup w
ere p
revio
usly
evalu
ated
by th
e Com
mitt
ee, a
t its
55th
, 73r
d, 76
th an
d 79t
h mee
tings
(Ann
ex 1,
refer
ence
s 149
, 202
, 211
and 2
20).
b Step
1: Th
e weig
ht of
evide
nce i
ndica
tes t
hat n
one o
f the
chem
ical-s
pecifi
c dat
a on g
enot
oxici
ty fo
r the
abov
e five
flavo
uring
agen
ts ind
icate
s tha
t the
y are
a po
tent
ial D
NA-re
activ
e car
cinog
en.
c Step
2: O
ne fl
avou
ring a
gent
is in
stru
ctura
l clas
s II (
No. 2
256)
, and
five
are i
n stru
ctura
l clas
s III (
Nos 2
257,
2258
, 225
9, 22
61 an
d 226
2). W
here
as na
ringin
, the
7-O-
glyco
side b
etwe
en th
e flav
anon
e nar
ingen
in an
d the
disa
ccha
ride n
eohe
sper
idose
, is a
com
mon
cons
titue
nt of
citru
s fru
it jui
ces a
nd is
resp
onsib
le fo
r the
bitte
r tas
te of
grap
efruit
, the
aglyc
one (
±)-n
aring
enin
(No.
2257
) is n
ot a
com
mon
cons
titue
nt of
food
s. He
nce,
it is
classi
fied i
n stru
ctura
l clas
s III.
d Step
3: D
ietar
y exp
osur
es w
ere e
stim
ated
with
both
the S
PET a
nd th
e MSD
I met
hod;
the h
igher
of th
e two
value
s for
each
flavo
uring
agen
t is r
epor
ted.
SPET
gave
the h
ighes
t esti
mat
e for
each
flavo
uring
agen
t. Al
l diet
ary i
ntak
e valu
es ar
e exp
resse
d in
µg/d
ay.
e The t
hres
holds
of to
xicolo
gical
conc
ern f
or st
ructu
ral c
lasse
s II a
nd III
are 5
40 an
d 90 μ
g/da
y, re
spec
tively
.
Note
1Ag
lycon
es ar
e dem
ethy
lated
or m
ethy
lated
and f
orm
sulfa
tes o
r gluc
uron
ic ac
id co
njug
ates
befo
re el
imina
tion i
n the
urine
or bi
le.
Tabl
e 1 (c
ontin
ued)
Flav
ourin
g ag
ent
No.
CAS N
o. an
d st
ruct
ure
Step
4 Do
es in
take
ex
ceed
the
thre
shol
d of
to
xico
logi
cal
conc
ern?
e
Step
5Do
es a
NOAE
L exi
st fo
r the
flav
ourin
g ag
ent o
r a st
ruct
ural
re
lativ
e tha
t pro
vide
s an
adeq
uate
mar
gin
of ex
posu
re?
Com
men
ts
on
pred
icted
m
etab
olism
Stru
ctur
al re
lativ
e nam
e (N
o.) a
nd st
ruct
ure
Conc
lusio
n ba
sed
on
curre
nt
estim
ated
di
etar
y ex
posu
re(R
)-5-H
ydro
xy-4
-(4
´-hyd
roxy
-3´-
met
hoxy
phen
yl)-7
-m
ethy
l-chr
oman
-2-o
ne
2261
1793
064-
68-2
Yes,
SPET
45
00Ye
s, The
NOA
EL of
968 m
g/kg
bw pe
r day
for s
tructu
rally
relat
ed
(±)-e
riodic
tyol
(No.
2172
) in a
90-d
ay st
udy i
n rat
s (8)
is 12
900 t
imes
th
e esti
mat
ed di
etar
y exp
osur
e of N
o. 22
61 w
hen u
sed a
s a fla
vour
ing
agen
t.
See n
ote 1
(±)-E
riodic
tyol
(No.
2172
)No
safet
y co
ncer
n
3-(3
-Hyd
roxy
-4-
met
hoxy
phen
yl)-1
-(2,4,
6-
trihy
drox
yphe
nyl)p
ropa
n-1-
one
2262
3540
0-60
-3Ye
s, SP
ET 30
00Ye
s. The
NOA
EL of
750 m
g/kg
bw pe
r day
for s
tructu
rally
relat
ed
neoh
espe
ridin
dihyd
roch
alcon
e in a
90-d
ay st
udy i
n rat
s (9)
is 15
000
times
the e
stim
ated
diet
ary e
xpos
ure o
f No.
2262
whe
n use
d as a
fla
vour
ing ag
ent.
See n
ote 1
Neo
hesp
eridi
n dih
ydro
chalc
hone
No sa
fety
conc
ern
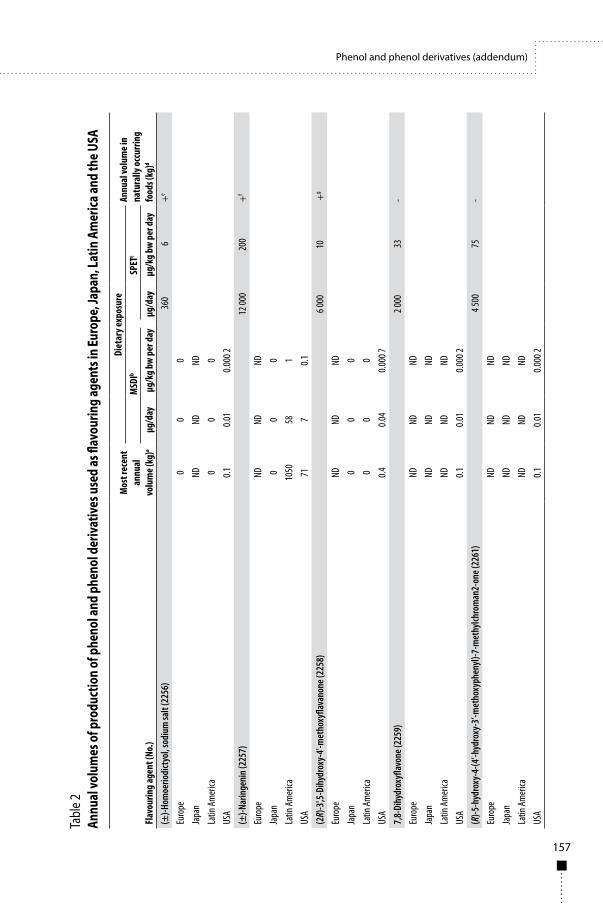
157
Phenol and phenol derivatives (addendum)
Flav
ourin
g ag
ent (
No.)
Mos
t rec
ent
annu
alvo
lum
e (kg
)a
Diet
ary e
xpos
ure
Annu
al vo
lum
e in
natu
rally
occu
rring
fo
ods (
kg)d
MSD
IbSP
ETc
μg/d
ay
μg/k
g bw
per
day
μg/d
ay
μg/k
g bw
per
day
(±)-H
omoe
riodi
ctyo
l, sod
ium
salt
(225
6) 36
0 6
+e
Euro
pe0
00
Japa
nND
NDND
Latin
Amer
ica0
00
USA
0.10.0
10.0
00 2
(±)-N
arin
geni
n (22
57)
12 00
0 20
0 +
f
Euro
peND
NDND
Japa
n0
00
Latin
Amer
ica10
5058
1US
A71
70.1
(2R)
-3',5
-Dih
ydro
xy-4
'-met
hoxy
flava
none
(225
8)6 0
00
10
+g
Euro
peND
NDND
Japa
n0
00
Latin
Amer
ica0
00
USA
0.40.0
40.0
00 7
7,8-
Dihy
drox
yflav
one (
2259
)2 0
00
33-
Euro
peND
NDND
Japa
nND
NDND
Latin
Amer
icaND
NDND
USA
0.10.0
10.0
00 2
(R)-5
-hyd
roxy
-4-(4
’-hyd
roxy
-3’-m
etho
xyph
enyl)
-7-m
ethy
lchro
man
2-on
e (22
61)
4 50
0 75
- Eu
rope
NDND
NDJa
pan
NDND
NDLa
tin Am
erica
NDND
NDUS
A0.1
0.01
0.000
2
Tabl
e 2An
nual
volu
mes
of p
rodu
ctio
n of
phe
nol a
nd p
heno
l der
ivat
ives
use
d as
flav
ourin
g ag
ents
in Eu
rope
, Jap
an, L
atin
Am
erica
and
the U
SA
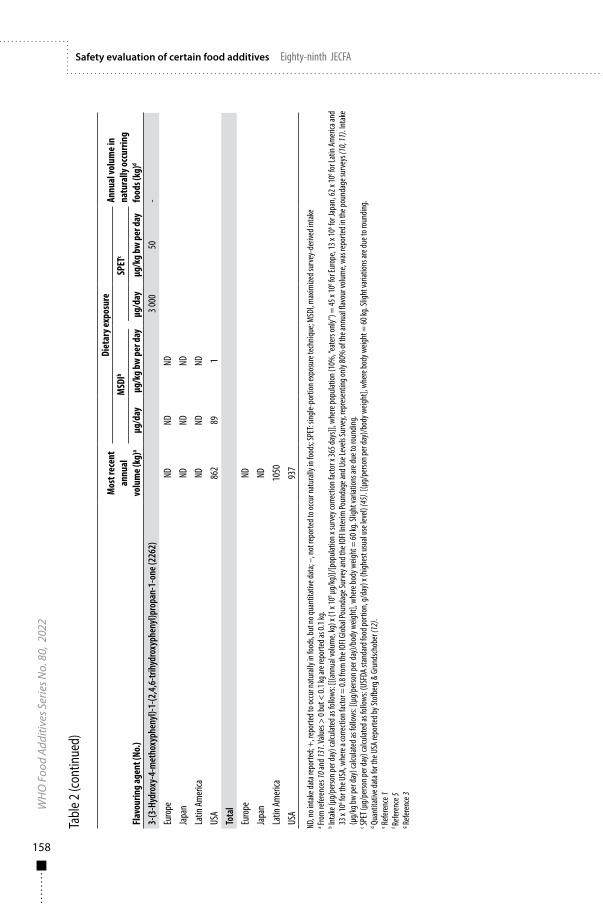
158
WH
O F
ood
Addi
tives
Ser
ies N
o. 8
0, 2
022
Safety evaluation of certain food additives Eighty-ninth JECFATa
ble 2
(con
tinue
d)
Flav
ourin
g ag
ent (
No.)
Mos
t rec
ent
annu
alvo
lum
e (kg
)a
Diet
ary e
xpos
ure
Annu
al vo
lum
e in
natu
rally
occu
rring
fo
ods (
kg)d
MSD
IbSP
ETc
μg/d
ay
μg/k
g bw
per
day
μg/d
ay
μg/k
g bw
per
day
3-(3
-Hyd
roxy
-4-m
etho
xyph
enyl)
-1-(2
,4,6
-trih
ydro
xyph
enyl)
prop
an-1
-one
(226
2) 3
000
50
- Eu
rope
NDND
NDJa
pan
NDND
NDLa
tin Am
erica
NDND
NDUS
A86
289
1To
tal
Euro
peND
Japa
nND
Latin
Amer
ica10
50US
A93
7
ND, n
o int
ake d
ata r
epor
ted;
+, re
porte
d to o
ccur
natu
rally
in fo
ods,
but n
o qua
ntita
tive d
ata;
–, no
t rep
orte
d to o
ccur
natu
rally
in fo
ods;
SPET
: sing
le-po
rtion
expo
sure
tech
nique
; MSD
I, max
imize
d sur
vey-
deriv
ed in
take
a From
refer
ence
s 10 a
nd 13
1. Va
lues >
0 bu
t < 0.
1 kg a
re re
porte
d as 0
.1 kg
.b In
take
(μg/
perso
n per
day)
calcu
lated
as fo
llows
: [[(a
nnua
l volu
me,
kg) x
(1 x
109 μg
/kg)
]/[po
pulat
ion x
surv
ey co
rrecti
on fa
ctor x
365 d
ays]]
, whe
re po
pulat
ion (1
0%, “e
ater
s onl
y") =
45 x
106 fo
r Eur
ope,
13 x
106 fo
r Jap
an, 6
2 x 10
6 for L
atin
Amer
ica an
d 33
x 10
6 for t
he U
SA, w
here
a co
rrecti
on fa
ctor =
0.8 f
rom
the I
OFI G
lobal
Poun
dage
Surv
ey an
d the
IOFI
Inte
rim Po
unda
ge an
d Use
Leve
ls Su
rvey
, repr
esen
ting o
nly 8
0% of
the a
nnua
l flav
our v
olum
e, wa
s rep
orte
d in t
he po
unda
ge su
rvey
s (10
, 11)
. Inta
ke
(μg/
kg bw
per d
ay) c
alcula
ted a
s foll
ows:
[(μg/
perso
n per
day)
/bod
y weig
ht],
wher
e bod
y weig
ht =
60 kg
. Slig
ht va
riatio
ns ar
e due
to ro
undin
g. c SP
ET (μ
g/pe
rson p
er da
y) ca
lculat
ed as
follo
ws: (
USFD
A sta
ndar
d foo
d por
tion,
g/da
y) x
(high
est u
sual
use l
evel)
(45)
. [(μ
g/pe
rson p
er da
y)/b
ody w
eight
], wh
ere b
ody w
eight
= 60
kg. S
light
varia
tions
are d
ue to
roun
ding.
d Qua
ntita
tive d
ata f
or th
e USA
repo
rted b
y Sto
fber
g & G
rund
schob
er (1
2).
e Refer
ence
1f Re
feren
ce 5
g Refer
ence
3
159
Phenol and phenol derivatives (addendum)
available for this meeting on three of the new flavouring agents (Nos 2257, 2260 and 2261).
Glycoside conjugates of polyphenols are hydrolysed on the brush border of or within small intestine epithelial cells. Polyphenols are rapidly but incompletely absorbed after oral administration and metabolized in the gastrointestinal tract and in the liver after absorption. Polyphenols are metabolized by hydrolysis, sulfation, glucuronidation and/or methylation. Those conjugates excreted into urine are eliminated rapidly. The molecular weight of some conjugates is high enough that a portion is also excreted into bile. The biliary metabolites can undergo enterohepatic circulation (transfer into the intestine, hydrolysis, reabsorption and reconjugation primarily in the liver, with excretion in urine), which accounts for the relatively slow urinary excretion sometimes observed. Metabolites that are not hydrolysed and absorbed in the small intestine may undergo further metabolism in the large intestine, where the microflora cleave conjugates and the resulting aglycones undergo ring cleavage, leading to phenolic acid and cinnamic acid derivatives (13), which are also ultimately excreted in the urine.
1.4 Application of the revised procedure for the safety evaluation of flavouring agentsStep 1. There are no structural alerts for genotoxicity for the additional flavouring agents (Nos 2256, 2257, 2258, 2259, 2260, 2261 and 2262) in this group. Chemical-specific genotoxicity data on previously evaluated flavouring agents in this group and on six of the seven new flavouring agents (Nos 2256–2259, 2261 and 2262) do not indicate that they are potentially genotoxic; however, the Committee was concerned that one of the seven new flavouring agents (No. 2260) is potentially genotoxic, and it was therefore not further considered with the revised procedure for the safety evaluation of flavouring agents.
Step 2. In applying the revised procedure to the six remaining flavouring agents (Nos 2256–2259, 2261 and 2262), the Committee assigned one agent (No. 2256) to structural class II and five (Nos 2257–2259, 2261 and 2262) to structural class III (14).
Step 3. Dietary exposures were determined with the MSDI method and SPET and are presented in Table 2.
Step 4. The higher estimated dietary exposure for the one flavouring agent in structural class II (No. 2256) is below the threshold of toxicological concern (i.e. 540 μg/person per day). The Committee therefore concluded that flavouring agent No. 2256 would not pose a safety concern at the currently estimated level of dietary exposure.
160
WH
O F
ood
Addi
tives
Ser
ies N
o. 8
0, 2
022
Safety evaluation of certain food additives Eighty-ninth JECFA
The highest estimated dietary exposures of the five flavouring agents in structural class III are above the threshold of toxicological concern (i.e. 90 μg/person per day), and their evaluation proceeded to Step 5 of the revised procedure.
Step 5. For (±)-naringenin (No. 2257), the NOAEL of 968 mg/kg bw per day for the structurally related substance (±)-eriodictyol (No. 2172) in a 90-day dietary study in male and female rats (8) provides an adequate MOE (4800) relative to the SPET estimate of 12 000 μg/day. The NOAEL of 968 mg/kg bw per day for (±)-eriodictyol (No. 2172) is also appropriate for assessing the structurally related flavouring agents (2R)-3´,5-dihydroxy-4´-methoxyflavanone (No. 2258), 7,8-dihydroxyflavone (No. 2259) and (R)-5-hydroxy-4-(4´-hydroxy-3´-methoxyphenyl)-7-methylchroman-2-one (No. 2261). The NOAEL of 986 mg/kg bw per day provides adequate MOEs of 9600, 29 500 and 12 900 relative to the SPET estimates of 6000, 2000 and 4500 μg/day, respectively, for these substances when used as flavouring agents.
For 3-(3-hydroxy-4-methoxyphenyl)-1-(2,4,6-trihydroxyphenyl)propan- 1-one (No. 2262), the NOAEL of 750 mg/kg bw per day for the structurally related substance neohesperidin dihydrochalcone in a 90-day dietary study in male and female rats (9) provides an adequate MOE (15 000) relative to the SPET estimate of 3000 μg/day when it is used as a flavouring agent.
Table 1 summarizes the evaluations of the six flavouring agents in the group of phenol and phenol derivatives (Nos 2256–2259, 2261 and 2262).
1.5 Consideration of combined intakes from use as flavouring agentsThe Committee previously considered the potential combined intake of this group of phenol and phenol derivatives and did not identify any safety concern. As the MSDI values for the six additional flavouring agents in this group (Nos 2256–2259, 2261 and 2262) are low (0.01–89 μg/day), they would make a negligible contribution to the combined intake of this group.
1.6 Consideration of secondary componentsOne flavouring agent in this group (No. 2256) has a minimum assay value of < 95% (Table 3). The major secondary components (±)-eriodyctiol-7-methyl ether, present at 3–5%, and (±)-homoeriodictyol-7-methyl ether, present at 1–2%, are structurally related to (±)-eriodictyol (No. 2172). These secondary compounds are considered not to present a safety concern when consumed as components of No. 2256 used as a flavouring agent at its current estimated dietary exposure.
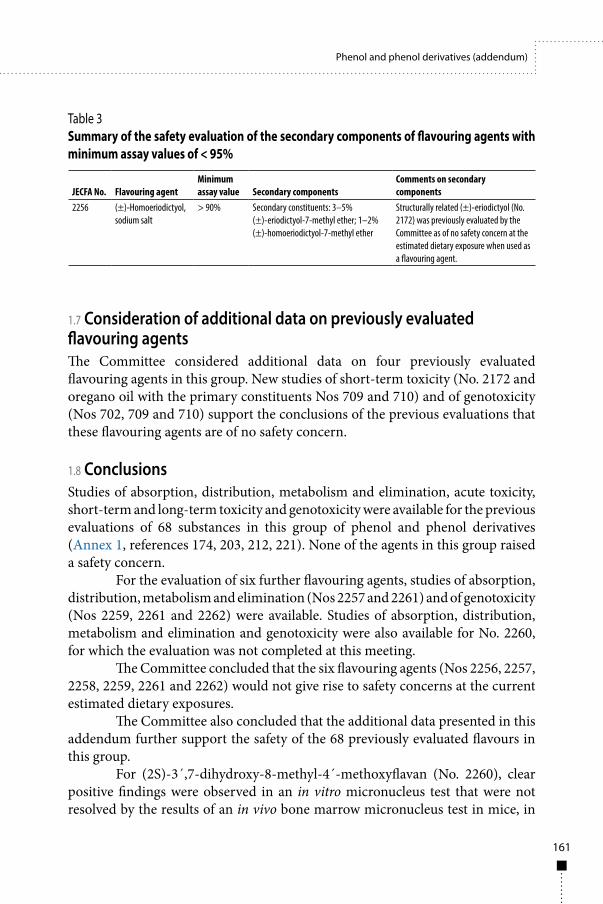
161
Phenol and phenol derivatives (addendum)
1.7 Consideration of additional data on previously evaluated flavouring agentsThe Committee considered additional data on four previously evaluated flavouring agents in this group. New studies of short-term toxicity (No. 2172 and oregano oil with the primary constituents Nos 709 and 710) and of genotoxicity (Nos 702, 709 and 710) support the conclusions of the previous evaluations that these flavouring agents are of no safety concern.
1.8 ConclusionsStudies of absorption, distribution, metabolism and elimination, acute toxicity, short-term and long-term toxicity and genotoxicity were available for the previous evaluations of 68 substances in this group of phenol and phenol derivatives (Annex 1, references 174, 203, 212, 221). None of the agents in this group raised a safety concern.
For the evaluation of six further flavouring agents, studies of absorption, distribution, metabolism and elimination (Nos 2257 and 2261) and of genotoxicity (Nos 2259, 2261 and 2262) were available. Studies of absorption, distribution, metabolism and elimination and genotoxicity were also available for No. 2260, for which the evaluation was not completed at this meeting.
The Committee concluded that the six flavouring agents (Nos 2256, 2257, 2258, 2259, 2261 and 2262) would not give rise to safety concerns at the current estimated dietary exposures.
The Committee also concluded that the additional data presented in this addendum further support the safety of the 68 previously evaluated flavours in this group.
For (2S)-3´,7-dihydroxy-8-methyl-4´-methoxyflavan (No. 2260), clear positive findings were observed in an in vitro micronucleus test that were not resolved by the results of an in vivo bone marrow micronucleus test in mice, in
JECFA No. Flavouring agentMinimum assay value Secondary components
Comments on secondary components
2256 (±)-Homoeriodictyol, sodium salt
> 90% Secondary constituents: 3–5% (±)-eriodictyol-7-methyl ether; 1–2% (±)-homoeriodictyol-7-methyl ether
Structurally related (±)-eriodictyol (No. 2172) was previously evaluated by the Committee as of no safety concern at the estimated dietary exposure when used as a flavouring agent.
Table 3Summary of the safety evaluation of the secondary components of flavouring agents with minimum assay values of < 95%
162
WH
O F
ood
Addi
tives
Ser
ies N
o. 8
0, 2
022
Safety evaluation of certain food additives Eighty-ninth JECFA
which no proof of systemic or target tissue exposure was provided. The evaluation of flavouring agent No. 2260 was not completed because of the genotoxic concern, and additional investigation is required.
2. Relevant background information
2.1 Additional considerations on exposureAnnual volumes of production and dietary exposures estimated both as the MSDI and with SPET are reported for each flavouring agent in Table 2.
2.2 Biological data2.2.1 Biochemical data: hydrolysis, absorption, distribution, metabolism and excretionInformation on the absorption, distribution, metabolism and elimination of these agents (Nos 2257, 2260 and 2261) has been reported since submission of the most recent monograph (Annex 1, references 150, 203, 212 and 221).
(a) (±)-Naringenin (No. 2257)In a series of studies on biotransformation, (±)-naringenin (No. 2257; Fig. 1) was administered to rats and rabbits orally and by intravenous injection, and metabolites were identified in the bile, urine and plasma. In rats, the principal biliary metabolites were glucuronide and sulfate conjugates on the phenolic hydroxyl at the C7-position of naringenin, and naringenin 7-glucuronide was identified in blood. Urine also contained glucuronide and sulfate conjugates with the phenolic hydroxyl group at the C4´-position of naringenin (15–17). Faecal samples also contained p-hydroxyphenylpropionic acid (16, 18).
In a metabolism study, bile duct-cannulated Wistar rats were dosed orally with 200 mg/kg bw of naringenin, and bile was collected for 30 h (15). Another group of rats received a total of 1200 mg/kg bw of naringenin by gavage over 6 days in doses of 200 mg/kg bw, and their urine was collected. A third group of rats was treated with 60 mg/kg bw of naringenin, and blood samples were drawn over 24 h. The biliary metabolites were identified as naringenin 7-glucuronide, naringenin 7-sulfate and the mixed conjugates naringenin 7-sulfate-4´-glucuronide and naringenin 7-glucuronide 4´-sulfate. The major urinary metabolites were identified as naringenin 4´-glucuronide and naringenin 7,4´-disulfate. In plasma, the primary metabolite was naringenin 7-glucuronide.
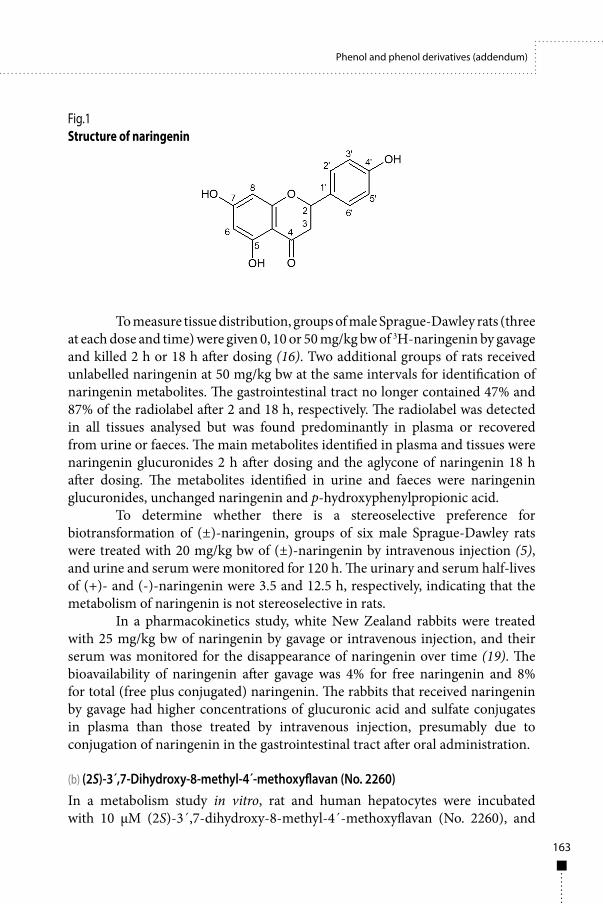
163
Phenol and phenol derivatives (addendum)
To measure tissue distribution, groups of male Sprague-Dawley rats (three at each dose and time) were given 0, 10 or 50 mg/kg bw of 3H-naringenin by gavage and killed 2 h or 18 h after dosing (16). Two additional groups of rats received unlabelled naringenin at 50 mg/kg bw at the same intervals for identification of naringenin metabolites. The gastrointestinal tract no longer contained 47% and 87% of the radiolabel after 2 and 18 h, respectively. The radiolabel was detected in all tissues analysed but was found predominantly in plasma or recovered from urine or faeces. The main metabolites identified in plasma and tissues were naringenin glucuronides 2 h after dosing and the aglycone of naringenin 18 h after dosing. The metabolites identified in urine and faeces were naringenin glucuronides, unchanged naringenin and p-hydroxyphenylpropionic acid.
To determine whether there is a stereoselective preference for biotransformation of (±)-naringenin, groups of six male Sprague-Dawley rats were treated with 20 mg/kg bw of (±)-naringenin by intravenous injection (5), and urine and serum were monitored for 120 h. The urinary and serum half-lives of (+)- and (-)-naringenin were 3.5 and 12.5 h, respectively, indicating that the metabolism of naringenin is not stereoselective in rats.
In a pharmacokinetics study, white New Zealand rabbits were treated with 25 mg/kg bw of naringenin by gavage or intravenous injection, and their serum was monitored for the disappearance of naringenin over time (19). The bioavailability of naringenin after gavage was 4% for free naringenin and 8% for total (free plus conjugated) naringenin. The rabbits that received naringenin by gavage had higher concentrations of glucuronic acid and sulfate conjugates in plasma than those treated by intravenous injection, presumably due to conjugation of naringenin in the gastrointestinal tract after oral administration.
(b) (2S)-3´,7-Dihydroxy-8-methyl-4´-methoxyflavan (No. 2260)In a metabolism study in vitro, rat and human hepatocytes were incubated with 10 μM (2S)-3´,7-dihydroxy-8-methyl-4´-methoxyflavan (No. 2260), and
Fig.1Structure of naringenin
164
WH
O F
ood
Addi
tives
Ser
ies N
o. 8
0, 2
022
Safety evaluation of certain food additives Eighty-ninth JECFA
reaction aliquots were stopped at 0, 60, 120 and 240 min (20). The compound was rapidly transformed by both rat and human hepatocytes; < 3% of the parent compound remained in rat hepatocytes after 60 min, and < 5% was present in human hepatocytes after 2 h. Cell viability at these times was 78% and 69%, respectively (initial viability, 92% and 93%, respectively; 71% after addition of the parent compound). The metabolites identified by mass spectrometry profiles were glucuronide conjugates of the parent compound and the dehydrogenated metabolites and their corresponding glucuronide conjugates. While no human-specific metabolites were detected, one direct glucuronide conjugate with phenolic hydroxyl at either C7 or C3´ was abundant in incubated human hepatocyte samples and was the major human metabolite observed. The authors of the report were, however, apparently unable to determine whether it was the C7 or the C3´ glucuronide. The same metabolite was detected in incubated rat hepatocytes but in only trace amounts.
(c) (R)-5-Hydroxy-4-(4´-hydroxy-3´-methoxyphenyl)-7-methylchroman-2-one (No. 2261)In a similar metabolism study in vitro, 10 μM (R)-5-hydroxy-4-(4´-hydroxy-3´-methoxyphenyl)-7-methylchroman-2-one (No. 2261) was incubated with rat and human hepatocytes and the reactions stopped at 0, 60, 120 and 240 min (21). In the rat hepatocytes, > 95% of the compound had been metabolically transformed by 60 min, and > 99% by 120 min. In the human hepatocytes, > 92% and > 99% of the substrate had been consumed by 60 and 120 min, respectively, with no detectable substrate at 4 h. The viability of the rat and human hepatocytes at 120 min was 80% and 62%, respectively (initial viability of 88% and 82%, respectively; 80% upon addition of the parent compound). Fifteen metabolites were detected in the final pooled rat and human hepatocyte incubations. Mass spectrometry demonstrated that the major metabolites were hydroxylation and hydrogenation products of (R)-5-hydroxy-4-(4´-hydroxy-3´methoxyphenyl)-7-methylchroman-2-one and their corresponding glucuronide and sulfate conjugates and sulfate and glucuronide conjugates of the compound itself. The compound was hydrolysed to its open lactone ring derivative to a greater extent in the presence of rat and human hepatocytes than in incubations with inactivated hepatocytes. Mass spectrometry indicated that the major metabolites in incubated human hepatocytes were hydroxylated, hydrogenated and glucuronide derivatives; a lactone hydrolysis product that formed an open neoflavanoid; and a direct glucuronide conjugate of the parent substance.
2.2.2 Toxicological studiesInformation on the short- and long-term toxicity and genotoxicity of No. 2172 and oregano oil containing Nos 709 and 710 as principal constituents has been
165
Phenol and phenol derivatives (addendum)
reported since submission of the most recent monograph (Annex 1, references 150, 203, 212 and 221).
(a) Short-term toxicityThe results of short-term studies of toxicity with (±)-eriodictyol (No. 2172) and oregano oil, an essential oil containing the structurally related principal constituents carvacrol (> 55%) (No. 710) and thymol (>5%) (No. 709), are described below.
(i) (±)-Eriodictyol (No. 2172) In a 90-day dietary study compliant with OECD test guidelines, groups of 10 Crl:Sprague-Dawley CD IGS rats of each sex at each concentration were fed diets calculated to provide daily intakes of 0 (control), 250, 500 and 1000 mg/kg bw per day of eriodictyol (No. 2172, purity 98%; lot no. 20100007) (8). The diets were calculated to provide average daily intakes of 241, 487 and 968 mg/kg bw per day for males and 244, 491 and 983 mg/kg/day for females over the course of the study (days 0–91). All rats were subjected to ophthalmic examination before initiation of the study and on day 88. They were assessed daily for viability, gross signs of toxicity and behavioural changes. Body weights were recorded on day 0 and weekly thereafter. Food consumption was recorded at the time of body weight measurements. Blood was drawn on day 85 for clinical chemistry and haematology, and urine was collected at the same time for urinalysis. Blood was collected to determine coagulation parameters on day 94 for males and day 95 for females. Gross necropsy was performed on all animals. Selected organs and tissue types were taken from all control and high-intake animals and processed for histopathology.
No differences in deaths or changes in ophthalmological parameters, body weight, bodyweight gain, food consumption or food efficiency were observed between test groups and controls, and no clinical observations were associated with treatment. A mammary carcinoma was observed in one female at 500 mg/kg bw per day from day 56, which was interpreted as a spontaneous finding by the study director. Urinalysis gave unremarkable results for both males and females, and females showed no remarkable haematological findings. Males at all intake levels had decreased absolute reticulocyte counts and red cell distribution widths, which were small. Decreased total white blood cell and absolute neutrophil counts were noted in males at 500 and 1000 mg/kg bw per day. Males in the high intake group had increased albumin and mean chloride levels, and females at the high intake had increased mean calcium and inorganic phosphate levels, but the differences were within the historical control levels in the testing laboratory. Increased absolute and relative kidney and liver weights
166
WH
O F
ood
Addi
tives
Ser
ies N
o. 8
0, 2
022
Safety evaluation of certain food additives Eighty-ninth JECFA
were observed in animals at the high intake but with no associated histological findings. The Committee identified NOAELs for eriodictyol in the diet for 90 days as 968 mg/kg bw per day for males and 983 mg/kg bw per day for females, corresponding to the highest levels tested.
(ii) Oregano oil-containing structurally related principal constituents carvacrol (No. 710) and thymol (709)In a 90-day study compliant with OECD test guideline 408 (22), groups of 10 Crl:W1(Han)(type outbred) Wistar rats of each sex per group were fed diets calculated to provide 0, 1000, 2000 or 4000 mg/kg feed (equivalent to 0 (vehicle controls), 50, 100 or 200 mg/kg bw per day) of oregano oil (lot no. OR2015; containing 55.8% carvacrol and 5.1% thymol) incorporated into gel prepared from neutral gelatin according to Mellado-Garcia et al. (23). The rats were observed throughout the study for viability, signs of toxicity and behavioural changes. Body weights and food consumption were recorded on day 1 and weekly thereafter until sacrifice. Blood samples were collected from all animals after an overnight fast on day 90 and subjected to haematology and clinical chemistry. All animals underwent gross necropsy, and major tissues and organs were collected, weighed and preserved. All high-dose and vehicle control animals were subject to detailed necropsy, and selected tissues were examined histopathologically.
No deaths were attributable to exposure to oregano oil, and the clinical observations throughout the study were unremarkable. Body weight gain and food and water consumption were comparable in control and test groups throughout the study. Haematology revealed a statistically significant decrease in red blood cell distribution width among females at 200 mg/kg bw per day. Clinical biochemistry showed a statistically significant decrease in serum glucose in males at 50 mg/kg bw per day and a statistically significant increase in serum glucose in females at 200 mg/kg bw per day. Gross necropsy revealed no remarkable changes. Females at 50 mg/kg bw per day had a statistically significant increase in ovary weights, and females at 200 mg/kg bw per day had a slight increase in kidney weights when compared with those at 100 mg/kg bw per day. None of the changes in haematology, clinical biochemistry or organ weight had correlated histopathology, and they were considered not to be adverse by the study authors. The Committee identified a NOAEL for oregano oil containing 55.8% carvacrol administered orally to rats of 200 mg/kg bw per day, the highest level tested. Intake of 200 mg/kg bw per day of oregano oil corresponds to an approximate dietary exposure of 112 mg/kg bw per day of carvacrol.
167
Phenol and phenol derivatives (addendum)
(b) Genotoxicity Studies of genotoxicity in vitro and in vivo reported for phenol and phenol derivatives are summarized in Table 4 and described below.
In vitro(i) Reverse mutationNo mutagenicity was observed in a reverse mutation assay compliant with GLP when Salmonella typhimurium strains TA1535, TA1537, TA98 and TA100 and Escherichia coli WP2uvrA were incubated with eight test concentrations of 7,8-dihydroxyflavone (No. 2259; lot RD39404; purity 99%) at 1.58–5000 μg/plate in the absence or presence of a phenobarbital/benzoflavone-induced rat liver (S9) metabolic activation system in the plate incorporation method (24). Precipitation and/or toxic effects such as lawn thinning and/or formation of microcolonies were observed in all test strains at concentrations of 1580 and/or 5000 μg/plate in both the absence and presence of metabolic activation. The positive and negative controls provided the appropriate responses in the tester strains.
No evidence of genotoxic potential was observed in a reverse mutation assay compliant with OECD test guideline 471 and GLP when S. typhimurium strains TA1535, TA1537, TA98 and TA100 and E. coli WP2uvrA were incubated with seven concentrations of (2S)-3´,7-dihydroxy-8-methyl-4´-methoxyflavan (No. 2260; Lot 9; > 98% purity) between 5 and 5000 μg/plate in the absence or presence of a phenobarbitol/5,6-benzoflavone-induced rat liver (S9) metabolic activation system in the plate incorporation method (25).
In a repeat assay with the preincubation method, seven concentrations of (2S)-3´,7-dihydroxy-8-methyl-4´-methoxyflavan between 5 and 5000 μg/plate were incubated with S. typhimurium strains TA100 and TA98 and E. coli WP2uvrA and eight concentrations in S. typhimurium at 1.5–5000 μg/plate in the absence and presence of S9 (25). In the absence of S9, toxicity was observed at ≥ 500 μg/plate in strains TA100 and TA1537 and at ≥ 1500 μg/plate in strain TA1535. In the presence of S9, background lawn thinning and/or reductions in the number of revertant colonies were observed in strain TA98 at 5000 μg/plate, in TA100, TA1535 and TA1537 at 1500 μg/plate and in E. coli WP2 at ≥ 500 μg/plate. Similar toxicity patterns were seen in both the plate incorporation and the pre-incubation tests. Precipitation was observed on all plates at ≥ 1500 μg/plate without S9 and at 5000 μg/plate with S9.
No evidence of genotoxic potential was observed in a reverse mutation assay compliant with OECD test guideline 471 and GLP when S. typhimurium strains TA1535, TA1537, TA98 and TA100 and E. coli WP2uvrA were incubated with seven concentrations of (R)-5-hydroxy-4-(4´-hydroxy-3´-methoxyphenyl)-7-methylchroman-2-one (No. 2261; lot 9; > 98% purity) at 5–5000 μg/plate in the
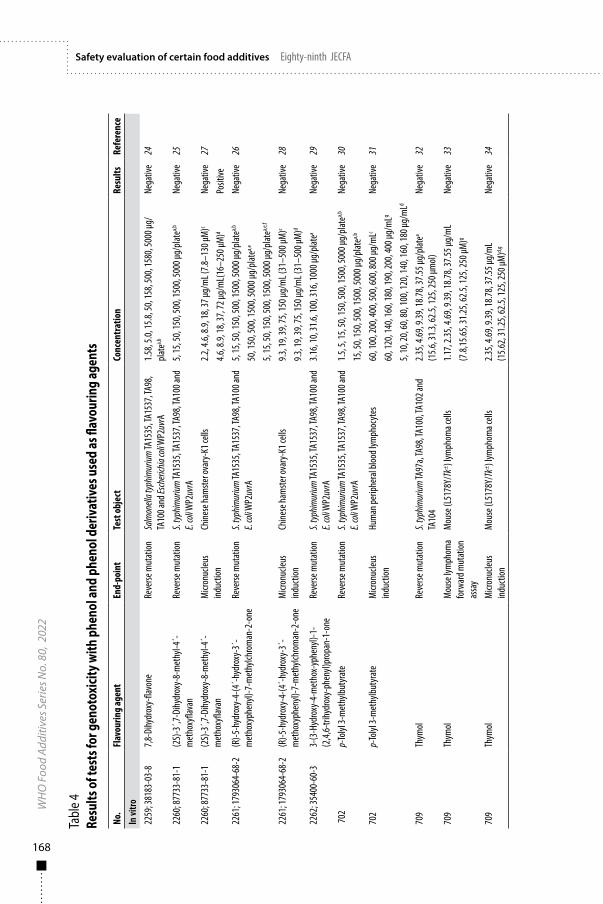
168
WH
O F
ood
Addi
tives
Ser
ies N
o. 8
0, 2
022
Safety evaluation of certain food additives Eighty-ninth JECFA
No.
Flav
ourin
g ag
ent
End-
poin
tTe
st ob
ject
Conc
entr
atio
nRe
sults
Refe
renc
eIn
vitro
2259
; 381
83-0
3-8
7,8-D
ihydr
oxy-
flavo
neRe
verse
mut
ation
Salm
onell
a typ
himur
ium TA
1535
, TA1
537,
TA98
, TA
100 a
nd Es
cheri
chia
coli W
P2uv
rA1.5
8, 5.0
, 15.8
, 50,
158,
500,
1580
, 500
0 µg/
plate
a,b
Nega
tive
24
2260
; 877
33-8
1-1
(2S)
-3´,7
-Dihy
drox
y-8-
met
hyl-4
´-m
etho
xyfla
van
Reve
rse m
utat
ionS.
typh
imur
ium TA
1535
, TA1
537,
TA98
, TA1
00 an
d E.
coli W
P2uv
rA5,
15, 5
0, 15
0, 50
0, 15
00, 5
000 µ
g/pla
tea,b
Nega
tive
25
2260
; 877
33-8
1-1
(2S)
-3´,7
-Dihy
drox
y-8-
met
hyl-4
´-m
etho
xyfla
van
Micr
onuc
leus
induc
tion
Chine
se ha
mste
r ova
ry-K
1 cell
s 2.2
, 4.6,
8.9,
18, 3
7 μg/
mL (
7.8–1
30 μM
)cNe
gativ
e27
4.6, 8
.9, 18
, 37,
72 μg
/mL(
16–2
50 μM
)dPo
sitive
2261
; 179
3064
-68-
2(R
)-5-h
ydro
xy-4
-(4´-h
ydro
xy-3
´-m
etho
xyph
enyl)
-7-m
ethy
lchro
man
-2-o
neRe
verse
mut
ation
S. ty
phim
urium
TA15
35, T
A153
7, TA
98, T
A100
and
E. co
li WP2
uvrA
5, 15
, 50,
150,
500,
1500
, 500
0 µg/
plate
a,bNe
gativ
e26
50, 1
50, 5
00, 1
500,
5000
µg/p
latea,e
5, 15
, 50,
150,
500,
1500
, 500
0 µg/
plate
a,e,f
2261
; 179
3064
-68-
2(R
)-5-h
ydro
xy-4
-(4´-h
ydro
xy-3
´-m
etho
xyph
enyl)
-7-m
ethy
lchro
man
-2-o
neM
icron
ucleu
s ind
uctio
nCh
inese
ham
ster o
vary
-K1 c
ells
9.3, 1
9, 39
, 75,
150 μ
g/m
L (31
–500
μM)c
Nega
tive
289.3
, 19,
39, 7
5, 15
0 μg/
mL (
31–5
00 μM
)d
2262
; 354
00-6
0-3
3-(3
-Hyd
roxy
-4-m
etho
x-yp
heny
l)-1-
(2,4,
6-tri
hydr
oxy-
phen
yl)pr
opan
-1-o
neRe
verse
mut
ation
S. ty
phim
urium
TA15
35, T
A153
7, TA
98, T
A100
and
E. co
li WP2
uvrA
3.16,
10, 3
1.6, 1
00, 3
16, 1
000 µ
g/pla
tea
Nega
tive
29
702
p-To
lyl 3-
met
hylbu
tyra
teRe
verse
mut
ation
S. ty
phim
urium
TA15
35, T
A153
7, TA
98, T
A100
and
E. co
li WP2
uvrA
1.5, 5
, 15,
50, 1
50, 5
00, 1
500,
5000
µg/p
latea,b
Nega
tive
3015
, 50,
150,
500,
1500
, 500
0 µg/
plate
a,b
702
p-To
lyl 3-
met
hylbu
tyra
teM
icron
ucleu
s ind
uctio
nHu
man
perip
hera
l bloo
d lym
phoc
ytes
60, 1
00, 2
00, 4
00, 5
00, 6
00, 8
00 µg
/mLc
Nega
tive
3160
, 120
, 140
, 160
, 180
, 190
, 200
, 400
µg/m
Lg
5, 10
, 20,
60, 8
0, 10
0, 12
0, 14
0, 16
0, 18
0 µg/
mLd
709
Thym
olRe
verse
mut
ation
S. ty
phim
urium
TA97
a, TA
98, T
A100
, TA1
02 an
d TA
104
2.35,
4.69,
9.39,
18.78
, 37.5
5 μg/
plate
a (1
5.6, 3
1.3, 6
2.5, 1
25, 2
50 μm
ol)Ne
gativ
e32
709
Thym
olM
ouse
lym
phom
a fo
rwar
d mut
ation
as
say
Mou
se (L
5178
Y/Tk
±) l
ymph
oma c
ells
1.17,
2.35,
4.69,
9.39,
18.78
, 37.5
5 μg/
mL
Nega
tive
33(7
.8,15
.65, 3
1.25,
62.5,
125,
250 μ
M)g
709
Thym
olM
icron
ucleu
s ind
uctio
nM
ouse
(L51
78Y/
Tk±
) lym
phom
a cell
s2.3
5, 4.6
9, 9.3
9, 18
.78, 3
7.55 μ
g/m
L (1
5.62,
31.25
, 62.5
, 125
, 250
µM)d,g
Nega
tive
34
Tabl
e 4Re
sults
of t
ests
for g
enot
oxici
ty w
ith p
heno
l and
phe
nol d
eriv
ativ
es u
sed
as fl
avou
ring
agen
ts
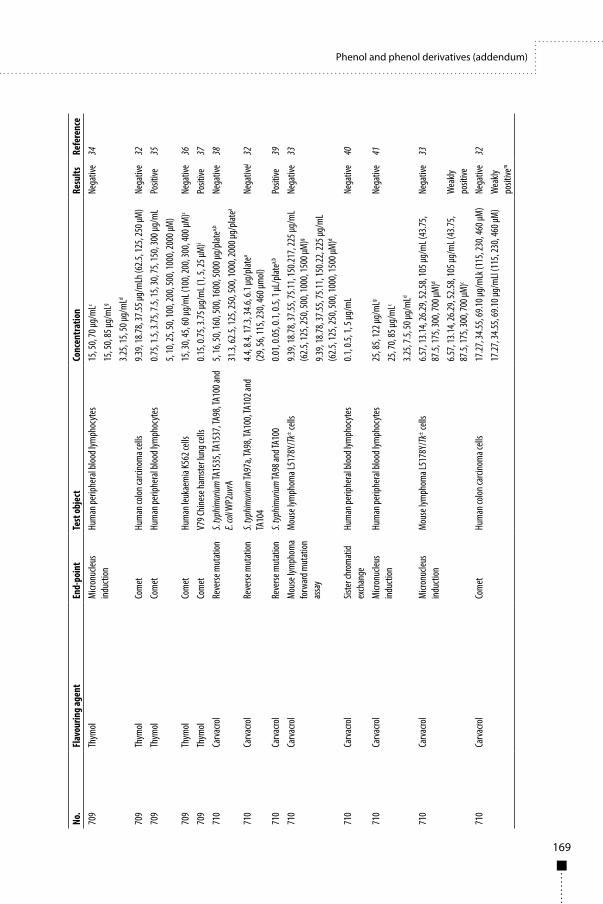
169
Phenol and phenol derivatives (addendum)
No.
Flav
ourin
g ag
ent
End-
poin
tTe
st ob
ject
Conc
entr
atio
nRe
sults
Refe
renc
e70
9Th
ymol
Micr
onuc
leus
induc
tion
Hum
an pe
riphe
ral b
lood l
ymph
ocyt
es15
, 50,
70 µg
/mLc
Nega
tive
3415
, 50,
85 µg
/mLg
3.25,
15, 5
0 µg/
mLd
709
Thym
olCo
met
Hum
an co
lon ca
rcino
ma c
ells
9.39,
18.78
, 37.5
5 μg/
mLh
(62.5
, 125
, 250
μM)
Nega
tive
3270
9Th
ymol
Com
etHu
man
perip
hera
l bloo
d lym
phoc
ytes
0.75,
1.5, 3
.75, 7
.5, 15
, 30,
75, 1
50, 3
00 μg
/mL
Posit
ive35
5, 10
, 25,
50, 1
00, 2
00, 5
00, 1
000,
2000
μM)
709
Thym
olCo
met
Hum
an le
ukae
mia
K562
cells
15, 3
0, 45
, 60 μ
g/m
L (10
0, 20
0, 30
0, 40
0 μM
)cNe
gativ
e36
709
Thym
olCo
met
V79 C
hines
e ham
ster l
ung c
ells
0.15,
0.75,
3.75 μ
g/m
L (1,
5, 25
μM)i
Posit
ive37
710
Carv
acro
lRe
verse
mut
ation
S. ty
phim
urium
TA15
35, T
A153
7, TA
98, T
A100
and
E. co
li WP2
uvrA
5, 16
, 50,
160,
500,
1600
, 500
0 μg/
plate
a,bNe
gativ
e38
31.3,
62.5,
125,
250,
500,
1000
, 200
0 μg/
plate
a
710
Carv
acro
lRe
verse
mut
ation
S. ty
phim
urium
TA97
a, TA
98, T
A100
, TA1
02 an
d TA
104
4.4, 8
.4, 17
.3, 34
.6, 6.
1 μg/
plate
a (2
9, 56
, 115
, 230
, 460
μmol)
Nega
tivej
32
710
Carv
acro
lRe
verse
mut
ation
S. ty
phim
urium
TA98
and T
A100
0.01,
0.05,
0.1, 0
.5, 1
μL/p
latea,b
Posit
ive39
710
Carv
acro
lM
ouse
lym
phom
a fo
rwar
d mut
ation
as
say
Mou
se ly
mph
oma L
5178
Y/Tk
± ce
lls9.3
9, 18
.78, 3
7.55,
75.11
, 150
.217,
225 μ
g/m
L (6
2.5, 1
25, 2
50, 5
00, 1
000,
1500
μM)g
Nega
tive
33
9.39,
18.78
, 37.5
5, 75
.11, 1
50.22
, 225
μg/m
L (6
2.5, 1
25, 2
50, 5
00, 1
000,
1500
μM)d
710
Carv
acro
lSis
ter c
hrom
atid
exch
ange
Hum
an pe
riphe
ral b
lood l
ymph
ocyt
es0.1
, 0.5,
1, 5
μg/m
LNe
gativ
e40
710
Carv
acro
lM
icron
ucleu
s ind
uctio
nHu
man
perip
hera
l bloo
d lym
phoc
ytes
25, 8
5, 12
2 µg/
mLg
Nega
tive
4125
, 70,
85 µg
/mLc
3.25,
7.5, 5
0 µg/
mLd
710
Carv
acro
lM
icron
ucleu
s ind
uctio
nM
ouse
lym
phom
a L51
78Y/
Tk±
cells
6.57,
13.14
, 26.2
9, 52
.58, 1
05 μg
/mL (
43.75
, 87
.5, 17
5, 30
0, 70
0 µM
)d
Nega
tive
33
6.57,
13.14
, 26.2
9, 52
.58, 1
05 μg
/mL (
43.75
, 87
.5, 17
5, 30
0, 70
0 µM
)c
Wea
kly
posit
ive71
0Ca
rvac
rol
Com
et
Hum
an co
lon ca
rcino
ma c
ells
17.27
, 34.5
5, 69
.10 μg
/mLk
(115
, 230
, 460
μM)
Nega
tive
3217
.27, 3
4.55,
69.10
μg/m
Ll (1
15, 2
30, 4
60 μM
)W
eakly
po
sitive
m
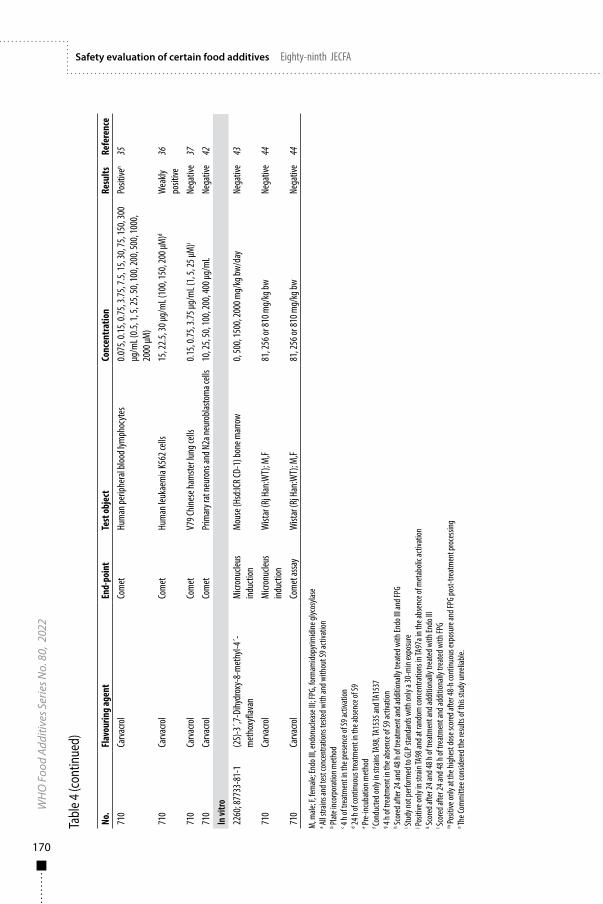
170
WH
O F
ood
Addi
tives
Ser
ies N
o. 8
0, 2
022
Safety evaluation of certain food additives Eighty-ninth JECFA
M, m
ale; F
, fem
ale; E
ndo I
II, en
donu
cleas
e III;
FPG,
form
amido
pyrim
idine
glyc
osyla
sea Al
l stra
ins an
d tes
t con
cent
ratio
ns te
sted w
ith an
d with
out S
9 acti
vatio
nb Pl
ate i
ncor
pora
tion m
etho
dc 4
h of t
reat
men
t in t
he pr
esen
ce of
S9 ac
tivat
iond 24
h of
cont
inuou
s tre
atm
ent i
n the
abse
nce o
f S9
e Pre-
incub
ation
met
hod
f Cond
ucte
d onl
y in s
trains
TA98
, TA1
535 a
nd TA
1537
g 4 h o
f tre
atm
ent i
n the
abse
nce o
f S9 a
ctiva
tion
h Scor
ed af
ter 2
4 and
48 h
of tr
eatm
ent a
nd ad
dition
ally t
reat
ed w
ith En
do III
and F
PGi St
udy n
ot pe
rform
ed to
GLP
stan
dard
s with
only
a 30-
min
expo
sure
j Po
sitive
only
in str
ain TA
98 an
d at r
ando
m co
ncen
tratio
ns in
TA97
a in t
he ab
senc
e of m
etab
olic a
ctiva
tion
k Scor
ed af
ter 2
4 and
48 h
of tr
eatm
ent a
nd ad
dition
ally t
reat
ed w
ith En
do III
l Scor
ed af
ter 2
4 and
48 h
of tr
eatm
ent a
nd ad
dition
ally t
reat
ed w
ith FP
Gm
Posit
ive on
ly at
the h
ighes
t dos
e sco
red a
fter 4
8-h c
ontin
uous
expo
sure
and F
PG po
st-tre
atm
ent p
roce
ssing
n The C
omm
ittee
cons
idere
d the
resu
lts of
this
study
unre
liable
.
Tabl
e 4 (c
ontin
ued)
No.
Flav
ourin
g ag
ent
End-
poin
tTe
st ob
ject
Conc
entr
atio
nRe
sults
Refe
renc
e71
0 Ca
rvac
rol
Com
etHu
man
perip
hera
l bloo
d lym
phoc
ytes
0.075
, 0.15
, 0.75
, 3.75
, 7.5,
15, 3
0, 75
, 150
, 300
μg
/mL (
0.5, 1
, 5, 2
5, 50
, 100
, 200
, 500
, 100
0, 20
00 µM
)
Posit
iven
35
710
Carv
acro
lCo
met
Hum
an le
ukae
mia
K562
cells
15, 2
2.5, 3
0 μg/
mL (
100,
150,
200 μ
M)d
Wea
kly
posit
ive36
710
Carv
acro
lCo
met
V79 C
hines
e ham
ster l
ung c
ells
0.15,
0.75,
3.75 μ
g/m
L (1,
5, 25
μM)i
Nega
tive
3771
0Ca
rvac
rol
Com
etPr
imar
y rat
neur
ons a
nd N
2a ne
urob
lasto
ma c
ells
10, 2
5, 50
, 100
, 200
, 400
μg/m
LNe
gativ
e42
In vi
tro22
60; 8
7733
-81-
1(2
S)-3
´,7-D
ihydr
oxy-
8-m
ethy
l-4´-
met
hoxy
flava
nM
icron
ucleu
s ind
uctio
nM
ouse
(Hsd
:ICR C
D-1)
bone
mar
row
0, 50
0, 15
00, 2
000 m
g/kg
bw/d
ayNe
gativ
e43
710
Carv
acro
lM
icron
ucleu
s ind
uctio
nW
istar
(Rj H
an:W
T); M
,F81
, 256
or 81
0 mg/
kg bw
Nega
tive
44
710
Carv
acro
lCo
met
assa
yW
istar
(Rj H
an:W
T); M
,F81
, 256
or 81
0 mg/
kg bw
Nega
tive
44
171
Phenol and phenol derivatives (addendum)
absence or presence of a phenobarbitol/5,6-benzoflavone-induced rat liver (S9) metabolic activation system in the plate incorporation method (26). Toxicity was observed in the forms of lawn thinning and/or a reduction of revertant colony numbers in strains S. typhimurium TA100 and TA1535 and E. coli WP2uvrA at 5000 μg/plate in the presence or absence of S9 as well as in TA1537 at 5000 μg/plate in the absence of S9 and at 500 μg/plate and higher in the presence of S9.
In a repeat assay with the preincubation method, five concentrations of (R)-5-hydroxy-4-(4´-hydroxy-3´-methoxyphenyl)-7-methylchroman-2-one were incubated with S. typhimurium strains TA1535, TA1537, TA100 and TA98 and E. coli WP2uvrA at 50–5000 μg/plate in the absence and presence of S9, with the exception of strain TA1537, with which eight concentrations between 1.5 and 5000 μg/plate were tested (25). Two test strains (TA98 and TA1537) showed signs of toxicity at ≥ 1500 μg/plate and the others at 5000 μg/plate only, in the absence of S9; in the presence of S9, toxicity was observed at ≥ 150 μg/plate in TA1537, at ≥ 500 μg/plate in TA1535 and only at 5000 μg/plate in all other strains. A third reverse mutation test was performed on the basis of the observed excessive cytotoxicity at 5000 µg/plate in the pre-incubation test in TA98 and TA1537 in the absence of S9 and in TA1535 in the presence of S9. Each was tested with seven concentrations of (R)-5-hydroxy-4-(4´-hydroxy-3´-methoxyphenyl)-7-methylchroman-2-one between 5 and 5000 μg/plate. Cytotoxicity was observed at 5000 μg/plate. Precipitation was observed on all plates at 5000 μg/plate in the absence of S9 in all three tests. There was no evidence of an increased incidence of reverse mutations on any of the plates scored with either the plate incorporation or the preincubation method.
No evidence of genotoxic potential was observed in a reverse mutation assay compliant with OECD test guideline 471 and GLP when S. typhimurium strains TA1535, TA1537, TA98 and TA100 and E. coli WP2uvrA were incubated with six test concentrations of 3-(3-hydroxy-4-methoxyphenyl)-1-(2,4,6-trihydroxylphenyl)propan-1-one (No. 2262; batch no. HN_162_019_RW1; purity 96.3%) between 3.16 and 1000 µg/plate in the presence or absence of an Aroclor 1254-induced rat liver (S9) metabolic activation system in the plate incorporation method (29). In a repeat assay with the preincubation method, six test concentrations between 3.16 and 1000 µg/plate were tested in the absence or presence of an S9 metabolic activation system. Toxicity was observed in both the plate incorporation and preincubation studies with and without metabolic activation, as evidenced by thinning of the background lawn and a > 50% reduction in the number of revertants at 1000 µg/plate in all test strains. The positive and negative controls provided the appropriate responses in the tester strains (29).
In a reverse mutation assay compliant with OECD test guideline 471, no evidence of genotoxic potential was observed when S. typhimurium strains
172
WH
O F
ood
Addi
tives
Ser
ies N
o. 8
0, 2
022
Safety evaluation of certain food additives Eighty-ninth JECFA
TA98, TA100, TA1535 and TA1537 and E. coli WP2uvrA were incubated with eight concentrations of p-tolyl 3-methylbutyrate (No. 702; lot no. 1001614963; 98% purity) at 1.5 –5000 μg/plate in the absence and presence of an Aroclor 1254-induced rat liver (S9) metabolic activation system in the plate incorporation method (30). TA98 showed a 1.7-times maximum increase in reverse mutations in the presence of S9, but the increase was not concentration-dependent and was within the 95th percentile of historical control data for this strain. In a confirmatory assay, the same test strains were incubated with six concentrations of p-tolyl 3-methylbutyrate between 15 and 5000 μg/plate in the absence or presence of S9. No increase in reverse mutation was seen for any strain at any concentration tested.
In a reverse mutation assay compliant with OECD test guideline 471, no mutagenicity was observed when S. typhimurium TA97A, TA98, TA100, TA102 and TA104 were incubated with five concentrations of thymol (No. 709; 99.5% purity) at 2.35–37.6 μg/plate (calculated from a molecular weight of 150.22) in the absence and presence of an Aroclor 1254-induced rat liver (S9) metabolic activation system with the plate incorporation method (32). The number of revertants was not increased in any strain under the conditions tested.
In the same study, the strains were tested with five concentrations of carvacrol (No. 710; 98% purity) at 4.35–60.1 μg/plate1 in the absence or presence of S9 with the plate incorporation method. This test indicated mutagenic potential in strain TA98 with and without S9. In strain TA97A without S9, random concentrations of carvacrol increased reverse mutations, with no concentration-dependence; the highest concentration tested did not increase revertants (32).
No evidence of genotoxic potential was observed in a reverse mutation assay compliant with OECD guideline 471 and GLP in which S. typhimurium strains TA1535, TA1537, TA98 and TA100 and E. coli WP2uvrA were incubated with seven test concentrations of carvacrol (No 710; lot no. R-80439; > 99% purity) between 5 and 5000 μg/plate in the absence or presence of an Aroclor 1254-induced rat liver (S9) metabolic activation system in the plate incorporation method (38). In a confirmatory assay, the same test strains were incubated with seven concentrations of carvacrol between 31.3 and 2000 μg/plate in the absence and presence of S9 (38). In the first test, all test strains showed precipitation at 5000 μg/plate in the presence of S9, and all test strains showed cytotoxicity at ≥ 1600 μg/plate in the presence and absence of S9. Cytotoxicity was also reported in TA100 in the absence of S9 and in TA1535 in the absence and presence of S9 at 500 μg/plate. In the confirmatory assay, cytotoxicity was observed in all the S. typhimurium test strains at ≥ 1000 μg/plate and in E. coli WP2uvrA at
1 The concentration is expressed in µM in the publication by Llana-Ruiz-Cabello et al. (26). The Committee believed that the correct unit is µmol.
173
Phenol and phenol derivatives (addendum)
2000 μg/plate with and without S9. Cytotoxicity was also reported in TA1535 in the presence of S9 at 500 μg/plate. No increased incidence of reverse mutation was seen with carvacrol under the test conditions. All positive and negative controls behaved as expected.
In a non-compliant two-strain Ames assay, no genotoxicity was observed when S. typhimurium strains TA98 and TA100 were incubated with four concentrations of origanum oil (containing 74% carvacrol, No. 710) between 0.01 and 0.50 μL/plate in the absence and presence of a 3-methylcolanthrene-induced rat liver (S9) metabolic activation system in the plate incorporation method (39). The same report indicated an increase in revertants when S. typhimurium strains TA98 and TA100 were incubated with five concentrations of carvacrol (No. 710; 99% purity) between 0.01 and 1.00 μL/plate in the absence or presence of S9 in the plate incorporation method; however, the increases were not concentration-dependent. The authors noted that 1 µL/plate of carvacrol was slightly toxic in both strains.
(ii) Forward mutation In a forward mutation assay, no genotoxic potential was observed in two experiments when mouse lymphoma L5178Y/Tk± cells were incubated with six concentrations of thymol (No. 709; 99.5% purity) between 1.17 and 37.6 μg/mL (calculated from a molecular weight of 150.22) for 4 h without metabolic activation (33). A slight reduction in relative total growth was observed in the first experiment at the two highest concentrations.
In a similar assay, no significant increase in the induction of mutations was observed when mouse lymphoma L5178Y/Tk± cells were incubated with six concentrations of carvacrol (No. 710; 98% purity) between 9.39 and 225 μg/mL (calculated from a molecular weight of 150.22) for 4 h without metabolic activation in two experiments (33). Additionally, six concentrations of carvacrol between 9.39 and 225 μg/mL were incubated with mouse lymphoma L5178Y/Tk± cells for 24 h in two experiments. A concentration-dependent reduction in relative total growth was observed at both 4 h and 24 h. Under the conditions tested, carvacrol did not induce forward mutations.
(iii) In vitro micronucleus formationIn a report with no certificate of compliance or quality assurance, an in vitro micronucleus induction assay was conducted in Chinese hamster ovary K1 (CHO-K1) cells (27). (2S)-3´,7-Dihydroxy-8-methyl-4´-methoxyflavan (No. 2260; 99% purity) was incubated at concentrations of 7.8–130 μM (2.2–37 μg/mL, calculated from a molecular weight of 286.33) for 4 h in the presence of a rat liver metabolic activation system (S9) and at concentrations
174
WH
O F
ood
Addi
tives
Ser
ies N
o. 8
0, 2
022
Safety evaluation of certain food additives Eighty-ninth JECFA
of 16–250 μM (4.6–72 μg/mL) continuously for 24 h in the absence of S9. Cytotoxicity of 56% and 67% was determined at the highest concentrations in the presence and absence of S9, respectively. No increase in micronucleus frequency was observed in the presence of S9; however, significant increases were observed in the presence of S9, with a positive trend. No historical control ranges were reported. Despite some limitations, which include the absence of short treatment without S9 metabolic activation, the Committee considered the outcome of the study to be clearly positive for the induction of micronuclei in mammalian cells in vitro.
In a similar report without a compliance or a quality assurance certificate, CHO-K1 cells were incubated with (R)-5-hydroxy-4-(4´-hydroxy-3´-methoxyphenyl)-7-methylchroman-2-one (No. 2261; batch no. 9; purity not stated) at concentrations of 31–500 μM (9.3–150 μg/mL, calculated from a molecular weight of 286.33) for 4 h in the presence of S9 and continuously for 24 h at the same concentrations in the absence of S9 (28). Cytotoxicity of 36% and 40% was determined at the highest concentrations evaluated in the presence and absence of S9, respectively. The frequency of micronucleus induction was not significantly increased in the presence or absence of S9 when compared with controls.
In an in vitro micronucleus induction assay compliant with OECD test guideline 487 and GLP, no increase in the rate of micronucleus induction was observed when human peripheral blood lymphocytes (HPBL) were incubated with 60, 100 or 200 µg/mL of p-tolyl 3-methylbutyrate (No. 702; batch no.1001614963; purity 98%) for 4 h with a 20-h recovery period in the presence of Aroclor 1254-induced rat liver (S9) metabolic activation system and with 60, 120 or 140 μg/mL p-tolyl 3-methylbutyrate in the absence of S9 (31). The percentage cytotoxicity at the highest concentrations evaluated was 16% and 53% in the presence and absence of S9, respectively. When 20, 60 or 80 μg/mL of p-tolyl 3-methylbutyrate were incubated with HPBL in the absence of S9 continuously for 24 h, a cytotoxicity of 53% was observed at the highest concentration. The authors of the report stated that p-tolyl 3-methylbutyrate did not increase the incidence of micronuclei under the conditions of the study.
In an in vitro micronucleus induction assay compliant with OECD test guideline 487 and GLP, no increase in the rate of micronucleus induction was observed when HPBL were incubated with 15, 50 or 70 µg/mL of thymol (No. 709; batch no. VE00152424; purity 100%) for 4 h with a 20-h recovery period in the presence of an Aroclor 1254-induced rat liver (S9) metabolic activation system and with 15, 50 or 85 μg/mL thymol in the absence of S9 (41). The percentage cytotoxicity determined at the highest concentrations was 55% and 51% in the presence and absence of S9, respectively. When 3.25, 15 or 50 μg/mL of thymol were incubated with HPBL in the absence of S9 continuously for 24 h,
175
Phenol and phenol derivatives (addendum)
the percentage cytotoxicity was 55% at the highest concentration. The authors reported that thymol did not increase the incidence of micronuclei under the conditions of this study.
In an in vitro micronucleus induction assay compliant with OECD test guideline 487 and GLP, no increase in the rate of micronucleus induction was observed when HPBL were incubated with 25, 70 or 85 µg/mL of carvacrol (No. 710; batch no. VE00128328; purity 100%) for 4 h with a 20-h recovery period in the presence of an Aroclor 1254-induced rat liver (S9) metabolic activation system and with 25, 85 or 122 μg/mL in the absence of S9 (41). The percentage cytotoxicity at the highest concentrations was 60% and 51%, respectively. When 3.25, 7.5 or 50 μg/mL of carvacrol were incubated with HPBL in the absence of S9 continuously for 24 h, a cytotoxicity of 51% was observed at the highest concentration. The authors of the report stated that carvacrol did not increase the incidence of micronuclei under the conditions of this study.
In an in vitro micronucleus induction assay compliant with OECD test guideline 487 and GLP, no increase in the number of binucleated cells was reported when mouse lymphoma L5178Y/Tk± cells were incubated with five concentrations of thymol (No. 709; 99.5% purity) between 15.6 and 250 μM (2.35–37.6 μg/mL, calculated from a molecular weight of 150.22) continuously for 24 h in the absence of S9 and with exposure of 3–6 h, followed by a 21-h recovery period in the presence of S9 prepared from livers of rats treated with either Aroclor 1254 or phenobarbital plus β-naphthoflavone (as outlined in OECD 487) (33). Induction of micronuclei was not increased over that in concurrent controls.
In a similar study, mutagenic potential was indicated at the highest concentration tested when mouse lymphoma L5178Y/Tk± cells were incubated with five concentrations of carvacrol (No. 710; 98% purity) between 43.75 and 700 μM (6.6–105.2 μg/mL, calculated from a molecular weight of 150.22) continuously for 24 h in the absence of S9 and with an exposure of 4 h followed by a 20-h recovery period in the presence of S9 (33). No micronucleus induction was seen in the tests with 4-h exposure and 20-h recovery in the presence of S9; however, a statistically significant increase in the presence of micronuclei was seen after 24 h of continuous exposure in the absence of S9 at 105.2 μg/mL when compared with negative controls. The authors concluded that the generally negative findings in both assays suggest marginal effects on micronuclei induction, with no biological relevance. The Committee agreed with the authors’ conclusion.
176
WH
O F
ood
Addi
tives
Ser
ies N
o. 8
0, 2
022
Safety evaluation of certain food additives Eighty-ninth JECFA
(iv) DNA strand breaks No increase in DNA strand breaks was detected when human colon carcinoma (Caco-2) cells were incubated with three concentrations of thymol between 62.5 and 250 μM (9.39–37.6 μg/mL, calculated from a molecular weight of 150.22) in standard and enzyme-modified (endonuclease III (Endo III) and formamidopyrimidine glycosylase (FPG)) comet assays (32). The cells were treated with thymol for 24 or 48 h and then processed for the assays. The Committee noted that the results of this study cannot be considered reliable because of the long treatment periods (24 and 48 h).
Similarly, Caco-2 cells were incubated with three concentrations of carvacrol between 115 and 460 μM (17.3 and 69.1 μg/mL, calculated from a molecular weight of 150.22) for 24 and 48 h in standard and Endo III- and FPG-modified comet assays (32). The standard and the Endo III-modified assays showed no strand breaks at any concentration tested for either 24 or 48 h. After the 48-h exposure, however, FPG treatment of cells exposed to 460 μM caused a statistically significant increase in DNA strand breaks. The Committee noted that the results of this study cannot be considered reliable because of the long treatment periods (24 and 48 h).
In a non-GLP-compliant in vitro comet assay, HPBL were incubated with nine concentrations of thymol between 5 and 2000 µM (0.75–300 μg/mL, calculated from a molecular weight of 150.22) or 10 concentrations of carvacrol between 0.5 and 2000 µM (0.075 and 300 μg/mL, calculated as above) for 30 min (35). Thymol induced strand breaks at ≥ 200 µM, while carvacrol induced strand breaks at ≥ 100 µM when compared with concurrent negative controls. DNA damage was graded visually from microscopic images of 200 randomly selected lymphocytes per test concentration, as 0 (no damage), 1 (low damage), 2 (medium damage), 3 (high damage) or 4 (very high damage). This method is currently considered to be obsolete as it is insufficient for correct estimation of DNA breakage. In addition, in the absence of negative historical control data, the outcome of the study cannot be considered reliable.
In a non-GLP-compliant assay for DNA damage, human leukaemia K562 cells were incubated with three concentrations of carvacrol between 100 and 200 μM (15–30 μg/mL, calculated from a molecular weight of 150.22) or four concentrations of thymol between 100 and 400 μM (15–60 μg/mL, calculated as above) continuously for 24 h (36). The assay showed no induction of DNA strand breaks with thymol, but a statistically significant increase in DNA damage was seen with carvacrol when compared with negative controls. The Committee noted that these results cannot be considered biologically meaningful in the absence of data on historical controls.
177
Phenol and phenol derivatives (addendum)
In an enzyme-modified in-vitro comet assay, V79 Chinese hamster lung fibroblast cells were incubated with three concentrations of carvacrol or thymol of 1, 5 or 25 μM (0.15, 0.75 or 3.76 μg/mL each, calculated from a molecular weight of 150.22) for 30 min before processing, with or without treatment with FPG after processing (37). No evidence of DNA strand breaks (reported as tail moment) was seen with carvacrol, with or without FPG treatment; however, a significant increase in DNA strand breaks was seen with thymol at 25 μM in the absence of FPG treatment. The increase in DNA tail moment was no longer observed after FPG treatment. The Committee noted that, overall, the positive finding observed in the absence of FPG treatment should also have been found in its presence and considered that the results are not biologically relevant and can be attributed to chance.
In a non-GLP-compliant in vitro assay to assess the ability of carvacrol to induce DNA damage, cultured primary rat neurons and mouse neuroblastoma cells (N2a) were incubated with six concentrations of carvacrol between 10 and 400 μg/mL (42). No DNA damage was observed in either cell model at any concentration tested.
(v) Sister chromatid exchangeIn an assay to detect sister chromatid exchange that was not compliant with GLP or any other published guidance, HPBL were incubated with four concentrations of carvacrol (No. 710; 99% purity) between 0.1 and 5 μL/mL for 48 h (40). No statistically significant increase in the occurrence of sister chromatid exchanges was seen.
In vivo(vi) Micronucleus induction In a study to evaluate clastogenic activity, (2S)-3´,7-dihydroxy-8-methyl-4´-methoxyflavan (No. 2260; 99% purity) was tested for its potential to induce micronuclei in polychromatic erythrocytes from mouse bone marrow (43). Groups of three male and three female Hsd:ICR (CD-1) mice per group were given 0 (vehicle), 125, 250, 500, 1000, 1500 or 2000 mg/kg bw per day of (2S)-3´,7-dihydroxy-8-methyl-4´-methoxyflavan in 1% aqueous carboxymethylcellulose by gavage and were killed 24 and 48 h after dosing. The bone marrow was sampled and prepared for micronucleus assessment. No deaths were reported. The only clinical sign of toxicity was piloerection observed at 1500 and 2000 mg/kg bw per day. Micronucleus induction was assessed in three dose groups (500, 1500 and 2000 mg/kg bw per day) in three animals of each sex per group killed at 24 and 48 h. There was no evidence of cytotoxicity to the bone marrow in the form of a reduction in polychromatic erythrocyte count at any dose. No
178
WH
O F
ood
Addi
tives
Ser
ies N
o. 8
0, 2
022
Safety evaluation of certain food additives Eighty-ninth JECFA
statistically significant increase in the induction of micronuclei in bone marrow was detected. The Committee noted, however, some limitations to the study, such as use of only three animals per sex per group and scoring of only 2000 immature erythrocytes per animal instead of 4000. In addition, systemic exposure was not clearly demonstrated, in the absence of relevant clinical signs or direct bone marrow toxicity. Overall, the outcomes of this study, although negative, cannot exclude potential genotoxicity of the test compound.
(vii) Combined micronucleus induction and DNA strand breaksIn a combined in vivo micronucleus induction and a standard and enzyme-modified comet assay compliant with OECD test guidelines 474 and 489, five Wistar (Rj Han:WT) rats of each sex per dose were given 0 (vehicle), 81, 256 or 810 mg/kg bw of carvacrol (No. 710; 99% purity) by gavage in corn oil at 0, 24 or 45 h (44). After 48 h, the animals were killed, and bone marrow, stomach, liver and lung tissue were harvested and examined histopathologically. The bone marrow was prepared for assessment of micronucleus induction. A significant decrease in the ratio of polychromatic to normochromatic erythrocytes was reported in males at 256 mg/kg bw and in males and females at 810 mg/kg bw, indicating toxicity to the bone marrow. Induction of micronucleated erythrocytes was not increased at any concentration of carvacrol. Liver and stomach tissues processed for standard and enzyme-modified (Endo III and FPG) comet assays showed no increase in DNA strand breaks in either the standard or the enzyme-modified comet assays at any concentration of carvacrol.
In a combined micronucleus induction and comet assay compliant with OECD test guidelines 474 and 408, groups of five male and five female Wistar rats at each dose were treated with 50, 100 or 200 mg/kg bw per day of oregano oil containing 55.8% carvacrol and 5.14% thymol incorporated into gel prepared from neutral gelatin according to Mellado-Garcia et al. (23) for 90 days (45). After day 90, femoral bone marrow was isolated, fixed and stained for analysis, and peripheral blood lymphocytes, stomach and liver samples were collected and processed for analysis in standard and enzyme-modified comet assays. The frequency of micronucleus induction in the bone marrow of rats administered oregano oil was not increased, and the occurrence of DNA strand breaks was not increased in the three tissues analysed in the standard or the Endo III- and FPG-modified comet assays.
(viii) Conclusions on genotoxicityAs described above and summarized in Table 4, this group of phenol and phenol derivatives gave uniformly negative results in GLP-compliant bacterial reverse mutation assays. The results of most previously evaluated studies of genotoxicity
179
Phenol and phenol derivatives (addendum)
(Annex 1, reference 150) with phenols and phenol derivatives used as flavouring agents were negative for the induction of reverse mutations in the absence or presence of S9. Additionally, as reported in the previous addenda to this group (Annex 1, references 203, 212, 221), the results of reverse mutation assays were uniformly negative.
In the studies available for the present addendum, members of the group of phenols and phenol derivatives generally showed no genotoxic potential. Erratic positive findings were observed with thymol in two non-GLP-compliant in vitro comet assays (35, 37); however, these were countered by negative results in one bacterial reverse mutation assay (32), one in vitro gene mutation assay in mouse lymphoma cells (33) and two in vitro micronucleus tests (33, 34).
With carvacrol, positive findings were obtained in a limited bacterial reverse mutation assay (39), one in vitro micronucleus test (33) and three in vitro comet assays (32, 35, 36); however, the Committee judged these results to be unreliable and they were countered by the negative results obtained in two bacterial reverse mutation assays (32, 38), one in vitro gene mutation assay in mouse lymphoma cells (33), two in vitro micronucleus tests (33, 34) and one in vivo OECD-compliant combined micronucleus test and comet assay in Wistar rats (44).
Clear positive findings were observed in an in vitro micronucleus test with (2S)-3´,7-dihydroxy-8-methyl-4´-methoxyflavan, despite some limitations of the study (27). These findings cannot be countered by the results of an in vivo bone marrow micronucleus test in mice that provided no proof of systemic or target tissue exposure (43).
Overall, the weight of the evidence supports a conclusion that this group of phenol and phenol derivatives has no genotoxic potential, with the exception of (2S)-3´,7-dihydroxy-8-methyl-4´-methoxyflavan (No. 2260), for which genotoxic concern cannot be ruled out; additional investigation is required. In view of the absence of proof of systemic and bone marrow exposure in the in vivo bone marrow micronucleus test in mice (43), the Committee recommended a follow-up testing strategy that should include determination, based on mode of action, of whether the test item is clastogenic or aneugenic in an in vitro micronucleus test with the fluorescence in situ hybridization technique to detect centromeres in the induced micronuclei. If a clastogenic mode of action is identified, an in vivo comet assay (compliant with OECD test guideline 489) in cells at the site of contact (e.g. duodenum) is recommended. If an aneugenic mode of action is identified, no further in vivo investigation is required because no validated alternative in vivo assays other than the bone marrow micronucleus test are available. In this case, aneugenicity will be considered a threshold genotoxic effect.
180
WH
O F
ood
Addi
tives
Ser
ies N
o. 8
0, 2
022
Safety evaluation of certain food additives Eighty-ninth JECFA
3. References1. Johnson ND. Flavanoid aglycones from Eriodyctyon californicum resin and their implications for
herbivory and UV screening. Biochem Syst Ecol. 1983;11(3):211–5.
2. Numata A, Takemura T, Ohbayashi H, Katsuno T, Yamamoto K, Sato K, et al. Antifeedants for the larvae of the yellow butterfly, Eurema hecabe mandarina, in Lycoris radiate. Chem Pharm Bull (Tokyo). 1983;31(6):2146–9.
3. Ruiz E, Donoso C, Gonzales F, Becerra J, Marticorena C, Silva M. Phenetic relationships between Juan Fernandez and continental Chilean species of Sophora (Fabaceae) based on flavonoid patterns, Bol Soc Chilena Quim. 1999;44:351–6.
4. Liu J, Dai HF, Wu J, Zeng YB, Mei WL (2008) Flavanes from Dracaena cambodiana. Z Naturforsch C. 2008;63:1407–10.
5. Yáñez JA, Remsberg CM, Miranda ND, Vega-Villa KR, Andrews PK, Davies NM. Pharmacokinetics of selected chiral flavonoids: hesperetin, naringenin and eriodictyol in rats and their content in fruit juices. Biopharm Drug Dispos. 2008;29(2):63–82.
6. Liu J, Mei W L, Wu J, Zhao Y X, Peng M, Dai HF. A new cytotoxic homoisoflavonoid from Dracaena cambodiana. J Asian Nat Prod Res. 2009;11(2):192–5.
7. Luo Y, Wang H, Xu X, Mei W, Dai H. Antioxidant phenolic compounds of Dracaena cambodiana. Molecules. 2010;15:8904–14.
8. Bauter M. Eriodictyol Nat. 98%: a 90-day dietary study in rats. Study no. 45619. Product Safety Labs, Dayton (NJ). Unpublished report to the Expert Panel of the Flavor and Extract Manufacturers Association. Submitted to WHO by the International Organization of the Flavor Industry, Brussels; 2018.
9. Lina BAR, Dreeg-van Meulen HC, Leegwater DC. Subchronic (13-week) oral toxicity of neohesperidin dihydrochalcone in rats. Food Chem Toxicol. 1990;2:507–13.
10. International Organization of the Flavor Industry. 2015 IOFI global poundage survey. Submitted to WHO by the International Organization of the Flavor Industry, Brussels; 2018.
11. International Organization of the Flavor Industry. Interim inquiry on volume use and added use levels for flavoring agents to be presented at the JECFA 89th meeting. Submitted to WHO by the International Organization of the Flavor Industry, Brussels; 2019.
12. Stofberg J, Grundschober F. Consumption ratio and food predominance of flavoring materials. Perfumer Flavorist. 1987;12(4):27–68.
13. Winter J, Moore LH, Dowell VR, Bokkenheuser VD. C-ring cleavage of flavonoids by human intestinal bacteria. Appl Environ Microbiol. 1989;55(5);1203–8.
14. Cramer GM, Ford RA, Hall RL. Estimation of toxic hazard – a decision tree approach. Food Cosmet Toxicol. 1978;16(3):255–76.
15. Abe K, Katayama H, Suzuki, A, Yumioka E. Biological fate of orally administered naringin and naringenin in rats. Jpn J Pharmacol. 1993;47(4):402–7.
16. El Mohsen MA, Marks J, Kuhnle G, Rice-Evans C, Moore K, Gibson G, et al. The differential tissue distribution of the citrus flavanone naringenin following gastric instillation. Free Radic Res. 2004;38(12):1329–40.
181
Phenol and phenol derivatives (addendum)
17. Felgines C, Texier O, Morand C, Manach C, Scalbert A, Re’gerat F, et al. Bioavailability of the flavanone naringenin and its glycosides in rats. Am J Physiol Gastrointest Liver Physiol. 2000;279:1148≠54.
18. Hackett A M, Marsh I, Barrow A, Griffiths LA. The biliary excretion of flavanones in the rat. Xenobiotica. 1979;9(8):491–501.
19. Hsiu SL, Huang TY, Hou YC, Chin DH, Chao PD. Comparison of metabolic pharmacokinetics of naringin and naringenin in rabbits. Life Sci. 2002;70(13):1481–9.
20. Kandel S. Metabolite characterization of flavan in the rat and human hepatocytes. Study no. XT154050. XenoTech, LLC, Lenexa (KS), USA. Unpublished report to the Expert Panel of the Flavor and Extract Manufacturers Association. Submitted to WHO by the International Organization of the Flavor Industry, Brussels; 2015.
21. Kandel S. Metabolite characterization of neoflavonoid in rat and human hepatocytes, Study no. XT15405. XenoTech, LLC, Lenexa (KS), USA. Unpublished report to the Expert Panel of the Flavor and Extract Manufacturers Association. Submitted to WHO by the International Organization of the Flavor Industry, Brussels; 2015.
22. Llana-Ruiz-Cabello M, Maisanaba S, Puerto M, Pichardo S, Jos A, Moyano R, et al. A subchronic 90-day oral toxicity study of Origanum vulgare essential oil in rats. Food Chem Toxicol. 2017;101:36–47.
23. Mellado-García P, Puerto M, Pichardo S, Llana-Ruiz-Cabello M, Moyano, R, Blanco A, et al. Toxicological evaluation of an Allium-based commercial product in a 90-day feeding study in Sprague–Dawley rats. Food Chem Toxicol. 2016;90:18–29.
24. Merrill D. 7,8-Dihydroxyflavone: bacterial reverse mutation test (Ames test), study no. 41325. Product Safety Labs, Dayton (NJ). Unpublished report to the Expert Panel of the Flavor and Extract Manufacturers Association. Submitted to WHO by the International Organization of the Flavor Industry, Brussels; 2015.
25. Soltesova A. Subject compound: bacterial reverse mutation test. Study no. TDG0001. Huntingdon Life Sciences, Huntington. Unpublished report to the Expert Panel of the Flavor and Extract Manufacturers Association. Submitted to WHO by the International Organization of the Flavor Industry, Brussels; 2015.
26. Soltesova A. Subject compound. Bacterial reverse mutation test. Unpublished results, study no. TDG0002 ed. Huntingdon Life Sciences, Huntington. Unpublished report to the Expert Panel of the Flavor and Extract Manufacturers Association. Submitted to WHO by the International Organization of the Flavor Industry, Brussels; 2015.
27. Zhao Y. ADME-tox study of subject compound. Study no. 100021791-A. Eurofins Panlabs, Redmond (WA). Unpublished report to the Expert Panel of the Flavor and Extract Manufacturers Association. Submitted to WHO by the International Organization of the Flavor Industry, Brussels; 2015.
28. Zhao Y. ADME-tox study of subject compound. Study no. 100021791-B. Eurofins Panlabs, Redmond (WA). Unpublished report to the Expert Panel of the Flavor and Extract Manufacturers Association. Submitted to WHO by the International Organization of the Flavor Industry, Brussels; 2015.
29. Leuschner PJ. Mutagenicity study of 3-(3-hydroxy-4-methoxyphenyl)-1-(2,4,6-trihydroxylphenyl) propan-1-one in the Salmonella typhimurium and Escherichia coli reverse mutation assay (in vitro). Study no. 33678. Laboratory of Pharmacology and Toxicology GmbH, Hamburg. Unpublished report to the Expert Panel of the Flavor and Extract Manufacturers Association. Submitted to WHO by the International Organization of the Flavor Industry, Brussels; 2016.
182
WH
O F
ood
Addi
tives
Ser
ies N
o. 8
0, 2
022
Safety evaluation of certain food additives Eighty-ninth JECFA
30. Dakoulas E. p-Tolyl 3-methylbutyrate (CAS# 55066-56-3): Bacterial reverse mutation assay. Study no. AE57XA.503.BTL, BioReliance Corporation, Rockville (MD). Unpublished study for the Research Institute for Fragrance Materials Inc., Woodcliff Lake (NJ). Submitted to WHO by the International Organization of the Flavor Industry, Brussels; 2016.
31. Roy S. p-Tolyl 3-methylbutyrate (CAS# 55066-56-3): In vitro mammalian cell micronucleus assay in human peripheral blood lymphocytes (HPBL). Study no. AE57XA.348.BTL. BioReliance Corporation, Rockville (MD). Unpublished report to the Research Institute for Fragrance Materials, Inc., Woodcliff Lake (NJ). Submitted to WHO by the International Organization of the Flavor Industry, Brussels; 2016.
32. Llana-Ruiz-Cabello M, Maisanaba S, Puerto M, Prieto AI, Pichardo S, Jos A. et al. Evaluation of the mutagenicity and genotoxic potential of carvacrol and thymol using the Ames Salmonella test and alkaline, endonuclease III- and FPG-modified comet assays with the human cell line Caco-2. Food Chem Toxicol. 2014;72:122–8.
33. Maisanaba S, Prieto AI, Puerto M, Gutiérrez-Praena D, Demir E, Marcos R, et al. In vitro genotoxicity testing of carvacrol and thymol using the micronucleus and mouse lymphoma assays. Mutat Res Genet Toxicol Environ Mutagen. 2015;784–5:37–44.
34. Roy S, Jois M. In vitro mammalian cell micronucleus test in human peripheral blood lymphocytes (HPBL), carvacrol. Study no. AD13HM.438.BTL. BioReliance, Rockville (MD). Unpublished report to the Research Institute for Fragrance Materials, Inc., Woodcliff Lake (NJ). Submitted to WHO by the International Organization of the Flavor Industry, Brussels; 2012.
35. Aydin S, Basaran AA, Basaran N. Modulating effects of thyme and its major ingredients on oxidative DNA damage in human lymphocytes. J Agric Food Chem. 2005;53:1299–305.
36. Horvathova E, Turcanova V, Slamenova D. Comparative study of DNA-damaging and DNA-protective effects of selected components of essential plant oils in human leukemic cells K562. Neoplasma. 2007;54:478–83.
37. Undeger U, Basaran A, Degen GH, Basaran N. Antioxidant activities of major thyme ingredients and lack of (oxidative) DNA damage in V79 Chinese hamster lung fibroblast cells at low levels of carvacrol and thymol. Food Chem Toxicol. 2009;47:2037–43.
38. Bhalli J. 2-Methyl-5-(1-methylethyl)-phenol (CAS No. 499-75-2): Bacterial reverse mutation assay: Plate incorporation method with a confirmatory assay. Study no. 8289031. Covance Laboratories Inc., Greenfield (IN). Unpublished report to the Research Institute for Fragrance Materials Inc., Woodcliff Lake (NJ). Submitted to WHO by the International Organization of the Flavor Industry, Brussels; 2014. 182
39. Ipek E, Zeytinoglu H, Okay S, Tuylu BA, Kurkcuoglu M, Husnu Can Baser K. Genotoxicity and antigenotoxicity of origanum oil and carvacrol evaluation by Ames Salmonella/microsomal test. Food Chem. 2005;93:551–6.
40. Ipek E, Tuylu BA, Zeytinoglu H (2003) Effects of carvacrol on sister chromatid exchanges in human lymphocyte cultures. Cytotechnology. 43:145-8.
41. Roy S, Jois M. In vitro mammalian cell micronucleus test in human peripheral blood lymphocytes (HPBL), thymol. Study no. AD13HL.348.BTL. BioReliance, Rockville (MD). Unpublished report to the Research Institute for Fragrance Materials, Inc., Woodcliff Lake (NJ). Submitted to WHO by the International Organization of the Flavor Industry, Brussels; 2012.
42. Aydin E, Turkez H, Keles MS. The effect of carvacrol on healthy neurons and N2s cancer cells: some biochemical, anticancerogenicity and genotoxicity studies. Cytotechnology. 2014;66:149–57.
183
Phenol and phenol derivatives (addendum)
43. Pant K. In vivo micronucleus screening assay in mice. Study no. AE26EV.121.BTL. BioReliance Corporation, Rockville (MD). Unpublished report to the Expert Panel of the Flavor and Extract Manufacturers Association. Submitted to WHO by the International Organization of the Flavor Industry, Brussels; 2015.
44. Llana-Ruiz-Cabello M, Maisanaba S, Puerto M, Prieto AI, Pichardo S, Moyano R, et al. Genotoxicity evaluation of carvacrol in rats using a combined micronucleus and comet assay. Food Chem Toxicol. 2016;98:240–50.
45. Llana-Ruiz-Cabello M, Puerto M, Maisanaba S, Guzman-Guillen R, Pichardo S, Camén AM. Use of micronucleus and comet assay to evaluate the genotoxicity of oregano essential oil (Origanum vulgare I. virens) in rats orally exposed for 90 days. J Toxicol Environ Health A. 2018;81(12):525–33.
46. Ipek E, Tuylu BA, Zeytinoglu H. Effects of carvacrol on sister chromatid exchanges in human lymphocyte cultures. Cytotechnology. 2003;43:145–8.

184
185
EXPOSURE ASSESSMENT

186
187
Dietary exposure to sucrose esters of fatty acids (INS 473) and sucrose oligoesters types I and II (INS 473a)
Second draft prepared byPolly E. Boon1 and Davide Arcella2
1 Department for Food Safety, Centre for Nutrition, Prevention and Health Services, National Institute for Public Health and the Environment, Bilthoven, The Netherlands
2 European Food Safety Authority, Parma, Italy
1. Sucrose esters of fatty acids and sucrose oligoesters types I and II 1872. Estimated dietary exposure 192
2.1 Estimates provided by the sponsor 1922.2 Estimates for the European population 1942.3 Estimates for the population of the USA 196 2.4 Overview of estimated dietary exposure 197
3. Evaluation 1994. Recommendations 1995. References 200
1. Sucrose esters of fatty acids and sucrose oligoesters types I and IIThe Committee considered studies of dietary exposure to sucrose esters of fatty acids (INS 473) (SEFs) and sucrose oligoesters types I and II (INS 473a) (SOEs). SEFs are authorized for use in 50 food categories at maximum permitted levels (MPLs) ranging from 200 mg/kg up to 20 000 mg/kg, as specified in the Codex GSFA (1). SOEs are authorized for use in all but seven of the same food categories at the same MPLs. The MPLs for SEFs and SOEs in the same food categories are valid for single use of the two additives or in combination, with sucroglycerides (INS 474).
SEFs and SOEs were on the agenda of the present meeting of the Committee at the request of the Fifty-first CCFA (2). Only an evaluation of exposure was requested. SEFs have been evaluated by the Committee at several meetings (Annex I, references 131 and 956), but dietary exposure was evaluated at none of those meetings. SOEs were evaluated by the Committee at its 71st meeting (Annex I, reference 196), when dietary exposure to SOEs of the populations of Japan and the USA was evaluated together because the functional
188
WH
O F
ood
Addi
tives
Ser
ies N
o. 8
0, 2
022
Safety evaluation of certain food additives Eighty-ninth JECFA
uses of types I and II were similar and there was common use in some food categories. Dietary exposure was calculated from typical and maximum use levels for SOEs and mean food consumption derived from national nutrition surveys for 11 food categories. The mean dietary exposure estimates based on typical use levels were 1.9 mg/kg bw per day for Japan and 2.5 mg/kg bw per day for the USA; the corresponding estimates based on maximum use levels were 3.7 and 4.6 mg/kg bw per day. The Committee concluded that these were overestimates of dietary exposure, because not all foods in each food category will contain SOEs and consumers will not consistently select those foods that contain the food additives. At its 71st meeting, the Committee also estimated dietary exposure to SOEs on the basis of a maximum use level of 5000 mg/kg in all food categories in which SOEs are authorized in the USA, combined with mean food consumption data for that country. The mean dietary exposure was 0.8 mg/kg bw per day, and the 90th percentile exposure was 1.6 mg/kg bw per day. The Committee noted that this estimate of mean dietary exposure was of the same order of magnitude as the estimates for the population of the USA per capita on the basis of poundage data.
For the current meeting, the sponsor provided the highest technical use levels for the sum of SEFs and SOEs for 46 food categories in the GFSA. The Committee noted that the sponsor provided use levels of SEFs or SOEs in two food categories with no MPLs in the GSFA, namely “02.1.2 Vegetable oils and fats” and “05.1.4 Cocoa and chocolate products”. As determined at the Fifty-first session of the Codex Committee on Food Additives (2), however, SEFs may be used in food category “02.1.2 Vegetable oils and fats” as emulsifiers in cooking oils for anti-spattering purposes at a maximum level of 2000 mg/kg. There is no provision for use of SEFs and SOEs in food category “05.1.4 Cocoa and chocolate products”. The highest technical use levels are listed in Table 1 with the corresponding MPLs.
The Committee evaluated estimates of dietary exposure to the sum of SEFs and SOEs provided by the sponsor and estimates of dietary exposure to SEFs for the populations of Europe (3) and the USA (4). As refined estimates of dietary exposure to the sum of the two compounds were available, the Committee did not use the budget method (5–7) to calculate a theoretical high level of exposure to the sum of SEFs and SOEs associated with the use levels provided by the sponsor. Further, the Committee did not assess international dietary exposure with the use levels provided and the commodity-based food consumption data of the Global Environment Monitoring System – Food Contamination Monitoring and Assessment Programme database cluster diets, the FAO/WHO CIFOCOss database or individual food consumption from the FAO/WHO Global Individual Food consumption data Tool (GIFT). The reasons were that:
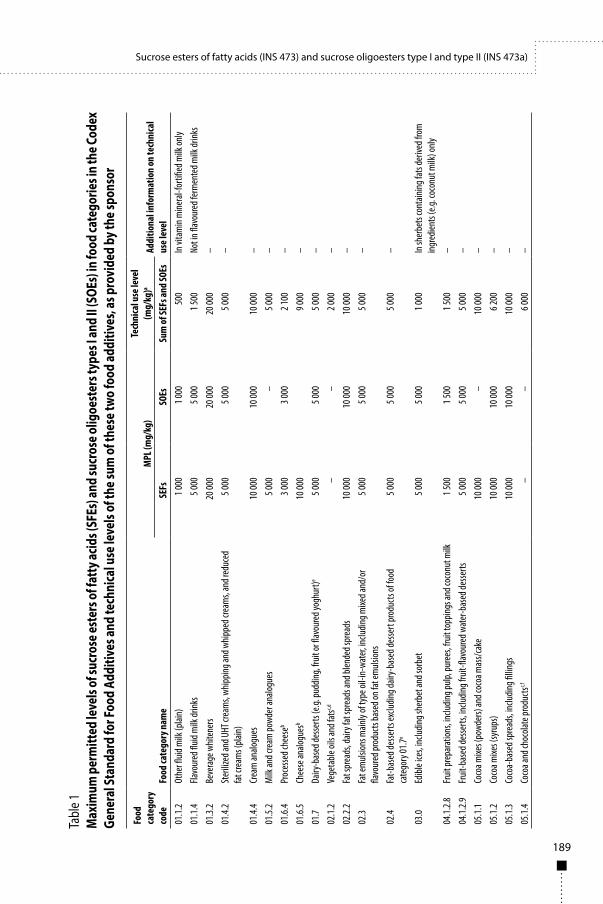
189
Sucrose esters of fatty acids (INS 473) and sucrose oligoesters type I and type II (INS 473a)
Tabl
e 1M
axim
um p
erm
itted
leve
ls of
sucr
ose e
ster
s of f
atty
acid
s (SF
Es) a
nd su
cros
e olig
oest
ers t
ypes
I and
II (S
OEs)
in fo
od ca
tego
ries i
n the
Code
x Ge
nera
l Sta
ndar
d fo
r Foo
d Ad
ditiv
es an
d te
chni
cal u
se le
vels
of th
e sum
of t
hese
two
food
addi
tives
, as p
rovi
ded
by th
e spo
nsor
Food
ca
tego
ry
code
Food
cate
gory
nam
eM
PL (m
g/kg
)Te
chni
cal u
se le
vel
(mg/
kg)a
Addi
tiona
l inf
orm
atio
n on
tech
nica
l us
e lev
elSE
Fs
SOEs
Su
m of
SEFs
and
SOEs
01
.1.2
Othe
r fluid
milk
(plai
n)1 0
001 0
0050
0In
vita
min
mine
ral-f
ortifi
ed m
ilk on
ly01
.1.4
Flavo
ured
fluid
milk
drink
s5 0
005 0
001 5
00No
t in fl
avou
red f
erm
ente
d milk
drink
s01
.3.2
Beve
rage
whit
ener
s20
000
20 00
020
000
–01
.4.2
Ster
ilized
and U
HT cr
eam
s, wh
ipping
and w
hippe
d cre
ams,
and r
educ
ed
fat cr
eam
s (pla
in)5 0
005 0
005 0
00–
01.4.
4Cr
eam
analo
gues
10 00
010
000
10 00
0–
01.5.
2M
ilk an
d cre
am po
wder
analo
gues
5 000
–5 0
00–
01.6.
4Pr
oces
sed c
hees
eb3 0
003 0
002 1
00–
01.6.
5Ch
eese
analo
gues
b10
000
9 000
–01
.7Da
iry-b
ased
desse
rts (e
.g. pu
dding
, fruit
or fla
vour
ed yo
ghur
t)e5 0
005 0
005 0
00–
02.1.
2Ve
geta
ble oi
ls an
d fat
sc,d–
–2 0
00–
02.2.
2Fa
t spr
eads
, dair
y fat
spre
ads a
nd bl
ende
d spr
eads
10 00
010
000
10 00
0–
02.3
Fat e
muls
ions m
ainly
of ty
pe oi
l-in-
wate
r, inc
luding
mixe
d and
/or
flavo
ured
prod
ucts
base
d on f
at em
ulsion
s5 0
005 0
005 0
00–
02.4
Fat-b
ased
desse
rts ex
cludin
g dair
y-ba
sed d
esse
rt pr
oduc
ts of
food
ca
tego
ry 01
.7e
5 000
5 000
5 000
–
03.0
Edibl
e ice
s, inc
luding
sher
bet a
nd so
rbet
5 000
5 000
1 000
In sh
erbe
ts co
ntain
ing fa
ts de
rived
from
ing
redie
nts (
e.g. c
ocon
ut m
ilk) o
nly
04.1.
2.8Fru
it pr
epar
ation
s, inc
luding
pulp,
pure
es, fr
uit to
pping
s and
coco
nut m
ilk1 5
001 5
001 5
00–
04.1.
2.9Fru
it-ba
sed d
esse
rts, in
cludin
g fru
it-fla
vour
ed w
ater
-bas
ed de
sserts
5 000
5 000
5 000
–05
.1.1
Coco
a mixe
s (po
wder
s) an
d coc
oa m
ass/c
ake
10 00
0–
10 00
0–
05.1.
2Co
coa m
ixes (
syru
ps)
10 00
010
000
6 200
–05
.1.3
Coco
a-ba
sed s
prea
ds, in
cludin
g fillin
gs10
000
10 00
010
000
–05
.1.4
Coco
a and
choc
olate
prod
uctsc,f
––
6 000
–
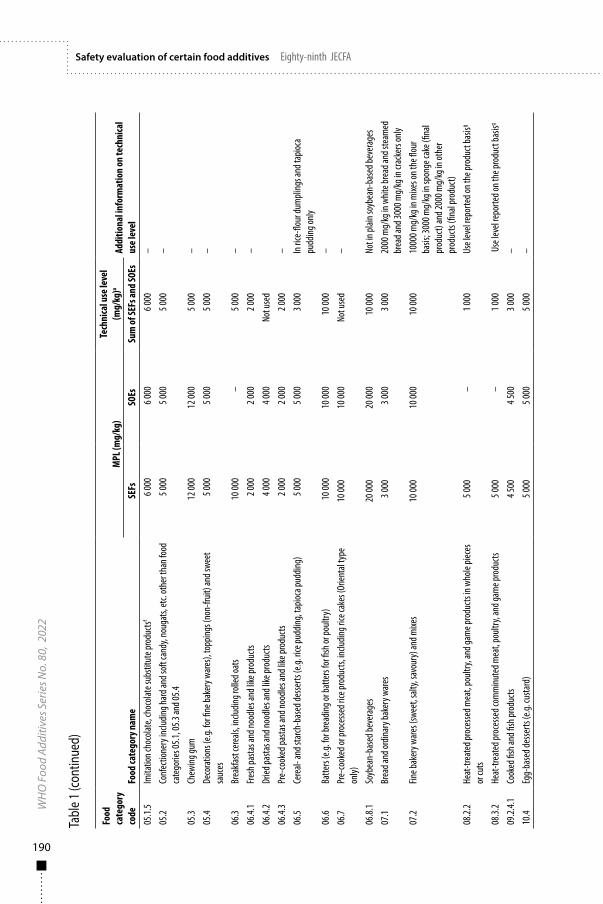
190
WH
O F
ood
Addi
tives
Ser
ies N
o. 8
0, 2
022
Safety evaluation of certain food additives Eighty-ninth JECFATa
ble 1
(con
tinue
d)
Food
ca
tego
ry
code
Food
cate
gory
nam
eM
PL (m
g/kg
)Te
chni
cal u
se le
vel
(mg/
kg)a
Addi
tiona
l inf
orm
atio
n on
tech
nica
l us
e lev
elSE
Fs
SOEs
Su
m of
SEFs
and
SOEs
05
.1.5
Imita
tion c
hoco
late,
choc
olate
subs
titut
e pro
ducts
f6 0
006 0
006 0
00–
05.2
Conf
ectio
nery
inclu
ding h
ard a
nd so
ft ca
ndy,
noug
ats,
etc.
othe
r tha
n foo
d ca
tego
ries 0
5.1, 0
5.3 an
d 05.4
5 000
5 000
5 000
–
05.3
Chew
ing gu
m12
000
12 00
05 0
00–
05.4
Deco
ratio
ns (e
.g. fo
r fine
bake
ry w
ares
), to
pping
s (no
n-fru
it) an
d swe
et
sauc
es5 0
005 0
005 0
00–
06.3
Brea
kfast
cere
als, in
cludin
g roll
ed oa
ts10
000
–5 0
00–
06.4.
1Fre
sh pa
stas a
nd no
odles
and l
ike pr
oduc
ts2 0
002 0
002 0
00–
06.4.
2Dr
ied pa
stas a
nd no
odles
and l
ike pr
oduc
ts4 0
004 0
00No
t use
d06
.4.3
Pre-
cook
ed pa
stas a
nd no
odles
and l
ike pr
oduc
ts2 0
002 0
002 0
00–
06.5
Cere
al- an
d sta
rch-b
ased
desse
rts (e
.g. ric
e pud
ding,
tapio
ca pu
dding
)5 0
005 0
003 0
00In
rice-
flour
dum
pling
s and
tapio
ca
pudd
ing on
ly06
.6Ba
tters
(e.g.
for b
read
ing or
batte
rs fo
r fish
or po
ultry
)10
000
10 00
010
000
–06
.7Pr
e-co
oked
or pr
oces
sed r
ice pr
oduc
ts, in
cludin
g rice
cake
s (Or
ienta
l typ
e on
ly)10
000
10 00
0No
t use
d–
06.8.
1So
ybea
n-ba
sed b
ever
ages
20 00
020
000
10 00
0No
t in p
lain s
oybe
an-b
ased
beve
rage
s07
.1Br
ead a
nd or
dinar
y bak
ery w
ares
3 000
3 000
3 000
2000
mg/
kg in
whit
e bre
ad an
d ste
amed
br
ead a
nd 30
00 m
g/kg
in cr
acke
rs on
ly07
.2Fin
e bak
ery w
ares
(swe
et, s
alty,
savo
ury)
and m
ixes
10 00
010
000
10 00
010
000 m
g/kg
in m
ixes o
n the
flour
ba
sis; 3
000 m
g/kg
in sp
onge
cake
(fina
l pr
oduc
t) an
d 200
0 mg/
kg in
othe
r pr
oduc
ts (fi
nal p
rodu
ct)08
.2.2
Heat
-trea
ted p
roce
ssed m
eat,
poult
ry, an
d gam
e pro
ducts
in w
hole
piece
s or
cuts
5 000
–1 0
00Us
e lev
el re
porte
d on t
he pr
oduc
t bas
isg
08.3.
2He
at-tr
eate
d pro
cesse
d com
minu
ted m
eat,
poult
ry, an
d gam
e pro
ducts
5 000
–1 0
00 U
se le
vel re
porte
d on t
he pr
oduc
t bas
isg
09.2.
4.1Co
oked
fish a
nd fis
h pro
ducts
4 500
4 500
3 000
–10
.4Eg
g-ba
sed d
esse
rts (e
.g. cu
stard
)5 0
005 0
005 0
00–
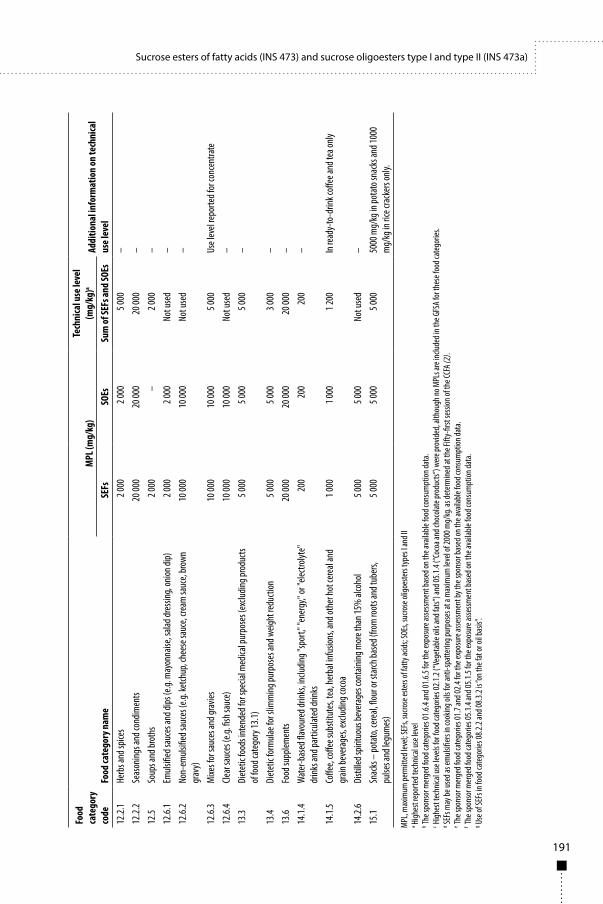
191
Sucrose esters of fatty acids (INS 473) and sucrose oligoesters type I and type II (INS 473a)
Food
ca
tego
ry
code
Food
cate
gory
nam
eM
PL (m
g/kg
)Te
chni
cal u
se le
vel
(mg/
kg)a
Addi
tiona
l inf
orm
atio
n on
tech
nica
l us
e lev
elSE
Fs
SOEs
Su
m of
SEFs
and
SOEs
12
.2.1
Herb
s and
spice
s2 0
002 0
005 0
00–
12.2.
2Se
ason
ings a
nd co
ndim
ents
20 00
020
000
20 00
0–
12.5
Soup
s and
brot
hs2 0
00–
2 000
–12
.6.1
Emuls
ified
sauc
es an
d dips
(e.g.
may
onna
ise, s
alad d
ressi
ng, o
nion d
ip)2 0
002 0
00No
t use
d–
12.6.
2No
n-em
ulsifi
ed sa
uces
(e.g.
ketch
up, c
hees
e sau
ce, c
ream
sauc
e, br
own
grav
y)10
000
10 00
0No
t use
d–
12.6.
3M
ixes f
or sa
uces
and g
ravie
s10
000
10 00
05 0
00Us
e lev
el re
porte
d for
conc
entra
te12
.6.4
Clear
sauc
es (e
.g. fis
h sau
ce)
10 00
010
000
Not u
sed
–13
.3Di
etet
ic fo
ods i
nten
ded f
or sp
ecial
med
ical p
urpo
ses (
exclu
ding p
rodu
cts
of fo
od ca
tego
ry 13
.1)5 0
005 0
005 0
00–
13.4
Diet
etic
form
ulae f
or sl
imm
ing pu
rpos
es an
d weig
ht re
ducti
on5 0
005 0
003 0
00–
13.6
Food
supp
lemen
ts20
000
20 00
020
000
–14
.1.4
Wat
er-b
ased
flavo
ured
drink
s, inc
luding
"spo
rt," "
ener
gy," o
r "ele
ctroly
te"
drink
s and
parti
culat
ed dr
inks
200
200
200
–
14.1.
5Co
ffee,
coffe
e sub
stitu
tes,
tea,
herb
al inf
usion
s, an
d oth
er ho
t cer
eal a
nd
grain
beve
rage
s, ex
cludin
g coc
oa1 0
001 0
001 2
00In
read
y-to
-drin
k coff
ee an
d tea
only
14.2.
6Di
stille
d spir
ituou
s bev
erag
es co
ntain
ing m
ore t
han 1
5% al
coho
l5 0
005 0
00No
t use
d–
15.1
Snac
ks –
pota
to, c
erea
l, flou
r or s
tarch
base
d (fro
m ro
ots a
nd tu
bers,
pu
lses a
nd le
gum
es)
5 000
5 000
5 000
5000
mg/
kg in
pota
to sn
acks
and 1
000
mg/
kg in
rice c
rack
ers o
nly.
MPL
, max
imum
perm
itted
leve
l; SEF
s, su
crose
este
rs of
fatty
acids
; SOE
s, su
crose
oligo
este
rs ty
pes I
and I
Ia H
ighes
t rep
orte
d tec
hnica
l use
leve
l b Th
e spo
nsor
mer
ged f
ood c
ateg
ories
01.6.
4 and
01.6.
5 for
the e
xpos
ure a
ssessm
ent b
ased
on th
e ava
ilable
food
cons
umpt
ion da
ta.
c High
est t
echn
ical u
se le
vels
for f
ood c
ateg
ories
02.1.
2 (“V
eget
able
oils a
nd fa
ts”) a
nd 05
.1.4 (
“Coc
oa an
d cho
colat
e pro
ducts
”) we
re pr
ovide
d, alt
houg
h no M
PLs a
re in
clude
d in t
he G
FSA f
or th
ese f
ood c
ateg
ories
.d SE
Fs m
ay be
used
as em
ulsifi
ers i
n coo
king o
ils fo
r ant
i-spa
tterin
g pur
pose
s at a
max
imum
leve
l of 2
000 m
g/kg
. as d
eter
mine
d at t
he Fi
fty-fi
rst se
ssion
of th
e CCF
A (2)
.e Th
e spo
nsor
mer
ged f
ood c
ateg
ories
01.7
and 0
2.4 fo
r the
expo
sure
asse
ssmen
t by t
he sp
onso
r bas
ed on
the a
vaila
ble fo
od co
nsum
ption
data
.f T
he sp
onso
r mer
ged f
ood c
ateg
ories
05.1.
4 and
05.1.
5 for
the e
xpos
ure a
ssessm
ent b
ased
on th
e ava
ilable
food
cons
umpt
ion da
ta.
g Use
of SE
Fs in
food
cate
gorie
s 08.2
.2 an
d 08.3
.2 is “
on th
e fat
or oi
l bas
is”.
192
WH
O F
ood
Addi
tives
Ser
ies N
o. 8
0, 2
022
Safety evaluation of certain food additives Eighty-ninth JECFA
■ many of the recorded foods are raw food commodities, whereas food additives are added to processed foods only;
■ description of the foods was often not specific enough to make a relevant link between these foods and the use levels provided; and
■ the assessment would have resulted in highly conservative estimates of exposure in view of the large number of wide food categories for which use levels were provided, and the use levels provided were highest technical use levels only (Table 1).
Furthermore, significant time would have been required to evaluate all foods recorded in each dietary survey in the GIFT for matching with the use levels.
2. Estimated dietary exposureThe sponsor provided poundage data and dietary exposure estimates for the sum of these food additives for Japan. In addition, the Committee considered dietary exposure estimates of SEFs for Europe (3) and the USA (4). The Committee did not consider the poundage data, because more refined estimates of dietary exposure were available.
2.1 Estimates provided by the sponsor The sponsor provided estimates of dietary exposure to the sum of SEFs and SOEs for Japan. Exposure was estimated from individual food consumption data collected in 2005–2007 in a research project of the Japanese Ministry of Health, Labour and Welfare (8), combined with MPLs from the GSFA and the highest reported technical use levels. Exposure was estimated for two scenarios. The first scenario was based on the MPLs, supplemented with technical use levels for:
■ two food categories for which the MPL was lower than the technical use level, namely “12.2.1 Herbs and spices” and “14.1.5 Coffee, coffee substitutes, tea, herbal infusions, and other hot cereal and grain beverages, excluding cocoa” (Table 1); and
■ two food categories with no MPL (“02.1.2 Vegetable oils and fats” and “05.1.4 Cocoa and chocolate products”).
In this scenario, 52 food categories were considered. The second scenario was based on the highest reported technical use levels for 46 food categories, including the additional information (Table 1). For example, exposure via the food category “07.2 Fine bakery wares (sweet, salty, savoury) and mixes” was calculated from a use level of 10 000 mg/kg in mixes on a flour basis,
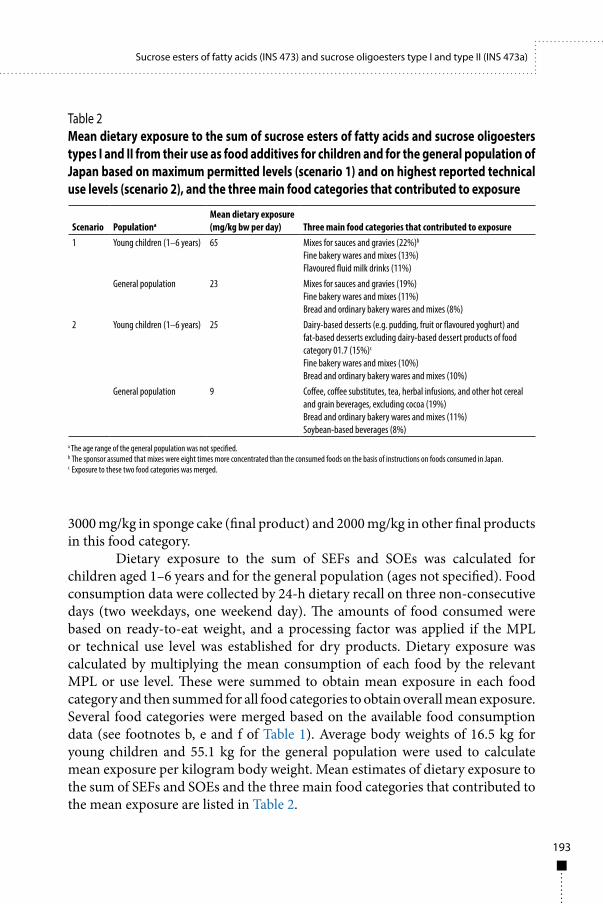
193
Sucrose esters of fatty acids (INS 473) and sucrose oligoesters type I and type II (INS 473a)
3000 mg/kg in sponge cake (final product) and 2000 mg/kg in other final products in this food category.
Dietary exposure to the sum of SEFs and SOEs was calculated for children aged 1–6 years and for the general population (ages not specified). Food consumption data were collected by 24-h dietary recall on three non-consecutive days (two weekdays, one weekend day). The amounts of food consumed were based on ready-to-eat weight, and a processing factor was applied if the MPL or technical use level was established for dry products. Dietary exposure was calculated by multiplying the mean consumption of each food by the relevant MPL or use level. These were summed to obtain mean exposure in each food category and then summed for all food categories to obtain overall mean exposure. Several food categories were merged based on the available food consumption data (see footnotes b, e and f of Table 1). Average body weights of 16.5 kg for young children and 55.1 kg for the general population were used to calculate mean exposure per kilogram body weight. Mean estimates of dietary exposure to the sum of SEFs and SOEs and the three main food categories that contributed to the mean exposure are listed in Table 2.
Table 2Mean dietary exposure to the sum of sucrose esters of fatty acids and sucrose oligoesters types I and II from their use as food additives for children and for the general population of Japan based on maximum permitted levels (scenario 1) and on highest reported technical use levels (scenario 2), and the three main food categories that contributed to exposure
Scenario PopulationaMean dietary exposure(mg/kg bw per day) Three main food categories that contributed to exposure
1 Young children (1–6 years) 65 Mixes for sauces and gravies (22%)b
Fine bakery wares and mixes (13%) Flavoured fluid milk drinks (11%)
General population 23 Mixes for sauces and gravies (19%) Fine bakery wares and mixes (11%) Bread and ordinary bakery wares and mixes (8%)
2 Young children (1–6 years) 25 Dairy-based desserts (e.g. pudding, fruit or flavoured yoghurt) and fat-based desserts excluding dairy-based dessert products of food category 01.7 (15%)c
Fine bakery wares and mixes (10%)Bread and ordinary bakery wares and mixes (10%)
General population 9 Coffee, coffee substitutes, tea, herbal infusions, and other hot cereal and grain beverages, excluding cocoa (19%) Bread and ordinary bakery wares and mixes (11%)Soybean-based beverages (8%)
a The age range of the general population was not specified.b The sponsor assumed that mixes were eight times more concentrated than the consumed foods on the basis of instructions on foods consumed in Japan. c Exposure to these two food categories was merged.
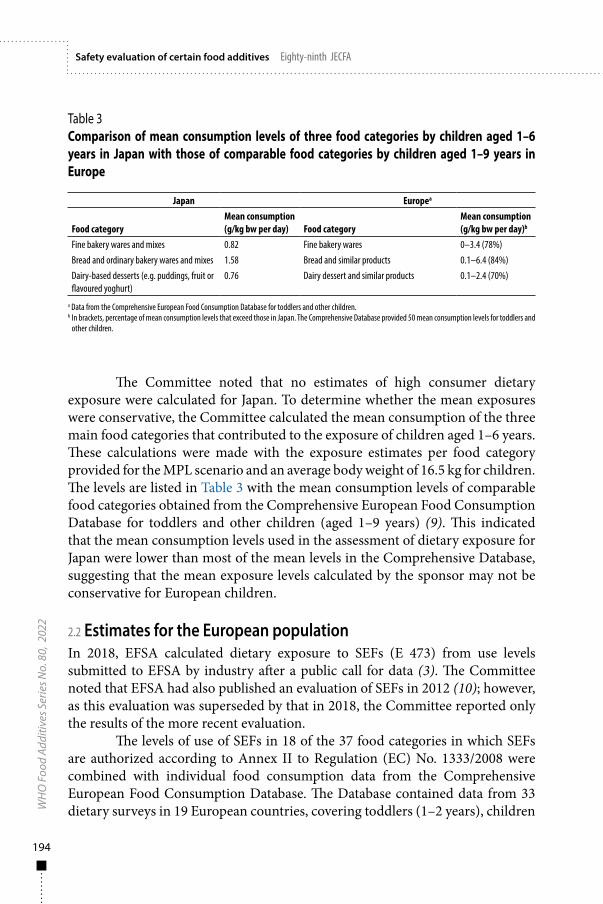
194
WH
O F
ood
Addi
tives
Ser
ies N
o. 8
0, 2
022
Safety evaluation of certain food additives Eighty-ninth JECFA
The Committee noted that no estimates of high consumer dietary exposure were calculated for Japan. To determine whether the mean exposures were conservative, the Committee calculated the mean consumption of the three main food categories that contributed to the exposure of children aged 1–6 years. These calculations were made with the exposure estimates per food category provided for the MPL scenario and an average body weight of 16.5 kg for children. The levels are listed in Table 3 with the mean consumption levels of comparable food categories obtained from the Comprehensive European Food Consumption Database for toddlers and other children (aged 1–9 years) (9). This indicated that the mean consumption levels used in the assessment of dietary exposure for Japan were lower than most of the mean levels in the Comprehensive Database, suggesting that the mean exposure levels calculated by the sponsor may not be conservative for European children.
2.2 Estimates for the European populationIn 2018, EFSA calculated dietary exposure to SEFs (E 473) from use levels submitted to EFSA by industry after a public call for data (3). The Committee noted that EFSA had also published an evaluation of SEFs in 2012 (10); however, as this evaluation was superseded by that in 2018, the Committee reported only the results of the more recent evaluation.
The levels of use of SEFs in 18 of the 37 food categories in which SEFs are authorized according to Annex II to Regulation (EC) No. 1333/2008 were combined with individual food consumption data from the Comprehensive European Food Consumption Database. The Database contained data from 33 dietary surveys in 19 European countries, covering toddlers (1–2 years), children
Table 3Comparison of mean consumption levels of three food categories by children aged 1–6 years in Japan with those of comparable food categories by children aged 1–9 years in Europe
Japan Europea
Food categoryMean consumption (g/kg bw per day) Food category
Mean consumption (g/kg bw per day)b
Fine bakery wares and mixes 0.82 Fine bakery wares 0–3.4 (78%)Bread and ordinary bakery wares and mixes 1.58 Bread and similar products 0.1–6.4 (84%)Dairy-based desserts (e.g. puddings, fruit or flavoured yoghurt)
0.76 Dairy dessert and similar products 0.1–2.4 (70%)
a Data from the Comprehensive European Food Consumption Database for toddlers and other children.b In brackets, percentage of mean consumption levels that exceed those in Japan. The Comprehensive Database provided 50 mean consumption levels for toddlers and
other children.
195
Sucrose esters of fatty acids (INS 473) and sucrose oligoesters type I and type II (INS 473a)
(3–9 years), adolescents (10–17 years) and adults (≥ 18 years). EFSA calculated dietary exposure to SEFs from the use levels provided for two refined exposure scenarios:
■ a “brand-loyal” consumer scenario, in which it was assumed that people are exposed to SEFs at the maximum reported use level for all foods in one food category and at the typical (mean) reported use level for all foods in the remaining food categories; and
■ a non-brand-loyal consumer scenario, in which it was assumed that people are exposed to SEFs at the typical (mean) reported use level for all foods in all food categories.
Dietary exposure to SEFs was calculated for five age groups in the Comprehensive European Food Consumption Database, with adults separated into the age groups 18–64 years and ≥ 65 years. Dietary exposure was calculated by multiplying the use level of SEFs per food category by the summed amounts of all foods in this category consumed by each individual in the Database. Exposure of each individual to SEFs in each food category was summed to derive total exposure per day and divided by the individual’s body weight. The exposure estimates were averaged over the number of survey days, resulting in an individual average exposure per day during the survey period. This was calculated for all individuals in each survey and population group and resulted in distributions of individual exposures. The mean and 95th percentile of exposure were calculated per survey and per population group. The dietary exposure estimates are listed in Table 4.
The exposure assessment for Europe included 18 of the 37 food categories in which SEFs are authorized according to Annex II to Regulation (EC) No. 1333/2008. EFSA (3) noted that information from Mintel’s Global New Products Database, an online database of newly introduced packaged goods onto the worldwide market, indicated that most of the foods for which SEFs were listed on the labels were included in the exposure assessment.
EFSA considered the brand-loyal scenario to be the most relevant for assessing the safety of SEFs because of possible loyalty to brands of certain types of flavoured drinks in which use of SEFs is authorized. These included aniseed-based, dairy-based, coconut and almond drinks. In this scenario and in the non-brand-loyal scenario, the main contributing food category for all age groups was “07.2 fine bakery wares”; food category “14.1.4 flavoured drinks” contributed largely to the exposure of all age groups except infants.
Dietary exposure to SEFs of consumers of special foods for medical purposes and of food supplements was also calculated. These estimates were, however, considered not critical for assessing the safety of SEFs because they
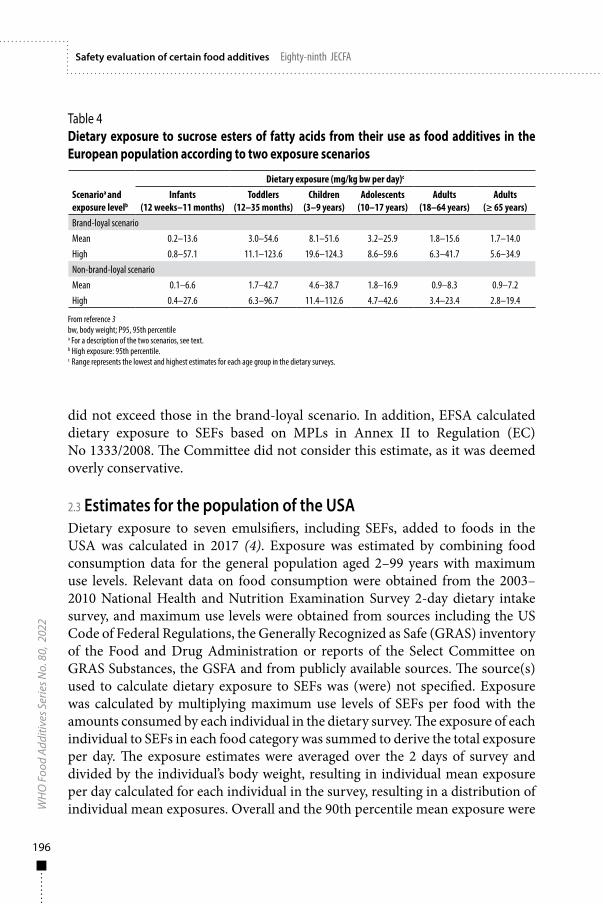
196
WH
O F
ood
Addi
tives
Ser
ies N
o. 8
0, 2
022
Safety evaluation of certain food additives Eighty-ninth JECFA
did not exceed those in the brand-loyal scenario. In addition, EFSA calculated dietary exposure to SEFs based on MPLs in Annex II to Regulation (EC) No 1333/2008. The Committee did not consider this estimate, as it was deemed overly conservative.
2.3 Estimates for the population of the USADietary exposure to seven emulsifiers, including SEFs, added to foods in the USA was calculated in 2017 (4). Exposure was estimated by combining food consumption data for the general population aged 2–99 years with maximum use levels. Relevant data on food consumption were obtained from the 2003–2010 National Health and Nutrition Examination Survey 2-day dietary intake survey, and maximum use levels were obtained from sources including the US Code of Federal Regulations, the Generally Recognized as Safe (GRAS) inventory of the Food and Drug Administration or reports of the Select Committee on GRAS Substances, the GSFA and from publicly available sources. The source(s) used to calculate dietary exposure to SEFs was (were) not specified. Exposure was calculated by multiplying maximum use levels of SEFs per food with the amounts consumed by each individual in the dietary survey. The exposure of each individual to SEFs in each food category was summed to derive the total exposure per day. The exposure estimates were averaged over the 2 days of survey and divided by the individual’s body weight, resulting in individual mean exposure per day calculated for each individual in the survey, resulting in a distribution of individual mean exposures. Overall and the 90th percentile mean exposure were
Table 4Dietary exposure to sucrose esters of fatty acids from their use as food additives in the European population according to two exposure scenarios
Scenarioa and exposure levelb
Dietary exposure (mg/kg bw per day)c
Infants (12 weeks–11 months)
Toddlers(12–35 months)
Children(3–9 years)
Adolescents(10–17 years)
Adults(18–64 years)
Adults (≥ 65 years)
Brand-loyal scenarioMean 0.2–13.6 3.0–54.6 8.1–51.6 3.2–25.9 1.8–15.6 1.7–14.0High 0.8–57.1 11.1–123.6 19.6–124.3 8.6–59.6 6.3–41.7 5.6–34.9Non-brand-loyal scenarioMean 0.1–6.6 1.7–42.7 4.6–38.7 1.8–16.9 0.9–8.3 0.9–7.2High 0.4–27.6 6.3–96.7 11.4–112.6 4.7–42.6 3.4–23.4 2.8–19.4
From reference 3bw, body weight; P95, 95th percentilea For a description of the two scenarios, see text.b High exposure: 95th percentile.c Range represents the lowest and highest estimates for each age group in the dietary surveys.
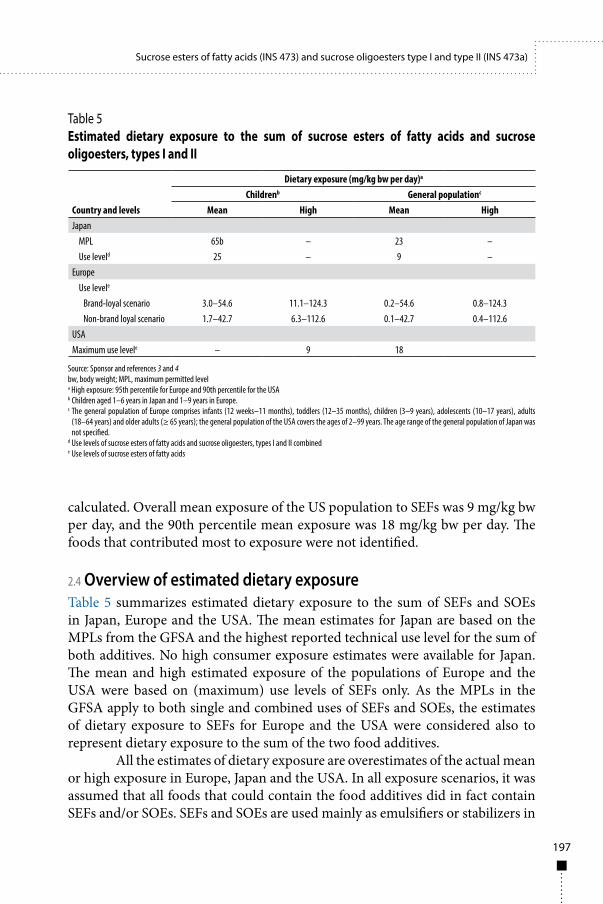
197
Sucrose esters of fatty acids (INS 473) and sucrose oligoesters type I and type II (INS 473a)
calculated. Overall mean exposure of the US population to SEFs was 9 mg/kg bw per day, and the 90th percentile mean exposure was 18 mg/kg bw per day. The foods that contributed most to exposure were not identified.
2.4 Overview of estimated dietary exposureTable 5 summarizes estimated dietary exposure to the sum of SEFs and SOEs in Japan, Europe and the USA. The mean estimates for Japan are based on the MPLs from the GFSA and the highest reported technical use level for the sum of both additives. No high consumer exposure estimates were available for Japan. The mean and high estimated exposure of the populations of Europe and the USA were based on (maximum) use levels of SEFs only. As the MPLs in the GFSA apply to both single and combined uses of SEFs and SOEs, the estimates of dietary exposure to SEFs for Europe and the USA were considered also to represent dietary exposure to the sum of the two food additives.
All the estimates of dietary exposure are overestimates of the actual mean or high exposure in Europe, Japan and the USA. In all exposure scenarios, it was assumed that all foods that could contain the food additives did in fact contain SEFs and/or SOEs. SEFs and SOEs are used mainly as emulsifiers or stabilizers in
Table 5Estimated dietary exposure to the sum of sucrose esters of fatty acids and sucrose oligoesters, types I and II
Country and levels
Dietary exposure (mg/kg bw per day)a
Childrenb General populationc
Mean High Mean HighJapan MPL 65b – 23 – Use leveld 25 – 9 –Europe Use levele
Brand-loyal scenario 3.0–54.6 11.1–124.3 0.2–54.6 0.8–124.3Non-brand loyal scenario 1.7–42.7 6.3–112.6 0.1–42.7 0.4–112.6
USAMaximum use levele – 9 18
Source: Sponsor and references 3 and 4bw, body weight; MPL, maximum permitted levela High exposure: 95th percentile for Europe and 90th percentile for the USAb Children aged 1–6 years in Japan and 1–9 years in Europe.c The general population of Europe comprises infants (12 weeks–11 months), toddlers (12–35 months), children (3–9 years), adolescents (10–17 years), adults
(18–64 years) and older adults (≥ 65 years); the general population of the USA covers the ages of 2–99 years. The age range of the general population of Japan was not specified.
d Use levels of sucrose esters of fatty acids and sucrose oligoesters, types I and II combinede Use levels of sucrose esters of fatty acids
198
WH
O F
ood
Addi
tives
Ser
ies N
o. 8
0, 2
022
Safety evaluation of certain food additives Eighty-ninth JECFA
foods; however, not all foods contain emulsifiers or stabilizers, and, for those that do, other food additives with the same functions in foods are available. SEFs and SOEs constituted 15% of all food additives used mainly as emulsifiers in Japan in 2013. At its 71st meeting, the Committee noted that SOEs are expected to account for ≤ 10% of the total market share of emulsifiers (Annex I, reference 196). In addition, EFSA (3) noted that Mintel’s Global New Products Database indicated that SEFs are listed on the labels of only a small percentage of foods. For example, a maximum of 3.1% of all foods in the two food categories that contribute most to dietary exposure to SEFs in Europe were labelled as containing SEFs. Overall, SEFs were listed on the labels of only 0.2% of the foods in categories in which use of SEFs is authorized. These foods were or had been available on the European market between January 2012 and October 2017. Another factor that contributed to the overestimates was the assumption that, when SEFs or SOEs are used, they are always present at the highest reported use levels. The Committee also noted that the use levels for the food categories “07.2 fine bakery wares” and “14.1.4 flavoured drinks” in the European exposure assessment were higher than those provided by the sponsor.
The high (90th percentile) estimate of exposure to SEFs of 19 mg/kw bw per day for the general population aged 2–99 years in the USA was within the ranges of estimated high (95th percentile) exposure of the adult European population, 3.4–23.4 mg/kg bw per day for adults aged 18–64 years and 2.8–19.4 mg/kg bw per day for adults aged ≥ 65 years. As the age range of 2–99 years comprises mainly adults, this estimate was considered to represent the exposure of the adult population of the USA to SEFs.
As only the European estimates of exposure included high exposure of children, and the mean consumption levels of the food categories that contribute most to the exposure of Japanese children aged 1–6 years were lower than most of the mean food consumption levels available in the Comprehensive European Food Consumption Database for children aged 1–9 years, the Committee considered that the high exposure of 113 mg/kg bw per day for children aged 3–9 years in the non-brand loyal scenario was the most suitable for evaluating dietary exposure to the sum of SEFs and SOEs. The non-brand loyal estimate was selected because SEFs and SOEs are predominantly used as emulsifiers or stabilizers in foods for which other food additives with the same functions are available and SEFs and SOEs are not expected to influence the taste or appearance of foods. The Committee noted that EFSA recommended that more detailed information be collected on the use of SEFs in foods belonging to the two categories that contribute most to exposure in order to refine the exposure assessment.
199
Sucrose esters of fatty acids (INS 473) and sucrose oligoesters type I and type II (INS 473a)
3. EvaluationAt its 49th meeting, the Committee established a group ADI of 0–30 mg/kg bw for SEFs and sucroglycerides. The ADI was established on the basis of their potential to induce laxative effects in adult volunteers at doses > 30 mg/kg bw per day, without application of an uncertainty factor (Annex 1, reference 131). At its 71st meeting, the Committee noted that some of the components of SEFs may be present in significant amounts in SOEs and established a group ADI of 0–30 mg/kg bw for SEFs, SOEs and sucroglycerides (Annex 1, reference 196).
The high estimate of dietary exposure to the sum of SEFs and SOEs of 113 mg/kg bw per day for children aged 3–9 years exceeded the group ADI of 0–30 mg/kg bw per day by a factor of about 4. The Committee also noted that the high estimates of dietary exposure of some other age groups also exceeded the ADI.
The Committee noted that the high estimates of dietary exposure are conservative, predominantly because of the assumptions that:
■ all foods that could contain SOEs and SEFs do in fact contain these food additives, whereas other food additives with the same functions in foods are available; and
■ when SEFs or SOEs are used, they are always present at the reported use levels.
Therefore, the Committee considered that more refined estimates of dietary exposure should be provided.
4. RecommendationsTo refine the estimates of dietary exposure to SEFs and SOEs, either alone or summed, the Committee recommends that the sponsors submit information on:
■ typical or mean and high use levels in foods in which the food additives are used; and
■ foods (or food categories) in which the use of SEFs and/or SOEs is permitted but in which they are never used.
In both cases, the information should be as specific as possible, and the foods should be classified according to the FoodEx2 classification system, which is that used for the CIFOCOss and GIFT food consumption databases, or another appropriate system. The Committee did not use the CIFOCOss and GIFT databases to assess dietary exposure to SEFs and SOEs, partly because
200
calculations of exposure would have been laborious in view of the number of broad food categories for which use levels were provided. In order to use these data for assessing dietary exposure to food additives that are present in large numbers of food categories, a table should be developed to map the foods recorded in both databases according to the FoodEx2 classification to the food categories of the GSFA. That would ensure that mapping was also consistent between meetings of JECFA.
The Committee recommends that more detailed information on the use of SEFs and SOEs in foods and a mapping table be made available within 2 years.
5. References1. FAO, WHO. Codex General Standard for Food Additives. Food additives database. Rome: Food and
Agriculture of the United Nations; 2019 (http://www.fao.org/gsfaonline/additives/index.html, accessed 6 May 2020).
2. Codex Alimentarius Commission. Codex Committee on Food Additives. Fifty-first session. Endorsement and/or revision of maximum levels for food additives and processing aids in Codex standards. Rome: Food and Agriculture of the United Nations; 2019 (http://www.fao.org/fao-who-codexalimentarius/sh-proxy/en/?lnk=1&url=https%253A%252F%252Fworkspace.fao.org%252Fsites%252Fcodex%252FMeetings%252FCX-711-51%252FWD%252Ffa51_05e.pdf, accessed September 2020).
3. Scientific opinion on the refined exposure assessment of sucrose esters of fatty acids (E 473) from its use as a food additive. EFSA J. 2018;16(1);5087.
4. Shah R, Kolanos R, DiNovi MJ, Mattia A, Kaneko KJ. Dietary exposures for the safety assessment of seven emulsifiers commonly added to foods in the United States and implications for safety. Food Addit Contam Part A. 2017;34:905–17.
5. Hansen SC. Acceptable daily intake of food additives and ceiling on levels of use. Food Cosmet Toxicol. 1966;4:427–32.
6. Hansen SC. Conditions for use of food additives based on a budget method for an acceptable daily intake. J Food Protect. 1979;42:429–34.
7. FAO, WHO. Principles and methods for the risk assessment of chemicals in food. Chapter 6. Dietary exposure assessment of chemicals in food. Geneva: World Health Organization; 2019 (https://apps.who.int/iris/bitstream/handle/10665/44065/WHO_EHC_240_9_eng_Chapter6.pdf ; jsessionid=4C1B9C27E95AC6E3D7E82941C3B4F14C?sequence=9).
8. Special tabulation report for food intake frequency and intake survey. Tokyo: Ministry of Health, Labour and Welfare; 2010 (https://www.mhlw.go.jp/file/06-Seisakujouhou-11130500-Shokuhinanzenbu/0000170577.pdf in Japanese and https://www.mhlw.go.jp/english/topics/foodsafety/foodadditives/dl/syokuhinsessyuhindo-english.pdf in English, accessed September 2020).
9. The EFSA Comprehensive European Food Consumption Database. Parma: European Food Safety Agency; 2018.
10. Scientific opinion on the exposure assessment of sucrose esters of fatty acids (E 473) from its use as food additive. EFSA J. 2012;10(5):2658.
201
ANNEX 1
Reports and other documents resulting from previous meetings of the Joint FAO/WHO Expert Committee on Food Additives
1. General principles governing the use of food additives (First report of the Joint FAO/WHO Expert Committee on Food Additives). FAO Nutrition Meetings Report Series, No. 15, 1957; WHO Technical Report Series, No. 129, 1957 (out of print).
2. Procedures for the testing of intentional food additives to establish their safety for use (Second report of the Joint FAO/WHO Expert Committee on Food Additives). FAO Nutrition Meetings Report Series, No. 17, 1958; WHO Technical Report Series, No. 144, 1958 (out of print).
3. Specifications for identity and purity of food additives (antimicrobial preservatives and antioxidants) (Third report of the Joint FAO/WHO Expert Committee on Food Additives). These specifications were subsequently revised and published as Specifications for identity and purity of food additives, Vol. I. Antimicrobial preservatives and antioxidants, Rome, Food and Agriculture Organization of the United Nations, 1962 (out of print).
4. Specifications for identity and purity of food additives (food colours) (Fourth report of the Joint FAO/WHO Expert Committee on Food Additives). These specifications were subsequently revised and published as Specifications for identity and purity of food additives, Vol. II. Food colours, Rome, Food and Agriculture Organization of the United Nations, 1963 (out of print).
5. Evaluation of the carcinogenic hazards of food additives (Fifth report of the Joint FAO/WHO Expert Committee on Food Additives). FAO Nutrition Meetings Report Series, No. 29, 1961; WHO Technical Report Series, No. 220, 1961 (out of print).
6. Evaluation of the toxicity of a number of antimicrobials and antioxidants (Sixth report of the Joint FAO/WHO Expert Committee on Food Additives). FAO Nutrition Meetings Report Series, No. 31, 1962; WHO Technical Report Series, No. 228, 1962 (out of print).
7. Specifications for the identity and purity of food additives and their toxicological evaluation: emulsifiers, stabilizers, bleaching and maturing agents (Seventh report of the Joint FAO/WHO Expert Committee on Food Additives). FAO Nutrition Meetings Series, No. 35, 1964; WHO Technical Report Series, No. 281, 1964 (out of print).
8. Specifications for the identity and purity of food additives and their toxicological evaluation: food colours and some antimicrobials and antioxidants (Eighth report of the Joint FAO/WHO Expert Committee on Food Additives). FAO Nutrition Meetings Series, No. 38, 1965; WHO Technical Report Series, No. 309, 1965 (out of print).
9. Specifications for identity and purity and toxicological evaluation of some antimicrobials and antioxidants. FAO Nutrition Meetings Report Series, No. 38A, 1965; WHO/Food Add/24.65 (out of print).
10. Specifications for identity and purity and toxicological evaluation of food colours. FAO Nutrition Meetings Report Series, No. 38B, 1966; WHO/Food Add/66.25.
202
WH
O F
ood
Addi
tives
Ser
ies N
o. 8
0, 2
022
Safety evaluation of certain food additives Eighty-ninth JECFA
11. Specifications for the identity and purity of food additives and their toxicological evaluation: some antimicrobials, antioxidants, emulsifiers, stabilizers, flour treatment agents, acids, and bases (Ninth report of the Joint FAO/WHO Expert Committee on Food Additives). FAO Nutrition Meetings Series, No. 40, 1966; WHO Technical Report Series, No. 339, 1966 (out of print).
12. Toxicological evaluation of some antimicrobials, antioxidants, emulsifiers, stabilizers, flour treatment agents, acids, and bases. FAO Nutrition Meetings Report Series, No. 40A, B, C; WHO/Food Add/67.29.
13. Specifications for the identity and purity of food additives and their toxicological evaluation: some emulsifiers and stabilizers and certain other substances (Tenth report of the Joint FAO/WHO Expert Committee on Food Additives). FAO Nutrition Meetings Series, No. 43, 1967; WHO Technical Report Series, No. 373, 1967.
14. Specifications for the identity and purity of food additives and their toxicological evaluation: some flavouring substances and non nutritive sweetening agents (Eleventh report of the Joint FAO/WHO Expert Committee on Food Additives). FAO Nutrition Meetings Series, No. 44, 1968; WHO Technical Report Series, No. 383, 1968.
15. Toxicological evaluation of some flavouring substances and non nutritive sweetening agents. FAO Nutrition Meetings Report Series, No. 44A, 1968; WHO/Food Add/68.33.
16. Specifications and criteria for identity and purity of some flavouring substances and non-nutritive sweetening agents. FAO Nutrition Meetings Report Series, No. 44B, 1969; WHO/Food Add/69.31.
17. Specifications for the identity and purity of food additives and their toxicological evaluation: some antibiotics (Twelfth report of the Joint FAO/WHO Expert Committee on Food Additives). FAO Nutrition Meetings Series, No. 45, 1969; WHO Technical Report Series, No. 430, 1969.
18. Specifications for the identity and purity of some antibiotics. FAO Nutrition Meetings Series, No. 45A, 1969; WHO/Food Add/69.34.
19. Specifications for the identity and purity of food additives and their toxicological evaluation: some food colours, emulsifiers, stabilizers, anticaking agents, and certain other substances (Thirteenth report of the Joint FAO/WHO Expert Committee on Food Additives). FAO Nutrition Meetings Series, No. 46, 1970; WHO Technical Report Series, No. 445, 1970.
20. Toxicological evaluation of some food colours, emulsifiers, stabilizers, anticaking agents, and certain other substances. FAO Nutrition Meetings Report Series, No. 46A, 1970; WHO/Food Add/70.36.
21. Specifications for the identity and purity of some food colours, emulsifiers, stabilizers, anticaking agents, and certain other food additives. FAO Nutrition Meetings Report Series, No. 46B, 1970; WHO/Food Add/70.37.
22. Evaluation of food additives: specifications for the identity and purity of food additives and their toxicological evaluation: some extraction solvents and certain other substances; and a review of the technological efficacy of some antimicrobial agents (Fourteenth report of the Joint FAO/WHO Expert Committee on Food Additives). FAO Nutrition Meetings Series, No. 48, 1971; WHO Technical Report Series, No. 462, 1971.
23. Toxicological evaluation of some extraction solvents and certain other substances. FAO Nutrition Meetings Report Series, No. 48A, 1971; WHO/Food Add/70.39.
24. Specifications for the identity and purity of some extraction solvents and certain other substances. FAO Nutrition Meetings Report Series, No. 48B, 1971; WHO/Food Add/70.40.
25. A review of the technological efficacy of some antimicrobial agents. FAO Nutrition Meetings Report Series, No. 48C, 1971; WHO/Food Add/70.41.
26. Evaluation of food additives: some enzymes, modified starches, and certain other substances: Toxicological evaluations and specifications and a review of the technological efficacy of some antioxidants (Fifteenth report
203
Annex 1
of the Joint FAO/WHO Expert Committee on Food Additives). FAO Nutrition Meetings Series, No. 50, 1972; WHO Technical Report Series, No. 488, 1972.
27. Toxicological evaluation of some enzymes, modified starches, and certain other substances. FAO Nutrition Meetings Report Series, No. 50A, 1972; WHO Food Additives Series, No. 1, 1972.
28. Specifications for the identity and purity of some enzymes and certain other substances. FAO Nutrition Meetings Report Series, No. 50B, 1972; WHO Food Additives Series, No. 2, 1972.
29. A review of the technological efficacy of some antioxidants and synergists. FAO Nutrition Meetings Report Series, No. 50C, 1972; WHO Food Additives Series, No. 3, 1972.
30. Evaluation of certain food additives and the contaminants mercury, lead, and cadmium (Sixteenth report of the Joint FAO/WHO Expert Committee on Food Additives). FAO Nutrition Meetings Series, No. 51, 1972; WHO Technical Report Series, No. 505, 1972, and corrigendum.
31. Evaluation of mercury, lead, cadmium and the food additives amaranth, diethylpyrocarbamate, and octyl gallate. FAO Nutrition Meetings Report Series, No. 51A, 1972; WHO Food Additives Series, No. 4, 1972.
32. Toxicological evaluation of certain food additives with a review of general principles and of specifications (Seventeenth report of the Joint FAO/WHO Expert Committee on Food Additives). FAO Nutrition Meetings Series, No. 53, 1974; WHO Technical Report Series, No. 539, 1974, and corrigendum (out of print).
33. Toxicological evaluation of some food additives including anticaking agents, antimicrobials, antioxidants, emulsifiers, and thickening agents. FAO Nutrition Meetings Report Series, No. 53A, 1974; WHO Food Additives Series, No. 5, 1974.
34. Specifications for identity and purity of thickening agents, anticaking agents, antimicrobials, antioxidants and emulsifiers. FAO Food and Nutrition Paper, No. 4, 1978.
35. Evaluation of certain food additives (Eighteenth report of the Joint FAO/WHO Expert Committee on Food Additives). FAO Nutrition Meetings Series, No. 54, 1974; WHO Technical Report Series, No. 557, 1974, and corrigendum.
36. Toxicological evaluation of some food colours, enzymes, flavour enhancers, thickening agents, and certain other food additives. FAO Nutrition Meetings Report Series, No. 54A, 1975; WHO Food Additives Series, No. 6, 1975.
37. Specifications for the identity and purity of some food colours, enhancers, thickening agents, and certain food additives. FAO Nutrition Meetings Report Series, No. 54B, 1975; WHO Food Additives Series, No. 7, 1975.
38. Evaluation of certain food additives: some food colours, thickening agents, smoke condensates, and certain other substances. (Nineteenth report of the Joint FAO/WHO Expert Committee on Food Additives). FAO Nutrition Meetings Series, No. 55, 1975; WHO Technical Report Series, No. 576, 1975.
39. Toxicological evaluation of some food colours, thickening agents, and certain other substances. FAO Nutrition Meetings Report Series, No. 55A, 1975; WHO Food Additives Series, No. 8, 1975.
40. Specifications for the identity and purity of certain food additives. FAO Nutrition Meetings Report Series, No. 55B, 1976; WHO Food Additives Series, No. 9, 1976.
41. Evaluation of certain food additives (Twentieth report of the Joint FAO/WHO Expert Committee on Food Additives). FAO Food and Nutrition Meetings Series, No. 1, 1976; WHO Technical Report Series, No. 599, 1976.
42. Toxicological evaluation of certain food additives. WHO Food Additives Series, No. 10, 1976.
43. Specifications for the identity and purity of some food additives. FAO Food and Nutrition Series, No. 1B, 1977; WHO Food Additives Series, No. 11, 1977.
204
WH
O F
ood
Addi
tives
Ser
ies N
o. 8
0, 2
022
Safety evaluation of certain food additives Eighty-ninth JECFA
44. Evaluation of certain food additives (Twenty-first report of the Joint FAO/WHO Expert Committee on Food Additives). WHO Technical Report Series, No. 617, 1978.
45. Summary of toxicological data of certain food additives. WHO Food Additives Series, No. 12, 1977.
46. Specifications for identity and purity of some food additives, including antioxidant, food colours, thickeners, and others. FAO Nutrition Meetings Report Series, No. 57, 1977.
47. Evaluation of certain food additives and contaminants (Twenty-second report of the Joint FAO/WHO Expert Committee on Food Additives). WHO Technical Report Series, No. 631, 1978.
48. Summary of toxicological data of certain food additives and contaminants. WHO Food Additives Series, No. 13, 1978.
49. Specifications for the identity and purity of certain food additives. FAO Food and Nutrition Paper, No. 7, 1978.
50. Evaluation of certain food additives (Twenty-third report of the Joint FAO/WHO Expert Committee on Food Additives). WHO Technical Report Series, No. 648, 1980, and corrigenda.
51. Toxicological evaluation of certain food additives. WHO Food Additives Series, No. 14, 1980.
52. Specifications for identity and purity of food colours, flavouring agents, and other food additives. FAO Food and Nutrition Paper, No. 12, 1979.
53. Evaluation of certain food additives (Twenty-fourth report of the Joint FAO/WHO Expert Committee on Food Additives). WHO Technical Report Series, No. 653, 1980.
54. Toxicological evaluation of certain food additives. WHO Food Additives Series, No. 15, 1980.
55. Specifications for identity and purity of food additives (sweetening agents, emulsifying agents, and other food additives). FAO Food and Nutrition Paper, No. 17, 1980.
56. Evaluation of certain food additives (Twenty-fifth report of the Joint FAO/WHO Expert Committee on Food Additives). WHO Technical Report Series, No. 669, 1981.
57. Toxicological evaluation of certain food additives. WHO Food Additives Series, No. 16, 1981.
58. Specifications for identity and purity of food additives (carrier solvents, emulsifiers and stabilizers, enzyme preparations, flavouring agents, food colours, sweetening agents, and other food additives). FAO Food and Nutrition Paper, No. 19, 1981.
59. Evaluation of certain food additives and contaminants (Twenty-sixth report of the Joint FAO/WHO Expert Committee on Food Additives). WHO Technical Report Series, No. 683, 1982.
60. Toxicological evaluation of certain food additives. WHO Food Additives Series, No. 17, 1982.
61. Specifications for the identity and purity of certain food additives. FAO Food and Nutrition Paper, No. 25, 1982.
62. Evaluation of certain food additives and contaminants (Twenty-seventh report of the Joint FAO/WHO Expert Committee on Food Additives). WHO Technical Report Series, No. 696, 1983, and corrigenda.
63. Toxicological evaluation of certain food additives and contaminants. WHO Food Additives Series, No. 18, 1983.
64. Specifications for the identity and purity of certain food additives. FAO Food and Nutrition Paper, No. 28, 1983.
65. Guide to specifications – General notices, general methods, identification tests, test solutions, and other reference materials. FAO Food and Nutrition Paper, No. 5, Rev. 1, 1983.
66. Evaluation of certain food additives and contaminants (Twenty-eighth report of the Joint FAO/WHO Expert Committee on Food Additives). WHO Technical Report Series, No. 710, 1984, and corrigendum.
205
Annex 1
67. Toxicological evaluation of certain food additives and contaminants. WHO Food Additives Series, No. 19, 1984.
68. Specifications for the identity and purity of food colours. FAO Food and Nutrition Paper, No. 31/1, 1984.
69. Specifications for the identity and purity of food additives. FAO Food and Nutrition Paper, No. 31/2, 1984.
70. Evaluation of certain food additives and contaminants (Twenty-ninth report of the Joint FAO/WHO Expert Committee on Food Additives). WHO Technical Report Series, No. 733, 1986, and corrigendum.
71. Specifications for the identity and purity of certain food additives. FAO Food and Nutrition Paper, No. 34, 1986.
72. Toxicological evaluation of certain food additives and contaminants. WHO Food Additives Series, No. 20. Cambridge University Press, 1987.
73. Evaluation of certain food additives and contaminants (Thirtieth report of the Joint FAO/WHO Expert Committee on Food Additives). WHO Technical Report Series, No. 751, 1987.
74. Toxicological evaluation of certain food additives and contaminants. WHO Food Additives Series, No. 21. Cambridge University Press, 1987.
75. Specifications for the identity and purity of certain food additives. FAO Food and Nutrition Paper, No. 37, 1986.
76. Principles for the safety assessment of food additives and contaminants in food. WHO Environmental Health Criteria, No. 70. Geneva, World Health Organization, 1987 (out of print). The full text is available electronically at www.who.int/pcs.
77. Evaluation of certain food additives and contaminants (Thirty-first report of the Joint FAO/WHO Expert Committee on Food Additives). WHO Technical Report Series, No. 759, 1987, and corrigendum.
78. Toxicological evaluation of certain food additives. WHO Food Additives Series, No. 22. Cambridge University Press, 1988.
79. Specifications for the identity and purity of certain food additives. FAO Food and Nutrition Paper, No. 38, 1988.
80. Evaluation of certain veterinary drug residues in food (Thirty-second report of the Joint FAO/WHO Expert Committee on Food Additives). WHO Technical Report Series, No. 763, 1988.
81. Toxicological evaluation of certain veterinary drug residues in food. WHO Food Additives Series, No. 23. Cambridge University Press, 1988.
82. Residues of some veterinary drugs in animals and foods. FAO Food and Nutrition Paper, No. 41, 1988.
83. Evaluation of certain food additives and contaminants (Thirty-third report of the Joint FAO/WHO Expert Committee on Food Additives). WHO Technical Report Series, No. 776, 1989.
84. Toxicological evaluation of certain food additives and contaminants. WHO Food Additives Series, No. 24. Cambridge University Press, 1989.
85. Evaluation of certain veterinary drug residues in food (Thirty-fourth report of the Joint FAO/WHO Expert Committee on Food Additives). WHO Technical Report Series, No. 788, 1989.
86. Toxicological evaluation of certain veterinary drug residues in food. WHO Food Additives Series, No. 25, 1990.
87. Residues of some veterinary drugs in animals and foods. FAO Food and Nutrition Paper, No. 41/2, 1990.
88. Evaluation of certain food additives and contaminants (Thirty-fifth report of the Joint FAO/WHO Expert Committee on Food Additives). WHO Technical Report Series, No. 789, 1990, and corrigenda.
89. Toxicological evaluation of certain food additives and contaminants. WHO Food Additives Series, No. 26, 1990.
206
WH
O F
ood
Addi
tives
Ser
ies N
o. 8
0, 2
022
Safety evaluation of certain food additives Eighty-ninth JECFA
90. Specifications for identity and purity of certain food additives. FAO Food and Nutrition Paper, No. 49, 1990.
91. Evaluation of certain veterinary drug residues in food (Thirty-sixth report of the Joint FAO/WHO Expert Committee on Food Additives). WHO Technical Report Series, No. 799, 1990.
92. Toxicological evaluation of certain veterinary drug residues in food. WHO Food Additives Series, No. 27, 1991.
93. Residues of some veterinary drugs in animals and foods. FAO Food and Nutrition Paper, No. 41/3, 1991.
94. Evaluation of certain food additives and contaminants (Thirty-seventh report of the Joint FAO/WHO Expert Committee on Food Additives). WHO Technical Report Series, No. 806, 1991, and corrigenda.
95. Toxicological evaluation of certain food additives and contaminants. WHO Food Additives Series, No. 28, 1991.
96. Compendium of food additive specifications (Joint FAO/WHO Expert Committee on Food Additives (JECFA)). Combined specifications from 1st through the 37th meetings, 1956–1990. Rome, Food and Agriculture Organization of the United Nations, 1992 (2 volumes).
97. Evaluation of certain veterinary drug residues in food (Thirty-eighth report of the Joint FAO/WHO Expert Committee on Food Additives). WHO Technical Report Series, No. 815, 1991.
98. Toxicological evaluation of certain veterinary residues in food. WHO Food Additives Series, No. 29, 1991.
99. Residues of some veterinary drugs in animals and foods. FAO Food and Nutrition Paper, No. 41/4, 1991.
100. Guide to specifications – General notices, general analytical techniques, identification tests, test solutions, and other reference materials. FAO Food and Nutrition Paper, No. 5, Ref. 2, 1991.
101. Evaluation of certain food additives and naturally occurring toxicants (Thirty-ninth report of the Joint FAO/WHO Expert Committee on Food Additives). WHO Technical Report Series, No. 828, 1992.
102. Toxicological evaluation of certain food additives and naturally occurring toxicants. WHO Food Additives Series, No. 30, 1993.
103. Compendium of food additive specifications: addendum 1. FAO Food and Nutrition Paper, No. 52, 1992.
104. Evaluation of certain veterinary drug residues in food (Fortieth report of the Joint FAO/WHO Expert Committee on Food Additives). WHO Technical Report Series, No. 832, 1993.
105. Toxicological evaluation of certain veterinary drug residues in food. WHO Food Additives Series, No. 31, 1993.
106. Residues of some veterinary drugs in animals and food. FAO Food and Nutrition Paper, No. 41/5, 1993.
107. Evaluation of certain food additives and contaminants (Forty-first report of the Joint FAO/WHO Expert Committee on Food Additives). WHO Technical Report Series, No. 837, 1993.
108. Toxicological evaluation of certain food additives and contaminants. WHO Food Additives Series, No. 32, 1993.
109. Compendium of food additive specifications: addendum 2. FAO Food and Nutrition Paper, No. 52, Add. 2, 1993.
110. Evaluation of certain veterinary drug residues in food (Forty-second report of the Joint FAO/WHO Expert Committee on Food Additives). WHO Technical Report Series, No. 851, 1995.
111. Toxicological evaluation of certain veterinary drug residues in food. WHO Food Additives Series, No. 33, 1994.
112. Residues of some veterinary drugs in animals and foods. FAO Food and Nutrition Paper, No. 41/6, 1994.
113. Evaluation of certain veterinary drug residues in food (Forty-third report of the Joint FAO/WHO Expert Committee on Food Additives). WHO Technical Report Series, No. 855, 1995, and corrigendum.
207
Annex 1
114. Toxicological evaluation of certain veterinary drug residues in food. WHO Food Additives Series, No. 34, 1995.
115. Residues of some veterinary drugs in animals and foods. FAO Food and Nutrition Paper, No. 41/7, 1995.
116. Evaluation of certain food additives and contaminants (Forty-fourth report of the Joint FAO/WHO Expert Committee on Food Additives). WHO Technical Report Series, No. 859, 1995.
117. Toxicological evaluation of certain food additives and contaminants. WHO Food Additives Series, No. 35, 1996.
118. Compendium of food additive specifications: addendum 3. FAO Food and Nutrition Paper, No. 52, Add. 3, 1995.
119. Evaluation of certain veterinary drug residues in food (Forty-fifth report of the Joint FAO/WHO Expert Committee on Food Additives). WHO Technical Report Series, No. 864, 1996.
120. Toxicological evaluation of certain veterinary drug residues in food. WHO Food Additives Series, No. 36, 1996.
121. Residues of some veterinary drugs in animals and foods. FAO Food and Nutrition Paper, No. 41/8, 1996.
122. Evaluation of certain food additives and contaminants (Forty-sixth report of the Joint FAO/WHO Expert Committee on Food Additives). WHO Technical Report Series, No. 868, 1997.
123. Toxicological evaluation of certain food additives. WHO Food Additives Series, No. 37, 1996.
124. Compendium of food additive specifications, addendum 4. FAO Food and Nutrition Paper, No. 52, Add. 4, 1996.
125. Evaluation of certain veterinary drug residues in food (Forty-seventh report of the Joint FAO/WHO Expert Committee on Food Additives). WHO Technical Report Series, No. 876, 1998.
126. Toxicological evaluation of certain veterinary drug residues in food. WHO Food Additives Series, No. 38, 1996.
127. Residues of some veterinary drugs in animals and foods. FAO Food and Nutrition Paper, No. 41/9, 1997.
128. Evaluation of certain veterinary drug residues in food (Forty-eighth report of the Joint FAO/WHO Expert Committee on Food Additives). WHO Technical Report Series, No. 879, 1998.
129. Toxicological evaluation of certain veterinary drug residues in food. WHO Food Additives Series, No. 39, 1997.
130. Residues of some veterinary drugs in animals and foods. FAO Food and Nutrition Paper, No. 41/10, 1998.
131. Evaluation of certain food additives and contaminants (Forty-ninth report of the Joint FAO/WHO Expert Committee on Food Additives). WHO Technical Report Series, No. 884, 1999.
132. Safety evaluation of certain food additives and contaminants. WHO Food Additives Series, No. 40, 1998.
133. Compendium of food additive specifications: addendum 5. FAO Food and Nutrition Paper, No. 52, Add. 5, 1997.
134. Evaluation of certain veterinary drug residues in food (Fiftieth report of the Joint FAO/WHO Expert Committee on Food Additives). WHO Technical Report Series, No. 888, 1999.
135. Toxicological evaluation of certain veterinary drug residues in food. WHO Food Additives Series, No. 41, 1998.
136. Residues of some veterinary drugs in animals and foods. FAO Food and Nutrition Paper, No. 41/11, 1999.
137. Evaluation of certain food additives (Fifty-first report of the Joint FAO/WHO Expert Committee on Food Additives). WHO Technical Report Series, No. 891, 2000.
138. Safety evaluation of certain food additives. WHO Food Additives Series, No. 42, 1999.
139. Compendium of food additive specifications, addendum 6. FAO Food and Nutrition Paper, No. 52, Add. 6, 1998.
208
WH
O F
ood
Addi
tives
Ser
ies N
o. 8
0, 2
022
Safety evaluation of certain food additives Eighty-ninth JECFA
140. Evaluation of certain veterinary drug residues in food (Fifty-second report of the Joint FAO/WHO Expert Committee on Food Additives). WHO Technical Report Series, No. 893, 2000.
141. Toxicological evaluation of certain veterinary drug residues in food. WHO Food Additives Series, No. 43, 2000.
142. Residues of some veterinary drugs in animals and foods. FAO Food and Nutrition Paper, No. 41/12, 2000.
143. Evaluation of certain food additives and contaminants (Fifty-third report of the Joint FAO/WHO Expert Committee on Food Additives). WHO Technical Report Series, No. 896, 2000.
144. Safety evaluation of certain food additives and contaminants. WHO Food Additives Series, No. 44, 2000.
145. Compendium of food additive specifications, addendum 7. FAO Food and Nutrition Paper, No. 52, Add. 7, 1999.
146. Evaluation of certain veterinary drug residues in food (Fifty-fourth report of the Joint FAO/WHO Expert Committee on Food Additives). WHO Technical Report Series, No. 900, 2001.
147. Toxicological evaluation of certain veterinary drug residues in food. WHO Food Additives Series, No. 45, 2000.
148. Residues of some veterinary drugs in animals and foods. FAO Food and Nutrition Paper, No. 41/13, 2000.
149. Evaluation of certain food additives and contaminants (Fifty-fifth report of the Joint FAO/WHO Expert Committee on Food Additives). WHO Technical Report Series, No. 901, 2001.
150. Safety evaluation of certain food additives and contaminants. WHO Food Additives Series, No. 46, 2001.
151. Compendium of food additive specifications: addendum 8. FAO Food and Nutrition Paper, No. 52, Add. 8, 2000.
152. Evaluation of certain mycotoxins in food (Fifty-sixth report of the Joint FAO/WHO Expert Committee on Food Additives). WHO Technical Report Series, No. 906, 2002.
153. Safety evaluation of certain mycotoxins in food. WHO Food Additives Series, No. 47; FAO Food and Nutrition Paper, No. 74, 2001.
154. Evaluation of certain food additives and contaminants (Fifty-seventh report of the Joint FAO/WHO Expert Committee on Food Additives). WHO Technical Report Series, No. 909, 2002.
155. Safety evaluation of certain food additives and contaminants. WHO Food Additives Series, No. 48, 2002.
156. Compendium of food additive specifications: addendum 9. FAO Food and Nutrition Paper, No. 52, Add. 9, 2001.
157. Evaluation of certain veterinary drug residues in food (Fifty-eighth report of the Joint FAO/WHO Expert Committee on Food Additives). WHO Technical Report Series, No. 911, 2002.
158. Toxicological evaluation of certain veterinary drug residues in food. WHO Food Additives Series, No. 49, 2002.
159. Residues of some veterinary drugs in animals and foods. FAO Food and Nutrition Paper, No. 41/14, 2002.
160. Evaluation of certain food additives and contaminants (Fifty-ninth report of the Joint FAO/WHO Expert Committee on Food Additives). WHO Technical Report Series, No. 913, 2002.
161. Safety evaluation of certain food additives and contaminants. WHO Food Additives Series, No. 50, 2003.
162. Compendium of food additive specifications: addendum 10. FAO Food and Nutrition Paper, No. 52, Add. 10, 2002.
163. Evaluation of certain veterinary drug residues in food (Sixtieth report of the Joint FAO/WHO Expert Committee on Food Additives). WHO Technical Report Series, No. 918, 2003.
164. Toxicological evaluation of certain veterinary drug residues in food. WHO Food Additives Series, No. 51, 2003.
209
Annex 1
165. Residues of some veterinary drugs in animals and foods. FAO Food and Nutrition Paper, No. 41/15, 2003.
166. Evaluation of certain food additives and contaminants (Sixty-first report of the Joint FAO/WHO Expert Committee on Food Additives). WHO Technical Report Series, No. 922, 2004.
167. Safety evaluation of certain food additives and contaminants. WHO Food Additives Series, No. 52, 2004.
168. Compendium of food additive specifications: addendum 11. FAO Food and Nutrition Paper, No. 52, Add. 11, 2003.
169. Evaluation of certain veterinary drug residues in food (Sixty-second report of the Joint FAO/WHO Expert Committee on Food Additives). WHO Technical Report Series, No. 925, 2004.
170. Residues of some veterinary drugs in animals and foods. FAO Food and Nutrition Paper, No. 41/16, 2004.
171. Toxicological evaluation of certain veterinary drug residues in food. WHO Food Additives Series, No. 53, 2005.
172. Compendium of food additive specifications: addendum 12. FAO Food and Nutrition Paper, No. 52, Add. 12, 2004.
173. Evaluation of certain food additives (Sixty-third report of the Joint FAO/WHO Expert Committee on Food Additives). WHO Technical Report Series, No. 928, 2005.
174. Safety evaluation of certain food additives. WHO Food Additives Series, No. 54, 2005.
175. Compendium of food additive specifications: addendum 13. FAO Food and Nutrition Paper, No. 52, Add. 13 (with Errata), 2005.
176. Evaluation of certain food contaminants (Sixty-fourth report of the Joint FAO/WHO Expert Committee on Food Additives). WHO Technical Report Series, No. 930, 2005.
177. Safety evaluation of certain contaminants in food. WHO Food Additives Series, No. 55; FAO Food and Nutrition Paper, No. 82, 2006.
178. Evaluation of certain food additives (Sixty-fifth report of the Joint FAO/WHO Expert Committee on Food Additives). WHO Technical Report Series, No. 934, 2006.
179. Safety evaluation of certain food additives. WHO Food Additives Series, No. 56, 2006.
180. Combined compendium of food additive specifications. FAO JECFA Monographs 1, Volumes 1–4, 2005, 2006.
181. Evaluation of certain veterinary drug residues in food (Sixty-sixth report of the Joint FAO/WHO Expert Committee on Food Additives). WHO Technical Report Series, No. 939, 2006.
182. Residue evaluation of certain veterinary drugs. FAO JECFA Monographs 2, 2006.
183. Toxicological evaluation of certain veterinary drug residues in food. WHO Food Additives Series, No. 57, 2006.
184. Evaluation of certain food additives and contaminants (Sixty-seventh report of the Joint FAO/WHO Expert Committee on Food Additives). WHO Technical Report Series, No. 940, 2007.
185. Compendium of food additive specifications. FAO JECFA Monographs 3, 2006.
186. Safety evaluation of certain food additives and contaminants. WHO Food Additives Series, No. 58, 2007.
187. Evaluation of certain food additives and contaminants (Sixty-eighth report of the Joint FAO/WHO Expert Committee on Food Additives). WHO Technical Report Series, No. 947, 2007.
188. Safety evaluation of certain food additives and contaminants. WHO Food Additives Series, No. 59, 2008.
210
WH
O F
ood
Addi
tives
Ser
ies N
o. 8
0, 2
022
Safety evaluation of certain food additives Eighty-ninth JECFA
189. Compendium of food additive specifications. FAO JECFA Monographs 4, 2007.
190. Evaluation of certain food additives (Sixty-ninth report of the Joint FAO/WHO Expert Committee on Food Additives). WHO Technical Report Series, No. 952, 2009.
191. Safety evaluation of certain food additives. WHO Food Additives Series, No. 60, 2009.
192. Compendium of food additive specifications. FAO JECFA Monographs 5, 2009.
193. Evaluation of certain veterinary drug residues in food (Seventieth report of the Joint FAO/WHO Expert Committee on Food Additives). WHO Technical Report Series, No. 954, 2009.
194. Toxicological evaluation of certain veterinary drug residues in food. WHO Food Additives Series, No. 61, 2009.
195. Residue evaluation of certain veterinary drugs. FAO JECFA Monographs 6, 2009.
196. Evaluation of certain food additives (Seventy-first report of the Joint FAO/WHO Expert Committee on Food Additives). WHO Technical Report Series, No. 956, 2010.
197. Safety evaluation of certain food additives. WHO Food Additives Series, No. 62, 2010.
198. Compendium of food additive specifications. FAO JECFA Monographs 7, 2009.
199. Evaluation of certain contaminants in food (Seventy-second report of the Joint FAO/WHO Expert Committee on Food Additives). WHO Technical Report Series, No. 959, 2011.
200. Safety evaluation of certain contaminants in food. WHO Food Additives Series, No. 63; FAO JECFA Monographs 8, 2011.
201. Residue evaluation of certain veterinary drugs. FAO JECFA Monographs 9, 2010.
202. Evaluation of certain food additives and contaminants (Seventy-third report of the Joint FAO/WHO Expert Committee on Food Additives). WHO Technical Report Series, No. 960, 2011.
203. Safety evaluation of certain food additives and contaminants. WHO Food Additives Series, No. 64, 2011.
204. Compendium of food additive specifications. FAO JECFA Monographs 10, 2010.
205. Evaluation of certain food additives and contaminants (Seventy-fourth report of the Joint FAO/WHO Expert Committee on Food Additives). WHO Technical Report Series, No. 966, 2011.
206. Safety evaluation of certain food additives and contaminants. WHO Food Additives Series, No. 65, 2011.
207. Compendium of food additive specifications. FAO JECFA Monographs 11, 2011.
208. Evaluation of certain veterinary drug residues in food (Seventy-fifth report of the Joint FAO/WHO Expert Committee on Food Additives). WHO Technical Report Series, No. 969, 2012.
209. Toxicological evaluation of certain veterinary drug residues in food. WHO Food Additives Series, No. 66, 2012.
210. Residue evaluation of certain veterinary drugs. FAO JECFA Monographs 12, 2012.
211. Evaluation of certain food additives (Seventy-sixth report of the Joint FAO/WHO Expert Committee on Food Additives). WHO Technical Report Series, No. 974, 2012.
212. Safety evaluation of certain food additives. WHO Food Additives Series, No. 67, 2012.
213. Compendium of food additive specifications. FAO JECFA Monographs 13, 2012.
214. Evaluation of certain food additives and contaminants (Seventy-seventh report of the Joint FAO/WHO Expert Committee on Food Additives). WHO Technical Report Series, No. 983, 2013.
211
Annex 1
215. Safety evaluation of certain food additives and contaminants. WHO Food Additives Series, No. 68, 2013.
216. Compendium of food additive specifications. FAO JECFA Monographs 14, 2013.
217. Evaluation of certain veterinary drug residues in food (Seventy-eighth report of the Joint FAO/WHO Expert Committee on Food Additives). WHO Technical Report Series, No. 988, 2014.
218. Toxicological evaluation of certain veterinary drug residues in food. WHO Food Additives Series, No. 69, 2014.
219. Residue evaluation of certain veterinary drugs. FAO JECFA Monographs 15, 2014.
220. Evaluation of certain food additives (Seventy-ninth report of the Joint FAO/WHO Expert Committee on Food Additives). WHO Technical Report Series, No. 990, 2015.
221. Safety evaluation of certain food additives. WHO Food Additives Series, No. 70, 2015.
222. Compendium of food additive specifications. FAO JECFA Monographs 16, 2014.
223. Evaluation of certain food additives and contaminants (Eightieth report of the Joint FAO/WHO Expert Committee on Food Additives). WHO Technical Report Series, No. 995, 2016.
224. Safety evaluation of certain food additives and contaminants. WHO Food Additives Series, No. 71, 2015.
225. Compendium of food additive specifications. FAO JECFA Monographs 17, 2015.
226. Evaluation of certain veterinary drug residues in food (Eighty-first report of the Joint FAO/WHO Expert Committee on Food Additives). WHO Technical Report Series, No. 997, 2016.
227. Toxicological evaluation of certain veterinary drug residues in food. WHO Food Additives Series, No. 72, 2016.
228. Residue evaluation of certain veterinary drugs. FAO JECFA Monographs 18, 2016.
229. Safety evaluation of certain food additives and contaminants. Supplement 1: Non-dioxin-like polychlorinated biphenyls. WHO Food Additives Series, No. 71-1, 2016.
230. Evaluation of certain food additives (Eighty-second report of the Joint FAO/WHO Expert Committee on Food Additives). WHO Technical Report Series, No. 1000, 2016.
231. Compendium of food additive specifications. FAO JECFA Monographs 19, 2016.
232. Safety evaluation of certain food additives. WHO Food Additives Series, No. 73, 2017.
233. Evaluation of certain contaminants in food (Eighty-third report of the Joint FAO/WHO Expert Committee on Food Additives) WHO Technical Report Series, No.1002, 2017.
234. Evaluation of certain food additives (Eighty-fourth report of the Joint FAO/WHO Expert Committee on Food Additives), WHO Technical Report Series, No. 1007, 2017.
235. Safety evaluation of certain contaminants in food. WHO Food Additives Series, No. 74, FAO JECFA Monographs 19 bis, 2018.
236. Compendium of food additive specifications. FAO JECFA Monographs 20, 2017.
237. Toxicological evaluation of certain food additives. WHO Food Additives Series, No. 75, 2019.
238. Evaluation of certain veterinary drug residues in food (Eighty-fifth report of the Joint FAO/WHO Expert Committee on Food Additives). WHO Technical Report Series, No. 1008, 2018.
239. Residue evaluation of certain veterinary drugs. FAO JECFA Monographs 21, 2018.
212
WH
O F
ood
Addi
tives
Ser
ies N
o. 8
0, 2
022
Safety evaluation of certain food additives Eighty-ninth JECFA
240. Compendium of food additive specifications. FAO JECFA Monographs 22, 2018.
241. Toxicological evaluation of certain veterinary drug residues in food. WHO Food Additives Series, No. 76, 2019.
242. Evaluation of certain food additives (Eighty-sixth report of the Joint FAO/WHO Expert Committee on Food Additives). WHO Technical Report Series, No. 1014, 2019.
243. Evaluation of certain food additives (Eighty-seventh report of the Joint FAO/WHO Expert Committee on Food Additives) WHO Technical Report Series, No. 1020, 2019.
244. Evaluation of veterinary drug residues in food (Eighty-eighth report of the Joint FAO/WHO Expert Committee on Food Additives) WHO Technical Report Series, No. 1023, 2020.
213
ANNEX 2
Abbreviations and acronyms used in the monographs
ADI acceptable daily intakeALT alanine aminotransferaseAMP adenosine 5´-monophosphateAST aspartate transaminaseBIBRA British Industrial Biological Research AssociationBLAST basic local alignment search toolbw body weightCAS Chemical Abstracts ServicesCCFA Codex Committee on Food AdditivesCHO-K1 Chinese hamster ovary cells K1CIFOCOss Chronic Individual Food Consumption database summary statisticsDMSO dimethyl sulfoxideEFSA European Food Safety AuthorityEHC Environmental Health Criteria Endo III endonuclease IIIFAO Food and Agriculture Organization of the United NationsFPG formamidoprimidine glycosylaseGEMS/Food Global Environment Monitoring System, Food Contamination Monitoring and Assessment ProgrammeGIFT Global Individual Food consumption data ToolGLP good laboratory practiceGRAS generally recognized as safeGSFA General Standard for Food Additives INS international numbering systemIOFI International Organization of the Flavor IndustryIPRU inositol phosphate-releasing unitIPTG isopropyl β-D-thiogalactopyranoside JECFA Joint Expert Committee on Food Additives LC/MS/MS liquid chromatography with tandem mass spectrometryLOAEL lowest-observed-adverse-effect levelLOQ limit of quantificationMOE margin of exposureMPL maximum permitted levelMSDI maximized survey-derived intake NOAEL no-observed-adverse-effect level
214
OECD Organization for Economic Co-operation and DevelopmentPI-PLC phosphatidylinositol-specific phospholipase C SD standard deviationSDS-PAGE sodium dodecyl sulfate polyacrylamide gel electrophoresisSEF sucrose ester of fatty acidsSOE sucrose oligoesterSPET single portion exposure technique TMDI theoretical maximum daily intakeTOS total organic solidsTRS Technical Report SeriesU unitUSA United States of AmericaUSFDA US Food and Drug AdministrationWHO World Health Organization
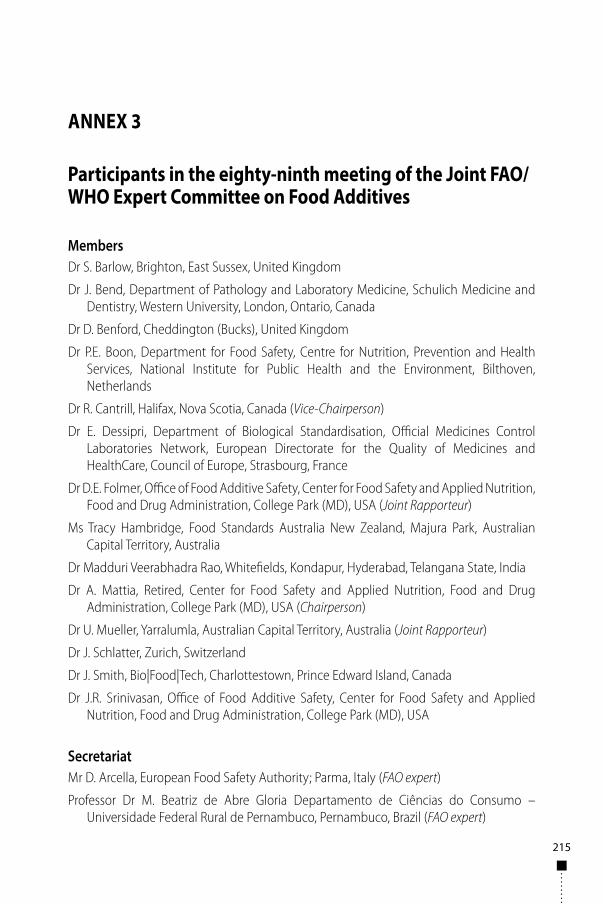
215
ANNEX 3
Participants in the eighty-ninth meeting of the Joint FAO/WHO Expert Committee on Food Additives
Members Dr S. Barlow, Brighton, East Sussex, United Kingdom
Dr J. Bend, Department of Pathology and Laboratory Medicine, Schulich Medicine and Dentistry, Western University, London, Ontario, Canada
Dr D. Benford, Cheddington (Bucks), United Kingdom
Dr P.E. Boon, Department for Food Safety, Centre for Nutrition, Prevention and Health Services, National Institute for Public Health and the Environment, Bilthoven, Netherlands
Dr R. Cantrill, Halifax, Nova Scotia, Canada (Vice-Chairperson)
Dr E. Dessipri, Department of Biological Standardisation, Official Medicines Control Laboratories Network, European Directorate for the Quality of Medicines and HealthCare, Council of Europe, Strasbourg, France
Dr D.E. Folmer, Office of Food Additive Safety, Center for Food Safety and Applied Nutrition, Food and Drug Administration, College Park (MD), USA (Joint Rapporteur)
Ms Tracy Hambridge, Food Standards Australia New Zealand, Majura Park, Australian Capital Territory, Australia
Dr Madduri Veerabhadra Rao, Whitefields, Kondapur, Hyderabad, Telangana State, India
Dr A. Mattia, Retired, Center for Food Safety and Applied Nutrition, Food and Drug Administration, College Park (MD), USA (Chairperson)
Dr U. Mueller, Yarralumla, Australian Capital Territory, Australia (Joint Rapporteur)
Dr J. Schlatter, Zurich, Switzerland
Dr J. Smith, Bio|Food|Tech, Charlottestown, Prince Edward Island, Canada
Dr J.R. Srinivasan, Office of Food Additive Safety, Center for Food Safety and Applied Nutrition, Food and Drug Administration, College Park (MD), USA
Secretariat Mr D. Arcella, European Food Safety Authority; Parma, Italy (FAO expert)
Professor Dr M. Beatriz de Abre Gloria Departamento de Ciências do Consumo – Universidade Federal Rural de Pernambuco, Pernambuco, Brazil (FAO expert)
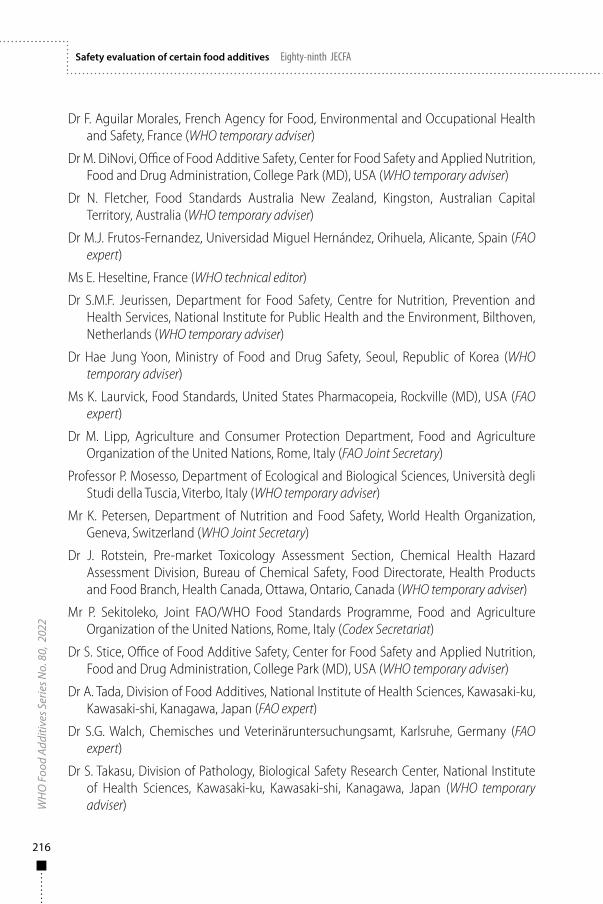
216
WH
O F
ood
Addi
tives
Ser
ies N
o. 8
0, 2
022
Safety evaluation of certain food additives Eighty-ninth JECFA
Dr F. Aguilar Morales, French Agency for Food, Environmental and Occupational Health and Safety, France (WHO temporary adviser)
Dr M. DiNovi, Office of Food Additive Safety, Center for Food Safety and Applied Nutrition, Food and Drug Administration, College Park (MD), USA (WHO temporary adviser)
Dr N. Fletcher, Food Standards Australia New Zealand, Kingston, Australian Capital Territory, Australia (WHO temporary adviser)
Dr M.J. Frutos-Fernandez, Universidad Miguel Hernández, Orihuela, Alicante, Spain (FAO expert)
Ms E. Heseltine, France (WHO technical editor)
Dr S.M.F. Jeurissen, Department for Food Safety, Centre for Nutrition, Prevention and Health Services, National Institute for Public Health and the Environment, Bilthoven, Netherlands (WHO temporary adviser)
Dr Hae Jung Yoon, Ministry of Food and Drug Safety, Seoul, Republic of Korea (WHO temporary adviser)
Ms K. Laurvick, Food Standards, United States Pharmacopeia, Rockville (MD), USA (FAO expert)
Dr M. Lipp, Agriculture and Consumer Protection Department, Food and Agriculture Organization of the United Nations, Rome, Italy (FAO Joint Secretary)
Professor P. Mosesso, Department of Ecological and Biological Sciences, Università degli Studi della Tuscia, Viterbo, Italy (WHO temporary adviser)
Mr K. Petersen, Department of Nutrition and Food Safety, World Health Organization, Geneva, Switzerland (WHO Joint Secretary)
Dr J. Rotstein, Pre-market Toxicology Assessment Section, Chemical Health Hazard Assessment Division, Bureau of Chemical Safety, Food Directorate, Health Products and Food Branch, Health Canada, Ottawa, Ontario, Canada (WHO temporary adviser)
Mr P. Sekitoleko, Joint FAO/WHO Food Standards Programme, Food and Agriculture Organization of the United Nations, Rome, Italy (Codex Secretariat)
Dr S. Stice, Office of Food Additive Safety, Center for Food Safety and Applied Nutrition, Food and Drug Administration, College Park (MD), USA (WHO temporary adviser)
Dr A. Tada, Division of Food Additives, National Institute of Health Sciences, Kawasaki-ku, Kawasaki-shi, Kanagawa, Japan (FAO expert)
Dr S.G. Walch, Chemisches und Veterinäruntersuchungsamt, Karlsruhe, Germany (FAO expert)
Dr S. Takasu, Division of Pathology, Biological Safety Research Center, National Institute of Health Sciences, Kawasaki-ku, Kawasaki-shi, Kanagawa, Japan (WHO temporary adviser)
217
Annex 3
Dr Y. (Janet) Zang, Office of Food Additive Safety, Center for Food Safety and Applied Nutrition, Food and Drug Administration, College Park (MD), USA (WHO temporary adviser)
Ms L. Zhang, Joint FAO/WHO Food Standards Programme, Food and Agriculture Organization of the United Nations, Rome, Italy (Codex Secretariat)

218
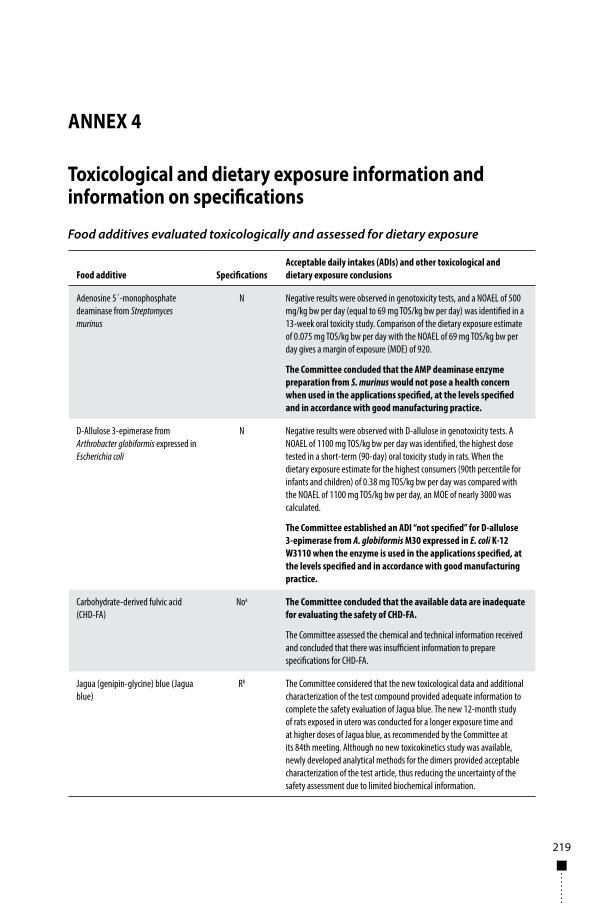
219
ANNEX 4
Toxicological and dietary exposure information and information on specifications
Food additives evaluated toxicologically and assessed for dietary exposure
Food additive SpecificationsAcceptable daily intakes (ADIs) and other toxicological and dietary exposure conclusions
Adenosine 5´-monophosphate deaminase from Streptomyces murinus
N Negative results were observed in genotoxicity tests, and a NOAEL of 500 mg/kg bw per day (equal to 69 mg TOS/kg bw per day) was identified in a 13-week oral toxicity study. Comparison of the dietary exposure estimate of 0.075 mg TOS/kg bw per day with the NOAEL of 69 mg TOS/kg bw per day gives a margin of exposure (MOE) of 920.
The Committee concluded that the AMP deaminase enzyme preparation from S. murinus would not pose a health concern when used in the applications specified, at the levels specified and in accordance with good manufacturing practice.
D-Allulose 3-epimerase from Arthrobacter globiformis expressed in Escherichia coli
N Negative results were observed with D-allulose in genotoxicity tests. A NOAEL of 1100 mg TOS/kg bw per day was identified, the highest dose tested in a short-term (90-day) oral toxicity study in rats. When the dietary exposure estimate for the highest consumers (90th percentile for infants and children) of 0.38 mg TOS/kg bw per day was compared with the NOAEL of 1100 mg TOS/kg bw per day, an MOE of nearly 3000 was calculated.
The Committee established an ADI “not specified” for D-allulose 3-epimerase from A. globiformis M30 expressed in E. coli K-12 W3110 when the enzyme is used in the applications specified, at the levels specified and in accordance with good manufacturing practice.
Carbohydrate-derived fulvic acid (CHD-FA)
Noa The Committee concluded that the available data are inadequate for evaluating the safety of CHD-FA.
The Committee assessed the chemical and technical information received and concluded that there was insufficient information to prepare specifications for CHD-FA.
Jagua (genipin-glycine) blue (Jagua blue)
Rb The Committee considered that the new toxicological data and additional characterization of the test compound provided adequate information to complete the safety evaluation of Jagua blue. The new 12-month study of rats exposed in utero was conducted for a longer exposure time and at higher doses of Jagua blue, as recommended by the Committee at its 84th meeting. Although no new toxicokinetics study was available, newly developed analytical methods for the dimers provided acceptable characterization of the test article, thus reducing the uncertainty of the safety assessment due to limited biochemical information.
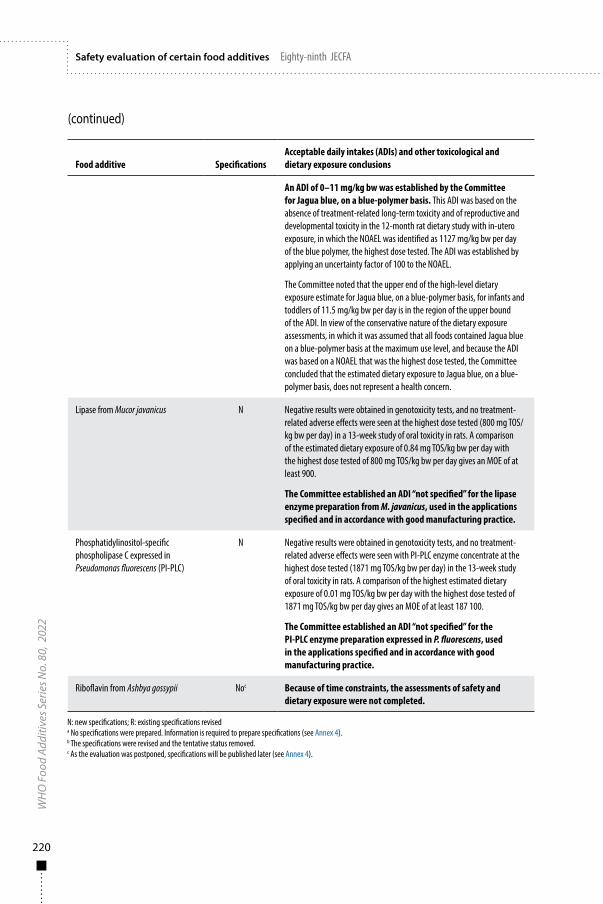
220
WH
O F
ood
Addi
tives
Ser
ies N
o. 8
0, 2
022
Safety evaluation of certain food additives Eighty-ninth JECFA
Food additive SpecificationsAcceptable daily intakes (ADIs) and other toxicological and dietary exposure conclusions
An ADI of 0–11 mg/kg bw was established by the Committee for Jagua blue, on a blue-polymer basis. This ADI was based on the absence of treatment-related long-term toxicity and of reproductive and developmental toxicity in the 12-month rat dietary study with in-utero exposure, in which the NOAEL was identified as 1127 mg/kg bw per day of the blue polymer, the highest dose tested. The ADI was established by applying an uncertainty factor of 100 to the NOAEL.
The Committee noted that the upper end of the high-level dietary exposure estimate for Jagua blue, on a blue-polymer basis, for infants and toddlers of 11.5 mg/kg bw per day is in the region of the upper bound of the ADI. In view of the conservative nature of the dietary exposure assessments, in which it was assumed that all foods contained Jagua blue on a blue-polymer basis at the maximum use level, and because the ADI was based on a NOAEL that was the highest dose tested, the Committee concluded that the estimated dietary exposure to Jagua blue, on a blue-polymer basis, does not represent a health concern.
Lipase from Mucor javanicus N Negative results were obtained in genotoxicity tests, and no treatment-related adverse effects were seen at the highest dose tested (800 mg TOS/kg bw per day) in a 13-week study of oral toxicity in rats. A comparison of the estimated dietary exposure of 0.84 mg TOS/kg bw per day with the highest dose tested of 800 mg TOS/kg bw per day gives an MOE of at least 900.
The Committee established an ADI “not specified” for the lipase enzyme preparation from M. javanicus, used in the applications specified and in accordance with good manufacturing practice.
Phosphatidylinositol-specific phospholipase C expressed in Pseudomonas fluorescens (PI-PLC)
N Negative results were obtained in genotoxicity tests, and no treatment-related adverse effects were seen with PI-PLC enzyme concentrate at the highest dose tested (1871 mg TOS/kg bw per day) in the 13-week study of oral toxicity in rats. A comparison of the highest estimated dietary exposure of 0.01 mg TOS/kg bw per day with the highest dose tested of 1871 mg TOS/kg bw per day gives an MOE of at least 187 100.
The Committee established an ADI “not specified” for the PI-PLC enzyme preparation expressed in P. fluorescens, used in the applications specified and in accordance with good manufacturing practice.
Riboflavin from Ashbya gossypii Noc Because of time constraints, the assessments of safety and dietary exposure were not completed.
(continued)
N: new specifications; R: existing specifications revised a No specifications were prepared. Information is required to prepare specifications (see Annex 4).b The specifications were revised and the tentative status removed.c As the evaluation was postponed, specifications will be published later (see Annex 4).
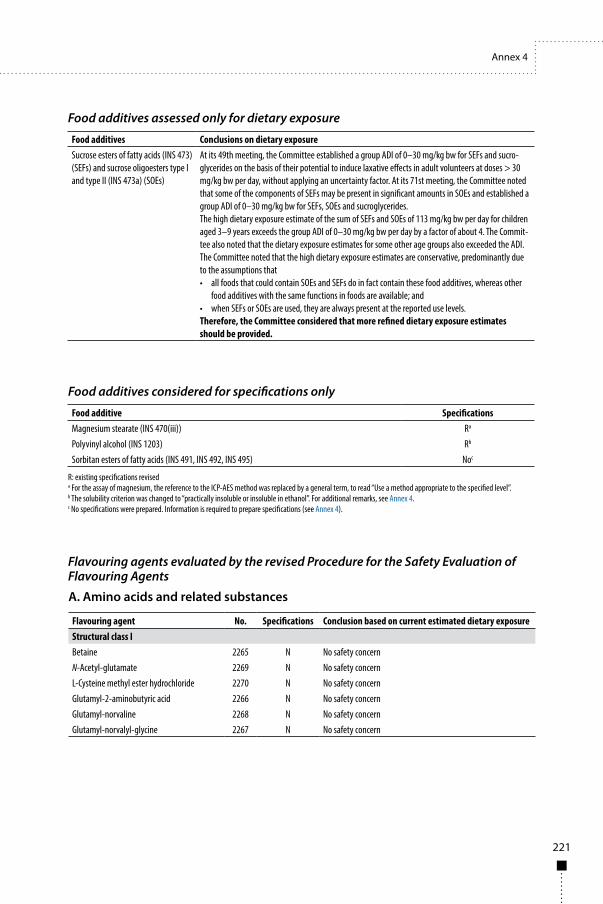
221
Annex 4
Food additives Conclusions on dietary exposureSucrose esters of fatty acids (INS 473) (SEFs) and sucrose oligoesters type I and type II (INS 473a) (SOEs)
At its 49th meeting, the Committee established a group ADI of 0–30 mg/kg bw for SEFs and sucro-glycerides on the basis of their potential to induce laxative effects in adult volunteers at doses > 30 mg/kg bw per day, without applying an uncertainty factor. At its 71st meeting, the Committee noted that some of the components of SEFs may be present in significant amounts in SOEs and established a group ADI of 0–30 mg/kg bw for SEFs, SOEs and sucroglycerides.The high dietary exposure estimate of the sum of SEFs and SOEs of 113 mg/kg bw per day for children aged 3–9 years exceeds the group ADI of 0–30 mg/kg bw per day by a factor of about 4. The Commit-tee also noted that the dietary exposure estimates for some other age groups also exceeded the ADI. The Committee noted that the high dietary exposure estimates are conservative, predominantly due to the assumptions that • all foods that could contain SOEs and SEFs do in fact contain these food additives, whereas other
food additives with the same functions in foods are available; and• when SEFs or SOEs are used, they are always present at the reported use levels.Therefore, the Committee considered that more refined dietary exposure estimates should be provided.
Food additives assessed only for dietary exposure
Food additive SpecificationsMagnesium stearate (INS 470(iii)) Ra
Polyvinyl alcohol (INS 1203) Rb
Sorbitan esters of fatty acids (INS 491, INS 492, INS 495) Noc
Food additives considered for specifications only
Flavouring agents evaluated by the revised Procedure for the Safety Evaluation of Flavouring Agents
R: existing specifications revised a For the assay of magnesium, the reference to the ICP-AES method was replaced by a general term, to read “Use a method appropriate to the specified level”.b The solubility criterion was changed to “practically insoluble or insoluble in ethanol”. For additional remarks, see Annex 4.c No specifications were prepared. Information is required to prepare specifications (see Annex 4).
Flavouring agent No. Specifications Conclusion based on current estimated dietary exposureStructural class IBetaine 2265 N No safety concernN-Acetyl-glutamate 2269 N No safety concernL-Cysteine methyl ester hydrochloride 2270 N No safety concernGlutamyl-2-aminobutyric acid 2266 N No safety concernGlutamyl-norvaline 2268 N No safety concernGlutamyl-norvalyl-glycine 2267 N No safety concern
A. Amino acids and related substances
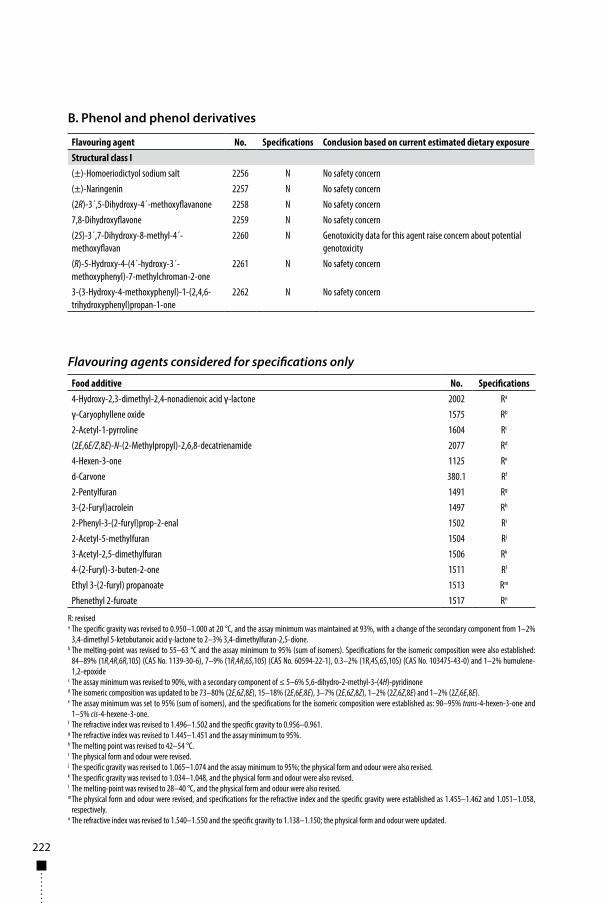
222
Flavouring agent No. Specifications Conclusion based on current estimated dietary exposureStructural class I(±)-Homoeriodictyol sodium salt 2256 N No safety concern(±)-Naringenin 2257 N No safety concern(2R)-3´,5-Dihydroxy-4´-methoxyflavanone 2258 N No safety concern7,8-Dihydroxyflavone 2259 N No safety concern(2S)-3´,7-Dihydroxy-8-methyl-4´-methoxyflavan
2260 N Genotoxicity data for this agent raise concern about potential genotoxicity
(R)-5-Hydroxy-4-(4´-hydroxy-3´-methoxyphenyl)-7-methylchroman-2-one
2261 N No safety concern
3-(3-Hydroxy-4-methoxyphenyl)-1-(2,4,6-trihydroxyphenyl)propan-1-one
2262 N No safety concern
Flavouring agents considered for specifications only
Food additive No. Specifications4-Hydroxy-2,3-dimethyl-2,4-nonadienoic acid γ-lactone 2002 Ra
γ-Caryophyllene oxide 1575 Rb
2-Acetyl-1-pyrroline 1604 Rc
(2E,6E/Z,8E)-N-(2-Methylpropyl)-2,6,8-decatrienamide 2077 Rd
4-Hexen-3-one 1125 Re
d-Carvone 380.1 Rf
2-Pentylfuran 1491 Rg
3-(2-Furyl)acrolein 1497 Rh
2-Phenyl-3-(2-furyl)prop-2-enal 1502 Ri
2-Acetyl-5-methylfuran 1504 Rj
3-Acetyl-2,5-dimethylfuran 1506 Rk
4-(2-Furyl)-3-buten-2-one 1511 Rl
Ethyl 3-(2-furyl) propanoate 1513 Rm
Phenethyl 2-furoate 1517 Rn
B. Phenol and phenol derivatives
R: reviseda The specific gravity was revised to 0.950–1.000 at 20 °C, and the assay minimum was maintained at 93%, with a change of the secondary component from 1–2%
3,4-dimethyl 5-ketobutanoic acid γ-lactone to 2–3% 3,4-dimethylfuran-2,5-dione.b The melting-point was revised to 55–63 °C and the assay minimum to 95% (sum of isomers). Specifications for the isomeric composition were also established:
84–89% (1R,4R,6R,10S) (CAS No. 1139-30-6), 7–9% (1R,4R,6S,10S) (CAS No. 60594-22-1), 0.3–2% (1R,4S,6S,10S) (CAS No. 103475-43-0) and 1–2% humulene-1,2-epoxide
c The assay minimum was revised to 90%, with a secondary component of ≤ 5–6% 5,6-dihydro-2-methyl-3-(4H)-pyridinoned The isomeric composition was updated to be 73–80% (2E,6Z,8E), 15–18% (2E,6E,8E), 3–7% (2E,6Z,8Z), 1–2% (2Z,6Z,8E) and 1–2% (2Z,6E,8E). e The assay minimum was set to 95% (sum of isomers), and the specifications for the isomeric composition were established as: 90–95% trans-4-hexen-3-one and
1–5% cis-4-hexene-3-one. f The refractive index was revised to 1.496–1.502 and the specific gravity to 0.956–0.961.g The refractive index was revised to 1.445–1.451 and the assay minimum to 95%. h The melting point was revised to 42–54 °C.I The physical form and odour were revised.j The specific gravity was revised to 1.065–1.074 and the assay minimum to 95%; the physical form and odour were also revised.k The specific gravity was revised to 1.034–1.048, and the physical form and odour were also revised. l The melting-point was revised to 28–40 °C, and the physical form and odour were also revised.m The physical form and odour were revised, and specifications for the refractive index and the specific gravity were established as 1.455–1.462 and 1.051–1.058,
respectively. n The refractive index was revised to 1.540–1.550 and the specific gravity to 1.138–1.150; the physical form and odour were updated.
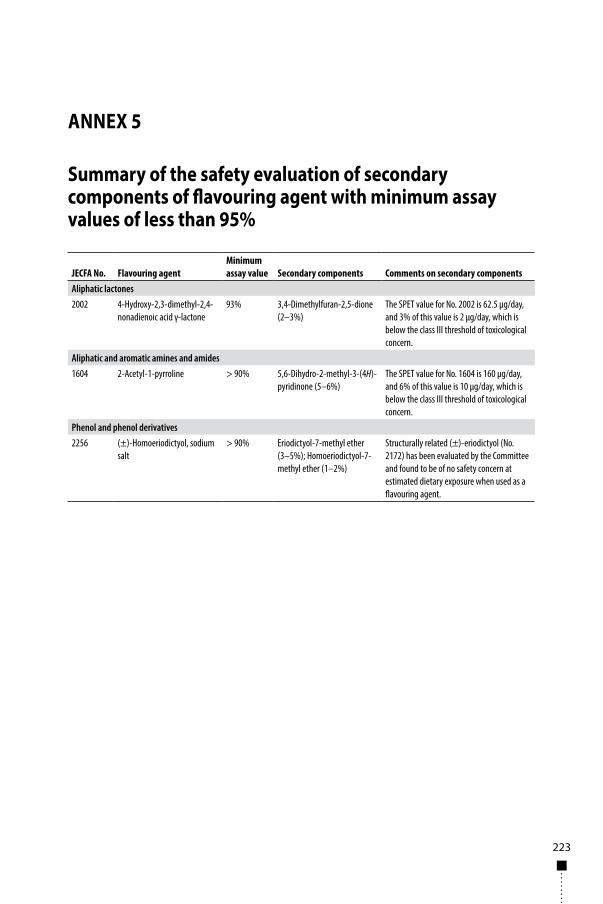
223
ANNEX 5
Summary of the safety evaluation of secondary components of flavouring agent with minimum assay values of less than 95%
JECFA No. Flavouring agentMinimum assay value Secondary components Comments on secondary components
Aliphatic lactones2002 4-Hydroxy-2,3-dimethyl-2,4-
nonadienoic acid γ-lactone93% 3,4-Dimethylfuran-2,5-dione
(2–3%)The SPET value for No. 2002 is 62.5 µg/day, and 3% of this value is 2 µg/day, which is below the class III threshold of toxicological concern.
Aliphatic and aromatic amines and amides1604 2-Acetyl-1-pyrroline > 90% 5,6-Dihydro-2-methyl-3-(4H)-
pyridinone (5–6%)The SPET value for No. 1604 is 160 µg/day, and 6% of this value is 10 µg/day, which is below the class III threshold of toxicological concern.
Phenol and phenol derivatives2256 (±)-Homoeriodictyol, sodium
salt> 90% Eriodictyol-7-methyl ether
(3–5%); Homoeriodictyol-7-methyl ether (1–2%)
Structurally related (±)-eriodictyol (No. 2172) has been evaluated by the Committee and found to be of no safety concern at estimated dietary exposure when used as a flavouring agent.

224
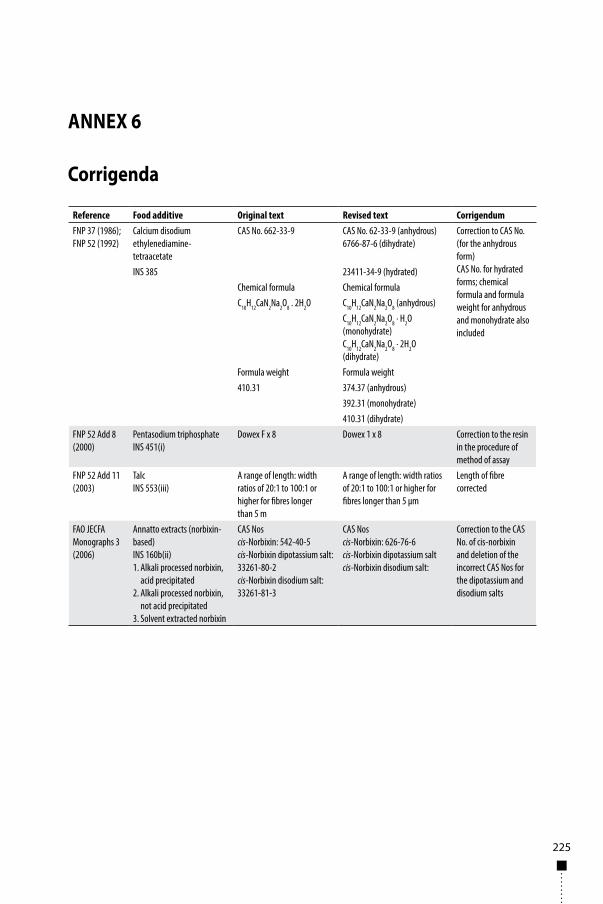
225
ANNEX 6
Corrigenda
Reference Food additive Original text Revised text CorrigendumFNP 37 (1986); FNP 52 (1992)
Calcium disodium ethylenediamine-tetraacetate
CAS No. 662-33-9 CAS No. 62-33-9 (anhydrous)6766-87-6 (dihydrate)
Correction to CAS No. (for the anhydrous form)CAS No. for hydrated forms; chemical formula and formula weight for anhydrous and monohydrate also included
INS 385 23411-34-9 (hydrated)Chemical formula Chemical formulaC10H12CaN2Na2O8 . 2H2O C10H12CaN2Na2O8 (anhydrous)
C10H12CaN2Na2O8 · H2O (monohydrate) C10H12CaN2Na2O8 · 2H2O (dihydrate)
Formula weight Formula weight410.31 374.37 (anhydrous)
392.31 (monohydrate)410.31 (dihydrate)
FNP 52 Add 8 (2000)
Pentasodium triphosphate INS 451(i)
Dowex F x 8 Dowex 1 x 8 Correction to the resin in the procedure of method of assay
FNP 52 Add 11 (2003)
TalcINS 553(iii)
A range of length: width ratios of 20:1 to 100:1 or higher for fibres longer than 5 m
A range of length: width ratios of 20:1 to 100:1 or higher for fibres longer than 5 µm
Length of fibre corrected
FAO JECFA Monographs 3 (2006)
Annatto extracts (norbixin-based)INS 160b(ii)1. Alkali processed norbixin,
acid precipitated2. Alkali processed norbixin,
not acid precipitated3. Solvent extracted norbixin
CAS Noscis-Norbixin: 542-40-5cis-Norbixin dipotassium salt: 33261-80-2 cis-Norbixin disodium salt: 33261-81-3
CAS Noscis-Norbixin: 626-76-6cis-Norbixin dipotassium saltcis-Norbixin disodium salt:
Correction to the CAS No. of cis-norbixin and deletion of the incorrect CAS Nos for the dipotassium and disodium salts
This volume contains monographs prepared at the eighty-
ninth meeting of the Joint FAO/WHO Expert Committee
on Food Additives (JECFA), which met virtually on 2–11
June 2020.
The toxicological and dietary exposure monographs in
this volume summarize the safety and dietary exposure
data on eight specific food additives (adenosine
5´-monophosphate deaminase from Streptomyces
murinus, D-allulose 3-epimerase from Arthrobacter
globiformis expressed in Escherichia coli, jagua (genipin-
glycine) blue (addendum), lipase from Mucor javanicus
and phosphatidylinisotol-specific phospholipase C
expressed in Pseudomonas fluorescens). Two addenda
summarize the safety and dietary exposure data on two
groups of related flavouring agents (amino acids and
related substances and phenol and phenol derivatives).
An exposure assessment is presented for sucrose esters
of fatty acids (INS 473) and sucrose oligoesters type I
and type II (INS 473a).
This volume and others in the WHO Food Additives
series contain information that is useful to those who
produce and use food additives and veterinary drugs and
those involved in the control of contaminants in food,
government and food regulatory officers, industrial
testing laboratories, toxicological laboratories and
universities.