Embed Size (px)
Citation preview

Variations in GDGT flux and TEX thermometry
in three distinct oceanic regimes of the Atlantic Ocean:
a sediment trap study
Dissertation
Zur Erlangung des Doktorgrades der Naturwissenschafen
am Fachbereich Geowissenschaften
der Universität Bremen
- Dr.rer.nat. -
Vorgelegt von:
Eun Mi Park
Bremen
März 2019


Gutachter der Dissertation:
Prof.Dr. Gesine Mollenhauer
Department of Geosciences
University of Bremen &
Alfred Wegener Institute
Am Handelshafen 12
27570 Bremerhaven
Germany
Prof.Dr. Ann Pearson
Department of Earth and Planetary Sciences
Harvard University
Cambridge, MA 02138
USA


To my parents


This Ph.D. project was conducted at the Marine Geochemistry group at the Alfred Wegener Institute
Helmholtz Center for Polar and Marine Research, Bremerhaven, Germany and at the Department of
Geosciences, University of Bremen under the supervision of Prof.Dr. Gesine Mollenhauer. This
project was funded through the German Science Foundation (DFG) Research Center/Cluster of
Excellence “The Ocean in the Earth System” MARUM – Center for Marine Environmental Sciences.
The Bremen International Graduate School for Marine Sciences (GLOMAR) provided financial
support for participation in summer schools and international conferences.


Table of Contents
ABSTRACT ...................................................................................................................................... 1
KURZFASSUNG ............................................................................................................................. 4
1 Introduction ...............................................................................................................................
1.1 Climate change and ocean warming ................................................................................... 8
1.2 Temperature proxy............................................................................................................... 9
1.3 General biology of Thaumarchaeota ................................................................................ 11
1.4 GDGTs .............................................................................................................................. 13
1.5 Constraints of TEX8 thermometry ................................................................................... 17
1. Trap study .......................................................................................................................... 20
1.7 Objectives of this thesis ..................................................................................................... 25
1.8 Materials and analytical techniques ................................................................................. 2
1.9 Description of own contributions ...................................................................................... 27
1.10 Outline of the thesis........................................................................................................... 27
2 Manuscript I: TEX in sinking particles in three eastern Atlantic upwelling regimes ... 30
3 Manuscript II: Seasonality of archaeal lipid flux and GDGT-based thermometry in
sinking particles of high latitude oceans: Fram Strait (79° N) and Antarctic Polar Front
(50° S) ...................................................................................................................................... 5
4 Manuscript III: GDGTs in sinking particles of the oligotrophic ocean: TEX
thermometry in the central Brazil Basin ...............................................................................
5 Manuscript IV: Alkenone flux and the U thermometry: comparisons with the TEX
thermometry .......................................................................................................................... 114
Summary and Perspectives .................................................................................................. 130
.1 Export mechanism of lipid signal .................................................................................... 130
.2 Potential non-thermal factors influencing on TEX8 thermometry ................................. 131
.3 Regional calibrations for high latitude oceans ............................................................... 133
.4 Difference between U and TEX8 temperature estimate .............................................. 134
Appendix 1 .................................................................................................................................... 135
References ..................................................................................................................................... 13
Acknowledgements ...................................................................................................................... 152


1
ABSTRACT
The global climate change and global warming have been observed since the pre-industrial times.
This phenomenon calls for immediate actions to fight climate change. The climate change of the
Earth´s history is preserved in ocean sediments, covering ~70% of the Earth, and the understanding of
this history is the significant way to predict the future climate. The temperature changes in the past
ocean can be estimated using several proxies. One of the most extensively applied temperature proxy
to the paleoclimate is the TEX8 (tetraether index of tetraethers consisting of 8 carbons). It is based
on the relative compositions of thaumarchaeotal membrane lipids, glycerol dialkyl glycerol tetraethers
(GDGTs), in marine surface sediments, allowing us to estimate sea surface temperature (SST). The
ubiquity of Thaumarchaeota, one phylum of the Archaea domain, and their dominant abundance in the
ocean make this proxy a promising tool for SST reconstructions worldwide. However, it has been
recognized that the composition of GDGTs can be altered by non-thermal factors, leading to variable
relationships between TEX8 and SST. This thesis shall contribute to a better understanding of TEX8
thermometry and the controlling environmental factors in various oceanic provinces by evaluating the
GDGT flux and TEX8 related temperature estimate in sinking particles. The sinking particles
collected using time-series sediment trap systems can be of great value to understand the export
mechanism of lipids and to estimate the seasonal variability of the proxy signal. Three different ocean
regimes ranging from upwelling (the Guinea Basin and Lüderitz off Namibia), high latitudes (the
eastern Fram Strait and the Antarctic Polar Front), to the oligotrophic oceans (the central Brazil Basin)
in the Atlantic Ocean are investigated.
In the first part of the thesis, TEX8 values are converted to temperatures using the TEX8 H
calibration. The results in the eastern equatorial Guinea Basin (GBN3) show that GDGTs are mainly
transported by particles containing opal. The TEX8 H
-derived temperatures at both different depth traps
correspond to the subsurface water depth (~50 m), where the nutricline exists, implying the favorable
habit at depth of thaumarchaeotal communities and thus the record of the water temperature. In the
coastal upwelling area off Lüderitz (LZ), the export mechanism of GDGT is yet unclear due to the
short duration of the sampling period. The results show that the TEX8 H -derived temperatures resemble
the satellite-derived SSTs with a delay of 2 days during the warmer season while warm-biased
estimates occur during the colder season. As relatively higher TEX8 values were found in oxygen-
depleted waters, oxygen-stress could explain the warm-bias of TEX8 H temperature in the Lüderitz,
where the oxygen minimum zone is pronounced. Those results are in agreement with the finding from
off Cape Blanc, Northwest Africa.
The second part of the thesis focuses on the high latitude cold regions. The TEX8 values are
converted to temperatures using the TEX8 L calibration. In the eastern Fram Strait (79° N; FEVI1 ),

2
GDGT fluxes are correlated with biological and non-biological component fluxes. The best
correlations are found between GDGT and opal/ carbonate fluxes, implying that opal and carbonate
are the major ballasting materials for GDGTs to be exported to the deep ocean. The TEX8 L -derived
temperatures display a strong variability due to temporal variability of transporting materials and their
different sinking velocities for particles carrying the lipids. The TEX8 L signal corresponds to water
temperature at 30-80 m depth, where nitrification might occur, and an almost identical TEX8 L value is
found in the underlying surface sediment. In the Antarctic Polar Front (50° S; PF3), the TEX8 L -
derived temperatures at the shallow trap display cold and warm biases relative to the SSTs and the
latter have a tendency to occur during periods of relatively low GDGT flux, which may be more
dominant in the deep trap. The warm biased TEX8 L signal (~7 °C) compared to the SST at the deep
trap and in the underlying surface sediment might be due to a contribution of GDGTs derived from
Euryarchaeota or a non-liner relationship of TEX8 L with SST in the Southern Ocean. In both polar
regions, a hydroxylated-GDGT related temperature proxy seems applicable.
The third part of the thesis contributes to understanding of GDGT-derived signals in the
oligotrophic regions, where usually attract less attention compared to two previous regimes despite
their size and the impact on global biogeochemical budgets. The TEX8 values at two depths from two
sites are examined (WAB1 and WA9). Good correlations between fluxes of GDGTs and
opal/carbonate at both shallow traps reveal a preferential incorporation of GDGTs in opal- and
carbonate-rich aggregates. At WAB1, which was located at the fringes of the gyre system, the TEX8 H -
derived temperatures of the shallow trap resemble the SSTs. The WA9 trap was collected in the more
nutrient-depleted location of the central oligotrophic gyre relative to the site WAB. The warm biased
TEX8 H -derived temperature of the shallow trap relative to the SST can be caused by the response of
Thaumarchaeota under energy stressed conditions. In the deep traps of both sites, the TEX8 H -derived
temperatures record the deep subsurface temperature. It is assumed that these signals are caused by a
higher relative contribution of colder signal from deep in situ production and a smaller contribution of
warmer signal from shallow waters.
The last part of the thesis investigates the alkenone-based temperatures (U or U
) in all three
oceanic regimes, where GDGT based temperatures are discussed in previous chapters. Most of U -
derived temperatures display the SSTs of the tropical regions (i.e. the equatorial Guinea Basin,
Lüderitz, the central Brazil Basin). It implies that the regional geochemical characteristics (e.g.,
availability of nitrogen or oxygen), which probably affect the TEX8 thermometry, do not have a
profound impact on the U thermometry. In the shallow trap of the Antarctic Polar Front, the U
-
derived temperatures record a clear SST seasonality with a delay time of 10 weeks. However, the
mixture of cold- and warm-biased temperature estimates based on the U in the deep trap is

3
underconstrained. Samples from the eastern Fram Strait yield U - and U
-derived temperature
estimates fall outside the expected temperature range with warm biases. It is in line with other studies
show that the applicability of alkenone proxies is limited in low temperature regions that disfavor
alkenone producers. This chapter shows that the U proxy provides an additional temperature
record complementary to the TEX8 proxy because of different responses of each source organism to
environmental conditions in the tropical oceans.

4
KURZFASSUNG
Seit dem Beginn der Industrialisierung lassen sich Klimaveränderung und globale Erwärmung
beobachten. Dieses Phänomen erfordert Strategien zur Minderung der Erderwärmung. Die Ozeane,
die 70% der Erdoberfläche ausmachen, zeichnen in ihren Sedimenten klimatische Veränderungen der
Erdvergangenheit auf. Diese Veränderungen zu verstehen, ist eine essenzielle Methode, zukünftige
Temperaturanstiege vorherzusagen. Ozeanische Temperaturveränderungen aus der Vergangenheit
können anhand verschiedener Proxies rekonstruiert werden. Einer der am häufigsten verwendeten
Proxies in der Paläoklimatologie ist der sogenannte TEX8 (engl.: tetraether index of tetraethers
consisting of 8 carbon atoms). Dieser basiert auf der relativen Häufigkeit sogenannter Glycerol
Dialkyl Glycerol Tetraether (GDGTs), Membranlipide der Thaumarchaeota (Phylum innerhalb der
Archaeendomäne). Anhand der GDGT Verteilung in marinen Sedimenten lässt sich die
Wasseroberflächentemperatur (SST – engl.: sea surface temperature) abschätzen. Die
Allgegenwärtigkeit und das dominante Auftreten der Thaumarchaeota in den Ozeanen machen die
Lipide zu einem vielversprechenden Proxy. Jedoch ist er noch relativ jung. Es hat sich gezeigt, dass
neben Temperaturveränderungen weitere Umweltbedingungen die Verteilung der GDGT beeinflussen
und zu einem unkonventionellen Zusammenhang zwischen Temperatur und TEX8 führen können.
Diese Arbeit soll zu einem besseren Verständnis des TEX8 -Temperaturproxies und dessen
Abhängigkeit von diversen Umweltparametern in verschiedenen ozeanischen Regimen beitragen.
Dazu werden GDGT-Verteilungen sowie TEX8 -basierte Temperaturen an sinkenden Partikeln
bewertet und Partikelflüsse verschiedener Materialien durch die Wassersäule bestimmt. Zeitreihen, die
mittels solcher Sedimentfallen an sinkenden Partikeln gewonnen werden, sind für das Verständnis von
Exportmechanismen von Lipiden sowie für die Abschätzung saisonaler Variabilität im Proxysignal
von großem Wert. In dieser Arbeit werden die drei folgenden Ozeanregime im Atlantik untersucht:
Upwelling-Zonen (Guineabecken, und Küstenregion vor Lüderitz, Namibia), hohe Breiten (östliche
Framstraße und antarktische Polarfront) und die oligotrophen Gyren (Zentral Brasilianisches Becken).
Im ersten Teil der Arbeit werden mittels der TEX8 H -Kalibration Temperaturen für die
Auftriebsgebiete berechnet. Die Ergebnisse zeigen, dass die GDGTs im östlichen äquatorialen
Guineabecken (GBN3) hauptsächlich durch opaltragende Partikel transportiert werden. Die TEX8 H -
basierten Temperaturen entsprechen in beiden beprobten Wassertiefen den Temperaturen unterhalb der
Wasseroberfläche (engl.: subsurface) in ~50 m Wassertiefe, und damit gleichzeitig der Position der
Nutrikline. Dieses Ergebnis impliziert, dass sich die bevorzugte Habitattiefe der Thaumarchaeota in
diesem Tiefenbereich befindet. Im küstennahen Auftriebsgebiet vor Namibia (Lüderitz, LZ) bleiben
die Exportmechanismen der GDGTs auf Grund eines verkürzten Beprobungszeitraums unklar. Die
TEX8 H -basierten Temperaturen entsprechen den mit Satelliten aufgezeichneten SSTs, wobei das

5
TEX8 H -Signal in der wärmeren Saison gegenüber den Satellitendaten um 2 Tage verzögert auftritt.
Während der kalten Jahreszeiten überschätzt TEX8 H die SST. Da relativ hohe TEX8 -Werte häufig in
sauerstoffarmen Wassermassen auftreten, könnte die stark ausgeprägte Sauerstoffminimumzone vor
Lüderitz die Temperaturüberschätzung erklären. Dieses Ergebnis stimmt mit vorherigen Arbeiten vor
Cap Blanc, Nordwestafrika, überein.
Der Fokus des zweiten Teils dieser Arbeit liegt auf den kalten Ozeanen in den hohen Breiten. In
diesem Fall wird die TEX8 L -Kalibration zur Temperaturberechnung angewendet. In der östlichen
Framstraße (79° N; FEVI1 ) korrelieren die GDGT-Flüsse sowohl mit Flüssen biologischer als auch
nicht-biologischer Partikel. Die beste Korrelation ergibt sich zwischen GDGTs und Opal/Karbonat,
was nahelegt, dass die Sedimentation der GDGTs hauptsächlich von Opal- und Karbonatpartikeln
vollzogen wird. Die TEX8 L -basierten Temperaturen zeigen eine starke Variabilität, die vermutlich auf
variierender Zusammensetzung des sinkenden Materials und der unterschiedlichen
Sinkgeschwindigkeiten der GDGT-tragenden Partikel beruht. Das TEX8 L Signal reflektiert die
Wassertemperatur in 30-80 m Tiefe, dem Tiefenbereich, in dem eventuell Nitrifizierung stattfindet. In
der antarktischen Polarfront (50° S; PF3) zeigen die TEX8 L -basierten Temperaturen aus der flachen
Sedimentfalle sowohl Über- als auch Unterschätzungen der SST, wobei die Unterschätzungen
tendenziell zu Zeiten geringen GDGT-Flusses auftreten. Dieser Effekt scheint in der tieferen Falle
stärker ausgeprägt zu sein. Überschätzungen der SST von ~7 °C treten sowohl in der tiefen Falle als
auch dem darunter befindlichen Oberflächensediment auf. Diese sind vermutlich auf Beiträge von
Euryarchaeota zurückzuführen oder auch durch einen non-linearen Zusammenhang von TEX8 L und
der SST im Südozean zu erklären. In beiden polaren Regionen scheinen hydroxylierte GDGT als
Temperaturproxy anwendbar zu sein.
Der dritte Teil der Arbeit befasst sich mit den oligotrophen Gyren, die im Vergleich zu den in Teil
eins und zwei betrachteten ozeanischen Regimen trotz ihrer Größe und ihres Einflusses auf
biogeochemische Budgets relativ wenig wissenschaftliche Aufmerksamkeit erhalten. In dieser Arbeit
werden die TEX8 -Werte aus zwei Tiefen an zwei Lokationen im Brasilianischen Becken untersucht
(WAB1 and WA9). An beiden Lokationen zeigen die flachgelegenen Fallen gute Korrelationen
zwischen GDGTs und Opal/Karbonat, was als Zeichen präferenzieller Aufnahme von GDGTs durch
opal- und karbonatreiche Aggregate interpretiert wird. An WAB1, die sich im Randgebiet des Gyre-
Systems befindet, ähneln die TEX8 H -basierten Temperaturen den SSTs. Im Gegensatz zu WAB1, wird
mit Falle WA9 Material aus den nährstoffärmeren Gebieten im Zentrum der oligotrophen Gyre
beprobt. Dort tritt in der flachen Falle eine Überschätzung der SST auf, die möglicherweise durch
Energiestress der Thaumarchaeota hervorgerufen wird. An beiden Lokationen entsprechen die TEX8 H -
basierten Temperaturen aus der tiefen Falle dem tieferen Subsurface. Grund dafür ist vermutlich ein

6
starker Beitrag von GDGTs, die in tieferen, kälteren Wassermassen gebildet werden, gegenüber
GDGTs aus flachen, wärmeren Wassermassen.
Während sich die ersten drei Teile dieser Arbeit mit GDGT-basierten Temperaturrekonstruktionen
beschäftigen, werden im letzten Teil Alkenone und die darauf basierenden SST-Proxies (U or U
)
in den drei ozeanischen Regimen betrachtet. In den tropischen Gebieten, dem äquatorialen
Guineabecken, dem Atlantik vor Lüderitz sowie dem zentralen Brasilianischen Becken, spiegeln die
U -basierten Temperaturen die regionalen SST wider. Dies impliziert, dass regional-spezifische
geochemische Charakteristika (z. B. Sauerstoffkonzentration und Verfügbarkeit von Nährstoffen), die
wahrscheinlich TEX8 in den Untersuchungsgebieten beeinflussen, keine Auswirkungen auf das
Temperatursignal des U haben. In der flachen Falle der antarktischen Polarfront zeichnen die U
-
basierten Temperaturen deutlich die Saisonalität der SST auf, allerdings mit einem zeitlichen Versatz
von zehn Wochen. In der tiefen Falle treten Über- und Unterschätzungen der SST auf, deren Ursprung
nicht eindeutig geklärt werden kann. In der östlichen Framstraße liefern sowohl U als auch U
zu
warme SSTs. Diese Ergebnisse unterstützten Schlussfolgerungen anderer Arbeiten, wonach die
Anwendung des Alkenon-Proxies in kalten Ozeanen wegen ungeeigneter Umweltbedingungen für
alkenonproduzierende Organismen limitiert ist. Dieses Kapitel zeigt, dass sich TEX8 und U in den
tropischen Ozeanen als Temperaturproxies ergänzen, da Thaumarchaeota und Alkenonproduzenten die
Bedingungen unterschiedlicher Habitate reflektieren. In den polaren Ozeanen ist TEX8 jedoch besser
zur Temperaturrekonstruktion geeignet als die Alkenon-Proxies.

7
CHAPTER 1
Introduction

8
1 Introduction
1.1 Climate change and ocean warming
The climate is the long term condition of weather, which is defined by temperature, precipitation,
wind, and the frequency and intensity of weather events. Solar radiation and the chemical composition
of the atmosphere play key roles in controlling the earth’s climate and temperature. The natural
oscillation in atmospheric CO2 concentration is linked to the solar energy cycle. However, the rate of
current CO2 increase is out of line with the rate that has applied at any time in the past 800,000 years
(IPCC, 2014). The atmospheric CO2 level has increased consistently since the first measurement in
1958 and it reached over 400 parts per million (ppm) in 2013 (Figure 1.1). Furthermore, the average
global temperature recorded in 2017 was about 1.1 °C above the pre-industrial levels; this rise closely
correlates with the rise in CO2. Natural sources of CO2 cannot account for the observed rise. Instead, it
is now recognized that the recent abrupt climate change and warming are ultimately caused by human
activities (IPCC, 2014). Reliable prediction of future climate change is essential to develop
appropriate mitigation and adaptation strategies. The precise scenario for future change can be
established when natural climate changes and anthropogenic changes arising from human activity are
properly distinguished, and interlinked changes of the earth’s climate system are fully comprehended.
Therefore, understanding the long-term evolution of the climate is one of the key issues in geoscience
that must be addressed to allow us to predict the effects of climate change that we cannot circumvent.
Figure 1.1 Observation of (a) global temperature anomalies, (b) sea level change relative to the average over
the period 1986-2005, (c) concentration of greenhouse gasses, and (d) global anthropogenic CO2 emission.
(adapted from: IPCC, 2014 and references therein)

9
The atmosphere and oceans interact and exchange energy. As the oceans cover about 70% of the
earth’s surface, they play a significant role in regulating the climate and atmosphere as a heat and
carbon reservoir. The ocean absorbs approximately 30% of anthropogenic CO2 from the atmosphere.
The rise of sea surface temperatures is accompanied by a rise in atmospheric CO2. The projected
changes in ocean temperature and uptake of CO2 pose several direct and indirect problems such as
ocean acidification; a decrease in O2 solubility; altered distribution and abundance of marine
resources; and further risks to human life (IPCC, 2014).
The temperature of the oceans is the principal parameter that is interconnected with other
biological- and non-biological parameters, and it represents the status of the climate’s condition. The
recent history of ocean temperature has been recorded by field and satellite-derived measurement.
However, the long-term history of temperature evolution can be determined by establishing
temperature proxies through the study of marine sediments. Establishing a proxy is based on an
assumption that the relationship between geochemical parameters and the proxy in the modern climate
is the same as it was in the past and that changes in the proxy are well preserved within the geological
records. Hence, an understating of the proxy system and precise historical temperature reconstruction
are fundamental to the accurate prediction of future climate change.
1.2 Temperature proxy
Several inorganic and organic seawater temperature proxies have been developed and applied to
paleoclimate studies (Table 1.1). Inorganic temperature proxies (δ18O, Mg/Ca, Sr/Ca) have a longer
history relative to organic temperature proxies (U , TEX8 , LDI). When organisms (Foraminifera,
Coral, Diatom) build their shells, the isotope fractionation (e.g. δ18O) controlled by temperature is
archived in the shell material (Leclerc and Labeyrie, 1987; Urey, 1947; Weber and Woodhead, 1972).
However, there are some uncertainties associated with the use of an isotope proxy. For example,
changes in δ18O of seawater experiencing evaporation and precipitation have an effect on oxygen
isotope thermometry. Also, the diagenesis of source organisms, the formation and preservation of
shells, and the composition of unknown species in each source organism have to be considered (Lea,
2014 and reference therein). The Mg/Ca ratio measured in foraminifera and ostracods, and Sr/Ca ratio
measured in corals (Chave, 1954; Dwyer et al., 1995; Kinsman and Holland, 19 9) are more recent
inorganic temperature proxies. These elemental proxies can be affected by the dissolution of elements
(Mg, Sr), contamination (Mg), species-specific control, and the growth rate of the source organism
(Lea, 2014 and reference therein).
The first organic temperature proxy U containing di- (C37:2), tri- (C37:3) and tetra-unsaturated
alkenones (C37:4) was developed by Brassell et al., (198 ) and later modified as U (= C37:2 / (C37:2 +
C37:3)) after excluding C37:4 (Prahl and Wakeham, 1987; Table 1.1). The proxy values in surface

10
sediments showed the strongest correlation with mean annual Sea Surface Temperature (ma SST)
(U = 0.033 x SST + 0.044, R2
= 0.958; Müller et al., 1998). It has been confirmed that SST is a
primary controller for the relative abundance ratio (U ) of alkenones synthesized by Haptophyte
algae (Emiliania huxleyi) living near the sea surface (Prahl and Wakeham, 1987). Despite the strong
dependence of U on SST, discrepancies between the records of surface sediments and overlying
SSTs have been investigated. The season of maximum production, export depth, selective degradation
and other physical factors have been discussed as major reasons for the discrepancies in
paleotemperature reconstruction using U (Prahl et al., 2000 and reference therein; Zabeti et al.,
2010; Rosell-Melé and Prahl, 2013 and reference therein).
Table 1.1 Summary of major seawater temperature proxies
Proxy Organism Non-thermal effects References
Inorganic
δ18
O
Foraminifera Evaporation, precipitation, diagenesis,
Species control a
Dehydration a
(Urey, 1947) (Epstein and Mayeda, 1953)
Coral (Weber and Woodhead, 1972)
Diatom (Leclerc and Labeyrie, 1987)
Mg/Ca
Foraminifera Dissolution Contamination (Mg) Species control
(Chave, 1954)
Ostracods (Dwyer et al., 1995)
Sr/Ca Corals Growth rate Symbiosis
(Kinsman and Holland, 1969)
Organic
Emiliania huxleyi Community composition Seasonal of production Export depth Selective degradation
b
Lateral transport b
Terrestrial input c
Energy level c
(Brassell et al., 1986) (Prahl and Wakeham, 1987)
Thaumarchaeota (Schouten et al., 2002)
LDI Eustigmatophyte algae (?)
On-going research (Rampen et al., 2012)
The most recently proposed temperature proxy, a long chain diol index (LDI), is based on the
distribution of C28 and C30 1,13- and 1,15-diols (Rampen et al., 2012; Table 1.1). The proportional
abundance of C30 1,15 to total diols (Σ C28 1,13 + C30 1,13 + C30 1,15) in marine sediments displayed
a good correlation with ma SST (LDI = 0.033 x SST + 0.09, R2 = 0.9 9; Rampen et al., (2012)).
These diols and C32 1,15-diols have been found in Eustigmatophyte algae (Méjanelle et al., 2003),
which are likely to be a source organism of diols in the freshwater system (Shimokawara et al., 2010).
However, a mismatch has been observed between the diol compositions of cultured Eustigmatophytes
and those found in natural marine environments (Versteegh et al., 1997; Volkman et al., 1992). LDI-
derived temperatures reflected neither ma SST nor any seasonal environment in sinking particles and

11
surface sediment around Iceland (Rodrigo-Gámiz et al., 2015), although they did correspond to SST
in Late Quaternary sediments from the Chilean margin (de Bar et al., 2018). The source organism of
diols and their role in marine sediments may need to be investigated further to constrain uncertainties
when applying the LDI proxy.
TEX8 index (TetraEther indeX consisting of 8 carbon atoms), which was introduced later than
the U and earlier than the LDI , has received a great deal of attention in paleoclimate studies
(Schouten et al., 2002; Table 1.1). TEX8 quantifies the relative distribution of isoprenoid glycerol
dialkyl tetraethers (GDGTs) produced by marine Thaumarchaeota, which are ammonia oxidizing
chemoautotrophs (Wuchter et al., 2003; Francis et al., 2005; Könneke et al., 2005; Martens-Habbena
et al., 2009). Their presence in many different environments and on a longer time scale compared to
Haptophyte algae (Emiliania huxleyi) makes the TEX8 more applicable as a temperature proxy than
the U (Schouten et al., 2013, 2000). The TEX8 was originally calibrated to ma SST (Table 1.2;
Schouten et al., 2002), but warm- or cold biases compared to SST have been observed in different
ocean regimes (see Section 1.4.1). Such anomalies could be caused by similar factors (e.g. the spatial
and temporal variability of source organism) (see Section 1.5) to those that account for the ambiguous
U calibration. Although the weakness of TEX8 calibration can be mitigated by applying
other proxies (Lopes dos Santos et al., 2010; McClymont et al., 2012), it is important to investigate
additional factors, which can alter GDGT compositions and the temperature estimates.
1.3 General biology of Thaumarchaeota
Thaumarchaeota were previously designated within the marine group I (MG-I) Crenarchaeota but
are now affiliated with a phylum of the domain Archaea (Brochier-Armanet et al., 2008). This group
is ubiquitously distributed in various ocean regions (Church et al., 2010; Francis et al., 2005; Karner
et al., 2001; Mincer et al., 2007; Alison E Murray et al., 1999). The isolation of the cultured
representative of this phylum, Nitrosopumilus maritimus, confirms that Thaumarchaeota are
chemoautotrophs generating energy by oxidizing ammonia to nitrite (Könneke et al., 2005).
Consequently, the high abundance of Thaumarchaeota as an ammonia oxidizer accounting for up to
30% of the total picoplankton in the oceans reveals their significant role in marine nitrogen cycles
(Francis et al., 2005; Ingalls et al., 200 ; Wuchter et al., 200 a). The isolated strain highlights a high
affinity of Thaumarchaeota for ammonia (Horak et al., 2013; Martens-Habbena et al., 2009; Urakawa
et al., 2014) allowing them to adapt to oligotrophic conditions. However, Achaea with mixotrophic or
heterotrophic metabolism have also found in mesopelagic oceans (Agogué et al., 2008; Herndl et al.,
2005; Ingalls et al., 200 ).
Several pieces of evidence using the ammonia monooxygenase subunit A (amoA), 1 S rRNA
genes, and mRNA transcripts suggest that Thaumarchaeota preferentially dwell below the photic zone

12
(Beman et al., 2008; Church et al., 2010; Delong, 1992; Fhurmann et al., 1992; Mincer et al., 2007).
These observations support the results from thaumarchaeotal membrane lipids, GDGTs (see Section
1.4), which also show the subsurface depth habit of Thaumarchaeota (Huguet et al., 2007; Karner et
al., 2001; Turich et al., 2007; Wuchter et al., 2005). The abundance of Thaumarchaeota varies
seasonally in widely different regions. A winter bloom occurs in the North Sea (Herfort et al., 2007;
Pitcher et al., 2011), in Antarctic coastal waters (Tolar et al., 201 ), and in the Santa Barbara Basin
(Massana et al., 1997) whilst the upwelling period bloom occurs in the Arabian Sea (Wuchter et al.,
200 b). The occurrence of winter blooms implies that winter time provides more favorable conditions
for Thaumarchaeota due to ammonia availability together with reduced competition from
phytoplankton, which suffer from the favorable water temperature and light intensity. However, the
bloom during the upwelling season indicates that other factors also play a part.
Figure 1.2 Sources of GDGTs in the marine environment. The detailed structure of GDGTs can be found in
Figure 1.3. GDGTs synthesized in upper waters are exported to deep waters in the form of aggregated
particles and buried in sediments.
The neutrally buoyant and small Thaumarchaeota (<1 μm) cannot sink by themselves (Schouten et
al., 2013); they can only sink when they have gained enough density through aggregation with

13
phytoplankton debris, incorporation into other suspended particles, and/or through grazing by
zooplankton (Wakeham et al., 2003; Figure 1.2). Together with the seasonal production and depth
distribution of Thaumarchaeota, an investigation into the sinking mechanism that exports
Thaumarchaeota to deep oceans is essential to understand the TEX8 -temperature relationship (Hurley
et al., 2018; Taylor et al., 2013).
1.4 GDGTs
GDGTs, which are thaumarchaeotal membrane lipids, comprise zero to three cyclopentane
moieties (GDGT-0−3) and crenarchaeol which has four cyclopentane moieties with a cyclohexane
(Japp S. Sinninghe et al., 2002; Figure 1.3). The absence of crenarchaeol in hyperthermophilic
Crenarchaeota and its unique presence in Thaumarchaeota (previously known as Crenarchaeota)
means that crenarchaeol is a biomarker of Thaumarchaeota. The cyclization of GDGTs (i.e. the
number of ring structures) is known to be an adaption to changes in temperature (Schouten et al.,
2002). Although the formation process of GDGTs and cyclopentane moieties has been poorly
elucidated, the relative abundances of different GDGTs are clearly seen in different oceans (Pearson
and Ingalls, 2013; Schouten et al., 2013). GDGT-1 to -3 are more pronounced in warm-water
environments, while the low abundance of GDGT-1 to -3 and higher abundance of GDGT-0 than
crenarchaeol are found (Figure 1.3 in this study).
Figure 1.3 Structure of GDGTs and base peak chromatogram of GDGTs. Monolgycosidic (1G)-GDGT-
GDGT), diglycosidic (2G)-GDGT, and hexosephosphohexose (HPH)-GDGT represent intact polar lipids
(IPLs). The chromatograms are extracted from (a) the equatorial (warm; discussed in Chapter 2) and (b) polar
(cold; discussed in Chapter 3) regions and their GDGT compositions are different. Abbreviations: GDGT,
glycerol dialkyl glycerol tetraethers.

14
GDGTs are bound to polar head groups (intact polar lipids, IPLs) when the organisms are alive,
and the head groups are detached from core GDGTs after cell death. Thus, IPLs are used as indicators
of living populations (Herfort et al., 2007; Huguet et al., 2007; Japp S. Sinninghe et al., 2002; Turich
et al., 2007). However, Schouten et al., (2010) demonstrated that IPLs can be preserved and buried in
sediments. In terms of TEX8 thermometry, it is still debatable whether or not the viability of IPLs
and the preferential degradation of certain head groups can influence core lipids (CL) GDGT distribu-
tions in the water column and sediments (Lengger et al., 2012; Schouten et al., 2012).
Recently Liu et al., (2012) reported a new set of GDGTs, the hydroxylated-GDGTs (OH-GDGTs)
with one or two additional hydroxyl groups on the alkyl chain of GDGTs in core and intact forms
(Figure 1.2; Liu et al., 2012). Relatively high proportion of OH-GDGTs to the total (OH- and CL-)
GDGT pool was determined in (sub) polar regions, suggesting ‘OH-GDGTs’ as a potential indicator
for polar waters (Fietz et al., 2013). A similar finding was made by comparing samples distributed by
latitude, showing an increasing proportion of OH-GDGTs in colder oceans (Huguet et al., 2013).
As a consequence, Fietz et al., (2013) and Huguet et al., (2013) suggested several SST calibrations
using OH-GDGTs for the polar ocean. On the other hand, two previous studies indicate that OH-
GDGTs can also play a role as a temperature proxy in subtropical and tropical marine environments
(Lü et al., 2015; Yang et al., 2018).
1.4.1 Global calibration
Culture experiments have found that the number of cyclopentane rings in GDGTs of
hyperthermophilic Archaea strongly depends on growth temperatures (Schouten et al., 2002). A
finding of phylogenetically related Archaea in the ocean, and their ubiquity (Delong, 2003; Karner et
al., 2001) led to the idea of GDGT composition as a temperature proxy (Schouten et al., 2002).
Schouten et al., (2002) plotted TEX8 values of 44 surface marine sediments against mean annual
(ma) SSTs extracted from the World Ocean Atlas. The relationship displays a linear correlation as
follows:
TEX8 = ([GDGT-2] + [GDGT-3] + [Cren´]) / ([GDGT-1] + [GDGT-2] + [GDGT-3] + [Cren´]) (1)
TEX8 = 0.015 × SST + 0.28 (R2 = 0.92, n = 44) (2)
A later mesocosm study also showed a linear correlation with the same slope and a higher intercept
at temperatures ranging from 5 to 35 °C, thus confirming that temperature is a main controlling factor
of GDGT composition (Wuchter et al., 2004; TEX8 = 0.015 × T + 0.010, R2 = 0.79).

15
Table 1.2 Most commonly used TEX8 related calibration.
Calibration n R2
Standard deviation of Residuals (°C)
Remarks Reference
SST = -10.78 + 56.2× 223 0.84 1.7 w/o
1 Red Sea
& residuals<1σ Kim et al., (2008)
SST = 50.475 - 16.332×(1/ ) 287 0.82 3.7 All data Liu et al., (2009)
SST = 46.9 + 67.5×
396 0.87 4.0 w/o Red Sea Kim et al., (2010)
SST = 38.6 + 68.4×
255 0.86 2.5 w/o Red Sea & <5 °C
Kim et al., (2010)
0-200m T = 36.1 + 50.8×
396 0.87 2.8 w/o Red Sea Kim et al., (2012a)
0-200m T = 30.7 + 54.7×
255 0.84 2.2 w/o Red Sea & <5 °C
Kim et al., (2012b)
Baysain Model
SST
1095
- 1.2-10
w/o> 70° N Tierney and Tingley, (2015)
0-200 mT - 1.4-9
1 w/o ís an abbreviation of without
The original TEX8 linear calibration has been updated by expanded data sets and/or a non-linear
regression approaches. After removing TEX8 values from the cold regions (<5 °C) and the Red Sea,
Kim et al., (2008) updated the linear calibration (Table 1.2; Kim et al., 2008). Using Kim et al.,
(2008)´s dataset, Liu et al., (2009) reformulated TEX8 (the relative amount of GDGT-2 to the sum of
GDGT-1, -2 and -3) and the reciprocal of TEX8 . Later, two non-linear calibrations were suggested to
overcome the scattered relationship between TEX8 and SST at both ends of the linear regression. The
base 10 logarithmic function of TEX8 in two different forms was developed to resolve these issues
for the warm area (named TEX8 H ; Figure 1.4a) and for the cold area (named TEX8
L ; Figure 1.4b)
(Table 1.2; Kim et al., 2010). The latter index, TEX8 L , does not contain the Crenarchaeol regioisomer
due to its scattered distribution in polar regions, revealing their insignificant role in cold
environments.
TEX86L = Log10 ([GDGT-2] / ([GDGT-1] + [GDGT-2] + [GDGT-3])) (3)
Rea Sea and (sub)polar regions, where the relationship between TEX8 and SST is not likely to be
linearly correlated, are excluded from the TEX8 H calibration (Figure 1.4a). When the residuals
(Residual (°C) = TEX8 / TEX8 L / TEX8
H -derived temperature − satellite SST) are compared, smaller
residuals are evident in the logarithmic calibrations than in the linear calibration. However, the
residuals do not seem to have any trend in their latitude or proxy values; rather, they are distributed
randomly (Figure 1.4c, d). The depth distribution of Thaumarchaeota and the reflection of the
subsurface in TEX8 -derived records promote depth-integrated calibrations, in which TEX8 L and
TEX8 H are plotted against 0200 m depth-integrated water temperatures (Table 1.2; Kim et al., 2012a,
2012b).

16
Figure 1.4 Global calibration of TEX8 L (a) and TEX8
H (b) (Kim et al., 2010). Black dots represent the
calibration data set. Red and grey indicate the Red Sea and (sub) polar regions, respectively, which are
excluded for the TEX8 H based calibration (b). (c) and (d) display the residual temperatures between the
calibrated ones and the satellite ones. Brown dots represent the original linear calibration. Note that SSTs as
the independent variable (X-axis) and TEX8 as the dependent variable (Y-axis) are treated.
1.4.2 Regional calibrations
Previously developed TEX8 based calibrations (see Section 1.4.1) have been made with the
assumption that the response of TEX8 (e.g. GDGT compositions) to temperature is constant across
the earth’s oceans. However, its response seems to vary depending on the environmental regimes, as
revealed in the scattered residuals (Figure 1.4).
For temperature prediction, Tierney and Tingley, (2015) suggested the Bayesian, spatially-varying
regression (BAYSPAR) model, which provides a compromise between a global calibration and a
regional calibration, excluding data north from 70° N. In the BAYSPAR model, calibration parameters
for each independent locale are decided within a 20° by 20° longitude-latitude grid box. Regionally
distinct archaeal communities, which may respond differently to SST, result in regionally specified
calibrations. In the deeply isolated basin of the Red Sea, where TEX8 values are clearly distinguished
from the global calibration (Figure 1.4b), a new ‘Red Sea’ TEX8 calibration was suggested
(Trommer et al., 2009). Later, Kim et al., (2015) identified a similar controlling mechanism of GDGT

17
to that found in the Red Sea in the Mediterranean Sea, where the global calibration shows warm-
biased temperatures. In the Baltic Sea, Kabel et al., (2012) drew a regional calibration for the last
1000 years and found that TEX8 temperatures increased by up to 2 °C between the Little Ice Age and
the Modern Warm Period when the anoxic area was expanded. Seki et al., (2014) made a local TEX8 L
calibration in the Sea of Okhotsk and North Pacific sub-polar region and generated reliable Last
Glacial Maximum and Holocene temperatures for the region. Following this regional TEX8 L
calibration, which displayed the best fit between TEX8 L values and the shallow subsurface
temperature in the summer months, Meyer et al., (201 ) reconstructed the glacial-Holocene
temperatures for the subarctic northwest Pacific and the western Bering Sea. Shevenell et al., (2011)
also suggested that a regional calibration is a right approach for TEX8 calibration in the western
Antarctic Peninsula, demonstrating a cooling of 3−4 °C over the last 12,000 years. Furthermore, Ho et
al., (2014) suggested that a regional TEX8 L calibration could be a suitable approach for the Southern
Ocean and the Pacific Subarctic Front Zone.
These observations of TEX8 thermometry in different regions challenge the efficacy of global
calibration and emphasize the importance of understanding regionally specified environmental
factors, which may lead the systematic offsets between proxy and measured temperatures.
1.5 Constraints of TEX8 thermometry
1.5.1 GDGTs-derived from Euryarchaeota
The ubiquity of Thaumarchaeota synthesizing GDGTs in a wide range of ocean environments
makes TEX8 a good proxy for reconstructing temperatures in geological history. GDGTs are assumed
to be predominantly produced by Thaumarchaeota, which are the dominant archaeal group in the
ocean (Karner et al., 2001). However, there is a debate as to whether mesophilic Euryarchaeota could
contribute to GDGT compositions (Lincoln et al., 2014; Schouten et al., 2014). This was one of the
main reasons that GDGT-0 was excluded from the TEX8 calculation (Schouten et al., 2002).
Turich et al., (2007) suggested that GDGTs in suspended particulate matters (SPM) from
mesopelagic water, as opposed to shallow waters (<100 m), can be attributed to GDGTs derived from
Group II Euryarchaeota, producing GDGT-0 to -3. Schouten et al., (2008) did not agree with Turich et
al., (2007) citing the temporal offset between the GDGT abundances (GDGT-0 and crenarchaeol) and
the cell abundances of Euryarchaeota in the North Sea, which was one of the areas that Turich et al.,
(2007) used as an example. In the epipelagic zone of the North Pacific subtropical gyre, Lincoln et al.,
(2014) showed that Group II Euryarchaeota were a major source of GDGTs as determined through
rRNA analysis in SPM samples. Although a bias caused by differing sampling processes is
unavoidable, a relatively large abundance of Euryarchaeota in surface water was also found in the

18
eastern tropical North Pacific (Podlaska et al., 2012). GDGT-1 to -4 have also been detected in many
strains of Euryarchaeota (Schouten et al., 2013 and reference therein).
In general, several lines of evidence detailed above illustrate that Euryarchaeota can contribute to
GDGT production and, therefore, to TEX8 thermometry. However, much is still unknown regarding
the proportional contribution of GDGTs solely produced by Euryarchaeota and the organism’s
physiological response to environmental parameters. Cultured mesophilic Euryarchaeota may help to
answer these questions in the future.
1.5.2 Shallow vs. deep origin of GDGTs
The strong correlation between TEX8 in surface sediments and overlaying SSTs has been
originally explained by GDGTs that were mostly exported from the surface waters (Schouten et al.,
2002; Wakeham et al., 2003) via zooplankton grazing and the formation of fecal pellets (Huguet et al.,
2006; Wuchter et al., 2005). However, the TEX8 -derived temperature often corresponds to
subsurface temperature rather than SST (Lee et al., 2008; Lopes dos Santos et al., 2010; McClymont
et al., 2012; Seki et al., 2014). The distribution (preferentially at the subsurface level) of
Thaumarchaeota in the water column has been invoked to explain the TEX8 subsurface temperature.
Archaea are found throughout the water column (Karner et al., 2001), but their maximum abundances
tend to occur below the surface water (Church et al., 2010; Delong, 1992; Fhurmann et al., 1992;
Massana et al., 1997; Mincer et al., 2007). These findings are associated with a generally high
ammonia oxidation rate in the subsurface (Beman et al., 2008; Church et al., 2010). Significant
production of GDGTs in waters deeper than subsurface was also observed by radiocarbon
measurements in some settings (Ingalls et al., 2006; Shah et al., 2008).
Taylor et al., (2013) observed that the GDGT [2]/[3] ratio in samples of SPM and surface
sediments increases with depth, indicating a potential contribution of deep-dwelling Archaea to
sedimentary GDGT distributions. Although it has not yet been clearly explained what causes the
increase in the GDGT [2]/[3] ratio by depth, the contribution of GDGTs derived from deep-dwelling
Archaea is relatively higher in deep settings compared to shallower settings (Hernández-Sánchez et
al., 2014; Kim et al., 201 ). Different ecotypes of Archaea (shallow vs. deep) have been distinguished
based on the ammonia monooxygenase (amoA) α-subunit genes (Francis et al., 2005; Sintes et al.,
2013; Villanueva et al., 2014). Sintes et al., (2013) showed that two phylogenetically distinct clusters
are separated by depth and regions, where ammonia availability differs. In the Arabian Sea and the
Atlantic Ocean, ammonia availability appears to be an important factor affecting the distribution of
two archaeal ecotypes (Sintes et al., 201 ; Villanueva et al., 2014). By extension, sedimentary TEX8 -
derived temperature reflects SST at shallow setting and subsurface temperature at deep settings.
However, there is an offset between TEX8 -derived temperature measured in SPM and in situ

19
temperature, and it increases with depth, indicating that the adaptation mechanism of deep-dwelling
Archaea to temperature is different to that of shallow-dwelling Archaea (Hernández-Sánchez et al.,
2014; Schouten et al., 2012).
1.5.3 Environmental factors
The influence of physiological parameters on TEX8 thermometry was tested by Elling et al.,
(2015) using a thaumarchaeotal culture. The authors determined that a response of TEX8 (i.e. GDGT
compositions) to growth temperature occurred differently; a linear response in Nitrosopumilus
maritimus but no correlation in the other strain culture. Thus, the authors suggested that community
composition may be a crucial factor determining GDGT distributions rather than salinity or pH, which
had no systematic effect on TEX8 in all strains. In another culture experiment TEX8 -derived
temperatures for individual core and IPL-GDGTs in different stationary phases were compared (Elling
et al., 2014). Between the early and late growth phase, the reconstructed temperatures increased in all
GDGTs, while the temperature changes were rather smaller between the early and late stationary
phase. It seems clear that TEX8 -derived temperature can be affected by the growth status of
Thaumarchaeota. However, it is assumed that Thaumarchaeota aggregated with particles and sunk
into deep waters are considered to be in the late stationary phase. Therefore, this finding may not be
applicable in the field.
Nutrients and light conditions are commonly invoked explanations for the tendency to maximum
values of the abundance of Thaumarchaeota and their ammonia oxidation at the base of the euphotic
zone and the higher production in winter, agreeing with TEX8 reconstruction of subsurface
temperatures (see Section 1.3 and 1.5.2). Turich et al., (2007) observed that a change in GDGT
distribution is induced by nutrient enrichment. Ammonia oxidation rate was inhibited by low light
intensity (Qin et al., 2014) or the presence of reactive oxygen species (Horak et al., 2017; Tolar et al.,
201 ). The vertical distribution of nutrients was also found to be a controlling factor of the niche
segregation (Lopes dos Santos et al., 2010; Sintes et al., 201 ). Using continuous cultures of
Nitrosopumilus maritimus, the Ring index (RI) value, the weighted average of cyclopentane moieties,
and TEX8 -derived temperature increased at low ammonia oxidation rate while the opposite trend
occurred at high ammonia oxidation rate (Hurley et al., 201 ). A similar finding was made by Qin et
al., (2015), implying an alteration of TEX8 temperature under energy stress condition.
1.5.4 Indices for non-thermal factors on TEX8
GDGTs derived from soil or euryarchaeotal communities are known to be able to modify
sedimentary GDGT composition. To evaluate non-thermal factors on TEX8 , a number of GDGT
based indices have been proposed (Table 1.3). The input of terrestrial GDGTs on TEX8 can be
examined by applying the BIT (branched and isoprenoid tetraether) index, which provides the relative

20
ratio of soil-derived branched GDGTs to crenarchaeol representing marine GDGTs (Hopmans et al.,
2004; Weijers et al., 200 ) (Figure 1.2 and 1.3). When the BIT value is higher than 0.3, TEX8 is
potentially influenced by soil-derived GDGTs. As explained in Section 1.5.1, methanogenic
Euryarchaeota can produce mainly GDGT-0 with a minor portion of GDGT-1 to -3. The percentage
of GDGT-0 to crenarchaeol, %GDGT, which indicates a relative extra contribution of GDGT-0 from
methanogenic Euryarchaeota to the sedimentary GDGTs, should not exceed 7% (Blaga et al., 2009;
Inglis et al., 2015; Sinninghe Damsté et al., 2012). Methanotrophic Euryarchaeota in marine gas
hydrate or methane-rich sites characterized by diffusive methane flux can synthesize GDGT-1 to -3.
Zhang et al., (2011) observed that TEX8 values represent normal marine signals when the methane
index (MI) is below 0.3. The most recently proposed non-thermal index is the RI (Table 1.3; RI;
Zhang et al., 201 ). The authors found a significant correlation between TEX8 and RI values in the
global marine data sets. They suggested that GDGT distributions are influenced by GDGTs derived
from soil, methanotrophic Euryarchaeota, or any other non-thermal factors when the discrepancy
(∆RI) between the measured RI value and the calculated one from the modern TEX8 -RI regression is
higher than 0.3 (Table 1.3).
Table 1.3 Indices for assessing non-thermal influences on TEX8
Index Non-thermal source
Limit value
Reference
BIT, Branched and Isoprenoid Tetraether index = ([I] + [II] + [III])/([I] + [II] + [III] + [Cren])
Soil <0.3 (Hopmans et al., 2004; Weijers et al., 2006)
%GDGT-0/Cren Methanogenic Euryarchaeota
<67 (Blaga et al., 2009; Inglis et al., 2015; Sinninghe Damsté et al., 2012)
MI, Methane Index = ([1] + [2] + [3])/([1] + [2] + [3] + [Cren] + [Cren ])
Methanotrophic Euryarchaeota
<0.3 (Zhang et al., 2011)
RI, Ring Index = (0×[0] + 1×[1] + 2×[2] + 3×[3] + 4×[Cren] + 4×[Cren ]
RITEX
= -0.77(±0.38)× + 3.32(±0.34)×( )2 + 0.59(±0.10)
∆R = RITEX − RIsample
Non-thermal input
<│0.3│ (Zhang et al., 2016)
* [I] and [numbers] refer to branch- and isoprenoid GDGTs, respectively. GDGT structures are shown in Figure 1.3 * For RI, each GDGT indicates a relative proportion to the sum of all isoprenoidal GDGTs.
1.6 Trap study
1.6.1 Trapping efficiency
Determining the particle flux is essential to understand the biological pump in the ocean. The
considerable amounts of carbon synthesized in the surface ocean sink in the form of particles and

21
finally reach to the sea floor. The time-series mooring system is equipped with a sediment trap with
20 (or 17) sample cups and 0.5 m2 of honeycomb baffles at the top, as well as a current meter (A1.
Figure 1). A time-series sediment trap allowing the direct measurement of the particle flux in the
ocean has been used for biogeochemical studies including paleo proxy, carbon cycle, the link between
the shallow and deep ocean, and the consequence of human impact on the benthic ecosystem.
Nonetheless, several efforts have been made to overcome the low trapping efficiency and to introduce
best practice into the trap system (Buesseler et al., 2007; Gardner, 2000, 1985; Scholten et al., 2001;
Yu et al., 2001). The trapping efficiency appeared to be generally low in the mesopelagic zone relative
to the bathypelagic zone, as calculated from radionuclide measurements (230Th and
231Pa) in sediment
traps and the water column (Buesseler et al., 2007 and references therein). Buesseler et al., (2007)
reviewed the capabilities and limitations of the trap system as well as the possible enhancements.
Under and over trappings are attributed to zooplankton, the biological process, and tilting by the
strong current in the vicinity of the trap. Zooplankton trapped as active migrants can be removed by
sieving or manual picking. To avoid further biological process within the sample cup, formaldehyde
or mercury chloride (HgCl2) can be used to poison the collected samples. Hydrodynamics are of most
concern, and can cause physical failure of the trap system (Gardner, 2000, 1985; Scholten et al.,
2001). For example, the measured current velocity using current meters attached to the mooring
system was in the range of 1 to 8 m s-1 in the Antarctic Polar Front (Walter et al., 2001). According to
Gardner, (1985), this would not affect the trapping efficiency because the current velocity was below
the critical value of >10 m s-1. On the other hand, Yu et al., (2001) tested the trapping efficiency using
radionuclides (230Th and
231Pa) and estimated that it was only 44%.
For all the trap samples used in the manuscripts of this thesis, swimmers were removed by sieving
or picking after traps were recovered. Formaldehyde or HgCl2 solutions were added to inhibit
microbial activity before and after the mooring system deployment. Even if the trap sampling was
biased by hydrodynamics around the trap, it would not affect the paleo proxy, which deals with the
relative composition of the respective lipids captured in the trap. Longer term trap studies (made over
several years) would be needed to measure long-term trends of particle flux and trap efficiency.
1.6.2 TEX8 thermometry with time-series sediment traps
It has been recognized that sinking particles collected using a sediment mooring system can be of
great value in helping us to understand the progress of lipid biomarkers on their way to the sea-floor
and for comparison with the sediment signal (Rosell-Melé and Prahl, 2013; Schouten et al., 2013). In
particular, results from time-series sediment traps allow us to examine the seasonality of material flux
as well as the lipid biomarker signal in a certain environment.

22
For GDGTs and TEX8 thermometry, time-series sediment trap studies have helped us to
understand the ecology of GDGT synthesizers such as the seasonal variation of their production, the
corresponding water depth of TEX8 -derived temperature, the transport mechanism of lipid signal to
the deep water, and potential environmental impacts on TEX8 thermometry. Despite the great value
of trap studies, the seasonality of TEX8 using a sediment trap has been reported from only ten
different regions (Figure 1.5, Table 1.4); the Arabian Sea (Wuchter et al., 200 b), the Santa Barbara
Basin (Huguet et al., 2007), the Mozambique Channel (Fallet et al., 2011), the Gulf of California
(McClymont et al., 2012), the western North Pacific (Yamamoto et al., 2012), the eastern Cariaco
Basin (Courtney Turich et al., 2013), off Northwest Africa (Mollenhauer et al., 2015), around Iceland
(Rodrigo-Gámiz et al., 2015), South of Java (Chen et al., 201 ), and the northern Gulf of Mexico
(Richey and Tierney, 201 ).
Variability of TEX8 thermometry has been revealed in various environmental ocean regimes.
TEX8 -derived temperatures either showed the clear seasonality of SST with a few weeks of delay
(e.g. Wuchter et al., 200 ; Mollenhauer et al., 2015), or its flux-weighted mean TEX8 temperature
reflected the ma SST or SST in a specific season without a seasonal pattern (e.g. Yamamoto et al.,
2012; Turich et al., 2013). The delay time or non-seasonality of the TEX8 signal in the sediment trap
was explained by the different season of GDGTs production or enhanced sinking flux of GDGTs. On
the other hand, several trap studies showed that TEX8 -based temperatures in sinking particles
corresponded to the subsurface water temperature (Huguet et al., 2007; McClymont et al., 2012;
Rodrigo-Gámiz et al., 2015; Chen et al., 201 ; Richey and Tierney, 201 ), even though TEX8 is
calibrated to ma SST. This is in a good agreement with other studies, showing that the TEX8
temperature-derived temperature represents the subsurface temperatures in surface sediments of
upwelling regimes (Lee et al., 2008; Lopes dos Santos et al., 2010). Rodrigo-Gámiz et al., (2015) and
Richey and Tierney, (201 ) found the best temperature estimates by applying the TEX8 depth-
integrated (0-200 m) calibration, indicating that most GDGTs are synthesized in upper water columns
including subsurface and, thus, TEX8 record the depth-integrated water temperature.
The covariance between GDGTs and mass fluxes is attributed to the transport mechanism of
GDGTs through the water columns, as GDGTs are incorporated into particles. GDGT fluxes were
enhanced when total mass fluxes peaked (Huguet et al., 2007; Courtney Turich et al., 2013). In the
west North Pacific, the authors suggested that GDGTs are transported by in aggregates with diatom
frustules and lithogenic materials (Yamamoto et al., 2012). In the South of Java and around Cape
Blanc off Northwest Africa, GDGT fluxes had a correlation with opal flux, implying preferential
incorporation with opal-dominated aggregates (Chen et al., 201 ; Mollenhauer et al., 2015).

23
Figure 1.5 Locations of time-series sediment trap studies. Blue dots indicate the previous studies summarized in Table 1.4. Red dots are the trap locations in this thesis.

24
Table 1.4 Summary of TEX8 time-series sediment trap studies.
Study area
Location Deployment period Water depth
Trap depth
calibration thermometry Reference
Latitude Longitude Start End
(° N) (° E) (mm/yyyy) (m) (m)
Arabian Sea 17.2 59.6 Nov/1994 Jan/1996 3,465
500
1500
3000
a Seasonal SST with 1-3 weeks delay
Similar among traps (Wuchter et al. 2006)
Cape Blanc off Mauritania
20.75 -18.7 June/2003 Mar/2007 2,690 1,300 b
Seasonal SST with delay
Similar in the core-top
(Mollenhauer et al., 2015)
Eastern Cariaco Basin
10.5 - 64.667 May/1999 July/2002
May/2000 July/2003
1,400 275 455
b
Seasonal SST
Similar among traps
(Courtney Turich et al., 2013)
Gulf of California 27.883 -111.667 Feb/1996 Feb/1997 700 500 b
No seasonality
Subsurface (below the thermocline) (McClymont et al., 2012)
Gulf of Mexico 27.5 -90.3 Jan/2010 Dec/2013 700 1,150 b
BAYSPAR
c
No seasonality, 0-200 m temperature
Similar in the core top
(Richey and Tierney, 2016)
Iceland 61.996 -16.00 July/2011 June/2012 2,255 1,850
b
b
No seasonality, 0-200 m temperature
Similar in the core top
(Rodrigo-Gámiz et al., 2015)
Mozambique Channel
-16.8 40.8 Oct/2003 Nov/2007 2,500 2,250 b
No seasonality
ma SST (Fallet et al., 2011)
Santa Barbara Basin
34.333 -120.033 Dec/1995 Dec/1997 540 490 a
No seasonality
Subsurface (below 75 m) (Huguet et al., 2007)
South of Java 8.292 108.033 Dec/2001 Nov/2002 2,200 1,400 b
No seasonality
Subsurface (upper thermocline ~50m) (Chen et al., 2016)
Western North Pacific
39.017 147.994 Nov/1997 Aug/1999 5,356
1,366
3,056
4,789
b
b
No seasonality
0-40 m (July-November)
Similar in the core-top
(Yamamoto et al., 2012)
a Schouten et al., (2002) s calibration
b Kim et al., (2010) s calibration
c Tierney and Tingley, (2015) s Bayesian calibration
* Calibrations used for each study can be found in the reference
25
When the TEX8 -derived temperatures reflect seasonality and its signals are delayed with respect
to satellite-derived SST, the delay time can be used to calculate the sinking velocities of particles
containing the relevant lipids. In the Arabian Sea, the TEX8 -derived temperatures resembled the in
situ SSTs with a 1−3 weeks of delay at 500 m depth, resulting in an estimated sinking velocity of
approximately 25−75 m d-1 for the sinking particles (Wuchter et al., 200 b). In a four year time-series
in the filamentous upwelling zone of the Cape Blanc, Northwest Africa, the time lag (>1−3 months)
of the TEX8 signal at 1300 m depth relative to the satellite SST indicated a GDGT sinking velocity
of approximately 9−17 m d-1 (Mollenhauer et al., 2015).
The similar TEX8 values between traps at multiple depths in a given study area and/or in the
underlying surface sediment indicate that TEX8 is not altered significantly during passage throughout
the water column (Wuchter et al., 200 ; Yamamoto et al., 2012; Mollenhauer et al., 2015; Rodrigo-
Gámiz et al., 2015; Richey and Tierney, 201 ; Chen et al., 201 ).
The study of temperature proxies ( U and TEX8 ) in sinking particles contributes to the
understanding of the process and mechanism of past climate changes (Huguet et al., 2007;
McClymont et al., 2012). For instance, the changes of the offset between surface (U ) and subsurface
( TEX8 ) signals allowed the assessment of the relative strength of seasonal upwelling and
stratification in the Last Glacial Maximum and Termination 1 (McClymont et al., 2012).
1.7 Objectives of this thesis
Existing time-series trap studies to date reveal the influence of environmental variables other than
temperature and underline the importance of TEX8 studies in sinking particle. Hence, many more
studies on spatial and temporal compositions and productions of archaeal lipids will be needed to
understand TEX8 thermometry dynamics.
In this sense, this thesis will contribute to broadening the knowledge regarding the seasonality of
GDGTs production, TEX8 thermometry, and its regional environmental impacts on TEX8 in the
Atlantic Ocean. This will shed light on the interpretation of changes in estimated temperatures based
on TEX8 in paleoclimate variability.
The major emphasis of this thesis is given to the following research questions, which are addressed
in the following manuscripts:
1) Do TEX8 signals reflect the temperature seasonality of the region? Does the seasonal
variation of GDGT production affect the TEX8 thermometry?
2) What are the major causes of discrepancies between TEX8 -based temperature estimates
and the satellite-derived SSTs?

26
3) At which depth archaeal lipids and TEX8 signals are originated from?
4) Which processes govern the export of GDGTs from their production zone to deep waters?
The above-mentioned research questions are addressed in three different ocean regimes from the
Atlantic Ocean.
1.8 Materials and analytical techniques
Sediment trap particle samples investigated in this thesis were retrieved from six mooring systems
across the Atlantic Ocean from three distinct oceanic regimes (upwelling regimes, high latitude
regions, oligotrophic system) (Figure 1.5). When there is no comparable data point in underlying
surface sediments from the global TEX8 dataset, additional surface sediments in the respective trap
location were also analysed to compare with the TEX8 signal in sinking particles.
The analytical procedure of samples can be found in the respective sections in each manuscript.
Figure 1. shows the schematic flowchart of the GDGT analysis.
Figure 1.6 Schematic view of the GDGT analysis

27
1.9 Description of own contributions
The sediment trap and surface sediment samples had already been retrieved and stored at MARUM
and AWI when I started my PhD. Surface sediment samples were provided by MARUM.
I conducted all the lipid extractions, and alkenone and GDGT measurements using the GC-FID
and HPLC-APCI-MS with the help of Jens Hefter in the laboratories at the University of Bremen and
Alfred Wegener Institute.
This project was initially designed by Gesine Mollenhauer and developed by myself. I interpreted
all generated data, created all figures and tables, wrote all sections of the manuscripts, with
suggestions and inputs from all the co-authors. Gesine Mollenhauer dedicated to the interpretation of
TEX8 signal in all manuscripts (in Manuscript II, III, IV, V). Gerhard Fischer (in Manuscript II, III,
IV) and Morten H. Iversen (in Manuscript III) contributed to the parts of sinking mechanisms of
particles. Eva-Maria Nöthig and Simon Ramondenc helped to describe the oceanographical setting
and to interpret the data in the Fram Strait (in Manuscript III).
1.10 Outline of the thesis
The study of GDGT flux and TEX8 thermometry from the Atlantic Ocean is addressed in four
manuscripts (Chapters 2-4) which are published, submitted or in preparation for publication in peer-
reviewed journals. To answer the objectives mentioned above, each manuscript deals with each
distinct oceanic regime; the first manuscript discusses in the eastern Atlantic upwelling regimes (the
equatorial Guinea Basin and Lüderitz off Namibia; Chapter 2), second manuscript in high latitude
regions (the eastern Fram Strait and Antarctic Polar Front; Chapter 3), and third manuscript in the
south Atlantic oligotrophic system (in the central Brazil Basin; Chapter 4). In the last manuscript
(Chapter 5), the U -derived temperatures in all trap locations where GDGT based temperatures are
discussed in previous chapters are investigated.

28

29
CHAPTER 2
TEX in sinking particles
in three eastern Atlantic upwelling regimes
Organic Geochemistry (Park et al., 2018)
Vol. 124 (2018), pages 151-1 3. doi: https://doi.org/10.101 /j.orggeochem.2018.07.015
© 2018 Elsevier Ltd. All rights reserved

30
2 Manuscript I
TEX86 in sinking particles in three eastern Atlantic upwelling
regimes
Eunmi Parka,b,c,*
, Jens Heftera, Gerhard Fischer
b,c, Gesine Mollenhauer
a,b,c
a Alfred Wegener Institute, Helmholtz Center for Polar and Marine Research, D-27570 Bremerhaven,
Germany b MARUM Centre for Marine Environmental Sciences, University of Bremen, D-28334 Bremen,
Germany c Department of Geosciences, University of Bremen, D-28334 Bremen, Germany
*Corresponding author ([email protected])
Abstract
Seasonal variations in fluxes of isoprenoid glycerol dialkyl glycerol tetraethers (GDGTs) and the
estimated temperatures based on TEX8 are examined in sinking particles collected using moored
sediment traps in the eastern Atlantic upwelling regions. In the equatorial Guinea Basin, GDGT fluxes
show a correlation with opal fluxes, implying that GDGTs are mainly transported via aggregation with
diatoms. The Flux-weighted mean TEX8 H temperatures derived from particles collected both at 853 m
and 3,921 m depth correspond to the water temperature (24.1 °C) of ca. 50 m depth, where nitrate
concentration starts to increase. This suggests that nutrient concentrations may affect the depth habitat
of Thaumarchaeota, thereby influencing the TEX8 derived water temperatures. In the coastal
upwelling off Namibia, TEX8 H temperatures are similar to satellite-derived sea surface temperature
(SST) during the warm season, but the record derived from the trap is delayed relative to the SST by
approximately 2 days. Warm biases, however, occur during the cold season. Higher TEX8 values
have been found within the oxygen minimum zones (OMZs) in the water column of coastal upwelling
regions. Thus, contributions from GDGTs produced in OMZs might explain the warmer temperature
estimates during the cold season in regions, where OMZs are pronounced. This scenario could explain
the observed warm bias off Namibia. We, therefore, suggest that in the eastern Atlantic upwelling
systems, nutrient depth distribution and GDGTs produced in OMZs can be potential environmental
factors influencing TEX8 in sinking particles. In paleoenvironmental records of TEX8 , non-thermal
signals have to be considered on regional scales.
2.1 Introduction
The TEX8 is a temperature proxy based on the relative abundance of glycerol dialkyl glycerol
tetraethers (GDGT) mainly synthesized by marine planktonic Thaumarchaeota, which are known as
31
chemoautotrophic ammonia-oxidizers in the ocean (e.g. Karner et al., 2001; Schouten et al., 2002;
Sinninghe Damsté et al., 2002). Since the original linear calibration between TEX8 index and SST
(Schouten et al., 2002), several modified and, partly, non-linear TEX8 calibrations have been
suggested with expanded data sets to minimize the uncertainty of the global calibration and give the
best absolute temperature estimates (Kim et al., 2008; Liu et al., 2009). Dedicated and logarithmic
calibrations for low (<15 °C) and high (>5 °C) temperature regions, TEX8 L and TEX8
H , respectively,
were suggested by Kim et al., (2010) and for 0-200 m water depth-integrated temperature by Kim et
al., (2012). In the BAYSPAR approach using Bayesian statistics and allowing for spatial variability of
TEX8 responding to temperature, SST and 0-200 m depth-integrated temperature calibrations were
developed (Tierney and Tingley, 2015).
Despite the availability of various TEX8 calibrations and extensive applications in marine
sediments (e.g., Lopes dos Santos et al., 2010; Rommerskirchen et al., 2011; McClymont et al., 2012;
Hertzberg et al., 2015), many issues regarding (i) the mechanisms leading to the export of GDGTs to
the deep oceans, (ii) the water depth and the seasonality of GDGT production, (iii) the contribution of
different archaeal groups, and (iv) additional factors like nutrient or oxygen concentrations other than
temperature influencing the proxy signals (Hurley et al., 201 ; Lincoln et al., 2014; Qin et al., 2015;
Turich et al., 2007; Wuchter et al., 2005) are still discussed.
Several studies on sinking particles collected by sediment traps reveal a correlation between
GDGT concentrations and biogenic components in sinking particles, confirming that particles rich in
organic matter are the major transport mechanisms for lipids (Chen et al., 201 ; Huguet et al., 2007;
Mollenhauer et al., 2015; Yamamoto et al., 2012). It appears that the lipids are aggregated or packed
into larger particles and subsequently exported to deep waters and buried in the sediment.
Additionally, the sinking rate depends on the dominant type of particles that the lipids are
preferentially attached to. Even when there is no clear correlation between GDGTs and organic matter
fluxes, TEX8 H temperatures derived from sinking particles nevertheless correspond to the measured
sea surface temperatures in the Cariaco Basin (Courtney Turich et al., 2013) and in the Gulf of
Mexico (Richey and Tierney, 201 ). The complexity of the sinking process of lipids and the transfer
of its signal to the deep ocean require further investigation.
It has been reported that Thaumarchaeota reach their maximum abundance near 200 m water depth
(Church et al., 2010; Hurley et al., 201 ; Karner et al., 2001; Santoro et al., 2010), and enhanced
GDGT production has been revealed in the subsurface oceans (Ingalls et al., 200 ; Pearson et al.,
2001; Shah et al., 2008). This supports the idea that Thaumarchaeota record the water temperature of
the depth where they mainly dwell. Especially in many upwelling settings, TEX8 H estimates reflected
subsurface temperatures (Chen et al., 201 ; Kim et al., 2012b; Lopes dos Santos et al., 2010;
McClymont et al., 2012; Richey and Tierney, 201 ).
32
Non-thermal environmental factors influencing TEX8 thermometry have been reported elsewhere.
Higher TEX8 values than expected from ambient or surface temperatures are found in OMZs in
water column studies (Basse et al., 2014; Schouten et al., 2012b; Xie et al., 2014; Qin et al. 2015),
suggesting a typical warm bias of TEX8 -derived water temperatures under oxygen limitation. Hurley
et al., (201 ) recently showed that GDGT cyclization of Nitrosopumilus maritimus SCM1 in a culture
experiment is enhanced when the ammonia oxidation rate is low, resulting in higher TEX8 signals in
response to energy stress. Zhang et al. (201 ) proposed an indicator, the Ring Index (RI), of potential
non-thermal impacts of TEX8 , such as terrestrial input, contributions of GDGTs from non-planktonic
Thaumarchaeota, nutrient, and/or dissolved oxygen levels. It is suggested that non-thermal effects on
GDGT composition have occurred when the RI values, the weighted average of ring number of
GDGTs, deviate from the typical TEX8 and RI relationship as observed in the modern ocean. It is
important to understand the potential factors determining the TEX8 proxy in different oceanic realms
in order to obtain reliable paleoenvironmental reconstructions. Samples of sinking particles collected
by sediment traps can be of great value to study the proxy signal, resolving its seasonal and vertical
variability.
Here we present TEX8 values in sinking particles collected in sediment traps deployed in eastern
Atlantic upwelling systems, i.e., in the Guinea Basin within a region of equatorial upwelling activity
(GBN3), and off Namibia within the Benguela coastal upwelling system near Lüderitz (LZ). We focus
on high productivity settings, as they are often chosen for palaeoceanographic studies, yielding high-
resolution sediment archives. Our results are compared to the sediment trap record from the eutrophic
coastal upwelling system in Cape Blanc off Mauritania (CBeu; Mollenhauer et al., 2015).
2.2 Oceanographic setting
In the Eastern Atlantic Ocean, upwelling of nutrient rich-water masses resulting in high primary
productivity occurs either along the coasts (coastal upwelling), or in the open ocean of the equatorial
divergence zone (equatorial upwelling). The prevailing trade wind systems are responsible for
upwelling in both types of settings. The north-easterly (NE) and south-easterly (SE) trade winds drive
the Canary Current (CC) and the Benguela Current (BC), respectively, along the northwest and
southwest African coasts, (Figure 2.1). Those two coastal upwelling systems belong to the four major
Eastern Boundary Upwelling Ecosystems (EBUEs), which are well known for their highly productive
ecosystems and their contribution to global primary production (Carr, 2002; Carr and Kearns, 2003;
Shannon and Nelson, 199 ).
The Intertropical Convergence Zone (ITCZ), where the NE and SE trade winds converge near the
equator, is displaced to the North in response to the seasonal changes in trade winds and land
configuration (Figure 2.1). During boreal summer (June - September), the SE trades are most strongly

33
developed and push the ITCZ to its northernmost location (10−15° N). This stimulates the South
Equatorial Current (SEC) and maximum eastward advection of the North Equatorial Counter current
(NECC), causing equatorial upwelling peaks and thermocline shoaling in the Guinea Basin. When the
NE trades are most intense and the SE trades are weakened during boreal winter, the ITCZ is pushed
to its southernmost location.
Figure 2.1 Location of GBN3, LZ, and CBeu sediment traps in the eastern Atlantic Ocean in context to the
main current systems. The Canary Current and the Benguela Current induced by the trade winds lead the
coastal upwelling along the northwest and southwest Africa, respectively, which belong to the four major
Eastern Boundary Upwelling Ecosystems (EBUEs) in the world ocean. NEC and SEC represent the North
and South Equatorial Currents. NECC represents the North Equatorial Counter Current. Dashed lines indicate
the seasonal position of Inter Tropic Convergence Zone (ITCZ). The background ocean color map is shown
for June 2004, displaying high chlorophyll-a concentrations near the trap locations. The Ocean Color Climate
Change Initiative dataset, version 3.1, European Space Agency, available online at http://www.esa-
oceancolour-cci.org/ was used. The map was produced using Ocean Data View (Schlitzer, 2017).
In the Guinea Basin, satellite SST reaches minimum values of approximately 24−25 °C, and
chlorophyll-a and primary production are at their maximum between 0−20° W, and 0−10° S (Pérez et
al., 2005). Except for this maximum production period, this region remains in a typical tropical
condition characterized by a nutrient-depleted mixed layer and a stable thermocline of approximately
30−40 m depth (Lange et al., 1994). The maximum SST reaches 29 °C during boreal winter. This

34
region is characterized as “open ocean with moderate coastal influence” due to the presence of non-
marine (fresh water) diatoms and enhanced lithogenic materials during boreal winter, which might be
supplied by the Saharan dust plume (Lange et al., 1998).
We compare this equatorial upwelling setting with the Benguela coastal upwelling system off
Namibia. Like the coastal upwelling off Cape Blanc, this upwelling area is active year-round with
seasonally changing intensity. The BC flows northwards along the western coast of South Africa and
causes strong coastal upwelling which is additionally strengthened by the south-easterly trade wind-
driven Ekman transport, supplying cold and nutrient-rich South Atlantic Central Water (Shannon and
Nelson, 199 ) (Figure 2.1). The intense year-round trade winds induce perennial upwelling in the
northern part of the BC system, in particular near Lüderitz (2 ° S), while upwelling is the strongest in
austral spring and summer in the southern part of the system (Shannon and Nelson, 199 ). The BC
system with 0.37 Gt C/y is the most productive of the EBUEs followed by the CC system (0.33 Gt
C/y) (Carr, 2002). A TOC maximum in surface sediments was found on the shelf off Lüderitz within
the BC system (Mollenhauer et al., 2002).
Associated with the high productivity, oxygen minimum layers have been recorded in the
Benguela system (Brüchert et al., 2003; Chapman and Shannon, 1987; Inthorn et al., 200 b; Monteiro
et al., 2011, 200 ). The seasonally oxygen depleted waters are developed mainly in austral summer
and autumn at around 200 m depth (150−400 m) over the shelf region (Brüchert et al., 2003;
Kalvelage et al., 2011). The seasonal variability of water temperature within the OMZs is ca. 1 °C at a
given depth. Monteiro et al., (200 ) reported year-round low-oxygen water (< 0.5 ml l-1) in 2000-2001
caused by a greater contribution of the Eastern Tropical-South Atlantic Central Water (ET-SACW),
which is characterized by strong hypoxia, rather than the Cape Basin-South Atlantic Central Water
(CB-SACW), which is better ventilated. The oceanographic dynamics in the central Benguela are
related to the relative contribution of the poleward ET-SACW and northward CB-SACW, which form
the sub-thermocline boundary near 25° S off Namibia, (Monteiro et al., 2008, 200 ).
2.3 Material and methods
2.3.1 Samples
Sediment trap moorings were deployed in the Guinea Basin (GBN3 at 1.8000° N, 11.1303° W,
4,481 m water depth) and off Lüderitz in the vicinity of the Lüderitz upwelling cell (LZ1 and LZ2 at
25.279° S. 13.052° E, 1,795 m depth) (Figure 2.1, Table 2.1). The GBN3 trap was deployed between
March 1989 and March 1990 at 853 m and 3,921 m water depths. Each LZ trap deployment period
covered months. The last cup from the LZ1 deployment is excluded from the data sets, due to
problems during trap servicing. In the LZ2 trap, particles were collected only in the first 4 sample
bottles (mid-August to mid-September, 2000), while the remaining bottles were almost empty in spite

35
of correct functioning of the sediment trap programming. Exact sampling periods and locations of the
sediment traps are summarized in Table 2.1. Additionally, a core-top sediment (GeoB1405-8; 1.78 7°
N, 11.14° W) recovered near the GBN3 trap site was analyzed.
Table 2.1 Trap names, locations, deployment depths and periods and sampling intervals.
Name
Location Water depth
Trap deployment -depth
Deployment period Sampling interval
Latitude (° N)
Longitude (° E)
Start End
(m) (m) (dd.mm.yyyy) (d)
GBN3 1.8000 -11.1333 4,481 853/ 3,921 01.03.89 16.03.90 19
LZ1 -25.279 13.052
1,795 960 17.02.00 09.08.00 8.5, 13.5
LZ2 1,800 965 11.08.00 28.01.01 8.5
CBeu* 20.75 -18.7 2,690 1,296 15.07.03 23.03.07 7.5-23
* GDGT fractional abundances and TEX86 values for site CBeu were published by Mollenhauer et al., (2015)
Cone-shaped sediment traps (Kiel type) with a collection area of 0.5 m2 were deployed for the
collection of sinking particles. Each trap was equipped with 20 cups, poisoned with mercury chloride
(HgCl2) before and after the deployment. The opening period of each cup was programmed before
launching the mooring system. Materials were stored at 4 °C until further processing after servicing
the trap. After recovery, wet samples were sieved (1 mm) to remove large particles, and swimmers
were manually removed with tweezers. Samples were split (4–5 times) using a McLane wet samples
at the University of Bremen and freeze-dried and homogenized afterwards. Prior to lipid analysis,
samples were sealed and stored in the dark at room temperature. More details can be found in Wefer
and Fischer (1993).
2.3.2 Mass fluxes
Samples of sinking particles collected with the sediment traps were weighed and analyzed for their
geochemical composition. Total organic carbon (TOC) and total nitrogen (TN) contents were
measured with a Heraeus CHN element analyzer. TOC content was determined after decalcifying the
samples with N hydrochloric acid (HCl) and drying them on a hot plate at 80 °C. Calcium carbonate
(carbonate) was estimated from the differences between non-decalcified and decalcified CHN
analyzer measurements as carbonate = (total carbon – organic carbon) x 8.33. Biogenic opal was
determined using a sequential leaching technique (Müller and Schneider, 1993). The flux of lithogenic
material was calculated from total mass flux – (2 x organic carbon + carbonate + opal). Total mass

36
flux, TOC, TN, carbonate, opal, and lithogenic material fluxes for site GBN3 were reported by Wefer
and Fischer (1993). Data from CBeu were shown in Mollenhauer et al., (2015).
2.3.3 Lipid analysis
Lipids were extracted from freeze-dried and homogenized samples (approximately 4-318 mg) with
dichloromethane (DCM): methanol (MeOH) 9:1 (v/v) solvent using an ultrasonic bath for 10 min. The
procedure was repeated three times. The extract was saponified at 80 °C for two hours with 0.1 M
potassium hydroxide (KOH) in MeOH and purified water (9:1) from a Seralpur system extracted with
DCM. Neutral lipids were recovered by partitioning into 1 mL hexane (Hex) (×3). This aliquot was
separated into F1 (apolar), F2 (ketone), and F3 (polar) fractions eluted in 2 mL Hex, 4 mL DCM: Hex
2:1 (v/v), and 4 mL DCM: MeOH 9:1 (v/v), respectively, through a silica-gel column (deactivated
with 1% distilled water, mesh size: 70−230 mm, length: 4 cm) prepared in a Pasteur pipette. To
quantify GDGTs, known amounts (1µg for GBN3 and 5 µg for LZ) of an internal standard (C-4
GDGT) were added to each sample before the extraction.
Polar fractions (F3) for GDGTs were filtered through 0.45 µm pore size polytetrafluoroethylene
(PTFE) syringe filters and diluted to 2 mg ml-1 concentrations in Hex: isopropanol 99:1 (v/v)
according to Hopmans et al. (2000). GDGTs were analyzed using high performance liquid
chromatography/atmospheric pressure chemical ionization-mass spectrometry (HPLC/APCI-MS) as
described by Meyer et al., (201 ). GDGT flux was calculated as the sum of GDGTs used to calculate
the TEX8 value.
The TEX8 / TEX8 H values were calculated according to Schouten et al. (2002, eq. 1) and Kim et
al. (2010, eq. 2):
TEX8 = ([GDGT-2] + [GDGT-3] + [Cren´]) / ([GDGT-1] + [GDGT-2] + [GDGT-3] + [Cren´]) (1)
TEX8 H = Log10 (TEX8 ) (2)
,where the numbers indicate the number of cyclopentane moieties (GDGT-1-3) in the isoprenoid
GDGTs, and Cren´ means the regio-isomer of Crenarchaeol containing 4 cyclopentane moieties and 1
cyclohexane moiety. When each bracket represents the relative abundance of individual GDGT in the
GDGT pool (eq. 3), the Ring Index (RI) was calculated as follows (eq. 4; Zhang et al., 201 ):
[GDGT-0] + [GDGT-1] + [GDGT-2] + [GDGT-3] + [Cren] + [Cren´] = 100% (3)
RI = 0 × [GDGT-0] + 1 × [GDGT-1] + 2 × [GDGT-2] + 3 × [GDGT-3] + 4 × [Cren] + 4 × [Cren´] (4)
Temperatures were calculated using the following TEX8 calibrations (Kim et al. 2010; 2012):
T = 8.4 × TEX8 H + 38. (5)

37
T = 54.7 × TEX8 H + 30.7 ( )
,which were suggested for regions with SSTs above 15 °C for SST (eq. 5) and for water depth of 0-
200 m (eq. ), respectively. Additionally, the BAYSPAR SST and subsurface temperature (SubT)
calibrations were applied with the standard prediction mode and the default settings (Tierney and
Tingley, 2015).
The standard deviation of replicate analyses of a lab-internal sediment standard is ± 0.01 units of
TEX8 , corresponding to an uncertainty of ± 0. 0 °C in the estimated temperatures based on the
TEX8 H calibration (Kim et al., 2010), and % for isoprenoid GDGT concentrations.
2.3.4 Environmental data
To compare the estimated SSTs based on TEX8 H and BAYSPAR, Advanced Very High Resolution
Radiometer (AVHRR) satellite-derived SSTs (http://www.ncdc.noaa.gov/oisst) were extracted and re-
averaged according to the sampling periods. The satellite-derived SSTs have a spatial grid resolution
of 0.25 degree and temporal resolution of 1 day. We also compare the seasonal and mean annual depth
profile of water temperature and nitrate (NO ) concentration in the vicinity of the trap locations
extracted from the World Ocean Atlas 2013 (WOA13), representing the average value for the period
from 1955 to 2012 (Garcia et al., 2013; Locarnini et al., 2013). The resolutions of WOA13 are 0.25
degree for temperature and 1 degree for nutrients. We used a definition of seasons according to
WOA13 (i.e. boreal winter/austral summer: January−March, spring/autumn: April−June,
summer/winter: July−September, autumn/spring: October−December; Garcia et al., 2013; Locarnini et
al., 2013).
2.4 Results
2.4.1 Sinking particles in the northern Guinea Basin (GBN3)
2.4.1.1 TEX8 thermometry
TEX8 varied in the range 0.59−0. 7 and 0. 0−0. 2 at the shallow and deep traps, respectively
(Figure 2.2). The seasonality in the estimated temperatures based on TEX8 H was similar to SST
changes at the shallow trap while there was no clear seasonality at the deep trap (Figure 2.2). The
Flux-weighted mean TEX8 values over the study period were identical at both depths with a value of
0. 1 (Table 2.2).
BAYSPAR SST temperatures ranged from 25.3 to 32.3 °C and from 2 .5 to 28.2 °C at the shallow
and the deep traps, respectively. The estimated temperatures were higher than the satellite-derived
SST from July to September 1989 at both depths, and the strongest overestimation of BAYSPAR SST
compared to the satellite-derived SST occurred from November 1989 to March 1990 at the shallow

38
trap. BAYSPAR SubT (proposed to reflect weighted averages of 0-200 m water depth) estimates of
17.4-23.1 °C at the shallow trap and 18.4−19.7 °C at the deep trap resembled the estimates obtained
with the TEX8 H 0-200 m depth-integrated calibration (18.0−21.2 °C at the shallow trap and
18.7−19.5 °C at the deep trap) (Table 2.2, Figure 2.2).
RI values ranged from 2.19 to 2.5 and from 2.03 to 2.29 at the shallow and deep traps,
respectively (Figure 2.3). Most values of TEX8 -RI from both depth traps reside well within the 95%
prediction intervals of global TEX8 -RI correlation, except for one sample collected in September
1989 (Figure 2.3).
2.4.1.2 Mass and GDGT fluxes
Between March 1989 and March 1990, seasonal mass fluxes at the shallow trap (853 m) in the
Guinea Basin were highest in boreal summer (240.5 mg m-2 d
-1 in August−September 1989) and in
spring (197.5 mg m-2 d
-1 in March 1989) (Figure 2.2). The deep trap (3,921 m) recorded similar peaks
of mass fluxes occurring in March and September 1989, but the fluxes were significantly higher than
those at the shallow trap. Over the entire trap deployment period, the fluxes of GDGT were higher in
the deep trap (0.15−0.73 µg m-2 d
-1) than in the shallow trap (0.01−0.38 µg m
-2 d
-1) (Figure 2.2). The
GDGT fluxes were correlated with opal fluxes (R2 = 0.71 for the shallow trap, R
2 = 0. 2 for the deep
trap) when episodic GDGT pulses in late-October and late-December 1989 at the shallow trap and
January−March 1990 at the deep trap were excluded in the correlations (Figure 2.2).
2.4.2 Sinking particles in the Benguela area off Namibia (LZ)
2.4.2.1 TEX8 thermometry
TEX8 values ranged from 0.47 to 0.54 in the Benguela upwelling region (Figure 2.4). TEX8 H
temperatures decreased from mid-February (20.0 °C) to early-June (1 .4 °C), and increased to 19.2 °C
in the remaining period while the satellite-derived SSTs decreased continuously from February to
September. The BAYSPAR SST showed similar temperature trends as obtained from the TEX8 H
calibration, varying between 1 .3 and 20.9 °C. The BAYSPAR SubT estimates ranged between 12.
and 1 .9 °C, which also had similar trends as obtained from TEX8 H 0-200 m depth-integrated
calibrations, but the amplitude of BAYSPAR temperature variations was higher (Figure 2.4).
RI values ranged from 1.70 to 1.97. Two samples collected in early and late May 2009 and four
samples collected between early-August and mid-September 2009 are out of the 95% prediction
intervals of TEX8 -RI global correlation (Figure 2.3).

39
Figure 2.2 Changes in (a) estimated temperatures for SST, (b) estimated 0-200 m depth-integrated temperatures, (c) GDGT flux and TEX8 and (d) mass flux and the
correlation of the fluxes between GDGT and opal at 853 m (left panel) and at 3921 m (right panel) water depth in the Guinea Basin (GBN3).

40
Table 2.2 Values of TEX8 (Flux-weighted mean values for trap time-series data) and estimated temperatures
at GBN3 and LZ.
Region
Material Location Estimated temperature (°C)
Latitude (° N)
Longitude (° E)
(1)
BAYSPAR(2)
SST 0-200m
SST 0-200m
Guinea Basin
GBN3 (853 m) sinking particles
1.8000 -11.1333
0.61 24.1 19.1 27.7 19.3
GBN3 (3,921 m) 0.61 24.1 19.1 27.6 19.3
GeoB1405-8 core-top sediment
1.7867 -11.14 0.57 21.7 17.2 23.8 16.0
Lüderitz LZ (960 m) sinking particles
-25.279 13.052 0.50 18.3 14.5 18.6 14.8
(1) temperatures are calculated by the
calibration for SST from Kim et al. (2010) and by the
0-200m depth-integrated calibration from Kim et al., (2012).
(2) temperatures are calculated by the Bayspar calibrations for SST and 0-200m depth-integrated temperature (Tierney and Tingley, 2015).
Figure 2.3 (a) Correlation between TEX86 and Ring index (RI) modified after Zhang et al., (2016). The grey,
blue, green and black empty circles represent the global ocean core-top points, GBN3, LZ, and CBeu trap
samples, respectively. (b) “RI sample − RI calculated” represents the difference of RI between the original sample
value and the calculated value based on the relationship of TEX86-RI in the global ocean by Zhang et al.,
(2016). TEX86 between two horizontal blue lines on (b) displays thermal signal, while samples located
outside of the lines possess non-thermal factors on TEX86 values.

41
2.4.2.2 Mass and GDGT fluxes
In the Benguela upwelling area off Lüderitz, mass fluxes ranged from 0 to 788 mg m-2 d
-1 (Figure
2.4) with multiple peaks in February−May and August. The maximum in mass fluxes occurred in mid-
May when opal and carbonate fluxes were enhanced. Carbonate fluxes mostly accounted for 2 −78%
of mass fluxes, but for only 9% when lithogenic flux was pronounced in early May. Between mid-
August and mid-September, the relative proportion of opal to mass flux was higher than the one of
carbonate. The seasonal variability of fluxes in TOC and TN was similar to the one of carbonate
fluxes, but both accounted for only 5−15% and 1−3% of mass fluxes, respectively. The GDGT fluxes
were not correlated to any of the biogenic fluxes due to maxima in different seasons. The flux of
GDGTs varied between 0.41 and 4.2 µg m-2 d
-1, with two maxima in mid-April (3.9 µg m
-2 d
-1) and
late-May (4.2 µg m-2 d
-1) (Figure 2.4).
Figure 2.4 Changes in (a) estimated temperatures for SST, (b) estimated 0-200 m depth-integrated
temperatures, (c) GDGT flux and TEX8 , and (d) mass flux at 960 m water depth in the Lüderitz bay (LZ) off
Namibia on the left panel. The vertical dashed line represents the end of LZ1 trap and the start of the LZ2
trap. TEX8 H signals in the trap between mid-February and early-June (right panel, a) have a good match with
satellite-derived SSTs between mid-January and early-May when a 26 days delay time is considered (right
panel b). Depth profile of temperature measured by a Seabird sensor during the 64PE174 MARE-3 cruise at
the trap location and seasonal depth profile of temperature extracted from WOA13 in the Lüderitz are
presented on the right bottom panel. No temperatures are available in April−June of WOA13.

42
2.5 Discussion
2.5.1 TEX8 -RI correlation
The TEX8 values were plotted against the RI values measured from GBN3 and LZ as well as
from NW Africa (Mollenhauer et al., 2015) on the global TEX8 -RI regression (Figure 2.3a; Zhang et
al., 201 ). The TEX8 values were also plotted against the differences between the sample´s original
RI values and calculated ones based on the global TEX8 -RI regression (RIsample−RIcalculated, ∆RI;
Figure 2.3b). Most trap samples fell within the 95% prediction intervals, but some samples had offsets
greater than 0.3 of │∆RI│, which was suggested as an indicator of non-thermal factors (Zhang et al.,
201 ). One sample collected in September 1989 at the lower trap of GBN3 fell outside the area
controlled by thermal factors (Figure 2.3b). Two samples in May 2000 and four consecutive samples
in between mid-August and mid-September 2000 from LZ had offsets (Figure 2.3b). Four samples in
CBeu were found outside the range of thermal factors; one sample collected in late-June 2003 with
│∆RI│ = 0.49 of and three samples collected in between mid-April and mid-May 2005, late-
September and late-October 2005, and early-July and late-July 200 with up to │∆RI│= 1. 8 of
(Figure 2.3). It appears that larger ∆RI do not systematically occur during a specific season. The
samples from CBeu (within the 95% confidence intervals of the global regression) contained 19-35%
GDGT-0 of total GDGTs. By contrast, those samples with low ring index values falling far off the
global regression were attributed to relative abundances of >80% of GDGT-0 (Mollenhauer et al.,
2015). Such a large proportion of GDGT-0 can be explained by GDGTs produced by methanogenic
archaea (Weijers et al., 2011). The influence of methanogenic archaea on GDGT pools can be
screened by the relative abundance of GDGT-0 to the sum of GDGT-0 and Crenarchaeol, represented
by the %GDGT-0 index (Inglis et al., 2015). The %GDGT-0 values of samples with deviated ∆RI
from CBeu were 85−87%, which exceeded 7% indicating the influence of methanogenic archaea,
while the index values of the remaining samples ranged between 24−42%. However, it seems unlikely
that methanogens thrive in the water column of the open ocean. The question also arises why such
events occurred randomly only in a very short term (e.g. only within the collection time of one sample
cup). Thus, the origin of these high GDGT-0 abundances remains unclear at this stage. Mollenhauer et
al., (2015) suggested a potential contribution of GDGTs derived from subsurface communities at site
CBeu, but predominantly during the upwelling season. Moreover, the authors pointed out that higher
TEX8 values could be caused by GDGTs produced in the OMZs, where Basse et al., (2014) found
high TEX8 values within suspended particles.
The above analysis showed that non-thermal effects are not directly obvious by using the TEX8 -
RI relationship. Therefore, in the following sections we discuss TEX8 H -derived temperature estimates
and the possible non-thermal factors on GDGT distributions. We investigate GDGT fluxes and indices
in the Guinea Basin characterized by equatorial upwelling and the Benguela coastal upwelling system

43
off Namibia and consider the respective regional conditions. This discussion includes implications for
TEX8 H observed in the eastern Atlantic upwelling settings.
2.5.2 Equatorial upwelling: Guinea Basin (GBN3)
In the Guinea Basin, the GDGT fluxes at the shallow GBN3 trap had multiple peaks in March,
July−late-August, late-October, and December 1989 (Figure 2.2). The maxima of GDGT and mass
fluxes in boreal spring and summer are associated with input of Saharan dust (lithogenic components)
and seasonal upwelling, respectively (Wefer and Fischer, 1993; Figure 2.2). These seasonal maxima in
GDGT and mass fluxes also occurred at the deep trap with less pronounced seasonality throughout the
trap deployment period. No clear correlation was found between the fluxes of GDGTs and biogenic
components at neither the shallow nor deep traps when all samples were considered. Surprisingly, the
correlation between the fluxes of GDGTs and opal appeared to be better when two or three episodic
GDGTs pulses at both depths were excluded (Figure 2.2; R2 = 0.71 for the shallow trap, R
2 = 0. 2 for
the deep trap). This is in good agreement with other studies which showed good correlations between
GDGTs and biogenic components fluxes in sinking particles in different environmental regimes (e.g.,
in the South of Java (Chen et al., 201 ), off Cape Blanc (Mollenhauer et al., 2015), and in the western
North Pacific (Yamamoto et al., 2012)). Based on those correlations it was suggested that GDGTs are
primarily aggregated into opal dominant particles and exported to deep waters.
Opal is primarily contributed by diatoms to the sediment of the pelagic ocean by the formation and
sinking of marine snow aggregates and zooplankton faecal pellets from the upper ocean (Ploug et al.,
2008a). Diatoms and silicoflagellates are the most abundant groups of opal producing organisms in
the Guinea Basin (Lange et al., 1994; Treppke et al., 199 ). Diatoms release extracellular polymer
substances which promote the formation of marine snow particles (Thornton, 2002). Planktonic
Archaea that are very small (<1 µm) and neutrally buoyant can only sink and be buried in sediments
when aggregated or packed into larger particles, similar to diatoms (Schouten et al., 2013). Indeed,
Wuchter et al., (2005) found TEX8 temperatures resembling water temperatures exclusively in upper
oceans (<100 m), implying a rapid sinking of GDGTs by aggregation and packaging. As mentioned
earlier, this sinking mechanism of GDGTs has been reflected in good correlations between GDGT and
opal fluxes in sinking particles. Therefore, our results support the idea that most GDGTs in the Guinea
Basin are transported to the deep sea by packaging into opal-rich particles. The episodic GDGT
pulses, which were not closely related to opal flux peaks, occurred in late-October and late-December
1989 at the shallow and in early 1990 at the deep trap. This might have been a consequence of
enhanced GDGT production during periods of relatively lower primary production when there is no
competition with phytoplankton for ammonia (Herfort et al., 2007; Pitcher et al., 2011; Wuchter et al.,
200 a). However, the export mechanism of GDGTs during these times remains unresolved.

44
The relatively low mass and GDGT fluxes at the shallow trap could be due to the low sampling
efficiency of the trap in the upper water column where the current velocities are generally higher than
in the deeper water column (Figure 2.2). However, the current velocities measured at 905 m and 39 0
m water depth varied around 15−20 cm s-1 at both depths (Wefer and Fischer, 1993). The sampling
efficiency therefore might be similar at both depth levels. A more plausible explanation is that the
deeper trap represents a larger source area, resulting in a higher organic material flux and a smoothed
seasonal variability compared to the shallower trap (Wuchter et al., 200 b). This is supported by the
observation of higher summer fluxes only north of the equator related to the oceanographic setting
(e.g. the equatorial divergence) and increased fluxes of lithogenic materials with depth originating
from topographic elevation in the Guinea Basin (Fischer and Wefer, 199 ).
For temperature estimations, neither TEX8 H nor BAYSPAR SST was successful in reproducing
SST. TEX8 H -derived temperatures were colder and BAYSPAR temperatures were warmer than the
satellite-derived SSTs (Figure 2.2). However, both depth-integrated calibrations based on TEX8 H 0-
200 m and BAYSPAR SubT yielded realistic subsurface temperatures (Table 2.1, Figure 2.2). Given
the fact that the BAYSPAR model takes calibration factors from the existing data near the study area,
it is surprising that BASYPAR SubT displayed rather realistic subsurface temperatures although there
are hardly any calibration points near the GBN3 trap site. However, considering that subsurface
temperatures are less variable spatially and temporally compared to SST, it is expectable that depth-
integrated calibrations generate more reasonable temperatures compared to SST calibrations
irrespective of the number of core top data points in the vicinity of a study site.
The decreasing trend in TEX8 H temperatures from March until early-September followed by an
increase starting from late October at the shallow trap was similar to the satellite-derived SST
variations (Figure 2.2). Due to the time required for GDGTs to become entrained into larger sinking
particles, and subsequent transportation to deep waters, TEX8 variations are often delayed relative to
the satellite-derived temperature variations (Ingalls et al., 2012; Mollenhauer et al., 2015; Wuchter et
al., 2005; Yamamoto et al., 2012). The absence of a notable time-lag indicates shorter residence time
(Ingalls et al., 2012) and faster transportation of core lipids in the water column here than in other
settings. Fischer and Karakaş, (2009) found that sinking rates are relatively high in the eastern
equatorial Atlantic and off NW Africa. Although these sinking rates are calculated based on the time
delay of flux maxima between two traps and do not represent the sinking velocity in surface waters,
this scenario explains particles tending to be transferred rapidly to the shallower trap of GBN3
(Fischer and Karakaş, 2009). Together with the high sinking rate of particles, 19 days of sample
resolution might be too long to record a time shift of the TEX8 signal. Taking 19 days of sample
resolution as a maximum travel time, and the travel distance between the depths of origin of the
45
TEX8 signal (50 m; see the discussion below) and the trap (853 m), the minimum sinking rate of
particles containing GDGTs is 42 m d-1 ((853 – 50) m / 19 days) in the Guinea Basin.
TEX8 H temperatures at the deep trap varied only by approximately 2 °C (22. −24. °C), which is
less than the temperature amplitude reconstructed from the shallow trap samples (22.7−2 .7 °C)
(Figure 2.2). Compared with higher fluxes and less pronounced seasonality of mass and GDGT fluxes
at the deep trap relative to the shallow one, the deep trap records a homogenized signal and integrates
sinking particles transported from a wide range of areas and long-time scales, comparable to finding
in the Arabian Sea (Wuchter et al., 200 b). Thus, a larger catchment area can explain the smaller
amplitude of estimated temperatures as well as higher mass and GDGTs fluxes at the deeper trap in
the Guinea Basin.
In order to investigate a possible sub-surface origin of the temperature signal reflected in TEX8 H ,
the TEX8 H temperature estimates from both traps at GBN were compared to the depth profiles of
water temperatures and nitrate ( NO ) concentrations (Figure 2.5). As no seasonally resolved
temperature and nutrient data are available from the subsurface, we compared annual mean data with
Flux-weighted mean values calculated from the sediment trap samples. The Flux-weighted mean
TEX8 H temperatures at both traps were 24.1 °C (Table 2.2), which corresponds to the temperatures
below the surface mixed layer (approximately 50 m water depth). Notably, this coincides with the
nutricline, where the nitrate concentration starts to increase (Figure 2.5). Known for their ability to
oxidize ammonia to nitrite, marine planktonic Thaumarchaeota play a crucial role in the nitrogen
cycle in the ocean (Wuchter et al., 200 a). In biological studies of Thaumarchaeota, correlations
between copy numbers of amoA (the gene coding for the subunit of the ammonia monooxygenase),
ammonia oxidation rate, and/or nutrient (NH , NO
, and/or NO ) concentrations have been reported
with depth or through time (Beman et al., 2008; Church et al., 2010; Horak et al., 2013; Wuchter et
al., 200 a). Beman et al. (2008) and Horak et al. (2013) showed increased nitrate ( NO )
concentrations at high ammonia oxidation rates and maximum amoA gene copies in the water column.
Intact polar lipid GDGTs (IPLs) are believed to reflect the living thaumarchaeal biomass, while the
core GDGTs (breakup products of IPLs) are less suitable to describe the living in situ communities
(Ingalls et al., 2012; Urakawa et al., 2014). However, a sediment mooring system collects particles
with incorporated GDGTs after Thaumarchaeota die in the upper waters and exported into deep
waters. Thus, the GDGT assemblage provides integrated information about the production of GDGTs,
the formation of aggregates, and the transport mechanism to the trap. While no unambiguous
information on the archaeal community can be deduced from our observations, the good agreement of
the TEX8 H temperatures with the water temperature at the onset of increasing nitrate concentrations
suggest that the corresponding depth (~50 m) may be the predominant origin of GDGTs. GDGTs are
expected to reflect the water temperature at the site of production, which may be the primary habitat

46
depth of the local thaumarchaeotal community. This habitat is suggested to be in the shallow
subsurface (~50 m) in the Guinea Basin.
Figure 2.5 Depth profile of temperature and nitrate concentrations in the Guinea Basin (GBN3) extracted
from WOA13. The arrows indicate the Flux-weighted mean TEX8 H
temperature (24.1 °C) in sinking particles
and the possible depth of (ca. 50 m) of major GDGT production.
Apart from the impact of nutrient distribution on the TEX8 value we suggest, other physiological
and environmental factors like pH, salinity, growth phase of Archaea, or different archaeal community
have been studied. Elling et al., (2015) found no significant impact of salinity and pH on TEX8 in a
culture study. Considering a wide range of both parameters tested in the study and a small range of
their variations in the open ocean, it seems that both parameters are negligible for TEX8
thermometry. Changes of GDGT compositions and TEX8 values were shown in response to the
growth phase in Nitrosopumilus maritimus culture (Elling et al., 2014). However, we assume that
particles captured in the sediment trap are derived from deceased planktonic Archaea cells after their
final stage of the life cycle. Thus, the growth stage of planktonic Archaea can be ruled out as a
physiological factor on TEX8 in sinking particles. As discussed earlier in section 2.5.2., we found no
clear evidence of methanogenic Archaea in the trap samples of GBN3. Several studies using different
approaches have revealed a contribution of subsurface GDGTs (deep-dwelling archaeal community)
to TEX8 signals (Hernández-Sánchez et al., 2014; Huguet et al., 2007; Lengger et al., 2012; Shah et
al., 2008; Taylor et al., 2013). This is consistent with our results in the Guinea Basin, which suggest
that TEX8 is a reflection of planktonic archaeal GDGTs from the shallow subsurface.

47
In studies using sediment traps deployed at multiple water depths, TEX8 values are generally
constant from the shallow to the deep waters across a range of different settings (Turich et al., 2007;
Wuchter et al., 200 a; Yamamoto et al., 2012). This is in agreement with other observations carried
out at different water depths and in various oxygen levels where TEX8 remains relatively constant
and less susceptible to oxic degradation and transport (Kim et al. 2009; Mollenhauer et al. 2008;
Schouten al. 2004; Wuchter et al. 2005). Moreover, when comparing TEX8 values (or an estimated
water temperature) between sinking particles and underlying core-top sediments, it has been found
that the TEX8 signal is transported through the water column and reaches the sediment without
significant alteration (Chen et al. 201 ; Mollenhauer et al. 2015; Rodrigo-Gámiz et al. 2015).
However, TEX8 temperature on underlying core-top sediment at GBN3 site (1.78 7° N, 11.14°
W, GeoB1405-8) was clearly lower (21.7 °C) than the Flux-weighted mean TEX8 H temperatures
(24.1 °C) from both traps (Table 2.1). Lateral transport from a substantially colder region could be one
explanation. However, such a strong lateral gradient of temperature does not exist near the trap region,
and there is evidence that GDGTs are less subjected to long distance lateral transport and they rather
represent the local conditions (Kim et al., 2009; Mollenhauer et al., 2008; Shah et al., 2008).
Moreover, SSTs are generally higher closer to the continental shelf regions than at open water
location. One possible explanation may be in situ production of methanogenic Archaea, which are
well known to contain relatively higher proportions of GDGT-1, -2 and -3 and can potentially
contribute to the GDGT pools in sediments (Weijers et al., 2011). Liu et al., (2011) also report a
relatively higher amount of GDGT-2 and -3 in the IPLs-GDGTs produced by methanogenic Archaea,
which can alter the composition of core lipid GDGTs (CLs). However, methanogenesis is not
expected in samples with a relatively low TOC content (0.5 wt.% of TOC in GeoB 1405-8 core-top
sediment; Mollenhauer et al., 2004). Further insights could be obtained by analysing IPL-GDGTs in
the surface sediments.
Our findings in the Guinea Basin agree well with other studies showing that TEX8 H temperatures
reflect a subsurface temperature rather than SST in tropical or subtropical upwelling regions where
thermocline and nutricline are well developed (Huguet et al., 2007; Lee et al., 2008; Lopes dos Santos
et al., 2010; McClymont et al., 2012; Rommerskirchen et al., 2011). This reveals that distribution of
GDGTs is not solely determined by sea surface water temperature, but also by the regional
environmental setting that determines the favorable dwelling depth of Thaumarchaeota.
2.5.3 Coastal upwelling: Benguela system (LZ) with comparisons to the Cape Blanc area
The mass fluxes peaked in March to early-April and mid-May 2000 (late austral summer to
autumn), but the maxima in GDGT fluxes occurred in mid-April and late-May 2000 (austral autumn;
Figure 2.4). Wefer and Fischer (1993) showed that mass fluxes peaked in austral autumn (May−June)
and in spring (October−November) from a sediment trap deployed at 599 m water depth at Walvis

48
Ridge located 5° north of the LZ trap within the Benguela upwelling system. These observations
suggest that the LZ trap recorded realistic peak fluxes in austral autumn, but it might miss the real
fluxes in austral spring. During two periods (LZ1 + LZ2) of the trapping interval, the collection cups
of the sediment traps were practically empty in mid-June to early-August 2000 from LZ1 and mid-
September 2000 to late January 2001 from LZ2. This might be caused by a low trapping efficiency.
Potential under-sampling in the rather shallow traps due to stronger currents in the more coastal site
compared to the Walvis Ridge location seems plausible (Buesseler et al., 2007; Gardner, 1985).
However, no current speed data from the LZ trap site were available. Considering the year-round high
productivity at Lüderitz, the above mentioned periods of minimal or no flux at LZ may indeed be due
to lower sediment trap efficiency.
Enhanced fluxes of GDGTs suggest a higher production of GDGTs at that time or an increased
transport of GDGTs to the trap depth. The temperature depth profile measured using a CTD when the
LZ2 was recovered in January 2001 showed a clear stratification in austral summer (Figure 2.4). It is
likely that the mass flux maxima observed in austral autumn were triggered by the shoaling of the
thermocline followed by the supply of nutrients (that accumulated during the stratification) to the
surface waters and thus stimulating productivity (Louw et al., 201 ; Vorrath et al., 2017). After the
bloom, ammonia released by remineralization of organic matter may prompt ammonia oxidation by
Thaumarchaeota and thus the production of GDGTs. At the same time, increased fluxes of
phytoplankton debris after the bloom can transport GDGTs to the trap depth more effectively. In this
case, GDGT fluxes should be parallel to the mass fluxes or other biogenic component fluxes (e.g.,
organic carbon, opal). A potential correlation between GDGTs and organic matters could be more
obvious if both flux data sets cover the entire year, which unfortunately is not the case. Therefore, we
cannot make any inferences regarding the main transport mechanism for GDGTs at site Lüderitz.
TEX8 H temperatures agreed well with the satellite-derived SSTs changes from mid-February to
early-June in 2000 when a delay-time of 2 days was considered, while the estimated temperatures
were higher by 2.5−4.9 °C than the satellite-derived SSTs from early-June to mid-September (Figure
2.4). The sinking rate of particles to the LZ trap determined by the delay time between the satellite-
derived SSTs and theTEX8 signals according to Müller and Fischer (2001) was approximately 37 m
d-1 ((9 0 − 0) m / 2 days). This sinking rate is slightly slower than those for alkenone-associated
particles within the Benguela regime at locations to the South (NU-2; 45 m d-1 at 251 m) and North
(WU 2−4; 48 m d-1 at 1 48/1717 m) of the LZ site (Fischer and Karakaş, 2009). Sinking rates of
particles tend to increase with depth (Berelson, 2002; Fischer and Karakaş, 2009), and particles
containing alkenones have been reported to sink faster than those containing GDGTs ( Mollenhauer et
al., 2015). Thus, the estimated sinking rate of particles containing GDGTs at LZ seems reasonable
within the Benguela system. This calculated sinking rate of GDGTs is much faster than the one in
Cape Blanc site (9−17 m d-1; Mollenhauer et al., 2015), where the trap was deployed at deeper water

49
depth. This could be due to higher productivity at Lüderitz compared to Cape Blanc resulting in
generally high particle density, strong grazing and faster sinking (Carr, 2002). Due to a high
interannual variability of fluxes, the limited time series at LZ make it difficult to compare among
different regimes and periods in the upwelling system like the one off Cape Blanc (Fischer and
Karakaş, 2009). A longer observation time of fluxes would be helpful to gain better insights into the
sedimentation processes and sinking rate of particles in the Benguela coastal upwelling system off
Lüderitz.
The temperature estimations based on TEX8 H in particles collected in the LZ traps are different
from previous studies that showed subsurface temperature estimations in the eastern Atlantic
upwelling regions (Figure 2.4) (Lee et al., 2008; Kim et al., 2012; Lopes dos Santos et al., 2010;
Rommerskirchen et al., 2011). Sinking particles collected from the strongest upwelling cell in the
Benguela system were used in our study, while previous studies showing subsurface signals based on
sediment samples and suspended particulate matter. Moreover, the samples used by Lee et al. (2008)
were taken from the southern less productive part of the Benguela system. For this region, the authors
concluded that TEX8 temperatures represent subsurface temperature both in particles from surface
water as well as on the core-top sediments using the calibration from Kim et al. (2008). When TEX8
values in the study by Lee et al. (2008) are re-calculated with the TEX8 H calibration (Kim et al., 2010)
for the areas where mean annual SSTs are higher than 15 °C, the temperature estimates differ by only
up to 0.8 °C, which is within the uncertainty range of both calibrations (± 1.7 °C for Kim et al., (2008)
and ±2.5 °C for TEX8 H ), but TEX8
H based estimates are still lower than mean annual SST. Therefore,
it is unlikely that the difference between our findings and the interpretations made by the authors of
the previous study are due to the fact that different sample types were used. The warm biases of
TEX8 H , we observed at LZ might be a reflection of the potential non-thermal effects in this region.
Interestingly, TEX8 H temperature estimates both in Lüderitz and off Cape Blanc agreed with SST
observations during the warm season and a warm bias occurred only during the cold season (Figure
2.4 and 2. ). Basse et al., (2014) reported TEX8 values in suspended particles from various depths in
the Cape Blanc region, showing higher TEX8 in the OMZs, and they used samples collected during
the time of strongest upwelling off Cape Blanc. Based on these results, Mollenhauer et al., (2015)
speculated that GDGTs produced by different ammonia oxidizing archaeal community in the OMZ
might cause higher TEX8 values. This might explain the warmer temperature estimates in sinking
particles collected during the cold season when the OMZs might be most pronounced (Figure 2.4 and
2. ). We suggest that a similar mechanism might be active in the Benguela region, where the OMZ
expands from the Walvis ridge to off Lüderitz during the peak upwelling period (Chapman and
Shannon, 1987; Monteiro et al., 2008).

50
Figure 2.6. Changes in (a) estimated temperatures for SST, and (b) estimated 0-200 m depth-integrated
temperatures off Cape Blanc, North West Africa at the water depth of approximately 1,300 m for between
June 2003 and March 2007. Modified after Mollenhauer et al., (2015).
The archaeal community was mostly dominated by marine group I Crenarchaeota (now re-named
to Thaumarchaeota) and their 1 S rRNA gene sequences tightly clustered with Nitrosopumilus
maritimus in the Namibian OMZ (Woebken et al., 2007), suggesting that the same archaeal
community prevailed throughout the water column. Likewise, Schouten et al., (2012) observed no
clear evidence for a substantial contribution on GDGT pools by archaeal communities other than
Thaumarchaeota in the Arabian Sea OMZ. Indeed, archaeal communities in the Arabian Sea OMZ
were not distinguished from the ones in oxygenated surface waters (Peng et al., 2013). This implies
that GDGTs, leading to elevated TEX8 values in sinking particles, are more likely produced by an
archaeal community adapted to OMZs (Martens-Habbena et al., 2009) rather than by different
archaeal communities as suggested by Mollenhauer et al., (2015).
Oxygen-depleted waters are observed between 150 m and 400 m depth on the shelf of Lüderitz
(Brüchert et al., 2003; Inthorn et al., 200 a). In the OMZs, a significant amount of oceanic nitrogen is
fixed with the contribution of both aerobic- and anaerobic oxidation processes (Kalvelage et al., 2011;
Kuypers et al., 2005). Intriguingly, high ammonia oxidation activity, amoA gene abundances as well
as GDGTs in oxygen-depleted conditions have been observed in other field studies (Ingalls et al.,
200 ; Kim et al., 2015; Schouten et al., 2012b; Xie et al., 2014). Higher TEX8 values were measured
under oxygen depleted and ammonia oxidation rate limited conditions in culture experiments (Hurley
et al., 201 ; Qin et al., 2015), exhibiting a high affinity of Thaumarchaeota for oxygen (Martens-
Habbena et al., 2009; Urakawa et al., 2014). These findings support our interpretation that the warm
51
biased TEX8 H temperatures can be attributed to the contributions of GDGTs synthesized within the
OMZ, which differ by an increase in the relative abundance of GDGT-2 and GDGT-3 from the
GDGT pools formed in surface waters in the Lüderitz region. Especially in 2000-2001 when the LZ
traps were deployed, this region was characterized by advection of less ventilated ocean water onto
the shelf, which resulted in intensified OMZs (Monteiro et al., 2008). This might have stimulated the
GDGT production in the OMZs. It is, however, unclear how these GDGTs are exported through the
water column and which proportions of GDGTs from the OMZs were collected in the sediment traps.
It is paramount to study the composition of GDGTs and TEX8 not only in sinking particles covering
a longer time period but also in sediments, ideally on transects crossing the depth range of the OMZs
in order to quantify the influence of GDGTs in the OMZs on TEX8 thermometry in the Benguela
coastal upwelling. The flux-weighted mean TEX8 H temperature of the LZ trap was 18.3 °C, which was
warmer than the averaged satellite-derived SSTs in 2000 (1 .4 °C) (Table 2.2, Figure 2.4). This is due
to the warm-biased TEX8 H estimates relative to the satellite-derived SSTs, which we observed in the
trap record from June to September 2000. The TEX8 H temperature in a core-top sediment from about
1° north of the LZ trap location, was 15.3 °C (WW24080 at 24.002° S, 12.999° E; unpublished data;
cf. Mollenhauer et al., 2007). This is relatively colder than the temperatures estimated from the LZ
trap and the satellite-derived mean annual SST. However, as the trap records do not cover the entire
year, the Flux-weighted mean TEX8 H estimation cannot be compared with the TEX8
H estimate from
the underlying core-top sediment. The BAYSPAR SSTs were very similar to TEX8 H estimations,
showing a warm bias compared to the satellite-derived SSTs during the cold season in the LZ while it
displayed a better match for the cold season at site CBeu (Figure 2.4 and 2. ). Although the
BAYSPAR SST had different trends in the LZ and CBeu, it seems to work better than for the GBN3
region (Figure 2.2). For BAYSPAR calibration in the global TEX8 the database, there are more data
points from the coast near Southwest Africa (off Namibia) and Northwest Africa (off Cape Blanc)
than in the eastern Atlantic equatorial region (Tierney and Tingley, 2015). This illustrates that the
quality of BAYSPAR SST calculations depends on the reference point density, which can provide
representative calibration parameters within the region. Instead, the poor reference point density can
lead to unrealistic temperature estimations based on BAYSPAR SST. BAYSPAR SubT demonstrated
subsurface temperatures at both sites LZ and CBeu (Figure 2.4 and 2. ). As discussed in section 2.5.2
for the site GBN3 (Figure 2.2), BAYSPAR SubT is likely to be insensitive to the number of
calibration points and it seems to work better.
Our findings from the Benguela coastal upwelling system and the Cape Blanc region suggest that a
different physicochemical response of thaumarchaeotal communities in oxygen depleted waters can
influence the TEX8 thermometry, resulting in a seasonal warm bias in TEX8 H temperature estimates

52
during the upwelling season. This underlines that water column oxygenation as an environmental
factor needs to be considered when the TEX8 H calibration is applied in areas with OMZs.
2.6 Summary and conclusions
We studied the seasonal variability of GDGT fluxes and TEX8 H thermometry in sinking particles in
three eastern Atlantic upwelling regimes. TEX8 H temperatures reflect temperatures at different depths
and different absolute temperature ranges depending on the sites and the calibrations.
In the equatorial upwelling area (GBN), GDGTs appear to be exported mostly by particles
containing opal. Due to the high particle sinking rate (>42 m d-1) and relatively long sampling period,
we did not observe a delay in TEX8 H -based temperature estimates relative to satellite-derived SST
data. TEX8 H -based temperature estimates derived from particles collected at 853 m and 3,921 m water
depth correspond to temperatures at ca. 50 m water depth where the nutricline exists. The depth
profile of nutrient concentrations can thus play an important role in determining the favorable habitat
depth of thaumarchaeotal communities and, as the result, the depth at which temperature is recorded
by GDGTs sinking to the sediment. In the coastal upwelling area off Lüderitz (LZ, Benguela system),
TEX8 H -based temperature estimates resemble the satellite-derived SSTs with a delay of 2 days
during the warmer season while it shows warmer estimations than satellite-derived SSTs during the
colder season. Similar trends were recorded in the coastal upwelling off NW Africa (Cape Blanc, site
CBeu), where higher TEX8 values were found in oxygen depleted water masses. As OMZs are
pronounced in the Benguela coastal upwelling area, GDGTs synthesized by Archaea adapted to the
OMZs are inferred to drive changes of TEX8 values in sinking particles.
Our findings in the high productivity upwelling systems of the eastern Atlantic prompt a re-
thinking of paleotemperature estimations using the TEX8 proxy. In paleoclimate studies based on the
TEX8 index, it should, therefore, be carefully considered that environmental conditions other than
temperature (particularly oxygen depletion) and variable habitat depths under different ecological-
and oceanographic settings may influence the sedimentary signals. This study furthermore suggests
limitations of one single calibration for SST based on TEX8 for all settings which might have
temporally and spatially varying nutrient and oxygen distributions in the water column.
Acknowledgments
We acknowledge the captains, crews, student assistants and scientists who participated in the
cruises for collecting samples used in this study. We thank Marco Klann who was responsible for the
sediment trap sample processing and bulk measurements and Götz Ruhland for preparation and
deployments/recoveries of the mooring arrays. The trap samples and core-top sediments were
supplied by the MARUM Centre of Marine Environmental Research at the University of Bremen.

53
This project is funded through DFG-Research Center / Cluster of Excellent “The Ocean in the Earth
System” and supported by GLOMAR− Bremen International Graduate School for Marine Sciences,
University of Bremen. The Royal Netherlands Institute for Sea Research is thanked for providing
unpublished TEX8 value of WWW24080 core-top (24.002° S, 12.999° E) and CTD profile data in
the Lüderitz Bay collected during the 4PE174 MARE-3 cruise. We also thank two anonymous
reviewers for their constructive comments on an earlier version of this manuscript.
Data availability
The data presented here are available on the PANGAEA database
(https://doi.pangaea.de/10.1594/PANGAEA.88 701).

54

55
CHAPTER 3
Seasonality of archaeal lipid flux and
GDGT-based thermometry in sinking
particles of high latitude oceans:
Fram Strait (79° N)
and Antarctic Polar Front (50° S)
Submitted to Biogeosciences (Park et al., 2019)

56
3 Manuscript II
Seasonality of archaeal lipid flux and GDGT-based thermometry
in sinking particles of high latitude oceans: Fram Strait (79° N)
and Antarctic Polar Front (50° S)
Eunmi Park1,2,3
, Jens Hefter1, Gerhard Fischer
2,3, Morten H. Iversen
1,2, Simon Ramondenc
1,2,
Eva-Maria Nöthig1, Gesine Mollenhauer
1,2,3
1Alfred Wegener Institute, Helmholtz Center for Polar and Marine Research, D-27570 Bremerhaven,
Germany
2MARUM Centre for Marine Environmental Sciences, University of Bremen, D-28334 Bremen,
Germany
3Department of Geosciences, University of Bremen, D-28334 Bremen, Germany
Abstract
The relative abundance of individual archaeal membrane lipids, namely of glycerol dialkyl
glycerol tetraethers (GDGTs) with the different numbers of cyclopentane rings, varies with
temperature, which enables their use as paleotemperature proxy. The first GDGT-based index in
marine sediments called TEX8 is believed to reflect mean annual sea surface temperature (ma SST).
The TEX8 L is an alternative temperature proxy for ´low´ temperature regions (<15 °C), where the
original TEX8 proxy suffers from scattering in a linear calibration with SSTs. However, TEX8 L -
derived temperatures still display anomalous estimates in polar regions. In order to elucidate the
potential cause of the disagreement between TEX8 L estimate and SST, we analyzed GDGT fluxes and
TEX8 L -derived temperatures in sinking particles collected with time-series sediment traps in high
northern and southern latitude regions. At 129 m depth in the eastern Fram Strait (79° N), a
combination of various transporting mechanisms for GDGTs might result in seasonally different
sinking velocities for particles carrying these lipids, resulting in strong variability in the TEX8 L signal.
The similarity of flux-weighted TEX8 L temperatures from sinking particles and surface sediments
implies an export of GDGTs without alteration during transport in the Fram Strait. The estimated
temperatures correspond to temperatures in water depths of 30−80 m, where nitrification might occur,
indicating the favorable depth habitat of Thaumarchaeota. In the Antarctic Polar Front of the Atlantic
sector (50° S), TEX8 L -derived temperatures displayed warm and cold biases compared to satellite-
derived SSTs at 14 m depth, and its flux-weighted mean signal differs from the deep signal at 319
m. TEX8 L -derived temperatures at 319 m depth and the surface sediment showed up to 7 °C warmer

57
temperatures relative to satellite-derived SST. Such a warm anomaly might be caused by GDGT
contributions from Euryarchaeota, which are known to dominate archaeal communities in the
circumpolar deep water of the Antarctic Polar Front. The other reason might be that a linear
calibration is not appropriate for this frontal region. Of the newly suggested SST proxies based on
hydroxylated GDGTs (OH-GDGTs), only those with OH-GDGT-0 and crenarchaeol or the ring index
(RI) of OH-GDGTs yield realistic temperature estimates in our study regions, suggesting that OH-
GDGTs could be applied as a potential temperature proxy in high latitude oceans.
3.1 Introduction
The knowledge that Thaumarchaeota, one phylum of Archaea, regulate the composition of their
membrane lipids according to the surrounding water temperatures enabled the development of the
paleothermometer TEX8 (Kim et al., 2010; Schouten et al., 2002). TEX8 is calculated based on the
relative abundance of GDGTs containing 0−3 cyclopentane (GDGT-0−3) or 4 cyclopentane and one
cyclohexane (crenarchaeol) rings (Figure 3.1).
The ubiquity of Thaumarchaeota, even in the polar oceans where the widely applied U proxy for
sea surface temperature (SST) reconstructions is often problematic, supports the use of TEX8 in high
latitude regions (Bendle and Rosell-Melé, 2004; Ho et al., 2014). Nonetheless, the SST dependence of
TEX8 in warm regions is stronger than in colder regions where SSTs are below 5 °C (Kim et al.,
2010). Thus, a logarithmic calibration, excluding the crenarchaeol region-isomer, of TEX8 L was
suggested for regions where ma SSTs are below 15 °C (see Eq. 2; Kim et al., 2010). The authors
speculated that the lack of correlation between the Crenarchaeol regio-isomer and SST at low
temperatures might be caused by genetically different GDGT producers.
Figure 3.1 Chemical structures and molecular ion m/z values of the isoprenoid glycerol dialkyl glycerol
tetraethers (GDGTs), branched GDGTs, and hydroxylated GDGTs.

58
It has been questioned whether temperature is the only factor influencing the lipid composition
(i.e., TEX8 ) particularly in the regions where strong cold or warm biases were observed between
TEX8 reconstructed and measured ma SSTs. The biases of TEX8 calibrations have been attributed to
enhanced production of GDGTs during seasons with favorable growth conditions for Thaumarchaeota
(Pitcher et al., 2011; Wuchter et al., 200 b), a contribution of GDGTs from deep-dwelling
communities (Kim et al., 2015; Lee et al., 2008; Taylor et al., 2013), terrestrial input (Weijers et al.,
200 ), influences of different archaeal communities (Lincoln et al., 2014; Turich et al., 2007), and/or
other environmental factors (Huguet et al., 200 ; Mollenhauer et al., 2015; Park et al., 2018; Turich et
al., 2007).
To circumvent these problems, especially in cold regions, a handful of studies have developed
dedicated calibrations on regional scales (Meyer et al., 201 ; Seki et al., 2014; Shevenell et al., 2011).
For the temperature estimate in the Eocene Arctic Ocean, a modified version of TEX8 , the index
termed TEX´8 was proposed (Sluijs et al., 200 ). It excludes GDGT-3 to eliminated contribution
from terrestrial input, leading to significantly higher temperature estimates compared to the original
TEX8 calibration. The TEX´8 values of 104 marine surface sediments showed a good linear
correlation with ma SSTs (R2 = 0.93) (Sluijs et al., 200 ). Following the addition of 7 additional
TEX8 values from surface sediments collected at the continental margin of the western Antarctic
Peninsula, Shevenell et al., (2011) modified the Kim et al., (2008)’s TEX8 calibration for this region
(TEX8 = 0.0125 × Temp + 0.3038, R2 = 0.82) and estimated water temperatures for the Holocene.
Ho et al., (2014) evaluated TEX8 and the different calibrations in an extended set of surface
sediments from the polar regions of both hemispheres and found that the global TEX8 calibration is
suitable for subpolar regions (e.g., the Pacific sector of the Southern Ocean and the Subarctic Front in
the North Pacific). Additionally, the TEX8 L yields reasonable temperature estimates if regional
calibrations are developed for high latitude regions. Using a regression of water temperatures (at 20 m
depth in August) versus TEX8 L values, Seki et al., (2014) obtained plausible paleotemperature
estimates for the Sea of Okhotsk and the subpolar North Pacific region. Meyer et al., (201 )
confirmed later that this regional TEX8 L calibration can also be applied to the subarctic northwest
Pacific and the western Bering Sea.
More recently, hydroxylated GDGTs (OH-GDGTs), which contain an additional hydroxyl group in
one of the biphytanyl moieties of GDGT-0, -1, and -2, have been recognized in marine sediments (Liu
et al., 2012; Figure 3.1). Based on the finding that the abundance of OH-GDGTs relative to the total
isoprenoid GDGTs increase towards cold regions (Huguet et al., 2013), OH-GDGT based SST
calibrations have been proposed for high latitude oceans (Fietz et al., 2013; Huguet et al., 2013).
In addition to the biological, phylogenetic, and statistical studies of the temperature proxy, sinking
particles collected in specific regions can provide new perspectives on the distribution of GDGTs and

59
TEX8 -based temperature reconstructions. The study using time-series sediment traps can give
insights on the seasonal variability of lipid flux and temperature signals, and allows the comparison of
the lipid signal to those in underlying sediments. Only one TEX8 study using a time-series sediment
trap in high latitude regions has been conducted near Iceland (Rodrigo-Gámiz et al., 2015), regardless
of the interest in polar regions, where temperature reconstructions with lipid proxies are troublesome.
Here, we examine the seasonal GDGT production and TEX8 L -derived temperatures in comparison to
measured SSTs in order to better understand the drivers influencing TEX8 L values in sinking particles
collected in two high latitude oceans (eastern Fram Strait, 79° N and Antarctic Polar Front of the
Atlantic sector, 50° S). The temperatures derived from OH-GDGT proxies were also calculated to
evaluate the applicability of these novel proxies for high latitude regions.
3.2 Study area
3.2.1 Fram Strait
The Fram Strait is located west of Spitsbergen, where the heat exchange occurs between the Arctic
Ocean and the North Atlantic (Figure 3.2). Relatively warm and nutrient-rich Atlantic water (AW) is
transported by the West Spitsbergen Current (WSC) to the central Arctic Ocean, while colder and less
saline Arctic water is transported along the East Greenland Current (EGC) to the Nordic Seas (Figure
3.2). Part of the WSC is separated from the northward flow and recirculated within the region
(Manley, 1995; Soltwedel et al., 201 ). Eddies, mixing, and recirculating Atlantic water contribute to
the hydrographic complexity observed in the Fram Strait (Walczowski, 2013). The volume transport
of the WSC and AW within the WSC displays strong seasonality with maxima in March and minima
in July for the WSC, and maxima in late autumn and winter and minima in June for the AW
(Beszczynska-Möller et al., 2012b). The occurrence of sea ice and its variability has an effect on the
particle fluxes as well as on benthic ecosystems (Bauerfeind et al., 2009; Hebbeln and Wefer, 1991;
Soltwedel et al., 201 ). Sinking particles in the Fram Strait, including organic and terrigenous
material, are well known to originate not only from the photic zone in the upper water column, but
also from the Svalbard archipelago and Siberian shelf, from where they are transported by sea ice
(Hebbeln, 2000; Lalande et al., 201 ). Phytoplankton blooms enhance the vertical flux of biogenic
components (organic carbon, carbonate, and opal) in spring-summer, but the downward flux of
particles is likely affected by the environmental conditions (e.g. hydrographic changes, sea ice extent,
and atmospheric low pressure) on an annual timescale (Wassmann et al., 200 ). Based on
oceanographic measurements from mooring arrays at multiple depths across the Fram Strait (from 7°
W to 9° E, 78.3° N), Beszczynska-Möller et al., (2012) found two warm anomalies in the Atlantic
water through the Fram Strait in 1999−2000 and 2005−2007. During the second warm anomaly,
community structures of phytoplankton and zooplankton were affected by the decreased sea ice in this

60
region (Lalande et al., 2013; Nöthig et al., 2015) and had a profound influence on biogenic sediment
fluxes.
Figure 3.2 Map of sediment trap locations in the high northern latitude (FEVI16) and in the Antarctic Polar
Front (PF3). In Fram Strait, the northward red arrow represents the West Spitsbergen Current bringing warm
and saline Atlantic waters to the Arctic and the southward blue arrow displays the East Greenland Current
transporting cold and fresh water to the Norwegian Sea. Around the Antarctic, the digitized blue shadow
exhibits the location of the Antarctic Polar Front for the years 2002−2014 at weekly resolution (Freeman and
Lovenduski, 2016). The blue arrow indicates the clockwise Antarctic Circumpolar Current (ACC). Ocean
Data View is used for mapping (Schlitzer, 2017; available at https://odv.awi.de).
3.2.2 Antarctic Polar Front
The Antarctic Polar Front (APF) region is one of the major frontal zones within the westerly wind-
driven Antarctic Circumpolar Current (ACC) (Figure 3.2). Spatial and temporal variability of the APF
is strongly affected by seafloor topography. The APF has an average width of 43 km (1987−1993),
which moves southward during the austral summer and reaches its northernmost position during the
austral winter (Moore et al., 1999). The ACC is well known for its meandering jet flow and eddy
formation (Moore et al., 1999; Orsi et al., 1995), which likely stimulate phytoplankton blooms and
primary production in this region by supplying growths-limiting nutrients, and/or bringing deeper-
dwelling phytoplankton into the photic zone (Abbott et al., 2001; Moore and Abbott, 2002, 2000).
Thus, the hydrographic structure is an important factor controlling the distribution of phytoplankton
and small zooplankton in this region (Read et al., 2002). The highest chlorophyll-a levels of up to 3.5
mg m-3 were recorded in the APF during the early austral summer 1990−1991, and it co-occurred with
elevated silicate levels as well as water column stability (Laubscher et al., 1993). The current speed
close to the PF3 trap was recorded to be up to 8 cm s−1 (Walter et al., 2001). Read et al., (2002)
reported the vertical profile of currents measured between the surface and 400 m depth in the polar
frontal regions in December 1995. The currents recorded at the surface and subsurface of the Polar

61
Front were much stronger (30−50 cm s-1) than the ones measured at 700 m depth (1−8 cm s
−1) by
Walter et al., (2001).
3.3 Materials and methods
3.3.1 Sediment traps
A time-series sediment trap system was moored to collect sinking particles at the eastern Fram
Strait (FEVI1 ) between July 2007 and July 2008 at 129 m water depth (Table 3.1, Figure 3.2). Two
traps (PF3) were deployed in the permanent ice-free area of the APF in the Atlantic sector at 14 m
and 319 m water depth from November 1989 to December 1990 (Table 3.1, Figure 3.2). The cone-
shaped funnel of the Kiel trap systems had a 0.5 m2 collection area, and the collection periods of each
individual sample cup were programmed depending on the expected time of ice cover and/or the
seasonality of the production. The sampling cups were filled with filtered seawater enriched in sodium
chloride (NaCl) to achieve a salinity of 40 psu, and they were poisoned with mercury chloride (HgCl2;
0.14% final solution) for sample preservation. For FEVI1 samples, zooplankton ‘large swimmers’
were removed using forceps before splitting each sampling cup into smaller subsamples (Lalande et
al., 201 ). For PF3 samples, large swimmers were removed using forceps and a sieve (mesh size: 1
mm mesh) in the laboratory (Fischer et al., 2002). Afterward, the samples were split for different
purposes. A current meter (RCM 9/11) was attached to both trap moorings, and the datasets are
available on PANGAEA (https://doi.org/10.1594/PANGAEA.845 10; FEVI1 ) and in Walter et al.,
(2001; PF3)
3.3.2 Mass flux
Split FEVI1 samples were filtered onto GF/F filters (pre-combusted at 500 °C for 4 h) for organic
carbon, organic nitrogen (PON), and carbonate and onto cellulose acetate filters for biogenic opal
quantification. Organic carbon (POC) and organic nitrogen (PON) were measured with a CHN
elemental analyzer after 0.1 N HCl treatment. Carbonate was calculated by subtracting the weight
from total mass after 0.1 N HCl treatments and recorrected according to the aragonite contents. The
detailed methods used for biogenic silica can be found in Lalande et al., (201 ). Split PF3 samples
were freeze-dried for further processing. Decalcified samples ( N HCl) were analysed for POC using
a CHN elemental analyzer. Total nitrogen (TN) was also determined. Carbonate was calculated by
subtracting POC from total carbon (TC), which was directly measured without decalcification
(carbonate = 8.33 × (TC - POC)). The methodology for the quantification of biogenic silica is
described in Fischer et al., (2002).

2
Table 3.1 Information on FEVI16 and PF3 trap.
Name Region Location Water depth
Trap depth
Deployment period Sampling interval
Cruise reports
Latitude (° N)
Longitude (° E)
Start End
(m) (m) (dd.mm.yyyy) (d)
FEVI16 Eastern Fram Strait
79.02 4.35 2589 1296 23.07.2007 30.06.2008 10-31*
ARK-XXII/1c (Klages and Participants, 2007)
ARK-XXIII/2 (Kattner and Participants, 2009)
PF3 Antarctic
Polar Front
-50.13 5.83 3785
614
10.11.1989 23.12.1990 21, 42*
ANT-VIII/3 (Gersonde and Participants, 1990)
ANT-IX/2 (Fahrbach and Cruise Participants, 1992)
3196
* The exact sampling interval of each sample at FEVI16 and PF3 can be found on PANGAEA (https://doi.pangaea.de/10.1594/PANGAEA.897268).

63
3.3.3 GDGT analyses
For GDGT analysis, total lipids were extracted with a solvent mixture (9:1 v/v dichloromethane
(DCM): methanol (MeOH)) using an ultrasonic bath for 10 min and a centrifuge for 5 min, after
which the supernatant was decanted. This process was repeated three times and the supernatants were
combined. Before the extraction process, a known amount of C4 -GDGT (internal standard) was
added to each sample for GDGT quantification.
Following saponification of total lipids with 1 mL of 0.1 M potassium hydroxide (KOH) in a
mixture of MeOH: purified water 9:1 (v/v) at 80 °C for two hours, neutral lipids (NLs) were
recovered with 1 mL of hexane (three times). NLs were separated into F1 (apolar), F2 (ketone), and
F3 (polar) polarity fractions eluted in 2 mL hexane, 4 mL DCM: hexane (2:1 v/v), and 4 mL DCM:
MeOH (1:1 v/v), respectively, using deactivated silica-gel chromatography (mesh size: 70-230 μm).
The F3 polar fraction containing GDGTs was redissolved in 500 µL of hexane: isopropanol 99:1
(v/v) and filtered through a polytetrafluoroethylene (PTFE) filter (pore size: 0.45 µm) into a glass
insert of a 2 mL vial according to Hopmans et al., (2000). The filtered polar fraction was diluted with
hexane: isopropanol 99:1 (v/v) to a concentration of approximately 2 mg ml-1 before the instrumental
analysis.
GDGTs were analyzed using high-performance liquid chromatography/atmospheric pressure
chemical ionization mass spectrometry (HPLC/APCI-MS) according to Chen et al., (2014). Molecular
ions m/z 1302, 1300, 1298, 129 , 1292 for isoprenoid GDGTs and 1050, 103 and 1022 for branched
GDGTs were determined and quantified in relation to the molecular ion m/z 744 of the C4 -GDGT.
The late eluting peaks of OH-GDGT-0, -1, and -2 with m/z 1318, 131 , and 1314 were also
determined in the m/z 1300, 1298, and 129 scan, as described by Fietz et al., (2013).
3.3.4 GDGT flux and indices
TEX8 L values were calculated according to Kim et al., (2010).
TEX8 L = Log10 ([GDGT-2] / ([GDGT-1] + [GDGT-2] + [GDGT-3])) (1)
where the numbers represent the number of cyclopentane moieties in the isoprenoid GDGTs.
TEX8 L values were converted into temperatures using the following equation (Kim et al., 2010):
SST (°C) = 7.5 × TEX8 L + 4 .9 (R
2 = 0.8 , n = 39 ) (2)
GDGT flux represents the sum of fluxes of individual GDGTs, which are used for calculating
TEX8 L .
GDGT flux = [GDGT-1] + [GDGT-2] + [GDGT-3] (3)
OH-GDGT-based indices and estimated temperatures were calculated using the following
equations (eq.4 by Fietz et al., 2013; eq. 5 and by Lü et al., 2015):

64
OH-GDGT-0/Cren = 0.25 − 0.025 × SST (°C) (R2 = 0.58, n = 13) (4)
RI-OH´ = ([OH-GDGT-1] + 2× [OH-GDGT-2]) / ([OH-GDGT-0] + [OH-GDGT-1] + [OH-GDGT-2])
(5)
RI-OH´ = 0.0382 × SST (°C) + 0.1 (R2 = 0.75, n = 107) ( )
BIT, an index of relative contributions of terrestrial versus marine input, was calculated according
to Hopmans et al., (2004).
BIT = [I + II + III] / [ I + II + III + Cren] (7)
The Roman numerals I, II and III refer to the branched GDGTs with 4, 5, and methyl moieties,
and Cren represents crenarchaeol containing 4 cyclopentane moieties and 1 cyclohexane ring (Figure
3.1). A terrestrial effect on TEX8 can be significant when the BIT value is >0.3 (Weijers et al., 200 ).
MI, the methane index indicating the relative contribution of GDGTs derived from methanotrophic
archaea to those from planktonic Thaumarchaeota was calculated as follows (Zhang et al., 2011):
MI = ([GDGT-1] + [GDGT-2] + [GDGT-3]) / ([GDGT-1] + [GDGT-2] + [GDGT-3] + [Cren] + [Cren´])
(8)
Cren´ represents the regio-isomer of crenarchaeol. Contributions from methanotrophic Archaea are
considered to be significant when MI >3.
%GDGT-0, an indicator of a methanogenic source of GDGTs with a %GDGT value > 7%, was
calculated as follows (Inglis et al., 2015):
%GDGT-0 = ([GDGT-0] / ([GDGT-0] + [Cren])) × 100 (9)
RI, the ring index, is a tool for identifying a potential non-thermal influence on GDGT
distributions. A sample´s ring index is defined as follows (Zhang et al., 201 ):
RIsample = 0 × [GDGT-0] + 1 × [GDGT-1] + 2 × [GDGT-2] + 3 × [GDGT-3] + 4 × [Cren] + 4 × [Cren´] (10)
│∆RI│ indicates the residual of a sample´s RI (RIsample) from a calculated RI (RIcalculated) based on
the global TEX8 −RI regression. RIcalculated and │∆RI│ are defined as follows:
RIcalculated = − 0.77(±0.38) × TEX8 + 3.32(±0.34) × (TEX8 )2
+ 1.59(±0.10) (R2 = 0.87, n = 531) (11)
│∆RI│= RIcalculated − RIsample (12)
Potential nonthermal influences on TEX8 can be recognized when │∆RI│ is >0.3 (Zhang et al.,
201 ).
3.3.5 Environmental parameters
TEX8 L -derived temperatures were compared to satellite-derived SSTs obtained by Advanced Very
High Resolution Radiometer (AVHRR), which has a spatial grid resolution of 0.25° and temporal
resolution of 1 day (Reynolds et al., 2007). The satellite-derived SSTs were averaged over the
collection period of each sample cup. The depth profiles of mean annual water temperature and nitrate

65
concentration were obtained from the World Ocean Atlas 2013 (WOA13) representing averaged
values for the years 1955−2012 (Garcia et al., 2013; Locarnini et al., 2013).
3.4 Results
3.4.1 Eastern Fram Strait: FEVI1
3.4.1.1 Mass and GDGT fluxes
The mass flux data of the FEVI1 trap have been published previously by Lalande et al., (201 ). In
summary, the mass flux (opal + POC + PON + lithogenic fluxes) measured at 129 m water depth
varied in between 18.5 and 52.9 mg m-2 d
−1, with minima in the winter season (November
2007−February 2008; Figure 3.3a). Lithogenic flux is presented separately in Figure 3.3a due to its
significantly higher contribution to total mass flux. The composition of sinking particles changed
between seasons. Lithogenic material flux showed sudden pulses in spring (March and April−May
2008). POC was predominant in mid-July 2007. Carbonate flux was elevated in March, early-May
and mid-June 2008. Opal was dominant in early-September 2007 and mid-May to June 2008.
GDGT fluxes varied between 7.2 and 85.9 ng m-2 d
−1 (Figure 3.3b). Peaks of GDGT flux occurred
in August−September 2007 and March, May−June 2008, while minima were observed in the winter
season (November 2007−February 2008). The GDGT flux was strongly correlated with opal flux (R2
= 0.82, p<0.0001) when two GDGT maxima in late-September 2007 and March 2008 were excluded
and with carbonate flux (R2 = 0.8 , p<0.0001) except for the last 2 months in May-June 2008 (Figure
3.3a, b).
3.4.1.2 TEX86L thermometry
TEX8 L values varied between -0.70 and -0. 4 and their TEX8
L -derived temperatures (Kim et al
(2010) calibration) ranged between 0. and 3.7 °C (Figure 3.3b, f). The flux-weighted mean TEX8 L
temperature during the trap deployment period was 2.8 °C. Two surface sediment TEX8 L values (-0.
at PS 8-251/2, 79.1° N, 4. ° E; -0. 5 at PS 8-271/2, 79.3° N, 4.3° E) are available near the FEVI1
trap (Ho et al., 2014). Most index values of BIT, MI, %GDGT-0, and │∆RI │for samples from
FEVI1 were below the critical values of each index (>0.3 for BIT and MI, > 7% for %GDGT−0,
>0.3 for │∆RI│). One sample with a │∆RI │value >0.3 was found, indicating a non-thermal effect
on TEX8 (Table A 3.1).

66
Figure 3.3 Changes in mass flux (a), GDGT flux (b), terrestrial biomarker flux and diatom and
coccolithophore abundances (c), fecal pellet flux (d), sea ice concentration (e), TEX8 L -derived temperatures
and satellite-derived SSTs obtained at 79.125° N, 4.375° E near the trap site (f) at 1296 m water depth in the
eastern Fram Strait site, FEVI1 during the deployment period (July 2007−July 2008). (a), (c), (d), and (e)
are previously reported by Lalande et al., (2016).
3.4.1.3 Fractional abundance of OH-GDGTs
All OH-GDGTs were clearly present in FEVI1 samples. OH-GDGT−0 was predominant in the
OH-GDGT pool, accounting for 87−95% (Figure 3.4a). The proportion of OH-GDGTs in the sum of
iso- and OH-GDGTs ranged between 7 and 11% during the trap deployment period (Figure 3.4a).
Estimated temperatures calculated using the calibrations as described in Eq. (4) and ( ) (Fietz et al.,
2013 and Lü et al., 2015) ranged between -0.3 and 2.5 °C and between -0.9 and 1.4 °C, respectively.
The last two data points for the trap time-series were unusually low when using Eq. (4) (Figure 3.4b).

67
Figure 3.4 Changes in fractional abundance of OH-GDGTs (a) and estimated temperatures based on OH-
related calibrations (b) at site FEVI16. The purple and orange lines indicate the calculated temperatures using
the calibrations by Fietz et al., (2013) (Eq. 4) and Lü et al., (2015) (Eq. 6), respectively. The green line
indicates the TEX8 L -derived temperatures.
3.4.2 Southern Atlantic Polar Front: PF3
3.4.2.1 Mass and GDGT fluxes
The mass flux data of the PF3 trap have been published previously by Fischer et al., (2002). The
mass flux at the shallow trap ranged between 19.7 and 592.1 mg m-2 d
−1 with a distinct seasonal
variability (Figure 3.5a). Flux maxima occurred in November 1989 to early-March 1990 and mid-
October to November 1990, while it stayed relatively low from mid-March to mid-October 1990. At
the deep trap, the mass flux varied between 0 and 51 . mg m-2 d
−1 (Figure 3.5d). The mass flux
peaked in mid-December 1989−January and March 1990 but stayed low for the remaining sampling
period except for mid-May 1990.
There was no clear correlation between organic material and GDGT fluxes at either depth. The
fluxes in GDGTs ranged from 10.5 to 73.9 ng m-2 d
−1 at 14 m and from 0.5 to 153.9 ng m
-2 d
−1 at
319 m depth (Figure 3.5b, e). GDGT fluxes were mostly enhanced during the low mass flux season
at the shallow trap (Figure 3.5b). GDGT flux maxima occurred in November and December 1989,
late-May and early-November 1990 at the deep trap (Figure 3.5e). GDGT analysis was not possible
between late-July and October 1990 in the deep trap since very little material was collected during
this time period.

8
Figure 3.5 Changes in mass flux (a, d), GDGT flux (b, e) and TEX8 L -derived temperatures and satellite-derived SSTs obtained at 50.125° S, 5.875° E near the trap site (c, f)
at the 614 m (left panels) and 3196 m (right panels) water depth in the Antarctic Polar Front site (PF3) during the deployment period (November 1989−December 1990).

9
Figure 3.6 Changes in fractional abundance of OH-GDGTs (a, c) and estimated temperatures based on OH-related calibrations (b, d) at site PF3. The purple and orange
lines indicate the calculated temperatures using the calibrations by Fietz et al., (2013) (eq. 4) and Lü et al., (2015) (eq. 6), respectively. The green lines indicate the TEX8 L -
derived temperatures.

70
3.4.2.2 TEX86L thermometry
TEX8 L values varied between -0.58 and -0. 7, and -0.55 and -0.59 at the shallow and deep trap,
respectively (Figure 3.5b, e). The TEX8 L -derived temperatures ranged between 1.3 and 7.8 °C for the
shallow trap and 7.4 and 9.8 °C for the deep trap (Figure 3.5c, f). The flux-weighted mean TEX8 L
temperatures were 4. °C and 8.5 °C at the shallow and deep traps, respectively. In some samples,
GDGT−3 was below the detection limit. In these cases, TEX8 L values and estimated temperatures
were not included in the figures, but GDGT flux was calculated. A surface sediment TEX8 L value of -
0.5 (CHN-115-4-34; 51.00° S, 5.33° E) in the vicinity of the PF3 trap site (50.13° S, 5.83° E) can be
found in the TEX8 global calibration dataset (Kim et al., 2010), and its TEX8 L -derived temperature
estimate is 9.1 °C. Most samples did not exceed the index values indicating nonthermal impacts on
TEX8 (see Section 3.3.4). Two samples from the deep trap between early November and late
December 1989, however, showed MI values between 0.3 and 0.5 (Table A 3.1).
3.4.2.3 Fractional abundance of OH-GDGTs
All OH-GDGTs were clearly present in samples from both depths. OH-GDGT-0 was predominant
in the OH-GDGT pool (76−89 % for the shallow trap, 77−83 % for the deep trap; Figure 3.6a, c). The
proportion of OH-GDGTs in the sum of iso- and OH-GDGTs ranged from 4 to 7% and 5 to 6% at the
shallow and deep traps, respectively, (Figure 3.6a, c). Estimated temperatures calculated according to
Eq. (4) and (6) ranged between 3.0−6.1 °C and 1.1−5.1 °C in the shallow trap (Figure 3.6b). With the
same calibrations, estimated temperatures varied between 3.6−5.8 °C and 2.8−5.2 °C in the deep trap
(Figure 3.6d).
3.5 Discussion
3.5.1 Eastern Fram Strait (79° N)
3.5.1.1 GDGT flux and particle export
Organic matt Organic matter (including GDGTs), formed in the upper ocean, is exported to the
bathypelagic mainly as zooplankton fecal pellets or marine snow aggregates (Fischer and Karakaş,
2009; Wuchter et al., 200 b). The velocities of the sinking aggregates vary in relation to their
composition (Fischer and Karakaş, 2009; Iversen and Ploug, 2010) and physical characteristics. For
instance, aggregates formed from coccolithophores are ballasted by carbonate and may sink faster
than opal-ballasted diatom aggregates (Iversen and Ploug, 2010). Still, fecal pellets formed from
either coccolithophores or diatoms sink faster than fecal pellets formed from non-ballasted flagellates
(Ploug et al., 2008a, 2008b). GDGTs have been suggested to be preferentially incorporated in opal-
dominated particles (Mollenhauer et al., 2015). This is in agreement with observed TEX8 -derived

71
temperatures in sediment trap samples off Cape Blanc being delayed relative to the SST signal, and
this time delay was longer than for U -derived temperatures (Mollenhauer et al., 2015).
GDGT fluxes covaried with fluxes of biogenic and non-biogenic components in the eastern Fram
Strait (Fig. 3). GDGT fluxes were enhanced in summer 2007 and spring 2008 with two clear maxima
in late September 2007 and March 2008 (Figure 3.3b). Without those two distinct GDGT flux
maxima, GDGT flux showed a good correlation with opal (R2 = 0.82, p<0.0001) throughout the
deployment period. GDGT fluxes also covaried with carbonate from the beginning of the deployment
until April 2008 (R2 = 0.8, p<0.0001) (Figure 3.3a, b). This agrees with the concept that GDGTs are
transported by particles mainly containing opal and carbonate as previously shown in sediment trap
studies (Chen et al., 201 ; Huguet et al., 2007; Mollenhauer et al., 2015; Park et al., 2018; Yamamoto
et al., 2012). This observation suggests that GDGTs are exported together with diatoms (opal) and
coccolithophores (carbonate). Supporting this, diatom and coccolithophore fluxes both, previously
reported by Lalande et al., (201 ), showed good correlations with GDGT fluxes (R2 = 0. 4, p<0.001
for diatoms and R2 = 0. 8, p<0.0001 for coccolithophores) when excluding two GDGT flux maxima
in the correlations with opal fluxes. The flux of terrestrial biomarkers (campesterol+ß-sitosterol),
previously analyzed by Lalande et al., (201 ), also showed a positive correlation with GDGT flux (R2
= 0. 4, p<0.001). The sterols (campesterol and ß-sitosterol), used frequently to assess the plant-
derived organic matter input to aquatic systems (Moreau et al., 2002), reflect the input of terrestrial
matter transported by sea ice in the Fram Strait (Lalande et al., 201 ). We thus assume that terrestrial
material is aggregated into particles which carry GDGTs. However, the lithogenic flux, also
representing terrestrial input, displayed a different trend with maxima only in mid-April−mid-May
2008, when the sea ice concentration abruptly increased (Figure 3.3e). The lithogenic material seems
to be mainly supplied by downslope export from the nearby Svalbard archipelago (Lalande et al.,
201 ), with a significant input when the sea ice is present (Figure 3.3e).
GDGTs might also be exported with fecal pellets after grazing of Archaea by zooplankton. Indeed,
GDGTs have been found in decapod guts and intestines, and their abundance ratios appear to be
unaltered during gut passage (Huguet et al., 200 ). The fecal pellet carbon (FPC) flux from
appendicularians contributed more to the total carbon flux than copepod FPC flux. Both
appendicularian and copepod FPC fluxes were higher during spring 2008 than during summer 2007
(Figure 3.3d; Lalande et al., (201 )). The correlation of GDGT fluxes with appendicularian FPC
fluxes (R2 = 0. 7, p<0.05 in mid-July to mid-October 2007) implies grazing of Archaea by the
appendicularians. Appendicularians are well known to ingest micro-size particles like Archaea (<1
µm) efficiently through a fine mucus filter (Conley and Sutherland, 2017).
Overall, it is reasonable to assume that seasonal changes in the relative proportion of materials that
GDGTs can be aggregated with, may result in variable export velocities of particles carrying GDGTs

72
to deeper waters in the eastern Fram Strait.er (including GDGTs), formed in the upper ocean, is
exported to the bathypelagic mainly as zooplankton fecal pellets or marine snow aggregates (Fischer
and Karakaş, 2009; Wuchter et al., 200 b). The velocities of the sinking aggregates vary in relation to
their composition (Fischer and Karakaş, 2009; Iversen and Ploug, 2010) and physical characteristics.
For instance, aggregates formed from coccolithophores are ballasted by carbonate and may sink faster
than opal ballasted diatom aggregates (Iversen and Ploug, 2010). Still, fecal pellets formed from either
coccolithophores or diatoms sink faster than fecal pellets formed from non-ballasted flagellates (Ploug
et al., 2008a, 2008b). GDGTs have been suggested to be preferentially incorporated in opal-dominated
particles (Mollenhauer et al., 2015). This is in agreement with observed TEX8 -derived temperatures
in sediment-trap samples off Cape Blanc being delayed relative to the SST signal, and this time delay
was longer than for U -derived temperatures (Mollenhauer et al., 2015).
GDGT fluxes co-varied with fluxes of biogenic- and non-biogenic components in the eastern Fram
Strait (Fig. 3). GDGT fluxes were enhanced in summer 2007 and spring 2008 with two clear maxima
in late September 2007 and March 2008 (Figure 3.3b). Without those two distinct GDGT flux
maxima, GDGT flux showed a good correlation with opal (R2 = 0.82, p<0.0001) throughout the
deployment period. GDGT fluxes co-varied also with carbonate from the beginning of the deployment
until April 2008 (R2 = 0.8, p<0.0001) (Figure 3.3a, b). This agrees with the concept that GDGTs are
transported by particles mainly containing opal and carbonate as previously shown in sediment trap
studies (Chen et al., 201 ; Huguet et al., 2007; Mollenhauer et al., 2015; Park et al., 2018; Yamamoto
et al., 2012). This observation suggests that GDGTs are exported together with diatoms (opal) and
coccolithophores (carbonate). Supporting this, diatom and coccolithophore fluxes both, previously
reported by Lalande et al., (201 ), showed good correlations with GDGT fluxes (R2 = 0. 4, p<0.001
for diatoms and R2 = 0. 8, p<0.0001 for coccolithophores) when excluding two GDGT flux maxima
in the correlations with opal fluxes. The flux of terrestrial biomarkers (campesterol+ß-sitosterol),
previously analyzed by Lalande et al., (201 ), also showed a positive correlation with GDGT flux (R2
= 0. 4, p<0.001). The sterols (campesterol and ß-sitosterol), used frequently to assess the plant-
derived organic matter input to aquatic systems (Moreau et al., 2002), reflect the input of terrestrial
matter transported by sea-ice in the Fram Strait (Lalande et al., 201 ). We thus assume that terrestrial
material is aggregated into particles which carry GDGTs. However, the lithogenic flux, also
representing terrestrial input, displayed a different trend with maxima only in mid-April−mid-May
2008, when the sea ice concentration abruptly increased (Figure 3.3e). The lithogenic material seems
to be mainly supplied by downslope export from the nearby Svalbard archipelago (Lalande et al.,
201 ), with a significant input when the sea ice is present (Figure 3.3e).
GDGTs might also be exported with fecal pellets after grazing of Archaea by zooplankton. Indeed,
GDGTs have been found in decapod guts and intestines, and their abundance ratios appear to be
unaltered during gut passage (Huguet et al., 200 ). The fecal pellet carbon (FPC) flux from

73
appendicularians contributed more to the total carbon flux than copepod FPC flux. Both
appendicularian and copepod FPC fluxes were higher during spring 2008 than during summer 2007
(Figure 3.3d; Lalande et al., (201 )). The correlation of GDGT fluxes with appendicularian FPC
fluxes (R2 = 0. 7, p<0.05 in mid-July to mid-October 2007) implies grazing of Archaea by the
appendicularians. Appendicularians are well known to ingest micro-size particles like Archaea (<1
µm) efficiently through a fine mucus filter (Conley and Sutherland, 2017).
Overall, it is reasonable to assume that seasonal changes in the relative proportion of materials that
GDGTs can be aggregated with may result in variable export velocities of particles carrying GDGTs
to deeper waters in the eastern Fram Strait.
3.5.1.2 Variability of TEX86L -derived temperature
TEX8 L temperatures varied (-0.2 to 3.7 °C) within a similar range as the satellite-derived SSTs (-
0.1 to 3.4 °C) during the trap deployment period in the eastern Fram Strait. Although it did not display
a clear seasonality, the TEX8 L signal is most likely to reflect the surface water environments without
nonthermal effects influencing the TEX8 L (Figure 3.3). First of all, the index values (e.g. BIT,
MI, %GDGT−0, RI), which could indicate potential non-thermal factors influencing the distribution
of GDGTs, suggest that TEX8 L temperatures should reflect the upper water column temperature
(Table A 3.1). The BIT index defined by Hopmans et al., (2004) as a tracer for the terrestrial organic
matter input was very low (<0.02), showing that negligible amounts of soil-derived GDGTs are
entrained in sinking particles. MI (Zhang et al., 2011) and %GDGT-0 (Inglis et al., 2015) have been
suggested as indicators for the impact of methanotrophic Archaea even though it was questioned if the
latter index can be applied in marine settings (Inglis et al., 2015). Both index values were consistently
lower than the respective critical values of 0.3 for MI and 7% for %GDGT−0. │∆RI│ was suggested
by Zhang et al., (201 ) as an indicator for the integrated non-thermal factors on TEX8 . Most │∆RI│
values were lower than a value of 0.3, and only three samples collected in late September 2007 and
June 2008 satisfied the criteria of being influenced by nonthermal factors. Secondly, although
significant portions of particles transported to the mid-depth and deep water in the eastern Fram Strait
originated off Svalbard and the Barents Sea (Lalande et al., 201 ), it is known that GDGTs are most
likely to reflect the local conditions rather than being affected by lateral transport (J. H. Kim et al.,
2009; Mollenhauer et al., 2008). Therefore, we conclude that GDGTs are mainly transported from
upper waters and non-regional sources of particles do not play a significant role in the TEX8 L estimate
of sinking particles of the eastern Fram Strait.
TEX8 L temperatures varied strongly between mid-July and October 2007, with the minimum
estimated temperature (0. °C) when the GDGT and terrestrial biomarker fluxes were highest (Figure
3.3b, c, f). This is the most productive period in the Fram Strait and also the period with the highest

74
export fluxes (e.g. Lalande et al., 201 ). The material collected by deep ocean sediment traps is a
mixture of many types of aggregates with different composition and settling velocities. Therefore,
fluctuating TEX8 L temperatures might be due to an average of signals from previous (before mid-July,
i.e. slowly sinking particles) and current seasons (mid-July to October, i.e. fast settling aggregates),
which were exported via different aggregation and sinking mechanisms with different horizontal
displacements during particle descent. Due to the collection of aggregates sinking with different
velocities, one sample cup in a sediment trap may collect GDGTs of different ages.
During the low flux period between November 2007 and February 2008, TEX8 L temperatures were
constantly lower than the satellite-derived SSTs (Figure 3.3a, b, f). These signals might be derived
from GDGTs synthesized in mid-August to October, which was a late-bloom period dominated by
protists that do not produce biominerals, such as Phaeocystis sp., dinoflagellates, and nanoflagellates
(Nöthig et al., 2015). Aggregates formed without biominerals have low sinking velocities (Iversen and
Ploug, 2010; Ploug et al., 2008a, 2008b), which may explain why the satellite-derived SSTs from
mid-August to October 2007 were similar to the TEX8 L -derived temperatures in sinking particles
collected during November 2007 and February 2008. In spring 2008, TEX8 L temperatures stayed
relatively warm until mid-April and suddenly dropped in May and June (Figure 3.3f). The relatively
warm TEX8 L temperatures in particles collected in March and April 2008 probably reflect the signal
transported by GDGTs produced in November−December 2007. Like previous seasons, the lack of
transporting materials for GDGTs delayed the TEX8 L signal. The sudden drop in TEX8
L -derived
temperatures in mid-May to June 2008 was matched with the season of the enhanced flux of biogenic
materials, GDGTs, phytoplankton, zooplankton fecal pellets and terrestrial biomarkers at the trap
when the sea ice concentration was enhanced (Figure 3.3). Eddies around the ice edge create
upwelling and downwelling, which breaks the stratified surface water and supplies nutrients to the
upper water column, fostering phytoplankton blooms (Lalande et al., 2013). The sea ice-edge bloom
probably enhanced the GDGT production followed by zooplankton grazing. Additionally, the
terrestrial materials as ballast were more available and were derived from sea ice as it melted during
spring 2008. This process caused the fast export of TEX8 L signal from the surface waters in mid-May
to June 2008. Overall, the particles containing GDGTs captured at 129 m depth in the eastern Fram
Strait were likely delivered by a combination of packaging mechanisms involving biological and
nonbiological transport materials with different delay times over the season. Moreover, most GDGTs
are exported vertically from the upper waters and reflect a regional TEX8 L signal in the eastern Fram
Strait, while significant particle supply from the south via lateral advection has been reported
previously (Lalande et al., 201 ). This result agrees with the finding that diatom and fecal pellet
fluxes can be traced as the export of local production regardless of the lateral particle supply.

75
The average export velocity of particles containing GDGTs can be calculated by dividing the travel
distance of particles (i.e., the depth of the sediment trap) by the temporal offset between TEX8 L -
derived temperature and the corresponding satellite-derived SST, greatly simplifying the complexity
of sinking mechanisms and range of settling velocities throughout the season (Mollenhauer et al.,
2015). When the TEX8 L -derived temperatures are shifted by 82 days, we found the best fit to the
satellite-derived SSTs (Figure 3.7b). Therefore, we see that GDGTs synthesized in the eastern Fram
Strait likely travel to the trap (129 m) approximately within 82 days. This translates into an average
minimum export velocity of GDGT-containing particles of approximately 15 m d−1 when assuming
export from 30 to 80 m water depth (see Section 3.5.1.3). We have assumed that the export velocity
includes the time of GDGT synthesis and transport time to the trap. The estimated sinking velocity of
15 m d-1 is within range (9−17 m d
−1) estimated at a similar water depth (~1300 m) in the filamentous
upwelling zone off northwest Africa (Mollenhauer et al., 2015) and only slightly lower than settling
velocities found previously for aggregates from the Fram Strait (Wekerle et al., 2018). Based on the
seasonal succession of peaks in appendicularian fecal pellets in the same mooring system, their
sinking velocity was estimated to be 5- to 11- fold higher (15−35 days to 2400 m depth; Lalande et
al., 201 ) compared to GDGTs. This is a realistic scenario because of the fast sinking velocity of a
fecal pellet, being rather big and dense, and generally faster average export velocities to deeper ocean
depths (Fischer and Karakaş, 2009; Iversen et al., 2017). Moreover, the average export velocity of
GDGTs includes the time it takes to be incorporated into aggregates. A more rapid export of GDGTs
to depth resulting in smaller temporal offsets of TEX8 L -derived temperature to water temperature
changes occurred in mid-May−June 2008 when the FPC flux of appendicularians was enhanced
(Figure 3.3d). It has to be noted that the export velocity we calculated here may represent an averaged
velocity of all the aggregates collected in the trap, as the export velocity of GDGTs can vary
depending on the type of sinking materials GDGTs are incorporated into.
The flux-weighted mean TEX8 L temperature over the mooring period was 2.8 °C. In the vicinity of
the site FEVI1 (79.03° N, 4.35° E), two TEX8 L values from surface sediments are available in the
dataset published by Ho et al., (2014). The estimated temperatures based on TEX8 L are 2.8 °C and
2.3 °C in PS 8-251/2 (79.30° N, 4.30° E) and PS 8-271/2 (79.10° N, 4. 0° E), respectively.
Considering the error of the TEX8 L calibration (Kim et al., 2010), TEX8
L estimates are almost
identical between sinking particles and surface sediments. This suggests that GDGTs synthesized in
the upper waters are propagated through the water column into the sediment without significant
alteration even though the sinking process of GDGTs in the eastern Fram Strait seems quite
complicated as discussed above. Iversen et al., (2010) and Jackson and Checkley Jr. (2011) also
suggested that most biological activities resulting in aggregate alteration and degradation occur
around the base of the photic zone. Our observations agree with previous studies, as TEX8 displays

76
consistent values at multiple depths and/or in the underlying surface sediments in various
environmental regimes such as in the Arabian Sea (Wuchter et al., 200 b), in the north western Pacific
(Yamamoto et al., 2012), off Cape Blanc (Mollenhauer et al., 2015), near Iceland (Rodrigo-Gámiz et
al., 2015), off southern Java (Chen et al., 201 ), and in the northern Gulf of Mexico (Richey and
Tierney, 201 ).
Figure 3.7 Changes in TEX8 L -derived temperatures and satellite-derived SSTs (a), time-delayed TEX8
L
temperatures (b), and sensor measured temperatures at approximately 68 m water depth (c) at site FEVI16.
3.5.1.3 Potential depth of TEX86L signal origin
To determine the water depth where the TEX8 L signal originated, the flux-weighted mean TEX8
L
temperature (2.8 °C) was compared to the depth profile of nutrient concentrations (NH , NO
, and
NO ) measured in late June to early July 2010, 2011, and 2013 and water temperature extracted from
WOA13 (79.125° N, 4.375° E) in the eastern Fram Strait (Figure 3.8). Unfortunately, ammonia data
are unavailable in 2007 and 2008. The mean estimated temperature (2.8 °C) in sinking particles
corresponds to the surface water in July−September or of 30−80 m subsurface waters in April−June
(Fig. 8). Major production of GDGTs in both seasons is a possible scenario because GDGT flux
peaked in both seasons (Figure 3.3b). However, the latter period (April−June) is the more plausible
season dominantly supplying GDGTs to the sediment if we consider the delay time of the GDGT
signal (approximately 82 days; see Section 3.5.1.2), which illustrates the initial time of GDGT
production (Figure 3.3b). Furthermore, Thaumarchaeota, the primary synthesizers of GDGTs in the
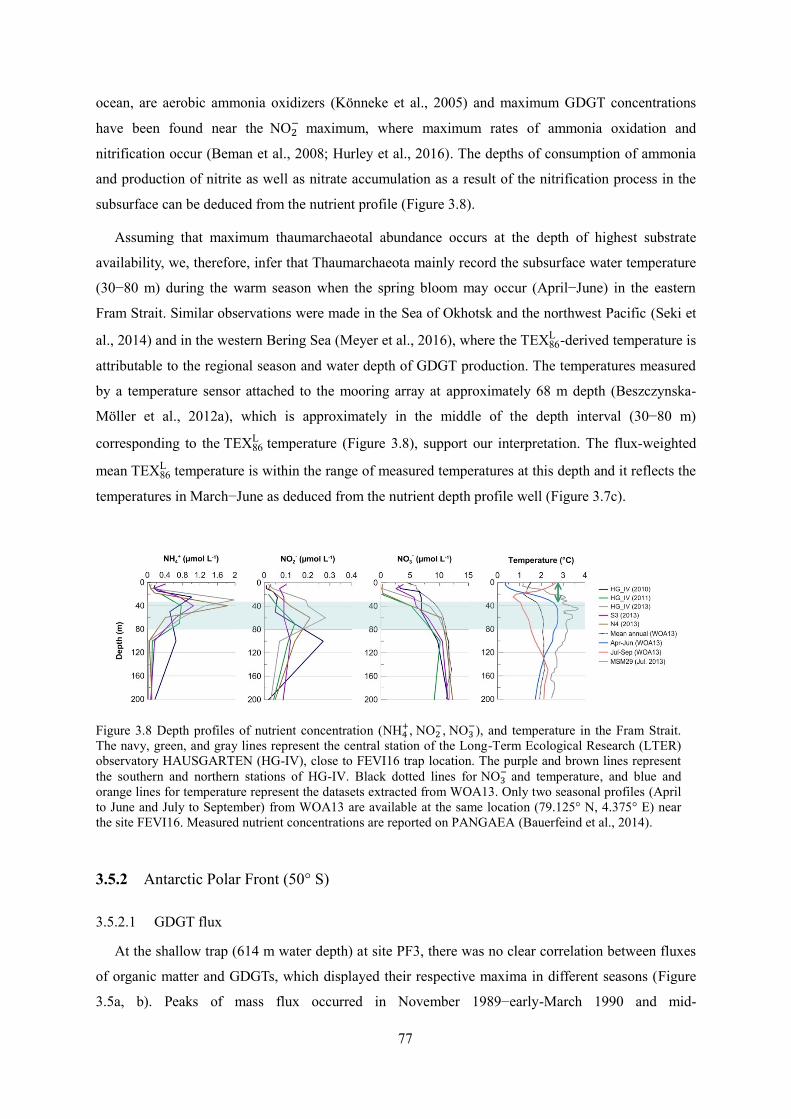
77
ocean, are aerobic ammonia oxidizers (Könneke et al., 2005) and maximum GDGT concentrations
have been found near the NO maximum, where maximum rates of ammonia oxidation and
nitrification occur (Beman et al., 2008; Hurley et al., 201 ). The depths of consumption of ammonia
and production of nitrite as well as nitrate accumulation as a result of the nitrification process in the
subsurface can be deduced from the nutrient profile (Figure 3.8).
Assuming that maximum thaumarchaeotal abundance occurs at the depth of highest substrate
availability, we, therefore, infer that Thaumarchaeota mainly record the subsurface water temperature
(30−80 m) during the warm season when the spring bloom may occur (April−June) in the eastern
Fram Strait. Similar observations were made in the Sea of Okhotsk and the northwest Pacific (Seki et
al., 2014) and in the western Bering Sea (Meyer et al., 201 ), where the TEX8 L -derived temperature is
attributable to the regional season and water depth of GDGT production. The temperatures measured
by a temperature sensor attached to the mooring array at approximately 8 m depth (Beszczynska-
Möller et al., 2012a), which is approximately in the middle of the depth interval (30−80 m)
corresponding to the TEX8 L temperature (Figure 3.8), support our interpretation. The flux-weighted
mean TEX8 L temperature is within the range of measured temperatures at this depth and it reflects the
temperatures in March−June as deduced from the nutrient depth profile well (Figure 3.7c).
Figure 3.8 Depth profiles of nutrient concentration (NH , NO
, NO ), and temperature in the Fram Strait.
The navy, green, and gray lines represent the central station of the Long-Term Ecological Research (LTER)
observatory HAUSGARTEN (HG-IV), close to FEVI16 trap location. The purple and brown lines represent
the southern and northern stations of HG-IV. Black dotted lines for NO and temperature, and blue and
orange lines for temperature represent the datasets extracted from WOA13. Only two seasonal profiles (April
to June and July to September) from WOA13 are available at the same location (79.125° N, 4.375° E) near
the site FEVI16. Measured nutrient concentrations are reported on PANGAEA (Bauerfeind et al., 2014).
3.5.2 Antarctic Polar Front (50° S)
3.5.2.1 GDGT flux
At the shallow trap (614 m water depth) at site PF3, there was no clear correlation between fluxes
of organic matter and GDGTs, which displayed their respective maxima in different seasons (Figure
3.5a, b). Peaks of mass flux occurred in November 1989−early-March 1990 and mid-
78
October−December 1990, while GDGT fluxes were highest in mid-May−June and late July−August
1990 (late austral autumn and winter) (Figure 3.5a, b). Similar observations were made in the North
Sea, where the abundance of Thaumarchaeota (previously known as marine group I Crenarchaeota)
and GDGT concentrations were high in winter time, supported by the seasonality of Thaumarchaeotal
16S rRNA and amoA gene abundances in that region (Herfort et al., 2007; Pitcher et al., 2011;
Wuchter et al., 2006a). An austral “winter bloom” of planktonic Archaea was also found near the
Antarctic Peninsula (Church et al., 2003; Alison E Murray et al., 1999; Tolar et al., 2016). Austral
winter blooms of planktonic Archaea can be explained by higher ammonia availability in winter,
while the chemoautotrophic Archaea are outcompeted by photoautotrophic phytoplankton in spring
and summer when the light is not limiting (Könneke et al., 2005; Pitcher et al., 2011). Laubscher et
al., (1993) found that ammonia was highly depleted at the chlorophyll-a maximum across the
Antarctic Polar Front in early austral summer, which might create less favorable conditions for
ammonia-oxidizing planktonic Archaea. Additionally, Thaumarchaeota are known to be sensitive to
photoinhibition (Horak et al., 2017). Therefore, the austral winter maxima in GDGT flux at the
shallow trap of PF3 might be a consequence of the higher production of planktonic Archaea in surface
waters of the APF during the time when ammonia is more available and photoautotrophs cannot
compete due to light limitation.
At the deep trap (319 m water depth) of PF3, GDGT flux peaked in November 1989 while mass
flux was most pronounced in March 1990 (Figure 3.5d, e). Due to the lack of sinking particles
captured in the deep trap in the period June to November 1990, it is unclear if a potential winter
bloom of GDGTs was also exported to deeper waters. The trapping efficiency of PF3 was found to be
below 50% at the deep trap using 230Th as flux proxy (Walter et al., 2001). The negligible mass flux
could thus be caused by low trapping efficiency. However, Fischer et al., (2002) observed a similar
flux pattern in the following years at the same location of site PF3 including periods of almost no flux
in July−December at a location further to the south in the marginal winter sea-ice zone. Thus, it is
assumed that a low trapping efficiency or a failure of the trap system did not account for the lack of
particle samples at the deep trap of PF3.
3.5.2.2 Variability of TEX86L -derived temperature
TEX8 L -derived temperatures at the shallow trap did not display a clear seasonal variability. Only
one-third of the data points were similar to the SSTs, while the remaining samples showed warm- or
cold-biased temperatures relative to the satellite-derived SSTs during the sampling period (Figure
3.5c). All samples in the deep trap displayed warmer TEX8 L temperatures by up to 7 °C relative to the
satellite-derived SSTs (Figure 3.5f). As discussed above, the mismatch between lipid proxy-based
temperature estimates and satellite-derived temperature could be explained by the delay time of the
proxy signal, due to the time needed between lipid synthesis and incorporation into sinking aggregates

79
plus the sinking time (Mollenhauer et al., 2015; Müller and Fischer, 2003; Park et al., 2018).
However, without a marked seasonality of the estimated temperature, it is difficult to determine a
delay time of the TEX8 signal. The other explanation for the absence of covariance between the
TEX8 signal and the satellite-derived SST is that we observe a mixed signal of Thaumarchaeotal
GDGTs derived from surface and deep oceans. The warm biases have a tendency to occur during
periods of lower GDGT flux and thus may include higher proportions of material from different
sources (early-December, mid-June−July, September−November), which may be more dominant in
the deep trap (see discussion below).
Warm-biased TEX8 L -derived temperatures have been attributed to the contribution of different
archaeal communities or GDGT input from terrestrial sources, which may alter the composition of
pelagic GDGTs, leading to unusual TEX8 L -derived temperature estimates (Hopmans et al., 2004;
Inglis et al., 2015; Zhang et al., 201 , 2011). For example, several studies showed that anomalous
TEX8 based temperature estimates can be caused by isoprenoid GDGTs produced by Group II
Euryarchaeota as significant contributors to the archaeal tetraether lipid pool and, thus, TEX8
(Lincoln et al., 2014; Schouten et al., 2014, 2008; Turich et al., 2007), a suggestion that is
controversial. A prevalence of marine Group II Euryarchaeota has been reported in Circumpolar Deep
Water (Alonso-Sáez et al., 2011) and in deep waters of the Antarctic Polar Front (López-García et al.,
2001; Martin-Cuadrado et al., 2008; Moreira et al., 2004; Alison E Murray et al., 1999). Therefore, we
would assume that GDGTs produced by deep-dwelling Euryarchaeota might have caused the warm-
biased TEX8 L signal at depth in the region. Alternatively, advection of particles from warmer ocean
regions could potentially lead to warm biases. However, it is known that the impact of lateral transport
of GDGTs on the local signal is insignificant (J. H. Kim et al., 2009; Mollenhauer et al., 2008).
BIT, MI, %GDGT−0, and │∆RI│ were examined to evaluate nonthermal factors on GDGT
composition and TEX8 values at both PF3 traps. However, none of the values for BIT, %GDGT−0,
and │∆RI│ exceeded the defined critical values (Table A 3.1). MI values were higher at the deep trap
than at the shallow one. The first two samples at the deep trap reached values of 0.3−0.5 MI,
suggesting that GDGTs are derived from a mixture of non-methanotrophic and methanotrophic
communities (Zhang et al., 2011). However, these two samples alone cannot fully explain the episodic
and continuous warm-biased TEX8 L estimates at the shallow and deep traps. Therefore, those indices
cannot explain the warm anomaly of TEX8 L estimates in the APF. Like in the Gulf of Mexico (Richey
and Tierney, 201 ), a longer time-series of samples would be helpful to investigate inter-annual
variability, paired with a direct assessment of the archaeal community in the region.
The flux-weighted mean TEX8 L temperatures averaged over the trap deployment period were 4.
and 8.5 °C at the shallow and deep traps, respectively. The TEX8 L temperature in surface sediment
(CHN 115-4-34; 51.00° S, 5.33° E) from the vicinity of the PF3 trap was 9.1 °C, which is 4.5 °C

80
warmer than the TEX8 L estimate temperature in the shallow trap (4. °C), but is similar to the one in
the deep trap (8.5 °C). This situation is different from the Fram Strait and other time-series trap
studies which showed that TEX8 values in different depths are almost identical (Chen et al., 201 ;
Mollenhauer et al., 2015; Wuchter et al., 200 b). This implies that there is a clearly different origin of
GDGTs in particles collected in the upper (<~ 00 m) and deeper ocean, yet the main explanation of
the warm-biased TEX8 L is still speculative.
3.5.3 Re-evaluation of TEX8 L calibration in polar oceans
In the two previous sections, the TEX8 L calibration developed by Kim et al., (2010) for regions
where ma SSTs are below 15 °C was applied. This calibration is based on data from 39 surface
sediments in the global ocean. Several studies have expanded the TEX8 and TEX8 L surface sediment
dataset. We revisited the latest global surface sediment dataset containing 1095 surface sediment
measurements (Tierney and Tingley, 2015, and references therein) to recalculate the TEX8 L
calibration and to examine the agreement of our results with the new calibration. From the dataset, the
data points for which TEX8 L values cannot be calculated or which were pointed out as problematic by
Ho et al., (2014) (see BIT>0.3 or ~1.0 and GDGT concentration below detection limit) were excluded
to avoid potential biases. With approximately 2 times more data points for the TEX8 L calibration than
the original one (Kim et al., 2010; n = 39 ), the new calibration again shows a linear correlation with
ma SSTs even though the correlation coefficient is slightly lower (Figure 3.9; TEX8 L = 0.013 × SST -
0. 57; R2 = 0.80, n = 744) and the residual standard error (±5.0 °C) is higher than those of the
calibration of Kim et al., (2010) (R2 = 0.8 , ±4.0 °C).
It should be noted that our new linear calibration has SST on the x axis as the control variable and
TEX8 L value on the y axis as the dependent variable because the composition of GDGTs (i.e., TEX8 /
TEX8 L value), membrane lipids of Thaumarchaeota, is potentially affected by water temperature. This
different regression might explain parts of the discrepancy between our and the original calibrations of
Kim et al. (2010). Larger scatter towards cold temperatures appears in the new calibration as shown in
previous studies (Ho et al., 2014; Kim et al., 2010) (Figure 3.9).
It is obvious that the relationship of ma SSTs to TEX8 L values in high latitude northern (>50° N)
and southern (>50° S) oceans is significantly different when both regions are plotted separately (Fig.
9). The data from the north (>50° N) are scattered on both the right- and left-hand sides of the
regression line, resulting in potential warm and cold anomalies, respectively (Figure 3.9). This may
reflect various sources of GDGTs in the high latitude northern oceans, which have direct geographical
connections to Eurasia and North America.

81
Figure 3.9 Correlation of TEX8 L values with mean annual SSTs in the global ocean (gray symbols; Tierney
and Tingley, (2015) and reference therein). Blue and black round symbols represent the high latitude regions
higher than 50° S and 50° N, respectively. In the southern regions (>50° S), TEX8 L values have a polynomial
correlation with ma SSTs (R2 = 0.63, n = 95). Red and orange diamonds represent the flux-weighted mean
TEX8 L of the two traps at the site PF3 and TEX8
L on the surface sediment (CHN-115-4-34), respectively.
Yellow and green round symbols represent the flux-weighted mean TEX8 L at the site FEVI16 and TEX8
L on
the surface sediments (PS68-251/2 and PS68-271/2), respectively.
Warm-biased TEX8 L estimates in these regions might be caused by input of soil-derived GDGTs,
which are picked up by the sea ice in the Arctic marginal seas (Laptev sea, Kara Sea, eastern
Greenland), and released while the sea ice melts. Alternatively, TEX8 L -derived temperatures might
reflect warmer subsurface temperatures in the warm season as shown in the subarctic North Pacific
region with the regional calibration by Seki et al., (2014) and Meyer et al., (201 ). Cold-biased TEX8 L
estimates are mainly found in the Barents Sea, North Sea, and the Norwegian Sea. In the North Sea, a
significantly enhanced abundance of planktonic Archaeal cells and high GDGT concentration in the
winter time could account for colder TEX8 L -derived temperature compared to SST (Herfort et al.,
2007; Pitcher et al., 2011; Wuchter et al., 200 a). Hence, regional calibrations in the high latitude
northern oceans seem to be a valid approach.
By contrast, most of the data from the south (>50° S) show higher TEX8 L values than predicted by
the regression line (n = 95). This explains the observed warm anomalies of TEX8 L -derived
temperature when using the original linear regression calibration. Instead of the global linear
calibration, a polynomial one seems to be a better option in these regions (Fig. 9). When excluding
one data point in the winter sea ice-covered Southern Ocean, the correlation coefficient of the
polynomial correlation is encouraging (R2 = 0. 3).
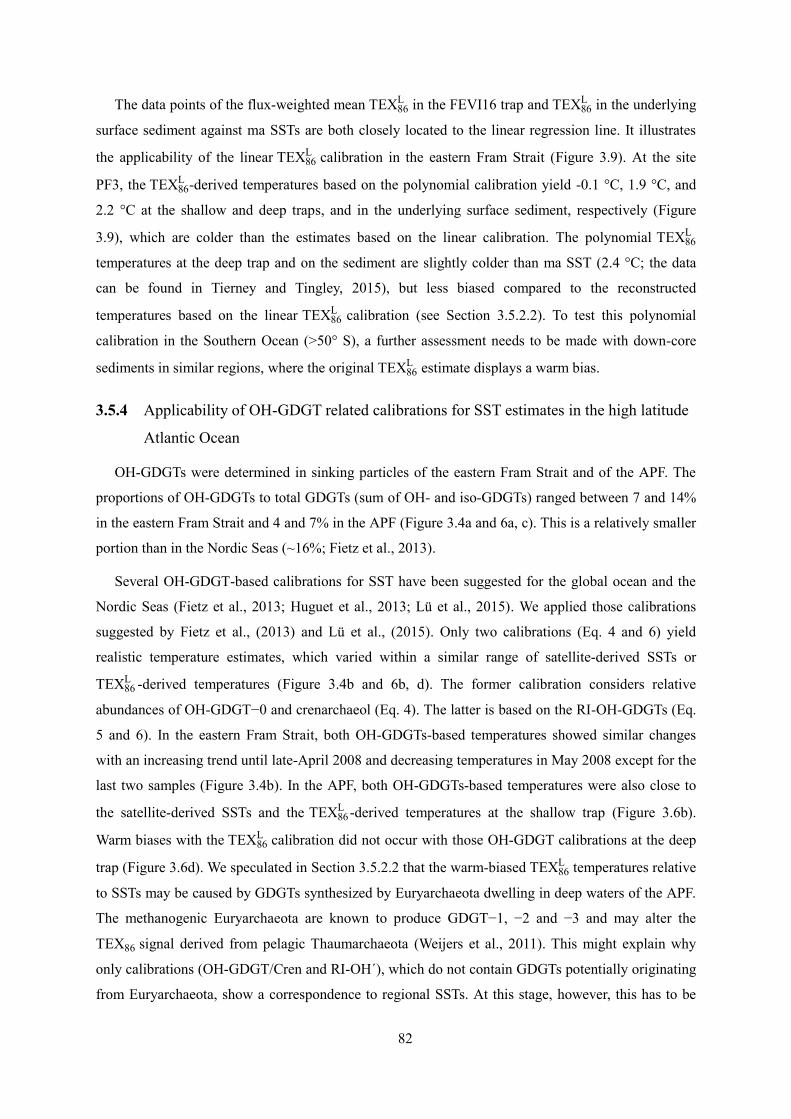
82
The data points of the flux-weighted mean TEX8 L in the FEVI1 trap and TEX8
L in the underlying
surface sediment against ma SSTs are both closely located to the linear regression line. It illustrates
the applicability of the linear TEX8 L calibration in the eastern Fram Strait (Figure 3.9). At the site
PF3, the TEX8 L -derived temperatures based on the polynomial calibration yield -0.1 °C, 1.9 °C, and
2.2 °C at the shallow and deep traps, and in the underlying surface sediment, respectively (Figure
3.9), which are colder than the estimates based on the linear calibration. The polynomial TEX8 L
temperatures at the deep trap and on the sediment are slightly colder than ma SST (2.4 °C; the data
can be found in Tierney and Tingley, 2015), but less biased compared to the reconstructed
temperatures based on the linear TEX8 L calibration (see Section 3.5.2.2). To test this polynomial
calibration in the Southern Ocean (>50° S), a further assessment needs to be made with down-core
sediments in similar regions, where the original TEX8 L estimate displays a warm bias.
3.5.4 Applicability of OH-GDGT related calibrations for SST estimates in the high latitude
Atlantic Ocean
OH-GDGTs were determined in sinking particles of the eastern Fram Strait and of the APF. The
proportions of OH-GDGTs to total GDGTs (sum of OH- and iso-GDGTs) ranged between 7 and 14%
in the eastern Fram Strait and 4 and 7% in the APF (Figure 3.4a and a, c). This is a relatively smaller
portion than in the Nordic Seas (~1 %; Fietz et al., 2013).
Several OH-GDGT-based calibrations for SST have been suggested for the global ocean and the
Nordic Seas (Fietz et al., 2013; Huguet et al., 2013; Lü et al., 2015). We applied those calibrations
suggested by Fietz et al., (2013) and Lü et al., (2015). Only two calibrations (Eq. 4 and ) yield
realistic temperature estimates, which varied within a similar range of satellite-derived SSTs or
TEX8 L -derived temperatures (Figure 3.4b and b, d). The former calibration considers relative
abundances of OH-GDGT−0 and crenarchaeol (Eq. 4). The latter is based on the RI-OH-GDGTs (Eq.
5 and ). In the eastern Fram Strait, both OH-GDGTs-based temperatures showed similar changes
with an increasing trend until late-April 2008 and decreasing temperatures in May 2008 except for the
last two samples (Figure 3.4b). In the APF, both OH-GDGTs-based temperatures were also close to
the satellite-derived SSTs and the TEX8 L -derived temperatures at the shallow trap (Figure 3. b).
Warm biases with the TEX8 L calibration did not occur with those OH-GDGT calibrations at the deep
trap (Figure 3. d). We speculated in Section 3.5.2.2 that the warm-biased TEX8 L temperatures relative
to SSTs may be caused by GDGTs synthesized by Euryarchaeota dwelling in deep waters of the APF.
The methanogenic Euryarchaeota are known to produce GDGT−1, −2 and −3 and may alter the
TEX8 signal derived from pelagic Thaumarchaeota (Weijers et al., 2011). This might explain why
only calibrations (OH-GDGT/Cren and RI-OH´), which do not contain GDGTs potentially originating
from Euryarchaeota, show a correspondence to regional SSTs. At this stage, however, this has to be

83
considered speculative. Moreover, it is not clear yet if OH-GDGTs are exclusively produced by
Thaumarchaeota since OH-GDGTs were also detected in a culture of Euryarchaeota
(Methanothermococcus thermolithotrophicus) (Liu et al., 2012). Therefore, further research is needed
to clarify various aspects of distribution, production, and modification of OH-GDGTs in response to
physicochemical changes in the global ocean. Nonetheless, OH-GDGTs appear to be a potential
temperature proxy in our two high latitude regions.
3.6 Summary and conclusion
Sinking particles collected using time-series sediment traps allowed us to determine the variability
of the downward GDGT export and the environmental influence on TEX8 L thermometry in northern
and southern high latitude regions of the Atlantic Ocean. We observed fundamentally different
patterns between the eastern Fram Strait and the Antarctic Polar Front.
In the eastern Fram Strait, the seasonally different composition of sinking materials resulted in
different sinking velocities of GDGTs, and thus the temporal offsets between TEX8 L -derived
temperatures and SSTs may vary by season. Although increased flux of terrestrial matter transported
by sea ice in intermediate and deep waters is well known in the region (Lalande et al., 201 ), TEX8 L
thermometry does not seem to be affected by lateral advection of particles. The flux-weighted mean
TEX8 L temperature in sinking particles was similar to the one in the underlying surface sediment,
indicating that the TEX8 L signal did not experience substantial changes while sinking. The flux-
weighted mean TEX8 L temperature corresponded to temperatures in water depths ranging between 30
and 80 m, where nutrient profiles suggest favorable conditions for Thaumarchaeota.
In the Antarctic Polar Front, changes in GDGT fluxes and TEX8 L temperatures are different
between the two traps moored at different depths. At the shallow trap, TEX8 L estimates do not covary
with satellite-derived SSTs, and its flux-weighted mean temperature is 4. °C. The warm-biased
TEX8 L at the deep trap and in the underlying surface sediment may be caused by GDGT contributions
from Euryarchaeota, which is dominant in the deeper part of the water column of CDW at the
Antarctic Polar Front. Alternatively, a systematic warm bias of the linear calibration in the high
latitude Southern Oocean could explain the discrepancy between TEX8 L reconstructed and observed
temperatures. The discrepancies can be reduced by using a nonlinear TEX8 L calibration developed for
high latitude samples from the Southern Hemisphere.
Our findings offer insights into the potential factors governing TEX8 L thermometry such as
nutrient availability or archaeal community composition in high latitude regions. In the high latitude
North Atlantic, regional TEX8 L calibrations can be an additional option next to the global calibration,
while in the high latitude Southern Ocean, the benefit of a polynomial TEX8 L calibration needs to be

84
further tested. Our studies suggest that OH-GDGTs-based calibrations are also worth further
investigation in the polar oceans. Accordingly, our study highlights that multiple approaches to global
versus regional calibrations, polynomial relationships, or OH-GDGTs-based calibrations are
beneficial to overcome the limitations of a single TEX8 L calibration in high latitude ocean regions.
Acknowledgments
We acknowledge the captain, crew and scientists who participated in the expeditions for collecting
sediment trap samples used in this study. This project is funded through the DFG-Research
Center/Cluster of Excellence “The Ocean in the Earth System” at the MARUM and supported by
GLOMAR−Bremen International Graduate School for Marine Sciences, University of Bremen. The
trap samples were supplied by the MARUM Centre of Marine Environmental Research at the
University of Bremen (PF3) and Alfred Wegener Institute, Helmholtz Center for Polar and Marine
Research (FEVI1 ). MHI received funding for the Helmholtz Young Investigator Group SeaPump
“Seasonal and regional food web interactions with the biological pump (VH-NG-1000)” at the Alfred
Wegener Institute.
Data availability
The data presented here are available on the PANGAEA database
(https://doi.pangaea.de/10.1594/PANGAEA.8972 8).

85
Appendix A
Table A 3.1 Index values for assessing the terrestrial and/or methanogen GDGT inputs at FEVI16 and PF3 sediment traps. The exact sampling interval of each sample
number at FEVI16 and PF3 can be found in PANGAEA (https://doi.pangaea.de/10.1594/PANGAEA.897268).
Cup no.
FEVI16 PF3
(1296 m) (614 m) (3196 m)
BIT a MI
b %GDGT-0
c │∆RI│
d BIT MI %GDGT-0 │∆RI│ BIT MI %GDGT-0 │∆RI│
1 0.01 0.09 60 0.15 0.00 0.15 58 0.05 0.00 0.34 62 0.23
2 0.01 0.11 60 0.22 0.02 0.14 58 0.08 0.00 0.30 61 0.17
3 0.01 0.11 60 0.21 0.00 0.14 64 0.24 0.00 0.21 58 0.09
4 0.01 0.10 60 0.20 0.00 0.16 61 0.16 - - - -
5 0.01 0.11 61 0.30 0.00 0.19 62 0.17 0.00 0.22 58 0.06
6 0.01 0.10 60 0.23 0.00 0.15 63 0.19 0.00 0.21 56 0.05
7 0.01 0.11 60 0.23 0.00 0.20 65 0.24 0.00 0.19 55 0.08
8 0.01 0.11 60 0.09
0.00 0.19 60 0.08 0.00 0.21 56 0.01
9 0.00 0.19 62 0.16
10 0.01 0.13 61 0.14
0.00 0.23 64 0.20 - - - -
11 0.00 0.20 59 0.06 - - - -
12 0.01 0.15 59 0.19 0.00 0.21 64 0.26 - - - -
13 0.01 0.13 59 0.10
0.00 0.21 62 0.19 - - - -
14 0.00 0.16 61 0.16 - - - -
15 0.02 0.14 59 0.13 0.00 0.15 60 0.15 - - - -
16 0.02 0.13 61 0.22 0.00 0.14 60 0.11 0.00 0.21 56 0.04
17 0.01 0.11 61 0.20 0.00 0.16 62 0.16 - - - -
18 0.01 0.09 63 0.26
19 0.01 0.10 64 0.31
20 - - - -
Total 20 samples Total 17 samples
a: BIT (Hopmans et al., 2004; Weijers et al., 2006) for terrestrial input when >0.3
b: MI (Zhang et al., 2011) for methanotrophic archaeal input when >0.5 and normal oceanic signal when <0.3
c: %GDGT-0 (Blaga et al., 2009; Inglis et al., 2015) for methanogenic archaeal input when >67%
d:│∆RI│(Zhang et al., 2016) for both methanotrophic archaeal and terrestrial input >0.3

86

87
CHAPTER 4
GDGTs in sinking particles of
the oligotrophic ocean: TEX thermometry
in the central Brazil Basin
In preparation for Organic Geochemistry

88
4 Manuscript III
GDGT in sinking particles of the oligotrophic ocean: TEX
thermometry in the central Brazil Basin
Eunmi Park1,2,3
, Jens Hefter1, Gerhard Fischer
2,3, Gesine Mollenhauer
1,2,3
1Alfred Wegener Institute, Helmholtz Center for Polar and Marine Research, D-27570 Bremerhaven,
Germany 2MARUM Centre for Marine Environmental Sciences, University of Bremen, D-28334 Bremen,
Germany
3Department of Geosciences, University of Bremen, D-28334 Bremen, Germany
Abstract
The TEX8 temperature proxy, based on the relative abundance of glycerol dialkyl glycerol
tetraethers (GDGT) in marine sediments, is calibrated to the overlying water temperature in the global
ocean. Most TEX8 studies focus on high productivity or high latitude regions, which experience
rapid climate change, albeit the important role of the oligotrophic zone in the global heat distribution.
In this study, the seasonal trends of GDGT flux and TEX8 H -derived temperature are examined in
sinking particles collected by time-series sediment traps at two sites in the central Brazil Basin of the
South Atlantic oligotrophic gyre (WA9 at 7.50° S/ 28.10° W; WAB1 at 11.53° S/ 28.52° W). At each
study site, traps were moored in two depths. Mass and GDGT flux at 591 and 445 m depth of site
WA9 are highest when the trade winds are strong in July. At site WAB1, both fluxes are lower than at
WA9, with multiple flux maxima at 727 m depth and a smoothed pattern at 4515 m depth. Good
correlations between fluxes of GDGTs and opal/carbonate at both shallow traps reveal the preferential
incorporation of GDGTs in opal- and carbonate-rich aggregates. TEX8 H -derived temperatures
resemble the satellite-derived SST without seasonality at 591 m of site WA9, while they display
consistent warm-biases at the 727 m trap of site WAB1. It has been shown in laboratory experiments
and in field studies that higher RI and thus TEX8 values occur under energy-stress conditions like
low ammonia oxidation rates (Hurley et al., 201 ). This likely accounts for the warm-biased TEX8
temperature at the shallow trap of site WAB1 in the oligotrophic gyre. In both deep traps of sites
WAB1 and WA9, the TEX8 H -derived temperatures reflect subsurface temperatures. We speculate that
in situ GDGT production in deep waters presenting colder signals overprint the relatively warm
surface signal in deep waters and surface sediments. Our results suggest that TEX8 thermometry in
the oligotrophic oceans is governed by the complex interplay of factors including nutrient conditions,
sinking pathways, and the deep production.

89
4.1 Introduction
An organic paleothermometer for sea surface temperature (SST), TEX8 , is based on the relative
abundance of isoprenoid glycerol dialkyl glycerol tetraether (GDGT) lipids. GDGTs are produced by
ammonia-oxidizing Thaumarchaeota (formerly Group I Crenarchaeota), one phylum of Archaea
(Schouten et al., 2002). The ubiquity of these organisms in the ocean allows the TEX8 proxy to be
applied in high (polar and sub-polar) and low latitude (tropical) regions, an advantage compared to the
other organic temperature proxies, including U (Delong, 2003; Schouten et al., 2002). For the
tropical regions (>28 °C), U is problematic because the proxy saturates and the sensitivity to
temperature diminishes (Prahl and Wakeham, 1987).
The original linear calibration of TEX8 with SSTs is based on values obtained from surface
sediments and has been refined using an expanded database to the base 10 logarithmic scale
“log10(TEX8 )” named TEX8 H for the regions with mean SST above 15 °C (Kim et al., 2010).
Recently, the Bayesian, spatially-varying regression (BAYSPAR) SST prediction model has been
developed (Tierney and Tingley, 2015). This model based calibration reconstructs temperatures with a
consideration of spatially varying uncertainties and TEX8 -temperature relationships by each 20° x
20° latitude-longitude grid. Several studies for both modern oceans (Chen et al., 201 ; Park et al.,
2018; Richey and Tierney, 201 ) and paleoenvironments (Kim et al., 2012b; Lopes dos Santos et al.,
2010; McClymont et al., 2012) have shown that TEX8 H based temperature estimates reflect subsurface
temperatures rather than mean annual (ma) SSTs in highly productive upwelling regions. Reflection
of subsurface temperature is often explained by the contribution of deeper dwelling planktonic
Archaea.
The main synthesizers of GDGTs in the ocean are ammonia-oxidizing Archaea, which nitrify
ammonia to nitrite (Horak et al., 2013; Könneke et al., 2005). With notable energy efficiency (Horak
et al., 2013; Könneke et al., 2014), Archaea can adapt to nutrient-limited marine conditions. This
agrees with the high activity and abundance of Archaea at the depth of the nitrite maximum in the
oligotrophic oceans (Horak et al., 2017; Sintes et al., 2013). Notably, Horak et al., (2017) showed that
the community structure of Thaumarchaeota is changed from near the subtropical transition zone
toward the oligotrophic gyre. This might lead to an additional factor in determining water column
TEX8 signals.
Recent culture studies have documented an increase in TEX8 values under low nitrification rates
(Hurley et al., 201 ) and low oxygen conditions (Qin et al., 2015), indicating a potential non-thermal
influence on the relative abundance of isoprenoid GDGTs and TEX8 thermometry.
The TEX8 calibration based on the Bayesian model collected TEX8 values from 1095 locations
in the global ocean (Tierney and Tingley, 2015 and reference therein). In this dataset, most points are

90
from the continental shelf and slope sites with relatively few samples from true deep-sea sites in the
north and south subtropical oligotrophic gyres of the Pacific and the Atlantic Oceans, and the Indian
Ocean. These oligotrophic subtropical oceans are characterized by a deep thermocline and depleted
nutrients in the surface mixed layer coinciding with deep chlorophyll maxima (DCM) and year-round
low primary production (Mignot et al., 2014). However, the sheer size of the oligotrophic oceans
makes their contribution to the carbon export substantial. Moreover, the gradual expansion of the
oligotrophic gyres in response to global warming calls for continuous attention to these regimes
(Polovina et al., 2008).
To provide insight into the environmental variables influencing the GDGT composition and the
interpretation of TEX8 temperature signals in the water column and in the sediments of the South
Atlantic oligotrophic gyre region, we investigate the variability of seasonal GDGT flux and TEX8 H -
derived temperature in sinking particles collected using moored sediment traps in the central Brazil
Basin.
4.2 Oceanographic setting
In the South Atlantic Ocean, the anticyclonic subtropical gyre is formed by boundary currents: the
Benguela Current (BC) flowing along the southwestern coast of Africa as the eastern boundary,
westward flowing South Equatorial Current (SEC) fed by the Benguela current in the north, the Brazil
Current flowing southward along the northeastern Brazil in the west, and the South Atlantic Current
flowing eastward in the South (Figure 4.1) (Peterson and Stramma, 1991; Stramma and England,
1999). Near the equator, the seasonal trade winds and the location of the Intertropical Convergence
Zone (ITCZ) are responsible for the variability of surface currents and upwelling. During the austral
winter (June−September), the southeasterly (SE) trade winds stimulate the SEC and thus the eastern
equatorial upwelling (Figure 4.1) (Shannon and Nelson, 199 ). During the austral summer (boreal
winter) when the ITCZ is situated in the southernmost part, Saharan dust can be transported over long
distances and reach the equatorial Atlantic (Wefer and Fischer, 1993).
The physical restriction caused by the gyre leads to nutrient-depleted environments in the open
oceans. Despite of the low biological productivity in these oceans (e.g. North and South Atlantic, and
North and South Pacific central ocean), the concern regarding their significant contribution to the C-
and N- cycles has risen due to their sizes covering approximately 40% of the world oceans (Mignot et
al., 2014; Polovina et al., 2008). The Atlantic Meridional Transect (AMT) programme provided
important insights into the temporal and spatial variability of planktonic ecosystems in relation with
biogeochemical parameters in the Atlantic Ocean between 50° N and 52° S including the North and
South Atlantic oligotrophic gyres (Robinson et al., 200 ). The central South Atlantic Tropical Gyre
(SATL) region was defined as autotrophic, and nutrients play a role as limiting factors for
phytoplankton biomass and growth rate in that region. Nutrients are supplied by lateral transport near

91
the gyre edges and by convection or mesoscale eddies across the thermocline into the euphotic zone
(Robinson et al., 200 and references therein). The south Atlantic oligotrophic ocean is characterized
by extremely low chlorophyll a concentrations (<0.1 mg m-3) with a deep chlorophyll maximum
(DCM) and permanently stratified surface water masses. When the WAB1 tap was recovered in May
1998, the DCM was recorded at around 200 m water depth with only 0.12 mg m-3 chlorophyll-a
concentration (METEOR-Cruise 41/4 cruise report; Fischer, G. et al., 1999). Daily SSTs measured by
AVHRR varied in the range of 24. −29.1 °C near site WAB1 and 25.5−28.8 °C near site WA9 while
the traps were deployed. According to WOA13 data, the nitrate-depleted upper water column extends
down to 125 m depth at site WAB1 and 100 m at site WA9 (Garcia et al., 2013).
4.3 Material and methods
4.3.1 Sample collection
Two mooring systems were deployed in the oligotrophic central Brazil Basin situated within the
South Atlantic subtropical gyre (Figure 4.1, Table 4.1). Sinking particles were collected using time-
series sediment traps (Kiel type, opening area: 0.5 m2) equipped with a rotating plate at two different
water depths. The rotating carousel for the collection of 20 samples was programmed for a 17 day
sampling interval for each sample bottle of WA9. The WAB1 trap had a sampling interval of 22.5
days, with 20.5 days intervals for the first and the last sample bottle, of the sampling period. The
location and deployment period of each trap can be found in Table 4.1. A detailed method for the trap
sample handling is described in Fischer and Wefer, (1991). Each sample cup was poisoned with HgCl2
before and after the deployment to avoid further biological activity. After the recovery, large
swimmers were picked out using forceps and later samples were sieved with a 1 mm mesh in the
home laboratory. Samples were split into 5 parts for further chemical and biological analysis in the
home laboratory. Surface sediment (GeoB 5201-8; 28.5° W, 11.5° S) sampled at the WAB1 trap
location was also analyzed.
4.3.2 Mass flux
Freeze-dried particle samples were ground and homogenized for the following chemical analysis at
the University of Bremen. Total carbon (TC) and total nitrogen (TN) were directly measured using a
CHN-analyzer (Fischer and Karakaş, 2009). Total Organic Carbon (TOC) content was analyzed after
treatment with 2N HCl. Carbonate content was obtained by subtracting OC from TC. Opal (biogenic
silica) was analyzed with a sequential leaching technique according to Müller and Schneider, (1993).
The lithogenic component was determined as follows: total flux − (opal + carbonate + 2×TOC).
“2×TOC” is assumed to approximate the mass of organic matter.

92
Figure 4.1 Two mooring systems (WA9 and WAB1) were deployed to collect sinking particles in the
northeast oligotrophic central Brazil Basin. The background represents the monthly chlorophyll-a
concentrations in February and August 2013. The data was extracted from Ocean color Climate change
Initiative dataset, European Space Agency (available online at http://www.esa-oceancolour-cci.org/). Four
major currents in the South Atlantic Ocean (Benguela Current (BC), westerly South Equatorial Current (SEC),
southerly Brazil Current, and easterly South Atlantic Current (SAC)) develop the south Atlantic oligotrophic
gyre. Parts of the SEC also feed the North Brazil Current. The map is created based on the Ocean Data View
(Available online http://odv.awi.de; Schlitzer, 2017).
4.3.3 Lipid extraction and analysis
5−1 0 mg of sediment trap samples and 5 g of the surface sediment sample were extracted. Total
lipids (TLE) were extracted three times with an ultrasonic bath for 10 minutes using 2 mL for sinking
particles and 10 mL for surface sediment of a solvent mixture (9:1 v/v dichloromethane (DCM) to
methane (MeOH)). The samples were centrifuged after each extraction, and the supernatants were
combined. Before the extraction, a known amount of C-4 GDGT was added as an internal standard to
achieve the lipids quantification. The TLEs were dried under a stream of N2 gas and then saponified
using 1 mL of 0.1 M potassium hydroxide in methanol and water (9:1 v/v) at 80 °C for two hours.
Neutral lipids recovered in n-hexane (Hex) were separated into three different polarity fractions via
deactivated silica gel column chromatography (mesh size: 70−230 µm) eluting with 2 mL Hex, 4 mL
DCM: Hex (2:1 v/v), and 4 mL DCM: MeOH (9:1 v/v) for apolar, ketone, and polar fractions,
respectively. The polar fractions were filtered through a 0.45 µm pore size polytetrafluoroethylene
(PTFE) syringe filter and re-dissolved in Hex: isopropanol (99:1 v/v) at a 2 mg ml-1 concentration
prior to GDGT analysis according to Hopmans et al., (2000).

93
Table 4.1 Sampling details of the sediment trap moorings and core-top sediment. Exact dates for the opening and closing of each sampling cup can be found along with
fractional GDGT data on www.pangaea.de (the exact address will be followed).
Name
Location Water depth
Trap depth
Deployment period Flux-weighted mean
temperature Intervals
Cruise name
References Latitude
(° S) Longitude
(° W)
Start End
(m) (m) (dd.mm.yyyy) (°C) (no × days)
WA9 7.5 28.1 4996 591
23.03.1996 26.02.1997 27.4
20×17 M34/4 M38/1
Fischer, G. et al., (1996) Fischer, G. et al., (1998)
4456 24.9
WAB1 11.55 28.52 5483 727
27.02.1997 19.05.1998 29.2
2×20.5, 18×22.5
M38/1 M41/4
Fischer, G. et al., (1998) Fischer, G. et al., (1999)
4515 24.6
GeoB 5201-8
11.53 28.52 5461 - - - 24.7 - M41/4 Fischer, G. et al., (1999)
* The exact sampling interval of each sample at WA9 and WAB1 can be found in PANGAEA

94
GDGTs were analyzed using high performance liquid chromatography (HPLC; Agilent 1200
series) coupled with an atmospheric pressure chemical ionization interface to the single quadrupole
mass selective detector (APCI-MS; Agilent 120 series). GDGT separation was achieved on an
Alltech Prevail Cyano column (2.1 × 150 mm, 3 µm, with flow rate at 0.2 ml min-1). The contents of
isoprenoids (GDGT-1, -2, -3, Crenarchaeol, Crenarchaeol regio-isomer) and branched GDGTs ([I],
[II], [III]) were determined by integrating the peak areas of masses (m/z) 1302, 1300, 1298, 129 and
1292 and 1050, 103 and 1022, respectively. Detailed conditions for GDGT analysis followed the
methods described by Schouten et al., (2007) and Chen et al., (201 )
4.3.4 Temperature estimate and GDGT flux
Chromatogram peak areas of GDGTs were used to calculate TEX8 and TEX8 H values according to
Schouten et al., (2002) and Kim et al., (2010), respectively :
TEX8 = ([GDGT-2] + [GDGT-3] + [Cren´]) / ([GDGT-1] + [GDGT-2] + [GDGT-3] + [Cren´]) (1)
TEX8 H = Log10 (TEX8 ) (2)
The numbers refer to the number of cyclopentane moieties in the isoprenoid GDGTs, and Cren´ is
the regio-isomer of Crenarchaeol containing four cyclopentane rings and one cyclohexane ring.
TEX8 H values were converted to water temperature using the following calibration according to
Kim et al., (2010):
SST (°C) = 8.4 × TEX8 H + 38. (R
2 = 0.87, n = 255) (3)
As an alternative calibration, the Bayesian regression model (BAYSPAR) (Tierney and Tingley,
2015) with default settings in the standard prediction mode was also applied to covert TEX8 values
to water temperature (available online at http://bayspar.geo.arizona.edu/).
The GDGT flux represents the sum of all GDGT fluxes, which are used to calculate TEX8 ratios.
The Flux-weighted mean TEX8 value was calculated as follows:
Flux-weighted mean TEX8 = ∑{TEX8 i × GDGT fluxi × sampling interval (days)i} / ∑{GDGT fluxi
× sampling interval (days)i} (4)
4.3.5 Indices for non-thaumarchaeotal GDGT source
BIT, the Branched and Isoprenoid Tetraether index, was calculated according to Hopmans et al.,
(2004):
BIT = ([I] + [II] + [III]) / ([I] + [II] + [III] + [Cren]) (5)

95
Roman numbers I, II, and III refer to branched GDGTs with m/z 1022, 103 , and 1050. A possible
impact of terrestrial organic matter on TEX8 is considered when the BIT value is >0.3.
MI, the methane index, was calculated to assess the relative input of GDGTs synthesized by meth-
anotrophic Euryarchaeota against by Thaumarchaeota as follows (Weijers et al., 2011; Zhang et al.,
2011):
MI = ([GDGT-1] + [GDGT-2] + [GDGT-3]) / ([GDGT-1] + [GDGT-2] + [GDGT-3] + [Cren] + [Cren´])
( )
when the MI value is lower than 0.3, it indicates a normal marine GDGT distribution while when the
MI value is higher than 0.5, hydrate-impacts are suggested.
%GDGT-0 can be used to assess the sedimentary methanogenic Archaea mainly producing
GDGT-0 (Blaga et al., 2009; Sinninghe Damsté et al., 2012):
%GDGT-0 = {([GDGT-0]) / ([GDGT-0] + ([Cren])} × 100 (7)
The %GDGT-0 can exceed 7% when there is an additional source of GDGTs produced by methano-
genesis.
The Ring Index (RI) is defined as follows (Zhang et al., 201 ):
RI = 0 × [GDGT-0] + 1 × [GDGT-1] + 2 × [GDGT-2] + 3 × [GDGT-3] + 4 × [Cren] + 4 × [Cren´] (8)
where each bracket indicates the relative proportion of GDGT in the sum of total GDGTs.
RI has a correlation with TEX8 values on the modern surface sediment dataset as follows:
RIcalculated = − 0.77(±0.38) × TEX8 + 3.32(±0.34) × (TEX8 )2 + 1.59(±0.10) (R
2 = 0.87, n = 531) (9)
when the difference of RI values (│∆RI│) between the calculated one by eq. 9 and the measured one
in geological samples is larger than 0.3, the authors suggest that it likely indicates the influence of
soil-derived GDGTs or methanotrophic archaeal GDGTs (Zhang et al., 201 ).
│∆RI│= RIcalculated − RIsample (10)
4.3.6 Environmental data
Daily SSTs were extracted from the data set measured by the Advanced Very High Resolution
Radiometer (AVHRR) of the National Oceanic and Atmospheric Administration (NOAA) (Reynolds
et al., 2002). The temperatures were averaged over each sampling time to compare with the TEX8 H -
derived temperatures. The AVHRR has a 0.25° grid of spatial resolution. Chlorophyll-a concentrations
were extracted from the Ocean Color Climate Change Initiative dataset, European Space Agency
(available online at http://www.esa-oceancolour-cci.org/) to show the seasonal difference of
chlorophyll-a concentration in the study region (Figure 4.1). The spatially averaged (8 days)

96
chlorophyll-a (Chl-a) concentration with a grid size of 1° around the trap location was also extracted
and averaged over 10 years (2001−2010) to show the seasonal variation. This satellite data is only
available since September 1997, which does not cover the entire time period of the trap deployments.
4.4 Results
4.4.1 WA9
4.4.1.1 Mass and GDGTs fluxes
Mass fluxes at the northern site WA9 (7.5° S) range from .1 to 103.2 mg m-2 d
-1 and from 1 .3 to
82.5 mg m-2 d
-1 at the shallow (591 m) and deep trap (445 m), respectively (Figure 4.2b, e).
Maximum fluxes occur in early July 199 at both depths. Carbonate accounts for 35−8 % and
5 −81% of total mass fluxes at the shallow and deep depth, respectively. GDGT fluxes vary between
24.7 and 30 .1 ng m-2 d
-1 at the shallow trap and between 87.1 and 184.8 ng m
-2 d
-1 at the deep trap
(Figure 4.2c, f). GDGT flux at the shallow trap shows the best correlation with opal flux (R2 = 0.85)
followed by carbonate flux (R2 = 0.72) and TOC flux (R
2 = 0.70, not shown) (Figure 4.3). Each
variable shows a weaker correlation with GDGTs at the deep trap (R2 = 0.5 for opal, R
2 = 0.50 for
carbonate, and R2 = 0.45 for TOC) relative to the shallow trap.
4.4.1.2 TEX86H estimations
In particles collected at the shallow trap, TEX8 values range between 0. and 0.70 (Figure 4.2c).
The TEX8 H -derived temperature according to Kim et al. (2010) ranges between 2 .2 and 28.1 °C and
resembles the satellite-derived SSTs (2 .1−28.0 °C) even though TEX8 H estimates in sinking particles
do not display the seasonality observed at the surface (Figure 4.2c). BAYSPAR SSTs vary between
30.3 and 33.7 °C for these samples (not shown). At the deep trap, TEX8 values range between 0. 1
and 0. 5 and their estimated TEX8 H temperatures range between 23.8 and 25.7 °C Figure 4.2f, g).
BAYSPAR SSTs vary between 2 .3 and 29. °C (Figure 4.2g). The Flux-weighted mean TEX8 H
temperatures are 27.4 °C and 24.9 °C at the shallow and deep trap, respectively (Table 4.1).
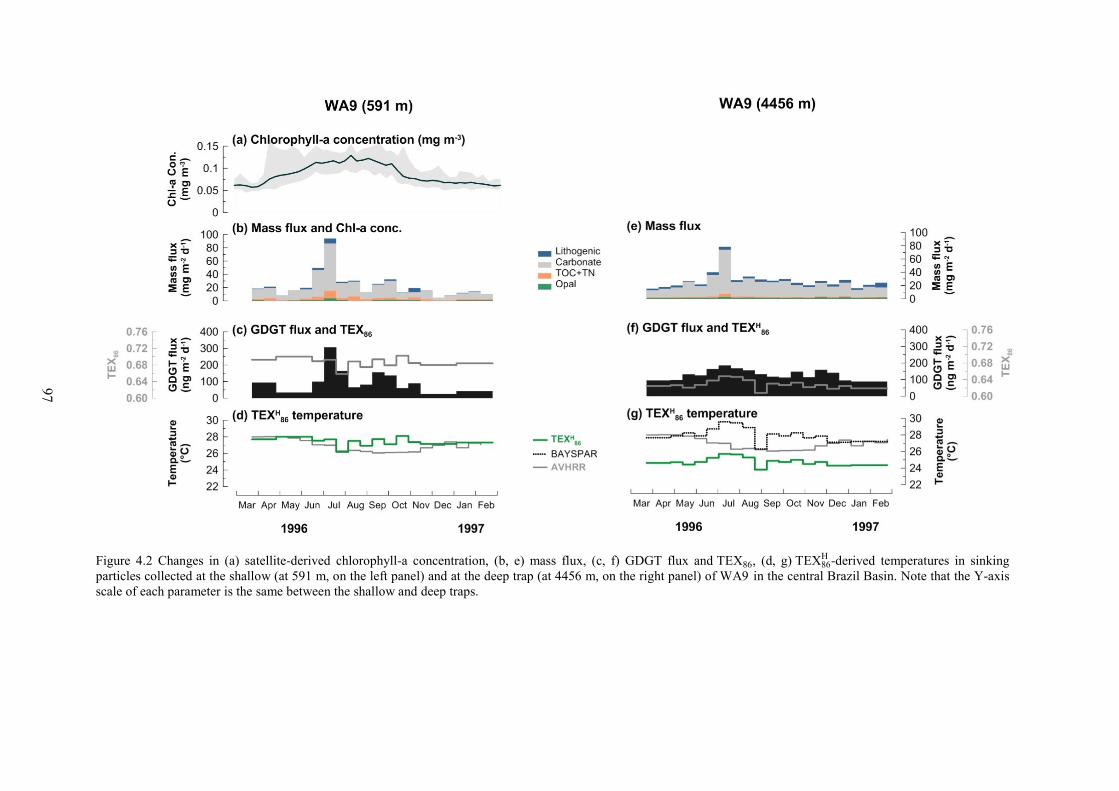
97
Figure 4.2 Changes in (a) satellite-derived chlorophyll-a concentration, (b, e) mass flux, (c, f) GDGT flux and TEX8 , (d, g) TEX8 H -derived temperatures in sinking
particles collected at the shallow (at 591 m, on the left panel) and at the deep trap (at 4456 m, on the right panel) of WA9 in the central Brazil Basin. Note that the Y-axis
scale of each parameter is the same between the shallow and deep traps.

98
WA9
WAB1
Shallow (591 m) Shallow (727 m)
Deep (4456 m) Deep (4515 m)
Figure 4.3 . Correlations of GDGT flux with opal and carbonate fluxes at the shallow and deep traps of the
sites WA9 (left panel) and WAB1 (right panel).
4.4.2 WAB1
4.4.2.1 Mass and GDGT s fluxes
Mass fluxes at the southern site WAB1 (11.5° S) range between 3.7 and 19.3 mg m-2 d
-1 and
between 4. and 18.5 mg m-2 d
-1 at the shallow (727 m) and deep trap (4515 m), respectively (Figure
4.4b, e). Multiple peaks occur in late February to April, August, November 1997, and March 1998 at
the shallow trap while the changes in mass fluxes are rather smoothed at the deep trap with a
maximum in June 1997. Mass fluxes are dominated by carbonate accounting for 37− 8% of mass flux
at the shallow trap and −79% at the deep trap. Over the trap deployment period, GDGT fluxes are
higher in the deep trap (58.9−181.9 ng m-2 d
-1) than in the shallow trap (3.1−48.9 ng m
-2 d
-1) (Figure
4.4c, f). Maxima in GDGT flux occur when mass fluxes are enhanced at the shallow trap while they
are not paralleled by mass flux maxima at the deep trap. GDGT flux is correlated with opal (R2 =
0.85) and carbonate (R2 = 0.81) fluxes at the shallow trap (Figure 4.3). At the deep trap, no
correlations between GDGTs and other components are found (Figure 4.3; R2 = 0.02 for opal, R
2 =
0.04 for carbonate).

99
Figure 4.4 Changes in (a) satellite-derived chlorophyll-a concentration, (b, e) mass flux, (c, f) GDGT flux and TEX8 , (d, g) TEX8 H -derived temperatures in sinking
particles collected at the shallow (at 727 m, on the left panel) and at the deep trap (at 4515 m, on the right panel) of WAB1 in the oligotrophic Brazil Basin. Note that the
Y-axis scale of each parameter is the same between the shallow and deep traps.

100
4.4.2.2 TEX86H estimations
At the shallow trap, TEX8 values range between 0. 9 and 0.74 (Figure 4.4c). TEX8 H -derived
temperatures vary between 27.4 and 29.8 °C while the satellite-derived SSTs change between 24.9
and 28.4 °C when daily satellite SSTs are averaged according to the periods of each sample cup
(Figure 4.4d). BAYSPAR SSTs exhibit higher temperatures (28.1−34.1 °C) compared to the TEX8 H
calibration (not shown). At the deep trap, TEX8 values vary between 0. 1 and 0. 4 and the TEX8 H -
derived temperatures range between 24.1 and 25.3 °C (Figure 4.4f, g). The Flux-weighted mean
TEX8 H temperatures are 29.2 °C and 24. °C at the shallow and deep trap, respectively. The TEX8
H -
derived temperature in the underlying surface sediment (GeoB 5201-8; 28.5° W, 11.5° S) of the
WAB1 trap is 24.7 °C (Table 4.1).
4.5 Discussion
4.5.1 Flux: seasonal mesotrophic (WA9) vs. oligotrophic (WAB1) condition
Seasonal variability in mass and GDGT fluxes are more pronounced in the shallow traps at both
sites WA9 and WAB1, with more smoothed patterns at both deep traps compared to the shallow ones
(Figure 4.2 and 4.4). The relative mass and GDGT fluxes are higher at site WA9 than at site WAB1 by
a factor of 2.5 (Figure 4.2 and 4.4). No big difference in the GDGT fluxes are found between deep
traps, but the GDGT flux recorded in the shallow trap at WA9 was almost 5 times higher than the one
at WAB1 (Figure 4.2c and 4.4c). This might be due to the different oceanographic regimes of the two
sites; WA9 was moored near the boundary region of the oligotrophic gyre while the WAB1 trap was
located more towards the gyre interior (Table 4.1). When the SEC is enhanced by the seasonal trade
wind near the equator in austral winter, a deepened mixed layer and relatively higher primary
production can be found across the Atlantic expanding from the east to the west as a result of the
upwelling (Figure 4.1). This could lead the enhanced nutrient supply into surface waters at site WA9
stimulating primary production in the euphotic zone and, hence, export of the organic matter (Figure
4.2b, c). The seasonal lateral nutrient inflow at the gyre fringe is a well-known mechanism in the
oligotrophic gyre (McClain et al., 2004). Instead, the more often enhanced fluxes in mass and GDGTs
recorded at the shallow trap of the more southern location of WAB1 show the dynamics of physical
forcing and biological response in the gyre center; the seasonal production in March when Ekman
upwelling occurs, in August when the mixed layer is deepest, and in October-November when the
downwelling is strongest (Figure 4.4b, c) ( McClain et al., 2004).
The Chl-a concentration averaged over 2001-2010 also showed seasonal maxima in austral winter
at both trap locations (Figure 4.2a and 4.4a) with relatively higher concentrations at WA9 than at
WAB1. Although the Chl-a concentration is extracted from 2001−2010 due to the unavailability of

101
Chl-a data for most of the trap sampling time (only available from September 1997), different from
the exact period of the trap deployment, a 10 years period can probably show the general seasonal
variation of this parameter in these regions. Some studies use Chl-a concentration in the surface water
of the tropical ocean to define the level of productivity; oligotrophic (Chl-a <0.1 mg m-3), mesotrophic
(0.1 < Chl-a < 1 mg m-3), eutrophic (1 < Chl-a < 10 mg m
-3) condition (Franz, 2012; Vedernikov et al.,
2007). As shown in Figure 4.2a and Figure 4.4a, most of Chl-a values in austral winter fell in the
range of mesotrophic conditions at site WA9 while they stayed below 0.1 mg m-3 typical for
oligotrophic conditions at site WAB1. This allows site WA9 to be described as being seasonally
mesotrophic.
At the seasonally mesotrophic northern site WA9, a notable seasonal peak of GDGT flux in July
199 co-occurs with a mass flux maximum at the shallow trap and with a coeval slight increase at the
deep trap (Figure 4.2c, d, f, g). A co-variation of GDGT flux with opal and carbonate flux with good
correlations (R2 = 0.85 for opal, R
2 = 0.72 for carbonate) at the shallow trap and relatively weaker
correlations at the deep trap (R2 = 0.5 for opal, R
2 = 0.50 for carbonate) are observed (Figure 4.3).
Several studies have reported similar results with good correlations of GDGT with total fluxes and for
those of opal, carbonate, TOC, or TN in various oceanic regimes; in Santa Barbara Basin (with total
flux; Huguet et al., 2007), in the western North Pacific (with OC, opal, and lithogenic material;
Yamamoto et al., 2012), in the Cariaco Basin (with TOC and carbonate; Turich et al., 2013), off
northwest Africa (with TOC and opal; Mollenhauer et al., 2015), in the eastern Indian Ocean (with
opal and carbonate; Chen et al., 201 ), and in the equatorial Guinea Basin (with opal; Park et al.,
2018). By contrast, a recent study by Richey and Tierney, (201 ) using a mooring system found no
correlation between GDGTs and TOC or mass flux in the northern Gulf of Mexico.
Strong correlations of GDGT flux with opal (R2 = 0.85) and carbonate flux (R
2 = 0.81) are also
observed at the shallow trap of the southern more oligotrophic site WAB1 while no correlations are
found between the respective fluxes at the deep trap (Figure 4.3). Our results support previous
findings that opal- and carbonate-rich aggregates play an important role in transporting GDGTs from
the upper water column, where lipids are produced and aggregates formed, to the deep waters.
However, it is unclear at this stage what causes the weak correlations at the deeper traps (445 m for
WA9; 4515 m for WAB1) and how GDGTs are exported to deep waters (below the depth of the
shallow trap) at both study sites (Figure 4.3).
At the oligotrophic site WAB1, given the higher mass and GDGT fluxes at the deep trap relative to
the shallow one and the lack of correlation between them (Figure 4.3), a significant contribution of
allochthonous sinking particles from regions with relatively higher productivity to the deep sediment
trap could explain the observations. The deep trap likely has a wider catchment area than the shallow
trap. Higher fluxes at deeper depth traps have been observed in other ocean regimes before; in the

102
eastern Atlantic (Fischer and Wefer, 199 ), in the Porcupine Abyssal Plain (Lampitt et al., 2001), in
the Arabian Sea (Wuchter et al., 200 b), in the eastern Fram Strait (Lalande et al., 201 ), and in the
equatorial Guinea Basin (Park et al., 2018). By using the concept of “a larger catchment” (the
statistical funnel) with increased depth (Siegel and Deuser, 1997), Lampitt et al., (2001) suggest that
catchment of a trap moored at 3,000 m could include the primary production from the euphotic zone
covering a diameter of 400 km. Thus, a larger catchment seems a reasonable scenario for explaining
the higher flux at the deeper ocean with little or no reflection of seasonal production in the directly
overlying water layers at site WAB1. However, this scenario would be realistic only if this large
catchment includes regions with higher productivity around the trap site, which is not the case in the
oligotrophic center.
There are two approaches to calculate a sinking rate of particles in the water column using
parameters measured in the sediment mooring system. In the first one, used when there is no time
delay between peaks in mass flux between two traps, the distance between traps is divided by half the
sampling interval (Fischer and Karakaş, 2009 and reference therein). In the second approach applied
when SST and proxy-based temperature estimates exhibit a pronounced seasonality, sinking rate is
determined by the time delay between the satellite-derived SST and the estimated temperature based
on the lipid proxies (e.g. U or TEX8 ) in sinking particles (e.g., Mollenhauer et al., 2015). Using the
first approach, the minimum sinking rate of particles between two traps moored at two depths (591 m
and 445 m) at site WA9 is approximately 454 m d-1 (38 5 m/ (17/2) days). Compared with values
published by Fischer and Karakaş, (2009), this is the second highest after the one determined for the
equatorial area in the Atlantic Ocean (see table 1 in Fischer and Karakaş, (2009)). Moreover, it is
around 1. -2. times higher than the ones in the following years at an almost identical location
(Fischer and Karakaş, 2009). The same approach is not applicable at site WAB1 due to the absence of
covariance in the respective fluxes between the two traps and the different depths (Figure 4.4). The
relatively higher sinking rate at WA9 than in other regions of the Atlantic Ocean can be partly
explained by the increasing sinking rate of particles with depth (Berelson, 2002) and/or the carbon-
dominated environment (Iversen and Ploug, 2010). However, the former explanation was questioned
later by Xue and Armstrong, (2009). For the latter explanation, Fischer and Karakaş, (2009) did not
find a statistically significant relationship between carbonate content and particle sinking rate in the
Atlantic Ocean, even though a relatively higher sinking rate in carbonate-rich aggregates than in opal-
dominated ones was confirmed in laboratory experiments (Iversen and Ploug, 2010).
In summary, the different seasonal oceanographic forcing and biological response between the two
locations (WA9 in the fringe of the gyre system and WAB1 in the center of the gyre) are reflected in
mass and GDGT fluxes.

103
4.5.2 Seasonality of TEX8 H -derived temperatures
TEX8 H -derived temperatures in sinking particles at both sites WA9 and WAB1 vary within a
relatively narrow range over the deployment time (Figure 4.2d and 4.4d) without clear seasonality. At
the shallow trap of the seasonal mesotrophic site WA9, the TEX8 H -derived temperatures mostly reflect
the SSTs with warm-biases relative to the satellite-derived SSTs between mid-August and October
when the SSTs reach their seasonal minimum (Figure 4.2d). Yet, the maximum temperature bias
(2 °C) is within the TEX8 H calibration error (Kim et al., 2010). At the shallow trap of the more
oligotrophic WAB1 site, the TEX8 H -derived temperatures are consistently warmer than the satellite-
derived SST, except for the last sample (Figure 4.4d). The temperature differences between the
estimated and measured ones are maximized (~4.2 °C) during austral winter. Unlike in the shallow
traps, the TEX8 H -derived temperatures are colder than the satellite-derived SSTs in the deep traps of
both WA9 and WAB1 sites, with the smaller temperature biases occurring towards the cold season
(Figure 4.2g and 4.4g).
There are a number of GDGT-based indices, including BIT index (Weijers et al., 200 ), MI (Zhang
et al., 2011), %GDGT-0 (Inglis et al., 2015), and │∆RI│ (Zhang et al., 201 ), which were developed
to obtain information on the occurrence of non-temperature-associated effects on TEX8 thermometry.
At our sites, the BIT values, assessing the contribution of soil-derived GDGTs, as expected are far
below the threshold (<0.3). MI values in the deep traps of both sites exceed the defined critical value
(<0.3), albeit they are still within the range (<0.3 ) of the ´normal marine realm´ (Zhang et al., 2011).
All %GDGT-0 values, an indicator of methanogenic sources, and │∆RI│, a comprehensive index for
non-thermal impact, are below the respective thresholds of 7% and 0.3. Thus, none of the indices
reveal significant non-thermal effects on GDGTs in our samples. Thus, the warm and cold biased
TEX8 H records in the study seem to be derived from other processes (see below sections), which
cannot be identified with these non-thermal indices.
4.5.3 Origin of TEX8 signal
4.5.3.1 Shallow trap: surface water column origin vs. energy stressed production
TEX8 H temperatures are almost identical to the SSTs in the shallow trap (591 m) of the less
oligotrophic northern WA9 site, while warm biased temperature estimates occur in the shallow trap
(727 m) of the more oligotrophic southern WAB1 site (Figure 4.2d and 4.4d). Both results differ from
other studies that showed that temperature estimates derived from the TEX8 H calibration reflect the
subsurface temperatures in the tropical oceans where the surface water column is stratified (Chen et
al., 201 ; Huguet et al., 2007; Kim et al., 2012; Lee et al., 2008; Lopes dos Santos et al., 2010;
McClymont et al., 2012; Park et al., 2018; Rodrigo-Gámiz et al., 2015). At several locations globally,

104
TEX8 is interpreted to reflect subsurface temperatures, which is explained by the deep habitat of the
source organisms. This observation is in agreement with the physiological and biological
characteristics of planktonic Thaumarchaeota in the ocean. As Thaumarchaeota are ammonia-
oxidizing Archaea (Könneke et al., 2005), maximum GDGT concentration and thaumarchaeal
abundances, as well as maximum copy numbers of 1 S rRNA genes and the ammonia
monooxygenase enzyme (amoA), are often found toward the depth of maximum NO concentration
near the base of the euphotic zone (Basse et al., 2014; Church et al., 2010; Horak et al., 2013; Karner
et al., 2001; A. E. Murray et al., 1999; Santoro et al., 2010; Schouten et al., 2012; Turich et al., 2007).
Park et al., (2018) found that the TEX8 H -derived temperature in sinking particles of the equatorial
Guinea Basin is similar to that in the water depth where the nutricline exists. However, these findings
do not apply to the shallow traps in our study regions, where TEX8 H -derived temperatures reflect ma
SST, or they are warm-biased.
Instead, similar observations to the shallow trap of site WA9 were made in the other oligotrophic
regions. In the oligotrophic northeastern Pacific Ocean, warm biased TEX8 temperatures in the larger
fraction (>300 µm) of suspended particulate matter (SPM) and relatively colder TEX8 temperatures
in the smaller fraction were found, while the average temperature of both fractions resembles ma SST
of the region (Wuchter et al., 200 b). In the offshore oligotrophic Gulf of Mexico, the four-year flux-
weighted mean TEX8 H -derived temperature in sinking particles is similar within the calibration error
(± 2.5 °C; Kim et al., 2010) to the ma SST and to the TEX8 H -derived temperature in the surface
sediment (Richey and Tierney, 201 ). A previous study conducted in the South Atlantic gyre explains
the relatively higher TEX8 values we observe at the shallow trap of site WAB1 under oligotrophic
conditions: Hurley et al. (2018) examined suspended particles collected from the water column and at
their station 7 with oligotrophic conditions, which is close to our study site, found that the TEX8 H -
derived temperatures reached the warmest values (>31.0 °C) at 250-349 m depth in two different size
fractions (0.3−0.7 and 0.7−53 µm; only core (CL)-GDGTs are considered). Throughout the water
column, the concentration- and depth-integrated average of TEX8 H -derived temperature (125−498 m)
was found to be 29.9 °C, which is approximately 10 °C warmer than measured overlying SST (see
Hurley et al., 2018). This observation agrees with the warm biased TEX8 H -derived temperatures we
found in particles collected in the shallow trap (727 m) of WAB1. Indeed, the high affinity of
Thaumarchaeota to ammonia allows them to adapt to low ammonia environments (Horak et al., 2013;
Könneke et al., 2005; Martens-Habbena et al., 2009); however, the TEX8 values (i.e., warmer
TEX8 -derived temperatures) were found to be higher at low ammonia oxidation rates in continuous
culture experiment of marine ammonia-oxidizing Archaea than in the control experiments (Hurley et
al., 201 ). The ring index (RI; Zhang et al., 201 ), the weighted average of cyclopentane moieties,
revealed the same trend as the ammonia oxidation rate decreased. These field and laboratory studies

105
therefore suggest that relatively high TEX8 signals are to be expected in such energy limited
environments, which has important implications for the interpretation of TEX8 -derived temperature
estimates in oligotrophic gyre centers.
A vertically diversified archaeal community may also lead to different responses to environmental
conditions like temperature, resulting in unconventional TEX8 thermometry (Agogué et al., 2008;
Ingalls et al., 200 ; Sintes et al., 201 , 2013). Ingalls et al., (200 ) and Sintes et al., (2013) observed
distinguishable thaumarchaeotal ecotypes by depth. Taylor et al., (2013) and Hernández-Sánchez et
al., (2014) found that the GDGT [2]/[3] ratio increases with depth in SPM of water column samples
and in marine sediments, revealing increasing input of GDGTs produced in the deep water with depth.
We modified the cross plots of GDGT [2]/[3] ratios versus depth after Taylor et al., (2013) using
the latest TEX8 global data collection of Tierney and Tingley, (2015) and SPM data from the Arabian
Sea, Black Sea, Bermuda, Equatorial Pacific, Southwest Atlantic oceans, and Northwest Africa (Basse
et al., 2014; Hernández-Sánchez et al., 2014; Hurley et al., 2018; Schouten et al., 2012; Turich et al.,
2007; Wakeham et al., 2003) (Figure 4.5). For 784 of the total 1095 data points both GDGT-2 and -3
fractional abundances are available. Within this newly compiled dataset, the maximum GDGT [2]/[3]
value is 24.3, and approximately 90% of the data points display GDGT [2]/[3] ratios below 10.
The range of GDGT [2]/[3] ratios is wider and values are higher in SPM samples than in sediments
(Figure 4.5). In the Arabian Sea, Northwest Africa, Southwest Atlantic Ocean (Basse et al., 2014;
Hurley et al., 2018; Schouten et al., 2012), where both IPL- and CL-GDGTs have been analyzed in
the same SPM samples, the bigger excursion of GDGT [2]/[3] ratios with depth occur in the IPL-
GDGTs, representing the GDGTs recently produced by the deep archaeal community (Schouten et al.,
2012) (Figure 4.5). A similar trend is observed in SPM samples of the West Atlantic ocean (Hurley et
al., 2018). Although it is not clear yet what causes the change in GDGT [2]/[3] ratio with water depth,
this ratio distinguishes between the longer time period and spatially integrated signals in sediments
with relatively lower GDGT [2]/[3] values and the rather “freshly” produced GDGTs in SPM with
higher GDGT [2]/[3] values. These studies support that the composition of GDGTs derived from in
situ production in the deeper ocean differs from surface-derived material with a potentially important
effect on TEX8 values, in particular in oligotrophic settings, where vertical export from the near
surface is lower than in eutrophic and mesotrophic oceans.
The GDGT [2]/[3] ratios of the shallow traps (WA9 and WAB1) are relatively close to the ones of
SPM samples, while the ones in the deep traps are more similar to ratios observed in surface
sediments (Figure 4.5). Especially, the shallow trap of WAB1 from the center of the oligotrophic gyre
is closer to the range of GDGT [2]/[3] ratios in SPMs than the one of WA9.

106
Figure 4.5 Cross plots of GDGT [2]/[3] ratio against water depth adapted after Taylor et al., (2013). The grey
symbols represent the latest global core-top TEX8 dataset (Tierney and Tingley, 2015 and references
therein). Crosses represents the GDGT [2]/[3] ratios determined in suspended particulate matter from the
Arabian Sea (black), Bermuda (dark brown), and Equatorial Pacific ocean (yellow) (Turich et al., 2007),
Arabian Sea (Schouten et al., 2012; black for CL-GDGTs and orange for IPL-GDGTs), Black Sea (Wakeham
et al., 2003; blue), Southeast Atlantic ocean (Hernández-Sánchez et al., 2014; green), Northwest Africa
(Basse et al., 2014; desert blue). Brown circles represent the ratios in the West Atlantic Ocean (Hurley et al.,
2018; empty one for CL-GDGTs and filled one for IPL-GDGTs). Red triangles represent the ratios in the two
traps (727 and 4515 m) and on the underlying sediment (GeoB 5201-8; 5461 m) of site WAB1 and yellow
ones in two traps (591 and 4456 m) of site WA9. Note that ratios in IPL-GDGTs are available only in the
Arabian Sea and West Atlantic Ocean while the remaining ratios were determined on core lipids only.
Thus, a large proportion of GDGTs derived from the ´fresh´ in situ GDGTs produced under energy
stress conditions at site WAB1 is a plausible explanation for the observed relatively warm TEX8 H
temperature estimates, despite the absence of direct evidence (i.e., IPL-GDGTs data) in our traps.
However, it still needs to be confirmed to which proportion the CL-GDGTs analyzed in our study are
derived from ´fresh´ in situ production.

107
4.5.3.2 Deep trap: water column integrated TEX86H signals with a dominant deep in situ production
When the TEX8 signals at different depths are almost identical, it would be reasonable to argue
that they are originated from the same source. However, this is not the case at both sites WA9 and
WAB1 as TEX8 H -derived temperatures at the deep traps are colder than those estimates at the
respective shallow traps and SSTs (see section 4.5.3.1; Figure 4.2d, g and 4.4d, g). Lateral advection
could account for differences in the proxy signals at depth, but GDGTs have been found to be less
susceptible to lateral transport than other lipid biomarkers (Mollenhauer et al., 2008; Shah et al.,
2008). As elaborated above, a variable archaeal source of GDGTs throughout the water column is
evident from the GDGT [2]/[3] ratios by depth at both study locations (see section 4.5.3.1).
Figure 4.6 Depth profile of mean annual water temperature and nitrate concentration extracted from WOA13.
Green arrows represent the flux-weighted mean TEX8 H -derived temperatures in the shallow traps of site WA9
(27.4 °C) and WAB1 (29.2 °C), respectively.
We compare the flux-weighted mean TEX8 H signal of each deep trap, which is averaged over the
trap deployment period, with the depth profile of temperature and nitrate concentration to determine
the potential depth of GDGT origin (Table 4.1, Figure 4. ). The flux-weighted mean TEX8 H -derived
temperature of the deep trap of WA9 is 24.9 °C, corresponding to the water temperature at 100 m
depth (Table 4.1, Figure 4. ). In the seasonal mesotrophic site WA9, the nutricline occurs at around
100 m depth, above which temperatures remain relatively uniform. In analogy to other studies, the
observed TEX8 signal is in agreement with a preferential habitat of Thaumarchaeota near 100 m
depth (Meyer et al., 201 ; Park et al., 2018; Seki et al., 2014). However, the discrepancy of TEX8 H
signals between 591 m and 445 m depth traps is different from other observations, which show
similar temperature estimates at multiple depths (Park et al., 2018; Wuchter et al., 200 ; Yamamoto et
al., 2012). The question arises why this subsurface TEX8 H signal at the deep trap is not captured in the

108
shallow trap, which was deployed far below (591 m) than the putative depth habitat of the main
GDGT source (~100 m).
Active zooplankton migration can be invoked to explain the GDGT transport mechanism
bypassing the shallow trap and exporting directly to the deep trap. Diel zooplankton migration is a
daily pattern of vertical movement feeding in surface water at night, returning to the depth at dawn,
and releasing fecal pellets in deep waters (Lampert, 1989). This scenario would be plausible only if
zooplankton migrates to a depth below 591 m and excrete their pellets. Indeed, Isla et al., (2015)
observed a significant contribution of total carbon flux through 500 m depth in the northwest
Mediterranean. In a recent study in the Atlantic oligotrophic zone near our trap site, the active
zooplankton migration was also found in lower mesopelagic layers (500−800 m; Bode, (2018)).
However, the authors suggest that zooplankton feeding occurs even below these water masses based
on the nitrogen isotope values. In this case, fecal pellets would not carry the subsurface particles
containing GDGTs from 100 m depth. Accordingly, such an active migration occurring in deep waters
does not seem to explain the bypassing export scenario of GDGTs. Thus, it will remain unresolved if
GDGTs in deep waters are originated from 100 m water depth until the export mechanism of GDGTs
is clearly identified.
Lateral input or selective degradation is often suggested to result in alteration of organic proxy
signals. However, both scenarios are not relevant to the TEX8 signal, which rather mirrors a local
signal and has been found not to be affected by the selective degradation (Lengger et al., 2012;
Mollenhauer et al., 2008). Although it remains unclear how a subsurface temperature signal is directly
exported to deep waters, a subsurface temperature record is also found in the neighboring surface
sediment (GeoB2212-1; 4.032° S, 25. 23° W). In the surface sediment, TEX8 H -derived temperature
(22.1 °C) is approximately 4. °C colder than the SST (2 .7 °C) of the location (data can be found in
Kim et al., (2010)’s global dataset).
Similar flux-weighted mean TEX8 H -derived temperatures at the deep trap of WAB1 (24. °C) and
in the underlying surface sediment (24.7 °C; GeoB 5201-8 at 28.52° W, 11.53° S) were observed
coincident with the water temperature at 100 m depth (Table 4.1). The above approach for the origin
of TEX8 H signals cannot be put forward for the deep trap of site WAB1 as well, where the preferred
depth habitat inferred from the temperature estimates of ~100 m is shallower than the deep
chlorophyll maximum (~125 m) and nutricline (~120 m) in the region. It is hard to imagine that
Thaumarchaeota as ammonia oxidizers dwell at water depths, where the energy source is scarcely
available (Figure 4. ). Field studies using radiocarbon of GDGTs and culture experiments have
revealed that Thaumarchaeota are chemoautotrophs (Francis et al., 2005; Ingalls et al., 200 ; Könneke
et al., 2005; Pearson et al., 2001; Wuchter et al., 2003). Compound-specific radiocarbon data of
GDGTs and an isotopic mass balance model showed that most GDGTs derive from autotrophic in situ

109
production (~83%) and only 15% are directly exported from the surface at 70 m water depth in the
oligotrophic North Pacific (Ingalls et al., 200 ). With a high contribution of in situ production at 70
m depth, the TEX8 temperature is only 3 °C colder than SST and far warmer than the actual
temperature at 70 m, implying a different physiological response of mesopelagic Thaumarchaeota to
surrounding water temperature. In the oligotrophic Atlantic water, TEX8 H temperatures based on CL-
GDGTs in SPM decreased below 250 m depth, while the estimates based on the combined (CL+IPL)-
GDGTs yield far colder temperatures below 500 m due to significantly cold-biased TEX8 H
temperatures in IPL-GDGT fractions with hexose (1G) and hexose-phosphohexose (HPH) head
groups (Hurley et al., 2018). If both studies are representative of oligotrophic conditions, we would
assume that the relatively colder TEX8 H based temperature estimates in the deep trap than in the
shallow trap are a consequence of combined rather ´cold and dominant´ in situ GDGT production and
relatively ´warm and less dominant´ GDGTs originated from the upper water column. This
explanation may be also applicable for the deep trap of the seasonally mesotrophic site WA9. In both
deep traps of WA9 and WAB1, the discrepancy between the TEX8 H estimate and SST is minimized
when chlorophyll-a concentration and GDGT flux are relatively enhanced (Figure 4.2a, g and 4.4a, g).
It may show that the proportional GDGT input carrying warmer signals produced in upper waters to
deep waters increases in that season. The decoupling of mass and GDGT flux pattern between the
shallow and deep traps, the lack of correlation between GDGT and opal/carbonate and the observed
GDGT [2]/[3] ratios also support distinct GDGT sources at depth compared to the shallow trap.
Hurley et al. (2018) could calculate the export depth of GDGTs as the depth where integrated GDGT
[2]/[3] values between the NO maximum depth and deeper water column agree exactly to the one in
the sediment. The deepest export depth (135−180 m) is estimated for their most oligotrophic station,
which coincides with the maximum GDGT concentration. This model might be suitable to reconstruct
the major export depth of GDGTs. However, it needs to be considered that this water column study is
only a snapshot time representing a day of sampling, while sediment reflects a longer time period.
Additionally, the authors calculated TEX8 values in the combined (IPL+CL)-GDGT fraction even
though the TEX8 global calibration considers only CL-GDGTs and the proportional contributions of
IPL-GDGTs degraded to CL-GDGTs on the sea-floor and their associated TEX8 values have not
been well constrained.
Although further investigations need to distinguish the origin of GDGTs captured in the shallow
and deep waters in the central Brazil Basin, TEX8 H signals from the upper water column do not appear
in deep waters; instead cold-biased temperature estimates are dominant in deep waters. In the tropical
oceans near the equator (between 5° N to 10° S), a total 123 of TEX8 H values are available in the latest
global calibration dataset (Tierney and Tingley, 2015). In agreement with our findings, most of these

110
TEX8 H -derived temperature estimates are colder than SSTs (n = 114), and only a few are almost
identical to SSTs (n = ).
4.5.4 BAYSPAR SST
The BAYSPAR (Tierney and Tingley, 2015) calibration model yields significantly different
temperatures between particles collected at different depths and locations investigated in this study. At
the shallow traps of both sites WA9 and WAB1, the BAYSPAR SSTs are remarkably warmer than the
satellite-derived SST and TEX8 H -derived temperatures (30.3−33.7 °C for WA9 and 29.1−31.4 °C for
WAB1; not shown in the figure). At the deep trap of site WA9, the BAYSPAR calibration yields
warm-biased temperatures in mid-June−November 199 compared to the satellite-derived SST
(Figure 4.2f), while they resemble the SSTs in remaining season. The BAYSPAR SSTs are similar to
the TEX8 H estimates at the deep trap of site WAB1 (Figure 4.4f). Warm-biased SST estimates based
on BAYSPAR were also observed in sinking particles of the equatorial Guinea Basin (Park et al.,
2018). In the oligotrophic northern Gulf of Mexico, the BAYSPAR SST in sinking particles varied
within the range of SSTs, but resembled more the colder temperatures. Park et al., (2018) suggested
that the reason of the warm bias based on the BAYSPAR SST calibration is due to the lack of
reference points within a 20° × 20° grid box, which is defined for spatial dependence. Site WA9 is
located within the calibration box, which covers the equator and further northern regions, with several
data points. Due to the scarcity of data within, and the large size of, the calibration box, we assume
that this grid box does not generate representative regression parameters for site WA9, which was
situated in the fringe of the oligotrophic gyre.
4.6 Conclusion
Two time-series records of sinking particles collected in the central Brazil Basin reveal
distinguishable variability in mass and GDGT flux according to the oceanographic setting. Mass and
GDGT fluxes at 7.5° S at the seasonally mesotrophic WA9 station are higher than at site WAB1 at
11.5° S in the center of the oligotrophic gyre. At the shallow and deep trap of WA9, mass and GDGT
flux both were enhanced in the winter time when the trade wind induced upwelling introduced
nutrients into the system along the fringe of the gyre. At site WAB1, the variability of mass and
GDGT flux displayed the biological response of seasonal oceanographic features like the Ekman
upwelling, the deepened mixed layer, and downwelling. At the shallow traps of WA9 and WAB1, a
good correlation between GDGT and opal flux suggests that GDGTs are preferably incorporated into
opal-rich aggregates and transported to deep waters.
TEX8 H -derived temperatures estimates obtained from sinking particles collected at 591 m agree
well with the satellite-derived SSTs at site WA9. This coincides with the input of nutrients directly
prompted by the change of surface oceanographic forcing, the consequent GDGT production and thus

111
the export of a surface-derived TEX8 signal. At 727 m of WAB1, the TEX8 H -derived temperature
estimates for sinking particles are consistently warmer than the satellite-derived SSTs. This
observation is in agreement with the response of Thaumarchaeota producing GDGTs with increased
TEX8 ratios under energy stress conditions. In the deep traps of both sites WA9 and WAB1, the
colder TEX8 H -derived temperature relative to SSTs may display an integrated signal of ´cold and
dominant´ in situ production in deep waters with the surface-derived ´warm´ GDGTs. The almost
identical TEX8 in the underlying surface sediment indicates a similar origin of GDGTs collected in
the deep trap and deposited in sediments. The distinct TEX8 values by location and by depth are
likely to be a reflection of oceanographic variables like nutrient conditions (less oligotrophic vs.
oligotrophic) and an integrated signal from upper and deep waters.
Acknowledgments
We are grateful to the crews, scientists, and students, who were collecting the sediment trap
samples used in this study. This project is funded through the DFG-Research Center/Cluster of
Excellence “The Ocean in the Earth System” at the MARUM and supported by GLOMAR−Bremen
International Graduate School for Marine Sciences, University of Bremen. The both WA9 and WAB1
trap samples and surface sediment (GeoB 5201-8) were supplied by the MARUM Centre of Marine
Environmental Research at the University of Bremen. Gerhard Fischer at the University of Bremen is
thanked for providing the unpublished mass flux data of WA9 and WAB1 traps.
Data availability
The data presented here will be archived on the PANGAEA database when the manuscript is
submitted.

112

113
CHAPTER 5
Alkenone flux and U 𝐤 thermometry:
comparison with TEX thermometry

114
5 Manuscript IV
Alkenone flux and the U 𝐤 thermometry: comparisons with the
TEX thermometry
Eunmi Park1,2,3
, Jens Hefter1, Gerhard Fischer
2,3, Gesine Mollenhauer
1,2,3
1Alfred-Wegener-Institute, Helmholtz Center for Polar and Marine Research, D-27570 Bremerhaven,
Germany 2MARUM Centre for Marine Environmental Sciences, University of Bremen, D-28334 Bremen,
Germany
3Department of Geosciences, University of Bremen, D-28334 Bremen, Germany
5.1 Introduction
In the previous chapters (Chapter 2, 3, 4), TEX8 (TEX8 H or TEX8
L )-derived temperatures are
discussed as reflecting SSTs, subsurface temperature or warm-biased temperature relative to SST in
the respective regions. Variable environmental factors (e.g. nutrient distribution and level, the
presence of OMZs, archaeal community structure, nutrient stress) likely play an important role in
determining TEX8 thermometry.
Similar environmental concerns as for the TEX8 are also considered for the U , which is based
on the relative distribution of long-chain alkenones synthesized by haptophyte algae, often dominated
by Emiliania huxleyi (see sec 1.2). Alkenone producers, haptophytes, are autotrophs which are able to
produce energy using the light while planktonic Archaea, the GDGT producers, are chemoautotrophic
oxidizers, which obtain energy by taking up NH . When those two proxy temperatures are compared,
they are often decoupled, reflecting the different time and/or depth of the highest lipid production and
export (Chen et al., 201 ; Fallet et al., 2011; Jonas et al., 2017; Lee et al., 2008; Leider et al., 2010;
Lopes dos Santos et al., 2013; Mollenhauer et al., 2015; Rodrigo-Gámiz et al., 2015; Rommerskirchen
et al., 2011; C Turich et al., 2013). Thus, the nature of source organisms of the two proxies explains
parts of the discrepancy between reconstructed temperatures, although both proxy values are
calibrated to ma SSTs in global calibrations.
Together with the innate biological mechanisms of those proxies, additional processes (e.g.
degradation and lateral input) are also known to cause uncertainty mainly in U
thermometry. In the
presence of an aerobic bacterial community isolated from an Emiliania huxleyi culture, selective
degradation of C37:3 over C37:2 led to the increase of U values and estimated temperatures (Rontani
et al., 2005; Zabeti et al., 2010). In long-term field studies, alterations occurred only in U values

115
under oxic conditions, and were not detected in TEX8 values (Huguet et al., 2009; J.-H. Kim et al.,
2009). Thus, GDGTs (TEX8 ) are regarded to be less prone to selective degradation than alkenones
(U ). A laterally transported allochthonous signal can overprint the local product, resulting in
misleading alkenone-based temperature estimates (Benthien and Müller, 2000; Sicre et al., 2005). In
contrast, lateral transport does not cause TEX8 biases in the sediment record (J. H. Kim et al., 2009;
Mollenhauer et al., 2008).
Multiple proxy approaches provide not only independently reconstructed temperatures, but offers
the advantage of complementarity between the proxies, leading to a more complete picture of the
paleotemperature evolution. For instance, the relationship of U reflecting ma SST with TEX8
H
reflecting subsurface temperature were used to determine the intensity of upwelling and stratification
by calculating the temperature differences between two proxies (Lopes dos Santos et al., 2010;
McClymont et al., 2012). The comprehensive GDGT dataset, which is intensively discussed in
previous chapters (Chapter 2, 3, 4), provide the opportunity to compare them with the U -derived
temperatures measured in the same sediment trap material. Here, the correlations of alkenone flux
with mass flux, the maximum flux season of alkenones, and the U
derived temperatures are
investigated.
5.2 Methods and materials
Alkenones were extracted from the same particles used for GDGTs. Alkenone fractions are
recovered by eluting DCM:Hex 2:1 (v/v) solvent with NLs throughout silica-gel column (see Section
1.8 for the lipid extraction process). To quantify the alkenones, known amounts of internal standards
(nonadekan-2-one) were added to each sample before the extraction. Alkenones were analyzed using a
HP-5890A gas chromatograph (GC) equipped with a DB5-MS capillary column and a flame
ionization detector (FID). A gas flow rate and temperature conditions followed methods described by
Chen et al., (201 ). The standard deviation of replicate analyse based on the lab-internal sediment
standard was ±0.002 units of the U and % for alkenone concentration. C37:2, C37:3, and C37:4 were
integrated compared to the relative retention time of an internal standard.
U
, U , and %C37:4 indices were calculated according to Brassell et al., (198 ), Prahl and
Wakeham, (1987), and Rosell-Melé, (1998), respectively.
U = [C37:2 – C37:4] / [C37:2 + C37:3 + C37:4] (1)
U = [C37:2] / [ C37:2 + C37:3] (2)
%C37:4 = {[C37:4] / [C37:2 + C37:3 + C37:4]} x 100 (3)

116
U
, U , and %C37:4 values were converted to temperature using the calibrations of Bendle and
Rosell-Melé, (2004), Müller et al., (1998), , and Sicre et al., (2002), respectively.
U = 0.081(±0.01) × SST (°C) – 0.54(±0.55) (4)
U = 0.033 × SST (°C) + 0.044 (5)
%C37:4 = -3.7 × SST (°C) + 43.7 ( )
Alkenone flux is a sum of fluxes of C37:2 and C37:3. For the eastern Fram Strait, where C37:4 is
uniquely present in sinking particles, the alkenone flux includes all three alkenones, C37:2, C37:3, and
C37:4 (see Section 5.3.2.1).
5.3 Results and discussion
5.3.1 Eastern Atlantic upwelling system: the Guinea Basin and off Namibia
5.3.1.1 Guinea Basin (GBN3; 1.800° N, 11.133° W)
In the northern Guinea Basin, alkenone fluxes have relatively better correlation with CaCO3 (R2 =
0.5 ) at the shallow trap and with PON (R2 = 0. 5) at the deep trap rather than other components
(Table 5.1). GDGT fluxes have a good correlation with opal at both depths (Table 5.1; see Section
2.5.1), showing that opal is a major exporter of GDGTs (R2 = 0.71 at the shallow trap and 0. 2 at the
deep trap;). By comparison, in the upwelling system off NW Africa, GDGT and alkenone fluxes are
more strongly correlated with TOC (R2 = 0.81 for GDGT and 0. 3 for alkenone), followed by GDGT
with opal (R2 = 0. 8) and alkenone with carbonate (R
2 = 0.42) fluxes (Mollenhauer et al., 2015). This
implies that GDGTs and alkenones are transported into deep waters by different export mechanisms.
Table 5.1 Correlations of alkenone and GDGT fluxes with opal, CaCO3, POC, PON and lithogenic
component fluxes determined in sinking particles collected in the Atlantic Ocean.
R2
Flux correlation
GBN3 LZ aFEVI16 PF3 WA9 WAB1
853m 3921m 960m 1296m 614m 3196m 591m 4456m 727m 4515m
Alkenone
Opal 0.27 0.39 0.02 0.44 - 0.48 0.81 0.71 0.59 -
CaCO3 0.56 0.40 0.32 0.71 - 0.46 0.74 0.79 0.81 -
POC 0.42 0.54 0.24 0.39 - 0.60 0.93 0.95 0.75 -
PON 0.50 0.65 0.41 0.33 - 0.47 0.92 0.97 0.32 -
Litho. - - - - - - 0.50 - - -
GDGTs
Opal 0.71 0.62 - 0.82 - - 0.85 0.56 0.85 -
CaCO3 0.43 0.28 - 0.80 - - 0.72 0.50 0.81 -
POC 0.50 0.55 - - - - 0.70 0.45 0.48
PON 0.57 0.56 - - - - 0.64 - - -
Litho. - - - - - - -
aAlkenone flux = ∑C37:2 + C37:3 + C37:4

117
In the Guinea Basin, alkenone flux is higher than GDGT flux and both lipid fluxes and mass flux
are relatively higher at the deep trap than at the shallow trap (Figure 5.1). Alkenone fluxes are clearly
pronounced in March-April and mid-June to mid-September at both depths. GDGT flux also shows a
clear seasonality at the shallow trap with multiple peaks in March-April, mid-June, and mid-August.
At the deep trap, GDGT flux records minima when mass and alkenone flux decrease (Figure 5.1). It
shows that the production and transport of GDGTs occur almost spontaneously when alkenones are
produced and sunk into deep waters. Thus, a fast biogeochemical cycle including primary production,
remineralization, ammonia release, archaeal production, the formation of aggregation with
phytoplankton debris, and zooplankton grazing is expected in this upwelling system.
Figure 5.1 Changes in mass flux (a, e), alkenone flux (b, f), GDGT flux (c, g), and reconstructed and satellite-
derived temperatures (d, h) at 853 m depth (left panel) and at 3921 m depth (right panel) in the Guinea Basin.
Note that Y-axis scales are identical on the left and right panels.
No time shift of major fluxes between both traps at the two depths indicted relatively faster sinking
rates of particles in summer 1989 (~351 m d-1; Fischer and Karakaş, 2009). This sinking rate can be
applied for the particles alkenones and GDGTs are aggregated with. Fischer and Karakaş, (2009)
reported faster sinking rates of particles from nearby locations in the equator of up to 530 m d-1. Using
the delay time of TEX8 H -derived temperatures relative to SSTs, the sinking rate of particles carrying
GDGTs is approximately 42 m d-1 between the depth of the major origin of the signal (~50 m) and the

118
shallow trap (853 m) (see Section 2.5.2). An equivalent approach is not feasible for the alkenone
signal due to the lack of seasonality in the U -derived temperatures. The two different approaches for
assessing the sinking rate of particles do not seem to be comparable.
U -derived temperatures vary in the range of 2 . −28.1 °C and 2 .7−28.2 °C at the shallow and
deep traps, respectively, which are continuously warmer than the TEX8 H -derived temperatures in the
traps from both depths. However, the U -derived estimates are similar to satellite-derived SSTs even
though they have no seasonality. This agrees with previous findings that Emiliania huxleyi as major
alkenone producers and autotrophs inhabit the surface waters, and thus lipid temperatures reflect SSTs
(Chen et al., 201 ; Fallet et al., 2011; Lee et al., 2008; Lopes dos Santos et al., 2013; Yamamoto et al.,
2007). The preferential depth habitat of Thaumarchaeota, GDGT producers, governed by the nutrient
distribution is probably mirrored in the TEX8 H -derived temperature, reflecting the subsurface
temperature (~50 m water depth) (see Section 2.5.2). Overall, the Guinea Basin site displays the
typical lipid temperature estimates of the upwelling regions, reflecting SST in the U signal and
subsurface temperatures in the TEX8 H signal.
5.3.1.2 Lüderitz, off Namibia (LZ; 25.279° S, 13.052° E)
At Lüderitz, maxima in alkenone and GDGT fluxes occur at different times (Figure 5.2). An
alkenone flux maximum is recorded in early March, but maxima in GDGT flux occur in mid-April
and mid-May. Neither alkenone nor GDGT fluxes are correlated with opal, CaCO3, POC, or PON
fluxes in the center of the Namibian coastal upwelling cell of Lüderitz (Table 5.1, section 2.4.2.2).
Therefore, any inferences for sinking mechanisms of particles associated with alkenones or GDGTs
are not available in this site.
The U -derived temperatures display a 2.4 °C cold-bias in late-February and a 3.3−4.5 °C warm-
bias in late-May and early-June relative to the satellite-derived SSTs. In the remaining times, the
estimated temperatures resemble the SSTs. An alteration of alkenone composition is often explained
by the preferential degradation of C37:3 against C37:2 or by lateral input. However, it is questionable if
these alterations can explain such a short term period of deviation from the SST. The warm-biased
TEX8 H estimates towards the upwelling periods may be due to the production of GDGTs in the OMZs
off Lüderitz, which imprints the surface signal (See Section 2.5.3; Figure 5.2). When the temporal
offset of TEX8 H estimates occur in mid-June and August-September, the U
-derived temperatures
closely resemble the SSTs (Figure 5.2).

119
Figure 5.2 Changes in mass flux (a), alkenone flux (b), GDGT flux (c), and reconstructed and satellite-
derived temperatures (d) at 960 m depth in the Lüderitz, off Namibia.
Our findings At Lüderitz with faithful SST reflection with U and warm-biased reconstructions
with TEX8 under low oxygen condition are opposed to the findings in sinking particles collected in
the equally oxygen deficient Cariaco Basin (C Turich et al., 2013). The authors compared
temperatures based on U and TEX8 measured within and below the chemocline. U
temperature
estimates below the chemocline differed from those within the chemocline while TEX8 temperature
estimates did not experience an alteration between the two sections of the water column. However, a
permanent anoxic basin like the Cariaco Basin is not likely to be comparable with the conditions off
Lüderitz, where the OMZs are seasonally present at Lüderitz. It is assumed that the response of
alkenone and GDGT producers in the Cariaco Basin, which are permanently adapted to the anoxic
conditions, might be fundamentally different from those inhabiting the coastal upwelling system off
Lüderitz.
Overall, both U and TEX8
H temperature proxies reflect the SSTs, but a seasonal warm bias of
TEX8 H -derived temperature occurs when OMZs are present. A study of a longer time scale is needed.

120
5.3.2 Polar oceans: eastern Fram Strait and Antarctic Polar Front
5.3.2.1 Eastern Fram Strait (FEVI16; 79.02° N, 4.35° E)
In the eastern Fram Strait, spring and summer-autumn primary production maxima are visible in
mass, alkenone and GDGT fluxes (Figure 5.3). In Section 3.5.1.1, it is shown that GDGT fluxes co-
vary with opal, CaCO3, phytoplankton cell, and terrestrial biomarker fluxes, but are correlated
differently by season, showing temporal variation of transport materials for GDGTs. Like GDGTs,
biogenic and non-biogenic components can be considered as ballast materials for alkenones since both
lipid fluxes have a similar seasonality. For alkenone flux, C37:4 alkenone in addition to C37:2 and C37:3
are also considered since C37:4 alkenones were identified in the eastern Fram Strait throughout the
entire trap deployment period. C37:4 alkenone accounts for 9–30% of total alkenones (the sum of C37:2,
C37:3, and C37:4). This alkenone compound was initially included in the temperature calibration
(Brassell et al., 198 ), but later was excluded due to the random presence in measured samples and
the discrepancy between calibrations (Müller et al., 1998; Prahl and Wakeham, 1987; Sikes et al.,
1997). However, further investigations have documented that C37:4 is present in cold waters, while it is
absent in warm waters of the North Atlantic and Nordic Sea (Bendle et al., 2005; Rosell-Melé, 1998;
Rosell-Melé et al., 1995; Sicre et al., 2002). These findings agree with this study where C37:4 is found
only in the eastern Fram Strait, but not in other warm tropics (Guinea Basin, Lüderitz off Namibia,
and central Brazil Basin) and cold southern oceans (Antarctic Polar Front). The alkenone fluxes are
mostly correlated with CaCO3 fluxes (R2 = 0.71; Table 5.1). Favorable correlations of GDGT with
opal and alkenone with CaCO3 were also determined in upwelling systems (NW Africa; Mollenhauer
et al., (2015), Guinea Basin; see Section 5.3.1.1).
The absolute alkenone flux is higher than GDGT flux in the eastern Fram Strait (Figure 5.3).
Although both lipid fluxes are pronounced in similar seasons, the maxima occur at slightly different
times. The maximum alkenone flux is up to 3 times higher in summer-autumn 2007 than in spring
2008, while the GDGT flux maxima reach similar flux values in both seasons. Within the summer-
autumn maxima, the GDGT peak flux appears approximately 20 days (collection time of two sample
cups) after the alkenone peak (Figure 5.3). The flux values indicate new production of lipids and/or
the enhanced export of lipids during the sampling period. Thus, it is reasonable to assume that the
time offset between the lipid flux peaks reveal that alkenones are produced earlier than GDGT and/ or
their sinking rate is faster than that of GDGT. Due to the presence of C37:4 alkenones, it was expected
that the U calibration can be used instead of U
despite the fact that SSTs in the Fram Strait stays
(0−4 °C) below the minimum calibration limit of the alkenone proxy (Bendle and Rosell-Melé, 2004;
Sicre et al., 2002). However, both U and U
-derived temperatures vary between 5.3−9.4 °C, which
are warmer than the satellite-derived SSTs and the TEX8 L -derived temperatures, reflecting the water
temperature at 30−80 m depth in the warm season (Figure 5.3, see Section 3.5.1).

121
Figure 5.3 Changes in mass flux (a), alkenone flux (b), GDGT flux (c), and reconstructed and satellite-
derived temperatures (d) at 1296 m depth in the eastern Fram Strait.
The reason for the warm-bias in the alkenone proxy temperatures can be found in the composition
of coccolithophore species in the eastern Fram Strait and Nordic Seas. The warm water species
Emiliania huxleyi, the primary alkenone source organism in many ocean regions, are predominant in
intermediate and deep waters, where the northward current carrying warm Atlantic water flows. In
contrast, the cold water species Coccolithus pelagicus are more dominant in surface waters, where the
southward current influenced by cold Arctic water flows (Bendle et al., 2005; Lalande et al., 201 ).
Warm-biased temperature estimated with the U and U
proxies confirms the previous finding that
lateral influx of alkenones can introduce bias. Bendle et al., (2005) concluded that the relative
proportion of C37:4 in total alkenones is better for assessing the relative influence of arctic/polar versus
Atlantic water masses rather than for reconstructing temperature in the Nordic Sea.
These observations confirm that the alkenone proxy is not applicable in such a high latitude region
due to the significant influence of allochthonous alkenone input, while the GDGT proxy-based
temperature reflects the local temperature.
5.3.2.2 Antarctic Polar Front of the Atlantic sector (PF3; 50.13° S, 5.83° E)
In the Antarctic Polar Front of the Atlantic sector, mass, alkenone, and GDGT fluxes are enhanced
in different seasons at two depths. At the shallow trap ( 14 m), both mass and alkenone fluxes show

122
peaks in the austral spring and summer season, but alkenone fluxes are 5 times higher in mid-October
1990 than in December 1989 (Figure 5.4). When mass and alkenone fluxes record the minima, GDGT
fluxes display multiple peaks with maxima in austral autumn and winter season (mid-May and August
1990). As discussed in Section 3.5.2.1, the temporal mismatch of maximum fluxes between alkenone
(or mass flux) and GDGT implies that Thaumarchaeota may be out-competed by phytoplankton
(including the haptophytes) and thus they preferentially occur in the water depth or season, which is
less favorable for phytoplankton. At the deep trap, almost no flux occurs since mid-June 1990 (Figure
5.4). Mass and alkenone fluxes are pulsed in mid-December 1989 to late-January, early-March, and
mid-May 1990. The last two peaks also occur in GDGT fluxes. However, the maximum of GDGT
flux appears in mid-November 1989. Consequently, neither alkenone nor GDGT fluxes have a
correlation with opal, CaCO3, POC, or PON at the shallow trap. Only CaCO3 flux showed a weak
correlation with alkenone flux (R2 = 0. 0; Table 5.1).
The U proxy at the deep trap and the TEX8
L proxy at both depths yielded somehow unrealistic
temperature reconstructions for the region. Only the U proxy measured at the shallow trap, which
was previously reported by Müller and Fischer, (2003), reflects the overlying SSTs (Figure 5.4d). Our
measurements corroborate their results when applying the same U calibration, showing a clear
seasonality (Figure 5.4d). When a time lag of about 10 weeks is considered, the estimated
temperatures vary fairly well with the satellite-derived SST variations. A delay time of 10 weeks can
be translated into a sinking rate of 9 m d-1 (=10 weeks/ 14 m). As TEX8
L -derived temperatures of the
shallow trap display a mixture of warm and cold-biased estimates relative to the SSTs, it is difficult to
directly compare with the ones derived from the U proxy.
The maximum discrepancy between two proxy estimates occurs when the U proxy records
relatively cold temperatures and reaches values up to 5 °C (Figure 5.4d). Greater offsets between two
proxies are recorded at the deep trap because of the warm bias of TEX8 L and cold bias of U
relative
to the SSTs (Figure 5.4h). The flux-weighted mean U value at the shallow trap is 0.12 and a similar
value is found in the surface sediment in Müller et al., (1998)’s database (0.149 of U at PS1759-1;
50.1 5° S, 5.755° E). The temperature difference between the shallow trap and surface sediment is
only 0.9 °C, which is below the calibration error (Müller et al., 1998; ±1 °C). Due to the short period
of sampling at the deep trap, the flux-weighted mean U is meaningless. However, we can confirm
that the alkenone signal corresponding to the SST at the shallow trap is propagated to the surface
sediment. In contrast, a similar TEX8 L signal was found in the deep trap and underlying surface
sediment, reconstructing warm-biased temperatures, which differ from the TEX8 L signal in the
shallow trap (see Section 3.5.2.2).

123
Figure 5.4 Changes in mass flux (a, e), alkenone flux (b, f), GDGT flux (c, g), and reconstructed and satellite-
derived temperatures (d, h) at 614 m depth (left panel) and at 3196 m depth (right panel) in the Antarctic
Polar Front of the Atlantic sector. Black dotted line (d) at the shallow trap shows the U -derived temperature
reported by (Müller and Fischer, 2003). Note that Y-axis scale for alkenone flux on the left panel is different
from the one on the right panel.
Overall, to date, the U calibration is likely to be a better option in the Antarctic Polar Front for
reconstructing SSTs than the TEX8 L calibration. However, GDGT based calibrations seem also to be
suited for the temperature reconstruction when the regression between TEX8 L values and SSTs is re-
defined or only certain OH-GDGTs are considered (see Section 3.5.3 and 3.5.4).
5.3.3 Oligotrophic system: central Brazil Basin
5.3.3.1 Seasonal mesotrophic region (WA9; 7.5° S, 28.1° W)
In the less oligotrophic site WA8, mass, alkenone, and GDGT fluxes covary and each show
maxima in July 199 at the shallow trap (Figure 5.5). Alkenone fluxes are highly correlated with all
ballasting components in the traps from both depths (Table 5.1). This implies that opal, CaCO3, POC,
and PON play roles as exporting materials for alkenones throughout the water column. The similar
flux patterns in total mass, alkenones, and GDGTs show that production and/ or transport of alkenones
and GDGTs occur almost at the same time.

124
Figure 5.5 Changes in mass flux (a, e), alkenone flux (b, f), GDGT flux (c, g), and reconstructed and satellite-
derived temperatures (d, h) at 591 m depth (left panel) and at 4456 m depth (right panel) in the central Brazil
Basin (WA9). Note that Y-axis scale for alkenone flux on the left panel is different from the one on the right
panel.
There have been concerns regarding the limited applicability of the U proxy in the tropical
oceans. A maximum growth temperature of Emiliania huxleyi or a significantly smaller portion of
C37:3 have been previously considered, rendering the calibration inaccurate in the regions, where SSTs
are warmer than 2 °C (Brassell et al., 198 ; Pelejero and Grimalt, 1997). Nonetheless, the U
calibration can still reconstruct reasonable temperatures at the warm end of the regression up to 29 °C
(Pelejero and Calvo, 2003). This is in line with the result of the central Brazil Basin.
The U -derived temperatures vary within 2 °C, with the range of 2 .3−28.1 °C at the shallow
trap and between 2 . −28.2 °C at the deep trap (Figure 5.5d, h). Although the signals at both traps do
not follow the seasonality of the satellite-derived SSTs, the U temperature estimates reflect the
SSTs. The flux-weighted mean U temperatures at both traps (27.5 °C at the shallow trap and
27.4 °C at the deep trap) are almost identical to the flux-weighted mean TEX8 H temperature of the
shallow trap (27.4 °C). The TEX8 H -derived temperatures of the deep trap are consistently up to 3.2 °C
colder than the U -derived temperatures (Figure 5.5h). Whatever the reasons for this discrepancy of

125
GDGT abundance ratios (i.e. TEX8 H ) between two depths (see Section 4.5.3), alkenone abundance
ratios (i.e. U ) are not affected and rather the surface signal is preserved while sinking.
5.3.3.2 Oligotrophic region (WAB1; 11.55° S, 28.52° W)
At the oligotrophic site WAB1, correlations between lipid biomarker (alkenone and GDGTs) and
ballasting component fluxes are found only at the shallow trap (Table 5.1, Figure 5. ). Alkenone flux
is well correlated with CaCO3 (R2 = 0.81) followed by POC (R
2 = 0.75). GDGT flux has a good
correlation with opal (R2 = 0.85) and CaCO3 (R
2 = 0.81). This confirms that alkenone and GDGTs are
preferentially incorporated into particles with different compositions.
Figure 5.6 Changes in mass flux (a, e), alkenone flux (b, f), GDGT flux (c, g), and reconstructed and satellite-
derived temperatures (d, h) at 727 m depth (left panel) and at 4515 m depth (right panel) in the central Brazil
Basin (WAB1). Note that Y-axis scales are identical on the left and right panels.
Mass and GDGT fluxes are higher at the deep trap than at the shallow one, but the opposite trend
occurs in alkenone fluxes (Figure 5. ). The seasonality of mass and alkenone fluxes is more strongly
displayed at the shallow trap. At the shallow trap, mass, alkenone and GDGT fluxes are all enhanced
in mid-March, August, and November 1997 and mid-March 1998. At the deep trap, the maximum

126
mass flux occurs in mid-June 1997, but the maxima of alkenone and GDGT flux occur in
August−September and October−November 1997, respectively.
In the previous Section 4.5.3.1, it is explained that the warm-biased TEX8 H -derived temperatures
of the shallow trap relative to the satellite-derived SST are attributed to the response of
Thaumarchaeota to nutrient stress (Figure 5. , Hurley et al., 201 ). For the alkenone proxy, culture
and field studies have also noted that nutrient conditions may influence on the U thermometry
(Conte et al., 1998; Epstein et al., 1998; Prahl et al., 2003; Sikes et al., 2005). Prahl et al., (2003)
found that the U values decreased under low nutrient levels in a culture experiment. In the field,
U -derived temperatures have been reported to be cold biased by up to 4 °C relative to SST when the
nutrient level was low (Sikes et al., 2005). However, such nutrient stress does not seem to affect U
ratios at site WAB1. The U -derived temperatures vary within 1. °C, with the range of 2 .0−27.2 °C
at the shallow trap and 25.5−27.1 °C at the deep one (Figure 5. ). Those reconstructed temperatures
do not display seasonality, but they are similar to the satellite-derived SSTs. The flux-weighted mean
U temperatures are almost identical at both traps (27.5 °C at the shallow trap and 27.4 °C at the
deep trap). While the TEX8 H -derived temperatures are warm-biased in upper waters and are cold-
biased in deep waters, the U -derived temperatures reconstruct the regional SST in the oligotrophic
environment. Thus, a comparison of TEX8 H and U
-derived temperatures in sinking particles
collected in the central Brazil Basin reveals that U is a better proxy for reconstructing SST in the
oligotrophic ocean and TEX8 H is more sensitive to nutrient stress.
5.3.3.3 Comparable oligotrophic region (PAP-XXV; 48.99° N, 16.44° W)
In order to better constrain the temperature proxy signals of oligotrophic settings, an additional site
in the northeast Atlantic is investigated. This region is characterized as a typical mid-latitude ocean
regime having a nutrient-limited spring production peak (Lampitt et al., 2001; 48.99° N, 1 .44° W).
The study site is a long-term observatory mooring region on the Porcupine Abyssal Plain (PAP) in the
northeast Atlantic since 1992. In several studies it was observed that the biogeochemistry in surface
waters is coupled with the benthic community of the abyssal plain (Lampitt et al., 2010 and reference
therein). The flux data measured at multiple depths allow determining that the downward flux
captured at 3000 m depth better represent the seasonal variability of primary production (Lampitt et
al., 2010, 2001).
In this study, we analyzed alkenones and GDGTs in time-series samples of sinking particles
collected at 1000 m water depth covering one year from October 1998 to September 1999 (PAP-XXV;
Figure 5.7). Unfortunately, C37:2 and C37:3 could not be reliably quantified in the chromatogram
probably due to low alkenone concentrations.
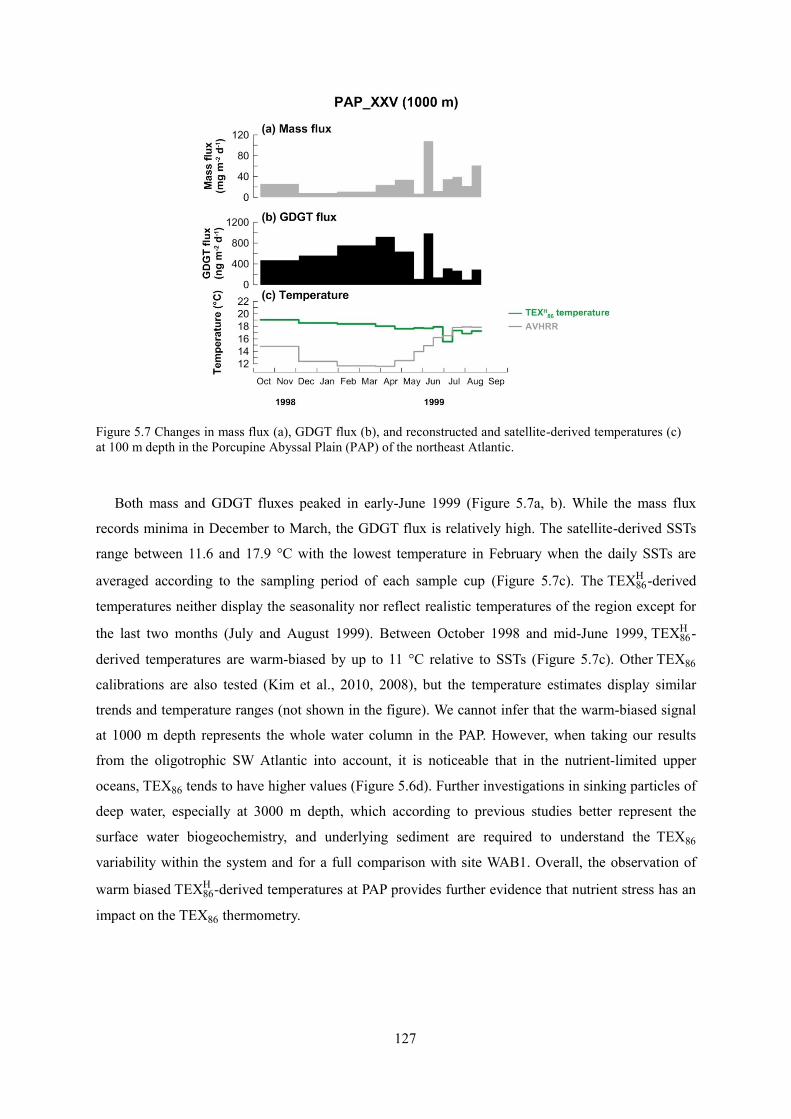
127
Figure 5.7 Changes in mass flux (a), GDGT flux (b), and reconstructed and satellite-derived temperatures (c)
at 100 m depth in the Porcupine Abyssal Plain (PAP) of the northeast Atlantic.
Both mass and GDGT fluxes peaked in early-June 1999 (Figure 5.7a, b). While the mass flux
records minima in December to March, the GDGT flux is relatively high. The satellite-derived SSTs
range between 11. and 17.9 °C with the lowest temperature in February when the daily SSTs are
averaged according to the sampling period of each sample cup (Figure 5.7c). The TEX8 H -derived
temperatures neither display the seasonality nor reflect realistic temperatures of the region except for
the last two months (July and August 1999). Between October 1998 and mid-June 1999, TEX8 H -
derived temperatures are warm-biased by up to 11 °C relative to SSTs (Figure 5.7c). Other TEX8
calibrations are also tested (Kim et al., 2010, 2008), but the temperature estimates display similar
trends and temperature ranges (not shown in the figure). We cannot infer that the warm-biased signal
at 1000 m depth represents the whole water column in the PAP. However, when taking our results
from the oligotrophic SW Atlantic into account, it is noticeable that in the nutrient-limited upper
oceans, TEX8 tends to have higher values (Figure 5. d). Further investigations in sinking particles of
deep water, especially at 3000 m depth, which according to previous studies better represent the
surface water biogeochemistry, and underlying sediment are required to understand the TEX8
variability within the system and for a full comparison with site WAB1. Overall, the observation of
warm biased TEX8 H -derived temperatures at PAP provides further evidence that nutrient stress has an
impact on the TEX8 thermometry.

128
5.4 Summary and conclusions
The temporal and spatial variability of fluxes in mass, alkenones and GDGTs and estimated
temperatures based on the U and TEX8 proxies are investigated throughout the Atlantic Ocean.
The correlations of alkenone or GDGT fluxes with ballasting material fluxes are different between the
regions, implying distinct export mechanisms. When only the best correlation is considered,
alkenones are better correlated with POC, PON and CaCO3 while GDGTs are mostly correlated with
Opal. This implies that alkenone and GDGTs are preferentially incorporated into particles containing
different materials.
The seasonal maxima of alkenone and GDGT fluxes occur in the same season in the tropical
oceans (equatorial upwelling regime and oligotrophic ocean) and high northern polar ocean. However,
in the coastal upwelling regime and Antarctic Polar Front, alkenone and GDGT fluxes have maxima
in different seasons. This implies that the competition for nutrients between alkenone producing
phytoplankton and GDGT producing archaea may differ according to the environmental conditions.
The U (and U
) are relatively faithful recorders of SSTs of the study regions. However, a
latitudinal limit clearly appears in the high latitude North Atlantic Ocean (in the eastern Fram Strait),
where the maximum SST reaches approximately only 4 °C. The TEX8 seems more sensitive to
environmental factors like the OMZs, archaeal community structure, or nutrient levels. Nonetheless,
the TEX8 temperature proxy is likely more reliable than the U proxy in the high northern latitude
ocean. Competitive and complementary relationships between alkenone and GDGT proxies are
beneficial to reconstruct paleotemperature.
Acknowledgments
We are thankful to the crews, scientists, and students, who were collecting the sediment trap
samples used in this study. This project is funded through the DFG-Research Center/Cluster of
Excellence “The Ocean in the Earth System” at the MARUM and supported by GLOMAR−Bremen
International Graduate School for Marine Sciences, University of Bremen.
Data availability
The data presented here will be archived on the PANGAEA database when the manuscript is
submitted.

129
CHAPTER
Summary and Perspectives

130
6 Summary and Perspectives
The studies conducted in this thesis are primarily aimed at contributing to a better understanding of
TEX8 thermometry using sinking particles collected in three different ocean regimes through the
Atlantic Ocean including the upwelling settings, Northern and Southern polar regions, and
oligotrophic settings. The seasonal variability of GDGT fluxes and TEX8 derived temperatures
recorded in sinking particles were investigated. Different TEX8 related calibrations (TEX8 , TEX8 H ,
TEX8 L ) were applied in the respective locations. In Polar Oceans, recently developed indices (OH-
GDGTs) were also applied. In each chapter, additional GDGT based indices for assessing non-thermal
signal in GDGT compositions were calculated.
The correlation between GDGT flux and potential ballasting material flux was used to identify the
major export mechanism of GDGTs to deep waters. The delay in receiving TEX8 signals relative to
overlying SST or the maximum period of GDGT flux at different depths when both parameters
exhibited clear seasonality was used to investigate the sinking velocity of particles carrying GDGTs. A
further aim was to obtain insights into the potential oceanographic and/or geochemical factors
influencing the regional and temporal applicability of the TEX8 thermometry. The flux-weighted
mean TEX8 (TEX8 H or TEX8
L ) temperatures averaged over the trap deployment period, which
covered all seasons, were compared to the depth profiles of water temperature and nutrient
concentration to estimate the depth origin of GDGT signals in respective the locations. The flux-
weighted mean signals in sinking particles were also compared to the TEX8 temperatures in
underlying surface sediment to test whether the signals are changed while sinking to deep waters. U
(or U )-derived temperatures were also compared with temperature estimates based on TEX8
proxies in each study.
The main findings and perspectives are summarized as set out below:
6.1 Export mechanism of lipid signal
Correlations of GDGT fluxes with those of opal, carbonate, and other biogenic/non-biogenic
components differ between regions and water depths where particles were collected. A strong
correlation of GDGTs with opal fluxes was observed in the equatorial upwelling zone of the Guinea
Basin (Chapter 2), in the eastern Fram Strait (Chapter 3), and in two locations of the central Brazil
Basin (Chapter 4), confirming that GDGTs are probably transported by opal-dominated aggregates. In
the regions where traps were available at two different depths, the correlation between the two
parameters was weaker with the deep trap compared to the shallow traps, suggesting that the particle
collections integrated larger spatial sources and variable temporal sources, together with a reduced
seasonal amplitude of GDGT fluxes. At the oligotrophic site, in particular, a strong correlation was

131
observed only at the shallow trap while no correlation was found at the deep trap, which might
indicate a different origin of GDGTs. Due to the relatively small number of data points at the
Lüderitz, correlations between parameters are not statistically significant. In the Antarctic Polar Front,
GDGT fluxes did not covary with any other parameters at either depth (Chapter 3). In addition to opal
or carbonate fluxes, other available biogenic and non-biogenic parameters in the eastern Fram Strait
allowed the determination of further GDGT exporters. Cell abundance of diatoms and
coccolithophores, which are sources of opal and carbonate respectively, co-varied with GDGT fluxes.
The flux of terrestrial biomarkers, which was probably drafted by sea-ice into the system, showed that
the terrestrial component can also play a role as a ballast material. Zooplankton fecal pellet fluxes
confirmed that GDGTs are incorporated into zooplankton fecal pellets and which probably lead to the
rapid sinking of TEX8 signal.
Overall, the role of aggregates mainly associated with opal is significant in exporting of GDGTs in
various ocean regimes. As found in the eastern Fram Strait, additional investigations with more
diverse components would be helpful to develop a comprehensive overview of the export mechanism
of GDGTs.
When the seasonal trend of U or TEX8 -based temperature signal follows the SST seasonality, it
allows the sinking velocity of particles containing alkenones or GDGTs to be calculated. The
calculated sinking velocity may underestimate the “real” one in the water column because it probably
includes the time taken for lipid production, aggregation, and transportation. In addition, the
composition of ballasting materials influences the sinking velocity of aggregates and thus the proxy
temperatures (Mollenhauer et al., 2015) (see Section 2 and 3). Nonetheless, determining sinking
velocities helps to track the temporal and spatial origin of particles incorporated with particles
(Wekerle et al., 2018). As the oceans are the carbon reservoirs for the earth, understanding the particle
export transferring organic materials and the magnitude of the transfer is important in terms of the
biological carbon pump. With reliable sinking velocity data, a particle trajectory study can estimate
the source area of particles caught in traps. Recently, Wekerle et al., (2018) simulated the catchment
area in the Fram Strait. The same approach applied to study the composition of ballasting materials
carrying lipids will enhance our understanding of the origin of lipids and temperature signals.
6.2 Potential non-thermal factors influencing on TEX8 thermometry
The seasonal temperature records in sinking particles and the distinctive oceanographic
characteristics in each region provided evidence for TEX8 thermometry. Additional GDGT-based
proxies, which can determine the non-thermal impacts on GDGT distributions, did not reveal inputs
of terrigenous, methanotrophic, or methanogenic sources of GDGTs. There was no latitudinal trend of

132
TEX8 temperature estimates throughout the Atlantic Ocean; rather, the reconstructed temperatures
based on the lipid proxy varied according to regional conditions.
Only at the Lüderitz (Chapter 2) and in the upper water column from the seasonal mesotrophic
Brazil Basin (chapter 4), did TEX8 thermometry reconstruct the SSTs. In the Guinea Basin (Chapter
2) and eastern Fram Strait (Chapter 3), the GDGT based (TEX8 H or TEX8
L ) temperature estimates
corresponded to the water temperature of the nutricline, where nitrification might be active and thus
GDGTs were dominantly exported. In the oligotrophic upper water column from the central Brazil
Basin (Chapter 4) and the Porcupine Abyssal Plain (Chapter 5), the TEX8 H -derived temperatures are
mostly warmer than the regional SSTs, responding to low energy “nutrient-depleted” conditions. The
nutrient dynamics thus seem to influence not only the depth distribution of the thaumarchaeotal
community, but also the distribution of GDGT. The adaptation to low oxygen level may also dictate
the ecology of Thaumarchaeota (Chapter 2). These findings are in line with batch culture experiments
and field studies where OMZs exist, showing that relatively higher TEX8 values are found in oxygen
limited conditions (Hurley et al., 201 ; Qin et al., 2015; Xie et al., 2014).
As for the delivery of lipid temperature throughout the water column, similar TEX8 values at the
multiple depth traps were found in the Arabian Sea and in the Northwest Pacific, which is in line with
the result in the equatorial upwelling Guinea Basin (Chapter 2). However, the estimated temperatures
were not consistent in two different depth traps in the Antarctic Polar Front (Chapter 3) and in the
central Brazil Basin (Chapter 4). In the Antarctic Polar Front, warm-biased temperature relative to
SST recorded in the deep trap and in the surface sediment may be caused by either input from a
euryarchaeotal community or a nonlinear correlation between TEX8 and SST in the Southern Ocean
(Chapter 3). The archaeal community in the trap location needs to be further examined and the
polynomial regression suggested in this study should be applied to the geological sediment record if
applicable. In the central Brazil Basin, the TEX8 signals recording the SST or warm-biased
temperatures measured in the shallow trap were not present in the deep traps. Relatively colder
temperatures compared to SST were recorded both in deep traps and in the surface sediment (Chapter
4). Based on the studies that measured TEX8 values in IPL-GDGT fractions and compound-specific
radiocarbon data of GDGTs in the oligotrophic ocean, it was hypothesized that the surface signal was
overprinted by significant deep ‘in situ GDGT production’ that carried colder temperature signals,
resulting in a cold-biased temperature in the deep traps and surface sediment (Chapter 4 and
references therein). The determination of radiocarbon data as conducted by Ingalls et al., (200 ) and
TEX8 value in IPL-GDGTs associated with specific head groups will give a better understanding of
the origin of GDGTs and the contribution of IPL-GDGTs to CL-GDGTs composition.
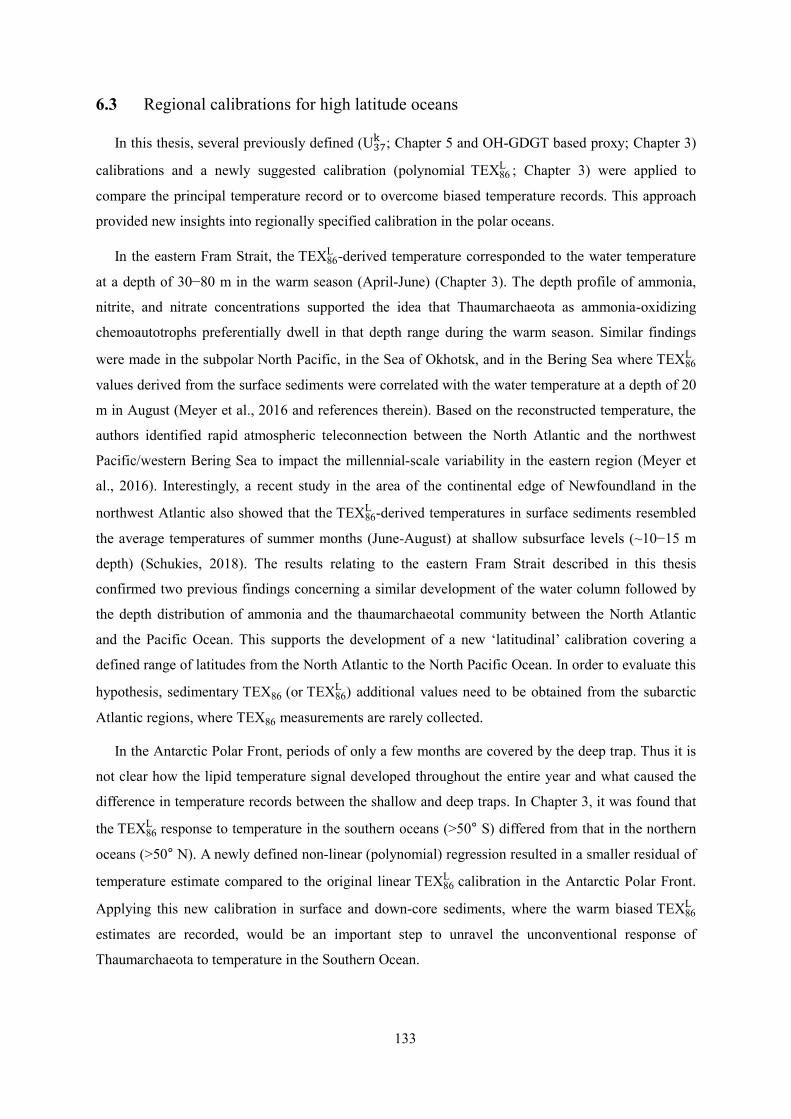
133
6.3 Regional calibrations for high latitude oceans
In this thesis, several previously defined (U ; Chapter 5 and OH-GDGT based proxy; Chapter 3)
calibrations and a newly suggested calibration (polynomial TEX8 L ; Chapter 3) were applied to
compare the principal temperature record or to overcome biased temperature records. This approach
provided new insights into regionally specified calibration in the polar oceans.
In the eastern Fram Strait, the TEX8 L -derived temperature corresponded to the water temperature
at a depth of 30−80 m in the warm season (April-June) (Chapter 3). The depth profile of ammonia,
nitrite, and nitrate concentrations supported the idea that Thaumarchaeota as ammonia-oxidizing
chemoautotrophs preferentially dwell in that depth range during the warm season. Similar findings
were made in the subpolar North Pacific, in the Sea of Okhotsk, and in the Bering Sea where TEX8 L
values derived from the surface sediments were correlated with the water temperature at a depth of 20
m in August (Meyer et al., 201 and references therein). Based on the reconstructed temperature, the
authors identified rapid atmospheric teleconnection between the North Atlantic and the northwest
Pacific/western Bering Sea to impact the millennial-scale variability in the eastern region (Meyer et
al., 201 ). Interestingly, a recent study in the area of the continental edge of Newfoundland in the
northwest Atlantic also showed that the TEX8 L -derived temperatures in surface sediments resembled
the average temperatures of summer months (June-August) at shallow subsurface levels (~10−15 m
depth) (Schukies, 2018). The results relating to the eastern Fram Strait described in this thesis
confirmed two previous findings concerning a similar development of the water column followed by
the depth distribution of ammonia and the thaumarchaeotal community between the North Atlantic
and the Pacific Ocean. This supports the development of a new ‘latitudinal’ calibration covering a
defined range of latitudes from the North Atlantic to the North Pacific Ocean. In order to evaluate this
hypothesis, sedimentary TEX8 (or TEX8 L ) additional values need to be obtained from the subarctic
Atlantic regions, where TEX8 measurements are rarely collected.
In the Antarctic Polar Front, periods of only a few months are covered by the deep trap. Thus it is
not clear how the lipid temperature signal developed throughout the entire year and what caused the
difference in temperature records between the shallow and deep traps. In Chapter 3, it was found that
the TEX8 L response to temperature in the southern oceans (>50° S) differed from that in the northern
oceans (>50° N). A newly defined non-linear (polynomial) regression resulted in a smaller residual of
temperature estimate compared to the original linear TEX8 L calibration in the Antarctic Polar Front.
Applying this new calibration in surface and down-core sediments, where the warm biased TEX8 L
estimates are recorded, would be an important step to unravel the unconventional response of
Thaumarchaeota to temperature in the Southern Ocean.

134
The occurrence of OH-GDGTs in sinking particles only from the polar oceans and their recon-
structed temperature corresponding to regional SSTs highlighted the applicability of OH-GDGTs as a
potential temperature proxy in cold regions (Chapter 3). However, this requires further research, simi-
lar to that conducted for TEX8 into the ecology of lipid producers and the export mechanisms.
Evidence of potential temperature calibrations along with the TEX8 proxy in the northern and south-
ern polar oceans highlights the need for regionally specified approaches to reconstruct temperature in
cold oceans.
6.4 Difference between U 𝐤 and TEX8 temperature estimate
Temperature differences between two lipid proxies (U and TEX8 ) varied by regions (Chapter
5). For most of times and locations, U -derived temperatures resembled the local SSTs. The
reconstructed temperatures based on U and TEX8
H in the Guinea Basin provided additional
evidence of alkenone proxy estimating SST and GDGT proxy estimating subsurface temperature as
shown in other upwelling regions (Chen et al., 201 ; Lee et al., 2008; Mollenhauer et al., 2015). The
discrepancy between the two proxy records could thus explain the thermocline adjustment caused by
the long-term nature of ocean circulation (Lopes dos Santos et al., 2010; Rommerskirchen et al.,
2011). The use of two lipid proxies as a pair is beneficial, especially in the warm oceans.
Even at the locations where non-thermal influences on TEX8 thermometry were identified, the
U records were rather consistent, mirroring the SSTs. It seems, therefore, that the U
proxy is less
sensitive to environmental settings such as availability of nutrients or oxygen, or the depth distribution
of nutrients, while the TEX8 proxy is useful to investigate paleotemperature during different climate
events. For instance, the SST evolutions in the Cretaceous period, which is characterized by higher
CO2 concentration and warmer climate than the modern era, have been reconstructed using the TEX8
proxy and agree with isotope-derived data (Littler et al., 2011; O’Brien et al., 2017; van Helmond et
al., 2014; Zachos et al., 200 ). Alkenones are rarely found in the Cretaceous period, so that the U
proxy cannot be applied. Additionally, the U proxy and its modified calibrations containing C37:4
failed to reconstruct temperatures below 4 °C whereas the TEX8 proxy successfully revealed the
regional temperature.
The results described in this thesis proved that time-series sediment trap samples are excellent
tools to investigate a proxy signal while sinking to the sediment. This work provides substantial
improvements in the TEX8 thermometry in terms of its depth origin and the potential non-thermal
effects on GDGT composition. In addition, it identifies the importance of regional calibrations for
polar oceans. Further time-series sediment trap studies for multiple years and depths in diverse
oceanic regions would improve the knowledge of regional TEX8 thermometry deviating from the
global trend.

135
Appendix 1
A1. Figure 1 Diagram of a time-series sediment trap used in this study. The rotary sample plate holds 20
particle collection cups (the number of cups can be different according to the model). According to the pre-
programmed schedule, the tray rotates and the following cup is placed. The apparatus has the top with an
opening of 0.5 m2 covered with a honeycomb baffle to prevent the large objects and turbulence (a figure was
modified after http://www.whoi.edu/page.do?pid=8415&tid=7342&cid=10286).

136
References
Abbott, M.R., Richman, J.G., Nahorniak, J.S., Barksdale, B.S., 2001. Meanders in the Antarctic Polar
Frontal Zone and their impact on phytoplankton. Deep. Res. Part II Top. Stud. Oceanogr. 48,
3891–3912. doi:10.1016/S0967-0645(01)00073-X
Agogué, H., Brink, M., Dinasquet, J., Herndl, G.J., 2008. Major gradients in putatively nitrifying and
non-nitrifying Archaea in the deep North Atlantic. Nature 456, 788–792.
doi:10.1038/nature07535
Alonso-Sáez, L., Andersson, A., Heinrich, F., Bertilsson, S., 2011. High archaeal diversity in
Antarctic circumpolar deep waters. Environ. Microbiol. Rep. 3, 689–697. doi:10.1111/j.1758-
2229.2011.00282.x
Basse, A., Zhu, C., Versteegh, G.J.M., Fischer, G., Hinrichs, K.-U., Mollenhauer, G., 2014.
Distribution of intact and core tetraether lipids in water column profiles of suspended particulate
matter off Cape Blanc, NW Africa. Org. Geochem. 72, 1–13.
doi:10.1016/j.orggeochem.2014.04.007
Bauerfeind, E., Kattner, G., Ludwichowski, K.-U., Nöthig, E.-M., Sandhop, N., 2014. Inorganic
nutrients measured on water bottle samples at AWI HAUSGARTEN during POLARSTERN
cruise MSM29. doi:10.1594/PANGAEA.834685
Bauerfeind, E., Nöthig, E.M., Beszczynska, A., Fahl, K., Kaleschke, L., Kreker, K., Klages, M.,
Soltwedel, T., Lorenzen, C., Wegner, J., 2009. Particle sedimentation patterns in the eastern
Fram Strait during 2000-2005: Results from the Arctic long-term observatory HAUSGARTEN.
Deep. Res. Part I Oceanogr. Res. Pap. 56, 1471–1487. doi:10.1016/j.dsr.2009.04.011
Beman, J.M., Popp, B.N., Francis, C.A., 2008. Molecular and biogeochemical evidence for ammonia
oxidation by marine Crenarchaeota in the Gulf of California. ISME J. 2, 429–441.
doi:10.1038/ismej.2008.33
Bendle, J., Rosell-Melé, A., 2004. Distributions of UK37 and UK 37 in the surface waters and
sediments of the Nordic Seas: Implications for paleoceanography. Geochemistry, Geophys.
Geosystems 5, 1–19. doi:10.1029/2004GC000741
Bendle, J., Rosell-mele, A., Ziveri, P., 2005. Variability of unusual distributions of alkenones in the
surface waters of the Nordic seas. Paleoceanography 20, 1–15. doi:10.1029/2004PA001025
Benthien, A., Müller, P.J., 2000. Anomalously low alkenone temperatures caused by lateral particle
and sediment transport in the Malvinas Current regions, western Argentine Basin. Deep Sea Res.
Part I Oceanogr. Res. Pap. 47, 2369–2393.
Berelson, W.M., 2002. Particle settling rates increase with depth in the ocean. Deep. Res. Part II Top.
Stud. Oceanogr. 49, 237–251. doi:10.1016/S0967-0645(01)00102-3
Beszczynska-Möller, A., Fahrbach, E., Rohardt, G., Schauer, U., 2012a. Physical oceanography and
current meter data from mooring F7-8. doi:10.1594/PANGAEA.800396
Beszczynska-Möller, A., Fahrbach, E., Schauer, U., Hansen, E., 2012b. Variability in Atlantic water
temperature and transport at the entrance to the Arctic Ocean, 1997-2010. ICES J. Mar. Sci. 69,
852–863. doi:10.1093/icejms/fss056
Blaga, C.I., Reichart, G.J., Heiri, O., Sinninghe Damsté, J.S., 2009. Tetraether membrane lipid
distributions in water-column particulate matter and sediments: A study of 47 European lakes
along a north-south transect. J. Paleolimnol. 41, 523–540. doi:10.1007/s10933-008-9242-2
Bode, A., Hernández-León, S., 2018. Trophic Diversity of Plankton in the Epipelagic and
Mesopelagic Layers of the Tropical and Equatorial Atlantic Determined with Stable Isotopes.
Diversity 10, 1–16. doi:10.3390/d10020048
Brassell, S.C., Eglinton, G., Marlowe, I.T., Pflaumann, U., Sarnthein, M., 1986. Molecular
stratigraphy: a new tool for climatic assessment. Nature 320, 129–133. doi:10.1038/320129a0
Brochier-Armanet, C., Boussau, B., Gribaldo, S., Forterre, P., 2008. Mesophilic crenarchaeota:
proposal for a third archaeal phylum, the Thaumarchaeota. Nat. Rev. Microbiol. 6, 245.
Brüchert, V., Jørgensen, B.B., Neumann, K., Riechmann, D., Schlösser, M., Schulz, H., 2003.
Regulation of bacterial sulfate reduction and hydrogen sulfide fluxes in the central Namibian

137
coastal upwelling zone. Geochim. Cosmochim. Acta 67, 4505–4518. doi:10.1016/S0016-
7037(03)00275-8
Buesseler, K.O., Antia, A.N., Chen, M., Fowler, S.W., Gardner, W.D., Gustafsson, O., Harada, K.,
Michaels, A.F., Rutgers van der Loeff, M., Sarin, M., Steinberg, D.K., Trull, T., 2007. An
assessment of the use of sediment traps for estimating upper ocean particle fluxes. J. Mar. Res.
345–416. doi:10.1357/002224007781567621
Carr, M.-E., 2002. Estimation of potential productivity in Eastern Boundary Currents using remote
sensing. Deep. Res. Part II Top. Stud. Oceanogr. 49, 59–80. doi:doi.org/10.1016/S0967-
0645(01)00094-7
Carr, M.-E., Kearns, E.J., 2003. Production regimes in four Eastern Boundary Current systems. Deep.
Res. Part II Top. Stud. Oceanogr. 50, 3199–3221. doi:10.1016/j.dsr2.2003.07.015
Chapman, P., Shannon, L. V., 1987. Seasonality in the oxygen minimum layers at the extremities of
the Benguela system. South Africa J. Mar. Sci. 5, 85–94.
doi:doi.org/10.2989/025776187784522162
Chave, K.E., 1954. Aspects of the Biogeochemistry of Magnesium 1. Calcareous Marine Organisms.
J. Geol. 62, 266–283. doi:10.1086/626162
Chen, W., Mohtadi, M., Schefuß, E., Mollenhauer, G., 2016. Concentrations and abundance ratios of
long-chain alkenones and glycerol dialkyl glycerol tetraethers in sinking particles south of Java.
Deep. Res. Part I Oceanogr. Res. Pap. 112, 14–24. doi:10.1016/j.dsr.2016.02.010
Chen, W., Mohtadi, M., Schefuß, E., Mollenhauer, G., 2014. Organic-geochemical proxies of sea
surface temperature in surface sediments of the tropical eastern Indian Ocean. Deep. Res. Part I
Oceanogr. Res. Pap. 88, 17–29. doi:10.1016/j.dsr.2014.03.005
Church, M.J., DeLong, E.F., Ducklow, H.W., Karner, M.B., Preston, C.M., Karl, D.M., 2003.
Abundance and distribution of planktonic Archaea and Bacteria in the waters west of the
Antarctic Peninsula. Limnol. Oceanogr. 48, 1893–1902. doi:10.4319/lo.2003.48.5.1893
Church, M.J., Wai, B., Karl, D.M., Delong, E.F., 2010. Abundances of crenarchaeal amoA genes and
transcripts in the Pacific Ocean. Environ. Microbiol. 12, 679–688. doi:10.1111/j.1462-
2920.2009.02108.x
Conley, K.R., Sutherland, K.R., 2017. Particle shape impacts export and fate in the ocean through
interactions with the globally abundant appendicularian Oikopleura dioica. PLoS One 12, 1–17.
doi:10.1371/journal.pone.0183105
Conte, M.H., Thompson, A., Lesley, D., Harris, R.P., 1998. Genetic and Physiological Influences on
the Alkenone/Alkenoate Versus Growth Temperature Relationship in Emiliania huxleyi and
Gephyrocapsa oceanica. Geochim. Cosmochim. Acta 62, 51–68. doi:10.1016/S0016-
7037(97)00327-X
de Bar, M.W., Stolwijk, D.J., McManus, J.F., Sinninghe Damste, J.S., Schouten, S., 2018. A Late
Quaternary climate record based on long chain diol proxies from the Chilean margin. Clim. Past
Discuss. 1–34. doi:10.5194/cp-2018-88
Delong, E.F., 2003. Oceans of Archaea. ASM News 69, 503–511. doi:10.2307/3954521
Delong, E.F., 1992. Archaea in coastal marine environments. Proc. Natl. Acad. Sci. 89, 5685–5689.
Dwyer, G.S., Cronin, T.M., Baker, P.A., Raymo, M.E., Buzas, J.S., Corrège, T., 1995. North Atlantic
Deepwater Temperature Change During Late Pliocene and Late Quaternary Climatic Cycles.
Science (80-. ). 270, 1347–1351. doi:10.1126/science.270.5240.1347
Elling, F.J., Könneke, M., Lipp, J.S., Becker, K.W., Gagen, E.J., Hinrichs, K.-U., 2014. Effects of
growth phase on the membrane lipid composition of the thaumarchaeon Nitrosopumilus
maritimus and their implications for archaeal lipid distributions in the marine environment.
Geochim. Cosmochim. Acta 141, 579–597. doi:10.1016/j.gca.2014.07.005
Elling, F.J., Könneke, M., Mußmann, M., Greve, A., Hinrichs, K.-U., 2015. Influence of temperature,
pH, and salinity on membrane lipid composition and TEX86 of marine planktonic
thaumarchaeal isolates. Geochim. Cosmochim. Acta 171, 238–255.
doi:10.1016/j.gca.2015.09.004
Epstein, B.L., D’Hondt, S., Quinn, J.G., Zhang, J., Hargraves, P.E., 1998. An effect of dissolved
nutrient concentrations based temperature estimates. PaleoceanographyCurrents 13, 122–126.
doi:10.1029/97PA03358

138
Epstein, S., Mayeda, T., 1953. Variation of O18 content of waters from natural sources. Geochim.
Cosmochim. Acta 4, 213–224. doi:10.1016/0016-7037(53)90051-9
Fahrbach, E., Cruise Participants, 1992. Report and preliminary results of the Expeditions
ANTARKTIS IX/2 of the Research Vessel Polarstern in 1990/91, Punta Arenas-Cape Town,
16.11.1990-30.12-1990.
Fallet, U., Ullgren, J.E., Castañeda, I.S., van Aken, H.M., Schouten, S., Ridderinkhof, H., Brummer,
G.J. a, 2011. Contrasting variability in foraminiferal and organic paleotemperature proxies in
sedimenting particles of the Mozambique Channel (SW Indian Ocean). Geochim. Cosmochim.
Acta 75, 5834–5848. doi:10.1016/j.gca.2011.08.009
Fhurmann, J.A., McCallum, K., Davis, A.A., 1992. Novel major archaebacterial group from marine
plankton. Nature 356, 148–149.
Fietz, S., Huguet, C., Rueda, G., Hambach, B., Rosell-Melé, A., 2013. Hydroxylated isoprenoidal
GDGTs in the Nordic Seas. Mar. Chem. 152, 1–10. doi:10.1016/j.marchem.2013.02.007
Fischer, G., 1999. Report and Preliminary Results of METEOR-CRUISE M 41/1, Svalvador da Bahia
- Las Palmas, 18.5-13.6.1998. Bremen.
Fischer, G., 1998. Report and Preliminary Results of METEOR-Cruise M 38/1, Las Palmas - Recife,
25.1.-1.3.1997.
Fischer, G., 1996. Report and Preliminary Results of METEOR-Cruise M 34/4, Recife - Bridgetown,
19.3.-15.4.1996. Bremen.
Fischer, G., Gersonde, R., Wefer, G., 2002. Organic carbon, biogenic silica and diatom fluxes in the
marginal winter sea-ice zone and in the Polar Front Region: Interannual variations and
differences in composition. Deep. Res. Part II Top. Stud. Oceanogr. 49, 1721–1745.
doi:10.1016/S0967-0645(02)00009-7
Fischer, G., Karakaş, G., 2009. Sinking rates and ballast composition of particles in the Atlantic
Ocean: implications for the organic carbon fluxes to the deep ocean. Biogeosciences 6, 85–102.
doi:10.5194/bg-6-85-2009
Fischer, G., Wefer, G., 1996. Long-term Observation of Particle Fluxes in the Eastern Atlantic:
Seasonality, Changes of Flux with Depth and Comparison with the Sediment Record, The South
Atlantic: Present and Past Circulation. Springer-Verlag, Berlin, Heidelberg.
doi:https://doi.org/10.1007/978-3-642-80353-6_18
Fischer, G., Wefer, G., 1991. Sampling, Preparation and Analysis of Marine Particulate Matter, in: C.
Herd, D., W. Spencer, D. (Eds.), Marine Particles: Analysis and Characterization, Geophysical
Monograph Series. American Geophysical Union, Washington, D.C, pp. 391–397.
doi:10.1029/GM063p0391
Francis, C.A., Roberts, K.J., Beman, J.M., Santoro, A.E., Oakley, B.B., 2005. Ubiquity and diversity
of ammonia-oxidizing archaea in water columns and sediments of the ocean. Proc. Natl. Acad.
Sci. 102, 14683–14688. doi:10.1093/ije/1.3.279
Franz, B.A., 2012. Quality and Consistency of the NASA Ocean Color Data Record. J. Geophys. Res.
Ocean. 106, 14015–14034. doi:10.1029/2000JC000304
Freeman, N.M., Lovenduski, N.S., 2016. Mapping the Antarctic Polar Front: Weekly realizations
from 2002 to 2014. Earth Syst. Sci. Data 8, 191–198. doi:10.5194/essd-8-191-2016
Garcia, H.E., Locarnini, R.A., Boyer, T.P., Antonov, J.I., Baranova, O.K., Zweng, M.M., Reagan, J.R.,
Johnson, D.R., 2013. World Ocean Atlas 2013, Volume 4 : Dissolved Inorganic Nutrients
(phosphate, nitrate, silicate). NOAA Atlas NESDIS 76 4, 25. doi:10.1182/blood-2011-06-
357442
Gardner, W.D., 2000. Sediment trap sampling in surface waters, in: Hanson, R.B., Ducklow, H.W.,
Field, J.G. (Eds.), The Changing Ocean Carbon Cycle, A Midterm Synthesis of the Joint Global
Ocean Flux Study. Cambridge University Press, pp. 240–281.
Gardner, W.D., 1985. The effect of tilt on sediment trap efficiency. Deep Sea Res. Part A, Oceanogr.
Res. Pap. 32, 349–361. doi:10.1016/0198-0149(85)90083-4
Gersonde, R., Participants, C., 1990. Report and preliminary results of the Expeditions ANTARKTIS
VIII/3 of the Research Vessel Polarstern in 1989/90, Cape Town-Punta Arenas, 01.11.1989-
01.12-1989.

139
Hebbeln, D., 2000. Flux of ice-rafted detritus from sea ice in the Fram Strait. Deep. Res. Part II Top.
Stud. Oceanogr. 47, 1773–1790. doi:10.1016/S0967-0645(00)00006-0
Hebbeln, D., Wefer, G., 1991. Effects of ice coverage and ice-rafted material on sedimentation in the
Fram Strait. Nature 350, 409–411. doi:10.1038/350409a0
Herfort, L., Schouten, S., Abbas, B., Veldhuis, M.J.W., Coolen, M.J.L., Wuchter, C., Boon, J.P.,
Herndl, G.J., Sinninghe Damsté, J.S., 2007. Variations in spatial and temporal distribution of
Archaea in the North Sea in relation to environmental variables. FEMS Microbiol. Ecol. 62,
242–257. doi:10.1111/j.1574-6941.2007.00397.x
Hernández-Sánchez, M.T., Woodward, E.M.S., Taylor, K.W.R., Henderson, G.M., Pancost, R.D.,
2014. Variations in GDGT distributions through the water column in the South East Atlantic
Ocean. Geochim. Cosmochim. Acta 132, 337–348. doi:10.1016/j.gca.2014.02.009
Herndl, G.J., Reinthaler, T., Teira, E., Aken, H. Van, Veth, C., Pernthaler, A., Pernthaler, J., 2005.
Contribution of Archaea to Total Prokaryotic Production in the Deep Atlantic Ocean. Appl.
Environ. Microbiol. 71, 2303–2309. doi:10.1128/AEM.71.5.2303
Hertzberg, J.E., Schmidt, M.W., Bianchi, T.S., Smith, R.K., Shields, M.R., Marcantonio, F., 2015.
Comparison of eastern tropical Pacific TEX86 and Globigerinoides ruber Mg/Ca derived sea
surface temperatures: Insights from the Holocene and Last Glacial Maximum. Earth Planet. Sci.
Lett. 434, 320–332. doi:10.1016/j.epsl.2015.11.050
Ho, S.L., Mollenhauer, G., Fietz, S., Martínez-Garcia, A., Lamy, F., Rueda, G., Schipper, K., Méheust,
M., Rosell-Melé, A., Stein, R., Tiedemann, R., 2014. Appraisal of TEX86 and TEX86L
thermometries in subpolar and polar regions. Geochim. Cosmochim. Acta 131, 213–226.
doi:10.1016/j.gca.2014.01.001
Hopmans, E.C., Schouten, S., Pancost, R.D., Van Der Meer, M.T.J., Sinninghe Damsté, J.S., 2000.
Analysis of intact tetraether lipids in archaeal cell material and sediments by high performance
liquid chromatography/atmospheric pressure chemical ionization mass spectrometry. Rapid
Commun. Mass Spectrom. 14, 585–589. doi:10.1002/(SICI)1097-
0231(20000415)14:7<585::AID-RCM913>3.0.CO;2-N
Hopmans, E.C., Weijers, J.W.H., Schefuß, E., Herfort, L., Sinninghe Damsté, J.S., Schouten, S., 2004.
A novel proxy for terrestrial organic matter in sediments based on branched and isoprenoid
tetraether lipids. Earth Planet. Sci. Lett. 224, 107–116. doi:10.1016/j.epsl.2004.05.012
Horak, R.E.A., Qin, W., Bertagnolli, A.D., Nelson, A., Heal, K.R., Han, H., Heller, M., Schauer, A.J.,
Jeffrey, W.H., Armbrust, E.V., Moffett, J.W., Ingalls, A.E., Stahl, D.A., Devol, A.H., 2017.
Relative impacts of light, temperature, and reactive oxygen on thaumarchaeal ammonia
oxidation in the North Pacific Ocean. Limnol. Oceanogr. 63, 1–16. doi:10.1002/lno.10665
Horak, R.E.A., Qin, W., Schauer, A.J., Armbrust, E.V., Ingalls, A.E., Moffett, J.W., Stahl, D.A.,
Devol, A.H., 2013. Ammonia oxidation kinetics and temperature sensitivity of a natural marine
community dominated by Archaea. ISME J. 7, 2023–2033. doi:10.1038/ismej.2013.75
Huguet, C., Cartes, J.E., Sinninghe Damsté, J.S., Schouten, S., 2006. Marine crenarchaeotal
membrane lipids in decapods: Implications for the TEX86 paleothermometer. Geochemistry,
Geophys. Geosystems 7, Q11010. doi:10.1029/2006GC001305
Huguet, C., Fietz, S., Rosell-Melé, A., 2013. Global distribution patterns of hydroxy glycerol dialkyl
glycerol tetraethers. Org. Geochem. 57, 107–118. doi:10.1016/j.orggeochem.2013.01.010
Huguet, C., Kim, J.H., de Lange, G.J., Sinninghe Damsté, J.S., Schouten, S., 2009. Effects of long
term oxic degradation on the U37 K′, TEX86 and BIT organic proxies. Org. Geochem. 40,
1188–1194. doi:10.1016/j.orggeochem.2009.09.003
Huguet, C., Schimmelmann, A., Thunell, R., Lourens, L.J., Sinninghe Damsté, J.S., Schouten, S.,
2007. A study of the TEX86 paleothermometer in the water column and sediments of the Santa
Barbara Basin, California. Paleoceanography 22, PA3203. doi:10.1029/2006PA001310
Hurley, S.J., Elling, F.J., Könneke, M., Buchwald, C., Wankel, S.D., Santoro, A.E., Lipp, J.S.,
Hinrichs, K.-U., Pearson, A., 2016. Influence of ammonia oxidation rate on thaumarchaeal lipid
composition and the TEX86 temperature proxy. Proc. Natl. Acad. Sci. USA 113, 7762–7767.
doi:10.1073/pnas.1518534113

140
Hurley, S.J., Lipp, J.S., Close, H.G., Hinrichs, K.-U., Pearson, A., 2018. Distribution and export of
isoprenoid tetraether lipids in suspended particulate matter from the water column of the
Western Atlantic Ocean. Org. Geochem. 116, 90–102. doi:10.1016/j.orggeochem.2017.11.010
Ingalls, A.E., Huguet, C., Truxal, L.T., 2012. Distribution of intact and core membrane lipids of
archaeal glycerol dialkyl glycerol tetraethers among size-fractionated particulate organic matter
in Hood Canal, Puget Sound. Appl. Environ. Microbiol. 78, 1480–1490.
doi:10.1128/AEM.07016-11
Ingalls, A.E., Shah, S.R., Hansman, R.L., Aluwihare, L.I., Santos, G.M., Druffel, E.R.M., Pearson, A.,
2006. Quantifying archaeal community autotrophy in the mesopelagic ocean using natural
radiocarbon. Proc. Natl. Acad. Sci. USA 103, 6442–6447. doi:10.1073/pnas.0510157103
Inglis, G.N., Farnsworth, A., Lunt, D., Foster, G.L., Hollis, C.J., Pagani, M., Jardine, P.E., Pearson,
P.N., Markwick, P., Galsworthy, A.M.J., 2015. Descent toward the Icehouse: Eocene sea surface
cooling inferred from GDGT distributions. Paleoceanography 30, 1000–1020.
doi:10.1002/2014PA002723.Received
Inthorn, M., Mohrholz, V., Zabel, M., 2006a. Nepheloid layer distribution in the Benguela upwelling
area offshore Namibia. Deep. Res. Part I Oceanogr. Res. Pap. 53, 1423–1438.
doi:10.1016/j.dsr.2006.06.004
Inthorn, M., Wagner, T., Scheeder, G., Zabel, M., 2006b. Lateral transport controls distribution,
quality, and burial of organic matter along continental slopes in high-productivity areas.
Geology 34, 205–208. doi:10.1130/G22153.1
IPCC, 2014. Climate Change 2014: Synthesis Report. Contribution to Working Groups I, II, III to the
Fifth Assessment Report of the Intergovernmental Panel on Climate Change. Geneva,
Switzerland. doi:10.1046/j.1365-2559.2002.1340a.x
Isla, A., Scharek, R., Latasa, M., 2015. Zooplankton diel vertical migration and contribution to deep
active carbon flux in the NW Mediterranean. J. Mar. Syst. 143, 86–97.
doi:10.1016/j.jmarsys.2014.10.017
Iversen, M.H., Nowald, N., Ploug, H., Jackson, G. a., Fischer, G., 2010. High resolution profiles of
vertical particulate organic matter export off Cape Blanc, Mauritania: Degradation processes and
ballasting effects. Deep. Res. Part I Oceanogr. Res. Pap. 57, 771–784.
doi:10.1016/j.dsr.2010.03.007
Iversen, M.H., Pakhomov, E.A., Hunt, B.P.V., van der Jagt, H., Wolf-Gladrow, D., Klaas, C., 2017.
Sinkers or floaters? Contribution from salp pellets to the export flux during a large bloom event
in the Southern Ocean. Deep. Res. Part II Top. Stud. Oceanogr. 138, 116–125.
doi:10.1016/j.dsr2.2016.12.004
Iversen, M.H., Ploug, H., 2010. Ballast minerals and the sinking carbon flux in the ocean: carbon-
specific respiration rates and sinking velocity of marine snow aggregates. Biogeosciences 7,
2613–2624. doi:10.5194/bg-7-2613-2010
Jackson, G.A., Checkley Jr, D.M., 2011. Particle size distribution in the upper 100 m water column
and their implications for animal feeding in the plankton. Deep Sea Res. Part I Oceanogr. Res.
Pap. 58, 283–297. doi:10.1016/j.dsr.2010.12.008
Japp S. Sinninghe, D., S, S., Ellen C, H., Adri C. T., van D., Jan A.J., G., 2002. Crenarchaeol: the
characteristic core glycerol dibiphytanyl glycerol tetraether membrane lipid of cosmopolitan
pelagic crenarchaeota. J. Lipid Res. 43, 1641–1651. doi:10.1194/jlr.M200148-JLR200
Jonas, A.-S., Schwark, L., Bauersachs, T., 2017. Late Quaternary water temperature variations of the
Northwest Pacific based on the lipid paleothermometers TEXH86, Uk’37 and LDI. Deep. Res.
Part I 125, 81–93. doi:10.1016/j.dsr.2017.04.018
Kabel, K., Moros, M., Porsche, C., Neumann, T., Adolphi, F., Andersen, T.J., Siegel, H., Gerth, M.,
Leipe, T., Jansen, E., Sinninghe Damsté, J.S., 2012. Impact of climate change on the Baltic Sea
ecosystem over the past 1,000 years. Nat. Clim. Chang. 2, 871–874. doi:10.1038/nclimate1595
Kalvelage, T., Jensen, M.M., Contreras, S., Revsbech, N.P., Lam, P., Günter, M., LaRoche, J., Lavik,
G., Kuypers, M.M.M., 2011. Oxygen Sensitivity of Anammox and Coupled N-cycle Processes
in Oxygen Minimum Zones. PLoS One 6, e29299. doi:10.1371/journal.pone.0029299
Karner, M.B., DeLong, E.F., Karl, D.M., 2001. Archaeal dominance in the mesopelagic zone of the
Pacific Ocean. Nature 409, 507–510. doi:10.1038/35054051

141
Kattner, G., Participants, C., 2009. Reports on Polar and Marine Research. The Expedition of the
Research Vessel Polarstern to the Arctic in 2008 (ARK-XXIII/2), Longyearbyen-Reykjavik,
06.07-10.08.2008.
Kim, J.-H., Crosta, X., Willmott, V., Renssen, H., Bonnin, J., Helmke, P., Schouten, S., Sinninghe
Damsté, J.S., 2012a. Holocene subsurface temperature variability in the eastern Antarctic
continental margin. Geophys. Res. Lett. 39. doi:10.1029/2012GL051157
Kim, J.-H., Huguet, C., Zonneveld, K.A.F., Versteegh, G.J.M., Roeder, W., Sinninghe Damsté, J.S.,
Schouten, S., 2009. An experimental field study to test the stability of lipids used for the TEX86
and UK 37 palaeothermometers. Geochim. Cosmochim. Acta 73, 2888–2898.
doi:10.1016/j.gca.2009.02.030
Kim, J.-H., Romero, O.E., Lohmann, G., Donner, B., Laepple, T., Haam, E., Sinninghe Damsté, J.S.,
2012b. Pronounced subsurface cooling of North Atlantic waters off Northwest Africa during
Dansgaard–Oeschger interstadials. Earth Planet. Sci. Lett. 339–340, 95–102.
doi:10.1016/j.epsl.2012.05.018
Kim, J.-H., Schouten, S., Rodrigo-Gámiz, M., Rampen, S., Marino, G., Huguet, C., Helmke, P.,
Buscail, R., Hopmans, E.C., Pross, J., Sangiorgi, F., Middelburg, J.B.M., Sinninghe Damsté, J.S.,
2015. Influence of deep-water derived isoprenoid tetraether lipids on the TEX86H
paleothermometer in the Mediterranean Sea. Geochim. Cosmochim. Acta 150, 125–141.
doi:10.1016/j.gca.2014.11.017
Kim, J.-H., van der Meer, J., Schouten, S., Helmke, P., Willmott, V., Sangiorgi, F., Koç, N., Hopmans,
E.C., Sinninghe Damsté, J.S., 2010. New indices and calibrations derived from the distribution
of crenarchaeal isoprenoid tetraether lipids: Implications for past sea surface temperature
reconstructions. Geochim. Cosmochim. Acta 74, 4639–4654. doi:10.1016/j.gca.2010.05.027
Kim, J.H., Crosta, X., Michel, E., Schouten, S., Duprat, J., Sinninghe Damsté, J.S., 2009. Impact of
lateral transport on organic proxies in the Southern Ocean. Quat. Res. 71, 246–250.
doi:10.1016/j.yqres.2008.10.005
Kim, J.H., Schouten, S., Hopmans, E.C., Donner, B., Sinninghe Damsté, J.S., 2008. Global sediment
core-top calibration of the TEX86 paleothermometer in the ocean. Geochim. Cosmochim. Acta
72, 1154–1173. doi:10.1016/j.gca.2007.12.010
Kim, J.H., Villanueva, L., Zell, C., Sinninghe Damsté, J.S., 2016. Biological source and provenance
of deep-water derived isoprenoid tetraether lipids along the Portuguese continental margin.
Geochim. Cosmochim. Acta 172, 177–204. doi:10.1016/j.gca.2015.09.010
Kinsman, D.J.J., Holland, H.D., 1969. The co-precipitation of cations with CaCO3,-IV. The co-
precipitation of Sr2+ with aragonite between 16°C and 96°C. Geochim. Cosmochim. Acta 33,
1–17.
Klages, M., Participants, C., 2007. Reports on Polar and Marine Research, The Expedition of the
Research Vessel Polarstern to the Arctic in 2007 (ARK-XXII/1a-c, Bremerhaven-Tromso-
Longyarbyen-Tromso, 29.05-25.07.2007, Alfred-Wegener Institute.
Könneke, M., Bernhard, A.E., de la Torre, J.R., Walker, C.B., Waterbury, J.B., Stahl, D.A., 2005.
Isolation of an autotrophic ammonia-oxidizing marine archaeon. Nature 437, 543–546.
doi:10.1038/nature03911
Könneke, M., Schubert, D.M., Brown, P.C., Hügler, M., Standfest, S., Schwander, T., Schada von
Borzyskowski, L., Erb, T.J., Stahl, D.A., Berg, I.A., 2014. Ammonia-oxidizing archaea use the
most energy-efficient aerobic pathway for CO2 fixation. Proc. Natl. Acad. Sci. 111, 8239–8244.
doi:10.1073/pnas.1402028111
Kuypers, M.M., Lavik, G., Woebken, D., Schmid, M., Fuchs, B.M., Amann, R., Jorgensen, B.B.,
Jetten, M.S., 2005. Massive nitrogen loss from the Benguela upwelling system through
anaerobic ammonium oxidation. Proc Natl Acad Sci U S A 102, 6478–6483.
doi:10.1073/pnas.0502088102
Lalande, C., Bauerfeind, E., Nöthig, E.M., Beszczynska-Möller, A., 2013. Impact of a warm anomaly
on export fluxes of biogenic matter in the eastern Fram Strait. Prog. Oceanogr. 109, 70–77.
doi:10.1016/j.pocean.2012.09.006
Lalande, C., Nöthig, E.M., Bauerfeind, E., Hardge, K., Beszczynska-Möller, A., Fahl, K., 2016.
Lateral supply and downward export of particulate matter from upper waters to the seafloor in

142
the deep eastern Fram Strait. Deep. Res. Part I Oceanogr. Res. Pap. 114, 78–89.
doi:10.1016/j.dsr.2016.04.014
Lampert, W., 1989. The Adaptive Significance of Diel Vertical Migration of Zooplankton. Funct.
Ecol. 3, 21–27. doi:10.2307/2389671
Lampitt, R.S., Bett, B.J., Kiriakoulakis, K., Popova, E.E., Ragueneau, O., Vangriesheim, A., Wolff,
G.A., 2001. Material supply to the abyssal seafloor in the northeast Atlantic. Prog. Oceanogr. 50,
27–63. doi:10.1016/S0079-6611(01)00047-7
Lampitt, R.S., Billett, D.S.M., Martin, A.P., 2010. The sustained observatory over the Porcupine
Abyssal Plain (PAP): Insights from time series observations and process studies. Deep. Res. Part
II Top. Stud. Oceanogr. 57, 1267–1271. doi:10.1016/j.dsr2.2010.01.003
Lange, C.B., Romero, O.E., Wefer, G., Gabric, A.J., 1998. Offshore influence of coastal upwelling off
Mauritania, NW Africa, as recorded by diatoms in sediment traps at 2195 m water depth. Deep.
Res. Part I Oceanogr. Res. Pap. 45, 985–1013. doi:10.1016/S0967-0637(97)00103-9
Lange, C.B., Treppke, U.F., Fischer, G., 1994. Seasonal diatom fluxes in the Guinea Basin and their
relationships to trade winds, hydrography and upwelling events. Deep. Res. Part I Oceanogr. Res.
Pap. 41, 859–878. doi:10.1016/0967-0637(94)90080-9
Laubscher, R.K., Prissinotto, R., McQuaid, C.D., 1993. Phytoplankton production and biomass at
frontal zones in the Atlantic sector of the Southern Ocean. Polar Biol. 13, 471–481.
Lea, D.W., 2014. Elemental and Isotopic Proxies of Past Ocean Temperatures, in: H.D., H., K.K., T.
(Eds.), Treatise on Geochemistry: Second Edition. Elsevier Ltd., Oxford, pp. 373–397.
doi:10.1016/B978-0-08-095975-7.00614-8
Leclerc, A.J., Labeyrie, L., 1987. Temperature dependence of the oxygen isotopic fractionation
between diatom silica and water. Earth Planet. Sci. Lett. 84, 69–74.
Lee, K.E., Kim, J.-H., Wilke, I., Helmke, P., Schouten, S., 2008. A study of the alkenone, TEX86, and
planktonic foraminifera in the Benguela Upwelling System: Implications for past sea surface
temperature estimates. Geochemistry, Geophys. Geosystems 9, 1–19.
doi:10.1029/2008GC002056
Leider, A., Hinrichs, K.U., Mollenhauer, G., Versteegh, G.J.M., 2010. Core-top calibration of the
lipid-based U37K′ and TEX86 temperature proxies on the southern Italian shelf (SW Adriatic
Sea, Gulf of Taranto). Earth Planet. Sci. Lett. 300, 112–124. doi:10.1016/j.epsl.2010.09.042
Lengger, S.K., Hopmans, E.C., Reichart, G.-J., Nierop, K.G.J., Sinninghe Damsté, J.S., Schouten, S.,
2012. Intact polar and core glycerol dibiphytanyl glycerol tetraether lipids in the Arabian Sea
oxygen minimum zone: II. Selective preservation and degradation in sediment and consequences
for the TEX86. Geochim. Cosmochim. Acta 98, 244–258. doi:10.1016/j.gca.2012.05.003
Lincoln, S.A., Wai, B., Eppley, J.M., Church, M.J., Summons, R.E., DeLong, E.F., 2014. Planktonic
Euryarchaeota are a significant source of archaeal tetraether lipids in the ocean. Proc. Natl. Acad.
Sci. USA 111, 9858–9863. doi:10.1073/pnas.1409439111
Littler, K., Robinson, S.A., Bown, P.R., Nederbragt, A.J., Pancost, R.D., 2011. High sea-surface
temperatures during the Early Cretaceous Epoch. Nat. Geosci. 4, 169–172.
doi:10.1038/ngeo1081
Liu, X., Lipp, J.S., Hinrichs, K.-U., 2011. Distribution of intact and core GDGTs in marine sediments.
Org. Geochem. 42, 368–375. doi:10.1016/j.orggeochem.2011.02.003
Liu, X.L., Lipp, J.S., Simpson, J.H., Lin, Y.S., Summons, R.E., Hinrichs, K.U., 2012. Mono- and
dihydroxyl glycerol dibiphytanyl glycerol tetraethers in marine sediments: Identification of both
core and intact polar lipid forms. Geochim. Cosmochim. Acta 89, 102–115.
doi:10.1016/j.gca.2012.04.053
Liu, Z., Pagani, M., Zinniker, D., Deconto, R.M., Huber, M., Brinkhuis, H., Shah, S.R., Leckie, R.M.,
Pearson, A., 2009. Global cooling during the Eocene-Oligocene calimate transition. Science (80-
. ). 323, 1187–1990. doi:10.1126/science.1166368
Locarnini, R.A., Mishonov, A. V., Antonov, J.I., Boyer, T.P., Garcia, H.E., Baranova, O.K., Zweng,
M.M., Paver, C.R., Reagan, J.R., Johnson, D.R., Hamilton, M., Seidov, D., 2013. World Ocean
Atlas 2013, Volume 1: Temperature. S. Levitus, Ed.; A. Mishonov, Tech. Ed.; NOAA Atlas
NESDIS 73, 40. doi:10.1182/blood-2011-06-357442

143
Lopes dos Santos, R.A., Prange, M., Castañeda, I.S., Schefuß, E., Mulitza, S., Schulz, M.,
Niedermeyer, E.M., Sinninghe Damsté, J.S., Schouten, S., 2010. Glacial-interglacial variability
in Atlantic meridional overturning circulation and thermocline adjustments in the tropical North
Atlantic. Earth Planet. Sci. Lett. 300, 407–414. doi:10.1016/j.epsl.2010.10.030
Lopes dos Santos, R.A., Spooner, M.I., Barrows, T.T., De Deckker, P., Sinninghe Damsté, J.S.,
Schouten, S., 2013. Comparison of organic (UK’ 37, TEXH 86, LDI) and faunal proxies
(foraminiferal assemblages) for reconstruction of late Quaternary sea surface temperature
variability from offshore southeastern Australia. Paleoceanography 28, 377–387.
doi:10.1002/palo.20035
López-García, P., Rodriguez-Valera, F., Pedrós-Alió, C., Moreira, D., 2001. Unexpected diversity of
small eukaryotes in deep-sea Antarctic plankton. Nature 409, 603–607. doi:10.1038/35054537
Louw, D.C., van der Plas, A.K., Mohrholz, V., Wasmund, N., Junker, T., Eggert, A., 2016. Seasonal
and interannual phytoplankton dynamics and forcing mechnisms in the Northern Benguela
upwelling system. J. Mar. Syst. 157, 124–134.
doi:http://dx.doi.org/10.1016/j.jmarsys.2016.01.009
Lü, X., Liu, X.L., Elling, F.J., Yang, H., Xie, S., Song, J., Li, X., Yuan, H., Li, N., Hinrichs, K.U.,
2015. Hydroxylated isoprenoid GDGTs in Chinese coastal seas and their potential as a
paleotemperature proxy for mid-to-low latitude marginal seas. Org. Geochem. 89–90, 31–43.
doi:10.1016/j.orggeochem.2015.10.004
Manley, T.O., 1995. Branching of Atlantic Water within the Greenland-Spitsbergen Passage: An
estimate of recirculation. J. Geophys. Res. 100, 20627–20634. doi:10.1029/95JC01251
Martens-Habbena, W., Berube, P.M., Urakawa, H., de la Torre, J.R., Stahl, D.A., 2009. Ammonia
oxidation kinetics determine niche separation of nitrifying Archaea and Bacteria. Nature 461,
976–979. doi:10.1038/nature08465
Martin-Cuadrado, A.-B., Rodriguez-Valera, F., Moreira, D., Alba, J.C., Ivars-Martínez, E., Henn,
M.R., Talla, E., López-García, P., 2008. Hindsight in the relative abundance, metabolic potential
and genome dynamics of uncultivated marine archaea from comparative metagenomic analyses
of bathypelagic plankton of different oceanic regions. ISME J. 2, 865–886.
doi:10.1038/ismej.2008.40
Massana, R., Murray, A.E., Preston, C.M., DeLong, E.F., 1997. Vertical distribution and phylogenetic
characterization of marine planktonic Archaea in the Santa Barbara Channel. Appl. Environ.
Microbiol. 63, 50–56.
McClain, C.R., Signorini, S.R., Christian, J.R., 2004. Subtropical gyre variability observed by ocean-
color satellites. Deep. Res. Part II Top. Stud. Oceanogr. 51, 281–301.
doi:10.1016/j.dsr2.2003.08.002
McClymont, E.L., Ganeshram, R.S., Pichevin, L.E., Talbot, H.M., van Dongen, B.E., Thunell, R.C.,
Haywood, A.M., Singarayer, J.S., Valdes, P.J., 2012. Sea-surface temperature records of
Termination 1 in the Gulf of California: Challenges for seasonal and interannual analogues of
tropical Pacific climate change. Paleoceanography 27, PA2202. doi:10.1029/2011PA002226
Méjanelle, L., Sanchez-Gargallo, A., Bentaleb, I., Grimalt, J.O., 2003. Long chain n-alkyl diols,
hydroxy ketones and sterols in a marine eustigmatophyte, Nannochloropsis gaditana, and in
Brachionus plicatilis feeding on the algae. Org. Geochem. 34, 527–538. doi:10.1016/S0146-
6380(02)00246-2
Meyer, V.D., Max, L., Hefter, J., Tiedemann, R., Mollenhauer, G., 2016. Glacial-to-Holocene
evolution of sea surface temperature and surface circulation in the subarctic northwest Pacific
and the Western Bering Sea. Paleoceanography 31, 916–927. doi:10.1002/2015PA002877
Mignot, A., Claustre, H., Uitz, J., Poteau, A., Ortenzio, F.D., Xing, X., 2014. Understanding the
seasonal dynamics of phytoplankton biomass and the deep chlorophyll maximum in oligotrophic
environments: A Bio-Argo float investigation. AGU. Glolal Biogeochem. Cycles 856–876.
doi:10.1002/2013GB004781.Received
Mincer, T.J., Church, M.J., Taylor, L.T., Preston, C., Karl, D.M., DeLong, E.F., 2007. Quantitative
distribution of presumptive archaeal and bacterial nitrifiers in Monterey Bay and the North
Pacific Subtropical Gyre. Environ. Microbiol. 9, 1162–1175. doi:10.1111/j.1462-
2920.2007.01239.x

144
Mollenhauer, G., Basse, A., Kim, J.-H., Sinninghe Damsté, J.S., Fischer, G., 2015. A four-year record
of UK’37- and TEX86-derived sea surface temperature estimates from sinking particles in the
filamentous upwelling region off Cape Blanc, Mauritania. Deep. Res. Part I Oceanogr. Res. Pap.
97, 67–79. doi:10.1016/j.dsr.2014.11.015
Mollenhauer, G., Eglinton, T.I., Hopmans, E.C., Sinninghe Damsté, J.S., 2008. A radiocarbon-based
assessment of the preservation characteristics of crenarchaeol and alkenones from continental
margin sediments. Org. Geochem. 39, 1039–1045. doi:10.1016/j.orggeochem.2008.02.006
Mollenhauer, G., Inthorn, M., Vogt, T., Zabel, M., Sinninghe Damsté, J.S., Eglinton, T.I., 2007.
Aging of marine organic matter during cross-shelf lateral transport in the Benguela upwelling
system revealed by compound-specific radiocarbon dating. Geochemistry, Geophys.
Geosystems 8. doi:10.1029/2007GC001603
Mollenhauer, G., Schneider, R.R., Jennerjahn, T., Müller, P.J., Wefer, G., 2004. Organic carbon
accumulation in the South Atlantic Ocean: Its modern, mid-Holocene and last glacial
distribution. Glob. Planet. Change 40, 249–266. doi:10.1016/j.gloplacha.2003.08.002
Mollenhauer, G., Schneider, R.R., Müller, P.J., Spieß, V., Wefer, G., 2002. Glacial/interglacial
variablity in the Benguela upwelling system: Spatial distribution and budgets of organic carbon
accumulation. Global Biogeochem. Cycles 16, 1134. doi:10.1029/2001GB001488
Monteiro, P.M.S., Dewitte, B., Scranton, M.I., Paulmier, A., van der Plas, A.K., 2011. The role of
open ocean boundary forcing on seasonal to decadal-scale variability and long-term change of
natural shelf hypoxia. Environ. Res. Lett. 6, 025002. doi:10.1088/1748-9326/6/2/025002
Monteiro, P.M.S., van Der Plas, A., Mohrholz, V., Mabille, E., Pascall, A., Joubert, W., 2006.
Variability of natural hypoxia and methane in a coastal upwelling system: Oceanic physics or
shelf biology? Geophys. Res. Lett. 33, L16614. doi:10.1029/2006GL026234
Monteiro, P.M.S., van der Plas, A.K., Mélice, J.L., Florenchie, P., 2008. Interannual hypoxia
variability in a coastal upwelling system: Ocean-shelf exchange, climate and ecosystem-state
implications. Deep. Res. Part I Oceanogr. Res. Pap. 55, 435–450. doi:10.1016/j.dsr.2007.12.010
Moore, J.K., Abbott, M.R., 2002. Surface chlorophyll concentrations in relation to the Antarctic Polar
Front: seasonal and spatial patterns from satellite observations. J. Mar. Syst. 37, 69–86.
doi:10.1016/S0924-7963(02)00196-3
Moore, J.K., Abbott, M.R., 2000. Phytoplankton chlorophyll distributions and primary production in
the Southern Ocean. J. Geophys. Res. Ocean. 105, 28,709-28,722. doi:10.1029/1999JC000043
Moore, J.K., Abbott, M.R., Richman, J.G., 1999. Location and dynamics of the Antarctic Polar Front
from satellite sea surface temperature data. J. Geophys. Res. 102, 3059–3074.
doi:10.1029/97JC01705
Moreau, R.A., Whitaker, B.D., Hicks, K.B., 2002. Phytosterols, phytostanols, and their conjugates in
foods: structural diversity, quantitative analysis, and health-promoting uses. Prog. Lipid Res. 41,
457–500. doi:10.1016/S0163-7827(02)00006-1
Moreira, D., Rodríguez-Valera, F., López-García, P., 2004. Analysis of a genome fragment of a deep-
sea uncultivated Group II euryarchaeote containing 16S rDNA, a spectinomycin-like operon and
several energy metabolism genes. Environ. Microbiol. 6, 959–969. doi:10.1111/j.1462-
2920.2004.00644.x
Müller, P.J., Fischer, G., 2003. C37-Alkenones as Paleotemperature Tool: Fundamentals Based on
Sediment Traps and Surface Sediments from the South Atlantic Ocean, in: Wefer, G., Mulitza,
S., Ratmeyer, V. (Eds.), The South Atlantic in the Late Quaternary. Springer, Berlin, Heidelberg,
pp. 167–193. doi:doi.org/10.1007/978-3-642-18917-3_9
Müller, P.J., Kirst, G., Ruhland, G., von Storch, I., Rosell-Melé, A., 1998. Calibration of the alkenone
paleotemperature index U37K′ based on core-tops from the eastern South Atlantic and the global
ocean (60°N-60°S). Geochim. Cosmochim. Acta 62, 1757–1772. doi:10.1016/S0016-
7037(98)00097-0
Müller, P.J., Schneider, R., 1993. An automated leaching method for the determination of opal in
sediments and particulate matter. Deep. Res. Part I Oceanogr. Res. Pap. 40, 425–444.
doi:10.1016/0967-0637(93)90140-X

145
Murray, A.E., Blakis, A., Massana, R., Strawzewski, S., Passow, U., Alldredge, A., DeLong, E.F.,
1999. A time series assessment of planktonic archaeal variability in the Santa Barbara Channel.
Aquat. Microb. Ecol. 20, 129–145. doi:10.3354/ame020129
Murray, A.E., Wul, K.Y., Moyer, C.L., Karl, D.M., Delong, E.F., 1999. Evidence for Circumpolar
Distribution of Planktonic Archaea in the Southern Ocean. Aquat. Microb. Ecol. 18, 263–273.
Nöthig, E.-M., Bracher, A., Engel, A., Metfies, K., Niehoff, B., Peeken, I., Bauerfeind, E.,
Cherkasheva, A., Gäbler-Schwarz, S., Hardge, K., Kilias, E., Kraft, A., Kidane, Y.M., Lalande,
C., Piontek, J., Thomisch, K., Wurst, M., 2015. Summertime plankton ecology in Fram Strait-a
compilation of long-and short-term observations. Polar Res. 34, 1–18.
doi:10.3402/polar.v34.23349
O’Brien, C.L., Robinson, S.A., Pancost, R.D., Sinninghe Damsté, J.S., Schouten, S., Lunt, D.J.,
Alsenz, H., Bornemann, A., Bottini, C., Brassell, S.C., Farnsworth, A., Forster, A., Huber, B.T.,
Inglis, G.N., Jenkyns, H.C., Linnert, C., Littler, K., Markwick, P., McAnena, A., Mutterlose, J.,
Naafs, B.D.A., Püttmann, W., Sluijs, A., van Helmond, N.A.G.M., Vellekoop, J., Wagner, T.,
Wrobel, N.E., 2017. Cretaceous sea-surface temperature evolution: Constraints from TEX86 and
planktonic foraminiferal oxygen isotopes. Earth-Science Rev. 172, 224–247.
doi:10.1016/j.earscirev.2017.07.012
Orsi, A.H., Whitworth III, T., Nowlin Jr, W.D., 1995. On the meridional extent and fronts of the
Antarctic Circumpolar Current. Deep. Res. Part I Oceanogr. Res. Pap. 42, 641–673.
doi:10.1016/0967-0637(95)00021-W
Park, E., Hefter, J., Fischer, G., Mollenhauer, G., 2018. TEX 86 in sinking particles in three eastern
Atlantic upwelling regimes. Org. Geochem. 124, 151–163.
doi:10.1016/j.orggeochem.2018.07.015
Pearson, A., Ingalls, A.E., 2013. Assessing the Use of Archaeal Lipids as Marine Environmental
Proxies. Annu. Rev. Earth Planet. Sci. 41, 359–384. doi:10.1146/annurev-earth-050212-123947
Pearson, A., McNichol, A.P., Benitez-Nelson, B.C., Hayes, J.M., Eglinton, T.I., 2001. Origins of lipid
biomarkers in Santa Monica Basin surface sediment: A case study using compound-specific
∆14C analysis. Geochim. Cosmochim. Acta 65, 3123–3137. doi:10.1016/S0016-
7037(01)00657-3
Pelejero, C., Calvo, E., 2003. The upper end of the UK′37temperature calibration revisited.
Geochemistry, Geophys. Geosystems 4, 1–12. doi:10.1029/2002GC000431
Pelejero, C., Grimalt, J.O., 1997. The correlation between the Uk37 and sea surface temperatures in
the warm boundary: The South China Sea. Geochim. Cosmochim. Acta 61, 4789–4797.
Peng, X., Jayakumar, A., Ward, B.B., 2013. Community composition of ammonia-oxidizing archaea
from surface and anoxic depths of oceanic oxygen minimum zones. Front. Microbiol. 4, 1–12.
doi:10.3389/fmicb.2013.00177
Pérez, V., Fernández, E., Marañón, E., Serret, P., García-Soto, C., 2005. Seasonal and interannual
variability of chlorophyll a and primary production in the Equatorial Atlantic: in situ and remote
sensing observations. J. Plankton Res. 27, 189–197. doi:10.1093/plankt/fbh159
Peterson, R.G., Stramma, L., 1991. Upper-level circulation in the South Atlantic Ocean. Prog.
Oceanogr. 26, 1–73. doi:10.1016/0079-6611(91)90006-8
Pitcher, A., Wuchter, C., Siedenberg, K., Schouten, S., Sinninghe Damsté, J.S., 2011. Crenarchaeol
tracks winter blooms of ammonia-oxidizing Thaumarchaeota in the coastal North Sea. Limnol.
Oceanogr. 56, 2308–2318. doi:10.4319/lo.2011.56.6.2308
Ploug, H., Iversen, M.H., Fischer, G., 2008a. Ballast, sinking velocity, and apparent diffusivity within
marine snow and zooplankton fecal pellets: Implications for substrate turnover by attached
bacteria. Limnol. Oceanogr. 53, 1878–1886. doi:10.4319/lo.2008.53.5.1878
Ploug, H., Iversen, M.H., Koski, M., Buitenhuis, E.T., 2008b. Production, oxygen respiration rates,
and sinking velocity of copepod fecal pellets: Direct measurements of ballasting by opal and
calcite. Limnol. Oceanogr. 53, 469–476. doi:10.4319/lo.2008.53.2.0469
Podlaska, A., Wakeham, S.G., Fanning, K.A., Taylor, G.T., 2012. Microbial community structure and
productivity in the oxygen minimum zone of the eastern tropical North Pacific. Deep. Res. Part I
Oceanogr. Res. Pap. 66, 77–89. doi:10.1016/j.dsr.2012.04.002

146
Polovina, J.J., Howell, E.A., Abecassis, M., 2008. Ocean’s least productive waters are expanding.
Geophys. Res. Lett. 35. doi:10.1029/2007GL031745
Prahl, F., Herbert, T., Brassell, S.C., Ohkouchi, N., Pagani, M., Repeta, D., Rosell-Melé, A., Sikes, E.,
2000. Status of alkenone paleothermometer calibration: Report from Working Group 3.
Geochemistry Geophys. Geosystems 1. doi:10.1029/2000GC000058
Prahl, F.G., Sparrow, M.A., Wolfe, G. V., 2003. Physiological impacts on alkenone
paleothermometry. Paleoceanography 18. doi:10.1029/2002PA000803
Prahl, F.G., Wakeham, S.G., 1987. Calibration of unsaturation patterns in long-chain ketone
compositions for palaeotemperature assessment. Nature 330, 367–369. doi:10.1038/330367a0
Qin, W., Amin, S.A., Martens-Habbena, W., Walker, C.B., Urakawa, H., Devol, A.H., Ingalls, A.E.,
Moffett, J.W., Armbrust, E.V., Stahl, D.A., 2014. Marine ammonia-oxidizing archaeal isolates
display obligate mixotrophy and wide ecotypic variation. Proc. Natl. Acad. Sci. U. S. A. 111,
12504–12509. doi:10.1073/pnas.1324115111
Qin, W., Carlson, L.T., Armbrust, E.V., Devol, A.H., Moffett, J.W., Stahl, D.A., Ingalls, A.E., 2015.
Confounding effects of oxygen and temperature on the TEX86 signature of marine
Thaumarchaeota. Proc. Natl. Acad. Sci. USA 112, 10979–10984. doi:10.1073/pnas.1501568112
Rampen, S.W., Willmott, V., Kim, J.-H., Uliana, E., Mollenhauer, G., Schefuß, E., Sinninghe Damsté,
J.S., Schouten, S., 2012. Long chain 1,13- and 1,15-diols as a potential proxy for
palaeotemperature reconstruction. Geochim. Cosmochim. Acta 84, 204–216.
doi:10.1016/j.gca.2012.01.024
Read, J.F., Pollard, R.T., Bathmann, U., 2002. Physical and biological patchiness of an upper ocean
transect from South Africa to the ice edge near the Greenwich Meridian. Deep. Res. Part II Top.
Stud. Oceanogr. 49, 3713–3733. doi:10.1016/S0967-0645(02)00108-X
Reynolds, R.W., Rayner, N.A., Smith, T.M., Stokes, D.C., Wang, W., 2002. An improved in situ and
satellite SST Analysis for climate. J. Clim. 15, 1609–1625.
Reynolds, R.W., Smith, T.M., Liu, C., Chelton, D.B., Casey, K.S., Schlax, M.G., 2007. Daily high-
resolution-blended analyses for sea surface temperature. J. Clim. 20, 5473–5496.
doi:10.1175/2007JCLI1824.1
Richey, J.N., Tierney, J.E., 2016. GDGT and alkenone flux in the northern Gulf of Mexico:
Implications for the TEX86 and UK′37 paleothermometers. Paleoceanography 31, 1547–1561.
doi:10.1002/2016PA003032
Robinson, C., Poulton, A.J., Holligan, P.M., Baker, A.R., Forster, G., Gist, N., Jickells, T.D., Malin,
G., Upstill-Goddard, R., Williams, R.G., Woodward, E.M.S., Zubkov, M. V., 2006. The Atlantic
Meridional Transect (AMT) Programme: A contextual view 1995-2005. Deep. Res. Part II Top.
Stud. Oceanogr. 53, 1485–1515. doi:10.1016/j.dsr2.2006.05.015
Rodrigo-Gámiz, M., Rampen, S.W., de Haas, H., Baas, M., Schouten, S., Sinninghe Damsté, J.S.,
2015. Constraints on the applicability of the organic temperature proxies UK’37, TEX86 and
LDI in the subpolar region around Iceland. Biogeosciences 12, 6573–6590. doi:10.5194/bgd-12-
6573-2015
Rommerskirchen, F., Condon, T., Mollenhauer, G., Dupont, L., Schefuß, E., 2011. Miocene to
Pliocene development of surface and subsurface temperatures in the Benguela Current system.
Paleoceanography 26, PA3216. doi:10.1029/2010PA002074
Rontani, J.-F., Bonin, P., Jameson, I., Volkman, J.K., 2005. Degradation of alkenones and related
compounds during oxic and anoxic incubation of the marine haptophyte Emiliania huxleyi with
bacterial consortia isolated from microbial mats from the Camargue, France. Org. Geochem. 36,
603–618. doi:10.1016/j.orggeochem.2004.10.010
Rosell-Melé, A., 1998. Interhemispheric appraisal of the value of alkenone indices as temperature and
salinity proxies in high-latitude locations. Paleoceanography 13, 694–703.
doi:10.1029/98PA02355
Rosell-Melé, A., Eglinton, G., Pflaumann, U., Sarnthein, M., 1995. Atlantic core-top calibration of the
U37Kindex as a sea-surface palaeotemperature indicator. Geochim. Cosmochim. Acta 59, 3099–
3107. doi:10.1016/0016-7037(95)00199-A
Rosell-Melé, A., Prahl, F.G., 2013. Seasonality of UK’37 temperature estimates as inferred from
sediment trap data. Quat. Sci. Rev. 72, 128–136. doi:10.1016/j.quascirev.2013.04.017

147
Santoro, A.E., Casciotti, K.L., Francis, C.A., 2010. Activity, abundance and diversity of nitrifying
archaea and bacteria in the central California Current. Environ. Microbiol. 12, 1989–2006.
doi:10.1111/j.1462-2920.2010.02205.x
Schlitzer, R., 2017. Ocean Data View [WWW Document]. URL odv.awi.de
Scholten, J.C., Fietzke, J., Vogler, S., Rutgers van der Loeff, M.M., Mangini, A., Koeve, W., Waniek,
J., Stoffers, P., Antia, A., Kuss, J., 2001. Trapping efficiencies of sediment traps from the deep
Eastern North Atlantic: The 230Th calibration. Deep. Res. Part II Top. Stud. Oceanogr. 48,
2383–2408. doi:10.1016/S0967-0645(00)00176-4
Schouten, S., Forster, A., Panoto, F.E., Sinninghe Damsté, J.S., 2007. Towards calibration of the
TEX86 paleothermometer for tropical sea surface temperatures in ancient greenhouse worlds.
Org. Geochem. 38, 1537–1546. doi:10.1029/2004PA001041
Schouten, S., Hopmans, E.C., Pancost, R.D., Damste, J.S., 2000. Widespread occurrence of
structurally diverse tetraether membrane lipids: evidence for the ubiquitous presence of low-
temperature relatives of hyperthermophiles. Proc. Natl. Acad. Sci. U. S. A. 97, 14421–14426.
doi:10.1073/pnas.97.26.14421
Schouten, S., Hopmans, E.C., Schefuß, E., Damsté, J.S.S., 2002. Distributional variations in marine
crenarchaeotal membrane lipids: a new tool for reconstructing ancient sea water temperatures?
Earth Planet. Sci. Lett. 204, 265–274. doi:doi.org/10.1016/S0012-821X(02)00979-2
Schouten, S., Hopmans, E.C., Sinninghe Damsté, J.S., 2013. The organic geochemistry of glycerol
dialkyl glycerol tetraether lipids: A review. Org. Geochem. 54, 19–61.
doi:10.1016/j.orggeochem.2012.09.006
Schouten, S., Hopmans, E.C., Sinninghe Damsté, J.S., 2004. The effect of maturity and depositional
redox conditions on archaeal tetraether lipid palaeothermometry. Org. Geochem. 35, 567–571.
doi:10.1016/j.orggeochem.2004.01.012
Schouten, S., Middelburg, J.J., Hopmans, E.C., Sinninghe Damsté, J.S., 2010. Fossilization and
degradation of intact polar lipids in deep subsurface sediments: A theoretical approach. Geochim.
Cosmochim. Acta 74, 3806–3814. doi:10.1016/j.gca.2010.03.029
Schouten, S., Pitcher, A., Hopmans, E.C., Villanueva, L., van Bleijswijk, J., Sinninghe Damsté, J.S.,
2012. Intact polar and core glycerol dibiphytanyl glycerol tetraether lipids in the Arabian Sea
oxygen minimum zone: I. Selective preservation and degradation in the water column and
consequences for the TEX86. Geochim. Cosmochim. Acta 98, 228–243.
doi:10.1016/j.gca.2012.05.002
Schouten, S., van der Meer, M.T.J., Hopmans, E.C., Sinninghe Damsté, J.S., 2008. Comment on
“Lipids of marine Archaea: Patterns and provenance in the water column and sediments” by
Turich et al. (2007). Geochim. Cosmochim. Acta 72, 5342–5346. doi:10.1016/j.gca.2008.03.028
Schouten, S., Villanueva, L., Hopmans, E.C., van der Meer, M.T.J., Sinninghe Damsté, J.S., 2014.
Are Marine Group II Euryarchaeota significant contributors to tetraether lipids in the ocean?
Proc. Natl. Acad. Sci. U. S. A. 111, E4285. doi:10.1073/pnas.1416176111
Schukies, J.L., 2018. Prüfung der Anwendbarkeit des TEX86 in Proben partikulären organischen
Materials und Oberflächensedimenten im Bereich des Zusammentreffens von Nordatlantik - und
Labradorstrom am Kontinentalhang vor. Universität Bremen.
Seki, O., Bendle, J.A., Harada, N., Kobayashi, M., Sawada, K., Moossen, H., Inglis, G.N., Nagao, S.,
Sakamoto, T., 2014. Assessment and calibration of TEX86 paleothermometry in the Sea of
Okhotsk and sub-polar North Pacific region: Implications for paleoceanography. Prog. Oceanogr.
126, 254–266. doi:10.1016/j.pocean.2014.04.013
Shah, S.R., Mollenhauer, G., Ohkouchi, N., Eglinton, T.I., Pearson, A., 2008. Origins of archaeal
tetraether lipids in sediments: Insights from radiocarbon analysis. Geochim. Cosmochim. Acta
72, 4577–4594. doi:10.1016/j.gca.2008.06.021
Shannon, L. V., Nelson, G., 1996. The Benguela: Large Scale Features and Processes and System
Variability, in: Wefer, G., Berger, W.H., Siedler, G., Webb, D.J. (Eds.), The South Atlantic:
Present and Past Circulation. Springer-Verlag, Berlin, Heidelberg, pp. 163–210.
doi:10.1007/978-3-642-80353-6_9

148
Shevenell, A.E., Ingalls, A.E., Domack, E.W., Kelly, C., 2011. Holocene Southern Ocean surface
temperature variability west of the Antarctic Peninsula. Nature 470, 250–254.
doi:10.1038/nature09751
Shimokawara, M., Nishimura, M., Matsuda, T., Akiyama, N., Kawai, T., 2010. Bound forms,
compositional features, major sources and diagenesis of long chain, alkyl mid-chain diols in
Lake Baikal sediments over the past 28,000 years. Org. Geochem. 41, 753–766.
doi:10.1016/j.orggeochem.2010.05.013
Sicre, M.-A., Bard, E., Ezat, U., Rostek, F., 2002. Alkenone distributions in the North Atlantic and
Nordic sea surface waters. Geochemistry Geophys. Geosystems 3, 1–13.
doi:10.1029/2001GC000159
Sicre, M.A., Labeyrie, L., Ezat, U., Duprat, J., Turon, J.L., Schmidt, S., Michel, E., Mazaud, A., 2005.
Mid-latitude Southern Indian Ocean response to Northern Hemisphere Heinrich events. Earth
Planet. Sci. Lett. 240, 724–731. doi:10.1016/j.epsl.2005.09.032
Siegel, D.A., Deuser, W.G., 1997. Trajectories of sinking in the Sargasso Sea: Modeling of statistical
funnel above deep-ocean sediment traps. Deep Sea Res. Part I Oceanogr. Res. Pap. 44, 1519–
1541.
Sikes, E.L., O’Leary, T., Nodder, S.D., Volkman, J.K., 2005. Alkenone temperature records and
biomarker flux at the subtropical front on the chatham rise, SW Pacific Ocean. Deep. Res. Part I
Oceanogr. Res. Pap. 52, 721–748. doi:10.1016/j.dsr.2004.12.003
Sikes, E.L., Volkman, J.K., Robertson, L.G., Pichon, J.-J., 1997. Alkenones and alkenes in surface
waters and sediments of the Southern Ocean: Implications for paleotemperature estimation in
polar regions. Geochim. Cosmochim. Acta 61, 1495–1505. doi:10.1016/S0016-7037(97)00017-
3
Sinninghe Damsté, J.S., Ossebaar, J., Schouten, S., Verschuren, D., 2012. Distribution of tetraether
lipids in the 25-ka sedimentary record of Lake Challa: Extracting reliable TEX 86 and
MBT/CBT palaeotemperatures from an equatorial African lake. Quat. Sci. Rev. 50, 43–54.
doi:10.1016/j.quascirev.2012.07.001
Sinninghe Damsté, J.S., Schouten, S., Hopmans, E.C., van Duin, A.C.T., Geenevasen, J.A.J., 2002.
Crenarchaeol: the characteristic core glycerol dibiphytanyl glycerol tetraether membrane lipid of
cosmopolitan pelagic crenarchaeota. J. Lipid Res. 43, 1641–1651. doi:10.1194/jlr.M200148-
JLR200
Sintes, E., Bergauer, K., De Corte, D., Yokokawa, T., Herndl, G.J., 2013. Archaeal amoA gene
diversity points to distinct biogeography of ammonia-oxidizing Crenarchaeota in the ocean.
Environ. Microbiol. 15, 1647–1658. doi:10.1111/j.1462-2920.2012.02801.x
Sintes, E., De Corte, D., Haberleitner, E., Herndl, G.J., 2016. Geographic distribution of archaeal
ammonia oxidizing ecotypes in the Atlantic Ocean. Front. Microbiol. 7, 1–14.
doi:10.3389/fmicb.2016.00077
Sluijs, A., Schouten, S., Pagani, M., Woltering, M., Brinkhuis, H., Damsté, J.S.S., Dickens, G.R.,
Huber, M., Reichart, G.-J., Stein, R., Matthiessen, J., Lourens, L.J., Pedentchouk, N., Backman,
J., Moran, K., the Expedition 302 Scientists, 2006. Subtropical Arctic Ocean temperatures
during the Palaeocene/Eocene thermal maximum. Nature 441, 610–613.
doi:10.1038/nature04668
Soltwedel, T., Bauerfeind, E., Bergmann, M., Bracher, A., Budaeva, N., Busch, K., Cherkasheva, A.,
Fahl, K., Grzelak, K., Hasemann, C., Jacob, M., Kraft, A., Lalande, C., Metfies, K., Nöthig,
E.M., Meyer, K., Quéric, N.V., Schewe, I., Włodarska-Kowalczuk, M., Klages, M., 2016.
Natural variability or anthropogenically-induced variation? Insights from 15 years of
multidisciplinary observations at the arctic marine LTER site HAUSGARTEN. Ecol. Indic. 65,
89–102. doi:10.1016/j.ecolind.2015.10.001
Stramma, L., England, M., 1999. On the water masses and mean circulation of the South Atlantic
Ocean. J. Geophys. Res. 104, 20863–20883.
Taylor, K.W.R., Huber, M., Hollis, C.J., Hernandez-Sanchez, M.T., Pancost, R.D., 2013. Re-
evaluating modern and Palaeogene GDGT distributions: Implications for SST reconstructions.
Glob. Planet. Change 108, 158–174. doi:10.1016/j.gloplacha.2013.06.011

149
Thornton, D.C.O., 2002. Diatom aggregation in the sea: Mechanisms and ecological implications. Eur.
J. Phycol. 37, 149–161. doi:10.1017/S0967026202003657
Tierney, J.E., Tingley, M.P., 2015. A TEX86 surface sediment database and extended Bayesian
calibration. Sci. data 2, 150029. doi:10.1038/sdata.2015.29
Tolar, B.B., Ross, M.J., Wallsgrove, N.J., Liu, Q., Aluwihare, L.I., Popp, B.N., Hollibaugh, J.T., 2016.
Contribution of ammonia oxidation to chemoautotrophy in Antarctic coastal waters. ISME J. 10,
2605–2619. doi:10.1038/ismej.2016.61
Treppke, U.F., Lange, C.B., Wefer, G., 1996. Vertical fluxes of diatoms and silicoflagellates in the
eastern equatorial Atlantic, and their contribution to the sedimentary record. Mar.
Micropaleontol. 28, 73–96.
Trommer, G., Siccha, M., van der Meer, M.T.J., Schouten, S., Sinninghe Damsté, J.S., Schulz, H.,
Hemleben, C., Kucera, M., 2009. Distribution of Crenarchaeota tetraether membrane lipids in
surface sediments from the Red Sea. Org. Geochem. 40, 724–731.
doi:10.1016/j.orggeochem.2009.03.001
Turich, C., Freeman, K.H., Bruns, M.A., Conte, M., Jones, A.D., Wakeham, S.G., 2007. Lipids of
marine Archaea: Patterns and provenance in the water-column and sediments. Geochim.
Cosmochim. Acta 71, 3272–3291. doi:10.1016/j.gca.2007.04.013
Turich, C., Schouten, S., Thunell, R.C., Varela, R., Astor, Y., Wakeham, S.G., 2013. Comparison of
TEX86 and U37K’ temperature proxies in sinking particles in the Cariaco Basin. Deep. Res.
Part I Oceanogr. Res. Pap. 78, 115–133. doi:10.1016/j.dsr.2013.02.008
Turich, C., Schouten, S., Thunell, R.C., Varela, R., Astor, Y., Wakeham, S.G., 2013. Comparison of
TEX86 and U37K’ temperature proxies in sinking particles in the Cariaco Basin. Deep. Res.
Part I Oceanogr. Res. Pap. 78, 115–133. doi:10.1016/j.dsr.2013.02.008
Urakawa, H., Martens-Habbena, W., Huguet, C., de la Torre, J.R., Ingalls, A.E., Devol, A.H., Stahl,
D.A., 2014. Ammonia availability shapes the seasonal distribution and activity of archaeal and
bacterial ammonia oxidizers in the Puget Sound Estuary. Limnol. Oceanogr. 59, 1321–1335.
doi:10.4319/lo.2014.59.4.1321
Urey, H.C., 1947. The thermodynamic properties of isotopic substances. J. Chem. Soc. 562–581.
doi:10.1039/JR9470000562
van Helmond, N.A.G.M., Sluijs, A., Reichart, G.J., Damsté, J.S.S., Slomp, C.P., Brinkhuis, H., 2014.
A perturbed hydrological cycle during Oceanic Anoxic Event 2. Geology 42, 123–126.
doi:10.1130/G34929.1
Vedernikov, V.I., Gagarin, V.I., Demidov, A.B., Burenkov, V.I., Stunzhas, P.A., 2007. Primary
production and chlorophyll distributions in the subtropical and tropical waters of the Atlantic
Ocean in the autumn of 2002. Oceanology 47, 386–399. doi:10.1134/S0001437007030113
Versteegh, G.J.M., Bosch, H.-J., de Leeuw, J.W., 1997. Potential palaeoenvironmental information of
C24 to C36 mid-chain diols, keto-and mid-chain hydroxy fatty acid; a critical review. Or 27, 1–
13.
Villanueva, L., Schouten, S., Sinninghe Damsté, J.S., 2014. Depth-related distribution of a key gene
of the tetraether lipid biosynthetic pathway in marine Thaumarchaeota. Environ. Microbiol. 6,
1–32. doi:10.1111/1462-2920.12508
unsaturated alcohols in microalgae of the class Eustigmatophyceae. Org. Geochem. 18, 131–138.
doi:10.1016/0146-6380(92)90150-V
Vorrath, M.-E., Lahajnar, N., Fischer, G., Libuku, V.M., Schmidt, M., Emeis, K.-C., 2017.
Spatiotemporal variation of vertical particle fluxes and modelled chlorophyll a standing stocks in
the Benguela Upwelling System. J. Mar. Syst. 180, 59–75. doi:10.1016/j.jmarsys.2017.12.002
Wakeham, S.G., Lewis, C.M., Hopmans, E.C., Schouten, S., Sinninghe Damsté, J.S., 2003. Archaea
mediate anaerobic oxidation of methane in deep euxinic waters of the Black Sea. Geochim.
Cosmochim. Acta 67, 1359–1374. doi:10.1016/S0016-7037(02)01220-6
Walczowski, W., 2013. Frontal structures in the West Spitsbergen current margins. Ocean Sci. 9,
957–975. doi:10.5194/os-9-957-2013
Walter, H.J., Geibert, W., Rutgers Van Der Loeff, M.M., Fischer, G., Bathmann, U., 2001. Shallow vs.
deep-water scavenging of 231Pa and 230Th in radionuclide enriched waters of the Atlantic

150
sector of the Southern Ocean. Deep. Res. Part I Oceanogr. Res. Pap. 48, 471–493.
doi:10.1016/S0967-0637(00)00046-7
Wassmann, P., Reigstad, M., Haug, T., Rudels, B., Carroll, M.L., Hop, H., Gabrielsen, G.W., Falk-
Petersen, S., Denisenko, S.G., Arashkevich, E., Slagstad, D., Pavlova, O., 2006. Food webs and
carbon flux in the Barents Sea. Prog. Oceanogr. 71, 232–287. doi:10.1016/j.pocean.2006.10.003
Weber, J.N., Woodhead, P.M.J., 1972. Temperature dependence of oxygen-18 concentration in Reef
Coral Carbonates. J. Geophys. Res. 77, 463–473. doi:10.1029/JC077i003p00463
Wefer, G., Fischer, G., 1993. Seasonal patterns of vertical particle flux in equatorial and coastal
upwelling areas of the eastern Atlantic. Deep Sea Res. Part I Oceanogr. Res. Pap. 40, 1613–1645.
doi:10.1016/0967-0637(93)90019-Y
Weijers, J.W.H., Lim, K.L.H., Aquilina, A., Damsté, J.S.S., Pancost, R.D., 2011. Biogeochemical
controls on glycerol dialkyl glycerol tetraether lipid distributions in sediments characterized by
diffusive methane flux. Geochemistry, Geophys. Geosystems 12, 1–15.
doi:10.1029/2011GC003724
Weijers, J.W.H., Schouten, S., Spaargaren, O.C., Sinninghe Damsté, J.S., 2006. Occurrence and
distribution of tetraether membrane lipids in soils: Implications for the use of the TEX86 proxy
and the BIT index. Org. Geochem. 37, 1680–1693. doi:10.1016/j.orggeochem.2006.07.018
Wekerle, C., Krumpen, T., Dinter, T., von Appen, W.-J., Iversen, M.H., Salter, I., 2018. Properties of
Sediment Trap Catchment Areas in Fram Strait: Results From Lagrangian Modeling and Remote
Sensing. Front. Mar. Sci. 5. doi:10.3389/fmars.2018.00407
Woebken, D., Fuchs, B.M., Kuypers, M.M.M., Amann, R., 2007. Potential interactions of particle-
associated anammox bacteria with bacterial and archaeal partners in the Namibian upwelling
system. Appl. Environ. Microbiol. 73, 4648–4657. doi:10.1128/AEM.02774-06
Wuchter, C., Abbas, B., Coolen, M.J.L., Herfort, L., van Bleijswijk, J., Timmers, P., Strous, M., Teira,
E., Herndl, G.J., Middelburg, J.J., Schouten, S., Sinninghe Damsté, J.S., 2006a. Archaeal
nitrification in the ocean. Proc. Natl. Acad. Sci. USA 103, 12317–12322.
doi:10.1073/pnas.0701630104
Wuchter, C., Schouten, S., Boschker, H.T.S., Sinninghe Damsté, J.S., 2003. Bicarbonate uptake by
marine Crenarchaeota. FEMS Microbiol. Lett. 219, 203–207. doi:10.1016/S0378-
1097(03)00060-0
Wuchter, C., Schouten, S., Coolen, M.J.L., Sinninghe Damsté, J.S., 2004. Temperature-dependent
variation in the distribution of tetraether membrane lipids of marine Crenarchaeota: Implications
for TEX86paleothermometry. Paleoceanography 19, 1–10. doi:10.1029/2004PA001041
Wuchter, C., Schouten, S., Wakeham, S.G., Sinninghe Damsté, J.S., 2006b. Archaeal tetraether
membrane lipid fluxes in the northeastern Pacific and the Arabian Sea: Implications for TEX86
paleothermometry. Paleoceanography 21, 1–9. doi:10.1029/2006PA001279
Wuchter, C., Schouten, S., Wakeham, S.G., Sinninghe Damsté, J.S., 2005. Temporal and spatial
variation in tetraether membrane lipids of marine Crenarchaeota in particulate organic matter:
Implications for TEX86 paleothermometry. Paleoceanography 20, 1–11.
doi:10.1029/2004PA001110
Xie, S., Liu, X.-L., Schubotz, F., Wakeham, S.G., Hinrichs, K.-U., 2014. Distribution of glycerol
ether lipids in the oxygen minimum zone of the Eastern Tropical North Pacific Ocean. Org.
Geochem. 71, 60–71. doi:10.1016/j.orggeochem.2014.04.006
Xue, J., Armstrong, R.A., 2009. An improved “benchmark” method for estimating particle settling
velocities from time-series sediment trap fluxes. Deep. Res. Part II Top. Stud. Oceanogr. 56,
1479–1486. doi:10.1016/j.dsr2.2008.11.033
Yamamoto, M., Shimamoto, A., Fukuhara, T., Naraoka, H., Tanaka, Y., Nishimura, A., 2007.
Seasonal and depth variations in molecular and isotopic alkenone composition of sinking
particles from the western North Pacific. Deep. Res. Part I Oceanogr. Res. Pap. 54, 1571–1592.
doi:10.1016/j.dsr.2007.05.012
Yamamoto, M., Shimamoto, A., Fukuhara, T., Tanaka, Y., Ishizaka, J., 2012. Glycerol dialkyl
glycerol tetraethers and TEX86 index in sinking particles in the western North Pacific. Org.
Geochem. 53, 52–62. doi:10.1016/j.orggeochem.2012.04.010

151
Yang, Y., Gao, C., Dang, X., Ruan, X., Lü, X., Xie, S., Li, X., Yao, Y., Yang, H., 2018. Assessing
hydroxylated isoprenoid GDGTs as a paleothermometer for the tropical South China Sea. Org.
Geochem. 115, 156–165. doi:10.1016/j.orggeochem.2017.10.014
Yu, E.F., Francois, R., Bacon, M.P., Honjo, S., Fleer, A.P., Manganini, S.J., Loeff, R.V.D.M.M.,
Ittekot, V., 2001. Trapping efficiency of bottom-tethered sediment traps estimated from the
intercepted fluxes of 230Th and 230Pa. Deep. Res. Part I Oceanogr. Res. Pap. 48, 865–889.
doi:10.1016/S0967-0637(00)00067-4
Zabeti, N., Bonin, P., Volkman, J.K., Jameson, I.D., Guasco, S., Rontani, J.-F., 2010. Potential
alteration of U37K′ paleothermometer due to selective degradation of alkenones by marine
bacteria isolated from the haptophyte Emiliania huxleyi. FEMS Microbiol. Ecol. 73, 83–94.
doi:10.1111/j.1574-6941.2010.00885.x
Zachos, J.C., Schouten, S., Bohaty, S., Quattlebaum, T., Sluijs, A., Brinkhuis, H., Gibbs, S.J.,
Bralower, T.J., 2006. Extreme warming of mid-latitude coastal ocean during the Paleocene-
Eocene Thermal Maximum: Inferences from TEX86 and isotope data. Geology 34, 737–740.
doi:10.1130/G22522.1
Zhang, Y.G., Pagani, M., Wang, Z., 2016. Ring Index: A new strategy to evaluate the integrity of
TEX86paleothermometry. Paleoceanography 31, 220–232. doi:10.1002/2015PA002848
Zhang, Y.G., Zhang, C.L., Liu, X.-L., Li, L., Hinrichs, K.-U., Noakes, J.E., 2011. Methane Index: A
tetraether archaeal lipid biomarker indicator for detecting the instability of marine gas hydrates.
Earth Planet. Sci. Lett. 307, 525–534. doi:10.1016/j.epsl.2011.05.031
.

152
Acknowledgements
The completion of this PhD would not have been possible without help and encouragement from a
number of people to whom I am extremely grateful.
I would like to give special thanks to my supervisor Gesine Mollenhauer. Gesine, thank you for
giving me a chance to my new scientific career under such a great circumstance as well as your
valuable times of supervision, for getting me into the topic and sharing your knowledge and passion
for building up my own ideas. I still remember your acceptance email me as a PhD student in your
group. That has changed my life a lot. A special thank also goes to you, Jens Hefter, for mentoring me
in the lab and most figures in this thesis were possible only with your help for last years. I would like
to thank Ann Pearson for reviewing my thesis. I am honored that you review my thesis and attend my
defense.
Particular thanks must also be recorded to Gesine’s working group members Maria Winterfeld,
Vera Meyer, Célia Santos, Shuwen Sun, and Hendrik Grotheer, Binging Wei, Torben Gentz, Elizabeth
Bonk for their support and encouragement over the years. Maria, it was possible with your help that I
got integrated into our group so easily. I always remember your big welcome when I started my PhD
in Bremen. I learned your passion for science. Vera, Celia, Shuwen, and Bingbing I enjoyed the time
we spent together and our conversation to help each other through our PhD life. I wish you a great
future of your life whatever you do and wherever you live. Hendrik, thank you for accompanying
while I was writing. You have overcome the boring time sitting next to me. The window seat is yours
from now on. Torben and Liz, your laugh and smile gave me positive energy every day.
I would also like to thank Gerhard Fischer, Morten Iverson, and Martin Könneke for their work in
my thesis committee. With all the valuable discussions we have, I could have different perspectives on
my research and it helped me a lot to develop new ideas.
I deeply thank to Jin-Hyung Kim. Your simple question ´where is your dream?´ made me to pursue
my PhD. As a friend and a mentor, you inspire me to learn something new. Thank you to all my
friends in Korea that are not mentioned here for supporting me mentally. The physical distance
between Korea and Germany is not a big matter for our friendship.
Finally, and most importantly, I want to thank my family in Korea whose support has been
constant despite the distance. Mom and dad, I appreciate your endless love. I always miss you. 엄마
아빠 항상 감사하고 사랑합니다. My brother, Sung-Jin, I wish I could support you as much as you
do for me. I am always proud of you. Renate and Volker, danke für alles. I learn your unconditional
love every day. I am glad to be part of this family.

153
Axel, thank you for your endless love and great patience over the years this thesis has taken. I cannot
say “thank you” enough. This thesis does exist only because you are always by my side. You have
encouraged and helped me get through this tough time. You have made such a huge impact on my life.
We always move forward together. Let´s start our new journey.