Embed Size (px)
Citation preview
Sampling and Analysis Plan Volume 1 - Field Sampling Plan Former Guterl Specialty Steel Corporation FUSRAP Site Lockport, New York
Prepared for
US Army Corps of Engineers Buffalo District Contract W912P4-05-D-0001 Delivery Order 0001
Prepared by
Earth Tech, Inc. 300 Broadacres Drive Bloomfield, NJ 07003 (973) 338-6680
January 2007

This page intentionally left blank.
Sampling and Analysis Plan Volume 1 - Field Sampling Plan
Former Guterl Specialty Steel Corporation FUSRAP Site
Lockport, New York
January 2007
Prepared for
US Army Corps of Engineers Buffalo District
Contract W912P4-05-D-0001 Delivery Order 0001
Prepared by
Earth Tech, Inc. 300 Broadacres Drive Bloomfield, NJ 07003
(973) 338-6680
Approvers:
James Kaczor, P.G. Date Project Manager
Mike Thiagaram, P.E. Date Program Manager
January 18, 2007
January 18, 2007

This page intentionally left blank.
Final Sampling and Analysis Plan, Volume 1 – Field Sampling Plan Former Guterl Specialty Steel Corporation FUSRAP Site, Lockport, New York
i 01/18/07
TABLE OF CONTENTS
Section No. Page No.
1 SITE BACKGROUND........................................................................................................ 1-1 1.1 SITE LOCATION........................................................................................................ 1-1 1.2 SITE HISTORY........................................................................................................... 1-2 1.3 PREVIOUS INVESTIGATIONS................................................................................ 1-3
1.3.1 Radiological Survey of the Former Simonds Saw and Steel Company, Lockport, New York, Final Report. Prepared by ORNL for DOE under FUSRAP, September 1978 .1-4 1.3.2 Preliminary Engineering and Environmental Evaluation of the Remedial Action Alternatives for the Former Simonds Saw and Steel Company Site, Lockport, New York, Former Utilized MED/AEC Sites Remedial Action Program, Final Report. Prepared by FBDU for Bechtel National, Inc. under FUSRAP, for DOE, November 1981 ................... 1-5 1.3.3 Engineering Investigations at Inactive Hazardous Waste Sites - Phase I Investigation, Guterl Specialty Steel, City of Lockport, Niagara County. Prepared by Engineering-Science and Dames & Moore for NYSDEC, January 1988 ........................... 1-5 1.3.4 Engineering Investigations at Inactive Hazardous Waste Sites - Preliminary Site Assessment, Task 1 Records Search, Guterl Specialty Steel Corporation, City of Lockport, Site No. 932032, Niagara County. Prepared by E.C. Jordan for NYSDEC, January 1991.1-6 1.3.5 Engineering Investigations at Inactive Hazardous Waste Sites- Preliminary Site Assessment Evaluation Report of Initial Data, Guterl Specialty Steel, City of Lockport, Niagara County, Volumes I and II. Prepared by ABB-ES for NYSDEC, April 1994........ 1-6 1.3.6 Final Report, Guterl Steel Site, Lockport, New York. Prepared by Roy F. Weston for USEPA, Work Assignment No. 2-194, April 1998 ....................................................... 1-7 1.3.7 Radiological Survey of the Guterl Specialty Steel Corporation, Lockport, New York. Prepared under a contract with DOE by ORISE for US Bankruptcy Court for the Western District of Pennsylvania, December 1999 (ORISE, 1999).................................... 1-7 1.3.8 Immediate Investigative Work Assignment Report, Guterl Excised Area, City of Lockport, Niagara County. NYSDEC, October 2000 ......................................................... 1-8
1.4 PHYSICAL SETTING ................................................................................................ 1-8 1.4.1 Topography.......................................................................................................... 1-8 1.4.2 Geology................................................................................................................ 1-9
1.4.2.1 Regional Geology ............................................................................................ 1-9 1.4.2.2 Site Geology................................................................................................... 1-10
1.4.3 Hydrogeology .................................................................................................... 1-11 1.4.3.1 Regional Hydrogeology................................................................................. 1-11 1.4.3.2 Site Hydrogeology ......................................................................................... 1-12
1.4.3.2.1 Unconsolidated Material.......................................................................... 1-12 1.4.3.2.2 Bedrock .................................................................................................... 1-12 1.4.3.2.3 Surface Water........................................................................................... 1-13
2 PROJECT ORGANIZATION AND RESPONSIBILITIES ............................................... 2-1 2.1 PROGRAM MANAGER............................................................................................. 2-1 2.2 PROJECT MANAGER ............................................................................................... 2-1 2.3 SITE SUPERVISOR.................................................................................................... 2-1 2.4 RI FIELD GEOLOGIST.............................................................................................. 2-2 2.5 QUALITY ASSURANCE/QUALITY CONTROL OFFICER................................... 2-2
Final Sampling and Analysis Plan, Volume 1 – Field Sampling Plan Former Guterl Specialty Steel Corporation FUSRAP Site, Lockport, New York
ii 01/18/07
2.6 SITE SAFETY AND HEALTH MANAGER ............................................................. 2-2 2.7 SITE SAFETY AND HEALTH OFFICER................................................................. 2-2 2.8 HEALTH PHYSICIST ................................................................................................ 2-3 2.9 SITE RADIATION SAFETY OFFICER .................................................................... 2-3
3 PROJECT SCOPE AND OBJECTIVES............................................................................. 3-1 3.1 PROJECT DATA QUALITY OBJECTIVES ............................................................. 3-1 3.2 TASK DESCRIPTION ................................................................................................ 3-2 3.3 Investigative Areas....................................................................................................... 3-3 3.4 CONSTITUENTS OF POTENTIAL CONCERN ...................................................... 3-4 3.5 APPLICABLE OR RELEVANT AND APPROPRIATE REQUIREMENTS ........... 3-4 3.6 SCHEDULE................................................................................................................. 3-4
4 NON-MEASUREMENT DATA ACQUISITION .............................................................. 4-1 4.1 RECORDS REVIEW AND EVALUATION.............................................................. 4-1 4.2 RI TASK 4: DATA GAP ANALYSIS ........................................................................ 4-1
4.2.1 Preliminary Conceptual Site Model..................................................................... 4-1 4.2.2 Investigative Areas............................................................................................... 4-2
4.2.2.1 Investigative Area 01 (IA01) - Excised Area – Building Surfaces and Interiors (Including Building 24).................................................................................................... 4-2 4.2.2.2 Investigative Area 02 (IA02) - Excised Area – Building Exterior Areas ........ 4-2 4.2.2.3 Investigative Area 03 (IA03) – Landfill Area.................................................. 4-2 4.2.2.4 Investigative Area 04 (IA04) – Niagara County Industrial Development Agency (NCIDA) Property (Excluding Excised Area, Landfill Area, and Building 24) 4-2 4.2.2.5 Investigative Area 05 (IA05) – Railroad Right-of-Way North of Site ............ 4-3 4.2.2.6 Investigative Area 06 (IA06) - Off-site Northeast Properties.......................... 4-3 4.2.2.7 Investigative Area 07 (IA07) – Groundwater .................................................. 4-3 4.2.2.8 Investigative Area 08 (IA08) – Site Utilities (Sewers and Drains) ................. 4-3 4.2.2.9 Investigative Area 09 (IA09) – Erie Barge Canal............................................ 4-4 4.2.2.10 Investigative Area 10 (IA10) – Tax Lot 4.1 (Lombardi Property) .............. 4-4
5 REMEDIAL INVESTIGATION DATA COLLECTION PROGRAM.............................. 5-1 5.1 GENERAL................................................................................................................... 5-1
5.1.1 Observational Approach ...................................................................................... 5-1 5.1.2 General Characterization ..................................................................................... 5-2
5.2 RADIOLOGICAL SURVEY PROGRAM.................................................................. 5-3 5.2.1 Characterization Surveys ..................................................................................... 5-3 5.2.2 Preliminary Survey Considerations ..................................................................... 5-4
5.2.2.1 Identify Contaminants...................................................................................... 5-4 5.2.2.2 Establish Screening Levels .............................................................................. 5-4 5.2.2.3 Classify Areas by Contamination Potential ..................................................... 5-6 5.2.2.4 Select Background Reference Areas................................................................ 5-7
5.2.2.4.1 Surface References..................................................................................... 5-7 5.2.2.4.2 Environmental Media and Background Radiation..................................... 5-8
5.2.2.5 Identify Survey Units (Investigative Areas) .................................................... 5-9 5.2.2.6 Site Preparation.............................................................................................. 5-10
5.2.2.6.1 Consent for Survey .................................................................................. 5-10 5.2.2.6.2 Property Boundaries................................................................................. 5-10 5.2.2.6.3 Physical Characteristics of Site................................................................ 5-10
Final Sampling and Analysis Plan, Volume 1 – Field Sampling Plan Former Guterl Specialty Steel Corporation FUSRAP Site, Lockport, New York
iii 01/18/07
5.2.2.6.4 Reference Coordinate System.................................................................. 5-11 5.3 CLASSIFICATION OF SITE AREAS AND FACILITIES ..................................... 5-11
5.3.1 General............................................................................................................... 5-11 5.3.2 Assumption Basis (General) .............................................................................. 5-11 5.3.3 Survey Basis (General) ...................................................................................... 5-12 5.3.4 IA01 Excised Area – Building Interior Surfaces (including Building 24) ........ 5-12
5.3.4.1 IA01 Classifications (General) ...................................................................... 5-13 5.3.4.2 IA01 Assumption Basis (General) ................................................................. 5-13 5.3.4.3 IA01 Survey Basis (General) ......................................................................... 5-14
5.3.4.3.1 Survey Grids ............................................................................................ 5-14 5.3.4.3.2 Swipe Tests .............................................................................................. 5-15 5.3.4.3.3 Soil Sampling........................................................................................... 5-15 5.3.4.3.4 Building Material Sampling..................................................................... 5-15
5.3.4.4 Interior Surfaces - Building 1 ........................................................................ 5-15 5.3.4.4.1 Class 1 Areas in Building 1 ..................................................................... 5-15 5.3.4.4.2 Class 2 Areas in Building 1 ..................................................................... 5-15 5.3.4.4.3 Class 3 Areas in Building 1 ..................................................................... 5-16 5.3.4.4.4 Other Media in Building 1 ....................................................................... 5-16 5.3.4.4.5 Assumption Basis for Building 1............................................................. 5-17 5.3.4.4.6 Survey Basis for Building 1..................................................................... 5-17
5.3.4.5 Interior Surfaces - Building 2 ........................................................................ 5-17 5.3.4.5.1 Class 1 Areas in Building 2 ..................................................................... 5-18 5.3.4.5.2 Class 2 Areas in Building 2 ..................................................................... 5-18 5.3.4.5.3 Class 3 Areas in Building 2 ..................................................................... 5-18 5.3.4.5.4 Other Media in Building 2 ....................................................................... 5-18 5.3.4.5.5 Assumption Basis for Building 2............................................................. 5-18 5.3.4.5.6 Survey Basis for Building 2..................................................................... 5-19
5.3.4.6 Interior Surfaces - Building 3 ........................................................................ 5-19 5.3.4.6.1 Class 1 Areas in Building 3 ..................................................................... 5-19 5.3.4.6.2 Class 2 Areas in Building 3 ..................................................................... 5-19 5.3.4.6.3 Class 3 Areas in Building 3 ..................................................................... 5-20 5.3.4.6.4 Other Media in Building 3 ....................................................................... 5-20 5.3.4.6.5 Assumption Basis for Building 3............................................................. 5-20 5.3.4.6.6 Survey Basis for Building 3..................................................................... 5-20
5.3.4.7 Interior Surfaces - Building 4 and Building 9................................................ 5-21 5.3.4.7.1 Class 1 Areas in Building 4 and Building 9............................................. 5-21 5.3.4.7.2 Class 2 Areas in Building 4 and Building 9............................................. 5-21 5.3.4.7.3 Class 3 Areas in Building 4 and Building 9............................................. 5-21 5.3.4.7.4 Other Media in Building 4 and Building 9 .............................................. 5-21 5.3.4.7.5 Assumption Basis for Building 4 and Building 9 .................................... 5-22 5.3.4.7.6 Survey Basis for Building 4 and Building 9 ............................................ 5-22
5.3.4.8 Interior Surfaces - Building 5 ........................................................................ 5-22 5.3.4.8.1 Class 1 Areas in Building 5 ..................................................................... 5-22 5.3.4.8.2 Class 2 Areas in Building 5 ..................................................................... 5-22 5.3.4.8.3 Class 3 Areas in Building 5 ..................................................................... 5-22 5.3.4.8.4 Other Media in Building 5 ....................................................................... 5-23
Final Sampling and Analysis Plan, Volume 1 – Field Sampling Plan Former Guterl Specialty Steel Corporation FUSRAP Site, Lockport, New York
iv 01/18/07
5.3.4.8.5 Assumption Basis for Building 5............................................................. 5-23 5.3.4.8.6 Survey Basis for Building 5..................................................................... 5-23
5.3.4.9 Interior Surfaces - Building 6 ........................................................................ 5-23 5.3.4.9.1 Class 1 Areas in Building 6 ..................................................................... 5-23 5.3.4.9.2 Class 2 Areas in Building 6 ..................................................................... 5-23 5.3.4.9.3 Class 3 Areas in Building 6 ..................................................................... 5-24 5.3.4.9.4 Other Media in Building 6 ....................................................................... 5-24 5.3.4.9.5 Assumption Basis for Building 6............................................................. 5-24 5.3.4.9.6 Survey Basis for Building 6..................................................................... 5-24
5.3.4.10 Interior Surfaces - Building 8 .................................................................... 5-25 5.3.4.10.1 Class 1 Areas in Building 8 ................................................................... 5-25 5.3.4.10.2 Class 2 Areas in Building 8 ................................................................... 5-25 5.3.4.10.3 Class 3 Areas in Building 8 ................................................................... 5-25 5.3.4.10.4 Other Media in Building 8 ..................................................................... 5-25 5.3.4.10.5 Assumption Basis for Building 8........................................................... 5-25 5.3.4.10.6 Survey Basis for Building 8................................................................... 5-26
5.3.4.11 Interior Surfaces - Building 24 .................................................................. 5-26 5.3.4.11.1 Class 1 Areas in Building 24 ................................................................. 5-26 5.3.4.11.2 Class 2 Areas in Building 24 ................................................................. 5-27 5.3.4.11.3 Class 3 Areas in Building 24 ................................................................. 5-27 5.3.4.11.4 Other Media in Building 24 ................................................................... 5-27 5.3.4.11.5 Assumption Basis for Building 24......................................................... 5-27 5.3.4.11.6 Survey Basis for Building 24................................................................. 5-28
5.3.4.12 Interior Surfaces - Building 35 .................................................................. 5-28 5.3.4.12.1 Class 1 Areas in Building 35 ................................................................. 5-28 5.3.4.12.2 Class 2 Areas in Building 35 ................................................................. 5-28 5.3.4.12.3 Class 3 Areas in Building 35 ................................................................. 5-28 5.3.4.12.4 Other Media in Building 35 ................................................................... 5-28 5.3.4.12.5 Assumption Basis for Building 35......................................................... 5-28 5.3.4.12.6 Survey Basis for Building 35................................................................. 5-29
5.3.5 IA02 - Excised Area – Building Exterior Areas ................................................ 5-29 5.3.5.1 Class 1 Areas in IA02 .................................................................................... 5-29 5.3.5.2 Class 2 Areas in IA02 .................................................................................... 5-29 5.3.5.3 Class 3 Areas in IA02 .................................................................................... 5-29 5.3.5.4 Other Media in IA02...................................................................................... 5-29 5.3.5.5 Assumption Basis for IA02............................................................................ 5-29 5.3.5.6 Survey Basis for IA02.................................................................................... 5-30
5.3.6 IA03 – Landfill Area.......................................................................................... 5-30 5.3.6.1 Class 1 Areas in IA03 .................................................................................... 5-30 5.3.6.2 Class 2 Areas in IA03 .................................................................................... 5-30 5.3.6.3 Class 3 Areas in IA03 .................................................................................... 5-30 5.3.6.4 Other Media in IA03...................................................................................... 5-31 5.3.6.5 Assumption Basis for IA03............................................................................ 5-31 5.3.6.6 Survey Basis for IA03.................................................................................... 5-31
5.3.7 IA04 – NCIDA Property (Excluding Excised Area, Landfill Area, and Building 24) ............................................................................................................................ 5-32
Final Sampling and Analysis Plan, Volume 1 – Field Sampling Plan Former Guterl Specialty Steel Corporation FUSRAP Site, Lockport, New York
v 01/18/07
5.3.7.1 Class 1 Areas in IA04 (Subunit 4A) .............................................................. 5-32 5.3.7.2 Class 2 Areas in IA04 (Subunit 4B) .............................................................. 5-32 5.3.7.3 Class 3 Areas in IA04 (Subunits 4C and 4D, and Building Interiors)........... 5-32 5.3.7.4 Other Media in IA04...................................................................................... 5-32 5.3.7.5 Assumption Basis for IA04............................................................................ 5-32 5.3.7.6 Survey Basis for IA04.................................................................................... 5-33
5.3.8 IA05 – Railroad Right-of-Way North of Site .................................................... 5-33 5.3.8.1 Class 1 Areas in IA05 (Subunit 5A) .............................................................. 5-33 5.3.8.2 Class 2 Areas in IA05 (Subunit 5B) .............................................................. 5-33 5.3.8.3 Class 3 Areas in IA05 .................................................................................... 5-33 5.3.8.4 Other Media in IA05...................................................................................... 5-33 5.3.8.5 Assumption Basis for IA05............................................................................ 5-34 5.3.8.6 Survey Basis for IA05.................................................................................... 5-34
5.3.9 IA06 – Off-site Northeast Properties ................................................................. 5-35 5.3.10 IA07 – Groundwater .......................................................................................... 5-35 5.3.11 IA08 – Site Utilities (Sewers and Drains).......................................................... 5-35
5.3.11.1 Rationale and Design ................................................................................. 5-35 5.3.11.2 Field Procedures......................................................................................... 5-36
5.3.12 IA09 – Erie Barge Canal.................................................................................... 5-37 5.3.12.1 Rationale and Design ................................................................................. 5-37 5.3.12.2 Field Procedures......................................................................................... 5-38
5.3.13 IA10 – Lot 4.1 (“Lombardi Property”) .............................................................. 5-38 5.3.13.1 Class 1 Areas in IA10 ................................................................................ 5-38 5.3.13.2 Class 2 Areas in IA10 ................................................................................ 5-39 5.3.13.3 Class 3 Areas in IA10 ................................................................................ 5-39 5.3.13.4 Other Media in IA10.................................................................................. 5-39 5.3.13.5 Assumption Basis for IA10........................................................................ 5-39 5.3.13.6 Survey Basis for IA10................................................................................ 5-40
5.4 CHARACTERIZATION SURVEY DESIGN .......................................................... 5-40 5.4.1 Instrumentation .................................................................................................. 5-41
5.4.1.1 Selection of Instruments ................................................................................ 5-41 5.4.1.2 Instrument Calibration ................................................................................... 5-42 5.4.1.3 ISOCS QA ..................................................................................................... 5-42 5.4.1.4 Onsite Gamma Spectroscopy Laboratory ...................................................... 5-43 5.4.1.5 Minimum Detectable Concentrations ............................................................ 5-43
5.4.1.5.1 Static Minimum Detectable Concentrations ............................................ 5-43 5.4.1.5.2 Scan Minimum Detectable Concentrations ............................................. 5-44
5.4.2 Scanning and Direct Measurement Survey Techniques .................................... 5-44 5.4.2.1 Building Interior Surfaces.............................................................................. 5-44
5.4.2.1.1 Class 1 Surfaces ....................................................................................... 5-45 5.4.2.1.2 Class 2 Surfaces ....................................................................................... 5-45 5.4.2.1.3 Class 3 Surfaces ....................................................................................... 5-45 5.4.2.1.4 Swipe Test Counting................................................................................ 5-46
5.4.2.2 Building Exterior Surfaces............................................................................. 5-46 5.4.2.3 Soil and Pavement Surfaces........................................................................... 5-46
5.4.2.3.1 Class 1 Soil and Pavement Surfaces ........................................................ 5-46
Final Sampling and Analysis Plan, Volume 1 – Field Sampling Plan Former Guterl Specialty Steel Corporation FUSRAP Site, Lockport, New York
vi 01/18/07
5.4.2.3.2 Class 2 Soil and Pavement Surfaces ........................................................ 5-47 5.4.2.3.3 Class 3 Soil and Pavement Surfaces ........................................................ 5-47
5.4.3 Surface and Subsurface Soil (Volumetric) ........................................................ 5-47 5.4.3.1 Rationale and Design ..................................................................................... 5-47
5.4.3.1.1 Soil Sampling Locations .......................................................................... 5-47 5.4.3.1.2 Decision Logic for Onsite and Offsite Gamma Spectroscopy COPC Analysis 5-47 5.4.3.1.3 Decision Logic for Offsite Alpha Spectroscopy Analyses ...................... 5-49 5.4.3.1.4 Offsite Analyses to Evaluate for Enriched/Recycled Uranium ............... 5-49 5.4.3.1.5 Decision Logic for Biased Horizontal Bounding..................................... 5-50 5.4.3.1.6 Onsite Gamma Spectroscopy Analysis of Volumetric Soil Samples ...... 5-50
5.4.3.2 Field Procedures............................................................................................. 5-51 5.4.3.2.1 Utility Clearances..................................................................................... 5-51 5.4.3.2.2 Drilling Method - Direct Push Technology ............................................. 5-51 5.4.3.2.3 Sampling Method - Surface and Subsurface Soil .................................... 5-52 5.4.3.2.4 Sampling Method – Geotechnical............................................................ 5-52 5.4.3.2.5 Concrete Cores......................................................................................... 5-52 5.4.3.2.6 Decontamination of Sampling Equipment............................................... 5-53
5.4.4 Groundwater ...................................................................................................... 5-53 5.4.4.1 Rationale and Design ..................................................................................... 5-53 5.4.4.2 Field Procedures............................................................................................. 5-55 5.4.4.3 Monitoring Well Equipment and Materials ................................................... 5-55
5.4.4.3.1 Drilling Methods and Equipment............................................................. 5-55 5.4.4.3.2 Materials .................................................................................................. 5-56 5.4.4.3.3 Monitoring Well Casing/Screen .............................................................. 5-56 5.4.4.3.4 Filter Pack, Bentonite Seal, Cement/Bentonite Grout ............................. 5-56 5.4.4.3.5 Surface Completion ................................................................................. 5-56 5.4.4.3.6 Water Source............................................................................................ 5-57 5.4.4.3.7 Delivery, Storage, and Handling of Materials ......................................... 5-57
5.4.4.4 Monitoring Well Installation.......................................................................... 5-57 5.4.4.4.1 Soil Sampling and Rock Coring During Drilling .................................... 5-57 5.4.4.4.2 Borehole Diameter and Depth ................................................................. 5-57 5.4.4.4.3 Screen and Well Casing Placement ......................................................... 5-58 5.4.4.4.4 Filter Pack Placement .............................................................................. 5-58 5.4.4.4.5 Bentonite Seal .......................................................................................... 5-59 5.4.4.4.6 Cement/Bentonite Grout Placement ........................................................ 5-59 5.4.4.4.7 Protective Cover Placement..................................................................... 5-59 5.4.4.4.8 Well Identification ................................................................................... 5-60 5.4.4.4.9 Well Survey ............................................................................................. 5-60
5.4.4.5 Documentation............................................................................................... 5-60 5.4.4.5.1 Soil Boring Logs ...................................................................................... 5-60 5.4.4.5.2 Rock Core Logs ....................................................................................... 5-61 5.4.4.5.3 Well Construction Diagrams.................................................................... 5-62
5.4.4.6 Monitoring Well Development ...................................................................... 5-63 5.4.4.6.1 Development Criteria............................................................................... 5-63 5.4.4.6.2 Development Records.............................................................................. 5-63
Final Sampling and Analysis Plan, Volume 1 – Field Sampling Plan Former Guterl Specialty Steel Corporation FUSRAP Site, Lockport, New York
vii 01/18/07
5.4.4.7 Existing Monitoring Well Rehabilitation....................................................... 5-64 5.4.4.8 Borehole and Monitoring Well Decommissioning/Abandonment ................ 5-64 5.4.4.9 Groundwater Level Measurement.................................................................. 5-65 5.4.4.10 Aquifer Testing (Slug Tests)...................................................................... 5-65 5.4.4.11 Groundwater Sampling .............................................................................. 5-66
5.4.4.11.1 Low Flow (Micro-Purge) Sampling....................................................... 5-66 5.4.4.11.2 Filtration................................................................................................. 5-67
5.4.5 Other Media ....................................................................................................... 5-67 5.4.5.1 Expansion Joints; Stress Cracks; Penetrations into Floors and Walls for Piping, Conduit, and Anchor Bolts; and Wall/Floor Interfaces ................................................. 5-67 5.4.5.2 Trenches, Pipes, and Drains........................................................................... 5-68 5.4.5.3 Sediment and Surface Water.......................................................................... 5-68
5.4.5.3.1 Ponar (Sediment) ..................................................................................... 5-68 5.4.5.3.2 Scoop/Trowel (Sediment) ........................................................................ 5-69 5.4.5.3.3 Hand-Held Bottle Method (Surface Water)............................................. 5-69 5.4.5.3.4 Dipper and Pond Sampler Method (Surface Water) ................................ 5-69 5.4.5.3.5 Decontamination of Sampling Equipment............................................... 5-69
5.4.6 Background Reference Areas ............................................................................ 5-70 5.4.6.1 Surfaces.......................................................................................................... 5-70 5.4.6.2 Soil ................................................................................................................. 5-70 5.4.6.3 Groundwater, Surface Water, and Sediment.................................................. 5-70
5.4.7 Site Civil Survey ................................................................................................ 5-70 5.4.7.1 Property Boundaries and Reference Coordinate Benchmarks....................... 5-71 5.4.7.2 Survey Units and Survey Grids...................................................................... 5-71 5.4.7.3 Location Survey Methods .............................................................................. 5-71
5.4.8 Non-Impacted Areas .......................................................................................... 5-72 5.4.9 Other Considerations ......................................................................................... 5-72
5.5 INVESTIGATION DERIVED WASTE DISPOSITION.......................................... 5-72 5.6 LEVEL OF EFFORT................................................................................................. 5-73
6 FIELD OPERATIONS DATA MANAGEMENT AND DOCUMENTATION ................ 6-1 6.1 DATA CONTROL FOR DECISION MAKING......................................................... 6-1 6.2 DAILY QUALITY CONTROL REPORTS................................................................ 6-2 6.3 FIELD LOGBOOKS ................................................................................................... 6-2 6.4 PHOTOGRAPHS ........................................................................................................ 6-2 6.5 SAMPLE DOCUMENTATION.................................................................................. 6-3
6.5.1 Sample Numbers.................................................................................................. 6-3 6.5.2 Sample Labels...................................................................................................... 6-5
6.6 RECORDS ................................................................................................................... 6-5 6.6.1 Responsibilities .................................................................................................... 6-5 6.6.2 Controlled Records .............................................................................................. 6-5 6.6.3 Quality Control .................................................................................................... 6-6
6.7 FIELD DOCUMENTATION PROCEDURES/DATA MANAGEMENT AND RETENTION ........................................................................................................................... 6-6
7 SAMPLE PACKAGING AND SHIPPING REQUIREMENTS......................................... 7-1 7.1 SAMPLE CONTAINERIZATION AND PRESERVATION..................................... 7-1 7.2 SAMPLE PACKAGING AND SHIPPING................................................................. 7-1
Final Sampling and Analysis Plan, Volume 1 – Field Sampling Plan Former Guterl Specialty Steel Corporation FUSRAP Site, Lockport, New York
viii 01/18/07
8 INVESTIGATION-DERIVED WASTE MANAGEMENT ............................................... 8-1 8.1 IDW COLLECTION AND CONTAINERIZATION ................................................. 8-1 8.2 WASTE CONTAINER LABELING........................................................................... 8-1 8.3 IDW FIELD STAGING AREA................................................................................... 8-2 8.4 IDW CHARACTERIZATION AND CLASSIFICATION FOR DISPOSAL ............ 8-3 8.5 INVENTORY OF IDW FROM PREVIOUS INVESTIGATIONS ............................ 8-3 8.6 DISPOSAL OF IDW ................................................................................................... 8-4 9 CONTRACTOR CHEMICAL QUALITY CONTROL PROGRAM /THREE-PHASE
INSPECTION PROCEDURES ................................................................................................... 9-1 9.1 PREPARATORY PHASE........................................................................................... 9-1 9.2 INITIAL PHASE ......................................................................................................... 9-2 9.3 FOLLOW-UP PHASE................................................................................................. 9-2
10 CORRECTIVE ACTIONS................................................................................................ 10-1 10.1 FIELD CORRECTIVE ACTIONS............................................................................ 10-1 10.2 LABORATORY CORRECTIVE ACTIONS............................................................ 10-1
11 REFERENCES .................................................................................................................. 11-1
Final Sampling and Analysis Plan, Volume 1 – Field Sampling Plan Former Guterl Specialty Steel Corporation FUSRAP Site, Lockport, New York
ix 01/18/07
LIST OF TABLES
Table 1-1 Prior Investigation and Analyses Summary Table
Table 3-1 Project Data Quality Objectives and Data Needs to be Achieved in RI/FS
Table 4-1 Buildings in IA-01 (Excised Area)
Table 5-1 Acceptable Surface Contamination Levels
Table 5-2 Acceptable Soil Contamination Levels above Natural Background
Table 5-3 Remedial Investigation Screening Levels
Table 5-4 Background Count Rates for Various Materials
Table 5-5 Approximate Site Areas by Class
Table 5-6 COPC Analytical Summary by Media
Table 5-7 Estimates for Interior and Exterior Areas in IA01 and IA02 by Class
Table 5-8 Estimated Number of Swipe and Building Material (Volumetric) Samples
Table 5-9 Estimated Number of Soil Samples
Table 5-10 Survey Methods (adapted from MARSSIM Table 4.1)
Table 5-11 Estimated Number of Groundwater Samples – IA07
Table 5-12 Estimated Number of Surface Water and Sediment Samples
Final Sampling and Analysis Plan, Volume 1 – Field Sampling Plan Former Guterl Specialty Steel Corporation FUSRAP Site, Lockport, New York
x 01/18/07
LIST OF FIGURES
Figure 1-1 Site Location Plan
Figure 1-2 Investigative Areas
Figure 2-1 Organization Chart
Figure 3-1 Summary Schedule
Figure 4-1 Preliminary CSM and Pathways for Human Exposure
Figure 5-1 Sequence of Preliminary Activities Leading to Survey Design
Figure 5-2 Background Soil Sample Site Location Plan
Figure 5-3 Building 1 Soil Sample Location Plan
Figure 5-4 Building 2 Soil Sample Location Plan
Figure 5-5 Building 3 Soil Sample Location Plan
Figure 5-6 Building 4/9 Soil Sample Location Plan
Figure 5-7 Building 6 Soil Sample Location Plan
Figure 5-8 Building 8 Soil Sample Location Plan
Figure 5-9 Building 24 Soil Sample Location Plan
Figure 5-10 Building 35 Soil Sample Location Plan
Figure 5-11 IA02 Soil Sample Location Plan
Figure 5-12 IA03 Soil Sample Location Plan
Figure 5-13 IA04A and IA04B Soil Sample Location Plan
Figure 5-14 IA04C and IA04D Soil Sample Location Plan
Figure 5-15 IA05A and IA05B Soil Sample Location Plan
Figure 5-16 Area Between Allegheny Ludlum Fence and Park Avenue
Figure 5-17 IA09 Location Plan
Figure 5-18 IA10 Soil Sample Location Plan
Figure 5-19 Onsite Gamma Spectroscopy Decision Tree
Figure 5-20 Biased Sampling Location Decision Tree
Figure 5-21 Existing Monitoring Well Locations
Figure 5-22 Proposed Monitoring Well Locations
Final Sampling and Analysis Plan, Volume 1 – Field Sampling Plan Former Guterl Specialty Steel Corporation FUSRAP Site, Lockport, New York
xi 01/18/07
LIST OF ATTACHMENTS
Attachment 1 Standard Operating Procedures
Attachment 2 Referenced Figures and Tables (from prior reports)
Attachment 3 Radiation Survey Equipment
Attachment 4 Field Forms and Logs

Final Sampling and Analysis Plan, Volume 1 – Field Sampling Plan Former Guterl Specialty Steel Corporation FUSRAP Site, Lockport, New York
xii 01/18/07
This page intentionally left blank.
Final Sampling and Analysis Plan, Volume 1 – Field Sampling Plan Former Guterl Specialty Steel Corporation FUSRAP Site, Lockport, New York
xiii 01/18/07
LIST OF ACRONYMS ABB-ES ABB Environmental Services, Inc. AEC Atomic Energy Commission ARAR Applicable or Relevant and Appropriate Requirement CERCLA Comprehensive Environmental Response, Compensation and Liability ActCCQC Contractor Chemical Quality Control CD Compact Disc COC Chain of Custody COPC Constituent of Potential Concern CQC Chemical Quality Control CSM Conceptual Site Model DCQCR Daily Chemical Quality Control Report DGAR Data Gap Analysis Report DOE Department of Energy DOT Department of Transportation dpm/100 cm2 Disintegration per Minute per 100 Square Centimeters DPT Direct Push Technology DQO Data Quality Objective ERTC Environmental Response Team Center EU Exposure Unit f Fraction FBDU Ford, Bacon & Davis Utah, Inc. FS Feasibility Study FSA Field Staging Area FSP Field Sampling Plan FUSRAP Formerly Utilized Sites Remedial Action Program GIS Geographic Information System gpd Gallons per Day gpm Gallons per Minute GPS Global Positioning System GWS Gamma Walkover Survey HAZWOPER Hazardous Waste Operations and Emergency Response HHRA Human Health Risk Assessment HTW Hazardous and Toxic Waste IA Investigative Area ICP-MS Inductively Coupled Plasma – Mass Spectroscopy ID Inner Diameter IDW Investigation Derived Waste ISOCS In-Situ Object Counting System K Hydraulic Conductivity keV kiloelectron volt (1 keV = 1.6 × 10⁻¹⁶ J) Lc Critical Level Ld Detection Level LQMP Laboratory Quality Management Plan MARSSIM Multi-Agency Radiation Survey and Site Investigation Manual
Final Sampling and Analysis Plan, Volume 1 – Field Sampling Plan Former Guterl Specialty Steel Corporation FUSRAP Site, Lockport, New York
xiv 01/18/07
MED Manhattan Engineer District MS/MSD Matrix Spike/Matrix Spike Duplicate MDC Minimum Detectable Concentration NaI Sodium Iodide NCIDA Niagara County Industrial Development Agency NCP National Oil and Hazardous Substances Pollution Contingency Plan NIOSH National Institute for Occupational Safety and Health NIST National Institute of Standards and Technologies NLO National Lead Company of Ohio NRC Nuclear Regulatory Commission NY New York NYCRR New York Codes, Rules, and Regulations NYSDEC New York State Department of Environmental Conservation ORISE Oak Ridge Institute for Science and Education ORNL Oak Ridge National Laboratory OWS Oil/water Separator PCB Polychlorinated Biphenyl PID Photo Ionization Detector PPE Personal Protective Equipment ppm Parts Per Million PRG Preliminary Remediation Goal (USEPA Region 9) PSA Preliminary Site Assessment PVC Poly Vinyl Chloride QAPP Quality Assurance Project Plan QA Quality Assurance QC Quality Control ROW Right of Way RPP Radiation Protection Plan RQD Rock Quality Designation SARSG San Antonio Radiation Safety Group SRSO Site Radiation Safety Officer RA Remedial Action RCRA Resource Conservation and Recovery Act RD Remedial Design RI Remedial Investigation SAP Sampling and Analysis Plan SLC Secure Landfill Contractors, Inc. SSHM Site Safety and Health Manager SSHO Site Safety and Health Officer SSHP Site Safety and Health Plan SOW Scope of Work SVOC Semivolatile Organic Compound TCLP Toxicity Characteristic Leaching Procedure TOC Total Organic Carbon TPP Technical Project Planning USACE United States Army Corps of Engineers

Final Sampling and Analysis Plan, Volume 1 – Field Sampling Plan Former Guterl Specialty Steel Corporation FUSRAP Site, Lockport, New York
xv 01/18/07
USCS Unified Soil Classification System USEDA United States Economic Development Association USEPA United States Environmental Protection Agency USGS United States Geological Survey VOC Volatile Organic Compound XRF X-ray Fluorescence

Final Sampling and Analysis Plan, Volume 1 – Field Sampling Plan Former Guterl Specialty Steel Corporation FUSRAP Site, Lockport, New York
xvi 01/18/07
This page intentionally left blank.
Final Sampling and Analysis Plan, Volume 1 – Field Sampling Plan Former Guterl Specialty Steel Corporation FUSRAP Site, Lockport, New York
1-1 01/18/07
1 SITE BACKGROUND In accordance with United States Army Corps of Engineers (USACE), Buffalo District contract number W912P4-05-D-0001, delivery order number 0001, Earth Tech has prepared this draft Field Sampling Plan (FSP) for the former Guterl Specialty Steel Corporation site (Site), as part of the Formerly Utilized Sites Remedial Action Program (FUSRAP), in accordance with Task 5 of the March 2005 delivery order Scope of Work (SOW) (USACE, 2005a).
The strategy for the Site, as directed by Congress and specified by USACE, is to address all Manhattan Engineer District (MED) and Atomic Energy Commission (AEC)-related waste at the Site (and adjacent properties, if necessary). The strategy will follow the process defined in the Comprehensive Environmental Response, Compensation and Liability Act (CERCLA). The criteria in CERCLA (United States Environmental Protection Agency (USEPA), 1988) and the National Oil and Hazardous Substances Pollution Contingency Plan (NCP) (USEPA, 1990) will be used for site evaluation and remedy.
This FSP is part of the Remedial Investigation (RI) Sampling and Analysis Plan (SAP). The overall SAP consists of this FSP and the companion Quality Assurance Project Plan (QAPP). The SAP contains the overall RI approach, rationale, procedures, and quality assurance/quality control (QA/QC) program for the various field activities planned during the Site RI. The SAP has been developed using available background information, and relevant guidance documents such as the USACE Requirements for the Preparation of Sampling and Analysis Plans Engineer Manual (EM 200-1-3 (USACE 2001a)), and the USEPA, US Department of Energy (USDOE), and US Department of Defense, Multi-Agency Radiation Survey and Site Investigation Manual, 2000, referred to herein as MARSSIM.
The purpose of this FSP is to specify and provide for documentation of the data collection program for the Site. The FSP addresses the field activities, including all aspects of sampling (e.g., soil, subsurface soil, groundwater, surface water, sediment, building media), test boring and monitoring well installation, and field data gathering activities.
The current and future uses of the data may include performing a RI, feasibility study (FS), remedial design (RD), and remedial action (RA). Within these broad programs, data may be used to establish the nature and extent of contamination, fate and transport, human health risk assessment, screening level ecological risk assessment, estimation of quantities and classification (e.g., hazardous or non-hazardous, low level radioactive waste, etc.) of contaminated material of various matrices (i.e., soil, groundwater, surface water, sediment, and building materials), and achievement of future risk-based cleanup goals (release criteria).
1.1 SITE LOCATION The Site is located in Lockport, Niagara County, New York (NY), approximately 20 miles northeast of Buffalo, NY.
The Site is located within the Lockport 7.5-minute topographic quadrangle (USGS, 1980), shown on Figure 1-1. The land surface elevation within the site vicinity is approximately 590 feet (ft) above mean sea level.
Final Sampling and Analysis Plan, Volume 1 – Field Sampling Plan Former Guterl Specialty Steel Corporation FUSRAP Site, Lockport, New York
1-2 01/18/07
1.2 SITE HISTORY From 1910 to 1966, the former Guterl Specialty Steel Corporation site was owned and operated by Simonds Saw and Steel Company (Simonds) to manufacture steel and specialty steel alloys (high-alloy) used in the production of saws and other tools. During World War I and World War II, normal plant operations were suspended, and the plant produced armor plating for the US Government under various contracts (Simonds Saw and Steel Company, 1943; and United States Ordnance Department, 1919).
In 1948, the NY Operations Office of the AEC negotiated a contract with Simonds. AEC operations continued until December 31, 1956. During the time between 1948 and 1952 documents indicated that Simonds processed as much as 600,000 pounds of natural uranium (i.e., processed uranium steel without enrichment supplied as metal ingots) and the plant annually conducted approximately 312 rolling turns of metal, which would process between 15,000 and 20,000 pounds of uranium ingots each. In 1953, 1954, 1955, and 1956, there was production of 29, 56, 58, and 22 turns of metal, respectively. Each turn processed between 15,000 and 20,000 pounds of uranium ingot. According to prior reports, some of the later lots contained enriched uranium and depleted uranium.1 It is also reported that during this time period, Simonds processed 30,000 to 40,000 pounds of thorium for National Lead Company of Ohio (NLO) and the AEC (Guterl Steel Corporation, Simonds Steel Division, 1979).
In a more recent report published by the National Institute for Occupational Safety and Health (NIOSH), the authors stated that 99% of all material processed at Simonds Saw and Steel was natural uranium. There is evidence to support the processing of depleted uranium and enriched uranium (up to 2.5%), but their fractions of contribution to worker radiation dose is small compared to the amount of natural uranium present (NIOSH, 2005).
In addition, of the thorium that was processed, 232Th and 228Th was present in equal fractions. That is to say that of the thorium present, 50% was comprised of 232Th and 50% was comprised of 228Th. This NIOSH report further discusses the presence of recycled depleted uranium. Recycled depleted uranium is known to be cross-contaminated with transuranic radionuclides and for Simonds Saw and Steel, they are neptunium (237Np) and plutonium (239Pu). Note that the estimate of contaminant activity fractions in a recycled depleted uranium source term are 0.00182 for 237Np and 0.000261 for 239Pu (NIOSH 2005). These fractions are so small when compared to the 99% natural uranium that they are nearly immeasurable.
In 1966, Simonds was acquired by the Wallace-Murray Corporation (Delaware Secretary of State, 1966). Wallace-Murray Corporation continued to operate the plant as a specialty steel mill until 1978, when Guterl Specialty Steel Corporation acquired the site property (Niagara County Clerks Department, 1978).
1 Natural uranium metal contains about 0.71% U-235, 99.28% U-238, and about 0.0054% U-234. In order to produce enriched uranium, the process of isotope separation removes a substantial portion of the U-235 for use in nuclear power, weapons, or other uses. The remainder, depleted uranium, contains only 0.2% to 0.4% U-235. Because natural uranium begins with such a low percentage of U-235, the enrichment process produces large quantities of depleted uranium. For example, producing 1 kg of 5% enriched uranium requires 11.8 kg of natural uranium, and leaves about 10.8 kg of depleted uranium with only 0.3% U-235 remaining. (Source: www.wikipedia.com)
Final Sampling and Analysis Plan, Volume 1 – Field Sampling Plan Former Guterl Specialty Steel Corporation FUSRAP Site, Lockport, New York
1-3 01/18/07
In 1982, Guterl Specialty Steel Corporation filed for Chapter 11 bankruptcy protection in the US Bankruptcy Court for the Western District of Pennsylvania (this was changed to a Chapter 7 bankruptcy in 1990.) In 1984, using industrial development bonds received through the Niagara County Industrial Development Agency (NCIDA), Allegheny Corporation purchased Guterl Specialty Steel Corporation’s assets at an auction (US Bankruptcy Court, 1984).
According to US Bankruptcy Court documents, “on information and belief, at the time, Allegheny Ludlum (Allegheny) was shown certain documents and learned from counsel for the United States Economic Development Association (USEDA), William Ogden, that the site contained radioactive contamination. On information and belief, the USEDA had certain documents in its possession that reflected the significant radiological contamination at the site. Allegheny refused to close” (US Bankruptcy Court, 2004).
As a result of the documents and information received from Mr. Ogden, Allegheny agreed to close the deal, but only after the “contaminated” area was removed from the sale. This portion of the property, approximately nine acres of land, became known as the “Excised Area.” Allegheny also excluded a portion of Guterl Specialty Steel Corporation’s assets from the sale, including equipment utilized during AEC-related operations at the site (US Bankruptcy Court, 1984).
The Site is currently being operated by Allegheny, which occupies the portion of the Site that is not part of the Landfill Area or Excised Area (USACE, 2005a).
1.3 PREVIOUS INVESTIGATIONS Existing data were generated under a number of previous investigations performed at the Site, dating back to 1978. USACE personnel compiled the data and conducted a preliminary evaluation of the existing data from seven of these investigations, focusing on usability for risk assessment (which is a use that typically has the most stringent data quality requirements). Earth Tech added summary information for one additional report, Oak Ridge National Laboratories (ORNL) (1978), in the same spirit as the USACE summary.
Previous investigations that are summarized below include:
• Radiological Survey of the Former Simonds Saw and Steel Company, Final Report, September 1978. Prepared by ORNL for United States Department of Energy (DOE). (ORNL, 1978)
• Preliminary Engineering and Environmental Evaluation of the Remedial Action Alternatives for the Former Simonds Saw and Steel Company Site, November 1981. Prepared by Ford, Bacon & Davis Utah, Inc. (FBDU) for Bechtel National, Inc., for DOE. (FBDU, 1981)
• Phase I Investigation, Guterl Specialty Steel, City of Lockport, Niagara County, January 1988. Prepared by Engineering-Science and Dames & Moore for New York State Department of Environmental Conservation (NYSDEC). (NYSDEC, 1988)
• Preliminary Site Assessment, Task 1 Records Search, Guterl Specialty Steel Corporation, January 1991. Prepared by E.C. Jordan for NYSDEC. (NYSDEC, 1991)
Final Sampling and Analysis Plan, Volume 1 – Field Sampling Plan Former Guterl Specialty Steel Corporation FUSRAP Site, Lockport, New York
1-4 01/18/07
• Preliminary Site Assessment Evaluation Report of Initial Data, Guterl Specialty Steel, Volumes I and II, April 1994. Prepared by ABB Environmental Services (ABB-ES) for NYSDEC. (NYSDEC, 1994)
• Final Report, Guterl Steel Site, Lockport, New York, USEPA Work Assignment No. 2-194, April 1998. Prepared by Roy F. Weston, Inc. for USEPA/Environmental Response Team Center (ERTC). (USEPA, 1998)
• Radiological Survey of the Guterl Specialty Steel Corporation, Lockport, New York, December 1999. Prepared under a contract with DOE by Oak Ridge Institute for Science and Education (ORISE) for United States Bankruptcy Court for the Western District of Pennsylvania (ORISE, 1999).
• Immediate Investigative Work Assignment (IIWA) Report for the Unlisted Guterl Excised Area, October 2000. Prepared by NYSDEC. (NYSDEC, 2000).
A summary of the data contained in each of these reports, as well as the preliminary conclusions regarding the usability of the data, taken from the USACE summary report (USACE, 2005b), is presented below. A summary of the analyses performed and referenced in these reports, with more details on the sample quantities and analyses of each sample type is presented in Table 1-1. The USACE summary report did not include a review of the ORNL (1978) report or data; the assessment and data compilation for that report was prepared by Earth Tech.
1.3.1 Radiological Survey of the Former Simonds Saw and Steel Company, Lockport, New York, Final Report. Prepared by ORNL for DOE under FUSRAP, September 1978
This investigation included the results of a radiological survey of Simonds, Lockport, NY. The survey was conducted “to characterize the existing radiological status of the property” (ORNL, 1978), primarily in what is now referred to as the Excised Area. Investigations, which were conducted in October 1976, included measurement of residual alpha and beta-gamma radiation levels in the rolling mill building and forging shop; external gamma radiation in the same area; uranium, radium, and thorium in soil samples taken from beneath removable floor plates in the rolling mill area and from other parts of the Site; radon and radon daughter concentrations in air samples in the rolling mill building; and contamination in drainage paths leading from the buildings and grounds. A few samples were also analyzed for individual uranium isotopes (U-234, U-235, and U-238) by mass spectrometry.
Using the same criteria as applied by USACE in its review, Earth Tech believes that these data may be usable in a risk assessment if chain-of-custody forms (COCs), equipment calibration records, detection limits, and analytical methods, are obtained from ORNL / DOE, assuming that the appropriate analytical methods were used, and that the detection limits are below appropriate screening levels for constituents of interest. Due to the age of the data, it is unlikely that all the supporting documentation will be available. However, even if the data quality does not allow the data to be used directly in a risk assessment, the data are likely to be useful for determining nature and extent of contamination, focusing subsequent investigations, and may assist in determining disposal options.
Final Sampling and Analysis Plan, Volume 1 – Field Sampling Plan Former Guterl Specialty Steel Corporation FUSRAP Site, Lockport, New York
1-5 01/18/07
1.3.2 Preliminary Engineering and Environmental Evaluation of the Remedial Action Alternatives for the Former Simonds Saw and Steel Company Site, Lockport, New York, Former Utilized MED/AEC Sites Remedial Action Program, Final Report. Prepared by FBDU for Bechtel National, Inc. under FUSRAP, for DOE, November 1981
The purpose of this report was to present the results of a preliminary engineering evaluation and the environmental assessment leading to the selection of appropriate remedial action options for the Site (formally Simonds). This investigation included analysis of cinder samples from the Guterl Excised Area (Excised Area), primarily within the area of the 16-inch rolling mill. FBDU also collected external gamma radiation measurements in “Building A” (equivalent to Building 8 in the ORISE, 1999 report) in the general vicinity of the 16-inch rolling mill, and in “Building B” (equivalent to Building 3 in the ORISE, 1999 report). Test parameters included radium, thorium, and uranium. The report included analytical results with units, and sample location and depth.
USACE (2005b) concluded that the data may be usable in a risk assessment if COCs, equipment calibration records, detection limits, analytical methods, and uncertainty are obtained from Bechtel, assuming that the appropriate analytical methods were used, and that the detection limits are below appropriate screening levels for constituents of interest. As with the ORNL (1978) data, it is unlikely that all the supporting documentation will be available. However, even if the data quality does not allow the data to be used directly in a risk assessment, the data are likely to be useful for determining nature and extent of contamination, focusing subsequent investigations, and may assist in determining disposal options.
1.3.3 Engineering Investigations at Inactive Hazardous Waste Sites - Phase I Investigation, Guterl Specialty Steel, City of Lockport, Niagara County. Prepared by Engineering-Science and Dames & Moore for NYSDEC, January 1988
The purpose of this report was to assess the hazard to the environment caused by the then-present condition of the Guterl Landfill Area (Landfill Area). Materials reportedly disposed in the onsite landfill, operated from 1962 until 1981, includes slag, palletized baghouse dust, foundry sand, wood, and miscellaneous plant rubbish. The Phase I Investigation report included presentation of five rounds of prior analyses, collected between 1980 and 1982 by Secure Landfill Contractors, Inc. (SLC), for groundwater samples from the Landfill Area. Test parameters reported included oil & grease, phenols, total organic carbon (TOC), total halogenated organics, and metals. The report included analytical results with units and sample location. Boring logs and monitoring well construction logs were also included.
USACE (2005b) concluded that the data may be usable in a risk assessment if COCs, equipment calibration records, detection limits and analytical methods are obtained from NYSDEC. (Some of this information was included in the 1991 Preliminary Site Assessment (PSA)-Task 1 document [NYSDEC, 1991], described immediately below.) Earth Tech notes that the data presented in the report were from samples collected between December 1980 (approximately 25 years ago) and April 1982; as such, the data are unlikely to be representative of current conditions. As a result, the data are not likely to be useful for current and future data needs.
Final Sampling and Analysis Plan, Volume 1 – Field Sampling Plan Former Guterl Specialty Steel Corporation FUSRAP Site, Lockport, New York
1-6 01/18/07
1.3.4 Engineering Investigations at Inactive Hazardous Waste Sites - Preliminary Site Assessment, Task 1 Records Search, Guterl Specialty Steel Corporation, City of Lockport, Site No. 932032, Niagara County. Prepared by E.C. Jordan for NYSDEC, January 1991
This report was prepared solely to determine the proper classification of the site in accordance with NYSDEC regulations (i.e., to determine if hazardous waste is present at the site [6 New York Codes, Rules and Regulations (NYCRR) Part 371] and if the waste at the site poses a ‘significant threat’). This investigation included a summary of previous analysis of groundwater samples collected by SLC from the Landfill Area for the period 1980 to 1982. Test parameters summarized in the report included oil & grease, TOC, total halogenated organics (as lindane), metals (chromium, copper, iron, lead, magnesium, and nickel), and phenols; however, no analyses were conducted as part of this Phase 1 PSA (Task 1). Data from the December 1980 through April 1982 samples presented in this report are a re-statement of the same set of samples presented in the NYSDEC, January 1988 Phase I Report; however, a more complete summary is provided in the appendix to this 1991 PSA report than was presented in the 1988 Phase I report.
USACE (2005b) concluded that the data may not be usable in the risk assessment as only maximum concentrations are provided at each location; however, Earth Tech notes that a more complete summary is provided in Appendix D of the report (NYSDEC, 1991), which includes all the parameters and all the events, including reporting limits for non-detects. (Appendix D indicates that analyses were performed, including lindane, oil and grease, and other metals.) In addition, Earth Tech notes that the data presented in the report were from samples collected between 1980 and 1982 (more than 20 years ago); as such, the data are unlikely to be representative of current conditions. As a result, the data are not likely to be useful for current and future data needs.
1.3.5 Engineering Investigations at Inactive Hazardous Waste Sites- Preliminary Site Assessment Evaluation Report of Initial Data, Guterl Specialty Steel, City of Lockport, Niagara County, Volumes I and II. Prepared by ABB-ES for NYSDEC, April 1994
The purpose of this report was to establish the presence of hazardous waste at the Site and to determine if the Site posed a significant threat to public health or the environment. Specifically, the investigation was performed to develop data to reclassify the Site from a Class 2a to a Class 2 hazardous waste site.
This investigation included analysis of surface and subsurface soil, surface water, sediment, groundwater, and waste from the Landfill Area. Analytical parameters included volatile organic compounds (VOCs), semivolatile organic compounds (SVOCs), pesticides, polychlorinated biphenyls (PCBs), metals, and toxicity characteristic leaching procedure (TCLP). Groundwater and surface water samples were also analyzed for gross alpha and gross beta activity. A survey for gamma radiation was conducted over the Landfill Area (228 grid points on a 33.33-ft spacing). In addition, split spoon samples were scanned for alpha, beta, and gamma radiation using a survey meter. The report included COCs, analytical results with units, detection limits, data qualifiers, analytical methods, equipment calibration records, and sample location and depth.
Final Sampling and Analysis Plan, Volume 1 – Field Sampling Plan Former Guterl Specialty Steel Corporation FUSRAP Site, Lockport, New York
1-7 01/18/07
USACE (2005b) concluded that these data may be usable in a risk assessment. Data for conventional chemical analyses were validated by the contractor (ABB-ES); the laboratory data for gross alpha and gross beta radioactivity (groundwater and surface water samples) were not validated.
1.3.6 Final Report, Guterl Steel Site, Lockport, New York. Prepared by Roy F. Weston for USEPA, Work Assignment No. 2-194, April 1998
The purpose of this investigation was to conduct in situ surficial, and ex situ subsurface soil analyses for target metals using x-ray fluorescence (XRF). The samples were collected within the Excised Area, inside and outside Buildings 1, 2, 3, and 4/9. The samples were analyzed to evaluate the horizontal and vertical distribution of cadmium and lead (identified by the authors as primary indicators), and arsenic, nickel, and zinc (identified as secondary indicators). Additionally, shallow subsurface soil samples analyzed ex situ by XRF were submitted for TCLP metals analysis. Samples were also collected for PCB analysis from oil-stained areas and in the vicinity of an electric transformer.
Surficial lead and cadmium concentrations were detected in excess of the “screening level” of 400 parts per million (ppm) for lead and 200 ppm for cadmium over variable areas in each of the buildings and in the building exterior “vicinity.” TCLP analyses showed limited areas of lead exceedances per regulatory guidance (5 ppm). PCBs (Aroclor 1260) were detected in samples collected near the transformer area, but were not detected in samples collected within oil-stained areas of Building 3.
The report included COCs, analytical results with units, equipment calibration records, detection limits, data qualifiers, analytical methods, and several figures depicting sample locations (without a fixed grid system) and contaminant isopleths. Data for sample depth are present, but must be derived from COCs and analytical data reports. USACE (2005b) concluded that the data may be usable in a risk assessment.
1.3.7 Radiological Survey of the Guterl Specialty Steel Corporation, Lockport, New York. Prepared under a contract with DOE by ORISE for US Bankruptcy Court for the Western District of Pennsylvania, December 1999 (ORISE, 1999)
The purpose of the ORISE investigation was to (1) adequately characterize the radiological status of the land and buildings areas located at the properties at the Site including the Allegheny property, and (2) to be comprehensive enough to provide both a volume and cost estimate for RD. This work was conducted in response to a request of the US Bankruptcy Court for the Western District of Pennsylvania and with the approval of the DOE.
This investigation included analysis of surface and subsurface soil and sediment samples from the Excised Area. The investigation also included a radiological survey of the buildings in the Excised Area. Test parameters included radium, thorium, and uranium. The report included analytical results with units, uncertainty, data qualifiers, analytical methods, and sample location and depth. Sample locations are often generalized to an item rather than a specific coordinate.
USACE (2005b) concluded that these data may be usable in a risk assessment if COCs, equipment calibration records, and detection limits are obtained from ORISE.
Final Sampling and Analysis Plan, Volume 1 – Field Sampling Plan Former Guterl Specialty Steel Corporation FUSRAP Site, Lockport, New York
1-8 01/18/07
1.3.8 Immediate Investigative Work Assignment Report, Guterl Excised Area, City of Lockport, Niagara County. NYSDEC, October 2000
The purpose of this report was to determine the presence and extent of hazardous wastes at the Site. Specifically, the purpose was to determine if consequential amounts of hazardous wastes were disposed of in the Excised Area that would require the Excised Area be listed in the New York State Registry of Inactive Hazardous Waste Sites (NYSDEC, 2003). In addition, this report evaluated the effects of the Erie Barge Canal and the Frontier Stone Products quarry on the groundwater flow pattern in the vicinity of the Site by studying the strata underlying the Site.
This investigation included analysis of surface and subsurface soil, groundwater, surface water, and sediment samples collected from the Excised Area. Analytical parameters included VOCs, SVOCs, pesticides, PCBs, metals, and TCLP. The report included analytical results with units, data qualifiers, analytical methods, and sample location and depth. Sample COCs, equipment calibration records, and detection limits were not included in the report.
USACE (2005b) concluded that these data may be usable in a risk assessment if COCs, equipment calibration records, and detection limits are obtained from NYSDEC.
1.4 PHYSICAL SETTING As defined by the RI SOW (USACE, 2005a), the Site was defined as “an approximately 70-acre site” comprised of three general areas, including the 52-acre Allegheny property, the 9-acre Landfill Area, and the 9-acre Excised Area. However, during the Technical Project Planning (TPP) Meeting conducted August 9 and 10, 2005, it was agreed to include additional properties that were at one time held by Simonds that may have been impacted by MED/AEC activity. (Simonds, a predecessor to Guterl Specialty Steel Corporation and operator of the facility during MED/AEC activity, appears in several historical report titles.)
Figure 1-2 presents the TPP-defined site boundaries including additional properties north (IA05) and northeast (IA06) of the SOW-defined boundaries. As discussed at the TPP Meeting, it was agreed to include IA05 and IA06 in the background records search and data gap analysis until individual tracts could be eliminated based on acquisition of data that would justify withdrawing the property from further consideration. Figure 1-2 also shows two additional IAs (IA09 and IA10) that were created during development of this SAP. The two IAs were evaluated during the data gap analysis as part of IA05 and IA08, but were drawn out as individual IAs during development of the SAP to provide improved flexibility to the investigative rationale.
1.4.1 Topography The Site is located in Lockport, Niagara County, NY, approximately 20 miles northeast of Buffalo, NY. The topography at the Site is relatively flat, with a relief of approximately 25 ft from the north side of the Site at Route 31 (elevation 595 ft) to the south side of the Site at NYS Route 93 (elevation 620 ft). The Site is located approximately one mile southeast of the west branch of Eighteen Mile Creek and 200 ft north of the northeast-southwest flowing Erie Barge Canal. There is a low-lying, seasonally wet area to the west and southwest of the Landfill Area. The Site does not contain any streams and has no visible connection to other surface water bodies (NYSDEC, 1988), including the Erie Barge Canal. The elevation of the Erie Barge Canal immediately south of the Site fluctuates by several feet due to its downstream location from the
Final Sampling and Analysis Plan, Volume 1 – Field Sampling Plan Former Guterl Specialty Steel Corporation FUSRAP Site, Lockport, New York
1-9 01/18/07
Lockport locks, and its confluence with Tonawanda Creek. In general, the elevation of the Erie Barge Canal averages elevation 565 ft. An active dolostone quarry is located approximately 0.1 miles southwest of the Site. Earth Tech contacted the quarry to inquire about dewatering activity, and the quarry manager indicated that the open pit dewatering system operates constantly throughout the year, maintaining a dewatered condition within the pit (no elevation was provided).
1.4.2 Geology This section of the FSP includes summaries of the regional and site-specific geologic settings for the Site.
1.4.2.1 Regional Geology The geology of the Niagara region consists of a generally thin blanket of unconsolidated Wisconsin-age glacial sediments overlying a thick sequence of shales, sandstones, limestones and dolostones deposited in ancient seas during the Silurian and Devonian Periods (439-360 million years ago) (Buehler and Tesmer, 1963 (NYSDEC, 2000)). Bedrock bedding generally strikes in an east-west direction, approximately paralleling the east-west trending Niagara and Onondaga Escarpments, and dips to the south at approximately 30 to 40 ft per mile (Johnson, 1964; La Sala, 1968; Yager and Kappel, 1987 (NYSDEC, 2000)).
Brett, et al (1995, page 45 (NYSDEC, 2000)) describe the uppermost bedrock group, the Lockport Group, as a “massive- to medium-bedded, argillaceous dolomite with minor amounts of dolomite and shale.” The uppermost bedrock formation underlying the Lockport area south of the Niagara Escarpment is the Goat Island Dolostone Formation of the Lockport Group (19 to 25 ft thick). The upper 10 to 25 ft of this unit can be heavily weathered and often contains abundant bedding planes and vertical fractures enlarged by dissolution and glacial scour (Miller and Kappel, 1987 (NYSDEC, 2000)). Stratigraphically below the Goat Island Member is the Gasport Member (15 to 30 ft thick) of the Lockport Group followed by the DeCew Formation (8 to 10 ft thick) of the Clinton Group and the Rochester Shale of the Clinton Group. The Rochester Shale is typically 55 to 65 ft thick in the Niagara region and is described as a dark bluish to brownish gray, calcareous shale with occasional argillaceous limestone layers. The upper Rochester Shale tends to be more dolomitic than the lower, especially where it contacts the DeCew Formation.
The major water-bearing units in the Niagara region are in the bedrock above the Rochester Shale. In the vicinity of the Site, this interval includes the rocks of the Goat Island and Gasport Members of the Lockport Group and the DeCew Formation of the Clinton Group.
In the recent past, most of New York, including the region of the Site, was covered by a series of continental ice sheets (often referred to as glaciers). The activity of the ice sheets widened pre-existing valleys, and deposited widespread accumulations of till. The melting of the most recent ice sheets, ending approximately 12,000 years ago in western NY, produced large volumes of melt water; this water subsequently shaped channels and deposited thick accumulations of stratified granular sediments.
As the ice sheets retreated from the region, meltwater formed proglacial lakes along the ice margin. This region is covered by lake sediments, the most recent being from Lake Iroquois (a large predecessor to Lake Ontario) and from Lake Tonawanda (an elongated lake which
Final Sampling and Analysis Plan, Volume 1 – Field Sampling Plan Former Guterl Specialty Steel Corporation FUSRAP Site, Lockport, New York
1-10 01/18/07
occupied an east-west valley and drained north into Lake Iroquois as the ice sheet retreated northward into the Ontario basin). The sediments consist of blanket sands and beach ridges which are occasionally underlain by lacustrine silts and clays (indicating quiet or deeper water deposition). In some areas, bedrock is within a few ft of the ground surface, where sediments have been eroded away. Drainage channels carved into the Niagara Escarpment, including Eighteen Mile Creek, indicate positions of former outlets of Lake Tonawanda.
Granular deposits in this area frequently act as shallow aquifers, whereas lacustrine clays, as well as tills, often inhibit groundwater movement. However, fine-grained, water-lain sediments, such as silts and clays, frequently contain horizontal laminations and sand seams. These internal features facilitate lateral groundwater movement through otherwise low permeable materials.
1.4.2.2 Site Geology Geology for the Site has been described in several reports and is best summarized by NYSDEC (2000). As described by NYSDEC, there are three basic overburden units, one bedrock unit, and potentially two water bearing zones present at the Site. The basic overburden units include imported and/or man-made fill materials, overlying native overburden materials comprised of glaciolacustrine silts and clays overlying glacial till. The two water bearing zones previously identified at the Site include a shallow water-table zone in the overburden, and the uppermost zone of bedrock. Each component is described in more detail below.
In general, fill material ranges from 0.3 to 3.7 ft in thickness at the Site. (Fill material at the Landfill Area, however, ranges up to 14 ft in thickness.) The fill material is reported to consist predominantly of production and miscellaneous plant wastes containing coal, ash, coke, and brick.
Native overburden is described as a combination of a thin, discontinuous glaciolacustrine deposit of silts and clays overlying a thin, discontinuous glacial till of silt and clay with lesser amounts of sand and bedrock fragments. Glaciolacustrine deposits were encountered in borings and test pits (SB-6, TB-101, and TP3-94) performed by NYSDEC (NYSDEC, 2000). The unit was noted to be mottled and to contain vertical desiccation cracks throughout its thickness. Borings and test pits that have completely penetrated this deposit reveal that it directly overlies either glacial till or bedrock, and where encountered, ranges in thickness from 0.5 to 2.5 ft (NYSDEC, 2000). Based on a review of boring logs from the 1980 landfill wells and the 1997 NYSDEC bedrock wells, the glacial till unit ranged from less than 1 to approximately 2.5 ft in thickness when encountered (NYSDEC, 1988).
The uppermost bedrock unit is the east-southeast dipping Goat Island Member of the Lockport Group. Depth to bedrock, as determined from well logs and test pit information, ranges from approximately 4 ft below grade (Excised Area wells; southeast portion of the Site, i.e., MW-4) to approximately 15.3 ft below grade (landfill test borings and test pits; northwest portions of the Site, i.e., TB-104) (NYSDEC, 2000). Physical features of the Goat Island Member observed within the region include horizontal and vertical fractures, vugs, physical weathering of the bedrock surface (e.g., glacial effects), and solution weathering of the fractures (i.e., solution-widened secondary porosity) (Johnson, 1964; Yager and Kappel, 1987 (NYSDEC, 2000)).
Final Sampling and Analysis Plan, Volume 1 – Field Sampling Plan Former Guterl Specialty Steel Corporation FUSRAP Site, Lockport, New York
1-11 01/18/07
1.4.3 Hydrogeology This section of the FSP includes summary descriptions of the regional and site-specific hydrogeologic setting for the Site.
1.4.3.1 Regional Hydrogeology Regional hydrogeology has been described for the Site vicinity in several prior investigation reports and is best summarized by NYSDEC (2000). The following material regarding regional hydrogeology is adapted in its entirety from NYSDEC, 2000 (Section VI, pp 17-18).
Water bearing zones in the Lockport area include unconsolidated glacial deposits and bedrock of the Lockport Group and Rochester Shale (Johnson, 1964; GZA, 1981). Most of the unconsolidated deposits in the area consist of fine grained glacial deposits with hydraulic conductivities roughly 10-7 centimeters per second (cm/s) or less (Earth Dimensions, 1980). These deposits, however, often contain horizontal laminations and sand lenses that can produce perched water-table conditions, or if areally extensive, can be utilized as sources of water (La Sala, 1968). Because the unconsolidated deposits in southwestern Lockport are relatively thin, and horizontal laminations and sand lenses are not common, groundwater yields from these deposits would be too low for domestic or industrial purposes. Overburden groundwater flow in the area, therefore, is expected to be highly localized and discontinuous.
The Lockport Group consists predominately of dolostone, however, thin beds of limestone and shaly dolostone, and small irregularly shaped masses of gypsum are common. These thin beds and masses are subject to dissolution by groundwater, resulting in the enlargement of fractures and the formation of migration pathways that transmit large quantities of groundwater. Groundwater wells completed in the Lockport Group have yields commonly ranging from 10 to 100 gallons per minute (gpm) (Miller and Kappel, 1987), with yields up to 950 gpm reported (Yager and Kappel, 1987). Reported transmissivity values range from 330 to 68,000 gpd/ft (Johnson, 1964). Groundwater in the Lockport Group is typically either calcium-sulfate or calcium-bicarbonate water, very hard, and highly mineralized with calcium, bicarbonate, magnesium, sulfate and chloride present in significant concentrations (Johnson, 1964; La Sala, 1968). Due to this poor water quality and the nearby presence of the Niagara River, an important source of municipal drinking water throughout Western New York, bedrock water is not extensively utilized as a source of domestic water in the Lockport area. The municipal drinking water source for the town of Lockport is the Niagara River.
Most recharge to the Lockport Group results from infiltration of rainfall, snowmelt, and surface water through the overburden deposits; subsurface flow of groundwater from areas of higher elevation (e.g., the Niagara Escarpment) also recharges the bedrock aquifer (Johnson, 1964; La Sala, 1968; Miller and Kappel, 1987; Yager and Kappel, 1987). The blocky structure, i.e., cracks that have formed as a result of swelling and shrinking of clay minerals, of the native glacial deposits in the southwestern Lockport area likely permits recharge of the upper bedrock aquifer by infiltration. Recharge of deeper bedrock aquifers by infiltration through the floor of the nearby quarry and Erie Barge Canal is also expected to occur.
Groundwater within the Lockport Group occurs primarily in the secondary porosity features such as weathered surface fractures, bedding planes, vertical joints, and small cavities and vugs. The principle control on groundwater flow, however, is the vertical joints and horizontal bedding
Final Sampling and Analysis Plan, Volume 1 – Field Sampling Plan Former Guterl Specialty Steel Corporation FUSRAP Site, Lockport, New York
1-12 01/18/07
plane fractures. The latter are the primary groundwater flow pathways in the Lockport Group and are areally extensive over several miles (Johnson, 1964; Yager and Kappel, 1987). Johnson (1964) identified seven such zones in the Niagara Falls area. Similar zones are likely to be found in the Lockport area but have not been extensively studied, or correlated with those in Niagara Falls. Some horizontal groundwater flow also occurs through small cavities and vugs (Woodward-Clyde and Conestoga-Rovers and Associates, 1992). Vertical movement of groundwater also occurs, especially in the upper 10 to 25 ft of rock where vertical fractures, created by stress relief from tectonic events, glacial rebound (Gross and Englelder, 1991), and quarrying operations (NYSDEC, 2000) have been enlarged by post-glacial fluvial exposure and fracture/joint dissolution. Vertical movement of groundwater within the Lockport Group is quite prevalent, with both upward and downward gradients observed (Woodward-Clyde and Conestoga-Rovers & Associates, 1992). Where horizontal and vertical fractures intersect, the water bearing capacity of the bedrock is substantially increased. Although such areas have been identified in the Niagara Falls area, little investigation has been conducted to identify such features in the immediate Lockport area.
1.4.3.2 Site Hydrogeology According to NYSDEC (2000), groundwater occurs in the fill and native soils of the overburden, and in the shallow bedrock. This report concludes that groundwater flow in both the overburden and bedrock zones appears to flow outward from a northeast-southwest trending groundwater divide centered over the landfill. Groundwater west of this divide appears to flow west toward the dolostone quarry, and groundwater east of this divide appears to flow east toward the Erie Barge Canal. Additional conclusions drawn by NYSDEC include that the two water-bearing zones appear to be hydraulically well-connected, and each zone exhibits definable seasonal water level fluctuations. By comparing the limited groundwater elevation data from existing Site wells, groundwater elevation data collected from wells in the summer (August 14, 1997) are uniformly lower than groundwater elevation data collected from wells in the spring (April 20, 1998).
1.4.3.2.1 Unconsolidated Material Five overburden monitoring wells have been installed at the Site, all of which are located in the Landfill Area. Only a small data set of water level measurements exist for these wells. No site-specific hydraulic conductivity data were located for these wells.
The available overburden groundwater data appear to indicate that fluctuations due to precipitation can be expected; i.e., in general, water levels will be higher during wet-weather conditions and lower during the relatively dry summer and fall months. At the Landfill Area, water level fluctuations up to three ft were observed in overburden monitoring wells.
1.4.3.2.2 Bedrock Five upper bedrock monitoring wells have been installed at the Site, all of which are located in the Excised Area. Only a small data set of water level measurements exist at the Site. No site-specific hydraulic conductivity data were located for these wells.
Like the overburden hydrogeologic zone, upper bedrock zone groundwater data appear to indicate that fluctuations due to precipitation can be expected; i.e., in general, water levels will be higher during wet-weather conditions and lower during the relatively dry summer and fall
Final Sampling and Analysis Plan, Volume 1 – Field Sampling Plan Former Guterl Specialty Steel Corporation FUSRAP Site, Lockport, New York
1-13 01/18/07
months. At the Excised Area, water level fluctuations up to two ft were observed the in bedrock monitoring wells.
1.4.3.2.3 Surface Water Based on an assessment of available information, surface water at the Site is largely unmanaged. Surface water can be considered to occur in two forms at the Site: storm water runoff, and standing or ponded water resulting from generally poor drainage patterns. Earth Tech suggests that the generally poor drainage patterns are a result of generally poor management of filling, landfilling, and grading activities at the site. USACE also notes “In general, this area of Lockport is found to have poor drainage. Due to low soil permeability, there is a high potential to collect water from precipitation and overland drainage” (USACE, 2001b; p 5).
Since storm water runoff is unmanaged, i.e., no storm sewers reportedly exist at the Site, runoff is expected to move as sheet flow from topographic highs to topographic lows. Two prominent topographic lows are apparent at the property: one at the northeastern corner of the Site (north of the Excised Area); and, another south-southwest of the landfill. USACE notes that “Drainage off the Site is to the north. During periods of high precipitation, overland runoff flowing to the north could reach Gulf Creek, a tributary of Eighteen Mile Creek” (USACE, 2001b, p. 5). The landfill is poorly graded, and has been observed to exhibit pockets of standing water (e.g., NYSDEC, 1991). Storm water that falls within the buildings of the Excised Area can be considered to be trapped, and subject to evaporation or infiltration within and around the building footprints.
No regulated wetlands have been identified at the Site. FBDU (1981) noted that the Site is not in a floodplain; but do not specifically mention the presence or absence of wetlands. NYSDEC (1988; citing Doleski, 1980) notes that there is a low-lying wet area to the west and southwest of the Site (the Landfill Area, which was the ‘site’ studied), but states that “this area is not classified as a regulated wetland.” However, this assessment is now somewhat dated, and should be repeated to confirm the current status. The Site does not contain any streams and has no visible connection to other surface water bodies (NYSDEC, 1988), including the Erie Barge Canal located south-southeast of the Site. Historic documents indicate that a cooling water intake and an oil/water separator were located in close proximity to the Erie Barge Canal, and overflows from the oil/water separator may have reached the Erie Barge Canal.

Final Sampling and Analysis Plan, Volume 1 – Field Sampling Plan Former Guterl Specialty Steel Corporation FUSRAP Site, Lockport, New York
1-14 01/18/07
This page intentionally left blank.

Final Sampling and Analysis Plan, Volume 1 – Field Sampling Plan Former Guterl Specialty Steel Corporation FUSRAP Site, Lockport, New York
2-1 01/18/07
2 PROJECT ORGANIZATION AND RESPONSIBILITIES The overall project organization and responsibilities of key personnel are described in the following sections. A flowchart depicting project organization is shown in Figure 2-1.
2.1 PROGRAM MANAGER The Program Manager manages the overall cost and schedule performance and provides oversight on technical issues pertaining to the projects under the USACE Buffalo District general contract W912P4-05-D-0001. His duties include oversight to ensure that all contractual requirements are properly satisfied; identification and preparation of requests for changes in the project scope, schedule, or budgetary baselines; and final resolution of any conflict identified during project performance.
2.2 PROJECT MANAGER The Project Manager manages the overall performance and quality of the delivery order project. This individual oversees the Site Supervisor in meeting project goals and objectives in a quality and timely manner and reports to the Program Manager. This individual also will serve as the primary point of contact for the Buffalo USACE Project Manager. The Project Manager will develop, monitor, and fill project staffing needs, delegate specific responsibilities to project team members, and coordinate with administrative staff to maintain a coordinated and timely flow of project activities. In coordination with the Site Supervisor and the QA/QC Officer, this individual will address issues including identification of non-conformances and verification of corrective action.
2.3 SITE SUPERVISOR The Site Supervisor is responsible for assisting the Project Manager in all aspects of project control and oversight and serves as a secondary point of contact for the Buffalo USACE Project Manager. In addition, he is responsible for implementing field activities conducted during the project in accordance with established project procedures and protocols and serves as the field QA/QC supervisor. This individual is responsible for the coordination of field personnel activities, management of investigation derived wastes, field documentation, and preparation of field change orders if required. The Site Supervisor reports directly to the Project Manager. The Site Supervisor is also responsible for implementation and documentation of all project QA/QC protocols during field activities and his role includes being the field Chemical Quality Control (CQC) Supervisor. In this capacity he will direct and implement the various components of the Contractor Chemical Quality Control (CCQC) program as identified in the SAP. This will include, but not be limited to the documentation of field QC activities and the completion of Daily Chemical Quality Control Reports (DCQCRs). The CCQC Representative reports directly to the QA/QC Officer, but will inform the Project Manager of all information and decisions reported.
Final Sampling and Analysis Plan, Volume 1 – Field Sampling Plan Former Guterl Specialty Steel Corporation FUSRAP Site, Lockport, New York
2-2 01/18/07
2.4 RI FIELD GEOLOGIST The RI Field Geologist is responsible for ensuring that the goals of the RI field data collection program are met. This individual is responsible for ensuring that the field program is performed in a manner that provides the quantity and quality of technical data required for project success. The RI Field Geologist will have site knowledge and history required to make technical decisions for the addition, deletion, or relocation of sample locations and/or numbers. This individual is responsible for the proper technical performance of drilling operations and field sampling activities, adherence to required sample, custody and other related QA/QC field procedures. The RI Field Geologist reports directly to the Site Supervisor.
2.5 QUALITY ASSURANCE/QUALITY CONTROL OFFICER The QA/QC Officer is responsible for overall project QA/QC oversight in accordance with the requirements of the QAPP, other work plan documentation, and appropriate management guidance. This individual will be responsible for participating in project field activity readiness reviews; approving variances during field activities before work continues; approving, evaluating, and documenting the disposition of non-conformance with project documents, overseeing and approving any required project training; and designing and supervising implementation of audit/surveillance plans. The QA/QC Officer reports directly to the Project Manager but will inform the Site Supervisor and RI Field Geologist of all information and decisions reported.
2.6 SITE SAFETY AND HEALTH MANAGER The Site Safety and Health Manager (SSHM) is the member of the Earth Tech Safety, Health and Environmental Department assigned to oversee health and safety requirements for the project and provide any needed technical support. The SSHM is responsible for confirming that health and safety procedures designed to protect personnel are maintained throughout the field activities conducted for the project. This will be accomplished by strict adherence to the project Site Safety and Health Plan (SSHP). This individual will have the authority to stop fieldwork if health and/or safety issues arise that are not immediately resolvable in accordance with the SSHP. The SSHM will coordinate with the Health Physicist on matters that involve, or might involve, health physics issues. The SSHM reports directly to the Project Manager.
2.7 SITE SAFETY AND HEALTH OFFICER The Site Safety and Health Officer (SSHO) is the Earth Tech employee assigned to oversee daily health and safety requirements for the field investigation. The SSHO is responsible for making health and safety decisions, for specific health and safety activities, and for verifying the effectiveness of the health and safety program. The SSHO’s qualifications include, at a minimum, current Hazardous Waste Operations and Emergency Response (HAZWOPER) training, HAZWOPER Supervisor training, experience with similar projects, knowledge of and understanding of the project SSHP, and the ability to use the required monitoring equipment. The SSHO will coordinate with the Health Physicist on matters that involve, or might involve, health physics issues. The SSHO reports directly to the SSHM.
Final Sampling and Analysis Plan, Volume 1 – Field Sampling Plan Former Guterl Specialty Steel Corporation FUSRAP Site, Lockport, New York
2-3 01/18/07
2.8 HEALTH PHYSICIST The Health Physicist is responsible for providing technical direction and support to the project related to human health issues, dose assessments and radiological data needs and interpretations. Specific responsibilities include developing risk methodologies, providing or reviewing portions of the SSHP, providing or reviewing the radiological data requirements and sampling methodology and developing responses to radiological issues associated with the Site. The Health Physicist reports directly to the Project Manager.
2.9 SITE RADIATION SAFETY OFFICER The Site Radiation Safety Officer (SRSO) is responsible for confirming that radiation safety procedures designed to protect personnel are maintained throughout the field activities conducted for the project. This will be accomplished by strict adherence to the project Radiation Protection Plan (RPP) provided as an attachment to the SSHP. This individual will have the authority to stop fieldwork if health and/or safety issues, as they apply to radiological issues, arise that are not immediately resolvable in accordance with the SSHP. The SRSO reports directly to the Health Physicist.

Final Sampling and Analysis Plan, Volume 1 – Field Sampling Plan Former Guterl Specialty Steel Corporation FUSRAP Site, Lockport, New York
2-4 01/18/07
This page intentionally left blank.

Final Sampling and Analysis Plan, Volume 1 – Field Sampling Plan Former Guterl Specialty Steel Corporation FUSRAP Site, Lockport, New York
3-1 01/18/07
3 PROJECT SCOPE AND OBJECTIVES This section of the FSP describes project objectives, tasks, Applicable or Relevant and Appropriate Requirements (ARARs), and the project schedule.
3.1 PROJECT DATA QUALITY OBJECTIVES The goal of the Site RI/FS is to generate data of known and sufficient quality and quantity, with quantitation levels low enough to meet pertinent standards, ARARs, and remediation goals, with the long-term objective being the selection of a protective remedy that satisfies CERCLA. To achieve this, it is necessary to obtain data that are sufficient to determine nature and extent, risk, and fate and transport of contaminants in a RI, conducted utilizing CERCLA guidance (USEPA, 1988). A secondary objective of this data collection may be to produce data sufficient to develop an adequate volume estimate of contaminated media, as well as to assist in the development of project cost estimates, to support the feasibility study. The data may also be used to identify appropriate disposal facilities for wastes generated during site investigation activities and during RA.
A preliminary identification of data quality objectives (DQOs) and ARARs is presented in the report Preliminary Identification of Data Quality Objectives and Applicable, Relevant, and Appropriate Requirements, Former Guterl Specialty Steel Corporation FUSRAP Site (USACE, 2005c).
As part of the planning phase for the Site RI, a TPP Meeting was conducted August 9 and 10, 2005. The purpose of the TPP Meeting was to gather the project stakeholders for informational discussions, and to begin to develop site-specific project DQOs for the RI/FS. A total of 21 project DQOs were developed for the RI/FS during the TPP Meeting, and are summarized in the Data Gap Analysis Report (USACE, 2006a).
Several of the project DQOs have been accomplished prior to development of this SAP, or are not directly applicable to the RI field data collection and management program. The project DQOs that are directly applicable to this FSP are listed below and discussed in more detail in Table 3-1. The project DQOs applicable to this RI include (grouped by topic with TPP Meeting numbering maintained for continuity): Overarching Objectives:
1. Determine the nature and extent of MED/AEC related constituents present at the Site (i.e., uranium, thorium, and radium2 and the media and locations in which they are present).
2. Acquire information to define the fate and transport of contaminants from the Site.
4. Provide sufficient characterization data to allow completion of subsequent FS, RD,
2 Radium was not included in the constituent list developed during the TPP Meeting, but was added to the list of constituents of potential concern during development of this FSP in response to further technical evaluation of the Site. This note applies to each of the project DQOs where radium is listed. Additional detail is provided in Section 3.4.
Final Sampling and Analysis Plan, Volume 1 – Field Sampling Plan Former Guterl Specialty Steel Corporation FUSRAP Site, Lockport, New York
3-2 01/18/07
and RA.
Operations:
6. Identify the underground utility system within the Site, including if possible, utilities in place at the time of AEC contracted efforts and utilities installed after the AEC contracted efforts. Includes both between building and within building utilities.
Nature and Extent:
9. Define nature and extent of isotopic uranium, thorium, and radium in surface soils, subsurface soils, and buildings to support risk assessment (using Nuclear Regulatory Commission (NRC) screening levels for human health and DOE guidance for ecological [DOE, 2002]) and development and evaluation of FS alternatives (volume determination).3
10. Determine whether groundwater has been impacted by isotopic uranium, thorium, and radium above screening levels; and if so, determine nature and extent to support risk assessment, and development and evaluation of FS alternatives.
11. Determine whether surface water and sediments have been impacted by isotopic uranium, thorium, and radium above screening levels.
13. Determine if isotopic uranium, thorium, and radium has contaminated underground utilities.
Risk Assessment/Feasibility Study:
14. Determine the magnitude of any chemical contamination to support establishing transportation and disposal requirements (e.g., waste classification) and associated costs to be included in various FS alternatives.
15. Conduct an inventory of building content/structures to support FS alternatives and evaluations.
19. Gather sufficient data to complete a Baseline Human Health Risk Assessment (HHRA) for human health and a screening level ecological risk assessment.
3.2 TASK DESCRIPTION Earth Tech has developed this FSP to specify the scope and provide for documentation of the RI field data collection program. The FSP has been developed prior to the start of field sampling activities and describes field investigation methods and procedures, including equipment decontamination. In addition, the FSP includes plans for mobilization to the Site, disposal plans for investigation derived wastes (IDW) and field personnel organization chart and responsibilities.
3 Since these elements are naturally occurring, a background concentration will be established for each radioisotope. The background concentration for each will be added to the appropriate NRC-provided screening level to derive an effective (working) screening level for RI purposes.
Final Sampling and Analysis Plan, Volume 1 – Field Sampling Plan Former Guterl Specialty Steel Corporation FUSRAP Site, Lockport, New York
3-3 01/18/07
The general approach in preparing the FSP is to first review data collected from previous investigations and other available sources to initially delineate the areas of concern. Earth Tech conducted a data gap analysis for the project Site that included evaluation of ten historical data reports and three additional related reports. Earth Tech prepared a Data Gap Analysis Report (USACE, 2006a), referred to herein as DGAR, that summarized the findings of the data gap analysis. The DGAR was organized by investigative areas (IA). Earth Tech also prepared a Data Gap Analysis Summary Document (USACE, 2006b), organizing data gaps by media. The media evaluated include soil/sediment, groundwater, surface water, and buildings surfaces. Earth Tech also considered two additional categories – sewers/drains and “other data gaps” (i.e., not media specific).
The data gap analysis identified documented, or in some cases a strong probability for, MED/AEC (i.e., FUSRAP-eligible) radiological contamination within seven of the eight IAs, including each of the media evaluated. Recommendations for additional data collection to fill the data gaps and develop data of sufficient quality and quantity to meet the project objectives have been presented in detail for each media, and are summarized in Section 5.
3.3 Investigative Areas During the TPP Meeting, the concept of developing IAs to better manage the assessment of existing data and future data needs was introduced and developed. The list of IAs was refined during the preparation of project plans, to better provide investigative flexibility. The organizational benefit of developing IAs is demonstrated by developing a correlation between the Conceptual Site Model (CSM) and data gap analysis. These IAs may also be useful for developing exposure units (EU) for risk assessment purposes.
IA01 Excised Area – Building Surfaces and Interiors (including Building 24)
IA02 Excised Area – Building Exterior Areas
IA03 Landfill Area
IA04 NCIDA Property (Allegheny operations area, not including Excised Area, Landfill Area, or Building 24)
IA05 Railroad Right-of-Way North of Site Proper
IA06 Off-site Northeast Properties
IA07 Groundwater
IA08 Site Utilities (sewers and drains)
IA09 Erie Barge Canal (adjacent to the Site)
IA10 Lot 4.1 (“Lombardi Property”)
Final Sampling and Analysis Plan, Volume 1 – Field Sampling Plan Former Guterl Specialty Steel Corporation FUSRAP Site, Lockport, New York
3-4 01/18/07
Figure 1-2 depicts the Site IAs. A detailed discussion of the extent and concerns associated with each of the IAs is presented in Section 4.2.2 of this FSP.
3.4 CONSTITUENTS OF POTENTIAL CONCERN The initial list of constituents of potential concern (COPCs) was presented in the DGAR (USACE, 2006a; Section 2.4) and consisted of U-234, U-235, U-238, and Th-232. During the development and review of project plans, additional site-specific COPCs have been identified and will be addressed during this RI/FS. These additional radiological isotopes are Th-228 and Th-230, and radium (Ra)-226 and Ra-228. These isotopes were added to the COPC list based on their being key daughter products of the initial COPC list; potential impurities in the raw materials processed at Guterl; and risk assessment needs.
Therefore, for this SAP (including both the FSP and QAPP), the COPC list consists of:
• Isotopic uranium (U-234, U-235, and U-238)
• Isotopic thorium (Th-228, Th-230, and Th-232)
• Ra-226 and Ra-228.
3.5 APPLICABLE OR RELEVANT AND APPROPRIATE REQUIREMENTS
A preliminary identification of ARARs is presented in the report Preliminary Identification of Data Quality Objectives and Applicable, Relevant, and Appropriate Requirements, Former Guterl Specialty Steel Corporation FUSRAP Site (USACE, 2005c). The preliminary list of ARARs will be evaluated throughout the RI process, and will be updated, if necessary, in the RI Report.
3.6 SCHEDULE A summary schedule for the activities to be performed during the RI data acquisition phase of this project is provided in Figure 3-1. The proposed schedule is based upon the following assumptions:
• Approval of the SAP (i.e., FSP and QAPP) by USACE and issuance of Notice to Proceed on February 28, 2007
• Availability of sufficient funding from the Federal Government for the performance of work
• Obtaining access agreements for the Site and neighboring properties (as needed) by March 29, 2007
If each of the above-listed items is completed by the anticipated dates shown, it is anticipated that RI field work will begin on March 29, 2007.
Final Sampling and Analysis Plan, Volume 1 – Field Sampling Plan Former Guterl Specialty Steel Corporation FUSRAP Site, Lockport, New York
4-1 01/18/07
4 NON-MEASUREMENT DATA ACQUISITION Several types of non-measurement data have been (and may continue to be) acquired during the course of the Site RI. Non-measurement data types include historic records and facility operation documents, historic aerial photographs, land ownership deeds and legal descriptions, and historic analytical data from previous site investigations.
4.1 RECORDS REVIEW AND EVALUATION Earth Tech conducted a site-specific records review and evaluation utilizing documents provided by Buffalo District USACE. The reports and data generated from the previous investigations were reviewed for applicability and potential usefulness going forward in the RI process. The evaluation is summarized in Section 1.3 of this FSP, and was the first step of the data gap analysis.
4.2 RI TASK 4: DATA GAP ANALYSIS Earth Tech performed a data gap analysis to provide a summary of existing data, including an assessment of the existing data for usability in the RI/FS. The usability assessment consisted of determining if the data generated to date is of sufficient quantity and quality for its intended uses. These uses include both the purposes for which the data were originally generated; and the extent to which these data are also adequate for current and future uses. The results of this review are briefly presented in this report. Complete results and a more detailed description of the evaluation methodology are presented in the Data Gap Analysis Report (USACE, 2006a).
An important aspect of the data gap analysis was the conduct of a TPP Meeting to gather the project stakeholders for informational and technical discussions regarding the project details and objectives. The TPP Meeting for the Site was conducted August 9 and 10, 2005.
4.2.1 Preliminary Conceptual Site Model A preliminary CSM has been developed for the Site. The preliminary CSM helps the data evaluation process, and assists with the evaluation of the impacts of MED/AEC operational history at the Site on the distribution, and potential fate and transport mechanisms of MED/AEC related wastes. Figure 4-1 represents the Preliminary CSM and Pathways for Human Exposure at the Site.
The preliminary CSM helps to identify and visually organize potential exposure pathways and receptors and identifies those pathways, which may be complete or incomplete, for the purpose of the data needs determination. The preliminary CSM will be refined utilizing additional site information collected during the RI. The elements of the preliminary CSM are:
• Contamination Mechanism (Rolling Mill Operations)
• Source Media (Building Surfaces and Surface Soil)
• Transportation Mechanisms (Wind, Surface Water Runoff/Sewers and Drains, Leaching, and Land Disposal/Disturbance)
• Exposure Media (Building Surfaces, Soil (Surface and Subsurface), Surface Water/Sediment, and Groundwater)
Final Sampling and Analysis Plan, Volume 1 – Field Sampling Plan Former Guterl Specialty Steel Corporation FUSRAP Site, Lockport, New York
4-2 01/18/07
• Exposure Routes (Ingestion, Dermal Contact, Inhalation (Fugitive Dust), External Radiation, and Ingestion of Produce)
• Current and Future Human Receptors (Trespasser, On-Site Worker, Construction Worker, Commercial/Industrial, and Residential)
4.2.2 Investigative Areas As noted in Section 3.3 of this FSP, IAs have been established to better manage the assessment of existing data and future data needs. A more detailed discussion of each of the ten IAs (as listed in Section 3.3 and illustrated on Figure 1-2) is presented below.
4.2.2.1 Investigative Area 01 (IA01) - Excised Area – Building Surfaces and Interiors (Including Building 24)
The buildings included in IA01 are the nine buildings within the Excised Area; several of the buildings are attached and appear to be a single building. The nine buildings in the Excised Area are Buildings 1 and 2; the attached (co-joined) buildings 3, 4, 5, 6, 8, and 9; and Building 35. Building 24, which is attached to the north side of Building 8, is not part of the Excised Area but is discussed within this section due to the impact of MED/AEC operations on the south end of the building. Table 4-1 provides a summary of building construction date, floor space, and use.
4.2.2.2 Investigative Area 02 (IA02) - Excised Area – Building Exterior Areas The exterior grounds of the Excised Area include a crane yard to the east of Buildings 1 and 2; an alleyway between Buildings 2 and 3; an alleyway surrounding Building 5; a courtyard area between Buildings 3 and 24; and the exterior loading dock area to the west of Buildings 6 and 8 and north of Buildings 4 and 9.
4.2.2.3 Investigative Area 03 (IA03) – Landfill Area The Landfill Area is a Class 2 NYSDEC Inactive Hazardous Waste Site (ID 9-32-032). It consists of an 8.6-acre area located in the northwest portion of the Site. Available records indicate that from 1962 to 1980 the landfill was used for the disposal of wastes such as slag, baghouse flue dust, foundry sand, and other plant rubbish. The operators of the facility during that period include Simonds (to 1963), Wallace-Murray Corporation (1963 to 1972), and Guterl Specialty Steel Corporation (1972 to 1980). Undeveloped property is present to the west and south of the landfill, and these areas exhibit marsh characteristics (at least seasonally). A private light industrial property (Lombardi) is present north of the northeast corner of the landfill.
4.2.2.4 Investigative Area 04 (IA04) – Niagara County Industrial Development Agency (NCIDA) Property (Excluding Excised Area, Landfill Area, and Building 24)
IA04 comprises the areas of the USACE SOW-defined project Site, including those areas of the primary plant Site that are not included in the Excised Area, the Landfill Area, or Building 24. ORISE (1999) discovered potential MED/AEC-related wastes north of the Excised Area and
Final Sampling and Analysis Plan, Volume 1 – Field Sampling Plan Former Guterl Specialty Steel Corporation FUSRAP Site, Lockport, New York
4-3 01/18/07
adjacent to the northeastern corner of the Landfill Area. During the July 1996 USEPA radiological survey, soil on the Allegheny property was determined to be contaminated.
4.2.2.5 Investigative Area 05 (IA05) – Railroad Right-of-Way North of Site IA05 includes the narrow, former railroad right-of-way corridor extending north from the northwest corner of the main plant area to NY Route 31. The former railroad corridor was included as an area of interest during the TPP Meeting. Available records indicate that the MED/AEC materials arrived at, and left, the facility via rail car. Based on available information, it appears materials were delivered to, or picked up at, the loading dock located at the west side of Building 6 (ORNL, 1978). Simonds did grant an easement to NY Central Railroad, and Simonds indicated in an August 1949 memorandum to the AEC, that the NY Central RR was the railroad company that transported materials from Simonds (Simonds Saw, 1949). Transport of radioactive materials was allowed by law and in fact there were a number of regulations and guidelines for transportation of such materials by various means. For example, an adequately trained AEC representative was required to accompany shipments of radioactive materials (AEC, 1958).
4.2.2.6 Investigative Area 06 (IA06) - Off-site Northeast Properties During the TPP Meeting, the status of three parcels of land that were historically owned by Simonds but are located off the FUSRAP-defined Site property was discussed. The lots are shown on Tax Map 108.20, Lots 27 and 29, Lots 23 and 25, and Lots 15, 17, 19, and 21 (Niagara County Real Property Tax Services, May 2004). The lots are not contiguous to the rest of the Site, and are not in an area (e.g., railroad right-of-way) likely to have been affected by the manufacturing, processing, storage, or transportation of MED/AEC materials at the Site. Based on available records, the parcels were sold by Simonds to third parties in February 1943; i.e., several years before Simonds began MED/AEC activities (Niagara County Clerks Department, 1943a, 1943b, and 1943c). Therefore, it does not appear reasonable that these parcels would be located in an area that would have been affected by Simonds’ MED/AEC activities. As a result, Earth Tech recommends removing these properties, and thus this IA, from further consideration under the FUSRAP investigation. No additional investigations are planned for this IA.
4.2.2.7 Investigative Area 07 (IA07) – Groundwater IA07 consists of the unconsolidated overburden and the uppermost bedrock zone at the Site. Previous investigations have detected the presence of radiological contamination within overburden groundwater at the landfill (gross alpha slightly above guidance value); no isotopic data have been developed for the overburden groundwater zone. The source and extent of the overburden groundwater contamination has not yet been determined. No radiological data have been developed for the bedrock groundwater zone.
4.2.2.8 Investigative Area 08 (IA08) – Site Utilities (Sewers and Drains) Only a limited amount of data exists to define the presence and status of Site utilities and drains. For the purpose of this report, IA08 is intended to include storm sewers, sanitary sewers, trenches constructed for sewer, gas, water, or electric service, and Excised Area building interior floor trenches or drains.
Final Sampling and Analysis Plan, Volume 1 – Field Sampling Plan Former Guterl Specialty Steel Corporation FUSRAP Site, Lockport, New York
4-4 01/18/07
4.2.2.9 Investigative Area 09 (IA09) – Erie Barge Canal This IA was evaluated in the DGAR within IA08; however, during development of the FSP a technical adjustment was made to identify this potentially affected area as a separate IA. The Erie Barge Canal IA is defined as surface water and sediment within the segment of the Erie Barge Canal that is just beyond the most upstream and most downstream IA08 discharge points to the Canal. No prior radiological data were found for surface water or sediment over this potentially impacted segment of the Canal.
4.2.2.10 Investigative Area 10 (IA10) – Tax Lot 4.1 (Lombardi Property) This IA was evaluated in the DGAR within IA03 and IA05; however, during development of the FSP a technical adjustment was made to identify this potentially affected area as a separate IA. Lot 4.1 (Tax Map 108.20; Niagara County Real Property Tax Services, 2004) is located immediately north of the northeast portion of IA03, and immediately west of the southwest portion of IA05. This privately owned parcel was partially investigated in 1999 by NYSDEC. Field inspection (NYSDEC, 1999) and analysis of aerial photos (USACE, 2006a) identified the potential for FUSRAP-related materials to have been inadvertently moved onto this IA as a result of land development activity. The IA is defined by the tax lot boundaries for the parcel. In prior reports, this IA has been referred to as the “Lombardi Property.”
Final Sampling and Analysis Plan, Volume 1 – Field Sampling Plan Former Guterl Specialty Steel Corporation FUSRAP Site, Lockport, New York
5-1 01/18/07
5 REMEDIAL INVESTIGATION DATA COLLECTION PROGRAM
5.1 GENERAL The RI data collection program is based on a progression of evaluation of information from the preceding phases of work and is designed to utilize identified data collection options to meet the identified project objectives and data needs. Brief discussions of specific data collection rationale and approaches are included in the following sections.
• Section 5.2 describes the bases for the design of the radiological survey program.
• Section 5.3 describes the classification of Site areas and facilities.
• Section 5.4 describes the characterization survey design and investigation methods.
• Section 5.5 describes investigation derived waste disposition.
• Section 5.6 summarizes the level of effort.
5.1.1 Observational Approach An observational approach with respect to the extent of radiological surface soil, subsurface soil, groundwater, surface water, sediment, and building material contamination will be employed during sampling activities conducted within applicable IAs. Additional detail regarding data management related to the characterization activity is provided in Section 6.
The observational approach for surface soil and subsurface soil samples incorporates the use of a real-time scan of the recovered soil core using a scintillation detector to screen segments of the core and identify segments for analysis at the on-site gamma spectroscopy laboratory. The on-site gamma spectroscopy laboratory will provide near real-time quantitative radiological data for site COPCs. Field screening data and onsite laboratory data will be evaluated to determine if the extent of radiological soil contamination has been defined. If the extent has not been defined, the installation of additional soil borings and collection of additional soil samples will be considered in coordination with USACE.
Two sampling events are planned for groundwater wells. The observational approach for groundwater samples includes an initial sampling event for all new and existing monitoring wells to occur early in the field investigation schedule4. The groundwater samples will be analyzed using fixed laboratory alpha spectroscopy (U and Th isotopes) and EPA method 903/904 (Ra-226 and Ra-228). Laboratory data will be evaluated immediately upon receipt. In this manner, the need for additional monitoring wells, parameters, and/or sampling events will be considered while the field investigation is still active. The project team will review the first round data prior
4 “Existing monitoring wells” refers to wells installed by Simonds Saw in 1981 and NYSDEC in 1995. NYSDEC completed the first phase of a remedial investigation in November 2006 focusing on the Excised Area and the Landfill Area, during which several new groundwater monitoring wells were installed. Earth Tech and USACE will review the new well locations and construction details, and may elect to include appropriately located and constructed wells in this RI. The actual number and location of wells to be considered will be determined during the mobilization phase of the RI field effort. USACE will negotiate access to the wells with NYSDEC.
Final Sampling and Analysis Plan, Volume 1 – Field Sampling Plan Former Guterl Specialty Steel Corporation FUSRAP Site, Lockport, New York
5-2 01/18/07
to implementation of the second round. Based on this review, the project team may, as appropriate, reduce the analyte list or add analytes necessary for fate and transport, risk assessment, or other project data needs. It is possible that secondary sampling locations may be required if primary sample results indicate the presence of contamination within soil and/or groundwater and if the associated extent of contamination has not been defined based on available data. Every effort will be made to limit secondary sampling to locations and sample intervals necessary to completely define the extent of radiological soil and groundwater contamination at the Site.
The observational approach for surface water and sediment samples incorporates the use of fixed laboratory gamma spectroscopy, alpha spectroscopy (U and Th isotopes), and EPA method 903/904 (Ra-226 and Ra-228) to provide radiological data. Similar to the groundwater approach, surface water and sediment samples will be collected early in the RI field schedule so that analytical data can be evaluated to determine if the extent of radiological contamination has been defined while the RI is ongoing. If the extent has not been defined, the collection of additional data points will be considered in coordination with USACE.
The observational approach for building materials also incorporates the use of fixed laboratory alpha spectroscopy to provide radiological data. The use of field gamma spectroscopy is not considered appropriate for this matrix (comprised of a variety of materials, such as concrete, brick, firebrick, etc.). Analytical data will be evaluated upon receipt to determine if the extent of radiological contamination has been defined. If the extent has not been defined, the collection of additional data points will be considered in coordination with USACE.
5.1.2 General Characterization Several types of data will be collected during the RI to support general site characterization activities. The types of general characterization data include soil geotechnical parameters, RI IDW characterization, groundwater aquifer properties, geophysical utility clearance surveys, and civil location surveys.
Disturbed and undisturbed (if possible) soil samples will be collected and submitted for laboratory analyses for the following geotechnical parameters:
• Atterberg Limits (ASTM D 4318)
• Grain Size (ASTM D 422-63(2002))
• Moisture Content (determined from radiological analysis dry weight calculations)
• Hydraulic Conductivity (ASTM D 5084-03)
• Bulk Density (determined from soil core volume and weight)
• Effective Porosity (estimated from literature for soil types identified and site-specific geotechnical testing)
Soil samples will be collected to allow for characterization of the listed parameters for three distinct soil types during the RI (fill, glaciolacustrine, and till). Data resulting from geotechnical characterization will support potential contaminant fate and transport modeling, groundwater modeling, and evaluations of preliminary remedial alternatives.
Final Sampling and Analysis Plan, Volume 1 – Field Sampling Plan Former Guterl Specialty Steel Corporation FUSRAP Site, Lockport, New York
5-3 01/18/07
Investigation derived waste (IDW) samples will be collected for a limited number of parameters. Waste characterization sample parameters are based on the potential waste acceptance criteria of potential disposal sites. Anticipated IDW sample types include soil (drill cuttings, excess sample volume, etc.) and liquid (monitoring well development purge water and equipment decontamination fluids).
Data will be collected for groundwater aquifer characterization during the RI. Slug tests will be conducted for existing wells and new wells. Water level measurements will be collected during one or more synoptic events to provide information on groundwater flow patterns. Additional groundwater characterization program details are presented in Section 5.4.4 of this FSP.
Limited geophysical surveys will be conducted to support underground utility clearance activities during the RI. Utility clearance activities are discussed in more detail in Section 5.4.3.2.1 of this FSP.
Civil location surveys will be conducted for completed sample locations, monitoring wells, and other Site features using total station and/or GPS methods. Preliminary field sample staking and locations will be measured using a sub-meter accurate portable GPS unit to allow for accurate mapping of field screening data in support of the RI observational approach. Civil location surveys are discussed in more detail in Section 5.4.7 of this FSP.
5.2 RADIOLOGICAL SURVEY PROGRAM The design of the Site RI radiological data collection program will follow, as a starting point, the model in the MARSSIM (NRC, 2000) for a characterization survey. However, as discussed in Section 5.4, the data collection program for this remedial investigation will devote the greatest effort on areas for which the nature and extent of contamination have the greatest uncertainty; that is, it will focus on defining the limits of contamination or the boundaries between contaminated and uncontaminated areas using observational methods to respond to real-time data analyses.
5.2.1 Characterization Surveys Previous surveys and reports (for example, FBDU, 1981; NYSDEC, 1994; NYSDEC, 1999; NYSDEC, 2000; ORISE, 1999; USACE, 2001; USACE, 2006; USEPA, 1998) have provided data that can be interpreted to show that portions of the Site can be classified as Class 1 or Class 2 for a MARSSIM final status survey; therefore, a characterization survey is warranted. Planning of the characterization survey is based on the historical site assessment and on scoping survey results. This type of survey is a detailed radiological environmental characterization of the area.
In general, the primary objectives of a characterization survey, which directly correlate with the RI project objectives, are to:
• Determine the nature and extent of the contamination
• Collect data to support evaluation of remedial alternatives and technologies
• Evaluate whether the survey plan can be optimized for use in the final status survey, as appropriate
• Support Remedial Investigation/Feasibility Study requirements
Final Sampling and Analysis Plan, Volume 1 – Field Sampling Plan Former Guterl Specialty Steel Corporation FUSRAP Site, Lockport, New York
5-4 01/18/07
• Provide input to the final status survey design
In particular, a specific objective of the present survey is to generate data that are sufficient to allow accurate estimation of radioactive waste disposal costs resulting from site remediation. These data will include estimated volumes, mass activity concentrations, and media types in order to identify disposal sites that may be suitable for disposal and the costs associated with disposal at those sites (for example, costs of special treatment, packaging, and transportation associated with a particular disposal site).
Section 2.4.4 of MARSSIM says, “The characterization survey is the most comprehensive of all the survey types and generates the most data. It includes preparing a reference grid, systematic as well as judgment measurements, and surveys of different media (for example, surface soils, interior and exterior surfaces of buildings, building and paving materials, cracks, crevices, drains, trenches, surface water, ground water, and sediments).”
The decision as to which media will be surveyed is a site-specific decision addressed in detail in the following sections.
5.2.2 Preliminary Survey Considerations The following discussion follows the guidance shown in Figure 5-1 (adapted from MARSSIM Figure 4.1).
5.2.2.1 Identify Contaminants As determined during preparation of the DGAR (USACE, 2006a) and as refined during the preparation of the project plans (see Section 3.4), the radioactive COPCs at the Site are isotopes of uranium (238U, 235U, and 234U), thorium (232Th), and radium (226Ra and 228Ra).
Additional data will be collected to evaluate the presence of enriched and recycled uranium. Presence of 236U indicates recycled uranium; enhanced abundances of 234U and 235U indicate enriched uranium. A limited number of samples (anticipated to be 12) will be selected from the offsite laboratory alpha spectroscopic analyses that have significantly elevated uranium activities to also undergo inductively coupled plasma – mass spectroscopy (ICP-MS) analysis for uranium isotopes to determine the relative abundances of 234U, 235U, U-236, and 238U to be used to evaluate the presence of recycled or enriched uranium. A similar number of background samples will also be analyzed by ICP-MS.
Gross alpha and gross beta radiation analyses will also be performed on the above samples for comparison to values from alpha spectroscopy and/or mass spectroscopy for COPC total alpha and total beta emissions.
5.2.2.2 Establish Screening Levels Section 2.6 of the DGAR presents screening levels adapted from other sources that will be used as the screening levels for this survey. Table 5-1 presents screening levels for building surfaces.5 Table 5-2 presents screening levels for soil (above local natural background) for the COPCs. Table 5-1 of the QAPP presents aqueous screening levels. 5 The radium isotopes are progeny in the thorium and uranium decay chains and, hence, Table 5-1 includes them with their parent radionuclides.
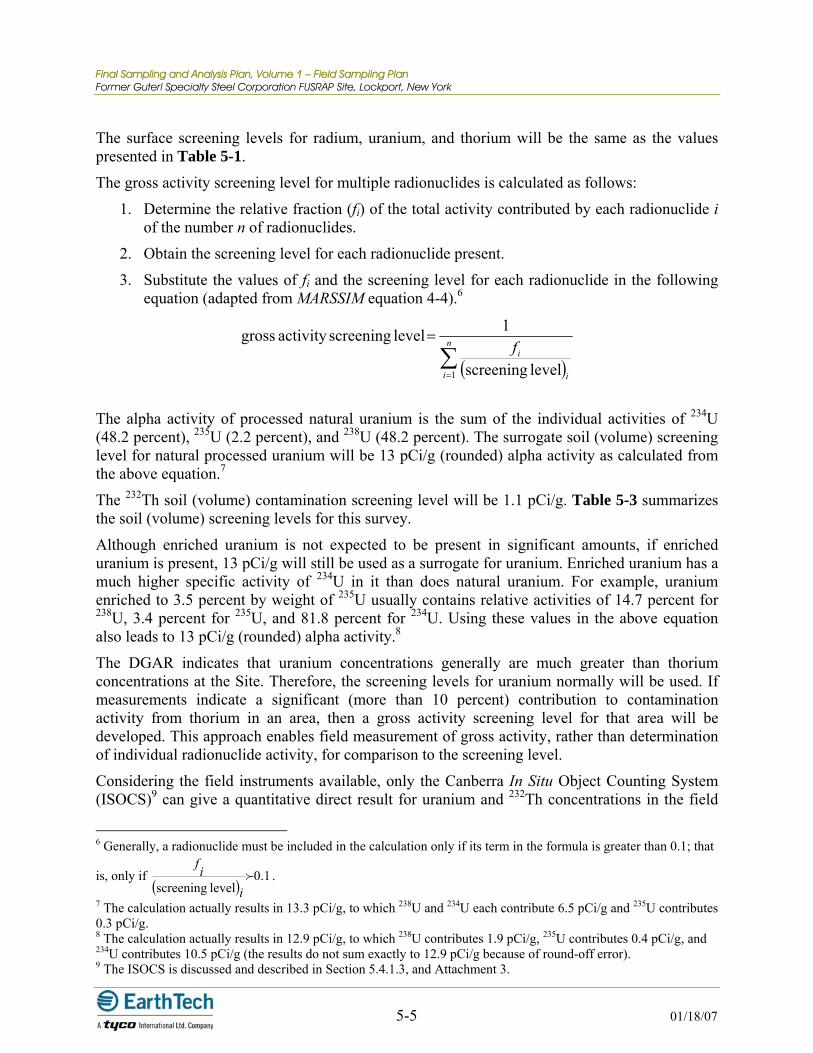
Final Sampling and Analysis Plan, Volume 1 – Field Sampling Plan Former Guterl Specialty Steel Corporation FUSRAP Site, Lockport, New York
5-5 01/18/07
The surface screening levels for radium, uranium, and thorium will be the same as the values presented in Table 5-1.
The gross activity screening level for multiple radionuclides is calculated as follows:
1. Determine the relative fraction (fi) of the total activity contributed by each radionuclide i of the number n of radionuclides.
2. Obtain the screening level for each radionuclide present.
3. Substitute the values of fi and the screening level for each radionuclide in the following equation (adapted from MARSSIM equation 4-4).6
The alpha activity of processed natural uranium is the sum of the individual activities of 234U (48.2 percent), 235U (2.2 percent), and 238U (48.2 percent). The surrogate soil (volume) screening level for natural processed uranium will be 13 pCi/g (rounded) alpha activity as calculated from the above equation.7
The 232Th soil (volume) contamination screening level will be 1.1 pCi/g. Table 5-3 summarizes the soil (volume) screening levels for this survey.
Although enriched uranium is not expected to be present in significant amounts, if enriched uranium is present, 13 pCi/g will still be used as a surrogate for uranium. Enriched uranium has a much higher specific activity of 234U in it than does natural uranium. For example, uranium enriched to 3.5 percent by weight of 235U usually contains relative activities of 14.7 percent for 238U, 3.4 percent for 235U, and 81.8 percent for 234U. Using these values in the above equation also leads to 13 pCi/g (rounded) alpha activity.8
The DGAR indicates that uranium concentrations generally are much greater than thorium concentrations at the Site. Therefore, the screening levels for uranium normally will be used. If measurements indicate a significant (more than 10 percent) contribution to contamination activity from thorium in an area, then a gross activity screening level for that area will be developed. This approach enables field measurement of gross activity, rather than determination of individual radionuclide activity, for comparison to the screening level.
Considering the field instruments available, only the Canberra In Situ Object Counting System (ISOCS)9 can give a quantitative direct result for uranium and 232Th concentrations in the field
6 Generally, a radionuclide must be included in the calculation only if its term in the formula is greater than 0.1; that
is, only if ( )
1.0level screening
f
iif .
7 The calculation actually results in 13.3 pCi/g, to which 238U and 234U each contribute 6.5 pCi/g and 235U contributes 0.3 pCi/g. 8 The calculation actually results in 12.9 pCi/g, to which 238U contributes 1.9 pCi/g, 235U contributes 0.4 pCi/g, and 234U contributes 10.5 pCi/g (the results do not sum exactly to 12.9 pCi/g because of round-off error). 9 The ISOCS is discussed and described in Section 5.4.1.3, and Attachment 3.
( )∑=
= n
i i
if1 level screening
1 level screeningactivity gross
Final Sampling and Analysis Plan, Volume 1 – Field Sampling Plan Former Guterl Specialty Steel Corporation FUSRAP Site, Lockport, New York
5-6 01/18/07
and it will be used whenever it appears necessary to differentiate uranium and thorium. Therefore, if 232Th contamination is encountered in significant amounts in soil or other bulk materials, the situation will require special consideration and analysis. As mentioned above, this is considered to be unlikely in most locations, but some exceptions were observed in previous surveys.
5.2.2.3 Classify Areas by Contamination Potential To make the best use of resources, MARSSIM places greater survey efforts on areas that have or had the highest potential for contamination. This is referred to as a graded approach.
Classification is the process by which an area is described according to radiological characteristics. The significance of survey unit classification is that this process determines the final status survey design and the procedures used to develop this design. Preliminary area classifications are made earlier in the MARSSIM process and are useful for planning subsequent surveys.
Areas that have no reasonable potential for residual contamination are classified as non-impacted areas. These areas have no radiological impact from Site operations, are typically identified early in the process, and require no further evidence to demonstrate compliance with the release criteria.
Areas with reasonable potential for residual contamination are classified as impacted areas. Impacted areas are further divided into one of three classifications:
• Class 1 Areas: Areas that have, or had prior to remediation, a potential for radioactive contamination (based on Site operating history) or known contamination (based on previous radiation surveys) above the screening level. Examples of Class 1 areas include:
1. Site areas previously subjected to remedial actions
2. Locations where leaks or spills are known to have occurred
3. Former burial or disposal sites
4. Waste storage sites
5. Areas with contaminants in discrete solid pieces of material and high specific activity.
• Class 2 Areas: Areas that have, or had prior to remediation, a potential for radioactive contamination or known contamination, but are not expected to exceed the screening level. To justify changing the classification from Class 1 to Class 2, measurement data should exist that provides a high degree of confidence that no individual measurement would exceed the screening level. Other justifications for reclassifying an area as Class 2 may be appropriate based on site-specific considerations. Examples of Class 2 areas include:
1. Locations where radioactive materials were present in an unsealed form
2. Potentially contaminated transport routes
3. Areas downwind from stack release points
Final Sampling and Analysis Plan, Volume 1 – Field Sampling Plan Former Guterl Specialty Steel Corporation FUSRAP Site, Lockport, New York
5-7 01/18/07
4. Upper walls and ceilings of buildings or rooms subjected to airborne radioactivity
5. Areas handling low concentrations of radioactive materials
6. Areas on the perimeter of former contamination control areas.
• Class 3 Areas: Any impacted areas that are not expected to contain any residual radioactivity or are expected to contain levels of residual radioactivity at a small fraction of the screening level, based on Site operating history and previous radiation surveys. Examples of Class 3 areas include:
1. Buffer zones around Class 2 areas
2. Areas with very low potential for residual contamination but insufficient information to justify a non-impacted classification
Preliminary classification of IAs by contamination potential is discussed in Section 5.3, below. As the characterization survey proceeds, results may indicate that Class 1 or Class 2 areas may be reclassified to a lower level. Conversely, results may require reclassification of Class 2 or Class 3 areas to a higher level. Reclassification may occur during the survey, with an accompanying appropriate modification of survey efforts and techniques, or after the survey. The characterization survey report will provide all final determined classifications as a main objective in order to guide future cost estimation of, planning for, and performance of remediation.
5.2.2.4 Select Background Reference Areas
5.2.2.4.1 Surface References For the purposes of evaluating contamination on structure surfaces, structures of similar material construction will be identified in non-impacted buildings located on-site. In the event that suitable reference materials cannot be located, reference material values may be assumed based on information provided in Table 5-4 (Background Count Rates for Various Materials) from NUREG-1507, Minimum Detectable Concentrations with Typical Radiation Survey Instruments for Various Contaminants and Field Conditions (NRC, 1998). The following background reference area measurements may be required to evaluate types of surface materials if the material type is identified in the study area:
• Concrete floor surfaces
• Structural steel surfaces
• Cinder block surfaces
• Fire brick surfaces
• Interior and exterior brick surfaces
• Floor tile surfaces
• Ceramic tile surfaces
• Dust/residue from overhead structures
• Floor penetration sediment
Final Sampling and Analysis Plan, Volume 1 – Field Sampling Plan Former Guterl Specialty Steel Corporation FUSRAP Site, Lockport, New York
5-8 01/18/07
• Transite siding surfaces
• Concrete coring material
• Roofing materials
• Slag
Background reference area measurements for each of the materials listed above will be conducted according to procedures in Section 5.4.2 and Section 5.4.5, as appropriate. Examples of material types will be sought in the interior of buildings that are outside the excised area. A total of five reference measurements will be completed for each material type.
5.2.2.4.2 Environmental Media and Background Radiation Background samples will be collected for soil (surface and subsurface), sediment, surface water, groundwater, and building materials during the RI. A total of 12 surface soil and 12 subsurface soil samples are planned; three surface water and three sediment samples are planned; two groundwater samples are planned (one overburden and one bedrock); and one sample from each type of building material sampled is planned.
MARSSIM defines the background reference area as a geographical area in which representative reference measurements are performed for comparison with measurements performed in specific survey units. The background reference area will have similar physical, chemical, radiological, and biological characteristics as the areas being investigated but has not been contaminated by Site activities (that is, it is non-impacted).
The background reference will be only 30 m2 for the following reasons:
• The present survey is a characterization survey, not a final status survey.
• Background reference areas are required when the COPCs occur in nature. One of the COPCs is refined uranium and some of the instruments that will be used are able to differentiate refined uranium from naturally occurring uranium. Therefore, a background reference area is not required for refined uranium.
• Thorium-232, one of the other COPCs, occurs in nature. Differentiating refined thorium from naturally occurring thorium at the concentrations the refined thorium likely will be encountered will be difficult with the instruments that will be used in the survey. However, 232Th concentrations that exceed screening levels are expected to be found over relatively small areas, so a small background reference area will suffice.
• Radium occurs in nature as a progeny radionuclide in the natural uranium and thorium decay chains. It is expected that its concentration will not vary much in the surface soil of the reference area, so that results of sampling over a larger reference area would not differ significantly from the results of sampling over 30 m2.
The background reference area for background soil samples and background radiation measurements will be surveyed as if it were a Class 1 area. Specifically, a total of 12 surface and 12 subsurface soil samples in the reference area will be collected to establish background soil concentrations for COPCs by gamma spectroscopy and alpha spectroscopy (U and Th), by EPA method 903/904 (Ra-226 and Ra-228), by mass spectroscopy for isotopic U, and gross alpha and
Final Sampling and Analysis Plan, Volume 1 – Field Sampling Plan Former Guterl Specialty Steel Corporation FUSRAP Site, Lockport, New York
5-9 01/18/07
gross beta. Sampling points will be placed at locations equidistant between the center and each corner of a 10-m grid square (that is, four sampling locations within each 10-m grid square). The location of the background reference area relative to the site is shown on Figure 5-2.
It is preferable to take background samples for building materials from non-impacted buildings if possible. Taking these samples likely will involve damaging property, so an approved alternative is to take samples from Class 3 areas in buildings in IA01.
The upstream transect (three points) of surface water and sediment samples obtained from the Erie Barge Canal will be considered the background location for IA09. The surface water samples will be submitted for COPC analyses by alpha spectroscopy (U, Th) and EPA method 903/904 (Ra). The sediment samples will be submitted for COPC analyses by gamma spectroscopy, alpha spectroscopy (U, Th), and EPA method 903/904 (Ra); and for total organic carbon. Samples will be collected as described in Section 5.4.5.3 and Section 5.4.6.3.
An upgradient groundwater sample will be collected from one new monitoring well in the overburden and bedrock, respectively. The upgradient monitoring well pair will be located in an area not expected to be impacted by Site activities (see planned wells MW-600S/D in the northeast quadrant of IA05). Groundwater samples will be submitted for off-site laboratory analyses for filtered and unfiltered COPCs, gross alpha, and gross beta, and unfiltered total suspended solids (TSS). Samples will be collected as described in Section 5.4.4.11.
5.2.2.5 Identify Survey Units (Investigative Areas) As discussed in Section 2.3 of the DGAR, the concept of developing IAs to better manage the assessment of existing data and future data needs was introduced during the TPP Meeting. The organizational benefit of developing IAs is demonstrated by developing a correlation between the conceptual site model and data gap analysis. These IAs may also be useful for developing EUs for risk assessment purposes.
The IAs developed for the Site RI are:
IA01 Excised Area – Building Surfaces and Interiors (including Building 24)
IA02 Excised Area – Building Exterior Areas
IA03 Landfill Area
IA04 NCIDA Property (Allegheny operations area, not including Excised Area, Landfill Area, or Building 24)
IA05 Railroad Right-of-Way North of Site Proper
IA06 Off-site Northeast Properties
IA07 Groundwater
IA08 Site Utilities (sewers and drains)
Final Sampling and Analysis Plan, Volume 1 – Field Sampling Plan Former Guterl Specialty Steel Corporation FUSRAP Site, Lockport, New York
5-10 01/18/07
IA09 Erie Barge Canal (adjacent to the Site)
IA10 Lot 4.1 (“Lombardi Property”)
5.2.2.6 Site Preparation Site preparation involves obtaining consent for performing the survey, establishing property boundaries, evaluating physical characteristics of the Site, accessing surfaces and land areas of interest, and establishing a reference coordinate system. Site preparation may also include removing equipment and materials that restrict access to surfaces. The presence of furnishings or equipment will restrict access to building surfaces and add additional items that the survey should address.
5.2.2.6.1 Consent for Survey USACE will coordinate and obtain consent from the site owner before the survey is conducted. Appropriate local, State, and Federal officials as well as the site owner and other affected parties will be notified of the survey schedule.
5.2.2.6.2 Property Boundaries Property boundaries will be determined using available public information and will be established by a NYS licensed surveyor as part of Site mobilization activities. In addition, the surveys will be performed to provide benchmarks across the Site prior to the conduct of the Gamma Walkover Survey (GWS). The benchmarks will be located to tie the GWS reference coordinate system to the New York State Plane Coordinate System (West Zone). Earth Tech will use the survey grade locations to establish local site coordinates at mapping grade (sub-meter) using a global positioning system (GPS) unit. See Figure 1-2 for a current approximation of property boundaries. Procedures for establishing local site coordinates are discussed further in SOP 07 (Attachment 1).
5.2.2.6.3 Physical Characteristics of Site Section 4.8.3 of MARSSIM discusses the many considerations about land areas and building structures that can impact the ability to perform a characterization survey. The land areas are generally easily accessible but overgrown, so some clearance of foliage must occur. Section 4.8.4 of MARSSIM discusses site clearing techniques that will be used during this survey as necessary to produce adequate results.
Because some parts are paved, drilling and other techniques will be used to access contamination under these surfaces as deemed necessary. Special techniques, discussed in Section 5.4.5.2, will be used to investigate potentially impacted drains and sewer lines.
Building structures are in various degrees of disrepair, structural integrity, and housekeeping. Safety considerations may limit the extent to which some of these structures may be accessed and characterized and, as a result, cause data gaps. Such instances will be noted in project logs and in the final survey report. Some special techniques, such as use of a properly collimated ISOCS from a safe distance, may possibly overcome these obstacles.
Final Sampling and Analysis Plan, Volume 1 – Field Sampling Plan Former Guterl Specialty Steel Corporation FUSRAP Site, Lockport, New York
5-11 01/18/07
5.2.2.6.4 Reference Coordinate System Grid systems will be established at the Site to:
• Facilitate systematic selection of measuring/sampling locations
• Provide a mechanism for referencing a measurement/sample back to a specific location so that the same survey point can be relocated
• Provide a convenient means for determining average activity levels.
Each grid will consist of a system of intersecting lines, referenced to a fixed site location or bench mark. The grid lines will be arranged in a perpendicular pattern, dividing the survey location into squares or blocks of equal area.
Earth Tech San Antonio Radiation Safety Group (SARSG) SOP 007, Grid Systems and Surveys, (Attachment 1) will be used to establish building interior grids. The basic grid system for impacted areas in building interiors will be 1 meter.
The site-wide outdoor reference coordinate system will be tied to the New York State Plane Coordinate System (West Zone). It will be established as 10-meter grid squares oriented and designed similarly to the local site grid used by ORISE (1999), including use of the same origin (southwest corner of Building 4/9) to optimize re-use of the ORISE data set.
Scale drawings of the survey areas will be developed that indicate facility features and superimposes the grid reference systems.
5.3 CLASSIFICATION OF SITE AREAS AND FACILITIES
5.3.1 General Classification of areas and facilities at the Site are based, with minor modifications, on the historical site assessment and previous surveys, as discussed in the DGAR. The classifications as well as building and facility descriptions are tentative, and dimensions are approximate. The classifications and descriptions may be revised as this characterization survey proceeds and new data are obtained.
5.3.2 Assumption Basis (General) Of the previous surveys, the survey by ORISE personnel most closely follows MARSSIM methodology. The results of the ORISE survey have been considered in the development of this FSP. To the extent possible, the ORISE data will be used to meet the needs of the current survey (i.e., preliminary identification of Class 1, Class 2, or Class 3 areas; supplement RI database pending verification and acceptance of data usability; etc.).
Refer to Attachment 2 for ORISE (1999) summary data tables and figures. The summary tables and figures present ORISE sampling locations, the ranges of summary measurements, and the approximate extent of the contamination in the areas investigated (i.e., IA01, IA02, IA03, and IA04A and IA04B). The ORISE data are organized as follows (figures 1 through 10 intentionally excluded):
Final Sampling and Analysis Plan, Volume 1 – Field Sampling Plan Former Guterl Specialty Steel Corporation FUSRAP Site, Lockport, New York
5-12 01/18/07
• Tables 1 through 10 and Figures 11 through 26 present a summary of Excised Area building interior surface activity (direct measurement and sampling).
• Table 12 and Figures 27 through 32 present a summary of Excised Area building interior surface soil and subsurface soil sample data (isotopic data for U-238, U-235, Th-232, and Ra-226).
• Tables 13 through 16 and Figures 33 through 35 present a summary of outdoor surface soil and subsurface soil sample data for RI-designated areas IA02, IA03, and IA04A and IA04B (isotopic data for U-238, U-235, Th-232, and Ra-226).
• Figure 36 presents the ORISE assessment of impacted areas.
Table 5-5 presents estimates for the Site by area of survey class and should be considered as gross estimates only that will be refined as better information becomes available. IA06 is a non-impacted area and, so, has no Class 1, Class 2, or Class 3 areas in it. Area is not a relevant parameter for surveys of IA07 or IA08.
Table 5-5 and the discussion that follows also do not include the surface areas of any equipment, shelves, sill, ledges, beams, and so on that might add to the areas of the surfaces to be surveyed. Information about the extent of these areas is not available; when it becomes available, it may be used to update these tables.
5.3.3 Survey Basis (General) Survey techniques discussed in Section 5.4 will be the preferred methods to meet the needs of the present survey. The techniques discussed in Section 5.4 include verification of, as well as supplementation of, prior investigation data, i.e., sampling at a lesser frequency in areas of ORISE (1999) or NYSDEC (2000, 1999, and 1994) data and at a greater frequency where data gaps have been identified. If the characterization survey does not reproduce results within uncertainties (that is, more than half of the pairs of results should agree within two standard deviations), prior data may not be relied upon as heavily, and the survey techniques discussed in Section 5.4 may need to be discussed with USACE to determine appropriate changes to ensure project DQOs are met.
Previous local sample grid coordinates (e.g., ORISE, 1999) will be correlated to the New York State Plane Coordinate System (West Zone) for entry into the project database. Prior data will be combined with RI data to assess achievement of characterizing the nature and extent of contamination at the Site. The characterization survey report will note when prior data are used.
Table 5-6 presents a general outline of the planned data collection parameters by matrix, including the general plan for radiological analyses. Specific details for each matrix are provided in the following IA-specific sections.
5.3.4 IA01 Excised Area – Building Interior Surfaces (including Building 24) Nine buildings within the Excised Area comprise IA01. Several of the buildings are attached and appear to be a single building. These nine buildings are Buildings 1 and 2; the attached (co-joined) buildings 3, 4, 5, 6, 8, and 9; and Building 35. Additionally, Building 24, which is attached to the north side of Building 8, is not part of the Excised Area but is included within this
Final Sampling and Analysis Plan, Volume 1 – Field Sampling Plan Former Guterl Specialty Steel Corporation FUSRAP Site, Lockport, New York
5-13 01/18/07
IA due to the impact of MED/AEC operations on the south end of the building. Table 4-1 provides a summary of building construction date, floor space, and use.
The types of roofs (for example, flat, shed, low pitch, medium pitch, louvered, etc.) vary by building. Following a review of available drawings and notes from site visits, best estimates for increase in roof area relative to building footprint were made, resulting in approximately 20 percent (shed) to 75 percent (complex shape as in Building 3) greater area than it would have been for a flat roof on the same building. These estimates will be improved as the survey progresses.
5.3.4.1 IA01 Classifications (General) The DGAR indicates the following classifications in general.
• Class 1 areas are in Building 1 (some), Building 2 (some), Building 3 (some), Building 4 (some), Building 5 (some), Building 6 (all), Building 8 (all), Building 9 (some), and Building 24 (some of southern section).
• Class 2 areas are in Building 1 (remainder), Building 2 (remainder), Building 3 (remainder), Building 4 (remainder), Building 5 (remainder), Building 9 (remainder), Building 24 (remainder of southern section), and Building 35 (all).
• A Class 3 area is in the northern section of Building 24.
However, these classifications primarily are concerned with floors and walls up to 2 m and, so, did not include all of the interior surfaces. Therefore, for surfaces other than floors or walls below 2 m, a 2-m wide Class 2 area will be adjacent to all Class 1 areas within each building and the remainder within each building not otherwise classified will be Class 3.
Table 5-7 summarizes the estimates for interior and exterior survey areas in IA01 and IA02 by class and should be considered as gross estimates only that will be refined as better information becomes available. The information that is not available at this writing includes some of the dimensions of the buildings, such as wall heights and roof slopes, as discussed elsewhere herein. This information will be obtained on site and entered into the spreadsheet that produced the tables to improve the estimates. The spreadsheets currently have “best estimates” of these dimensions, so it should be expected that any changes in the estimated numbers of samples will be relatively small.
5.3.4.2 IA01 Assumption Basis (General) The following are summarized from the data gap analysis and apply as the assumption basis for all IA01 buildings in addition to any specific information included in other sections below:
• No previous results are available for measurements of or samples from building exterior surfaces including roofing media.
• Exposure rate measurements taken within these buildings are specified only as a range for each building (ORISE, 1999, Table 10), so they cannot be correlated to locations.
• The limited depth profiling within the buildings precludes accurate estimates of the volume of sub-floor media above the screening levels.
Final Sampling and Analysis Plan, Volume 1 – Field Sampling Plan Former Guterl Specialty Steel Corporation FUSRAP Site, Lockport, New York
5-14 01/18/07
• While the areal extent of the contaminated areas is generally known based on the survey findings and presentation in the ORISE figures, the accuracy of the area determination is limited by the measurement and sample density. Current data are sufficient to determine that the surface and subsurface conditions generally exceed the screening levels and to determine the nature of the COPCs. Additional surface measurements and subsurface samples may be desired to support better definition of the extent of the contamination.
• While scanning surveys were conducted on a grid basis in some buildings, the recorded direct measurement and sample locations within these buildings were based on observational results.
• Within the ORISE survey report, the scale drawings appear to be approximate, and no grid coordinates are evident for location of measurements and samples inside these buildings.
• An accurate set of drawings is desired to clearly demarcate the building boundaries between adjacent buildings that are open to each other to aid in interpretation of the survey results by building.
• Some of the reported values for surface areas in the buildings differ significantly based on the source of information.
Previous sampling by ORISE in most of IA01 was not based on a formal site-wide grid and does not provide sufficient density of coverage in all areas to meet the current survey objectives. ORISE data indicate that radioactivity is not “removable”10 and therefore decontamination of structures is not likely to be feasible.
Building 1 was not surveyed adequately due to safety considerations and the flooded condition of the basement. The survey of Building 5 was described as “minimum” due to structural concerns and accumulated debris. No residual contamination (based on screening) was reported by ORISE in Buildings 5 and 35; however, no isotopic samples were collected in these buildings. Buildings 2, 3, 6, and 8 (initially Class 3) were re-surveyed as Class 1; coverage was adequate, but only Buildings 6 and 8 were surveyed on a grid (again, only site-specific). Not all the floor plates were removed during the survey in Building 6; therefore contamination under the plates needs to be assessed in many areas. Information on the extent of the survey in the northern part of Building 24 (24N), currently used for storage by Allegheny, is lacking.
5.3.4.3 IA01 Survey Basis (General) The following components apply as the general survey basis for all buildings in IA01 in addition to any specific survey bases included in other sections below.
5.3.4.3.1 Survey Grids Each IA01 building will be gridded to establish coordinate systems in accordance with Section 5.2.2.6.4. Scan surveys will be performed to accurately locate previously identified contamination. Scan surveys will be conducted in accordance with Section 5.4.2.1.
10 The current survey will verify this ORISE assertion by taking a limited number of swipe tests (see Section 5.3.4.3.2).
Final Sampling and Analysis Plan, Volume 1 – Field Sampling Plan Former Guterl Specialty Steel Corporation FUSRAP Site, Lockport, New York
5-15 01/18/07
5.3.4.3.2 Swipe Tests Since the ORISE survey indicated that removable contamination everywhere in the buildings was below the screening levels, swipe tests for removable contamination will be performed for verification purposes as discussed in Section 5.4.2.1. Should the results of these swipe tests fail to confirm the ORISE results (that is, results indicate levels of removable contamination greater than the screening levels), the rate of swipe testing will be discussed with USACE to determine an appropriate frequency adjustment to meet the project DQOs.
5.3.4.3.3 Soil Sampling Surface and subsurface soil samples will be collected within each IA01 building. Building-specific sampling plans are discussed in the respective “Survey Basis” subsections, below. Surface and subsurface soil sampling performed during the ORISE survey may be used to complement and, in some cases, replace soil sampling for the current survey; use of these ORISE results will be in accordance with Section 5.3.3. Soil sampling procedures are described in Section 5.4.3.
5.3.4.3.4 Building Material Sampling At least one sample will be taken in each discrete Class 1 area. Indicators for the location and type of material to be sampled are anomalous exposure rate or scanning measurements and physical indications, such as the presence of suspicious discoloration or residues. Professional judgment will be used to select building material samples in Class 2 and Class 3 areas; however, a minimum of one sample per area will be collected to verify area classification.
Off-site laboratory analysis (i.e., isotope-specific analysis by gamma and alpha spectroscopy methods) will be performed on these volumetric samples of building materials to provide data to support disposal decisions and to conduct a baseline dose and risk assessment.
5.3.4.4 Interior Surfaces - Building 1 Building 1 has a floor area of approximately 815 m2. According to background documentation, this building was used for metal smelting and manufactured gas production. Refer to Figure 5-3 for a layout of Building 1.
5.3.4.4.1 Class 1 Areas in Building 1 An approximately 10 m × 7 m rectangular area of approximately 70 m2 of the floor in the work room at the south end of the building is Class 1.
The total Class 1 area in Building 1 is approximately 70 m2.
5.3.4.4.2 Class 2 Areas in Building 1 The remainder of the floor area, 745 m2, is Class 2, as well as the walls to a height of 2 m, adding another approximately 360 m2 to the total Class 2 area.
The total Class 2 area in Building 1 is approximately 1100 m2.
Final Sampling and Analysis Plan, Volume 1 – Field Sampling Plan Former Guterl Specialty Steel Corporation FUSRAP Site, Lockport, New York
5-16 01/18/07
5.3.4.4.3 Class 3 Areas in Building 1 The exact height of each building interior is not readily available. For the purpose of illustrating the methodology to be used to determine the number of sample locations for walls and ceilings (to also include roof area), assume the building height is x.
The exterior dimensions of Building 1 according to available drawings are the result of two adjoining rectangles that are approximately 800 m × 10 m and 10 m × 10 m. This would give a total floor area of approximately 900 m2. Presumably, wall thicknesses reduce interior dimensions of the floor area to the given area of 815 m2, or by approximately 9 percent. Assume this same 9 percent reduction affects wall area.
Building 1’s perimeter is approximately 200 m. Therefore the total interior wall area, not counting the ceiling, is approximately 200 m × 0.91 × x. If we assume x = 10 m, then the total interior wall area, not counting the ceiling is estimated as approximately 1810 m2. Subtracting the Class 1 and Class 2 areas on the walls leaves approximately 1450 m2 for Class 3. This will be adjusted when an accurate value for the building height is available.
The ceiling cross section area is assumed to be the same as the floor area. The pitch (deviation from the horizontal plane) of the roof is estimated from available drawings and photographs to increase this value by about 70 percent. Thus the ceiling area, which is Class 3, is 815 m2 × 1.7 or approximately 1390 m2.
All surfaces of the flooded basement are Class 3; however, survey of the basement surfaces is not planned for the current investigation. In order for the investigation to be conducted, the basement would have to be dewatered, a structural assessment of the corroded ceiling/floor joist must be made, and any related health and safety concerns would have to be mitigated. However, collection of up to four surface water/sediment pairs from the flooded basement is planned; see Section 5.3.4.4.4.
For the purpose of completing the assumption basis, the Class 3 area estimate for the basement surfaces has been completed. It is assumed the flooded basement extends from the north end approximately 70 m to the south. It has a floor area of approximately 634 m2. The height of the wall is not available and will be assumed to be 2.5 m. A stairwell leads into the basement. It is assumed that it will reduce the basement ceiling area by approximately 4 m2. Using the 91-percent area reduction factor mentioned above for the wall area, the total surface area of the flooded basement is approximately 634 m2 (floor) + 630 m2 (ceiling) + 340 m2 (walls) or approximately 1600 m2.
The total Class 3 area in Building 1 is approximately 2830 m2, not counting the flooded basement, which adds approximately another 1600 m2 to the total.
5.3.4.4.4 Other Media in Building 1 Many of the other media discussed in Section 5.4.5 will be encountered and will be surveyed at a level commensurate with the classification of the area in which they are located. In particular, the drain in the Class 1 area and the pipes leading away from it will require close scrutiny.
Four surface water and sediment (if present) pairs will be collected from the flooded basement and analyzed for COPCs to verify its classification as a Class 3 area and to characterize the water and sediment (if present). The four pairs will be spaced equidistantly across the footprint of the
Final Sampling and Analysis Plan, Volume 1 – Field Sampling Plan Former Guterl Specialty Steel Corporation FUSRAP Site, Lockport, New York
5-17 01/18/07
basement, but will be located such that confined space entry will not be required to obtain the samples. To the extent possible, the surface water and sediment samples will be collected accordance with the procedures presented in Section 5.4.5.3.
5.3.4.4.5 Assumption Basis for Building 1 General assumptions for IA01 are addressed in Section 5.3.2 and Section 5.3.4.2. The following paragraphs address assumptions specific to Building 1.
The ORISE survey confirmed the Class 3 designation of the northern part of the building and identified elevated readings in the West Work Room (ORISE, 1999; Figure 11 and Table 2). Radiological contamination was below the direct measurement screening levels throughout the building except in the Work Room located in the southwest corner of Building 1. All of the direct measurements noted in the Work Room on the countertop, a lower shelf and the concrete floor exceed 5,000 dpm/100 cm2. The maximum reading of 100,000 dpm/100 cm2 was measured on the concrete floor below the shelf.
The throat of a floor drain in the immediate area is sealed with concrete and the reading for the concrete floor at the drain was 35,000 dpm/100 cm2. As a result, the sealed drain and the drain line are suspect for contamination. Based on these findings, this area was reclassified as a Class 1 area but a more thorough survey of the Work Room was not conducted due to health and safety concerns.
The Work Room is approximately 100 m2 and the locations of the readings that exceed the screening levels appear to be limited to the southern half of the room (ORISE, 1999, Figure 11). In the worst case, the approximate 100 m2 area in the Work Room represents approximately 12 percent of the floor space in Building 1.
None of the measurements for removable activity identified values above the screening levels. No soil or sub-floor samples were collected for analysis in Building 1. The basement could not be surveyed since it was flooded.
5.3.4.4.6 Survey Basis for Building 1 Building surface scanning and swipe testing will be conducted in accordance with Section 5.4.2.1. Building material (volumetric) sampling will be conducted in accordance with Section 5.3.4.3.4. Table 5-8 provides an estimate of swipe testing and building material (volumetric) sample quantities.
Surface and subsurface soil sampling will be conducted in accordance with Section 5.4.3. Planned soil sample locations are shown on Figure 5-3. An estimate of soil sample quantities is presented in Table 5-9.
5.3.4.5 Interior Surfaces - Building 2 Building 2 has a floor area of approximately 6400 m2. It was used for metal rolling and manufacturing. Refer to Figure 5-4 for a layout of Building 2.
Final Sampling and Analysis Plan, Volume 1 – Field Sampling Plan Former Guterl Specialty Steel Corporation FUSRAP Site, Lockport, New York
5-18 01/18/07
5.3.4.5.1 Class 1 Areas in Building 2 Six separate locations in Building 2 are Class 1 areas with a total floor area of 150 m2. Specific locations that are noted to be above the screening levels include a locker, a work bench, and a door frame. Three are adjacent to one wall, two are in a corner, and one is away from the walls.
The total Class 1 area in Building 2 is approximately 150 m2.
5.3.4.5.2 Class 2 Areas in Building 2 The remainder of the floor area, 6250 m2, as well as the walls to a height of 2 m, is Class 2. The perimeter of Building 2 is approximately 450 m. Using the 0.91 interior wall area reduction factor, the total wall area up to 2 m height is approximately 450 m × 2 m × 0.91 or approximately 815 m2.
The total Class 2 area in Building 2 is approximately 7070 m2.
5.3.4.5.3 Class 3 Areas in Building 2 The exact height of each building interior is not readily available. For the purpose of illustrating the methodology to be used to determine the number of sample locations for walls and ceilings (to also include roof area), assume the building height is x.
Building 2’s perimeter is approximately 450 m. Therefore the total interior wall area, not counting the ceiling, is approximately 450 m × 0.91 × x. If we assume x = 10 m, then the total interior wall area, not counting the ceiling is estimated as approximately 4080 m2. Subtracting the Class 2 areas on the walls (820 m2) leaves approximately 3260 m2 for wall area Class 3. This will be adjusted when an accurate value for the building height is available.
The ceiling cross section area is assumed to be the same as the floor area. The pitch (deviation from the horizontal plane) of the roof is estimated from available drawings and photographs to increase this value by about 70 percent. Thus the ceiling area, which is Class 3, is 6400 m2 × 1.7 or approximately 10,880 m2.
The total Class 3 area in Building 2 is approximately 14,140 m2.
5.3.4.5.4 Other Media in Building 2 Many of the other media discussed in Section 5.4.5 will be encountered and will be surveyed at a level commensurate with the classification of the area in which they are located.
5.3.4.5.5 Assumption Basis for Building 2 General assumptions for IA01 are addressed in Section 5.3.2 and Section 5.3.4.2.
Coverage and existing data in the ORISE report for Building 2 appear adequate; however, measurements were not taken in a grid pattern and are subject to general confirmation. Depth data are needed at the floor locations that were identified to be above the screening levels to better define the nature and extent of the contamination (ORISE, 1999, Figure 12).
Final Sampling and Analysis Plan, Volume 1 – Field Sampling Plan Former Guterl Specialty Steel Corporation FUSRAP Site, Lockport, New York
5-19 01/18/07
5.3.4.5.6 Survey Basis for Building 2 Building surface scanning and swipe testing will be conducted in accordance with Section 5.4.2.1. Building material (volumetric) sampling will be conducted in accordance with Section 5.3.4.3.4. Table 5-8 provides an estimate of swipe testing and building material (volumetric) sample quantities.
Surface and subsurface soil sampling will be conducted in accordance with Section 5.4.3. Planned soil sample locations are shown on Figure 5-4. An estimate of soil sample quantities is presented in Table 5-9.
5.3.4.6 Interior Surfaces - Building 3 Building 3 is connected and opens to Buildings 4 and 9 and to Buildings 6 and 8. It has a floor area of approximately 6300 m2 and was used for metal rolling and grinding. See Figure 5-5 for a layout figure of Building 3.
5.3.4.6.1 Class 1 Areas in Building 3 Three separate locations in Building 3 are Class 1 areas with a total floor area of approximately 1880 m2. Specific locations in the North Section include the center throughway near the track, the truss above the furnace at 4 m, and the window ledge at 8 m. In the South Section, notable findings include an I-beam pedestal, a cabinet top, a roller cap, the south end of the trench, a window ledge at 8 m, a crane rail I-beam at 8 m, I-beams at 5 and 7 m, and the sidewalk near the cafeteria. As noted in the DGAR, definitive information about contamination in the two trenches in the South Section is a significant data gap.
The depths of the trenches are unavailable. It will be assumed that they are both 1.5 m deep. The walls of the trenches are not included as a floor area.
The wider trench is approximately 5 m wide and 45 m long with 40 m of that length in a Class 1 area. The area of the trench walls that are in a Class 1 area is approximately (40 m × 2 + 5 m) × 1.5 m or approximately 130 m2.
The other trench is approximately 2 m wide and 23 m long. All of it is in a Class 1 area. It appears that one end of the trench gradually rises to floor level and so does not contribute to the wall area, so this trench wall area is approximately (23 m × 2 + 2 m) × 1.5 or approximately 70 m2.
The total Class 1 area in Building 3 is approximately 2080 m2.
5.3.4.6.2 Class 2 Areas in Building 3 The remainder of the floor area (including the remainder of the floor area of the wider trench), 4420 m2, as well as the walls to a height of 2 m and the remainder of walls of the wider trench are Class 2.
The perimeter of Building 3 is approximately 450 m. Using the 0.91 interior wall area reduction factor, the total wall area up to 2 m height is approximately 450 m × 2 m × 0.91 or approximately 815 m2.
Final Sampling and Analysis Plan, Volume 1 – Field Sampling Plan Former Guterl Specialty Steel Corporation FUSRAP Site, Lockport, New York
5-20 01/18/07
The area of the remainder walls of the wider trench is approximately (5 m × 2 + 5 m) × 1.5 m = 22.5 m2.
The total Class 2 area in Building 3 is approximately 5260 m2.
5.3.4.6.3 Class 3 Areas in Building 3 The exact height of each building interior is not readily available. For the purpose of illustrating the methodology to be used to determine the number of sample locations for walls and ceilings (to also include roof area), assume the building height is x.
Building 3’s perimeter is approximately 450 m. Therefore the total interior wall area, not counting the ceiling, is approximately 450 m × 0.91 × x. If we assume x = 10 m, then the total interior wall area, not counting the ceiling is estimated as approximately 4080 m2. Subtracting the Class 2 areas on the walls (820 m2) leaves approximately 3260 m2 for wall area Class 3. This will be adjusted when an accurate value for the building height is available.
The ceiling cross section area is assumed to be the same as the floor area. The pitch (deviation from the horizontal plane) of the roof is estimated from available drawings and photographs and increases this value by about 70 percent. Thus the ceiling area, which is Class 3, is 6030 m2 × 1.7 or approximately 10,710 m2.
The total Class 3 area in Building 3 is approximately 13,790 m2.
5.3.4.6.4 Other Media in Building 3 Many of the other media discussed in Section 5.4.5 will be encountered and will be surveyed at a level commensurate with the classification of the area in which they are located.
5.3.4.6.5 Assumption Basis for Building 3 General assumptions for IA01 are addressed in Section 5.3.2 and Section 5.3.4.2.
ORISE re-surveyed Building 3 as Class 1. Coverage and existing data appear adequate; however, measurements were not taken in a grid pattern and are subject to general confirmation. Additional surface measurements and subsurface samples are needed to support better definition on the aerial and vertical extent of the contamination.
5.3.4.6.6 Survey Basis for Building 3 Building surface scanning and swipe testing will be conducted in accordance with Section 5.4.2.1. Building material (volumetric) sampling will be conducted in accordance with Section 5.3.4.3.4. Table 5-8 provides an estimate of swipe testing and building material (volumetric) sample quantities.
Surface and subsurface soil sampling will be conducted in accordance with Section 5.4.3. Planned soil sample locations are shown on Figure 5-5. An estimate of soil sample quantities is presented in Table 5-9.
Final Sampling and Analysis Plan, Volume 1 – Field Sampling Plan Former Guterl Specialty Steel Corporation FUSRAP Site, Lockport, New York
5-21 01/18/07
5.3.4.7 Interior Surfaces - Building 4 and Building 9 Building 4 and Building 9 together have a floor area of approximately 4400 m2. Building 4 is connected to and open to Building 9 on the west side and connected and open to Building 3 on the east side. A loading dock is on the west side of Building 9. They were used for metal rolling and manufacturing. Refer to Figure 5-6 for a layout of Buildings 4 and 9.
5.3.4.7.1 Class 1 Areas in Building 4 and Building 9 A large rectangular area near the center of the floor of Building 4/Building 9 is a Class 1 area with a total floor area of approximately 1200 m2. Overhead surfaces above this area also had elevated activity levels in excess of the screening levels of the ORISE survey. The area of these “overhead” surfaces is not available and, so, will be assumed to be located above the Class 1 floor area and be 1200 m2.
The total Class 1 area in Building 4 and Building 9 together is approximately 2400 m2.
5.3.4.7.2 Class 2 Areas in Building 4 and Building 9 The remainder of the floor area, 3200 m2, as well as the walls to a height of 2 m is Class 2.
The perimeter of Building 4 and Building 9 together is approximately 290 m. Using the 0.91 interior wall area reduction factor, the total wall area up to 2 m height is approximately 290 m × 2 m × 0.91 or approximately 525 m2.
The total Class 2 area in Building 4 and Building 9 together is approximately 3730 m2.
5.3.4.7.3 Class 3 Areas in Building 4 and Building 9 The exact height of each building interior is not readily available. For the purpose of illustrating the methodology to be used to determine the number of sample locations for walls and ceilings (to also include roof area), assume the building height is x.
Building 4 and Building 9’s perimeter together is approximately 450 m. Therefore the total interior wall area, not counting the ceiling, is approximately 290 m × 0.91 × x. If we assume x = 10 m, then the total interior wall area, not counting the ceiling is estimated as approximately 2630 m2. Subtracting the Class 2 areas on the walls (530 m2) leaves approximately 2100 m2 for wall area Class 3. This will be adjusted when an accurate value for the building height is available.
The ceiling cross section area is assumed to be the same as the floor area. The pitch (deviation from the horizontal plane) of the roof is estimated from available drawings and photographs and increases this value by about 45 percent. Thus the ceiling area, which is Class 3, is 4440 m2 x 1.45 or approximately 6380 m2.
The total Class 3 area in Building 4 and Building 9 together is approximately 8480 m2.
5.3.4.7.4 Other Media in Building 4 and Building 9 Many of the other media discussed in Section 5.4.5 will be encountered and will be surveyed at a level commensurate with the classification of the area in which they are located.
Final Sampling and Analysis Plan, Volume 1 – Field Sampling Plan Former Guterl Specialty Steel Corporation FUSRAP Site, Lockport, New York
5-22 01/18/07
5.3.4.7.5 Assumption Basis for Building 4 and Building 9 General assumptions for IA01 are addressed in Section 5.3.2 and Section 5.3.4.2. The general assumptions adequately address the approach for Building 4 and Building 9.
5.3.4.7.6 Survey Basis for Building 4 and Building 9 Building surface scanning and swipe testing will be conducted in accordance with Section 5.4.2.1. Building material (volumetric) sampling will be conducted in accordance with Section 5.3.4.3.4. Table 5-8 provides an estimate of swipe testing and building material (volumetric) sample quantities.
Surface and subsurface soil sampling will be conducted in accordance with Section 5.4.3. Planned soil sample locations are shown on Figure 5-6. An estimate of soil sample quantities is presented in Table 5-9.
5.3.4.8 Interior Surfaces - Building 5 Building 5 has a floor area of approximately 350 m2. It was used as a transformer station and powerhouse. No dimensions are available to create a figure for Building 5.
5.3.4.8.1 Class 1 Areas in Building 5 Building 5 contains no Class 1 areas.
5.3.4.8.2 Class 2 Areas in Building 5 The entire floor area, estimated from site drawings as 350 m2, is Class 2, as well as the walls to a height of 2 m.
The perimeter of Building 5 is approximately 110 m. Using the 0.91 interior wall area reduction factor, the total wall area up to 2 m height is approximately 110 m × 2 m × 0.91 or approximately 200 m2.
The total Class 2 area in Building 5 is approximately 550 m2.
5.3.4.8.3 Class 3 Areas in Building 5 The height of the interior of Building 5 is estimated from drawings and photographs as 6 m. Building 5’s perimeter is approximately 110 m. Therefore the total interior wall area, not counting the ceiling, is approximately 110 m × 0.91 × 6 m or about 600 m2. Subtracting the Class 2 areas on the walls (200 m2) leaves approximately 400 m2 for wall area Class 3.
The ceiling cross section area is assumed to be same as the floor area except that the pitch (deviation from the horizontal plane) of the roof is not available. Assume that the pitch of the roof increases this value by 20 percent. This will be adjusted when an accurate value for the pitch of the roof, is available. Thus the ceiling area, which is Class 3, is 350 m2 × 1.2 or approximately 420 m2.
The total Class 3 area in Building 5 is approximately 820 m2.
Final Sampling and Analysis Plan, Volume 1 – Field Sampling Plan Former Guterl Specialty Steel Corporation FUSRAP Site, Lockport, New York
5-23 01/18/07
5.3.4.8.4 Other Media in Building 5 Many of the other media discussed in Section 5.4.5 will be encountered and will be surveyed at a level commensurate with the classification of the area in which they are located.
5.3.4.8.5 Assumption Basis for Building 5 General assumptions for IA01 are addressed in Section 5.3.2 and Section 5.3.4.2.
The ORISE survey report described the survey of Building 5 as “minimum” due to structural concerns and accumulated debris. No residual contamination (based on screening) was reported by ORISE; however, no samples were collected in this building. Building 5 was listed as a Class 2 area in the ORISE, 1999 report. Although no specific data are included in the ORISE report for Building 5, the report states that no areas of elevated beta or gamma radiation were detected by surface scans within this facility.
5.3.4.8.6 Survey Basis for Building 5 ORISE survey results will not be used for Building 5. Building surface scanning and swipe testing will be conducted in accordance with Section 5.4.2.1. Building material (volumetric) sampling will be conducted in accordance with Section 5.3.4.3.4. Table 5-8 provides an estimate of swipe testing and building material (volumetric) sample quantities.
No surface and subsurface soil sampling is planned for Building 5. However, surface scan and building material (volumetric) sampling will be reviewed to determine if subfloor sampling is warranted.
5.3.4.9 Interior Surfaces - Building 6 Building 6 is located west of and open to Building 3 and south of Building 8. It has a floor area of approximately 970 m2 and was used for cold metal rolling. Refer to Figure 5-7 for a layout figure of Building 6.
5.3.4.9.1 Class 1 Areas in Building 6 Four separate locations in Building 6 are Class 1 areas with a total floor area of approximately 225 m2. Specific locations include near the loading dock, two at the corners west of the roll mill, and surrounding the furnace on the south wall.
The total Class 1 area in Building 6 is approximately 225 m2.
5.3.4.9.2 Class 2 Areas in Building 6 The remainder of the floor area, approximately 745 m2, as well as the walls to a height of 2 m, is Class 2.
The perimeter of Building 6 is approximately 205 m, not counting the open “wall” to Building 3. Using the 0.91 interior wall area reduction factor, the total wall area up to 2 m height is approximately 205 m × 2 m × 0.91 or approximately 370 m2.
The total Class 2 area in Building 6 is approximately 1120 m2.
Final Sampling and Analysis Plan, Volume 1 – Field Sampling Plan Former Guterl Specialty Steel Corporation FUSRAP Site, Lockport, New York
5-24 01/18/07
5.3.4.9.3 Class 3 Areas in Building 6 The exact height of each building interior is not readily available. For the purpose of illustrating the methodology to be used to determine the number of sample locations for walls and ceilings (to also include roof area), assume the building height is x.
The perimeter of Building 6 is approximately 205 m, not counting the open “wall” to Building 3. Therefore the total interior wall area, not counting the ceiling, is approximately 205 m × 0.91 × x. If we assume x = 10 m, then the total interior wall area, not counting the ceiling is approximately 1860 m2. Subtracting the Class 2 areas on the walls (370 m2) leaves approximately 1490 m2 for wall area Class 3. This will be adjusted when an accurate value for the building height is available.
The ceiling cross section area is assumed to be the same as the floor area. The pitch (deviation from the horizontal plane) of the roof is estimated from available drawings and photographs and increases this value by about 45 percent. Thus the ceiling area, which is Class 3, is 970 m2 × 1.45 or approximately 1410 m2.
The total Class 3 area in Building 6 is approximately 2890 m2.
5.3.4.9.4 Other Media in Building 6 Many of the other media discussed in Section 5.4.5 will be encountered and will be surveyed at a level commensurate with the classification of the area in which they are located.
5.3.4.9.5 Assumption Basis for Building 6 General assumptions for IA01 are addressed in Section 5.3.2 and Section 5.3.4.2.
A total of 11 out of 30 measurement locations in Building 6 in the ORISE survey exceeded 1,000 dpm/100 cm2 (ORISE, 1999, Figures 18 and 30, Tables 5 and 12), one of which exceeded 5,000 dpm/100 cm2. The highest reading of 30,000 dpm/100 cm2 was located on a metal floor plate near the transition to Building 8. The overhead surfaces could not be accessed for surveying. None of the removable alpha and or beta levels were in excess of the screening levels. Nine of 21 floor surface samples exceed one or more of the soil concentration screening levels. Based on the approximate 970 m2 floor space and the 28 direct measurements on the floor, the average measurement frequency is approximately one per 35 m2. No measurements on any surfaces above one meter and no sub-floor samples were noted.
5.3.4.9.6 Survey Basis for Building 6 Building surface scanning and swipe testing will be conducted in accordance with Section 5.4.2.1. Building material (volumetric) sampling will be conducted in accordance with Section 5.3.4.3.4. Table 5-8 provides an estimate of swipe testing and building material (volumetric) sample quantities.
Surface and subsurface soil sampling will be conducted in accordance with Section 5.4.3. Planned soil sample locations are shown on Figure 5-7. An estimate of soil sample quantities is presented in Table 5-9.
Final Sampling and Analysis Plan, Volume 1 – Field Sampling Plan Former Guterl Specialty Steel Corporation FUSRAP Site, Lockport, New York
5-25 01/18/07
5.3.4.10 Interior Surfaces - Building 8 Building 8 is connected to Building 6 and is open to Building 3. It has a floor area of approximately 3390 m2 and was used for cold metal rolling. See Figure 5-8 for a layout of Building 8.
5.3.4.10.1 Class 1 Areas in Building 8 The entire floor of Building 8 is a Class 1 area.
The total Class 1 area in Building 8 is approximately 3390 m2.
5.3.4.10.2 Class 2 Areas in Building 8 The walls to a height of 2 m are Class 2.
The perimeter of Building 8, not counting its opening to Building 3, is approximately 210 m. Using the 0.91 interior wall area reduction factor, the total wall area up to 2 m height is approximately 210 m × 2 m × 0.91 or approximately 380 m2.
The total Class 2 area in Building 8 is approximately 380 m2.
5.3.4.10.3 Class 3 Areas in Building 8 The exact height of each building interior is not readily available. For the purpose of illustrating the methodology to be used to determine the number of sample locations for walls and ceilings (to also include roof area), assume the building height is x.
The perimeter of Building 8 is approximately 210 m, not counting the open “wall” to Building 3. Therefore the total interior wall area, not counting the ceiling, is approximately 210 m × 0.91 × x. If we assume x = 10 m, then the total interior wall area, not counting the ceiling is approximately 1900 m2. Subtracting the Class 2 areas on the walls (380 m2) leaves approximately 1520 m2 for wall area Class 3. This will be adjusted when an accurate value for the building height is available.
The ceiling cross section area is assumed to be the same as the floor area. The pitch (deviation from the horizontal plane) of the roof is estimated from available drawings and photographs and increases this value by about 45 percent. Thus the ceiling area, which is Class 3, is 3390 m2 × 1.45 or approximately 4920 m2.
The total Class 3 area in Building 8 is approximately 6440 m2.
5.3.4.10.4 Other Media in Building 8 Many of the other media discussed in Section 5.4.5 will be encountered and will be surveyed at a level commensurate with the classification of the area in which they are located.
5.3.4.10.5 Assumption Basis for Building 8 General assumptions for IA01 are addressed in Section 5.3.2 and Section 5.3.4.2.
Building 8 was found during the ORISE survey to have extensive areas of elevated direct beta activity in soils and on surfaces throughout, including all of the overhead surfaces investigated
Final Sampling and Analysis Plan, Volume 1 – Field Sampling Plan Former Guterl Specialty Steel Corporation FUSRAP Site, Lockport, New York
5-26 01/18/07
(ORISE, 1999, Figures 19 and 31, Tables 6 and 12). The ORISE report referred to and verified the findings of several prior surveys that had identified cinders below the metal plates that had residual radioactivity that exceeded the screening levels.
Based on the approximate 2,300 m2 floor space in Building 8 and the 81 direct measurements on the floor, the average measurement frequency is approximately one per 30 m2. Essentially, all surfaces within Building 8 had some residual activity, with the highest levels noted in the central and eastern portions. A total of 110 out of 132 locations were elevated above 1,000 dpm/100 cm2, 77 of these exceed 5,000 dpm/100 cm2 and 34 are above 15,000 dpm/100 cm2. Readings at three locations exceeded 50,000 dpm/100 cm2, with the highest (64,000 dpm/100 cm2) located on an I-beam at 4 m above the floor. These elevated areas were found primarily in the southern two-thirds of the structure, the northern point being the point at which Building 8 ended.
Although approximately 54 measurement locations showed removable alpha and or beta levels above background, none were in excess of the screening levels.
A total of 35 of the 42 surface soil samples and all 15 of the sub-floor samples exceed one or more of the soil concentration screening levels. Although large areas of Building 8 have residual contamination in excess of the screening levels, the equipment and structural surfaces that were scanned within Building 8 and found to be free of dust or other residues, and generally did not have residual contamination in excess of the screening levels.
5.3.4.10.6 Survey Basis for Building 8 Building surface scanning and swipe testing will be conducted in accordance with Section 5.4.2.1. Building material (volumetric) sampling will be conducted in accordance with Section 5.3.4.3.4. Table 5-8 provides an estimate of swipe testing and building material (volumetric) sample quantities.
Surface and subsurface soil sampling will be conducted in accordance with Section 5.4.3. Planned soil sample locations are shown on Figure 5-8. An estimate of soil sample quantities is presented in Table 5-9.
5.3.4.11 Interior Surfaces - Building 24 Building 24 is outside the Excised Area but its southern end is included in this discussion of IA01 since it is adjacent to Building 8 and known to have areas of contamination above the screening levels. Building 24 is connected to and partially open to Building 8. It has a floor area of approximately 6600 m2 and was used as a mill area. Refer to Figure 5-9.
5.3.4.11.1 Class 1 Areas in Building 24 The southwestern section of Building 24 had a number of areas that exceeded activity screening levels identified in past surveys. Additional elevated findings were on elevated structures above 2 m. One measurement on the concrete floor in the southeastern section also exceeded the screening levels. Additional locations on the concrete that exceeded screening levels were on the concrete floor in the Southeast Storage Room.
The total Class 1 area in Building 24 is approximately 600 m2.
Final Sampling and Analysis Plan, Volume 1 – Field Sampling Plan Former Guterl Specialty Steel Corporation FUSRAP Site, Lockport, New York
5-27 01/18/07
5.3.4.11.2 Class 2 Areas in Building 24 In the southern end of Building 24, the walls to a height of 2 m and the remainder of the floor are Class 2.
Approximately half of the floor area, 3300 m2, is in the southern half of the building, so 2700 m2 in the southern half of the building is Class 2.
The perimeter of Building 24 is approximately 520 m. Using the 0.91 interior wall area reduction factor, the total wall area up to 2 m height is approximately 520 m × 2 m × 0.91 or approximately 940 m2. Approximately half of this area, 470 m2, is in the southern end of the building.
The total Class 2 area in Building 24 is approximately 3170 m2.
5.3.4.11.3 Class 3 Areas in Building 24 The north half of the floor area (½ × 6600 m2 = 3300 m2) in Building 24 is Class 3.
The exact height of each building interior is not readily available. For the purpose of illustrating the methodology to be used to determine the number of sample locations for walls and ceilings (to also include roof area), assume the building height is x.
The perimeter of Building 24 is approximately 520 m. Therefore the total interior wall area, not counting the ceiling, is approximately 520 m × 0.91 × x. If we assume x = 10 m, then the total interior wall area, not counting the ceiling is approximately 4710 m2. Subtracting the Class 2 areas on the walls (approximately 470 m2) leaves approximately 4240 m2 for wall area Class 3. This will be adjusted when an accurate value for the building height is available.
The ceiling cross section area is assumed to be same as the floor area except that the pitch (deviation from the horizontal plane) of the roof is not available. Assume that the pitch of the roof increases this value by 20 percent. This will be adjusted when an accurate value for the pitch of the roof is available. Thus the ceiling area, which is Class 3, is 6600 m2 × 1.2 or approximately 7920 m2.
The total Class 3 area in Building 24 is approximately 15,500 m2.
5.3.4.11.4 Other Media in Building 24 Many of the other media discussed in Section 5.4.5 will be encountered and will be surveyed at a level commensurate with the classification of the area in which they are located.
5.3.4.11.5 Assumption Basis for Building 24 General assumptions for IA01 are addressed in Section 5.3.2 and Section 5.3.4.2.
The ORISE survey confirmed the Class 3 designation of the northern part of Building 24 (ORISE, 1999; Figures 20, 32 and Table 7); however, no sub-floor soil samples were collected in the north area. None of the 15 measurement locations in the north section are above the screening levels for total or removable activity.
Final Sampling and Analysis Plan, Volume 1 – Field Sampling Plan Former Guterl Specialty Steel Corporation FUSRAP Site, Lockport, New York
5-28 01/18/07
5.3.4.11.6 Survey Basis for Building 24 Building surface scanning and swipe testing will be conducted in accordance with Section 5.4.2.1. Building material (volumetric) sampling will be conducted in accordance with Section 5.3.4.3.4. Table 5-8 provides an estimate of swipe testing and building material (volumetric) sample quantities.
Surface and subsurface soil sampling will be conducted in accordance with Section 5.4.3. Planned soil sample locations are shown on Figure 5-9. An estimate of soil sample quantities is presented in Table 5-9.
5.3.4.12 Interior Surfaces - Building 35 Building 35 has a floor area of approximately 410 m2 and was used for metal rolling and grinding. Refer to Figure 5-10.
5.3.4.12.1 Class 1 Areas in Building 35 Previous surveys identified no areas of elevated beta or gamma radiation in Building 35.
Building 35 contains no Class 1 areas.
5.3.4.12.2 Class 2 Areas in Building 35 The floor of Building 35 will be designated as Class 2.
The total Class 2 area in Building 24 is approximately 410 m2.
5.3.4.12.3 Class 3 Areas in Building 35 The entire interior area of Building 35, except for the floor, will be designated as Class 3.
The height of the interior of Building 35 is estimated from drawings and photographs as 6 m. Building 35’s perimeter is approximately 100 m. Therefore the total interior wall area, not counting the ceiling, is approximately 100 m × 0.91 × 6 m or about 540 m2 for the Class 3 wall area.
The ceiling cross section area is assumed to be same as the floor area except that the pitch (deviation from the horizontal plane) of the roof is not available. Assume that the pitch of the roof increases this value by 20 percent. This will be adjusted when an accurate value for the pitch of the roof is available. Thus the ceiling area, which is Class 3, is 410 m2 × 1.2 or approximately 490 m2.
The total Class 3 area in Building 35 is approximately 1035 m2.
5.3.4.12.4 Other Media in Building 35 Many of the other media discussed in Section 5.4.5 will be encountered and will be surveyed at a level commensurate with the classification of the area in which they are located.
5.3.4.12.5 Assumption Basis for Building 35 General assumptions for IA01 are addressed in Section 5.3.2 and Section 5.3.4.2.
Final Sampling and Analysis Plan, Volume 1 – Field Sampling Plan Former Guterl Specialty Steel Corporation FUSRAP Site, Lockport, New York
5-29 01/18/07
The ORISE survey report did not identify contamination in Building 35. However, no swipe samples or soil samples were collected in this building.
5.3.4.12.6 Survey Basis for Building 35 Building surface scanning and swipe testing will be conducted in accordance with Section 5.4.2.1. Building material (volumetric) sampling will be conducted in accordance with Section 5.3.4.3.4. Table 5-8 provides an estimate of swipe testing and building material (volumetric) sample quantities.
Surface and subsurface soil sampling will be conducted in accordance with Section 5.4.3. Planned soil sample locations are shown on Figure 5-10. An estimate of soil sample quantities is presented in Table 5-9.
5.3.5 IA02 - Excised Area – Building Exterior Areas
5.3.5.1 Class 1 Areas in IA02 Based on a review of ORISE (1999) data, all of IA02 ground and paved areas are designated Class 1. Therefore, the total Class 1 area in IA02 is approximately 16,000 m2, not including ground covered by buildings.
5.3.5.2 Class 2 Areas in IA02 There are no Class 2 areas in IA02.
5.3.5.3 Class 3 Areas in IA02 The exterior surfaces of all buildings in the Excised Area are classified as Class 3. As noted in Section 5.3.4, building heights are not available and will be assumed to be 10 m. Table 5-7 shows the estimated areas of the building exteriors in the Excised Area.
The total Class 3 area in IA02, comprised entirely of building surfaces, is approximately 87,400 m2.
5.3.5.4 Other Media in IA02 Many of the other media discussed in Section 5.4.5 will be encountered and will be surveyed at a level commensurate with the classification of the area in which they are located.
5.3.5.5 Assumption Basis for IA02 The general assumption basis for the characterization survey is presented in Section 5.3.2. The following paragraphs present assumptions specific to IA02.
ORISE detected radiological contamination in soils at various locations within the outdoor areas of the Excised Area. Areas identified as contaminated by ORISE included areas directly west of Building 24 and Building 6/8, the area between Building 2 and Building 3, a portion of the small courtyard east of Building 5, and areas west of Building 2 and north of Building 1 in the general area below the former railroad tracks.
Final Sampling and Analysis Plan, Volume 1 – Field Sampling Plan Former Guterl Specialty Steel Corporation FUSRAP Site, Lockport, New York
5-30 01/18/07
The exterior portion of the Excised Area was surveyed using a site-specific grid, but the grid used was not tied to the New York State Plane Coordinate System. The extent of radiological contamination (horizontal and vertical) was roughly established, although the sample density may not be sufficient for full delineation of impacted (contaminated) areas. Some contamination found was associated with firebrick and pieces of radioactive metal.
5.3.5.6 Survey Basis for IA02 Section 5.3.3 presents the general survey basis for the characterization survey effort.
Surface and subsurface soil samples will be collected to confirm and supplement ORISE data. ORISE soil sampling results will be verified and used as appropriate to reduce the soil sampling efforts of the present survey. RI soil sampling locations have been designed to bound areas of contamination identified by ORISE, as well as to fill potential subsurface data gaps. The soil sample locations planned for IA02 are presented on Figure 5-11.
Surface and subsurface soil samples will be collected in accordance with Section 5.4.3. Selection of recovered core intervals for on-site gamma spectroscopy laboratory analysis will be performed in accordance with the decision logic presented in Section 5.4.3.1.
5.3.6 IA03 – Landfill Area The total area of the Landfill Area is approximately 36,500 m2 (approximately 9 acres).
5.3.6.1 Class 1 Areas in IA03 Previous surveys of the Landfill Area indicate contamination potentially greater than the screening levels in the northeast corner, so that part of the northeast corner will be surveyed as Class 1.
The total Class 1 area is approximately 2300 m2.
5.3.6.2 Class 2 Areas in IA03 The remainder of the Landfill Area will be surveyed as Class 2.
The Class 2 gamma walkover survey may demonstrate that some portions of IA03 may be reclassified as Class 3, with a commensurate reduction in survey activity in those portions.
Initially, the total Class 2 area is approximately 34,200 m2. This will be subject to change, depending on whether the gamma walkover survey of IA03 as a Class 2 area causes portions of it to be reclassified as Class 3.
5.3.6.3 Class 3 Areas in IA03 None of IA03 will be surveyed as Class 3. However, this may change as a result of the gamma walkover survey.
Final Sampling and Analysis Plan, Volume 1 – Field Sampling Plan Former Guterl Specialty Steel Corporation FUSRAP Site, Lockport, New York
5-31 01/18/07
5.3.6.4 Other Media in IA03 Surface water and sediment samples will be collected from the western and southern perimeter of the Landfill Area to look for possible overland migration of MED/AEC materials during times the Landfill Area was active or mined.
5.3.6.5 Assumption Basis for IA03 The general assumption basis for the characterization survey is presented in Section 5.3.2. The following paragraphs present assumptions specific to IA03.
The presence of radiological contamination in soils in IA03 has not been confirmed, with the exception of a limited area at the northeast corner of the Landfill Area. This area is a NYSDEC inactive hazardous waste site (NYSDEC, 2003), and as such NYSDEC has conducted several studies of this area. The chemical (non-radiological) sampling and analytical data are adequate.
Surface radiological data includes isotopic analyses of soils and are adequate except in the northeast corner of the landfill. Subsurface data in the Landfill Area are inadequate, as MED/AEC material initially deposited in the northeast corner may have been moved (and buried) as a result of later activities (land-filling, mining, and covering). NYSDEC excavated test pits and conducted borings in areas outside of the northeast corner, but samples were only field screened for radiological contaminants (that is, not sent for laboratory analysis). Subsurface radiological data are inadequate, as ORISE subsurface data (boreholes) were obtained only from locations with evidence of surface contamination.
Samples in the southern part of the landfill, from the marshy area, were also collected and analyzed by NYSDEC for chemical parameters; these samples were reported as “surface water” and “sediment” samples.
The Landfill Area is shown in Figure 1-2. Refer to ORISE Figures 34 and 36 included in Attachment 2 for presentation of the sampling locations, the ranges of summary measurements, and the approximate extent of the contamination in the Landfill Area (ORISE, 1999).
5.3.6.6 Survey Basis for IA03 Section 5.3.3 presents the general survey basis for the characterization survey effort.
Soil sample locations planned for IA03 are presented on Figure 5-12. ORISE (1999) and NYSDEC (1994) soil sampling results will be verified and used as appropriate to reduce the soil sampling efforts of the present survey. RI soil sampling locations have been designed to bound areas of contamination identified by ORISE and NYSDEC, as well as to fill potential subsurface data gaps.
Soil samples will be collected from the western and southern perimeter of the Landfill Area in the course of the Class 2 survey and analyzed for radiological parameters to evaluate potential overland migration of radiological contamination during times the landfill was active or mined.
Surface and subsurface soil samples will be collected in accordance with Section 5.4.3. Selection of recovered core intervals for on-site gamma spectroscopy laboratory analysis will be performed in accordance with the decision logic presented in Section 5.4.3.1.
Final Sampling and Analysis Plan, Volume 1 – Field Sampling Plan Former Guterl Specialty Steel Corporation FUSRAP Site, Lockport, New York
5-32 01/18/07
Wetland delineation may be needed if radiological material is found in the western or southern part of the Landfill Area.
5.3.7 IA04 – NCIDA Property (Excluding Excised Area, Landfill Area, and Building 24)
The total area of IA04 is approximately 211,000 m2 (52 acres), including areas occupied by buildings. The area occupied by buildings is approximately 12,000 m2 (3 acres), so the total outdoor area is approximately 199,000 m2.
During development of this FSP, the investigative area identified as IA04 during the TPP Meeting and in the DGAR was divided into subunits IA04A, IA04B, IA04C, and IA04D; the overall footprint of IA04 was not changed. The areas designated IA04A and IA04B were investigated by ORISE (1999); prior surveys have not been conducted in the areas designated IA04C or IA04D. Figure 1-2 shows the overall IA04 boundary. Figure 5-13 shows the areas designated IA04A and IA04B (roughly coinciding with ORISE Figures 33 and 35, respectively), and Figure 5-14 shows the areas designated IA04C and IA04D.
IA04 building exteriors will be considered to be non-impacted.
5.3.7.1 Class 1 Areas in IA04 (Subunit 4A) The ORISE survey detected several locations with radiological contamination greater than the screening levels. However, the survey did not adequately define the extent of this contamination. It is likely that some large portions of IA04A should be classified as Class 1, but this is uncertain.
The total Class 1 area in IA04 (Subunit 4A) is about 67,000 m2.
5.3.7.2 Class 2 Areas in IA04 (Subunit 4B) The ORISE survey conducted in this area did not detect radiological contamination greater than the screening levels (with the exception of location 270 which has now been incorporated into IA04A). The total Class 2 area is approximately 64,000 m2.
5.3.7.3 Class 3 Areas in IA04 (Subunits 4C and 4D, and Building Interiors) The total outdoor Class 3 area in IA04 (Subunit 4C) is approximately 31,000 m2.
The total outdoor Class 3 area in IA04 (Subunit 4D) is approximately 37,000 m2.
Building floors in IA04 (approximately 11,000 m2) will be surveyed as Class 3 areas; approximately 10,000 m2 are in IA04B and 1,000 m2 are in IA04D.
5.3.7.4 Other Media in IA04 Other media not included under IA07 or IA08 are not expected to be encountered in IA04.
5.3.7.5 Assumption Basis for IA04 The general assumption basis for the characterization survey is presented in Section 5.3.2. The following paragraphs present assumptions specific to IA04.
Final Sampling and Analysis Plan, Volume 1 – Field Sampling Plan Former Guterl Specialty Steel Corporation FUSRAP Site, Lockport, New York
5-33 01/18/07
As noted above, the area designated as IA04 during the TPP Meeting has been further broken down to four separate IAs for the Site RI. The areas designated IA04A and IA04B for the Site RI were investigated by ORISE (1999); prior surveys have not been conducted in the areas designated IA04C or IA04D.
Refer to Attachment 2 for ORISE data tables (13 through 16) and figures (33, 35, and 36) for presentation of the ORISE sampling locations, the ranges of summary measurements, and the approximate extent of the contamination in those areas covered by the ORISE survey (ORISE, 1999).
5.3.7.6 Survey Basis for IA04 Section 5.3.3 presents the general survey basis for the characterization survey effort.
The soil sample locations planned for IA04A and IA04B are presented on Figure 5-13, and locations planned for IA04C and IA04D are presented on Figure 5-14. ORISE (1999) sample results within IA04A and IA04B will be verified and used as appropriate to reduce the soil sampling efforts of the present survey. RI soil sampling locations have been designed to bound areas of contamination identified by ORISE, as well as to fill potential subsurface data gaps.
Surface and subsurface soil samples will be collected in accordance with Section 5.4.3. Selection of recovered core intervals for on-site gamma spectroscopy laboratory analysis will be performed in accordance with the decision logic presented in Section 5.4.3.1.
5.3.8 IA05 – Railroad Right-of-Way North of Site The total area of IA05 is approximately 24,300 m2 (6 acres). During development of this FSP, the investigative area identified as IA05 during the TPP Meeting and in the DGAR was divided into subunits IA05A and IA05B; the overall footprint of IA05 was not changed. The area designated IA05A between IA04 and NY Route 31 was investigated by NYSDEC (1999); prior surveys have not been conducted in the area designated IA05B. Figure 1-2 shows the overall IA05 boundary. Figure 5-15 shows the areas designated IA05A and IA05B.
5.3.8.1 Class 1 Areas in IA05 (Subunit 5A) Subunit IA05A has been designated as Class 1 based on the results of the NYSDEC (1999) survey. The total Class 1 area in IA05A is approximately 15,800 m2.
5.3.8.2 Class 2 Areas in IA05 (Subunit 5B) Subunit 1A05B has been designated Class 2 based on a review of available data. The total Class 2 area in IA05B is approximately 8,500 m2.
5.3.8.3 Class 3 Areas in IA05 IA05 has no Class 3 areas.
5.3.8.4 Other Media in IA05 Other media are not expected to be encountered in IA05.
Final Sampling and Analysis Plan, Volume 1 – Field Sampling Plan Former Guterl Specialty Steel Corporation FUSRAP Site, Lockport, New York
5-34 01/18/07
5.3.8.5 Assumption Basis for IA05 The general assumption basis for the characterization survey is presented in Section 5.3.2. The following paragraphs present assumptions specific to IA05.
The area of the NYSDEC (1999) USRADS survey has been designated IA05A. NYSDEC (1999) reported that “elevated uranium and thorium concentrations [were] found along the former rail spur at several locations up to about 600 ft north of the Allegheny Ludlum fence.” The findings included:
• Above background readings were found at the southern-most part of “manual survey #1,” (see Figure 5-16, extracted from NYSDEC 1999) on the back side of a mound of soil that was placed there during the leveling/filling work done behind the Lombardi property.
• Above background readings up to about 30,000 cpm at small spots located near what would have been the spur bed during “manual survey #2” (see Figure 5-16).
• Two areas with maximum count rates greater than 100,000 cpm were observed, at about 185 ft and at about 475 ft north of the intersection of two fences along the north boundary of the Allegheny Ludlum property. These areas are consistent with the disposal of radioactive waste along the rail spurs that served the steel mill. Some of the elevated areas have recognizable fire brick at or near the surface which will contribute to the measured radiation, but most of the above background readings were believed to result from uranium and thorium disposal.
• Elevated readings were noted on both sides of the former spur line (indicated by still-remaining railroad ties and northward extensions from those indications) over much of its length extending north to West Avenue.
• Radioactive material found consisted of small pieces of thorium metal, soil-like matrix containing mixtures of uranium and thorium, one location of identifiable small flakes containing uranium and thorium, slag, and fire brick.
The railroad right-of-way (ROW) is also shown on Figure 1-2.
5.3.8.6 Survey Basis for IA05 Section 5.3.3 presents the general survey basis for the characterization survey effort.
The GWS will be used to verify and validate the NYSDEC survey. Parts of IA05 may be reclassified to Class 1 or Class 3 as a result.
The soil sample locations planned for IA05A and IA05B are presented on Figure 5-15. NYSDEC (1999) scan data will be used to the extent possible to reduce the soil sampling efforts of the present survey. RI soil sampling locations have been designed to bound areas of contamination identified by NYSDEC, as well as to fill potential subsurface data gaps. Prior surveys have not been conducted in the area designated IA05B.
The GWS may locate discrete sources of radioactive material based on data presented in NYSDEC (1999). In such cases, as an ALARA measure, the sources will be recovered and handled as radioactive waste. However, it is noted that, in many cases, the discrete sources may not be easily recovered and disposed of. Several, if not dozens of “hot spot” pockets of highly
Final Sampling and Analysis Plan, Volume 1 – Field Sampling Plan Former Guterl Specialty Steel Corporation FUSRAP Site, Lockport, New York
5-35 01/18/07
concentrated soil contamination consisting of uranium and/or thorium may exists along the abandoned rail spur. A cursory survey of the area will allow for easy identification of these areas.
Surface and subsurface soil samples will be collected in accordance with Section 5.4.3. Selection of recovered core intervals for on-site gamma spectroscopy laboratory analysis will be performed in accordance with the decision logic presented in Section 5.4.3.1.
5.3.9 IA06 – Off-site Northeast Properties As determined during the data gap analysis, IA06 includes only non-impacted areas. Based on this determination, this IA has been characterized as non-impacted and no further characterization of this area is planned.
5.3.10 IA07 – Groundwater Evaluation of IA07, Groundwater, is presented in Section 5.4.4
5.3.11 IA08 – Site Utilities (Sewers and Drains)
5.3.11.1 Rationale and Design As reported in the DGAR, limited data exist about radioactive contamination in the sewers, drains, and trenches. Five trenches (in Buildings 3 and 8) and an oil-water separator between Buildings 2 and 3 were sampled by ORISE (1999) for radiological contaminants. NYSDEC (2000) reported that a surface water sample was collected from a sewer line in Building 3 (within the Excised Area), and the sample was submitted for radiological analysis, but the results were not included in the investigation report.
Radiological contamination exceeding the ORISE screening levels (and also the currently-proposed screening levels) was reported in some of the samples analyzed by ORISE, including equipment or trenches in Buildings 3 and 8. The DGAR noted that these data suggest that the residual materials in the production area floor trenches are a concern. Plant-wide utility drawings have been made available; however, field locations need to be verified.
Historical data indicate that an oil/water separator (OWS) with an overflow to the Erie Canal existed near the Erie Canal; it is possible that MED/AEC contaminated materials were present in water that may have been discharged to the Erie Canal via an overflow outfall. NYSDEC (2000) indicates that the OWS has been abandoned, and is no longer accessible. A review of available aerial photos confirms that the OWS and pump house no longer exist. No data were located for surface water or sediment samples associated with the Erie Canal. Therefore, surface water and sediment samples are planned as discussed in Section 5.4.5.3.
One goal of the assessment of the IA01 trenches will be to estimate the volume of aqueous waste that may require disposal. Therefore, the dimensions of the trenches will be determined, along with the volume of water in the trench.
Final Sampling and Analysis Plan, Volume 1 – Field Sampling Plan Former Guterl Specialty Steel Corporation FUSRAP Site, Lockport, New York
5-36 01/18/07
5.3.11.2 Field Procedures In order to characterize the potential nature and extent of possible MED/AEC-related contamination in site utilities, sewers and drains, and trenches a series of investigative techniques are proposed.
• Field-verify utilities per available facility drawings.
o During the mobilization phase of the RI field investigation, Earth Tech will
Field-verify the location and dimensions of the open trenches in the Excised Area
Field-audit the Excised Area and the NCIDA area for obvious signs of utilities that may not have been shown on the plant-supplied drawings (e.g., storm sewer catch basins, sanitary sewer manholes, roof drains, pavement cuts, etc.)
Field-audit the former OWS location near the Erie Canal to investigate potential surface soil, surface water, or sediment sample locations to investigate nature and extent of potential contamination.
Mark and map using civil survey methods any of the various features identified above. Determine trench dimensions, and volume of any standing liquids and/or sediments (probing).
• Sample residuals (aqueous and non-aqueous materials (e.g., sediment-like) remaining in floor drains, open trenches, lift stations, etc.) and materials of which sewers/drains are constructed.
o Aqueous and/or non-aqueous (sediment-like) samples (if both matrices are present) from open trenches or pits within the Excised Area buildings (IA01) will be collected in accordance with the procedures outlined in Section 5.4.5.3. Aqueous and non-aqueous samples will be analyzed for COPCs by gamma spectroscopy (non-aqueous only), alpha spectroscopy (U, Th) and EPA method 903/904 (Ra), The estimated number of sample locations includes:
Building 1 Basement 4 pair within flooded basement
Building 2 None known 0 pair
Building 3 Open trench Minimum 1 pair per 50 linear ft; 4 pair total
Furnace pits 1 pair per furnace; 4 pair total
Building 4/9 Covered (steel plate) floor drain
Minimum 1 pair per 50 linear ft; 4 pair total
Building 5 None known 0 pair
Final Sampling and Analysis Plan, Volume 1 – Field Sampling Plan Former Guterl Specialty Steel Corporation FUSRAP Site, Lockport, New York
5-37 01/18/07
Building 6/8 Open trench Minimum 1 pair per 50 linear ft; 4 pair total
Building 24 Floor drains Minimum 1 pair per 50 linear ft; 6 pair total
o Sample residuals (water and/or solids remaining in storm sewer lines, catch basins, meter pits, etc.) within IA01, IA02, and IA04. Aqueous and non-aqueous samples will be analyzed for COPCs by gamma spectroscopy (non-aqueous only), alpha spectroscopy (U, Th), and EPA method 903/904 (Ra). The estimated number of sample locations includes:
IA01 Previously undiscovered drains Assume 4 pair total
IA02 Roof drains, storm drains Assume 4 pair total
IA04 Sewers or drains discharging from IA01/IA02 Assume 2 pair total
• Sediment and surface water samples will be analyzed at the off-site, fixed laboratory. Sample preparation and handling will be conducted in accordance with Section 6 and Section 7 of this FSP.
5.3.12 IA09 – Erie Barge Canal
5.3.12.1 Rationale and Design As reported in the DGAR, the Erie Canal adjacent to the Site was evaluated as part of IA08; however, during development of the FSP a technical adjustment was made to identify this potentially affected area as a separate IA. Figure 5-17 shows the area designated as IA09.
As noted in Section 5.3.11.1, five trenches (in Buildings 3 and 8) and an oil-water separator between Buildings 2 and 3 were sampled by ORISE (1999) for radiological contaminants. Radiological contamination exceeding the ORISE screening levels (and also the currently-proposed screening levels) was reported in some of the samples analyzed by ORISE, including equipment or trenches in Buildings 3 and 8. In addition, historical data indicate that an OWS with an overflow to the Erie Canal existed near the Erie Canal. The presence of radioactive contamination in the Site sewers, drains, or trenches may create a pathway for the contamination to have been discharged to the Erie Canal.
No data were located for surface water or sediment samples associated with the Erie Canal. Therefore, four transects consisting of three paired surface water and sediment samples will be collected. The four transects will be located as follows:
• Locate paired surface water and sediment samples along each transect at 25 percent, 50 percent, and 75 percent of transect width.
o Collect aqueous sample from mid-point of water column.
o Collect sediment sample from top six inches of sediment.
Final Sampling and Analysis Plan, Volume 1 – Field Sampling Plan Former Guterl Specialty Steel Corporation FUSRAP Site, Lockport, New York
5-38 01/18/07
• One transect to be located upstream of potential Site influence.
• One transect to be located immediately east of the Route 93 overpass (assumed to be more than 100 feet removed from any potential Excised Area (i.e., IA01 and IA02) outfalls).
• Two transects located between the upstream and downstream points, as follows:
o Space equidistant between upstream and downstream transects if no specific Excised Area outfalls are located.
o If only one Excised Area outfall is located, place one transect at the outfall point and one spaced equidistant between the outfall and the most downstream transect.
o If two Excised Area outfalls are located, place transects at each outfall.
o If three or more outfalls are located, consult with USACE before proceeding.
Surface water samples will be analyzed by alpha spectroscopy (U, Th) and EPA method 903/904 (Ra). Each sediment sample will be analyzed for COPCs by gamma spectroscopy and alpha spectroscopy (U, Th); and 50 percent of the sediment samples will be analyzed for isotopic Ra (EPA method 903/904) and total organic carbon.
5.3.12.2 Field Procedures In order to characterize the potential nature and extent of possible MED/AEC-related contamination in the Erie Barge Canal adjacent to the Site, the following investigation will be completed.
• Field-verify IA08 outfalls to the Erie Canal (refer to Section 5.3.11.2).
• Confirm direction of flow within Erie Canal to determine upstream and downstream directions.
• Collect surface water and sediment samples at the approximate locations shown on Figure 5-17 allowing for field conditions noted in Section 5.3.12.1.
• Collect surface water and sediment samples in accordance with the field procedures described in Section 5.4.5.3.
Surface water and sediment samples will be analyzed at the off-site, fixed laboratory. Sample management and handling will be conducted in accordance with Section 6 and Section 7 of this FSP, respectively.
5.3.13 IA10 – Lot 4.1 (“Lombardi Property”) The total area of IA10 is approximately 6,400 m2 (1.6 acres). This IA was evaluated in the DGAR within IA03 and IA05; however, during development of the FSP a technical adjustment was made to identify this potentially affected area as a separate IA.
5.3.13.1 Class 1 Areas in IA10 IA10 has no Class 1 areas.
Final Sampling and Analysis Plan, Volume 1 – Field Sampling Plan Former Guterl Specialty Steel Corporation FUSRAP Site, Lockport, New York
5-39 01/18/07
5.3.13.2 Class 2 Areas in IA10 IA10 will be surveyed as a Class 2 area.
The total Class 2 area is approximately 6,400 m2.
5.3.13.3 Class 3 Areas in IA10 IA10 has no Class 3 areas.
5.3.13.4 Other Media in IA10 Other media are not expected to be encountered in IA10.
5.3.13.5 Assumption Basis for IA10 The general assumption basis for the characterization survey is presented in Section 5.3.2. The following paragraphs present assumptions specific to IA10.
This IA was evaluated in the DGAR within the context of IA03 and IA05; however, during development of the FSP a technical adjustment was made to identify this potentially affected area as a separate IA. This IA is defined as Lot 4.1 (Tax Map 108.20; Niagara County Real Property Tax Services, 2004), and is located immediately north of the northeast portion of IA03, and immediately west of the southwest portion of IA05. This privately owned parcel was partially investigated in 1999 by NYSDEC. Field inspection (NYSDEC, 1999) and analysis of aerial photos (USACE, 2006a) identified the potential for FUSRAP-related materials to have been inadvertently moved onto this IA as a result of land development activity. In prior reports, this IA has been referred to as the “Lombardi Property.”
This IA will be surveyed because the New York State Department of Environmental Conservation (NYSDEC, 1999) reported that “elevated uranium and thorium concentrations [were] found along the former rail spur at several locations up to about 600 ft north of the Allegheny Ludlum fence.” This rail spur is immediately adjacent to the Lombardi property. Specifically:
• Above background readings were found at the southern-most part of “manual survey #1,” (see Figure 5-16, extracted from NYSDEC 1999) on the back side of a mound of soil that was placed there during the leveling/filling work done behind the Lombardi property.
• Above background readings up to about 30,000 cpm at small spots located near what would have been the spur bed during “manual survey #2” (see Figure 5-16).
• Two areas with maximum count rates greater than 100,000 cpm were observed, at about 185 ft and at about 475 ft north of the intersection of two fences along the north boundary of the Allegheny Ludlum property. These areas are consistent with the disposal of radioactive waste along the rail spurs that served the steel mill. Some of the elevated areas have recognizable fire brick at or near the surface which will contribute to the measured radiation, but most of the above background readings were believed to result from uranium and thorium disposal.
Final Sampling and Analysis Plan, Volume 1 – Field Sampling Plan Former Guterl Specialty Steel Corporation FUSRAP Site, Lockport, New York
5-40 01/18/07
• Elevated readings were noted on both sides of the former spur line (indicated by still-remaining railroad ties and northward extensions from those indications) over much of its length extending north to West Avenue.
• Radioactive material found consisted of small pieces of thorium metal, soil-like matrix containing mixtures of uranium and thorium, one location of identifiable small flakes containing uranium and thorium, slag, and fire brick.
The location of IA10 relative to IA03 and IA05 is shown on Figure 1-2.
5.3.13.6 Survey Basis for IA10 Section 5.3.3 presents the general survey basis for the characterization survey effort.
The GWS will be used to verify and validate the NYSDEC survey. Parts of IA10 may be reclassified to Class 1 or Class 3 as a result.
The soil sample locations planned for IA10 are presented on Figure 5-18. NYSDEC (1999) scan data will be used to the extent possible to reduce the soil sampling efforts of the present survey. RI soil sampling locations have been designed to bound areas of contamination identified by NYSDEC, as well as to fill potential subsurface data gaps. Prior surveys have not been conducted over the majority of the area designated IA10.
The GWS may locate discrete sources of radioactive material based on data presented in NYSDEC (1999). In such cases, as an ALARA measure, the sources will be recovered and handled as radioactive waste. However, it is noted that, in many cases, the discrete sources may not be easily recovered and disposed of. Several, if not dozens of “hot spot” pockets of highly concentrated soil contamination consisting of uranium and/or thorium may exists along the abandoned rail spur. A cursory survey of the area will allow for easy identification of these areas.
Surface and subsurface soil samples will be collected in accordance with Section 5.4.3. Selection of recovered core intervals for on-site gamma spectroscopy laboratory analysis will be performed in accordance with the decision logic presented in Section 5.4.3.1.
5.4 CHARACTERIZATION SURVEY DESIGN Survey design will be such that results of the characterization survey include:
• Identification and distribution of contamination in buildings, structures, and other Site facilities
• Concentration and distribution of contaminants in surface and subsurface soils
• Distribution and concentration of contaminants in groundwater, surface water, and sediments
• Distribution and concentration of contaminants in other impacted media
Personnel conducting the survey will be trained and qualified in the procedures they will use.
Final Sampling and Analysis Plan, Volume 1 – Field Sampling Plan Former Guterl Specialty Steel Corporation FUSRAP Site, Lockport, New York
5-41 01/18/07
5.4.1 Instrumentation Instrumentation and measurement techniques will be selected based on detection sensitivity to provide technically defensible results that meet the objectives of the survey. Because of the uncertainty associated with interpreting scanning results, the detection sensitivity of the selected instruments will be as far below the screening levels as possible within time and resource constraints. For direct measurements and sample analyses, minimum detectable concentrations (MDCs) less than 10 percent of the screening levels are preferable while MDCs up to 50 percent of the screening level are acceptable.
Table 5-10 (adapted from MARSSIM Table 4.1) presents the recommended survey methods that have proven to be effective for uranium and thorium based on past survey experience in the decommissioning industry. This table provides a general indication of the detection capability of commercially-available instruments. One or more of each of these instruments will be used during the survey. Attachment 3 presents examples of some of the equipment that will be used in this survey.
5.4.1.1 Selection of Instruments Detector selection will depend on the survey to be performed, surface contours and survey area size. The project team will normally use a dual phosphor 125-cm2 zinc sulfide (ZnS) scintillation detector (Ludlum 43-89 or equivalent) or 545-cm2 gas flow proportion counter (Ludlum 43-37 or equivalent) for direct alpha and beta measurements. As a general example, Table 5-10 lists appropriate instrumentation for various direct measurement techniques.
Swipes for removable alpha and beta activity will be analyzed using the Ludlum Model 2929 coupled with a Ludlum Model 43-10-1 detector, or equivalent.
Field radiation measurements will be collected for purposes of documenting environmental exposure, assisting in field decisions, and possibly correlating them with the results of sampling. Surface soil sample locations will be screened by measuring and recording gamma radiation using Ludlum Model 19A microR meters, Inspector 1000s coupled to 2 inch × 2 inch sodium iodide (NaI) detectors, and other similar equivalent gamma detectors.
The following SOPs, included in Attachment 1, provide detailed procedures for radiological instrument measurement activities:
• SOP 1, Portable Detection Equipment
• SOP 2, Swipe Counter
• SOP 4, Equipment Decontamination
• SOP 6, General Radiological Equipment Checklist
• SOP 11, Radiological Survey and Postings
• SOP 12, Swipe Samples
SOPs for the onsite laboratory gamma spectroscopy laboratory will be included in the Laboratory Quality Management Plan (LQMP) (additional detail presented in Section 3.6 of the QAPP) which will be submitted under separate cover for USACE approval prior to mobilization for the field characterization surveys.
Final Sampling and Analysis Plan, Volume 1 – Field Sampling Plan Former Guterl Specialty Steel Corporation FUSRAP Site, Lockport, New York
5-42 01/18/07
5.4.1.2 Instrument Calibration All instruments shall be calibrated by a qualified calibration/repair facility at least annually in accordance with manufacturers’ instructions. Sources used in calibration will be National Institute of Standards and Technology (NIST)-traceable. A calibration certificate will be maintained on-site for each instrument and included in the project final report. See SOP 1, Portable Detection Equipment, and SOP 2, Swipe Counter, in Attachment 1.
Each instrument shall be checked at the beginning, middle, and end of each shift with check sources to verify that its response is within ± 20 percent of the value established by the calibration laboratory for that instrument/check source/geometry combination. If the instrument fails the post-survey source check, all data collected during that time period with the instrument must be reviewed and adjusted or discarded as appropriate. The affected data shall be flagged and later studied by the SRSO to determine if they are useable.
Each item of survey equipment shall meet function response requirements before and during its use. Control charts shall be maintained to monitor the performance of field instruments for the duration of the project in accordance with SOP 1 and SOP 2. If survey equipment requires repair during a workday, it shall be repaired and its proper function verified before it is returned to use.
5.4.1.3 ISOCS QA Quality assurance for the ISOCS will be verified by tracking peak energy, peak resolution, and net peak area for a high and low energy peak, based on daily counts of a NIST-traceable source. These quality assurance checks will be performed in accordance with the instrument’s SOP.
Instrument control charts will be generated and evaluated in accordance with the following guidelines. If all QA parameter results are within the acceptable “investigation level” range, the ISOCS system shall be approved for routine use during the remainder of that day. The investigation level range encompasses ± 1 keV for the peak energy trend and ± 2σ for the resolution and net peak area trends.
If any of the results are outside the “investigation level” range but still within the “action level” range, the QC calibration check count shall be repeated and the event noted in the project logbook. If the peak energy trend falls outside of 1-keV band, then the ISOCS shall be taken out of service until the problem is resolved. If the results of the second count are within the acceptable “investigation level” range, the ISOCS system shall be approved for routine use.
If the results of the second count are outside the “investigation level” range or the results of any count are outside the “action level” range (± 3σ), the ISOCS system shall be taken out of service until the problem is resolved. This event should also be noted in the project logbook.
After performing any significant corrective actions, the Health Physicist shall require two consecutive QC calibration check counts with acceptable results before approving the system for routine use. Additionally, the Health Physicist will review each spectral data report and include them as appendices to the final project report along with the nuclide identification/quantification libraries used.
A background spectrum will be collected once each day for information purposes. Any significant changes in the background spectrum will be reviewed by the Health Physicist.
Final Sampling and Analysis Plan, Volume 1 – Field Sampling Plan Former Guterl Specialty Steel Corporation FUSRAP Site, Lockport, New York
5-43 01/18/07
Duplicate analyses of field scans will also be performed for quality assurance purposes on ten percent of the performed measurements and evaluated in accordance with the Site QAPP.
5.4.1.4 Onsite Gamma Spectroscopy Laboratory The primary purpose and benefit of the onsite gamma spectroscopy laboratory is to provide reliable near-real-time results to permit the survey team to locate and take additional samples where contamination is identified in order to ensure that the contamination is bounded to within an appropriate distance. The onsite gamma spectroscopy laboratory will be used to analyze selected surface soil and subsurface soil samples (see Section 5.4.3) for radiological COPCs. SOPs for the onsite gamma spectroscopy laboratory will be included in the LQMP (additional detail presented in Section 3.6 of the QAPP) which will be submitted under separate cover for USACE approval prior to mobilization for the field characterization surveys.
5.4.1.5 Minimum Detectable Concentrations The following sections describe how the Minimum Detectable Concentrations (MDCs) will be determined for field equipment (as opposed to the onsite gamma spectroscopy laboratory which will be addressed in the LQMP).
5.4.1.5.1 Static Minimum Detectable Concentrations According to MARSSIM, the critical level (LC) is the level, in counts, at which there is a 5 percent statistical probability of incorrectly identifying a measurement system background value as greater than background. Any response above this level is considered to be greater than background. The detection limit (LD) is an a priori estimate of the detection capability of a measurement system and is also reported in units of counts. The MDC is the detection limit (counts) multiplied by an appropriate conversion factor to give units consistent with a site guideline, such as pCi/g or dpm/100 cm2. In other words, the MDC is the a priori net activity level above the critical level that an instrument can be expected to detect 95 percent of the time,
MARSSIM explains how to calculate LC, LD, and MDC and arrives at the following result (MARSSIM Equation 6-7) for the static MDC:
Static MDC = C [3 + 4.65 × B½].
C represents total detection and efficiency and other constants or factors needed to put the static MDC into appropriate units and B is the number of background counts that are expected to occur while performing an actual measurement. All static counts will be taken in 1 minute.
For the present purposes,
2
2
cm 100cm 1001
×=siA
Cεε
.
A is the effective area of the probe, εi is the instrument or detector efficiency, εs = 0.5 is the efficiency of the contamination source, and the final factor, which equals 1, helps put the units of scan MDC into dpm/100 cm2.
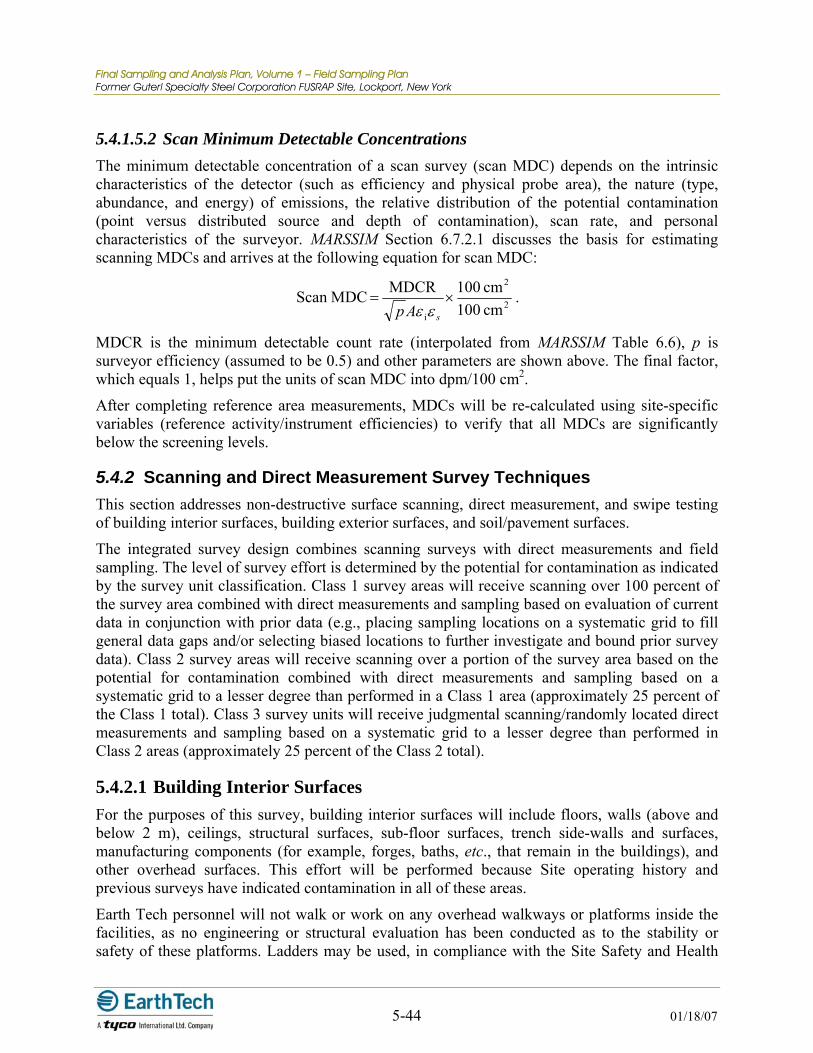
Final Sampling and Analysis Plan, Volume 1 – Field Sampling Plan Former Guterl Specialty Steel Corporation FUSRAP Site, Lockport, New York
5-44 01/18/07
5.4.1.5.2 Scan Minimum Detectable Concentrations The minimum detectable concentration of a scan survey (scan MDC) depends on the intrinsic characteristics of the detector (such as efficiency and physical probe area), the nature (type, abundance, and energy) of emissions, the relative distribution of the potential contamination (point versus distributed source and depth of contamination), scan rate, and personal characteristics of the surveyor. MARSSIM Section 6.7.2.1 discusses the basis for estimating scanning MDCs and arrives at the following equation for scan MDC:
2
2
i cm 100cm 100MDCR MDCScan ×=
sAp εε.
MDCR is the minimum detectable count rate (interpolated from MARSSIM Table 6.6), p is surveyor efficiency (assumed to be 0.5) and other parameters are shown above. The final factor, which equals 1, helps put the units of scan MDC into dpm/100 cm2.
After completing reference area measurements, MDCs will be re-calculated using site-specific variables (reference activity/instrument efficiencies) to verify that all MDCs are significantly below the screening levels.
5.4.2 Scanning and Direct Measurement Survey Techniques This section addresses non-destructive surface scanning, direct measurement, and swipe testing of building interior surfaces, building exterior surfaces, and soil/pavement surfaces.
The integrated survey design combines scanning surveys with direct measurements and field sampling. The level of survey effort is determined by the potential for contamination as indicated by the survey unit classification. Class 1 survey areas will receive scanning over 100 percent of the survey area combined with direct measurements and sampling based on evaluation of current data in conjunction with prior data (e.g., placing sampling locations on a systematic grid to fill general data gaps and/or selecting biased locations to further investigate and bound prior survey data). Class 2 survey areas will receive scanning over a portion of the survey area based on the potential for contamination combined with direct measurements and sampling based on a systematic grid to a lesser degree than performed in a Class 1 area (approximately 25 percent of the Class 1 total). Class 3 survey units will receive judgmental scanning/randomly located direct measurements and sampling based on a systematic grid to a lesser degree than performed in Class 2 areas (approximately 25 percent of the Class 2 total).
5.4.2.1 Building Interior Surfaces For the purposes of this survey, building interior surfaces will include floors, walls (above and below 2 m), ceilings, structural surfaces, sub-floor surfaces, trench side-walls and surfaces, manufacturing components (for example, forges, baths, etc., that remain in the buildings), and other overhead surfaces. This effort will be performed because Site operating history and previous surveys have indicated contamination in all of these areas.
Earth Tech personnel will not walk or work on any overhead walkways or platforms inside the facilities, as no engineering or structural evaluation has been conducted as to the stability or safety of these platforms. Ladders may be used, in compliance with the Site Safety and Health
Final Sampling and Analysis Plan, Volume 1 – Field Sampling Plan Former Guterl Specialty Steel Corporation FUSRAP Site, Lockport, New York
5-45 01/18/07
Plan, Ladders, to access elevated work areas. Such ladders will be inspected prior to each use. Alternately, man-lifts, including scissor and boom lifts, may be used, in accordance with the Site Safety and Health Plan. Appropriate fall protection will be used by employees in man-lifts. Cones or other demarcation will be used to prevent workers from entering the area below the man lift when in use.
The primary objective of the building characterization effort is to provide data sufficient to plan future actions such as decontamination, demolition, radioactive waste disposal, or final status surveys. The survey design is not necessarily intended to conclusively demonstrate compliance with regulatory standards, although data may ultimately be used to support that purpose.
5.4.2.1.1 Class 1 Surfaces Floors will be 100-percent surveyed with the ISOCS or a floor monitor. Commensurate with safety considerations, other surfaces will be measured by the ISOCS if possible or 100-percent scanned with an appropriate instrument otherwise. A swipe test and static measurement will be taken at the location of the highest concentration detected by scanning or by the ISOCS in each 10-m grid square or other surface or, if no contamination is detected, at the center of the grid square. Exposure rate measurements at 1 m from floor and other surfaces will be performed at a frequency of 1 systematic measurement per every 4 m2.
5.4.2.1.2 Class 2 Surfaces A minimum of 30 measurement locations each, on vertical and horizontal surfaces where radioactive material would likely accumulate, (air exhaust vents and horizontal surfaces where dust would settle) will be surveyed. To assure a reasonable coverage of these surfaces, an average of at least 1 measurement location per 20 m2 of surface area will be selected. The ISOCS will be used for these measurements whenever possible. If the ISOCS can not be used for a 20-m2 section and the section is otherwise safely accessible, a scan of the surface will be performed to identify the presence of any elevated activity levels, followed by the measurement.
Scanning will cover at least 25 percent of the surface. If scans or measurements indicate residual activity exceeding 25% of the screening level, the surface will be considered potentially contaminated and the surface exhibiting such levels will be surveyed in the same manner as Class 1 surfaces to determine whether reclassification is necessary. Exposure rate measurements at 1 m from floor and other surfaces will be performed at a frequency of 1 systematic measurement per every 16 m2.
5.4.2.1.3 Class 3 Surfaces MARSSIM says, “Class 3 survey units receive judgmental scanning and randomly located measurements.” Therefore, Class 3 surfaces will be surveyed similar to Class 2 surfaces but to a lesser extent based on the professional judgments of the Project Manager and Project Health Physicist. For example, if they are contaminated, upper walls and ceilings are likely to be contaminated uniformly from dust deposition, so one or two measurements may suffice to adequately characterize these Class 3 areas.
As a general guideline for the beginning of the survey, the survey coverage of Class 3 areas will be approximately 5 percent to 10 percent of the area and the number of samples per unit area will
Final Sampling and Analysis Plan, Volume 1 – Field Sampling Plan Former Guterl Specialty Steel Corporation FUSRAP Site, Lockport, New York
5-46 01/18/07
be approximately one-fourth of the number for Class 2 areas (i.e., one measurement location per 80 m2). As site experience is gained, these percentages may change. For example, if no significant contamination is found on the first few ceilings surveyed, it may be reasonable to assume that additional surveys on ceilings are unnecessary.
5.4.2.1.4 Swipe Test Counting Swipe samples will be collected in accordance with SOP 12. Swipe test samples will be analyzed onsite for gross alpha and beta activity in accordance with SOP 2 using appropriate on-site instrumentation. Table 5-8 presents an estimated count of swipe tests for IA01. SOPs for swipe testing and counting are presented in Attachment 1, and typical on-site instrumentation is presented in Attachment 3.
5.4.2.2 Building Exterior Surfaces Building exterior surfaces will typically have a low potential for residual contamination. They normally will be classified as Class 3 surfaces and so will be surveyed similarly to Class 3 interior surfaces. As a general guideline for the beginning of the survey, the survey coverage of Class 3 areas will be approximately 5 percent to 10 percent of the area and the number of samples per unit area will be approximately one-fourth of the number for Class 2 areas (i.e., one measurement location per 80 m2). As site experience is gained, these percentages may change. For example, if no significant contamination is found on the first few roofs surveyed, it may be reasonable to assume that additional surveys on roofs are unnecessary.
The ISOCS will be used whenever possible, preferably set back with a large field of view, so that large areas may be surveyed at one time. If significant COPC contamination (more than 10 percent of the applicable screening level) is found, the ISOCS will be moved closer with a smaller field of view to better locate the contamination.
On buildings with roof exhausts, roof contamination will be investigated. Because roofs are periodically resurfaced, although this has not been confirmed for this site, contaminants may have been trapped in roofing material, and samples of this material may have to be obtained. Exterior locations near wall penetrations for process equipment, piping, and exhaust ventilation; roof drainage points such as drip-lines along overhangs, downspouts, and gutters; and window ledges and outside exits (doors, doorways, landings, stairways, etc.) from former contamination control areas will be surveyed.
Earth Tech personnel may use ladders or man-lifts to access elevated work areas. Use of ladders and/or man-lifts will be in accordance with the SSHP. Appropriate fall protection will be used by employees in man-lifts. Cones or other demarcation will be used to prevent workers from entering the area below the man lift when in use.
5.4.2.3 Soil and Pavement Surfaces Exposure rates will be measured at 1 m above surfaces.
5.4.2.3.1 Class 1 Soil and Pavement Surfaces Prior to soil sampling and static gamma radiation measurements, survey areas will be 100-percent gamma-scanned as described in the GWS Plan (submitted under separate cover) to
Final Sampling and Analysis Plan, Volume 1 – Field Sampling Plan Former Guterl Specialty Steel Corporation FUSRAP Site, Lockport, New York
5-47 01/18/07
identify the presence of elevated direct radiation that might indicate residual gross activity or hot-spots. Exposure rate measurements at 1 m from the surface will be performed at a frequency of 1 systematic measurement per every 400 m2.
5.4.2.3.2 Class 2 Soil and Pavement Surfaces Surface scanning of Class 2 soil and pavement will be performed similarly to Class 1 soil and pavement except that scanning will cover only 25 percent of the surface.
5.4.2.3.3 Class 3 Soil and Pavement Surfaces Class 3 soil and pavement will be surveyed similar to Class 2 soil and pavement but to a lesser extent based on the professional judgments of the Project Manager and Health Physicist, similarly as discussed above in Section 5.4.2.1.3.
5.4.3 Surface and Subsurface Soil (Volumetric)
5.4.3.1 Rationale and Design
5.4.3.1.1 Soil Sampling Locations As noted in Section 5.3.2, significant data are available from prior investigations to provide preliminary guidance for the current RI soil sampling program. Initial surface/subsurface soil sample locations have been developed based on IA-specific data evaluations presented in Section 5.3.4 through Section 5.3.13. Soil sample locations are shown on Figures 5-3 through 5-15, and 5-17 and 5-18. Soil sample analyses are summarized on Table 5-6 and Table 5-9.
This FSP is also designed to incorporate, to the extent possible, prior investigation data into the real-time decision making process during the execution of the current RI. The first step in this process is to compare the preliminary GWS data and building scan data against the currently designed soil sampling locations. Should the GWS or preliminary scan data identify previously unknown areas of concern, adjustments to surface and subsurface soil sample locations will be made to investigate the newly identified areas.
The second step in the process is to evaluate onsite gamma spectroscopy and offsite gamma and alpha spectroscopy COPC analytical data to determine whether the nature and extent of contamination has been adequately characterized in the horizontal (x,y) and vertical (z) directions. To that end, a pair of decision logic diagrams has been developed to help guide the technical team in determining the most appropriate “next step” when evaluating surface and subsurface soil data. Figure 5-19 presents the decision path for determining which intervals of a soil core should be selected for onsite gamma spectroscopy analysis for COPCs. Figure 5-20 presents the decision path for determining whether identified contamination has been adequately bounded. Use of the two figures is incorporated in the following sections.
5.4.3.1.2 Decision Logic for Onsite and Offsite Gamma Spectroscopy COPC Analysis Whenever possible, soil samples will be collected using Geoprobe® soil sampling techniques. The Geoprobe core will be taken down in 0.6 m (2 foot) intervals to a depth of 6 m (e.g., Landfill
Final Sampling and Analysis Plan, Volume 1 – Field Sampling Plan Former Guterl Specialty Steel Corporation FUSRAP Site, Lockport, New York
5-48 01/18/07
Area) or to refusal, whichever is less. Upon retrieval, the recovered core will be screened using one of two methods:
• Hand-held instrumentation: The recovered soil core will be laid lengthwise on a suitable surface (workbench, etc.) and scanned with a Ludlum Model 44-10 Gamma Scintillator or equivalent. The hand-held scanner will be passed over the soil core and readings will be noted for every 6-inch interval of core.
• Automated core scanner: The recovered soil core will be transported to a central location for scanning using an automated core scanner. The core will be scanned in a device containing two diametrically opposed 2-inch × 2-inch NaI(Tl) gamma scintillator detectors mounted in a unit with a calibrated track that will advance the core through the scanner in 4-inch intervals. The core scanner will be outfitted with an electronic data recording system to allow for electronic data transfer, minimizing the potential for transcription error. The automated core scanner method will be the preferred method for core scanning.
The core-scan data will be reviewed in accordance with Figure 5-19. The default soil sampling assumption will be that three soil samples will be collected at each designated soil sample location (one surface and two subsurface; or if no surface soil sample, then three subsurface soil samples). Specific considerations when reviewing the core scan data include:
• The procedure applies to both indoor and outdoor sample/boring locations.
• Soil samples segregated for onsite gamma spectroscopy analysis will be derived from the section of core between about 5 cm above and 5 cm below the target 4-inch interval; i.e., the core interval analyzed will have a length l equal to 5 cm + 10 cm + 5 cm = 20 cm. The diameter of the sample core that will be used is 2.5 inches = 6.35 cm, so the volume of this sample from the core will be V = ¼πd2l = 0.25 × π × 6.35 cm × 6.35 cm × 20 cm = 633 cm3, which is sufficient after vegetation and rocks have been removed, to provide a 500 cm3 = 500 mL soil sample. The range of the depth of the sample will be recorded for each sample.
• If evaluation of GWS data, scan data, ORISE data, or professional judgment suggests the possibility of surface contamination above screening levels, the surface soil sample (top 20-cm) will be analyzed in the onsite gamma spectroscopy laboratory for COPCs.
o Surface soil samples will be collected for onsite laboratory gamma spectroscopy analysis at a frequency of not less than 50 percent of soil sample locations for each respective IA; e.g., 40 sample locations in an IA generates at least 20 surface soil samples in that IA distributed to account for high and low scan readings, as well as spatial coverage of the IA.
• The subsurface sample with the highest scan result will be analyzed for COPCs at the onsite gamma spectroscopy laboratory.
• The subsurface sample, 20 cm long, from a depth greater than that of the previous sample, that the core scan indicates is approaching background count-rate levels (the “bounding” sample) will be analyzed for COPCs at the onsite gamma spectroscopy laboratory.
Final Sampling and Analysis Plan, Volume 1 – Field Sampling Plan Former Guterl Specialty Steel Corporation FUSRAP Site, Lockport, New York
5-49 01/18/07
• If the core scan does not indicate elevated activity, then analysis of the same vertical interval as the nearest horizontal exceedance will be analyzed; e.g., surface soil interval 20 m north was above screening levels, then analyze surface soil interval in the subject core. [This procedure is not to be confused with bounding contamination described in the next section, but rather is a default position as the pre-determined sample locations are completed.]
Finally, of the total number of samples analyzed in the field screening laboratory, five percent or 100, whichever number is greater, will be sent to the fixed analytical laboratory for gamma spectroscopic analysis for COPCs. These samples will be selected as a representative variety of high and low scan values and of the vertical and horizontal distributions. The purpose of these second measurements is to obtain results from an accredited laboratory that can be used to corroborate and/or to correlate (provide a correction factor for) the field screening laboratory results.
5.4.3.1.3 Decision Logic for Offsite Alpha Spectroscopy Analyses A limited number of soil samples will be selected for offsite alpha spectroscopy analysis for COPCs. All of the samples selected for offsite alpha spectroscopy analysis will be analyzed for uranium and thorium COPCs; one-half (i.e., 50 percent) of those samples will also be analyzed for radium COPCs. The selection of samples for offsite alpha spectroscopy analysis is dependent upon several factors, including:
• The current arrangement of IAs is anticipated to approximate exposure units that will be evaluated during the feasibility study/risk assessment. An approximate total of 12 to 30 samples per IA and per medium (i.e., surface and subsurface soil), depending on the nature and size of the IA, will be collected to accommodate risk assessment.
• For the purposes of this assessment, surface soil samples can be defined as 0 to 6 inch depth.
• Exposure point samples need to be alpha spec samples.
• Samples for offsite alpha spectroscopy analysis will be selected to ensure that each exposure unit/point is characterized at the surface and to full depth. Sample selection at depth will be determined using a decision tree based on onsite gamma spectroscopy laboratory data.
• Samples for offsite alpha spectroscopy analysis will be selected from those with the highest scan values.
• A secondary purpose of these analyses is to obtain results from an accredited laboratory that can be used to corroborate and/or to correlate (provide a correction factor for) the field screening laboratory results.
5.4.3.1.4 Offsite Analyses to Evaluate for Enriched/Recycled Uranium Additional data will be collected to evaluate the presence of enriched and recycled uranium. Presence of 236U indicates recycled uranium; enhanced abundances of 234U and 235U indicate enriched uranium. A limited number of samples (anticipated to be 12) will be selected from the
Final Sampling and Analysis Plan, Volume 1 – Field Sampling Plan Former Guterl Specialty Steel Corporation FUSRAP Site, Lockport, New York
5-50 01/18/07
offsite laboratory alpha spectroscopic analyses that have significantly elevated uranium activities to also undergo inductively coupled plasma – mass spectroscopy (ICP-MS) analysis for uranium isotopes to determine the relative abundances of 234U, 235U, U-236, and 238U to be used to evaluate the presence of recycled or enriched uranium. A similar number of background samples will also be analyzed by ICP-MS.
Gross alpha and gross beta radiation analyses will also be performed on the above samples for comparison to values from alpha spectroscopy and/or mass spectroscopy for COPC total alpha and total beta emissions.
5.4.3.1.5 Decision Logic for Biased Horizontal Bounding As noted above, prior data as well as ongoing RI-generated data will be used together to determine whether horizontal bounding of identified contamination has been adequately determined. As the data are generated and entered into the RI sample database (see Section 6.1), the data will be reviewed and the decision logic presented in Figure 5-20 will be applied to determine if contamination has been adequately bounded. If the contamination above screening levels has not been bounded based on application of the decision logic, then a new biased sampling location will be installed. The selection of sample intervals will be biased by the desire to bound the specific interval(s) in question.
In order to meet the project DQOs, the tolerable uncertainty for bounding contamination has been set at 5 m. Using assumed location point G (for greater than screening levels) and assumed location point L (for lower than screening levels) located a distance more than 10 m apart, it can be seen that a new boring location is required between point G and point L to reduce the uncertainty for the limits of contamination above screening levels to less than half the distance between the two points (i.e., point P). When considering the decision logic, it is important to note that the final point P is not “confirmed as clean.” It represents the assumed boundary, within tolerance, between “clean” and “contaminated above screening levels.” The region between P and G is assumed “contaminated” and the region between P and L is assumed “clean.” The real boundary, wherever it is, is less than the tolerable distance from P (≤5 m in this case), which is the intended goal of the biased sampling. Therefore, the error in calculating volume estimates will not be more than 5 m.
The decision logic will be applied in all horizontal directions (i.e., to also include diagonals across a square grid).
5.4.3.1.6 Onsite Gamma Spectroscopy Analysis of Volumetric Soil Samples An onsite gamma spectroscopy laboratory will be used to analyze discrete volumetric soil samples selected as described in the previous sections. SOPs for the on-site gamma spectroscopy laboratory will be included in the LQMP (additional detail presented in Section 3.6 of the QAPP) and submitted prior to mobilization for the field characterization surveys.
The concentrations of other gamma-emitting radionuclides may also be quantified using gamma energy and yield data from the ISOCS database as a matter of course. If unanticipated radionuclides are identified, Earth Tech will immediately notify the USACE Project Manager.
Final Sampling and Analysis Plan, Volume 1 – Field Sampling Plan Former Guterl Specialty Steel Corporation FUSRAP Site, Lockport, New York
5-51 01/18/07
5.4.3.2 Field Procedures
5.4.3.2.1 Utility Clearances Prior to any subsurface investigation, public utilities (water, gas, electric, phone, etc.) will be located and marked to the extent possible. The one-call Dig Safely New York center will be utilized to clear areas in public domain. In addition, available information from current property owners will be reviewed as a precautionary step to protect underground utilities in the area of subsurface sampling activities.
Limited electromagnetic geophysical surveys will be conducted around each soil boring (total depth > 2 ft) in areas where utilities may reasonably be expected (i.e., IA01, IA02, and IA04) in an attempt to identify the presence of buried utilities. The geophysical survey to clear boring locations will utilize a Geonics EM-31 ground conductivity meter to detect changes in the conductivity related to buried utilities and structures. The EM-31 transmits and receives an electromagnetic signal. Changes in the observed signal strength reflect different conductivity conditions in the subsurface. Disturbances in subsurface soil (e.g., excavations) and buried materials (e.g., USTs) typically have a different conductance than background undisturbed soil. It is possible that cultural influences such fences, buildings, or manufacturing equipment may create interference sufficient to generate inconclusive surveys.
The EM-31 will be hand carried along a grid pattern at a grid line spacing of approximately three ft while continuously monitoring the instrument in analog mode for anomalous conductivity readings. In areas where anomalous readings are detected, the line spacing will be reduced to 1 foot to confirm the readings. In addition, a metro-tech line tracer may be used to confirm the location of utilities that appear at the surface.
GPS coordinates will be collected at each of the subsurface structures or fill areas identified. These data will be collected using a backpack mounted GPS receiver system.
Soil borings to be completed at depths greater than two ft will be performed using direct push technology (DPT) methods (for example, Geoprobe®). It is anticipated the Geoprobe® will be less likely to damage any unforeseen subsurface utilities. Monitoring well borings will be completed with hollow-stem augers. A pilot Geoprobe hole will be advanced at each monitoring well location to obtain soil cores as well as to advance a potentially less destructive initial borehole.
5.4.3.2.2 Drilling Method - Direct Push Technology Subsurface soil samples for COPC analyses will be collected using direct push technology (DPT) (e.g., Geoprobe®) drilling methods in accordance with EM 200-1-3 C.6.4.9. Subsurface soil sample collection will utilize a four-inch outside diameter (2.5-inch inside diameter), four foot long Macro-Core sampling device fitted with a disposable acetate liner. The sampler will be advanced using one inch diameter steel rods attached to the hydraulic device. The borehole will be advanced by attaching additional lengths of extension rod to the Macro-Core barrel and pushing the entire pipe string downward. DPT borings will use a truck-mounted hydraulic system of sufficient size and power to advance the Macro-Core to the required depths. Background information indicates depth to bedrock at the Site ranges from less than four ft to about 15 ft (land-filled areas).
Final Sampling and Analysis Plan, Volume 1 – Field Sampling Plan Former Guterl Specialty Steel Corporation FUSRAP Site, Lockport, New York
5-52 01/18/07
Soil boring logs will be prepared as described in Section 5.4.4.5.1.
5.4.3.2.3 Sampling Method - Surface and Subsurface Soil The primary method for collection of surface and subsurface soil samples for radiological analyses will be Geoprobe drilling and sampling techniques performed in accordance with EM 200-1-3 C.6. Dedicated acetate sleeves inside decontaminated Macro-Core® samplers will be the primary sampling tool. Soil cores will be screened for radioactivity and soil intervals for onsite gamma spectroscopy analyses will be determined as described in Section 5.4.3.1.
If Geoprobe access is not possible, or if frequent refusals are encountered, the bucket hand auger method will be used for collection of surface soil samples. The bucket hand auger will be a stainless steel bucket auger head attached to an extension rod and T-shaped bar. The hand auger will be advanced into the soil to the required depth designated for the sampling location. Material collected in the bucket from each interval will be removed using a stainless steel spoon and transferred into a stainless steel bowl for homogenization. Prior to homogenization, the soil material will be field-screened for radioactivity using hand-held instrumentation.
Surface and subsurface soil samples will be analyzed at the onsite gamma spectroscopy laboratory for isotopic COPCs. In addition, approximately 1 percent of the samples will be analyzed at the off-site fixed laboratory for total organic carbon. Vegetation and rocks will be excluded from the samples as much as reasonably possible using a trowel or gloved hands.
Soil sampling equipment will be decontaminated between sample intervals and between sample locations as described Section 5.4.3.2.6.
5.4.3.2.4 Sampling Method – Geotechnical Geotechnical samples for Atterberg limits, grain size distribution, moisture content, and bulk density can be obtained from Macro-Core sample intervals. The default procedure will be to select five representative samples of each soil type encountered (fill, glaciolacustrine silt and clay, glacial till) from non-impacted intervals (i.e., background readings from core scanner). It is anticipated that these samples can be obtained from Class 3 areas onsite.
If a suitable soil type is located that is appropriate for undisturbed soil sampling, attempts will be made to collect undisturbed soil samples for geotechnical testing using a Shelby tube. Shelby tube samples will be collected using conventional hollow stem auger drilling methods (see Section 5.4.4.3.1). Shelby tubes will not be attempted in granular soil, fill material (presumed to be primarily granular in nature), or very stiff to hard cohesive soils. Once the Shelby tube is removed from the borehole, the end will be capped and orientation arrows will be drawn. Void space within the top or bottom of the tube will be filled with inert material, and the ends of the tube will be sealed with wax to prevent shifting and dehydration during shipment. Undisturbed soil samples will be submitted for hydraulic conductivity and effective porosity testing.
5.4.3.2.5 Concrete Cores Concrete coring will be conducted to obtain samples of the concrete building floors and also allow access to subsurface soil beneath building floors (active and inactive) and paved areas. A portable industry standard concrete coring drill will be used in accordance with the
Final Sampling and Analysis Plan, Volume 1 – Field Sampling Plan Former Guterl Specialty Steel Corporation FUSRAP Site, Lockport, New York
5-53 01/18/07
manufacturer’s specifications. No gasoline powered equipment will be used inside buildings without proper ventilation.
Masonry core samples (approximately 5 per building in IA01) will be collected from concrete floors and brick walls. Samples of residues from floor penetrations (for example, sumps, etc) will be obtained at locations determined by the Project Manager or Health Physicist.
Generally, floor level concrete corings will extend to the underlying soil, as these samples will be taken in conjunction with samples of soil below the building. The depth of other corings will be as deep as is reasonably achievable, depending on the nature of the subject material. The primary objective of the samples will be to produce data suitable for comparison against waste acceptance criteria.
5.4.3.2.6 Decontamination of Sampling Equipment Two methods of decontamination will be used to minimize the generation of unnecessary IDW without impacting data quality.
• Sampling equipment used for collection of surface soil samples within an IA will be decontaminated between samples by removing gross debris and vegetation with a dry cloth or brush at the sample location, followed by a potable water rinse.
• Sampling equipment will be thoroughly decontaminated between IAs and between subsurface sample intervals. Equipment will first be decontaminated by removing gross debris and vegetation at the sampling site. The equipment will then be rinsed with tap water and soap (e.g. Alconox®) followed by a deionized water rinse. DPT rods will be decontaminated using a high-pressure steam wash, upon mobilization to the Site, in between sample locations and before leaving the Site.
All decontamination liquids will be containerized and treated as IDW (refer to Chapter 8 for additional information).
5.4.4 Groundwater This section of the FSP describes field methods for the groundwater investigation and includes existing monitoring well inspection, monitoring well installation, monitoring well development, monitoring well abandonment, and groundwater sampling.
5.4.4.1 Rationale and Design No groundwater sampling for radiological contamination has been conducted other than a screening analysis by NYSDEC at the Landfill Area; alpha radioactivity was reported to exceed NYSDEC groundwater standards at one location.
Only limited data are available from monitoring wells and there are no current ongoing sampling programs. Overburden monitoring wells (four total) are present only at the perimeter of the Landfill Area (IA03); and bedrock monitoring wells (five total) are present only within the perimeter of the Excised Area (IA02). Stratigraphic and monitoring well construction details for existing wells (NYSDEC, 2000; Appendix C) is included in Attachment 2, for reference. The locations of existing monitoring wells are shown on Figure 5-21.
Final Sampling and Analysis Plan, Volume 1 – Field Sampling Plan Former Guterl Specialty Steel Corporation FUSRAP Site, Lockport, New York
5-54 01/18/07
The existing monitoring well network is not adequate to delineate groundwater occurrence or flow direction. Three of the four Landfill Area wells may need to be replaced due to inadequacies in their initial construction (that is, installed prior to current standards). However, Earth Tech understands that NYSDEC recently completed the first phase of an RI focusing on the Landfill Area and the Excised Area (late fall 2006). Earth Tech will consult with USACE regarding use of any new, permanent overburden or bedrock wells installed at the Site in the assessment program described in this section. Earth Tech will consult with USACE regarding use of the NYSDEC wells, if the wells are determined to be appropriately located, constructed, and in good condition (i.e., the number of new wells proposed by Earth Tech may be reduced).
Each of the existing onsite monitoring wells will be visually inspected for integrity of the surface seal and the locking cap. The wells will also be sounded to identify potential obstructions and to determine if sediment infilling has occurred since installation. Based on the results of these evaluations, existing wells considered suitable for re-development and continuing use will be identified. If the well assessment inspection indicates an existing monitoring well is not capable of providing reliable data, then that monitoring well will be recommended for replacement. A replacement monitoring well will be installed with concurrence from USACE.
A total of 21 new wells are proposed for this field investigation, assuming current wells are adequate for the RI. If current wells are found to be inadequate, Earth Tech will consult with USACE regarding installation of replacement wells on a case-by-case basis. In general, existing overburden wells at the Landfill Area or bedrock wells at the Excised Area will be paired with bedrock (4) or overburden wells (5), respectively. Five new overburden and bedrock well pairs (10 total wells) are proposed within IA04 to supplement the well network (i.e., fill data gaps). A sixth new overburden and bedrock well pair (2 wells) is proposed as an up-gradient background location. The following paragraphs provide additional detail regarding the proposed well locations. Figure 5-22 presents the proposed new and existing monitoring well locations.
New overburden monitoring wells are proposed adjacent to each of the existing bedrock wells within the Excised Area, hydraulically down-gradient of known areas of elevated radioactivity, and up-gradient of the Landfill Area (i.e., background well). The expanded network of monitoring wells will provide hydraulic and COPC monitoring points in the overburden.
New bedrock wells are proposed adjacent to each of the existing Landfill Area overburden wells, hydraulically down-gradient of known areas of elevated radioactivity, and up-gradient of the Landfill Area (i.e., background well). The expanded network of bedrock monitoring wells will provide hydraulic and COPC monitoring points in the shallow bedrock.
Upon completion of new monitoring well installation and existing monitoring well re-development activities, slug tests will be performed (Section 5.4.4.10) and groundwater samples will be collected (Section 5.4.4.11) from the entire monitoring well network. Two rounds of groundwater samples will be collected (one round in the early summer and one round in late fall) and submitted for off-site laboratory analyses for TSS (unfiltered), and filtered and unfiltered samples for COPCs (alpha spectroscopy [U and Th] and EPA method 903.0/904 [Ra]), and gross alpha and gross beta.
Static water level measurements will be collected from the entire monitoring well network prior to the sampling event. Water level data will be included in subsequent evaluations to determine probable flow directions to produce potentiometric surface maps. Results from the radiological

Final Sampling and Analysis Plan, Volume 1 – Field Sampling Plan Former Guterl Specialty Steel Corporation FUSRAP Site, Lockport, New York
5-55 01/18/07
sampling event will be reviewed to determine if any groundwater radiological contamination is present. If results indicate the presence of COPCs in groundwater, the locations and concentrations of COPCs will be evaluated to determine if additional groundwater investigation activities are needed. Additional activities may include new monitoring well installations and additional radiological sampling.
5.4.4.2 Field Procedures As described above, installation and testing of 21 new monitoring wells is planned for this RI to assess water quality parameters and to determine groundwater flow direction in the overburden and shallow bedrock units. The locations of the proposed new monitoring wells are shown on Figure 5-22. Existing wells that are determined to be in poor condition will be abandoned as described in Section 5.4.4.8 and will be replaced.
Monitoring well installation will be conducted in accordance with EM 1110-1-4000 Monitoring Well Design, Installation, and Documentation at Hazardous, Toxic, and Radioactive Waste Sites (USACE, 1998). In general, new monitoring wells will be installed as 2-inch, Schedule 40 PVC wells with standard above-grade completions. Specifications for drilling, installation, and completion are contained in the following subsections.
5.4.4.3 Monitoring Well Equipment and Materials
5.4.4.3.1 Drilling Methods and Equipment Conventional drilling techniques (hollow stem auger and bedrock coring) will be used to install overburden and bedrock monitoring wells.
Earth Tech will request that the drilling sub-contractor verify that drilling equipment has been decontaminated before delivery to the Site. After arrival at the Site, the drilling equipment will be cleaned with steam or pressurized hot water using approved water at the decontamination pad to ensure the equipment is clean and ready for use at the Site.
Similar decontamination of drilling and sampling equipment will be conducted upon completion of each monitoring well borehole. However, only the equipment used during the drilling and sampling activities at each borehole location will undergo decontamination.
A temporary drilling equipment decontamination pad will be constructed in such a manner to allow for containment and collection of solid and liquid wastes and to minimize loss of over-spray water during decontamination activities. Solid and liquid wastes generated from the decontamination process will be managed in accordance with the procedures defined in Section 8 of this FSP.
Soil drilling using the hollow stem auger method will be accomplished using a truck mounted auger rig of sufficient size and power to advance augers to the required drilling depth. Background information indicates depth to bedrock at the Site ranges from less than four ft to about 15 ft (land-filled areas).
Bedrock drilling will be accomplished using the same drill rig as used for hollow-stem augering. Overburden boreholes will be cased off with permanent steel casing prior to advancing the borehole into bedrock. Bedrock cores will be collected with HX-wireline coring system,
Final Sampling and Analysis Plan, Volume 1 – Field Sampling Plan Former Guterl Specialty Steel Corporation FUSRAP Site, Lockport, New York
5-56 01/18/07
producing a nominal 3-15/16 inch bedrock borehole. Bedrock cores will be stored in standard wooden core boxes. The cores will be staged in a suitable on-site location for future reference.
5.4.4.3.2 Materials This section describes the type and specification of the materials to be used during monitoring well construction and installation.
5.4.4.3.3 Monitoring Well Casing/Screen The monitoring well riser, screen and fitting materials to be used for construction of overburden monitoring wells will be new, pre-cleaned, 2-inch Schedule 40 PVC. The materials to be used for construction of bedrock monitoring wells will be new, pre-cleaned, four inch steel permanent overburden casing and new, pre-cleaned, 2-inch Schedule 40 PVC riser and screen. Screen sections will be commercially fabricated and slotted with openings equal to 0.010 inches (“10 slot”). Screen and casing sections will be flush threaded; thermal or solvent welded couplings will not be used. Gaskets, pop rivets, and screws will also not be used during monitoring well construction.
Monitoring well caps and centralizers will be new, pre-cleaned PVC. The tops of the monitoring wells will be fitted with a well cap and will be designed to preclude binding to the casing resulting from tightness of fit, unclean surface, or frost and to allow for equilibration between hydrostatic and atmospheric pressures. The caps will also be designed to fit securely enough to preclude debris and insects from entering the monitoring well.
5.4.4.3.4 Filter Pack, Bentonite Seal, Cement/Bentonite Grout A filter pack of appropriate gradation will be used for the overburden and bedrock wells, respectively. The granular filter pack material will be visually clean, greater than 99 percent free of materials that would pass through a No. 200 sieve, inert, siliceous, and composed of rounded grains. The filter materials will be packaged in bags or buckets. The filter pack will be installed through the augers after placement and centralization of the monitoring well screen and riser in the casing (bedrock) or hollow-stem augers (overburden).
Granular bentonite will be used for the creation of an annular seal during monitoring well construction between the lower granular filter pack and upper grout seal. Compressed powered bentonite pellets or chips, generally measuring 0.25 inches in size, will be used for annular seal applications. The bentonite seal will be slowly added to the open borehole, with care taken to prevent bridging. Powdered bentonite will be used for grout additive applications.
Powdered bentonite will be used as an additive in the upper grout seal mixture. The grout used during monitoring well installation will be composed of Type I Portland cement with approximately 5% powdered bentonite per 94-pound sack of dry cement, and approximately eight to nine gallons of water per sack of cement. The amount of water used to prepare grout mixtures will be minimized to the greatest extent possible for a pumpable mix.
5.4.4.3.5 Surface Completion Surface completion installations will be required for newly installed monitoring wells, and for upgrading existing monitoring well seals if deemed necessary by Earth Tech and USACE.
Final Sampling and Analysis Plan, Volume 1 – Field Sampling Plan Former Guterl Specialty Steel Corporation FUSRAP Site, Lockport, New York
5-57 01/18/07
The well protection assembly will be composed of new iron/steel protective casing. Protective casings for above-grade installations will be equipped with locking iron/steel covers. Covers on the protective casings will be such that the possibility of water leakage is minimized. The diameter of all protective casings will be four inches. The length of protective casings for overburden monitoring well completions will be approximately three to four ft; considering the shallow depth to rock and the desire to avoid interference with the shallow screen interval. Bedrock monitoring well surface completions will use the permanent overburden steel casing as a protective casing.
5.4.4.3.6 Water Source Water will be used during the RI for the following purposes:
• Preparation of grout mixture used for monitoring well installation or borehole abandonment
• Preparation of cement mixture used for construction of monitoring well surface completions
• Decontamination of drilling and sampling equipment
Water will be obtained from the local municipal water supply, which draws water from the Niagara River. Water quality data will be collected from the local municipality and documented for the Administration Record.
5.4.4.3.7 Delivery, Storage, and Handling of Materials Monitoring well construction materials will be supplied and delivered by the subcontracted drilling company. Upon delivery to the Site, the Field Geologist will inspect the materials to ensure that the required types of materials have been delivered and that the materials have not been damaged or contaminated during transport to the Site. Materials will be stored in a dry and secure location until used.
5.4.4.4 Monitoring Well Installation A discussion of the anticipated monitoring well installation process is presented below. The actual monitoring well design may be modified due to location-specific requirements, well completion depths, or subsurface conditions. Modifications will be approved by USACE prior to completion and documented.
5.4.4.4.1 Soil Sampling and Rock Coring During Drilling Split spoon samples will be collected, described and logged from the overburden in accordance with Section 5.4.4.5.1. Rock cores will be collected, described and logged during bedrock well drilling in accordance with Section 5.4.4.5.2.
5.4.4.4.2 Borehole Diameter and Depth Overburden boreholes will be advanced using 4¼-inch inside diameter (ID) hollow stem augers producing a borehole of approximately eight inches inside diameter. Monitoring wells will be installed through the hollow stem augers. The 4¼-inch ID hollow-stem augers are of sufficient
Final Sampling and Analysis Plan, Volume 1 – Field Sampling Plan Former Guterl Specialty Steel Corporation FUSRAP Site, Lockport, New York
5-58 01/18/07
diameter to permit at least two inches of annular space between the auger wall and the sides of the well (centered screen and casing).
Each overburden borehole will be advanced through the overlying soil material to the underlying bedrock. If sufficient groundwater to support a functional monitoring well is found, a monitoring well will be constructed. However, if sufficient groundwater is not found, relocation of the proposed location will be discussed with USACE. Any borehole that is not completed as a monitoring well will be abandoned as discussed in Section 5.4.4.8.
Overburden boreholes will be advanced at bedrock well locations for permanent casing installation. The overburden portion of the borehole will be advanced using 6¼-inch ID hollow stem augers. A permanent steel casing 4-inches ID will be grouted into place and allowed to cure for a minimum of 24 hours. The casing will be installed a minimum of six inches into bedrock. The bedrock borehole will then be advanced using HX-wireline coring system producing a nominal 3 16
15 -inch open-bedrock borehole. As done for prior investigations, 2-inch ID PVC screen and riser monitoring wells will be installed in the open-bedrock borehole and permanent casing.
The anticipated depth of overburden boreholes for overburden monitoring wells is estimated to be 4 to 7 ft. Bedrock wells will be screened within the upper 10 ft of bedrock to be consistent with existing monitoring wells installed during the NYSDEC IIWA (1994). However, an observational approach focusing on groundwater occurrence (e.g., more or less, or higher or lower than anticipated) and lithology (e.g., soil type, depth to bedrock, presence of water-bearing fractures, etc.) will also be employed to allow for refinement of the completed screen interval, if appropriate. Any potential refinements to the screen intervals will be discussed with USACE prior to implementation.
5.4.4.4.3 Screen and Well Casing Placement Overburden and bedrock monitoring well screens will be installed such that the bottom of each well screen is placed no more than three inches above the bottom of the drilled borehole. The screen bottom will be securely fitted with a threaded poly vinyl chloride (PVC) cap or plug within six inches of the open portion of the screen.
Due to the shallow depth to bedrock at the Site, Earth Tech anticipates that conventional screen lengths will not be suitable for most overburden well locations. Therefore, Earth Tech will seek approval of a location-specific screen length and well construction diagram from USACE prior to completing wells where depth to bedrock is less than 15 ft. For overburden locations where depth to bedrock is greater than 15 ft, standard 10-foot screens will be installed. As noted in Section 5.4.4.4.2, an observational approach to setting screen intervals may also be employed.
Bedrock monitoring well screens will be five ft in length, consistent with existing bedrock wells installed during the NYSDEC IIWA (1994). As noted in Section 5.4.4.4.2, an observational approach to setting screen intervals may also be employed.
5.4.4.4.4 Filter Pack Placement Granular filter pack material used for monitoring well construction will be placed within the annular space around the monitoring well screen using a tremie pipe with the monitoring well capped. For typical installations, the filter pack will extend from the bottom of the borehole to
Final Sampling and Analysis Plan, Volume 1 – Field Sampling Plan Former Guterl Specialty Steel Corporation FUSRAP Site, Lockport, New York
5-59 01/18/07
two ft above the top of the well screen. However, Earth Tech will seek approval of a location-specific filter pack interval from USACE prior to completing wells where depth to bedrock is less than 15 ft. If well depth is such that a standard thickness of normal filter pack cannot be installed, a No. 00 chocker sand will be substituted for a portion of the normal filter pack below the bentonite seal to lessen the thickness of the sand pack above the screened interval and still avoid bentonite or grout contamination. The final depth to the top of the filter pack will be measured directly with a weighted tape and recorded. The monitoring well riser will remain capped but vented during placement of the filter pack.
5.4.4.4.5 Bentonite Seal The type of bentonite material to be used for construction of monitoring well seals will be composed of commercially available pellets or chips. For typical installations, the bentonite seal will extend one foot above the filter pack. However, Earth Tech will seek approval of a location-specific bentonite seal interval from USACE prior to completing wells where depth to bedrock is less than 15 ft. A weighted tape will be used to prevent bridging and to measure the placement of bentonite. After placement of the bentonite pellets, a small volume of approved water will be used to hydrate the pellets, and the hydration time for the pellets will be a minimum of one hour. The final depth to the top of the bentonite seal will be measured directly with a weighted tape and recorded. The monitoring well riser will remain capped during placement of the bentonite seal.
5.4.4.4.6 Cement/Bentonite Grout Placement Grout materials to be used for monitoring well construction will be combined in an above-ground rigid container and mechanically blended to produce a thick, lump-free mixture throughout the mixing vessel. The grout will be placed from within a rigid grout pipe initially located just over the top of the bentonite seal in such a manner as to minimize disturbance of the seal.
Before exposing any portion of the borehole above the seal by removal of any surface casing (to include hollow-stem augers), the annulus between the surface casing and well casing will be filled with sufficient grout to allow for casing removal. The grout mixture will be pumped through the grout pipe until it reaches a level that will permit at least three ft of grout to remain in the annulus after removing the selected length of surface casing. Using this method, the grout pipe will only be reinserted to the base of the casing yet to be removed before repeating the process. After grouting has been completed to within approximately two ft of the ground surface, the remaining surface casing will be removed from the borehole and the remaining annulus will be grouted to within two ft of the ground surface.
After 24 hours, the site will be checked for grout settlement and more grout will be added at that time to fill any depression. This process will be repeated until firm grout remains within two ft of the ground surface. Incremental quantities of grout added in this manner will be recorded on the well construction diagram.
5.4.4.4.7 Protective Cover Placement Protective iron/steel casing will be installed around each monitoring well. The protective casing used for overburden monitoring well installations will be set approximately one to two ft below
Final Sampling and Analysis Plan, Volume 1 – Field Sampling Plan Former Guterl Specialty Steel Corporation FUSRAP Site, Lockport, New York
5-60 01/18/07
grade and will extend approximately three ft above the ground surface. Each protective casing will be installed so that the distance between the top of the protective casing and the top of the monitoring well riser casing is no more than 4 inches (taking into account any height requirement for the riser cap).
The annulus around the outside of the protective casing (between the casing and borehole wall) will be filled with bentonite slurry or hydrated powdered bentonite prior to the placement of the concrete pad. A layer of filter pack sand will be placed on top of the annular seal to within 4-inches of the top of the riser to help prevent loss of tools or equipment that may fall in the annulus during sampling.
A sloping concrete pad measuring approximately 30-inch × 30-inch square will be poured around the exterior of the protective casing. The thickness of each concrete pad will be uniform and no less than four inches. Following placement and curing of the concrete pad, a drainage port measuring approximately 0.25 inches in diameter will be drilled into the protective casing 0.1 foot above the top of the internal mortar collar.
5.4.4.4.8 Well Identification For each monitoring well installed during the RI, the well designation number will be painted, using white paint, on the outside of the protective casing, and/or a metal tag bearing the designation will be attached to the protective casing or well casing depending upon the type of installation.
New wells installed during this RI will be designated with a 600-sereies format, including an “S” or “D” suffix to designate shallow (overburden) or deep (top of bedrock), respectively.
5.4.4.4.9 Well Survey Each well will be surveyed at the completion of the well installation activity. The survey data will include horizontal location to the nearest 0.1 foot, and elevation data for the top of the inner and outer casings and ground surface at the well to the nearest 0.01 foot. Additional survey detail is provided in Section 5.4.7.
5.4.4.5 Documentation This section of the FSP describes monitoring well installation documentation requirements including soil boring logs, bedrock core logs, and monitoring well construction diagrams.
5.4.4.5.1 Soil Boring Logs Each borehole log generated will fully describe the subsurface environment and the procedures used to gain that description. Borehole data will be recorded in the field by the Field Geologist on the Hazardous and Toxic Waste drilling log (Attachment 4). A scale of one inch on the log equaling one foot of borehole will be used during borehole log preparation.
Borehole logs generated during the RI will contain the following information:
• Unique borehole/monitoring well number.
• Depths or heights recorded in feet and decimal fractions thereof (tenths of ft).
Final Sampling and Analysis Plan, Volume 1 – Field Sampling Plan Former Guterl Specialty Steel Corporation FUSRAP Site, Lockport, New York
5-61 01/18/07
• Field estimates of soil classification (Unified Soil Classification System [USCS]).
• Full description of each soil sample collected.
• Full description, to the greatest extent practical, of bedrock material encountered, and degree of weathering.
• Description of drilling equipment, including such information as auger size (inner and outer diameter), bit types, rig manufacturer, and model.
• Any special problems encountered during drilling and their resolution.
• Dates for the start and completion of the borehole.
• Each sequential boundary between various soil types and individual lithologies.
• The depth of first-encountered free water along with the method of determination and any subsequent distinct water level(s) encountered thereafter. Before proceeding, the first encountered water will be allowed to partially stabilize (from five to ten minutes) and will be recorded along with the time between measurements.
• Interval by depth for each sample collected, including the length of sampled interval, length of sample recovery, and the sampler type and size (diameter and length).
• Total depth of drilling and sampling.
• Results of soil core radiological scan readings. Notation will include interval sampled, corresponding radiological activity (counts per minute) and key to the specific instrument used to obtain readings. A general note will be made on the log indicating the manufacturer and model.
• Definition of any special abbreviations used at the first occurrence of their usage.
5.4.4.5.2 Rock Core Logs Each rock core log generated will fully describe the subsurface environment and the procedures used to gain that description. All rock core data will be recorded in the field by the Field Geologist in the HTW drilling log (Attachment 4). A scale of one inch on the log equaling one foot of borehole will be used during rock core log preparation.
All rock core logs generated during the RI will contain the following information, in addition to the information included on the borehole log noted above:
• Full description, to the greatest extent practical, of bedrock material encountered, and degree of weathering.
• Dates for the start and completion of the rock core.
• Each sequential boundary between various rock types and characteristics including fractures, mechanical breaks, vugs, minerals, and bedding.
• Interval by depth for each rock core collected, including the core number, depth of core interval, core recovery length, and RQD.
Final Sampling and Analysis Plan, Volume 1 – Field Sampling Plan Former Guterl Specialty Steel Corporation FUSRAP Site, Lockport, New York
5-62 01/18/07
• Results of rock core radiological scan readings. Notation will include interval surveyed, corresponding radiological activity (counts per minute) and key to the specific instrument used to obtain readings. A general note will be made on the log indicating the manufacturer and model.
• All cores will be archived on-site in a secure location for potential later reference or access for sampling.
5.4.4.5.3 Well Construction Diagrams Each monitoring well installed will be depicted in an as-built well construction diagram (Attachment 4). Each diagram will be attached to the original borehole log for that installation and will graphically denote, by depth from the ground surface, the following information:
• Location of the borehole bottom and borehole diameter(s)
• Location of the well screen
• Location of any casing joints
• Location of the granular filter pack
• Location of the bentonite seal
• Location of grout
• Height of riser (stickup), without cap/plug, above the ground surface
• Height of the protective casing, without cap/cover, above the ground surface
• Depth of protective casing base below the ground surface
• Location and size of drainage port
• Location of the internal mortar collar
Additional information to be described on each as-built well construction diagram will include the following:
• Actual quantity and composition of the grout, bentonite seal, and granular filter pack used for construction of the monitoring wells
• Screen slot size in inches, slot configuration, outside diameter; nominal inside diameter, schedule/thickness, and composition
• Type of material located between the bottom of the borehole and the bottom of the screen
• Monitoring well riser outside diameter, nominal inside diameter, schedule/thickness, and composition
• Casing joint design and composition
• Composition and nominal inside diameter of protective casing
• Any special problems encountered during well construction and their resolution
• Dates for the start and completion of monitoring well installation
Final Sampling and Analysis Plan, Volume 1 – Field Sampling Plan Former Guterl Specialty Steel Corporation FUSRAP Site, Lockport, New York
5-63 01/18/07
• Definition of any special abbreviations used at the first occurrence of their usage.
5.4.4.6 Monitoring Well Development Monitoring well development will be conducted in accordance with EM 1110-1-4000 Monitoring Well Design, Installation, and Documentation at Hazardous, Toxic, and Radioactive Waste Sites (USACE, 1998). Data will be recorded on the monitoring well development log (see Attachment 4).
The development of monitoring wells will not be initiated sooner than 48 hours after placement of the grout seal.
Well development will be conducted using a submersible pump and surge block to aid in the removal of sediment from the well and filter pack.
5.4.4.6.1 Development Criteria Development of each monitoring well will proceed until each of the following criteria is achieved:
• Water is clear to the unaided eye
• The sediment thickness remaining within the well is less than 0.1 ft.
• A minimum removal of five times the standing water volume in the well (to include the well screen and casing plus saturated annulus, assuming 30% annular porosity) has been achieved.
• Equalization of required water quality parameters (for three consecutive readings at a frequency of one reading per well volume):
- pH (variation ± 0.2 units).
- Dissolved oxygen (variation ± 10%).
- Specific conductivity (variation ± 3%).
- Temperature (variation ± 1° C).
- Turbidity (variation ± 10%).
- Oxygen reduction potential (variation ± 10 mV).
During the course of well development, the Project Manager will be contacted for guidance if well recharge is so slow that the required volume of water cannot be removed within 48 hours of the start of development, if persistent water discoloration is observed after completion of the required volume removal, or if excessive sediment remains after completion of the required volume removal.
5.4.4.6.2 Development Records For each monitoring well developed during the RI, a record will be prepared to include the following information:
• Project name and location
Final Sampling and Analysis Plan, Volume 1 – Field Sampling Plan Former Guterl Specialty Steel Corporation FUSRAP Site, Lockport, New York
5-64 01/18/07
• Well designation and location
• Date(s) and time(s) of monitoring well development
• Static water level from top of well casing before and 24 hours after completion of well development with dates and times of measurements
• Quantity of standing water contained with the well, and contained within the saturated annulus (assuming 30 percent porosity), before well development
• Field readings of pH, conductivity, turbidity, oxygen reduction potential, dissolved oxygen, and temperature measured after each well volume has been removed, and at completion of well development
• Depth from top of well casing to bottom of well
• Length of the well screen
• Physical character of the removed water, including changes during development in clarity, color, particulates, and any noted odor
• Type and size/capacity of the bailer or pump used for development
• Description of the surge technique used during development
• Quantity of water removed from the well during the development operation and the time for removal, presented as both incremental and total values
• Discharge rate
5.4.4.7 Existing Monitoring Well Rehabilitation Existing monitoring wells installed during 1980 at the Landfill Area may not be in an acceptable condition for continued use. Existing monitoring wells within the Excised Area, and well MW-105 at the Landfill Area, are likely to be suitable for future use as these wells were installed in 1994 by a NYSDEC contractor. A well assessment, described above in this section, will be performed on the existing wells.
For those wells deemed suitable for use during the remainder of the RI, damaged or otherwise compromised surface completions will be rehabilitated to ensure well integrity and security. Damaged existing surface completions will be removed (including protective casing, concrete pad, and guard posts) to allow for installation of a new surface completion described above in this section.
5.4.4.8 Borehole and Monitoring Well Decommissioning/Abandonment Abandonment of soil boreholes not completed as monitoring wells and existing, orphaned monitoring wells (i.e., Landfill Area wells installed by Guterl in December 1980) deemed unsuitable for future use will be performed during this RI. Well abandonment will include removal of casing and screen, over-drilling of the well borehole, and grouting to the surface. Abandonment of soil boreholes will be accomplished by filling the entire volume of the borehole with a bentonite grout mixture.
Final Sampling and Analysis Plan, Volume 1 – Field Sampling Plan Former Guterl Specialty Steel Corporation FUSRAP Site, Lockport, New York
5-65 01/18/07
For each abandoned well/borehole, a record will be prepared (refer to Attachment 4) and submitted to the USACE Project Manager including the following information:
• Project and well/borehole designation
• Location with respect to the replacement well or borehole (if any)
• Open depth of well/borehole before grouting
• Casing or items left in borehole by depth, description, composition, and size (if applicable)
• Copy of the borehole log
• Copy of construction diagram for abandoned well (if applicable)
• Reason for abandonment
• Description and total quantity of grout used initially
• Description and daily quantities of grout used to compensate for settlement
• Dates of grouting
• Water or mud level prior to grouting and date measured
Depths reported in the borehole abandonment record will be designated in feet from the ground surface. Any replacement wells/boreholes installed during the investigation will be offset at least 10 ft from any abandoned site.
5.4.4.9 Groundwater Level Measurement Measurement of one complete set of initial static groundwater levels for the monitoring well network will be made over a single, consecutive 4-hour period, at least 24 hours after development and sampling of the last new monitoring well.
Static water level measurements will be made using an electronic water level indicator in accordance with EM 1110-1-4000 Chapter 8, Water Levels and recorded on the water level data summary form (Attachment 4). Initially, the indicator probe will be lowered into each monitoring well until the alarm sounds and/or the indicator light illuminates. The distance between the top of casing and the groundwater surface will be recorded to within 0.01 ft. The static water level measurement procedure will be repeated to ensure that the water level measurements are consistent (± 0.01’).
5.4.4.10 Aquifer Testing (Slug Tests) Aquifer testing will be conducted during the RI to determine aquifer properties. The following discussion addresses the types of aquifer testing that will be employed during field activities.
A slug test will be performed in each new and suitable existing monitoring well to determine the hydraulic conductivity of the surrounding geologic material. The slug test method involves lowering or raising the static water level in a well bore by the removal or insertion of a cylinder (slug) of known volume. The return of the water level to a pre-test static level is then measured over time. The change in water level over time is plotted to determine hydraulic conductivity
Final Sampling and Analysis Plan, Volume 1 – Field Sampling Plan Former Guterl Specialty Steel Corporation FUSRAP Site, Lockport, New York
5-66 01/18/07
(K). K is a function of the formation permeability, the fluid in the formation, and is influenced by well construction.
Each new and existing well will be tested by rising head and falling head methods. In the event one form of the test cannot be conducted, the well location and the constraint will be documented. For the rising head test, if possible, the slug test will be performed in such a manner to prevent the water level in the well from dropping below the top of the screened interval when the slug is removed. Each test will be performed after the groundwater has been sampled, and will be contingent upon a monitoring well containing sufficient water to allow testing (minimum of 5 ft or as determined by the Field Geologist).
Slug tests will only be initiated after the well has recovered from groundwater sampling (or a minimum of 12 hours has elapsed since sampling) and will be conducted in accordance with Attachment 1, SOP BLM 09, Conducting Slug Tests.
5.4.4.11 Groundwater Sampling Two rounds of groundwater samples will be collected during the RI. Collection of groundwater samples from monitoring wells will involve three general steps: (1) well purging, (2) measurement and stabilization of field parameters, and (3) groundwater sample collection. Groundwater sampling activities will follow the requirements of EM 200-1-3 C.2 Groundwater Sampling. Groundwater parameter data will be entered onto the groundwater sampling log (Attachment 4). It is anticipated that groundwater sampling will begin no sooner than 14 days after the completion of well development.
Purging and sampling of monitoring wells will be accomplished using a peristaltic pump, a disposable bailer, or a low-flow submersible pump. The use of a peristaltic pump with dedicated Teflon tubing left in the well will be the preferred method (i.e., down-hole Teflon line, flexible pump roller tube, and Teflon outflow tube). A bailer will be used only if attempts to use a submersible pump are unsuccessful (that is, insufficient recharge). Water quality parameters will be measured using a flow-through cell designed specifically for micro-purge sampling.
For wells requiring the use of a bailer, the use of a flow-through cell will not be possible and an open vessel instrument will be used.
5.4.4.11.1 Low Flow (Micro-Purge) Sampling In order to minimize the quantity of liquid IDW generated as a result of well purging, wells will be micro-purged where conditions permit, in accordance with EM 200-1-3 C.2.4.9, as follows:
• A submersible pump or peristaltic pump will be used for purging
• The pump intake or tubing will be located within the well screened interval
• The purge rate will not exceed 100 mL/minute unless it can be shown that higher rates will not disturb the stagnant water column above the well screen (that is, will not result in drawdown)
• The volume purged will be based on the stabilization of the following required water quality parameters for three consecutive readings (measured at ten-minute intervals):
- pH (variation ± 0.2 units)
Final Sampling and Analysis Plan, Volume 1 – Field Sampling Plan Former Guterl Specialty Steel Corporation FUSRAP Site, Lockport, New York
5-67 01/18/07
- Dissolved oxygen (variation ± 10%)
- Specific conductivity (variation ± 3%)
- Temperature (variation ± 1° C)
- Turbidity (variation ± 10%)
- Oxidation reduction potential (for data needs, not as a stabilization parameter)
- Sample collection shall occur immediately after micro-purging
5.4.4.11.2 Filtration Filtered and unfiltered groundwater samples will be collected during the RI. Filtered samples will be collected using 0.45 micrometer (μm) disposable in-line pore filter attached to the return line of the pump. Filters will be replaced between sample locations and, if needed, as they become restricted by solids buildup at any one location.
Unfiltered samples will be collected for TSS, and filtered and unfiltered samples will be collected for gross alpha, gross beta, and isotopic analyses for uranium, thorium, and radium. The project team will review the first round data prior to implementation of the second round. Based on this review, the project team may, as appropriate, reduce the analyte list or add analytes necessary for fate and transport, risk assessment, or other project data needs.
5.4.5 Other Media Unfiltered samples will be collected for TSS, and filtered and unfiltered samples will be collected for gross alpha, gross beta, and isotopic analyses for uranium, thorium, and radium. The project team will review the first round data prior to implementation of the second round. Based on this review, the project team may, as appropriate, reduce the analyte list or add analytes necessary for fate and transport, risk assessment, or other project data needs.
The level of survey effort will be determined by the potential for contamination as indicated by the survey area classification associated with the other media. For example, greater level of effort will be applied within Class 1 areas than within Class 2 areas, and so on for Class 3.
5.4.5.1 Expansion Joints; Stress Cracks; Penetrations into Floors and Walls for Piping, Conduit, and Anchor Bolts; and Wall/Floor Interfaces
For surveys of small penetrations, such as cracks or anchor-bolt holes, cotton swabs will be used to swipe the area of concern. Sampling may also be performed by scraping the crack or joint with a pointed tool, such as a screwdriver or chisel. Samples (smears or swabs) will be placed into small plastic envelopes or other individual containers to prevent cross-contamination. Samples and smears will be evaluated in the field by counting them on an integrating scaler unit with appropriate detectors (for example, the HandECount).
Positive results of an analysis may indicate possible penetrating contamination (for example, sub-floor or sub-wall). Checking for activity below the floor will require sampling methods described in prior sections (for example, coring), as appropriate. After the suspect area is accessed, direct monitoring of the underlying surface will be performed and samples of soil or other media will be collected.
Final Sampling and Analysis Plan, Volume 1 – Field Sampling Plan Former Guterl Specialty Steel Corporation FUSRAP Site, Lockport, New York
5-68 01/18/07
Coring will also be used for collecting samples of construction material that may contain activity that has penetrated below the surface. This type of sampling will also be applied to roofing material which may contain imbedded or entrapped contaminants. The profile of the distribution and the total radionuclide content will be determined by analyzing horizontal sections of the core.
If residual activity has been coated by paint or some other treatment, the underlying surface and the coating itself may be contaminated. In this case the surface layer will be removed from a 100 cm2 area using a commercial stripping agent or by physically abrading the surface. The removed coating material will be analyzed for activity content and the results will be compared to the guidelines for surface activity in Table 5-1. Direct measurements will be performed on the underlying surface, after removal of the coating.
5.4.5.2 Trenches, Pipes, and Drains Inaccessible surfaces cannot be adequately evaluated by direct measurements on external surfaces alone; therefore those locations that could contain residual radioactive material will be accessed for survey.
Residue will be collected from drain lines using a piece of wire or plumbers “snake” with a strip of cloth attached to the end; deposits on the pipe interior will be loosened by scraping with a hard tipped tool that can be inserted into the drain opening. Particular attention will be given to “low-points” or “traps” where activity would likely accumulate.
Whenever possible, potentially contaminated sanitary sewer lines and drain lines will be surveyed by passing a cable-driven 3/8-inch diameter sodium iodide (NaI(Tl)) radiation detector (Ludlum Model 44-149) through the lines. Static measurements will be taken at 1-m intervals.
The need for further internal monitoring and sampling will be determined on the basis of residue samples and direct measurements at the inlet, outlet, cleanouts, and other access points to the pipe interior.
In the event it appears that field data indicate the potential for contamination to have migrated off-site through pipes, drains, or trenches, Earth Tech will coordinate any follow-up sampling with USACE prior to performance.
5.4.5.3 Sediment and Surface Water Sediment samples will be collected in accordance with EM 200-1-3 C.5, Sediment Sampling. Sediment samples will be collected from the sediment-water interface to a depth of six inches. Surface water samples will be collected in accordance with EM 200-1-3 C.3, Surface Water Sampling.
5.4.5.3.1 Ponar (Sediment) The Ponar sampler will be used to collect sediment samples from 12 locations in the Erie Barge Canal (refer to Figure 5-17), and from deep floor trenches (for example, Building 3). The Ponar sampler is a clamshell-type scoop activated by a counter-level system. The shell is opened, latched in place, and slowly lowered to the bottom. When tension is released on the lowering cable, the latch releases and the lifting action of the cable on the lever system closes the
Final Sampling and Analysis Plan, Volume 1 – Field Sampling Plan Former Guterl Specialty Steel Corporation FUSRAP Site, Lockport, New York
5-69 01/18/07
clamshell. The Ponar is then slowly raised to the surface and free liquids are allowed to drain, being careful not to lose fine sediments. The Ponar is placed into a stainless steel tray or bowl and opened. This process is repeated until sufficient sample volume is obtained. Sediment then will be homogenized in a stainless steel bowl.
The Ponar sampler will be decontaminated between sample locations as described below in this Section.
5.4.5.3.2 Scoop/Trowel (Sediment) The scoop/trowel method will be used for collection of easily accessible dry sediment samples and sediment samples located underwater where the water depth is less than six inches. This collection method will be accomplished using a stainless steel trowel or spoon used to manually dig into the subsurface material to the required depth designated for the sampling location. Five locations around the perimeter of the landfill, at a spacing of one sample per 500 ft (refer to Figure 5-12), are expected to be collected using this method. Sampled material then will be transferred to a stainless steel bowl for homogenization.
The trowel and bowl will be decontaminated between sample locations as described below in this Section.
5.4.5.3.3 Hand-Held Bottle Method (Surface Water) Directly filling a sample container is one of the most efficient methods of surface water collection. Collection of surface water samples using the hand-held bottle method will be used for easily accessible locations (e.g., perimeter of landfill area). The sample will be collected by submerging the appropriate sample container with the cap in place into the body of water. The container will then be slowly and continuously filled using the cap to regulate the rate of sample entry into the container. The sample container should be filled such that a minimum of bubbling (and volatilization) occurs.
5.4.5.3.4 Dipper and Pond Sampler Method (Surface Water) Dipper and pond samplers may be used to collect surface water samples from the Erie Barge Canal, the perimeter of the landfill area, and from deep floor trenches. The dipper and pond sampler perform similar functions and vary only in the length of the handle attached to the sampling vessel (usually a beaker). Before beginning sampling, a handle of appropriate length is attached to the dipper or pond sampler. Collection of surface water samples using the dipper or pond sampler method will then be accomplished by slowly submerging the device into the water so that the open end of the device is facing upstream. The sampler device will be retrieved from the water body with minimal disturbance to the sample, which will then be transferred into appropriate sample containers.
The dipper and handle will be decontaminated between sample locations as described in below in this Section
5.4.5.3.5 Decontamination of Sampling Equipment Two methods of decontamination will be used to minimize the generation of unnecessary IDW without impacting data quality.
Final Sampling and Analysis Plan, Volume 1 – Field Sampling Plan Former Guterl Specialty Steel Corporation FUSRAP Site, Lockport, New York
5-70 01/18/07
Sampling equipment will be thoroughly decontaminated between sample locations. The equipment will then be rinsed with tap water and soap (e.g., Alconox®) followed by a deionized water rinse.
Decontamination liquids will be containerized and treated as IDW.
5.4.6 Background Reference Areas
5.4.6.1 Surfaces For the purposes of evaluating gross beta activity on structure surfaces, structures of similar material construction will be identified in non-impacted buildings located on-site. In the event that suitable reference materials cannot be located, reference material values may be assumed based on information provided in Table 5-4 (Background Count Rates for Various Materials) from NUREG-1507, Minimum Detectable Concentrations with Typical Radiation Survey Instruments for Various Contaminants and Field Conditions (NRC, 1998) or other appropriate guidance documents.
A total of five reference measurements will be completed for each material type. Swipe samples will be collected at a minimum frequency of 20% of fixed-point measurements to characterize any potential removable radioactive contamination. Swipe samples also will be collected at any fixed-point location where the total measured activity exceeds the total activity screening level.
5.4.6.2 Soil Background soil samples will be collected from 12 locations within the background reference area (refer to Figure 5-2), and will include one surface soil and one subsurface soil at each location generating a total of 24 samples. The subsurface soil samples will be collected from either the 4-6 ft below ground surface (bgs) or 8-10 ft bgs depth intervals, with specific intervals varied to provide full characterization of the subsurface soil interval.
All background soil samples will be submitted for laboratory analyses for COPCs by gamma and alpha spectroscopy (U and Th), by EPA method 903/904 (Ra), by mass spectroscopy for uranium isotopes, and for gross alpha and gross beta. Samples will be collected as described in Section 5.3.
5.4.6.3 Groundwater, Surface Water, and Sediment Background samples will be collected for groundwater, surface water, and sediment during the RI. Two upgradient groundwater samples are planned for collection, and one transect of three surface water/sediment pairs are planned for collection from the Erie Canal (refer to Figure 5-22 and Figure 5-17, respectively).
5.4.7 Site Civil Survey Earth Tech and its subcontractor will establish survey grade benchmarks tied to the New York State Plane Coordinate System at locations around the Site for use in the conduct of the GWS and subsequent characterization surveys. Site civil survey will be performed by a NYS licensed surveyor as part of site mobilization activities. The surveyor’s license will be current and active throughout the term of performance during the project.
Final Sampling and Analysis Plan, Volume 1 – Field Sampling Plan Former Guterl Specialty Steel Corporation FUSRAP Site, Lockport, New York
5-71 01/18/07
5.4.7.1 Property Boundaries and Reference Coordinate Benchmarks Property boundaries and survey benchmarks will be determined using available public information. Civil surveys will be performed to provide benchmarks across the Site. These benchmarks may include property boundary locations and other locations that are convenient for access during the conduct of the investigation.
The survey grade benchmarks will be located to provide a reference for the investigation area data to local grid systems that will be established during the characterization surveys. The benchmarks will be tied to New York State Plane Coordinate System (West Zone).
5.4.7.2 Survey Units and Survey Grids A local grid system will be established at the Site prior to investigation activities (i.e., GWS) to:
• Aid in establishing and maintaining the specified survey coverage based on local grid coordinates.
• Provide a mechanism for referencing a measurement back to a specific location so that the same survey point can be readily relocated.
• Support direct comparison to data collected in prior surveys.
• Facilitate subsequent systematic selection of subsequent measuring/sampling locations.
• Provide a convenient means for determining average activity levels by area.
Each grid will consist of a system of intersecting lines, referenced to a fixed Site location or benchmark. The grid lines will be arranged in a perpendicular pattern, dividing the survey location into squares or blocks of equal area.
The site-wide outdoor reference coordinate system will initially be established as 20-meter grid squares oriented to grid north with the origin at the southwest corner of Building 4/9. The grid numbering system will coincide with the outdoor system used by ORISE (1999) to allow for convenient comparison of data.
Scale drawings of the survey areas will be developed that indicate facility features and superimposes the grid reference systems.
5.4.7.3 Location Survey Methods The use of a portable GPS unit may be utilized in outdoor areas to establish the general locations of soil borings, monitoring wells, and surface water/sediment samples for initial (i.e., observational) data development purposes. The GPS unit will be accurate to within approximately one meter and will be used in accordance with the GPS unit’s manufacturer recommendations. Each completed sample point will subsequently be surveyed to greater accuracy as described below.
A location survey will be conducted for all groundwater monitoring wells, soil borings, and other sample locations in accordance with EM 1110-1-4000 (USACE 1998). Horizontal locations will be referenced to NAD 83 and vertical elevations will be referenced using National Geodetic Vertical Datum 88.
Final Sampling and Analysis Plan, Volume 1 – Field Sampling Plan Former Guterl Specialty Steel Corporation FUSRAP Site, Lockport, New York
5-72 01/18/07
Groundwater monitoring wells will be surveyed at the top of the well riser (notched point), top of the protective casing, and the ground surface (north side ground surface, not the pad surface). All elements surveyed will have an accuracy of at least 0.01 feet.
A topographic survey will be completed as near as possible to the time when the last monitoring well is installed. Survey field data (as corrected), to include loop closures and other statistical data in accordance with the standards and specifications referenced above, will be provided to the USACE Project Manager. Closure will be within the horizontal and vertical limits referenced above. The following data will be clearly listed in tabular form: coordinates (and system) and elevation (ground surface and top of well) as appropriate, for all boreholes, wells, and reference marks. All permanent and semi-permanent reference marks used for horizontal and vertical control (i.e., benchmarks, caps, plates, chiseled cuts, rail spikes, etc.) will be described in terms of their name, character, physical location, and reference value.
5.4.8 Non-Impacted Areas No surveys are required for non-impacted areas. However, if on-site personnel decide to perform quality-assurance radiological measurements in a non-impacted area for some reason (for example, for personnel testing, training, or familiarization purposes), the locations and results of such measurements will be documented and reported. However, non-impacted areas generally will not be gridded for the purposes of establishing measurement or sampling locations.
5.4.9 Other Considerations Civil location surveys will be conducted for completed sample locations, monitoring wells, and other Site features using total station and/or GPS methods. Preliminary field sample staking and locations will be measured using a sub-meter accurate portable GPS unit to allow for accurate mapping of field screening data in support of the RI observational approach. GPS techniques are discussed in the GWS.
Limited geophysical surveys will be conducted to support underground utility clearance activities during the RI. Utility clearance activities are discussed in more detail in Section 5.3.3.
5.5 INVESTIGATION DERIVED WASTE DISPOSITION IDW includes all materials generated during performance of an investigation that cannot be effectively reused, recycled, or decontaminated in the field. IDW consists of materials that could potentially pose a risk to human health and the environment (i.e., hazardous waste), as well as materials that have little potential to pose risk to human health and the environment (i.e., non-hazardous wastes). IDW will be collected and categorized as potentially hazardous or non-hazardous.
Only IDW that do not exhibit a characteristic of a RCRA hazardous waste or contain RCRA hazardous waste may be returned to the environment. IDW that contains RCRA-listed waste or exhibits a characteristic of a hazardous waste will be managed on site and disposed off-site as RCRA hazardous waste.
A composite sample will be taken of each IDW type (soil or water) and analyzed off-site for disposal parameters, as itemized in Section 8.4. Overall IDW management is discussed in more detail in Section 8.
Final Sampling and Analysis Plan, Volume 1 – Field Sampling Plan Former Guterl Specialty Steel Corporation FUSRAP Site, Lockport, New York
5-73 01/18/07
5.6 LEVEL OF EFFORT It is emphasized that the estimated level of effort summarized in this chapter is based on the best available information available at the time this plan was written. The estimated level of effort will be updated continuously during the survey, with these updates provided to USACE on a regular basis.
The information presented in this FSP is an estimate, which will be updated during the survey as new and better information becomes available. Factors affecting the level of effort may include:
• Professional judgment during the survey may increase or decrease the level of effort in certain places.
• Immitigable safety hazards in certain areas may require a reduction in level of effort in those areas.
• Preliminary data gathering and assessment, such as GWS; e.g., it is possible that large portions of IA05 may be reclassified as Class 3 based on review of GWS data.
Regardless of the effort devoted to the development of this survey plan, all conditions, situations, and findings will not be as anticipated. Weather, hazardous, or site surface conditions may require changes in survey procedures, patterns, and schedules. Previously unknown areas of residual contamination may be found. Radionuclides which were not expected to be present at significant levels may be identified.
In order to be flexible and adaptable, unanticipated field conditions may require that this plan be modified based on situations and findings as the survey progresses. The RI Field Geologist will document these situations and findings as they arise and perform appropriate coordination with USACE if plan changes appear to be necessary.

Final Sampling and Analysis Plan, Volume 1 – Field Sampling Plan Former Guterl Specialty Steel Corporation FUSRAP Site, Lockport, New York
5-74 01/18/07
This page intentionally left blank.
Final Sampling and Analysis Plan, Volume 1 – Field Sampling Plan Former Guterl Specialty Steel Corporation FUSRAP Site, Lockport, New York
6-1 01/18/07
6 FIELD OPERATIONS DATA MANAGEMENT AND DOCUMENTATION
This section of the FSP describes the field documentation that will be maintained during the Site RI field work.
6.1 DATA CONTROL FOR DECISION MAKING To address the need to implement a real-time decision making approach with respect to data generation and evaluation, Earth Tech will implement a data control system for field and analytical data. As field and analytical data are generated during the RI, the data will be reviewed, reduced, and presented in the form of tables and figures in real-time during the collection effort to allow for the identification of data gaps.
To implement this approach, steps will be taken during the project planning stage, i.e., prior to the field effort, to facilitate data sharing when the field investigation begins. The following tasks will be completed in the planning stage of the field effort:
• Create a site-specific file transfer protocol (FTP) site for data sharing
• Create a database for all planned sample locations
• Create a translation for local reference grid to New York State Plane Coordinate System
• Prepare text file template with columns for x,y,z coordinates (planned and actual), screening results, on-site laboratory results and whether or not the location exceeds thresholds (this file will not contain QC results)
• Input data from prior investigations (e.g., ORISE, 1999) and from preliminary RI activities (e.g., gamma walkover survey)
• Develop a geographic information system (GIS) routine to develop and present maps of sample locations and results (i.e., whether the location exceeds thresholds)
• Field equipment (gamma walkover survey and GPS) and laboratory instruments (core scanning and on-site) will be set up to provide data electronically, directly from the instruments (to the extent possible) to minimize transcription errors.
During the field effort coordination between the GIS operator, on-site laboratory director, and project manager (PM) or Site Supervisor (SS) dedicated to this project will be necessary. The following tasks will be completed daily during the field effort, to the extent possible, with the goal of presenting the results of the previous days’ sampling on a daily basis:
• The SS and/or PM will consolidate, review and post the available results of sampling on the FTP site each day, posting QC results separately.
• The on-site laboratory director will review the data and then post the updated file to the FTP site.
• The GIS operator will identify which samples exceed screening criteria, and save and map these results to a PDF file. The operator will also check for unplanned samples (e.g.,
Final Sampling and Analysis Plan, Volume 1 – Field Sampling Plan Former Guterl Specialty Steel Corporation FUSRAP Site, Lockport, New York
6-2 01/18/07
drainage ditch samples, or additional samples collected to reduce the uncertainty in identifying impacted areas) that may be outside areas depicted on the maps and adjust the layouts accordingly. The PDF and text files will be uploaded to the FTP site.
• The PM and/or SS will download the latest map and use the criteria in the decision making flow charts (Figure 5-19 and Figure 5-20) and from the gamma walkover survey to identify data gaps and additional sample points needed to complete the delineation.
• If possible, the GIS software will be used to identify tentative data gaps based on the criteria outlined above for review by the project engineer.
Files posted to the FTP site will be named according to the date, state (field, screened, mapping) and placed in directories labeled for each day of sampling.
6.2 DAILY QUALITY CONTROL REPORTS During the field investigation activities performed for this project, the Earth Tech Team will prepare DQCRs, which will be signed and dated by the Earth Tech RI Field Geologist. These reports will be completed each day that work activities are performed on Site and filed in the field office. A copy of the DQCRs will be submitted to the USACE Project Manager on a weekly basis (or as otherwise agreed to) during field operations. Each DQCR will include a summary of activities performed at the Site, weather conditions, results of the Earth Tech activities performed including field instrument calibrations (unless maintained in a separate calibration log book), departures from the approved SAP, problems encountered during field activities, and any instructions received from Government personnel. Any deviations that may affect achieving the project data quality objectives will be immediately conveyed to the USACE Project Manager.
6.3 FIELD LOGBOOKS Samples will be collected following the sampling procedures documented in this FSP (see Section 5). When a sample is collected or a measurement is made, a description of the location with respect to site landmarks will be recorded in the field logbook. The equipment used to collect samples will be noted, along with the time of sampling, sample description, depth at which the sample was collected, volume, and number of containers. (Information recorded on other forms (for example, calibration log books or groundwater sampling logs) need not be repeated in the field logbook so long as the location of the information is clearly indicated.) A sample identification number will be assigned before sample collection. Field QA/QC samples (for example, field duplicates, spikes, and duplicates) and QA split samples will be noted under sample description. Equipment (instrumentation) employed to make field measurements will be identified.
6.4 PHOTOGRAPHS Earth Tech will obtain representative photographs (digital format) of routine operations, and will also obtain photographs of representative samples or locations to document unusual or controlling characteristics. For each photograph taken, the following items will be noted in the field logbook (or dedicated photograph logbook):
• Date
Final Sampling and Analysis Plan, Volume 1 – Field Sampling Plan Former Guterl Specialty Steel Corporation FUSRAP Site, Lockport, New York
6-3 01/18/07
• Time
• Name of the sample location
• General direction faced and description of the subject
• Sequential number of the photograph
After obtaining the photograph, the photographer will review the photographs to verify that the photograph was obtained as intended. If the photograph was not obtained as intended, another attempt will be made to obtain the photograph.
Standard film (analog) cameras will be maintained at the field office in the event a digital camera malfunctions. Photographs made with film cameras will be delivered in electronic format on compact discs (CDs) from the developer.
6.5 SAMPLE DOCUMENTATION This section describes the sample documentation requirements that will be followed during field sampling activities for the Site RI.
6.5.1 Sample Numbers A sample numbering system will be used to enable tracking and management of environmental samples and the resulting laboratory and/or field analytical data. Each sample will be assigned a unique alpha-numeric sample number that includes a matrix-specific code and a unique numeric code. Numeric codes will run consecutively through the entire course of the project and will not be re-used for the same sample matrix. Separate groups of numeric codes will be used for regular field samples and field duplicate samples for ease of identification and tracking in the field.
The following describes all of the components of the sample numbering system and provide examples of sample numbers.
Investigative Area codes:
A prefix indicating the IA from which the sample was collected will lead the sample identification string. For IA01, a modified system is proposed to allow for quick recognition of the respective building.
Bxx
Exx
Investigative Area 01, interior, where B is Building and xx is 01, 02, etc.
Investigative Area 01, exterior, where B is Building and xx is 01, 02, etc.
A02 Investigative Area 02
A03 Investigative Area 03
A04x Investigative Area 04, where x = A, B, C, or D, as appropriate
A05x Investigative Area 05, where x = A or B, as appropriate
- - (IA06 intentionally omitted – no samples planned)
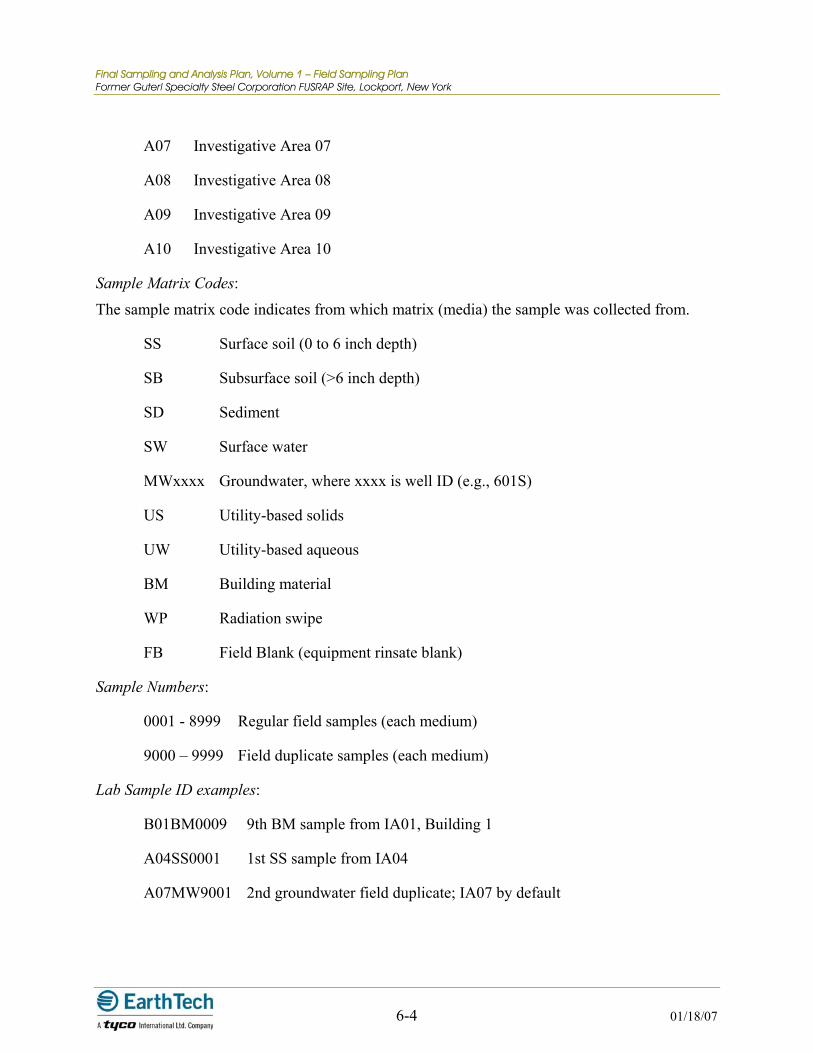
Final Sampling and Analysis Plan, Volume 1 – Field Sampling Plan Former Guterl Specialty Steel Corporation FUSRAP Site, Lockport, New York
6-4 01/18/07
A07 Investigative Area 07
A08 Investigative Area 08
A09 Investigative Area 09
A10 Investigative Area 10
Sample Matrix Codes:
The sample matrix code indicates from which matrix (media) the sample was collected from.
SS Surface soil (0 to 6 inch depth)
SB Subsurface soil (>6 inch depth)
SD Sediment
SW Surface water
MWxxxx Groundwater, where xxxx is well ID (e.g., 601S)
US Utility-based solids
UW Utility-based aqueous
BM Building material
WP Radiation swipe
FB Field Blank (equipment rinsate blank)
Sample Numbers:
0001 - 8999 Regular field samples (each medium)
9000 – 9999 Field duplicate samples (each medium)
Lab Sample ID examples:
B01BM0009 9th BM sample from IA01, Building 1
A04SS0001 1st SS sample from IA04
A07MW9001 2nd groundwater field duplicate; IA07 by default
Final Sampling and Analysis Plan, Volume 1 – Field Sampling Plan Former Guterl Specialty Steel Corporation FUSRAP Site, Lockport, New York
6-5 01/18/07
6.5.2 Sample Labels Labels will be affixed to all sample containers during sampling activities. Some information may be preprinted on each sample container label (for example, project name and location). Information that is not pre-printed will be recorded on each sample container label at the time of sample collection. The information to be recorded on the labels will be as follows:
• Contractor name (Earth Tech)
• Sample identification number
• Analysis to be performed
• Type of chemical preservative present in container
• Date and time of sample collection
• Sampler's initials
6.6 RECORDS
6.6.1 Responsibilities The Health Physicist will evaluate radiological information and verify that adequate documentation is maintained. Requirements of radiological documentation are contained in SOP 005, Standard Operating Procedure: Documentation Control (Attachment 1).
The RI Field Geologist is responsible for the maintenance, storage, and transfer of documents. Any deviation from the requirements will be reported immediately to the Project Manager.
Health Physics Technicians and other field personnel will record documentation neatly and in accordance with these and work plan procedures and requirements.
6.6.2 Controlled Records The following is a list of field records that may be produced during the project (copies of the logs and forms are located in SOP 005):
• Instrument Calibration Records
• Instrument Source Check Records
• Radiation Survey Forms
• Medical Information
• Training Records
• Dosimetry Records
• Project Field Logs
• Project Reports
• Radioactive Material Transportation Records
• Radioactive Material Disposal Records

Final Sampling and Analysis Plan, Volume 1 – Field Sampling Plan Former Guterl Specialty Steel Corporation FUSRAP Site, Lockport, New York
6-6 01/18/07
• Radioactive Source Transfer Receipts
• Sample Collection Forms
• Sample Chain of Custody Records
• Emergency Response Documentation
• Document Distribution and Transmittal Forms
• Respirator Issue Logs and History Records
• Bioassay Records
• Personnel and Equipment Contamination and Decontamination Reports
6.6.3 Quality Control The project manager will verify that quality records are accurate, neatly and properly prepared, properly maintained, and periodically reviewed during the project.
The RI Field Geologist or delegated representative will periodically review the status of controlled documents, and document the findings to the program manager.
The Project Manager will verify that required records are present at the end of the project and that records are safely maintained during transfer or shipment to the archival location.
6.7 FIELD DOCUMENTATION PROCEDURES/DATA MANAGEMENT AND RETENTION
Hard copies of original site and field logbooks, COC forms, field data with analytical results and associated QA/QC information, and other field-related information will be indexed, catalogued into appropriate file groups and series, and archived.
The project data will be archived to appropriate electronic media. Originals of field data (for example, logbooks) will be scanned and archived in portable document format (that is, as a pdf). A data archive information package (that is, metadata) will be prepared that describes the data system, file format, and method of archive. Sufficient documentation will accompany the archived data to describe the source, contents, and structure of the data.
Necessary field data will be incorporated into the final Quality Control Summary Report (along with laboratory and other relevant data) in either hard copy or electronic versions, as described in Section 8.6 of the QAPP.
Final Sampling and Analysis Plan, Volume 1 – Field Sampling Plan Former Guterl Specialty Steel Corporation FUSRAP Site, Lockport, New York
7-1 01/18/07
7 SAMPLE PACKAGING AND SHIPPING REQUIREMENTS The following sections describe environmental sample packaging and shipping requirements that will apply during execution of the Site RI field activities.
7.1 SAMPLE CONTAINERIZATION AND PRESERVATION Sample containers, chemical preservation techniques, and holding times for soil and water samples collected during the RI are described in Table 4-1 of the QAPP. Sample containers will be provided by the analytical laboratory. Containers for chemical analysis of chemical (non-radiological) analyses will be provided pre-preserved, as required by the method. (Soil samples are not subject to chemical preservation). Soil and water samples for chemical analysis will be cooled to and maintained at 4°C (±2°C) immediately after collection by placing the sample in a cooler with ice and storing the samples either in coolers with ice or in a refrigerator. The samples will be maintained at this temperature until the samples are analyzed. In the event that sample integrity is compromised, the problem will be noted on the laboratory’s “condition on receipt” form (example copy of this form is provided in QAPP Appendix A) and the laboratory will contact the designated Earth Tech QA officer or his representative for instructions.
Samples for radiological analysis do not require preservation of any type, including temperature preservation. Containers will be provided by the laboratory and packaging will be appropriate for the type of analysis and volume required (see QAPP Table 4-1).
7.2 SAMPLE PACKAGING AND SHIPPING Environmental sample containers will be packaged and shipped in steel or sturdy rigid plastic coolers. Sample packaging and shipping will be conducted in accordance with applicable guidance following EM 200-1-3, Appendix F (USACE 2001a). Packaging and shipping procedures to be utilized for samples collected during this project will include the following:
• Use waterproof high-strength plastic ice chests or coolers only.
• After filling out the pertinent information on the sample label, put the sample in the container (bottle) and secure the closure. Bottle lids may be secured with tape to reduce the likelihood of leakage during shipment; however this is not required.
• Tape cooler drain shut
• Place about 3 inches of inert cushioning material such as bubble-pack or styrofoam “popcorn” in the bottom of the cooler.
• Enclose the samples in clear plastic bags through which sample labels are visible, and seal the bag. Place bottles upright in the cooler in such a way that they do not touch and will not touch during shipment
• Put in additional inert packing material to partially cover sample bottles (more than half-way). For samples for chemical analysis only, place bags of ice or frozen ice-gel packs in double bags around, among, and on top of the sample bottles.
• Fill the remaining space in the cooler with cushioning material.
Final Sampling and Analysis Plan, Volume 1 – Field Sampling Plan Former Guterl Specialty Steel Corporation FUSRAP Site, Lockport, New York
7-2 01/18/07
• If sending the samples by common carrier (e.g., FedEx), sign the chain-of-custody under “Relinquished by,” enter the carrier name and airbill number, retain a copy for field records, and put the chain-of-custody record in waterproof, sealed plastic bag and secure it with tape to the inside lid of the cooler.
• Apply custody seals to the front and back of the cooler, across the lid.
• Secure lid by taping. Wrap the cooler completely with tape at a minimum of two locations. Do not cover any labels.
• The airbill for the shipment will be completed and attached to the top of the shipping box/cooler, which will then be transferred to the courier for delivery to the laboratory. The shipping label must include a return address.
• Ship the cooler to the laboratory by overnight express (i.e., FedEx).
For radiological analyses, samples may be consolidated over several days if appropriate to maximize shipping efficiency. Environmental samples for chemical analyses will be shipped as soon as possible, normally on the same day or by the day after sample collection. Samples may be held in a secure area for a longer period of time, provided that analyte-specific holding times are not jeopardized. During the time period between collection and shipment, samples for non-radiological analyses will be stored in ice-filled coolers or refrigerated (when required) and maintained in a secure area. Holding times are provided Table 4-1 of the QAPP.
Final Sampling and Analysis Plan, Volume 1 – Field Sampling Plan Former Guterl Specialty Steel Corporation FUSRAP Site, Lockport, New York
8-1 01/18/07
8 INVESTIGATION-DERIVED WASTE MANAGEMENT IDW includes all materials generated during performance of an investigation that cannot be effectively reused, recycled, or decontaminated in the field. IDW consists of materials that could potentially pose a risk to human health and the environment (i.e., hazardous waste), as well as materials that have little potential to pose risk to human health and the environment (i.e., non-hazardous wastes). IDW will be collected and categorized as potentially hazardous or non-hazardous. Potentially hazardous IDW (e.g., purge water, decontamination fluids, drill cuttings, disposable protective clothing, and dedicated disposable sampling equipment) will be tested and characterized for disposal. Non-hazardous IDW (i.e., normal trash) will be disposed of in a timely fashion during fieldwork. Existing IDW generated during previous investigations will be inventoried for informational purposes only. Procedures to be utilized for managing IDW are described below.
8.1 IDW COLLECTION AND CONTAINERIZATION Drill cuttings will be collected and segregated according to the IA from which they were generated. Solid IDW (i.e., drill cuttings) will be contained in new or reconditioned UN1A2/X1.8/250, labeled, open-top 55-gallon drums equipped with plastic drum liners and sealed with bung-top lids. Rock cores will be placed in appropriately labeled wooden core boxes for characterization and future reference and disposal.
Other solid IDW including expendable sampling equipment, personal protective equipment (PPE), and trash will be segregated as potentially contaminated or non-contaminated material on the basis of visual inspection (e.g., soiled versus non-soiled), usage of the waste material (e.g., outer sampling gloves versus glove liners), and field screening of the material using available field instrumentation (e.g., photo-ionization detector and radiation detectors). Non-contaminated IDW will be contained in trash bags and will be placed in a rented dumpster for periodic disposal at a municipal landfill. Potentially contaminated IDW will be contained in new or reconditioned UN1A2/X1.8/250, labeled open-top 55-gallon drums equipped with plastic drum liners and sealed with bung-top lids.
Liquid IDW generated from monitoring well installation, development, and purging will be collected in new UN1A1/X1.8/250, labeled 55-gallon closed-top drums with a minimum of 10 percent headspace and segregated by well location. Liquid IDW generated from decontamination activities and rinses will be collected in new UN1A1/X1.8/250, labeled 55-gallon closed-top drums with a minimum of 10% headspace and segregated by waste stream.
During project activities, waste generation will be minimized to the greatest extent practical. Waste will be minimized by limiting access to restricted areas, reuse and decontamination of equipment, and use of non-hazardous materials.
8.2 WASTE CONTAINER LABELING Drums and other IDW storage containers will be labeled as they are generated and collected for proper identification of the stored wastes. The following procedure will be used for waste container labeling.
Final Sampling and Analysis Plan, Volume 1 – Field Sampling Plan Former Guterl Specialty Steel Corporation FUSRAP Site, Lockport, New York
8-2 01/18/07
Weather-resistant, commercially available Empty, Pending Analysis, Hazardous, Non-hazardous, and/or Radioactive Material labels, as appropriate, will be affixed on two sides on the upper one-third of each storage container. Each label will be placed on a smooth part of the container and will not be affixed across drum bungs, seams, ridges, or dents. Container labels will be protected in a manner to prevent damage or degradation of the recorded information. Additional label information may be recorded directly on a clean, dry drum surface using an indelible paint marker.
Information documented on container labels will be recorded with a permanent marker or paint pen, and will also be recorded in the IDW log (refer to Attachment 4 for a copy of the IDW log). Information to be recorded on each label will include the following:
• Project name and site identification • Container number • Generation date(s) • Contents / source of waste • Physical characteristic of the waste • Emergency contact information
All containers, including those that are empty, must be labeled appropriately. A Pending Analysis label will be affixed to applicable containers until characterization of the IDW is complete. After characterization, the Pending Analysis label will be replaced by either a Hazardous, Non-Hazardous, and/or Radioactive Material label, as appropriate.
Radioactive material labels will be affixed to those containers when radiological results from the environmental samples statistically exceed the background concentration. Liquid IDW will be labeled as radioactive material if, when evaluated against NRC water effluent release concentrations (10 CFR 20, Appendix B, Table 2, Column 2), an exceedance is noted.
8.3 IDW FIELD STAGING AREA Subject to the review and approval of USACE, the RI Field Geologist will designate a primary IDW Field Staging Area (FSA) for the project. The primary FSA will be located within the locked fence of the Excised Area. A satellite FSA will also be established and co-located with the primary decontamination facility to store liquid and solid IDW resulting from decontamination activities. Solid and liquid IDW will be stored in an FSA until such time that the IDW is characterized for disposal in accordance with Section 8.4.
Each FSA will be visibly marked and any waste containers will be placed on top of plastic sheeting and/or pallets. Liquid waste containers will be stored on approved spill collection pallets and will be covered with tarps to limit surface water collection. IDW will be segregated by location and type (e.g., drill cuttings, decontamination fluids, well development and purge water, etc.) so that the IDW generated can be identified with a given location or operation. Waste containers will be stored in a manner to accommodate inspection and sampling, if necessary, and to facilitate safe handling of the containers.
Any contaminated or potentially contaminated liquid IDW that is stored in an FSA during winter months will require special management to prevent accidental releases due to freezing. IDW will be managed so that, if possible, disposal can be completed before freezing conditions arise. If
Final Sampling and Analysis Plan, Volume 1 – Field Sampling Plan Former Guterl Specialty Steel Corporation FUSRAP Site, Lockport, New York
8-3 01/18/07
disposal cannot be executed before the onset of such conditions, or if long-term storage of liquids is anticipated, suitable secondary containment will be provided.
IDW stored within the on-site FSA will be inspected on a regular basis while Earth Tech personnel are on site from the time of containerization and placement in the FSA to the time of ultimate disposition. Inspections of the FSA and associated IDW containers will be conducted a minimum of weekly while Earth Tech personnel are on site and will be documented in the field notebook. IDW containers will be visually inspected for leaks, improper seals, or other damage or unsafe condition. Any container damage or unsafe condition associated with the FSA will be reported to USACE, the RI Field Geologist, and appropriate regulatory agencies, if necessary.
8.4 IDW CHARACTERIZATION AND CLASSIFICATION FOR DISPOSAL
IDW (liquid and solid) generated as part of this investigation will be characterized for disposal based on disposal characterization samples. Analytical parameters for IDW listed below are based on known site contaminants and, to a lesser extent, presumed disposal requirements. This parameter list may be modified based on the results of NYSDEC’s current RI, if data are available prior to characterization of the Earth Tech-generated IDW.
Soils will be analyzed for COPCs (U, Th, and Ra isotopes), TCLP metals, and PCBs. Sediments, if any are generated (unlikely), may also be analyzed for free liquids using the paint filter test.
Groundwater will be analyzed for COPCs, gross alpha/beta, and VOCs.
Note that there is no evidence (based on site knowledge and characteristics) that any of the media being sampled would be hazardous for corrosivity (for groundwater, this will be confirmed by field pH measurements during sampling), ignitability (only a concern if there are sufficient flammable volatile organic vapors, which is not the case for the Guterl soil or water); or reactivity.
Potentially contaminated PPE and expendable sampling equipment and other items not amenable for sampling will be scanned for radiation and characterized for disposal based on its physical description, radiological screening, and general knowledge of the types and degree of contamination at the Site (both as indicated during the previous ORISE investigation as well as the current Earth Tech investigation).
8.5 INVENTORY OF IDW FROM PREVIOUS INVESTIGATIONS IDW from previous investigations (believed to be generated by ORISE and NYSDEC) has been identified on Site. These materials include rock cores (currently in wooden core boxes), bagged PPE, drummed soil cuttings and/or PPE, and other miscellaneous materials, much of which may not be amenable to sampling or analysis.
Existing IDW will be inventoried by Earth Tech, with a description of the location, estimated quantity, container type, and material contained noted on the IDW log included in Attachment 4. Opening of any containerized IDW – drums, boxes, or other items – will be in accordance with the RPP and SSHP for the Site. Radiological screening data will be recorded, and the containers will be labeled in accordance with Section 8.2. Earth Tech will isolate exiting IDW
Final Sampling and Analysis Plan, Volume 1 – Field Sampling Plan Former Guterl Specialty Steel Corporation FUSRAP Site, Lockport, New York
8-4 01/18/07
areas using simple barriers (e.g., caution tape or high visibility fence) to minimize foot traffic near the staged materials.
8.6 DISPOSAL OF IDW IDW from the Guterl Steel FUSRAP RI will be staged on site as described in Section 8.3. The FUSRAP RI IDW will be characterized for disposal as described in Section 8.4. Earth Tech will coordinate FUSRAP RI IDW disposal utilizing appropriately licensed transporters for disposal at appropriately licensed facilities as determined by characterization samples. Earth Tech will prepare waste manifests and other shipping documents, as appropriate. A representative of the USACE will sign the respective waste manifests and other shipping documents.
For the purposes of this section, all soil/solids samples (including samples returned from off-site laboratories) and building material samples (e.g., concrete cores) will be staged onsite for possible future analyses. The samples will be stored in a dry, secure area of the site, which may include rented trailer-type storage units if a suitable location cannot be identified.
Existing IDW from prior investigations will be disposed during the future remediation phase of the Site.
Final Sampling and Analysis Plan, Volume 1 – Field Sampling Plan Former Guterl Specialty Steel Corporation FUSRAP Site, Lockport, New York
9-1 01/18/07
9 CONTRACTOR CHEMICAL QUALITY CONTROL PROGRAM /THREE-PHASE INSPECTION PROCEDURES
This section of the FSP summarizes the CCQC program that will be implemented and used during the completion of all Site RI field activities. The CCQC program to be utilized by the Earth Tech team for the project will consist of three phases. The three CCQC phases include the preparatory phase, the initial phase, and the follow-up phase. The CCQC program will be performed whether or not a USACE-Buffalo District representative is present.
Several definable features of work that make up the CCQC program are identified below:
• Soil sampling
• Sediment/surface water sampling
• Monitoring well construction
• Groundwater sampling
• Building surveys
• Background sampling
The relationship between the three phases and the definable features of work is explained in the following sections.
9.1 PREPARATORY PHASE The preparatory phase of the CCQC program will be conducted by the Earth Tech team representative, in conjunction with the rest of the field staff, prior to beginning each definable feature of work. A summary of all activities performed during each preparatory phase meeting will be documented by the CQC Supervisor in a meeting minutes record. The USACE Project Manager may wish to attend preparatory meetings and shall be informed of these meetings.
Each preparatory phase meeting will address the following:
• Review pertinent sections of the SAP in order to ensure that field personnel are cognizant of the overall project data quality objectives, specific project activities to be accomplished, and specific sampling and analysis requirements.
• Review of calibration procedures for instruments to be used for measurement of field parameters.
• Physical examination of all materials and equipment required to accomplish the specific project activities.
• Review of equipment decontamination procedures in accordance with the project Work Plan.
• Review of how each sample type is to be collected, containerized, documented and packaged.
• Review of proper IDW management and documentation.
Final Sampling and Analysis Plan, Volume 1 – Field Sampling Plan Former Guterl Specialty Steel Corporation FUSRAP Site, Lockport, New York
9-2 01/18/07
• Review of the procedure for completing all required information to be recorded on sample custody forms, and discussion of the project sampling numbering system. Completed examples of a COC form, sample container label, and IDW drum will be provided to the field personnel for reference.
• Review/discussion of any other activities to be performed as deemed necessary by the CQC Supervisor.
• Examination of the work area(s) to ascertain if all preliminary work is complete.
• Review of preparatory phase field equipment and support materials checklists.
9.2 INITIAL PHASE The initial phase of the CCQC program will be conducted by the CQC Supervisor and will include the following:
• Oversight of drilling, geoprobing, monitoring well installation, field lab, and/or sampling activities and review of this work to ensure compliance with delivery order requirements.
• Inspection of individual sample labels and COC forms for accuracy, completeness, and consistency.
• Inspection of sample packaging and shipping activities.
• Observation, verification, and documentation of initial and ongoing field instrument calibration.
• Inspection of field logbooks and other field records/sketches to assure that all pertinent data are recorded in accordance with delivery order requirements.
• Inspection of the QA sample match-up table to ensure that all samples collected during each day are documented properly.
9.3 FOLLOW-UP PHASE The follow-up phase of the CCQC program will be conducted by the CQC Supervisor. The CQC Supervisor will perform follow-up phase inspections on an as-needed basis to ensure continued compliance with contract requirements until completion of that particular feature of work. General procedures and documentation as included in the initial phase will be periodically checked to ensure they are complete, accurate, and consistently executed throughout the duration of the project.
Final Sampling and Analysis Plan, Volume 1 – Field Sampling Plan Former Guterl Specialty Steel Corporation FUSRAP Site, Lockport, New York
10-1 01/18/07
10 CORRECTIVE ACTIONS The ultimate responsibility for maintaining quality throughout the project rests with the Project Manager. The responsibility for the routine implementation of the QA Program during the RI, however, falls on the RI Field Geologist and the QA/QC Officer.
Corrective action will be taken when significant non-conformance with the CCQC program, QAPP or other project quality document occurs. A non-conformance is defined as an event which is beyond the limits established for a particular operation. Non-conformances can occur within the realm of sampling procedures, sample receipt, sample storage, sample analysis, data reporting, and computations.
Corrective actions will be implemented to resolve problems and to restore proper functioning to the analytical system when errors, deficiencies, or out-of-control situations occur during field activities or at the laboratory. Documentation of the corrective action procedure needed to resolve the problem will be filed with the project records, and the information will be summarized in the case narrative. A discussion of the corrective actions to be taken is presented in the following sections.
10.1 FIELD CORRECTIVE ACTIONS The RI Field Geologist will review the procedures being implemented in the field for consistency with the established protocols in the FSP and QAPP. The RI Field Geologist will be responsible for implementation and documentation of the appropriate corrective action, and informing the Project Manager of any such actions.
10.2 LABORATORY CORRECTIVE ACTIONS Laboratory corrective actions are addressed in Section 5.7of the QAPP.

Final Sampling and Analysis Plan, Volume 1 – Field Sampling Plan Former Guterl Specialty Steel Corporation FUSRAP Site, Lockport, New York
10-2 01/18/07
This page intentionally left blank.
Final Sampling and Analysis Plan, Volume 1 – Field Sampling Plan Former Guterl Specialty Steel Corporation FUSRAP Site, Lockport, New York
11-1 01/18/07
11 REFERENCES AEC, 1958. Handbook of Federal Regulations Applying to Transportation of Radioactive
Materials. May.
Brett, C.E., Tepper, D.H., Goodman, W.M., LoDuca, S.T., and Eckert, B.Y., 1995. Revised Stratigraphy and Correlations of the Niagara Provincial Series (Medina, Clinton, and Lockport Groups) in the Type Area Western New York: United States Geological Survey (USGS) Bulletin 2086, 66p.
Buehler, E.J., and Tesmer, I.H., 1963. Geology of Erie County, New York: Buffalo Society of Natural Sciences Bulletin, v. 21, no. 3, 118p.
Delaware Secretary of State, 1966. Certificate of Ownership and Merger, Merging Simons Saw and Steel Co. into the Wallace-Murray Corporation. June.
Department of Energy (DOE), 2002. A Graded Approach for Evaluating Radiation Doses to Aquatic and Terrestrial Biota: DOE-STD-1153-2002. July.
Ford, Bacon, & Davis Utah Inc (FBDU). 1981. Preliminary Engineering and Environmental Evaluation of the Remedial Action Alternatives for the Former Simonds Saw and Steel Company Site. Prepared for Bechtel National Inc., Nuclear Fuel Operations under Contract DE-AC05-810R20722 with the Department of Energy. Bechtel Report No. 10-05-11-59A. November.
Guterl Specialty Steel Corporation, Simonds Steel Division, 1979. Memo from Guterl Steel to the U.S. Department of Energy regarding a summary of MED/AEC activities conducted at Simonds with attached copy of a document titled “Uranium History”. E.C. Keller. January.
Nuclear Regulatory Commission (NRC), 1998. Minimum Detectable Concentrations with Typical Radiation Survey Instruments for Various Contaminants and Field Conditions. NUREG 1507. June.
NRC, 2000. Nuclear Material Safety and Safeguards Decommissioning Standard Review Plan. NUREG-1727. September.
New York State Department of Environmental Conservation (NYSDEC), 1988. Engineering Investigations at Inactive Hazardous Waste Sites – Phase I Investigation, Guterl Specialty Steel, City of Lockport, Niagara County. Division of Environmental Remediation, Region 9, Buffalo NY. Prepared for NYSDEC by Engineering-Science and Dames & Moore. January.
NYSDEC, 1991. Engineering Investigations at Inactive Hazardous Waste Sites – Preliminary Site Assessment, Task 1 – Records Search. Guterl Specialty Steel, City of Lockport, Niagara County. Prepared for NYSDEC by E.C. Jordan Co., Portland, ME. January.
NYSDEC, 1994. Engineering Investigations at Inactive Hazardous Waste Sites – Preliminary Site Assessment, Task 3 – Evaluation of Initial Data. Volumes I and II. Guterl Specialty

Final Sampling and Analysis Plan, Volume 1 – Field Sampling Plan Former Guterl Specialty Steel Corporation FUSRAP Site, Lockport, New York
11-2 01/18/07
Steel, City of Lockport, Niagara County. Prepared for NYSDEC by ABB Environmental Services, Portland, ME. April.
NYSDEC, 1999. Summary of data obtained during a radiation survey of the property north of the Allegheny Ludlum Mill in Lockport, New York. October.
NYSDEC, 2000. Immediate Investigative Work Assignment (IIWA) Report – Guterl Excised Area, City of Lockport, Niagara County. Division of Environmental Remediation, Region 9, Buffalo NY. October.
NYSDEC, 2003. Registry of Inactive Hazardous Waste Disposal Sites in New York, Volume 9. April.
Niagara County Clerks Department (NCCD), 1943a. Deed: Simonds Saw and Steel Company to Frank B. Anderson and Louise M. Anderson, Deeds No. 711, pp 63-64. February.
NCCD, 1943b. Deed: Simonds Saw and Steel Company to Vincent Logozzo and Mary Logozzo, Deeds No. 711, pp 65-66. February.
NCCD, 1943c. Deed: Simonds Saw and Steel Company to Joseph A. Gervaise and Isabell Gervaise, Deeds No. 711, pp 71-72. February.
NCCD, 1978. Deed: Wallace-Murray Corp. to Guterl Specialty Steel Corp. Liber 1616 pp 817 – 821. May.
Niagara County Real Property Tax Services, 2004. Tax Map 108.20. May.
Oak Ridge Associated Universities, Dade Moeller & Associates, MJW Corporation, 2005. Site Profile for Simonds Saw and Steel. Dose Reconstruction Project for NIOSH, Document Number ORAUT-TKBS-0032. July.
Oak Ridge Institute for Science and Education (ORISE), Environmental Survey and Site Assessment Program (ESSAP). 1999. Radiological Survey of the Guterl Specialty Steel Corporation, Lockport, New York (T. J. Vitkus for the United States Bankruptcy Court for the Western District of Pennsylvania.) December.
Oak Ridge National Laboratory (ORNL). 1978. Radiological Survey of the Former Simonds Saw and Steel Company, Lockport, New York. Final Report. Prepared by the Health and Safety Research Division, ORNL, Oak Ridge, TN. September.
Simonds Saw and Steel Company, 1943. Telegram Regarding Preference Rating Certificate TA-719927. April.
Simonds Saw and Steel Company, 1949. Memo to Atomic Energy Commission: Railroad Cars. A.D. Potts. August.
United States Army Corps of Engineers (USACE), 1997. Radiation Protection Manual, Engineer Manual (EM) 385-1-80. May.
USACE, 1998, Monitoring Well Design, Installation, and Documentation at Hazardous, Toxic, and Radioactive Waste Site, EM 1110-1-4000. November.
USACE, 2001a. Requirements for the Preparation of Sampling and Analysis Plans, EM 200-1-3. February.
Final Sampling and Analysis Plan, Volume 1 – Field Sampling Plan Former Guterl Specialty Steel Corporation FUSRAP Site, Lockport, New York
11-3 01/18/07
USACE, 2001b. Preliminary Assessment/Site Inspection (PA/SI) – Former Guterl Specialty Steel Corporation, Lockport, New York. US Army Corps of Engineers, Buffalo District. April.
USACE, 2005a. Scope of Work, Data Review, Data Gap Analysis, Acquisition of Field Data, and Remedial Investigation for the Former Guterl Specialty Steel Corporation. US Army Corps of Engineers (USACE), Buffalo District. March.
USACE, 2005b. Summary of Historical Analytical Data for the Guterl Steel FUSRAP Site, Lockport, New York. USACE, Buffalo District. June.
USACE, 2005c. Preliminary Identification of DQOs and ARARs for the Former Guterl Specialty Steel Corporation. Final. Prepared by Earth Tech for USACE, Buffalo District. September.
USACE, 2006a. Data Gap Analysis Report for the Former Guterl Specialty Steel Corporation. Final. Prepared by Earth Tech for USACE, Buffalo District. March.
USACE, 2006b. Data Gap Analysis Summary Report for the Former Guterl Specialty Steel Corporation. Final. Prepared by Earth Tech for USACE, Buffalo District. March.
US Bankruptcy Court, 1984. Motion and Order for approving modification of terms of sale of assets. Western District of Pennsylvania, Bankruptcy No. 82-2590. August.
US Bankruptcy Court, 2004. Motion and Cross Motion to compel disgorgement or valuation hearing and opposition to trustee’s motion to abandon property of estate, disburse funds, and close case filed by interested party State of New York. Western District of Pennsylvania Consolidated Case No. 82-22590-BM. July.
US Environmental Protection Agency (USEPA), 1988. Guidance for Conducting Remedial Investigations and Feasibilities Studies under CERCLA. Interim Final. Office of Emergency and Remedial Response. EPA/540/G-89/004 (OSWER Directive 9355.3-01). October.
USEPA, 1990. National Oil and Hazardous Substances Pollution Contingency Plan. USEPA. Washington, D.C. [55 FR 8666].
USEPA, 1991. Risk Assessment Guidance for Superfund, Volume 1, Part B – Development of Risk-based Preliminary Goals. Interim. EPA/540/R-92/003. December.
USEPA, 1998. Final Report – Guterl Steel Site, Lockport, New York. Prepared by Roy F. Weston, Inc. for USEPA/ERTC). April.
USEPA, US DOE, US NRC, US Department of Defense, 2000. Multi-Agency Radiation Survey and Site Investigation Manual (MARSSIM). EPA 402-R-97-016, Rev 1; NUREG 1575-Rev 1; DOE-EH 624, Rev 1. August.
USGS, 1980. Lockport, New York 7 ½ Minute Topographic Quadrangle.
United States Ordnance Department, 1919. Memo Regarding Ordnance Department Contracts with the Simonds Manufacturing Company. R.H. Hawkins, E.B. Cooper. May.

Final Sampling and Analysis Plan, Volume 1 – Field Sampling Plan Former Guterl Specialty Steel Corporation FUSRAP Site, Lockport, New York
11-4 01/18/07
This page intentionally left blank.

#�$�%�#�$�%�#�$�%�#�$�%������

This page intentionally left blank.
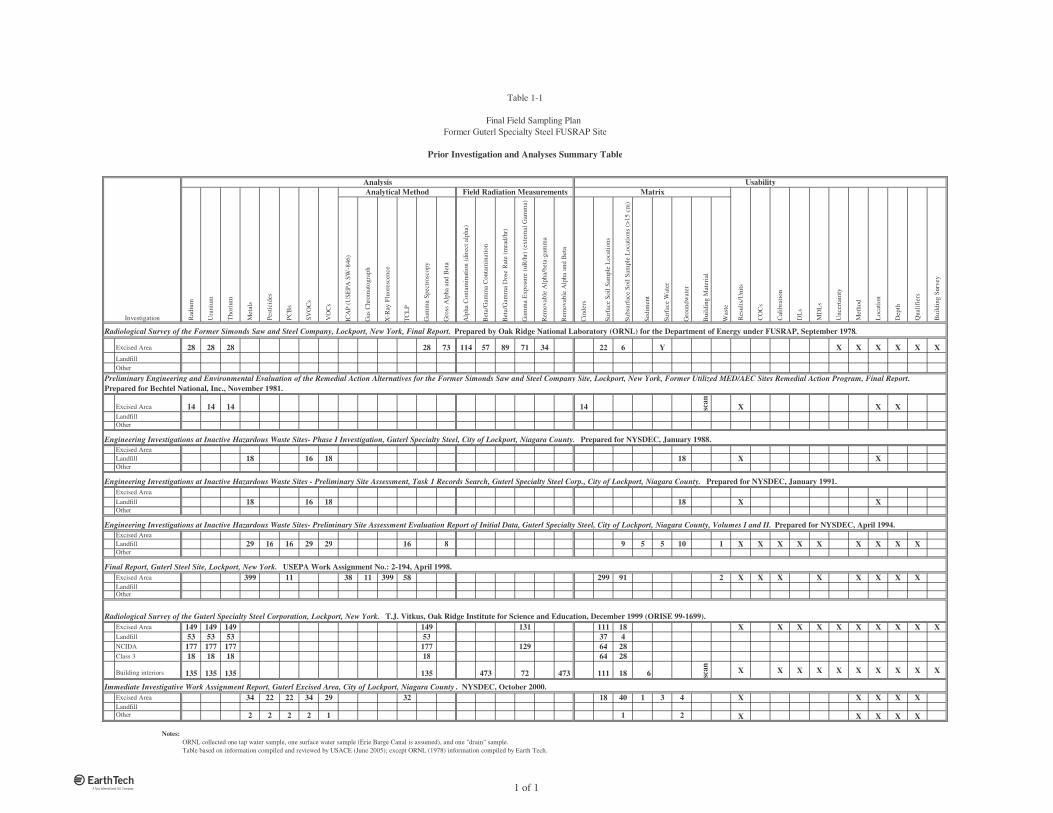
ICA
P (U
SEPA
SW
-846
)
Gas
Chr
omat
ogra
ph
X-R
ay F
luor
esce
nce
TC
LP
Gam
ma
Spec
tros
copy
Gro
ss A
lpha
and
Bet
a
Alp
ha C
onta
min
atio
n (d
irec
t alp
ha)
Bet
a/G
amm
a C
onta
min
atio
n
Bet
a/G
amm
a D
ose
Rat
e (m
rad/
hr)
Gam
ma
Exp
osur
e (u
R/h
r) (e
xter
nal G
amm
a)
Rem
ovab
le A
lpha
/bet
a-ga
mm
a
Rem
ovab
le A
lpha
and
Bet
a
Cin
ders
Surf
ace
Soil
Sam
ple
Loc
atio
ns
Subs
urfa
ce S
oil S
ampl
e L
ocat
ions
(>15
cm
)
Sedi
men
t
Surf
ace
Wat
er
Gro
undw
ater
Bui
ldin
g M
ater
ial
Was
te
Excised Area 28 28 28 28 73 114 57 89 71 34 22 6 Y X X X X X XLandfillOther
Excised Area 14 14 14 14 scan X X X
LandfillOther
Excised Area Landfill 18 16 18 18 X XOther
Excised Area Landfill 18 16 18 18 X XOther
Excised Area Landfill 29 16 16 29 29 16 8 9 5 5 10 1 X X X X X X X X XOther
Excised Area 399 11 38 11 399 58 299 91 2 X X X X X X X XLandfillOther
Excised Area 149 149 149 149 131 111 18 X X X X X X X X X XLandfill 53 53 53 53 37 4NCIDA 177 177 177 177 129 64 28Class 3 18 18 18 18 64 28
Building interiors 135 135 135 135 473 72 473 111 18 6 scan X X X X X X X X X X
Excised Area 34 22 22 34 29 32 18 40 1 3 4 X X X X XLandfillOther 2 2 2 2 1 1 2 X X X X X
Notes:ORNL collected one tap water sample, one surface water sample (Erie Barge Canal is assumed), and one "drain" sample. Table based on information compiled and reviewed by USACE (June 2005); except ORNL (1978) information compiled by Earth Tech.
Final Report, Guterl Steel Site, Lockport, New York. USEPA Work Assignment No.: 2-194, April 1998.
Radiological Survey of the Guterl Specialty Steel Corporation, Lockport, New York. T.J. Vitkus, Oak Ridge Institute for Science and Education, December 1999 (ORISE 99-1699).
Immediate Investigative Work Assignment Report, Guterl Excised Area, City of Lockport, Niagara County . NYSDEC, October 2000.
Preliminary Engineering and Environmental Evaluation of the Remedial Action Alternatives for the Former Simonds Saw and Steel Company Site, Lockport, New York, Former Utilized MED/AEC Sites Remedial Action Program, Final Report. Prepared for Bechtel National, Inc., November 1981.
Engineering Investigations at Inactive Hazardous Waste Sites- Phase I Investigation, Guterl Specialty Steel, City of Lockport, Niagara County. Prepared for NYSDEC, January 1988.
Engineering Investigations at Inactive Hazardous Waste Sites - Preliminary Site Assessment, Task 1 Records Search, Guterl Specialty Steel Corp., City of Lockport, Niagara County. Prepared for NYSDEC, January 1991.
Engineering Investigations at Inactive Hazardous Waste Sites- Preliminary Site Assessment Evaluation Report of Initial Data, Guterl Specialty Steel, City of Lockport, Niagara County, Volumes I and II. Prepared for NYSDEC, April 1994.
Dep
th
Qua
lifie
rs
Bui
ldin
g Su
rvey
Radiological Survey of the Former Simonds Saw and Steel Company, Lockport, New York, Final Report. Prepared by Oak Ridge National Laboratory (ORNL) for the Department of Energy under FUSRAP, September 1978.
MD
Ls
Unc
erta
inty
Met
hod
Loc
atio
n
Res
ults
/Uni
ts
CO
Cs
Cal
ibra
tion
DL
s
VO
Cs
Analytical Method Field Radiation Measurements Matrix
Investigation
Analysis UsabilityR
adiu
m
Ura
nium
Tho
rium
Met
als
Pest
icid
es
PCB
s
SVO
Cs
Table 1-1
Final Field Sampling PlanFormer Guterl Specialty Steel FUSRAP Site
Prior Investigation and Analyses Summary Table
� 1 of 1
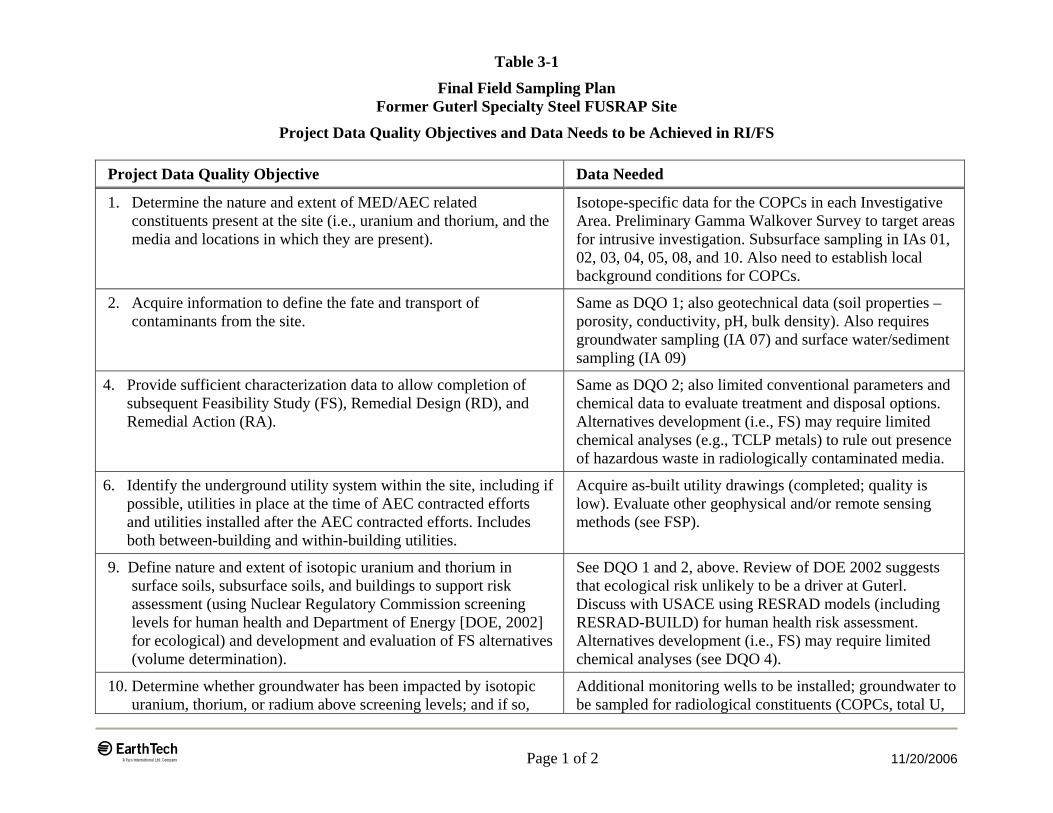
Table 3-1
Final Field Sampling Plan Former Guterl Specialty Steel FUSRAP Site
Project Data Quality Objectives and Data Needs to be Achieved in RI/FS
E� Page 1 of 2 11/20/2006
Project Data Quality Objective Data Needed
1. Determine the nature and extent of MED/AEC related constituents present at the site (i.e., uranium and thorium, and the media and locations in which they are present).
Isotope-specific data for the COPCs in each Investigative Area. Preliminary Gamma Walkover Survey to target areas for intrusive investigation. Subsurface sampling in IAs 01, 02, 03, 04, 05, 08, and 10. Also need to establish local background conditions for COPCs.
2. Acquire information to define the fate and transport of contaminants from the site.
Same as DQO 1; also geotechnical data (soil properties – porosity, conductivity, pH, bulk density). Also requires groundwater sampling (IA 07) and surface water/sediment sampling (IA 09)
4. Provide sufficient characterization data to allow completion of subsequent Feasibility Study (FS), Remedial Design (RD), and Remedial Action (RA).
Same as DQO 2; also limited conventional parameters and chemical data to evaluate treatment and disposal options. Alternatives development (i.e., FS) may require limited chemical analyses (e.g., TCLP metals) to rule out presence of hazardous waste in radiologically contaminated media.
6. Identify the underground utility system within the site, including if possible, utilities in place at the time of AEC contracted efforts and utilities installed after the AEC contracted efforts. Includes both between-building and within-building utilities.
Acquire as-built utility drawings (completed; quality is low). Evaluate other geophysical and/or remote sensing methods (see FSP).
9. Define nature and extent of isotopic uranium and thorium in surface soils, subsurface soils, and buildings to support risk assessment (using Nuclear Regulatory Commission screening levels for human health and Department of Energy [DOE, 2002] for ecological) and development and evaluation of FS alternatives (volume determination).
See DQO 1 and 2, above. Review of DOE 2002 suggests that ecological risk unlikely to be a driver at Guterl. Discuss with USACE using RESRAD models (including RESRAD-BUILD) for human health risk assessment. Alternatives development (i.e., FS) may require limited chemical analyses (see DQO 4).
10. Determine whether groundwater has been impacted by isotopic uranium, thorium, or radium above screening levels; and if so,
Additional monitoring wells to be installed; groundwater to be sampled for radiological constituents (COPCs, total U,
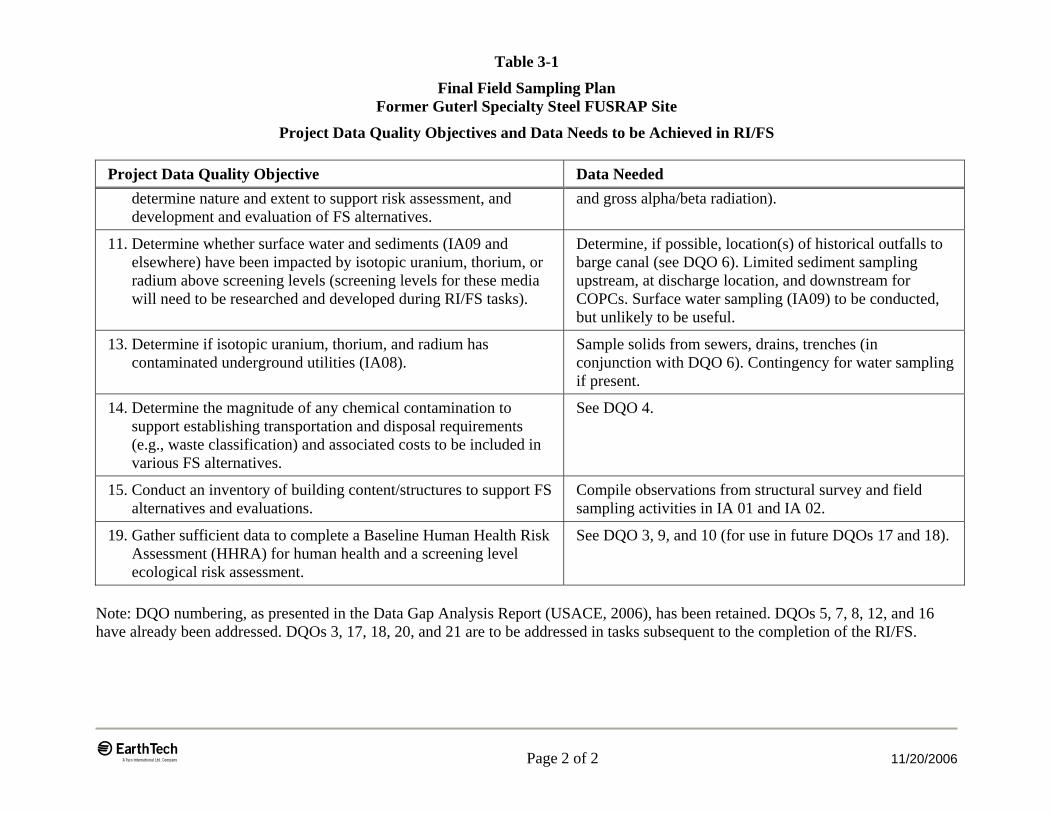
Table 3-1
Final Field Sampling Plan Former Guterl Specialty Steel FUSRAP Site
Project Data Quality Objectives and Data Needs to be Achieved in RI/FS
E� Page 2 of 2 11/20/2006
Project Data Quality Objective Data Needed determine nature and extent to support risk assessment, and development and evaluation of FS alternatives.
and gross alpha/beta radiation).
11. Determine whether surface water and sediments (IA09 and elsewhere) have been impacted by isotopic uranium, thorium, or radium above screening levels (screening levels for these media will need to be researched and developed during RI/FS tasks).
Determine, if possible, location(s) of historical outfalls to barge canal (see DQO 6). Limited sediment sampling upstream, at discharge location, and downstream for COPCs. Surface water sampling (IA09) to be conducted, but unlikely to be useful.
13. Determine if isotopic uranium, thorium, and radium has contaminated underground utilities (IA08).
Sample solids from sewers, drains, trenches (in conjunction with DQO 6). Contingency for water sampling if present.
14. Determine the magnitude of any chemical contamination to support establishing transportation and disposal requirements (e.g., waste classification) and associated costs to be included in various FS alternatives.
See DQO 4.
15. Conduct an inventory of building content/structures to support FS alternatives and evaluations.
Compile observations from structural survey and field sampling activities in IA 01 and IA 02.
19. Gather sufficient data to complete a Baseline Human Health Risk Assessment (HHRA) for human health and a screening level ecological risk assessment.
See DQO 3, 9, and 10 (for use in future DQOs 17 and 18).
Note: DQO numbering, as presented in the Data Gap Analysis Report (USACE, 2006), has been retained. DQOs 5, 7, 8, 12, and 16 have already been addressed. DQOs 3, 17, 18, 20, and 21 are to be addressed in tasks subsequent to the completion of the RI/FS.
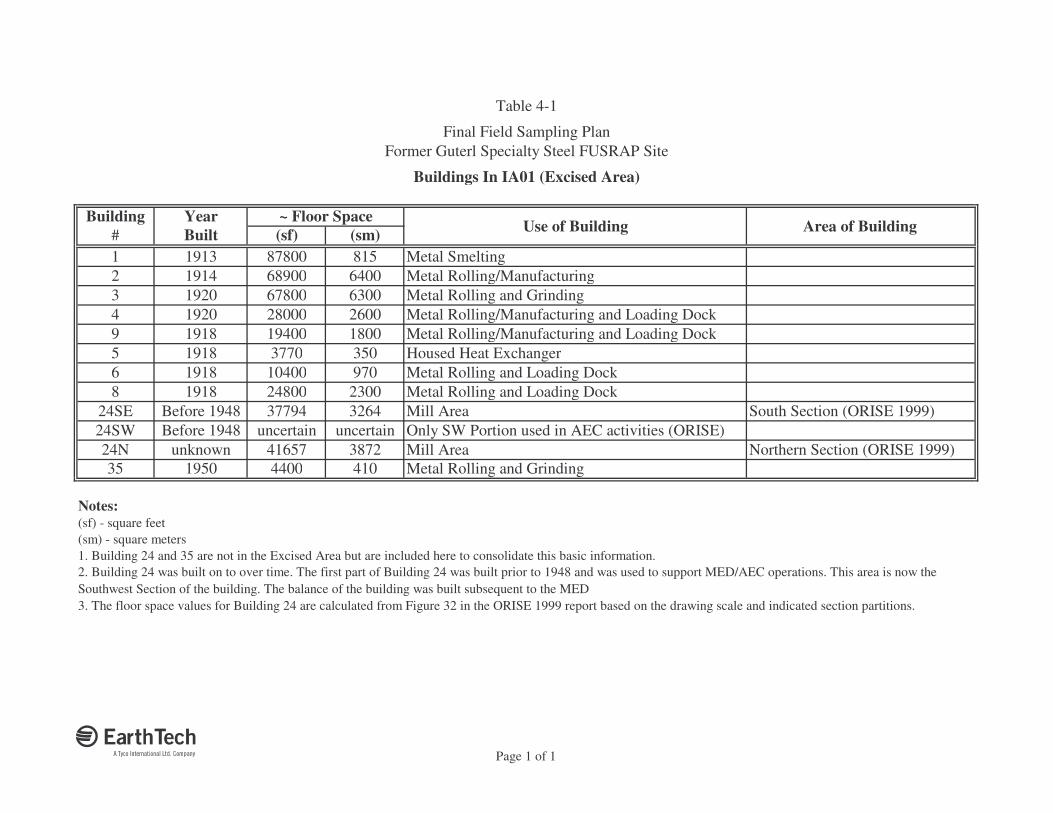
Building Year ~ Floor Space# Built (sf) (sm)1 1913 87800 815 Metal Smelting2 1914 68900 6400 Metal Rolling/Manufacturing3 1920 67800 6300 Metal Rolling and Grinding4 1920 28000 2600 Metal Rolling/Manufacturing and Loading Dock9 1918 19400 1800 Metal Rolling/Manufacturing and Loading Dock5 1918 3770 350 Housed Heat Exchanger6 1918 10400 970 Metal Rolling and Loading Dock8 1918 24800 2300 Metal Rolling and Loading Dock
24SE Before 1948 37794 3264 Mill Area South Section (ORISE 1999)24SW Before 1948 uncertain uncertain Only SW Portion used in AEC activities (ORISE)24N unknown 41657 3872 Mill Area Northern Section (ORISE 1999)35 1950 4400 410 Metal Rolling and Grinding
Notes:(sf) - square feet(sm) - square meters
Table 4-1
Final Field Sampling PlanFormer Guterl Specialty Steel FUSRAP Site
3. The floor space values for Building 24 are calculated from Figure 32 in the ORISE 1999 report based on the drawing scale and indicated section partitions.
Use of Building Area of Building
2. Building 24 was built on to over time. The first part of Building 24 was built prior to 1948 and was used to support MED/AEC operations. This area is now the Southwest Section of the building. The balance of the building was built subsequent to the MED
1. Building 24 and 35 are not in the Excised Area but are included here to consolidate this basic information.
Buildings In IA01 (Excised Area)
��� Page 1 of 1
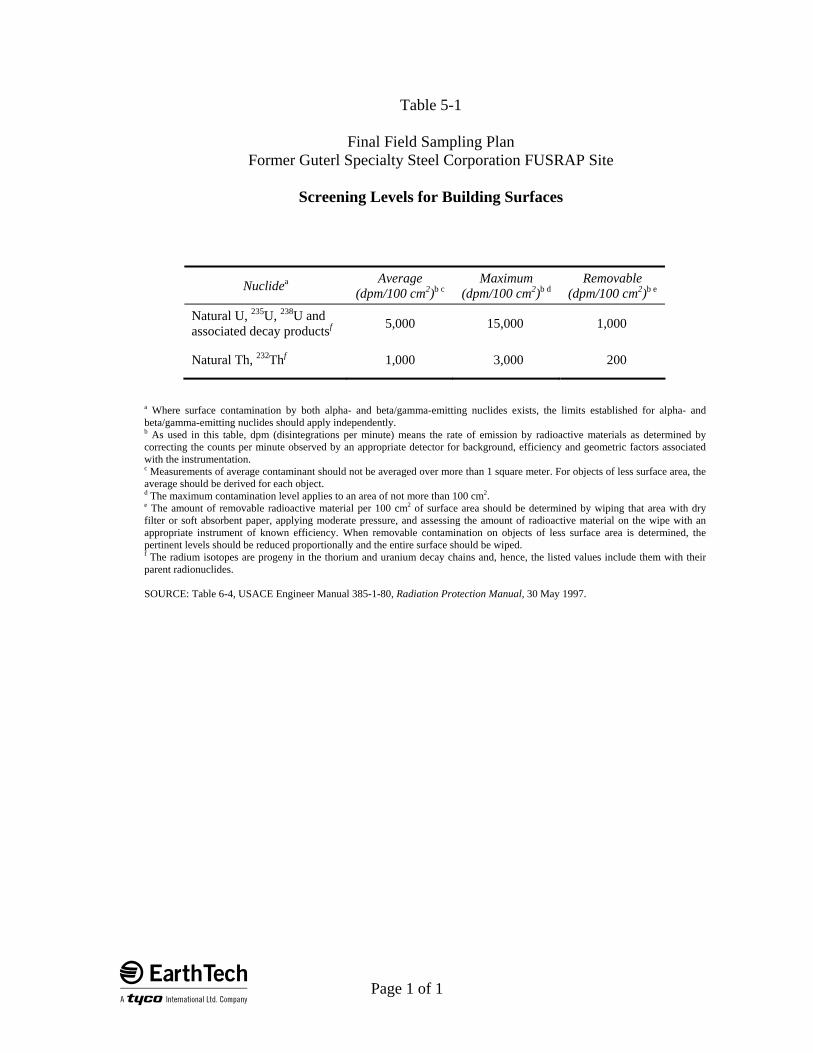
Table 5-1
Final Field Sampling Plan Former Guterl Specialty Steel Corporation FUSRAP Site
Screening Levels for Building Surfaces
E�� Page 1 of 1
Nuclidea Average (dpm/100 cm2)b c
Maximum (dpm/100 cm2)b d
Removable (dpm/100 cm2)b e
Natural U, 235U, 238U and associated decay productsf 5,000 15,000 1,000
Natural Th, 232Thf 1,000 3,000 200
a Where surface contamination by both alpha- and beta/gamma-emitting nuclides exists, the limits established for alpha- and beta/gamma-emitting nuclides should apply independently. b As used in this table, dpm (disintegrations per minute) means the rate of emission by radioactive materials as determined by correcting the counts per minute observed by an appropriate detector for background, efficiency and geometric factors associated with the instrumentation. c Measurements of average contaminant should not be averaged over more than 1 square meter. For objects of less surface area, the average should be derived for each object. d The maximum contamination level applies to an area of not more than 100 cm2. e The amount of removable radioactive material per 100 cm2 of surface area should be determined by wiping that area with dry filter or soft absorbent paper, applying moderate pressure, and assessing the amount of radioactive material on the wipe with an appropriate instrument of known efficiency. When removable contamination on objects of less surface area is determined, the pertinent levels should be reduced proportionally and the entire surface should be wiped. f The radium isotopes are progeny in the thorium and uranium decay chains and, hence, the listed values include them with their parent radionuclides. SOURCE: Table 6-4, USACE Engineer Manual 385-1-80, Radiation Protection Manual, 30 May 1997.
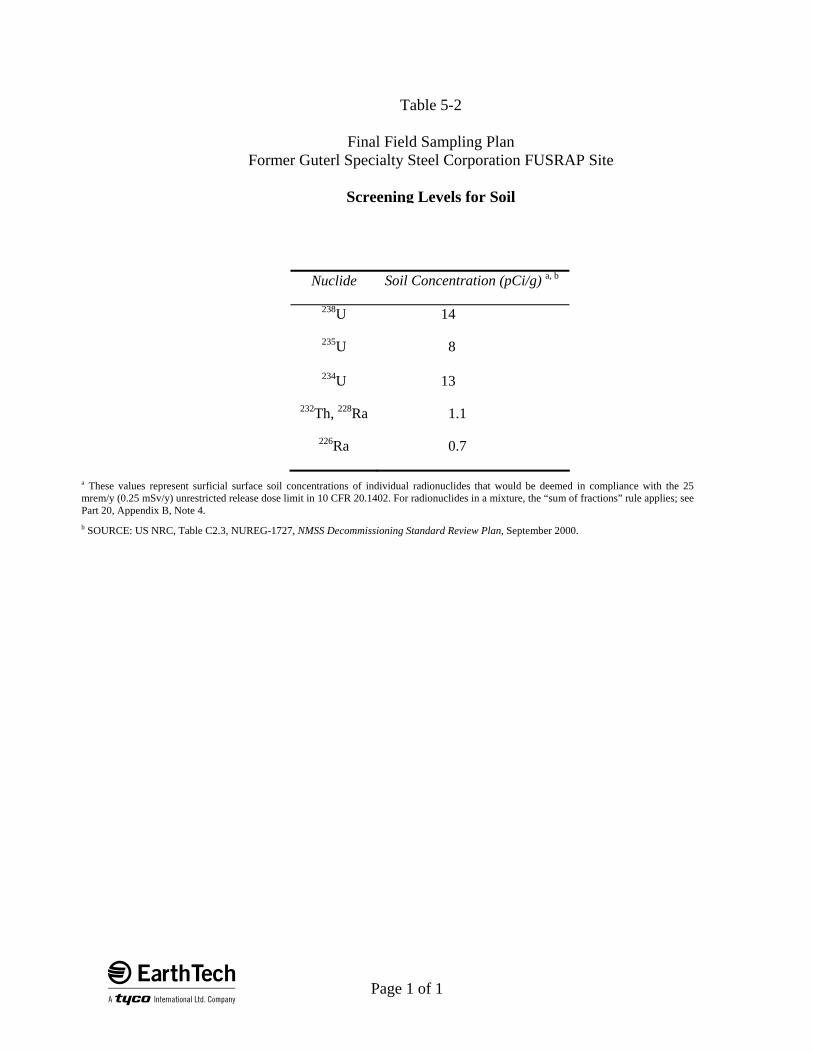
Table 5-2
Final Field Sampling Plan Former Guterl Specialty Steel Corporation FUSRAP Site
Screening Levels for Soil
E�� Page 1 of 1
Nuclide Soil Concentration (pCi/g) a, b
238U 14
235U 8
234U 13
232Th, 228Ra 1.1
226Ra 0.7
a These values represent surficial surface soil concentrations of individual radionuclides that would be deemed in compliance with the 25 mrem/y (0.25 mSv/y) unrestricted release dose limit in 10 CFR 20.1402. For radionuclides in a mixture, the “sum of fractions” rule applies; see Part 20, Appendix B, Note 4. b SOURCE: US NRC, Table C2.3, NUREG-1727, NMSS Decommissioning Standard Review Plan, September 2000.
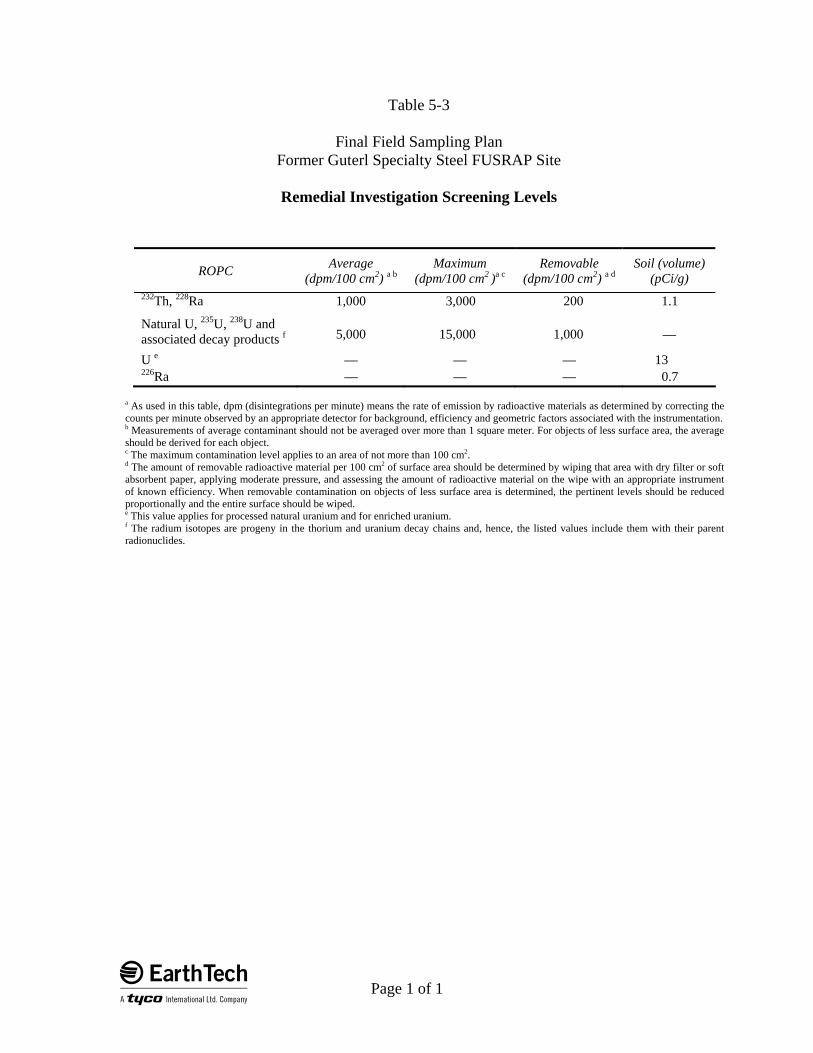
Table 5-3
Final Field Sampling Plan Former Guterl Specialty Steel FUSRAP Site
Remedial Investigation Screening Levels
E�� Page 1 of 1
ROPC Average (dpm/100 cm2) a b
Maximum (dpm/100 cm2 )a c
Removable (dpm/100 cm2) a d
Soil (volume)(pCi/g)
232Th, 228Ra 1,000 3,000 200 1.1
Natural U, 235U, 238U and associated decay products f 5,000 15,000 1,000 —
U e — — — 13 226Ra — — — 0.7
a As used in this table, dpm (disintegrations per minute) means the rate of emission by radioactive materials as determined by correcting the counts per minute observed by an appropriate detector for background, efficiency and geometric factors associated with the instrumentation. b Measurements of average contaminant should not be averaged over more than 1 square meter. For objects of less surface area, the average should be derived for each object. c The maximum contamination level applies to an area of not more than 100 cm2. d The amount of removable radioactive material per 100 cm2 of surface area should be determined by wiping that area with dry filter or soft absorbent paper, applying moderate pressure, and assessing the amount of radioactive material on the wipe with an appropriate instrument of known efficiency. When removable contamination on objects of less surface area is determined, the pertinent levels should be reduced proportionally and the entire surface should be wiped. e This value applies for processed natural uranium and for enriched uranium. f The radium isotopes are progeny in the thorium and uranium decay chains and, hence, the listed values include them with their parent radionuclides.
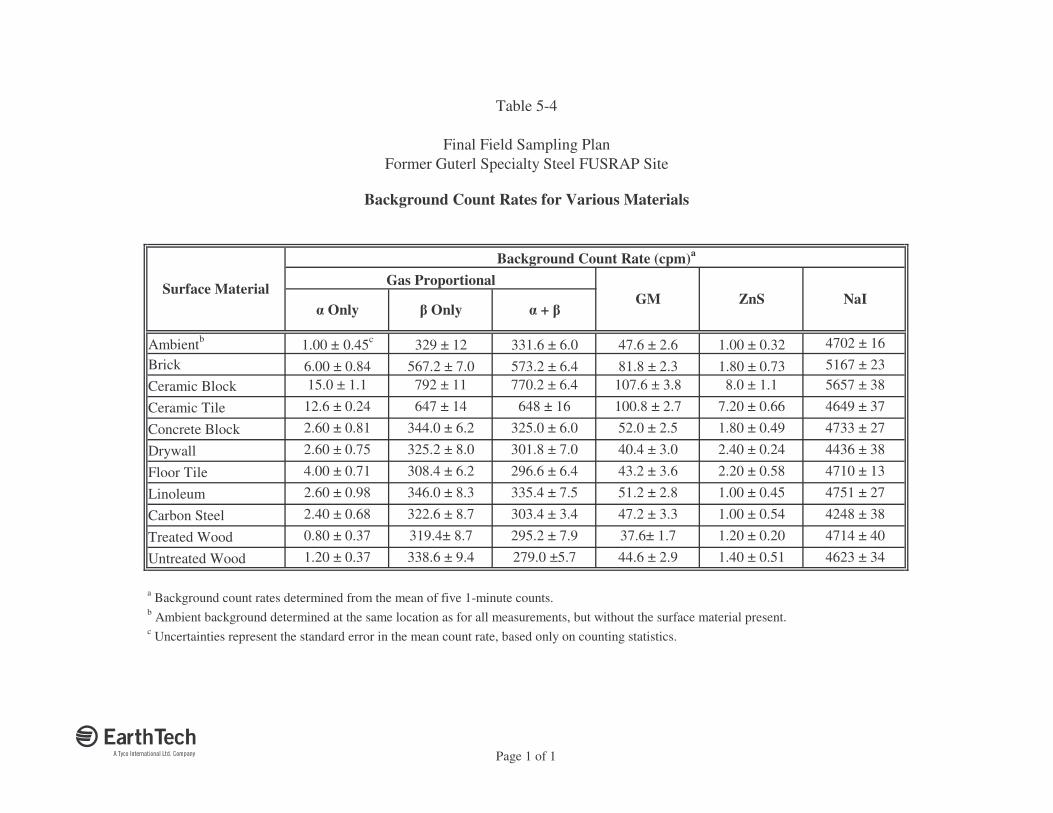
Ambientb 1.00 ± 0.45c 329 ± 12 331.6 ± 6.0 47.6 ± 2.6 1.00 ± 0.32 4702 ± 16Brick 6.00 ± 0.84 567.2 ± 7.0 573.2 ± 6.4 81.8 ± 2.3 1.80 ± 0.73 5167 ± 23Ceramic Block 15.0 ± 1.1 792 ± 11 770.2 ± 6.4 107.6 ± 3.8 8.0 ± 1.1 5657 ± 38
Ceramic Tile 12.6 ± 0.24 647 ± 14 648 ± 16 100.8 ± 2.7 7.20 ± 0.66 4649 ± 37
Concrete Block 2.60 ± 0.81 344.0 ± 6.2 325.0 ± 6.0 52.0 ± 2.5 1.80 ± 0.49 4733 ± 27
Drywall 2.60 ± 0.75 325.2 ± 8.0 301.8 ± 7.0 40.4 ± 3.0 2.40 ± 0.24 4436 ± 38
Floor Tile 4.00 ± 0.71 308.4 ± 6.2 296.6 ± 6.4 43.2 ± 3.6 2.20 ± 0.58 4710 ± 13
Linoleum 2.60 ± 0.98 346.0 ± 8.3 335.4 ± 7.5 51.2 ± 2.8 1.00 ± 0.45 4751 ± 27
Carbon Steel 2.40 ± 0.68 322.6 ± 8.7 303.4 ± 3.4 47.2 ± 3.3 1.00 ± 0.54 4248 ± 38
Treated Wood 0.80 ± 0.37 319.4± 8.7 295.2 ± 7.9 37.6± 1.7 1.20 ± 0.20 4714 ± 40
Untreated Wood 1.20 ± 0.37 338.6 ± 9.4 279.0 ±5.7 44.6 ± 2.9 1.40 ± 0.51 4623 ± 34
a Background count rates determined from the mean of five 1-minute counts.b Ambient background determined at the same location as for all measurements, but without the surface material present.c Uncertainties represent the standard error in the mean count rate, based only on counting statistics.
Surface Material
Background Count Rate (cpm)a
� Only � Only � + �NaIGM ZnS
Gas Proportional
Table 5-4
Final Field Sampling PlanFormer Guterl Specialty Steel FUSRAP Site
Background Count Rates for Various Materials
��� Page 1 of 1
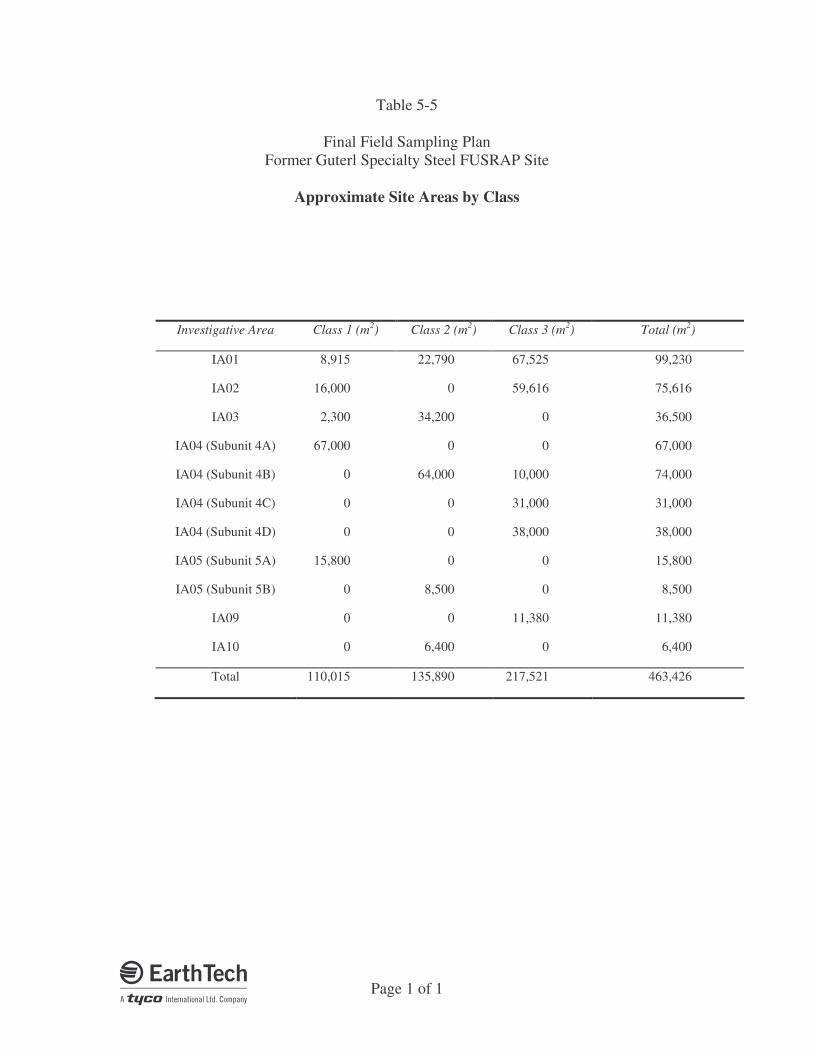
Table 5-5
Final Field Sampling Plan Former Guterl Specialty Steel FUSRAP Site
Approximate Site Areas by Class
��� Page 1 of 1
Investigative Area Class 1 (m2) Class 2 (m2) Class 3 (m2) Total (m2)
IA01 8,915 22,790 67,525 99,230
IA02 16,000 0 59,616 75,616
IA03 2,300 34,200 0 36,500
IA04 (Subunit 4A) 67,000 0 0 67,000
IA04 (Subunit 4B) 0 64,000 10,000 74,000
IA04 (Subunit 4C) 0 0 31,000 31,000
IA04 (Subunit 4D) 0 0 38,000 38,000
IA05 (Subunit 5A) 15,800 0 0 15,800
IA05 (Subunit 5B) 0 8,500 0 8,500
IA09 0 0 11,380 11,380
IA10 0 6,400 0 6,400
Total 110,015 135,890 217,521 463,426
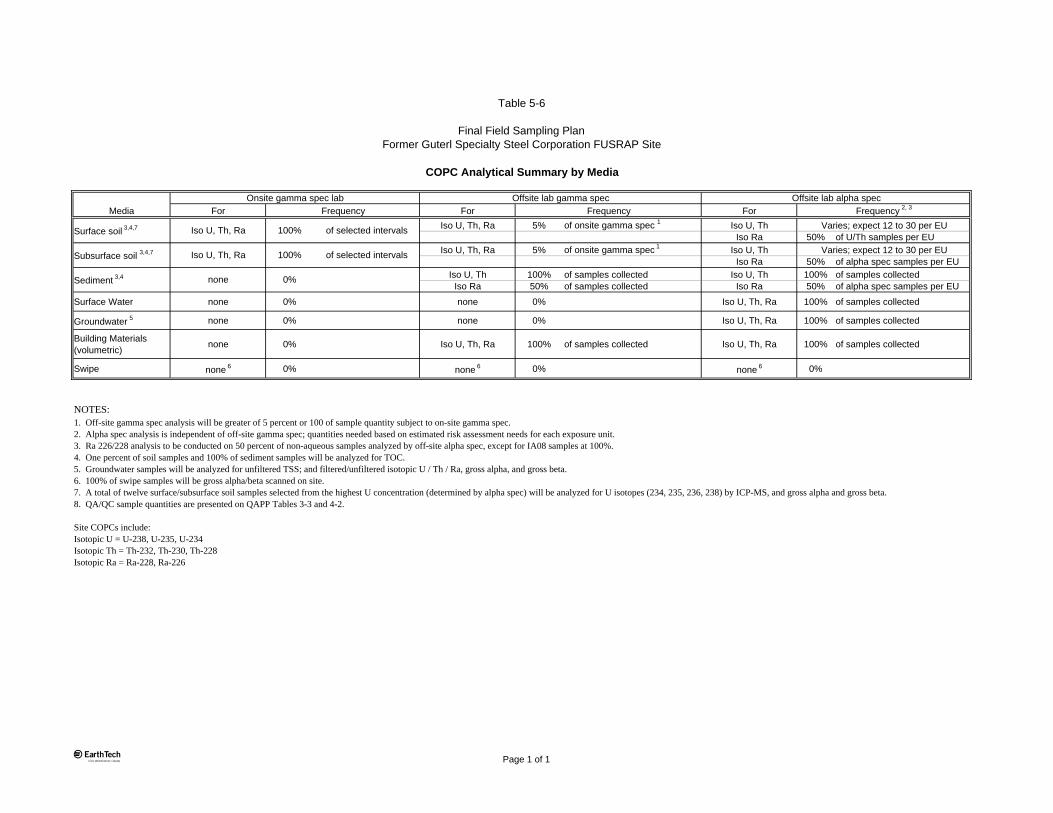
Media For For ForIso U, Th, Ra 5% of onsite gamma spec 1 Iso U, Th
Iso Ra 50% of U/Th samples per EUIso U, Th, Ra 5% of onsite gamma spec 1 Iso U, Th
Iso Ra 50% of alpha spec samples per EUIso U, Th 100% of samples collected Iso U, Th 100% of samples collected
Iso Ra 50% of samples collected Iso Ra 50% of alpha spec samples per EU
Surface Water none 0% none 0% Iso U, Th, Ra 100% of samples collected
Groundwater 5 none 0% none 0% Iso U, Th, Ra 100% of samples collected
Building Materials(volumetric) none 0% Iso U, Th, Ra 100% of samples collected Iso U, Th, Ra 100% of samples collected
Swipe none 6 0% none 6 0% none 6 0%
NOTES:
3. Ra 226/228 analysis to be conducted on 50 percent of non-aqueous samples analyzed by off-site alpha spec, except for IA08 samples at 100%.4. One percent of soil samples and 100% of sediment samples will be analyzed for TOC.5. Groundwater samples will be analyzed for unfiltered TSS; and filtered/unfiltered isotopic U / Th / Ra, gross alpha, and gross beta.6. 100% of swipe samples will be gross alpha/beta scanned on site.7. A total of twelve surface/subsurface soil samples selected from the highest U concentration (determined by alpha spec) will be analyzed for U isotopes (234, 235, 236, 238) by ICP-MS, and gross alpha and gross beta. 8. QA/QC sample quantities are presented on QAPP Tables 3-3 and 4-2.
Site COPCs include:Isotopic U = U-238, U-235, U-234Isotopic Th = Th-232, Th-230, Th-228Isotopic Ra = Ra-228, Ra-226
Onsite gamma spec lab Offsite lab gamma spec Offsite lab alpha spec
Varies; expect 12 to 30 per EU
1. Off-site gamma spec analysis will be greater of 5 percent or 100 of sample quantity subject to on-site gamma spec.2. Alpha spec analysis is independent of off-site gamma spec; quantities needed based on estimated risk assessment needs for each exposure unit.
Varies; expect 12 to 30 per EU
Frequency Frequency Frequency 2, 3
Surface soil 3,4,7
Subsurface soil 3,4,7
Sediment 3,4
Iso U, Th, Ra
Table 5-6
Final Field Sampling PlanFormer Guterl Specialty Steel Corporation FUSRAP Site
COPC Analytical Summary by Media
Iso U, Th, Ra
none
100% of selected intervals
100% of selected intervals
0%
e Page 1 of 1
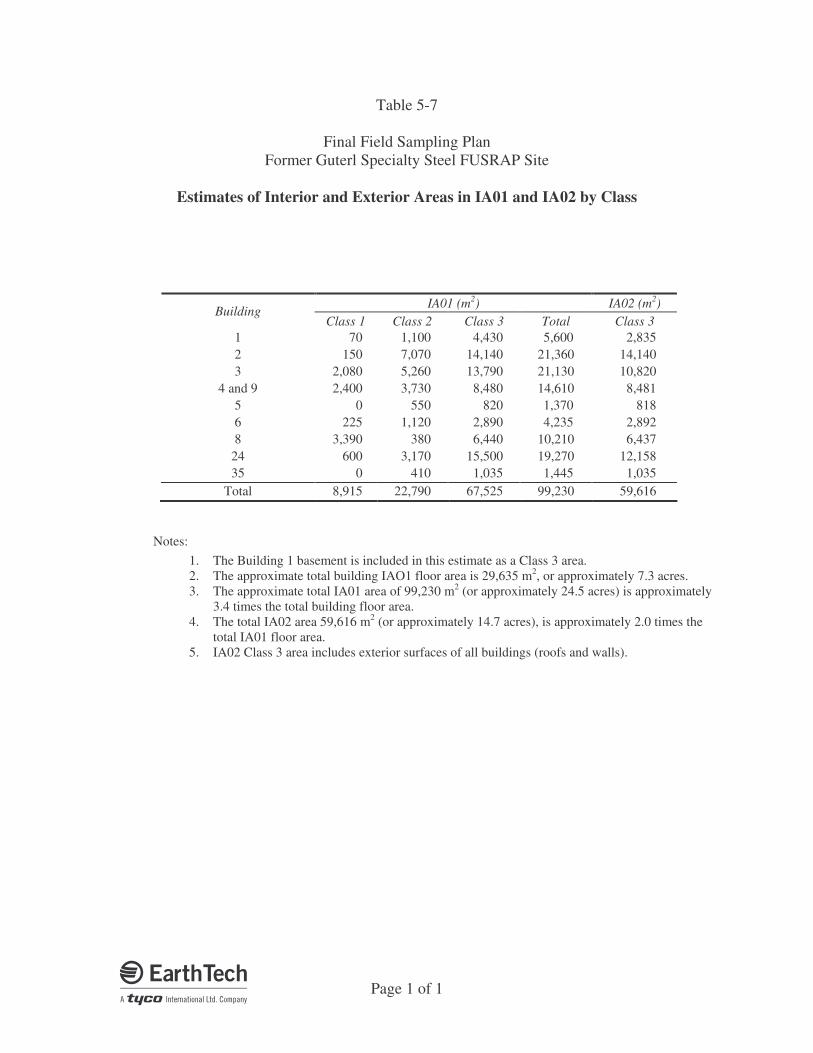
Table 5-7
Final Field Sampling Plan Former Guterl Specialty Steel FUSRAP Site
Estimates of Interior and Exterior Areas in IA01 and IA02 by Class
��� Page 1 of 1
IA01 (m2) IA02 (m2) Building
Class 1 Class 2 Class 3 Total Class 3 1 70 1,100 4,430 5,600 2,835 2 150 7,070 14,140 21,360 14,140 3 2,080 5,260 13,790 21,130 10,820
4 and 9 2,400 3,730 8,480 14,610 8,481 5 0 550 820 1,370 818 6 225 1,120 2,890 4,235 2,892 8 3,390 380 6,440 10,210 6,437
24 600 3,170 15,500 19,270 12,158 35 0 410 1,035 1,445 1,035
Total 8,915 22,790 67,525 99,230 59,616
Notes: 1. The Building 1 basement is included in this estimate as a Class 3 area. 2. The approximate total building IAO1 floor area is 29,635 m2, or approximately 7.3 acres. 3. The approximate total IA01 area of 99,230 m2 (or approximately 24.5 acres) is approximately
3.4 times the total building floor area. 4. The total IA02 area 59,616 m2 (or approximately 14.7 acres), is approximately 2.0 times the
total IA01 floor area. 5. IA02 Class 3 area includes exterior surfaces of all buildings (roofs and walls).
IA02Class 1 Class 2 Class 3 Total Class 3 Class 1 Class 2 Class 3
Building 1 7 55 55 117 35 1 1 1 3Building 2 15 354 177 545 177 5 3 1 9Building 3 208 263 172 643 135 3 4 1 8
Building 4/9 240 187 106 533 106 2 1 1 4Building 5 0 28 10 38 10 0 1 1 2Building 6 23 56 36 115 36 3 2 1 6Building 8 339 19 81 439 80 1 0 1 2Building 24 60 159 194 412 152 1 2 1 4Building 35 0 21 13 33 13 0 1 1 2
Total 892 1140 844 2875 745 16 15 9 40
NOTES:
2. Class 1 swipe samples will be collected at a frequency of 1 per 10 square meters; Class 2 at 1 per 20 square meters; and Class 3 at 1 per 80 square meters.3. All swipe samples will be gross alpha/beta scanned on site.
5. All building material volumetric samples will be analyzed by offsite lab by gamma and alpha spectroscopy for isotopic U, Th, Ra.6. QA/QC sample quantities are presented on QAPP Tables 3-3 and 4-2.
4. Building material volumetric samples will be collected at a minimum frequency of 1 per each discrete class of area. For IA02, sample quantities and locations will be determined following the scan survey.
Total
1. Estimates for interior and exterior areas by class are presented on Table 5-7.
Table 5-8
Final Field Sampling PlanFormer Guterl Specialty Steel Corporation FUSRAP Site
Building Material Volumetric Samples
Estimated Number of Swipe and Building Material Volumetric Samples
Swipe SamplesBuilding IA01 IA01
e Page 1 of 1
Table 5-9
Final Field Sampling PlanFormer Guterl Specialty Steel Corporation FUSRAP Site
Estimated Number of Soil Samples
Estimated Sample Quantity 4,5
Exterior Areas - Soil SamplesLocations per Area
Samples per
Location 6
On-site Gamma
Spec(all COPCs)
Off-site Gamma Spec 1
(all COPCs)
Surface Subsurface Total Surface Subsurface TotalIA02 43 3 129 6 30 30 60 15 15 30IA03 42 3 126 6 30 30 60 15 15 30IA04A 78 3 234 12 30 30 60 15 15 30IA04B 41 3 123 6 30 30 60 15 15 30IA04C 15 3 45 2 12 12 24 6 6 12IA04D 32 3 96 5 12 12 24 6 6 12IA05A 31 3 93 5 30 30 60 15 15 30IA05B 11 3 33 2 12 12 24 6 6 12IA10 13 3 39 2 12 12 24 6 6 12
Subtotal 306 918 46 198 198 396 99 99 198Interior Areas (IA01 Soil)
Building 1 1 3 3 0 0 0 0 0 0 0Building 2 – North Section 19 3 57 3 4 4 8 2 2 4Building 2 – Center Section 27 3 81 4 6 6 12 3 3 6Building 2 – South Section 12 3 36 2 3 3 6 2 2 4Building 3 – North Section 18 3 54 3 4 4 8 2 2 4Building 3 – South Section 18 3 54 3 4 4 8 2 2 4Building 4/9 41 3 123 6 9 9 18 5 5 10Building 6 24 3 72 4 5 5 10 3 3 6Building 8 28 3 84 4 6 6 12 3 3 6Building 24 – North Area 17 3 51 3 4 4 8 2 2 4Building 24 – Southeast Area 11 3 33 2 2 2 4 1 1 2Building 24 – Southwest Area 6 3 18 1 1 1 2 1 1 2Building 35 4 3 12 1 1 1 2 1 1 2
IA01 (Bldg Interior) subtotal 226 678 34 49 49 98 27 27 54
Background/reference area 12 2 24 24 12 12 24 12 12 24Bkgd Area Subtotal 12 24 24 12 12 24 12 12 24
Total (without contingency) 544 1620 104 259 259 518 138 138 276
Contingency Subtotal at 20% 109 2 218 11 0 0 0 0 0 0
TOTAL (including contingency) 653 1838 115 259 259 518 138 138 276
NOTES:
3. Ra 226/228 analysis to be conducted on 50 percent of samples analyzed by off-site alpha spec.
7. QA/QC sample quantities are presented on QAPP Tables 3-3 and 4-2.
8. Geotechnical sample quantities are listed on QAPP Table 4-2.
Site COPCs include:Isotopic U = U-238, U-235, U-234Isotopic Th = Th-232, Th-230, Th-228Isotopic Ra = Ra-228, Ra-226
Off-site Alpha Spec 2
(Isotopic U and Th) Off-site Radium 226/228 3
6. "Samples per Location" may or may not include surface soil; default quantity is as noted, regardless. Surface soil sample quantity will be dependent upon gamma walk-over survey data, ORISE data, and Triad evaluation.
2. Off site alpha spec analysis is independent of off-site gamma spec analyses; i.e., estimated quantities are based on anticipated risk assessment needs for each exposure unit by matrix (surface soil and subsurface soil).
1. Off-site gamma spec analysis will be greater of 5 percent of quantity subject to on-site gamma spec or 100.
5. 1% of the soil samples will be submitted for TOC analysis; locations determined at the discretion of the Project Chemist.
4. A total of twelve surface/subsurface soil samples selected from the highest U concentration (determined by alpha spec) will be analyzed for U isotopes (234, 235, 236, 238) by ICP-MS, and gross alpha and gross beta.
e Page 1 of 1
DCGL (dpm/100 cm 2 )
Screening Level (dpm/100
cm 2 ) DCGL (pCi/g)Screening Lavel
(pCi/g)MARSSIM This Detectable? MARSSIM This Detectable?example a project example a project
GPα, αS, PIC, γS,GPβ ISγ
GPα, αS, γS, ISγ PIC, γSGPβ, Isβ GPβ ISγ
PIC, γS,ISγ
b GPα = gas-flow proportional counter (α mode); αS = alpha scintillation survey meter; GPβ = gas-flow proportional counter (β mode); γS = gamma scintillation (gross); ISγ = in situ gamma spectroscopy; PIC = pressurized ionization chamberc Bold indicates the preferred method where alternative methods are available.d For decay chains having two or more radionuclides of significant half-life that reach secular equilibrium. The notation "(c)" indicates the direct measurement techniques assume the presence of progeny in the chain.e Depleted, natural, and enriched.
g MARSSIM Table 4.1 does not include radium-228.
f Although the screening values for this project are slightly less than the derived concentration guideline levels from MARSSIM, they are close enough to be similarly detectable. This will be verified in the field when background values are available for calculating MDCs.
a Example Derived Concentration Guideline Levels (DCGLs) are based on values given in NRC draft report NUREG-1500 (with unit conversion from values shown in MARSSIM and rounded to one significant digit).
Structure Surfaces Land Areas
226Ra (c) d,g
Direct Measurement Instruments b c
Surface Activity Soil Activity Exposure Rate
γS, ISγ9 1.1 No
Nuclide
γS, ISγ
(adapted from MARSSIM Table 4.1)
Table 5-10
Final Field Sampling PlanFormer Guterl Specialty Steel Corporation FUSRAP Site
Survey Methods
232Th (c) d 200 200 Yes
U e,f 300
600
1000 Yes
1000 Yes 6 0.7 GPα, αS,
19 13 Yes(f)
Yes(f)
e�� Page 1 of 1
Filtered Radiological Samples per
Location1
Unfiltered Radiological Samples per
Location1
Estimated Radiological
Sample Quantity per Round1
Unfiltered TSS Samples per
Location1
Estimated TSS Sample
Quantity per Round1
Comments
MW- 81-01 1 1 2 1 1 IA03MW- 81-02 1 1 2 1 1 IA03MW- 81-04 1 1 2 1 1 IA03MW- 105 1 1 2 1 1 IA03
MW- 1 1 1 2 1 1 IA02MW- 2 1 1 2 1 1 IA02MW- 3 1 1 2 1 1 IA02MW- 4 1 1 2 1 1 IA02MW- 5 1 1 2 1 1 IA02
MW- 600S 1 1 2 1 1 Background overburden (IA05B area)MW- 600D 1 1 2 1 1 Background bedrock (IA05B area)MW- 601S 1 1 2 1 1 IA04AMW- 601D 1 1 2 1 1 IA04AMW- 602S 1 1 2 1 1 IA04AMW- 602D 1 1 2 1 1 IA04AMW- 603S 1 1 2 1 1 IA04AMW- 603D 1 1 2 1 1 IA04AMW- 604S 1 1 2 1 1 IA04DMW- 604D 1 1 2 1 1 IA04DMW- 605S 1 1 2 1 1 IA04CMW- 605D 1 1 2 1 1 IA04CMW- 606D 1 1 2 1 1 Paired with MW-81-01MW- 607D 1 1 2 1 1 Paired with MW-81-02MW- 608D 1 1 2 1 1 Paired with MW-81-04MW- 609D 1 1 2 1 1 Paired with MW-105MW- 610S 1 1 2 1 1 Paired with MW-1MW- 611S 1 1 2 1 1 Paired with MW-2MW- 612S 1 1 2 1 1 Paired with MW-3MW- 613S 1 1 2 1 1 Paired with MW-4MW- 614S 1 1 2 1 1 Paired with MW-5
Total per Round 30 30 60 30 302 2 260 60 120 60 60
NOTES:
NA - Not Applicable
2. QA/QC sample quantities are presented on QAPP Tables 3-3 and 4-2.
Estimated Project Total
1. All groundwater samples will be analyzed by offsite lab for unfiltered TSS, and for filtered/unfiltered isotopic U / Th / Ra, gross alpha, and gross beta.
Table 5-11
Final Field Sampling PlanFormer Guterl Specialty Steel Corporation FUSRAP Site
Estimated Number of Groundwater Samples - IA07
Existing Overburden Wells
Existing Bedrock Wells
New Overburden (S) and Bedrock (D) Wells
Area
No. of Rounds
e Page 1 of 1
AreaSample
LocationsOff-site Alpha Spec (U, Th) Off-site Ra
Off-site Gamma Spec
Off-site Alpha Spec (U, Th) Off-site Ra
Total Organic Carbon
IA03 6 6 6 6 6 3 3IA09 12 12 12 12 12 6 6
Subtotal 18 18 18 18 18 9 9IA08
IA08 (outisde IA01) 6 6 6 6 6 6 0Building 1 (basement) 4 4 4 4 4 4 0Building 3 – North Section 4 4 4 4 4 4 0Building 3 – South Section 4 4 4 4 4 4 0Building 4/9 4 4 4 4 4 4 0Building 6 2 2 2 2 2 2 0Building 8 2 2 2 2 2 2 0Building 24 – North Area 2 2 2 2 2 2 0Building 24 – Southeast Area 2 2 2 2 2 2 0Building 24 – Southwest Area – 6 2 2 2 2 2 2 0
Subtotal 32 32 32 32 32 32 0
Contingency (20%) 10 10 10 10 10 5 5
TOTAL (including contingency) 60 60 60 60 60 46 14
NOTES:
6. QA/QC sample quantities are presented on QAPP Tables 3-3 and 4-2.
4. For IA08, 100% of the sediment samples will be analyzed by gamma spectroscopy (U, Th, Ra), alpha spectroscopy (U, Th), and EPA method 903/904 (Ra).
5. For IA03, IA09, and the contingency samples, 100% of the sediment samples will be analyzed by gamma spectroscopy (U, Th, Ra) and alpha spectroscopy (U, Th); and 50% of the samples will be analyzed by EPA 903/904 (Ra) and for TOC.
2. All surface water and sediment samples will be analyzed at the off-site laboratory.
1. Quantities and locations for IA01 (except Bldg 1 basement), IA02, IA04, and IA08 are estimates. Sample locations will be determined as part of mobilization / start-up task.
3. 100% of the surface water samples will be analyzed by alpha spectroscopy for isotopic U and Th, and by EPA method 903/904 for Ra.
Table 5-12
Final Field Sampling PlanFormer Guterl Specialty Steel Corporation FUSRAP Site
Estimated Number of Surface Water and Sediment Samples
Surface Water(aqueous)
Sediment(non-aqueous)
e Page 1 of 1

�&� ��%��&� ��%��&� ��%��&� ��%������

This page intentionally left blank.
�
�
Figure 2-1
Organization Chart
Former Guterl Specialty Steel Corporation FUSRAP Site
Lockport, New York
Site Safety and Health Manager
Bob Poll, CIH, CSP
HTRW Program Manager
Mike Thiagaram, PE
James Kaczor, PG
USACE Project Manager
Raymond Pilon
Health Physicist
David Hearnsberger, PhD, CHP
Dino Zack, CPG
QA/QC Officer &
Project Chemist
Allen Burton
Product Delivery Team
RI Field Geologist
Personnel TBD
NYSDEC, NYSDOH, NCDH, Lockport, A-L
Site Radiation Safety Officer
Thomas Fontaine
Site Safety & Health Officer
Personnel TBD
Site Supervisor & Field QA/QC Supervisor
Earth Tech Field Personnel
Personnel TBD
Drilling Subcontractor
TBD (SJB Drilling, Inc. or Parratt-Wolff, Inc.)
Laboratory Subcontractor
STL-St. Louis
RI Data Manager
Claire Hunt
GIS Specialist
Roman Senyk
Community Stakeholders
Project Manager
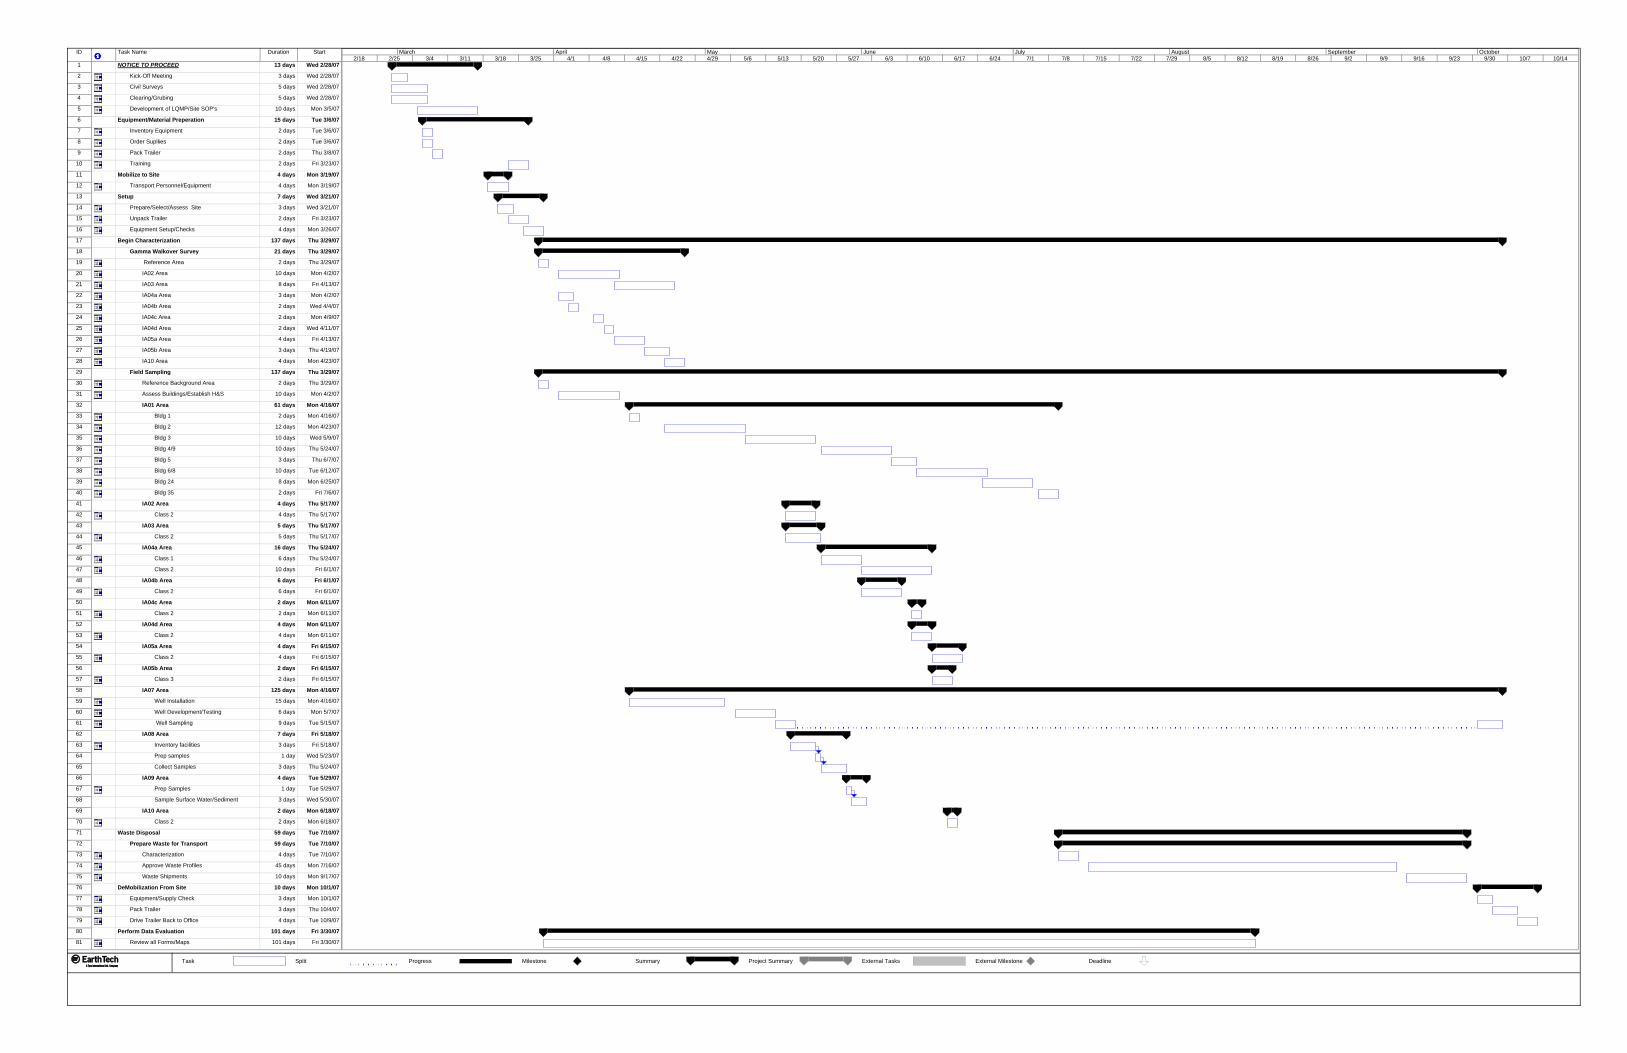
ID Task Name Duration Start
1 NOTICE TO PROCEED 13 days Wed 2/28/07
2 Kick-Off Meeting 3 days Wed 2/28/07
3 Civil Surveys 5 days Wed 2/28/07
4 Clearing/Grubing 5 days Wed 2/28/07
5 Development of LQMP/Site SOP's 10 days Mon 3/5/07
6 Equipment/Material Preperation 15 days Tue 3/6/07
7 Inventory Equipment 2 days Tue 3/6/07
8 Order Supllies 2 days Tue 3/6/07
9 Pack Trailer 2 days Thu 3/8/07
10 Training 2 days Fri 3/23/07
11 Mobilize to Site 4 days Mon 3/19/07
12 Transport Personnel/Equipment 4 days Mon 3/19/07
13 Setup 7 days Wed 3/21/07
14 Prepare/Select/Assess Site 3 days Wed 3/21/07
15 Unpack Trailer 2 days Fri 3/23/07
16 Equipment Setup/Checks 4 days Mon 3/26/07
17 Begin Characterization 137 days Thu 3/29/07
18 Gamma Walkover Survey 21 days Thu 3/29/07
19 Reference Area 2 days Thu 3/29/07
20 IA02 Area 10 days Mon 4/2/07
21 IA03 Area 8 days Fri 4/13/07
22 IA04a Area 3 days Mon 4/2/07
23 IA04b Area 2 days Wed 4/4/07
24 IA04c Area 2 days Mon 4/9/07
25 IA04d Area 2 days Wed 4/11/07
26 IA05a Area 4 days Fri 4/13/07
27 IA05b Area 3 days Thu 4/19/07
28 IA10 Area 4 days Mon 4/23/07
29 Field Sampling 137 days Thu 3/29/07
30 Reference Background Area 2 days Thu 3/29/07
31 Assess Buildings/Establish H&S 10 days Mon 4/2/07
32 IA01 Area 61 days Mon 4/16/07
33 Bldg 1 2 days Mon 4/16/07
34 Bldg 2 12 days Mon 4/23/07
35 Bldg 3 10 days Wed 5/9/07
36 Bldg 4/9 10 days Thu 5/24/07
37 Bldg 5 3 days Thu 6/7/07
38 Bldg 6/8 10 days Tue 6/12/07
39 Bldg 24 8 days Mon 6/25/07
40 Bldg 35 2 days Fri 7/6/07
41 IA02 Area 4 days Thu 5/17/07
42 Class 2 4 days Thu 5/17/07
43 IA03 Area 5 days Thu 5/17/07
44 Class 2 5 days Thu 5/17/07
45 IA04a Area 16 days Thu 5/24/07
46 Class 1 6 days Thu 5/24/07
47 Class 2 10 days Fri 6/1/07
48 IA04b Area 6 days Fri 6/1/07
49 Class 2 6 days Fri 6/1/07
50 IA04c Area 2 days Mon 6/11/07
51 Class 2 2 days Mon 6/11/07
52 IA04d Area 4 days Mon 6/11/07
53 Class 2 4 days Mon 6/11/07
54 IA05a Area 4 days Fri 6/15/07
55 Class 2 4 days Fri 6/15/07
56 IA05b Area 2 days Fri 6/15/07
57 Class 3 2 days Fri 6/15/07
58 IA07 Area 125 days Mon 4/16/07
59 Well Installation 15 days Mon 4/16/07
60 Well Development/Testing 6 days Mon 5/7/07
61 Well Sampling 9 days Tue 5/15/07
62 IA08 Area 7 days Fri 5/18/07
63 Inventory facilities 3 days Fri 5/18/07
64 Prep samples 1 day Wed 5/23/07
65 Collect Samples 3 days Thu 5/24/07
66 IA09 Area 4 days Tue 5/29/07
67 Prep Samples 1 day Tue 5/29/07
68 Sample Surface Water/Sediment 3 days Wed 5/30/07
69 IA10 Area 2 days Mon 6/18/07
70 Class 2 2 days Mon 6/18/07
71 Waste Disposal 59 days Tue 7/10/07
72 Prepare Waste for Transport 59 days Tue 7/10/07
73 Characterization 4 days Tue 7/10/07
74 Approve Waste Profiles 45 days Mon 7/16/07
75 Waste Shipments 10 days Mon 9/17/07
76 DeMobilization From Site 10 days Mon 10/1/07
77 Equipment/Supply Check 3 days Mon 10/1/07
78 Pack Trailer 3 days Thu 10/4/07
79 Drive Trailer Back to Office 4 days Tue 10/9/07
80 Perform Data Evaluation 101 days Fri 3/30/07
81 Review all Forms/Maps 101 days Fri 3/30/07
2/18 2/25 3/4 3/11 3/18 3/25 4/1 4/8 4/15 4/22 4/29 5/6 5/13 5/20 5/27 6/3 6/10 6/17 6/24 7/1 7/8 7/15 7/22 7/29 8/5 8/12 8/19 8/26 9/2 9/9 9/16 9/23 9/30 10/7 10/14March April May June July August September October
Task Split Progress Milestone Summary Project Summary External Tasks External Milestone Deadlinee
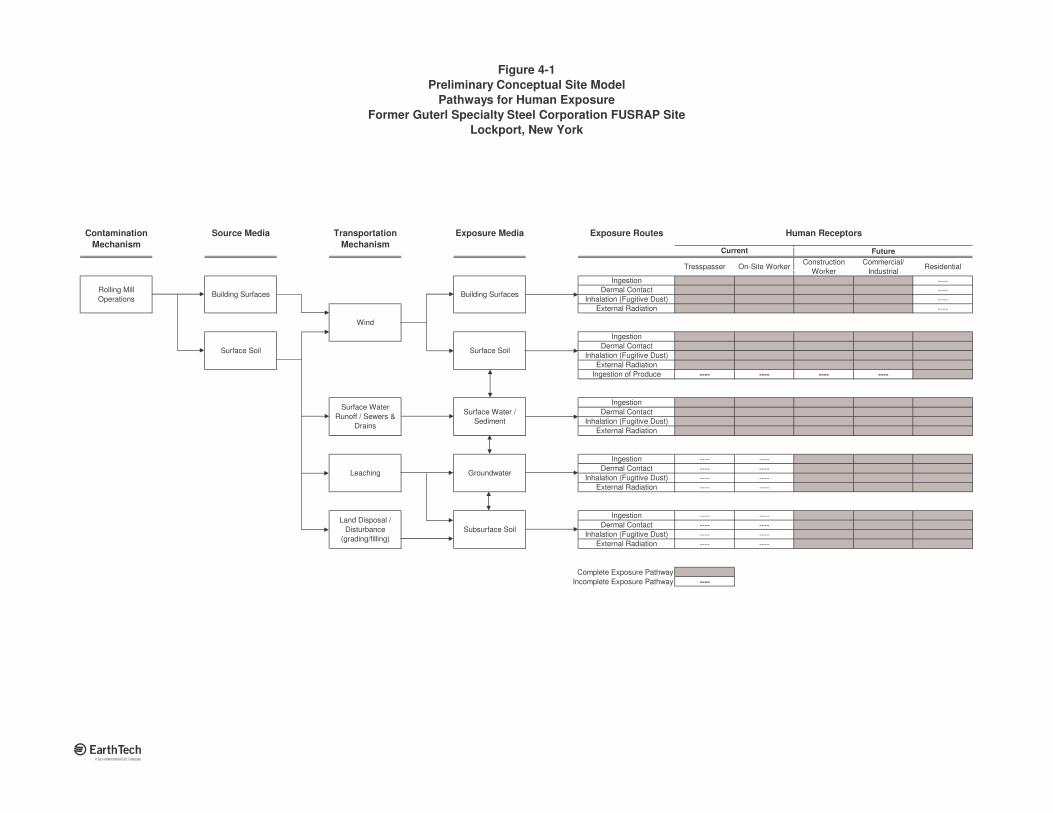
Figure 4-1Preliminary Conceptual Site Model
Pathways for Human Exposure Former Guterl Specialty Steel Corporation FUSRAP Site
Lockport, New York
Future
----------------
---- ---- ---- ----
---- -------- -------- -------- ----
---- -------- -------- -------- ----
Complete Exposure PathwayIncomplete Exposure Pathway ----
External Radiation
External Radiation
IngestionDermal Contact
Inhalation (Fugitive Dust)
Rolling Mill Operations
Building Surfaces
Surface Soil
Subsurface Soil
Groundwater
Surface Water / Sediment
Surface Water Runoff / Sewers &
Drains
Leaching
Land Disposal / Disturbance
(grading/filling)
Surface Soil
Inhalation (Fugitive Dust)
IngestionDermal Contact
Inhalation (Fugitive Dust)External Radiation
IngestionDermal Contact
Contamination Mechanism
Exposure MediaTransportation Mechanism
Source Media
Ingestion of Produce
Exposure Routes
Current
Tresspasser On-Site Worker
Dermal ContactInhalation (Fugitive Dust)
External Radiation
Human Receptors
Wind
Commercial/ Industrial
Residential
External Radiation
Ingestion
Construction Worker
IngestionDermal Contact
Inhalation (Fugitive Dust)Building Surfaces
�
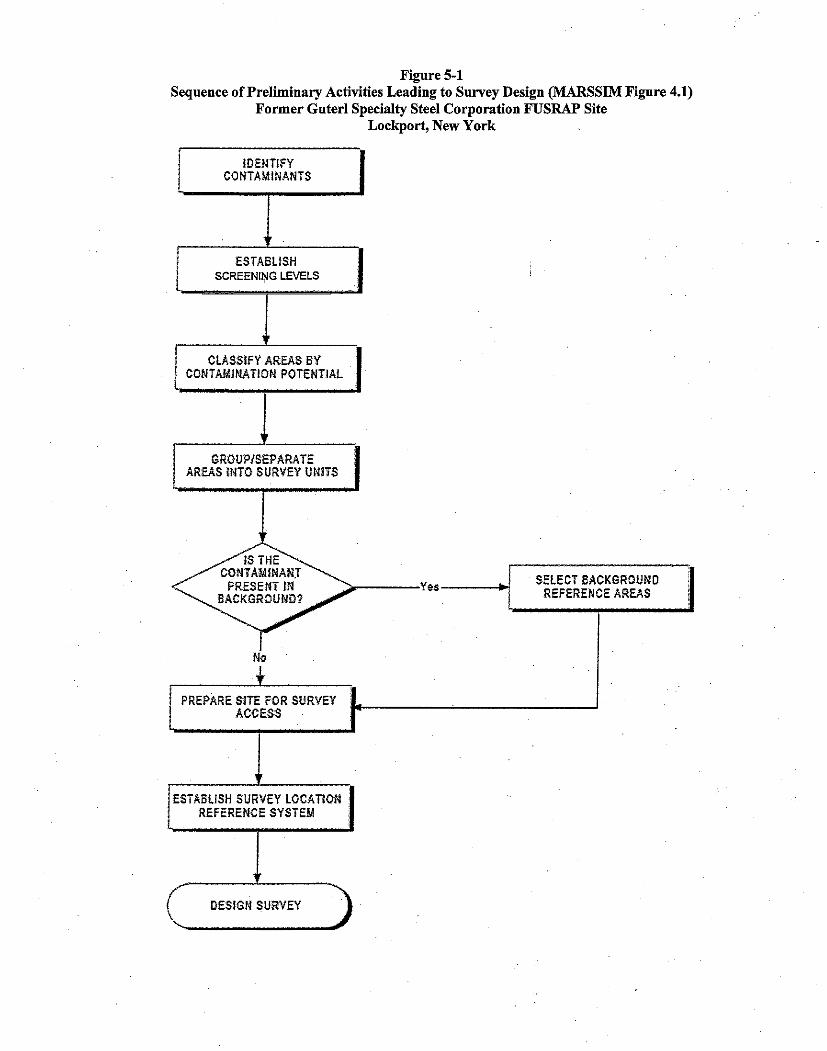
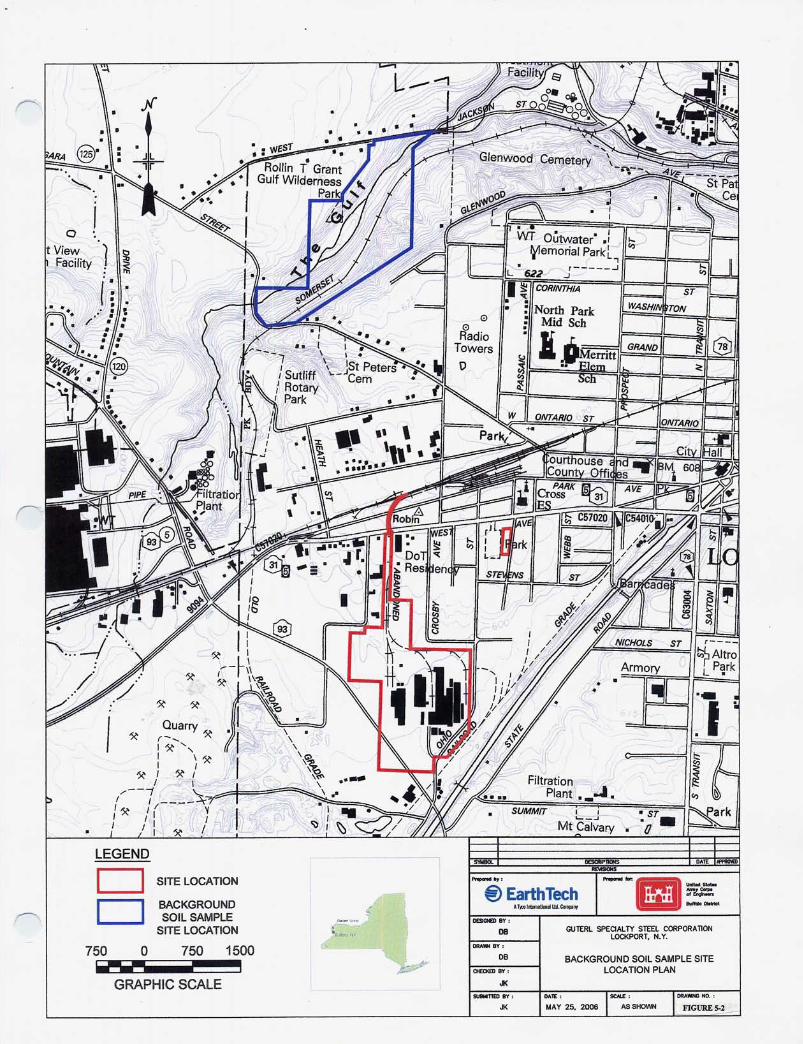
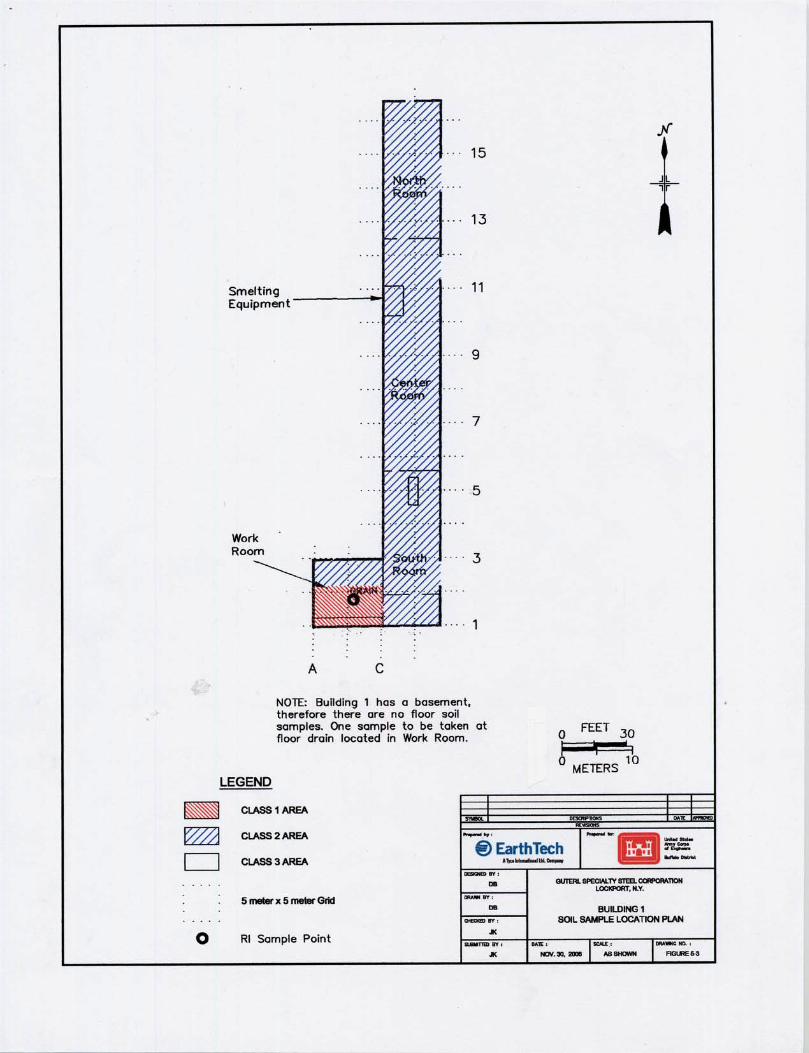
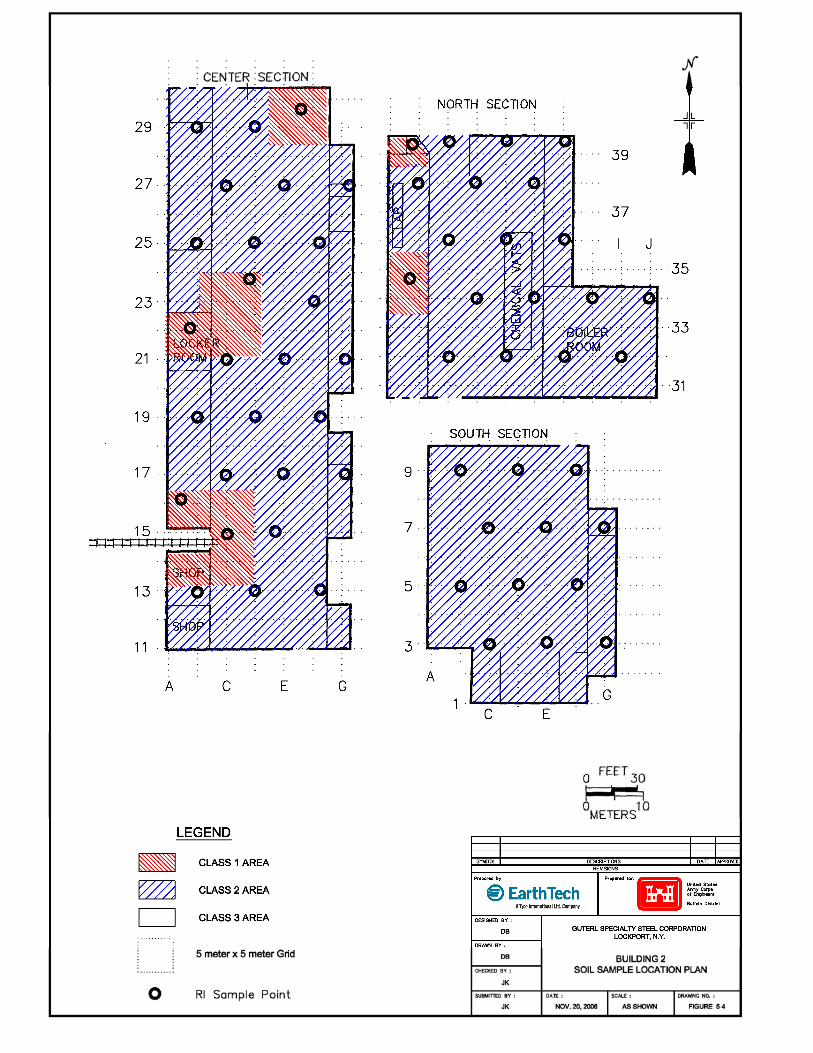
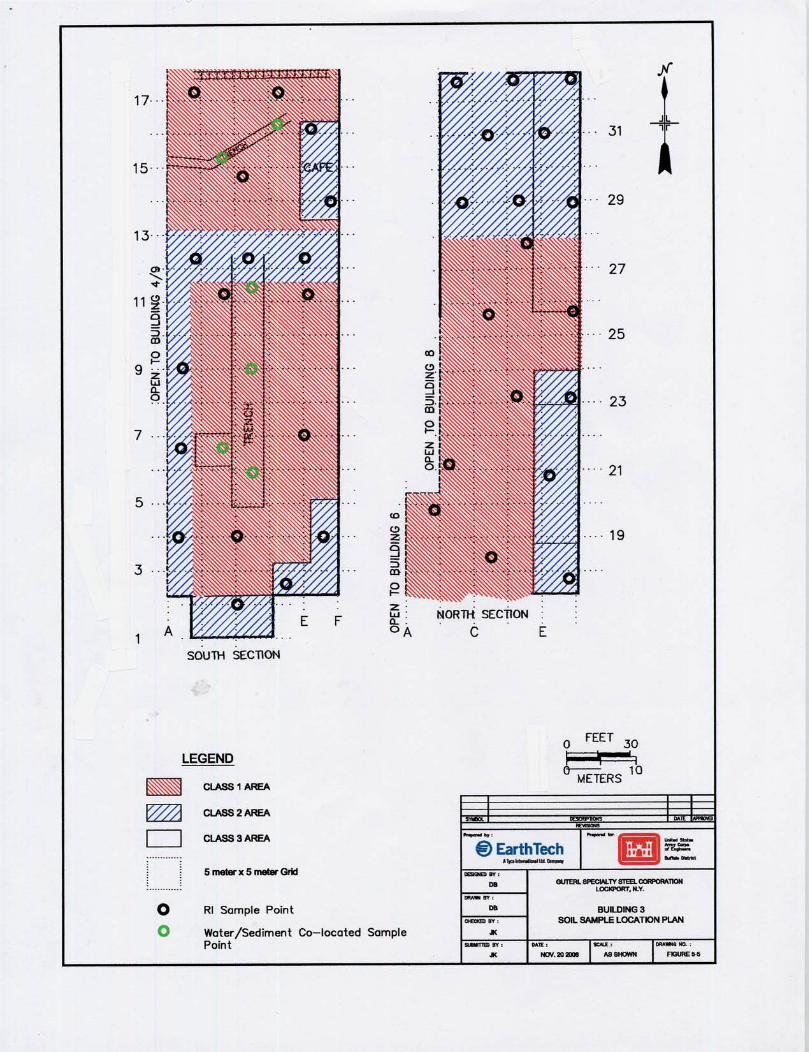
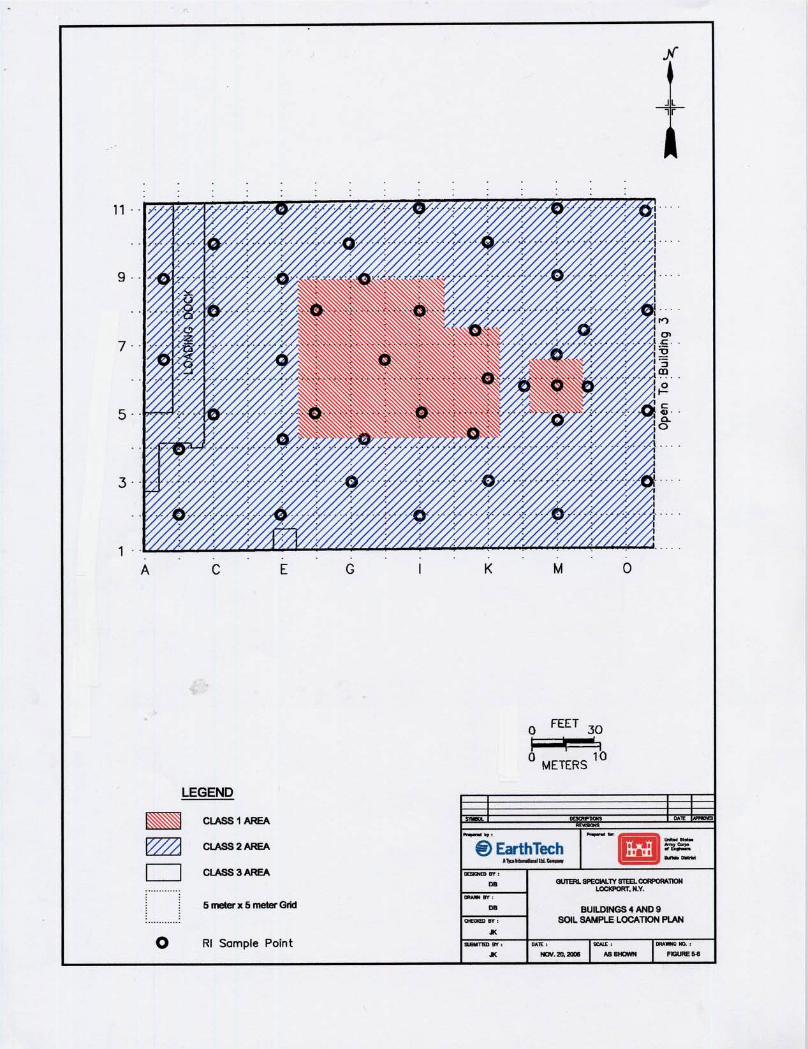
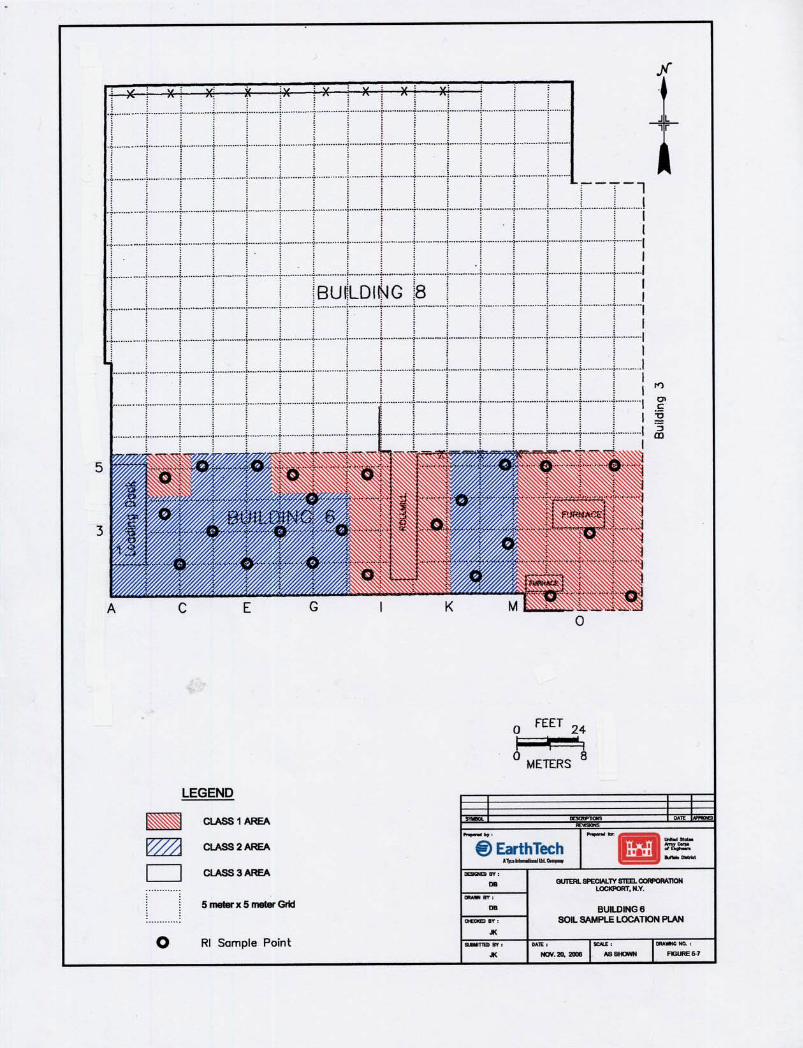
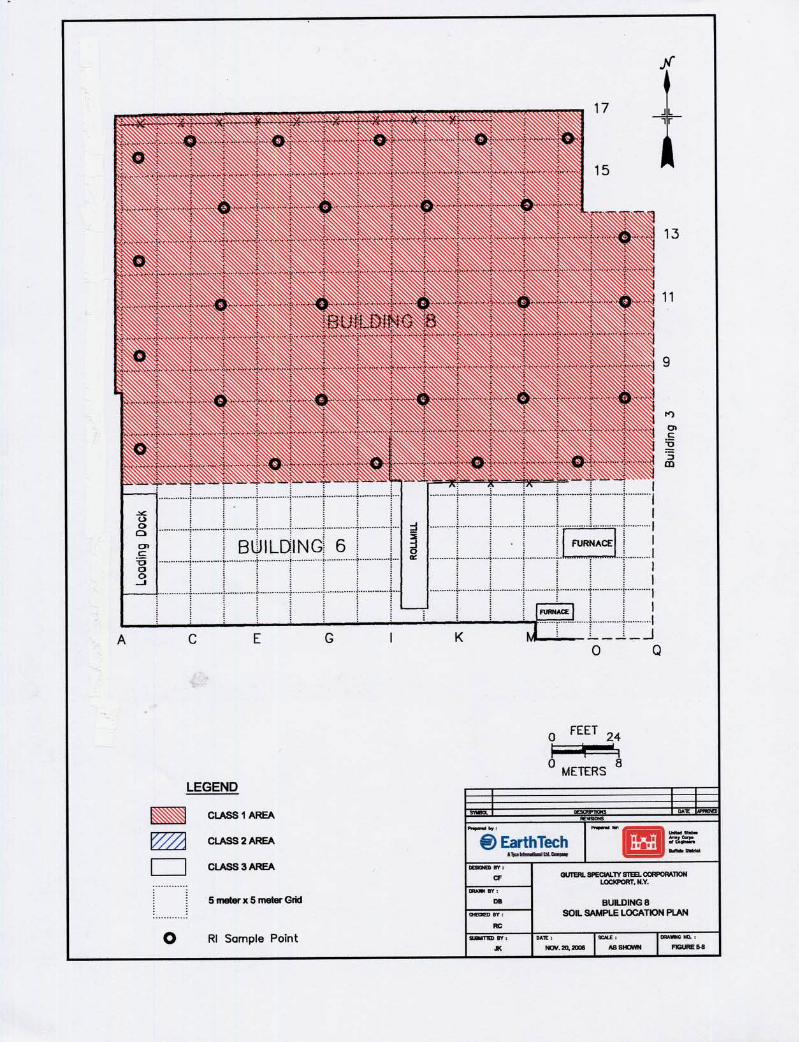
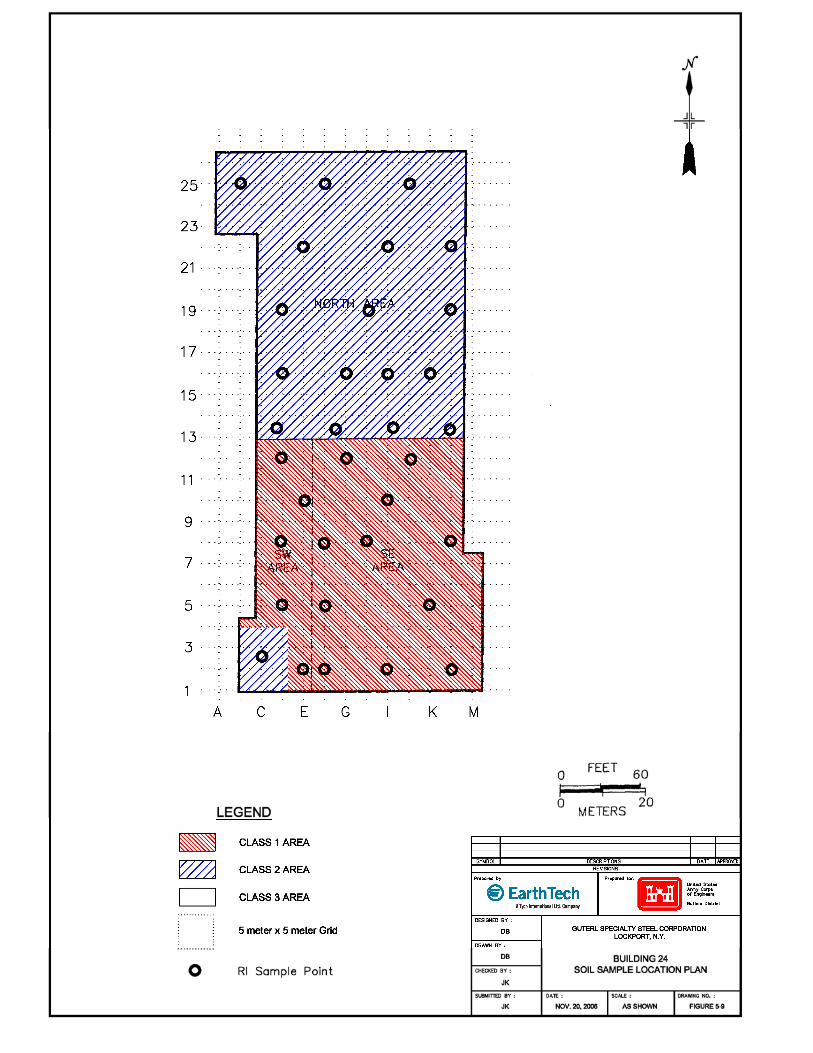
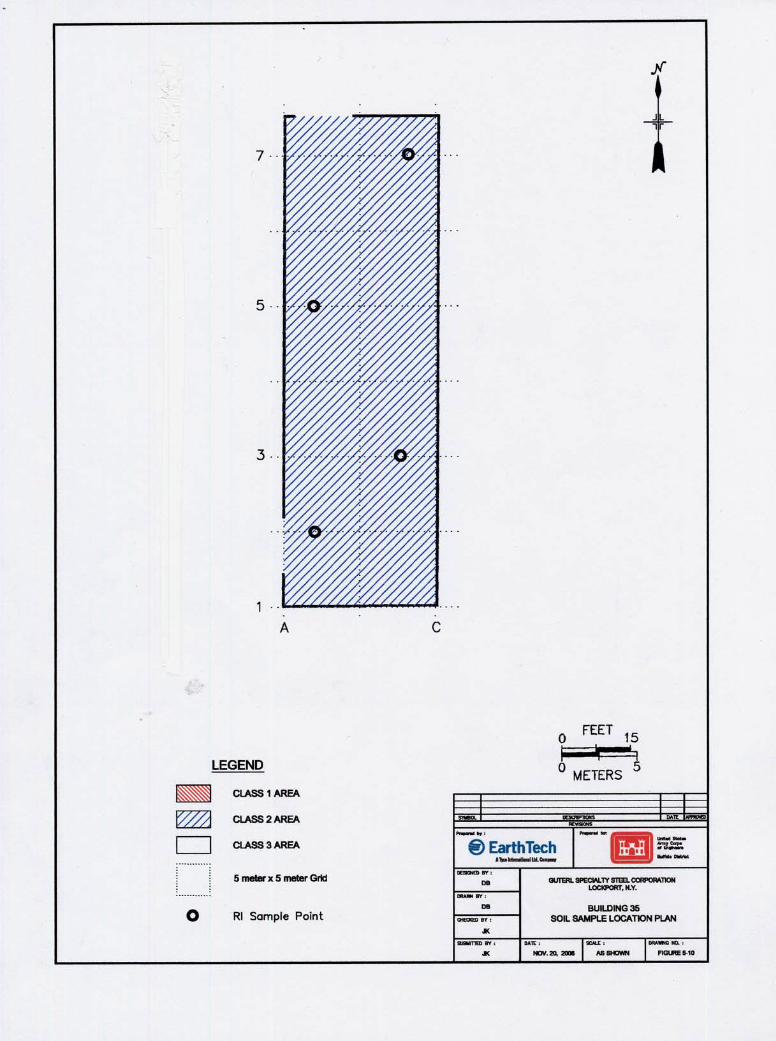
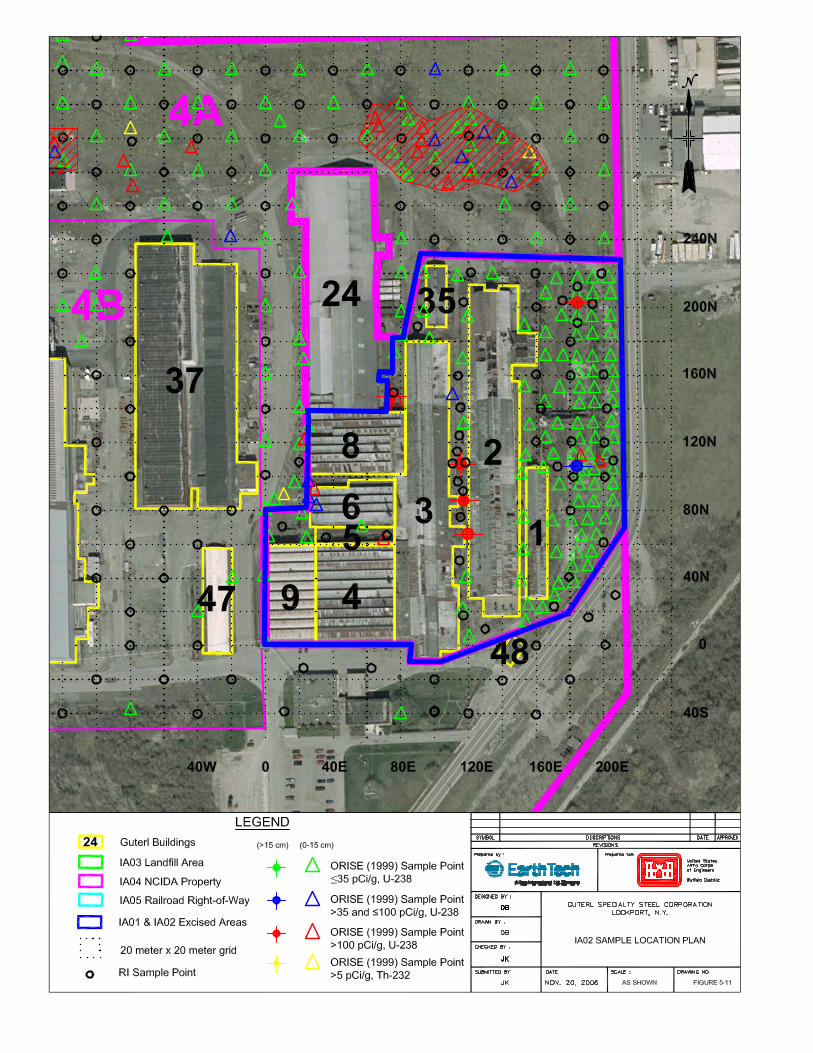
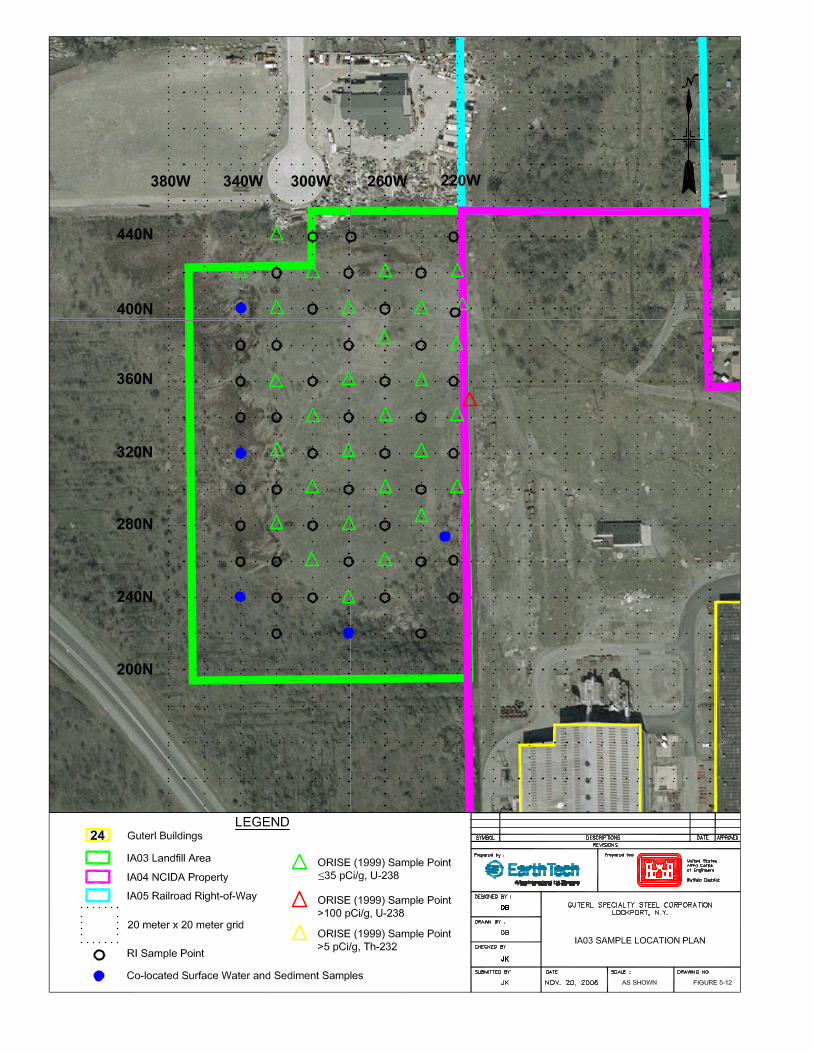
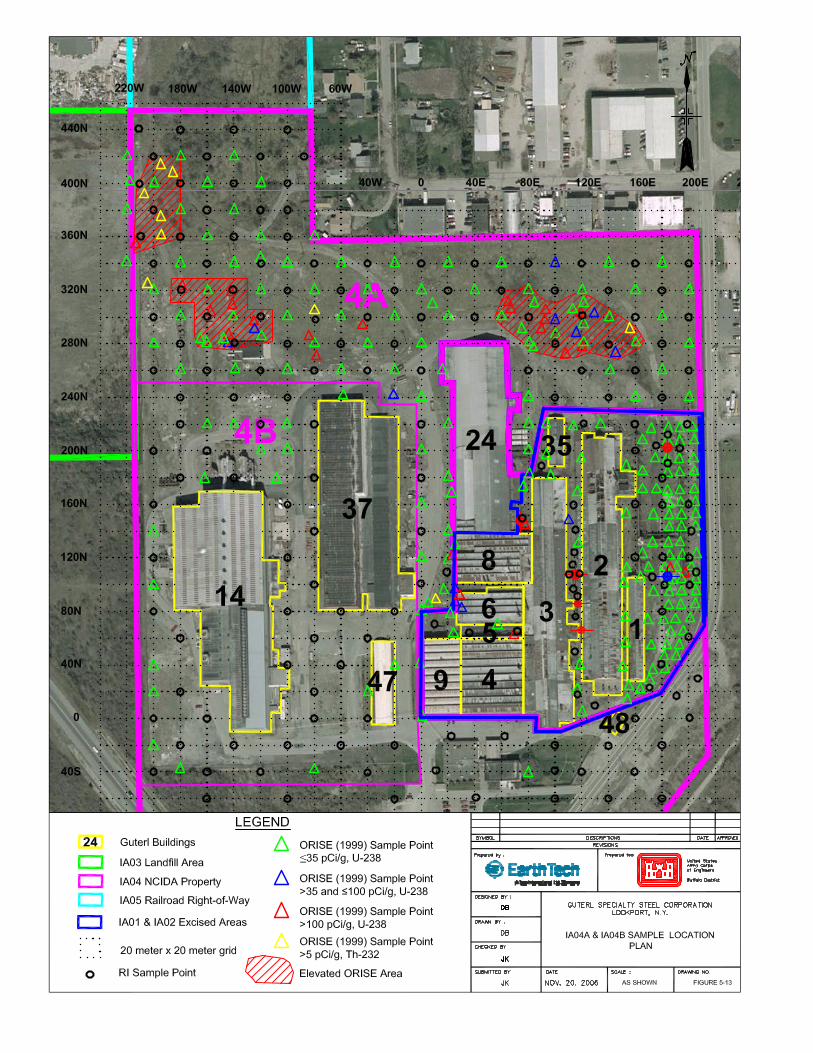
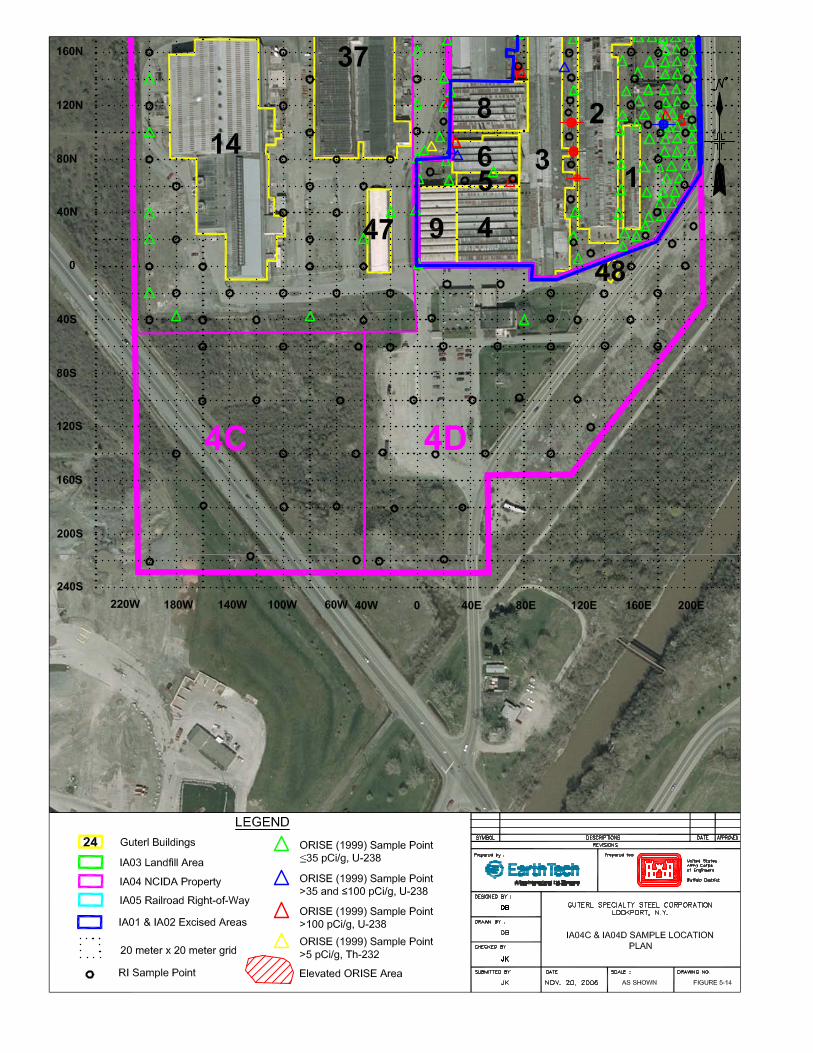
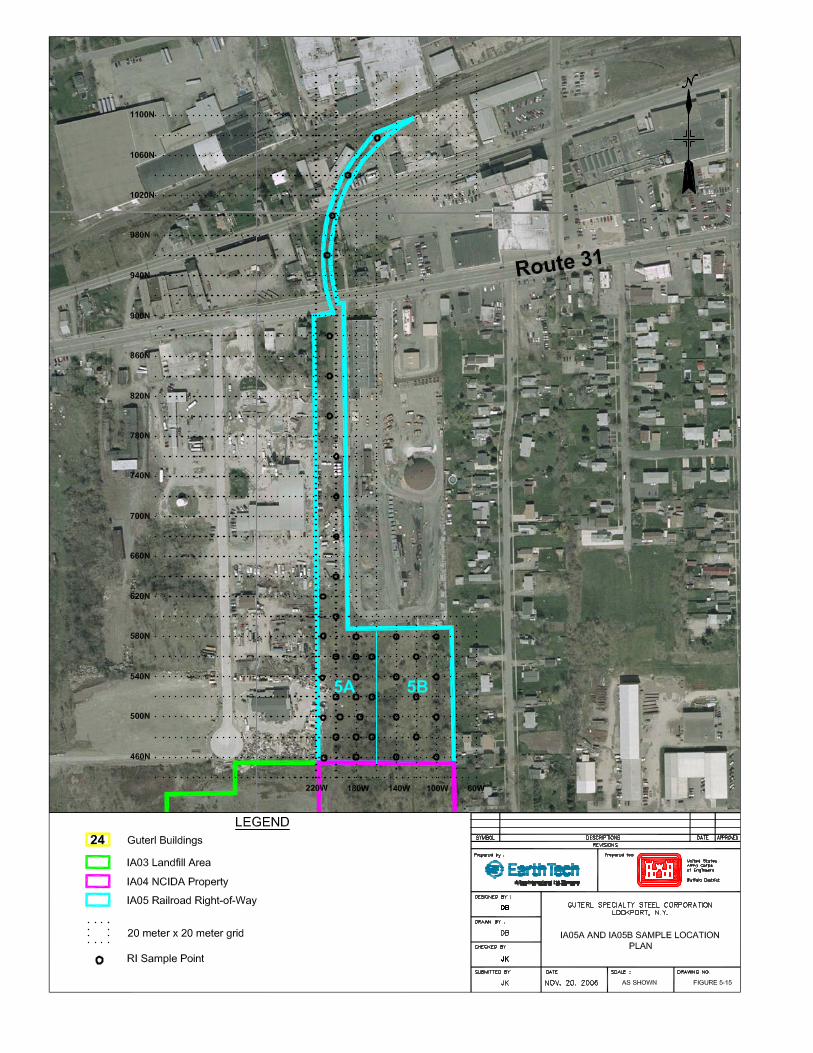
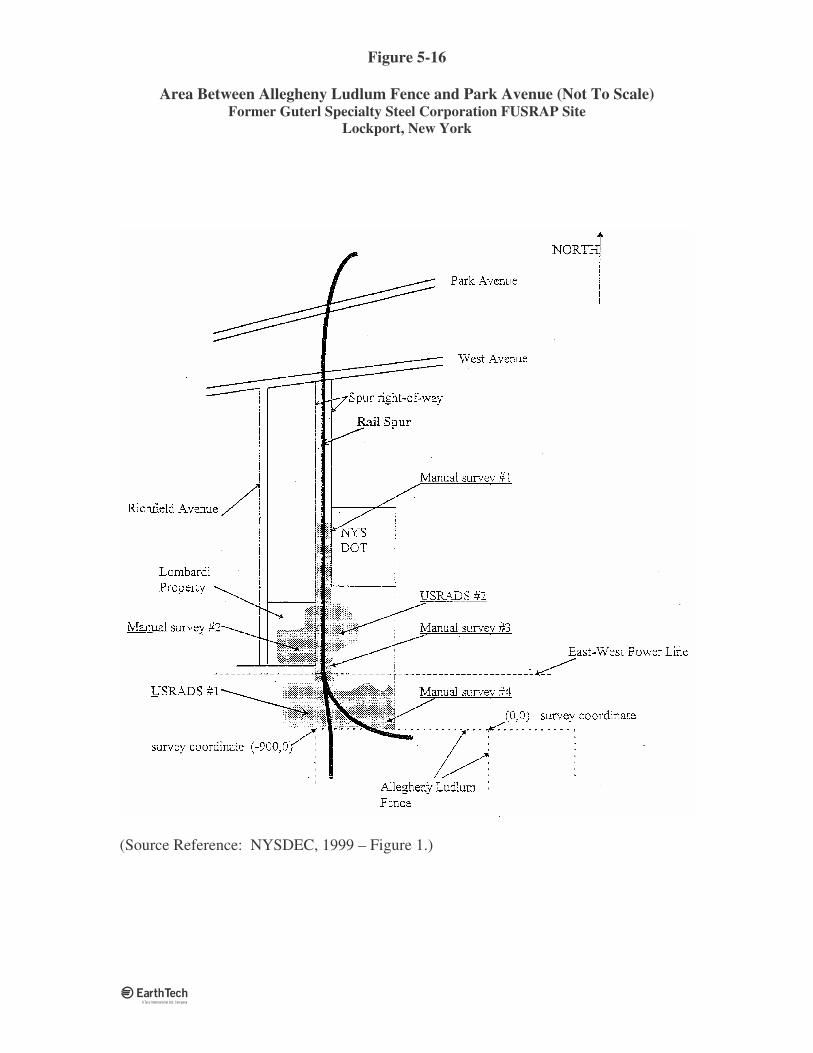
Figure 5-16
Area Between Allegheny Ludlum Fence and Park Avenue (Not To Scale) Former Guterl Specialty Steel Corporation FUSRAP Site
Lockport, New York
��
(Source Reference: NYSDEC, 1999 – Figure 1.)
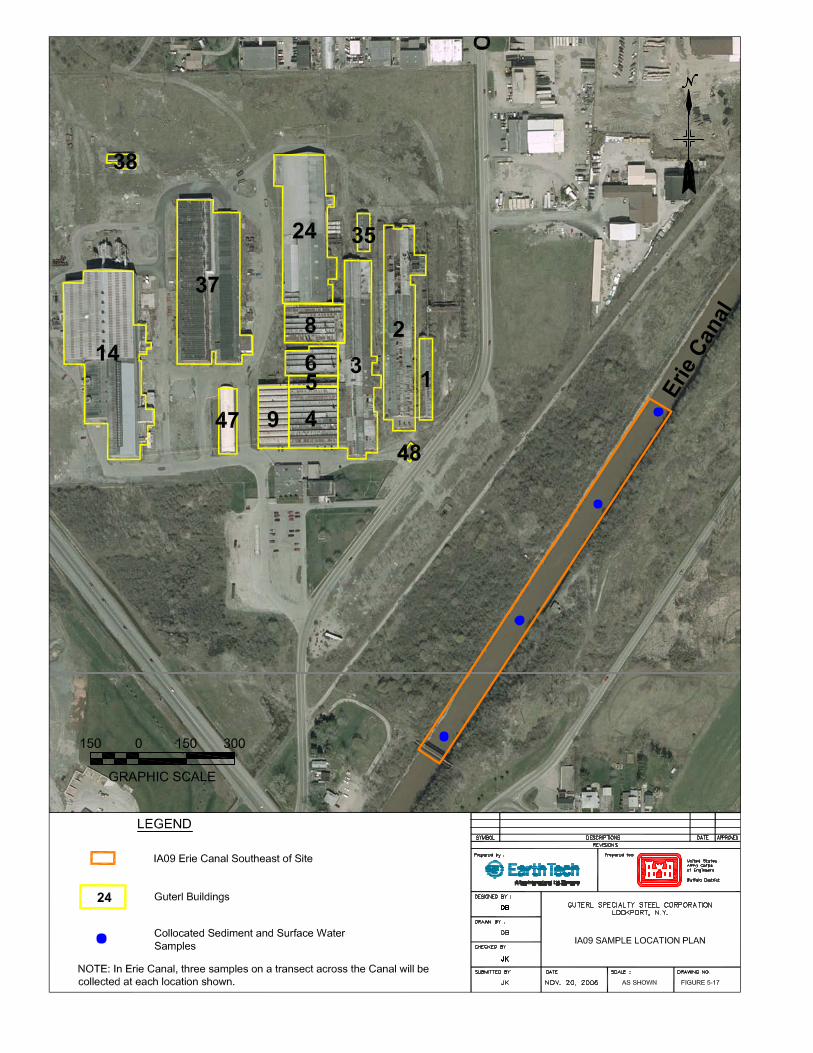
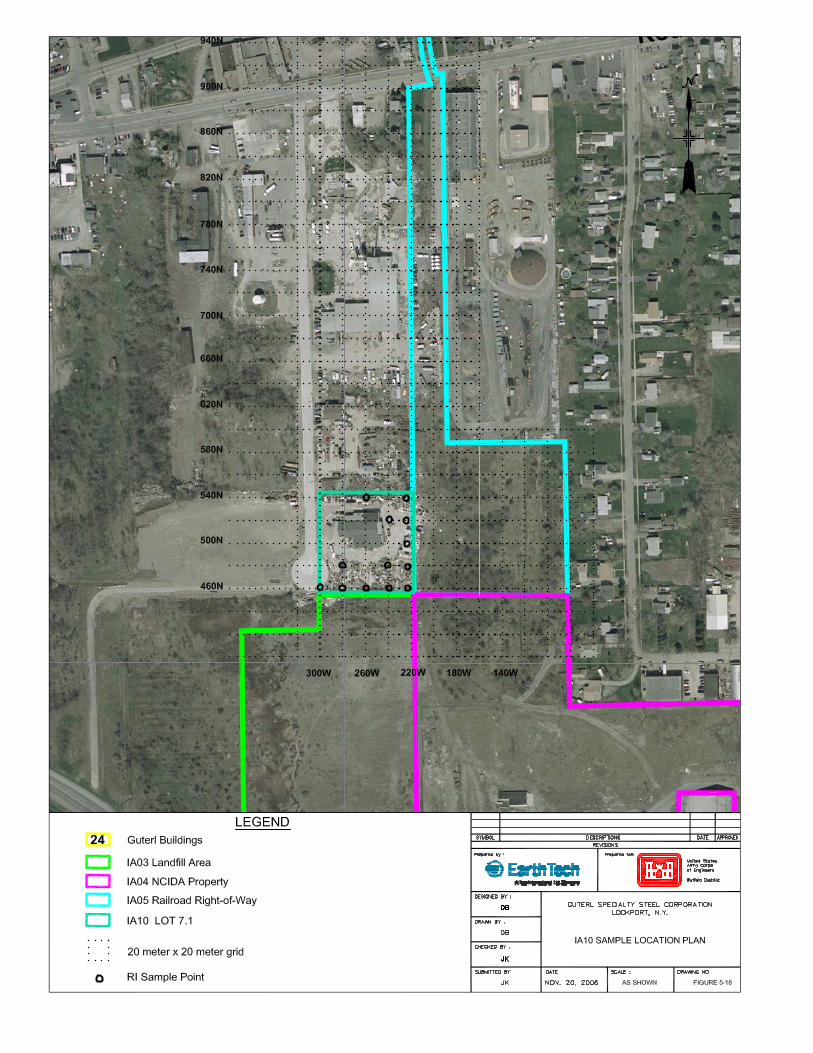
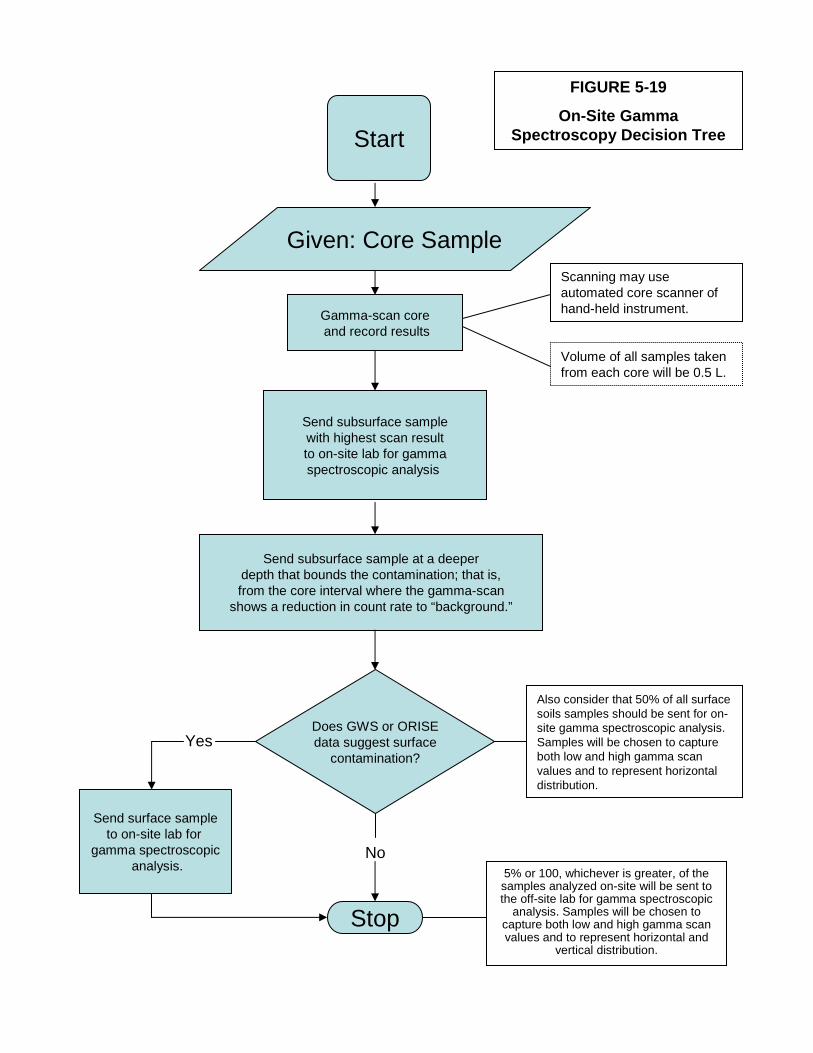
Also consider that 50% of all surface soils samples should be sent for on-site gamma spectroscopic analysis. Samples will be chosen to capture both low and high gamma scan values and to represent horizontal distribution.
5% or 100, whichever is greater, of the samples analyzed on-site will be sent to the off-site lab for gamma spectroscopic
analysis. Samples will be chosen to capture both low and high gamma scan values and to represent horizontal and
vertical distribution.
Start
Given: Core Sample
Gamma-scan coreand record results
Send subsurface samplewith highest scan resultto on-site lab for gammaspectroscopic analysis
Send subsurface sample at a deeperdepth that bounds the contamination; that is,from the core interval where the gamma-scan
shows a reduction in count rate to “background.”
Does GWS or ORISEdata suggest surface
contamination?
Send surface sampleto on-site lab for
gamma spectroscopicanalysis.
Stop
Yes
No
Scanning may use automated core scanner of hand-held instrument.
Volume of all samples taken from each core will be 0.5 L.
FIGURE 5-19
On-Site Gamma Spectroscopy Decision Tree
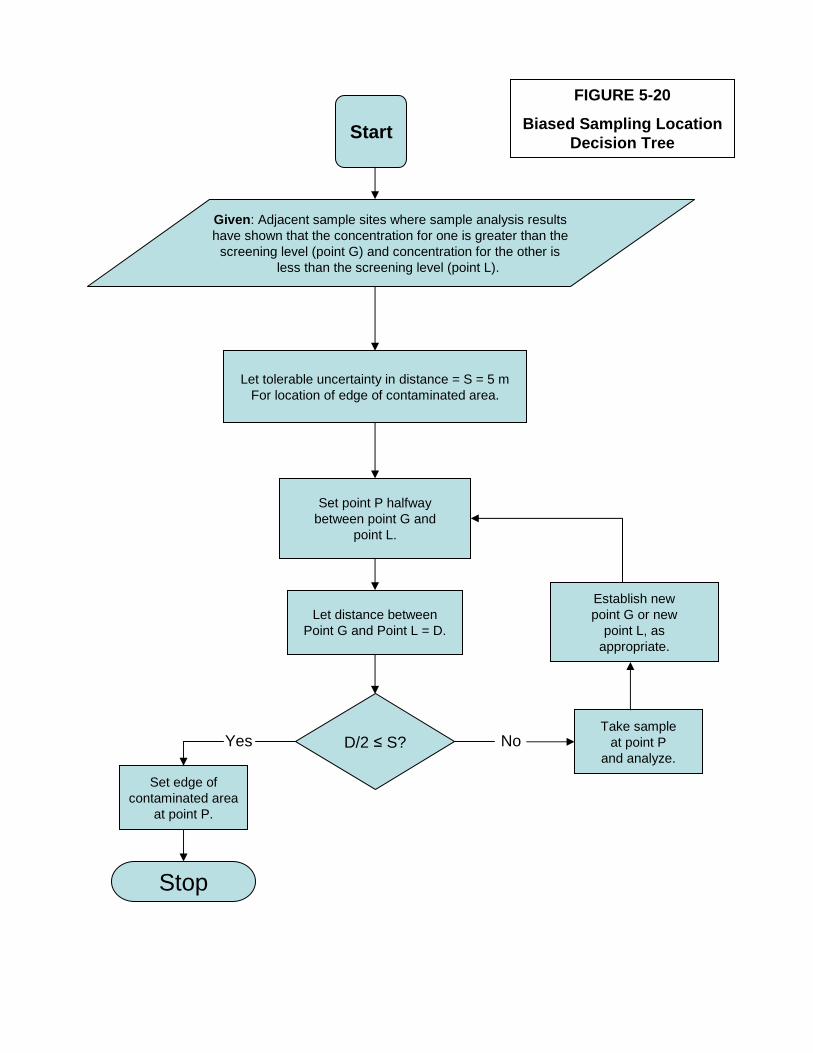
Start
Given: Adjacent sample sites where sample analysis resultshave shown that the concentration for one is greater than the
screening level (point G) and concentration for the other isless than the screening level (point L).
Let tolerable uncertainty in distance = S = 5 mFor location of edge of contaminated area.
Set point P halfwaybetween point G and
point L.
D/2 ≤ S?
Set edge ofcontaminated area
at point P.
Stop
Yes No
FIGURE 5-20
Biased Sampling Location Decision Tree
Let distance betweenPoint G and Point L = D.
Take sampleat point P
and analyze.
Establish newpoint G or new
point L, asappropriate.
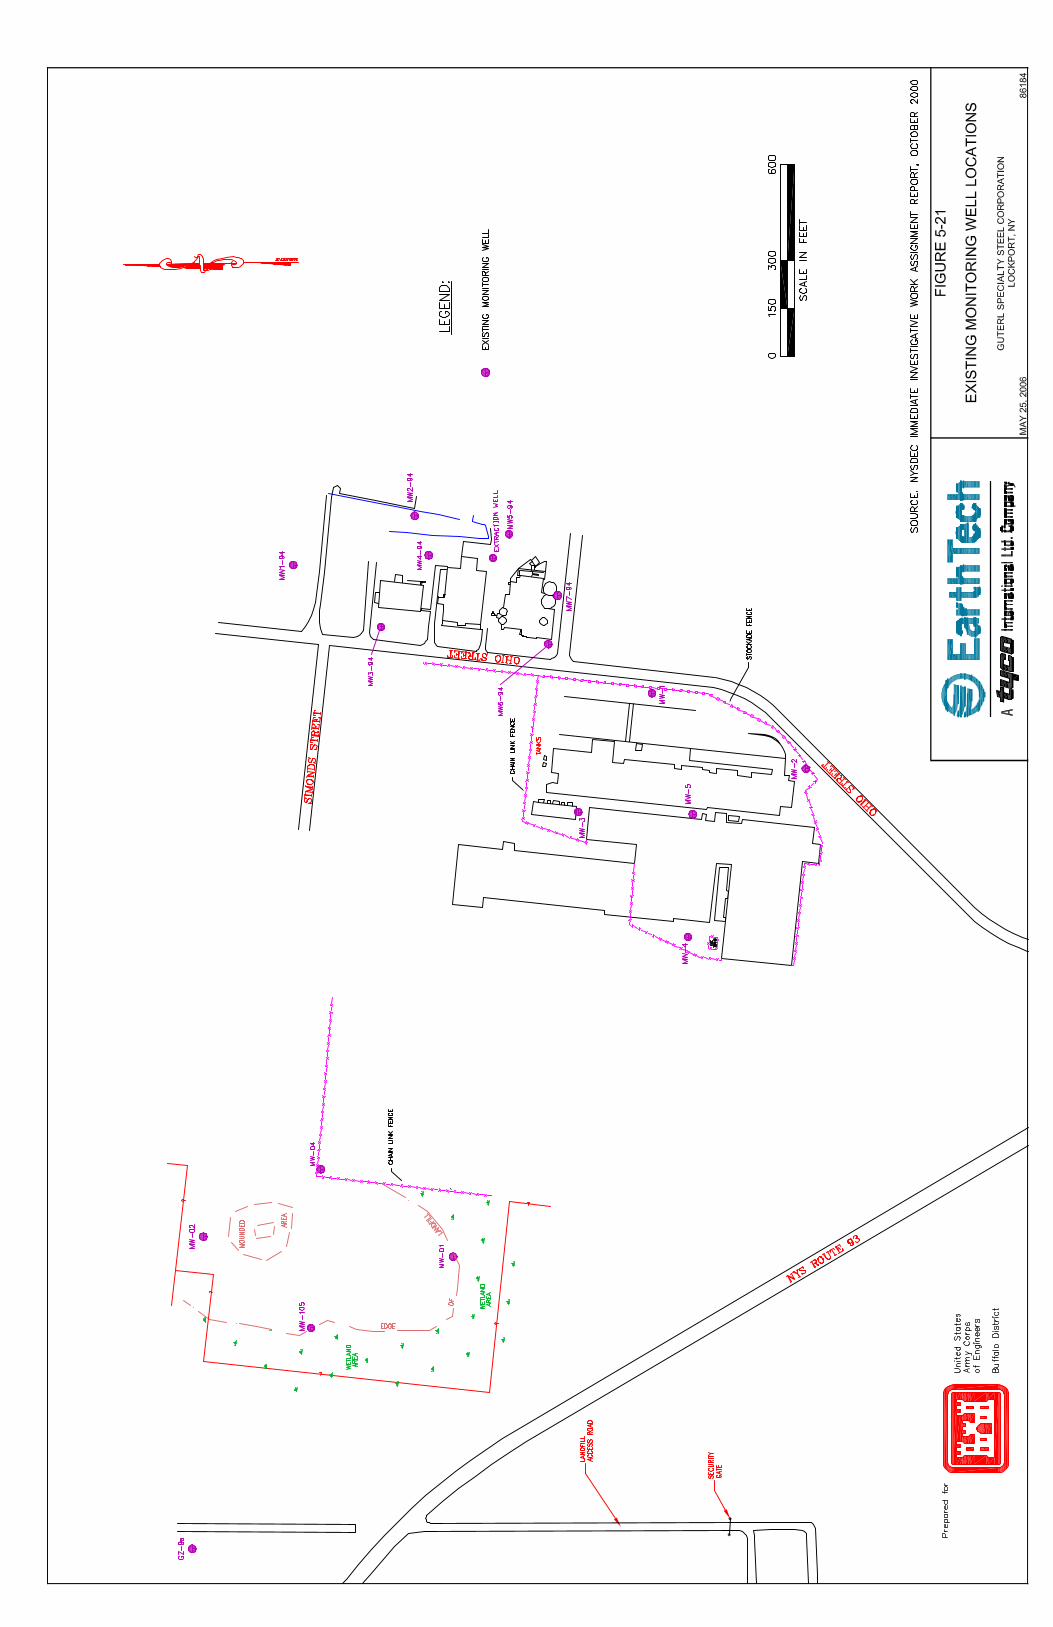
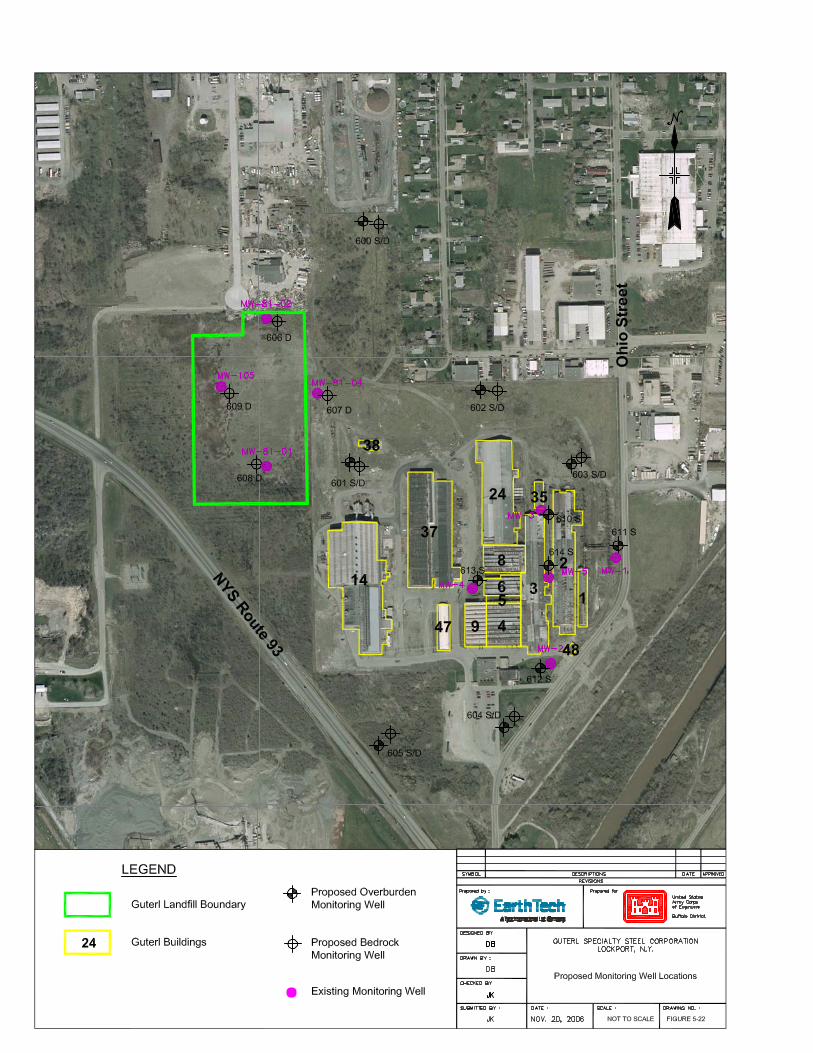
����
�##��'( % #��##��'( % #��##��'( % #��##��'( % #�����
����

This page intentionally left blank.
�
�
����
�##��'( % #���##��'( % #���##��'( % #���##��'( % #������
�������) ���������������� �������) ���������������� �������) ���������������� �������) ���������������� �����

This page intentionally left blank.
�
����
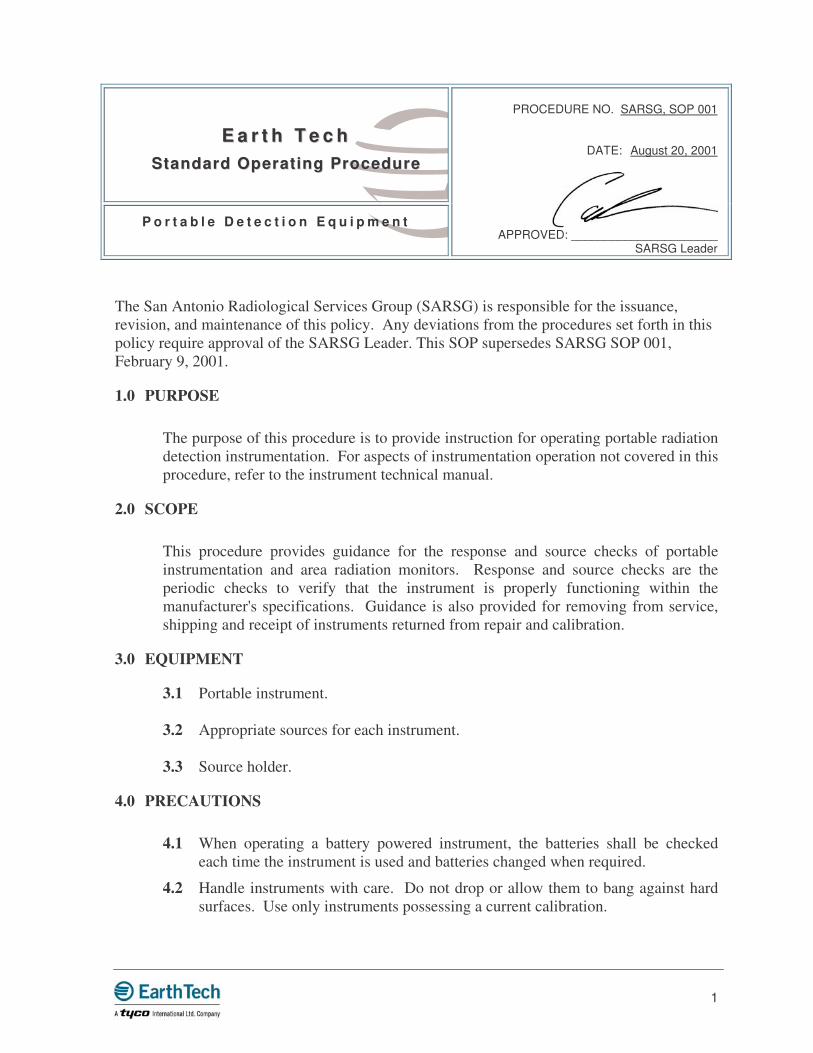
1�
The San Antonio Radiological Services Group (SARSG) is responsible for the issuance, revision, and maintenance of this policy. Any deviations from the procedures set forth in this policy require approval of the SARSG Leader. This SOP supersedes SARSG SOP 001, February 9, 2001.
1.0 PURPOSE
The purpose of this procedure is to provide instruction for operating portable radiation detection instrumentation. For aspects of instrumentation operation not covered in this procedure, refer to the instrument technical manual.
2.0 SCOPE
This procedure provides guidance for the response and source checks of portable instrumentation and area radiation monitors. Response and source checks are the periodic checks to verify that the instrument is properly functioning within the manufacturer's specifications. Guidance is also provided for removing from service, shipping and receipt of instruments returned from repair and calibration.
3.0 EQUIPMENT
3.1 Portable instrument. 3.2 Appropriate sources for each instrument. 3.3 Source holder.
4.0 PRECAUTIONS
4.1 When operating a battery powered instrument, the batteries shall be checked each time the instrument is used and batteries changed when required.
4.2 Handle instruments with care. Do not drop or allow them to bang against hard surfaces. Use only instruments possessing a current calibration.
�
P o r t a b l e D e t e c t i o n E q u i p m e n t
PROCEDURE NO. SARSG, SOP 001
DATE: August 20, 2001
APPROVED: ______________________
SARSG Leader
EE aa rr tt hh TT ee cc hh SSttaannddaarrdd OOppeerraatt iinngg PPrroocceedduurree
SARSG. SOP 001
2
4.3 Care should be taken when using thin window detectors (pancake and scintillation detectors) near sharp objects so that the window and detector shall not damaged.
4.4 Slowly enter areas of unknown radiation with instruments on the high scale to avoid off-scale readings and subsequent prolonged recovery time.
4.5 Although incidental contact with the surveyed surface will not generally contaminate the detector, minimize contact with the surface.
4.6 Occasionally verify instrument is responding properly if background appears low.
4.7 When checking instruments, place the source in its holder or center it on the probe as required.
4.8 Carefully pack for shipment any instrument being sent to a facility to be calibrated or repaired to avoid damage in transit.
4.9 Radiation survey instruments and count rate instruments shall be calibrated at least every twelve months, after the instrument is repaired.
5.0 PROCEDURE
5.1 Steps prior to using instruments.
5.1.1 Calibration Verification
4.9.1.1 All portable radiological instruments shall have a current calibration label.
4.9.1.2 All field instruments will be verified to be under current source check prior to use.
5.1.2 Physical Check
5.1.2.1 Inspect the general physical condition of the instrument and detector prior to each use.
5.1.2.2 Inspect for loose, damaged knobs, buttons, cables, connectors, broken/damaged meter movements/ displays, dented or corroded instrument cases, punctured/deformed probe/probe window(s), cables, etc., and any other physical impairments that may affect the proper operation of the instrument or detector.
5.1.2.3 Any instrument or detector having a questionable physical condition shall not be used until corrected.
5.1.3 Battery Check
5.1.3.1 Check that there is sufficient voltage being supplied to the detector and instrument circuitry for proper operation.
SARSG. SOP 001
3
5.1.3.2 Perform this check in accordance with the instrument's technical manual; although, it is generally performed as follows:
5.1.3.2.1 Position the appropriate selector switch to the "Batt" position or depress the "Batt Check" button with the instrument on.
5.1.3.2.2 Observe the indication for the current battery condition. Typically, the current battery condition will be indicated by a meter deflection into the "Batt OK" region or "Batt OK" on the display, etc.
5.1.3.2.3 If unsatisfactory results are obtained, refer to the technical manual for replacement of the batteries and repeat the check. The instrument shall display a satisfactory battery check prior to use.
5.1.4 High Voltage (HV) Check
5.1.4.1 HV is adjusted appropriately during instrument calibration and does not require adjustment for normal operation.
5.1.4.2 A HV check is required prior to each use as applicable in accordance with the instrument technical manual.
5.1.4.3 An instrument with suspected HV problems shall be reported to the Project Manager and RSO.
5.1.5 Instrument Source Check
This check is performed daily to verify that the instrument will respond accurately to a known source of radiation. Locate the source for the instrument/detector being used and perform the response source check as described in the following.
5.1.5.1 Determine the background radiation level. It must be low enough to allow a measurable response to the check source being used. Careful monitoring of changing background levels is necessary to obtain accurate instrument readings.
5.1.5.2 Check the battery condition. If batteries are not in the allowed range, replace the batteries or clean contacts as necessary. If battery check is not satisfactory after corrective actions, then place instrument out of service and send to an authorized calibration facility for repair and calibration.
5.1.5.3 Perform source checks with appropriate sources. For on-contact readings, verify that the source to probe geometry is reproducible, in direct contact, and facing the probe.
SARSG. SOP 001
4
5.1.5.4 Record the source check results on the Radiological Instrument Daily Calibration Record, Attachment 1.
5.1.5.5 Instruments with source check responses that vary by more than 20% under identical conditions shall be removed from service and the Project Manager notified.
5.1.6 Daily Response Checks
This instrument check is performed to see if the instrument responds to a source of radiation. This is a qualitative check only.
5.1.6.1 Intermittent response checks of the count rate survey and radiation survey instruments shall be performed everyday if instrument is in use. Documentation of these response checks is not required.
5.1.6.2 Begin with the instrument on the highest range/scale and enable the audible device, if applicable.
5.1.6.3 Slowly move the detector towards the check source and observe for an increase in audible and/or visual response.
5.1.6.4 Change the range/scale of the instrument as appropriate to obtain a readable indication and to check each of the meter ranges/scales possible. If an appreciable response can not be obtained, even in the lowest range, evaluate instrument performance by comparison to previous source check data for the instrument.
5.1.7 Should the response check be unsatisfactory, the instrument shall be removed from service. Record this on the instrument check form, Attachment 1. Send the instrument to an authorized calibration facility for repair and calibration.
5.1.8 When an instrument has reached its calibration due date, the instrument shall be sent to an authorized calibration facility.
5.2 Using Exposure Rate Instruments (survey instruments that read in R/hr, mR/hr, or µµµµR/hr)
5.2.1 General Area Surveys
Hold the detector at waist level with the most sensitive areas of the detector facing the item or areas being surveyed. Unless the radiation level on the item being surveyed is known, start on the high scale and work down scale until the instrument reading is between 1/4 and 3/4 (mid scale) scale, if possible.
SARSG. SOP 001
5
5.2.2 Direct Surveys
Hold the detector at about one inch from the surface of the item being surveyed.
5.3 Using Beta-Gamma Friskers
5.3.1 Counting Smears and Air Sample Filters
Hold the detector no further than 1/2 inch from the smear or filter. Count the smear for a minimum of five seconds, or if positive indication is noted, count for at least 15 seconds or until the meter indication stabilizes.
5.3.2 Frisking
Hold the detector within 1/2 inch of the surface being frisked. Move the detector no faster than two inches per second. Stop when positive indication is noted from audio response, allow meter indication to stabilize and record that value. The background for release of materials/equipment should be 100 cpm or less.
5.4 Using Alpha Survey Meters
Hold the detector within 1/4 inch of the surface being surveyed. Move the detector no faster than two inches per second. Stop when positive indication is noted and allow meter indication to stabilize; record that value.
5.5 Instruments requiring calibration or repair at an off-site facility, as determined in Section 5.1, are treated as follows.
5.5.1 Remove the instrument from service and record information on instrument check form. In addition, fill out the appropriate information in the Out of Service Tracking Log, Attachment 2.
5.5.2 Instruments with delicate probe windows should have a probe cover secured to prevent damage. Any special instructions should be included with the instrument.
5.5.3 Carefully package the instrument and ship to the calibration facility.
5.6 Receipt of Repaired/Calibrated Instrument
5.6.1 Perform a reference source check of the instrument using the appropriate source.
5.6.1.1 Record the reference source check on Attachment 1.
5.6.1.2 Verify instrument has the correct calibration due date on the calibration sticker.
SARSG. SOP 001
6
5.6.1.3 A new set of baseline dose rate/count rate numbers will be established for the instrument.
5.6.2 Place the date the instrument was returned to service in the Out of Service Tracking Log, Attachment 2.
5.7 Calibration
Instruments used for monitoring and contamination control shall be:
• Periodically maintained and calibrated on an established frequency of at least once per year;
• Appropriate for the type(s), levels, and energies of the radiation(s) encountered;
• Appropriate for existing environmental conditions; and • Routinely tested for operability.
5.7.1 Radiological instruments shall be used only to measure the radiation for which their calibrations are valid.
5.7.2 The ANSI N323 method for radiological instrumentation calibration will be adhered to.
5.7.3 Calibrations shall use National Institute of Standards and Technology (NIST) traceable sources.
5.7.4 Calibration procedures shall be developed for each radiological instrument type and should include frequency of calibration, precalibration requirements, and primary calibration requirements, periodic performance test requirements, calibration record requirements and maintenance requirements.
5.7.5 Pocket and electronic dosimeters and area radiation monitors should be calibrated at least annually.
5.7.6 The effects of environmental conditions, including interfering radiation has on an instrument shall be known prior to use.
5.7.7 Functional tests should be used to assess the instrumentation’s features.
5.7.8 In unusual and limited situations it may be necessary to use an instrument in an application other than that envisioned by the manufacturer.
5.7.9 Special calibrations should be performed for use of instrumentation outside manufacturer's specifications.
5.7.10 The instrument should be adjusted, calibrated and labeled to identify the special conditions and used only under the special conditions for which it was calibrated.
5.7.11 Instruments should bear a label or tag with the date of calibration and date calibration expires.
SARSG. SOP 001
7
5.7.12 A properly authorized company such as Ludlum or Suntrac Services will calibrate instruments, at least once per year or in accordance with manufacturer recommendations.
6.0 ACTION LEVELS
6.1 Readings that deviate more than ± 20% from reference source check readings obtained at the time the instrument was first calibrated require instrument re-calibration.
6.2 Unsatisfactory response battery check.
6.3 Unsatisfactory operation of instrument.
7.0 RECORDS
7.1 Radiological Instrument Daily Calibration Record, Attachment 1.
7.2 Out of Service Tracking Log, Attachment 2.
8.0 REFERENCES
8.1 Instrument Technical Manuals
8.2 Knoll, Glenn F., Radiation Detection and Measurement, 2nd Edition. John Wiley and Sons, lnc., 1979.
8.3 Multi-Agency Radiation and Site Investigation Manual (MARSSIM), NUREG-1575, Revision 1, Aug 2000.
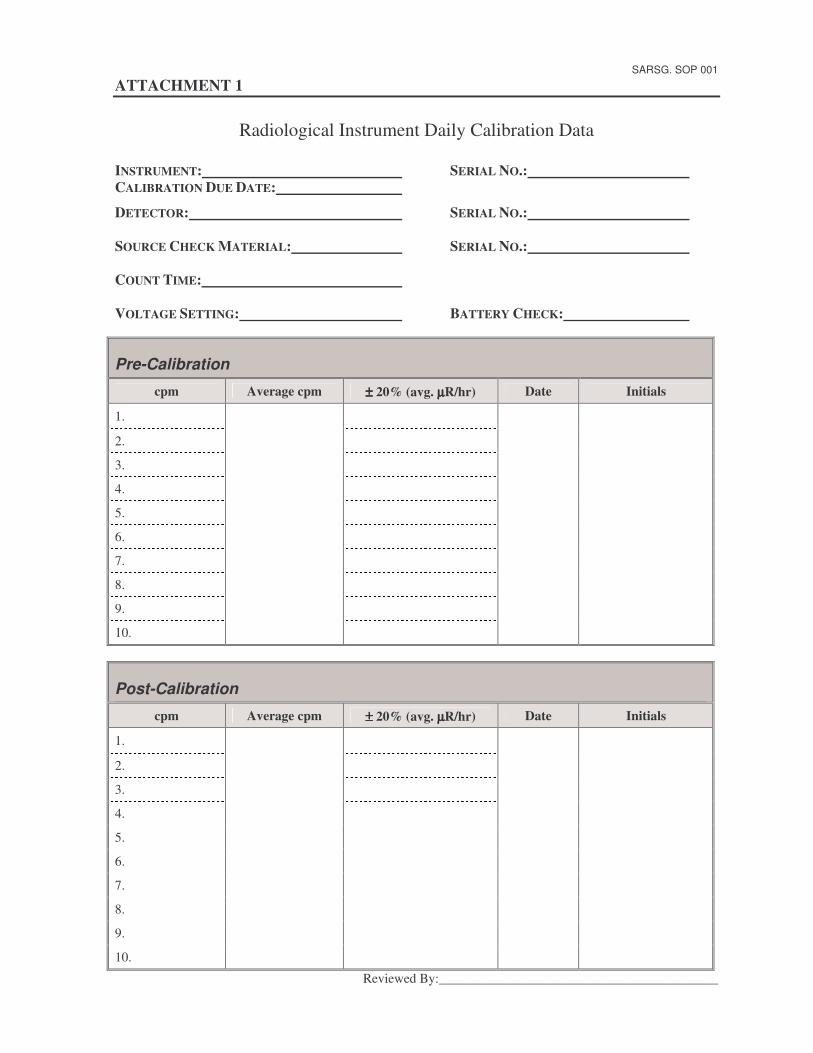
SARSG. SOP 001
ATTACHMENT 1
Radiological Instrument Daily Calibration Data
INSTRUMENT: SERIAL NO.: CALIBRATION DUE DATE: DETECTOR: SERIAL NO.: SOURCE CHECK MATERIAL: SERIAL NO.: COUNT TIME: VOLTAGE SETTING: BATTERY CHECK:
Pre-Calibration
cpm Average cpm ±±±± 20% (avg. µµµµR/hr) Date Initials
1.
2.
3.
4.
5.
6.
7.
8.
9.
10.
Post-Calibration
cpm Average cpm ±±±± 20% (avg. µµµµR/hr) Date Initials
1.
2.
3.
4.
5.
6.
7.
8.
9.
10.
Reviewed By:__________________________________________
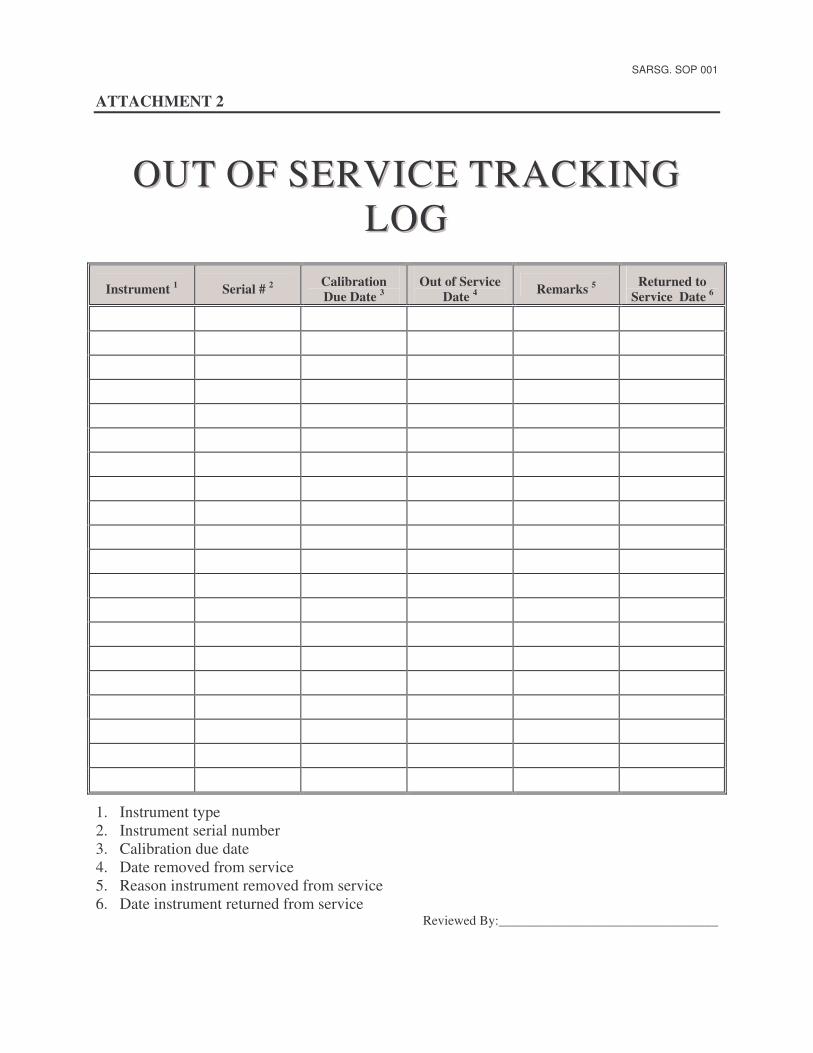
SARSG. SOP 001
ATTACHMENT 2
�
OOUUTT OOFF SSEERRVVIICCEE TTRRAACCKKIINNGG LLOOGG
Instrument 1 Serial # 2 Calibration Due Date 3
Out of Service Date 4 Remarks 5 Returned to
Service Date 6
1. Instrument type 2. Instrument serial number 3. Calibration due date 4. Date removed from service 5. Reason instrument removed from service 6. Date instrument returned from service
Reviewed By:_________________________________
1
The San Antonio Radiological Services Group (SARSG) is responsible for the issuance, revision, and maintenance of this policy. Any deviations from the procedures set forth in this policy require approval of the SARSG Leader. This SOP supersedes SARSG SOP 002, February 9, 2001. 1.0 PURPOSE This Standard Operating Procedure (SOP) establishes requirements for the operation of swipe counter instruments. Specific instructions for individual swipe counters may be found in the manufacturers instruction manual. 2.0 SCOPE This procedure identifies a proper methodology for the operation of the swipe counter instruments. It is applicable to SARSG operations and provides guidelines that should be used by sub-contractor personnel. 3.0 EQUIPMENT
3.1. Swipe counter and gas flow proportional detector, or other appropriate detectors.
3.2. Check sources. 4.0 PRECAUTIONS
4.1. Check that all settings on the HandECount are correct for the type of operation being performed. Failure to check these settings could result in improper operation.
4.2. Loose radioactive contamination on samples may contaminate holder and detector.
4.3. Use protective gloves and tweezers when handling radioactive samples.
�
S w i p e C o u n t e r
PROCEDURE NO. SARSG, SOP 002
DATE: June 28, 2002
APPROVED: ______________________
SARSG Leader
EE aa rr tt hh TT ee cc hh SSttaannddaarrdd OOppeerraatt iinngg PPrroocceedduurree
SARSG, SOP 002
2
4.4. High voltage is used to power detectors. 5.0 PROCEDURES
5.1. Pre Operational Requirements
Prior to using swipe counters and detectors, the following inspections/operational verifications are performed:
5.1.1. Calibration Verification
5.1.1.1. Radiological instruments shall have a current calibration label.
5.1.1.2. A source check shall be performed prior to use each day.
5.1.1.3. Document source check in the projects field log book or on a separate check sheet.
5.1.2. Physical Check
5.1.2.1. Inspect the general physical condition of the instrument and detector prior to each use.
5.1.2.2. Inspect for loose or damaged knobs, buttons, cables, connectors; broken/damaged meter movements/displays; dented or corroded instrument cases; punctured/deformed probe/probe window(s), cables; and any other physical impairments that may affect the proper operation of the instrument or detector.
5.1.2.3. Any instrument or detector having a questionable physical condition shall not be used until the discrepancy is corrected.
5.1.2.4. Document check in field logbook or on a separate check sheet. If discrepancy noted, discuss problem and resolution prior to use.
5.1.3. Battery Check (if applicable)
5.1.3.1. Perform this check in accordance with the instrument's technical manual; it is generally performed as follows:
5.1.3.2. Position the appropriate selector switch to the "Batt" position or depress the "Batt Check" button with the instrument on.
5.1.3.3. Observe the indication for the current battery condition. Typically, the current battery condition will be indicated by a meter deflection into the *Batt OK" region or "Batt OK" on the display, etc.
SARSG, SOP 002
3
5.1.3.4. If unsatisfactory results are obtained, refer to the technical manual for replacement of the batteries and repeat the check. The instrument shall display a satisfactory battery check prior to use.
5.1.3.5. Document check in field logbook or on a separate check sheet. If discrepancy noted, discuss problem and resolution prior to use.
5.1.4. High Voltage Check (HV)
5.1.4.1. The HV is adjusted appropriately during instrument calibration and does not require adjustment for normal operation.
5.1.4.2. An HV check shall be performed prior to each use in accordance with the instrument technical manual.
5.1.4.3. An instrument with suspected HV problems shall be reported to the project on-site manager.
5.1.4.4. Document check in field logbook or on a separate check sheet. If discrepancy noted, discuss problem and resolution prior to use.
5.2. Daily Scaler Set Up
5.2.1. Turn on scaler and select a 20-minute count time.
5.2.2. Perform the background measurement and record total counts measured and background cpm on the Scaler Daily Log Sheet, Attachment 4.
Note: If single count Cb (cpm) has exceeded the high limit or is below the low limit, inform the project or on-site manager.
5.2.3. Perform a one-minute source check with the source used in the initial efficiency determination.
5.2.4. Record gross counts (cpm) Cg and net counts (cpm) Cg-Cb on the Scaler Daily Log Sheet, Attachment 4.
Note: If Cg-Cb has exceeded the source check high limit or the source check low limit, inform the project or on-site manager.
5.2.5. Estimated Minimum Detectable Activity (MDA)
5.2.5.1. The estimated minimum detectable activity is determined to verify that the detector being used will detect the presence of activity at or above the allowable limit under a given set of counting conditions. MDA is based on the estimated Minimum Detectable Counts (MDC) and detector efficiency. Determine the estimated MDC and MDA as follows:
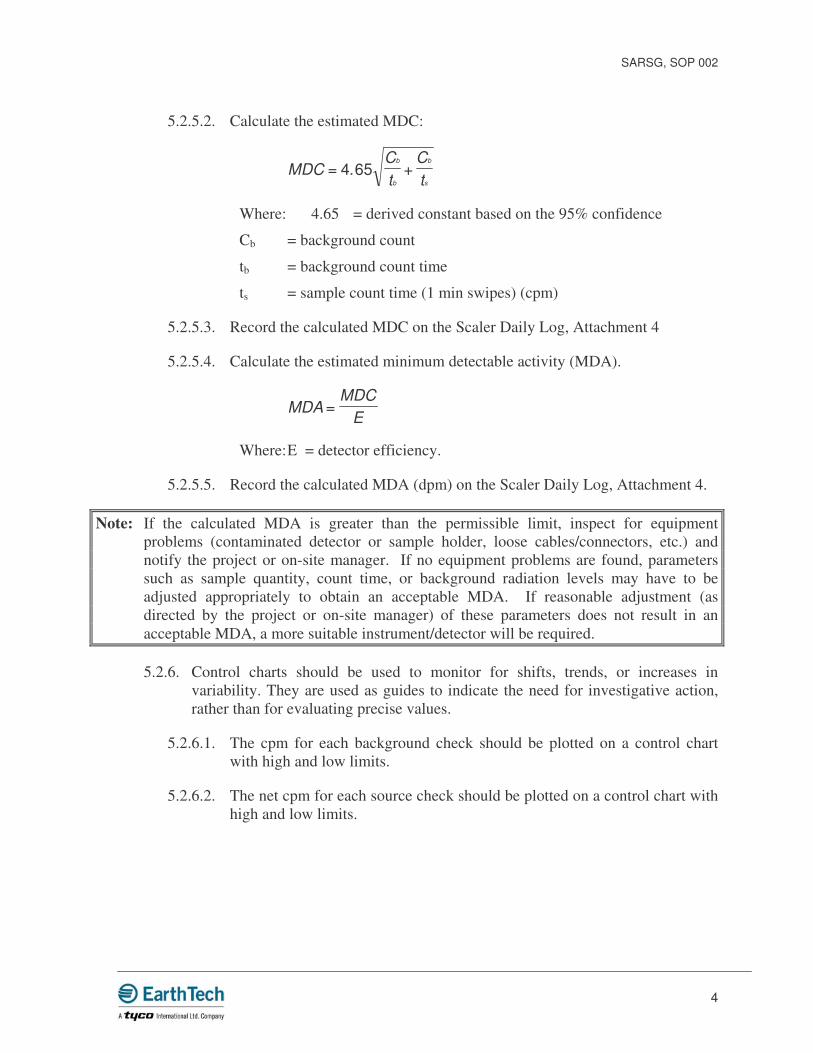
SARSG, SOP 002
4
5.2.5.2. Calculate the estimated MDC:
MDCCt
Ct
b
b
b
s
= +4 65.
Where: 4.65 = derived constant based on the 95% confidence
Cb = background count
tb = background count time
ts = sample count time (1 min swipes) (cpm)
5.2.5.3. Record the calculated MDC on the Scaler Daily Log, Attachment 4
5.2.5.4. Calculate the estimated minimum detectable activity (MDA).
MDAMDC
E=
Where: E = detector efficiency.
5.2.5.5. Record the calculated MDA (dpm) on the Scaler Daily Log, Attachment 4.
Note: If the calculated MDA is greater than the permissible limit, inspect for equipment problems (contaminated detector or sample holder, loose cables/connectors, etc.) and notify the project or on-site manager. If no equipment problems are found, parameters such as sample quantity, count time, or background radiation levels may have to be adjusted appropriately to obtain an acceptable MDA. If reasonable adjustment (as directed by the project or on-site manager) of these parameters does not result in an acceptable MDA, a more suitable instrument/detector will be required.
5.2.6. Control charts should be used to monitor for shifts, trends, or increases in variability. They are used as guides to indicate the need for investigative action, rather than for evaluating precise values.
5.2.6.1. The cpm for each background check should be plotted on a control chart with high and low limits.
5.2.6.2. The net cpm for each source check should be plotted on a control chart with high and low limits.
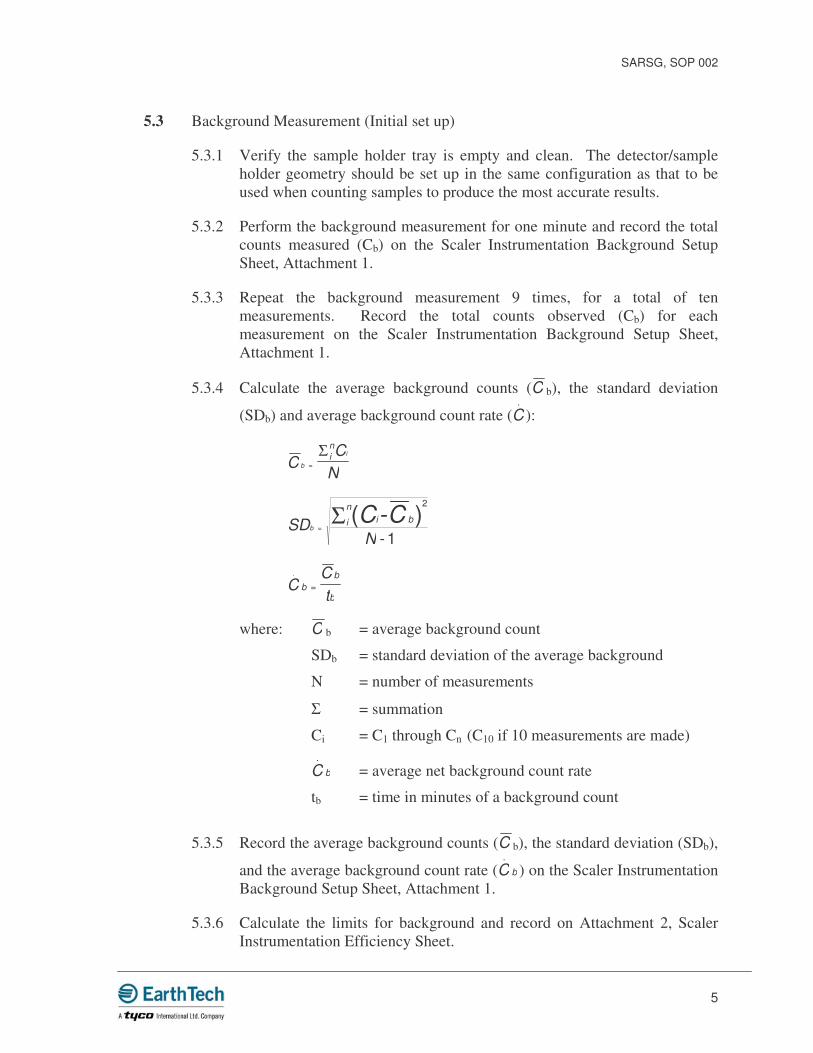
SARSG, SOP 002
5
5.3 Background Measurement (Initial set up)
5.3.1 Verify the sample holder tray is empty and clean. The detector/sample holder geometry should be set up in the same configuration as that to be used when counting samples to produce the most accurate results.
5.3.2 Perform the background measurement for one minute and record the total counts measured (Cb) on the Scaler Instrumentation Background Setup Sheet, Attachment 1.
5.3.3 Repeat the background measurement 9 times, for a total of ten measurements. Record the total counts observed (Cb) for each measurement on the Scaler Instrumentation Background Setup Sheet, Attachment 1.
5.3.4 Calculate the average background counts (C b), the standard deviation
(SDb) and average background count rate (C.
):
CC
Nb
iin
=
Σ
SDN
bi
ni bC C
=--
Σ2
1( )
CCt
bb
b
.
=
where: C b = average background count
SDb = standard deviation of the average background
N = number of measurements
Σ = summation
Ci = C1 through Cn (C10 if 10 measurements are made)
C b
.
= average net background count rate
tb = time in minutes of a background count
5.3.5 Record the average background counts (C b), the standard deviation (SDb),
and the average background count rate (C b
.
) on the Scaler Instrumentation Background Setup Sheet, Attachment 1.
5.3.6 Calculate the limits for background and record on Attachment 2, Scaler Instrumentation Efficiency Sheet.
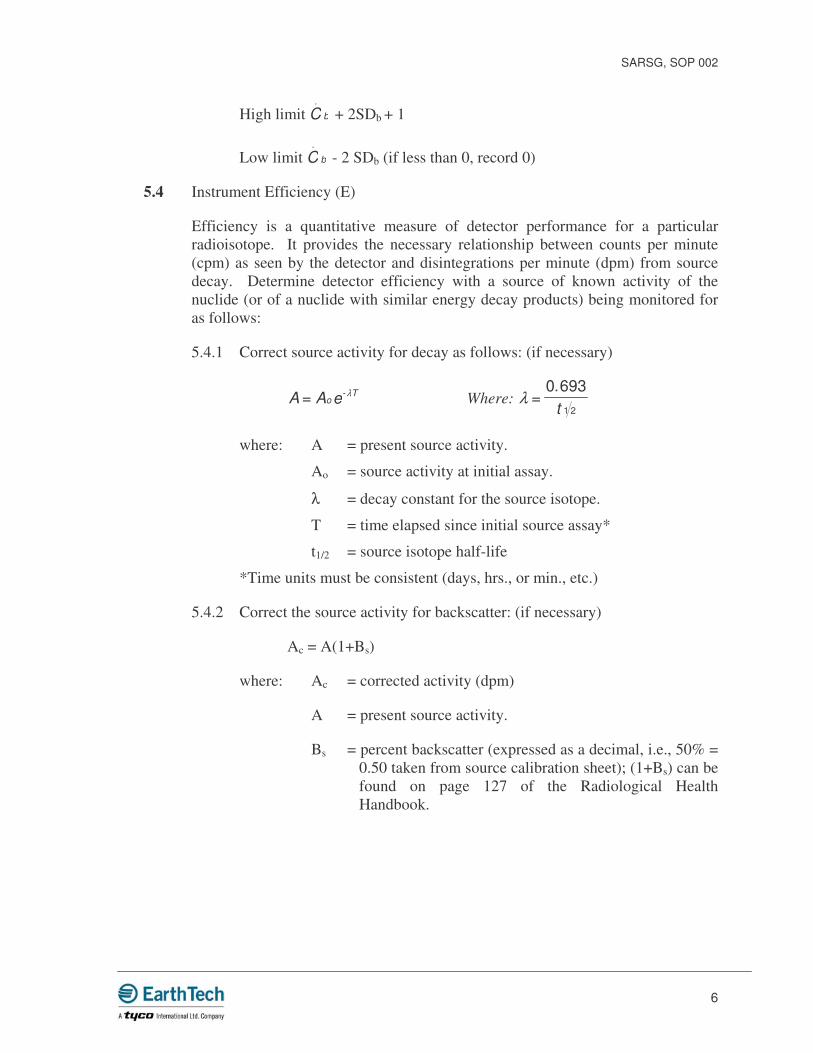
SARSG, SOP 002
6
High limit C b
.
+ 2SDb + 1
Low limit C b
.
- 2 SDb (if less than 0, record 0)
5.4 Instrument Efficiency (E)
Efficiency is a quantitative measure of detector performance for a particular radioisotope. It provides the necessary relationship between counts per minute (cpm) as seen by the detector and disintegrations per minute (dpm) from source decay. Determine detector efficiency with a source of known activity of the nuclide (or of a nuclide with similar energy decay products) being monitored for as follows:
5.4.1 Correct source activity for decay as follows: (if necessary)
A A eoT= -λ Where: λ =
0 6931 2
.t
where: A = present source activity.
Ao = source activity at initial assay.
λ = decay constant for the source isotope.
T = time elapsed since initial source assay*
t1/2 = source isotope half-life
*Time units must be consistent (days, hrs., or min., etc.)
5.4.2 Correct the source activity for backscatter: (if necessary)
Ac = A(1+Bs)
where: Ac = corrected activity (dpm)
A = present source activity.
Bs = percent backscatter (expressed as a decimal, i.e., 50% = 0.50 taken from source calibration sheet); (1+Bs) can be found on page 127 of the Radiological Health Handbook.
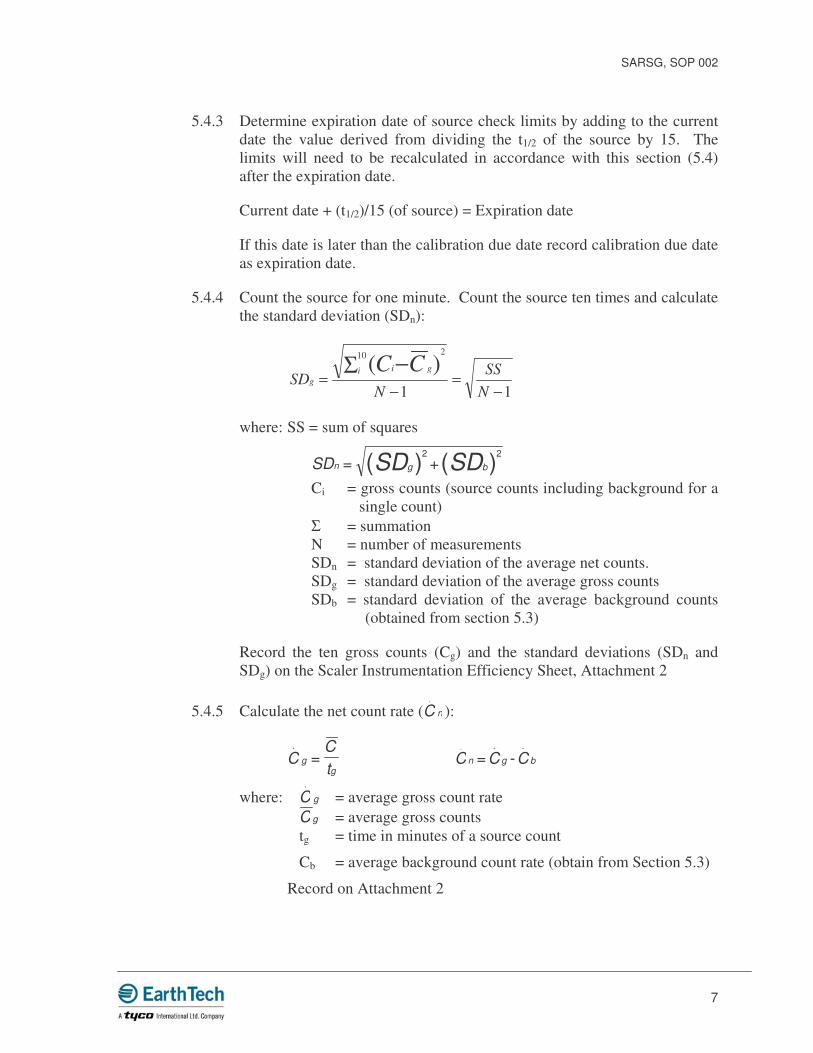
SARSG, SOP 002
7
5.4.3 Determine expiration date of source check limits by adding to the current date the value derived from dividing the t1/2 of the source by 15. The limits will need to be recalculated in accordance with this section (5.4) after the expiration date.
Current date + (t1/2)/15 (of source) = Expiration date
If this date is later than the calibration due date record calibration due date as expiration date.
5.4.4 Count the source for one minute. Count the source ten times and calculate the standard deviation (SDn):
11
)(210
−=
−=
−ΣNSS
NSD
giig
CC
where: SS = sum of squares
SDn g bSD SD= +2 2( ) ( )
Ci = gross counts (source counts including background for a single count)
Σ = summation N = number of measurements SDn = standard deviation of the average net counts. SDg = standard deviation of the average gross counts SDb = standard deviation of the average background counts
(obtained from section 5.3)
Record the ten gross counts (Cg) and the standard deviations (SDn and SDg) on the Scaler Instrumentation Efficiency Sheet, Attachment 2
5.4.5 Calculate the net count rate (C n.
):
CCt
gg
.
= C C Cn g b. . .
= -
where: C g
.
= average gross count rate C g = average gross counts tg = time in minutes of a source count
Cb = average background count rate (obtain from Section 5.3)
Record on Attachment 2
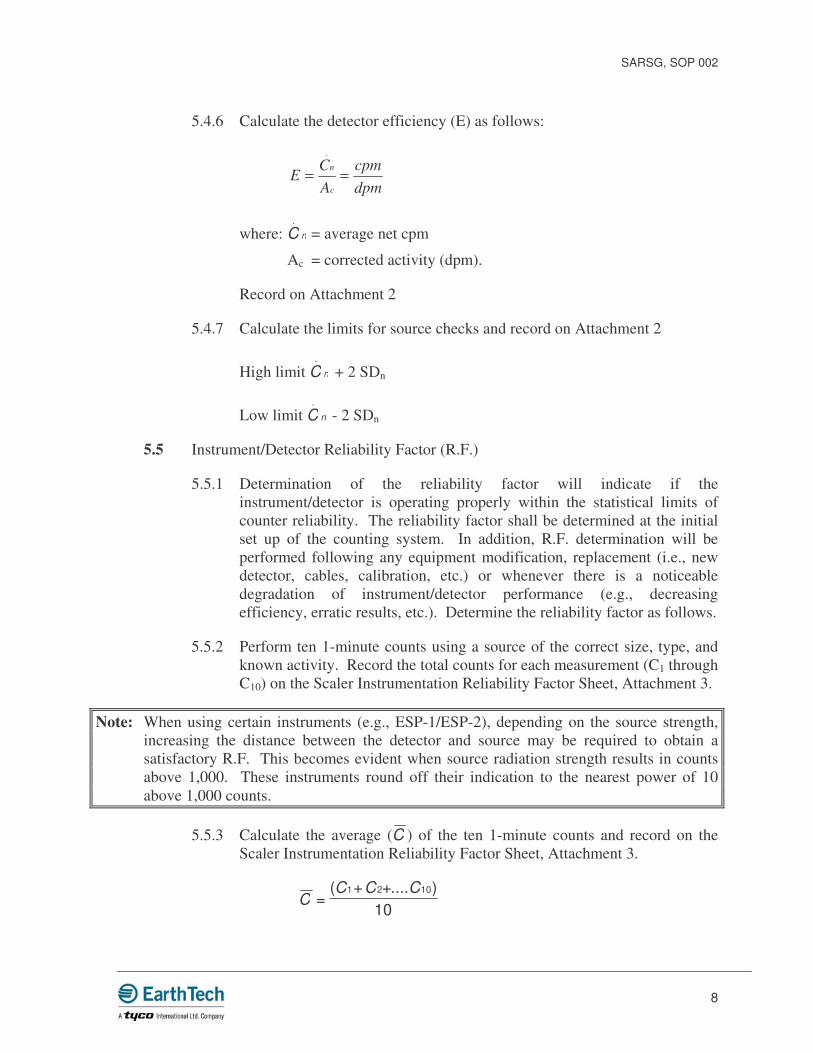
SARSG, SOP 002
8
5.4.6 Calculate the detector efficiency (E) as follows:
dpmcpm
AC
Ec
n ==.
where: C n
.
= average net cpm
Ac = corrected activity (dpm).
Record on Attachment 2
5.4.7 Calculate the limits for source checks and record on Attachment 2
High limit C n
.
+ 2 SDn
Low limit C n
.
- 2 SDn
5.5 Instrument/Detector Reliability Factor (R.F.)
5.5.1 Determination of the reliability factor will indicate if the instrument/detector is operating properly within the statistical limits of counter reliability. The reliability factor shall be determined at the initial set up of the counting system. In addition, R.F. determination will be performed following any equipment modification, replacement (i.e., new detector, cables, calibration, etc.) or whenever there is a noticeable degradation of instrument/detector performance (e.g., decreasing efficiency, erratic results, etc.). Determine the reliability factor as follows.
5.5.2 Perform ten 1-minute counts using a source of the correct size, type, and known activity. Record the total counts for each measurement (C1 through C10) on the Scaler Instrumentation Reliability Factor Sheet, Attachment 3.
Note: When using certain instruments (e.g., ESP-1/ESP-2), depending on the source strength, increasing the distance between the detector and source may be required to obtain a satisfactory R.F. This becomes evident when source radiation strength results in counts above 1,000. These instruments round off their indication to the nearest power of 10 above 1,000 counts.
5.5.3 Calculate the average (C ) of the ten 1-minute counts and record on the Scaler Instrumentation Reliability Factor Sheet, Attachment 3.
CC C C
=+ +( .... )1 2 10
10
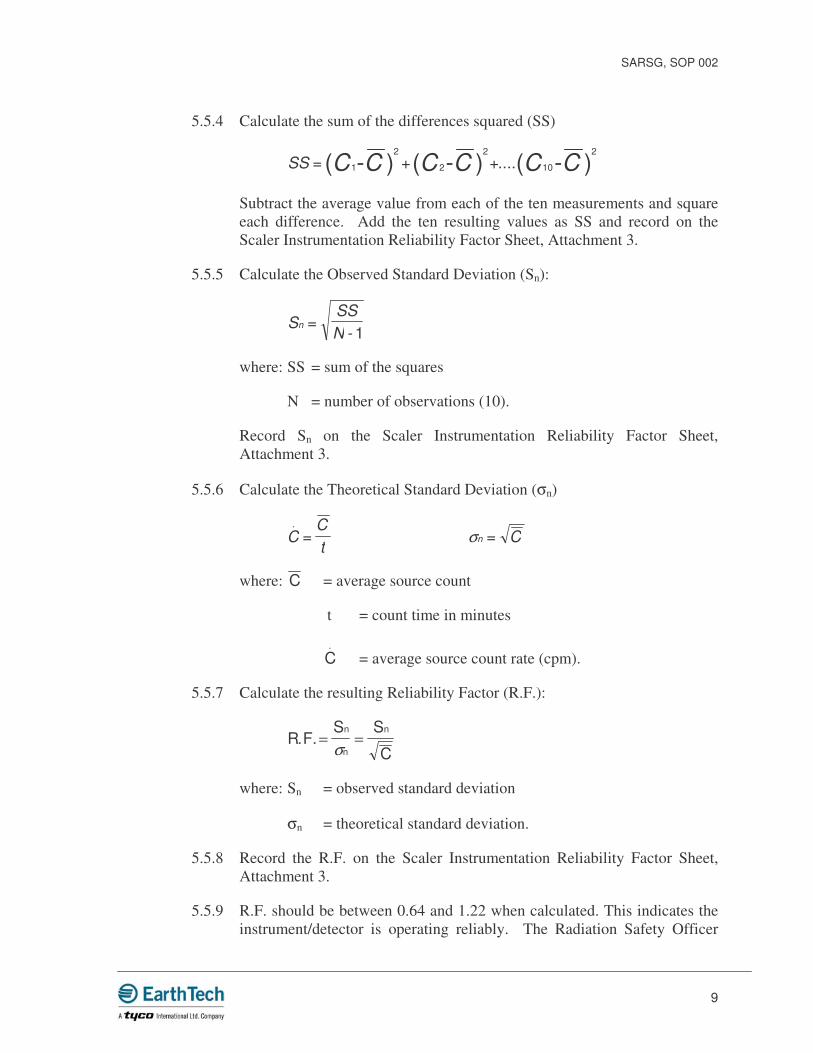
SARSG, SOP 002
9
5.5.4 Calculate the sum of the differences squared (SS)
SS C C C C C C= + +- - -2
1
2
2
2
10( ) ( ) ( )....
Subtract the average value from each of the ten measurements and square each difference. Add the ten resulting values as SS and record on the Scaler Instrumentation Reliability Factor Sheet, Attachment 3.
5.5.5 Calculate the Observed Standard Deviation (Sn):
SSSN
n =-1
where: SS = sum of the squares
N = number of observations (10).
Record Sn on the Scaler Instrumentation Reliability Factor Sheet, Attachment 3.
5.5.6 Calculate the Theoretical Standard Deviation (σn)
CCt
.
= σn C=
where: C = average source count
t = count time in minutes
C.
= average source count rate (cpm).
5.5.7 Calculate the resulting Reliability Factor (R.F.):
R FS S
C
n
n
n. . = =
σ
where: Sn = observed standard deviation
σn = theoretical standard deviation.
5.5.8 Record the R.F. on the Scaler Instrumentation Reliability Factor Sheet, Attachment 3.
5.5.9 R.F. should be between 0.64 and 1.22 when calculated. This indicates the instrument/detector is operating reliably. The Radiation Safety Officer
SARSG, SOP 002
10
shall investigate an R.F. that falls between 0.50 and 0.64 or 1.22 and 1.40. An R.F. less than 0.50 or greater than 1.40 is unsatisfactory.
5.6 High Voltage Plateau (HVP)
The high voltage plateau is performed during instrument calibration and should not be required under normal conditions. However, following equipment modification, replacement (i.e., new detector, power supply, etc.) or whenever there is a noticeable degradation of instrument/detector performance (e.g., decreasing efficiency, erratic results, etc.) an HVP shall be performed. Unless a more specific procedure is in the Manufacturer's Technical Manual, the following general procedure shall be used to determine the HVP. Plot and record the HVP data on the High Voltage Plateau Data Sheet, Attachment 5 and graph.
5.6.1 Check to see that the power switch to the system is off and that the high voltage controls are set to zero or the lowest setting.
5.6.2 Turn the main power and HV switches ON.
5.6.3 Insert an appropriate alpha, beta, or gamma source in the sample counting position.
5.6.4 Set the timer to ten minutes and slowly increase the HV potentiometer until counts register on the scaler. This is the counting threshold.
5.6.5 Starting at the nearest even voltage increment mark, above the counting threshold, take 1 - 2 minute counts every 50 - 100 volt increments until the count rate starts to increase again.
5.6.6 For each data point plot, on graph paper, total counts (or count rate) versus HV setting to determine the HVP. Draw a smooth curve through the data points. A region should be reached that results in very little change in count rate with each successive change in HV. This is the HVP.
5.6.7 Repeat the above procedure without a source in the sample holder. Plot the data on the same graph paper that the source data was plotted on.
5.6.8 The operating HV should be chosen to be the mid-range of the source plateau, but not on the exponentially increasing part of the background curve. The operating HV is chosen to optimize MDA, efficiency, and stability.
5.6.9 Perform the HV check in accordance with Section 5.1.4.
5.7 Counting with Scaler Instruments
The scaler instruments may be used for a variety of different sample media.
SARSG, SOP 002
11
5.7.1 Loose Contamination (Swipe) Samples.
Swipe samples may be counted for alpha and beta-gamma activity for a one-minute count.
5.7.2 Calculate activity as follows:
DPMCPM corrected
efficiency=
*
*CPM corrected = CPM sample - CPM Background
Example: A swipe is counted on a probe with 10% efficiency (in cpm/dpm) and results in 10 counts per minute above background:
DPM = =10
0 10100
CCPM DPM
.
5.7.3 Information shall be recorded on a miscellaneous survey form.
6.0 ACTION LEVELS
In reviewing the instrument/detector performance records, the project manager and/or on-site manger should be notified when the following observations indicate detection problems.
6.1. Background drift in a continuous direction either up or down.
6.2. Alpha background greater than 0.5 counts per minute.
6.3. A calculated MDA 50% in excess of limits.
6.4. An instrument does not zero.
6.5. Battery check that does not respond.
6.6. Reliability factors greater than 1.40 or less than 0.50.
6.7. Failure to indicate response on scaler during a response check.
7.0 RECORDS
7.1. Scaler Instrumentation Background Set-up Sheet, Attachment 1.
7.2. Scaler Instrumentation Efficiency Sheet, Attachment 2.
7.3. Scaler Instrumentation Reliability Factor Check Sheet, Attachment 3.
SARSG, SOP 002
12
7.4. Scaler Daily Log Sheet, Attachment 4.
7.5. High Voltage Plateau Data Sheet, Attachment 5.
8.0 REFERENCES
8.1 Nuclear Radiation Detection, second edition, McGraw-HiIl Book Company: New York, New York, 1964.
8.2 Technical manuals
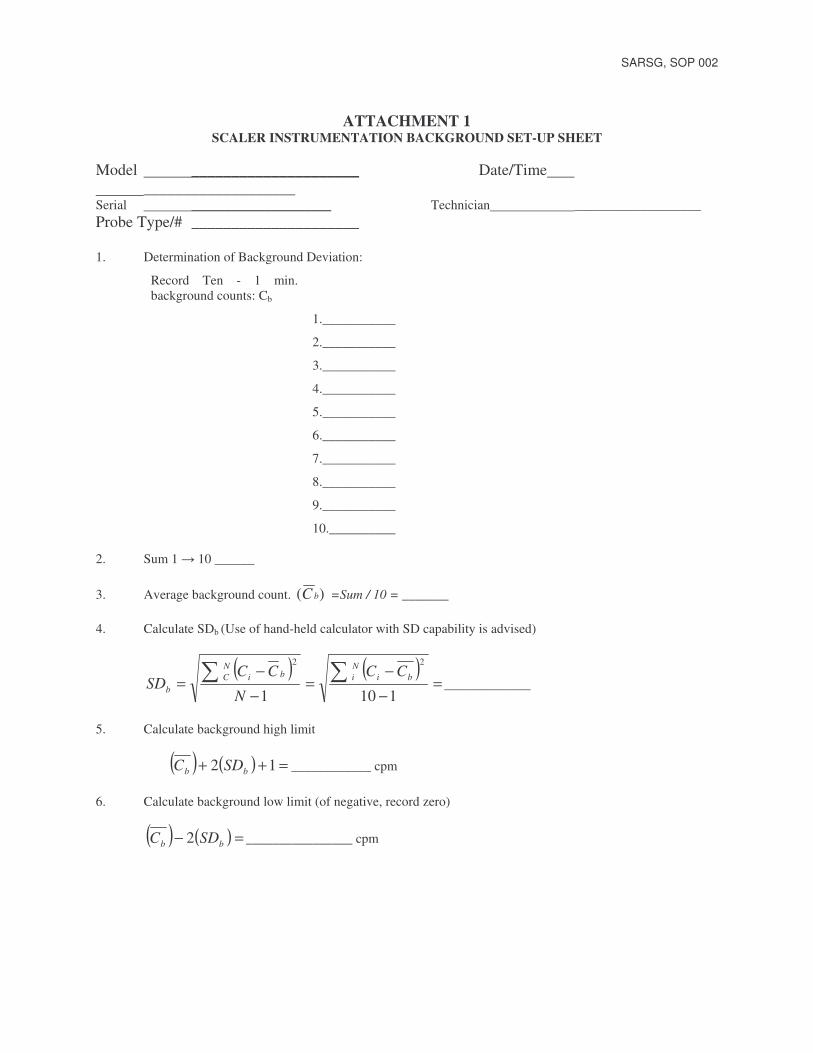
SARSG, SOP 002
ATTACHMENT 1 SCALER INSTRUMENTATION BACKGROUND SET-UP SHEET
Model _____________________ Date/Time ___________________ Serial _____________________ Technician ___________________ Probe Type/# _____________________ 1. Determination of Background Deviation:
Record Ten - 1 min. background counts: Cb
1.___________
2.___________
3.___________
4.___________
5.___________
6.___________
7.___________
8.___________
9.___________
10.__________ 2. Sum 1 � 10 ______
3. Average background count. )( bC =Sum / 10 = _______ 4. Calculate SDb (Use of hand-held calculator with SD capability is advised)
( ) ( )=
−−
=−−
= ��1101
22
biNibi
NC
b
CC
N
CCSD _____________
5. Calculate background high limit
( ) ( ) =++ 12 bb SDC ____________ cpm
6. Calculate background low limit (of negative, record zero)
( ) ( ) =− bb SDC 2 ________________ cpm
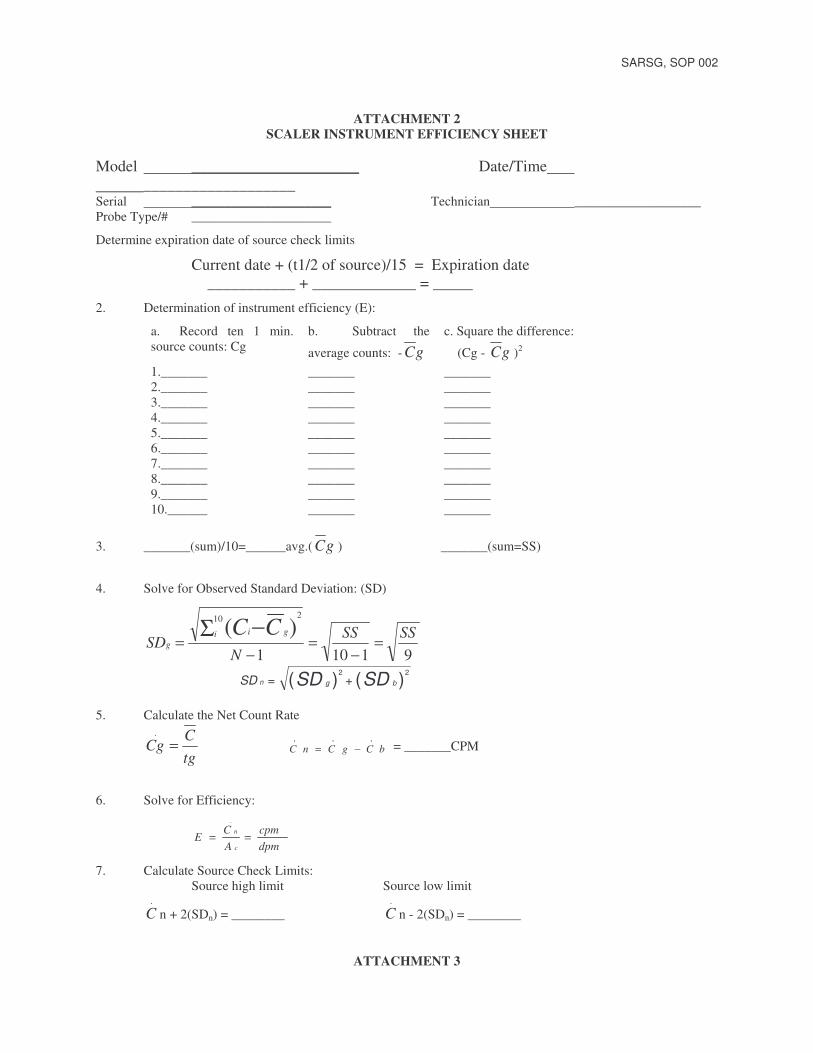
SARSG, SOP 002
ATTACHMENT 2
SCALER INSTRUMENT EFFICIENCY SHEET Model _____________________ Date/Time ___________________ Serial _____________________ Technician ___________________ Probe Type/# _____________________
Determine expiration date of source check limits
Current date + (t1/2 of source)/15 = Expiration date ___________ + _____________ = _____
2. Determination of instrument efficiency (E):
a. Record ten 1 min. source counts: Cg
b. Subtract the
average counts: - gC
c. Square the difference:
(Cg - gC )2 1._______ _______ _______ 2._______ _______ _______ 3._______ _______ _______ 4._______ _______ _______ 5._______ _______ _______ 6._______ _______ _______ 7._______ _______ _______ 8._______ _______ _______ 9._______ _______ _______ 10.______ _______ _______
3. _______(sum)/10=______avg.( gC ) _______(sum=SS)
4. Solve for Observed Standard Deviation: (SD)
91101
)(210
SSSSN
SDgii
gCC
=−
=−
=−Σ
SD n g bSD SD= +2 2( ) ( )
5. Calculate the Net Count Rate
tgC
Cg =.
bCgCnC...
−= = _______CPM
6. Solve for Efficiency:
dpmcpm
AC
Ec
n ==.
7. Calculate Source Check Limits: Source high limit Source low limit
.
C n + 2(SDn) = ________ .
C n - 2(SDn) = ________
ATTACHMENT 3
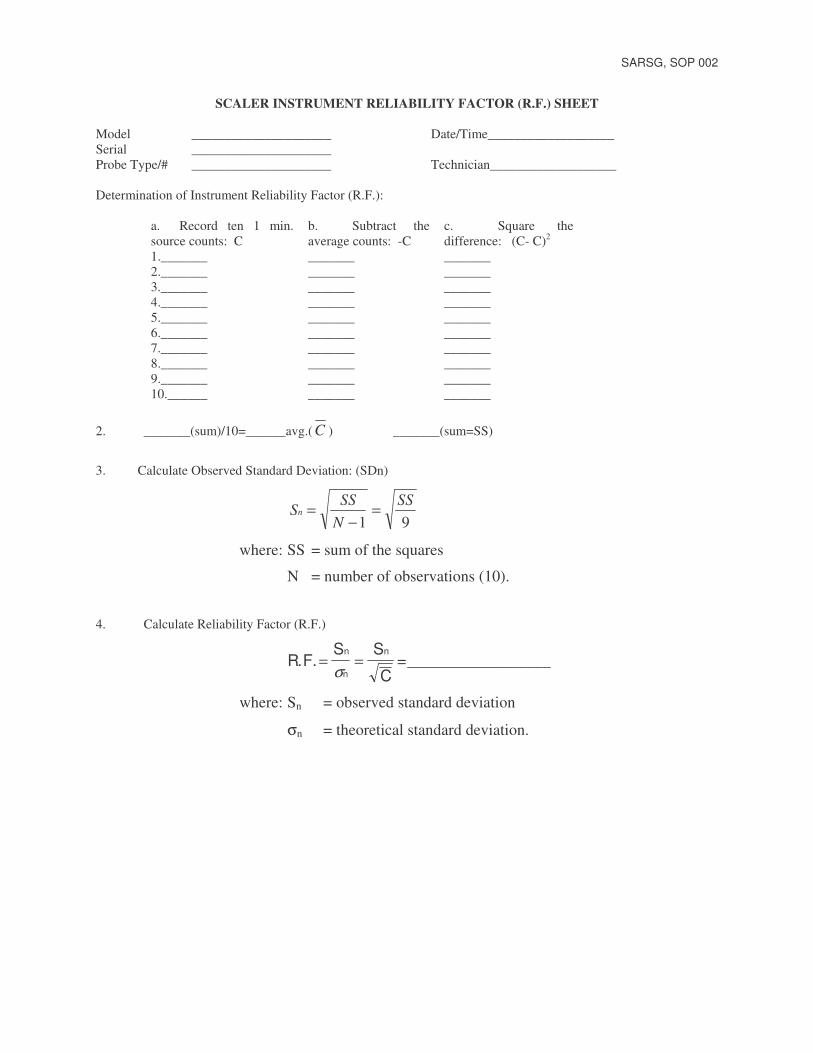
SARSG, SOP 002
SCALER INSTRUMENT RELIABILITY FACTOR (R.F.) SHEET Model _____________________ Date/Time___________________ Serial _____________________ Probe Type/# _____________________ Technician___________________ Determination of Instrument Reliability Factor (R.F.):
a. Record ten 1 min. source counts: C
b. Subtract the average counts: -C
c. Square the difference: (C- C)2
1._______ _______ _______ 2._______ _______ _______ 3._______ _______ _______ 4._______ _______ _______ 5._______ _______ _______ 6._______ _______ _______ 7._______ _______ _______ 8._______ _______ _______ 9._______ _______ _______ 10.______ _______ _______
2. _______(sum)/10=______avg.( C ) _______(sum=SS)
3. Calculate Observed Standard Deviation: (SDn)
91SS
NSS
Sn =−
=
where: SS = sum of the squares
N = number of observations (10).
4. Calculate Reliability Factor (R.F.)
R FS S
C
n
n
n. .= =
σ=__________________
where: Sn = observed standard deviation
σn = theoretical standard deviation.
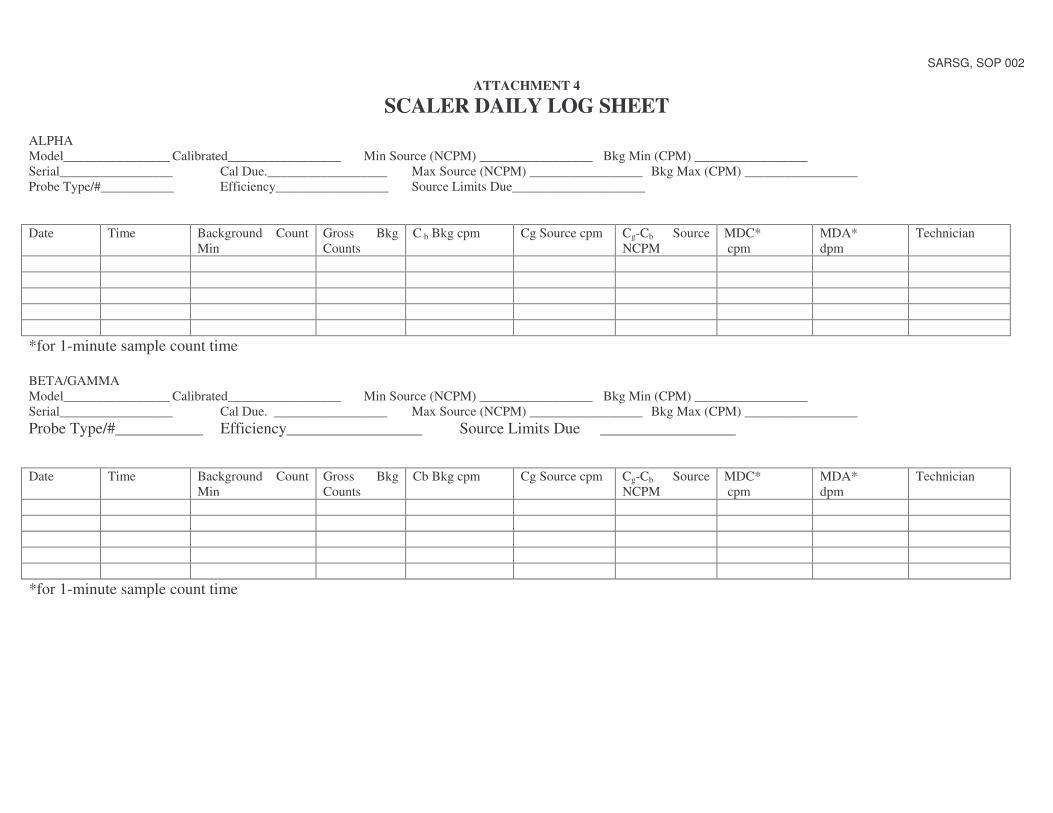
SARSG, SOP 002
ATTACHMENT 4
SCALER DAILY LOG SHEET ALPHA Model________________ Calibrated_________________ Min Source (NCPM) _________________ Bkg Min (CPM) _________________ Serial_________________ Cal Due.__________________ Max Source (NCPM) _________________ Bkg Max (CPM) _________________ Probe Type/#___________ Efficiency_________________ Source Limits Due____________________ Date Time Background Count
Min Gross Bkg Counts
C b Bkg cpm Cg Source cpm Cg-Cb Source NCPM
MDC* cpm
MDA* dpm
Technician
*for 1-minute sample count time BETA/GAMMA Model________________ Calibrated_________________ Min Source (NCPM) _________________ Bkg Min (CPM) _________________ Serial_________________ Cal Due. _________________ Max Source (NCPM) _________________ Bkg Max (CPM) _________________ Probe Type/#___________ Efficiency_________________ Source Limits Due _________________ Date Time Background Count
Min Gross Bkg Counts
Cb Bkg cpm Cg Source cpm Cg-Cb Source NCPM
MDC* cpm
MDA* dpm
Technician
*for 1-minute sample count time
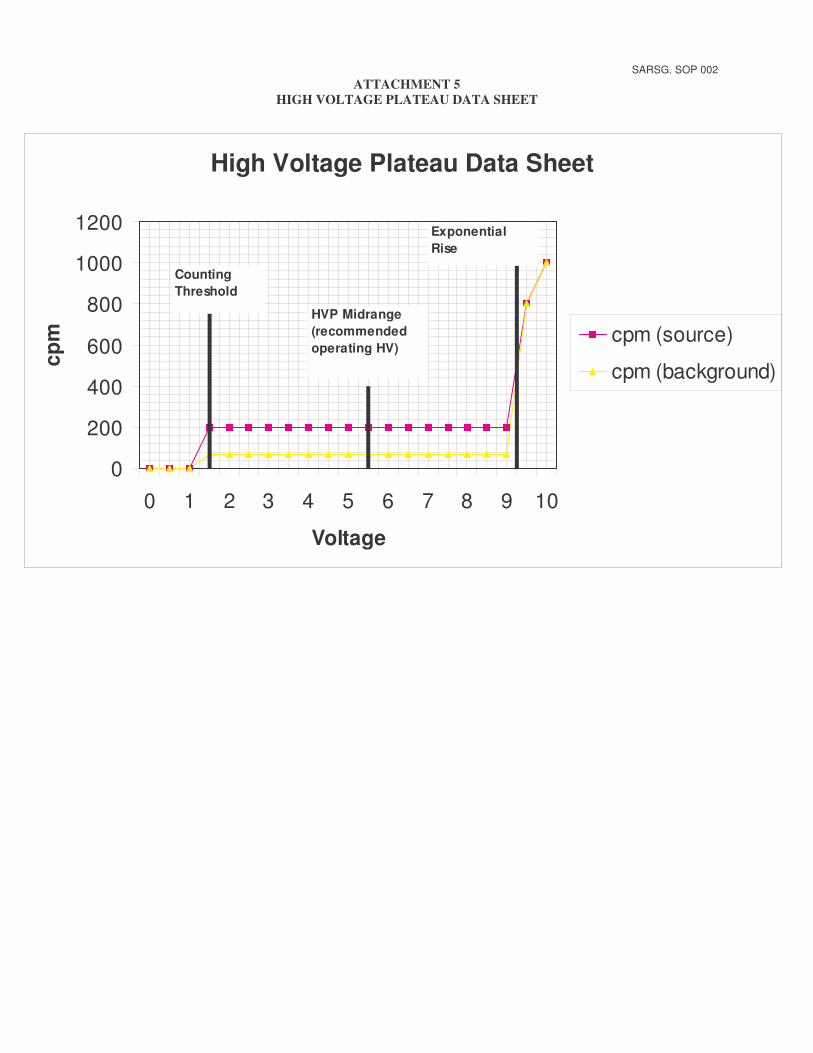
SARSG. SOP 002
ATTACHMENT 5 HIGH VOLTAGE PLATEAU DATA SHEET
High Voltage Plateau Data Sheet
0
200
400
600
800
1000
1200
0 1 2 3 4 5 6 7 8 9 10
Voltage
cpm cpm (source)
cpm (background)
CountingThreshold
ExponentialRise
HVP Midrange(recommended operating HV)
1�
The San Antonio Radiological Services Group (SARSG) is responsible for the issuance, revision, and maintenance of this policy. SARSG radiological protection procedures are designed to minimize the items that need to be decontaminated by only using the minimum items inside the radioactive control space. Any deviations from the procedures set forth in this policy require approval of the SARSG Leader. This SOP supersedes all previous SOPs on this topic.
1.0 PURPOSE
The purpose of this Standard Operating Procedure (SOP) is to establish the requirements for the decontamination of equipment, material, and tools that become contaminated with radioactive material.
2.0 SCOPE
This SOP identifies a decontamination methodology for equipment, materials and tools, and provides general decontamination techniques to be utilized by field personnel for all decontamination operations. This procedure applies to all employees involved in decontamination processes.
NOTE: Personnel decontamination is not covered in this SOP but shall be covered in project/task health and safety plans.
3.0 DEFINITIONS
3.1. Survey Area – Area where radioactive materials or contamination are or may be present. Survey areas include areas where samples or smears, potentially containing radiological material, are being screened.
3.2. Decontamination – The process whereby contamination can be safely and effectively
removed from equipment, tools, and materials. 3.3. MSDS – Material Safety Data Sheet; manufacturer directions, safety information, and
limitations for use of decontamination related solvents or cleaning solutions.
�
E q u i p m e n t D e c o n t a m i n a t i o n
PROCEDURE NO. SARSG, SOP 004
DATE: October 8, 2001
APPROVED: ______________________
SARSG Leader
EE aa rr tt hh TT ee cc hh SSttaannddaarrdd OOppeerraatt iinngg PPrroocceedduurree
SARSG. SOP 004
2
3.4. Radiation Work Permit (RWP) – A document approved by the Radiation Safety Officer (RSO). See SARSG SOP 020, Site Ionizing Radioactive Protection Plan for further information.
4.0 GENERAL REQUIREMENTS AND LIMITATIONS
4.1. Only qualified and trained personnel shall be allowed to decontaminate equipment. 4.2. All decontamination procedures shall be performed under the direction of the Project
RSO. 4.3. Decontamination activities shall be performed within a designated area. 4.4. Controls to contain the spread of loose contamination during the decontamination
activity shall be determined prior to the start of decontamination operations. 4.5. Personal protective clothing worn by the personnel involved in decontamination
activities shall be determined by the RSO and delineated in the RWP. 4.6. Decontamination solvents/solutions shall only be used in accordance with the
directions and limitations listed on the manufacturer supplied MSDS. Solvents/solutions requiring a pH adjustment shall be modified prior to use.
4.7. Every effort shall be made to avoid recontamination of clean equipment and
materials. Contamination controls shall always be observed throughout each decontamination operation.
5.0 RESPONSIBILITIES
5.1. Radiation Safety Officer (RSO)
5.1.1. Responsible for training the Health Physics Technicians in these procedures.
5.1.2. Establishing personal protective equipment requirements for performing the decontamination activities.
5.1.3. Approving RWPs.
5.2. Health Physics Technicians 5.2.1. Responsible for performing decontamination in accordance with this procedure
and applicable training. 5.2.2. Reporting unsafe or unusual conditions to the Site Safety Officer (SSO)/RSO.
SARSG. SOP 004
3
6.0 PROCEDURES
6.1. General
6.1.1 A radiological survey shall be performed on all equipment and materials, which are to be removed from the Radiation Control Area (RCA) that may be contaminated.
6.1.2 If a survey indicates that decontamination is required, the item shall be
completely decontaminated prior to release from the RCA.
6.2. Establishing a Decontamination Area
6.2.1. The RSO and Health Physics Technicians shall determine a location for establishing the decontamination area.
6.2.2. The following materials may be required for decontamination:
• Safe, sturdy work stations with contamination resistant surfaces;
• Adequate supply of approved cleaning solutions and solvents;
• Light duty decontamination equipment such as paper wipes, paper towels, etc.;
• Medium duty decontamination equipment such as scrub pads, wire brushes, steel wool, files, sandpaper, etc.;
• Radioactive material storage bags, stickers, etc.;
• Buckets, barrels or drums for the storage of contaminated liquids, sludge or slurries, if applicable;
• Blotter paper or absorbent material such as oil dry;
• Storage drums/bags for the storage of contaminated protective clothing;
• Adequate supply of personal protective clothing;
• Step-off pad or double step-off pad in accordance with the provisions of the RWP;
• A designated area within the decontamination area for the segregation and monitoring of radioactive waste.
• Plastic drop cloth (3-6 mil)
6.2.3. Once the decontamination area has been established and stocked for operation, the bagged or wrapped contaminated equipment can be placed in the decontamination work area.
SARSG. SOP 004
4
6.3. Decontamination
6.3.1. The preparation for decontaminating a particular tool, material, or piece of equipment should consider the following:
An item that is highly contaminated with removable contamination should be misted with an approved liquid. The water vapor will wet down the particulate contamination and help prevent the possibility of airborne contamination. Caution: Do not over wet the item to the point where the liquid drips from the item to be decontaminated.
6.3.2. General decontamination:
6.3.2.1. Any contaminated equipment with inaccessible areas shall be dismantled so that all surfaces are accessible for decontamination and for survey.
6.3.2.2. Decontamination shall be performed in a safe, effective manner.
6.3.3. Considerations for decontaminating items with removable contamination.
6.3.3.1. Moisten the surface of the item with an approved liquid 6.3.3.2. Fold a paper or cloth wipe into sections, using one surface of the wipe;
gently wipe contamination off in ONE direction AWAY from the body to reduce the possibility of personnel contamination.
6.3.3.3. Re-fold the paper or cloth wipe so that a CLEAN surface is available (this
should prevent cross-contamination) and continue until the item is ready for survey.
6.3.3.4. For some materials, duct tape will effectively remove contamination. Wrap
the duct tape loosely around the gloved hand, ADHESIVE side OUT. Roll the tape over the contaminated area.
6.3.4. Considerations for abrasive hand decontamination techniques.
6.3.4.1. Remove as much removable contamination as possible. 6.3.4.2. Moisten the surface of the item to be decontaminated. 6.3.4.3. Use an abrasive cleaning tool (e.g. sandpaper, steel wool, steel brush, etc.)
to loosen fixed contamination. Clean in one direction ONLY and clean AWAY from the body to prevent personnel contamination.
6.3.4.4. Continue to moisten the surface of the items to contain contamination. 6.3.4.5. Periodically remove as much removable contamination as possible. 6.3.4.6. Survey the surface to determine the effectiveness of the decontamination
process.
SARSG. SOP 004
5
6.3.4.7. Continue abrasive process until the item is decontaminated or three abrasive cycles have been attempted.
6.3.5. Items are to be scanned for radioactive contamination. If the readings are below
the baseline survey for the item, the item is considered to be decontaminated. 6.3.6. If contamination remains after attempting to decontaminate the item, contact the
Project RSO for further direction. 6.3.7. Items that cannot be effectively or economically decontaminated will either be
managed as radiological waste or sent to a decontamination vendor. 6.3.8. After all decontamination operations have been completed, survey the
decontamination area to ensure that no residual contamination remains.
6.4. Personnel Decontamination. Personnel decontamination methods shall be addressed in the Project/Task-Specific Health and Safety Plan
NOTE: NO WOUND SHALL BE DECONTAMINATED IN THE FIELD. MEDICAL ATTENTION MUST BE OBTAINED FOR DECONTAMINATING WOUNDS.
7.0 RECORDS. Record all decontamination operations into the field logbook.
��
Standard Operating Procedure
Documentation Control
PROCEDURE NO. SARSG SOP 005
DATE November 28, 2001
APPROVED ____________________________
SARSG Leader
Standard Operating Procedure DOCUMENTATION CONTROL
The San Antonio Radiological Services Group (SARSG) is responsible for the issuance, revision, and maintenance of this policy. Any deviations from the procedures set forth in this policy require approval of the SARSG Leader. This SOP supersedes SOP 005, August 7, 2001.
1 PURPOSE
The purpose of this Standard Operating Procedure (SOP) is to maintain proper control of information such as operational procedures, project reports, dose records, medical information, training records, and any additional records that may be required to demonstrate compliance with TDH license conditions. It is to be used in conjunction with the SARSG Radiological Quality Assurance and Quality Control Program.
2 SCOPE
This procedure identifies document control methods associated with license requirements, projects, personnel, and equipment. Adherence to this procedure shall provide reasonable assurance that information will be retrievable. All personnel are responsible to use good judgement in document control.
3 RESPONSIBILITIES
3.1 Program Manager. The Program Manager is responsible for:
3.3.1 Providing equipment to enable compliance with this procedure.
3.3.2 Assigning qualified personnel to the project who are responsible for the
tasks of producing, validating, transferring, or controlling information for the project and who are familiar with this procedure.
3.3.3 Training all personnel in the use of this procedure and allowing
personnel access to a copy of this procedure.
SARSG. SOP 005
2 ��
3.2 Project Manager The Project Manager (PM) is responsible for the collection of and the correct recording of the project documentation in accordance with the Project Work Plan. The PM is responsible for document control of all project related quality information throughout the complete project. This responsibility can be carried out through continuous evaluation of the project.
3.3 Radiation Safety Officer (RSO) The RSO shall establish procedures to record and evaluate all radiation safety
information and to verify that adequate documentation is maintained that support the Radiation Safety Program.
3.4 Quality Assurance Coordinator (QAC) The QAC shall verify that documents are issued, maintained, stored, and
transferred in accordance with this procedure. Any deviation from the requirements shall be reported immediately to the PM following the procedures delineated in the SARSG Quality Assurance/Quality Control Program.
3.5 Health Physics Technicians and Other Field Personnel Health Physics Technicians and other field personnel shall record documentation neatly and in accordance with these and work plan procedures and requirements.
4 GENERAL REQUIREMENTS AND LIMITATIONS
4.1 Controlled Records
The following not all inclusive list of records shall be controlled:
4.1.1 Instrument Calibration Records
4.1.2 Instrument Source Check Records
4.1.3 Radiation Survey Forms
4.1.4 Medical Information
4.1.5 Training Records
4.1.6 Dosimetry Records
4.1.7 Project Field Logs
4.1.8 Project Reports
SARSG. SOP 005
3 ��
4.1.9 Radioactive Material Transportation Records
4.1.10 Radioactive Material Disposal Records
4.1.11 Radioactive Source Transfer Receipts
4.1.12 Sample Collection Forms
4.1.13 Sample Chain of Custody Records
4.1.14 Emergency Response Documentation
4.1.15 Document Distribution and Transmittal Forms
4.1.16 Respirator Issue Logs and History Records
4.1.17 Bioassay Records
4.1.18 Personnel and Equipment Contamination and Decontamination Reports
4.2 Quality Control
4.2.1 The project manager shall verify that quality records are accurate, neatly and properly prepared, properly maintained, and periodically reviewed during the project.
4.2.2 The project manager shall verify that all records are present at the end of the project and that records are safely maintained during transfer or shipment to the archival location.
4.2.3 The QAC or delegated representative shall assess the status of controlled documents, at least semi-annually, and document the findings to the program manager. Periodic no notice audits may be used in support of this program.
5 PROCEDURES
5.1 Records Preparations
Records shall be prepared in dark ink and shall be neat and easily readable. Pre-prepared forms shall be used when available to collect information such as survey data or instrument analysis results. When a procedure has not defined a form for a specific purpose, the project manager may authorize creation of the method of documentation.
SARSG. SOP 005
4 ��
5.2 Record Review
The PM shall review all controlled records. Full signature and date of review on the record shall document this review.
5.3 Record Correction
The document creator shall correct incorrect information in records if possible. In cases where the creator is not available, the project or site managers may make corrections.
Corrections shall be made by drawing a single line through the error and making the correction adjacent to the error. The line out shall be initialed and dated by the corrector.
5.4 Record Retention
Records shall be retained at the site for the duration of the project.
5.4.1 Upon return to the location of record management, the records shall be maintained so they are protected from loss or damage. Record storage shall be in accordance with federal regulations or TDH license conditions. This may be dual storage: one copy at both facilities or storage in a certified fireproof container.
5.4.2 Records shall be retained for a minimum of 10 years from the date of creation, for the duration specified in the contract, which caused the creation of the project, or in accordance with Federal or State regulations where applicable.
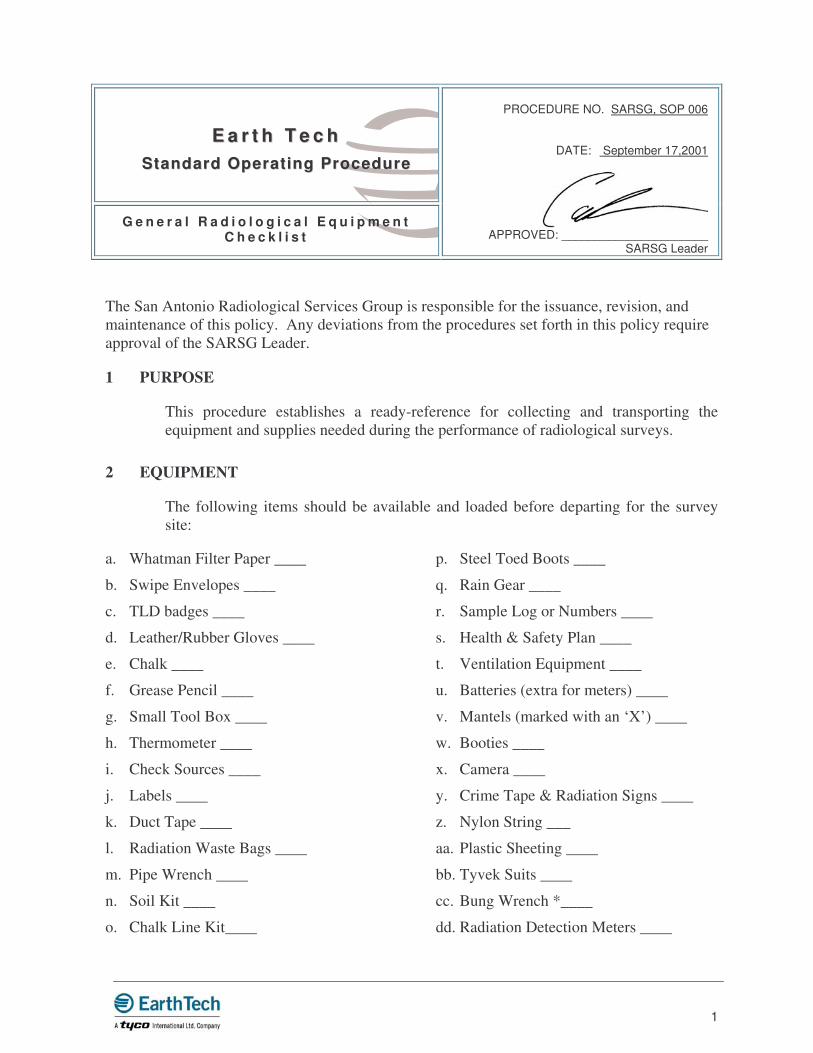
1
The San Antonio Radiological Services Group is responsible for the issuance, revision, and maintenance of this policy. Any deviations from the procedures set forth in this policy require approval of the SARSG Leader.
1 PURPOSE
This procedure establishes a ready-reference for collecting and transporting the equipment and supplies needed during the performance of radiological surveys.
2 EQUIPMENT
The following items should be available and loaded before departing for the survey site:
a. Whatman Filter Paper ____
b. Swipe Envelopes ____
c. TLD badges ____
d. Leather/Rubber Gloves ____
e. Chalk ____
f. Grease Pencil ____
g. Small Tool Box ____
h. Thermometer ____
i. Check Sources ____
j. Labels ____
k. Duct Tape ____
l. Radiation Waste Bags ____
m. Pipe Wrench ____
n. Soil Kit ____
o. Chalk Line Kit____
p. Steel Toed Boots ____
q. Rain Gear ____
r. Sample Log or Numbers ____
s. Health & Safety Plan ____
t. Ventilation Equipment ____
u. Batteries (extra for meters) ____
v. Mantels (marked with an ‘X’) ____
w. Booties ____
x. Camera ____
y. Crime Tape & Radiation Signs ____
z. Nylon String ___
aa. Plastic Sheeting ____
bb. Tyvek Suits ____
cc. Bung Wrench *____
dd. Radiation Detection Meters ____
�
G e n e r a l R a d i o l o g i c a l E q u i p m e n t C h e c k l i s t
PROCEDURE NO. SARSG, SOP 006
DATE: September 17,2001
APPROVED: ______________________
SARSG Leader
EE aa rr tt hh TT ee cc hh SSttaannddaarrdd OOppeerraatt iinngg PPrroocceedduurree
SARSG. SOP 006
2
ee. Administrative supplies: Pens, paper, clipboard, grease pencils, white drum markers, permanent makers ____
ff. Step-off Pads ____
gg. Communication Devices ____
hh. P-10 Gas (extra) ____
ii. Coolers ____
jj. Flashlight ____
kk. Sample Containers ____
ll. Sampling Equipment (shovels, picks, etc.) ____
mm. Coveralls ____
nn. Decon Equipment/Supplies ____
oo. Training Folders ____
pp. Field Notebook ____
qq. References (MARSSIM, etc.) ____
rr. Emergency Telephone Numbers ____
ss. Personal Protective Equipment____
tt. QAPP ____
uu. Work Plan ____
vv. Cell Phones ____
3 Before departing for the job site verify the following tasks have been accomplished:
a. Instruments have been source checked: __________
b. Swipe paper has been marked: __________
c. Detection meters have been packed so as to avoid damage while in transport: _________
* NOTE: Use caution when opening waste drums. If drums or containers are leaking or bulging, notify the Site Manager/RSO.
1�
The San Antonio Radiological Services Group (SARSG) is responsible for the issuance, revision, and maintenance of this policy. Any deviations from the procedures set forth in this policy require approval of the SARSG Leader.
1 PURPOSE
The purpose of this procedure provides instruction for establishing a reference grid system and performing radiological surveys for the established grids.
2 EQUIPMENT
Instrumentation shall be selected to accomplish the type of survey to be performed. All instrumentation shall be approved for use by a SARSG Certified Health Physicist (CHP) or Radiation Safety Officer (RSO). The following are examples of the instruments that can be used.
2.1 Dose rate instruments such as a Ludlum Model 19.
2.2 Count rate meters with air proportional probes or alpha scintillation detectors for alpha contamination detection.
2.3 Ludlum Model 2929 with a thin window Zinc Sulfide Scintillator detector for the swipes.
2.4 Crayons, permanent marker, or other markings devices depending on the type of surface to be marked.
2.5 The Ludlum Model 2221 Scaler with/239-1F detector shall be utilized to characterize flooring. The Model 2221 is battery capable and shall be mounted on a cart with a P-10 gas supply for easy handling and overall equipment protection.
�
G r i d S y s t e m s & S u r v e y s
PROCEDURE NO. SARSG, SOP 007
DATE: October 8, 2001
APPROVED: ______________________
SARSG Leader
EE aa rr tt hh TT ee cc hh SSttaannddaarrdd OOppeerraatt iinngg PPrroocceedduurree
SARSG. SOP 007
2
3 PRECAUTIONS Pre-operational checks shall be performed on all instruments prior to use to verify the following requirements:
3.1 The instrument has been pre/post source checked for the day.
3.2 The instrument has been calibrated within the past 12 months.
3.3 The battery check is satisfactory (for portable instrumentation).
3.4 Overall physical condition of the instrument is satisfactory.
3.5 The instrument manufacturers specific operational checks have been accomplished.
4 PROCEDURE
4.1 Establishing Interior Grids
4.1.1 Each interior building, (rooms, walls and hallways) shall be gridded prior to starting the instrument survey.
4.1.2 Each interior 3m x 3m grid area or 1m x 1m grid area, dependent on the CHP/RSO, shall be based on an alphanumeric numbering system.
4.1.3 Each gridded area shall begin in the northwest corner. The northwest grid corner shall be labeled as A1. Each subsequent grid to the east of that grid shall be labeled A2, A3, A4, etc. Each subsequent grid to the south of that grid shall be labeled B1, C1, D1, etc.
4.1.4 A variety of materials may be used to mark grids, including chalk lines, paint, labels, tags, etc. Uniformity and reproducibility of results shall drive material selection
4.2 Surveying Interior Floor Grids
4.2.1 All Interior grids classed as potentially contaminated shall be surveyed.
4.2.2 Interior grids classed as potentially uncontaminated shall have at least 10% of grids surveyed. Survey grids shall be selected based on areas of high probability for contamination.
4.2.3 Use Radiological Survey Report, Attachment 1 to SARSG SOP-011, to document the survey readings.
Note: There is an area for comments on the survey form. Surveying personnel are encouraged to check and comment on suspicious areas within the survey grid. Mark the areas on grid to correspond with comments.
SARSG. SOP 007
3
4.3 Establishing Interior Wall Grids
4.3.1 Walls shall be identified as North, South, East, and West.
4.3.2 Walls shall be drawn on miscellaneous survey maps. Wall dimensions and descriptive material or equipment shall be indicated on map, to the extent it would aid in survey reproducibility
4.3.3 Potentially contaminated walls shall be marked with survey locations at one meter points, vertically corresponding to floor grids.
4.3.4 Survey locations shall be marked with paint, labels, tags or other methods to provide reproducibility.
4.3.5 Survey locations shall be marked numerically beginning from the northwest corner.
4.3.6 Potentially uncontaminated interior walls shall be marked in the same manner as above, but at a frequency of at least one survey location per 10 floor grids.
4.4 Establishing Survey Locations, Ceilings/Overhead
4.4.1 Ceilings shall not be gridded in the manner previously described for floors, walls, etc. Rather a prescribed number of survey locations shall be identified and marked on a per square meter basis determined by building classification.
4.4.2 Potentially contaminated rooms and/or buildings shall have at least one disk smear taken above each floor grid.
4.4.3 Potentially uncontaminated rooms and/or buildings shall have at least one disk smear taken above each 4 floor grids.
4.4.4 Survey locations shall be marked by paint, label, tag or other material.
4.4.5 Ceiling surveys shall be identified on miscellaneous survey maps
4.4.6 Survey locations shall be identified numerically, beginning in the northwest corner.
4.5 Surveying Ceilings/Overhead
4.5.1 Follow the gridding procedures listed in 4.4.1.
4.5.2 Obtain a miscellaneous survey form and draw the ceiling as viewed from below. Add equipment, lights, vent ducts, etc., to the extent it would aid in survey reproducibility.
4.5.3 Establish survey locations pursuant to Section 4.4.6. Monitoring personnel shall
select locations where contamination would be most probable.
SARSG. SOP 007
4
4.5.4 Disk smears shall be taken at the frequency required by Sections 4.4.2 and 4.4.3.
4.5.5 Disk smears shall be counted for one minute on the Ludlum Model 2929 Alpha/Beta counting system or pancake probe if approved by the CHP or RSO.
4.5.6 Disk smears shall be taken when contamination is suspected, consideration will be
given to the use of large area swipes. This shall be dependent on surface medium, access, and building use. This shall be determined on a building-by-building basis by the CHP or RSO.
4.5.7 All survey results shall be recorded on the Radiological Survey Report Form,
Attachment 1 to SARSG SOP-011.
4.6 Final Status Survey
4.6.1 Survey grid for the final status survey will be established by MARSSIMs.
4.6.2 The number of readings required for the final status survey will be established by MARSSIMs.
4.6.3 Distance between samples for final status survey will be established by MARSSIMs.
4.6.4 Other associated operations will be done in accordance with the MARSSIMs program.
5 REFERENCES
5.1 Multi-Agency Radiation Survey and Site Investigation Manual (MARSSIM), Revision 1, August 2000.

1
The San Antonio Radiological Services Group (SARSG) is responsible for the issuance, revision, and maintenance of this policy. Any deviations from the procedures set forth in this policy require approval of the SARSG Leader.
1 PURPOSE
This document establishes the guidelines to be used for the monitoring and posting of radioactive materials and areas. It also provides guidelines for maintaining control of radioactive materials and areas that need to be surveyed.
2 EQUIPMENT
The following are examples of instrumentation that might be used to perform surveys.
2.1 Beta-gamma contamination surveys are performed using a thin window Geiger-Mueller (GM) probe, a Bicron or equivalent.
2.2 Alpha surveys are performed with a thin window gas flow proportional probe, a Ludlum model 2221 with 43-89 probe, or equivalent.
2.3 Disk smears from equipment or buildings may be counted in the Ludlum Model 2929
attached to a zinc sulfide thin window scintillator.
2.4 The Ludlum Model 2221 Scaler with/239-1F detector or equivalent will be utilized to Characterize flooring, during the characterization phase. The Model 2221 is battery capable and will be mounted on a cart with a P-10 gas supply for easy handling and overall equipment protection.
2.5 The Ludlum Model 19 or equivalent Micro-R meter will be used to document radiation levels. The Model 19 is portable, battery powered and durable.
3 INSTRUMENT OPERATIONAL CHECKS
3.1 A pre-operational check will be performed on all instruments prior to use to verify the following requirements.
�������� Instrumentation used in the surveys will be source checked in accordance with SARG SOP #2;
�
R a d i o l o g i c a l S u r v e y s a n d P o s t i n g s
PROCEDURE NO. SARSG, SOP 011
DATE: September 17,2003
APPROVED: ______________________
SARSG Leader
EE aa rr tt hh TT ee cc hh SSttaannddaarrdd OOppeerraatt iinngg PPrroocceedduurree
SARSG. SOP 011
2
�������� The instrument has been calibrated within the last 12 months;
�������� The battery check is satisfactory (for portable instrumentation);
�������� Overall physical condition of the instrument is satisfactory; and
�������� Smears should be counted in an area where the background is less than 100 cpm for beta-gamma radiation.
4 POSTING
�������� Signs should be posted between two feet and five feet above the ground for good visibility;
�������� Signs should be placed so that all accessible areas are covered and posting is visible;
�������� Do not attach signs to items or equipment that could be moved;
�������� Boundary rope should be yellow and magenta;
�������� Radiation signs should be tri-foil caution signs with the appropriate inserts; (i.e. contaminated area, radiation area, airborne radioactive material, etc.); and
�������� Boundary tape (yellow and magenta).
5 PROCEDURES
5.1 Exposure rate Surveys
�������� Exposure rate surveys are performed, using any of the exposure rate instruments approved for use, to provide an indication of the amount and type (e.g., beta or gamma) of external radiation exposure the workers will receive while performing routine work operations;
�������� A reasonable amount of care should be taken when performing exposure rate surveys to identify items that are contributing to the general area exposure rates (i.e., barrels, equipment, etc.);
�������� All exposure rates shall be recorded on the Radiological Survey Report Form, Attachment 2-1, or equivalent;
�������� Gamma exposure rates are recorded as mR/hr (µSv/hr), or (µR/hr);
�������� Beta dose rates are recorded as mRad/hr (µGy/hr);
�������� Beta dose rates are derived by the following formula:
mRad/hr = (OW - CW) x CF
OW = Open window exposure rate
SARSG. SOP 011
3
CW = Closed window exposure rate CF = Correction factor*
�������� The beta correction factor used for each instrument shall be determined by the calibration facility;
�������� Exposure rates that are taken "on contact" shall be noted on the Radiological Survey Report Form, Attachment 2-1; and
�������� Items identified with exposure rates greater than five times the general work area shall be recorded with an asterisk indicating "hot spot". As these items are identified, the surveyor should shield the item, or remove it from the area, if possible.
5.2 Contamination Surveys
�������� Contamination surveys are used as a tool to maintain control of work areas, verify clean areas, and establish protective clothing and requirements;
�������� Surveys for removable contamination are performed by using either disk smears or large area swipes.
(a) Disk smear surveys are performed by wiping a surface area approximately
100 cm2.
(b) Large area swipes are performed using either masslin or similar cloth to wipe a large surface area.
�������� Count rate instruments approved for use shall be used for evaluating contamination levels of disk smears or wipes;
�������� Smears are counted in an area where the background is less than 100 cpm;
�������� Smears are placed 1/2" from the surface of the detector for 15 to 20 seconds to allow the count rate meter's indication to stabilize;
�������� Smear results are recorded on the Radiological Survey Report Form, Attachment 2-1, in disintegrations per minute. DPM shall be calculated by the following formula:
DPM = Gross CPM - Background CPM Detector Efficiency
Example: 2,000 CPM - 60 CPM = 9,700 DPM 0.20
Note: For detectors with an efficiency of 10 percent, multiply the net counts per minute by 10.
SARSG. SOP 011
4
Example: (1,100 cpm-100 cpm) x 10 = 10,000 dpm
A. Disk smears are indicated as 100 cm2.
Example: 1,000 dpm/100 cm2
B. Large area swipes are indicated as probe area.
Example: 1,000 dpm/PA
Note: Contamination surveys on material or equipment for unconditional release shall be performed with disk smears and documented in dpm/100 cm2
�������� Fixed contamination surveys may be performed with any of the approved count rate instruments. Consideration should be given to using the audible setting on the instrument, if so equipped, since audible response is quicker to respond to than the visual provided by the meter.
a) When using the beta-gamma instrument, the detector should be held within 1/2 inch of the surface being frisked and moved no faster than 2 inches per second.
b) When using the alpha instrument, the detector should be held within 1/4 inch of the surface being monitored and the probe moved no faster than 2 inches per second. Increased counts are an indication of alpha activity, when counts increase either by audible or visual, stop all detector motion until a stable count rate is determined.
SARSG. SOP 011
5
Personnel contamination surveys shall be performed by any individual exiting from the facility. Surveys are performed in accordance with section 5.2. The detector movement should be paused at locations of potential contamination such as knees, elbows, and mouth.
Posting Requirements
�������� "Caution Radioactive Material(s)" shall be conspicuously posted at the entrance to each room or area in which licensed material is used or stored and exceeds the quantity of such material specified in USACE Manual 385-1-80 or 10 NYCRR sect 16.
�������� "Caution Radiation Area" shall be conspicuously posted at the access of any area, building or room where exposure rates from the radioactivity inside that area could result in an individual receiving a dose equivalent to 5 mrem in one hour.
�������� "Caution Contamination Area" shall be posted at the entrance to areas where removable contamination levels meet or exceed the following activity:
Areas that are greater than 1 times but less than 100 times levels specified in USACE Manual 385-1-80 or 10 NYCRR sect 16.
�������� "Caution High Contamination Area" shall be posted at areas where removable contamination exceeds the following activity:
Areas greater than 100 times levels specified in USACE Manual 385-1-80 or 10 NYCRR sect 16.
�������� "No Eating, Drinking, or Smoking" shall be posted at all entrances to the restricted area.
Survey Frequency
�������� The frequency of routine surveys shall be determined at the start of the project by the Radiation Safety Officer based on which buildings or areas are used for storing or processing radioactive materials, the frequency of use of these areas, and traffic flow. A Routine Survey Matrix shall be generated by the Project manager or his designee at the start of the project to provide guidance for surveys of specific areas. The Project manager will update the matrix if determined necessary during the project.
Survey Documentation
�������� Surveys performed shall be documented on the radiological survey report for that area or item.
Surveying Miscellaneous Equipment, Pipe, Valves, Etc.
�������� The surveying of miscellaneous equipment shall be performed and documented as in Section 5.2.
SARSG. SOP 011
6
�������� The miscellaneous equipment surveyed shall be drawn and described on the Radiological Survey Report, Attachment 2-1, to the extent it could be relocated and resurveyed.
6 RECORDS
a) Radiological Survey Report, Attachment 2-1
7 REFERENCES
The following document or portions thereof was used as reference.
Sources
7.1.1 USACE Manual # 385-1-80, Radiation Protection Manual.
7.1.2 New York Codes of Rules and Regulations Tital 10 section 16 “Ionizing radiation.
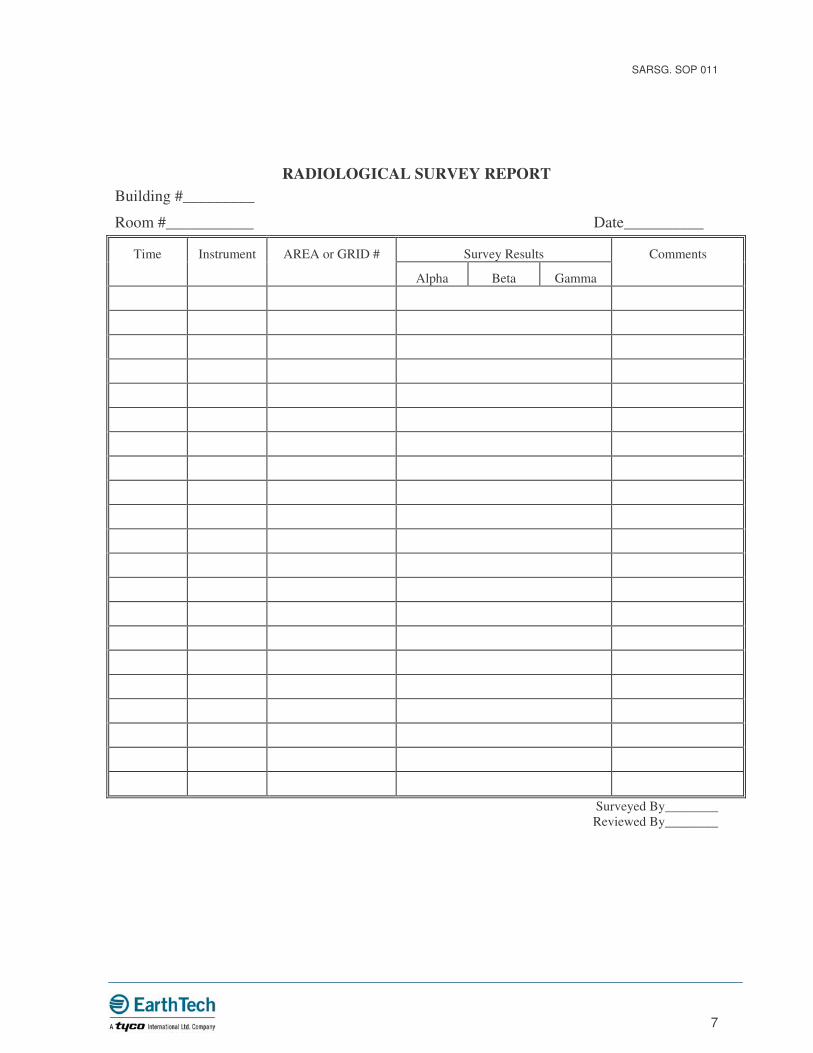
SARSG. SOP 011
7�
RADIOLOGICAL SURVEY REPORT
Building #_________
Room #___________ Date__________
Survey Results Time Instrument AREA or GRID #
Alpha Beta Gamma
Comments
Surveyed By________ Reviewed By________
1�
The San Antonio Radiological Services Group is responsible for the issuance, revision, and maintenance of this policy. Any deviations from the procedures set forth in this policy require approval of the SARSG Leader.
1 PURPOSE
This procedure provides the requirements and techniques for collecting swipe samples to determine the amount of removable radioactive surface contamination.
2 SCOPE.
The purpose of taking removable surface measurements is three-fold: 2.1 Determine the extent of removable radioactive contamination, 2.2 Evaluate the potential for its migration, and 2.3 Assess methods for its decontamination.
This procedure establishes the requirements for performance, documentation, and review of surface contamination surveys. 3 3.0 DEFINITIONS
3.1 Survey Area - An area where radioactive materials or contamination are or may be present; includes areas where samples/swipes (potentially containing radioactivity) are being screened.
3.2 Direct Surface Contamination Monitoring - Total radioactivity measurement present on a surface; does not differentiate between fixed and loose surface contamination.
3.3 Removable Surface Contamination Monitoring - Measurement of the contamination transferred from a contaminated surface to a swipe by application of moderate pressure.
4 4.0 General Requirements and Limitations 4.1 Only qualified and trained personnel are allowed to collect swipe samples. 4.2 Latex or nitrile gloves shall be worn when taking swipes where radiological
contamination is present or suspected. Cotton gloves may be worn under the latex or nitrile gloves.
4.3 Change gloves when contamination is suspected or gloves become torn. 4.4 Check hands periodically for contamination.
�
S w i p e S a m p l e s
PROCEDURE NO. SARSG, SOP 012
DATE: February 6,2001
APPROVED: ______________________
SARSG Leader
EE aa rr tt hh TT ee cc hh SSttaannddaarrdd OOppeerraatt iinngg PPrroocceedduurree
SARSG. SOP 012
2�
5 5.0 RESPONSIBILITIES
5.1 Project Radiation Safety Officer (RSO) is responsible for training the Radiological Control Technicians (RCTs) in the implementation of this procedure.
5.2 Radiological Control Technicians are responsible for:
5.2.1 Collecting swipe samples in accordance with this procedure and applicable training.
5.2.2 Reporting unsafe or unusual conditions to the Field Supervisor.
6 6.0 Procedures
6.1 Initial Actions
6.1.1 Follow the appropriate provisions of the Work Plan for initial actions and determining where swipes are to be collected.
6.1.2 For each new box of 500 swipes opened, randomly choose one unused swipe and submit for field gross alpha/beta counting. Perform a 5-minute background count on the swipe and use this value to establish the background cpm for the counting of swipe samples.
6.2 Collection of Swipe Samples for Surfaces
6.2.1 Measure all surfaces or items that have the potential for fixed contamination. Fixed contamination may become removable during these operations and must be identified so that proper precautions may be taken.
6.2.2 Use caution while surveying rough surfaces to avoid personal injury or tearing of the swipe paper.
SARSG. SOP 001
3
6.1.1 6.2.3 Hold the swipe paper with the back of the swipe firmly against the fingers. Ensure the face of the swipe paper contacts the surface to be swiped.
6.1.2 6.2.4 Apply moderate pressure across the swipe paper to ensure that most of the swipe face comes in contact with the surface.
6.1.3 6.2.5 Swipe an area of approximately 100 square centimeters (16 square inches) per swipe. A template may be used to standardize swipe collection.
6.1.4 6.2.6 Place individual swipes in a separate envelope (or similar container) to prevent cross contamination.
6.1.5 6.2.7 Label each container with a sample location number cross-referenced to a sample location, preferably a location map.
6.1.6 6.2.8 Screen the swipe samples for the presence of radiological materials. Do this outside the survey area. Swipes shall be screened individually by performing a 1-minute count. Place the swipe on the same surface used to perform the background measurement. Center the swipe with the contaminated side facing upward under the alpha/beta probe. Perform a 1-minute count and subtract the previous background measurements. Report net cpm values.
6.1.7 6.3 Record the following information on the Swipe Sample Counting Data Sheet:
6.3.1 Sample location (or other specific identification)
6.3.2 Date of survey
6.3.3 Signature(s) of individual(s) performing the survey
6.3.4 Swipe screening results
6.1.7.1 NOTE: AVOID FILLING OUT UNNECESSARY PAPERWORK IN CONTAMINATED AREAS OR RADIATION FIELDS.
6.1.7.2 6.4 Collection of Swipe Samples from Sampling Equipment: When swiping non-uniform objects or surfaces with odd shapes, inside surfaces, or small items, ensuring that surfaces are adequately monitored and the face of the swipe paper has come in contact with a representative portion of the object.
NOTE: LARGE AREA SWIPES MAY BE USED TO OBTAIN A GENERAL INDICATION OF THE AMOUNT OF REMOVABLE CONTAMINATION PRESENT ON A SURFACE. HOWEVER, IT IS NOT TO BE USED TO COMPARE RESULTS AGAINST RELEASE CRITERIA.
SARSG. SOP 001
4
6.1.8 6.4.1 Swipe the area following the methodology discussed previously
6.1.9 6.4.2 Outside of the survey area, screen the swipe samples for the presence of radiological materials. Swipes shall be screened one at a time.
6.1.10 6.4.3 The following information shall be recorded on the Swipe Sample Counting Data Sheet or in the field log book:
6.4.3.1 Sample location (or other specific identification).
6.4.3.2 Date of measurements.
6.4.3.3 Swipe screening results.
6.4.3.4 If the sample is a large area swipe, record the approximate area swiped in the "Remarks" column.
6.1.10.1 NOTE: AVOID FILLING OUT UNNECESSARY PAPERWORK IN CONTAMINATED AREAS OR RADIATION FIELDS.
6.5 RELEASE LEVELS –acceptable surface contamination release levels can be found in the applicable work plan.
7 6.6 records - RECORD ALL INFORMATION GENERATED DURING THIS PROJECT INTO THE FIELD LOGBOOK FOR FUTURE REFERENCE.
8 7.0 REFERENCEs
7.1 Sampling and Surveying Radiological Environments, CRC Press, 2001.
7.2 Multi-Agency Radiation Survey and Site Investigation Manual (MARSSIM), Revision 1, August 2000.
Section No. 09 Revision No. 1.2
Date: August 1994 Page: 1 of 14�
IN-SITU EARTHTECH BLOOMFIELD HYDRAULIC CONDUCTIVITY TESTING STANDARD OPERATING PROCEDURE 09 �
�
� 1 SOP BLM 09 ����
1. OBJECTIVE
The objective of these guidelines is to provide general reference information for estimating the hydraulic conductivity of an aquifer by in-situ tests performed in either piezometers, monitoring wells or boreholes.
2. LIMITATIONS
These guidelines are for information only and are not to take precedence over the requirements of project-specific plans for in-situ hydraulic conductivity testing.
These tests approximate the hydraulic conductivity of the formation only at the interval of the test. The disturbance to the formations caused by drilling and the potential turbulence from the well screen can influence the data. The diameter of the well is critical to the computation of the hydraulic conductivity, and the effective diameter of a well can be increased considerably by the well development process. Poor well efficiency caused by inappropriate slot size, poor condition of the well screen, or a poorly designed gravel pack could produce results not representative of the tested formation. Hydraulic conductivity tests in wells should be conducted only after the well has been fully developed. Slug test evaluation formulas assume an instantaneous initial change in water level in the tested interval. Tests performed after extended periods of pumping or water addition may yield inaccurate results. Slug tests provide only rough estimates of hydraulic conductivity, and should not be run in preference to pumping tests.
3. DEFINITIONS
Slug Test - An aquifer test made either by pouring a small instantaneous charge of water into a well or by withdrawing a slug of water from the well. A synonym for this test, when a slug of water is removed from the well, is a bail-down test.
Rising Head Test - A test performed in an individual borehole or well within the saturated zone to estimate the hydraulic conductivity of the surrounding formation by lowering the water level in the boring or well and measuring the rate of recovery of the water level. The water level may be lowered by pumping or bailing.
Falling Head Test - A test performed in an individual borehole or well to estimate the hydraulic conductivity of the surrounding formation by raising the water level in the boring or well and measuring the rate of drop in the water level.
Constant Head Test - A constant head test is a variation of the falling head test in which water is constantly added to the borehole or well to be tested, and the flow rate required to maintain a hydraulic head at a constant level above the static water level is measured.
Packer Test - A hydraulic conductivity test using inflatable packers to isolate a discrete zone within the borehole for testing purposes.
Section No. 09 Revision No. 1.2
Date: August 1994 Page: 2 of 14�
IN-SITU EARTHTECH BLOOMFIELD HYDRAULIC CONDUCTIVITY TESTING STANDARD OPERATING PROCEDURE 09 �
�
� 2 SOP BLM 09 ����
Packer - A sealing device installed in a well or borehole which isolates intervals within the boring or well for testing purposes.
4. GUIDELINES
In-situ hydraulic conductivity testing provides a relatively rapid method of estimating the hydraulic conductivity of a portion of an aquifer and the transmissivity (if the saturated thickness of the unconfined or confined aquifer is known). While the performance of a pumping test is the optimum aquifer testing method for estimation of hydraulic conductivities, transmissivities, and storage coefficients, pumping tests are relatively expensive and time consuming. Certain methods of in-situ testing, on the other hand, are much less expensive, less time intensive per test and several wells or piezometers can be tested in a single day by one technician. These guidelines present methods for conducting in-situ hydraulic conductivity tests in piezometers, monitoring wells, and boreholes.
4.1 Slug Test
Slug tests are conducted to estimate the hydraulic conductivity of the soil/rock strata within the screen interval of a piezometer or a monitoring well. A standard slug test consists of instantaneous injection or withdrawal of a known volume that causes immediate change of water levels in the well. The subsequent amounts of rise or decline of water levels with time are recorded and used to calculate hydraulic conductivities of the in-situ materials open to the well. Because the slug is small compared to the volume of water in the surrounding aquifer, the slug test is an estimate of permeability within only a few feet of the well.
A slug test is performed by quickly lowering a slug into a well to displace the water from the initial water level and measuring the rate at which the water level declines (falling-head test), then measuring the rate at which the water level rises (rising-head test) after the slug is removed. A bailer can also be used to remove a slug of water. This type of test is usually called a "bail-down test" or "bailer" test. Water level measurements should be recorded every 5 to 10 seconds for the first two minutes and every 30 seconds thereafter. Measurement can be terminated when the depth to water has stabilized for approximately 10 minutes. Water levels during the test can be recorded manually using a water level indicator, or a Hermit Model SE 100B Data logger with a pressure transducer can be used for this purpose.
Prior to slug testing, the well should be thoroughly developed and water levels allowed to stabilize in order to obtain accurate results. The following data should be obtained when performing a slug test, in addition to the static water level and all time and water level measurements:
1. Casing diameter
2. Borehole diameter
3. Well pipe and screen diameter and length
4. Screen slot size
5. Procedures used
Section No. 09 Revision No. 1.2
Date: August 1994 Page: 3 of 14�
IN-SITU EARTHTECH BLOOMFIELD HYDRAULIC CONDUCTIVITY TESTING STANDARD OPERATING PROCEDURE 09 �
�
� 3 SOP BLM 09 ����
6. Gravel pack size
7. Saturated thickness of the aquifer being tested 4.1.1 Slug Test Data Analysis
Slug test data can be analyzed by three different methods to determine in-situ hydraulic conductivity. The first method (Cooper, Bredehoeft, and Papadopulos, 1967) assumes slug test data was collected from wells in a confined aquifer with fully penetrating wells. The second method (Bouwer and Rice, 1976), while originally developed for an unconfined aquifer, can also be used for confined or stratified aquifers if the top of the screen or perforated section is some distance below the upper confining layer (Bouwer, 1989). The third method (Hvorslev, 1951) calculates permeabilities for various well geometries based on the assumption of infinite vertical extent (upward and downward) of the flow system. Detailed description of these methods can be located in the listed references. The most widely used method to reduce slug test data is that of Hvorslev. A brief description of this method is given below.
Figure 9-1 shows the geometry of a piezometer installed in an aquifer. In the case of a piezometer installed into a low permeability unit, special attention must be paid to the method of construction. In many cases, gravel pack is used to fill the open annular space between the well screen and the wall of the open hole. Under such conditions, the radius of the well screen, R, is the radius of the borehole and the length of the well screen, L, is the length of the gravel pack. The gravel pack would typically be extended one to several feet above the well screen and the remainder of the open hole backfilled with some type of grout.
�
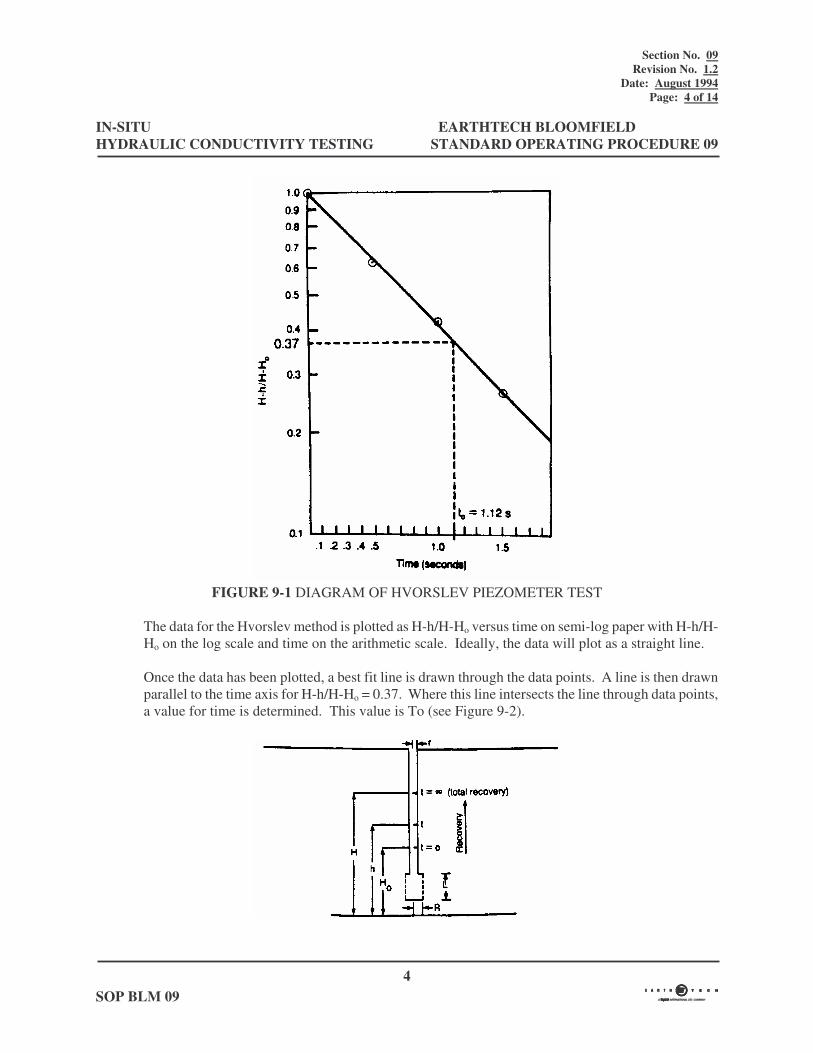
Section No. 09 Revision No. 1.2
Date: August 1994 Page: 4 of 14�
IN-SITU EARTHTECH BLOOMFIELD HYDRAULIC CONDUCTIVITY TESTING STANDARD OPERATING PROCEDURE 09 �
�
� 4 SOP BLM 09 ����
� �
� FIGURE 9-1 DIAGRAM OF HVORSLEV PIEZOMETER TEST
The data for the Hvorslev method is plotted as H-h/H-Ho versus time on semi-log paper with H-h/H-Ho on the log scale and time on the arithmetic scale. Ideally, the data will plot as a straight line.
Once the data has been plotted, a best fit line is drawn through the data points. A line is then drawn parallel to the time axis for H-h/H-Ho = 0.37. Where this line intersects the line through data points, a value for time is determined. This value is To (see Figure 9-2).
�
� �
�
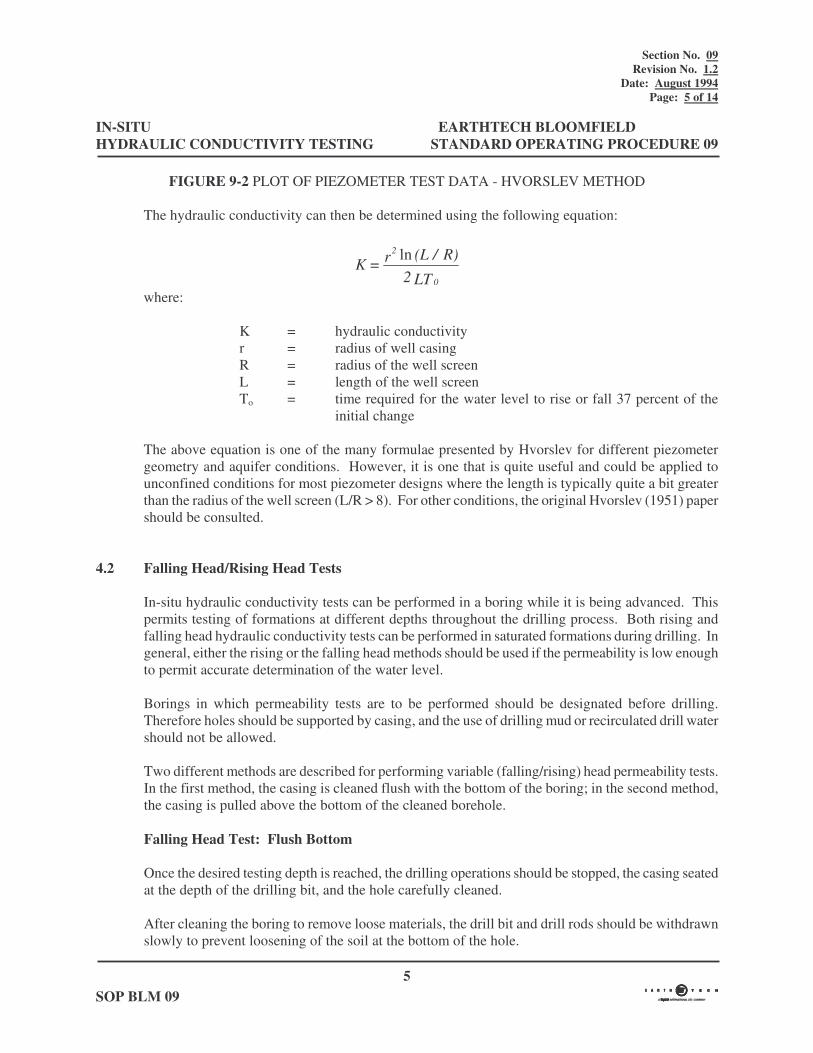
Section No. 09 Revision No. 1.2
Date: August 1994 Page: 5 of 14�
IN-SITU EARTHTECH BLOOMFIELD HYDRAULIC CONDUCTIVITY TESTING STANDARD OPERATING PROCEDURE 09 �
�
� 5 SOP BLM 09 ����
FIGURE 9-2 PLOT OF PIEZOMETER TEST DATA - HVORSLEV METHOD
The hydraulic conductivity can then be determined using the following equation: �
�
LT2R) / (L r = K
0
2 ln�
where:
K = hydraulic conductivity r = radius of well casing R = radius of the well screen L = length of the well screen To = time required for the water level to rise or fall 37 percent of the
initial change
The above equation is one of the many formulae presented by Hvorslev for different piezometer geometry and aquifer conditions. However, it is one that is quite useful and could be applied to unconfined conditions for most piezometer designs where the length is typically quite a bit greater than the radius of the well screen (L/R > 8). For other conditions, the original Hvorslev (1951) paper should be consulted.
4.2 Falling Head/Rising Head Tests
In-situ hydraulic conductivity tests can be performed in a boring while it is being advanced. This permits testing of formations at different depths throughout the drilling process. Both rising and falling head hydraulic conductivity tests can be performed in saturated formations during drilling. In general, either the rising or the falling head methods should be used if the permeability is low enough to permit accurate determination of the water level.
Borings in which permeability tests are to be performed should be designated before drilling. Therefore holes should be supported by casing, and the use of drilling mud or recirculated drill water should not be allowed.
Two different methods are described for performing variable (falling/rising) head permeability tests. In the first method, the casing is cleaned flush with the bottom of the boring; in the second method, the casing is pulled above the bottom of the cleaned borehole.
Falling Head Test: Flush Bottom
Once the desired testing depth is reached, the drilling operations should be stopped, the casing seated at the depth of the drilling bit, and the hole carefully cleaned.
After cleaning the boring to remove loose materials, the drill bit and drill rods should be withdrawn slowly to prevent loosening of the soil at the bottom of the hole.
Section No. 09 Revision No. 1.2
Date: August 1994 Page: 6 of 14�
IN-SITU EARTHTECH BLOOMFIELD HYDRAULIC CONDUCTIVITY TESTING STANDARD OPERATING PROCEDURE 09 �
�
� 6 SOP BLM 09 ����
The hole should then be maintained full of water to a level within 5 ft from the top of the casing for about 10 to 15 minutes by adding the necessary amount of water. This is essential to develop a steady seepage condition.
When the water level inside the casing has been adjusted for the last time, the depth to water should be recorded and a timer started. The depth to water should be measured with a calibrated tape equipped with a sounding device. In highly permeable soils or rock, an electric pressure transducer and recorder may be required. The level of water is then allowed to fall inside the hole from the seepage of water through the bottom of the hole.
The depth of water inside the hole should be carefully recorded at logarithmically increasing intervals of time as determined by the site geologist. The top of the casing should be used as a reference point for all measurements.
The length of the test should be determined by the site geologist.
The following data should be obtained, in addition to all time and depth measurements (when applicable):
1. Ground elevation
2. Reference elevation
3. Depth of test run
4. Casing diameter
5. Length of uncased borehole
6. Identification of equipment used
Falling Head Test: Pulling Back Casing
This method is similar to the above method except that the hole is backfilled with a clean, washed sand and the casing is bumped back a designated distance. A well screen may also be used that is fitted with threads at the top to accept pipe to pull it back out after the test is complete.
The hole should be prepared as described above. The test should be carried out in a similar manner as described previously or as determined by the site geologist, and all pertinent data should be similarly recorded.
Rising Head Test
This method is equivalent to that used for the falling head test.
Section No. 09 Revision No. 1.2
Date: August 1994 Page: 7 of 14�
IN-SITU EARTHTECH BLOOMFIELD HYDRAULIC CONDUCTIVITY TESTING STANDARD OPERATING PROCEDURE 09 �
�
� 7 SOP BLM 09 ����
The water level in the borehole is temporarily lowered as quickly as possible and readings are obtained as the water rises in the borehole. Any convenient means of rapidly lowering the water in the boring may be used, such as a bailer or pump.
All pertinent data should be similarly recorded.
4.2.1 Rising Head/Falling Head Test Data Analysis
There are many different published formulae for calculating hydraulic conductivity from in-situ borehole tests. Some of these formulae are outlined in Figure 9-2 (Hvorslev, 1951) for various geometries keeping in view the nature of subsurface materials encountered in the boreholes. Relevant formulae can be selected based on site-specific conditions for data analysis. These formulae are based on the assumptions that the effect of soil compressibility is negligible.
4.3 Constant Head Test
A constant head test is normally conducted as an inflow test in which arrangements are made for water to flow into the ground under a sensibly constant head. In this method water is added to the casing at a rate sufficient to maintain a constant water level at or near the top of the casing for a period of not less 10 minutes. The water may be added by pouring from calibrated containers or by pumping through a water meter. The intake rate is measured and the hydraulic conductivity is determined from this. It is essential to use clean water for the test. A limitation of the constant head test is that foreign water introduced into the formation must be removed from the well area before a representative groundwater sample can be obtained. This method of testing may be used in both saturated and unsaturated formations. In those cases where the permeability is so high as to preclude an accurate measurement of the rising or falling water level, the constant head test is used.
Two different setups (similar to falling/rising head tests) can be used to conduct the constant head test. In the case first case, the casing is cleaned flush with the bottom of the boring; in the second case, the casing is pulled above the bottom of the cleaned borehole. A brief description of these setups is given in Section 4.2.
4.3.1 Constant Head Test Data Analysis
Constant head test data can be analyzed by using an appropriate applicable equation from Figure 9-2, keeping in view the test setup.
4.4 Packer Test
Inflatable packers are used to isolate a test zone within the borehole to perform in-situ permeability tests. The apparatus for pressure tests usually comprises a water pump, a manually-adjusted automatic pressure relief valve, pressure gauge, a water meter, and a packer assembly. The packers, which provide a means of sealing off a limited section of borehole for testing should have a length of five times the diameter of the hole. They may be of the pneumatically or mechanically expandable type. The former are preferred since they adapt to an oversized hole, whereas the latter may not. The piping of the packer assembly is designed to permit testing of either the portion of the hole between
Section No. 09 Revision No. 1.2
Date: August 1994 Page: 8 of 14�
IN-SITU EARTHTECH BLOOMFIELD HYDRAULIC CONDUCTIVITY TESTING STANDARD OPERATING PROCEDURE 09 �
�
� 8 SOP BLM 09 ����
the packers or the portion below the lower packer. Flow to the section below the lower packer is through the interior pipe; flow to the section between the packers is provided by perforations in the outer pipe which have an outlet area two or more times the cross-sectional area of the pipe. The packers are normally set 2, 5, or 10 feet apart and it is common to provide flexibility in testing by having assemblies with different packer spacings available, thereby permitting the testing of different lengths of the hole. The wider spacings are used for rock which is more uniform; the shorter spacing is used to test individual joints which may be the cause of high water loss in otherwise tight strata.
Methods of Testing
The test procedure used depends upon the condition of the rock. In rock which is not subject to cave-in, the following method is in general use. The hole is drilled to the total depth without testing. Two inflatable packers 5 to 10 feet apart are mounted near the bottom of the rod or pipe used for making the test. The bottom of the rod or pipe is sealed, and the section between the packers is perforated. The perforations should be at least one quarter of an inch in diameter, and the total area of all perforations should be greater than two times the inside cross-sectional area of he pipe or rod. Tests are made beginning at the bottom of the hole. After each test, the packers are raised the length of the test section and another test made. This procedure is followed until the entire length of the hole has been tested.
If the rock in which the hole is being drilled is subject to cave-in, the pressure test is conducted after each advance of the hole for a length equal to the maximum unsupported length of hole or the distance between the packers, whichever is less.
Cleaning Test Sections Before Testing
Before each test, the test section should be surged with clean water and bailed out to clear cuttings and drilling fluid from the face of the hole. If the test section is above the water table and will not hold water, water should be poured into the hole during the surging, then bailed out as rapidly as possible. When a completed hole is tested using two packers, the entire hole can be cleaned in one operation. Cleaning the hole is frequently omitted from testing procedures; however, this omission may result in a permeable rock appearing to be impermeable because the hole face is sealed by cuttings or drilling fluid. In such cases, the computed permeability will be lower than the true permeability.
Length of Test Section
The length of the test section is governed by the character of the rock, but generally a length of 10 feet is desirable. At times, a good seal cannot be obtained for the packer at the planned elevation because of bridging, railing, or the presence of fractures. Under these circumstances, the test section length should be increased or decreased or test sections overlapped to assure that the test is made with well-seated packers. On some tests, a 10-foot sections will take more water than the pump can deliver; hence, no back pressure can be developed. When this occurs, the length of the test sections should be shortened until back pressure can be developed, or the falling head test might be tried.
Section No. 09 Revision No. 1.2
Date: August 1994 Page: 9 of 14�
IN-SITU EARTHTECH BLOOMFIELD HYDRAULIC CONDUCTIVITY TESTING STANDARD OPERATING PROCEDURE 09 �
�
� 9 SOP BLM 09 ����
The test sections should never be shortened to where the ratio DA
is less than 5, where D is the
diameter of the hole and A is the length of the test section.
Size of Rod or Pipe to Use in Tests
Drill rods are commonly used as intake pipes to make pressure and permeability tests. NX and NW rods can be used for this purpose without seriously affecting the reliability of the test data, if the intake of the test section does not exceed 12 to 15 gallons per minute and the depth to the top of the test section does not exceed 50 feet. For tests deeper than 50 feet, head loss due to friction in pipe should be accounted for when calculating hydraulic conductivity.
Pumping Equipment
Permeability tests made in drill holes ideally should be performed using centrifugal pumps having sufficient capacity to develop back pressure. A pump with a capacity of up to 250 gallons per minute against a total head of 160 feet would be adequate for most testing. Head and discharge of such pumps are easily controlled by changing engine speed or with a control valve on the discharge.
Water Pressures, Duration of Tests, and Data to Be Recorded
A minimum of three pressures are utilized at each test section. The magnitude of the pressures should be respectively at least 10, 20, and 40 lbs/sq. in. (psi) above the natural piezometric pressure or 10, 20, and 40 psi where pressure testing above the piezometric level except that in no case should the excess pressure above natural piezometric pressure exceed one psi per foot of existing overburden. Each pressure increment should be maintained for ten or more minutes until a uniform rate of flow has been reached or until stopped by the geologist. The quantity of flow for each pressure is recorded at one, two, and five minutes, and at five minute intervals thereafter. After the rate of flow at 10, 20, and 40 psi pressures have been recorded, the water pressure should be reduced to 20 and 10 psi and the intake recorded at these pressures. Additional data to be recorded in each test are as follows:
1. Depth of hole at time of each test.
2. Depth to bottom of top packer.
3. Depth to top of lower packer.
4. Depth to water surface in boring at specified intervals.
5. Elevation of piezometer level in artesian strata.
6. Length of test section.
7. Radius of hole.
8. Length of packer.
9. Distance pressure gauge is above ground surface.
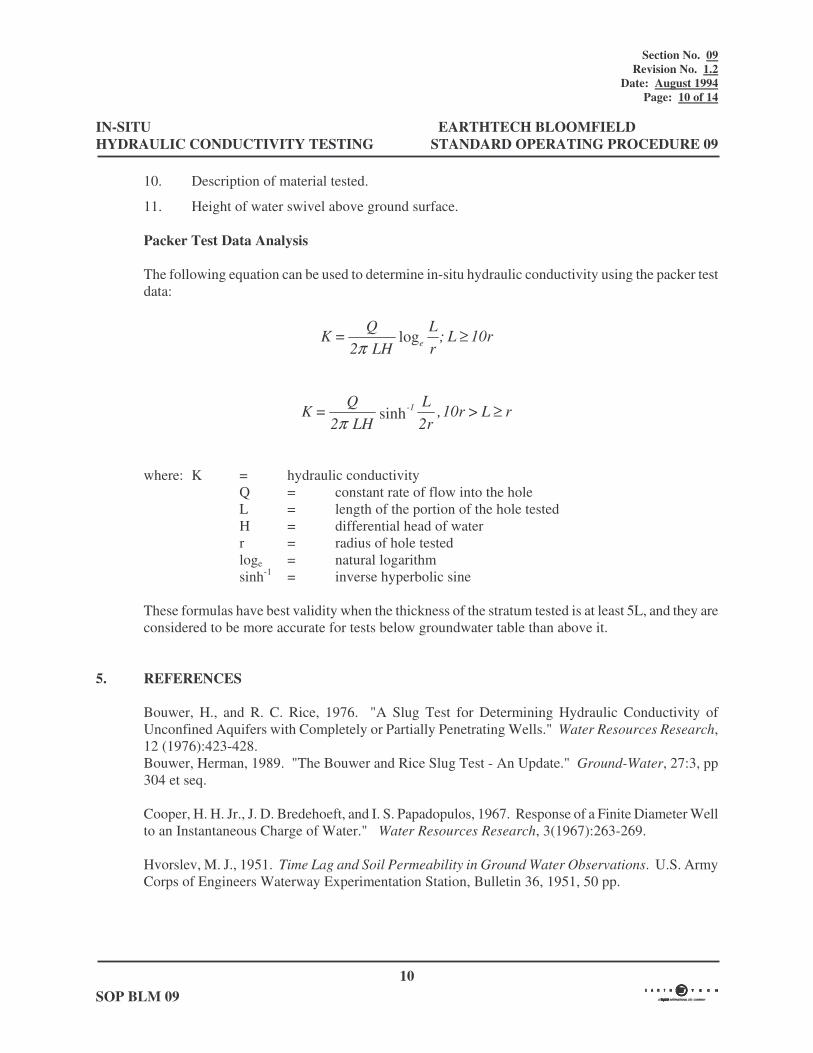
Section No. 09 Revision No. 1.2
Date: August 1994 Page: 10 of 14�
IN-SITU EARTHTECH BLOOMFIELD HYDRAULIC CONDUCTIVITY TESTING STANDARD OPERATING PROCEDURE 09 �
�
� 10 SOP BLM 09 ����
10. Description of material tested.
11. Height of water swivel above ground surface.
Packer Test Data Analysis
The following equation can be used to determine in-situ hydraulic conductivity using the packer test data:
10r L ;rL
LH 2
Q = K e ≥log
π
r L > 10r ,2rL
LH 2
Q = K 1- ≥sinhπ
where: K = hydraulic conductivity Q = constant rate of flow into the hole L = length of the portion of the hole tested H = differential head of water r = radius of hole tested loge = natural logarithm sinh-1 = inverse hyperbolic sine
These formulas have best validity when the thickness of the stratum tested is at least 5L, and they are considered to be more accurate for tests below groundwater table than above it.
5. REFERENCES
Bouwer, H., and R. C. Rice, 1976. "A Slug Test for Determining Hydraulic Conductivity of Unconfined Aquifers with Completely or Partially Penetrating Wells." Water Resources Research, 12 (1976):423-428. Bouwer, Herman, 1989. "The Bouwer and Rice Slug Test - An Update." Ground-Water, 27:3, pp 304 et seq.
Cooper, H. H. Jr., J. D. Bredehoeft, and I. S. Papadopulos, 1967. Response of a Finite Diameter Well to an Instantaneous Charge of Water." Water Resources Research, 3(1967):263-269.
Hvorslev, M. J., 1951. Time Lag and Soil Permeability in Ground Water Observations. U.S. Army Corps of Engineers Waterway Experimentation Station, Bulletin 36, 1951, 50 pp.
Section No. 09 Revision No. 1.2
Date: August 1994 Page: 11 of 14�
IN-SITU EARTHTECH BLOOMFIELD HYDRAULIC CONDUCTIVITY TESTING STANDARD OPERATING PROCEDURE 09 �
�
� 11 SOP BLM 09 ����
6. REVISION HISTORY
Original - revision 0 - April 1989
Revision 1 - June 1991 - complete rewrite, text expanded, graphics incorporated.
Revision 1.1 - May 1993 - typographical errors corrected, minor formatting changes
Revision 1.2 - August 1994 - Internal review; typographical errors and technical content corrected; references added.

�##��'( % #�*�##��'( % #�*�##��'( % #�*�##��'( % #�*����
��+������������ ����#�,�� ��+������������ ����#�,�� ��+������������ ����#�,�� ��+������������ ����#�,�� �����

This page intentionally left blank.
�
����
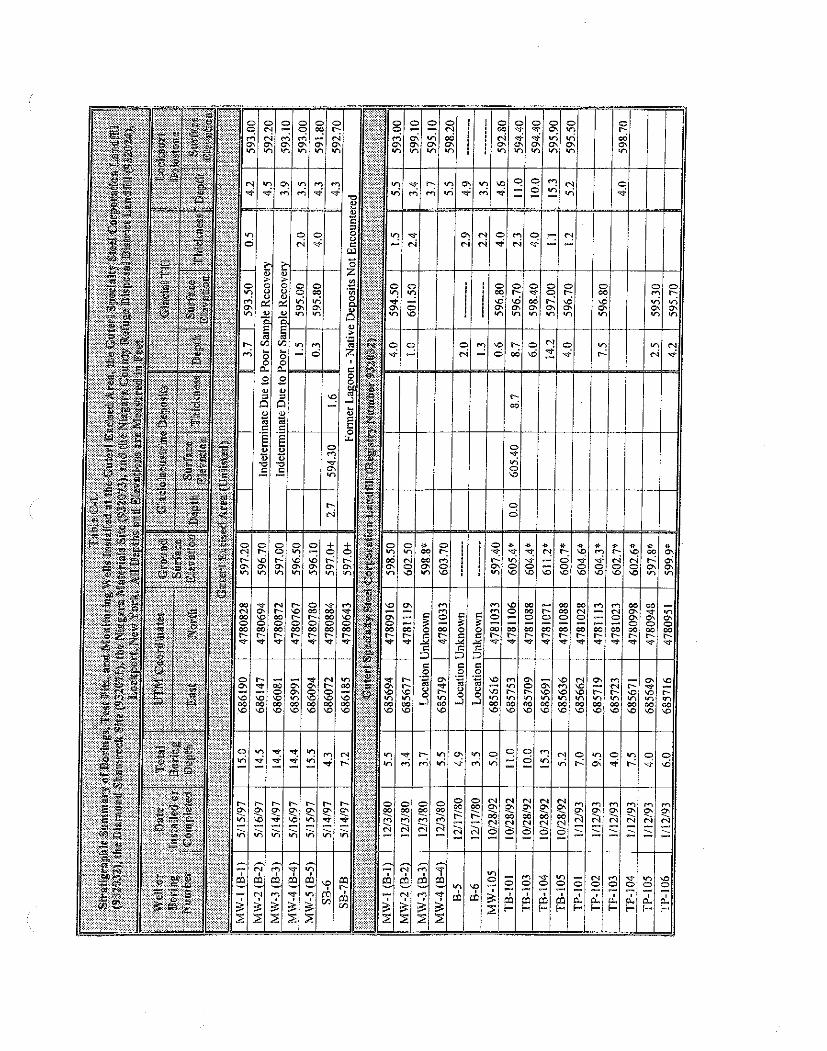
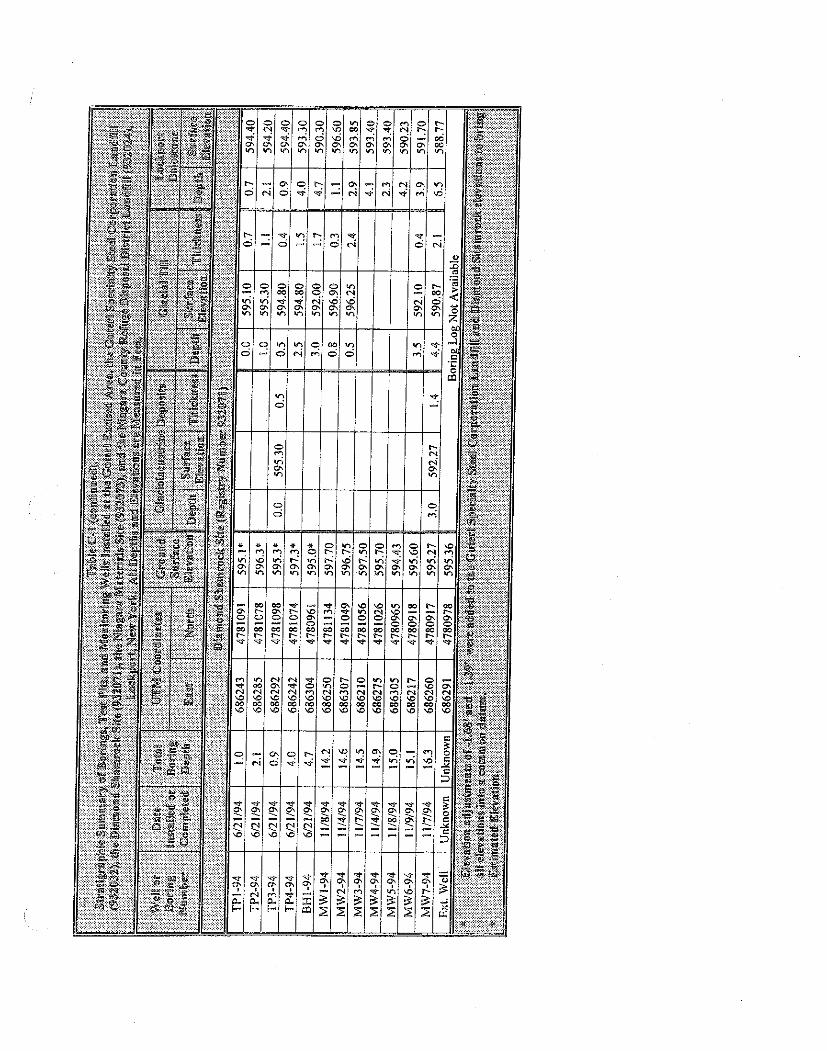
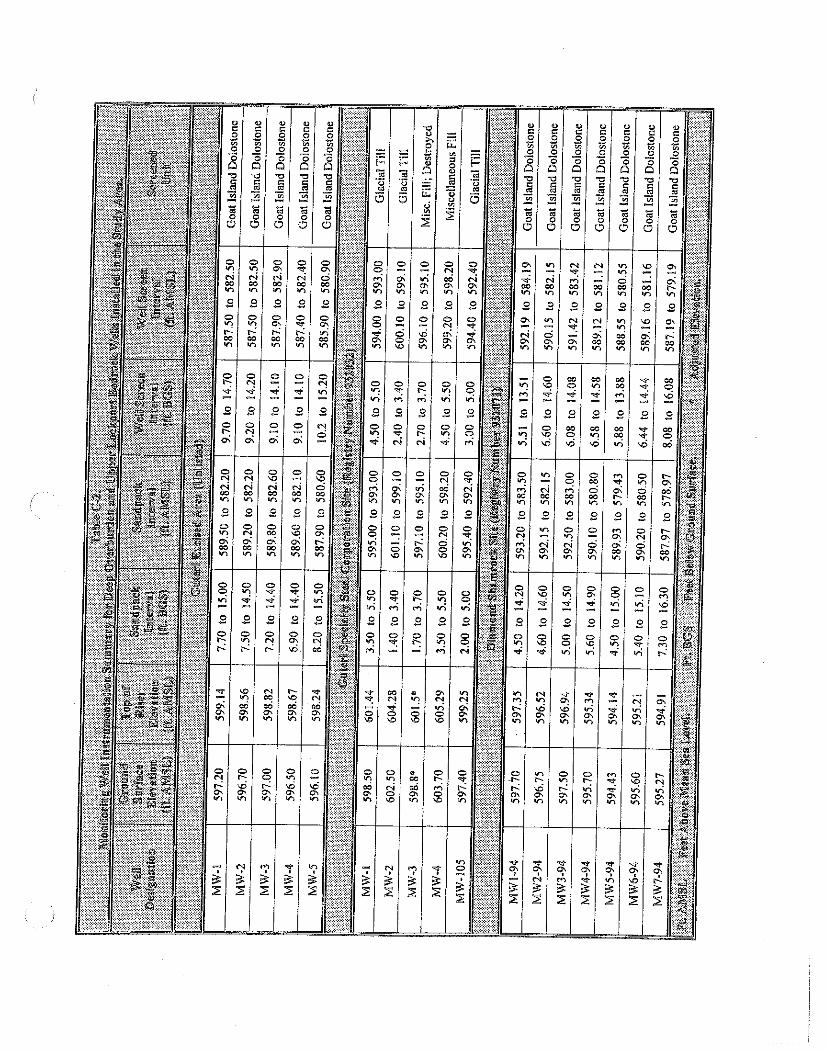
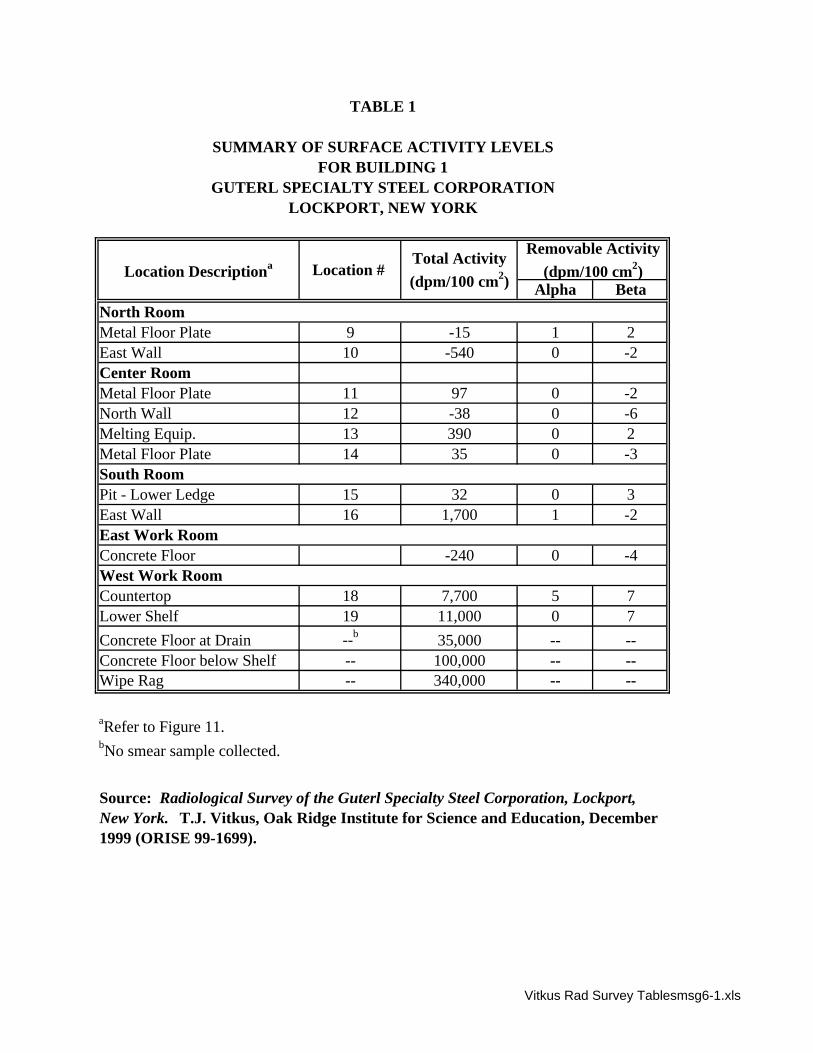
Alpha Beta
Metal Floor Plate 9 -15 1 2East Wall 10 -540 0 -2Center RoomMetal Floor Plate 11 97 0 -2North Wall 12 -38 0 -6Melting Equip. 13 390 0 2Metal Floor Plate 14 35 0 -3
Pit - Lower Ledge 15 32 0 3East Wall 16 1,700 1 -2
Concrete Floor -240 0 -4
Countertop 18 7,700 5 7Lower Shelf 19 11,000 0 7Concrete Floor at Drain --b 35,000 -- --Concrete Floor below Shelf -- 100,000 -- --Wipe Rag -- 340,000 -- --
aRefer to Figure 11.bNo smear sample collected.
LOCKPORT, NEW YORK
TABLE 1
SUMMARY OF SURFACE ACTIVITY LEVELSFOR BUILDING 1
GUTERL SPECIALTY STEEL CORPORATION
Source: Radiological Survey of the Guterl Specialty Steel Corporation, Lockport, New York. T.J. Vitkus, Oak Ridge Institute for Science and Education, December 1999 (ORISE 99-1699).
East Work Room
West Work Room
Location Descriptiona Location # Total Activity (dpm/100 cm2)
Removable Activity (dpm/100 cm2)
North Room
South Room
Vitkus Rad Survey Tablesmsg6-1.xls
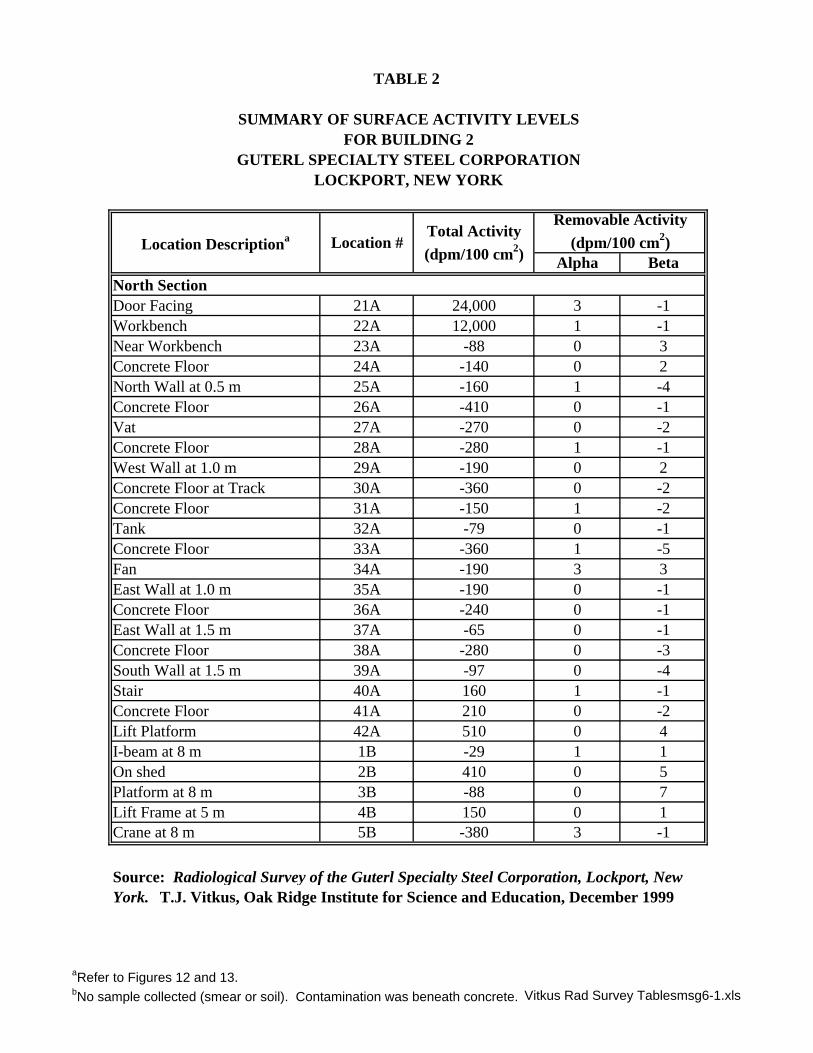
Alpha Beta
Door Facing 21A 24,000 3 -1Workbench 22A 12,000 1 -1Near Workbench 23A -88 0 3Concrete Floor 24A -140 0 2North Wall at 0.5 m 25A -160 1 -4Concrete Floor 26A -410 0 -1Vat 27A -270 0 -2Concrete Floor 28A -280 1 -1West Wall at 1.0 m 29A -190 0 2Concrete Floor at Track 30A -360 0 -2Concrete Floor 31A -150 1 -2Tank 32A -79 0 -1Concrete Floor 33A -360 1 -5Fan 34A -190 3 3East Wall at 1.0 m 35A -190 0 -1Concrete Floor 36A -240 0 -1East Wall at 1.5 m 37A -65 0 -1Concrete Floor 38A -280 0 -3South Wall at 1.5 m 39A -97 0 -4Stair 40A 160 1 -1Concrete Floor 41A 210 0 -2Lift Platform 42A 510 0 4I-beam at 8 m 1B -29 1 1On shed 2B 410 0 5Platform at 8 m 3B -88 0 7Lift Frame at 5 m 4B 150 0 1Crane at 8 m 5B -380 3 -1
Source: Radiological Survey of the Guterl Specialty Steel Corporation, Lockport, New York. T.J. Vitkus, Oak Ridge Institute for Science and Education, December 1999
Removable Activity (dpm/100 cm2)
North Section
Location Descriptiona Location #Total Activity (dpm/100 cm2)
TABLE 2
SUMMARY OF SURFACE ACTIVITY LEVELSFOR BUILDING 2
GUTERL SPECIALTY STEEL CORPORATIONLOCKPORT, NEW YORK
aRefer to Figures 12 and 13.bNo sample collected (smear or soil). Contamination was beneath concrete. Vitkus Rad Survey Tablesmsg6-1.xls
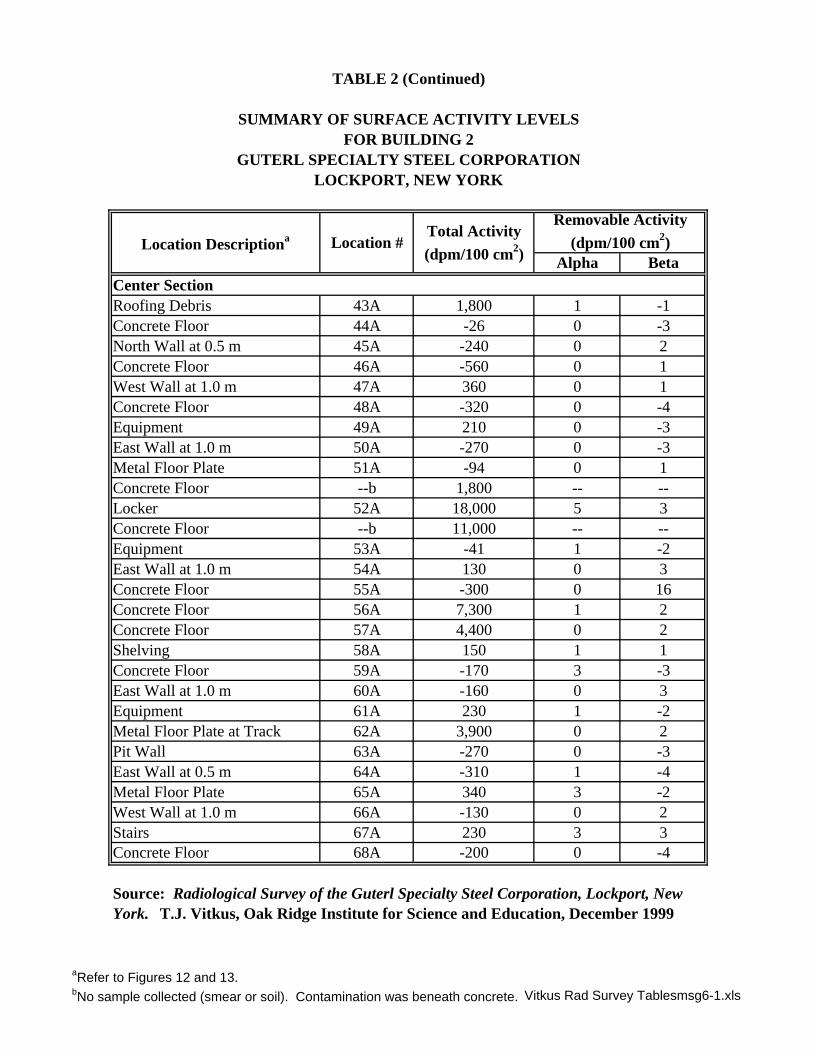
Alpha Beta
Roofing Debris 43A 1,800 1 -1Concrete Floor 44A -26 0 -3North Wall at 0.5 m 45A -240 0 2Concrete Floor 46A -560 0 1West Wall at 1.0 m 47A 360 0 1Concrete Floor 48A -320 0 -4Equipment 49A 210 0 -3East Wall at 1.0 m 50A -270 0 -3Metal Floor Plate 51A -94 0 1Concrete Floor --b 1,800 -- --Locker 52A 18,000 5 3Concrete Floor --b 11,000 -- --Equipment 53A -41 1 -2East Wall at 1.0 m 54A 130 0 3Concrete Floor 55A -300 0 16Concrete Floor 56A 7,300 1 2Concrete Floor 57A 4,400 0 2Shelving 58A 150 1 1Concrete Floor 59A -170 3 -3East Wall at 1.0 m 60A -160 0 3Equipment 61A 230 1 -2Metal Floor Plate at Track 62A 3,900 0 2Pit Wall 63A -270 0 -3East Wall at 0.5 m 64A -310 1 -4Metal Floor Plate 65A 340 3 -2West Wall at 1.0 m 66A -130 0 2Stairs 67A 230 3 3Concrete Floor 68A -200 0 -4
Center Section
Source: Radiological Survey of the Guterl Specialty Steel Corporation, Lockport, New York. T.J. Vitkus, Oak Ridge Institute for Science and Education, December 1999
Location Descriptiona Location #Total Activity (dpm/100 cm2)
Removable Activity (dpm/100 cm2)
FOR BUILDING 2GUTERL SPECIALTY STEEL CORPORATION
LOCKPORT, NEW YORK
TABLE 2 (Continued)
SUMMARY OF SURFACE ACTIVITY LEVELS
aRefer to Figures 12 and 13.bNo sample collected (smear or soil). Contamination was beneath concrete. Vitkus Rad Survey Tablesmsg6-1.xls
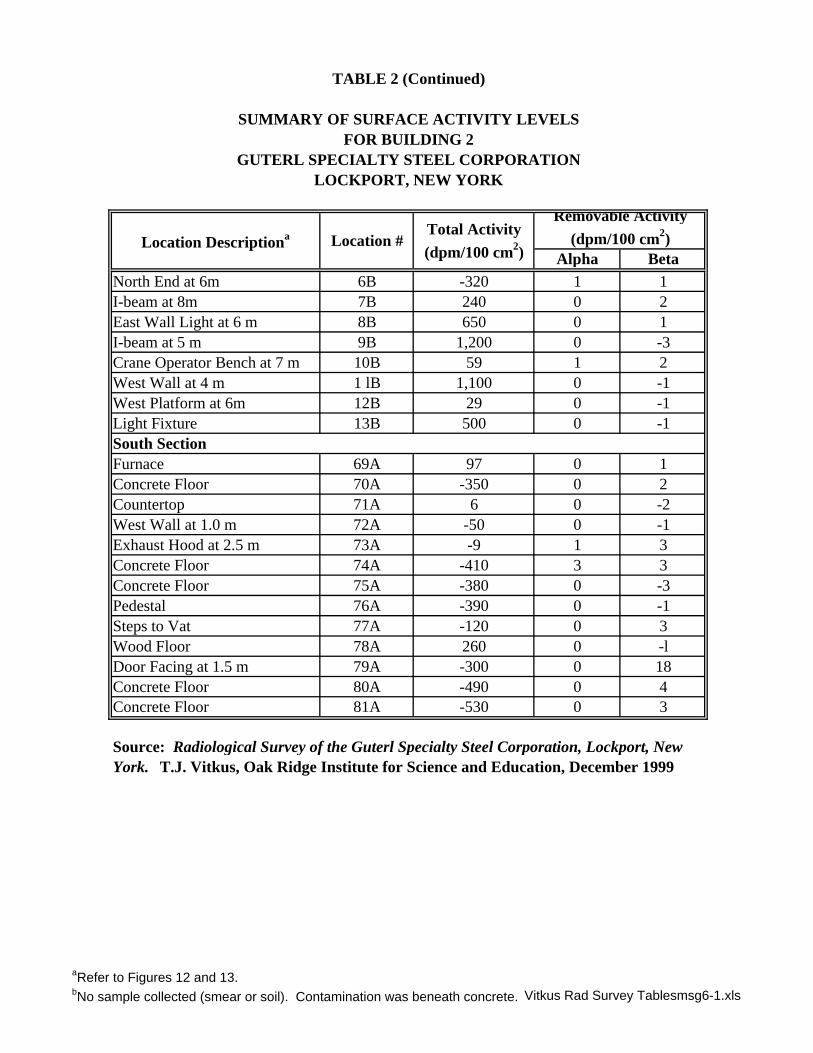
Alpha BetaNorth End at 6m 6B -320 1 1I-beam at 8m 7B 240 0 2East Wall Light at 6 m 8B 650 0 1I-beam at 5 m 9B 1,200 0 -3Crane Operator Bench at 7 m 10B 59 1 2West Wall at 4 m 1 lB 1,100 0 -1West Platform at 6m 12B 29 0 -1Light Fixture 13B 500 0 -1
Furnace 69A 97 0 1Concrete Floor 70A -350 0 2Countertop 71A 6 0 -2West Wall at 1.0 m 72A -50 0 -1Exhaust Hood at 2.5 m 73A -9 1 3Concrete Floor 74A -410 3 3Concrete Floor 75A -380 0 -3Pedestal 76A -390 0 -1Steps to Vat 77A -120 0 3Wood Floor 78A 260 0 -lDoor Facing at 1.5 m 79A -300 0 18Concrete Floor 80A -490 0 4Concrete Floor 81A -530 0 3
South Section
FOR BUILDING 2GUTERL SPECIALTY STEEL CORPORATION
LOCKPORT, NEW YORK
Location Descriptiona Location #Total Activity (dpm/100 cm2)
Removable Activity (dpm/100 cm2)
TABLE 2 (Continued)
SUMMARY OF SURFACE ACTIVITY LEVELS
Source: Radiological Survey of the Guterl Specialty Steel Corporation, Lockport, New York. T.J. Vitkus, Oak Ridge Institute for Science and Education, December 1999
aRefer to Figures 12 and 13.bNo sample collected (smear or soil). Contamination was beneath concrete. Vitkus Rad Survey Tablesmsg6-1.xls
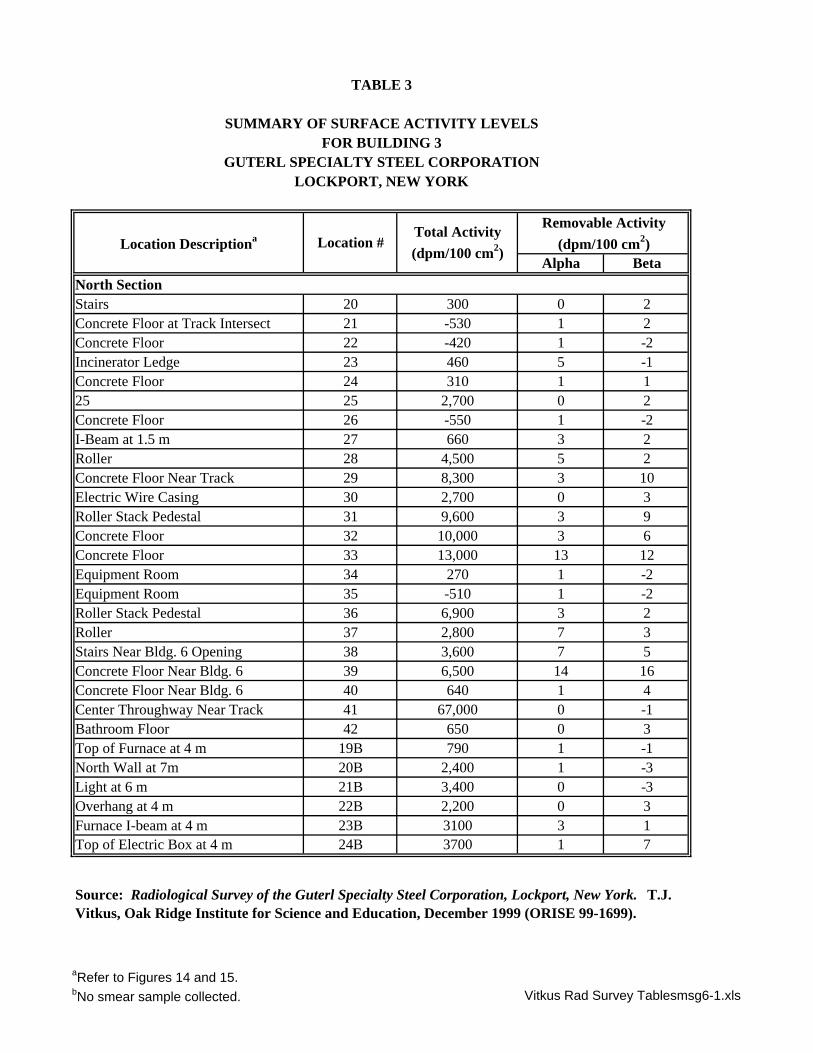
Alpha Beta
Stairs 20 300 0 2Concrete Floor at Track Intersect 21 -530 1 2Concrete Floor 22 -420 1 -2Incinerator Ledge 23 460 5 -1Concrete Floor 24 310 1 125 25 2,700 0 2Concrete Floor 26 -550 1 -2I-Beam at 1.5 m 27 660 3 2Roller 28 4,500 5 2Concrete Floor Near Track 29 8,300 3 10Electric Wire Casing 30 2,700 0 3Roller Stack Pedestal 31 9,600 3 9Concrete Floor 32 10,000 3 6Concrete Floor 33 13,000 13 12Equipment Room 34 270 1 -2Equipment Room 35 -510 1 -2Roller Stack Pedestal 36 6,900 3 2Roller 37 2,800 7 3Stairs Near Bldg. 6 Opening 38 3,600 7 5Concrete Floor Near Bldg. 6 39 6,500 14 16Concrete Floor Near Bldg. 6 40 640 1 4Center Throughway Near Track 41 67,000 0 -1Bathroom Floor 42 650 0 3Top of Furnace at 4 m 19B 790 1 -1North Wall at 7m 20B 2,400 1 -3Light at 6 m 21B 3,400 0 -3Overhang at 4 m 22B 2,200 0 3Furnace I-beam at 4 m 23B 3100 3 1Top of Electric Box at 4 m 24B 3700 1 7
TABLE 3
SUMMARY OF SURFACE ACTIVITY LEVELSFOR BUILDING 3
GUTERL SPECIALTY STEEL CORPORATIONLOCKPORT, NEW YORK
Location Descriptiona Location #Total Activity (dpm/100 cm2)
Removable Activity (dpm/100 cm2)
North Section
Source: Radiological Survey of the Guterl Specialty Steel Corporation, Lockport, New York. T.J. Vitkus, Oak Ridge Institute for Science and Education, December 1999 (ORISE 99-1699).
aRefer to Figures 14 and 15.bNo smear sample collected. Vitkus Rad Survey Tablesmsg6-1.xls
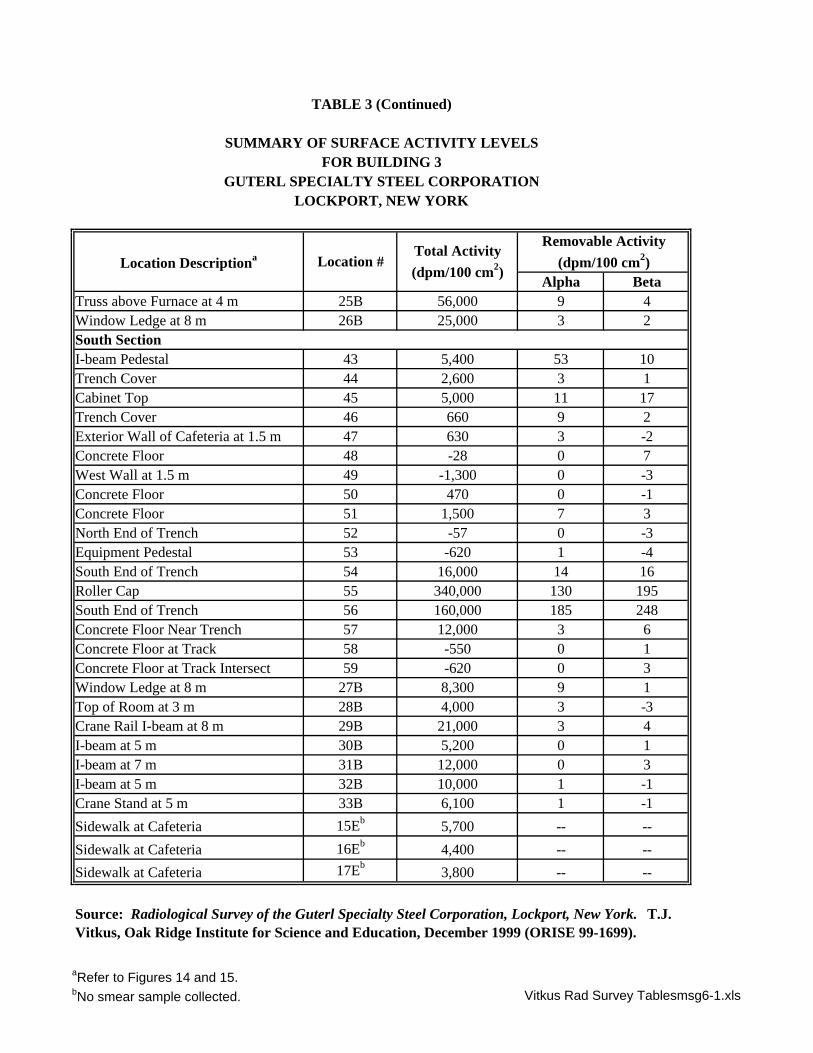
Alpha BetaTruss above Furnace at 4 m 25B 56,000 9 4Window Ledge at 8 m 26B 25,000 3 2
I-beam Pedestal 43 5,400 53 10Trench Cover 44 2,600 3 1Cabinet Top 45 5,000 11 17Trench Cover 46 660 9 2Exterior Wall of Cafeteria at 1.5 m 47 630 3 -2Concrete Floor 48 -28 0 7West Wall at 1.5 m 49 -1,300 0 -3Concrete Floor 50 470 0 -1Concrete Floor 51 1,500 7 3North End of Trench 52 -57 0 -3Equipment Pedestal 53 -620 1 -4South End of Trench 54 16,000 14 16Roller Cap 55 340,000 130 195South End of Trench 56 160,000 185 248Concrete Floor Near Trench 57 12,000 3 6Concrete Floor at Track 58 -550 0 1Concrete Floor at Track Intersect 59 -620 0 3Window Ledge at 8 m 27B 8,300 9 1Top of Room at 3 m 28B 4,000 3 -3Crane Rail I-beam at 8 m 29B 21,000 3 4I-beam at 5 m 30B 5,200 0 1I-beam at 7 m 31B 12,000 0 3I-beam at 5 m 32B 10,000 1 -1Crane Stand at 5 m 33B 6,100 1 -1
Sidewalk at Cafeteria 15Eb 5,700 -- --
Sidewalk at Cafeteria 16Eb 4,400 -- --
Sidewalk at Cafeteria 17Eb3,800 -- --
TABLE 3 (Continued)
SUMMARY OF SURFACE ACTIVITY LEVELS
Source: Radiological Survey of the Guterl Specialty Steel Corporation, Lockport, New York. T.J. Vitkus, Oak Ridge Institute for Science and Education, December 1999 (ORISE 99-1699).
South Section
FOR BUILDING 3GUTERL SPECIALTY STEEL CORPORATION
LOCKPORT, NEW YORK
Location Descriptiona Location #Total Activity (dpm/100 cm2)
Removable Activity (dpm/100 cm2)
aRefer to Figures 14 and 15.bNo smear sample collected. Vitkus Rad Survey Tablesmsg6-1.xls
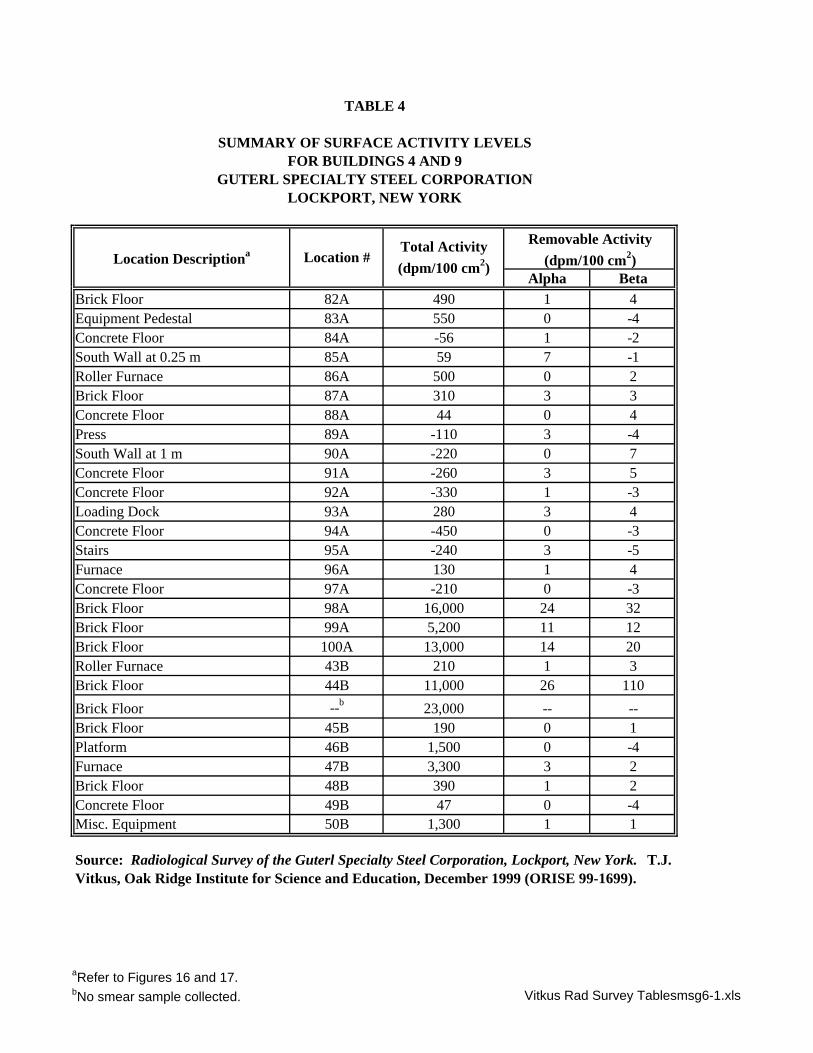
Alpha BetaBrick Floor 82A 490 1 4Equipment Pedestal 83A 550 0 -4Concrete Floor 84A -56 1 -2South Wall at 0.25 m 85A 59 7 -1Roller Furnace 86A 500 0 2Brick Floor 87A 310 3 3Concrete Floor 88A 44 0 4Press 89A -110 3 -4South Wall at 1 m 90A -220 0 7Concrete Floor 91A -260 3 5Concrete Floor 92A -330 1 -3Loading Dock 93A 280 3 4Concrete Floor 94A -450 0 -3Stairs 95A -240 3 -5Furnace 96A 130 1 4Concrete Floor 97A -210 0 -3Brick Floor 98A 16,000 24 32Brick Floor 99A 5,200 11 12Brick Floor 100A 13,000 14 20Roller Furnace 43B 210 1 3Brick Floor 44B 11,000 26 110
Brick Floor --b 23,000 -- --Brick Floor 45B 190 0 1Platform 46B 1,500 0 -4Furnace 47B 3,300 3 2Brick Floor 48B 390 1 2Concrete Floor 49B 47 0 -4Misc. Equipment 50B 1,300 1 1
Source: Radiological Survey of the Guterl Specialty Steel Corporation, Lockport, New York. T.J. Vitkus, Oak Ridge Institute for Science and Education, December 1999 (ORISE 99-1699).
Location Descriptiona Location #Total Activity (dpm/100 cm2)
Removable Activity (dpm/100 cm2)
TABLE 4
SUMMARY OF SURFACE ACTIVITY LEVELSFOR BUILDINGS 4 AND 9
GUTERL SPECIALTY STEEL CORPORATIONLOCKPORT, NEW YORK
aRefer to Figures 16 and 17.bNo smear sample collected. Vitkus Rad Survey Tablesmsg6-1.xls
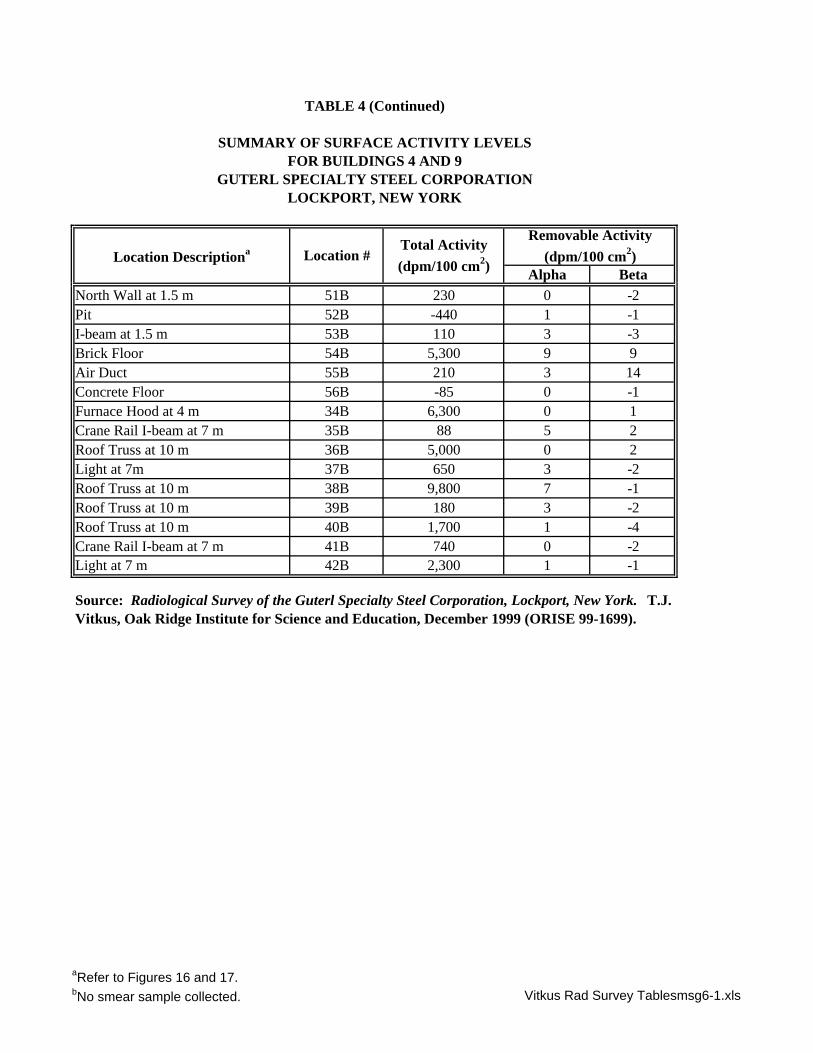
Alpha BetaNorth Wall at 1.5 m 51B 230 0 -2Pit 52B -440 1 -1I-beam at 1.5 m 53B 110 3 -3Brick Floor 54B 5,300 9 9Air Duct 55B 210 3 14Concrete Floor 56B -85 0 -1Furnace Hood at 4 m 34B 6,300 0 1Crane Rail I-beam at 7 m 35B 88 5 2Roof Truss at 10 m 36B 5,000 0 2Light at 7m 37B 650 3 -2Roof Truss at 10 m 38B 9,800 7 -1Roof Truss at 10 m 39B 180 3 -2Roof Truss at 10 m 40B 1,700 1 -4Crane Rail I-beam at 7 m 41B 740 0 -2Light at 7 m 42B 2,300 1 -1
Location Descriptiona Location #Total Activity (dpm/100 cm2)
Removable Activity (dpm/100 cm2)
FOR BUILDINGS 4 AND 9GUTERL SPECIALTY STEEL CORPORATION
LOCKPORT, NEW YORK
Source: Radiological Survey of the Guterl Specialty Steel Corporation, Lockport, New York. T.J. Vitkus, Oak Ridge Institute for Science and Education, December 1999 (ORISE 99-1699).
TABLE 4 (Continued)
SUMMARY OF SURFACE ACTIVITY LEVELS
aRefer to Figures 16 and 17.bNo smear sample collected. Vitkus Rad Survey Tablesmsg6-1.xls
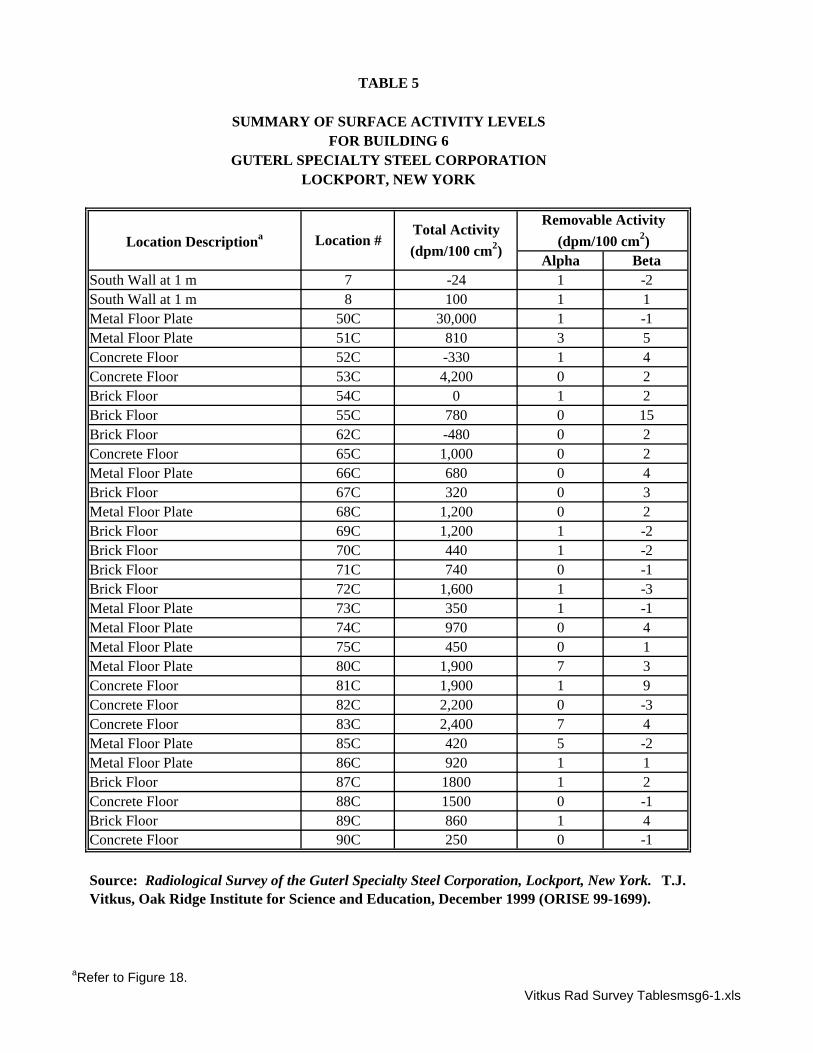
Alpha BetaSouth Wall at 1 m 7 -24 1 -2South Wall at 1 m 8 100 1 1Metal Floor Plate 50C 30,000 1 -1Metal Floor Plate 51C 810 3 5Concrete Floor 52C -330 1 4Concrete Floor 53C 4,200 0 2Brick Floor 54C 0 1 2Brick Floor 55C 780 0 15Brick Floor 62C -480 0 2Concrete Floor 65C 1,000 0 2Metal Floor Plate 66C 680 0 4Brick Floor 67C 320 0 3Metal Floor Plate 68C 1,200 0 2Brick Floor 69C 1,200 1 -2Brick Floor 70C 440 1 -2Brick Floor 71C 740 0 -1Brick Floor 72C 1,600 1 -3Metal Floor Plate 73C 350 1 -1Metal Floor Plate 74C 970 0 4Metal Floor Plate 75C 450 0 1Metal Floor Plate 80C 1,900 7 3Concrete Floor 81C 1,900 1 9Concrete Floor 82C 2,200 0 -3Concrete Floor 83C 2,400 7 4Metal Floor Plate 85C 420 5 -2Metal Floor Plate 86C 920 1 1Brick Floor 87C 1800 1 2Concrete Floor 88C 1500 0 -1Brick Floor 89C 860 1 4Concrete Floor 90C 250 0 -1
Source: Radiological Survey of the Guterl Specialty Steel Corporation, Lockport, New York. T.J. Vitkus, Oak Ridge Institute for Science and Education, December 1999 (ORISE 99-1699).
GUTERL SPECIALTY STEEL CORPORATIONLOCKPORT, NEW YORK
Location Descriptiona Location #Total Activity (dpm/100 cm2)
Removable Activity (dpm/100 cm2)
TABLE 5
SUMMARY OF SURFACE ACTIVITY LEVELSFOR BUILDING 6
aRefer to Figure 18.Vitkus Rad Survey Tablesmsg6-1.xls
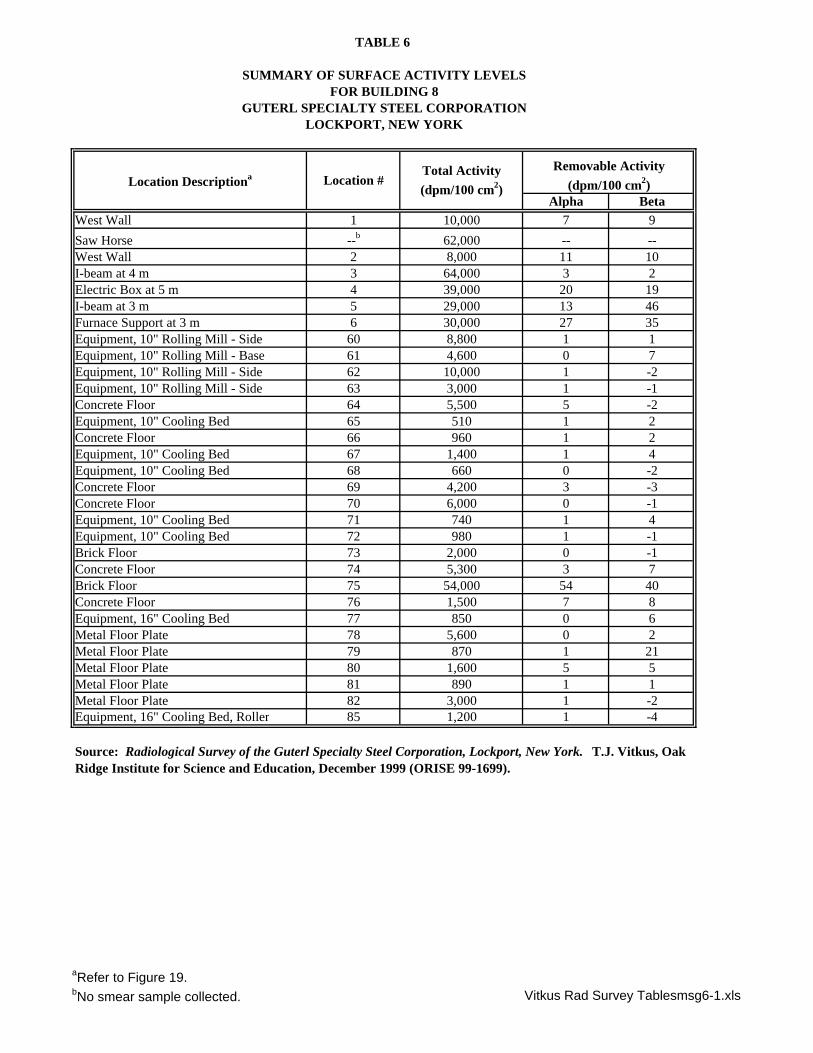
Alpha BetaWest Wall 1 10,000 7 9
Saw Horse --b 62,000 -- --West Wall 2 8,000 11 10I-beam at 4 m 3 64,000 3 2Electric Box at 5 m 4 39,000 20 19I-beam at 3 m 5 29,000 13 46Furnace Support at 3 m 6 30,000 27 35Equipment, 10" Rolling Mill - Side 60 8,800 1 1Equipment, 10" Rolling Mill - Base 61 4,600 0 7Equipment, 10" Rolling Mill - Side 62 10,000 1 -2Equipment, 10" Rolling Mill - Side 63 3,000 1 -1Concrete Floor 64 5,500 5 -2Equipment, 10" Cooling Bed 65 510 1 2Concrete Floor 66 960 1 2Equipment, 10" Cooling Bed 67 1,400 1 4Equipment, 10" Cooling Bed 68 660 0 -2Concrete Floor 69 4,200 3 -3Concrete Floor 70 6,000 0 -1Equipment, 10" Cooling Bed 71 740 1 4Equipment, 10" Cooling Bed 72 980 1 -1Brick Floor 73 2,000 0 -1Concrete Floor 74 5,300 3 7Brick Floor 75 54,000 54 40Concrete Floor 76 1,500 7 8Equipment, 16" Cooling Bed 77 850 0 6Metal Floor Plate 78 5,600 0 2Metal Floor Plate 79 870 1 21Metal Floor Plate 80 1,600 5 5Metal Floor Plate 81 890 1 1Metal Floor Plate 82 3,000 1 -2Equipment, 16" Cooling Bed, Roller 85 1,200 1 -4
GUTERL SPECIALTY STEEL CORPORATIONLOCKPORT, NEW YORK
Location Descriptiona Location #Total Activity (dpm/100 cm2)
Removable Activity (dpm/100 cm2)
TABLE 6
SUMMARY OF SURFACE ACTIVITY LEVELSFOR BUILDING 8
Source: Radiological Survey of the Guterl Specialty Steel Corporation, Lockport, New York. T.J. Vitkus, Oak Ridge Institute for Science and Education, December 1999 (ORISE 99-1699).
aRefer to Figure 19.bNo smear sample collected. Vitkus Rad Survey Tablesmsg6-1.xls
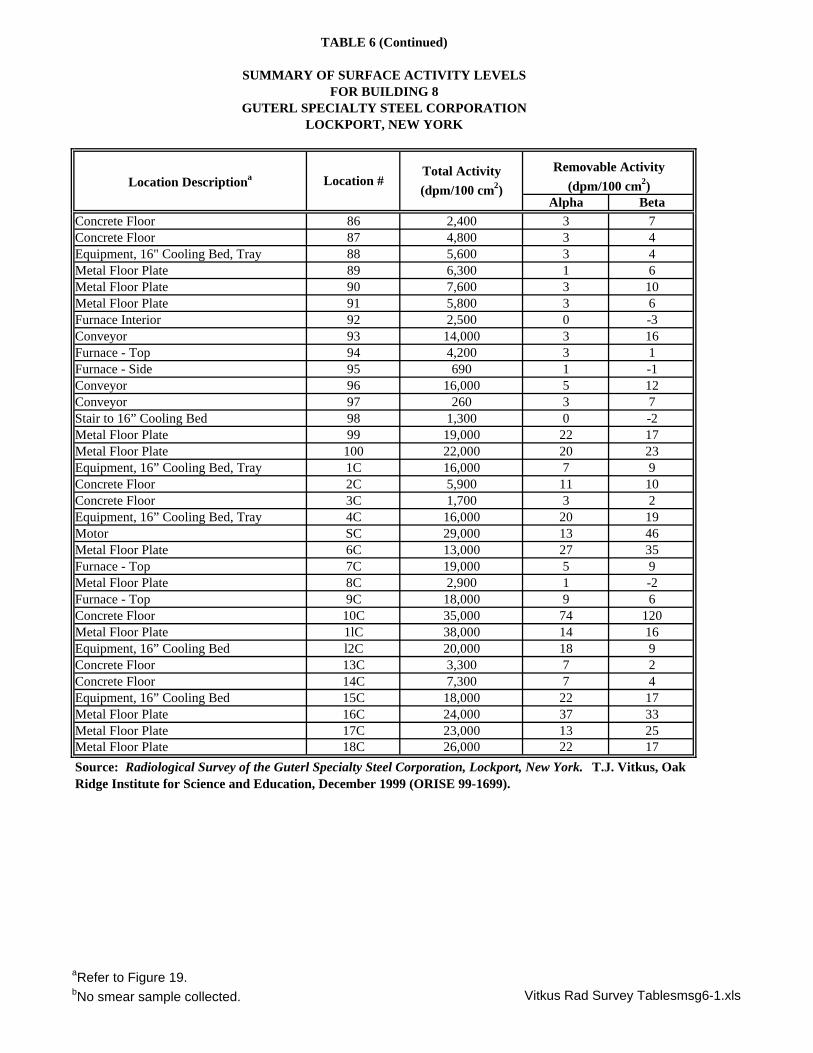
Alpha BetaConcrete Floor 86 2,400 3 7Concrete Floor 87 4,800 3 4Equipment, 16" Cooling Bed, Tray 88 5,600 3 4Metal Floor Plate 89 6,300 1 6Metal Floor Plate 90 7,600 3 10Metal Floor Plate 91 5,800 3 6Furnace Interior 92 2,500 0 -3Conveyor 93 14,000 3 16Furnace - Top 94 4,200 3 1Furnace - Side 95 690 1 -1Conveyor 96 16,000 5 12Conveyor 97 260 3 7Stair to 16” Cooling Bed 98 1,300 0 -2Metal Floor Plate 99 19,000 22 17Metal Floor Plate 100 22,000 20 23Equipment, 16” Cooling Bed, Tray 1C 16,000 7 9Concrete Floor 2C 5,900 11 10Concrete Floor 3C 1,700 3 2Equipment, 16” Cooling Bed, Tray 4C 16,000 20 19Motor SC 29,000 13 46Metal Floor Plate 6C 13,000 27 35Furnace - Top 7C 19,000 5 9Metal Floor Plate 8C 2,900 1 -2Furnace - Top 9C 18,000 9 6Concrete Floor 10C 35,000 74 120Metal Floor Plate 1lC 38,000 14 16Equipment, 16” Cooling Bed l2C 20,000 18 9Concrete Floor 13C 3,300 7 2Concrete Floor 14C 7,300 7 4Equipment, 16” Cooling Bed 15C 18,000 22 17Metal Floor Plate 16C 24,000 37 33Metal Floor Plate 17C 23,000 13 25Metal Floor Plate 18C 26,000 22 17
FOR BUILDING 8GUTERL SPECIALTY STEEL CORPORATION
LOCKPORT, NEW YORK
Location Descriptiona Location #Total Activity (dpm/100 cm2)
Removable Activity (dpm/100 cm2)
Source: Radiological Survey of the Guterl Specialty Steel Corporation, Lockport, New York. T.J. Vitkus, Oak Ridge Institute for Science and Education, December 1999 (ORISE 99-1699).
TABLE 6 (Continued)
SUMMARY OF SURFACE ACTIVITY LEVELS
aRefer to Figure 19.bNo smear sample collected. Vitkus Rad Survey Tablesmsg6-1.xls
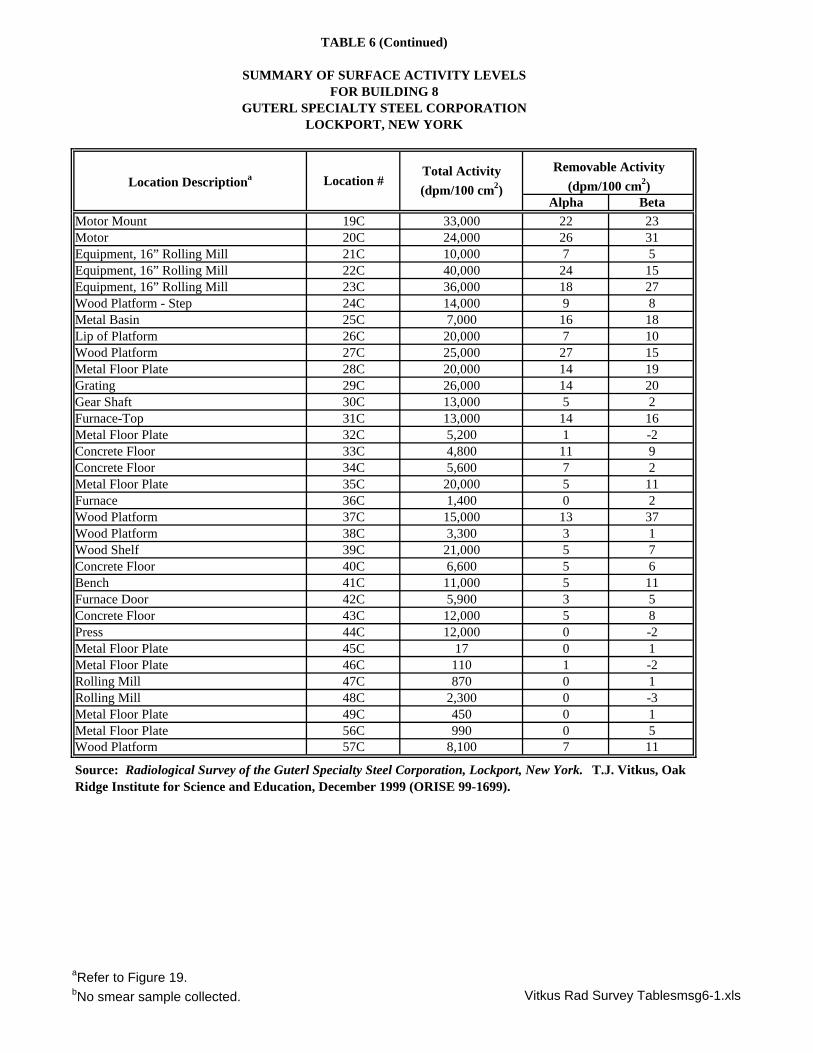
Alpha BetaMotor Mount 19C 33,000 22 23Motor 20C 24,000 26 31Equipment, 16” Rolling Mill 21C 10,000 7 5Equipment, 16” Rolling Mill 22C 40,000 24 15Equipment, 16” Rolling Mill 23C 36,000 18 27Wood Platform - Step 24C 14,000 9 8Metal Basin 25C 7,000 16 18Lip of Platform 26C 20,000 7 10Wood Platform 27C 25,000 27 15Metal Floor Plate 28C 20,000 14 19Grating 29C 26,000 14 20Gear Shaft 30C 13,000 5 2Furnace-Top 31C 13,000 14 16Metal Floor Plate 32C 5,200 1 -2Concrete Floor 33C 4,800 11 9Concrete Floor 34C 5,600 7 2Metal Floor Plate 35C 20,000 5 11Furnace 36C 1,400 0 2Wood Platform 37C 15,000 13 37Wood Platform 38C 3,300 3 1Wood Shelf 39C 21,000 5 7Concrete Floor 40C 6,600 5 6Bench 41C 11,000 5 11Furnace Door 42C 5,900 3 5Concrete Floor 43C 12,000 5 8Press 44C 12,000 0 -2Metal Floor Plate 45C 17 0 1Metal Floor Plate 46C 110 1 -2Rolling Mill 47C 870 0 1Rolling Mill 48C 2,300 0 -3Metal Floor Plate 49C 450 0 1Metal Floor Plate 56C 990 0 5Wood Platform 57C 8,100 7 11
TABLE 6 (Continued)
SUMMARY OF SURFACE ACTIVITY LEVELS
Location Descriptiona Location #Total Activity (dpm/100 cm2)
Removable Activity (dpm/100 cm2)
FOR BUILDING 8
LOCKPORT, NEW YORKGUTERL SPECIALTY STEEL CORPORATION
Source: Radiological Survey of the Guterl Specialty Steel Corporation, Lockport, New York. T.J. Vitkus, Oak Ridge Institute for Science and Education, December 1999 (ORISE 99-1699).
aRefer to Figure 19.bNo smear sample collected. Vitkus Rad Survey Tablesmsg6-1.xls
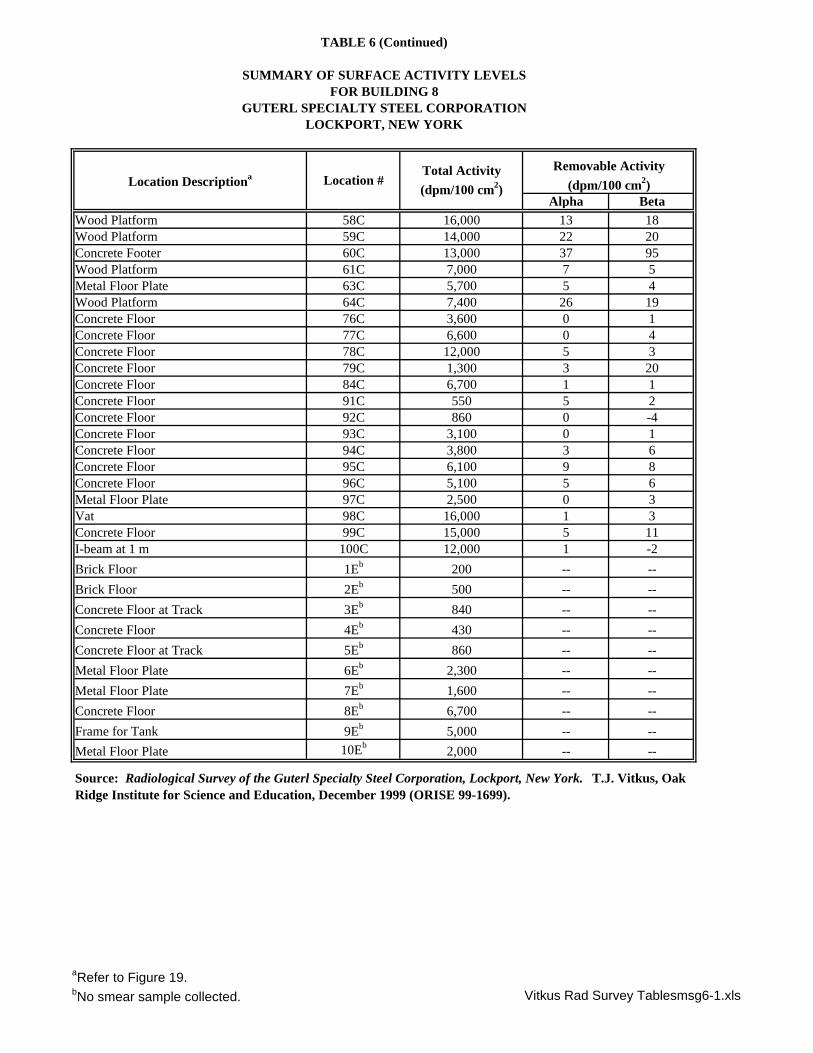
Alpha BetaWood Platform 58C 16,000 13 18Wood Platform 59C 14,000 22 20Concrete Footer 60C 13,000 37 95Wood Platform 61C 7,000 7 5Metal Floor Plate 63C 5,700 5 4Wood Platform 64C 7,400 26 19Concrete Floor 76C 3,600 0 1Concrete Floor 77C 6,600 0 4Concrete Floor 78C 12,000 5 3Concrete Floor 79C 1,300 3 20Concrete Floor 84C 6,700 1 1Concrete Floor 91C 550 5 2Concrete Floor 92C 860 0 -4Concrete Floor 93C 3,100 0 1Concrete Floor 94C 3,800 3 6Concrete Floor 95C 6,100 9 8Concrete Floor 96C 5,100 5 6Metal Floor Plate 97C 2,500 0 3Vat 98C 16,000 1 3Concrete Floor 99C 15,000 5 11I-beam at 1 m 100C 12,000 1 -2
Brick Floor 1Eb 200 -- --
Brick Floor 2Eb 500 -- --
Concrete Floor at Track 3Eb 840 -- --
Concrete Floor 4Eb 430 -- --
Concrete Floor at Track 5Eb 860 -- --
Metal Floor Plate 6Eb 2,300 -- --
Metal Floor Plate 7Eb 1,600 -- --
Concrete Floor 8Eb 6,700 -- --
Frame for Tank 9Eb 5,000 -- --Metal Floor Plate 10Eb 2,000 -- --
TABLE 6 (Continued)
SUMMARY OF SURFACE ACTIVITY LEVELSFOR BUILDING 8
GUTERL SPECIALTY STEEL CORPORATIONLOCKPORT, NEW YORK
Location Descriptiona Location #Total Activity (dpm/100 cm2)
Removable Activity (dpm/100 cm2)
Source: Radiological Survey of the Guterl Specialty Steel Corporation, Lockport, New York. T.J. Vitkus, Oak Ridge Institute for Science and Education, December 1999 (ORISE 99-1699).
aRefer to Figure 19.bNo smear sample collected. Vitkus Rad Survey Tablesmsg6-1.xls
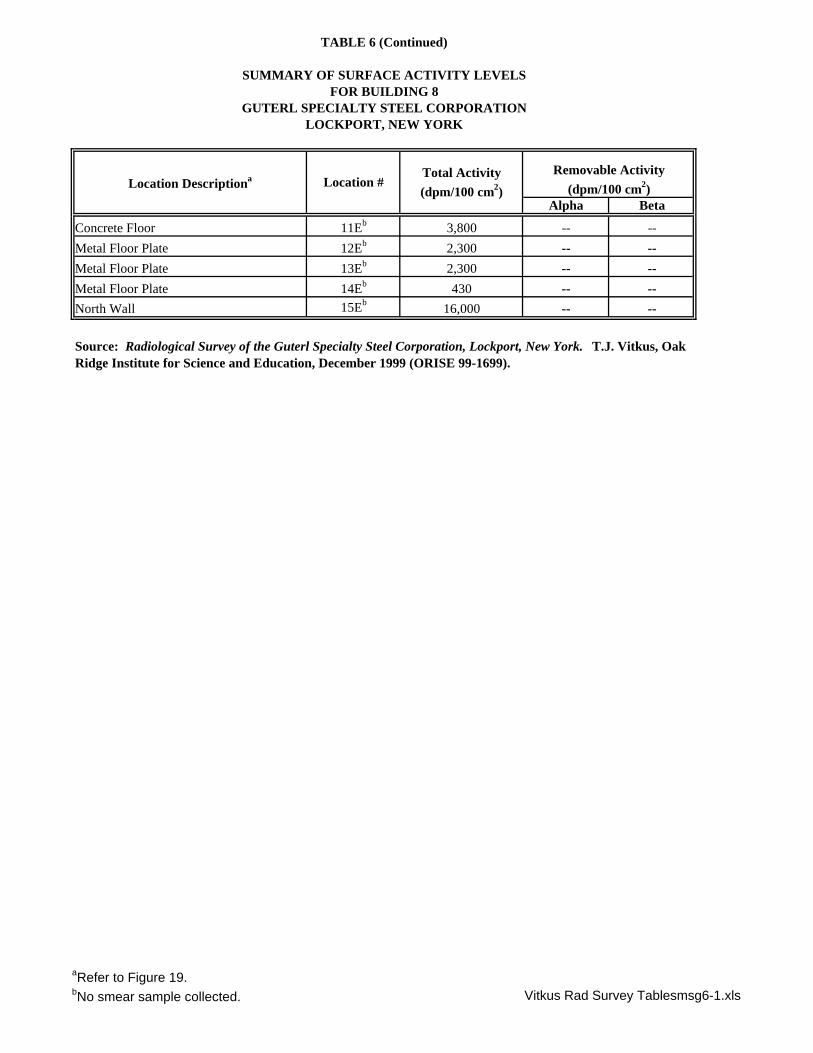
Alpha Beta
Concrete Floor 11Eb 3,800 -- --
Metal Floor Plate 12Eb 2,300 -- --
Metal Floor Plate 13Eb 2,300 -- --
Metal Floor Plate 14Eb 430 -- --North Wall 15Eb 16,000 -- --
FOR BUILDING 8GUTERL SPECIALTY STEEL CORPORATION
LOCKPORT, NEW YORK
TABLE 6 (Continued)
Removable Activity (dpm/100 cm2)
SUMMARY OF SURFACE ACTIVITY LEVELS
Source: Radiological Survey of the Guterl Specialty Steel Corporation, Lockport, New York. T.J. Vitkus, Oak Ridge Institute for Science and Education, December 1999 (ORISE 99-1699).
Location Descriptiona Location #Total Activity (dpm/100 cm2)
aRefer to Figure 19.bNo smear sample collected. Vitkus Rad Survey Tablesmsg6-1.xls
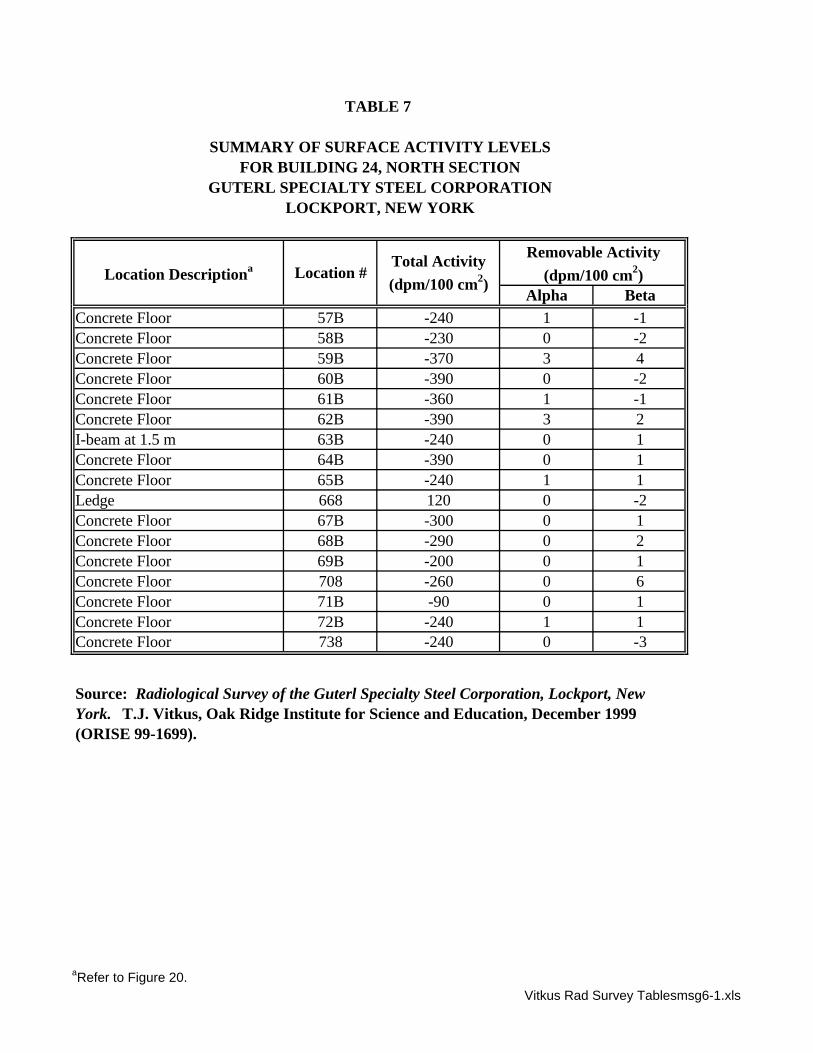
Alpha BetaConcrete Floor 57B -240 1 -1Concrete Floor 58B -230 0 -2Concrete Floor 59B -370 3 4Concrete Floor 60B -390 0 -2Concrete Floor 61B -360 1 -1Concrete Floor 62B -390 3 2I-beam at 1.5 m 63B -240 0 1Concrete Floor 64B -390 0 1Concrete Floor 65B -240 1 1Ledge 668 120 0 -2Concrete Floor 67B -300 0 1Concrete Floor 68B -290 0 2Concrete Floor 69B -200 0 1Concrete Floor 708 -260 0 6Concrete Floor 71B -90 0 1Concrete Floor 72B -240 1 1Concrete Floor 738 -240 0 -3
TABLE 7
SUMMARY OF SURFACE ACTIVITY LEVELSFOR BUILDING 24, NORTH SECTION
Source: Radiological Survey of the Guterl Specialty Steel Corporation, Lockport, New York. T.J. Vitkus, Oak Ridge Institute for Science and Education, December 1999 (ORISE 99-1699).
GUTERL SPECIALTY STEEL CORPORATIONLOCKPORT, NEW YORK
Location Descriptiona Location #Total Activity (dpm/100 cm2)
Removable Activity (dpm/100 cm2)
aRefer to Figure 20.Vitkus Rad Survey Tablesmsg6-1.xls
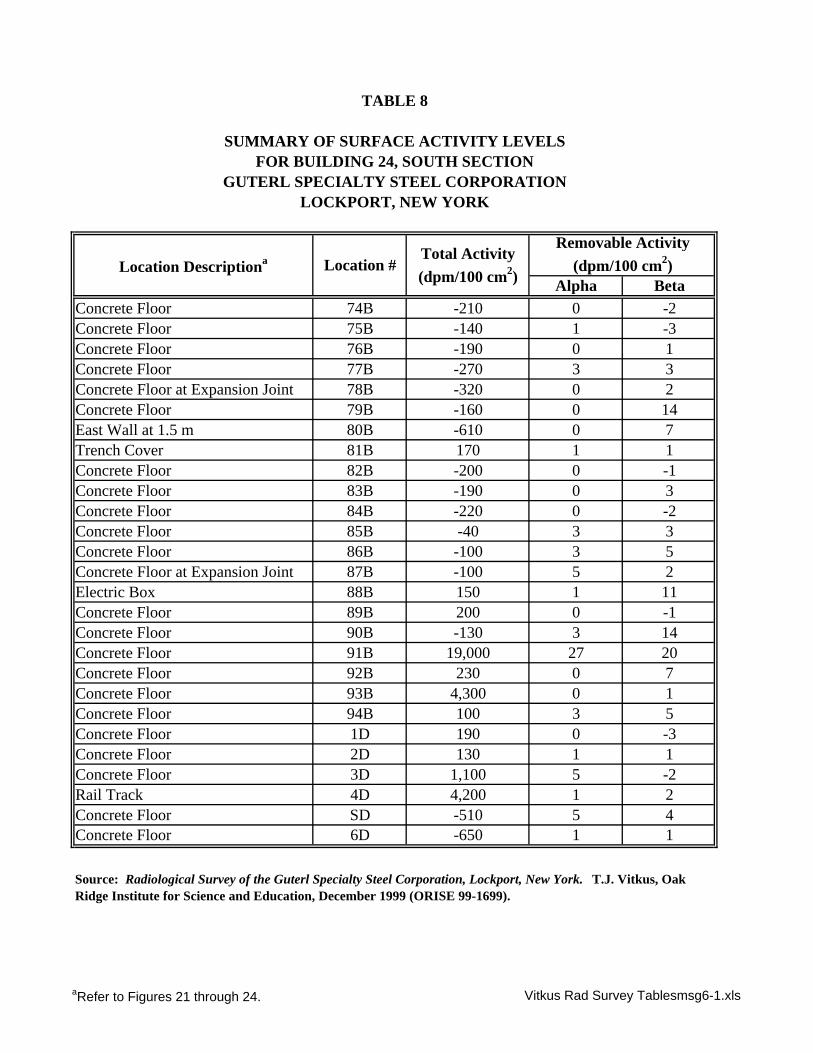
Alpha BetaConcrete Floor 74B -210 0 -2Concrete Floor 75B -140 1 -3Concrete Floor 76B -190 0 1Concrete Floor 77B -270 3 3Concrete Floor at Expansion Joint 78B -320 0 2Concrete Floor 79B -160 0 14East Wall at 1.5 m 80B -610 0 7Trench Cover 81B 170 1 1Concrete Floor 82B -200 0 -1Concrete Floor 83B -190 0 3Concrete Floor 84B -220 0 -2Concrete Floor 85B -40 3 3Concrete Floor 86B -100 3 5Concrete Floor at Expansion Joint 87B -100 5 2Electric Box 88B 150 1 11Concrete Floor 89B 200 0 -1Concrete Floor 90B -130 3 14Concrete Floor 91B 19,000 27 20Concrete Floor 92B 230 0 7Concrete Floor 93B 4,300 0 1Concrete Floor 94B 100 3 5Concrete Floor 1D 190 0 -3Concrete Floor 2D 130 1 1Concrete Floor 3D 1,100 5 -2Rail Track 4D 4,200 1 2Concrete Floor SD -510 5 4Concrete Floor 6D -650 1 1
TABLE 8
SUMMARY OF SURFACE ACTIVITY LEVELSFOR BUILDING 24, SOUTH SECTION
GUTERL SPECIALTY STEEL CORPORATIONLOCKPORT, NEW YORK
Location Descriptiona Location #Total Activity (dpm/100 cm2)
Removable Activity (dpm/100 cm2)
Source: Radiological Survey of the Guterl Specialty Steel Corporation, Lockport, New York. T.J. Vitkus, Oak Ridge Institute for Science and Education, December 1999 (ORISE 99-1699).
aRefer to Figures 21 through 24. Vitkus Rad Survey Tablesmsg6-1.xls
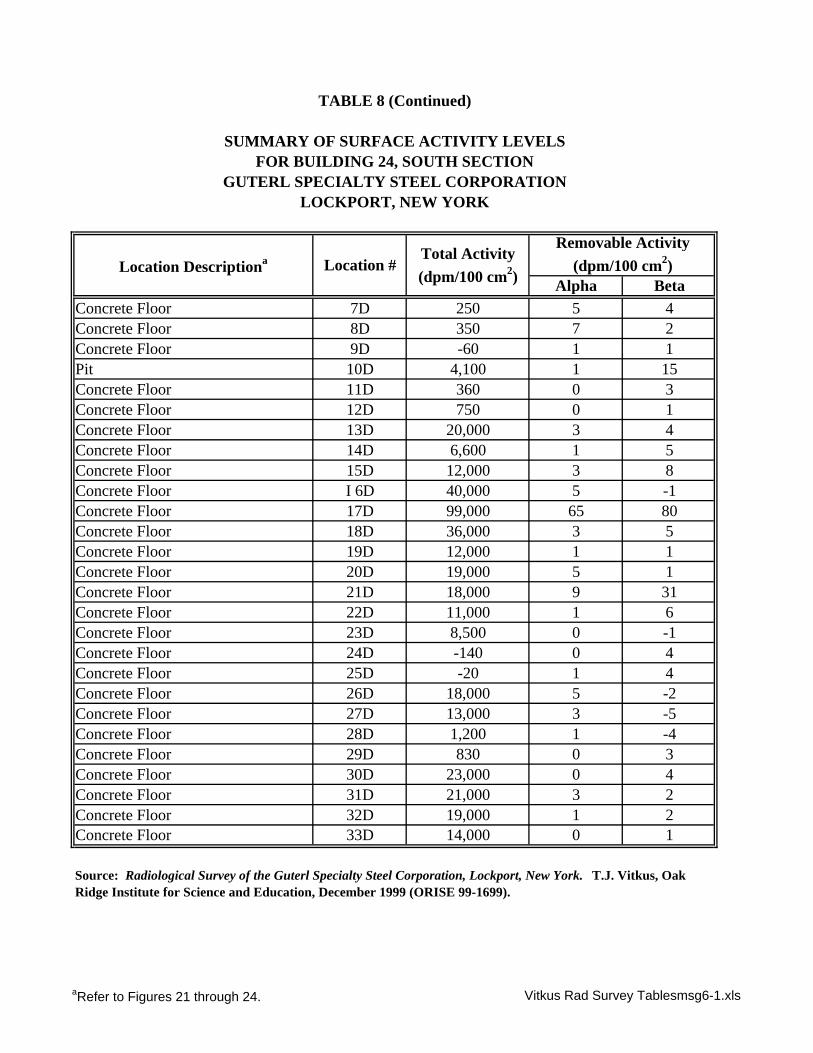
Alpha BetaConcrete Floor 7D 250 5 4Concrete Floor 8D 350 7 2Concrete Floor 9D -60 1 1Pit 10D 4,100 1 15Concrete Floor 11D 360 0 3Concrete Floor 12D 750 0 1Concrete Floor 13D 20,000 3 4Concrete Floor 14D 6,600 1 5Concrete Floor 15D 12,000 3 8Concrete Floor I 6D 40,000 5 -1Concrete Floor 17D 99,000 65 80Concrete Floor 18D 36,000 3 5Concrete Floor 19D 12,000 1 1Concrete Floor 20D 19,000 5 1Concrete Floor 21D 18,000 9 31Concrete Floor 22D 11,000 1 6Concrete Floor 23D 8,500 0 -1Concrete Floor 24D -140 0 4Concrete Floor 25D -20 1 4Concrete Floor 26D 18,000 5 -2Concrete Floor 27D 13,000 3 -5Concrete Floor 28D 1,200 1 -4Concrete Floor 29D 830 0 3Concrete Floor 30D 23,000 0 4Concrete Floor 31D 21,000 3 2Concrete Floor 32D 19,000 1 2Concrete Floor 33D 14,000 0 1
TABLE 8 (Continued)
SUMMARY OF SURFACE ACTIVITY LEVELSFOR BUILDING 24, SOUTH SECTION
GUTERL SPECIALTY STEEL CORPORATIONLOCKPORT, NEW YORK
Location Descriptiona Location #Total Activity (dpm/100 cm2)
Removable Activity (dpm/100 cm2)
Source: Radiological Survey of the Guterl Specialty Steel Corporation, Lockport, New York. T.J. Vitkus, Oak Ridge Institute for Science and Education, December 1999 (ORISE 99-1699).
aRefer to Figures 21 through 24. Vitkus Rad Survey Tablesmsg6-1.xls
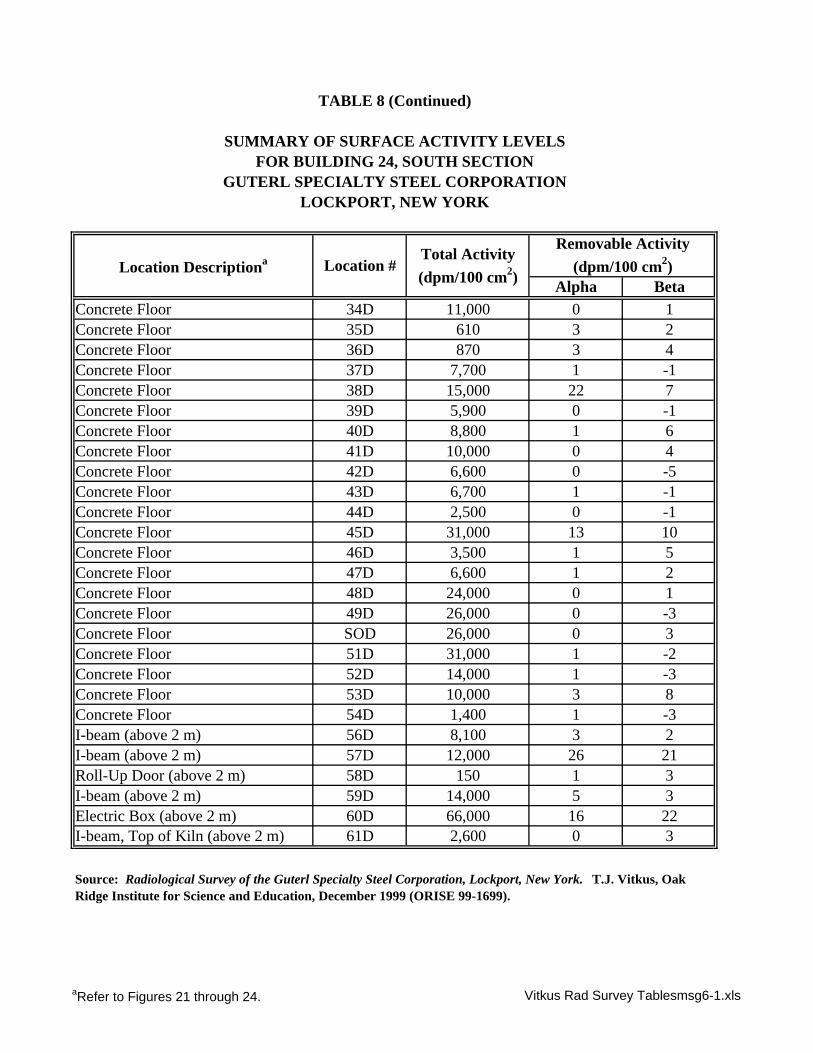
Alpha BetaConcrete Floor 34D 11,000 0 1Concrete Floor 35D 610 3 2Concrete Floor 36D 870 3 4Concrete Floor 37D 7,700 1 -1Concrete Floor 38D 15,000 22 7Concrete Floor 39D 5,900 0 -1Concrete Floor 40D 8,800 1 6Concrete Floor 41D 10,000 0 4Concrete Floor 42D 6,600 0 -5Concrete Floor 43D 6,700 1 -1Concrete Floor 44D 2,500 0 -1Concrete Floor 45D 31,000 13 10Concrete Floor 46D 3,500 1 5Concrete Floor 47D 6,600 1 2Concrete Floor 48D 24,000 0 1Concrete Floor 49D 26,000 0 -3Concrete Floor SOD 26,000 0 3Concrete Floor 51D 31,000 1 -2Concrete Floor 52D 14,000 1 -3Concrete Floor 53D 10,000 3 8Concrete Floor 54D 1,400 1 -3I-beam (above 2 m) 56D 8,100 3 2I-beam (above 2 m) 57D 12,000 26 21Roll-Up Door (above 2 m) 58D 150 1 3I-beam (above 2 m) 59D 14,000 5 3Electric Box (above 2 m) 60D 66,000 16 22I-beam, Top of Kiln (above 2 m) 61D 2,600 0 3
TABLE 8 (Continued)
SUMMARY OF SURFACE ACTIVITY LEVELSFOR BUILDING 24, SOUTH SECTION
GUTERL SPECIALTY STEEL CORPORATIONLOCKPORT, NEW YORK
Location Descriptiona Location #Total Activity (dpm/100 cm2)
Removable Activity (dpm/100 cm2)
Source: Radiological Survey of the Guterl Specialty Steel Corporation, Lockport, New York. T.J. Vitkus, Oak Ridge Institute for Science and Education, December 1999 (ORISE 99-1699).
aRefer to Figures 21 through 24. Vitkus Rad Survey Tablesmsg6-1.xls
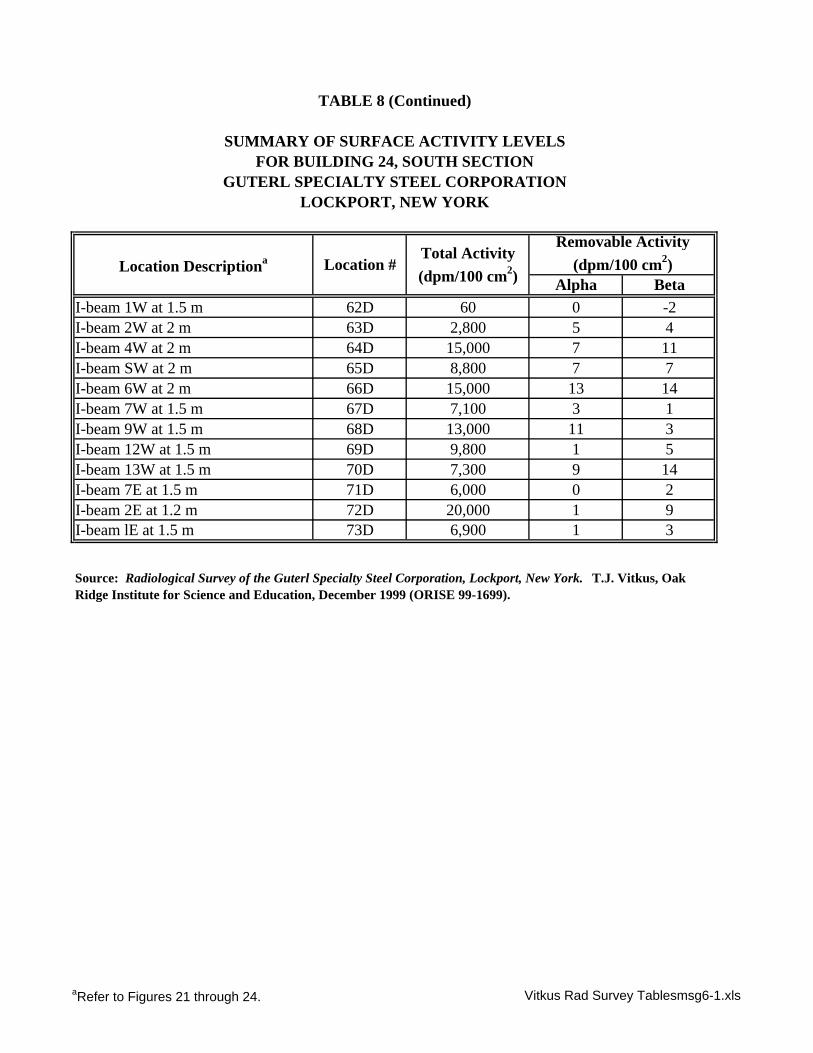
Alpha BetaI-beam 1W at 1.5 m 62D 60 0 -2I-beam 2W at 2 m 63D 2,800 5 4I-beam 4W at 2 m 64D 15,000 7 11I-beam SW at 2 m 65D 8,800 7 7I-beam 6W at 2 m 66D 15,000 13 14I-beam 7W at 1.5 m 67D 7,100 3 1I-beam 9W at 1.5 m 68D 13,000 11 3I-beam 12W at 1.5 m 69D 9,800 1 5I-beam 13W at 1.5 m 70D 7,300 9 14I-beam 7E at 1.5 m 71D 6,000 0 2I-beam 2E at 1.2 m 72D 20,000 1 9I-beam lE at 1.5 m 73D 6,900 1 3
SUMMARY OF SURFACE ACTIVITY LEVELSFOR BUILDING 24, SOUTH SECTION
GUTERL SPECIALTY STEEL CORPORATION
Source: Radiological Survey of the Guterl Specialty Steel Corporation, Lockport, New York. T.J. Vitkus, Oak Ridge Institute for Science and Education, December 1999 (ORISE 99-1699).
LOCKPORT, NEW YORK
Location Descriptiona Location #Total Activity (dpm/100 cm2)
Removable Activity (dpm/100 cm2)
TABLE 8 (Continued)
aRefer to Figures 21 through 24. Vitkus Rad Survey Tablesmsg6-1.xls
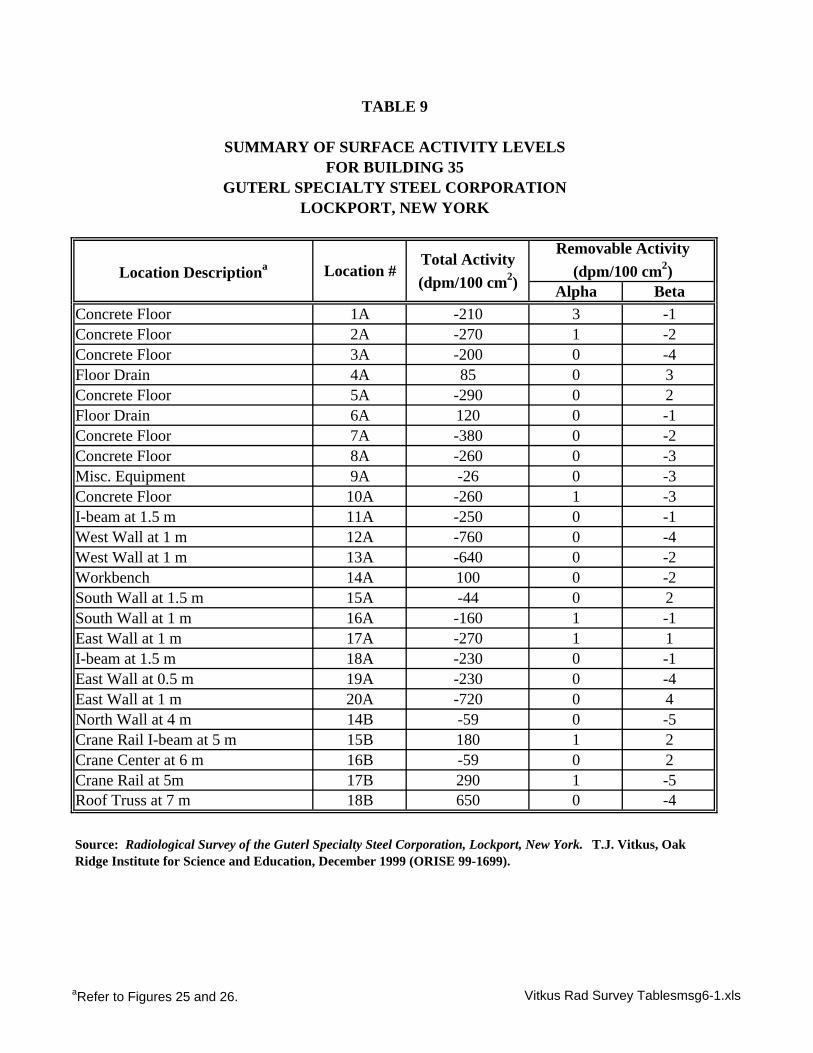
Alpha BetaConcrete Floor 1A -210 3 -1Concrete Floor 2A -270 1 -2Concrete Floor 3A -200 0 -4Floor Drain 4A 85 0 3Concrete Floor 5A -290 0 2Floor Drain 6A 120 0 -1Concrete Floor 7A -380 0 -2Concrete Floor 8A -260 0 -3Misc. Equipment 9A -26 0 -3Concrete Floor 10A -260 1 -3I-beam at 1.5 m 11A -250 0 -1West Wall at 1 m 12A -760 0 -4West Wall at 1 m 13A -640 0 -2Workbench 14A 100 0 -2South Wall at 1.5 m 15A -44 0 2South Wall at 1 m 16A -160 1 -1East Wall at 1 m 17A -270 1 1I-beam at 1.5 m 18A -230 0 -1East Wall at 0.5 m 19A -230 0 -4East Wall at 1 m 20A -720 0 4North Wall at 4 m 14B -59 0 -5Crane Rail I-beam at 5 m 15B 180 1 2Crane Center at 6 m 16B -59 0 2Crane Rail at 5m 17B 290 1 -5Roof Truss at 7 m 18B 650 0 -4
Source: Radiological Survey of the Guterl Specialty Steel Corporation, Lockport, New York. T.J. Vitkus, Oak Ridge Institute for Science and Education, December 1999 (ORISE 99-1699).
GUTERL SPECIALTY STEEL CORPORATIONLOCKPORT, NEW YORK
Location Descriptiona Location #Total Activity (dpm/100 cm2)
Removable Activity (dpm/100 cm2)
TABLE 9
SUMMARY OF SURFACE ACTIVITY LEVELSFOR BUILDING 35
aRefer to Figures 25 and 26. Vitkus Rad Survey Tablesmsg6-1.xls
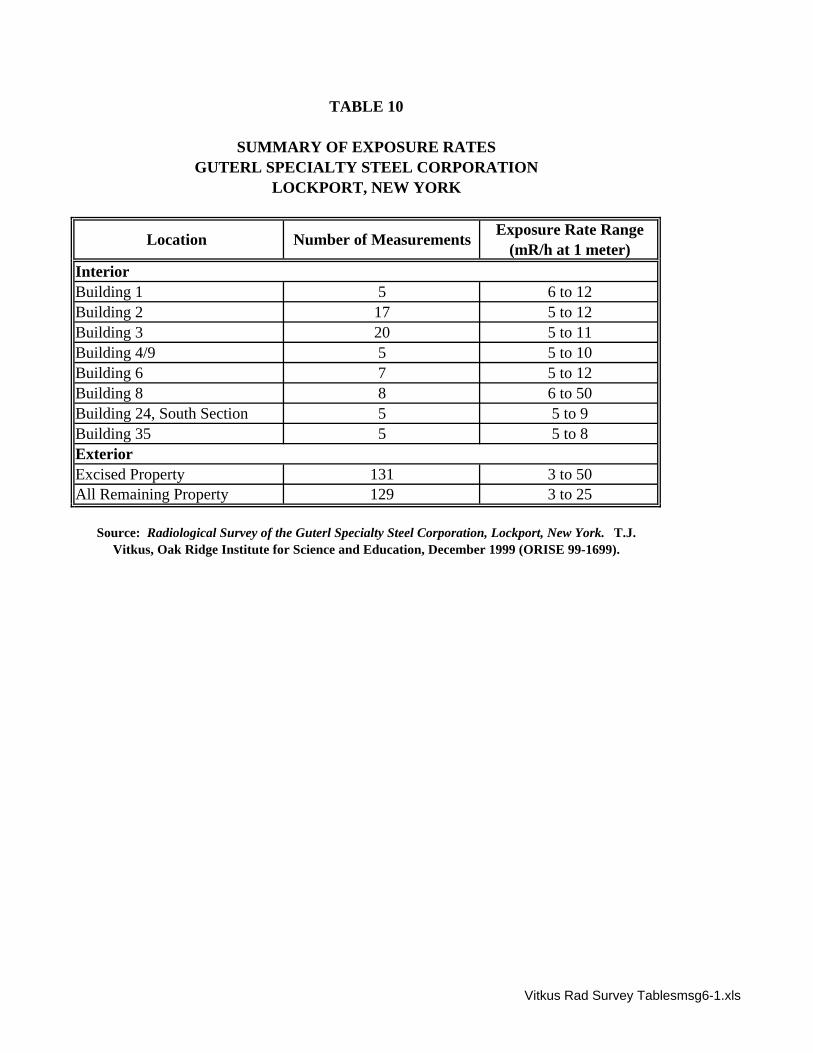
Building 1 5 6 to 12Building 2 17 5 to 12Building 3 20 5 to 11Building 4/9 5 5 to 10Building 6 7 5 to 12Building 8 8 6 to 50Building 24, South Section 5 5 to 9Building 35 5 5 to 8
Excised Property 131 3 to 50All Remaining Property 129 3 to 25
Source: Radiological Survey of the Guterl Specialty Steel Corporation, Lockport, New York. T.J. Vitkus, Oak Ridge Institute for Science and Education, December 1999 (ORISE 99-1699).
TABLE 10
Interior
Exterior
SUMMARY OF EXPOSURE RATESGUTERL SPECIALTY STEEL CORPORATION
LOCKPORT, NEW YORK
Location Number of MeasurementsExposure Rate Range
(mR/h at 1 meter)
Vitkus Rad Survey Tablesmsg6-1.xls
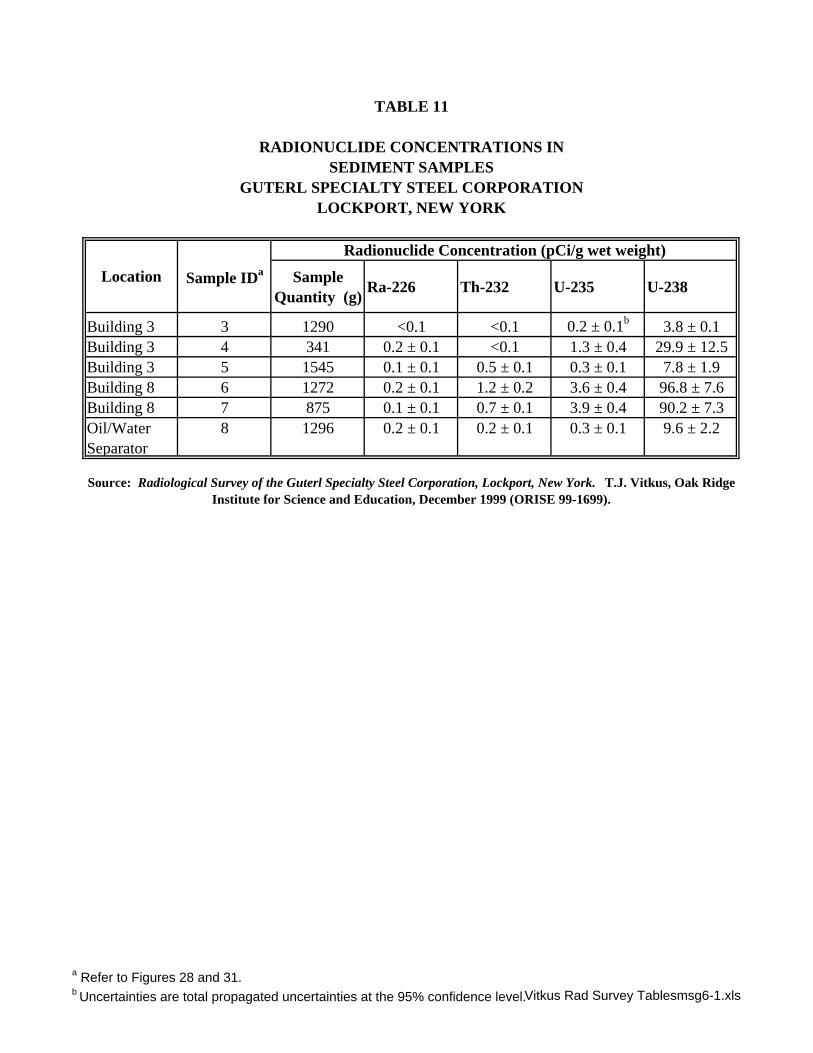
Sample Quantity (g)
Ra-226 Th-232 U-235 U-238
Building 3 3 1290 <0.1 <0.1 0.2 ± 0.1b 3.8 ± 0.1Building 3 4 341 0.2 ± 0.1 <0.1 1.3 ± 0.4 29.9 ± 12.5Building 3 5 1545 0.1 ± 0.1 0.5 ± 0.1 0.3 ± 0.1 7.8 ± 1.9Building 8 6 1272 0.2 ± 0.1 1.2 ± 0.2 3.6 ± 0.4 96.8 ± 7.6Building 8 7 875 0.1 ± 0.1 0.7 ± 0.1 3.9 ± 0.4 90.2 ± 7.3Oil/Water Separator
8 1296 0.2 ± 0.1 0.2 ± 0.1 0.3 ± 0.1 9.6 ± 2.2
Source: Radiological Survey of the Guterl Specialty Steel Corporation, Lockport, New York. T.J. Vitkus, Oak Ridge Institute for Science and Education, December 1999 (ORISE 99-1699).
Radionuclide Concentration (pCi/g wet weight)
Sample IDa
TABLE 11
RADIONUCLIDE CONCENTRATIONS IN
GUTERL SPECIALTY STEEL CORPORATIONLOCKPORT, NEW YORK
SEDIMENT SAMPLES
Location
a Refer to Figures 28 and 31.b Uncertainties are total propagated uncertainties at the 95% confidence level.Vitkus Rad Survey Tablesmsg6-1.xls
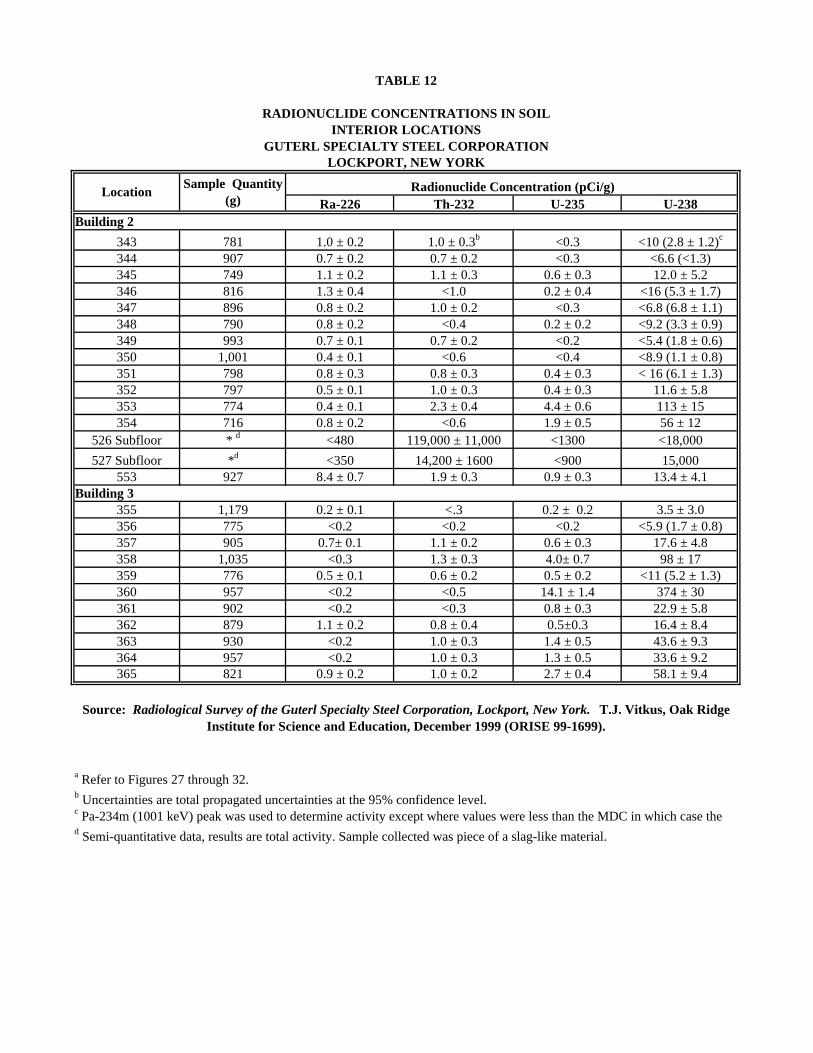
Ra-226 Th-232 U-235 U-238
343 781 1.0 ± 0.2 1.0 ± 0.3b <0.3 <10 (2.8 ± 1.2)c
344 907 0.7 ± 0.2 0.7 ± 0.2 <0.3 <6.6 (<1.3)345 749 1.1 ± 0.2 1.1 ± 0.3 0.6 ± 0.3 12.0 ± 5.2346 816 1.3 ± 0.4 <1.0 0.2 ± 0.4 <16 (5.3 ± 1.7)347 896 0.8 ± 0.2 1.0 ± 0.2 <0.3 <6.8 (6.8 ± 1.1)348 790 0.8 ± 0.2 <0.4 0.2 ± 0.2 <9.2 (3.3 ± 0.9)349 993 0.7 ± 0.1 0.7 ± 0.2 <0.2 <5.4 (1.8 ± 0.6)350 1,001 0.4 ± 0.1 <0.6 <0.4 <8.9 (1.1 ± 0.8)351 798 0.8 ± 0.3 0.8 ± 0.3 0.4 ± 0.3 < 16 (6.1 ± 1.3)352 797 0.5 ± 0.1 1.0 ± 0.3 0.4 ± 0.3 11.6 ± 5.8353 774 0.4 ± 0.1 2.3 ± 0.4 4.4 ± 0.6 113 ± 15354 716 0.8 ± 0.2 <0.6 1.9 ± 0.5 56 ± 12
526 Subfloor * d <480 119,000 ± 11,000 <1300 <18,000
527 Subfloor *d <350 14,200 ± 1600 <900 15,000553 927 8.4 ± 0.7 1.9 ± 0.3 0.9 ± 0.3 13.4 ± 4.1
355 1,179 0.2 ± 0.1 <.3 0.2 ± 0.2 3.5 ± 3.0356 775 <0.2 <0.2 <0.2 <5.9 (1.7 ± 0.8)357 905 0.7± 0.1 1.1 ± 0.2 0.6 ± 0.3 17.6 ± 4.8358 1,035 <0.3 1.3 ± 0.3 4.0± 0.7 98 ± 17359 776 0.5 ± 0.1 0.6 ± 0.2 0.5 ± 0.2 <11 (5.2 ± 1.3)360 957 <0.2 <0.5 14.1 ± 1.4 374 ± 30361 902 <0.2 <0.3 0.8 ± 0.3 22.9 ± 5.8362 879 1.1 ± 0.2 0.8 ± 0.4 0.5±0.3 16.4 ± 8.4363 930 <0.2 1.0 ± 0.3 1.4 ± 0.5 43.6 ± 9.3364 957 <0.2 1.0 ± 0.3 1.3 ± 0.5 33.6 ± 9.2365 821 0.9 ± 0.2 1.0 ± 0.2 2.7 ± 0.4 58.1 ± 9.4
a Refer to Figures 27 through 32. b Uncertainties are total propagated uncertainties at the 95% confidence level.
d Semi-quantitative data, results are total activity. Sample collected was piece of a slag-like material.
Building 2
Building 3
Radionuclide Concentration (pCi/g)
c Pa-234m (1001 keV) peak was used to determine activity except where values were less than the MDC in which case the
Source: Radiological Survey of the Guterl Specialty Steel Corporation, Lockport, New York. T.J. Vitkus, Oak Ridge Institute for Science and Education, December 1999 (ORISE 99-1699).
TABLE 12
RADIONUCLIDE CONCENTRATIONS IN SOILINTERIOR LOCATIONS
GUTERL SPECIALTY STEEL CORPORATIONLOCKPORT, NEW YORK
LocationSample Quantity
(g)
Ra-226 Th-232 U-235 U-238
366 715 0.7± 0.2 2.3 ± 0.5 2.1 ± 0.5 63 ± 14367 724 0.7 ± 0.2 0.8 ± 0.2 0.2 ± 0.2 <9.3 (3.4 ± 1.4)368 883 0.4 ± 0.1 <0.4 <0.2 <6.0 (<1.0)369 1,019 0.3 ± 0.1 0.6 ± 0.1 0.4 ± 0.2 14.7 ± 3.7370 879 <0.4 <0.4 10.3 ± 1.2 264 ± 27371 1,014 <0.3 <0.5 33.6 ± 2.7 850 ± 53372 1,083 <0.2 <0.3 12.3 ± 1.1 338 ± 24373 985 <0.2 <0.3 2.6 ± 0.5 64 ± 12374 695 <0.3 <0.4 18.7 ± 1.9 444 ± 39375 818 <0.8 <1.1 60.4 ± 5.1 6,020 ± 290376 938 <3.0 <3.4 796 ± 53 41,600 ± 1900550 1,184 <0.3 <0.3 64.6 ± 4.3 1595 ± 76551 1,002 0.7 ± 0.1 0.6 ± 0.1 0.2 ± 0.1 5.4 ± 2.1
552 Subfloor (0 to 4 cm) 999 <0.3 78.5 ± 7.3 1.9 ± 0.6 90 ± 11
549 Subfloor (4 to 25 cm) 775 0.7 ± 0.1 27.0 ± 2.5 <0.4 <6.6 (3.7 ± 1.3)
528 (Residue) 505 0.3 ± 0.1 0.4 ± 0.2 4.4 ± 0.5 274 ± 19
529 Subfloor Soil 707 0.6 ± 0.1 0.6 ± 0.1 <0.1 <3.0 (1.8 ± 0.4)
530 (Residue) 490 0.6 ± 0.1 0.4 ± 0.2 6.8 ± 0.7 140.2 ± 13.4)
531 Subfloor Soil 883 0.4 ± 0.1 0.4 ± 0.1 <0.1 <4.1 (1.9 ± 0.6)
1 768 <0.5 58.2 ± 5.7 <1.6 50 ± 305 705 <0.2 <0.4 0.8 ± 0.3 24.2 ± 7.8
475 806 0.5 ± 0.1 <0.4 <0.2 <9.1 (1.2 ± 0.9)
a Refer to Figures 27 through 32. b Uncertainties are total propagated uncertainties at the 95% confidence level.
d Semi-quantitative data, results are total activity. Sample collected was piece of a slag-like material.
Building 4
Building 6
c Pa-234m (1001 keV) peak was used to determine activity except where values were less than the MDC in which case the
LocationSample Quantity
(g)Radionuclide Concentration (pCi/g)
Building 3 (Continued)
TABLE 12 (Continued)
RADIONUCLIDE CONCENTRATIONS IN SOILINTERIOR LOCATIONS
GUTERL SPECIALTY STEEL CORPORATIONLOCKPORT, NEW YORK
Source: Radiological Survey of the Guterl Specialty Steel Corporation, Lockport, New York. T.J. Vitkus, Oak Ridge Institute for Science and Education, December 1999 (ORISE 99-1699).
Ra-226 Th-232 U-235 U-238
476 1,151 <0.5 68.7 ± 6.6 7.8 ± 1.6 297 ± 32477 920 0.5 ± 0.1 <0.4 <0.3 <8.1 (1.7 ± 11)478 724 <0.4 <0.6 <.04 < 12 (<2.1)479 693 <0.2 0.4 ± 0.2 <0.3 <9.5 (3.9 ± 1.4)480 687 0.5 ± 0.1 0.7 ± 0.2 <0.3 <8.1 (4.8 ± 1.4)481 664 <0.3 1.1 ± 0.3 1.8 ± 0.6 39 ± 10482 613 0.7 ± 0.2 1.4 ± 0.4 0.7 ± 0.4 17 ± 11483 896 0.2 ± 0.1 0.6 ± 0.2 0.2 ± 0.1 6.6 ± 3.9484 737 <0.3 8.7 ± 1.1 10.9 ± 1.3 272 ± 29486 804 0.4 ± 0.2 0.7 ± 0.3 <0.4 <11 (1.5 ± 1.5)487 735 0.6 ± 0.1 <0.4 <0.3 <10 (1.1 ± 0.8)488 488 0.6 ± 0.2 0.9 ± 0.4 <0.4 <12 (1.6 ± 1.4)489 788 <0.2 2.1 ± 0.4 0.8 ± 0.3 26.5 ± 7.8490 771 <0.3 0.6 ± 0.3 <0.4 <12.7 (<1.7)491 1,030 <0.2 0.6 ± 0.2 0.7 ± 0.3 13.4 ± 6.1493 742 0.6 ± 0.2 0.5 ± 0.2 <0.3 <8.5 (1.4 ± 1.0)494 637 0.5 ± 0.1 1.7 ± 0.4 2.2 ± 0.5 61 ± 12495 674 <0.4 36.7 ± 3.6 1.2 ± 0.9 54 ± 14
2 829 <2.2 <2.8 213 ± 15 25,200 ± 12003 1,120 <0.7 213 ± 20 84.4 ± 6.1 2,520 ± 1304 633 <2.1 <2.3 238 ± 17 9,300 ± 460
435 1,135 <0.1 <0.1 0.6 ± 0.2 17.7 ± 4.8436 808 0.5 ± 0.1 0.6 ± 0.2 <0.2 <5.6 (0.8 ± 0.8)437 1,215 <0.2 2.0 ± 0.4 5.1 ± 0.8 151 ± 17438 846 <0.2 1.0 ± 0.3 4.5 ± 0.7 132 ± 11439 939 <0.2 <0.4 1.7 ± 0.4 41.1 ± 8.6
a Refer to Figures 27 through 32. b Uncertainties are total propagated uncertainties at the 95% confidence level.
d Semi-quantitative data, results are total activity. Sample collected was piece of a slag-like material.
Building 6 (Continued)
Building 8
c Pa-234m (1001 keV) peak was used to determine activity except where values were less than the MDC in which case the
GUTERL SPECIALTY STEEL CORPORATIONLOCKPORT, NEW YORK
LocationSample Quantity
(g)Radionuclide Concentration (pCi/g)
TABLE 12 (Continued)
RADIONUCLIDE CONCENTRATIONS IN SOILINTERIOR LOCATIONS
Source: Radiological Survey of the Guterl Specialty Steel Corporation, Lockport, New York. T.J. Vitkus, Oak Ridge Institute for Science and Education, December 1999 (ORISE 99-1699).
Ra-226 Th-232 U-235 U-238
440 924 <.02 <0.3 9.2 ± 0.9 251 ± 21441 841 0.5 ± 0.2 <0.6 0.5 ± 0.3 13.0 ± 7.1442 953 <0.2 0.4 ± 0.2 1.3 ± 0.4 35.0 ± 7.7443 735 <0.2 0.8 ± 0.2 0.5 ± 0.2 12.8 ± 4.9444 1,018 <0.5 2.5 ± 0.6 142.6 ± 9.5 4,200 ± 200445 1,141 <0.7 5.4 ± 0.9 78.5 ± 5.5 2,470 ± 130446 1,139 <1.1 <1.7 275±18 10,250 ± 480
447 (0 to 15 cm)
1,100 <1.2 <1.4 187± 13 9,720 ± 450
539 (15 to 30 cm)
1,130 <0.1 0.7 ± 0.1 25.2 ± 1.7 660 ± 31
448 (0 to 15 cm)
652 0.7 ± 0.3 2.8 ± 0.6 26.2 ± 2.1 722 ± 47
538 (15 to 20 cm)
692 1.0 ± 0.3 1.1± 0.2 18.0 ± 1.4 430 ± 26
450 725 <0.3 <0.5 17.6 ± 1.7 471 ± 38451 (0 to
15 cm)1,105 <1.4 9.2 ± 1.8 348 ± 23 14,680 ± 680
536 (15 to 30 cm) 367 1.3 ± 0.2 1.3 ± 0.3 10.4 ± 0.9 238 ± 19
537 (30 to 45 cm) 404 1.6 ± 0.2 1.7 ± 0.3 1.8 ± 0.3 36.9 ± 7.4
452 1,136 <0.6 30.3 ± 3.0 128.5 ± 8.6 4,970 ± 230453 1,025 <0.8 3.5 ± 0.8 103.7 ± 7.2 3,270 ± 170454 1,087 <0.1 <0.1 0.6 ± 0.2 29.6 ± 6.6455 865 <0.2 <0.3 2.1 ± 0.5 57 ± 12456 1,049 <0.2 1.4 ± 0.3 36.5 ± 2.7 1,028 ± 56457 1,142 <0.7 <1.0 0.9 ± 0.3 26.5 ± 7.1
458 (0 to 15 cm) 1,196 -3.00000 -1.00000 164± 11 5,400 ± 260
a Refer to Figures 27 through 32. b Uncertainties are total propagated uncertainties at the 95% confidence level.
d Semi-quantitative data, results are total activity. Sample collected was piece of a slag-like material.
Building 8 (Continued)
c Pa-234m (1001 keV) peak was used to determine activity except where values were less than the MDC in which case the
Source: Radiological Survey of the Guterl Specialty Steel Corporation, Lockport, New York. T.J. Vitkus, Oak Ridge Institute for Science and Education, December 1999 (ORISE 99-1699).
INTERIOR LOCATIONSGUTERL SPECIALTY STEEL CORPORATION
LOCKPORT, NEW YORK
LocationSample Quantity
(g)Radionuclide Concentration (pCi/g)
TABLE 12 (Continued)
RADIONUCLIDE CONCENTRATIONS IN SOIL
Ra-226 Th-232 U-235 U-238
532 (15 to 30 cm)
522 1.3 ± 0.2 1.5 ± 0.2 4.3 ± 0.4 84.8 ± 7.8
533 (30 to 45 cm)
597 0.8 ± 0.1 1.0 ± 0.2 1.6 ± 0.3 37.2 ± 6.1
459 582 <0.3 1.2 ± 0.4 7.4 ± 1.0 194 ± 24460 1,137 <0.7 <0.9 280 ± 18 9,350 ± 430461 1,232 <0.5 <0.7 39.4 ± 3.1 1,144 ± 67462 1,107 <0.3 1.3 ± 0.5 26.6 ± 2.2 692 ± 45463 726 <0.6 <0.8 158 ± 11 3,980 ± 200464 884 <0.7 <0.8 156 ± 10 5,990 ± 280465 992 <0.2 0.8 ± 0.2 0.6 ± 0.4 21.3 ± 7.8466 995 <0.3 10.3 ± 1.2 2.6 ± 0.7 49 ± 16467 676 <0.4 12.0 ± 1.5 38.8 ± 3.2 1,133 ± 71468 872 0.8 ± 0.2 4.4 ± 0.6 4.2 ± 0.6 116 ± 15469 826 <0.6 7.4 ± 1.0 14.9 ± 1.7 736 ± 53470 1,154 <0.3 20.7 ± 2.1 10.5 ± 1.4 332 ± 31471 830 <0.3 5.2 ± 0.8 15.2 ± 1.4 486 ± 37472 1,016 <2.0 442 ± 41 7.2 ± 3.0 158 ± 53473 758 0.4 ± 0.1 0.5 ± 0.2 0.2 ± 0.2 <5.9 (2.0 ± 0.9)474 802 <0.3 0.9 ± 0.3 <0.5 <15 (4.4 ± 1.6)485 751 0.5 ± 0.1 <0.4 0.5 ± 0.3 12.5 ± 5.6492 616 <0.6 15.1 ± 1.9 25.6 ± 2.5 730 ± 58497 1,034 <0.5 7.6 ± 1.1 27.5 ± 2.4 763 ± 53498 827 0.2 ± 0.1 <0.4 1.2 ± 0.3 32.1 ± 6.2
534 (0 to 15 cm)
886 <0.2 1.3 ± 0.4 128.8 ± 8.4 3260 ± 150
535 (15 to 30 cm)
469 1.0 ± 0.3 <0.5 13.8 ± 1.2 313 ± 22
a Refer to Figures 27 through 32. b Uncertainties are total propagated uncertainties at the 95% confidence level.
d Semi-quantitative data, results are total activity. Sample collected was piece of a slag-like material.
Building 8 (Continued)
c Pa-234m (1001 keV) peak was used to determine activity except where values were less than the MDC in which case the
Source: Radiological Survey of the Guterl Specialty Steel Corporation, Lockport, New York. T.J. Vitkus, Oak Ridge Institute for Science and Education, December 1999 (ORISE 99-1699).
GUTERL SPECIALTY STEEL CORPORATIONLOCKPORT, NEW YORK
LocationSample Quantity
(g)Radionuclide Concentration (pCi/g)
TABLE 12 (Continued)
RADIONUCLIDE CONCENTRATIONS IN SOILINTERIOR LOCATIONS
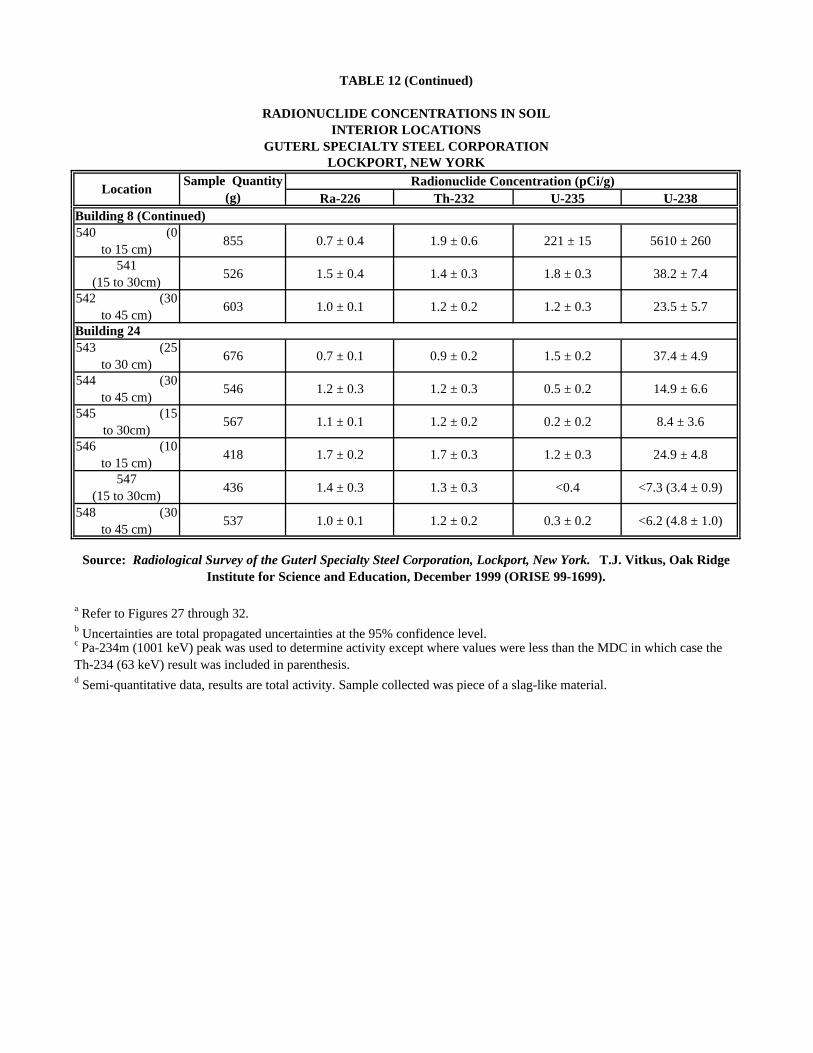
Ra-226 Th-232 U-235 U-238
540 (0 to 15 cm)
855 0.7 ± 0.4 1.9 ± 0.6 221 ± 15 5610 ± 260
541 (15 to 30cm)
526 1.5 ± 0.4 1.4 ± 0.3 1.8 ± 0.3 38.2 ± 7.4
542 (30 to 45 cm)
603 1.0 ± 0.1 1.2 ± 0.2 1.2 ± 0.3 23.5 ± 5.7
543 (25 to 30 cm)
676 0.7 ± 0.1 0.9 ± 0.2 1.5 ± 0.2 37.4 ± 4.9
544 (30 to 45 cm)
546 1.2 ± 0.3 1.2 ± 0.3 0.5 ± 0.2 14.9 ± 6.6
545 (15 to 30cm)
567 1.1 ± 0.1 1.2 ± 0.2 0.2 ± 0.2 8.4 ± 3.6
546 (10 to 15 cm)
418 1.7 ± 0.2 1.7 ± 0.3 1.2 ± 0.3 24.9 ± 4.8
547 (15 to 30cm)
436 1.4 ± 0.3 1.3 ± 0.3 <0.4 <7.3 (3.4 ± 0.9)
548 (30 to 45 cm)
537 1.0 ± 0.1 1.2 ± 0.2 0.3 ± 0.2 <6.2 (4.8 ± 1.0)
a Refer to Figures 27 through 32. b Uncertainties are total propagated uncertainties at the 95% confidence level.
d Semi-quantitative data, results are total activity. Sample collected was piece of a slag-like material.
Building 8 (Continued)
Building 24
c Pa-234m (1001 keV) peak was used to determine activity except where values were less than the MDC in which case the Th-234 (63 keV) result was included in parenthesis.
GUTERL SPECIALTY STEEL CORPORATIONLOCKPORT, NEW YORK
LocationSample Quantity
(g)Radionuclide Concentration (pCi/g)
Source: Radiological Survey of the Guterl Specialty Steel Corporation, Lockport, New York. T.J. Vitkus, Oak Ridge Institute for Science and Education, December 1999 (ORISE 99-1699).
TABLE 12 (Continued)
RADIONUCLIDE CONCENTRATIONS IN SOILINTERIOR LOCATIONS
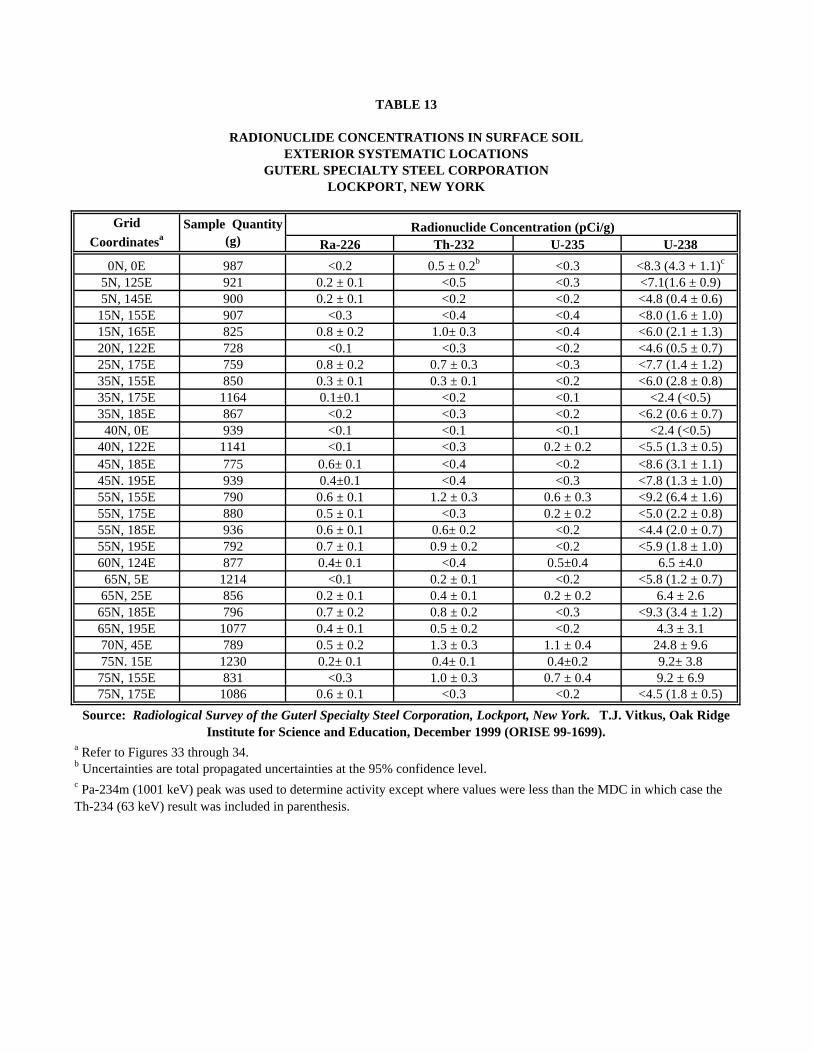
Ra-226 Th-232 U-235 U-238
0N, 0E 987 <0.2 0.5 ± 0.2b <0.3 <8.3 (4.3 + 1.1)c
5N, 125E 921 0.2 ± 0.1 <0.5 <0.3 <7.1(1.6 ± 0.9)5N, 145E 900 0.2 ± 0.1 <0.2 <0.2 <4.8 (0.4 ± 0.6)
15N, 155E 907 <0.3 <0.4 <0.4 <8.0 (1.6 ± 1.0)15N, 165E 825 0.8 ± 0.2 1.0± 0.3 <0.4 <6.0 (2.1 ± 1.3)20N, 122E 728 <0.1 <0.3 <0.2 <4.6 (0.5 ± 0.7)25N, 175E 759 0.8 ± 0.2 0.7 ± 0.3 <0.3 <7.7 (1.4 ± 1.2)35N, 155E 850 0.3 ± 0.1 0.3 ± 0.1 <0.2 <6.0 (2.8 ± 0.8)35N, 175E 1164 0.1±0.1 <0.2 <0.1 <2.4 (<0.5)35N, 185E 867 <0.2 <0.3 <0.2 <6.2 (0.6 ± 0.7)
40N, 0E 939 <0.1 <0.1 <0.1 <2.4 (<0.5)40N, 122E 1141 <0.1 <0.3 0.2 ± 0.2 <5.5 (1.3 ± 0.5)45N, 185E 775 0.6± 0.1 <0.4 <0.2 <8.6 (3.1 ± 1.1)45N. 195E 939 0.4±0.1 <0.4 <0.3 <7.8 (1.3 ± 1.0)55N, 155E 790 0.6 ± 0.1 1.2 ± 0.3 0.6 ± 0.3 <9.2 (6.4 ± 1.6)55N, 175E 880 0.5 ± 0.1 <0.3 0.2 ± 0.2 <5.0 (2.2 ± 0.8)55N, 185E 936 0.6 ± 0.1 0.6± 0.2 <0.2 <4.4 (2.0 ± 0.7)55N, 195E 792 0.7 ± 0.1 0.9 ± 0.2 <0.2 <5.9 (1.8 ± 1.0)60N, 124E 877 0.4± 0.1 <0.4 0.5±0.4 6.5 ±4.0
65N, 5E 1214 <0.1 0.2 ± 0.1 <0.2 <5.8 (1.2 ± 0.7)65N, 25E 856 0.2 ± 0.1 0.4 ± 0.1 0.2 ± 0.2 6.4 ± 2.6
65N, 185E 796 0.7 ± 0.2 0.8 ± 0.2 <0.3 <9.3 (3.4 ± 1.2)65N, 195E 1077 0.4 ± 0.1 0.5 ± 0.2 <0.2 4.3 ± 3.170N, 45E 789 0.5 ± 0.2 1.3 ± 0.3 1.1 ± 0.4 24.8 ± 9.675N. 15E 1230 0.2± 0.1 0.4± 0.1 0.4±0.2 9.2± 3.8
75N, 155E 831 <0.3 1.0 ± 0.3 0.7 ± 0.4 9.2 ± 6.975N, 175E 1086 0.6 ± 0.1 <0.3 <0.2 <4.5 (1.8 ± 0.5)
a Refer to Figures 33 through 34.
LOCKPORT, NEW YORK
Grid Coordinatesa
Sample Quantity (g)
Radionuclide Concentration (pCi/g)
TABLE 13
RADIONUCLIDE CONCENTRATIONS IN SURFACE SOILEXTERIOR SYSTEMATIC LOCATIONS
GUTERL SPECIALTY STEEL CORPORATION
Source: Radiological Survey of the Guterl Specialty Steel Corporation, Lockport, New York. T.J. Vitkus, Oak Ridge Institute for Science and Education, December 1999 (ORISE 99-1699).
b Uncertainties are total propagated uncertainties at the 95% confidence level. c Pa-234m (1001 keV) peak was used to determine activity except where values were less than the MDC in which case the Th-234 (63 keV) result was included in parenthesis.
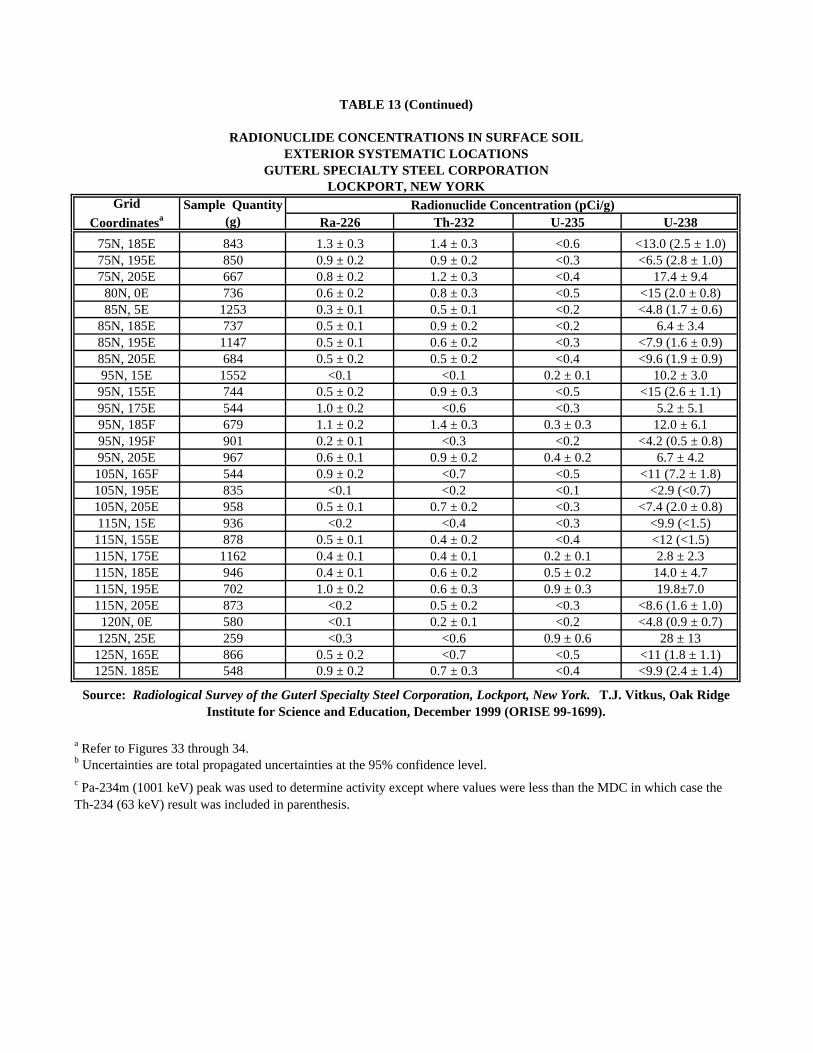
Ra-226 Th-232 U-235 U-238
75N, 185E 843 1.3 ± 0.3 1.4 ± 0.3 <0.6 <13.0 (2.5 ± 1.0)75N, 195E 850 0.9 ± 0.2 0.9 ± 0.2 <0.3 <6.5 (2.8 ± 1.0)75N, 205E 667 0.8 ± 0.2 1.2 ± 0.3 <0.4 17.4 ± 9.4
80N, 0E 736 0.6 ± 0.2 0.8 ± 0.3 <0.5 <15 (2.0 ± 0.8)85N, 5E 1253 0.3 ± 0.1 0.5 ± 0.1 <0.2 <4.8 (1.7 ± 0.6)
85N, 185E 737 0.5 ± 0.1 0.9 ± 0.2 <0.2 6.4 ± 3.485N, 195E 1147 0.5 ± 0.1 0.6 ± 0.2 <0.3 <7.9 (1.6 ± 0.9)85N, 205E 684 0.5 ± 0.2 0.5 ± 0.2 <0.4 <9.6 (1.9 ± 0.9)95N, 15E 1552 <0.1 <0.1 0.2 ± 0.1 10.2 ± 3.0
95N, 155E 744 0.5 ± 0.2 0.9 ± 0.3 <0.5 <15 (2.6 ± 1.1)95N, 175E 544 1.0 ± 0.2 <0.6 <0.3 5.2 ± 5.195N, 185F 679 1.1 ± 0.2 1.4 ± 0.3 0.3 ± 0.3 12.0 ± 6.195N, 195F 901 0.2 ± 0.1 <0.3 <0.2 <4.2 (0.5 ± 0.8)95N, 205E 967 0.6 ± 0.1 0.9 ± 0.2 0.4 ± 0.2 6.7 ± 4.2105N, 165F 544 0.9 ± 0.2 <0.7 <0.5 <11 (7.2 ± 1.8)105N, 195E 835 <0.1 <0.2 <0.1 <2.9 (<0.7)105N, 205E 958 0.5 ± 0.1 0.7 ± 0.2 <0.3 <7.4 (2.0 ± 0.8)115N, 15E 936 <0.2 <0.4 <0.3 <9.9 (<1.5)
115N, 155E 878 0.5 ± 0.1 0.4 ± 0.2 <0.4 <12 (<1.5)115N, 175E 1162 0.4 ± 0.1 0.4 ± 0.1 0.2 ± 0.1 2.8 ± 2.3115N, 185E 946 0.4 ± 0.1 0.6 ± 0.2 0.5 ± 0.2 14.0 ± 4.7115N, 195E 702 1.0 ± 0.2 0.6 ± 0.3 0.9 ± 0.3 19.8±7.0115N, 205E 873 <0.2 0.5 ± 0.2 <0.3 <8.6 (1.6 ± 1.0)
120N, 0E 580 <0.1 0.2 ± 0.1 <0.2 <4.8 (0.9 ± 0.7)125N, 25E 259 <0.3 <0.6 0.9 ± 0.6 28 ± 13
125N, 165E 866 0.5 ± 0.2 <0.7 <0.5 <11 (1.8 ± 1.1)125N. 185E 548 0.9 ± 0.2 0.7 ± 0.3 <0.4 <9.9 (2.4 ± 1.4)
a Refer to Figures 33 through 34.
GUTERL SPECIALTY STEEL CORPORATIONLOCKPORT, NEW YORK
Grid Coordinatesa
Sample Quantity (g)
Radionuclide Concentration (pCi/g)
Source: Radiological Survey of the Guterl Specialty Steel Corporation, Lockport, New York. T.J. Vitkus, Oak Ridge Institute for Science and Education, December 1999 (ORISE 99-1699).
c Pa-234m (1001 keV) peak was used to determine activity except where values were less than the MDC in which case the Th-234 (63 keV) result was included in parenthesis.
TABLE 13 (Continued)
RADIONUCLIDE CONCENTRATIONS IN SURFACE SOILEXTERIOR SYSTEMATIC LOCATIONS
b Uncertainties are total propagated uncertainties at the 95% confidence level.
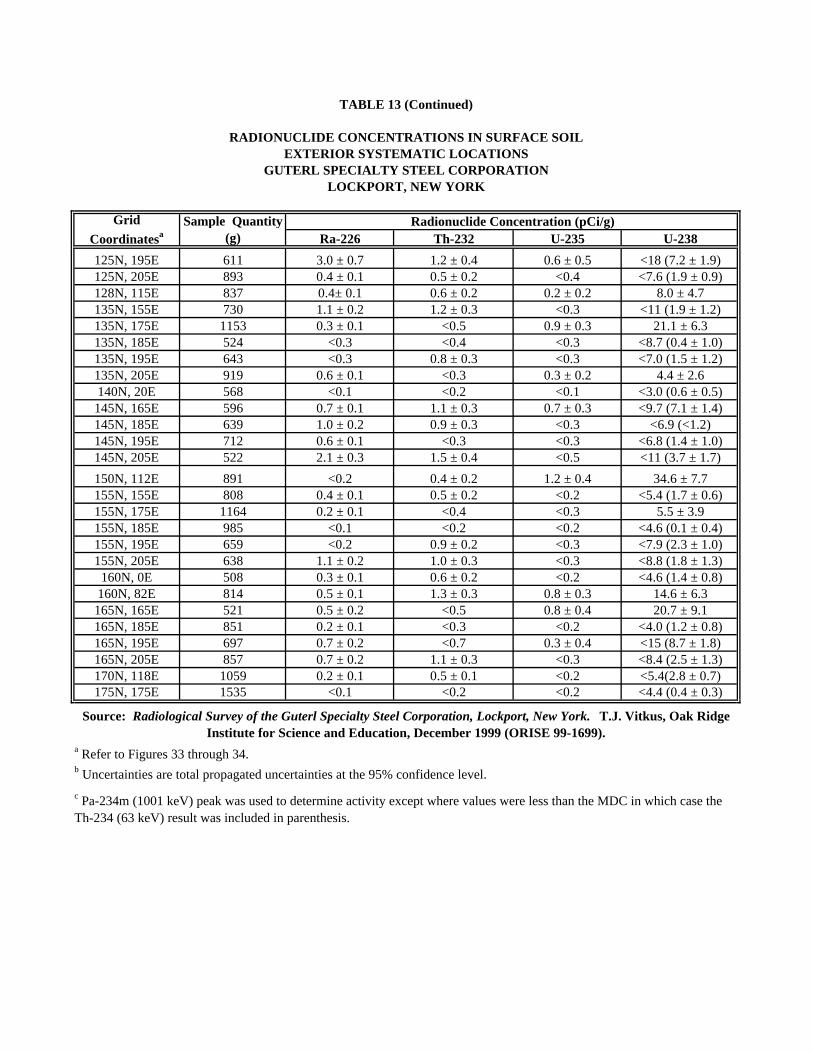
Ra-226 Th-232 U-235 U-238
125N, 195E 611 3.0 ± 0.7 1.2 ± 0.4 0.6 ± 0.5 <18 (7.2 ± 1.9)125N, 205E 893 0.4 ± 0.1 0.5 ± 0.2 <0.4 <7.6 (1.9 ± 0.9)128N, 115E 837 0.4± 0.1 0.6 ± 0.2 0.2 ± 0.2 8.0 ± 4.7135N, 155E 730 1.1 ± 0.2 1.2 ± 0.3 <0.3 <11 (1.9 ± 1.2)135N, 175E 1153 0.3 ± 0.1 <0.5 0.9 ± 0.3 21.1 ± 6.3135N, 185E 524 <0.3 <0.4 <0.3 <8.7 (0.4 ± 1.0)135N, 195E 643 <0.3 0.8 ± 0.3 <0.3 <7.0 (1.5 ± 1.2)135N, 205E 919 0.6 ± 0.1 <0.3 0.3 ± 0.2 4.4 ± 2.6140N, 20E 568 <0.1 <0.2 <0.1 <3.0 (0.6 ± 0.5)
145N, 165E 596 0.7 ± 0.1 1.1 ± 0.3 0.7 ± 0.3 <9.7 (7.1 ± 1.4)145N, 185E 639 1.0 ± 0.2 0.9 ± 0.3 <0.3 <6.9 (<1.2)145N, 195E 712 0.6 ± 0.1 <0.3 <0.3 <6.8 (1.4 ± 1.0)145N, 205E 522 2.1 ± 0.3 1.5 ± 0.4 <0.5 <11 (3.7 ± 1.7)
150N, 112E 891 <0.2 0.4 ± 0.2 1.2 ± 0.4 34.6 ± 7.7155N, 155E 808 0.4 ± 0.1 0.5 ± 0.2 <0.2 <5.4 (1.7 ± 0.6)155N, 175E 1164 0.2 ± 0.1 <0.4 <0.3 5.5 ± 3.9155N, 185E 985 <0.1 <0.2 <0.2 <4.6 (0.1 ± 0.4)155N, 195E 659 <0.2 0.9 ± 0.2 <0.3 <7.9 (2.3 ± 1.0)155N, 205E 638 1.1 ± 0.2 1.0 ± 0.3 <0.3 <8.8 (1.8 ± 1.3)
160N, 0E 508 0.3 ± 0.1 0.6 ± 0.2 <0.2 <4.6 (1.4 ± 0.8)160N, 82E 814 0.5 ± 0.1 1.3 ± 0.3 0.8 ± 0.3 14.6 ± 6.3
165N, 165E 521 0.5 ± 0.2 <0.5 0.8 ± 0.4 20.7 ± 9.1165N, 185E 851 0.2 ± 0.1 <0.3 <0.2 <4.0 (1.2 ± 0.8)165N, 195E 697 0.7 ± 0.2 <0.7 0.3 ± 0.4 <15 (8.7 ± 1.8)165N, 205E 857 0.7 ± 0.2 1.1 ± 0.3 <0.3 <8.4 (2.5 ± 1.3)170N, 118E 1059 0.2 ± 0.1 0.5 ± 0.1 <0.2 <5.4(2.8 ± 0.7)175N, 175E 1535 <0.1 <0.2 <0.2 <4.4 (0.4 ± 0.3)
a Refer to Figures 33 through 34.
RADIONUCLIDE CONCENTRATIONS IN SURFACE SOILEXTERIOR SYSTEMATIC LOCATIONS
GUTERL SPECIALTY STEEL CORPORATIONLOCKPORT, NEW YORK
Grid Coordinatesa
Sample Quantity (g)
Radionuclide Concentration (pCi/g)
b Uncertainties are total propagated uncertainties at the 95% confidence level. c Pa-234m (1001 keV) peak was used to determine activity except where values were less than the MDC in which case the Th-234 (63 keV) result was included in parenthesis.
Source: Radiological Survey of the Guterl Specialty Steel Corporation, Lockport, New York. T.J. Vitkus, Oak Ridge Institute for Science and Education, December 1999 (ORISE 99-1699).
TABLE 13 (Continued)
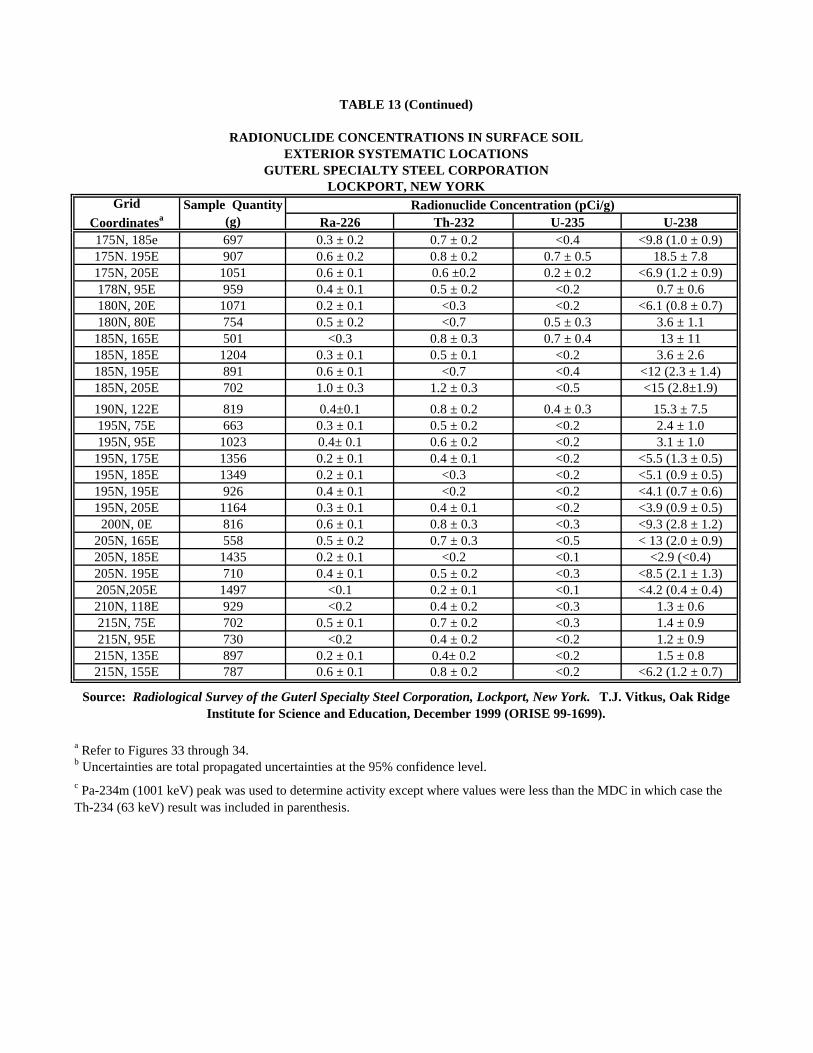
Ra-226 Th-232 U-235 U-238175N, 185e 697 0.3 ± 0.2 0.7 ± 0.2 <0.4 <9.8 (1.0 ± 0.9)175N. 195E 907 0.6 ± 0.2 0.8 ± 0.2 0.7 ± 0.5 18.5 ± 7.8175N, 205E 1051 0.6 ± 0.1 0.6 ±0.2 0.2 ± 0.2 <6.9 (1.2 ± 0.9)178N, 95E 959 0.4 ± 0.1 0.5 ± 0.2 <0.2 0.7 ± 0.6180N, 20E 1071 0.2 ± 0.1 <0.3 <0.2 <6.1 (0.8 ± 0.7)180N, 80E 754 0.5 ± 0.2 <0.7 0.5 ± 0.3 3.6 ± 1.1
185N, 165E 501 <0.3 0.8 ± 0.3 0.7 ± 0.4 13 ± 11185N, 185E 1204 0.3 ± 0.1 0.5 ± 0.1 <0.2 3.6 ± 2.6185N, 195E 891 0.6 ± 0.1 <0.7 <0.4 <12 (2.3 ± 1.4)185N, 205E 702 1.0 ± 0.3 1.2 ± 0.3 <0.5 <15 (2.8±1.9)
190N, 122E 819 0.4±0.1 0.8 ± 0.2 0.4 ± 0.3 15.3 ± 7.5195N, 75E 663 0.3 ± 0.1 0.5 ± 0.2 <0.2 2.4 ± 1.0195N, 95E 1023 0.4± 0.1 0.6 ± 0.2 <0.2 3.1 ± 1.0
195N, 175E 1356 0.2 ± 0.1 0.4 ± 0.1 <0.2 <5.5 (1.3 ± 0.5)195N, 185E 1349 0.2 ± 0.1 <0.3 <0.2 <5.1 (0.9 ± 0.5)195N, 195E 926 0.4 ± 0.1 <0.2 <0.2 <4.1 (0.7 ± 0.6)195N, 205E 1164 0.3 ± 0.1 0.4 ± 0.1 <0.2 <3.9 (0.9 ± 0.5)
200N, 0E 816 0.6 ± 0.1 0.8 ± 0.3 <0.3 <9.3 (2.8 ± 1.2)205N, 165E 558 0.5 ± 0.2 0.7 ± 0.3 <0.5 < 13 (2.0 ± 0.9)205N, 185E 1435 0.2 ± 0.1 <0.2 <0.1 <2.9 (<0.4)205N. 195E 710 0.4 ± 0.1 0.5 ± 0.2 <0.3 <8.5 (2.1 ± 1.3)205N,205E 1497 <0.1 0.2 ± 0.1 <0.1 <4.2 (0.4 ± 0.4)210N, 118E 929 <0.2 0.4 ± 0.2 <0.3 1.3 ± 0.6215N, 75E 702 0.5 ± 0.1 0.7 ± 0.2 <0.3 1.4 ± 0.9215N, 95E 730 <0.2 0.4 ± 0.2 <0.2 1.2 ± 0.9
215N, 135E 897 0.2 ± 0.1 0.4± 0.2 <0.2 1.5 ± 0.8215N, 155E 787 0.6 ± 0.1 0.8 ± 0.2 <0.2 <6.2 (1.2 ± 0.7)
a Refer to Figures 33 through 34. b Uncertainties are total propagated uncertainties at the 95% confidence level. c Pa-234m (1001 keV) peak was used to determine activity except where values were less than the MDC in which case the Th-234 (63 keV) result was included in parenthesis.
LOCKPORT, NEW YORKGrid
CoordinatesaSample Quantity
(g)Radionuclide Concentration (pCi/g)
EXTERIOR SYSTEMATIC LOCATIONSGUTERL SPECIALTY STEEL CORPORATION
TABLE 13 (Continued)
RADIONUCLIDE CONCENTRATIONS IN SURFACE SOIL
Source: Radiological Survey of the Guterl Specialty Steel Corporation, Lockport, New York. T.J. Vitkus, Oak Ridge Institute for Science and Education, December 1999 (ORISE 99-1699).
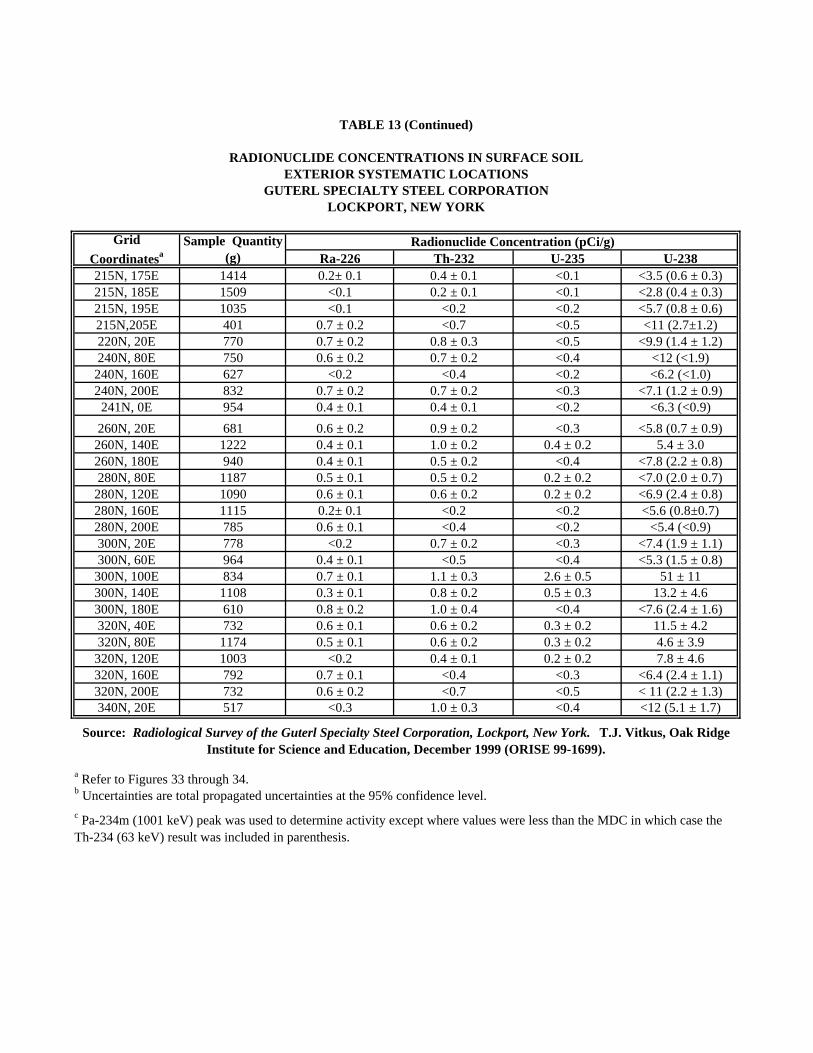
Ra-226 Th-232 U-235 U-238215N, 175E 1414 0.2± 0.1 0.4 ± 0.1 <0.1 <3.5 (0.6 ± 0.3)215N, 185E 1509 <0.1 0.2 ± 0.1 <0.1 <2.8 (0.4 ± 0.3)215N, 195E 1035 <0.1 <0.2 <0.2 <5.7 (0.8 ± 0.6)215N,205E 401 0.7 ± 0.2 <0.7 <0.5 <11 (2.7±1.2)220N, 20E 770 0.7 ± 0.2 0.8 ± 0.3 <0.5 <9.9 (1.4 ± 1.2)240N, 80E 750 0.6 ± 0.2 0.7 ± 0.2 <0.4 <12 (<1.9)
240N, 160E 627 <0.2 <0.4 <0.2 <6.2 (<1.0)240N, 200E 832 0.7 ± 0.2 0.7 ± 0.2 <0.3 <7.1 (1.2 ± 0.9)
241N, 0E 954 0.4 ± 0.1 0.4 ± 0.1 <0.2 <6.3 (<0.9)
260N, 20E 681 0.6 ± 0.2 0.9 ± 0.2 <0.3 <5.8 (0.7 ± 0.9)260N, 140E 1222 0.4 ± 0.1 1.0 ± 0.2 0.4 ± 0.2 5.4 ± 3.0260N, 180E 940 0.4 ± 0.1 0.5 ± 0.2 <0.4 <7.8 (2.2 ± 0.8)280N, 80E 1187 0.5 ± 0.1 0.5 ± 0.2 0.2 ± 0.2 <7.0 (2.0 ± 0.7)
280N, 120E 1090 0.6 ± 0.1 0.6 ± 0.2 0.2 ± 0.2 <6.9 (2.4 ± 0.8)280N, 160E 1115 0.2± 0.1 <0.2 <0.2 <5.6 (0.8±0.7)280N, 200E 785 0.6 ± 0.1 <0.4 <0.2 <5.4 (<0.9)300N, 20E 778 <0.2 0.7 ± 0.2 <0.3 <7.4 (1.9 ± 1.1)300N, 60E 964 0.4 ± 0.1 <0.5 <0.4 <5.3 (1.5 ± 0.8)
300N, 100E 834 0.7 ± 0.1 1.1 ± 0.3 2.6 ± 0.5 51 ± 11300N, 140E 1108 0.3 ± 0.1 0.8 ± 0.2 0.5 ± 0.3 13.2 ± 4.6300N, 180E 610 0.8 ± 0.2 1.0 ± 0.4 <0.4 <7.6 (2.4 ± 1.6)320N, 40E 732 0.6 ± 0.1 0.6 ± 0.2 0.3 ± 0.2 11.5 ± 4.2320N, 80E 1174 0.5 ± 0.1 0.6 ± 0.2 0.3 ± 0.2 4.6 ± 3.9
320N, 120E 1003 <0.2 0.4 ± 0.1 0.2 ± 0.2 7.8 ± 4.6320N, 160E 792 0.7 ± 0.1 <0.4 <0.3 <6.4 (2.4 ± 1.1)320N, 200E 732 0.6 ± 0.2 <0.7 <0.5 < 11 (2.2 ± 1.3)340N, 20E 517 <0.3 1.0 ± 0.3 <0.4 <12 (5.1 ± 1.7)
a Refer to Figures 33 through 34.
EXTERIOR SYSTEMATIC LOCATIONSGUTERL SPECIALTY STEEL CORPORATION
LOCKPORT, NEW YORK
Grid Coordinatesa
Sample Quantity (g)
Radionuclide Concentration (pCi/g)
TABLE 13 (Continued)
RADIONUCLIDE CONCENTRATIONS IN SURFACE SOIL
c Pa-234m (1001 keV) peak was used to determine activity except where values were less than the MDC in which case the Th-234 (63 keV) result was included in parenthesis.
Source: Radiological Survey of the Guterl Specialty Steel Corporation, Lockport, New York. T.J. Vitkus, Oak Ridge Institute for Science and Education, December 1999 (ORISE 99-1699).
b Uncertainties are total propagated uncertainties at the 95% confidence level.
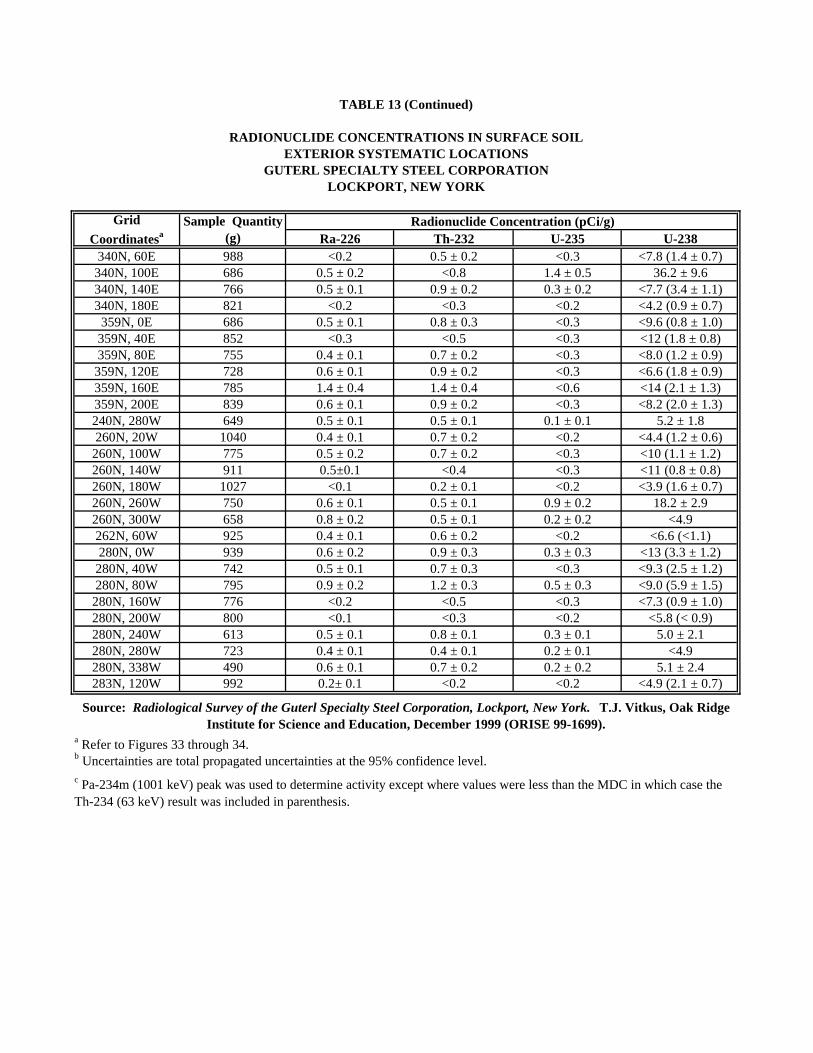
Ra-226 Th-232 U-235 U-238340N, 60E 988 <0.2 0.5 ± 0.2 <0.3 <7.8 (1.4 ± 0.7)
340N, 100E 686 0.5 ± 0.2 <0.8 1.4 ± 0.5 36.2 ± 9.6340N, 140E 766 0.5 ± 0.1 0.9 ± 0.2 0.3 ± 0.2 <7.7 (3.4 ± 1.1)340N, 180E 821 <0.2 <0.3 <0.2 <4.2 (0.9 ± 0.7)
359N, 0E 686 0.5 ± 0.1 0.8 ± 0.3 <0.3 <9.6 (0.8 ± 1.0)359N, 40E 852 <0.3 <0.5 <0.3 <12 (1.8 ± 0.8)359N, 80E 755 0.4 ± 0.1 0.7 ± 0.2 <0.3 <8.0 (1.2 ± 0.9)
359N, 120E 728 0.6 ± 0.1 0.9 ± 0.2 <0.3 <6.6 (1.8 ± 0.9)359N, 160E 785 1.4 ± 0.4 1.4 ± 0.4 <0.6 <14 (2.1 ± 1.3)359N, 200E 839 0.6 ± 0.1 0.9 ± 0.2 <0.3 <8.2 (2.0 ± 1.3)240N, 280W 649 0.5 ± 0.1 0.5 ± 0.1 0.1 ± 0.1 5.2 ± 1.8260N, 20W 1040 0.4 ± 0.1 0.7 ± 0.2 <0.2 <4.4 (1.2 ± 0.6)
260N, 100W 775 0.5 ± 0.2 0.7 ± 0.2 <0.3 <10 (1.1 ± 1.2)260N, 140W 911 0.5±0.1 <0.4 <0.3 <11 (0.8 ± 0.8)260N, 180W 1027 <0.1 0.2 ± 0.1 <0.2 <3.9 (1.6 ± 0.7)260N, 260W 750 0.6 ± 0.1 0.5 ± 0.1 0.9 ± 0.2 18.2 ± 2.9260N, 300W 658 0.8 ± 0.2 0.5 ± 0.1 0.2 ± 0.2 <4.9262N, 60W 925 0.4 ± 0.1 0.6 ± 0.2 <0.2 <6.6 (<1.1)280N, 0W 939 0.6 ± 0.2 0.9 ± 0.3 0.3 ± 0.3 <13 (3.3 ± 1.2)
280N, 40W 742 0.5 ± 0.1 0.7 ± 0.3 <0.3 <9.3 (2.5 ± 1.2)280N, 80W 795 0.9 ± 0.2 1.2 ± 0.3 0.5 ± 0.3 <9.0 (5.9 ± 1.5)
280N, 160W 776 <0.2 <0.5 <0.3 <7.3 (0.9 ± 1.0)280N, 200W 800 <0.1 <0.3 <0.2 <5.8 (< 0.9)280N, 240W 613 0.5 ± 0.1 0.8 ± 0.1 0.3 ± 0.1 5.0 ± 2.1280N, 280W 723 0.4 ± 0.1 0.4 ± 0.1 0.2 ± 0.1 <4.9280N, 338W 490 0.6 ± 0.1 0.7 ± 0.2 0.2 ± 0.2 5.1 ± 2.4283N, 120W 992 0.2± 0.1 <0.2 <0.2 <4.9 (2.1 ± 0.7)
a Refer to Figures 33 through 34. b Uncertainties are total propagated uncertainties at the 95% confidence level. c Pa-234m (1001 keV) peak was used to determine activity except where values were less than the MDC in which case the Th-234 (63 keV) result was included in parenthesis.
LOCKPORT, NEW YORK
Grid Coordinatesa
Sample Quantity (g)
Radionuclide Concentration (pCi/g)
GUTERL SPECIALTY STEEL CORPORATION
RADIONUCLIDE CONCENTRATIONS IN SURFACE SOILEXTERIOR SYSTEMATIC LOCATIONS
TABLE 13 (Continued)
Source: Radiological Survey of the Guterl Specialty Steel Corporation, Lockport, New York. T.J. Vitkus, Oak Ridge Institute for Science and Education, December 1999 (ORISE 99-1699).
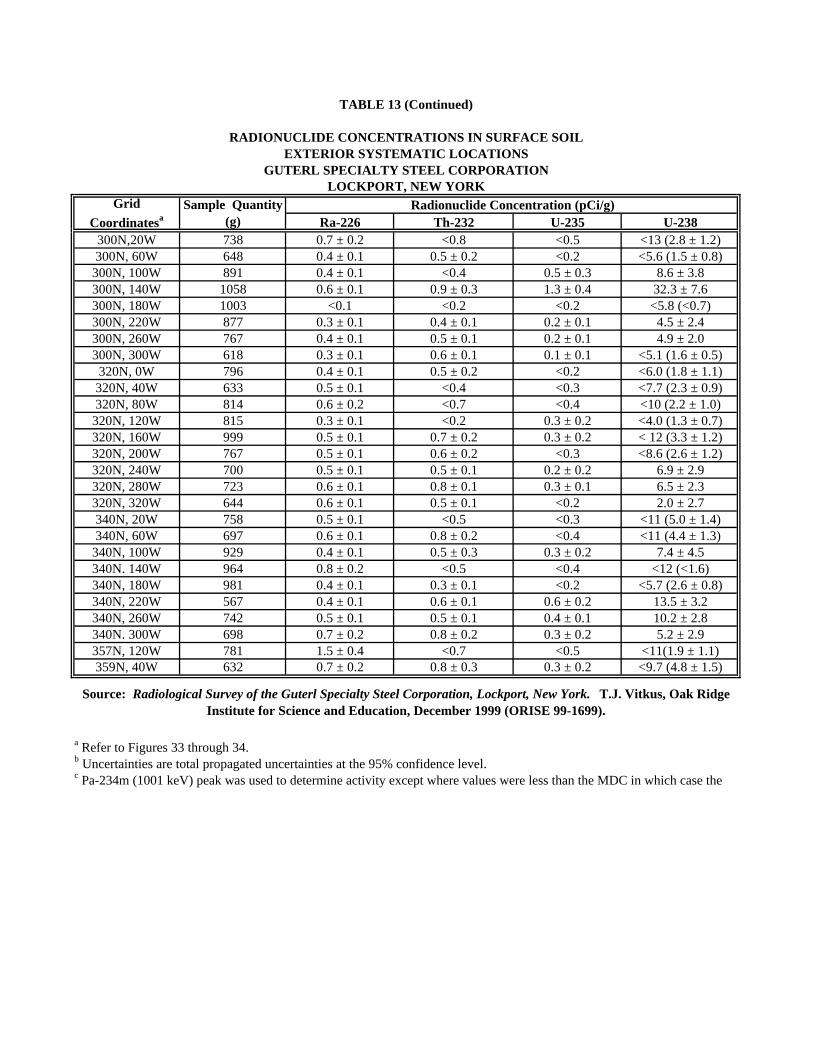
Ra-226 Th-232 U-235 U-238300N,20W 738 0.7 ± 0.2 <0.8 <0.5 <13 (2.8 ± 1.2)300N, 60W 648 0.4 ± 0.1 0.5 ± 0.2 <0.2 <5.6 (1.5 ± 0.8)
300N, 100W 891 0.4 ± 0.1 <0.4 0.5 ± 0.3 8.6 ± 3.8300N, 140W 1058 0.6 ± 0.1 0.9 ± 0.3 1.3 ± 0.4 32.3 ± 7.6300N, 180W 1003 <0.1 <0.2 <0.2 <5.8 (<0.7)300N, 220W 877 0.3 ± 0.1 0.4 ± 0.1 0.2 ± 0.1 4.5 ± 2.4300N, 260W 767 0.4 ± 0.1 0.5 ± 0.1 0.2 ± 0.1 4.9 ± 2.0300N, 300W 618 0.3 ± 0.1 0.6 ± 0.1 0.1 ± 0.1 <5.1 (1.6 ± 0.5)
320N, 0W 796 0.4 ± 0.1 0.5 ± 0.2 <0.2 <6.0 (1.8 ± 1.1)320N, 40W 633 0.5 ± 0.1 <0.4 <0.3 <7.7 (2.3 ± 0.9)320N, 80W 814 0.6 ± 0.2 <0.7 <0.4 <10 (2.2 ± 1.0)
320N, 120W 815 0.3 ± 0.1 <0.2 0.3 ± 0.2 <4.0 (1.3 ± 0.7)320N, 160W 999 0.5 ± 0.1 0.7 ± 0.2 0.3 ± 0.2 < 12 (3.3 ± 1.2)320N, 200W 767 0.5 ± 0.1 0.6 ± 0.2 <0.3 <8.6 (2.6 ± 1.2)320N, 240W 700 0.5 ± 0.1 0.5 ± 0.1 0.2 ± 0.2 6.9 ± 2.9320N, 280W 723 0.6 ± 0.1 0.8 ± 0.1 0.3 ± 0.1 6.5 ± 2.3320N, 320W 644 0.6 ± 0.1 0.5 ± 0.1 <0.2 2.0 ± 2.7340N, 20W 758 0.5 ± 0.1 <0.5 <0.3 <11 (5.0 ± 1.4)340N, 60W 697 0.6 ± 0.1 0.8 ± 0.2 <0.4 <11 (4.4 ± 1.3)
340N, 100W 929 0.4 ± 0.1 0.5 ± 0.3 0.3 ± 0.2 7.4 ± 4.5340N. 140W 964 0.8 ± 0.2 <0.5 <0.4 <12 (<1.6)340N, 180W 981 0.4 ± 0.1 0.3 ± 0.1 <0.2 <5.7 (2.6 ± 0.8)340N, 220W 567 0.4 ± 0.1 0.6 ± 0.1 0.6 ± 0.2 13.5 ± 3.2340N, 260W 742 0.5 ± 0.1 0.5 ± 0.1 0.4 ± 0.1 10.2 ± 2.8340N. 300W 698 0.7 ± 0.2 0.8 ± 0.2 0.3 ± 0.2 5.2 ± 2.9357N, 120W 781 1.5 ± 0.4 <0.7 <0.5 <11(1.9 ± 1.1)359N, 40W 632 0.7 ± 0.2 0.8 ± 0.3 0.3 ± 0.2 <9.7 (4.8 ± 1.5)
a Refer to Figures 33 through 34.
EXTERIOR SYSTEMATIC LOCATIONSGUTERL SPECIALTY STEEL CORPORATION
LOCKPORT, NEW YORKGrid
CoordinatesaSample Quantity
(g)Radionuclide Concentration (pCi/g)
TABLE 13 (Continued)
RADIONUCLIDE CONCENTRATIONS IN SURFACE SOIL
b Uncertainties are total propagated uncertainties at the 95% confidence level. c Pa-234m (1001 keV) peak was used to determine activity except where values were less than the MDC in which case the
Source: Radiological Survey of the Guterl Specialty Steel Corporation, Lockport, New York. T.J. Vitkus, Oak Ridge Institute for Science and Education, December 1999 (ORISE 99-1699).
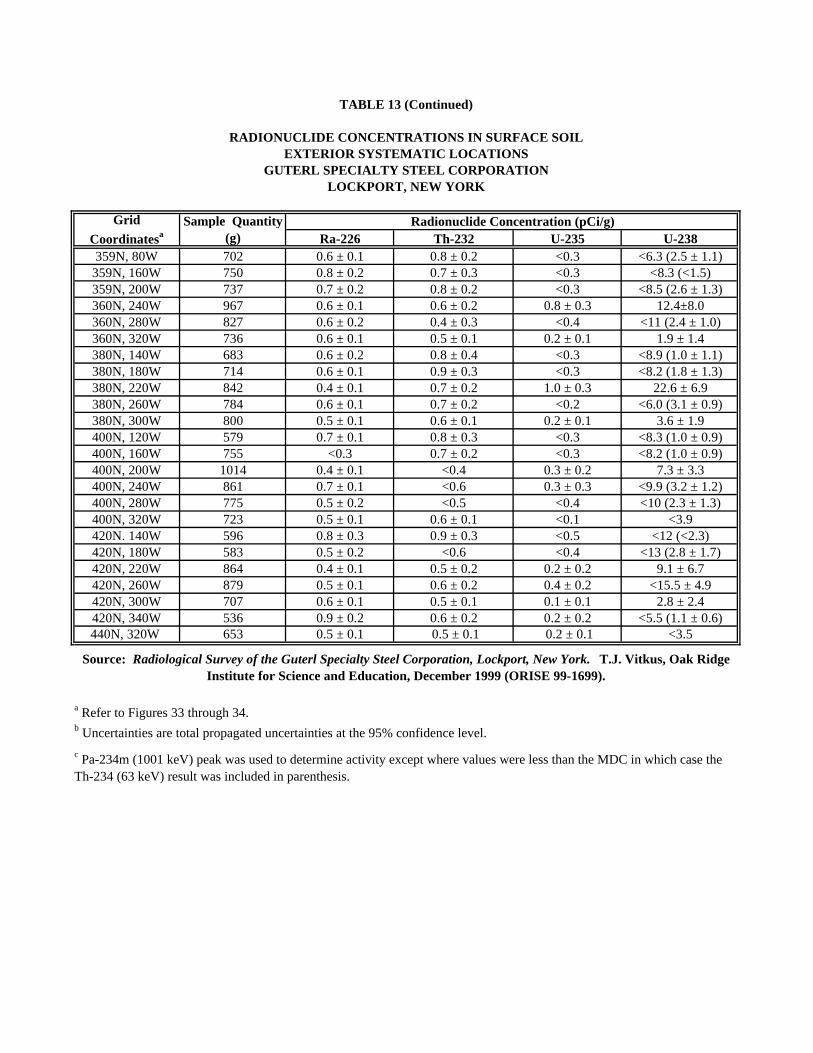
Ra-226 Th-232 U-235 U-238359N, 80W 702 0.6 ± 0.1 0.8 ± 0.2 <0.3 <6.3 (2.5 ± 1.1)
359N, 160W 750 0.8 ± 0.2 0.7 ± 0.3 <0.3 <8.3 (<1.5)359N, 200W 737 0.7 ± 0.2 0.8 ± 0.2 <0.3 <8.5 (2.6 ± 1.3)360N, 240W 967 0.6 ± 0.1 0.6 ± 0.2 0.8 ± 0.3 12.4±8.0360N, 280W 827 0.6 ± 0.2 0.4 ± 0.3 <0.4 <11 (2.4 ± 1.0)360N, 320W 736 0.6 ± 0.1 0.5 ± 0.1 0.2 ± 0.1 1.9 ± 1.4380N, 140W 683 0.6 ± 0.2 0.8 ± 0.4 <0.3 <8.9 (1.0 ± 1.1)380N, 180W 714 0.6 ± 0.1 0.9 ± 0.3 <0.3 <8.2 (1.8 ± 1.3)380N, 220W 842 0.4 ± 0.1 0.7 ± 0.2 1.0 ± 0.3 22.6 ± 6.9380N, 260W 784 0.6 ± 0.1 0.7 ± 0.2 <0.2 <6.0 (3.1 ± 0.9)380N, 300W 800 0.5 ± 0.1 0.6 ± 0.1 0.2 ± 0.1 3.6 ± 1.9400N, 120W 579 0.7 ± 0.1 0.8 ± 0.3 <0.3 <8.3 (1.0 ± 0.9)400N, 160W 755 <0.3 0.7 ± 0.2 <0.3 <8.2 (1.0 ± 0.9)400N, 200W 1014 0.4 ± 0.1 <0.4 0.3 ± 0.2 7.3 ± 3.3400N, 240W 861 0.7 ± 0.1 <0.6 0.3 ± 0.3 <9.9 (3.2 ± 1.2)400N, 280W 775 0.5 ± 0.2 <0.5 <0.4 <10 (2.3 ± 1.3)400N, 320W 723 0.5 ± 0.1 0.6 ± 0.1 <0.1 <3.9420N. 140W 596 0.8 ± 0.3 0.9 ± 0.3 <0.5 <12 (<2.3)420N, 180W 583 0.5 ± 0.2 <0.6 <0.4 <13 (2.8 ± 1.7)420N, 220W 864 0.4 ± 0.1 0.5 ± 0.2 0.2 ± 0.2 9.1 ± 6.7420N, 260W 879 0.5 ± 0.1 0.6 ± 0.2 0.4 ± 0.2 <15.5 ± 4.9420N, 300W 707 0.6 ± 0.1 0.5 ± 0.1 0.1 ± 0.1 2.8 ± 2.4420N, 340W 536 0.9 ± 0.2 0.6 ± 0.2 0.2 ± 0.2 <5.5 (1.1 ± 0.6)
440N, 320W 653 0.5 ± 0.1 0.5 ± 0.1 0.2 ± 0.1 <3.5
a Refer to Figures 33 through 34. b Uncertainties are total propagated uncertainties at the 95% confidence level. c Pa-234m (1001 keV) peak was used to determine activity except where values were less than the MDC in which case the Th-234 (63 keV) result was included in parenthesis.
EXTERIOR SYSTEMATIC LOCATIONSGUTERL SPECIALTY STEEL CORPORATION
LOCKPORT, NEW YORK
Grid Coordinatesa
Sample Quantity (g)
Radionuclide Concentration (pCi/g)
Source: Radiological Survey of the Guterl Specialty Steel Corporation, Lockport, New York. T.J. Vitkus, Oak Ridge Institute for Science and Education, December 1999 (ORISE 99-1699).
TABLE 13 (Continued)
RADIONUCLIDE CONCENTRATIONS IN SURFACE SOIL
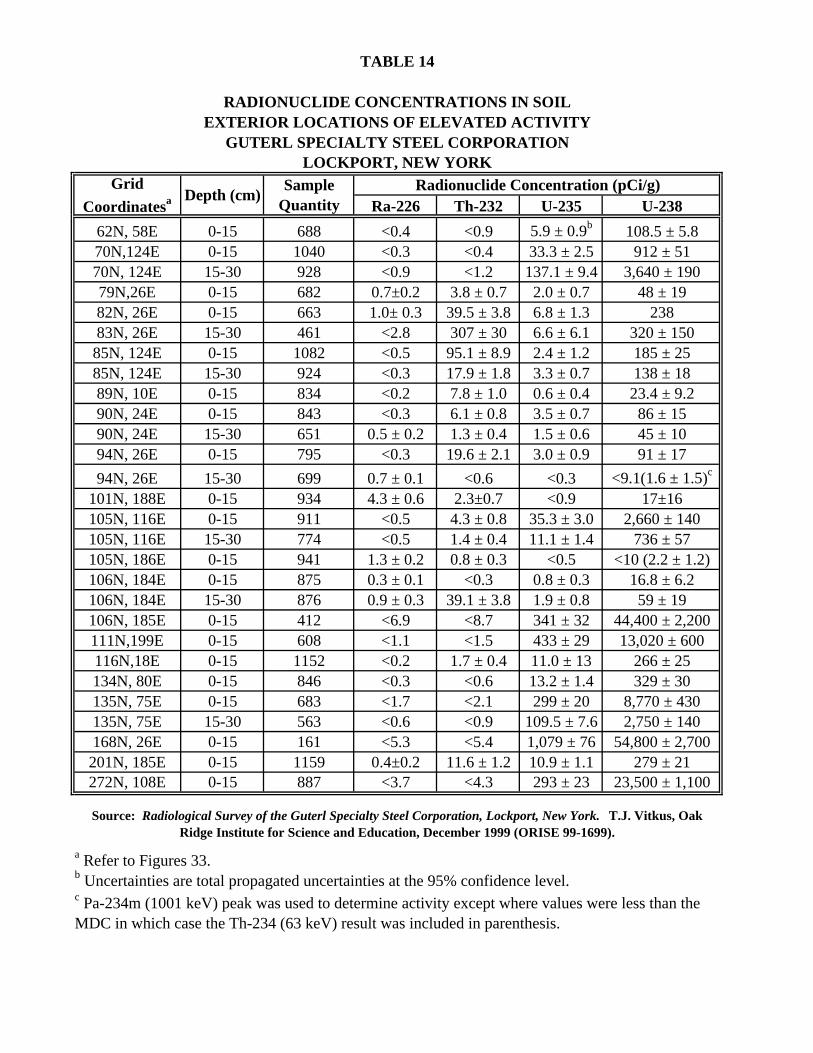
Ra-226 Th-232 U-235 U-238
62N, 58E 0-15 688 <0.4 <0.9 5.9 ± 0.9b 108.5 ± 5.870N,124E 0-15 1040 <0.3 <0.4 33.3 ± 2.5 912 ± 5170N, 124E 15-30 928 <0.9 <1.2 137.1 ± 9.4 3,640 ± 19079N,26E 0-15 682 0.7±0.2 3.8 ± 0.7 2.0 ± 0.7 48 ± 1982N, 26E 0-15 663 1.0± 0.3 39.5 ± 3.8 6.8 ± 1.3 23883N, 26E 15-30 461 <2.8 307 ± 30 6.6 ± 6.1 320 ± 15085N, 124E 0-15 1082 <0.5 95.1 ± 8.9 2.4 ± 1.2 185 ± 2585N, 124E 15-30 924 <0.3 17.9 ± 1.8 3.3 ± 0.7 138 ± 1889N, 10E 0-15 834 <0.2 7.8 ± 1.0 0.6 ± 0.4 23.4 ± 9.290N, 24E 0-15 843 <0.3 6.1 ± 0.8 3.5 ± 0.7 86 ± 1590N, 24E 15-30 651 0.5 ± 0.2 1.3 ± 0.4 1.5 ± 0.6 45 ± 1094N, 26E 0-15 795 <0.3 19.6 ± 2.1 3.0 ± 0.9 91 ± 1794N, 26E 15-30 699 0.7 ± 0.1 <0.6 <0.3 <9.1(1.6 ± 1.5)c
101N, 188E 0-15 934 4.3 ± 0.6 2.3±0.7 <0.9 17±16105N, 116E 0-15 911 <0.5 4.3 ± 0.8 35.3 ± 3.0 2,660 ± 140105N, 116E 15-30 774 <0.5 1.4 ± 0.4 11.1 ± 1.4 736 ± 57105N, 186E 0-15 941 1.3 ± 0.2 0.8 ± 0.3 <0.5 <10 (2.2 ± 1.2)106N, 184E 0-15 875 0.3 ± 0.1 <0.3 0.8 ± 0.3 16.8 ± 6.2106N, 184E 15-30 876 0.9 ± 0.3 39.1 ± 3.8 1.9 ± 0.8 59 ± 19106N, 185E 0-15 412 <6.9 <8.7 341 ± 32 44,400 ± 2,200111N,199E 0-15 608 <1.1 <1.5 433 ± 29 13,020 ± 600116N,18E 0-15 1152 <0.2 1.7 ± 0.4 11.0 ± 13 266 ± 25134N, 80E 0-15 846 <0.3 <0.6 13.2 ± 1.4 329 ± 30135N, 75E 0-15 683 <1.7 <2.1 299 ± 20 8,770 ± 430135N, 75E 15-30 563 <0.6 <0.9 109.5 ± 7.6 2,750 ± 140168N, 26E 0-15 161 <5.3 <5.4 1,079 ± 76 54,800 ± 2,700201N, 185E 0-15 1159 0.4±0.2 11.6 ± 1.2 10.9 ± 1.1 279 ± 21272N, 108E 0-15 887 <3.7 <4.3 293 ± 23 23,500 ± 1,100
Grid Coordinatesa
Sample Quantity
Radionuclide Concentration (pCi/g)
Source: Radiological Survey of the Guterl Specialty Steel Corporation, Lockport, New York. T.J. Vitkus, Oak Ridge Institute for Science and Education, December 1999 (ORISE 99-1699).
RADIONUCLIDE CONCENTRATIONS IN SOILEXTERIOR LOCATIONS OF ELEVATED ACTIVITY
GUTERL SPECIALTY STEEL CORPORATIONLOCKPORT, NEW YORK
TABLE 14
a Refer to Figures 33. b Uncertainties are total propagated uncertainties at the 95% confidence level. c Pa-234m (1001 keV) peak was used to determine activity except where values were less than the MDC in which case the Th-234 (63 keV) result was included in parenthesis.
Depth (cm)
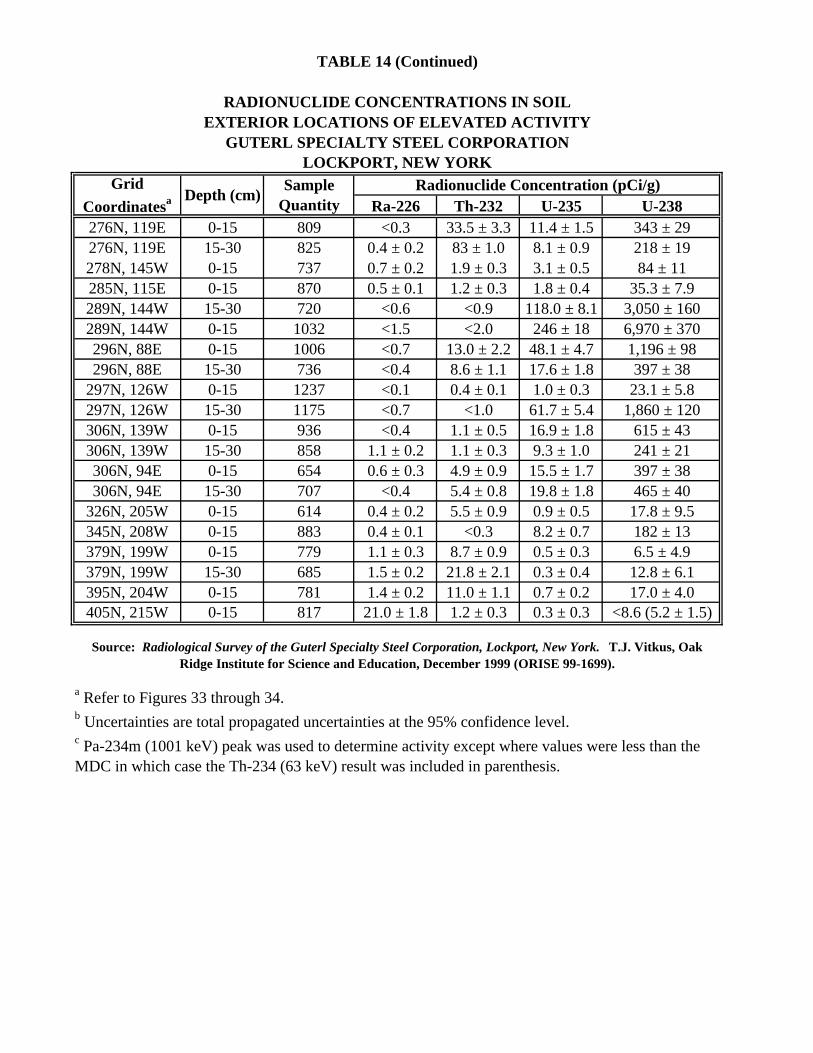
Ra-226 Th-232 U-235 U-238276N, 119E 0-15 809 <0.3 33.5 ± 3.3 11.4 ± 1.5 343 ± 29276N, 119E 15-30 825 0.4 ± 0.2 83 ± 1.0 8.1 ± 0.9 218 ± 19278N, 145W 0-15 737 0.7 ± 0.2 1.9 ± 0.3 3.1 ± 0.5 84 ± 11285N, 115E 0-15 870 0.5 ± 0.1 1.2 ± 0.3 1.8 ± 0.4 35.3 ± 7.9289N, 144W 15-30 720 <0.6 <0.9 118.0 ± 8.1 3,050 ± 160289N, 144W 0-15 1032 <1.5 <2.0 246 ± 18 6,970 ± 370296N, 88E 0-15 1006 <0.7 13.0 ± 2.2 48.1 ± 4.7 1,196 ± 98296N, 88E 15-30 736 <0.4 8.6 ± 1.1 17.6 ± 1.8 397 ± 38
297N, 126W 0-15 1237 <0.1 0.4 ± 0.1 1.0 ± 0.3 23.1 ± 5.8297N, 126W 15-30 1175 <0.7 <1.0 61.7 ± 5.4 1,860 ± 120306N, 139W 0-15 936 <0.4 1.1 ± 0.5 16.9 ± 1.8 615 ± 43306N, 139W 15-30 858 1.1 ± 0.2 1.1 ± 0.3 9.3 ± 1.0 241 ± 21306N, 94E 0-15 654 0.6 ± 0.3 4.9 ± 0.9 15.5 ± 1.7 397 ± 38306N, 94E 15-30 707 <0.4 5.4 ± 0.8 19.8 ± 1.8 465 ± 40
326N, 205W 0-15 614 0.4 ± 0.2 5.5 ± 0.9 0.9 ± 0.5 17.8 ± 9.5345N, 208W 0-15 883 0.4 ± 0.1 <0.3 8.2 ± 0.7 182 ± 13379N, 199W 0-15 779 1.1 ± 0.3 8.7 ± 0.9 0.5 ± 0.3 6.5 ± 4.9379N, 199W 15-30 685 1.5 ± 0.2 21.8 ± 2.1 0.3 ± 0.4 12.8 ± 6.1395N, 204W 0-15 781 1.4 ± 0.2 11.0 ± 1.1 0.7 ± 0.2 17.0 ± 4.0405N, 215W 0-15 817 21.0 ± 1.8 1.2 ± 0.3 0.3 ± 0.3 <8.6 (5.2 ± 1.5)
b Uncertainties are total propagated uncertainties at the 95% confidence level. c Pa-234m (1001 keV) peak was used to determine activity except where values were less than the MDC in which case the Th-234 (63 keV) result was included in parenthesis.
Grid Coordinatesa Depth (cm)
Sample Quantity
Radionuclide Concentration (pCi/g)
Source: Radiological Survey of the Guterl Specialty Steel Corporation, Lockport, New York. T.J. Vitkus, Oak Ridge Institute for Science and Education, December 1999 (ORISE 99-1699).
a Refer to Figures 33 through 34.
LOCKPORT, NEW YORK
TABLE 14 (Continued)
RADIONUCLIDE CONCENTRATIONS IN SOILEXTERIOR LOCATIONS OF ELEVATED ACTIVITY
GUTERL SPECIALTY STEEL CORPORATION
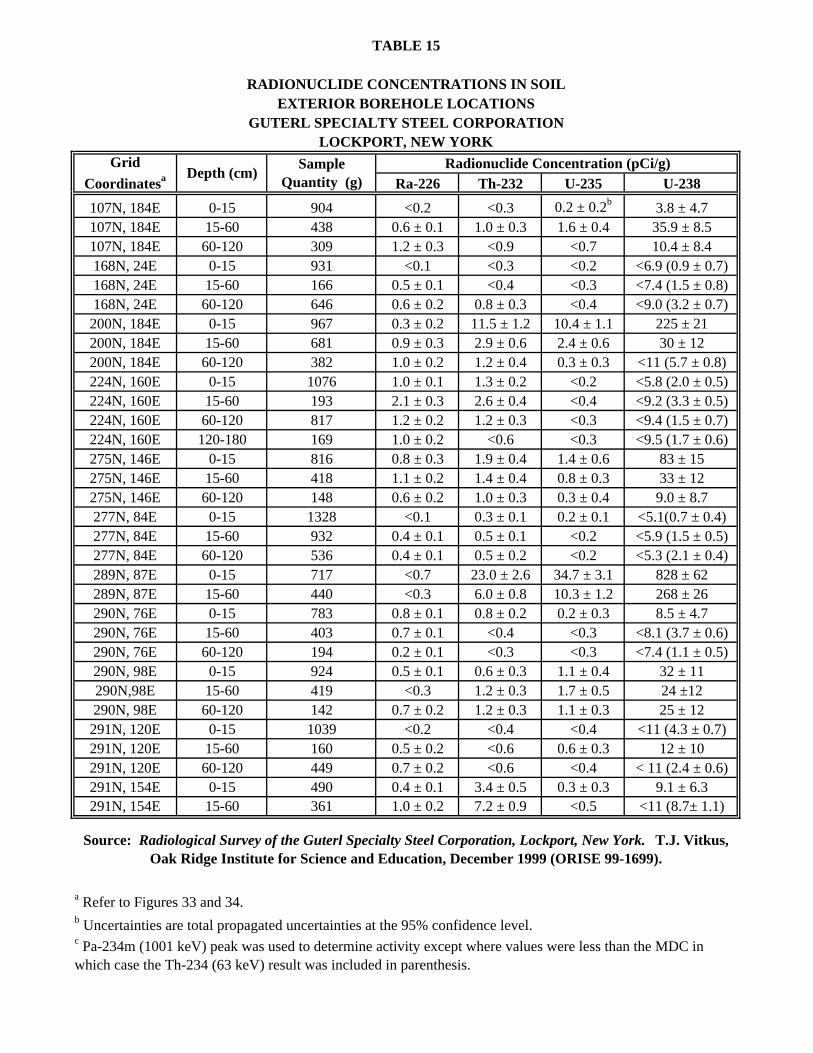
Ra-226 Th-232 U-235 U-238
107N, 184E 0-15 904 <0.2 <0.3 0.2 ± 0.2b 3.8 ± 4.7107N, 184E 15-60 438 0.6 ± 0.1 1.0 ± 0.3 1.6 ± 0.4 35.9 ± 8.5107N, 184E 60-120 309 1.2 ± 0.3 <0.9 <0.7 10.4 ± 8.4168N, 24E 0-15 931 <0.1 <0.3 <0.2 <6.9 (0.9 ± 0.7)168N, 24E 15-60 166 0.5 ± 0.1 <0.4 <0.3 <7.4 (1.5 ± 0.8)168N, 24E 60-120 646 0.6 ± 0.2 0.8 ± 0.3 <0.4 <9.0 (3.2 ± 0.7)200N, 184E 0-15 967 0.3 ± 0.2 11.5 ± 1.2 10.4 ± 1.1 225 ± 21200N, 184E 15-60 681 0.9 ± 0.3 2.9 ± 0.6 2.4 ± 0.6 30 ± 12200N, 184E 60-120 382 1.0 ± 0.2 1.2 ± 0.4 0.3 ± 0.3 <11 (5.7 ± 0.8)224N, 160E 0-15 1076 1.0 ± 0.1 1.3 ± 0.2 <0.2 <5.8 (2.0 ± 0.5)224N, 160E 15-60 193 2.1 ± 0.3 2.6 ± 0.4 <0.4 <9.2 (3.3 ± 0.5)224N, 160E 60-120 817 1.2 ± 0.2 1.2 ± 0.3 <0.3 <9.4 (1.5 ± 0.7)224N, 160E 120-180 169 1.0 ± 0.2 <0.6 <0.3 <9.5 (1.7 ± 0.6)275N, 146E 0-15 816 0.8 ± 0.3 1.9 ± 0.4 1.4 ± 0.6 83 ± 15275N, 146E 15-60 418 1.1 ± 0.2 1.4 ± 0.4 0.8 ± 0.3 33 ± 12275N, 146E 60-120 148 0.6 ± 0.2 1.0 ± 0.3 0.3 ± 0.4 9.0 ± 8.7277N, 84E 0-15 1328 <0.1 0.3 ± 0.1 0.2 ± 0.1 <5.1(0.7 ± 0.4)277N, 84E 15-60 932 0.4 ± 0.1 0.5 ± 0.1 <0.2 <5.9 (1.5 ± 0.5)277N, 84E 60-120 536 0.4 ± 0.1 0.5 ± 0.2 <0.2 <5.3 (2.1 ± 0.4)289N, 87E 0-15 717 <0.7 23.0 ± 2.6 34.7 ± 3.1 828 ± 62289N, 87E 15-60 440 <0.3 6.0 ± 0.8 10.3 ± 1.2 268 ± 26290N, 76E 0-15 783 0.8 ± 0.1 0.8 ± 0.2 0.2 ± 0.3 8.5 ± 4.7290N, 76E 15-60 403 0.7 ± 0.1 <0.4 <0.3 <8.1 (3.7 ± 0.6)290N, 76E 60-120 194 0.2 ± 0.1 <0.3 <0.3 <7.4 (1.1 ± 0.5)290N, 98E 0-15 924 0.5 ± 0.1 0.6 ± 0.3 1.1 ± 0.4 32 ± 11290N,98E 15-60 419 <0.3 1.2 ± 0.3 1.7 ± 0.5 24 ±12290N, 98E 60-120 142 0.7 ± 0.2 1.2 ± 0.3 1.1 ± 0.3 25 ± 12291N, 120E 0-15 1039 <0.2 <0.4 <0.4 <11 (4.3 ± 0.7)291N, 120E 15-60 160 0.5 ± 0.2 <0.6 0.6 ± 0.3 12 ± 10291N, 120E 60-120 449 0.7 ± 0.2 <0.6 <0.4 < 11 (2.4 ± 0.6)291N, 154E 0-15 490 0.4 ± 0.1 3.4 ± 0.5 0.3 ± 0.3 9.1 ± 6.3291N, 154E 15-60 361 1.0 ± 0.2 7.2 ± 0.9 <0.5 <11 (8.7± 1.1)
Source: Radiological Survey of the Guterl Specialty Steel Corporation, Lockport, New York. T.J. Vitkus, Oak Ridge Institute for Science and Education, December 1999 (ORISE 99-1699).
a Refer to Figures 33 and 34. b Uncertainties are total propagated uncertainties at the 95% confidence level. c Pa-234m (1001 keV) peak was used to determine activity except where values were less than the MDC in which case the Th-234 (63 keV) result was included in parenthesis.
LOCKPORT, NEW YORKGrid
Coordinatesa Depth (cm)Sample
Quantity (g)Radionuclide Concentration (pCi/g)
TABLE 15
RADIONUCLIDE CONCENTRATIONS IN SOILEXTERIOR BOREHOLE LOCATIONS
GUTERL SPECIALTY STEEL CORPORATION
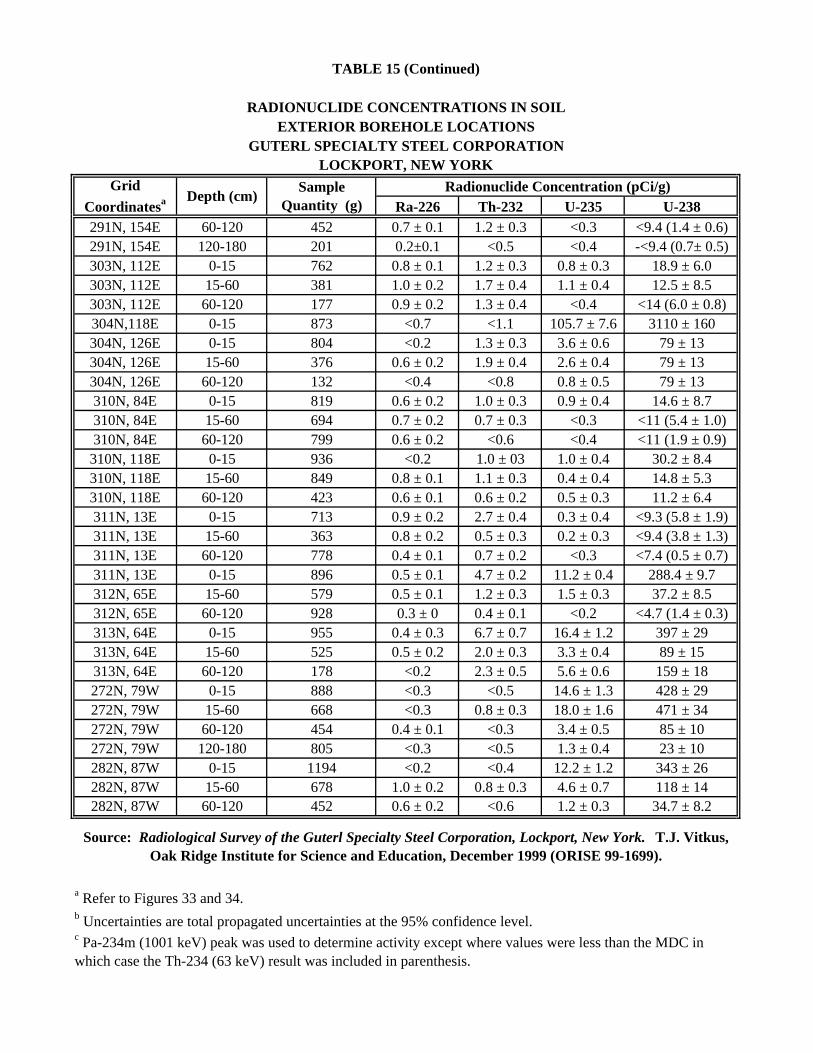
Ra-226 Th-232 U-235 U-238291N, 154E 60-120 452 0.7 ± 0.1 1.2 ± 0.3 <0.3 <9.4 (1.4 ± 0.6)291N, 154E 120-180 201 0.2±0.1 <0.5 <0.4 -<9.4 (0.7± 0.5)303N, 112E 0-15 762 0.8 ± 0.1 1.2 ± 0.3 0.8 ± 0.3 18.9 ± 6.0303N, 112E 15-60 381 1.0 ± 0.2 1.7 ± 0.4 1.1 ± 0.4 12.5 ± 8.5303N, 112E 60-120 177 0.9 ± 0.2 1.3 ± 0.4 <0.4 <14 (6.0 ± 0.8)304N,118E 0-15 873 <0.7 <1.1 105.7 ± 7.6 3110 ± 160304N, 126E 0-15 804 <0.2 1.3 ± 0.3 3.6 ± 0.6 79 ± 13304N, 126E 15-60 376 0.6 ± 0.2 1.9 ± 0.4 2.6 ± 0.4 79 ± 13304N, 126E 60-120 132 <0.4 <0.8 0.8 ± 0.5 79 ± 13310N, 84E 0-15 819 0.6 ± 0.2 1.0 ± 0.3 0.9 ± 0.4 14.6 ± 8.7310N, 84E 15-60 694 0.7 ± 0.2 0.7 ± 0.3 <0.3 <11 (5.4 ± 1.0)310N, 84E 60-120 799 0.6 ± 0.2 <0.6 <0.4 <11 (1.9 ± 0.9)310N, 118E 0-15 936 <0.2 1.0 ± 03 1.0 ± 0.4 30.2 ± 8.4310N, 118E 15-60 849 0.8 ± 0.1 1.1 ± 0.3 0.4 ± 0.4 14.8 ± 5.3310N, 118E 60-120 423 0.6 ± 0.1 0.6 ± 0.2 0.5 ± 0.3 11.2 ± 6.4311N, 13E 0-15 713 0.9 ± 0.2 2.7 ± 0.4 0.3 ± 0.4 <9.3 (5.8 ± 1.9)311N, 13E 15-60 363 0.8 ± 0.2 0.5 ± 0.3 0.2 ± 0.3 <9.4 (3.8 ± 1.3)311N, 13E 60-120 778 0.4 ± 0.1 0.7 ± 0.2 <0.3 <7.4 (0.5 ± 0.7)311N, 13E 0-15 896 0.5 ± 0.1 4.7 ± 0.2 11.2 ± 0.4 288.4 ± 9.7312N, 65E 15-60 579 0.5 ± 0.1 1.2 ± 0.3 1.5 ± 0.3 37.2 ± 8.5312N, 65E 60-120 928 0.3 ± 0 0.4 ± 0.1 <0.2 <4.7 (1.4 ± 0.3)313N, 64E 0-15 955 0.4 ± 0.3 6.7 ± 0.7 16.4 ± 1.2 397 ± 29313N, 64E 15-60 525 0.5 ± 0.2 2.0 ± 0.3 3.3 ± 0.4 89 ± 15313N, 64E 60-120 178 <0.2 2.3 ± 0.5 5.6 ± 0.6 159 ± 18272N, 79W 0-15 888 <0.3 <0.5 14.6 ± 1.3 428 ± 29272N, 79W 15-60 668 <0.3 0.8 ± 0.3 18.0 ± 1.6 471 ± 34272N, 79W 60-120 454 0.4 ± 0.1 <0.3 3.4 ± 0.5 85 ± 10272N, 79W 120-180 805 <0.3 <0.5 1.3 ± 0.4 23 ± 10282N, 87W 0-15 1194 <0.2 <0.4 12.2 ± 1.2 343 ± 26282N, 87W 15-60 678 1.0 ± 0.2 0.8 ± 0.3 4.6 ± 0.7 118 ± 14282N, 87W 60-120 452 0.6 ± 0.2 <0.6 1.2 ± 0.3 34.7 ± 8.2
Source: Radiological Survey of the Guterl Specialty Steel Corporation, Lockport, New York. T.J. Vitkus, Oak Ridge Institute for Science and Education, December 1999 (ORISE 99-1699).
a Refer to Figures 33 and 34. b Uncertainties are total propagated uncertainties at the 95% confidence level.
LOCKPORT, NEW YORKGrid
Coordinatesa Depth (cm)Sample
Quantity (g)Radionuclide Concentration (pCi/g)
c Pa-234m (1001 keV) peak was used to determine activity except where values were less than the MDC in which case the Th-234 (63 keV) result was included in parenthesis.
TABLE 15 (Continued)
RADIONUCLIDE CONCENTRATIONS IN SOILEXTERIOR BOREHOLE LOCATIONS
GUTERL SPECIALTY STEEL CORPORATION
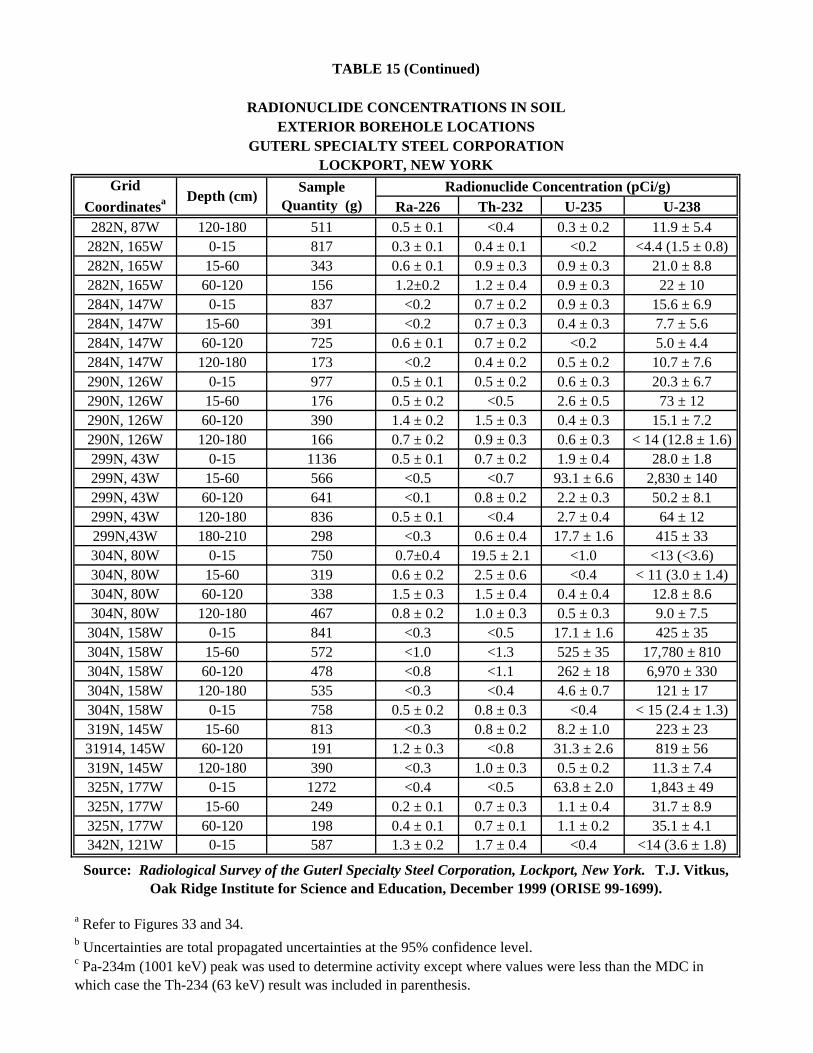
Ra-226 Th-232 U-235 U-238282N, 87W 120-180 511 0.5 ± 0.1 <0.4 0.3 ± 0.2 11.9 ± 5.4
282N, 165W 0-15 817 0.3 ± 0.1 0.4 ± 0.1 <0.2 <4.4 (1.5 ± 0.8)282N, 165W 15-60 343 0.6 ± 0.1 0.9 ± 0.3 0.9 ± 0.3 21.0 ± 8.8282N, 165W 60-120 156 1.2±0.2 1.2 ± 0.4 0.9 ± 0.3 22 ± 10284N, 147W 0-15 837 <0.2 0.7 ± 0.2 0.9 ± 0.3 15.6 ± 6.9284N, 147W 15-60 391 <0.2 0.7 ± 0.3 0.4 ± 0.3 7.7 ± 5.6284N, 147W 60-120 725 0.6 ± 0.1 0.7 ± 0.2 <0.2 5.0 ± 4.4284N, 147W 120-180 173 <0.2 0.4 ± 0.2 0.5 ± 0.2 10.7 ± 7.6290N, 126W 0-15 977 0.5 ± 0.1 0.5 ± 0.2 0.6 ± 0.3 20.3 ± 6.7290N, 126W 15-60 176 0.5 ± 0.2 <0.5 2.6 ± 0.5 73 ± 12290N, 126W 60-120 390 1.4 ± 0.2 1.5 ± 0.3 0.4 ± 0.3 15.1 ± 7.2290N, 126W 120-180 166 0.7 ± 0.2 0.9 ± 0.3 0.6 ± 0.3 < 14 (12.8 ± 1.6)299N, 43W 0-15 1136 0.5 ± 0.1 0.7 ± 0.2 1.9 ± 0.4 28.0 ± 1.8299N, 43W 15-60 566 <0.5 <0.7 93.1 ± 6.6 2,830 ± 140299N, 43W 60-120 641 <0.1 0.8 ± 0.2 2.2 ± 0.3 50.2 ± 8.1299N, 43W 120-180 836 0.5 ± 0.1 <0.4 2.7 ± 0.4 64 ± 12299N,43W 180-210 298 <0.3 0.6 ± 0.4 17.7 ± 1.6 415 ± 33304N, 80W 0-15 750 0.7±0.4 19.5 ± 2.1 <1.0 <13 (<3.6)304N, 80W 15-60 319 0.6 ± 0.2 2.5 ± 0.6 <0.4 < 11 (3.0 ± 1.4)304N, 80W 60-120 338 1.5 ± 0.3 1.5 ± 0.4 0.4 ± 0.4 12.8 ± 8.6304N, 80W 120-180 467 0.8 ± 0.2 1.0 ± 0.3 0.5 ± 0.3 9.0 ± 7.5
304N, 158W 0-15 841 <0.3 <0.5 17.1 ± 1.6 425 ± 35304N, 158W 15-60 572 <1.0 <1.3 525 ± 35 17,780 ± 810304N, 158W 60-120 478 <0.8 <1.1 262 ± 18 6,970 ± 330304N, 158W 120-180 535 <0.3 <0.4 4.6 ± 0.7 121 ± 17304N, 158W 0-15 758 0.5 ± 0.2 0.8 ± 0.3 <0.4 < 15 (2.4 ± 1.3)319N, 145W 15-60 813 <0.3 0.8 ± 0.2 8.2 ± 1.0 223 ± 2331914, 145W 60-120 191 1.2 ± 0.3 <0.8 31.3 ± 2.6 819 ± 56319N, 145W 120-180 390 <0.3 1.0 ± 0.3 0.5 ± 0.2 11.3 ± 7.4325N, 177W 0-15 1272 <0.4 <0.5 63.8 ± 2.0 1,843 ± 49325N, 177W 15-60 249 0.2 ± 0.1 0.7 ± 0.3 1.1 ± 0.4 31.7 ± 8.9325N, 177W 60-120 198 0.4 ± 0.1 0.7 ± 0.1 1.1 ± 0.2 35.1 ± 4.1342N, 121W 0-15 587 1.3 ± 0.2 1.7 ± 0.4 <0.4 <14 (3.6 ± 1.8)
Source: Radiological Survey of the Guterl Specialty Steel Corporation, Lockport, New York. T.J. Vitkus, Oak Ridge Institute for Science and Education, December 1999 (ORISE 99-1699).
a Refer to Figures 33 and 34. b Uncertainties are total propagated uncertainties at the 95% confidence level.
LOCKPORT, NEW YORKGrid
Coordinatesa Depth (cm)Sample
Quantity (g)Radionuclide Concentration (pCi/g)
TABLE 15 (Continued)
RADIONUCLIDE CONCENTRATIONS IN SOILEXTERIOR BOREHOLE LOCATIONS
GUTERL SPECIALTY STEEL CORPORATION
c Pa-234m (1001 keV) peak was used to determine activity except where values were less than the MDC in which case the Th-234 (63 keV) result was included in parenthesis.
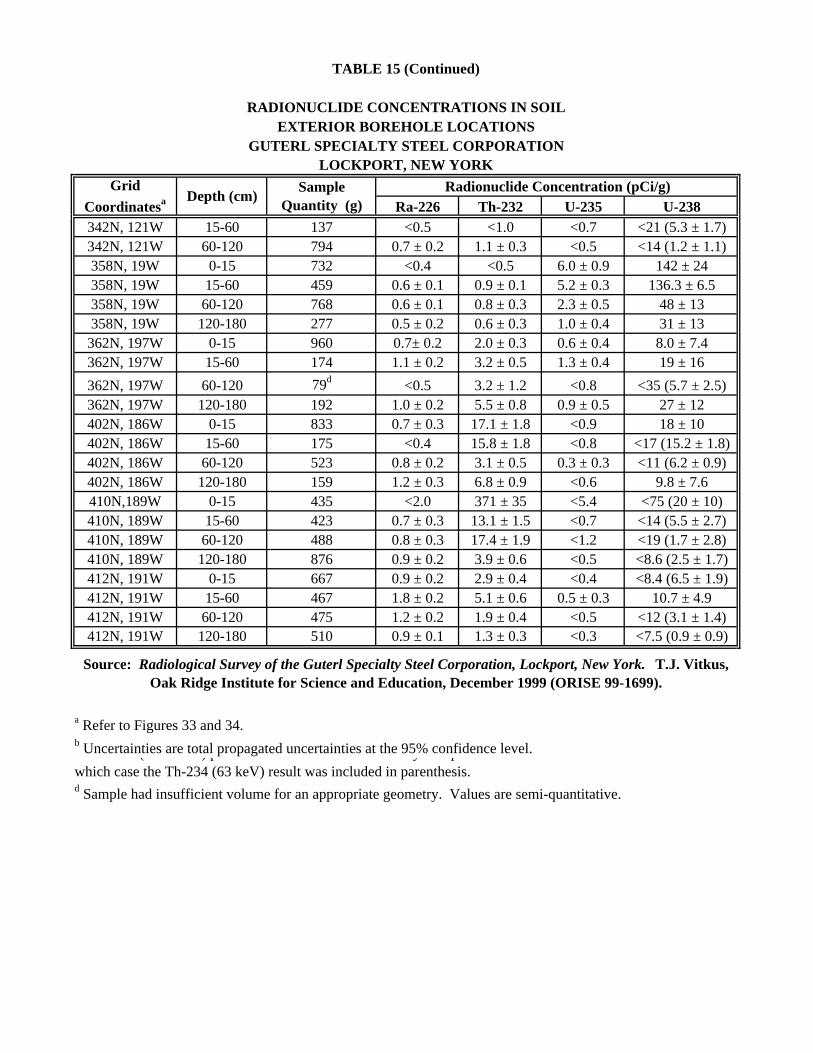
Ra-226 Th-232 U-235 U-238342N, 121W 15-60 137 <0.5 <1.0 <0.7 <21 (5.3 ± 1.7)342N, 121W 60-120 794 0.7 ± 0.2 1.1 ± 0.3 <0.5 <14 (1.2 ± 1.1)358N, 19W 0-15 732 <0.4 <0.5 6.0 ± 0.9 142 ± 24358N, 19W 15-60 459 0.6 ± 0.1 0.9 ± 0.1 5.2 ± 0.3 136.3 ± 6.5358N, 19W 60-120 768 0.6 ± 0.1 0.8 ± 0.3 2.3 ± 0.5 48 ± 13358N, 19W 120-180 277 0.5 ± 0.2 0.6 ± 0.3 1.0 ± 0.4 31 ± 13
362N, 197W 0-15 960 0.7± 0.2 2.0 ± 0.3 0.6 ± 0.4 8.0 ± 7.4362N, 197W 15-60 174 1.1 ± 0.2 3.2 ± 0.5 1.3 ± 0.4 19 ± 16
362N, 197W 60-120 79d <0.5 3.2 ± 1.2 <0.8 <35 (5.7 ± 2.5)362N, 197W 120-180 192 1.0 ± 0.2 5.5 ± 0.8 0.9 ± 0.5 27 ± 12402N, 186W 0-15 833 0.7 ± 0.3 17.1 ± 1.8 <0.9 18 ± 10402N, 186W 15-60 175 <0.4 15.8 ± 1.8 <0.8 <17 (15.2 ± 1.8)402N, 186W 60-120 523 0.8 ± 0.2 3.1 ± 0.5 0.3 ± 0.3 <11 (6.2 ± 0.9)402N, 186W 120-180 159 1.2 ± 0.3 6.8 ± 0.9 <0.6 9.8 ± 7.6410N,189W 0-15 435 <2.0 371 ± 35 <5.4 <75 (20 ± 10)410N, 189W 15-60 423 0.7 ± 0.3 13.1 ± 1.5 <0.7 <14 (5.5 ± 2.7)410N, 189W 60-120 488 0.8 ± 0.3 17.4 ± 1.9 <1.2 <19 (1.7 ± 2.8)410N, 189W 120-180 876 0.9 ± 0.2 3.9 ± 0.6 <0.5 <8.6 (2.5 ± 1.7)412N, 191W 0-15 667 0.9 ± 0.2 2.9 ± 0.4 <0.4 <8.4 (6.5 ± 1.9)412N, 191W 15-60 467 1.8 ± 0.2 5.1 ± 0.6 0.5 ± 0.3 10.7 ± 4.9412N, 191W 60-120 475 1.2 ± 0.2 1.9 ± 0.4 <0.5 <12 (3.1 ± 1.4)412N, 191W 120-180 510 0.9 ± 0.1 1.3 ± 0.3 <0.3 <7.5 (0.9 ± 0.9)
d Sample had insufficient volume for an appropriate geometry. Values are semi-quantitative.
Source: Radiological Survey of the Guterl Specialty Steel Corporation, Lockport, New York. T.J. Vitkus, Oak Ridge Institute for Science and Education, December 1999 (ORISE 99-1699).
TABLE 15 (Continued)
RADIONUCLIDE CONCENTRATIONS IN SOILEXTERIOR BOREHOLE LOCATIONS
a Refer to Figures 33 and 34. b Uncertainties are total propagated uncertainties at the 95% confidence level. Pa-234m (1001 keV) peak was used to determine activity except where values were less than the MDC in which case the Th-234 (63 keV) result was included in parenthesis.
GUTERL SPECIALTY STEEL CORPORATIONLOCKPORT, NEW YORK
Grid Coordinatesa Depth (cm)
Sample Quantity (g)
Radionuclide Concentration (pCi/g)
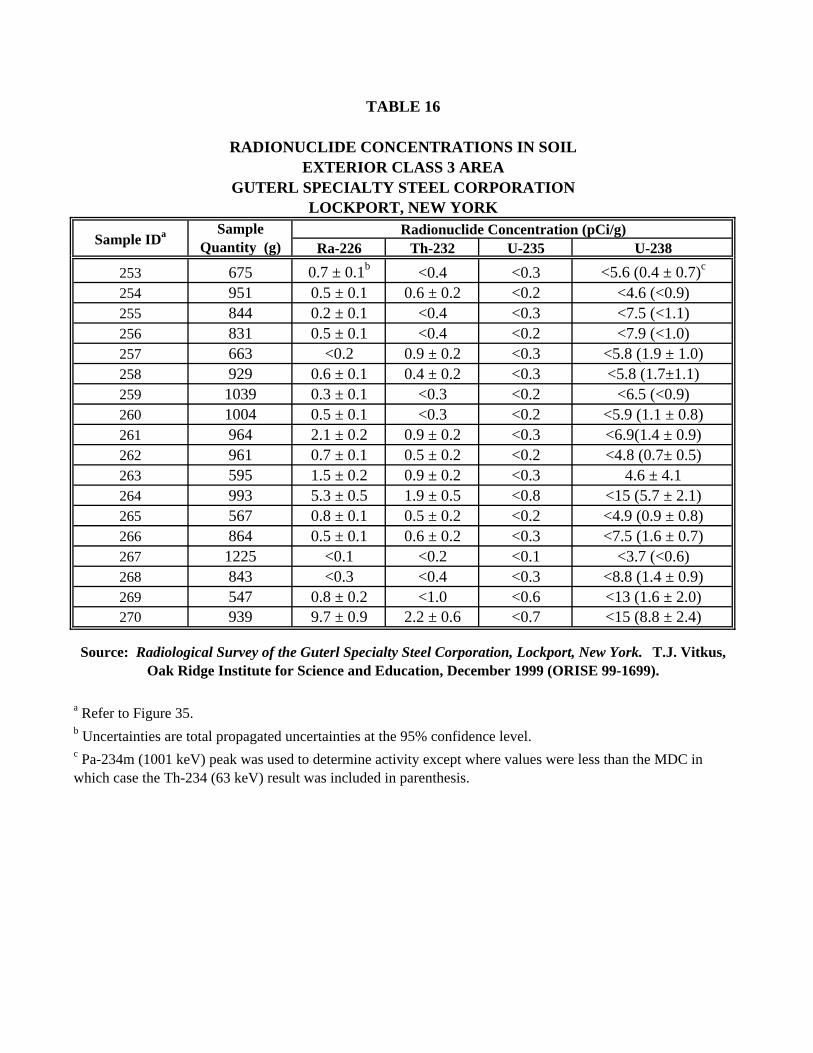
Ra-226 Th-232 U-235 U-238
253 675 0.7 ± 0.1b <0.4 <0.3 <5.6 (0.4 ± 0.7)c
254 951 0.5 ± 0.1 0.6 ± 0.2 <0.2 <4.6 (<0.9)255 844 0.2 ± 0.1 <0.4 <0.3 <7.5 (<1.1)256 831 0.5 ± 0.1 <0.4 <0.2 <7.9 (<1.0)257 663 <0.2 0.9 ± 0.2 <0.3 <5.8 (1.9 ± 1.0)258 929 0.6 ± 0.1 0.4 ± 0.2 <0.3 <5.8 (1.7±1.1)259 1039 0.3 ± 0.1 <0.3 <0.2 <6.5 (<0.9)260 1004 0.5 ± 0.1 <0.3 <0.2 <5.9 (1.1 ± 0.8)261 964 2.1 ± 0.2 0.9 ± 0.2 <0.3 <6.9(1.4 ± 0.9)262 961 0.7 ± 0.1 0.5 ± 0.2 <0.2 <4.8 (0.7± 0.5)263 595 1.5 ± 0.2 0.9 ± 0.2 <0.3 4.6 ± 4.1264 993 5.3 ± 0.5 1.9 ± 0.5 <0.8 <15 (5.7 ± 2.1)265 567 0.8 ± 0.1 0.5 ± 0.2 <0.2 <4.9 (0.9 ± 0.8)266 864 0.5 ± 0.1 0.6 ± 0.2 <0.3 <7.5 (1.6 ± 0.7)267 1225 <0.1 <0.2 <0.1 <3.7 (<0.6)268 843 <0.3 <0.4 <0.3 <8.8 (1.4 ± 0.9)269 547 0.8 ± 0.2 <1.0 <0.6 <13 (1.6 ± 2.0)270 939 9.7 ± 0.9 2.2 ± 0.6 <0.7 <15 (8.8 ± 2.4)
b Uncertainties are total propagated uncertainties at the 95% confidence level. c Pa-234m (1001 keV) peak was used to determine activity except where values were less than the MDC in which case the Th-234 (63 keV) result was included in parenthesis.
TABLE 16
RADIONUCLIDE CONCENTRATIONS IN SOILEXTERIOR CLASS 3 AREA
GUTERL SPECIALTY STEEL CORPORATIONLOCKPORT, NEW YORK
a Refer to Figure 35.
Sample IDa
Source: Radiological Survey of the Guterl Specialty Steel Corporation, Lockport, New York. T.J. Vitkus, Oak Ridge Institute for Science and Education, December 1999 (ORISE 99-1699).
Sample Quantity (g)
Radionuclide Concentration (pCi/g)
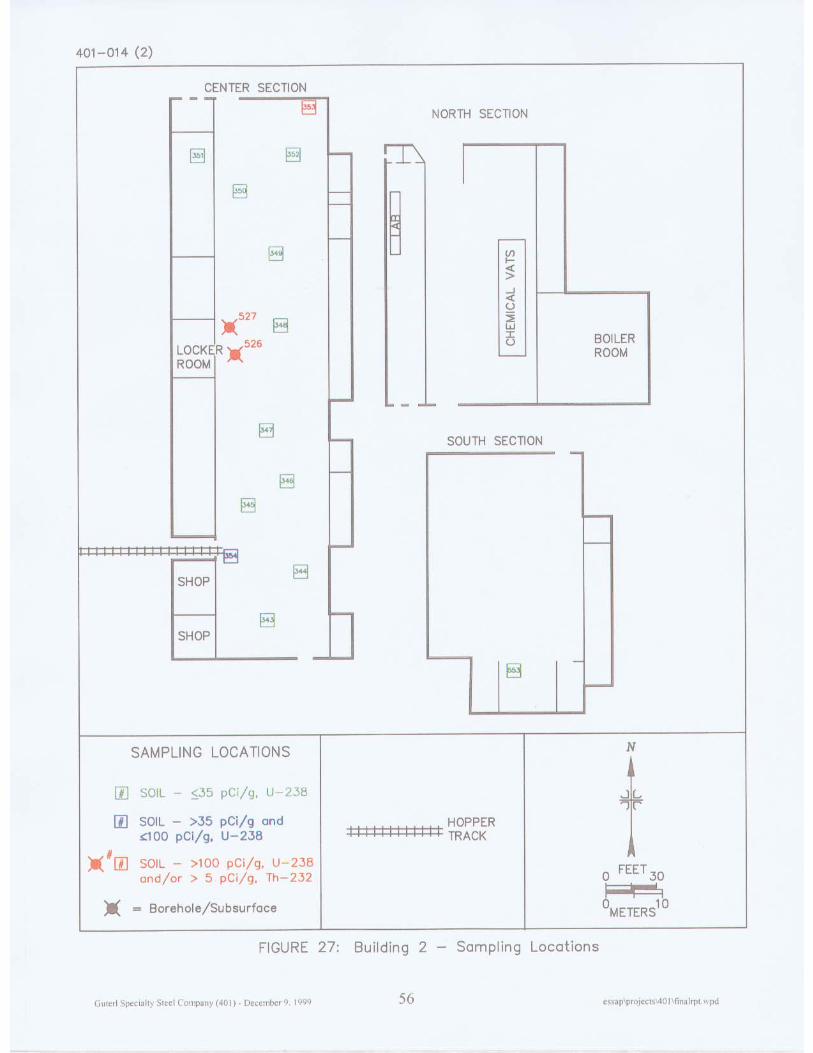
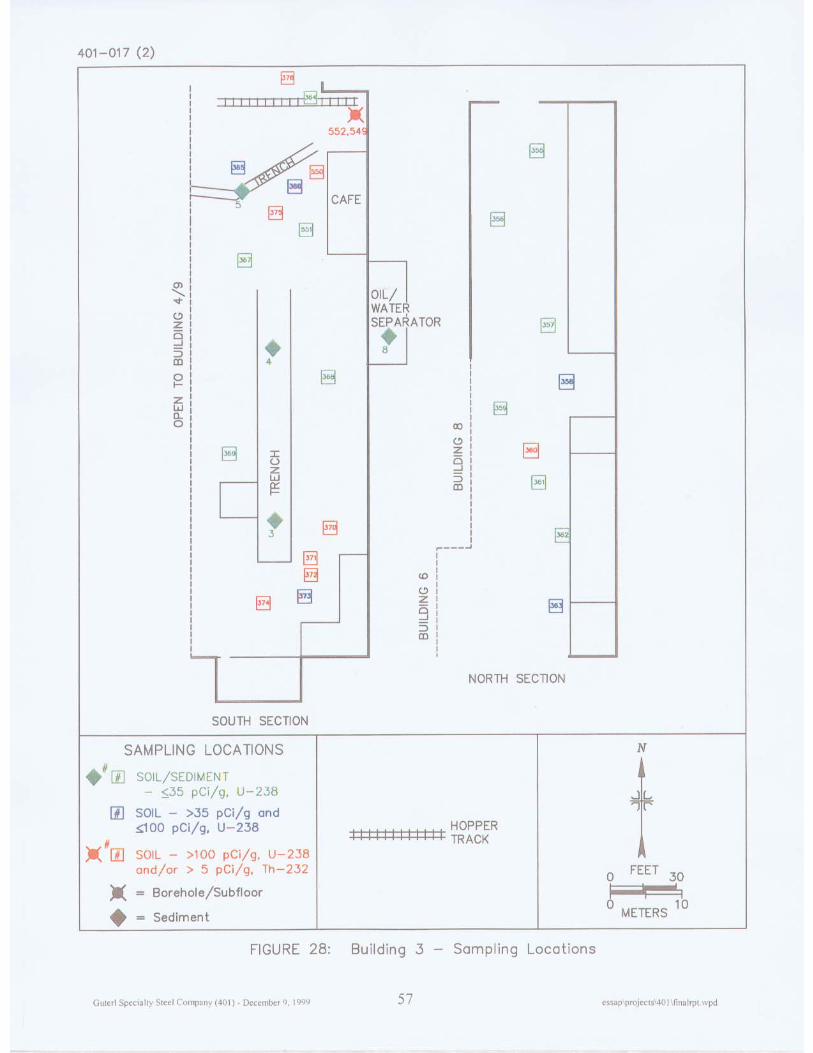
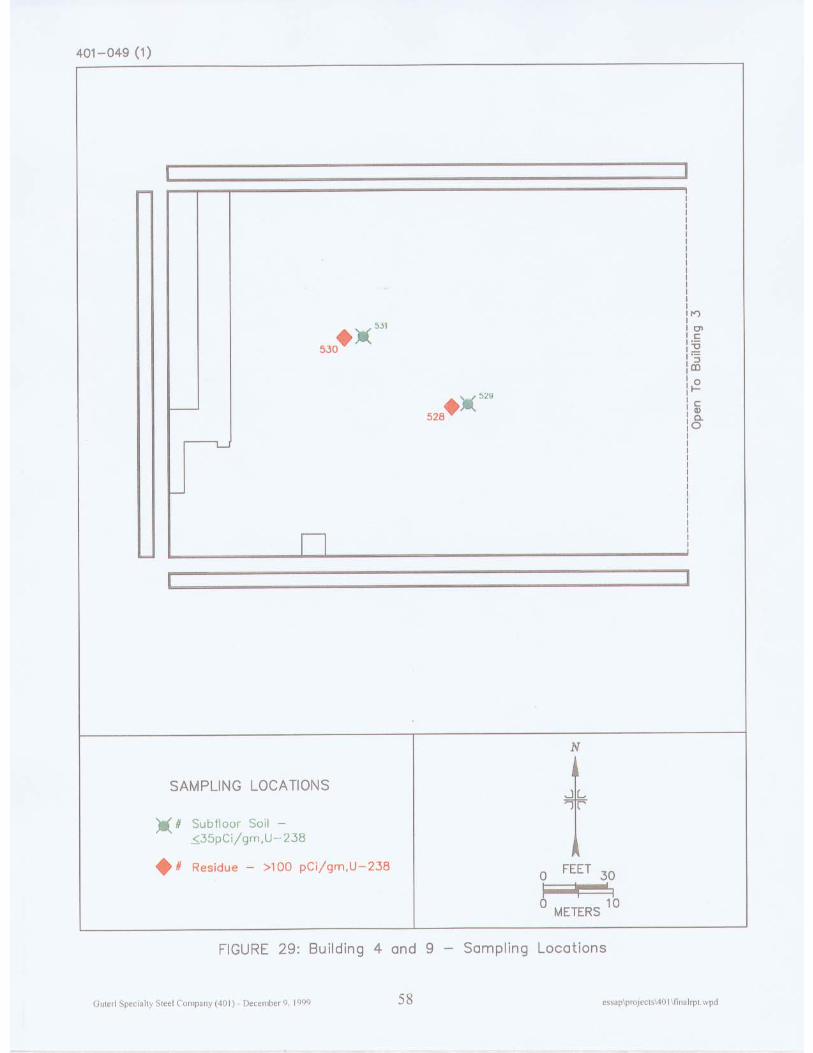
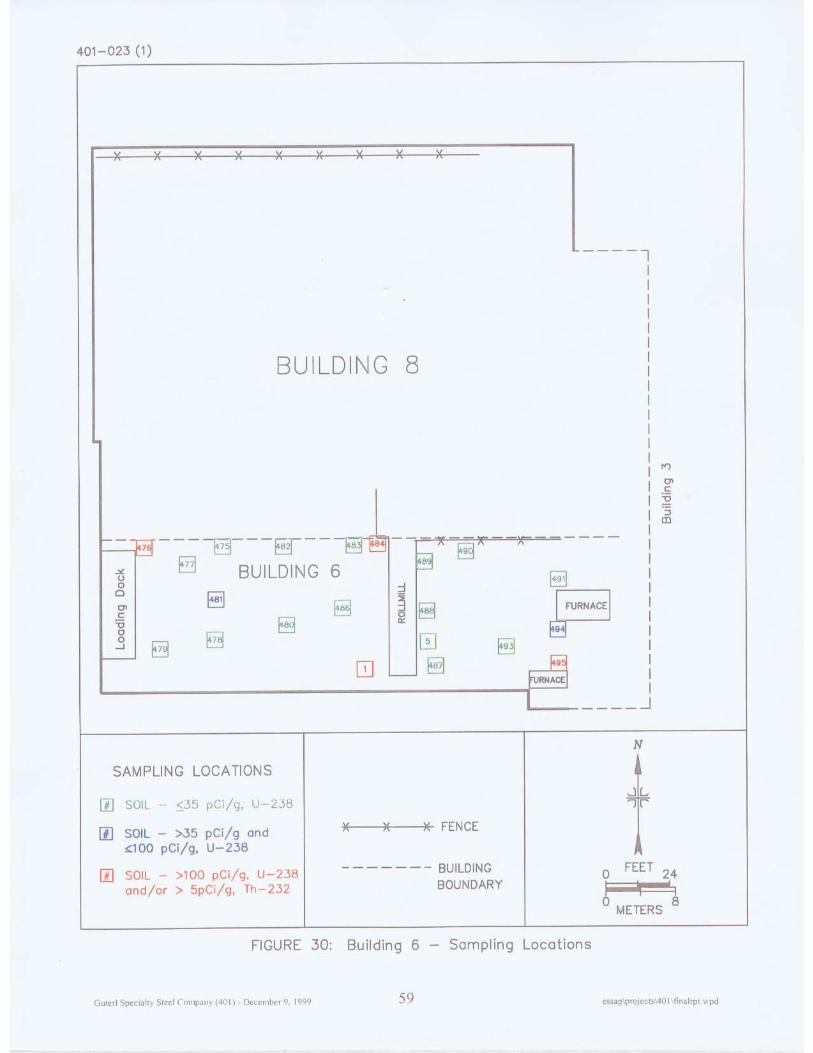
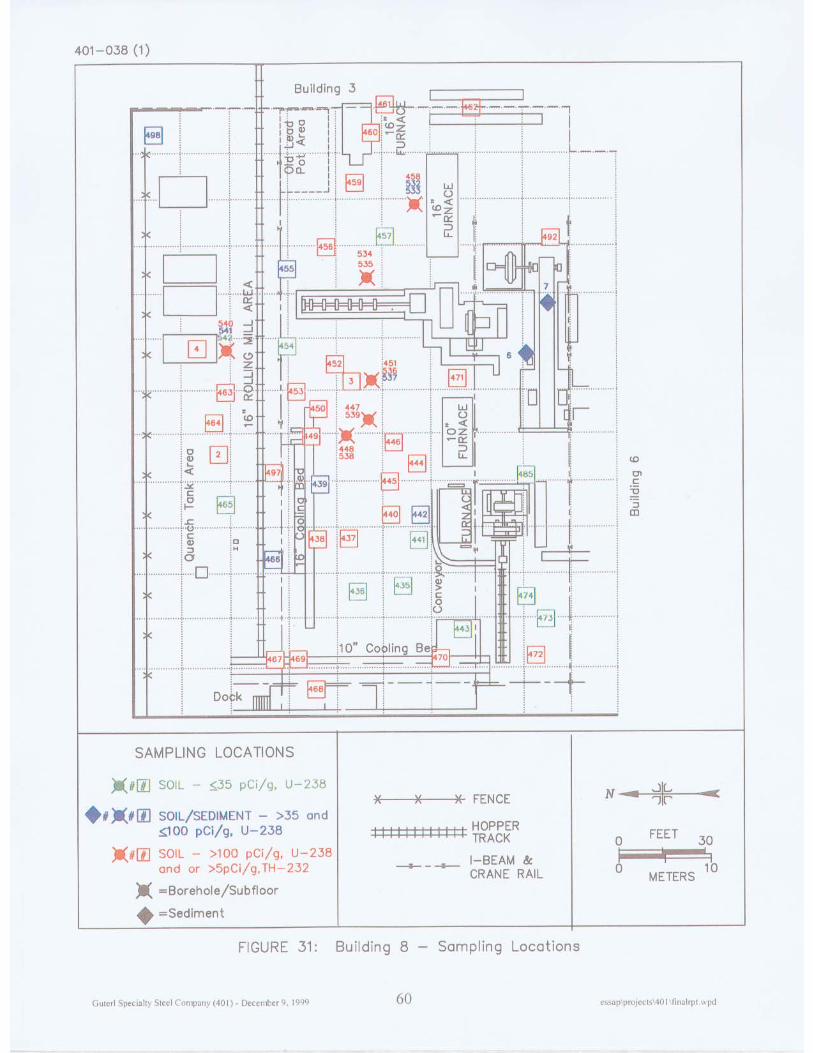
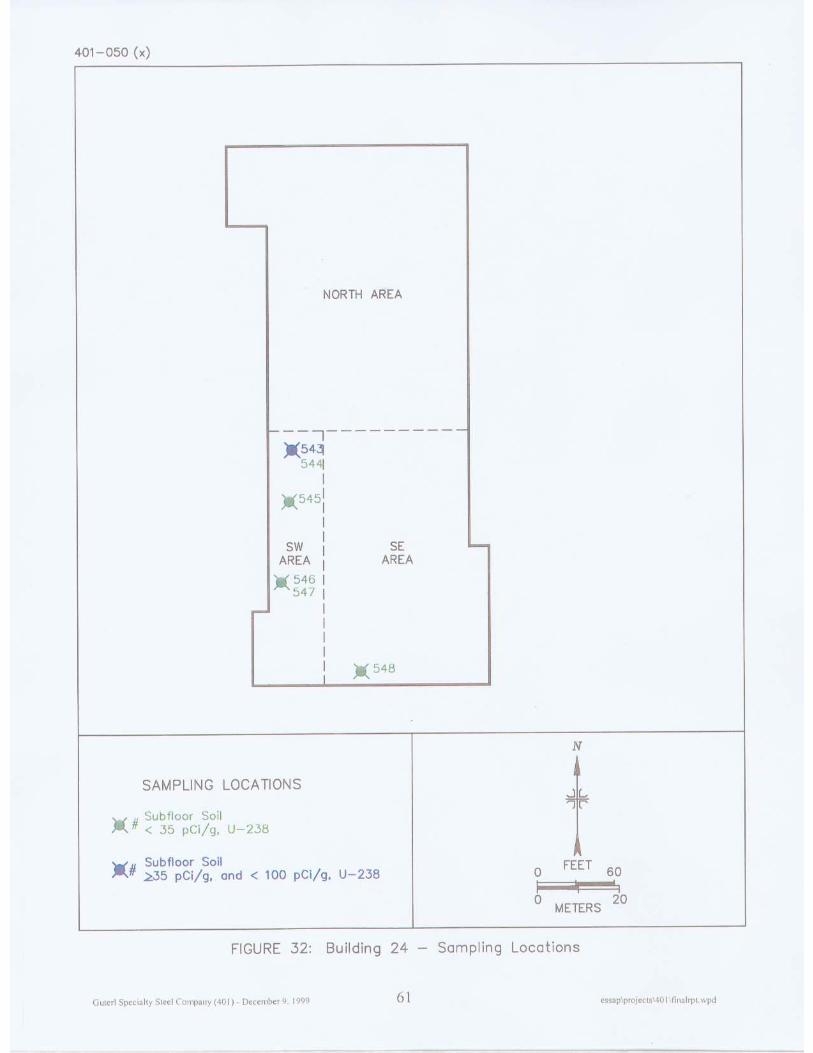
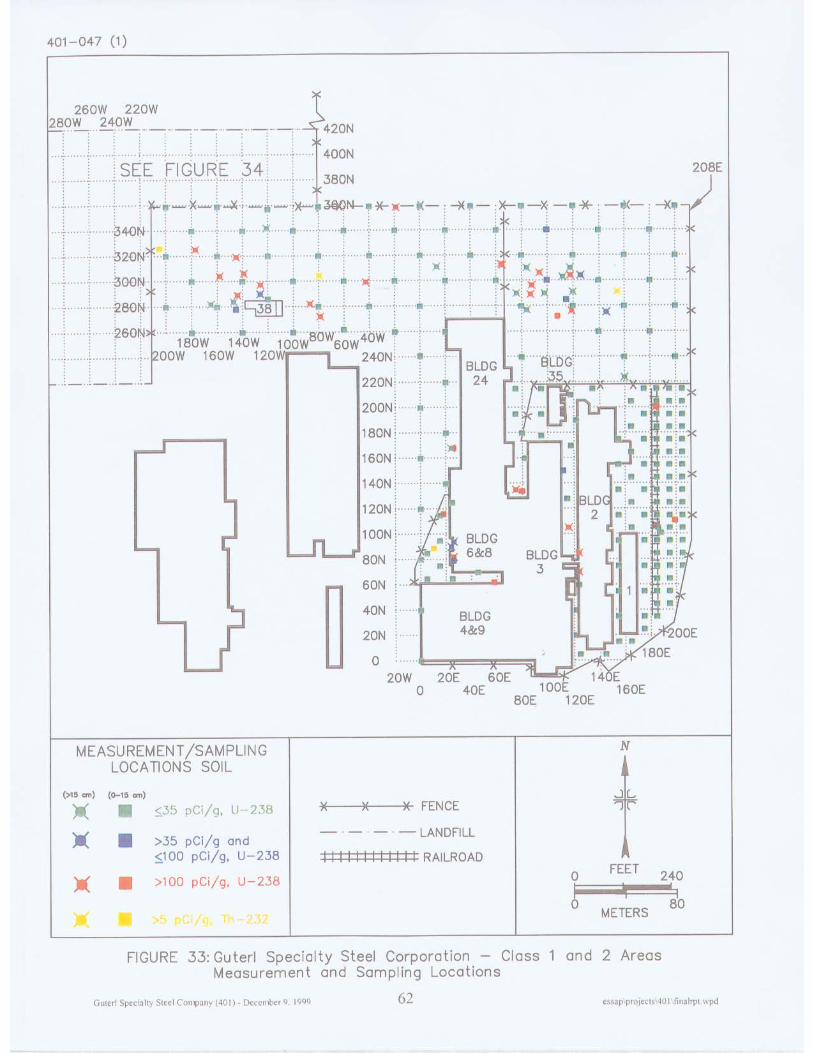
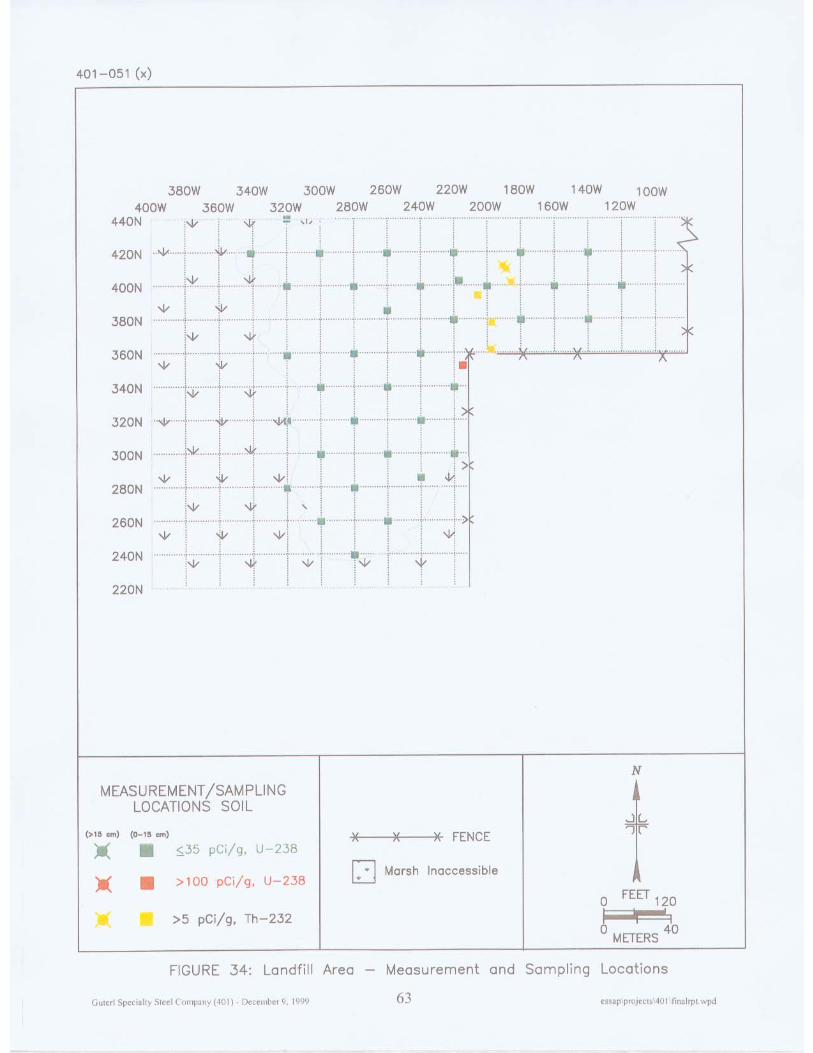
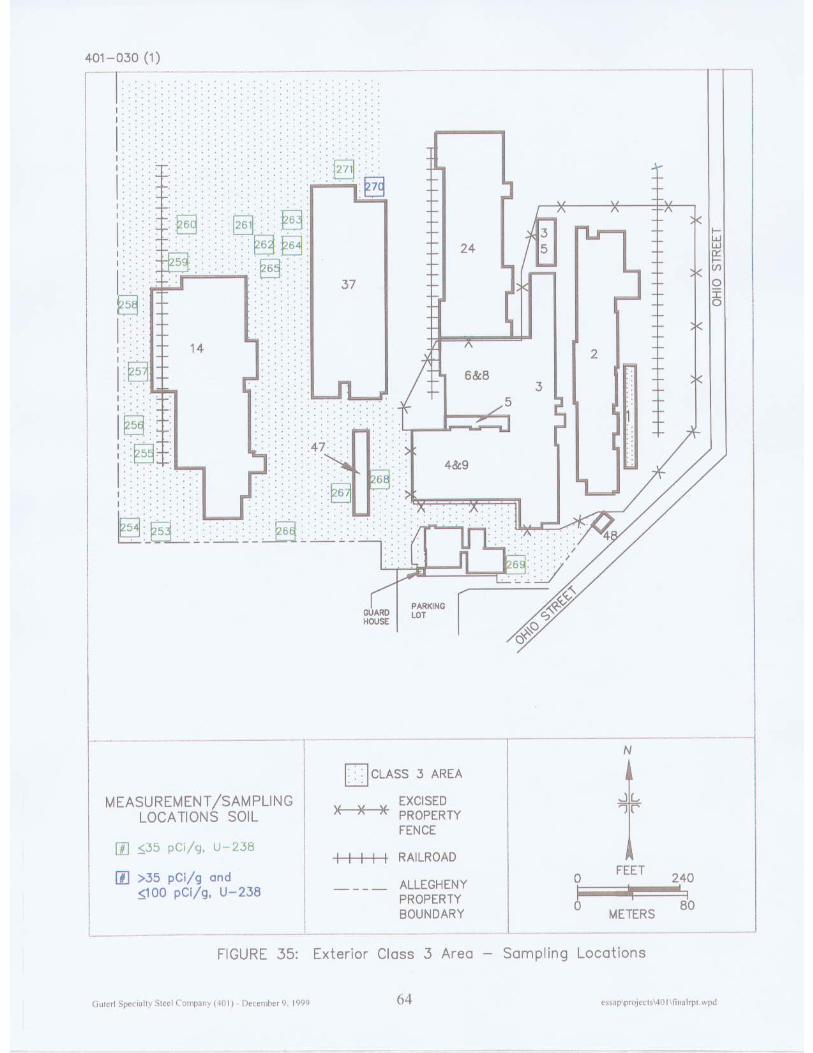
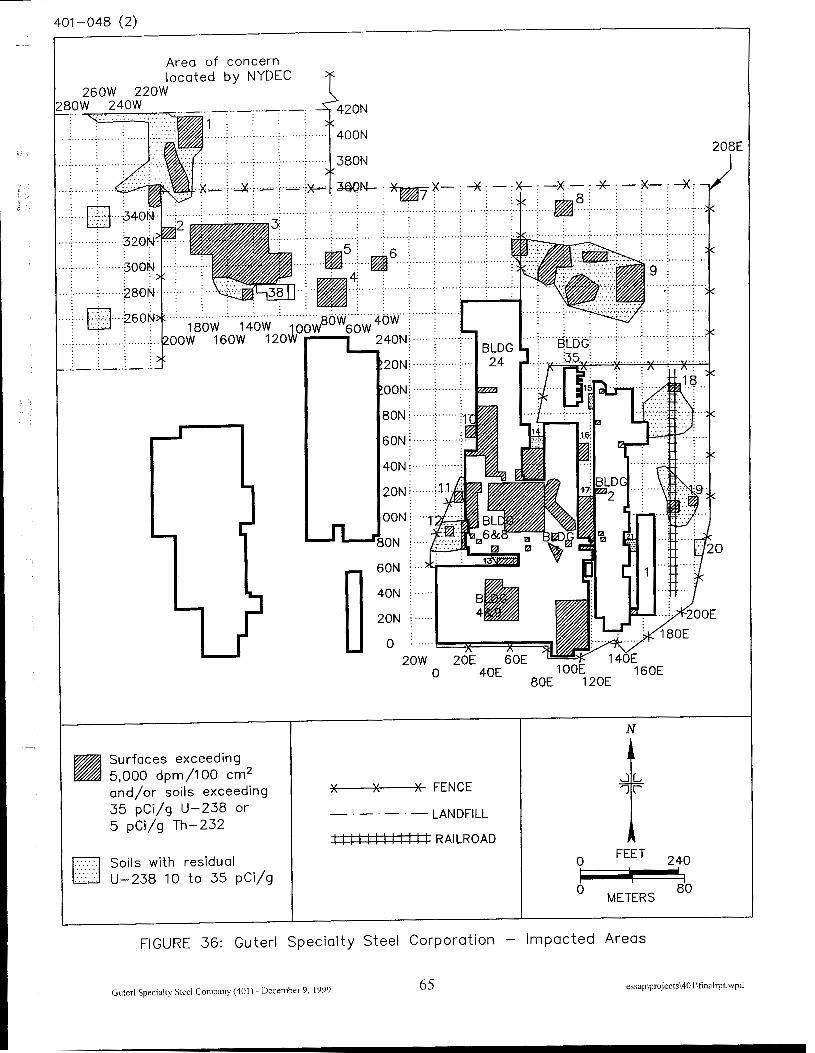
Area of concern located by NYDEC
260W 220W 1
Surfaces exceeding 5,000 dpm/100 cm2 and/or soils exceeding 35 p ~ i / g U-238 or 5 pCi/g Th-232
. . . . . . . . . . . . . . . . . . . . . . 0 Soils with residual .-....::. U-238 10 t o 35 pCi/g
FIGURE 36: Guterl Specialty Steel Corporation - Impacted Areas
FENCE
- . - . - - LANDFILL
RAILROAD
Guterl Specialty Steel Company (401) - December 9, 1999 6 5 essap\projects\401\finallpt.~pd
�##��'( % #�-�##��'( % #�-�##��'( % #�-�##��'( % #�-����
������������.���������������.���������������.���������������.���%/���� ���%/���� ���%/���� ���%/���� ��������

This page intentionally left blank.
�
����
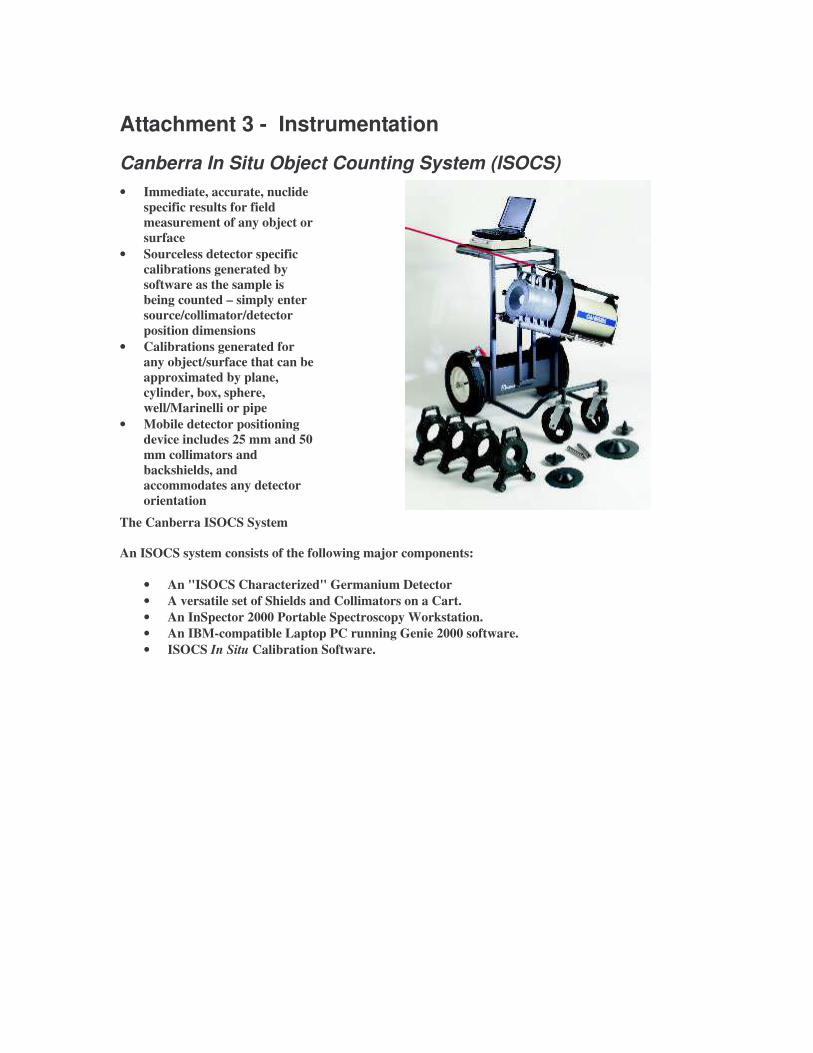
Attachment 3 - Instrumentation
Canberra In Situ Object Counting System (ISOCS) • Immediate, accurate, nuclide
specific results for field measurement of any object or surface
• Sourceless detector specific calibrations generated by software as the sample is being counted – simply enter source/collimator/detector position dimensions
• Calibrations generated for any object/surface that can be approximated by plane, cylinder, box, sphere, well/Marinelli or pipe
• Mobile detector positioning device includes 25 mm and 50 mm collimators and backshields, and accommodates any detector orientation
The Canberra ISOCS System An ISOCS system consists of the following major components:
• An "ISOCS Characterized" Germanium Detector • A versatile set of Shields and Collimators on a Cart. • An InSpector 2000 Portable Spectroscopy Workstation. • An IBM-compatible Laptop PC running Genie 2000 software. • ISOCS In Situ Calibration Software.
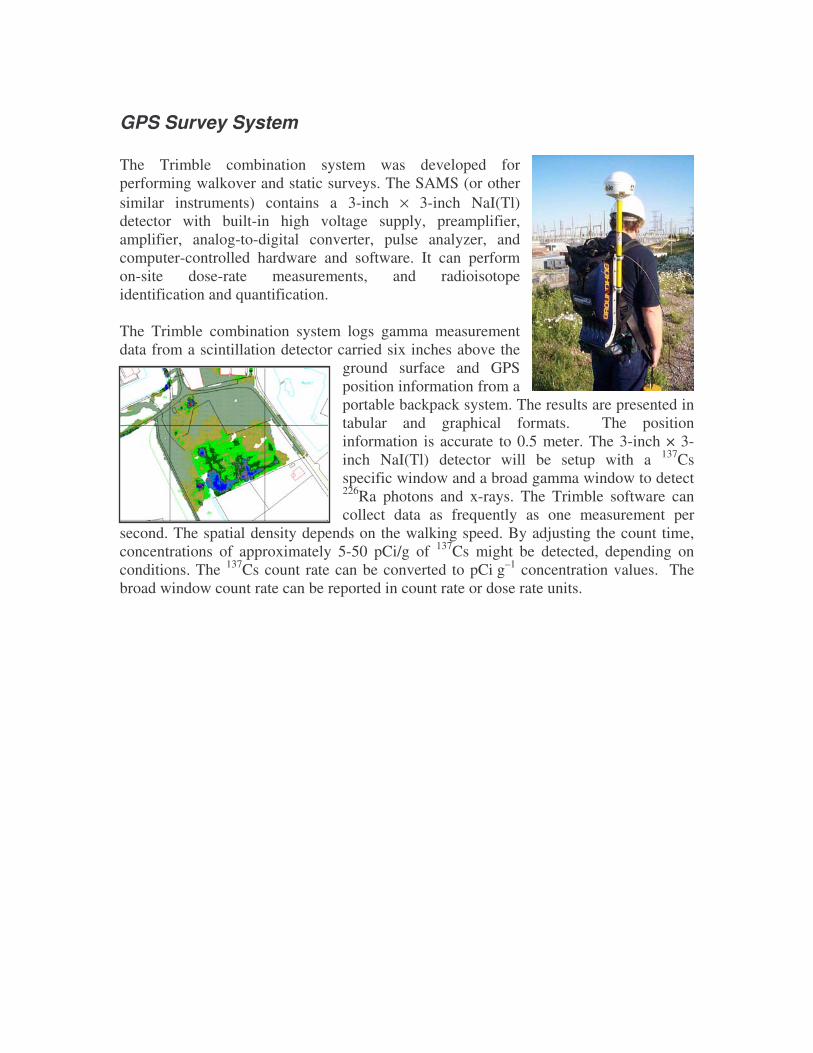
GPS Survey System The Trimble combination system was developed for performing walkover and static surveys. The SAMS (or other similar instruments) contains a 3-inch × 3-inch NaI(Tl) detector with built-in high voltage supply, preamplifier, amplifier, analog-to-digital converter, pulse analyzer, and computer-controlled hardware and software. It can perform on-site dose-rate measurements, and radioisotope identification and quantification. The Trimble combination system logs gamma measurement data from a scintillation detector carried six inches above the
ground surface and GPS position information from a portable backpack system. The results are presented in tabular and graphical formats. The position information is accurate to 0.5 meter. The 3-inch × 3-inch NaI(Tl) detector will be setup with a 137Cs specific window and a broad gamma window to detect 226Ra photons and x-rays. The Trimble software can collect data as frequently as one measurement per
second. The spatial density depends on the walking speed. By adjusting the count time, concentrations of approximately 5-50 pCi/g of 137Cs might be detected, depending on conditions. The 137Cs count rate can be converted to pCi g–1 concentration values. The broad window count rate can be reported in count rate or dose rate units.
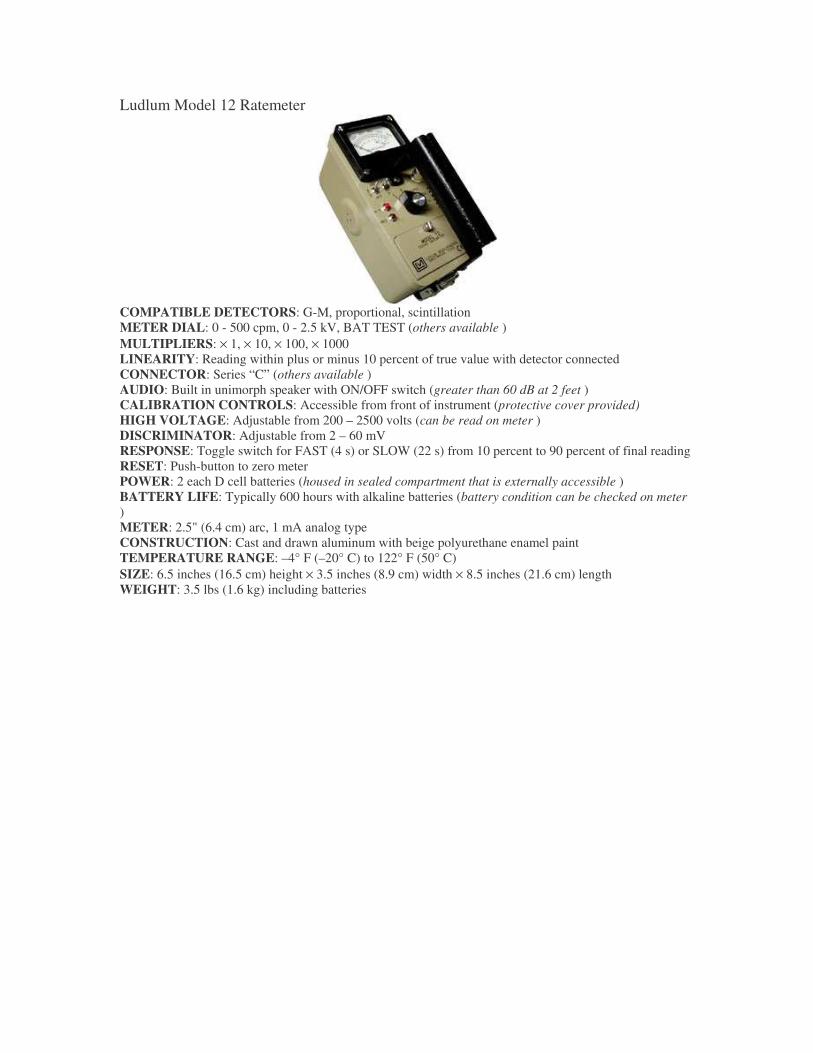
Ludlum Model 12 Ratemeter
COMPATIBLE DETECTORS: G-M, proportional, scintillation METER DIAL: 0 - 500 cpm, 0 - 2.5 kV, BAT TEST (others available ) MULTIPLIERS: × 1, × 10, × 100, × 1000 LINEARITY: Reading within plus or minus 10 percent of true value with detector connected CONNECTOR: Series “C” (others available ) AUDIO: Built in unimorph speaker with ON/OFF switch (greater than 60 dB at 2 feet ) CALIBRATION CONTROLS: Accessible from front of instrument (protective cover provided) HIGH VOLTAGE: Adjustable from 200 – 2500 volts (can be read on meter ) DISCRIMINATOR: Adjustable from 2 – 60 mV RESPONSE: Toggle switch for FAST (4 s) or SLOW (22 s) from 10 percent to 90 percent of final reading RESET: Push-button to zero meter POWER: 2 each D cell batteries (housed in sealed compartment that is externally accessible ) BATTERY LIFE: Typically 600 hours with alkaline batteries (battery condition can be checked on meter ) METER: 2.5" (6.4 cm) arc, 1 mA analog type CONSTRUCTION: Cast and drawn aluminum with beige polyurethane enamel paint TEMPERATURE RANGE: –4° F (–20° C) to 122° F (50° C) SIZE: 6.5 inches (16.5 cm) height × 3.5 inches (8.9 cm) width × 8.5 inches (21.6 cm) length WEIGHT: 3.5 lbs (1.6 kg) including batteries
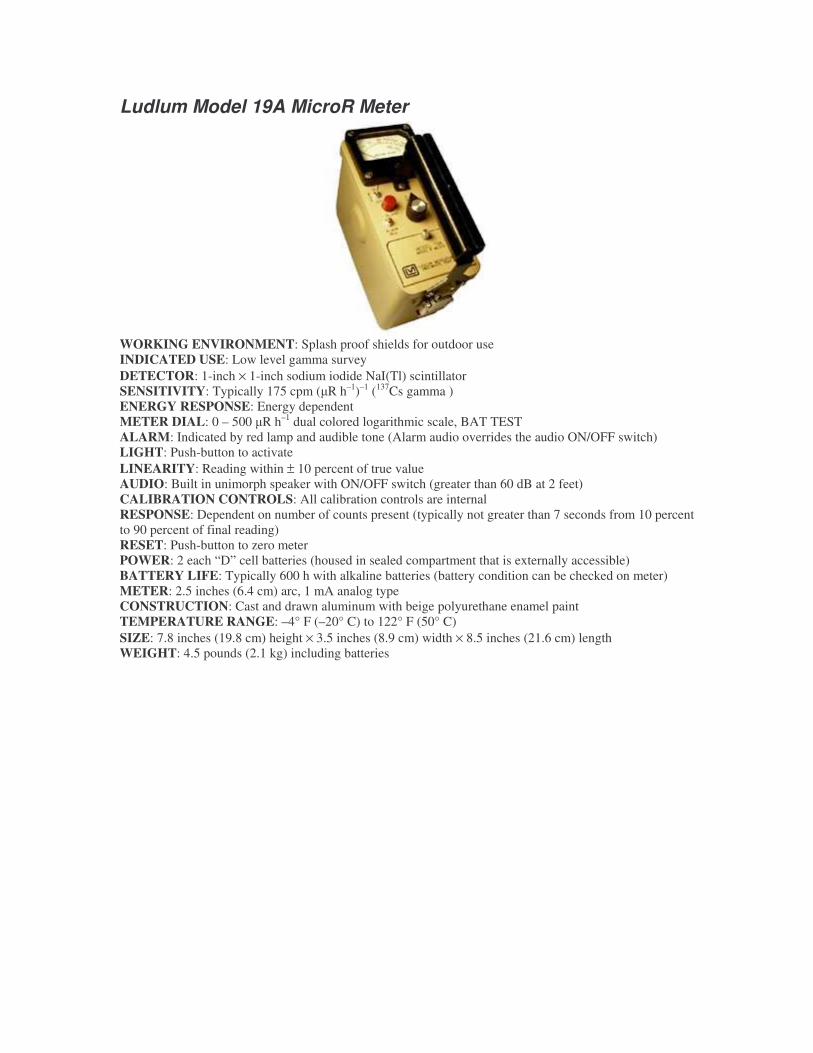
Ludlum Model 19A MicroR Meter
WORKING ENVIRONMENT: Splash proof shields for outdoor use INDICATED USE: Low level gamma survey DETECTOR: 1-inch × 1-inch sodium iodide NaI(Tl) scintillator SENSITIVITY: Typically 175 cpm (�R h–1)–1 (137Cs gamma ) ENERGY RESPONSE: Energy dependent METER DIAL: 0 – 500 �R h–1 dual colored logarithmic scale, BAT TEST ALARM: Indicated by red lamp and audible tone (Alarm audio overrides the audio ON/OFF switch) LIGHT: Push-button to activate LINEARITY: Reading within ± 10 percent of true value AUDIO: Built in unimorph speaker with ON/OFF switch (greater than 60 dB at 2 feet) CALIBRATION CONTROLS: All calibration controls are internal RESPONSE: Dependent on number of counts present (typically not greater than 7 seconds from 10 percent to 90 percent of final reading) RESET: Push-button to zero meter POWER: 2 each “D” cell batteries (housed in sealed compartment that is externally accessible) BATTERY LIFE: Typically 600 h with alkaline batteries (battery condition can be checked on meter) METER: 2.5 inches (6.4 cm) arc, 1 mA analog type CONSTRUCTION: Cast and drawn aluminum with beige polyurethane enamel paint TEMPERATURE RANGE: –4° F (–20° C) to 122° F (50° C) SIZE: 7.8 inches (19.8 cm) height × 3.5 inches (8.9 cm) width × 8.5 inches (21.6 cm) length WEIGHT: 4.5 pounds (2.1 kg) including batteries
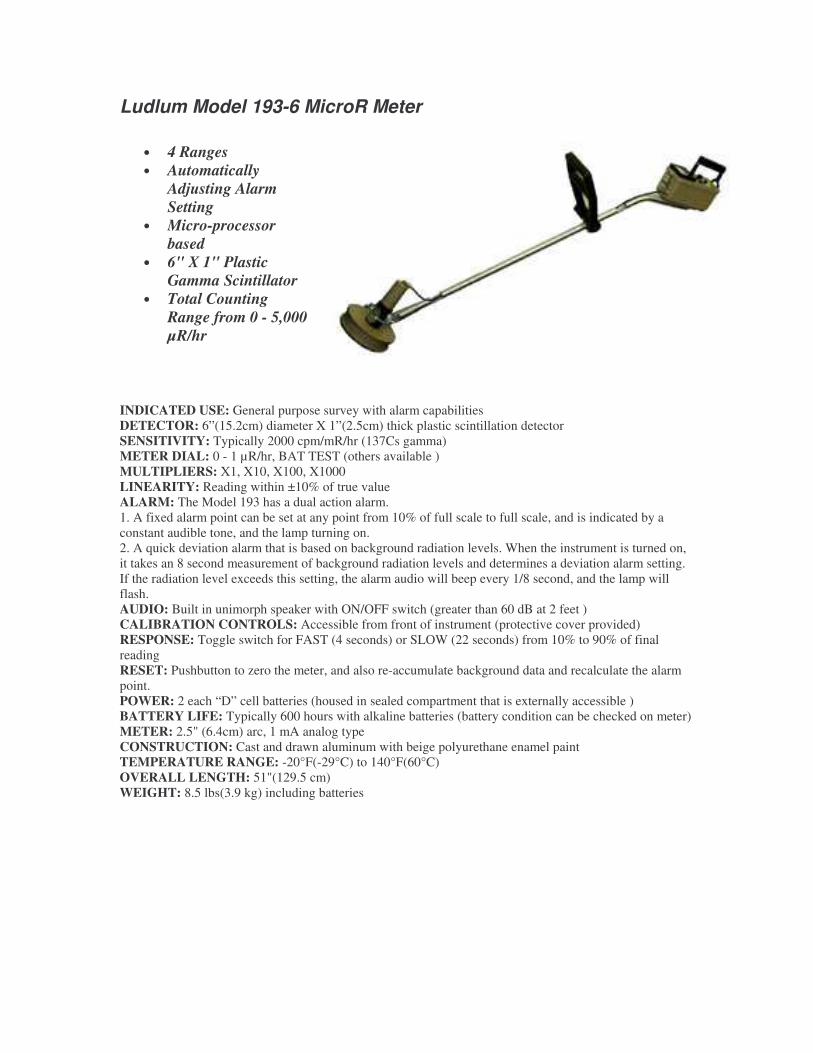
Ludlum Model 193-6 MicroR Meter
• 4 Ranges • Automatically
Adjusting Alarm Setting
• Micro-processor based
• 6" X 1" Plastic Gamma Scintillator
• Total Counting Range from 0 - 5,000 µR/hr
INDICATED USE: General purpose survey with alarm capabilities DETECTOR: 6”(15.2cm) diameter X 1”(2.5cm) thick plastic scintillation detector SENSITIVITY: Typically 2000 cpm/mR/hr (137Cs gamma) METER DIAL: 0 - 1 µR/hr, BAT TEST (others available ) MULTIPLIERS: X1, X10, X100, X1000 LINEARITY: Reading within ±10% of true value ALARM: The Model 193 has a dual action alarm. 1. A fixed alarm point can be set at any point from 10% of full scale to full scale, and is indicated by a constant audible tone, and the lamp turning on. 2. A quick deviation alarm that is based on background radiation levels. When the instrument is turned on, it takes an 8 second measurement of background radiation levels and determines a deviation alarm setting. If the radiation level exceeds this setting, the alarm audio will beep every 1/8 second, and the lamp will flash. AUDIO: Built in unimorph speaker with ON/OFF switch (greater than 60 dB at 2 feet ) CALIBRATION CONTROLS: Accessible from front of instrument (protective cover provided) RESPONSE: Toggle switch for FAST (4 seconds) or SLOW (22 seconds) from 10% to 90% of final reading RESET: Pushbutton to zero the meter, and also re-accumulate background data and recalculate the alarm point. POWER: 2 each “D” cell batteries (housed in sealed compartment that is externally accessible ) BATTERY LIFE: Typically 600 hours with alkaline batteries (battery condition can be checked on meter) METER: 2.5" (6.4cm) arc, 1 mA analog type CONSTRUCTION: Cast and drawn aluminum with beige polyurethane enamel paint TEMPERATURE RANGE: -20°F(-29°C) to 140°F(60°C) OVERALL LENGTH: 51"(129.5 cm) WEIGHT: 8.5 lbs(3.9 kg) including batteries
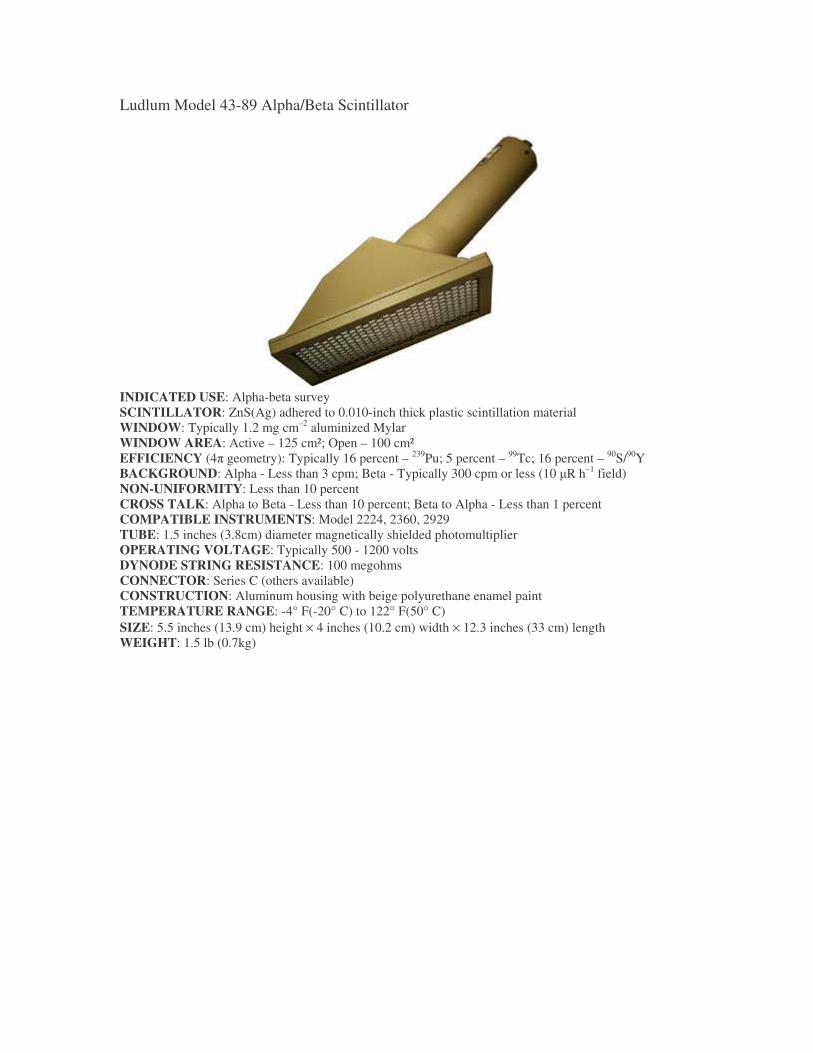
Ludlum Model 43-89 Alpha/Beta Scintillator
INDICATED USE: Alpha-beta survey SCINTILLATOR: ZnS(Ag) adhered to 0.010-inch thick plastic scintillation material WINDOW: Typically 1.2 mg cm–2 aluminized Mylar WINDOW AREA: Active – 125 cm²; Open – 100 cm² EFFICIENCY (4� geometry): Typically 16 percent – 239Pu; 5 percent – 99Tc; 16 percent – 90S/90Y BACKGROUND: Alpha - Less than 3 cpm; Beta - Typically 300 cpm or less (10 �R h–1 field) NON-UNIFORMITY: Less than 10 percent CROSS TALK: Alpha to Beta - Less than 10 percent; Beta to Alpha - Less than 1 percent COMPATIBLE INSTRUMENTS: Model 2224, 2360, 2929 TUBE: 1.5 inches (3.8cm) diameter magnetically shielded photomultiplier OPERATING VOLTAGE: Typically 500 - 1200 volts DYNODE STRING RESISTANCE: 100 megohms CONNECTOR: Series C (others available) CONSTRUCTION: Aluminum housing with beige polyurethane enamel paint TEMPERATURE RANGE: -4° F(-20° C) to 122° F(50° C) SIZE: 5.5 inches (13.9 cm) height × 4 inches (10.2 cm) width × 12.3 inches (33 cm) length WEIGHT: 1.5 lb (0.7kg)
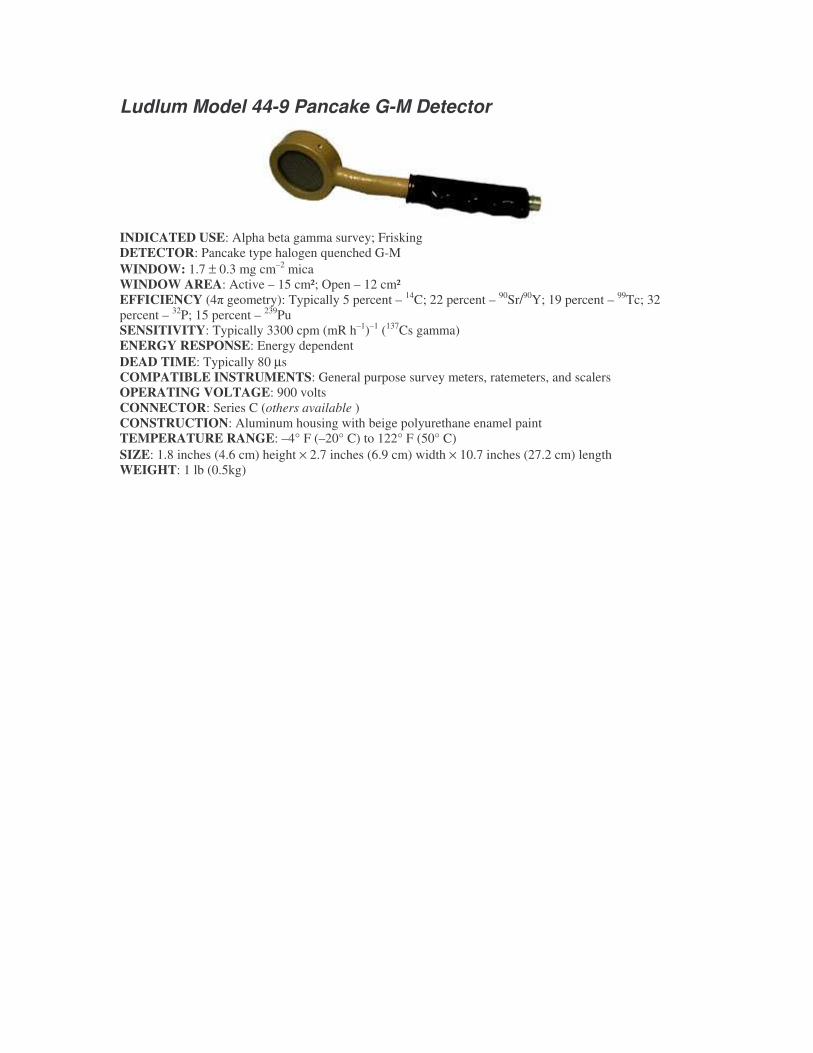
Ludlum Model 44-9 Pancake G-M Detector
INDICATED USE: Alpha beta gamma survey; Frisking DETECTOR: Pancake type halogen quenched G-M WINDOW: 1.7 ± 0.3 mg cm–2 mica WINDOW AREA: Active – 15 cm²; Open – 12 cm² EFFICIENCY (4� geometry): Typically 5 percent – 14C; 22 percent – 90Sr/90Y; 19 percent – 99Tc; 32 percent – 32P; 15 percent – 239Pu SENSITIVITY: Typically 3300 cpm (mR h–1)–1 (137Cs gamma) ENERGY RESPONSE: Energy dependent DEAD TIME: Typically 80 µs COMPATIBLE INSTRUMENTS: General purpose survey meters, ratemeters, and scalers OPERATING VOLTAGE: 900 volts CONNECTOR: Series C (others available ) CONSTRUCTION: Aluminum housing with beige polyurethane enamel paint TEMPERATURE RANGE: –4° F (–20° C) to 122° F (50° C) SIZE: 1.8 inches (4.6 cm) height × 2.7 inches (6.9 cm) width × 10.7 inches (27.2 cm) length WEIGHT: 1 lb (0.5kg)
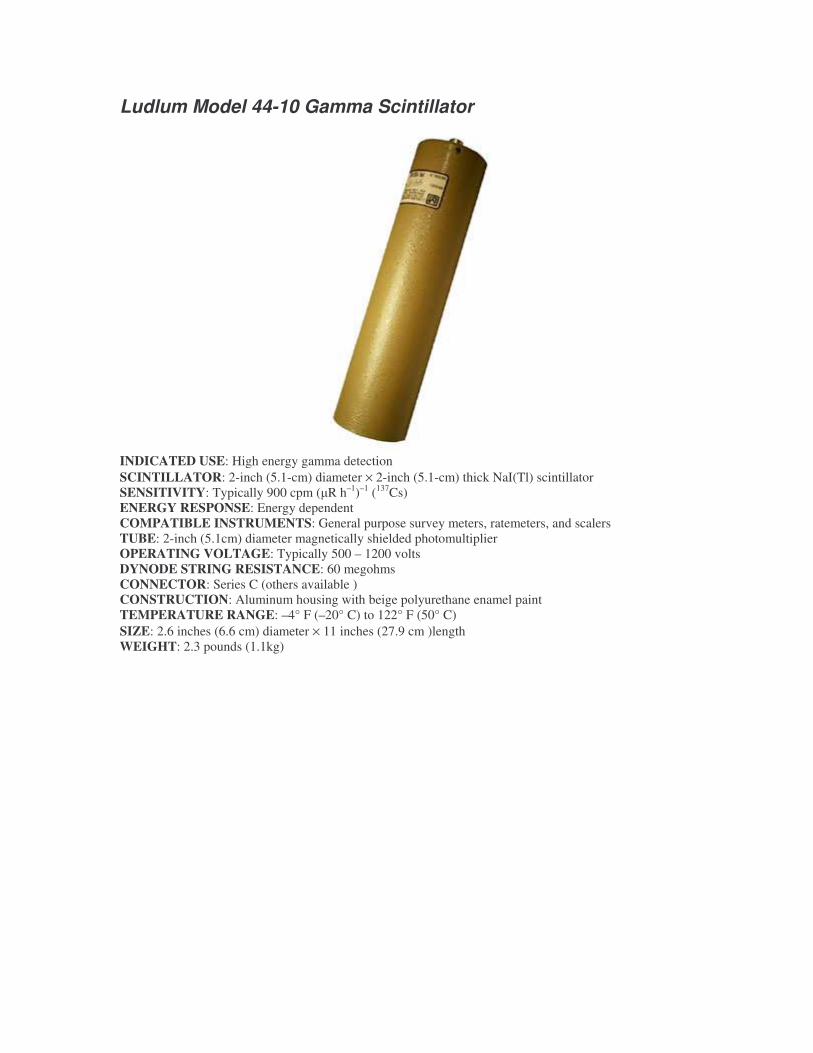
Ludlum Model 44-10 Gamma Scintillator
INDICATED USE: High energy gamma detection SCINTILLATOR: 2-inch (5.1-cm) diameter × 2-inch (5.1-cm) thick NaI(Tl) scintillator SENSITIVITY: Typically 900 cpm (�R h–1)–1 (137Cs) ENERGY RESPONSE: Energy dependent COMPATIBLE INSTRUMENTS: General purpose survey meters, ratemeters, and scalers TUBE: 2-inch (5.1cm) diameter magnetically shielded photomultiplier OPERATING VOLTAGE: Typically 500 – 1200 volts DYNODE STRING RESISTANCE: 60 megohms CONNECTOR: Series C (others available ) CONSTRUCTION: Aluminum housing with beige polyurethane enamel paint TEMPERATURE RANGE: –4° F (–20° C) to 122° F (50° C) SIZE: 2.6 inches (6.6 cm) diameter × 11 inches (27.9 cm )length WEIGHT: 2.3 pounds (1.1kg)
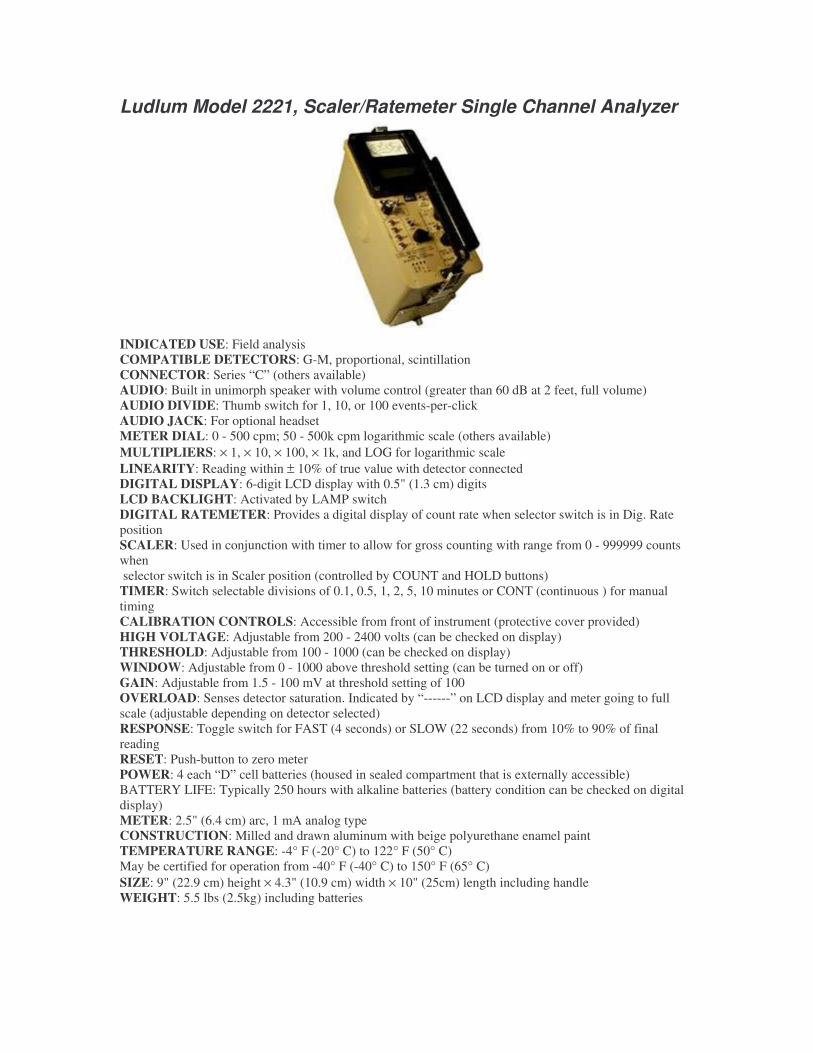
Ludlum Model 2221, Scaler/Ratemeter Single Channel Analyzer
INDICATED USE: Field analysis COMPATIBLE DETECTORS: G-M, proportional, scintillation CONNECTOR: Series “C” (others available) AUDIO: Built in unimorph speaker with volume control (greater than 60 dB at 2 feet, full volume) AUDIO DIVIDE: Thumb switch for 1, 10, or 100 events-per-click AUDIO JACK: For optional headset METER DIAL: 0 - 500 cpm; 50 - 500k cpm logarithmic scale (others available) MULTIPLIERS: × 1, × 10, × 100, × 1k, and LOG for logarithmic scale LINEARITY: Reading within ± 10% of true value with detector connected DIGITAL DISPLAY: 6-digit LCD display with 0.5" (1.3 cm) digits LCD BACKLIGHT: Activated by LAMP switch DIGITAL RATEMETER: Provides a digital display of count rate when selector switch is in Dig. Rate position SCALER: Used in conjunction with timer to allow for gross counting with range from 0 - 999999 counts when selector switch is in Scaler position (controlled by COUNT and HOLD buttons) TIMER: Switch selectable divisions of 0.1, 0.5, 1, 2, 5, 10 minutes or CONT (continuous ) for manual timing CALIBRATION CONTROLS: Accessible from front of instrument (protective cover provided) HIGH VOLTAGE: Adjustable from 200 - 2400 volts (can be checked on display) THRESHOLD: Adjustable from 100 - 1000 (can be checked on display) WINDOW: Adjustable from 0 - 1000 above threshold setting (can be turned on or off) GAIN: Adjustable from 1.5 - 100 mV at threshold setting of 100 OVERLOAD: Senses detector saturation. Indicated by “------” on LCD display and meter going to full scale (adjustable depending on detector selected) RESPONSE: Toggle switch for FAST (4 seconds) or SLOW (22 seconds) from 10% to 90% of final reading RESET: Push-button to zero meter POWER: 4 each “D” cell batteries (housed in sealed compartment that is externally accessible) BATTERY LIFE: Typically 250 hours with alkaline batteries (battery condition can be checked on digital display) METER: 2.5" (6.4 cm) arc, 1 mA analog type CONSTRUCTION: Milled and drawn aluminum with beige polyurethane enamel paint TEMPERATURE RANGE: -4° F (-20° C) to 122° F (50° C) May be certified for operation from -40° F (-40° C) to 150° F (65° C) SIZE: 9" (22.9 cm) height × 4.3" (10.9 cm) width × 10" (25cm) length including handle WEIGHT: 5.5 lbs (2.5kg) including batteries
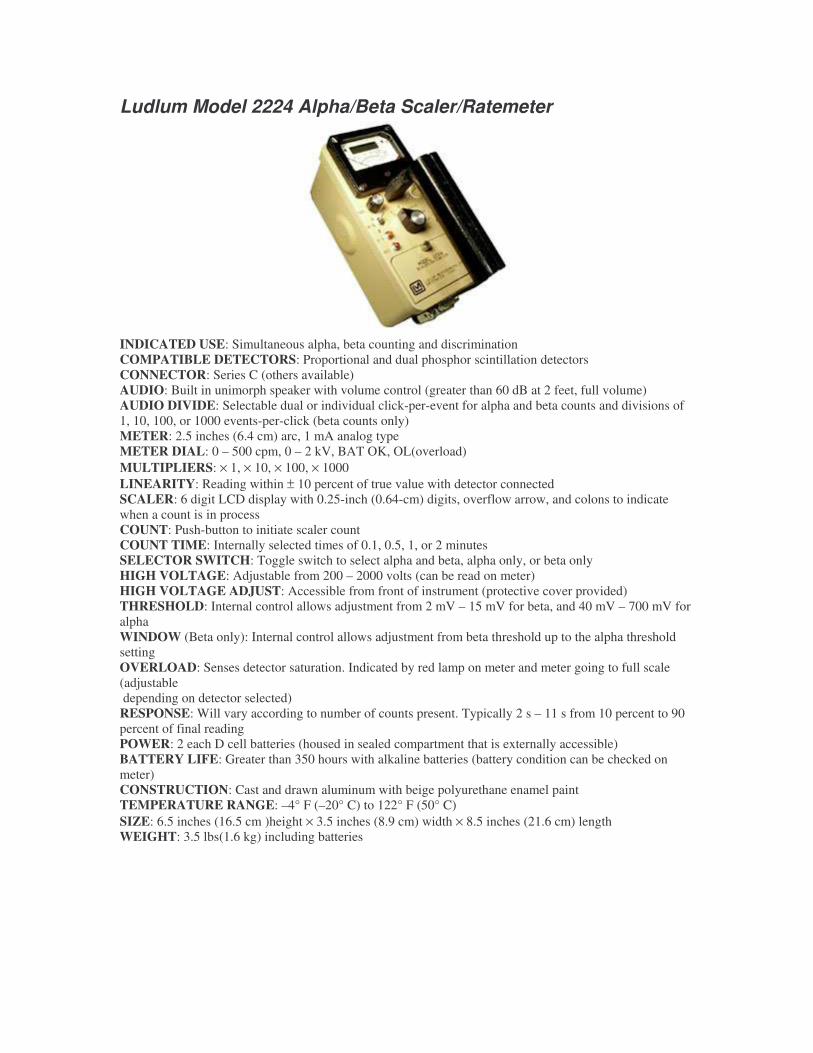
Ludlum Model 2224 Alpha/Beta Scaler/Ratemeter
INDICATED USE: Simultaneous alpha, beta counting and discrimination COMPATIBLE DETECTORS: Proportional and dual phosphor scintillation detectors CONNECTOR: Series C (others available) AUDIO: Built in unimorph speaker with volume control (greater than 60 dB at 2 feet, full volume) AUDIO DIVIDE: Selectable dual or individual click-per-event for alpha and beta counts and divisions of 1, 10, 100, or 1000 events-per-click (beta counts only) METER: 2.5 inches (6.4 cm) arc, 1 mA analog type METER DIAL: 0 – 500 cpm, 0 – 2 kV, BAT OK, OL(overload) MULTIPLIERS: × 1, × 10, × 100, × 1000 LINEARITY: Reading within ± 10 percent of true value with detector connected SCALER: 6 digit LCD display with 0.25-inch (0.64-cm) digits, overflow arrow, and colons to indicate when a count is in process COUNT: Push-button to initiate scaler count COUNT TIME: Internally selected times of 0.1, 0.5, 1, or 2 minutes SELECTOR SWITCH: Toggle switch to select alpha and beta, alpha only, or beta only HIGH VOLTAGE: Adjustable from 200 – 2000 volts (can be read on meter) HIGH VOLTAGE ADJUST: Accessible from front of instrument (protective cover provided) THRESHOLD: Internal control allows adjustment from 2 mV – 15 mV for beta, and 40 mV – 700 mV for alpha WINDOW (Beta only): Internal control allows adjustment from beta threshold up to the alpha threshold setting OVERLOAD: Senses detector saturation. Indicated by red lamp on meter and meter going to full scale (adjustable depending on detector selected) RESPONSE: Will vary according to number of counts present. Typically 2 s – 11 s from 10 percent to 90 percent of final reading POWER: 2 each D cell batteries (housed in sealed compartment that is externally accessible) BATTERY LIFE: Greater than 350 hours with alkaline batteries (battery condition can be checked on meter) CONSTRUCTION: Cast and drawn aluminum with beige polyurethane enamel paint TEMPERATURE RANGE: –4° F (–20° C) to 122° F (50° C) SIZE: 6.5 inches (16.5 cm )height × 3.5 inches (8.9 cm) width × 8.5 inches (21.6 cm) length WEIGHT: 3.5 lbs(1.6 kg) including batteries
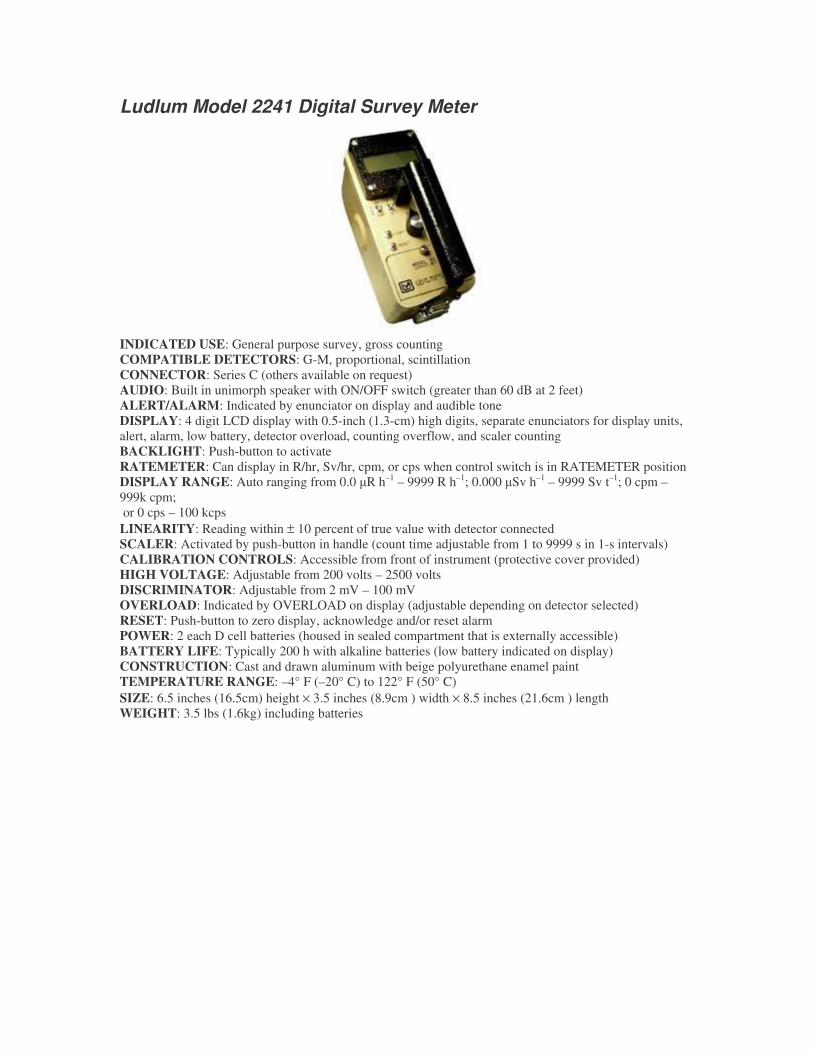
Ludlum Model 2241 Digital Survey Meter
INDICATED USE: General purpose survey, gross counting COMPATIBLE DETECTORS: G-M, proportional, scintillation CONNECTOR: Series C (others available on request) AUDIO: Built in unimorph speaker with ON/OFF switch (greater than 60 dB at 2 feet) ALERT/ALARM: Indicated by enunciator on display and audible tone DISPLAY: 4 digit LCD display with 0.5-inch (1.3-cm) high digits, separate enunciators for display units, alert, alarm, low battery, detector overload, counting overflow, and scaler counting BACKLIGHT: Push-button to activate RATEMETER: Can display in R/hr, Sv/hr, cpm, or cps when control switch is in RATEMETER position DISPLAY RANGE: Auto ranging from 0.0 �R h–1 – 9999 R h–1; 0.000 �Sv h–1 – 9999 Sv t–1; 0 cpm – 999k cpm; or 0 cps – 100 kcps LINEARITY: Reading within ± 10 percent of true value with detector connected SCALER: Activated by push-button in handle (count time adjustable from 1 to 9999 s in 1-s intervals) CALIBRATION CONTROLS: Accessible from front of instrument (protective cover provided) HIGH VOLTAGE: Adjustable from 200 volts – 2500 volts DISCRIMINATOR: Adjustable from 2 mV – 100 mV OVERLOAD: Indicated by OVERLOAD on display (adjustable depending on detector selected) RESET: Push-button to zero display, acknowledge and/or reset alarm POWER: 2 each D cell batteries (housed in sealed compartment that is externally accessible) BATTERY LIFE: Typically 200 h with alkaline batteries (low battery indicated on display) CONSTRUCTION: Cast and drawn aluminum with beige polyurethane enamel paint TEMPERATURE RANGE: –4° F (–20° C) to 122° F (50° C) SIZE: 6.5 inches (16.5cm) height × 3.5 inches (8.9cm ) width × 8.5 inches (21.6cm ) length WEIGHT: 3.5 lbs (1.6kg) including batteries
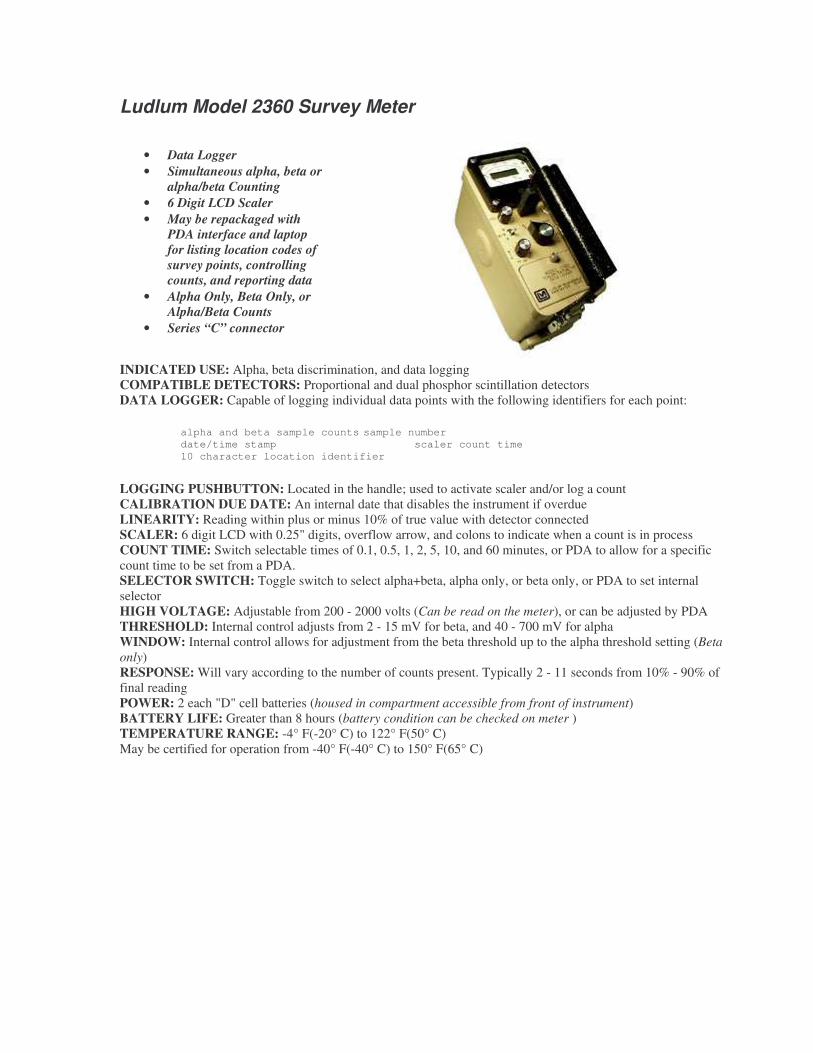
Ludlum Model 2360 Survey Meter
• Data Logger • Simultaneous alpha, beta or
alpha/beta Counting • 6 Digit LCD Scaler • May be repackaged with
PDA interface and laptop for listing location codes of survey points, controlling counts, and reporting data
• Alpha Only, Beta Only, or Alpha/Beta Counts
• Series “C” connector
INDICATED USE: Alpha, beta discrimination, and data logging COMPATIBLE DETECTORS: Proportional and dual phosphor scintillation detectors DATA LOGGER: Capable of logging individual data points with the following identifiers for each point:
alpha and beta sample counts sample number date/time stamp scaler count time 10 character location identifier
LOGGING PUSHBUTTON: Located in the handle; used to activate scaler and/or log a count CALIBRATION DUE DATE: An internal date that disables the instrument if overdue LINEARITY: Reading within plus or minus 10% of true value with detector connected SCALER: 6 digit LCD with 0.25" digits, overflow arrow, and colons to indicate when a count is in process COUNT TIME: Switch selectable times of 0.1, 0.5, 1, 2, 5, 10, and 60 minutes, or PDA to allow for a specific count time to be set from a PDA. SELECTOR SWITCH: Toggle switch to select alpha+beta, alpha only, or beta only, or PDA to set internal selector HIGH VOLTAGE: Adjustable from 200 - 2000 volts (Can be read on the meter), or can be adjusted by PDA THRESHOLD: Internal control adjusts from 2 - 15 mV for beta, and 40 - 700 mV for alpha WINDOW: Internal control allows for adjustment from the beta threshold up to the alpha threshold setting (Beta only) RESPONSE: Will vary according to the number of counts present. Typically 2 - 11 seconds from 10% - 90% of final reading POWER: 2 each "D" cell batteries (housed in compartment accessible from front of instrument) BATTERY LIFE: Greater than 8 hours (battery condition can be checked on meter ) TEMPERATURE RANGE: -4° F(-20° C) to 122° F(50° C) May be certified for operation from -40° F(-40° C) to 150° F(65° C)
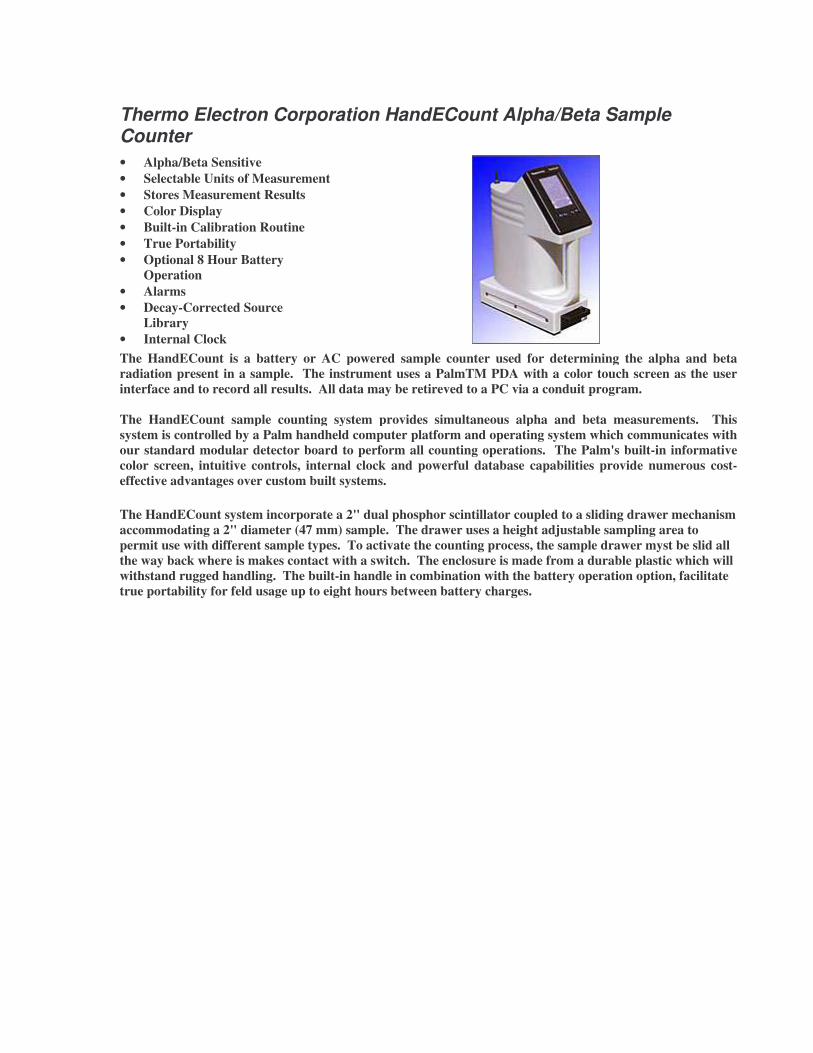
Thermo Electron Corporation HandECount Alpha/Beta Sample Counter • Alpha/Beta Sensitive • Selectable Units of Measurement • Stores Measurement Results • Color Display • Built-in Calibration Routine • True Portability • Optional 8 Hour Battery
Operation • Alarms • Decay-Corrected Source
Library • Internal Clock The HandECount is a battery or AC powered sample counter used for determining the alpha and beta radiation present in a sample. The instrument uses a PalmTM PDA with a color touch screen as the user interface and to record all results. All data may be retireved to a PC via a conduit program. The HandECount sample counting system provides simultaneous alpha and beta measurements. This system is controlled by a Palm handheld computer platform and operating system which communicates with our standard modular detector board to perform all counting operations. The Palm's built-in informative color screen, intuitive controls, internal clock and powerful database capabilities provide numerous cost-effective advantages over custom built systems.
The HandECount system incorporate a 2" dual phosphor scintillator coupled to a sliding drawer mechanism accommodating a 2" diameter (47 mm) sample. The drawer uses a height adjustable sampling area to permit use with different sample types. To activate the counting process, the sample drawer myst be slid all the way back where is makes contact with a switch. The enclosure is made from a durable plastic which will withstand rugged handling. The built-in handle in combination with the battery operation option, facilitate true portability for feld usage up to eight hours between battery charges.
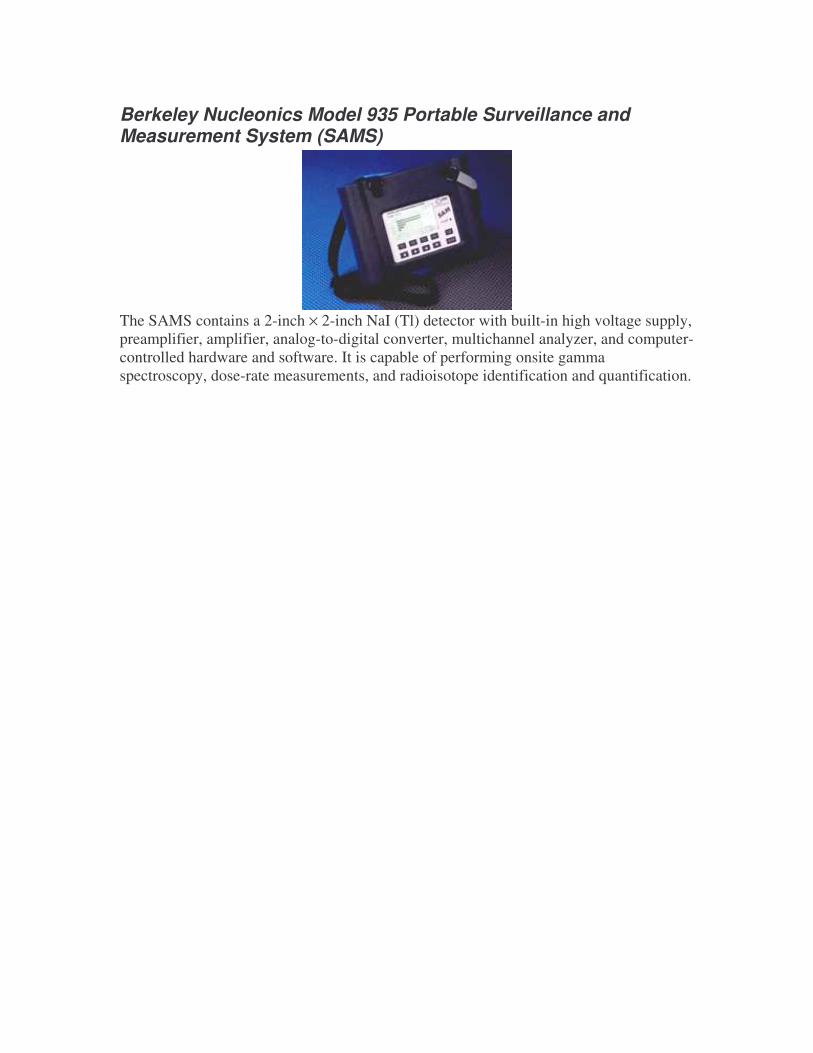
Berkeley Nucleonics Model 935 Portable Surveillance and Measurement System (SAMS)
The SAMS contains a 2-inch × 2-inch NaI (Tl) detector with built-in high voltage supply, preamplifier, amplifier, analog-to-digital converter, multichannel analyzer, and computer-controlled hardware and software. It is capable of performing onsite gamma spectroscopy, dose-rate measurements, and radioisotope identification and quantification.

�##��'( % #�0�##��'( % #�0�##��'( % #�0�##��'( % #�0����
��������� ������ ��������� ������ ��������� ������ ��������� ������ �����

This page intentionally left blank.
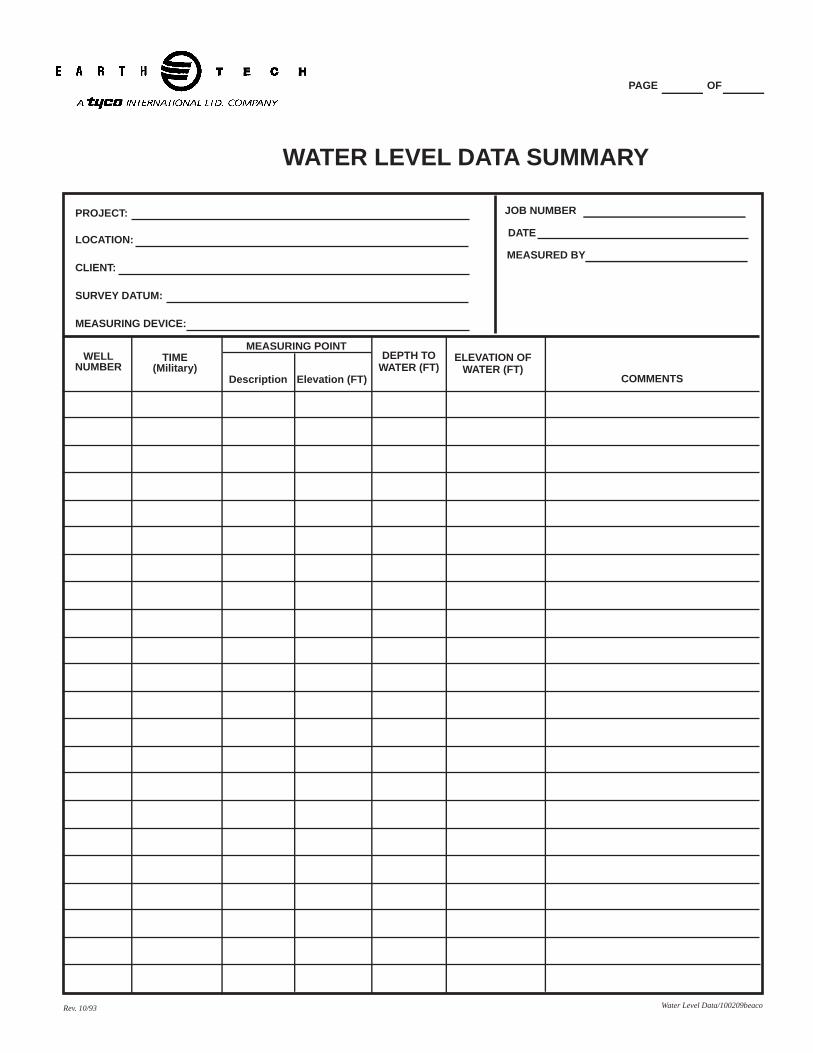
Rev. 10/93
JOB NUMBER
OFPAGE
WATER LEVEL DATA SUMMARY
TIME(Military)
MEASURING POINT
Description Elevation (FT)
DEPTH TOWATER (FT)
ELEVATION OFWATER (FT)
COMMENTS
PROJECT:
LOCATION:
CLIENT:
SURVEY DATUM:
MEASURING DEVICE:
WELLNUMBER
Water Level Data/100209beaco
DATE
MEASURED BY
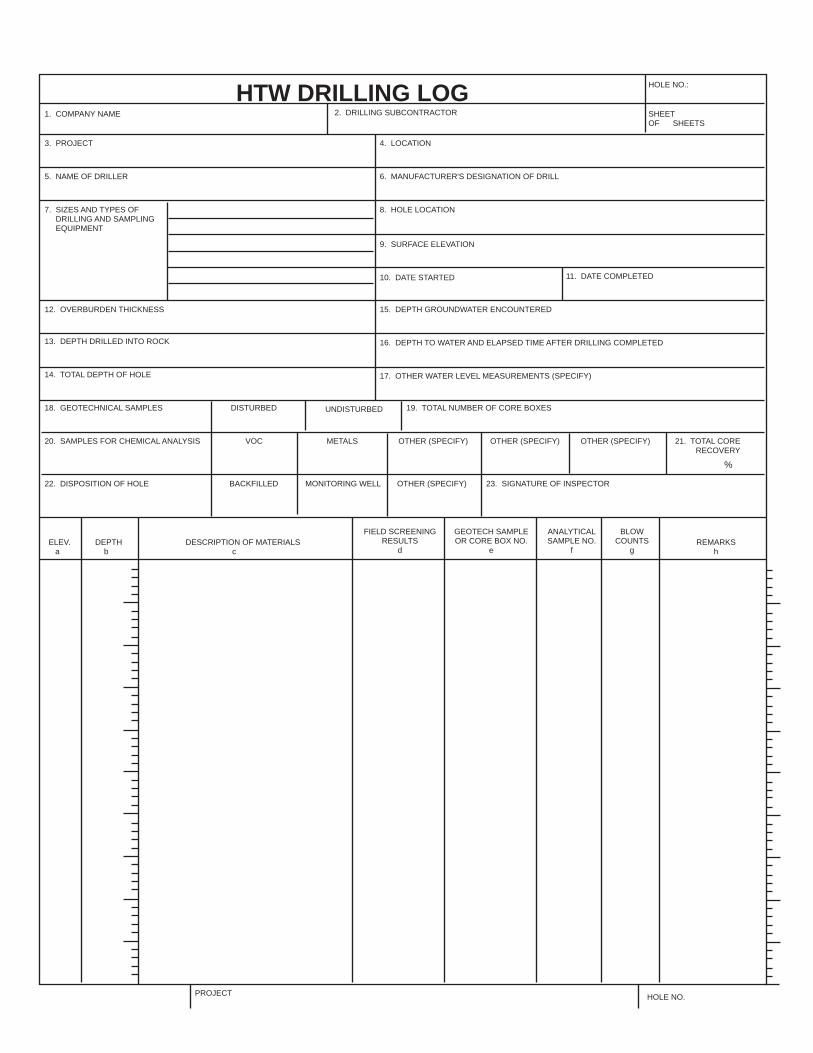
PROJECT HOLE NO.
ELEV. a
DEPTH b
DESCRIPTION OF MATERIALS c
FIELD SCREENINGRESULTS
d
GEOTECH SAMPLEOR CORE BOX NO.
e
ANALYTICALSAMPLE NO.
f
BLOWCOUNTS
gREMARKS
h
20. SAMPLES FOR CHEMICAL ANALYSIS
5. NAME OF DRILLER
1. COMPANY NAME
3. PROJECT
7. SIZES AND TYPES OF DRILLING AND SAMPLING EQUIPMENT
12. OVERBURDEN THICKNESS
13. DEPTH DRILLED INTO ROCK
14. TOTAL DEPTH OF HOLE
18. GEOTECHNICAL SAMPLES
22. DISPOSITION OF HOLE
2. DRILLING SUBCONTRACTOR
4. LOCATION
8. HOLE LOCATION
9. SURFACE ELEVATION
10. DATE STARTED
15. DEPTH GROUNDWATER ENCOUNTERED
16. DEPTH TO WATER AND ELAPSED TIME AFTER DRILLING COMPLETED
17. OTHER WATER LEVEL MEASUREMENTS (SPECIFY)
19. TOTAL NUMBER OF CORE BOXES
6. MANUFACTURER'S DESIGNATION OF DRILL
DISTURBED UNDISTURBED
VOC METALS
BACKFILLED MONITORING WELL
OTHER (SPECIFY) OTHER (SPECIFY) OTHER (SPECIFY) 21. TOTAL CORERECOVERY
23. SIGNATURE OF INSPECTOR
%
OTHER (SPECIFY)
HTW DRILLING LOG HOLE NO.:
SHEETOF SHEETS
11. DATE COMPLETED
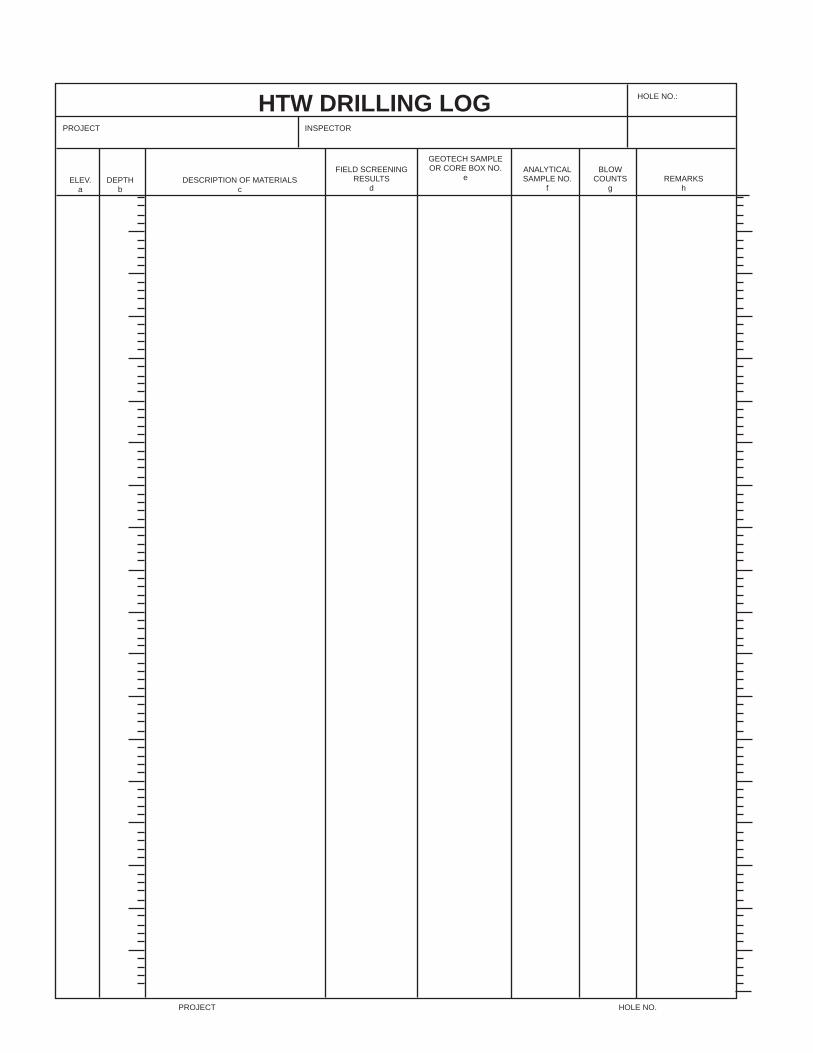
HTW DRILLING LOG HOLE NO.:
PROJECT INSPECTOR
ELEV.a
DEPTHb
DESCRIPTION OF MATERIALSc
GEOTECH SAMPLEOR CORE BOX NO.
eFIELD SCREENING
RESULTSd
ANALYTICALSAMPLE NO.
f
BLOWCOUNTS
gREMARKS
h
PROJECT HOLE NO.
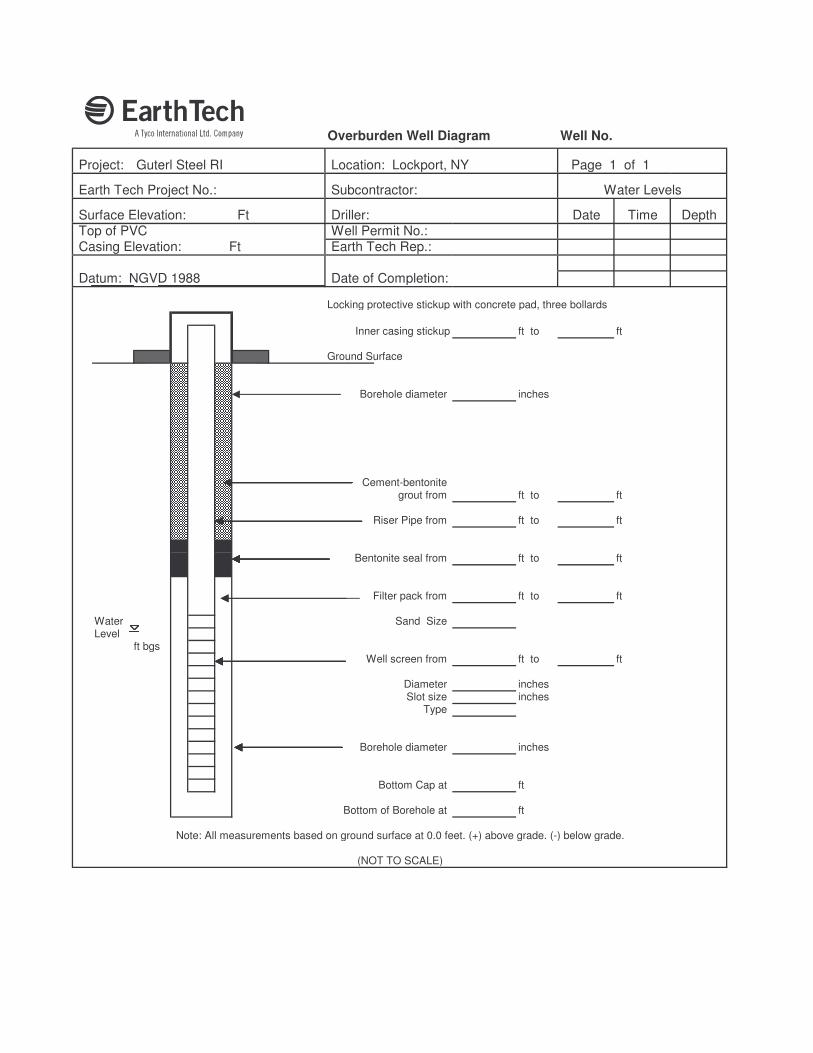
� Overburden Well Diagram Well No.
Project: Guterl Steel RI Location: Lockport, NY Page 1 of 1
Earth Tech Project No.: Subcontractor: Water Levels
Surface Elevation: Ft Driller: Date Time Depth Top of PVC Well Permit No.: Casing Elevation: Ft Earth Tech Rep.:
Datum: NGVD 1988 Date of Completion:
Locking protective stickup with concrete pad, three bollards
Inner casing stickup ft to ft
Ground Surface
Borehole diameter inches
Cement-bentonite grout from ft to ft
Riser Pipe from ft to ft
Bentonite seal from ft to ft
Filter pack from ft to ft
Water Sand Size Level ft bgs
Well screen from ft to ft
Diameter inchesSlot size inches
Type
Borehole diameter inches
Bottom Cap at ft
Bottom of Borehole at ft
Note: All measurements based on ground surface at 0.0 feet. (+) above grade. (-) below grade.
(NOT TO SCALE)
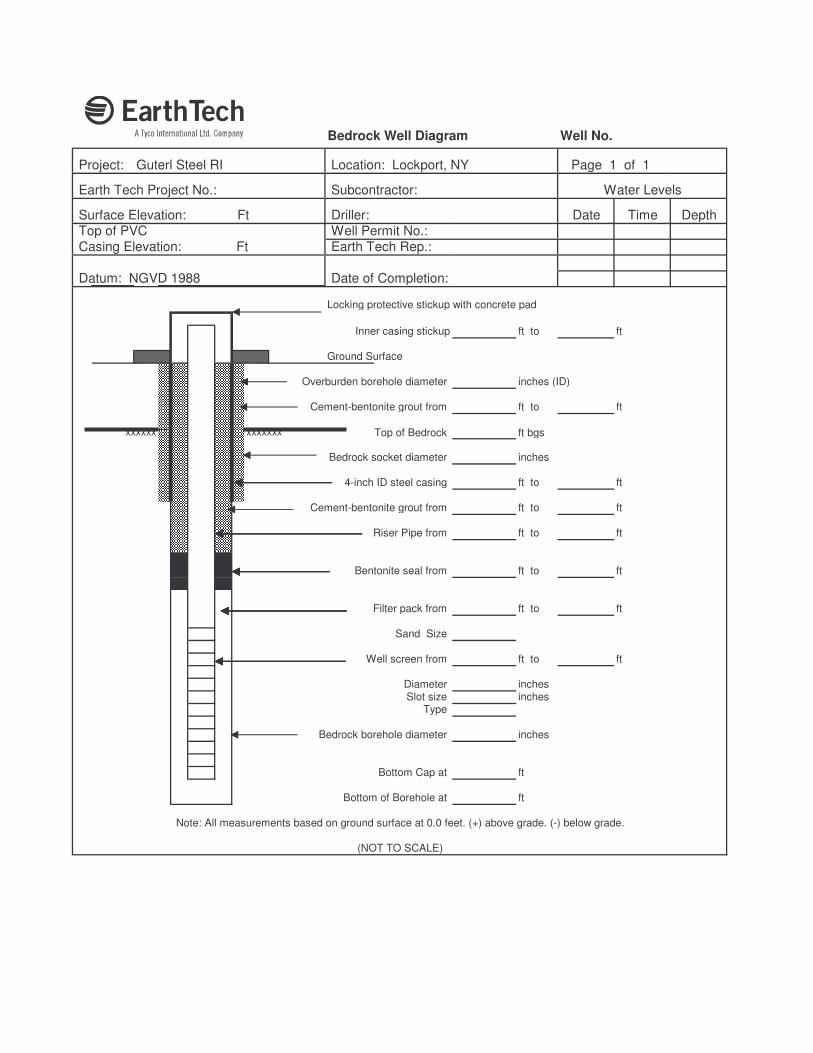
� Bedrock Well Diagram Well No.
Project: Guterl Steel RI Location: Lockport, NY Page 1 of 1
Earth Tech Project No.: Subcontractor: Water Levels
Surface Elevation: Ft Driller: Date Time Depth Top of PVC Well Permit No.: Casing Elevation: Ft Earth Tech Rep.:
Datum: NGVD 1988 Date of Completion:
Locking protective stickup with concrete pad
Inner casing stickup ft to ft
Ground Surface
Overburden borehole diameter inches (ID)
Cement-bentonite grout from ft to ft
xxxxxx xxxxxxx Top of Bedrock ft bgs
Bedrock socket diameter inches
4-inch ID steel casing ft to ft
Cement-bentonite grout from ft to ft
Riser Pipe from ft to ft
Bentonite seal from ft to ft
Filter pack from ft to ft
Sand Size
Well screen from ft to ft
Diameter inchesSlot size inches
Type
Bedrock borehole diameter inches
Bottom Cap at ft
Bottom of Borehole at ft
Note: All measurements based on ground surface at 0.0 feet. (+) above grade. (-) below grade.
(NOT TO SCALE)
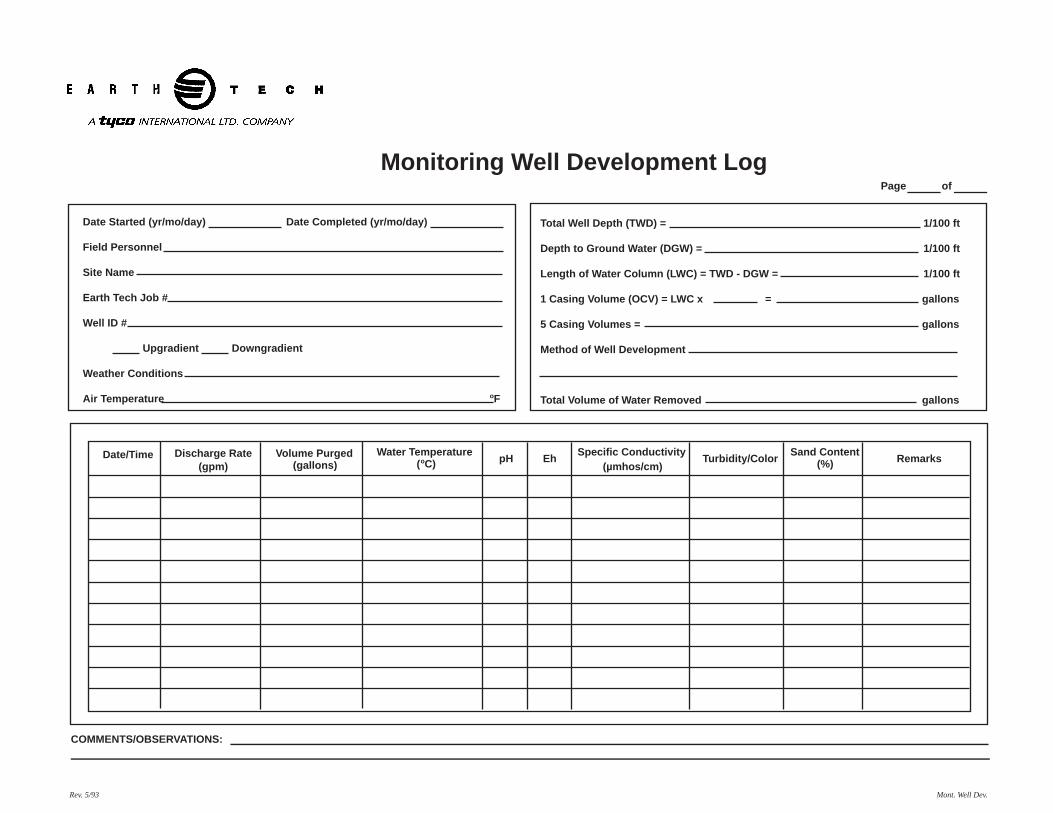
Total Well Depth (TWD) = 1/100 ft
Depth to Ground Water (DGW) = 1/100 ft
Length of Water Column (LWC) = TWD - DGW = 1/100 ft
1 Casing Volume (OCV) = LWC x = gallons
5 Casing Volumes = gallons
Method of Well Development
Total Volume of Water Removed gallons
Date Started (yr/mo/day) Date Completed (yr/mo/day)
Field Personnel
Site Name
Earth Tech Job #
Well ID #
Upgradient Downgradient
Weather Conditions
Air Temperature oF
Monitoring Well Development Log
COMMENTS/OBSERVATIONS:
RemarksSand Content(%)
Specific Conductivity(µmhos/cm)
Turbidity/ColorDate/Time Discharge Rate(gpm)
Volume Purged(gallons)
Water Temperature(oC) pH Eh
Page of
Rev. 5/93 Mont. Well Dev.
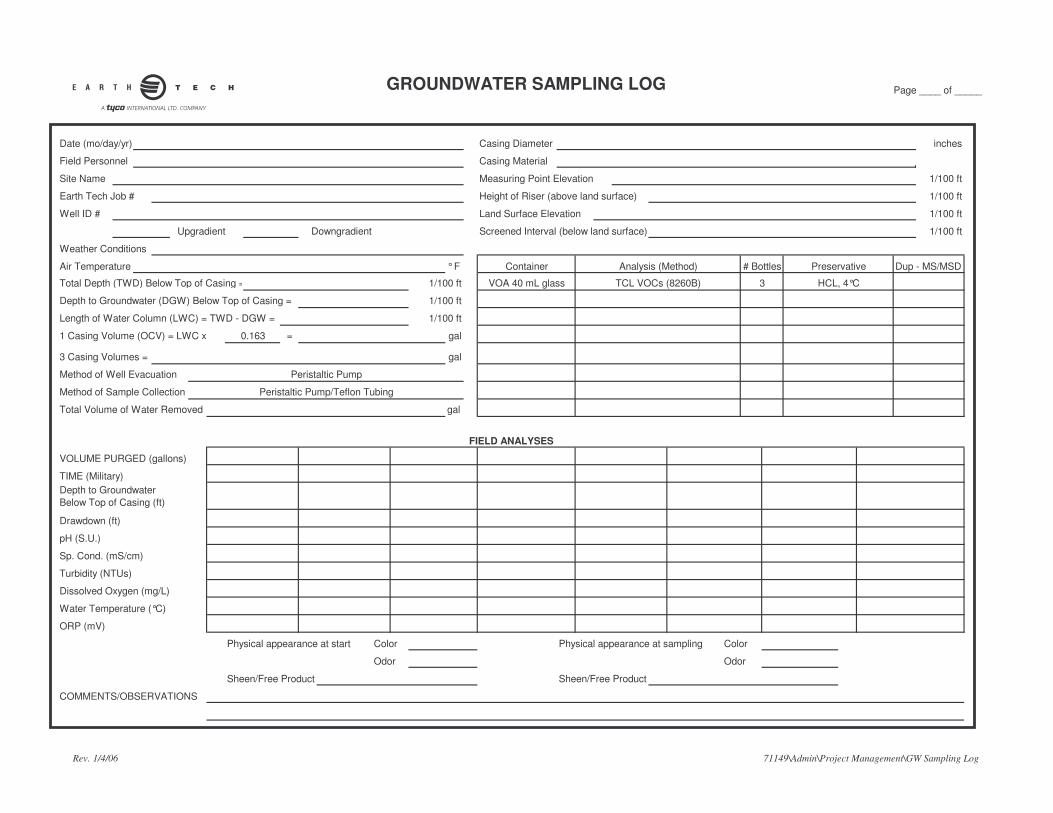
�GROUNDWATER SAMPLING LOG Page ____ of _____
Date (mo/day/yr) Casing Diameter inches
Field Personnel Casing Material
Site Name Measuring Point Elevation 1/100 ft
Earth Tech Job # Height of Riser (above land surface) 1/100 ft
Well ID # Land Surface Elevation 1/100 ft
Upgradient Downgradient Screened Interval (below land surface) 1/100 ft
Weather Conditions
Air Temperature ° F Container Analysis (Method) # Bottles Preservative Dup - MS/MSD
Total Depth (TWD) Below Top of Casing = 1/100 ft
Depth to Groundwater (DGW) Below Top of Casing = 1/100 ft
Length of Water Column (LWC) = TWD - DGW = 1/100 ft
1 Casing Volume (OCV) = LWC x = gal
3 Casing Volumes = gal
Method of Well Evacuation
Method of Sample Collection
Total Volume of Water Removed gal
FIELD ANALYSES
VOLUME PURGED (gallons)
TIME (Military)
Drawdown (ft)
pH (S.U.)
Sp. Cond. (mS/cm)
Turbidity (NTUs)
Dissolved Oxygen (mg/L)
Water Temperature (°C)
ORP (mV)
Physical appearance at start Color Physical appearance at sampling Color
Odor Odor
Sheen/Free Product Sheen/Free Product
COMMENTS/OBSERVATIONS
Depth to GroundwaterBelow Top of Casing (ft)
VOA 40 mL glass HCL, 4°C
Peristaltic Pump/Teflon Tubing
TCL VOCs (8260B) 3
0.163
Peristaltic Pump
Rev. 1/4/06 71149\Admin\Project Management\GW Sampling Log
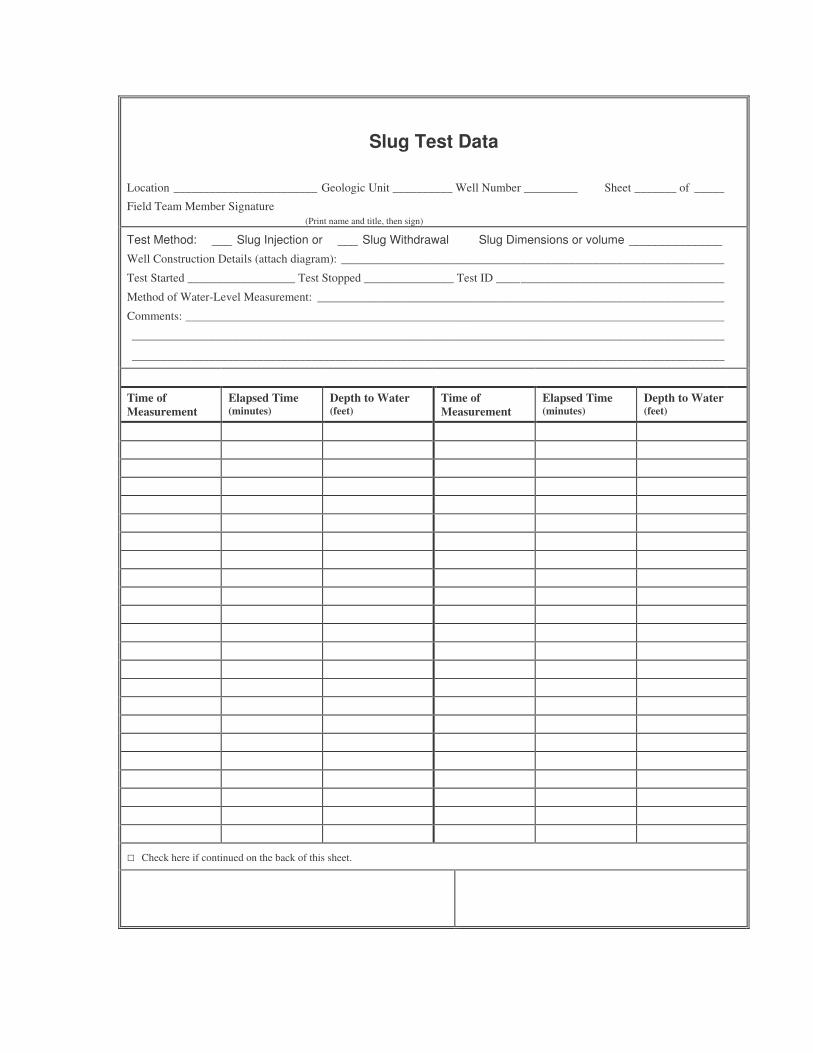
Slug Test Data
Location ________________________ Geologic Unit __________ Well Number _________ Sheet _______ of _____ Field Team Member Signature (Print name and title, then sign) Test Method: ___ Slug Injection or ___ Slug Withdrawal Slug Dimensions or volume ______________
Well Construction Details (attach diagram): ________________________________________________________________
Test Started __________________ Test Stopped _______________ Test ID ______________________________________
Method of Water-Level Measurement: ____________________________________________________________________
Comments: __________________________________________________________________________________________
___________________________________________________________________________________________________
___________________________________________________________________________________________________
Time of Measurement
Elapsed Time (minutes)
Depth to Water (feet)
Time of Measurement
Elapsed Time (minutes)
Depth to Water (feet)
� Check here if continued on the back of this sheet.
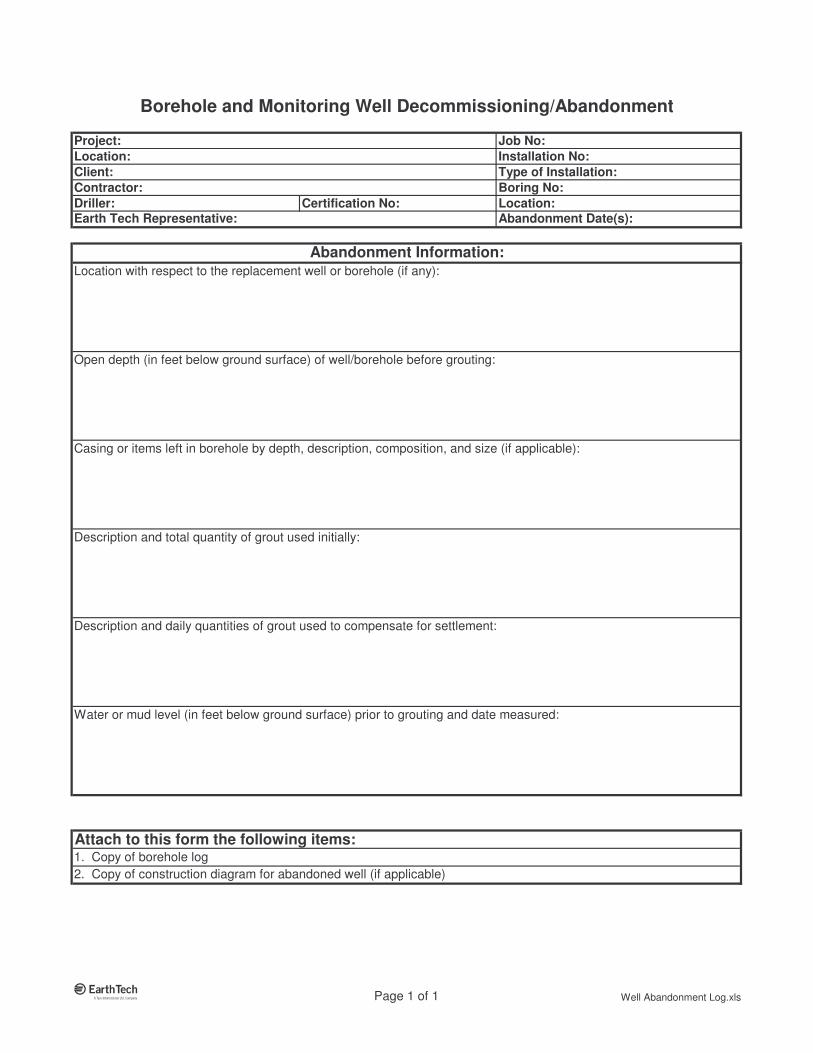
Client:Contractor:
Casing or items left in borehole by depth, description, composition, and size (if applicable):
Abandonment Information:
Driller: Certification No:Earth Tech Representative:
Location:Abandonment Date(s):
Borehole and Monitoring Well Decommissioning/Abandonment
Location with respect to the replacement well or borehole (if any):
Open depth (in feet below ground surface) of well/borehole before grouting:
Job No:Installation No:Type of Installation:Boring No:
Project:Location:
1. Copy of borehole log2. Copy of construction diagram for abandoned well (if applicable)
Attach to this form the following items:
Description and total quantity of grout used initially:
Description and daily quantities of grout used to compensate for settlement:
Water or mud level (in feet below ground surface) prior to grouting and date measured:
� Page 1 of 1 Well Abandonment Log.xls
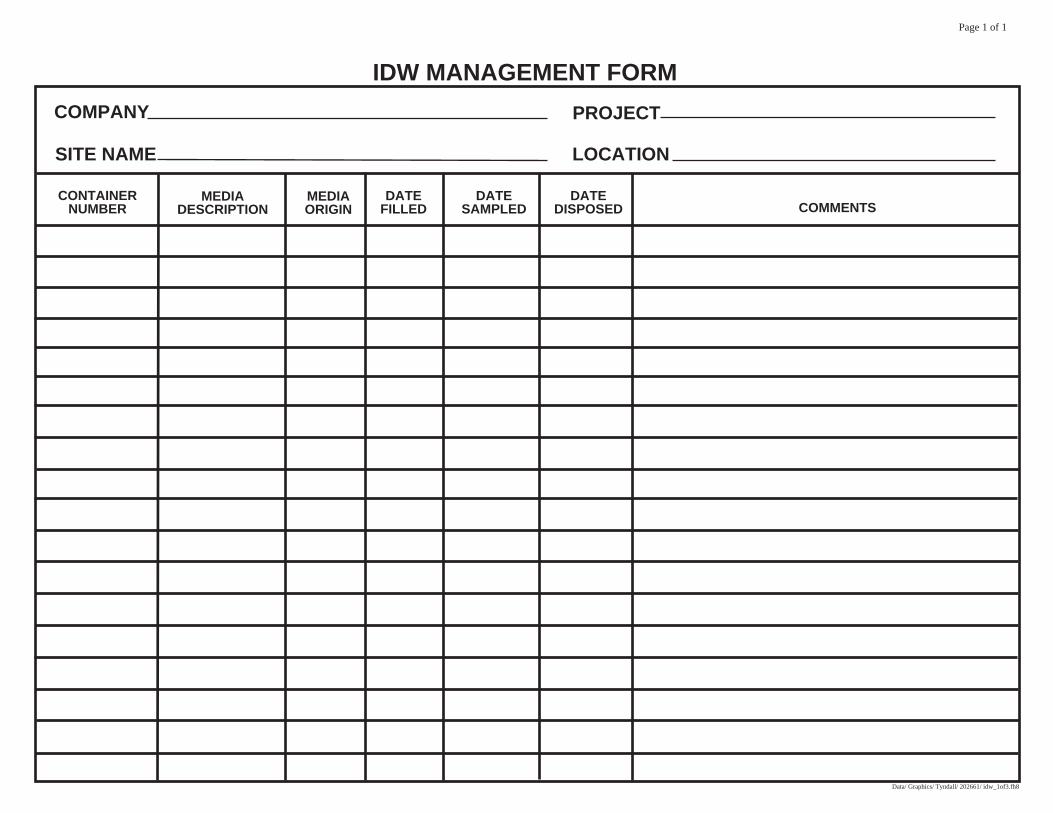
COMPANY
SITE NAME
PROJECT
LOCATION
CONTAINERNUMBER
MEDIADESCRIPTION
MEDIAORIGIN
DATEFILLED
DATESAMPLED
DATEDISPOSED COMMENTS
IDW MANAGEMENT FORM
Data/ Graphics/ Tyndall/ 202661/ idw_1of3.fh8
Page 1 of 1


![VOLUME 1 [2016] ISSUE 2 [FALL] - The Plan Journal](https://img.pdfslide.net/doc/110x75/632347a73a06c6d45f060bfc/volume-1-2016-issue-2-fall-the-plan-journal.jpg)


