Embed Size (px)
Citation preview

Journal of Contaminant Hydrology 122 (2011) 40–52
Contents lists available at ScienceDirect
Journal of Contaminant Hydrology
j ourna l homepage: www.e lsev ie r.com/ locate / jconhyd
Sandstones of unexpectedly high diffusibility
Khairul Bashar a, John H. Tellam b,⁎a Department of Geological Sciences, Jahangirnagar University, Bangladeshb Water Sciences, School of Geography, Earth and Environmental Sciences, University of Birmingham, Birmingham, B15 2TT, UK
a r t i c l e i n f o
⁎ Corresponding author. Tel.: +44 121 414 6138; faE-mail addresses: [email protected] (K. Bas
[email protected] (J.H. Tellam).
0169-7722/$ – see front matter © 2010 Elsevier B.V.doi:10.1016/j.jconhyd.2010.11.001
a b s t r a c t
Article history:Received 23 December 2009Received in revised form 23 July 2010Accepted 1 November 2010Available online 23 November 2010
Measurements have been made of diffusion coefficients (Di=−mass flux/concentrationgradient) using a double reservoir, steady-state method with two tracers, CaBr2 and amino-G-acid, on intact samples of Triassic red-bed sandstone from northwest England. Diffusibility(D′=Di /diffusion coefficient in water) averages 0.124, ranging between 0.075 and 0.215(porosity 0.1 to 0.24), very similar for the two tracers. Implied tortuosities (actual pathlength/straight line length) average 1.21 (range 1.06 to 1.47), with constrictivities close to 1.In comparison with limited red-bed sandstone data from elsewhere, these D′ values are up to4 times greater, and tortuosity correspondingly lower. Re-interpretation of formation factordata from previous studies on shallow sandstone samples also from northwest Englandconfirms that diffusibility is significantly higher in these sandstones than others from similarpalaeoenvironment/stratigraphic units. The lower tortuosities appear to result from therelatively high permeability, open fabric of the rock, properties likely to be present in shallowsandstone systems used for water supply. It is concluded that diffusion rates may, in someshallow freshwater-containing continental sandstone systems, be significantly greater than isimplied by estimates of sandstone diffusibility current in the literature.
© 2010 Elsevier B.V. All rights reserved.
Keywords:DiffusionDiffusibilityTortuositySandstone
1. Introduction
Diffusion is important in many hydrogeological contexts,including in sandstone sequences (e.g. Grathwohl, 1998).Though groundwater velocities are often significant insandstones, diffusion is still important in, especially, trans-verse dispersion of solutes between adjacent units of differentlithofacies that will often have very different permeabilities(e.g. Bloomfield et al., 2006; Hornung and Aigner, 1999), aswell as in transferring solutes from fractures to surroundingmatrix (e.g. Maloszewski and Zuber, 1993). These effects willbe felt especially over intermediate distances and times (e.g.Streetly et al., 2002), e.g. importantly those associated withcontaminated sites, including remediation.
The results presented in this study arose from a widerinvestigation of unreacting solute transport through sandstone
x: +44 121 414 4942har),
All rights reserved.
.
matrix at laboratory scales (Bashar and Tellam, 2006; Tellamand Barker, 2006).
As part of this study, a series of diffusion coefficientmeasurements was undertaken. These indicated that thesandstone investigated, a continental red-bed sandstone,displayed unusually high diffusion coefficients in comparisonwith the relatively small number of values available in theliterature from similar sandstones. This paper describes themethods used and the results obtained, attempts to explainthe high diffusibilities, and considers the implications.
2. The sandstone
The sandstones investigated are from theUKPermo-Triassicsequence, an aquifer extensively used in water supply (e.g.Barker and Tellam, 2006). The sequence comprises a series offluvial and aeolian sandstones (e.g. Benton et al., 2002).Typically the framework clasts are of quartz with subordinatefeldspars and lithic fragments, and the sandstones usuallycontain clay and are often carbonate-cemented: haematite

Fig. 1. Schematic diagram of diffusion cell apparatus.
41K. Bashar, J.H. Tellam / Journal of Contaminant Hydrology 122 (2011) 40–52
coats the grains giving the rock its reddish colouring. Medianpore size is usually a few tens of microns (Bloomfield et al.,2001; Digges la Touche, 1998) with porosity in the range 10–30%, averaging ~25% (Allen et al., 1997). Hydraulic conductivityvaries over at least seven orders of magnitude, from 10−11 to2×10−4 m s−1 (Allen et al., 1997). Similar age and lithologysandstones are present elsewhere in the world, and inparticular across Europe and in North America.
3. Methods
There are various methods available for the determinationof diffusion coefficients (e.g. Shackelford, 1991; Stenhouseet al., 1996). In accord with the conclusions of Stenhouse et al.(1996), and in common with many studies on a range of rocktypes [e.g. in UK: Hill (1984), Needham (1995) (Cretaceouschalk); Chen and Lerner (1991) (Carboniferous sandstone);Greswell (1995), Greswell et al. (1998) (Jurassic limestone)],the double reservoir method was used here. In this method,tracer diffuses from a donor reservoir across a slice of rockinto a receiver reservoir. By analysis of concentrations inthe reservoirs, the diffusion coefficient can be calculated.The method is a ‘direct’ one at a scale large in comparisonwith pore diameter (cf. geophysical and NMR methods), isconvenient, includes measurement of both upstream anddownstream concentrations, can be applied to intact rocksamples, does not require expensive equipment, and the datacollected can be interpreted relatively simply.
Ten sandstone samples were obtained from the 140 mmcore of an observation borehole at Gatewarth EffluentTreatment Works, Warrington, northwest England (nationalgrid reference SJ 5817 8722) (Segar, 1993). The samples areall from the Wilmslow Sandstone Formation of the TriassicSherwood Sandstone Group, and all were obtained fromdepths of less than 110 m below ground surface. Howard(1987), Tellam (1994, 1995), and Plant et al. (1999) provideinformation on the regional flow, chemistry, and geologicalsettings. The samples were cut into ~1 cm by 10 cm by 5 cmslices before being cemented in place in the diffusion cellsusing silicone sealant. Five samples were cut parallel with thelamination, andwere composed of relatively fine-grained andwell-cemented sandstone. The other five samples were cutperpendicular to the lamination andwere less well cemented.The permeabilities of the samples were determined usingthe falling head method, and porosity by the water vacuum-saturation method.
The tracers used were Br− and amino-G-acid (AGA) (7amino 1, 3 naphthalene disulphonic acid). CaBr2 was chosenas the Br salt as Ca is dominant on the rock exchange sites(Carlyle et al., 2004). AGA is anionic, only becomingsignificantly protonated below a pH of ~4 (Lyons, 1993; cf.Smart and Laidlaw, 1977). Batch experiments were under-taken to determine whether the tracers were sorbed to thesandstone. For each batch experiment, 20 g of disaggregatedsandstone was placed in a conical flask with 200 ml ofsolution containing 80 mg l−1 Br and 5 mg l−1 AGA. Theflask was stirred continuously for 14 h and about 5 ml ofsample was collected each hour. In both the batch experi-ments and the diffusion experiments, Br was determinedusing a specific ion electrode with double junction referenceelectrode connected to an Orion 290A digital meter: AGA
was determined using a Perkin Elmer 204A fluorescencespectrophotometer.
The diffusion experiments were carried out as follows. Thesandstone slices were dried and cemented in place in the testcell (Fig. 1). The cells were then placed in a vacuum chamberand the samples saturated with distilled water. The donorand receiver reservoirs for each sample, which are of identicalvolume (254–270 ml), were then filled with test solution(10 mg l−1 Br and 10 mg l−1 AGA) and deionized waterrespectively. A spirit level was used to check that the headswere the same in each pair of reservoirs. The tops of thetest cells have coverable access ports for insertion of Brprobes and removal of samples for AGA analysis. The (3.5 ml)samples removed were analysed immediately and returnedto the appropriate reservoir: the loss of water from samplingand probe removal was negligible in comparison with thevolume and surface area of the cells. Measurements weretaken over a period of around 1 month. The reservoirs werestirred each day. A control experiment cell, with a steelplate replacing the sandstone sample, was also set up to testsorption, decay, and sampling problems. Temperature washeld at 20±0.62 °C, and the cells covered with aluminiumfoil to avoid light-induced decay of the AGA.
The data collected were used to determine the effectivediffusion coefficient, Di, for the sample, the latter being definedby Fick's First Law:
Fm = −Di∂C∂x ð1Þ
where Fm is the tracer mass flux [ML−2 T−1], C is concentration[ML−3], and x is distance [L]. Once a pseudo-steady-state hasbeen set up, i.e. flux rates into and out of the rock are≫rate ofchange in mass stored, there will be a linear concentrationgradient in the sandstone, and Fick's First Law can be directlyapplied:
∂ VCdð Þ∂t = −DiA Cd−Crð Þ
Lð2Þ
where V is the volume of each reservoir, Cd is the concentrationin the donor reservoir, t is time, A is the area of the sandstone at90° to the tracer flux, Cr is the concentration in the receiverreservoir, and L is the sandstone slice thickness. Noting that

Fig. 2. Typical experimental curves for (a) amino-G-acid and (b) bromideruns (sandstone sample 10).
42 K. Bashar, J.H. Tellam / Journal of Contaminant Hydrology 122 (2011) 40–52
Cr≈Co−CdwhereCo is the concentration in thedonor reservoirat t=0, Eq. (2) can be integrated to yield:
Cd−Cr = Coexp −2DiAtVL
� �: ð3Þ
Accordingly, a graph of log [(Cd−Cr)/Co] against t willgive a straight line of slope −(2/2.303)DiA /VL, thus allowingDi to be obtained by applying least squares linear regression.This analysis is equivalent to that used in a number of otherstudies (Shackelford, 1991), and has been validated forthe specific dimensions of our experimental system using anumerical model [Modflow (Harbaugh et al., 2000), usingthe analogy between the physics of flow and diffusion]. Theassumption that Cr=Co−Cd can be shown to be reasonableby including in the analysis the concentration in the rockassuming it to be the average of the concentrations inthe reservoirs. This modification changes the final estimatesof the diffusion coefficient by b1%. The results are reportedas Di
CaPBr2 and Di
AGA, reflecting the fact that the form of themonitored tracer will have some influence on the dataobtained (e.g. Berner, 1980).
Resin-impregnated rock thin sections were preparedusing standard methods. Mercury injection porosimetrywas undertaken to estimate pore size distributions using aMicromeritics Pore Sizer 9310 with a maximum pressure ofapproximately 200 MPa.
4. Results
4.1. Preliminary experiments
The batch experiments on sorption of Br and AGA to thesandstone were unable to detect any measurable uptake: anythat occurs would either reduce or not affect the interpretedvalue of the diffusion coefficient depending on how closelythe system approximates steady-state. The experiment usinga steel plate in place of the sandstone slice showed thatsorption to the apparatus, if occurring, is also insignificant.Fig. 2 shows that the experiments produced the expectedlinear concentration/time relationship once a pseudo steady-state had been established. This is further confirmed by theclose agreement between the rate of rise in concentration inthe receiver cell and the rate of fall in concentration in thedonor reservoir: averaged over all experiments and all data,the difference is b5%, and no consistent pattern is seen overtime when balances are calculated sample interval by sampleinterval. Over each sampling interval, the change in tracermass present in the rock is b1% of the change in the reservoirsover the same interval.
4.2. Permeability and porosity values
The permeability and porosity values (Table 1) are mostlyat the lower end of the range seen in shallow (b200 m depth)UK Triassic Sandstones (cf. e.g. Allen et al., 1997; Lovelock,1977). The samples cut parallel with the laminations all havelower permeability than those cut at 90° to the laminations:they also happen to have lower porosities. Because the twosets of samples are not of comparable porosity, care needs tobe taken when inferring any affects of anisotropy.
4.3. Diffusion coefficient values
Di values for the CaBr2 and AGA experiments are listed inTable 1. The average value of Di
CaPBr2 is 1.53×10⁻¹⁰ m2 s−1
(σ=0.43×10⁻¹⁰ m2 s−1), and the average value for DiAGA is
0.59×10⁻¹⁰ m2 s−1 (σ=0.18×10⁻¹⁰ m2 s−1). Fig. 3 showsDi to be approximately linearly related to ϕ: the two setsof samples appear to form single consistent linear Di/ϕrelationships, with the gradient for AGA being lower than thatfor Br (it is possible that the higher porosity Br experimentsamples may have a steeper gradient, but there are too fewsamples to be sure).
5. Comparisons with other sandstones
5.1. Introduction
To compare the results obtained here with those fromother studies which may have been undertaken on othersolutes, it is necessary to calculate a value for the diffusibility(D′):
D′ = Di =Do ð4Þ
where Do is the diffusion coefficient in water in the absence ofthe sandstone.
It is often assumed (e.g. Bear, 1972; Berner, 1980;Dykhuizen and Casey, 1989; Grathwohl, 1998; van Brakel

Table 1Permeability, porosity, and diffusion coefficients determined for the 10 samples studied. The permeability and Di values were measured perpendicular to thelaminations in the cases of samples 1–5, and parallel with the laminations in the cases of samples 6–10.
Sample no. Permeability(m2)
Porosity(−)
DiCaPBr2
(m2 s−1)DiAGA
(m2 s−1)
Samples cut parallel to laminations1 2.11E−16 0.102 9.9E−11 3.5E−112 4.58E−16 0.142 1.4E−10 4.5E−113 5.44E−16 0.169 1.4E−10 5.8E−114 4.12E−16 0.158 1.3E−10 5.2E−115 2.63E−16 0.122 1.2E−10 4.8E−11Mean (st. dev.) 3.78E−16 (1.38E−16) 0.139 (0.027) 1.3E−10 (1.7E−11) 4.8E−11 (8.6E−12)
Samples cut perpendicular to laminations6 2.75E−14 0.211 2.1E−10 6.3E−117 5.86E−14 0.234 1.7E−10 8.0E−118 2.39E−14 0.193 1.4E−10 6.5E−119 4.58E−14 0.212 1.3E−10 4.8E−1110 5.63E−14 0.241 2.4E−10 9.6E−11Mean (st. dev.) 4.24E−14 (1.61E−14) 0.218 (0.019) 1.8E−10 (4.7E−11) 7.0E−11 (1.8E−11)Mean (st. dev.) for all samples 2.14E−14 (2.46E−14) 0.18 (0.05) 1.53E−10 (4.31E−11) 5.91E−11 (1.80E−11)
43K. Bashar, J.H. Tellam / Journal of Contaminant Hydrology 122 (2011) 40–52
and Heertjes, 1974) that the diffusibility is related to othersystem properties by:
Di =Do = D′ = ϕδ = τ2 ð5Þ
where ϕ is the porosity, δ is the constrictivity, and τ is thetortuosity (=actual distance diffused by solute between pointsA and B/straight line distance between points A and B). Theconstrictivity accounts for the steric hindrance when rela-tively large molecules pass through relatively small pores(see below).
Eq. (5) offers a means of comparing data from sandstonesof different porosities, and suggests possible petrographiccontrols on the value of D′. To calculate D′, Do needs first tobe estimated. Unfortunately, there appear to be no availableexperimental Do values for either CaBr2 or AGA in theliterature. Hence these need first to be estimated, and given
Fig. 3. The relationship between Di and porosity. Errors were estimated bycombining the standard error of the slope estimate with the estimated errorsfor the measurements of the geometry of the sample and apparatus.
the importance of these estimates for the overall argument,various ways will be considered in each case (Sections 5.2and 5.3). Once D′/ϕ relationships have been established,they can be compared across the two (CaBr2 and AGA)data sets (Section 5.4), and thenwith values obtained in othersandstone studies (Section 5.5), including with valuesestimated using geophysical techniques (Section 5.6).
5.2. Estimation of DoCa
PBr2
The value of DoCaPBr2 can be calculated using:
Dsalto = DþD−
Zþ + jZ−j� �jZ−jD− + ZþDþ� � ð6Þ
where Dsalto is the aqueous diffusion coefficient for a diffusing
salt inwater, Z+ is the cation charge, Z− is the anion charge, andD+ and D− are the single ion diffusion coefficients (e.g. Tyrrelland Harris, 1984). Using the experimental values Do
Ca2+=7.92×10⁻¹⁰ m2 s−1 and Do
Br−=20.80×10⁻¹⁰ m2 s−1, both at298 K (Vanysek, 2001), and correcting for temperature using4% per K for Ca2+ and 4.8% per K for Br− (e.g. Lloyd andHeathcote, 1985), Do
CaPBr2=10.5×10⁻¹⁰ m2 s−1.Although Eq. (5) provides a theoretical value for Do
CaPBr2 at
infinite dilution, Do values are concentration-dependent (e.g.Tyrrell and Harris, 1984). For salt diffusion, a correction canbe made using Gordon's equation (e.g. Reid et al., 1987;Tyrrell and Harris, 1984):
Do′ = Do
ηsη
1ρsV̄s
1 + m∂ ln γ∂m
� �ð7Þ
whereDo′ is the diffusion coefficient in water at concentrationm, ηs is the viscosity of the solvent, η is the viscosity of thesolution, ρs is the molar density of the solvent [mol L−3], V̄ s isthe partial molar volume of the solvent [L3 mol−1], and γ isthe mean ionic activity coefficient of the solute (Gordon,1937). Taking ηs /η=ρs·V̄ s=1, and activity coefficientsfrom the extended Debye–Huckel equation with ion size
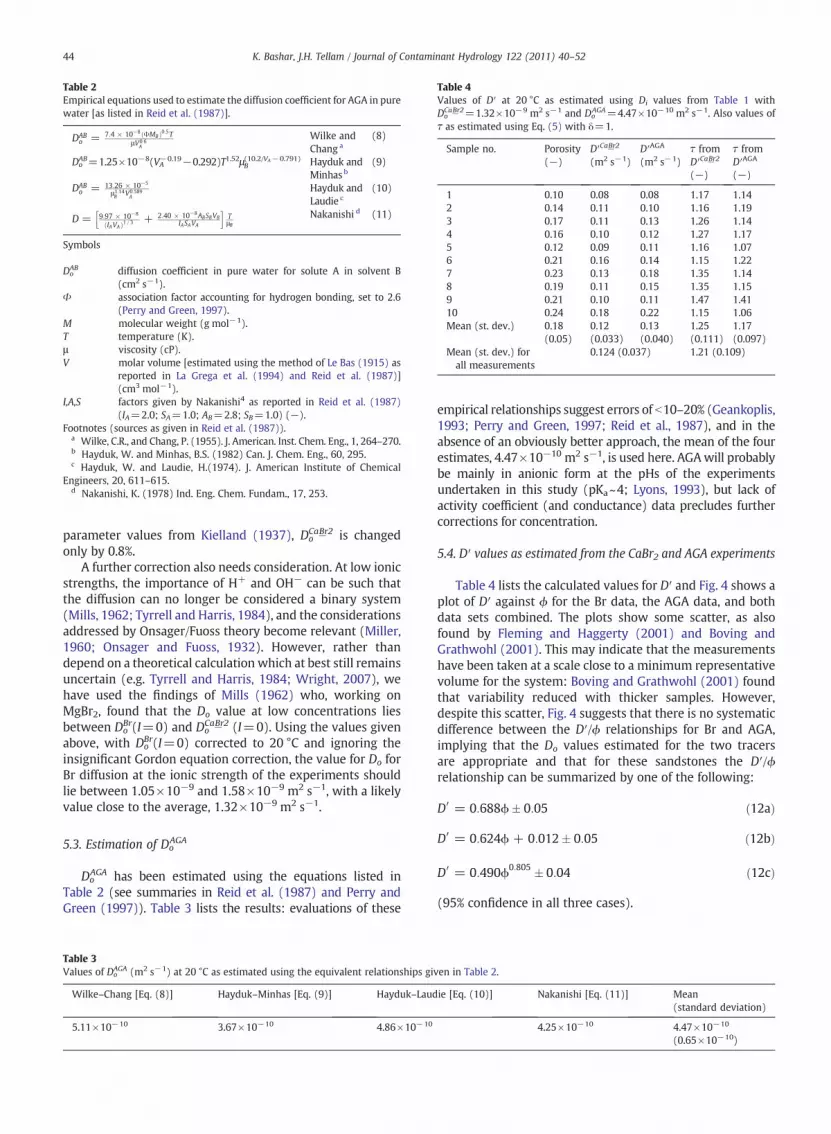
Table 2Empirical equations used to estimate the diffusion coefficient for AGA in purewater [as listed in Reid et al. (1987)].
DABo = 7:4 × 10⁻⁸ ΦMBð Þ0:5T
μV0:6A
Wilke andChang a
(8)
DoAB=1.25×10⁻⁸(VA−0.19−0.292)T1.52μB
(10.2/VA−0.791) Hayduk andMinhasb
(9)
DABo = 13:26 × 10−5
μ1:14B V0:589
AHayduk andLaudie c
(10)
D = 9:97 × 10−8
IAVAð Þ1 = 3 + 2:40 × 10−8ABSBVBIASAVA
h iTμB
Nakanishi d (11)
Symbols
DoAB diffusion coefficient in pure water for solute A in solvent B
(cm2 s−1).Φ association factor accounting for hydrogen bonding, set to 2.6
(Perry and Green, 1997).M molecular weight (g mol−1).T temperature (K).μ viscosity (cP).V molar volume [estimated using the method of Le Bas (1915) as
reported in La Grega et al. (1994) and Reid et al. (1987)](cm3 mol−1).
I,A,S factors given by Nakanishi4 as reported in Reid et al. (1987)(IA=2.0; SA=1.0; AB=2.8; SB=1.0) (−).
Footnotes (sources as given in Reid et al. (1987)).a Wilke, C.R., and Chang, P. (1955). J. American. Inst. Chem. Eng., 1, 264–270.b Hayduk, W. and Minhas, B.S. (1982) Can. J. Chem. Eng., 60, 295.c Hayduk, W. and Laudie, H.(1974). J. American Institute of Chemical
Engineers, 20, 611–615.d Nakanishi, K. (1978) Ind. Eng. Chem. Fundam., 17, 253.
Table 4Values of D′ at 20 °C as estimated using Di values from Table 1 withDoCa
PBr2=1.32×10⁻⁹ m2 s−1 and Do
AGA=4.47×10⁻¹⁰ m2 s−1. Also values ofτ as estimated using Eq. (5) with δ=1.
Sample no. Porosity(−)
D′CaPBr2
(m2 s−1)D′AGA
(m2 s−1)τ fromD′CaPBr2
(−)
τ fromD′AGA
(−)
1 0.10 0.08 0.08 1.17 1.142 0.14 0.11 0.10 1.16 1.193 0.17 0.11 0.13 1.26 1.144 0.16 0.10 0.12 1.27 1.175 0.12 0.09 0.11 1.16 1.076 0.21 0.16 0.14 1.15 1.227 0.23 0.13 0.18 1.35 1.148 0.19 0.11 0.15 1.35 1.159 0.21 0.10 0.11 1.47 1.4110 0.24 0.18 0.22 1.15 1.06Mean (st. dev.) 0.18
(0.05)0.12(0.033)
0.13(0.040)
1.25(0.111)
1.17(0.097)
Mean (st. dev.) forall measurements
0.124 (0.037) 1.21 (0.109)
44 K. Bashar, J.H. Tellam / Journal of Contaminant Hydrology 122 (2011) 40–52
parameter values from Kielland (1937), DoCa
PBr2 is changed
only by 0.8%.A further correction also needs consideration. At low ionic
strengths, the importance of H+ and OH− can be such thatthe diffusion can no longer be considered a binary system(Mills, 1962; Tyrrell and Harris, 1984), and the considerationsaddressed by Onsager/Fuoss theory become relevant (Miller,1960; Onsager and Fuoss, 1932). However, rather thandepend on a theoretical calculation which at best still remainsuncertain (e.g. Tyrrell and Harris, 1984; Wright, 2007), wehave used the findings of Mills (1962) who, working onMgBr2, found that the Do value at low concentrations liesbetween Do
Br(I=0) and DoCa
PBr2 (I=0). Using the values given
above, with DoBr(I=0) corrected to 20 °C and ignoring the
insignificant Gordon equation correction, the value for Do forBr diffusion at the ionic strength of the experiments shouldlie between 1.05×10⁻⁹ and 1.58×10⁻⁹ m2 s−1, with a likelyvalue close to the average, 1.32×10⁻⁹ m2 s−1.
5.3. Estimation of DoAGA
DoAGA has been estimated using the equations listed in
Table 2 (see summaries in Reid et al. (1987) and Perry andGreen (1997)). Table 3 lists the results: evaluations of these
Table 3Values of Do
AGA (m2 s−1) at 20 °C as estimated using the equivalent relationships gi
Wilke–Chang [Eq. (8)] Hayduk–Minhas [Eq. (9)] Hayduk–Laud
5.11×10⁻¹⁰ 3.67×10⁻¹⁰ 4.86×10⁻¹⁰
empirical relationships suggest errors of b10–20% (Geankoplis,1993; Perry and Green, 1997; Reid et al., 1987), and in theabsence of an obviously better approach, the mean of the fourestimates, 4.47×10⁻¹⁰ m2 s−1, is used here. AGAwill probablybe mainly in anionic form at the pHs of the experimentsundertaken in this study (pKa~4; Lyons, 1993), but lack ofactivity coefficient (and conductance) data precludes furthercorrections for concentration.
5.4. D′ values as estimated from the CaBr2 and AGA experiments
Table 4 lists the calculated values for D′ and Fig. 4 shows aplot of D′ against ϕ for the Br data, the AGA data, and bothdata sets combined. The plots show some scatter, as alsofound by Fleming and Haggerty (2001) and Boving andGrathwohl (2001). This may indicate that the measurementshave been taken at a scale close to a minimum representativevolume for the system: Boving and Grathwohl (2001) foundthat variability reduced with thicker samples. However,despite this scatter, Fig. 4 suggests that there is no systematicdifference between the D′/ϕ relationships for Br and AGA,implying that the Do values estimated for the two tracersare appropriate and that for these sandstones the D′/ϕrelationship can be summarized by one of the following:
D′ = 0:688ϕ� 0:05 ð12aÞ
D′ = 0:624ϕ + 0:012� 0:05 ð12bÞ
D′ = 0:490ϕ0:805 � 0:04 ð12cÞ
(95% confidence in all three cases).
ven in Table 2.
ie [Eq. (10)] Nakanishi [Eq. (11)] Mean(standard deviation)
4.25×10⁻¹⁰ 4.47×10⁻¹⁰
(0.65×10⁻¹⁰)

Fig. 4. The relationships between diffusibility and porosity for the CaBr2 andAGA tests. The errors were estimated by combining those of the Di estimate(Fig. 3 caption) with an estimated error for the D0 values. Linear regressionsin the inset table provide one indication that the effect of combining the AGAand Br data sets is limited.
45K. Bashar, J.H. Tellam / Journal of Contaminant Hydrology 122 (2011) 40–52
Thus the factor δ/τ2 is approximately constant across all thesamples tested, and thedifference in slopes in Fig. 3 is explainedby the difference in Do between the two tracers. It is alsoconcluded that porosity, as often is the case (e.g. Boving andGrathwohl, 2001), is the dominant factor in determining D′.
5.5. Comparison with published values from other sandstonestudies
Despite a significant literature on diffusion properties ofmany types of rock (e.g. Grathwohl, 1998; Ohlsson andNeretnieks, 1995), there have been relatively few investiga-tions of porewater diffusion in intact samples of red-bedsandstone. For example, we have been able to trace only oneprevious study for the sequence fromwhich the samples usedin the work reported here were taken, the UK Permo-TriassicSandstone (Braney et al., 2001), and only a small numberfrom the equivalent sequence elsewhere (Grathwohl, 1998;Rügner et al., 1999; Sabatini, 2000; (probably) Frosch et al.,2000; Boving and Grathwohl, 2001; Pape et al., 2005). Ofthese studies, two used disaggregated samples, and theresults are therefore not directly comparable (Rügner et al.,1999; Sabatini, 2000) and will not be considered further.Frosch et al. (2000) and Pape et al. (2005) used pore-scaleNMR techniques, and again the results are not directlycomparable. At least three of the intact-sample studiesobtained samples from much greater depths (N0.5 km) thanin the present study (Braney et al., 2001 (a few also fromshallower depths); Pape et al., 2005; Frosch et al., 2000): nodepths are noted by Boving and Grathwohl (2001). Threestudies involved the use of much higher ionic strengthsolutions (Braney et al., 2001 (two exceptions); Boving andGrathwohl, 2001; Pape et al., 2005) and two experimentedwith rocks originally containing saline waters (Braney et al.,2001; Frosch et al., 2000).
Bearing these differences in mind, Table 5 lists the datafrom these studies, together with data from an example studyof petrographically rather different sandstones (Garrouchet al., 2001). Fig. 5 compares the relationships betweenD′ and
ϕ for the studies of Braney et al. (2001) and Boving andGrathwohl (2001) with that for the present study. It is clearthat, for similar porosities, the diffusibilities of the sandstonesin our study are much greater than those in previous studies,withD′ values typically being 4 times greater. [A Kolmogorov–Smirnov test comparing the data of the present study withthose of Braney et al. (2001), ignoring the porosity depen-dence, confirms that the values are significantly different(pb0.001), even if only those data for which ϕN0.1 areincluded. This result is confirmed by determining the overlapof the 95% confidence limits for linear correlation of D′ againstϕ for the same two data sets — no overlap occurs beyondϕ=0.15.] This difference in D′ values is present despite thefact that most of the sandstones listed in Table 5 are fromthe same broad stratigraphic unit and have the same broadpalaeoenvironment as the sandstones studied here.
5.6. Comparisons with geophysical measurements on shallowUK Permo-Triassic Sandstones
Electrical property measurements offer an independentmethod for confirming whether diffusibilities of these sand-stones are unusually high.
Many authors havenoted a connection betweendiffusibilityand the formation factor (e.g. Grathwohl, 1998). Diffusibilitycan be viewed as the ratio: ion mobility through the rock systemunder the influence of a concentration gradient/ion mobilitythrough water under the influence of a concentration gradient.Likewise, the inverse of the formation factor can be consideredas the ratio: ion mobility through the rock system under theinfluence of a voltage gradient/ion mobility through water underthe influence of a voltage gradient. Provided, as often implied(e.g. Boving and Grathwohl, 2001; Pape et al., 2005), that theseratios are equal to each other, and assuming Archie's formationfactor (F)/porosity relationship to hold,
D′ = Fð Þ−1 =ϕm
Að13Þ
where m and A are the Archie empirical constants (Archie,1942; Wyllie and Gregory, 1953). This approach assumes thatthe electrical current through the rock is dominated by ionicconduction through the pore space. In the sandstones underinvestigation, ‘matrix conduction’ also occurs (e.g. Barker andWorthington, 1973), but this issue can be circumvented bythe use of the ‘true’ formation factor rather than the apparentformation factor (Barker and Worthington, 1973): surfaceconduction effects are considered further in Section 6.4.Eq. (12) is effectively the Pirson (1983) model, the modelwhich Garrouch et al. (2001) have found to bemost consistentwith Eq. (5).
Barker (1986) presents a list of Archie law relationshipsfor his extensive studies of Permo-Triassic Sandstones acrossnorthern England and Wales. His relationships are for trueformation factors, the effects of matrix conduction havingbeen taken into account by undertaking measurements ata range of electrolyte strengths and then extrapolating toinfinite salinities. Fig. 6 shows a plot of the diffusibilitiesinferred from Barker's (1986) relationships plotted againstporosity. For the range of porosities measured during thediffusion experiments (0.1 to 0.24), the predicted D′ values
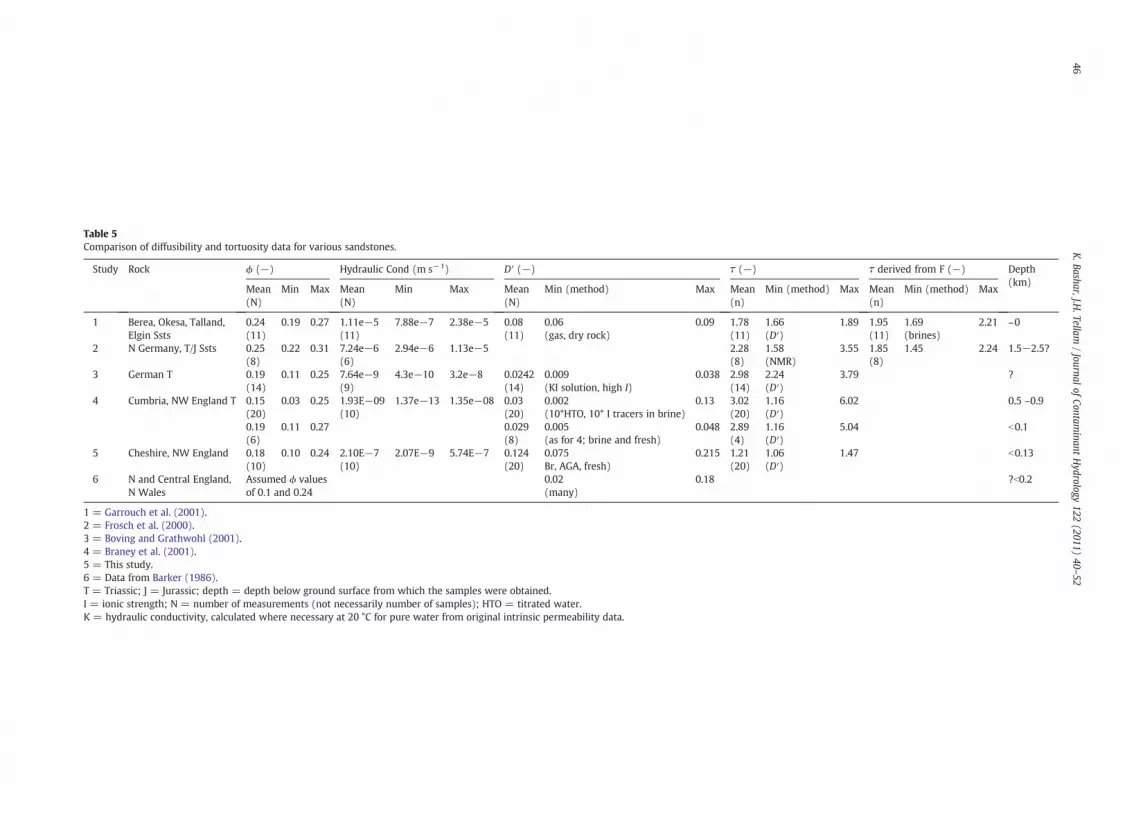
Table 5Comparison of diffusibility and tortuosity data for various sandstones.
Study Rock ϕ (−) Hydraulic Cond (m s−1) D′ (−) τ (−) τ derived from F (−) Depth(km)
Mean Min Max Mean Min Max Mean Min (method) Max Mean Min (method) Max Mean Min (method) Max(N) (N) (N) (n) (n)
1 Berea, Okesa, Talland,Elgin Ssts
0.24(11)
0.19 0.27 1.11e−5(11)
7.88e−7 2.38e−5 0.08(11)
0.06(gas, dry rock)
0.09 1.78(11)
1.66(D′)
1.89 1.95(11)
1.69(brines)
2.21 ~0
2 N Germany, T/J Ssts 0.25(8)
0.22 0.31 7.24e−6(6)
2.94e−6 1.13e−5 2.28(8)
1.58(NMR)
3.55 1.85(8)
1.45 2.24 1.5−2.5?
3 German T 0.19(14)
0.11 0.25 7.64e−9(9)
4.3e−10 3.2e−8 0.0242(14)
0.009(KI solution, high I)
0.038 2.98(14)
2.24(D′)
3.79 ?
4 Cumbria, NW England T 0.15(20)
0.03 0.25 1.93E−09(10)
1.37e−13 1.35e−08 0.03(20)
0.002(10*HTO, 10* I tracers in brine)
0.13 3.02(20)
1.16(D′)
6.02 0.5 –0.9
0.19(6)
0.11 0.27 0.029(8)
0.005(as for 4; brine and fresh)
0.048 2.89(4)
1.16(D′)
5.04 b0.1
5 Cheshire, NW England 0.18(10)
0.10 0.24 2.10E−7(10)
2.07E−9 5.74E−7 0.124(20)
0.075Br, AGA, fresh)
0.215 1.21(20)
1.06(D′)
1.47 b0.13
6 N and Central England,N Wales
Assumed ϕ valuesof 0.1 and 0.24
0.02(many)
0.18 ?b0.2
1 = Garrouch et al. (2001).2 = Frosch et al. (2000).3 = Boving and Grathwohl (2001).4 = Braney et al. (2001).5 = This study.6 = Data from Barker (1986).T = Triassic; J = Jurassic; depth = depth below ground surface from which the samples were obtained.I = ionic strength; N = number of measurements (not necessarily number of samples); HTO = titrated water.K = hydraulic conductivity, calculated where necessary at 20 °C for pure water from original intrinsic permeability data.
46K.Bashar,J.H
.Tellam/Journal
ofContam
inantHydrology
122(2011)
40–52

Fig. 5. Relationship between diffusibility and porosity for the data set fromthis study, that of Braney et al. (2001), and that of Boving and Grathwohl(2001). For the present study, the mean of the AGA and Br D′ estimates ispresented, with the errors estimated as twice the standard error.
47K. Bashar, J.H. Tellam / Journal of Contaminant Hydrology 122 (2011) 40–52
range from 0.02–0.06 (ϕ=0.1) to 0.10–0.18 (ϕ=0.24). Thisrange is only slightly lower than that obtained from thediffusion experiments (0.075 to 0.215), and rather higherthan the values reported by Boving and Grathwohl (2001)and Braney et al. (2001) (cf. Fig. 5). Some of the samples usedby Barker (1986) come from Cumbria, northwest England,close to the location of the samples obtained by Braney et al.(2001): however, Barker's (1986) data are from samples fromshallow depths, and from a part of the sequence containingfresh groundwater whereas most — though not quite all — ofthe samples used by Braney et al. (2001) come from muchgreater depths.
Fig. 6. Relationship between porosity and diffusibility as implied by theformation factor relationships of Barker (1986). Fylde = Fylde area ofLancashire, northwest England; Notts = Nottinghamshire, east centralEngland; Shrop= Shropshire, west central England; Clwyd= Vale of Clwyd,north Wales; Cumbria = northernmost northwest England. Also plotted arethe results from the present study (see caption to Fig. 5 for explanation oferror estimates).
6. Possible reasons for the high D′ values
6.1. Introduction
The high D′ values might be a product of the method used.Alternatively, they may represent phenomena intrinsic to therock/water system. For example, according to the model ofEq. (5), high values of D′/ϕ imply high δ, or low tortuosities,or both. Given the same fabric, high δ would probably beassociated with low τ. High diffusibilities might also bemeasured if there were significant surface conduction, anionexclusion, or ion exchange effects. These possibilities arebriefly examined in the following sub-sections.
6.2. The method
There appears to be no a priori reason to suppose thatthe method used, a common one, should over-estimatediffusibilities. However, because of the importance to themain argument of the paper, here we consider some details ofthe method as applied in our study to determine if they couldhave affected the interpreted values adversely.
6.2.1. Tracer sorptionSorption might be occurring below the detection limit
of the batch experiments, but if so, this would result eitherin underestimation of diffusibility or leave the values unaf-fected depending on how closely the system approximatessteady-state.
6.2.2. OsmosisIn principle, osmosis is possible given the presence of
slightly different ionic strengths (b~1.5×10⁻⁴ M) in thedonor reservoir compared with the sample and the receiverreservoir. However, this difference in ionic strength, due tothe presence of tracer, is very small, equivalent to a differenceof, for example, 2 mg l−1 Ca. Even had the difference beenmuch larger, significant osmosis is very unlikely as the rocksare of relatively high porosity and high permeability, behaveperfectly in column experiments where flow is perpendicularto lamination (100% Br and amino-G-acid recovery with nodelay: Bashar and Tellam, 2006), and display no discernibleosmosis-related phenomena in the field.
6.2.3. Other chemical effectsSome carbonate cement dissolution will have occurred
during the experiments, and in principle this would haveincreased the pore volumes. However, the CO2 contentavailable to the water, even if the unlikely assumption ofopen system conditions is made, is very small, and PHREEQC(Parkhurst and Appelo, 1999) calculations suggest that for apore volume the carbonate dissolution is b0.004% of the massof the cement, a figure that is negligible in comparison withthe fluxes of carbonate experienced by the rock in the past.Ion exchange will also have occurred, but again would havebeen limited because of the small total cation concentrationsin solution, and in any case it is not obvious how this wouldhave affected interpreted diffusibility values. Further discus-sion of surface conduction is provided in Section 6.5.

48 K. Bashar, J.H. Tellam / Journal of Contaminant Hydrology 122 (2011) 40–52
6.2.4. Initial reservoir head differencesExperiments undertaken with the numerical model men-
tioned in Section 3 show that the log[Cd−Cr)/Co] / t plot, andtherefore the interpreted Di value, is insensitive (≪1%Di change) to the initial penetration of the tracer into thesample— the system rapidly converges to a state very similarto that for the case where no penetration of the sample occursat the start of the experiment, perhaps not surprising giventhat the mass of tracer present in the sample is a smallproportion of that in the reservoirs.
6.2.5. Sampling methodThe sampling and probe insertions would have caused
small head differences (b0.5 mm) to develop temporarily inthe forward direction and then equally in the backwarddirection. Using the average permeability and porosity valuesfor the samples (Table 1), and taking the maximum headdifferences likely, over a sampling period it might beexpected that solute would move by 30 μm, roughly onepore diameter: on return of the sample, the movement wouldhave been in the opposite direction. The sampling will thussmear the concentration distributions, but only slightly:diffusion times over these scales are on the order of a minute,and such small perturbations are insignificant over the long(~100 h) sampling intervals. Had these sampling issues beenof importance in explaining the high diffusibilities obtained,it would be expected that the slope of the log[(Cd−Cr) /Co] /t plots would show a significant (~4-fold) increase in time:this is not the case (e.g. Fig. 2), and even the first samplein each experiment, before any disturbance could haveoccurred, is consistent with the later data.
It is concluded that there is no reason to suppose that themethod used has produced a bias towards higher diffusibilityvalues, and that therefore a physical cause should be soughtfor the higher than expected values.
6.3. δ values
Constrictivity δ can be estimated using various empiricalformulae based on the parameter λ, where λ=moleculardiameter/pore diameter, e.g.
δ = 1−λð Þ4 ð14Þ
(Beck and Schultz, 1970; see also Barraclough and Nye, 1979and Grathwohl, 1998).
The size of AGA molecules has been estimated crudelyhere using the molecular weight (128.2 g mol−1) and density(1.101 g cm−3) of naphthalene. This yields a molecularvolume of 1.93×10⁻²⁸ m3, equivalent to a sphere of radius0.36 nm. This compares with the estimates of Kärger andRuthven (1992, p.453) of 0.34–0.45 nm for the radius ofdimethyl naphthalene, and Lande et al. (1984) of 0.31 to0.46 nm for naphthalene. The hydrated Br− ion has an ionicradius of about 0.15 nm (Kielland, 1937). Mercury injectionporosimetry data from sandstones used in this investigationsuggest that 20–30% of pores are smaller than 40 nm indiameter, and about 10% below 8 nm (detection limit is~4 nm, though absolute pore sizes will vary with interpreta-tion model used). Applying Eq. (13) suggests that pore sizesof 40 nm would be associated with constrictivities to AGA of
about 0.93: evenwhen the pores are 8 (4)nm in diameter, theconstrictivity will still be 0.69 (0.45). It is concluded that theconstrictivity is likely to be close to unity, i.e. high, in thesesandstones. Boving and Grathwohl (2001) arrive at the sameconclusion for their sandstones.
6.4. τ values
Table 4 lists values for τ calculated from the D′ and ϕ dataassuming that δ=1 and that Eq. (5) holds: as δmay be lower,the τ values should be considered as maximum values. Theaverage tortuosity is 1.21, with values ranging from 1.06 to1.47. The values calculated using the AGA and Br data are inclose agreement, the averages (±two standard errors) beingrespectively 1.25±0.070 and 1.17±0.061. There is nosignificant correlation between tortuosity and porosity orhydraulic conductivity [(linear) R2 valuesb0.17] (implyinghydraulic conductivity anisotropy to be unimportant). Thecalculated tortuosity values are low in absolute terms, andtherefore warrant further examination, using data from boththeoretical studies and experimental investigations of rocks.
Many studies, from Maxwell's (1873) investigation ofdilute suspensions of spheres to Shen and Chen's (2007)review, have investigated theoretically tortuosity in porousmedia made up of regular geometrically shaped grains. Theconclusions vary (e.g. Shen and Chen, 2007; van Brakel andHeertjes, 1974), but usually some experimental evidence canbe found to substantiate the theoretical arguments beingproposed: the differences in the conclusions result from theneed for approximations to be made when describing thecomplex geometries involved. Thus, for example, Weissberg(1963) suggests a lower bound tortuosity for randomlyoverlapping spheres of uniform or non-uniform size to be[1–0.5ln(ϕ)], which would yield tortuosities greater thanimplied by our measurements, yet experimental data andsubsequent modelling work (e.g. Akanni et al., 1987) showthat lower tortuosities are possible. The analysis of van Brakeland Heertjes (1974) shows how lower tortuosities mayoccur: they conclude that even for spherical grains, τ will liebetween 1.15 and 1.52, averaging ~1.24 (values recalculatedassuming constrictivity=1.0), and they provide and citeexperimental data from work on polydisperse sphericalgrains indicating tortuosities ranging from 1.0 to 1.4. It isconcluded that with relatively simple geometries, tortuositiesmay lie within the range found in the experiments reportedhere. This is supported by records of tortuosities based onexperimentally-determined diffusion coefficients within therangemeasured here (e.g. those of Braney et al., 2001), even ifthe averages are greater.
Low tortuosities suggest that the rock will have an ‘open’fabric. Fig. 7 shows example thin sections. Especially in thehigher permeability laminae, the pore network is indeedrelatively open: in the lower permeability laminae, connec-tivity may be present but is often obscured by haematite andclays. A very crude method for placing the images in thecontext of tortuosity is to imagine all pores as straight, butinclined at an angle φ to the macroscopic direction ofdiffusion — the ‘inclined pore model’ (e.g. Dykhuizen andCasey, 1989; Pape et al., 2005): this gives τ=1/cos2 φ. Withτ=1.21, the average tortuosity from the diffusion cellmeasurements, φ~25°, which conceptually seems possible

Fig. 7. Example thin sections viewed under plane (a, b) and cross (c) polarized light. (a) Thin section showing laminations (F = finer grained/lower ‘macro’porosity; C= coarser grained); scale bar=1 mm. (b) Example thin section of coarser lamination; scale bar=0.1 mm. (c) Example thin section of finer lamination;scale bar=0.1 mm.
49K. Bashar, J.H. Tellam / Journal of Contaminant Hydrology 122 (2011) 40–52
when considering the thin section images, especially giventhat the images are only two dimensional. Electron micro-graphs suggest that some pores are lined with authigenic clayof open boxwork form, which may explain the relativelylow permeability of the samples. Again, it is concluded thatthe tortuosity values are possible.
On the basis of this evidence there appears to be no reasonto doubt the interpreted tortuosity values. It is unlikely,however, that they could be much lower, thus confirmingthe interpretation that constrictivity values are close tounity [as was concluded by Boving and Grathwohl (2001)for their samples]. Low tortuosity values might be expectedto be associated with higher permeability values, and indeedthe samples from the present study have on average rathergreater permeabilities (10−9 to 10−7 m s−1 compared with10−13 to 10−8 m s−1 (Braney et al., 2001) and 10−10 to10−8 m s−1 (Boving andGrathwohl, 2001)). The correlationsof tortuosity and D′ with permeability within the samplesstudied here are not strong, but the range of permeabilityvalues is relatively limited.
6.5. Surface conduction and anion exclusion
A possible mechanism contributing to greater diffusibilityis surface diffusion through the electrical double layers
associated with clays especially. The geophysical studiessummarized by Barker (1986) found that the sandstoneshave a matrix conduction, and Scott and Barker (2003, 2006)also found that surface conduction gave rise to a significantinducedpolarization effect in sandstone samples from the samesequence. A crude calculation of the porosity associated withthe double layer can be made by assuming a bulk density(quartz with ϕ=0.25), a surface area (e.g. 0.42–6.8 m2 g−1;Scott and Barker, 2003), and a double layer thickness estimatedfrom the Debye length (e.g. Stumm and Morgan, 1996;~10 nm). This yields a double layer ‘porosity’ of 0.01 to 0.14,suggesting that in some cases surface diffusion could beimportant, at least volumetrically. However, as the sorption ofthe AGA and Br used in the experiments was not measurable,the concentrations are presumably similar to those in thebulk aqueousphase: this is consistentwith the fact that theAGAand Br− data produced very similar results. If this is the case,then there may be no specific advantage of a tracer moleculebeingwithin the surface layer. It would be interesting to re-testunderhigher ionic strengths, as thiswould reduce the thicknessof the double layer, though may well cause other effects too.However, a few measurements were undertaken by Braneyet al. (2001) using freshwater, and they found no simple effecton diffusibility, the freshwater test results spanning the wholerange of D′ values seen in their study as a whole.

Table 6Characteristic diffusion times for CaBr2 and AGA using the averaged valuesfor Di obtained in this study (1.5×10⁻¹⁰ m2 s−1 and 6×10⁻¹¹ m2 s−1
respectively) and assuming a porosity of 0.2.
Distance Characteristic time
CaBr2 AGA
1 μm 0.001 0.002 s1 mm 11 28 mins1 cm 18 47 hours10 cm 0.2 0.5 years1 m 21 54 years3 m 188 483 years10 m 2086 5371 years30 m 18,775 48,338 years
50 K. Bashar, J.H. Tellam / Journal of Contaminant Hydrology 122 (2011) 40–52
The samples are from a part of the sandstone sequencewhere ion exchange is occurring within the groundwaters,with Na concentrations significantly greater than Cl concen-trations (Tellam, 1994). Although Ca concentrations remainhigh and the exchange sites will still be dominated by sorbedCa, it is possible that some Ca/Na exchange took place duringthe experiments. This would result in the diffusion of Ca, Na,and Br rather than just Ca and Br. As DNaBr is NDCaBr2, theinterpreted value of D′ used in the calculations of tortuositymay be too low: however, application of Eq. (6) indicates thatthe difference is small, especially bearing in mind Ca will stillbe dominant over Na (1.62×10⁻⁹ and 1.32×10⁻⁹ m2 s−1).
Anion exclusion may be occurring in the smaller pores, aspossibly indicated by the measurable induced polarizationeffects for samples from elsewhere in the UK Permo-Triassicsandstone sequence (Scott and Barker, 2003). In general,anion exclusion may be expected to reduce apparentdiffusibility, and therefore cannot be used to explain thehigh values found here. In the present study, the agreementof results for AGA and Br strongly suggests that it is not asignificant process. Braney et al. (2001) also concluded, onthe basis of similar results for tritiated water and iodidetracers, that there was no evidence for anion exclusion inmost of their sandstone samples.
Of the three othermost closely comparable Permo-Triassicsandstone studies, this is the only case where the originalwater and the test solutions were both fresh. In the case ofBraney et al. (2001), the groundwaters were saline and thetest solutions also saline; in the case of Boving and Grathwohl(2001), the groundwaters were probably fresh, though thetest solutions were saline; in the case of Frosch et al. (2000),low concentration solutions were injected into rock initiallycontaining brines. Thus in the case of Frosch et al. (2000) atleast it might be expected that ion exchange could haveplayed a role: despite being derived from NMR measure-ments which often yield higher values, the tortuosity valuesfrom the Frosch et al. (2000) study are lower on average thanin the other two studies. Although it is unlikely that ionexchange had a major effect on the diffusion in the presentstudy, this remains a potentially important mechanism, andneeds to be considered in diffusion in the sandstones ingeneral.
6.6. Causes of high D′ values —conclusion
It is not possible to be certain why the sandstones studiedhere have unusually high diffusibility values in comparisonwith the other available, non-NMR, studies on intact Permo-Triassic red-bed sandstone samples (Boving and Grathwohl,2001; Braney et al., 2001). Accepting Boving and Grathwohl's(2001) conclusion that the constrictivities of their samplesare close to unity, and the general consensus that surfaceprocesses are unlikely to be important, the main differencemust lie in the tortuosity values— the sandstones tested herehave a more ‘open’ fabric. This is supported by their higherpermeabilities, despite similar porosities, though there mustalso be other differences in fabric given that there is someoverlap of permeability ranges. The open fabric may be theresult of dissolution processes, or different authigenesis, thesandstones in this study being from shallow, relatively rapidfresh groundwater flow zones in contrast to the deeper
samples of the other studies: in this context it is worthwhilenoting that Barker's (1986) geophysical data, which yieldedhigher diffusibility estimates, was from in the same area asstudied by Braney et al. (2001), but from shallower depths.
7. Implications
Bashar and Tellam (2006) have shown that, at laboratoryscales, layering has a strong influence on solute breakthroughin intact UK Permo-Triassic sandstone samples. The mainfeature of the breakthrough curves when flow is parallel withlamination is a significant tailingwhich is absent when flow isperpendicular to lamination. This is qualitatively and quan-titatively consistent with diffusion from high permeabilitylaminae already containing tracer into lower permeabilitylaminae yet to achieve advective breakthrough (Bashar,1997). In these experiments, Br and AGA show the sameeffects, except that more tailing occurs in the case of Brbecause of its greater diffusion coefficient (Bashar, 1997).Thus the diffusion will result, as might be expected, in somedegree of chemical fractionation in multi-solute systems.
The effects seen at laboratory scale are likely also to beseen at larger scales in the field (Tellam and Barker, 2006),where laminae are replaced by beds, and hours are replacedby years. It is interesting to note that Hitchmough et al.(2007) inferred the tortuosity for the (sparse) fracturenetwork in these sandstones to be 1.6: however, tortuositiesfor the matrix system at large scales are not yet known.
Table 6 indicates characteristic diffusion times (Einstein–Smoluchowski equation, t=L2ϕ /2Di, where t is time and L isdistance) for a range of distances using the averaged diffusioncoefficient values obtained in this study. Using the averagetortuosity values obtained by Braney et al. (2001) increasesthe times by a factor of just over 4. This difference haspractical significance for the interpretation of tracer testsin this aquifer (e.g. Streetly et al., 2002), for dispersioncoefficient evaluation, for contaminant breakthrough (andaccompanying fractionation), and for remediation efficiency.
8. Conclusions
Diffusion coefficient measurements undertaken on sam-ples of red-bed sandstone samples using both amino-G-acidand Br− tracers indicated large diffusibility (=diffusioncoefficient/diffusion coefficient in water) and correspondingly

51K. Bashar, J.H. Tellam / Journal of Contaminant Hydrology 122 (2011) 40–52
low tortuosity compared with the small number of otherstudies available on red-bed (andother) sandstones. Tortuosityestimates using data from previous, independent work onelectrical properties of similar sequences were similarlyrelatively large. It is concluded that the range of sandstonetortuosity values, and therefore diffusibility values, may berather greater than has previously been found. It is proposedthat the high values determined in the present study are theresult of the relatively open framework of the sandstonesstudied, and we speculate that similar results may be foundfor similarly shallow, high-throughput freshwater sandstoneaquifer systems whose burial and diagenetic history is suchthat their ‘minus-cement’ porosities are large. In practice, thehigh diffusibilities measured here could result in movementrates of up to ~4 times that expected from previous results. Asfound in previous studies, diffusibility is strongly dependent onporosity, but tortuosity is at most only very weakly correlatedwith porosity and permeability.
Acknowledgements
We would like to thank Richard Greswell for his expertadvice on the laboratory work, and Susan Digges la Touchefor undertaking the mercury injection analysis. The BritishGeological Survey provided access to their mercury injectionporosimeter. We are very grateful to the University ofJahangirnagar, Dhaka, and the UK Commonwealth ScholarshipCommission for funding the research. Finally, we would like tothank Michael Riley for his comments and suggestions,insightful as always!
References
Akanni, K.A., Evans, J.W., Abramson, I.S., 1987. Effective coefficients inheterogeneous media. Chem. Eng. Sci. 42, 1945–1954.
Allen, D.J., Brewerton, L.J., Coleby, L.M., Gibbs, B.R., Lewis,M.A.,Macdonald, A.M.,Wagstaff, S.J.,Williams, A.T., 1997. Thephysical properties ofmajor aquifersin England andWales: British Geological Survey Technical Report WD/97/34, and Environment Agency R&D Publication, 8, p. 312.
Archie, G.E., 1942. The electrical resistivity log as an aid in determining somereservoir characteristics. Trans. Am. Inst. Min. Metall. Pet. Eng. 146,54–62.
Barker, R.D., 1986. Surface geophysical techniques. In: Brandon, T.W. (Ed.),Groundwater: occurrence, development and protection. The Institutionof Water Engineers and Scientists Water Practice Manual 5, Chapter 8,pp. 271–314.
Barker, R.D., Tellam, J.H., 2006. Fluid flow and solute movement insandstones: the onshore UK Permo-Triassic red bed sequence: GeologicalSociety of London Special Publication, 263. 346 pp.
Barker, R.D., Worthington, P.F., 1973. Some hydrogeophysical properties ofthe Bunter Sandstone of northwest England. Geoexploration 11, 151–170.
Barraclough, D., Nye, P.H., 1979. The effect of molecular size on diffusioncharacteristic in soil. J. Soil Sci. 30, 29–42.
Bashar, K., 1997. Developing a conceptual model of intergranular conservativesolute transport processes for laboratory-scale samples of the U.K. Triassicsandstones. PhD Thesis, University of Birmingham. 306pp.
Bashar, K., Tellam, J.H., 2006. Micro- andmacro-scale dispersion in laboratoryexperiments on intact sandstone cores: experiments and developmentof conceptual models. In: Barker, R.D., Tellam, J.H. (Eds.), Fluid Flow andSolute Movement in Sandstones: The Onshore UK Permo-Triassic RedBed Sequence: Geological Society Special Publication, 263, pp. 233–252.
Bear, J., 1972. Dynamics of Fluids in Porous Media. Elsevier, New York.Beck, R.E., Schultz, J.S., 1970. Hindered diffusion in microporous membranes
with known pore geometry. Science 170, 1302–1305.Benton, M.J., Cook, E., Turner, P., 2002. Permian and Triassic Red Beds and the
Penarth Group of Great Britain. Joint Nature Conservation Committee,Peterborough.
Berner, R.A., 1980. Early Diagenesis. Princeton University Press, Princeton.241 pp.
Bloomfield, J.P., Gooddy, D.C., Bright, M.I.,Williams, P.J., 2001. Pore-throat sizedistributions in Permo-Triassic sandstones from the United Kingdomand some implications for contaminant hydrogeology. Hydrogeol. J. 9,219–230.
Bloomfield, J.P., Moreau, M.F., Newell, A.J., 2006. Characterization ofpermeability distributions in six lithofacies from the Helsby andWilmslow sandstone formations of the Cheshire Basin, UK. In: Barker,R.D., Tellam, J.H. (Eds.), Fluid Flow and Solute Movement in Sandstones:The Onshore UK Permo-Triassic Red Bed Sequence: Geological SocietySpecial Publication, 263, pp. 83–102.
Boving, T.B., Grathwohl, P., 2001. Tracer diffusion coefficients in sedimentaryrocks: correlation to porosity and hydraulic conductivity. J. Contam.Hydrol. 53, 85–100.
Braney, M.C., Gilling, D., Jefferies, N.L., Lineham, T.R., Stone, N.S., 2001.Laboratory measurements of the mass transfer properties of samples ofPermo-Triassic sedimentary strata from Cumbria. UK Nirex Ltd ReportNSS/R278. 68 pp.
Carlyle, H.F., Tellam, J.H., Parker, K., 2004. The use of laboratory-determinedion exchange parameters in the prediction of field-scale major cationmigration over a 40 year period. J. Contam. Hydrol. 68, 55–81.
Chen, T., Lerner, D.N., 1991. Diffusion coefficient of trichloroethylenein sandstone. Report, Hydrogeology Research Group, University ofBirmingham. 18 pp.
Digges La Touche, S.V., 1998. Unsaturated flow in the Triassic Sandstones ofthe UK. PhD Thesis, University of Birmingham.
Dykhuizen, R.C., Casey, W.H., 1989. An analysis of solute diffusion in rocks.Geochim. Cosmochim. Acta 53, 2797–2805.
Fleming, S.W., Haggerty, R., 2001. Modeling solute diffusion in the presenceof pore-scale heterogeneity: method development and an application tothe Culebra dolomite Member of the Rustler Formation, New Mexico,USA. J. Contam. Hydrol. 48, 253–276.
Frosch, G.P., Tillich, J.E., Haselmeier, R., Holz, M., Althaus, E., 2000. Probingthe pore space of geothermal reservoir sandstones by nuclear magneticresonance. Geothermics 29, 671–687.
Garrouch, A.A., Ali, L., Qasem, F., 2001. Using diffusion and electricalmeasurements to assess tortuosity of porous media. Ind. Eng. Chem. Res.40, 4363–4369.
Geankoplis, C.J., 1993. Transport Processes and Unit Operations, 3rd Edition.Prentice Hall, London. 921 pp.
Gordon, A.R., 1937. The diffusion of an electrolyte, and its relation toconcentration. J. Chem. Phys. 5, 522–526.
Grathwohl, P., 1998. Diffusion in Natural Porous Media: ContaminantTransport, Sorption/Desorption and Dissolution Kinetics. Kluwer AcademicPublishers, Boston. 207 pp.
Greswell, R., 1995. A laboratory investigation of flow and transport processesin the Lincolnshire limestone. Ph.D. Thesis, University of Birmingham,UK, 258pp.
Greswell, R., Yoshida, K., Tellam, J.H., Lloyd, J.W., 1998. The micro-scalehydrogeological properties of the Lincolnshire Limestone, UK. Q. J. Eng.Geol. 31, 181–197.
Harbaugh, A.W., Banta, E.R., Hill, M.C., McDonald, M.G., 2000. MODFLOW-2000,the U.S. Geological Survey modular ground-water model. User guideto modularization concepts and the ground-water flow process. USGSOpen-File Report 00-92. U.S. Geological Survey, Denver, Colorado, USA.
Hill, D., 1984. Diffusion coefficient of nitrate, chloride, sulphate and water incracked and uncracked Chalk. J. Soil Sci. 35, 27–33.
Hitchmough, A., Herbert, A.W., Riley, M., Tellam, J.H., 2007. Estimating thehydraulic properties of the fracture network in a sandstone aquifer.J. Contam. Hydrol. 93, 38–57.
Hornung, J., Aigner, T., 1999. Reservoir and aquifer characterization of fluvialarchitectural elements: Stubensandstein, Upper Triassic, southwestGermany. Sed. Geol. 129, 215–280.
Howard, K.W.F., 1987. Beneficial aspects of sea-water intrusion. GroundWater 25, 398–406.
Kärger, J., Ruthven, D.M., 1992. Diffusion in Zeolite. JohnWiley and Sons, Inc,N.Y. 556 pp.
Kielland, J., 1937. Individual activity coefficients of ions in aqueous solutions.J. Am. Chem. Soc. 59, 1675–1678.
La Grega, M.D., Buckingham, P.L., Evans, J.C., 1994. Hazardous WasteManagement. McGraw-Hill, New York. 1146 pp.
Lande, S.S., Hagen, D.F., Seaver, A.E., Pearlman, R.S., 1984. An improvedmethod to estimate ionic size for calculating polyatomic ion mobility.J. Chem. Phys. 81, 2503–2506.
Le Bas, G., 1915. The Molecular Volumes of Liquid Chemical Compounds.Longmans, New York.
Lloyd, J.W., Heathcote, J.H., 1985. Natural Inorganic Hydrochemistry inRelation to Groundwater: An Introduction. Clarendon Press, Oxford.296 pp.
Lovelock, P.E.R., 1977. Aquifer properties of Permo-Triassic sandstones in theUnited Kingdom: Bulletin of the Geological Survey, 56. 49pp.
52 K. Bashar, J.H. Tellam / Journal of Contaminant Hydrology 122 (2011) 40–52
Lyons, R.G., 1993. Identification and separation of water tracing dyes usingpH response characteristics. J. Hydrol. 152, 13–29.
Maloszewski, P., Zuber, A., 1993. Tracer experiments in fractured rocks; matrixdiffusion and the validity of methods. Water Resour. Res. 29, 2723–2735.
Maxwell, J.C., 1873. A treatise on electricity andmagnetism. New York, DoverPublications, 3rd ed, 1954.
Miller, D.G., 1960. Thermodynamics of irreversible processes. The experimentalverification of the Onsager reciprocal relations. Chem. Rev. 60, 15–37.
Mills, R., 1962. The effect of the ionization of water on diffusional behavior indilute aqueous electrolytes. J. Phys. Chem. 66, 2716–2718.
Needham, S.N., 1995. The behaviour of atrazine and simazine within thechalk aquifer. Ph.D. Thesis. University of Birmingham, England.
Ohlsson, Y., Neretnieks, I., 1995. Literature survey of matrix diffusion theoryand of experiments and data including natural analogues. SKB TechnicalReport 95-12. Swedish Nuclear Fuel andWaste Management, Stockholm.89 pp.
Onsager, L., Fuoss, R.M., 1932. Irreversible processes in electrolytes.Diffusion, conductance, and viscous flow in arbitrary mixtures ofstrong electrolytes. J. Phys. Chem. 36, 2689–2778.
Pape, H., Tillich, J.E., Holz, M., 2005. Pore geometry of sandstone derived frompulsed filed gradient NMR. J. Appl. Geophys. 58, 232–252.
Parkhurst, D.L., Appelo, C.A.J., 1999. User's Guide to PHREEQC (version 2)— AComputer Program for Speciation, Batch-reaction, One-dimensionalTransport, and Inverse Geochemical Calculations. U.S. Geological Survey,Water-Resources Investigations Report 99-4259.
Perry, R.H., Green, D.W., 1997. Perry's Chemical Engineers' Handbook, 7thEdition. McGraw-Hill, New York. Section 5.
Pirson, S.J., 1983. Geologic Well Log Analysis. Gulf Publishing, Houston, USA.Plant, J.A., Jones, D.G., Haslam, H.W., 1999. The Cheshire Basin: Basin
Evolution, Fluid Movement and Mineral Resources in a Permo-TriassicRift Setting. British Geological Survey, Keyworth. 263 pp.
Reid, R.C., Prausnitz, J.M., Poling, B.E., 1987. The Properties of Gases andLiquids, 4th Edition. McGraw-Hill, New York. 741 pp.
Rügner, H., Kleineidam, S., Grathwohl, P., 1999. Long term sorption kinetics ofphenanthrene in aquifer materials. Environ. Sci. Technol. 33, 1645–1651.
Sabatini, D.A., 2000. Sorption and intraparticle diffusion of fluorescent dyeswith consolidated aquifer media. Ground Water 38, 651–656.
Scott, J.B.T., Barker, R.D., 2003. Determining pore-throat size in Permo-Triassicsandstones from low-frequency electrical spectroscopy. Geophys. Res.Lett. 30, 1450.
Scott, J.B.T., Barker, R.D., 2006. Pore geometry of Permo-Triassic sandstonefrom measurements of electrical spectroscopy. In: Barker, R.D., Tellam,J.H. (Eds.), Fluid Flow and Solute Movement in Sandstones: The OnshoreUK Permo-Triassic Red Bed Sequence: Geological Society of LondonSpecial Publication, 263, pp. 65–82.
Segar, D.A., 1993. The effect of open boreholes on groundwater flows andchemistry. PhD Thesis, University of Birmingham.
Shackelford, C.D., 1991. Laboratory diffusion testing for waste disposal — areview. J. Contam. Hydrol. 7, 177–217.
Shen, L., Chen, Z., 2007. Critical review of the impact of tortuosity on diffusion.Chem. Eng. Sci. 62, 3748–3755.
Smart, P.L., Laidlaw, I.M.S., 1977. An evaluation of some fluorescent dyes forwater tracing. Water Resour. Res. 13, 15–33.
Stenhouse, M.J., Merceron, T., De Martinville, E.S., 1996. Provision for diffusioncoefficients for argillaceous media in support of preliminary safetyassessment within the French HLW disposal programme. J. Contam.Hydrol. 21, 351–361.
Streetly, H., Hamilton, C.A.L., Betts, C., Tellam, J.H., Herbert, A.W., 2002.Reconnaissance tracer tests in the Triassic Sandstone aquifer north ofLiverpool, UK. Q. J. Eng. Geol. Hydrogeol. 35, 167–178.
Stumm, W., Morgan, J.J., 1996. Aquatic Chemistry. John Wiley & Sons,New York. 1022 pp.
Tellam, J.H.,1994. Thegroundwater chemistryof the LowerMerseyBasinPermo-Triassic Sandstone aquifer system, UK: 1980 and pre-industrialisation/urbanisation. J. Hydrol. 161, 287–325.
Tellam, J.H., 1995. Hydrochemistry of the saline groundwaters of the lowerMersey Basin Permo-Triassic sandstone aquifer, UK. J. Hydrol. 165,45–84.
Tellam, J.H., Barker, R.D., 2006. Towards prediction of saturated zonepollutant movement in groundwaters in fractured permeable-matrixaquifers: the case of the UK Permo-Triassic Sandstones. In: Barker, R.D.,Tellam, J.H. (Eds.), Fluid Flow and Solute Movement in Sandstones: TheOnshore UK Permo-Triassic Red Bed Sequence: Geological Society ofLondon Special Publication, 263, pp. 1–48.
Tyrrell, H.J.V., Harris, K.R., 1984. Diffusion in Liquids. A Theoretical andExperimental Study. ButterworthsMonographs inChemistry, Butterworths,London. 448 pp.
van Brakel, J., Heertjes, P.M., 1974. Analysis of diffusion in macroporousmedia in terms of a porosity, a tortuosity and a constrictivity factor. Int. J.Heat Mass Transfer 17, 1093–1103.
Vanysek, P., 2001. Ionic conductivity and diffusion at infinite dilution. In:Lide, D.R. (Ed.), CRC handbook of chemistry and physics. CRC Press, BocaRaton, p. 5-95-5-97.
Weissberg, H.L., 1963. Effective diffusion coefficient in porous media. J. Appl.Phys. 34, 2636–2639.
Wright, M.R., 2007. An Introduction to Aqueous Electrolyte Solutions. JohnWiley & Sons, Chichester. 602 pp.
Wyllie, M.R.J., Gregory, A.R., 1953. Formation factors of unconsolidatedporous media: influence of particle shape and effect of cementation.Trans. Am. Inst. Min. Metall. Eng. 198, 103–110.


