Embed Size (px)
Citation preview

www.elsevier.com/locate/clay
Applied Clay Science 27 (2004) 119–128
Sandwich structures in the Etruscan-Padan type pottery
L. Nodaria,*, L. Maritanb, C. Mazzolib,c, U. Russoa
aDipartimento di Chimica Inorganica, Metallorganica e Analitica, Universita di Padova, Via Loredan 4, I-35131 Padova, ItalybDipartimento di Mineralogia e Petrologia, Universita di Padova, C.so Garibaldi 37, I-35137 Padova, Italy
c Istituto di Geoscienze e Georisorse, CNR-Padova, C.so Garibaldi 37, I-35137 Padova, Italy
Received 25 April 2003; received in revised form 14 January 2004; accepted 31 March 2004
Available online 17 June 2004
Abstract
The sandwich (black core) structure in the production of Etruscan-Padan type pottery was investigated. Petrographic, X-ray
diffraction (XRD) and Mossbauer data showed that colour changes from core to margin are related to differences in both Fe
oxidation state and abundance of maghemite, hercynite and hematite. The occurrence of maghemite and hercynite and the
higher quantity of Fe(II) in the cores suggest poor oxygen diffusion in the potsherds during firing. This is congruent with the
occurrence of high fractions of paramagnetic Fe in octahedral sites, located in the amorphous phase probably derived from
chlorite breakdown, and with the wide range of grain-size distribution of oxidic particles, indicated by the slowing down of
superparamagnetic relaxation as temperatures are lowered.
D 2004 Elsevier B.V. All rights reserved.
Keywords: Sandwich structures; X-ray diffraction; Mossbauer spectroscopy; Iron oxidation state; Iron age pottery; Veneto region
1. Introduction on raw materials used and on firing conditions, e.g.,
In the study of ancient potsherds, colour is an
important feature to be determined, as it can provide
information on technological aspects of pottery man-
ufacture, as well as on the aesthetic preferences of a
specific production culture. The latter aspect is indeed
relevant when we consider the variety of painted
decorations and covering slips, which often over-
comes mere technical aspects such as to make the
pottery impermeable. Analysis of a freshly cut cross
section of the ceramic paste can provide information
0169-1317/$ - see front matter D 2004 Elsevier B.V. All rights reserved.
doi:10.1016/j.clay.2004.03.003
* Corresponding author. Fax: +39-49-8275161.
E-mail address: [email protected] (L. Nodari).
maximum temperature and firing atmosphere (Krei-
meyer, 1987; Stienstra, 1986).
In the present work, pottery characterised by sand-
wich (black core) structure was examined. Potsherds
were provided by the Italian National Museums of
Altino (AL11; AL17), Este (E22; E25) and Adria
(AD1; AD11) (Veneto region, northeastern Italy)
which preserve collections of findings from local
archaeological sites (Fig. 1). The potsherds belong
to the Etruscan-Padan type class, a ceramic production
that spread over the Veneto region from the end of the
V century B.C.
This type of pottery includes fine ceramic vessels
of open and closed shapes, characterised by pinkish to
reddish paste and reddish to brownish, sometimes

Fig. 1. Geographic location of the Veneto centres where the ceramic samples are from.
L. Nodari et al. / Applied Clay Science 27 (2004) 119–128120
banded, decorated external surface (Gamba and Gam-
bacurta, 1987; Rossi, 2000).
On the basis of geochemical and petrographic
study, Maritan (2002, 2004) demonstrated that Etrus-
can-Padan type pottery is of local production and that
potsherds from the towns of Altino, Este and Adria
can be distinguished from each other by their chem-
ical composition and firing temperature. Analysis of
the fabric reveals that the colours of the paste change
from core to margin in most of the samples, display-
ing a sandwich structure with a black core (Maritan,
2002, 2004).
According to Picon (1973) and Rye (1981), this
type of structure is due to firing in reducing con-
Table 1
Pottery paste colour as a function of redox conditions during heating
and cooling and of occurrence of organic matter (modified after
Picon, 1973; Rye, 1981)
Pottery colour Heating Cooling Organic matter
Beige-red with reducing oxidising absent/present
black core oxidising oxidising rich
Grey-black reducing reducing absent/present
Beige-red oxidising oxidising absent/scarce
reducing oxidising absent
ditions with an oxidising cooling stage, or to firing
organic matter-rich clays in oxidising conditions
(Table 1). The dark colour of the core is normally
attributed either to a high Fe2 +/Fe3 + ratio, in par-
ticular to the presence of magnetite (Fe3O4) or
wustite (FeO) in the paste (Letsch and Noll, 1983;
Harrel and Russel, 1967), or to the presence of
unburned carbon particles (Letsch and Noll, 1983).
The reddish and beige colour of the margins is
generally attributed to hematite (a-Fe2O3) and Fe–
Ca silicates, respectively (Kreimeyer, 1987; Molera
et al., 1998).
The main aim of the present work was to determine
which mineral phases controlled paste colour and its
variations from core to margin in the sandwich struc-
ture, by combining petrography, X-ray diffraction and
Mossbauer data. They reflect the oxidation state of the
various layers, providing information on environmen-
tal conditions and changes during firing.
2. Experimental methods
The potsherds were analysed by several different
methods, summarised below. The colours were mac-
roscopically defined by comparison with Munsell

Table 2
Colour of cores (c) and margins (m) of sandwich structures,
according to Munsell (1975) and NCS (1997) classifications
Sample Portion Colour Munsell NCS
AL11 m light red 2.5YR6/6 S3030-Y60R
c dark grey 10YR4/1 S6005-Y50R
AL17 m light red 2.5YR6/6 S2050-Y50R
c grey 5Y3/1 S7502-Y
E22 m light brown 7.5YR6/4 S3020-Y40R
c very dark grey N5 S5500-N
E25 m pink 7.5YR7/4 S2020-Y40R
c very dark grey N5 S5500-N
AD1 m red 10R5/8 S3560-Y20R
c dark grey 2.5YR4/0 S6010-Y70R
AD11 m light reddish brown 5YR6/4 S3020-Y50R
c very dark grey 7.5YR3/0 S7010-Y50R
L. Nodari et al. / Applied Clay Science 27 (2004) 119–128 121
(1975) and NCS (1997) charts on freshly cross-cut
surfaces of the sherds, and petrographic features were
determined on standard (30 Am) thin sections under a
polarised transmission microscope.
Chemical compositions for both major and trace
elements were determined on the bulk by X-ray
fluorescence (XRF) spectroscopy using a Philips
PW 2400 spectrometer equipped with an Rh tube, at
the Dipartimento di Mineralogia e Petrologia, Univer-
sity of Padova. Samples were prepared as beads by
dilution 1:10 of a calcined powder with Li2B4O7.
Geological standards were used for calibration. The
FeO/FeOtot ratio was determined by titration with
potassium permanganate (on bulk samples) and by
Mossbauer spectroscopy (separately on cores and
margins), considering the latter more reliably indica-
tive of the redox conditions of each of the two
portions.
The coloured margins were then mechanically
separated from the black cores by means of a glass
chisel, to avoid Fe contamination. Both margins
and cores were ground in an agate mortar under
acetone, to avoid oxidation, and separately analysed
by X-ray diffraction (XRD) and Mossbauer spec-
troscopy. XRD analyses were carried out by a
Philips PW 3710 BASED Diffractometer with
CuKa radiation, at the Istituto di Geoscienze e
Georisorse (CNR-Padova). Mossbauer spectra were
recorded on a conventional constant-acceleration
spectrometer, which used a room temperature Rh
matrix 57Co source, at the Dipartimento di Chimica
Inorganica, Metallorganica e Analitica (University
of Padova). Spectra were collected both at room
temperature (RT) and at 80 K. When necessary,
spectra were also collected at 21 K, using a closed-
circuit cryostat installed at the National Institute for
Materials Physics in Bucharest (Romania). In this
kind of cryostat, the natural line width is increased
by about 15%, due to pump vibrations. The hyper-
fine parameter isomer shift (IS), quadrupole split-
ting (QS), full line width at half maximum (W),
expressed in mm/s, and the internal magnetic field
(Hint), expressed in Tesla, were obtained by a
standard least-squares minimisation technique. The
spectra were fitted to Lorentzian line shapes using
a minimum number of sextets and doublets. Isomer
shift is quoted relative to metallic iron at room
temperature.
3. Results
The analysed potsherds are 5 to 8 mm thick, in
which two-thirds of the body is generally made up of
a black core and one-third of coloured inner and outer
margins, although their relative thicknesses may vary
significantly among samples and even within a single
fragment. The change in colour from core to margin
is often sharp, although shaded boundaries were
observed in some samples. The cores are generally
very dark grey to grey, and the margins are red,
brown or pink. Colour codes are listed in Table 2,
following the classification of Munsell (1975) and
NCS (1997).
Analysis of microstructural features in thin sections
revealed that cores and margins are very similar, as
they display identical porosity and similar type and
distribution of inclusions, when the change in colour
of the groundmass is excluded.
The geochemical data of Table 3 show that the
potsherds are chemically heterogeneous. In particular,
Fe2O3tot and CaO, which may determine changes in
relative abundance of colouring mineral phases, vary
from 5.02 to 8.61 wt.% and from 1.19 to 6.11 wt.%,
respectively. We refer to Maritan (2004) for a com-
plete discussion on the chemistry of the Etruscan-
Padan type pottery and on its implication for prove-
nance studies. As concerns the oxidation state of iron,
the reduction index (RI = FeO/FeOtot) proposed by
Maggetti and Galetti (1981), calculated by titration
on bulk samples (i.e., core plus margins), was quite
variable among the samples, from 0.16 to 0.66. This is

Table 4
Semiquantitative mineral composition for cores (c) and margins (m)
Sample Qtz Pl Kfs Ill Cc Dol Di Gh Hem Mgh
AL11 m ���� � � � � � � �c ���� � � � � � �
AL17 m ���� �� � � � � � �c ���� �� � � � � �
E22 m ���� �� � �� � � � �c ���� �� � �� � � �
E25 m ���� �� �� � �� �c ���� �� �� � �� � �
AD1 m ���� �� �� � � � � �c ���� �� �� � � � �
AD11 m ���� � � � � � �c ���� � � � �
Mineral abbreviations: (Qtz) quartz; (Pl) plagioclase; (Kfs) K-
feldspar; (Ill) illite; (Cc) calcite; (Dol) dolomite; (Di) diopside; (Gh)
gehlenite; (Hem) hematite; (Mgh) maghemite. Quantities: very
abundant (���� ); abundant (��� ); frequent (�� ); scarce
(� ).
Table 3
Geochemical composition of samples and relative reduction index
(RI) for bulk samples (titration data) and for margins and cores
separately (Mossbauer data)
AL11 AL17 E22 E25 AD1 AD11
SiO2 52.90 60.48 56.72 63.65 62.03 61.82
TiO2 0.99 0.94 0.82 0.89 0.83 0.83
Al2O3 27.54 22.38 22.64 16.92 18.69 19.40
Fe2O3tot 8.61 8.18 8.52 5.02 7.02 6.83
MnO 0.08 0.06 0.16 0.09 0.09 0.08
MgO 2.62 1.35 2.23 1.65 3.94 3.77
CaO 1.39 1.19 2.22 6.11 2.36 2.32
Na2O 0.54 1.06 0.83 1.85 1.34 1.09
K2O 4.02 3.32 4.29 3.40 3.34 3.52
P2O5 0.39 0.31 1.30 0.66 0.25 0.41
Tot 99.08 99.27 99.73 100.24 99.89 100.07
FeO 1.25 1.19 1.63 1.61 4.19 1.66
RI bulk 0.16 0.16 0.21 0.36 0.66 0.27
RI margin 0.00 0.00 0.04 0.00 0.00 0.00
RI core 0.16 0.11 0.41 0.43 0.79 0.74
L. Nodari et al. / Applied Clay Science 27 (2004) 119–128122
in agreement with the data of Maggetti et al. (1988) on
sandwich structure pottery from Sissach-Bruhl. As the
apparent, RI value calculated in such a way is greatly
affected by differences in the volumetric ratio between
core and margin, it does not give any reliable infor-
mation on firing conditions. For this reason, we
preferred to calculate the RI for cores and margins
separately, by using Mossbauer data. Results are listed
in Table 3. They indicate that margins are completely
oxidised, as only Fe(III) was detected, if we exclude
sample E22 which bears a small amounts of Fe(II);
cores display different degrees of oxidation, with RI in
the range 0.11–0.79, very close to or higher than that
estimated on bulk samples.
The mineral assemblage was determined by XRD
analysis. Varying proportions of quartz, plagioclase,
K-feldspar and illite (Table 4) were identified in all
samples. Gehlenite and/or diopside was only detected
in a few fragments (AD1, AL17). When these mineral
phases were absent, calcite and dolomite were ob-
served elsewhere (AD11, AL11, E22, E25). Regard-
ing Fe oxide phases, hematite was recognised in all
margins, with the exception of sample E25, where
hematite is apparently absent or at least its concentra-
tion is below detection limit. It was always associated
with another Fe oxide mineral phase, displaying a
peak at 35.64j of 2h in the XRD pattern, attributed to
the near end-member maghemite of the Fe spinel
series. As diopside and K-feldspar display minor
reflections at similar 2h angles, the attribution to
maghemite was made by subtracting from the inten-
sity of the peak the contribution of diopside and K-
feldspar, calculated on the basis of the relative inten-
sity with that of the major peaks, assuming random
distribution of particles in the powder. As regards the
distribution of Fe oxide, cores generally contain only
maghemite (Table 4).
The magnetite–maghemite series (i.e., kenomag-
netite series) has a general formula Fe2 +1� y(Fe3 +
Fe3 +1 + 2/3y[ ]y/3)O4, where y may vary continuously
from 0 (magnetite Fe3O4) to 1 (maghemite Fe2.67O4 =
g-Fe2O3), according to the substitution 3Fe+ 2!2Fe+ 3 + vacancy [ ]. Synthetic end-member magnetite
and maghemite have rather similar diffraction pat-
terns, complicating their distinction when they occur
in low concentrations in multiphase systems. Since
maghemite often derives from the oxidation of orig-
inal magnetite (Deer et al., 1992), determination of the
composition of this spinel is essential to obtain
information on the oxidising vs. reducing conditions
of firing.
The composition of spinel within the magnetite–
maghemite series can be more reliably determined by
Mossbauer spectroscopy, which provides the Fe va-
lence, site geometry and nature of hyperfine interac-
tions (Greenwood and Gibb, 1971).
At room temperature, the spectra of all samples
show doublets due to paramagnetic Fe(III) and Fe(II)

L. Nodari et al. / Applied Clay Science 27 (2004) 119–128 123
and sextets attributable to Fe(III) contained in mag-
netic phases. It is evident from the area values (Table
5) that the percentage of Fe(II) is greater in the cores
than in the margins, and that the dimensions and
nature of the oxidic particles are different in the two
portions. These differences are discussed below.
On the basis of isomer shift values, Fe(III) occu-
pies only octahedral sites, whereas Fe(II) occupies
both octahedral and tetrahedral sites. These signals are
generated by Fe in both silicates and the amorphous
phase deriving from decomposition of phyllosilicates.
The magnetic signals of all samples were charac-
terised by a large line width, at both room temperature
(RT) and low temperature (LT), due to poor crystal-
linity and/or degree of high Al-substitution. Thus, a
hyperfine field distribution was first used to obtain
information on the presence of different oxides with
similar magnetic fields. The hyperfine parameters
obtained from the distribution of hyperfine magnetic
field (H) were then used in subsequent fitting to
crystalline subspectra. In this way, reasonable hyper-
fine values of H were obtained for most of the spectra
(Table 5). Several spectra for which the signal-to-
noise ratio was particularly low did not supply valu-
able results concerning the attribution of oxide phases
(AL17(m) LT, AL17(c) LT, AD1(m)).
The hyperfine parameters obtained for the magnet-
ic sextets in the spectra of the margins are typical of
Al-substituted or poorly crystallised hematite and
maghemite (Da Costa et al., 1998; Wagner et al.,
1992) (Table 5). Those of the cores also indicate the
presence of other magnetic species, although they are
not well defined due to the low quality of the spectra.
One important difference among the sherds from the
three different archaeological sites refers to the dimen-
sions of the Fe oxide particles, in both cores and
margins. It is well-known that superparamagnetic
relaxation is a function of temperature and grain size
of oxide particles, so that their grain size can be
estimated from low-temperature spectra. The Altino
sherds display a sextet even at RT, the area of which
increases further at 80 K, suggesting a wide grain-size
distribution. At RT, the sherds from Este and Adria
show a magnetic pattern and a superparamagnetic
doublet, which develops into a sextet at LT, indicating
a much smaller grain size for the Fe oxides.
Samples AL11 and AL17 are characterised by the
absence of Fe(II) sites in the margins and the appear-
ance of a magnetic subspectrum at RT. In fact, in the
margin of sample AL11, 23% of total iron occupies a
site which is already magnetic at RT (Fig. 2a). The
internal field of 49.6 T and the values of isomeric shift
(IS) and quadrupole splitting (QS) (0.35 and � 0.25
mm/s, respectively) suggest the presence of an Al-
substituted hematite (Greenwood and Gibb, 1971).
The remaining 77% gives rise to a paramagnetic
doublet with a large line width, attributable to octa-
hedral Fe(III). On decreasing the temperature, the
doublet area decreases in favour of that of the sextet
(Fig. 2b), proving the superparamagnetic behaviour of
this oxide. The broad line width supports the contem-
porary presence of hematite and superparamagnetic
hematite and/or maghemite. The hypothesis of super-
paramagnetic maghemite is also supported by XRD
data. In the core of sample AL11, 16% of total iron is
attributed to Fe(II) in an octahedral site, whereas
Fe(III) is distributed between a paramagnetic and a
magnetic site, the population of which increases at 80
K. The small QS value supports the attribution to an
Al-substituted superparamagnetic maghemite (Da
Costa et al., 1998).
In the margins of sample AL17, 74% of total Fe is
located in a paramagnetic octahedral site, while the
remaining 26% occupies a magnetic site, attributed to
Al-substituted hematite. On cooling the system down
to 80 K, the area of the magnetic sextet increases by
about 25%, at the expense of the paramagnetic signal,
and can be fitted by two sextets related to hematite
and a superparamagnetic oxide. In the core of sample
AL17, RT measurements indicate that Fe is distributed
over three different sites: 89% in two Fe(III) octahe-
dral sites, and the remaining 11% in a Fe(II) octahe-
dral site. The presence of small oxidic particles is
confirmed by LT measurement, and the new magnetic
pattern, with a very large line width, is attributable to
Al-substituted oxides.
In sample E25 from Este, a well-defined magnetic
pattern appears only at 21 K. It is known from the
literature (Da Costa et al., 1995) that, for small Al-
substituted maghemite particles with dimensions be-
tween 2 and 5 nm, T0 (defined as the temperature
above which only the doublet exists) is in the range
100–140 K. Therefore, the occurrence of the sextet at
21 K indicates that T0 is between 21 and 80 K and that
the oxidic particles are sized about or lower than 2 nm.
At RT, the margins of sample E25 show two paramag-

Table 5
Mossbauer parameters for room temperature (RT) and low temperature (LT) measurements
RT LT
Sample IS (mm/s) QS (mm/s) H (T) W (mm/s) A (%) Attributions T (K) IS (mm/s) QS (mm/s) H (T) W (mm/s) A (%) Attributions
AL11(m) 0.30F 0.02 0.80F 0.01 0.47F 0.02 77F 1 Fe(III) M 80 0.43F 0.01 0.98F 0.02 1.07F 0.03 52F 1 Fe(III) M
0.35F 0.03 � 0.25F 0.05 49.6F 0.2 0.77F 0.06 23F 1 Hem 0.46F 0.02 � 0.06F 0.03 51.7F 0.1 1.15F 0.07 48F 1 Hem
AL11(c) 0.30F 0.04 0.85F 0.05 0.59F 0.08 62F 1 Fe(III) M 80 0.42F 0.02 0.89F 0.04 0.78F 0.04 58F 1 Fe(III) M
1.10F 0.05 2.23F 0.03 0.55F 0.03 16F 1 Fe(II) M 1.24F 0.05 2.40F 0.20 0.58F 0.08 13F 1 Fe(II) M
0.35F 0.03 � 0.02F 0.06 49.3F 0.2 1.1F 0.1 22F 1 Mgh 0.47F 0.04 � 0.02F 0.08 51.9F 0.3 1.1F 0.20 30F 1 Mgh
AL17(m) 0.34F 0.01 0.84F 0.01 0.66F 0.02 74F 1 Fe(III) M 80 0.45F 0.01 0.91F 0.02 0.74F 0.03 49F 1 Fe(III) M
0.35F 0.02 � 0.19F 0.04 50.7F 0.3 0.63F 0.08 26F 1 Hem 0.43F 0.08 � 0.08F 0.06 49.4F 0.9 1.5F 0.30 26F 1 Oxid
0.47F 0.01 � 0.01F 0.06 52.8F 0.2 0.7F 0.10 25F 1 Hem
AL17(c) 0.37F 0.01 0.58F 0.02 0.33F 0.04 41F1 Fe(III) M 80 0.46F 0.01 0.76F 0.01 0.52F 0.02 53F 1 Fe(III) M
0.37F 0.09 1.0F 0.10 0.51F 0.04 48F 1 Fe(III) M 1.11F 0.05 2.6F 0.10 0.9F 0.20 13F 1 Fe(II) M
1.0F 0.40 2.20F 0.02 0.5F 0.10 11F1 Fe(II) M 0.4F 0.10 � 0.07F 0.06 48.4F 0.6 1.8F 0.40 33F 1 Oxid
E22(m) 0.31F 0.01 1.05F 0.03 0.80F 0.01 72F 1 Fe(III) M 21 0.52F 0.01 1.16F 0.01 0.85F 0.01 36F 1 Fe(III) M
1.09F 0.01 2.41F 0.01 0.52F 0.02 4F 1 Fe(II) M 1.04F 0.03 3.06F 0.07 1.4F 0.10 10F 1 Fe(II) M
0.38F 0.01 � 0.14F 0.02 48.9F 0.1 1.07F 0.05 24F 1 Hem 0.42F 0.02 0.04F 0.05 45.7F 0.8 1.5F 0.10 22F 1 Oxid
0.47F 0.01 � 0.08F 0.01 52.1F 0.4 0.67F 0.02 31F1 Hem
E22(c) 0.37F 0.02 1.08F 0.04 0.78F 0.03 59F 1 Fe(III) M 21 0.45F 0.01 1.22F 0.01 1.00F 0.01 41F1 Fe(III) M
1.16F 0.03 2.24F 0.06 0.52F 0.03 27F 1 Fe(II) M 1.28F 0.01 2.45F 0.01 0.74F 0.01 25F 1 Fe(II) M
0.9F 0.10 1.8F 0.30 0.8F 0.20 14F 1 Fe(II) T 0.4F 0.10 � 0.3F 0.10 46.4F 0.3 1.2F 0.10 17F 1 Oxid
0.47F 0.01 � 0.03F 0.01 51.6F 0.1 0.57F 0.01 17F 1 Mgh
E25(m) 0.37F 0.02 0.98F 0.01 0.62F 0.02 63F 1 Fe(III) M 21 0.47F 0.01 1.26F 0.01 0.98F 0.01 68F 1 Fe(III) M
0.36F 0.01 1.49F 0.02 0.66F 0.04 37F 1 Fe(III) M 0.4F 0.10 � 0.2F 0.40 51.5F 0.3 1.8F 0.10 32F 1 Oxid
E25(c) 0.38F 0.01 1.18F 0.03 0.71F 0.05 57F 1 Fe(III) M 21 0.53F 0.04 1.11F 0.08 1.1F 0.03 37F 1 Fe(III) M
1.04F 0.02 2.17F 0.03 0.60F 0.05 43F 1 Fe(II) M 1.37F 0.04 2.50F 0.08 0.99F 0.02 35F 1 Fe(II) M
0.44F 0.03 � 0.3F 0.10 51.5F 0.2 2.0F 0.10 27F 1 Oxid
AD1(m) 0.32F 0.01 0.92F 0.01 0.62F 0.01 64F 1 Fe(III) M 21 0.42F 0.01 0 1.89F 0.02 44F 1 Relaxing
component
0.30F 0.01 � 0.02F 0.01 51.0F 0.3 0.46F 0.02 36F 1 Hem 0.52F 0.01 � 0.05F 0.01 53.0F 0.1 1.76F 0.02 50F 1 Hem
AD1(c) 0.41F 0.05 0.70F 0.08 0.63F 0.09 21F1 Fe(III) M 0.45F 0.06 0.06F 0.01 48.2F 0.4 0.55F 0.02 6F 1 Oxid
1.10F 0.03 2.04F 0.04 0.66F 0.05 52F 1 Herc 21 1.24F 0.01 2.59F 0.01 0.92F 0.01 91F1 Herc
1.16F 0.01 2.53F 0.03 0.39F 0.06 27F 1 Herc 0.49F 0.02 0.55F 0.03 0.66F 0.02 9F 1 Fe(III) M
AD11(m) 0.32F 0.03 0.73F 0.07 0.4F 0.2 23F 1 Fe(III) M 21 0.48F 0.01 1.32F 0.01 1.01F 0.01 54F 1 Fe(III) M
0.35F 0.02 1.3F 0.10 0.70F 0.06 77F 1 Fe(III) M 0.49F 0.02 � 0.13F 0.07 52.5F 0.1 0.76F 0.05 20F 1 Hem
0.48F 0.04 � 0.19F 0.02 44.0F 0.2 1.9F 0.4 26F 1 Oxid
AD11(c) 0.48F 0.02 0.85F 0.10 0.70F 0.20 26F 1 Fe(III) M 21 Relaxing components
1.09F 0.03 2.02F 0.10 0.68F 0.10 47F 1 Herc
1.14F 0.04 2.51F 0.10 0.46F 0.10 27F 1 Herc
IS: isomeric shift; QS: quadrupole splitting (DEQ) for nonmagnetic or quadrupole shift (2e) for magnetic subspectra; H: hyperfine magnetic field; W: full width at half height; A:
relative area; M: octahedral site; T: tetrahedral site; Hem: hematite; Mgh: Al-substituted maghemite; Herc: hercynite, Oxid: poorly crystallised oxides; (m) margins, (c) core. All
values are relative to metallic a-iron.
L.Nodariet
al./Applied
ClayScien
ce27(2004)119–128
124
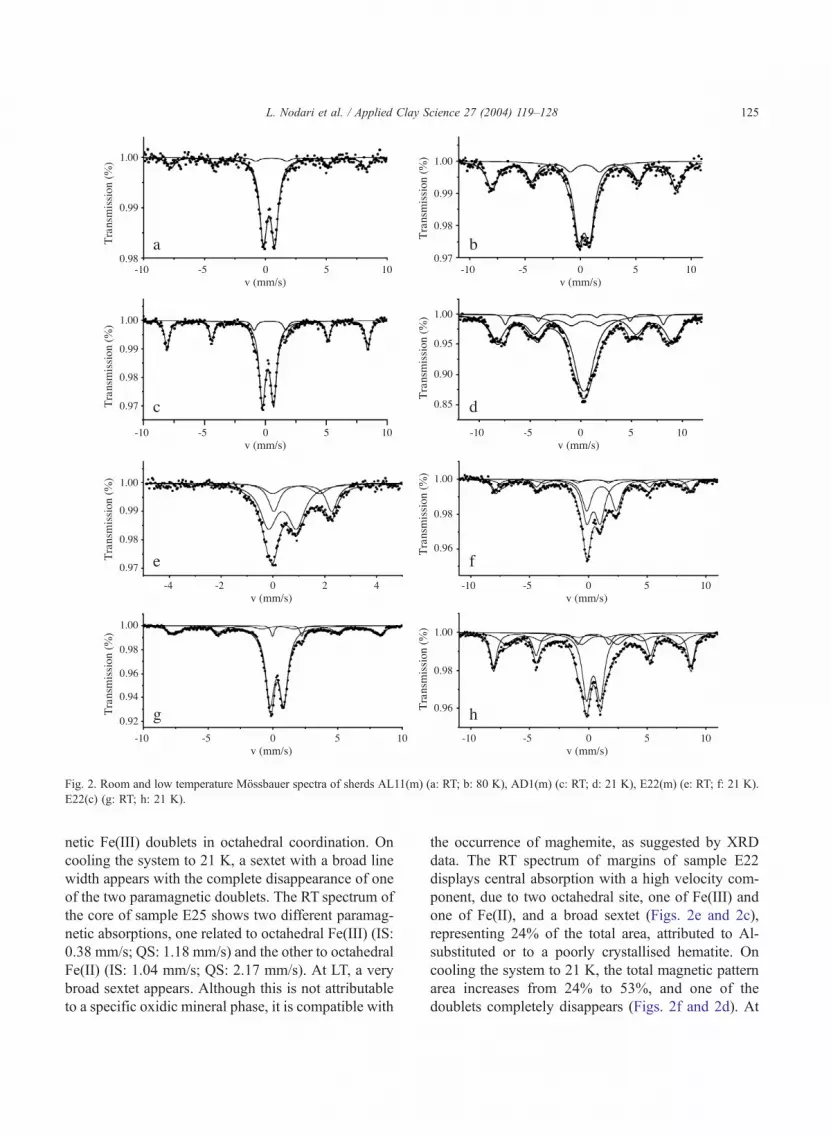
Fig. 2. Room and low temperature Mossbauer spectra of sherds AL11(m) (a: RT; b: 80 K), AD1(m) (c: RT; d: 21 K), E22(m) (e: RT; f: 21 K).
E22(c) (g: RT; h: 21 K).
L. Nodari et al. / Applied Clay Science 27 (2004) 119–128 125
netic Fe(III) doublets in octahedral coordination. On
cooling the system to 21 K, a sextet with a broad line
width appears with the complete disappearance of one
of the two paramagnetic doublets. The RT spectrum of
the core of sample E25 shows two different paramag-
netic absorptions, one related to octahedral Fe(III) (IS:
0.38 mm/s; QS: 1.18 mm/s) and the other to octahedral
Fe(II) (IS: 1.04 mm/s; QS: 2.17 mm/s). At LT, a very
broad sextet appears. Although this is not attributable
to a specific oxidic mineral phase, it is compatible with
the occurrence of maghemite, as suggested by XRD
data. The RT spectrum of margins of sample E22
displays central absorption with a high velocity com-
ponent, due to two octahedral site, one of Fe(III) and
one of Fe(II), and a broad sextet (Figs. 2e and 2c),
representing 24% of the total area, attributed to Al-
substituted or to a poorly crystallised hematite. On
cooling the system to 21 K, the total magnetic pattern
area increases from 24% to 53%, and one of the
doublets completely disappears (Figs. 2f and 2d). At

L. Nodari et al. / Applied Clay Science 27 (2004) 119–128126
RT, the core of sample E22 shows a spectrum similar
to that of the case of E25 (Fig. 2a). The absorption was
fitted using three doublets: an Fe(III) octahedral site
(IS: 0.37 mm/s; QS: 1.08 mm/s), an Fe(II) tetrahedral
site (IS: 0.90 mm/s; QS: 1.80 mm/s) and an Fe(II)
octahedral site (IS: 1.16 mm/s; QS: 2.24 mm/s). At 21
K, a magnetic pattern characterised by a very large line
width becomes evident (Fig. 2b). This pattern was
fitted using two sextets: the first, with a higher hyper-
fine field (HF) (51.6 T), is compatible with the
presence of Al-substituted maghemite; the second,
with a very broad line width, suggests the presence
of a poorly crystallised oxide and/or highly Al-substi-
tuted maghemite.
The RT spectrum of the margin of AD1 presents
absorption due to two octahedral Fe(III) sites and a
sextet due to Al-substituted hematite (Fig. 2c). On
cooling to 21 K (Fig. 2d), the system presents one
residual signal related to octahedral Fe(III) and two
magnetic sextets, one attributable to hematite and the
other to a poorly crystallised oxide. At RT, the
spectrum of the core presents a strong doublet fitted
to an octahedral Fe(III) component and to two Fe(II)
sites, one attributed to hercynite (Stevens et al., 1998).
At 21 K, the two Fe(II) doublets collapse into a single
doublet, perhaps as a consequence of crystal structure
contraction; the Fe(III) site seems to be unaffected.
At RT, the margins of sample AD11 present two
octahedral Fe(III) sites. On cooling to 21 K, two
sextets appear: the first with a hyperfine magnetic
field (Hint.) value of 52.5 T, indicating Al-substituted
hematite; and the second, with a lower Hint. and a
broad line width, suggesting Al-substituted oxides.
The core of sample AD11 also shows a strong
absorption due to Fe(II) and a shoulder in the low-
velocity component, which reveals a small amount of
Fe(III). The spectrum was fitted with two doublets for
octahedral Fe(II), with parameters typical of hercyn-
ite, and one doublet due to octahedral Fe(III). On
cooling the system to 21 K, the spectrum becomes
complex, due to slow relaxing species, and was not
fitted.
4. Conclusions
A key point in the characterisation of pottery is to
assess firing conditions. This task is particularly hard
in the core of sandwich structure pottery, since differ-
ent combinations of redox conditions and bulk chem-
ical composition of the raw materials can produce
such a structure during firing. In this work, the
oxidation state of both core and margins was deter-
mined by combining XRD and Mossbauer data.
At RT, Mossbauer spectra of potsherd margins are
characterised by the typical sextet of hematite, if we
exclude sample E25, where hematite is absent, and
sample AL11, where hematite is identified at LT. An
additional magnetic component was also identified at
LT and attributed to Al-substituted oxides.
At LT, maghemite was recognised in the cores of
samples AL11 and E22. The occurrence of super-
paramagnetic phenomena at LT indicates that the
grain size of maghemite is much lower than that of
hematite.
In some cases (AL17, E22, E25, AD1, AD11), a
magnetic signal was seen, the HF of which was not
assignable to specific oxidic phases and may represent
poorly crystallised oxides. Furthermore, the typical
double sextet of magnetite was never observed.
Paramagnetic octahedral coordinated Fe(III) and
Fe(II) was also observed. Fe(II) is generally detected
in cores and is absent in margins, except for sample
E22, where its concentration in the margin is much
lower than in the core. In the lack of high concen-
trations of Fe-bearing silicates in the potsherds, as
suggested by the XRD data (Table 4), the paramag-
netic signal may be due to the amorphous phase
deriving from decomposition of Fe-bearing clay min-
erals such as chlorite (Maniatis et al., 1983), although
small quantities of Fe may also be contained in illite.
The formation of the amorphous phase probably
caused a reduction in porosity (Tite and Maniatis,
1975) and consequently of the permeability of the
ceramic paste. In such a way, growth of oxidic phases
at the expense of the octahedral Fe of the amorphous
matter (Murad and Wagner, 1998) was locally
inhibited. This is in agreement with the higher content
of Fe(II) in the cores and the wide grain-size distri-
bution of maghemite.
The colours of the potsherds, macroscopically
observed and described in Table 2, are congruent with
XRD and Mossbauer data. In particular, the pinkish
and reddish hues of margins are related to different
proportions of hematite and maghemite, which re-
spectively contribute with their characteristic red and

L. Nodari et al. / Applied Clay Science 27 (2004) 119–128 127
brown colours. In addition, samples AD1 and AL1
also contain diopside and gehlenite, which respective-
ly confer yellowish and buff colours to the paste.
Considering the cores, the situation seems to be
different for each finding site. The dark colour ob-
served in the cores of samples AD1 and AD11 is
attributable to the hercynite, whereas those from
Altino and Este are related to both Fe(II) in the
amorphous phases and maghemite.
The presence of hercynite in the samples from
Adria indicates strong reducing firing conditions.
Maggetti et al. (1981) experimentally verified that
hercynite forms at oxygen fugacity between 10� 12
and 10� 21 bar. Recent firing experiments carried out
by Maritan (2002) showed that hercynite may also be
obtained by firing organic matter-rich clays in an
oxidising environment. In this case, the local reducing
conditions of the cores are not related to the general
redox conditions of the kiln, but caused by firing of
organic matter.
Acknowledgements
The authors would like to thank the ‘‘Soprinten-
denza Archeologica del Veneto’’ for providing
samples and the ‘‘Istituto di Geoscienze e Geori-
sorse’’, CNR, Padova, for analytical support. They
also thank the ‘‘National Institute for Materials
Physics’’, Bucharest, Romania, for collecting 21 K
Mossbauer spectra. We acknowledge G. Walton, who
revised the English text. This work was financially
supported by the MIUR-2000 project ‘‘Development
and application of mineralogical and petrographic
investigation methodologies to the study of archaeo-
logical materials’’.
References
Da Costa, G.M., De Grave, E., De Bekker, P.M.A., Vanderberghe,
R.E., 1995. Influence of nonstoichiometry and the presence of
maghemite on Mossbauer spectrum. Clays and Clay Minerals
43 (6), 656–668.
Da Costa, G.M., De Grave, E., Vanderberghe, R.E., 1998. Mossba-
uer studies of magnetite and Al-substituted maghemites. Hyper-
fine Interactions 117, 207–243.
Deer, W.A., Howie, R.A., Zussman, J., 1992. An Introduction to the
Rock-Forming Minerals, second edition. Longman Scientific
and Technical, Essex.
Gamba, M., Gambacurta, G., 1987. La ceramica etrusco-padana nel
Veneto. Gli Etruschi a nord del Po. Catalogo della Mostra,
Mantova, p. 121.
Greenwood, N.N., Gibb, T.C., 1971. Mossbauer Spectroscopy.
Chapman & Hall, London.
Harrel, G.O., Russel, R.R., 1967. Influence of ambient atmosphere
in maturation of structural clay products. Engineering Experi-
ment Station Bulletin. Ohio State University, Columbus, p. 204.
Kreimeyer, R., 1987. Some notes on the firing colour of clay bricks.
Applied Clay Science 2, 175–183.
Letsch, J., Noll, W., 1983. Phase formation in several ceramics
subsystems at 600 jC–1000 jC as a function of oxygen fugac-
ity. cfi/Ber. DKG 7, 259–267.
Maggetti, M., Galetti, G., 1981. Archaometrische Untersuchungen
an spatlateinezeitlicher Keramik von Basel-Gasfabrik und Sis-
sach-Bruhl. Archaologisches Korrespondenzblatt 11, 321–328.
Maggetti, M., Galetti, G., Schwander, H., Picon, M., Wessicken, R.,
1981. Campanian pottery: the nature of black coatings.
Archaeometry 23, 199–208.
Maggetti, M., Galetti, G., Schnalleuwly, R., 1988. Die Feinkeramik
von Sissach-Bruhl: eine spatlateinezeitliche Referenzgruppe.
Berichte aus der Arbeit des Amtes fur Museen und Archaologie
des Kantons Baselland 13, 1–47.
Maniatis, Y., Simopoulos, A., Kostikas, A., Perdikatsis, V., 1983.
Effect of reducing atmosphere on minerals and iron oxides de-
veloped in fired clay: the role of Ca. Journal of American Ce-
ramic Society 66 (11), 773–781.
Maritan, L., 2002. Studio archeometrico di ceramiche di tipo
etrusco padano dell’area veneta: indagini petrografiche, chi-
mico-fisiche e confronto con i risultati ottenuti da prove sper-
imentali di cottura di materiali argillosi. Unpublished PhD
thesis, Earth Sciences, University of Padova.
Maritan, L., 2004. Archaeometric study of Etruscan-Padan type
pottery from the Veneto region: petrographic, mineralogical
and geochemical-physical characterisation. European Journal
of Mineralogy 16, 297–307.
Molera, J., Pradell, T., Vendrell-Saz, M., 1998. The colours of Ca-
rich ceramic pastes: origin and characterisation. Applied Clay
Science 13, 187–202.
Munsell, A., 1975. Soil Colour Charts. Munsell Colour, Baltimore.
Murad, E., Wagner, U., 1998. Clay and clay minerals: the firing
process. Hyperfine Interactions 117, 337–356.
NCS, 1997. Natural Colour System Charts. Scandinavian Colour
Institute AB, Stockolm Sweden.
Picon, M., 1973. Introduction a l’etude tecnnique des ceramiques
sigillees de Lezoux. Universite de Dijon, Centre de recherches
sur les techniques greco-romaines, Dijon.
Rossi, S., 2000. Ceramica depurata e semidepurata nel Veneto:
proposte per un aggiornamento della problematica. Unpublished
Degree thesis, Archaeological Sciences, Universita di Padova.
Rye, O., 1981. Pottery Technology: Principles and Reconstruction.
Taraxacum, Washington.
Stevens, J.G., Khasanov, A.M., Miller, J.W., Pollak, H., Li, Z.,
1998. Mossbauer mineral handbook. Mossbauer Effect Data
Center, pp. 306–307.

L. Nodari et al. / Applied Clay Science 27 (2004) 119–128128
Stienstra, P., 1986. Systematic macroscopic description of the
texture and composition of ancient pottery: some basic
methods. Newsletter of Department of Pottery Technology
4, 29–48.
Tite, M.S., Maniatis, Y., 1975. Examination of ancient pottery using
the scanning electron microscope. Nature 257, 122–123.
Wagner, U., Gebhard, R., Murad, E., Shimada, I., Wagner, F.E.,
1992. The role of small particles in the study of archaeological
ceramics. In: Dormann, J.L., Fiorani, D. (Eds.), Study of Mag-
netic Properties of Fine Particles and Their Relevance to Mate-
rials Science. Elsevier, Amsterdam, pp. 381–392.


