Embed Size (px)
Citation preview

August 2020 scaleupinstitute.org.uk @Scaleupinst
ScaleUp Insights ONS ScaleUp Landscape The latest national and local level picture
FOREWORD
2 3
SCALEUP INSIGHTS: ONS SCALEUP LANDSCAPE – THE LATEST NATIONAL AND LOCAL LEVEL PICTURE
AUGUST 2020 SCALEUP INSTITUTE | www.scaleupinstitute.org.uk | @scaleupinst | #scaleup
Enabling scaleups to drive the UK out of deeply challenging times In 2020 the world has faced an unprecedented challenge. The Covid-19 emergency has posed an immense threat to all countries’ health, wellbeing and economies. As the UK starts on the path of post-lockdown recovery it is timely to consider the role scaleups can play in restoring the nation’s fortunes.
Thanks to the ScaleUp Institute’s collaboration with the Office for National Statistics we have had the opportunity to review the scaleup landscape by analysing the most recent data available. The resulting findings confirm our view that scaleups remain the champions of growth and innovation and are powerhouses of productivity. But they also show that scaleups still face major obstacles and these have had an impact on the spectacular growth we have seen in their numbers in recent years.
This report contains the results of the ScaleUp Institute’s third annual analysis of scaleup growth and performance both national and local, based on ONS 2018 data – the most recent available. It also builds on a joint project with Arup to identify the drivers of local scaleup growth through in-depth structured interviews with scaleup leaders and innovative research.
Our evidence is not just designed to improve our collective understanding of the scaleup landscape. The ScaleUp Institute will use it to shape and promote interventions that can help the creation and nurture the development of businesses that are central to the health of the economy.
The top-line finding is that the number of scaleups fell in 2018, driven by an 11% drop in the number scaling by turnover (albeit this masks growth in employment scaleups and those doing both). As a picture of 2018, this fall may reflect the uncertainty surrounding Brexit and the increasing barriers that scaleups tell us they face in gaining access to markets and to customers both at home and abroad. It is a clear signal that complacency is not an option.
Urgent action is vital at national and local level to help scaleups survive this current global crisis because their survival and growth are at the core of future prosperity.
Why do we say that? Very significant positives emerge from the 2018 data. With the UK number of scaleups at 33,860 the total is still 25% higher than it was in 2013 and these high-growth companies continue to outperform the economy and small businesses. In the same period – 2013 to 2018 - GDP grew by just 11% and the number of SMEs by 16%.
There was a rise in the number of employment scaleups and in scaleups growing by both employment and turnover. Jobs provided by scaleups also grew to 3.5 million.
This year, for the first time, we have also been able to identify a substantial pipeline of scaling companies who fall just outside the definition of a scaleup. In 2018 there were 16,890 businesses in this category employing 1.9 million people and generating £592 billion in turnover. Scaling companies may represent an important source of future jobs as proportionately they are stronger in the employment measurement.
ACKNOWLEDGEMENTS
Our thanks to our partners, supporters and contributors to this document.
Report design by NEO and StudioTM www.neoposition.com www.studiotm.design
Data used in this report is taken from the IDBR datasets 2010-2017. The confidentiality of all data held on the IDBR is protected by the National Statistics Code of Practice and associated Protocols and by specific legislation. In accordance with these requirements, data presented is rounded to prevent disclosure. Differences may exist in totals across tables due to disclosure methods used. This work contains statistical data from ONS which is Crown Copyright.
The use of the ONS statistical data in this work does not imply the endorsement of the ONS in relation to the interpretation or analysis of the statistical data.
This work uses research datasets which may not exactly reproduce National Statistics aggregates.
Published by the ScaleUp Institute 101 Euston Road, London, NW1 2RA
Any enquiries relating to this Review or the work of the ScaleUp Institute should be sent to: [email protected] This document can be accessed at: https://www.scaleupinstitute.org.uk/reports /the-scaleup-landscape-2020/
www.scaleupinstitute.org.uk @scaleupinst
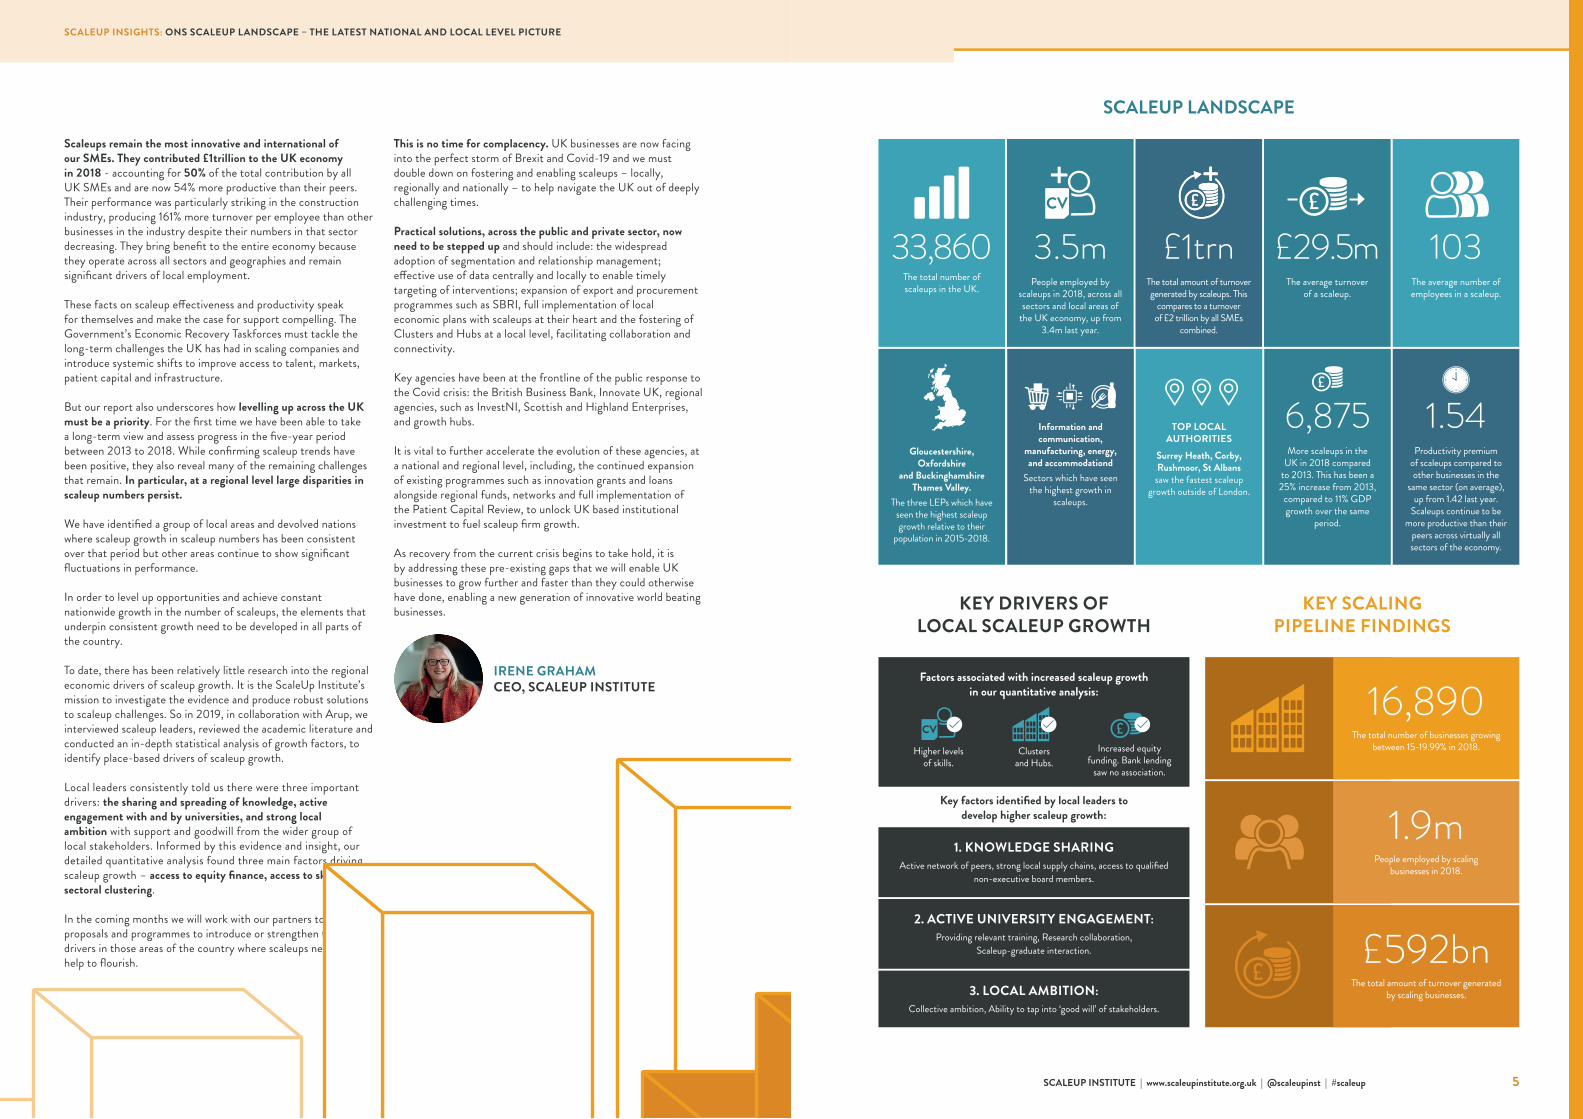
Key factors identified by local leaders to develop higher scaleup growth:
1. KNOWLEDGE SHARING Active network of peers, strong local supply chains, access to qualified
non-executive board members.
2. ACTIVE UNIVERSITY ENGAGEMENT: Providing relevant training, Research collaboration,
Scaleup-graduate interaction.
3. LOCAL AMBITION: Collective ambition, Ability to tap into ‘good will’ of stakeholders.
Factors associated with increased scaleup growth in our quantitative analysis:
Higher levels of skills.
Clusters and Hubs.
Increased equity funding. Bank lending
saw no association.
This is no time for complacency. UK businesses are now facing into the perfect storm of Brexit and Covid-19 and we must double down on fostering and enabling scaleups – locally, regionally and nationally – to help navigate the UK out of deeply challenging times.
Practical solutions, across the public and private sector, now need to be stepped up and should include: the widespread adoption of segmentation and relationship management; effective use of data centrally and locally to enable timely targeting of interventions; expansion of export and procurement programmes such as SBRI, full implementation of local economic plans with scaleups at their heart and the fostering of Clusters and Hubs at a local level, facilitating collaboration and connectivity.
Key agencies have been at the frontline of the public response to the Covid crisis: the British Business Bank, Innovate UK, regional agencies, such as InvestNI, Scottish and Highland Enterprises, and growth hubs.
It is vital to further accelerate the evolution of these agencies, at a national and regional level, including, the continued expansion of existing programmes such as innovation grants and loans alongside regional funds, networks and full implementation of the Patient Capital Review, to unlock UK based institutional investment to fuel scaleup firm growth.
As recovery from the current crisis begins to take hold, it is by addressing these pre-existing gaps that we will enable UK businesses to grow further and faster than they could otherwise have done, enabling a new generation of innovative world beating businesses.
IRENE GRAHAM CEO, SCALEUP INSTITUTE
Scaleups remain the most innovative and international of our SMEs. They contributed £1trillion to the UK economy in 2018 - accounting for 50% of the total contribution by all UK SMEs and are now 54% more productive than their peers. Their performance was particularly striking in the construction industry, producing 161% more turnover per employee than other businesses in the industry despite their numbers in that sector decreasing. They bring benefit to the entire economy because they operate across all sectors and geographies and remain significant drivers of local employment.
These facts on scaleup effectiveness and productivity speak for themselves and make the case for support compelling. The Government’s Economic Recovery Taskforces must tackle the long-term challenges the UK has had in scaling companies and introduce systemic shifts to improve access to talent, markets, patient capital and infrastructure. But our report also underscores how levelling up across the UK must be a priority. For the first time we have been able to take a long-term view and assess progress in the five-year period between 2013 to 2018. While confirming scaleup trends have been positive, they also reveal many of the remaining challenges that remain. In particular, at a regional level large disparities in scaleup numbers persist.
We have identified a group of local areas and devolved nations where scaleup growth in scaleup numbers has been consistent over that period but other areas continue to show significant fluctuations in performance.
In order to level up opportunities and achieve constant nationwide growth in the number of scaleups, the elements that underpin consistent growth need to be developed in all parts of the country.
To date, there has been relatively little research into the regional economic drivers of scaleup growth. It is the ScaleUp Institute’s mission to investigate the evidence and produce robust solutions to scaleup challenges. So in 2019, in collaboration with Arup, we interviewed scaleup leaders, reviewed the academic literature and conducted an in-depth statistical analysis of growth factors, to identify place-based drivers of scaleup growth.
Local leaders consistently told us there were three important drivers: the sharing and spreading of knowledge, active engagement with and by universities, and strong local ambition with support and goodwill from the wider group of local stakeholders. Informed by this evidence and insight, our detailed quantitative analysis found three main factors driving scaleup growth – access to equity finance, access to skills and sectoral clustering.
In the coming months we will work with our partners to develop proposals and programmes to introduce or strengthen these drivers in those areas of the country where scaleups need more help to flourish.
4 5AUGUST 2020 SCALEUP INSTITUTE | www.scaleupinstitute.org.uk | @scaleupinst | #scaleup
33,860The total number of scaleups in the UK.
103 The average number of employees in a scaleup.
3.5mPeople employed by
scaleups in 2018, across all sectors and local areas of
the UK economy, up from 3.4m last year.
£1trnThe total amount of turnover generated by scaleups. This
compares to a turnover of £2 trillion by all SMEs
combined.
£29.5m The average turnover
of a scaleup.
TOP LOCAL
AUTHORITIES Surrey Heath, Corby, Rushmoor, St Albans
saw the fastest scaleup growth outside of London.
Gloucestershire, Oxfordshire
and Buckinghamshire Thames Valley.
The three LEPs which have seen the highest scaleup growth relative to their
population in 2015-2018.
Information and communication,
manufacturing, energy, and accommodationd
Sectors which have seen the highest growth in
scaleups.
6,875More scaleups in the
UK in 2018 compared to 2013. This has been a 25% increase from 2013,
compared to 11% GDP growth over the same
period.
1.54
Productivity premium of scaleups compared to other businesses in the
same sector (on average), up from 1.42 last year.
Scaleups continue to be more productive than their
peers across virtually all sectors of the economy.
SCALEUP INSIGHTS: ONS SCALEUP LANDSCAPE – THE LATEST NATIONAL AND LOCAL LEVEL PICTURE
SCALEUP LANDSCAPE
KEY DRIVERS OF LOCAL SCALEUP GROWTH
KEY SCALING PIPELINE FINDINGS
16,890The total number of businesses growing
between 15-19.99% in 2018.
1.9m People employed by scaling
businesses in 2018.
£592bn The total amount of turnover generated
by scaling businesses.
36,510IN 2017
26,985IN 2013
27,490IN 2014
31,440IN 2015
35,210IN 2016
TOTAL NO. OF SCALEUPS
12.495IN 2013
12,180IN 2015
13,665IN 2016
14,190IN 2014
BY EMPLOYEE GROWTH
BY TURNOVER GROWTH
BY EMPLOYMENT AND TURNOVER
20,195IN 2013
25,530IN 2015
28,970IN 2016
19,610IN 2014
5,705IN 2013
6,270IN 2015
6,310IN 2014
7,425IN 2016
7,305IN 2017
13,165IN 2017
30,650IN 2017
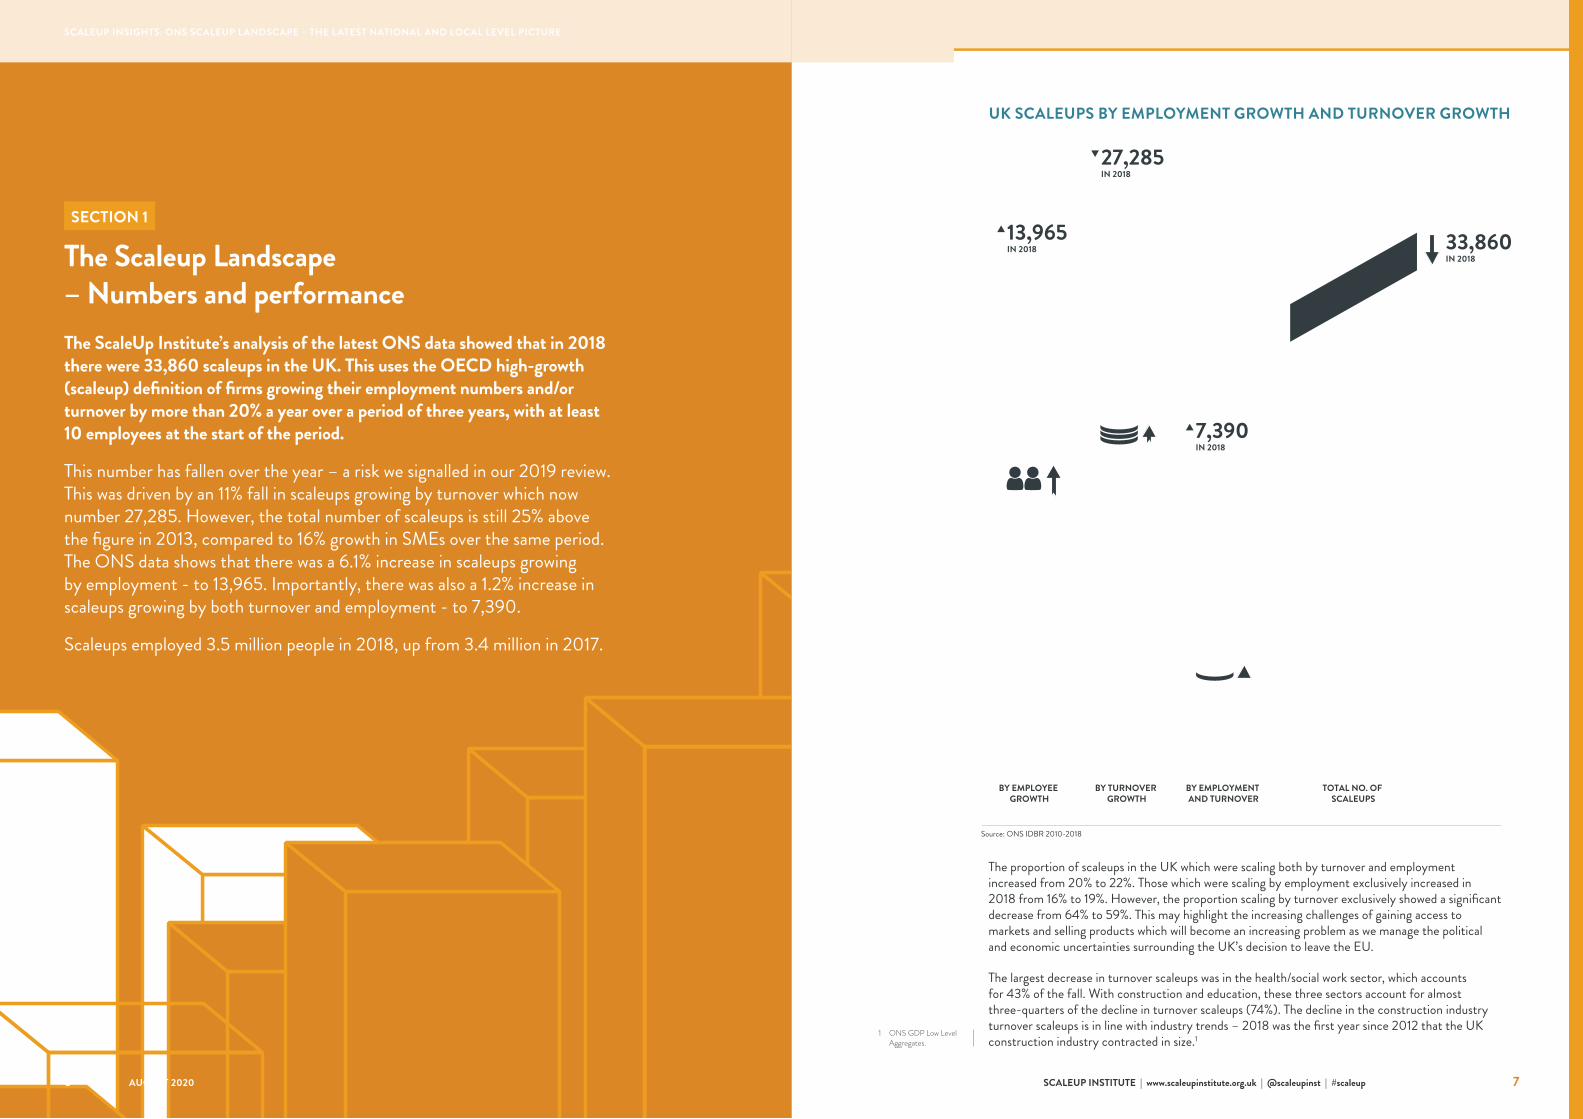
13,965 IN 2018
27,285 IN 2018
7,390 IN 2018
33,860 IN 2018
UK SCALEUPS BY EMPLOYMENT GROWTH AND TURNOVER GROWTH
The proportion of scaleups in the UK which were scaling both by turnover and employment increased from 20% to 22%. Those which were scaling by employment exclusively increased in 2018 from 16% to 19%. However, the proportion scaling by turnover exclusively showed a significant decrease from 64% to 59%. This may highlight the increasing challenges of gaining access to markets and selling products which will become an increasing problem as we manage the political and economic uncertainties surrounding the UK’s decision to leave the EU.
The largest decrease in turnover scaleups was in the health/social work sector, which accounts for 43% of the fall. With construction and education, these three sectors account for almost three-quarters of the decline in turnover scaleups (74%). The decline in the construction industry turnover scaleups is in line with industry trends – 2018 was the first year since 2012 that the UK construction industry contracted in size.1
Source: ONS IDBR 2010-2018
1 ONS GDP Low Level Aggregates.
7SCALEUP INSTITUTE | www.scaleupinstitute.org.uk | @scaleupinst | #scaleup6 AUGUST 2020
The ScaleUp Institute’s analysis of the latest ONS data showed that in 2018 there were 33,860 scaleups in the UK. This uses the OECD high-growth (scaleup) definition of firms growing their employment numbers and/or turnover by more than 20% a year over a period of three years, with at least 10 employees at the start of the period.
This number has fallen over the year – a risk we signalled in our 2019 review. This was driven by an 11% fall in scaleups growing by turnover which now number 27,285. However, the total number of scaleups is still 25% above the figure in 2013, compared to 16% growth in SMEs over the same period. The ONS data shows that there was a 6.1% increase in scaleups growing by employment - to 13,965. Importantly, there was also a 1.2% increase in scaleups growing by both turnover and employment - to 7,390.
Scaleups employed 3.5 million people in 2018, up from 3.4 million in 2017.
SECTION 1 The Scaleup Landscape – Numbers and performance
SCALEUP INSIGHTS: ONS SCALEUP LANDSCAPE – THE LATEST NATIONAL AND LOCAL LEVEL PICTURE
2013
100%
80%
60%
40%
20%
10%2014 2015 2016 2017 2018
TurnoverEmploymentTurnover and Employment
21%
25%
54%
23%
29%
48%
20%
19%
61%
21%
18%
61%
20%
16%
64%
22%
19%
59%
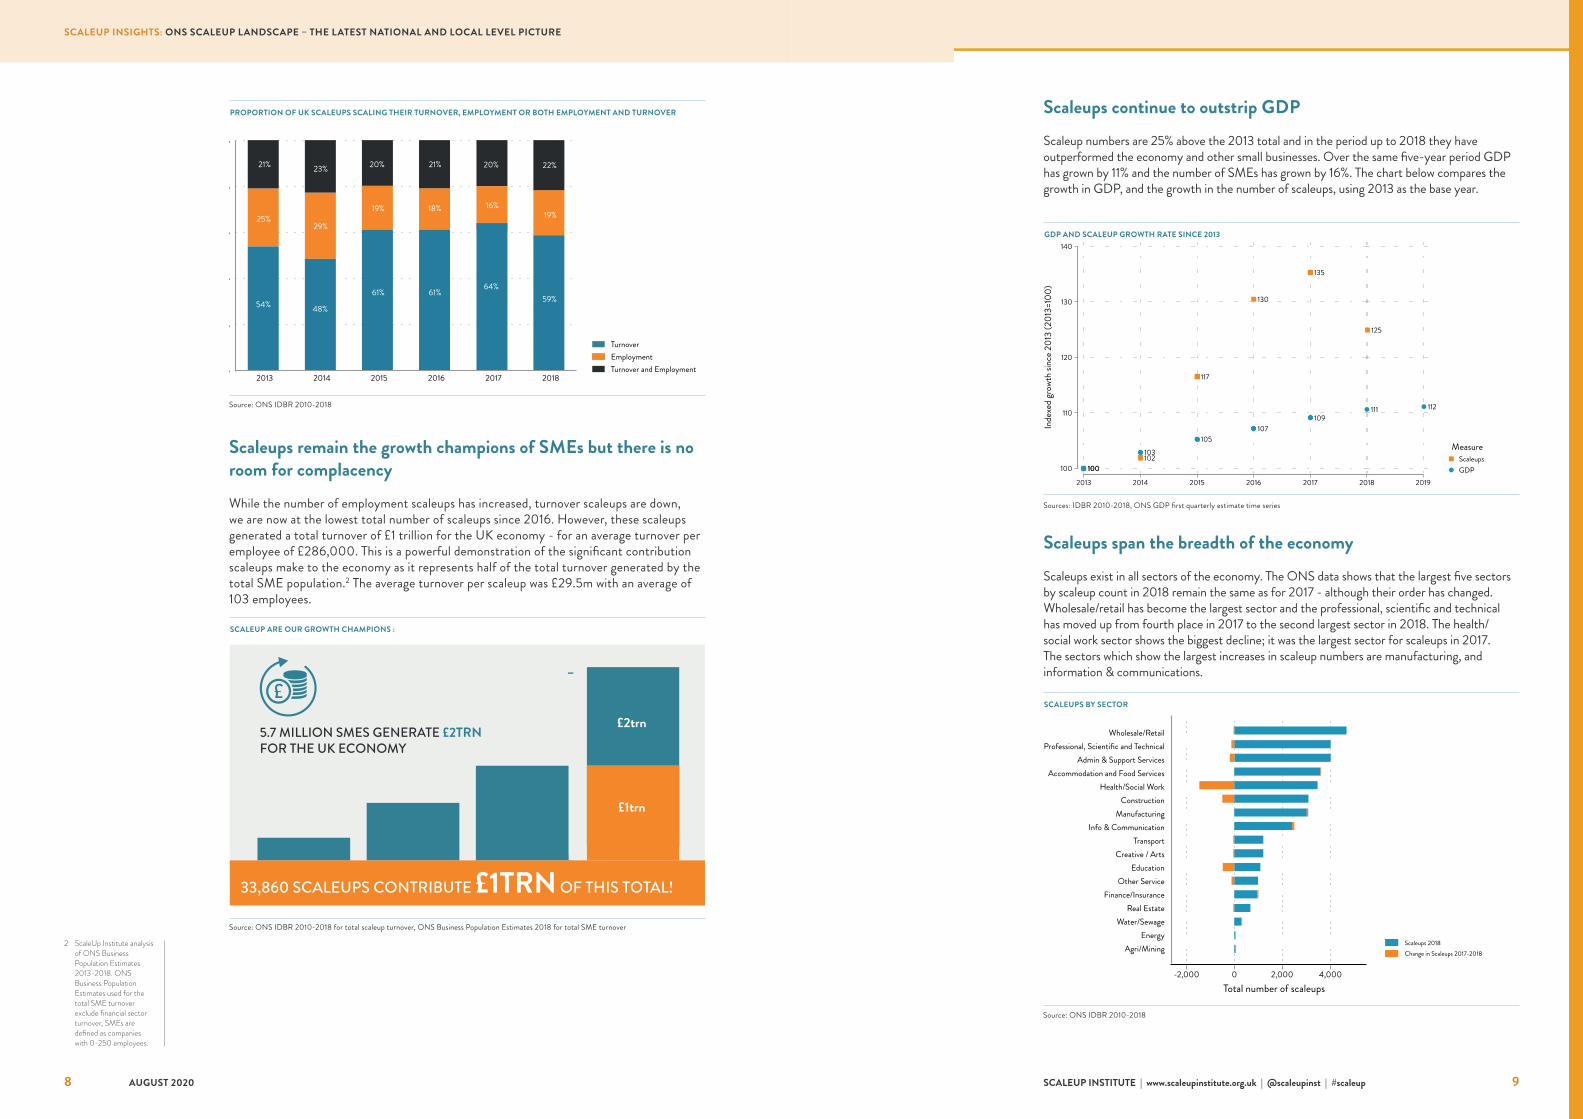
PROPORTION OF UK SCALEUPS SCALING THEIR TURNOVER, EMPLOYMENT OR BOTH EMPLOYMENT AND TURNOVER
Source: ONS IDBR 2010-2018
Scaleups continue to outstrip GDP Scaleup numbers are 25% above the 2013 total and in the period up to 2018 they have outperformed the economy and other small businesses. Over the same five-year period GDP has grown by 11% and the number of SMEs has grown by 16%. The chart below compares the growth in GDP, and the growth in the number of scaleups, using 2013 as the base year.
Scaleups span the breadth of the economy Scaleups exist in all sectors of the economy. The ONS data shows that the largest five sectors by scaleup count in 2018 remain the same as for 2017 - although their order has changed. Wholesale/retail has become the largest sector and the professional, scientific and technical has moved up from fourth place in 2017 to the second largest sector in 2018. The health/social work sector shows the biggest decline; it was the largest sector for scaleups in 2017. The sectors which show the largest increases in scaleup numbers are manufacturing, and information & communications.
2 ScaleUp Institute analysis of ONS Business Population Estimates 2013-2018. ONS Business Population Estimates used for the total SME turnover exclude financial sector turnover, SMEs are defined as companies with 0-250 employees.
100102
117
130
135
100
103
105107
109111
100
110
120
130
140
Inde
xed
grow
th si
nce 2
013
(201
3=10
0)
2013 2014 2015 2016 2017 2018 2019
ScaleupsGDP
Measure
125
112
GDP AND SCALEUP GROWTH RATE SINCE 2013
Scaleups remain the growth champions of SMEs but there is no room for complacency While the number of employment scaleups has increased, turnover scaleups are down, we are now at the lowest total number of scaleups since 2016. However, these scaleups generated a total turnover of £1 trillion for the UK economy - for an average turnover per employee of £286,000. This is a powerful demonstration of the significant contribution scaleups make to the economy as it represents half of the total turnover generated by the total SME population.2 The average turnover per scaleup was £29.5m with an average of 103 employees.
Sources: IDBR 2010-2018, ONS GDP first quarterly estimate time series
SCALEUP ARE OUR GROWTH CHAMPIONS :
£2trn
£1trn
5.7 MILLION SMES GENERATE £2TRN FOR THE UK ECONOMY
33,860 SCALEUPS CONTRIBUTE £1TRN OF THIS TOTAL!
Source: ONS IDBR 2010-2018 for total scaleup turnover, ONS Business Population Estimates 2018 for total SME turnover
SCALEUPS BY SECTOR
Source: ONS IDBR 2010-2018
-2,000 0 2,000 4,000Total number of scaleups
Agri/MiningEnergy
Water/SewageReal Estate
Finance/InsuranceOther Service
EducationCreative / Arts
TransportInfo & Communication
ManufacturingConstruction
Health/Social WorkAccommodation and Food Services
Admin & Support ServicesProfessional, Scientific and Technical
Wholesale/Retail
Scaleups 2018Change in Scaleups 2017-2018
8 9
SCALEUP INSIGHTS: ONS SCALEUP LANDSCAPE – THE LATEST NATIONAL AND LOCAL LEVEL PICTURE
AUGUST 2020 SCALEUP INSTITUTE | www.scaleupinstitute.org.uk | @scaleupinst | #scaleup
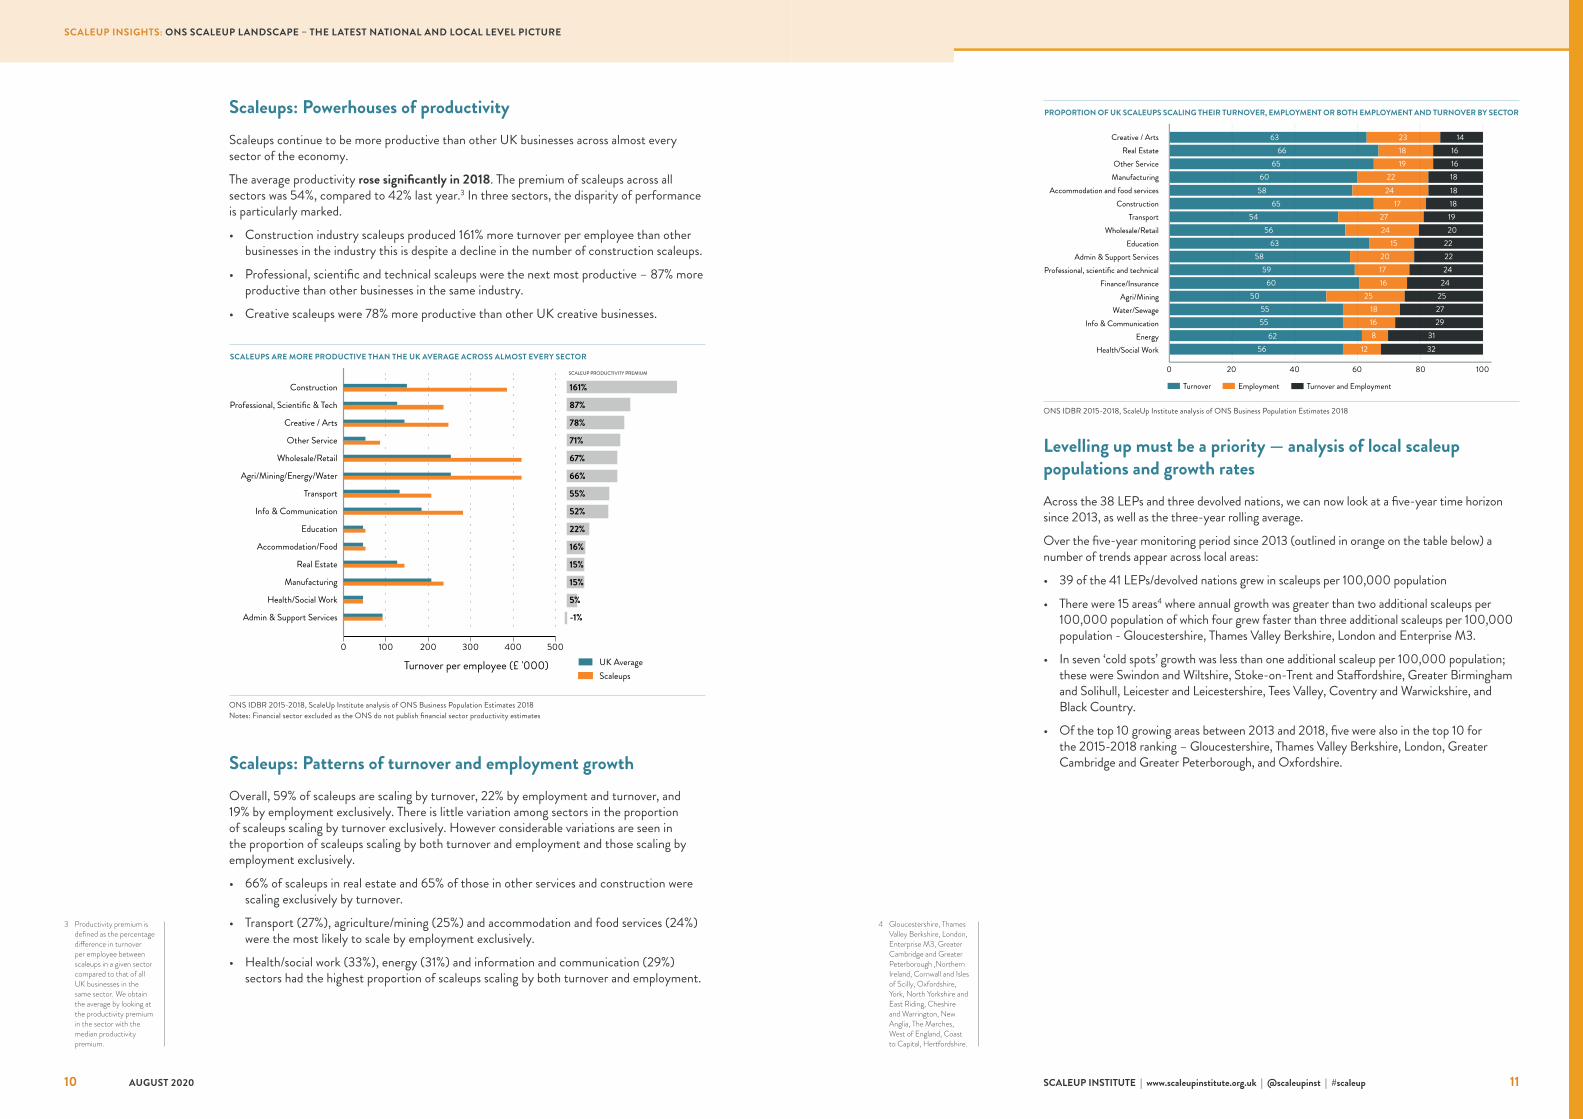
Scaleups: Powerhouses of productivity Scaleups continue to be more productive than other UK businesses across almost every sector of the economy.
The average productivity rose significantly in 2018. The premium of scaleups across all sectors was 54%, compared to 42% last year.3 In three sectors, the disparity of performance is particularly marked.
• Construction industry scaleups produced 161% more turnover per employee than other businesses in the industry this is despite a decline in the number of construction scaleups.
• Professional, scientific and technical scaleups were the next most productive – 87% more productive than other businesses in the same industry.
• Creative scaleups were 78% more productive than other UK creative businesses.
Scaleups: Patterns of turnover and employment growth Overall, 59% of scaleups are scaling by turnover, 22% by employment and turnover, and 19% by employment exclusively. There is little variation among sectors in the proportion of scaleups scaling by turnover exclusively. However considerable variations are seen in the proportion of scaleups scaling by both turnover and employment and those scaling by employment exclusively.
• 66% of scaleups in real estate and 65% of those in other services and construction were scaling exclusively by turnover.
• Transport (27%), agriculture/mining (25%) and accommodation and food services (24%) were the most likely to scale by employment exclusively.
• Health/social work (33%), energy (31%) and information and communication (29%) sectors had the highest proportion of scaleups scaling by both turnover and employment.
Levelling up must be a priority — analysis of local scaleup populations and growth ratesAcross the 38 LEPs and three devolved nations, we can now look at a five-year time horizon since 2013, as well as the three-year rolling average.
Over the five-year monitoring period since 2013 (outlined in orange on the table below) a number of trends appear across local areas:
• 39 of the 41 LEPs/devolved nations grew in scaleups per 100,000 population
• There were 15 areas4 where annual growth was greater than two additional scaleups per 100,000 population of which four grew faster than three additional scaleups per 100,000 population - Gloucestershire, Thames Valley Berkshire, London and Enterprise M3.
• In seven ‘cold spots’ growth was less than one additional scaleup per 100,000 population; these were Swindon and Wiltshire, Stoke-on-Trent and Staffordshire, Greater Birmingham and Solihull, Leicester and Leicestershire, Tees Valley, Coventry and Warwickshire, and Black Country.
• Of the top 10 growing areas between 2013 and 2018, five were also in the top 10 for the 2015-2018 ranking – Gloucestershire, Thames Valley Berkshire, London, Greater Cambridge and Greater Peterborough, and Oxfordshire.
3 Productivity premium is defined as the percentage difference in turnover per employee between scaleups in a given sector compared to that of all UK businesses in the same sector. We obtain the average by looking at the productivity premium in the sector with the median productivity premium.
4 Gloucestershire, Thames Valley Berkshire, London, Enterprise M3, Greater Cambridge and Greater Peterborough ,Northern Ireland, Cornwall and Isles of Scilly, Oxfordshire, York, North Yorkshire and East Riding, Cheshire and Warrington, New Anglia, The Marches, West of England, Coast to Capital, Hertfordshire.
PROPORTION OF UK SCALEUPS SCALING THEIR TURNOVER, EMPLOYMENT OR BOTH EMPLOYMENT AND TURNOVER BY SECTOR
ONS IDBR 2015-2018, ScaleUp Institute analysis of ONS Business Population Estimates 2018
0 20 40 60 80 100
Turnover Employment Turnover and Employment
Health/Social WorkEnergy
Info & CommunicationWater/Sewage
Agri/MiningFinance/Insurance
Professional, scientific and technicalAdmin & Support Services
EducationWholesale/Retail
TransportConstruction
Accommodation and food servicesManufacturingOther Service
Real EstateCreative / Arts 63 23 14
66 18 1665 19 16
60 22 1858 24 18
65 17 1854 27 19
56 24 2063 15 22
58 20 2259 17 24
60 16 2450 25 25
55 18 2755 16 29
62 8 3156 12 32
SCALEUPS ARE MORE PRODUCTIVE THAN THE UK AVERAGE ACROSS ALMOST EVERY SECTOR
ONS IDBR 2015-2018, ScaleUp Institute analysis of ONS Business Population Estimates 2018Notes: Financial sector excluded as the ONS do not publish financial sector productivity estimates
0 100 200 300 400 500
Turnover per employee (£ '000)
Admin & Support Services
Health/Social Work
Manufacturing
Real Estate
Accommodation/Food
Education
Info & Communication
Transport
Agri/Mining/Energy/Water
Wholesale/Retail
Other Service
Creative / Arts
Professional, Scientific & Tech
ConstructionSCALEUP PRODUCTIVITY PREMIUM
161%
87%
78%
71%
67%
66%
55%
52%
22%
16%
15%
15%
5%
UK AverageScaleups
-1%
10 11
SCALEUP INSIGHTS: ONS SCALEUP LANDSCAPE – THE LATEST NATIONAL AND LOCAL LEVEL PICTURE
AUGUST 2020 SCALEUP INSTITUTE | www.scaleupinstitute.org.uk | @scaleupinst | #scaleup
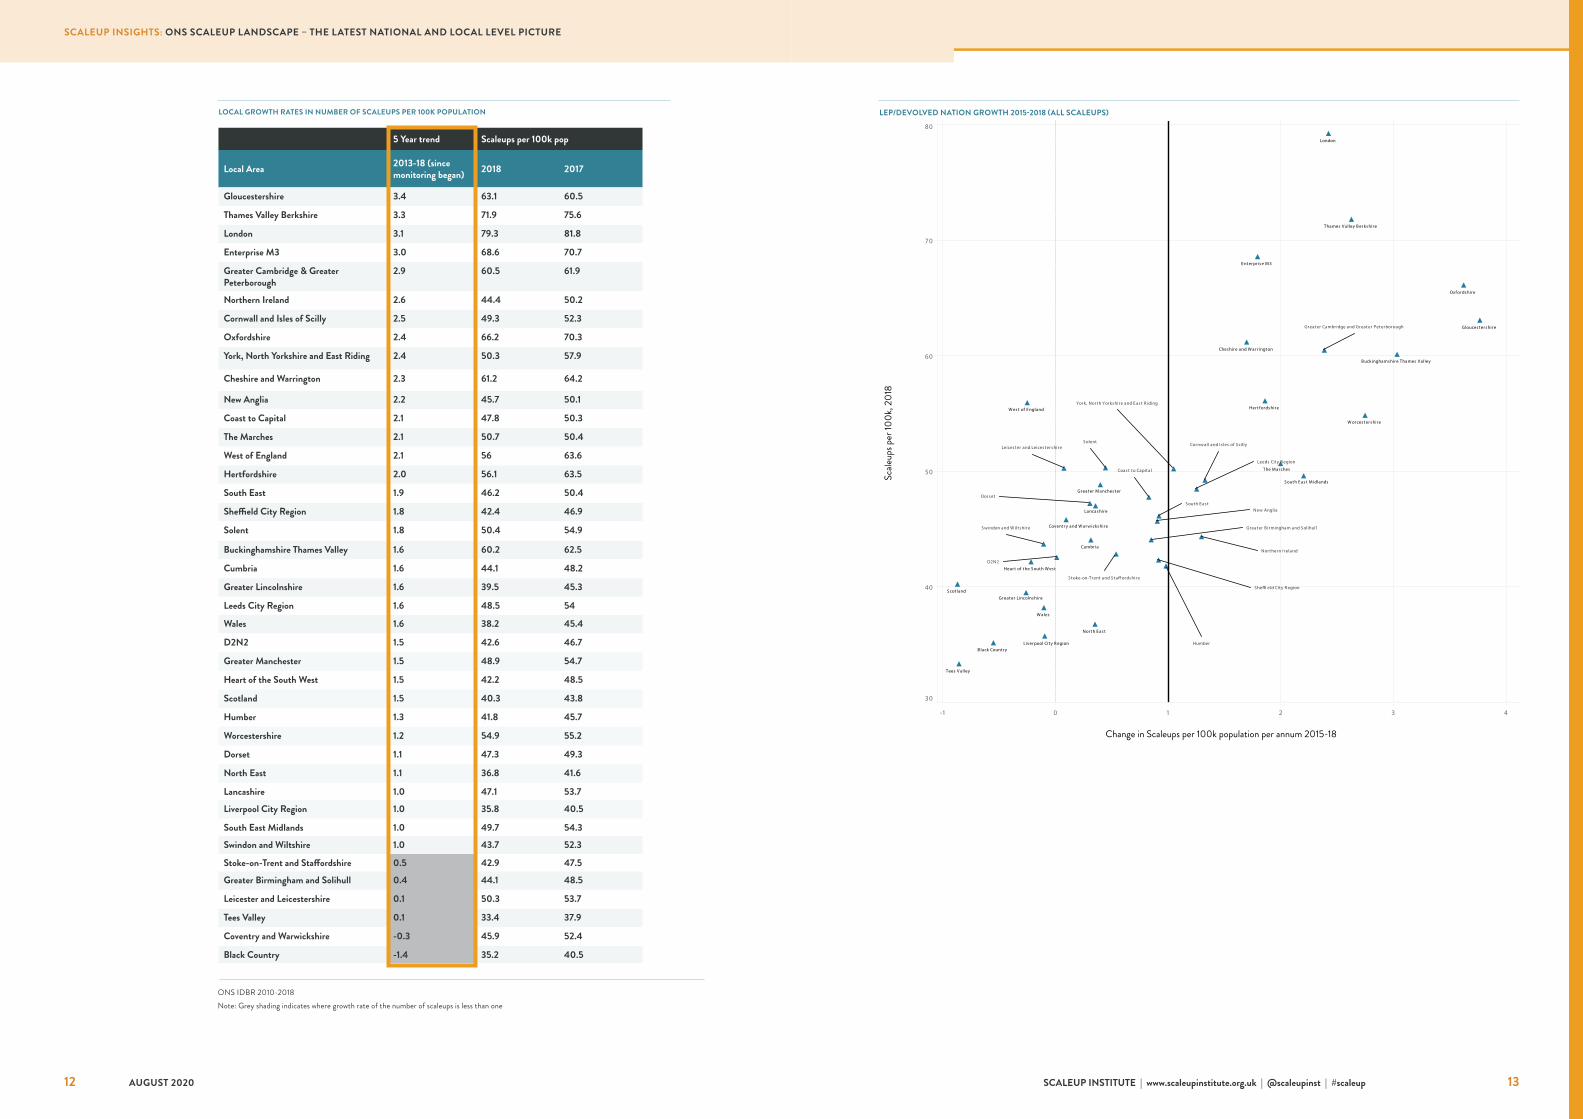
LOCAL GROWTH RATES IN NUMBER OF SCALEUPS PER 100K POPULATION
5 Year trend Scaleups per 100k pop
Local Area 2013-18 (since monitoring began) 2018 2017
Gloucestershire 3.4 63.1 60.5
Thames Valley Berkshire 3.3 71.9 75.6
London 3.1 79.3 81.8
Enterprise M3 3.0 68.6 70.7
Greater Cambridge & Greater Peterborough
2.9 60.5 61.9
Northern Ireland 2.6 44.4 50.2
Cornwall and Isles of Scilly 2.5 49.3 52.3
Oxfordshire 2.4 66.2 70.3
York, North Yorkshire and East Riding 2.4 50.3 57.9
Cheshire and Warrington 2.3 61.2 64.2
New Anglia 2.2 45.7 50.1
Coast to Capital 2.1 47.8 50.3
The Marches 2.1 50.7 50.4
West of England 2.1 56 63.6
Hertfordshire 2.0 56.1 63.5
South East 1.9 46.2 50.4
Sheffield City Region 1.8 42.4 46.9
Solent 1.8 50.4 54.9
Buckinghamshire Thames Valley 1.6 60.2 62.5
Cumbria 1.6 44.1 48.2
Greater Lincolnshire 1.6 39.5 45.3
Leeds City Region 1.6 48.5 54
Wales 1.6 38.2 45.4
D2N2 1.5 42.6 46.7
Greater Manchester 1.5 48.9 54.7
Heart of the South West 1.5 42.2 48.5
Scotland 1.5 40.3 43.8
Humber 1.3 41.8 45.7
Worcestershire 1.2 54.9 55.2
Dorset 1.1 47.3 49.3
North East 1.1 36.8 41.6
Lancashire 1.0 47.1 53.7
Liverpool City Region 1.0 35.8 40.5
South East Midlands 1.0 49.7 54.3
Swindon and Wiltshire 1.0 43.7 52.3
Stoke-on-Trent and Staffordshire 0.5 42.9 47.5
Greater Birmingham and Solihull 0.4 44.1 48.5
Leicester and Leicestershire 0.1 50.3 53.7
Tees Valley 0.1 33.4 37.9
Coventry and Warwickshire -0.3 45.9 52.4
Black Country -1.4 35.2 40.5
ONS IDBR 2010-2018Note: Grey shading indicates where growth rate of the number of scaleups is less than one
LEP/DEVOLVED NATION GROWTH 2015-2018 (ALL SCALEUPS)
Change in Scaleups per 100k population per annum 2015-18
Scale
ups p
er 10
0k, 2
018
12 13
SCALEUP INSIGHTS: ONS SCALEUP LANDSCAPE – THE LATEST NATIONAL AND LOCAL LEVEL PICTURE
AUGUST 2020 SCALEUP INSTITUTE | www.scaleupinstitute.org.uk | @scaleupinst | #scaleup
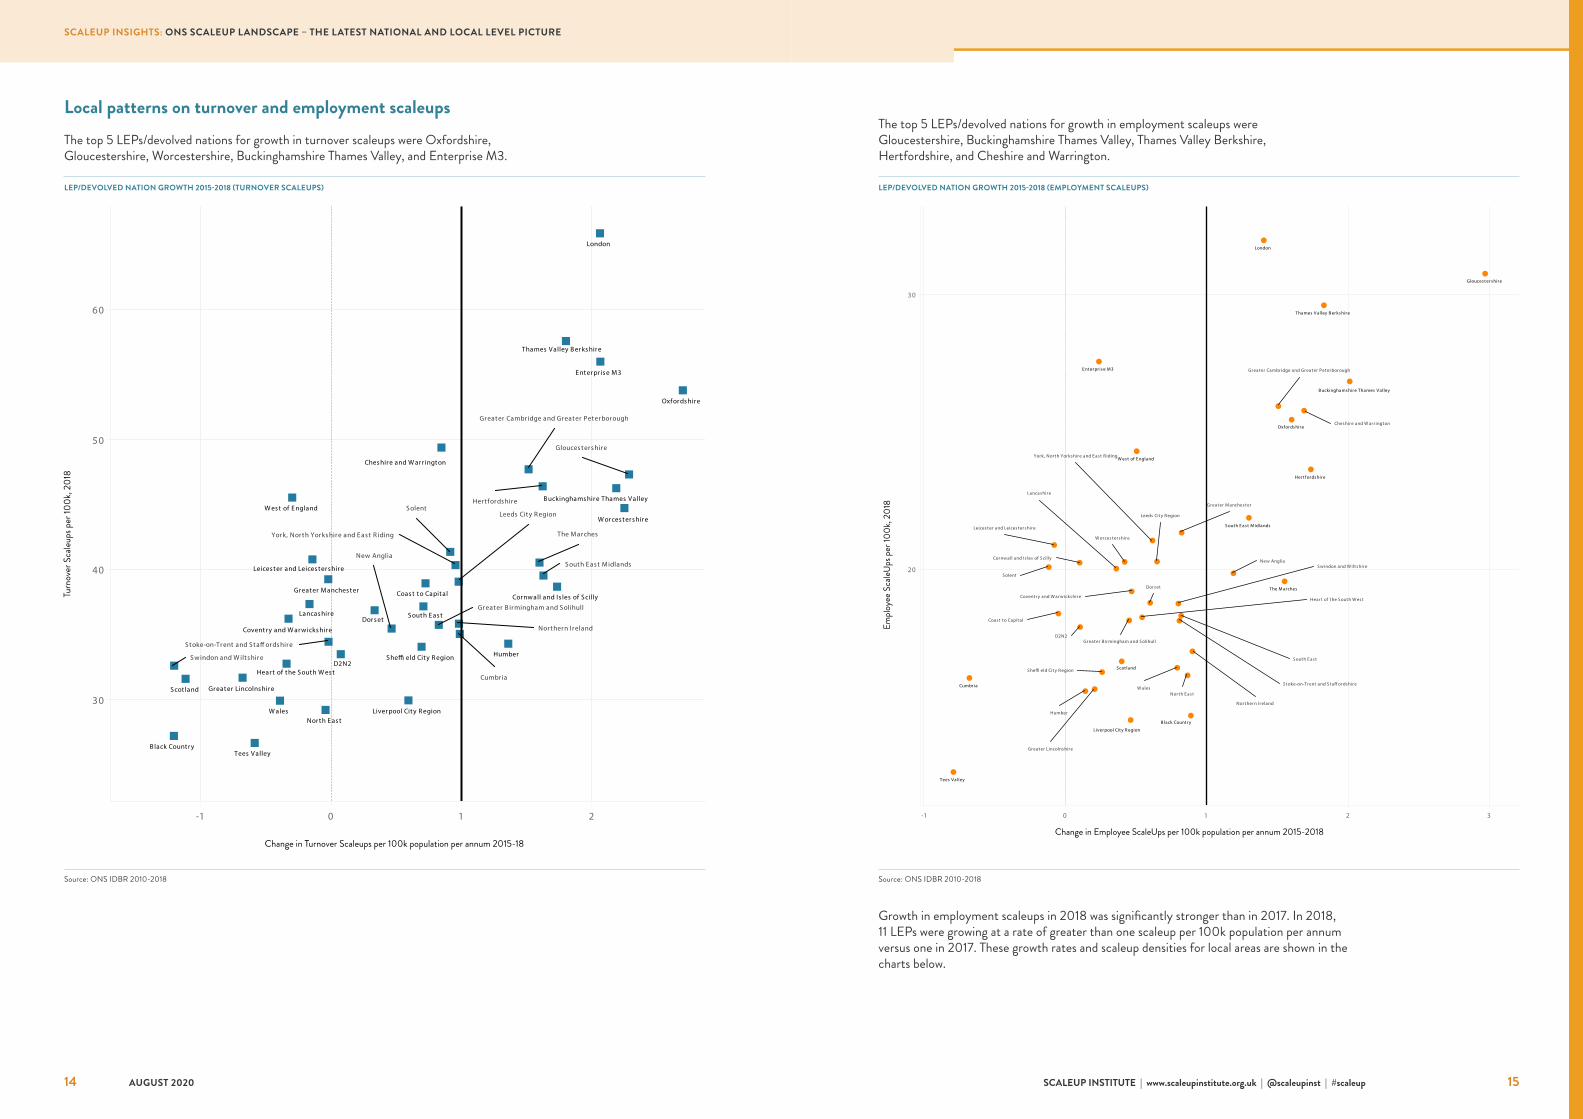
The top 5 LEPs/devolved nations for growth in employment scaleups were Gloucestershire, Buckinghamshire Thames Valley, Thames Valley Berkshire, Hertfordshire, and Cheshire and Warrington.
Change in Employee ScaleUps per 100k population per annum 2015-2018
Emplo
yee S
caleU
ps p
er 10
0k, 2
018
LEP/DEVOLVED NATION GROWTH 2015-2018 (EMPLOYMENT SCALEUPS)
Local patterns on turnover and employment scaleupsThe top 5 LEPs/devolved nations for growth in turnover scaleups were Oxfordshire, Gloucestershire, Worcestershire, Buckinghamshire Thames Valley, and Enterprise M3.
Change in Turnover Scaleups per 100k population per annum 2015-18
Turn
over
Sca
leups
per
100k
, 201
8
Source: ONS IDBR 2010-2018 Source: ONS IDBR 2010-2018
LEP/DEVOLVED NATION GROWTH 2015-2018 (TURNOVER SCALEUPS)
Growth in employment scaleups in 2018 was significantly stronger than in 2017. In 2018, 11 LEPs were growing at a rate of greater than one scaleup per 100k population per annum versus one in 2017. These growth rates and scaleup densities for local areas are shown in the charts below.
14 15
SCALEUP INSIGHTS: ONS SCALEUP LANDSCAPE – THE LATEST NATIONAL AND LOCAL LEVEL PICTURE
AUGUST 2020 SCALEUP INSTITUTE | www.scaleupinstitute.org.uk | @scaleupinst | #scaleup
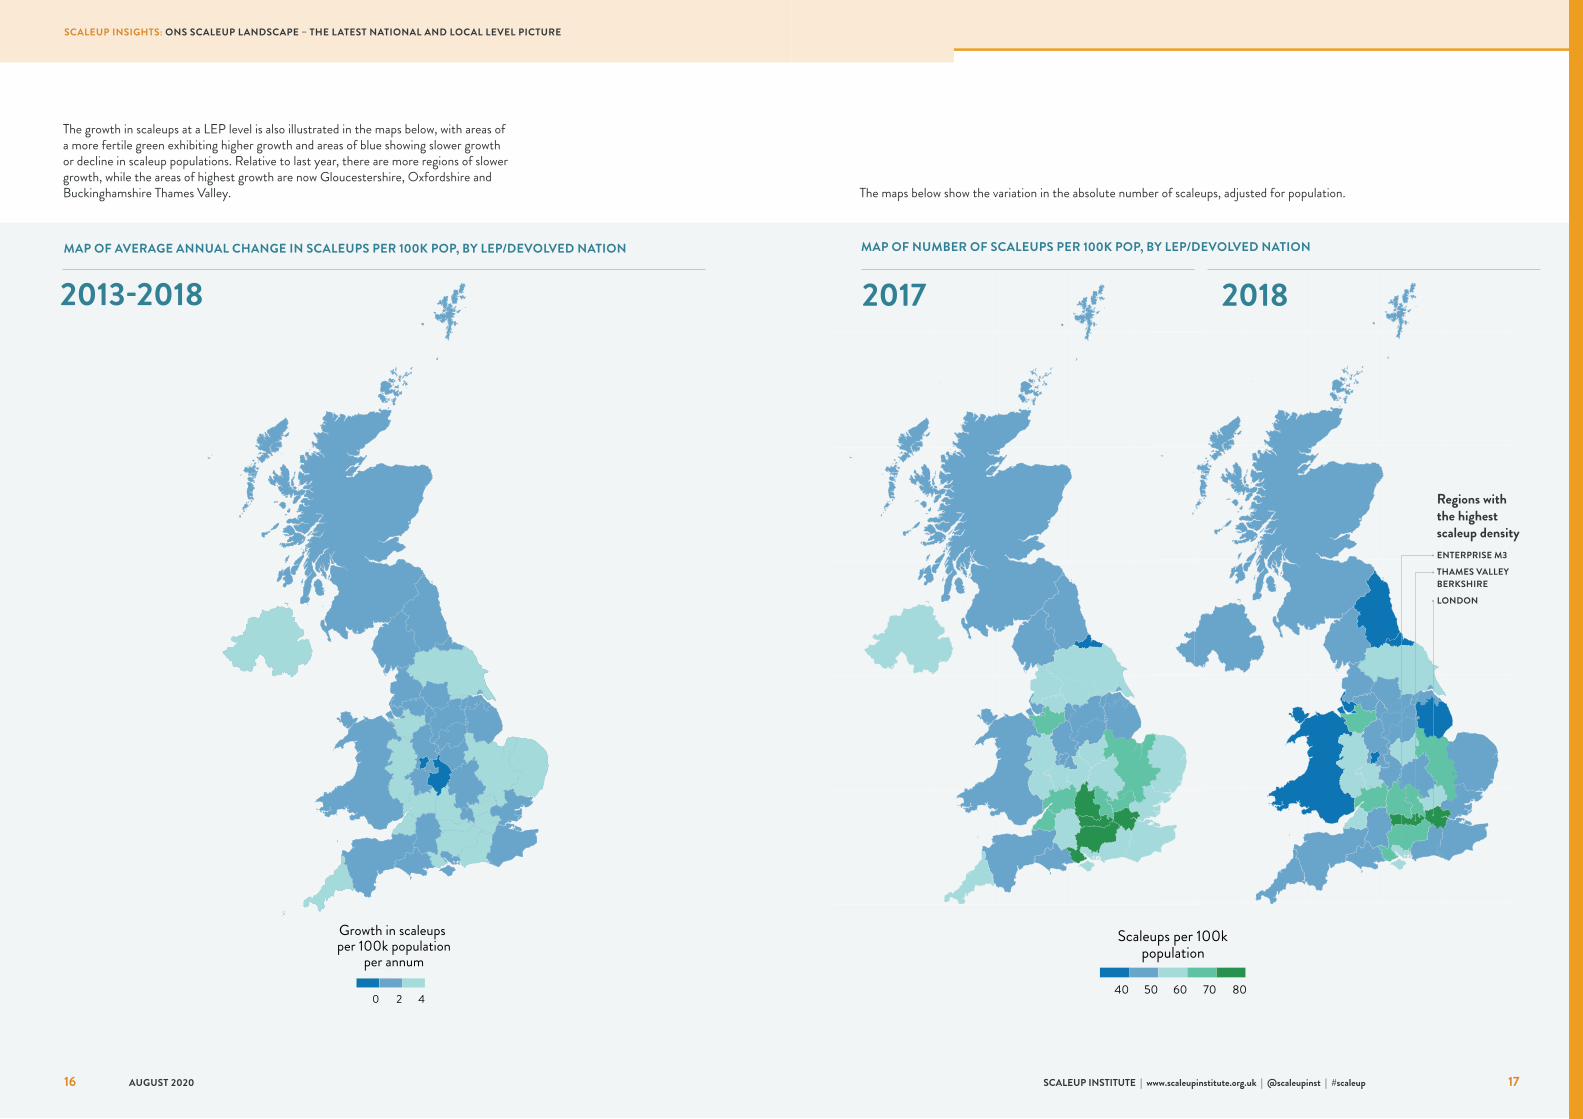
The growth in scaleups at a LEP level is also illustrated in the maps below, with areas of a more fertile green exhibiting higher growth and areas of blue showing slower growth or decline in scaleup populations. Relative to last year, there are more regions of slower growth, while the areas of highest growth are now Gloucestershire, Oxfordshire and Buckinghamshire Thames Valley. The maps below show the variation in the absolute number of scaleups, adjusted for population.
MAP OF NUMBER OF SCALEUPS PER 100K POP, BY LEP/DEVOLVED NATION
2017 2018
Regions with the highest scaleup densityENTERPRISE M3
THAMES VALLEY BERKSHIRE
LONDON
MAP OF AVERAGE ANNUAL CHANGE IN SCALEUPS PER 100K POP, BY LEP/DEVOLVED NATION
2013-2018
16 17
SCALEUP INSIGHTS: ONS SCALEUP LANDSCAPE – THE LATEST NATIONAL AND LOCAL LEVEL PICTURE
AUGUST 2020 SCALEUP INSTITUTE | www.scaleupinstitute.org.uk | @scaleupinst | #scaleup
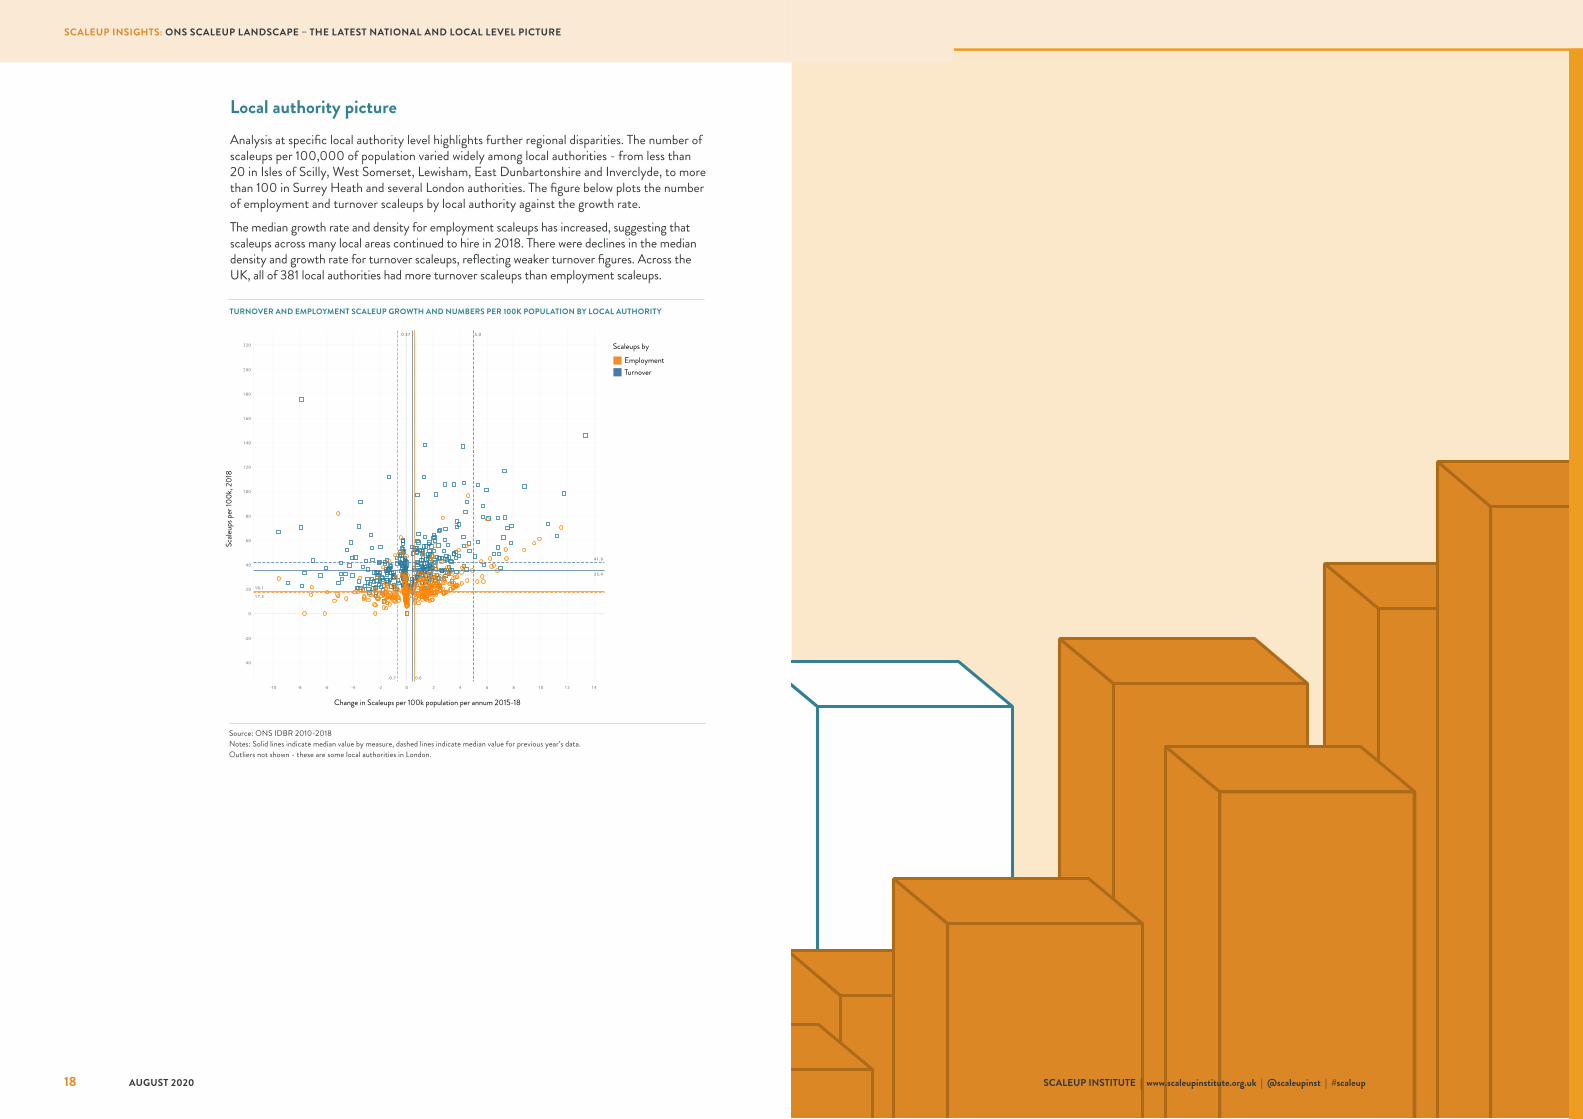
TURNOVER AND EMPLOYMENT SCALEUP GROWTH AND NUMBERS PER 100K POPULATION BY LOCAL AUTHORITY
Scaleups by
Change in Scaleups per 100k population per annum 2015-18
EmploymentTurnover
Scale
ups p
er 10
0k, 2
018
Source: ONS IDBR 2010-2018Notes: Solid lines indicate median value by measure, dashed lines indicate median value for previous year’s data. Outliers not shown - these are some local authorities in London.
Local authority pictureAnalysis at specific local authority level highlights further regional disparities. The number of scaleups per 100,000 of population varied widely among local authorities - from less than 20 in Isles of Scilly, West Somerset, Lewisham, East Dunbartonshire and Inverclyde, to more than 100 in Surrey Heath and several London authorities. The figure below plots the number of employment and turnover scaleups by local authority against the growth rate.
The median growth rate and density for employment scaleups has increased, suggesting that scaleups across many local areas continued to hire in 2018. There were declines in the median density and growth rate for turnover scaleups, reflecting weaker turnover figures. Across the UK, all of 381 local authorities had more turnover scaleups than employment scaleups.
18 19
SCALEUP INSIGHTS: ONS SCALEUP LANDSCAPE – THE LATEST NATIONAL AND LOCAL LEVEL PICTURE
AUGUST 2020 SCALEUP INSTITUTE | www.scaleupinstitute.org.uk | @scaleupinst | #scaleup
SECTION 2
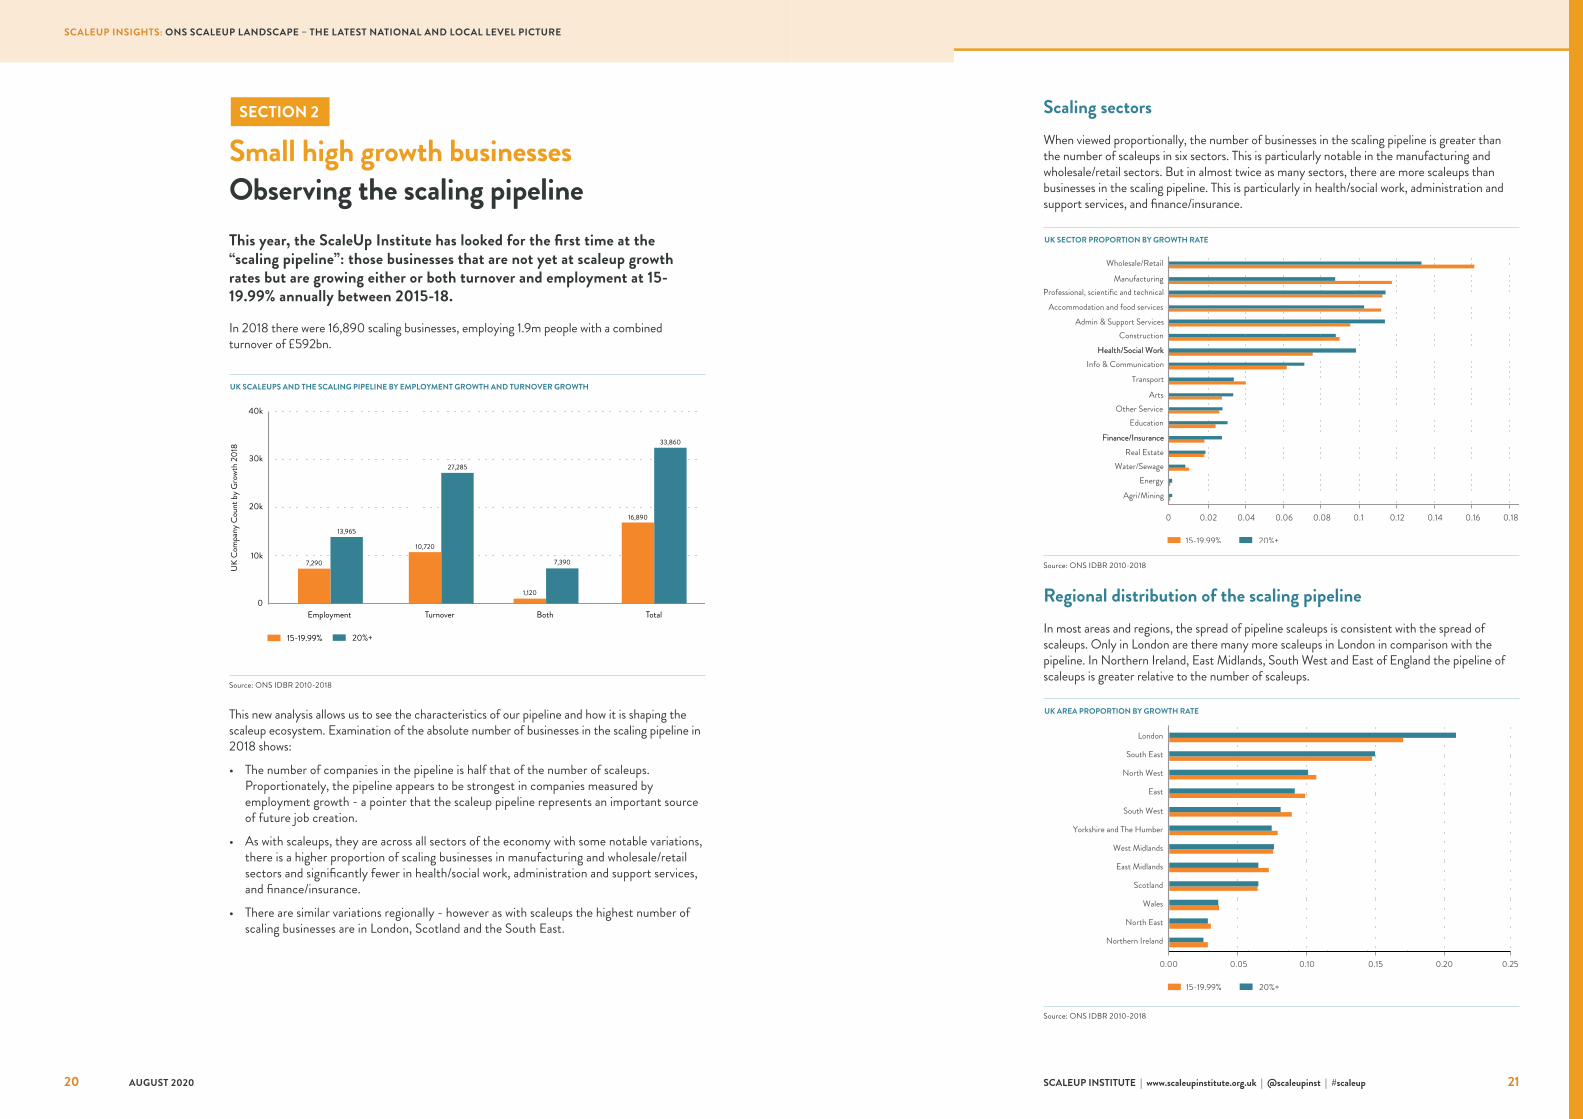
Small high growth businesses Observing the scaling pipelineThis year, the ScaleUp Institute has looked for the first time at the “scaling pipeline”: those businesses that are not yet at scaleup growth rates but are growing either or both turnover and employment at 15-19.99% annually between 2015-18.
In 2018 there were 16,890 scaling businesses, employing 1.9m people with a combined turnover of £592bn.
This new analysis allows us to see the characteristics of our pipeline and how it is shaping the scaleup ecosystem. Examination of the absolute number of businesses in the scaling pipeline in 2018 shows:
• The number of companies in the pipeline is half that of the number of scaleups. Proportionately, the pipeline appears to be strongest in companies measured by employment growth - a pointer that the scaleup pipeline represents an important source of future job creation.
• As with scaleups, they are across all sectors of the economy with some notable variations, there is a higher proportion of scaling businesses in manufacturing and wholesale/retail sectors and significantly fewer in health/social work, administration and support services, and finance/insurance.
• There are similar variations regionally - however as with scaleups the highest number of scaling businesses are in London, Scotland and the South East.
UK SCALEUPS AND THE SCALING PIPELINE BY EMPLOYMENT GROWTH AND TURNOVER GROWTH
Source: ONS IDBR 2010-2018
Employment
40k
30k
20k
10k
0Turnover Both
UK
Com
pany
Cou
nt b
y Gro
wth
2018
Total
15-19.99% 20%+
13,965
27,285
7,390
33,860
7,290
10,720
1,120
16,890
UK SECTOR PROPORTION BY GROWTH RATE
Source: ONS IDBR 2010-2018
UK AREA PROPORTION BY GROWTH RATE
Source: ONS IDBR 2010-2018
0.00 0.05 0.10 0.15 0.20 0.25
Northern Ireland
North East
Wales
Scotland
East Midlands
West Midlands
Yorkshire and The Humber
South West
East
North West
South East
London
15-19.99% 20%+
Scaling sectorsWhen viewed proportionally, the number of businesses in the scaling pipeline is greater than the number of scaleups in six sectors. This is particularly notable in the manufacturing and wholesale/retail sectors. But in almost twice as many sectors, there are more scaleups than businesses in the scaling pipeline. This is particularly in health/social work, administration and support services, and finance/insurance.
Regional distribution of the scaling pipeline In most areas and regions, the spread of pipeline scaleups is consistent with the spread of scaleups. Only in London are there many more scaleups in London in comparison with the pipeline. In Northern Ireland, East Midlands, South West and East of England the pipeline of scaleups is greater relative to the number of scaleups.
20 21
SCALEUP INSIGHTS: ONS SCALEUP LANDSCAPE – THE LATEST NATIONAL AND LOCAL LEVEL PICTURE
AUGUST 2020 SCALEUP INSTITUTE | www.scaleupinstitute.org.uk | @scaleupinst | #scaleup
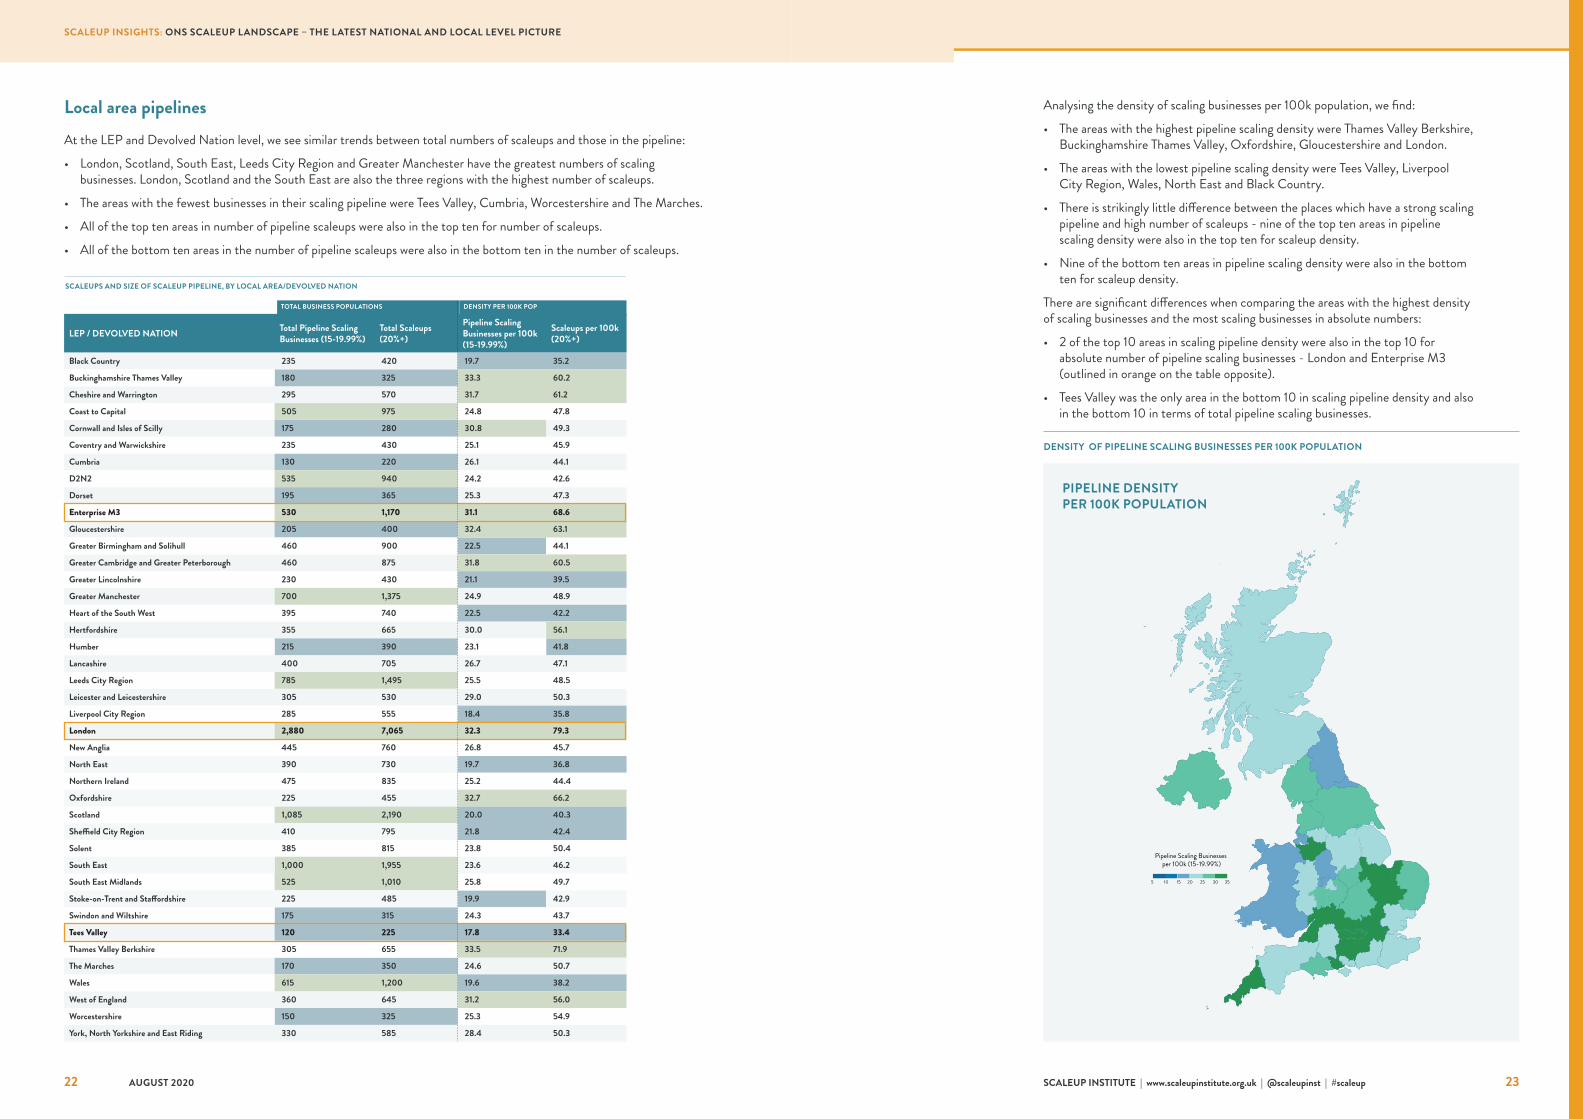
Local area pipelinesAt the LEP and Devolved Nation level, we see similar trends between total numbers of scaleups and those in the pipeline:
• London, Scotland, South East, Leeds City Region and Greater Manchester have the greatest numbers of scaling businesses. London, Scotland and the South East are also the three regions with the highest number of scaleups.
• The areas with the fewest businesses in their scaling pipeline were Tees Valley, Cumbria, Worcestershire and The Marches.
• All of the top ten areas in number of pipeline scaleups were also in the top ten for number of scaleups.
• All of the bottom ten areas in the number of pipeline scaleups were also in the bottom ten in the number of scaleups.
Analysing the density of scaling businesses per 100k population, we find:
• The areas with the highest pipeline scaling density were Thames Valley Berkshire, Buckinghamshire Thames Valley, Oxfordshire, Gloucestershire and London.
• The areas with the lowest pipeline scaling density were Tees Valley, Liverpool City Region, Wales, North East and Black Country.
• There is strikingly little difference between the places which have a strong scaling pipeline and high number of scaleups - nine of the top ten areas in pipeline scaling density were also in the top ten for scaleup density.
• Nine of the bottom ten areas in pipeline scaling density were also in the bottom ten for scaleup density.
There are significant differences when comparing the areas with the highest density of scaling businesses and the most scaling businesses in absolute numbers:
• 2 of the top 10 areas in scaling pipeline density were also in the top 10 for absolute number of pipeline scaling businesses - London and Enterprise M3 (outlined in orange on the table opposite).
• Tees Valley was the only area in the bottom 10 in scaling pipeline density and also in the bottom 10 in terms of total pipeline scaling businesses.
SCALEUPS AND SIZE OF SCALEUP PIPELINE, BY LOCAL AREA/DEVOLVED NATION
LEP / DEVOLVED NATION Total Pipeline Scaling Businesses (15-19.99%)
Total Scaleups (20%+)
Pipeline Scaling Businesses per 100k (15-19.99%)
Scaleups per 100k (20%+)
Black Country 235 420 19.7 35.2
Buckinghamshire Thames Valley 180 325 33.3 60.2
Cheshire and Warrington 295 570 31.7 61.2
Coast to Capital 505 975 24.8 47.8
Cornwall and Isles of Scilly 175 280 30.8 49.3
Coventry and Warwickshire 235 430 25.1 45.9
Cumbria 130 220 26.1 44.1
D2N2 535 940 24.2 42.6
Dorset 195 365 25.3 47.3
Enterprise M3 530 1,170 31.1 68.6
Gloucestershire 205 400 32.4 63.1
Greater Birmingham and Solihull 460 900 22.5 44.1
Greater Cambridge and Greater Peterborough 460 875 31.8 60.5
Greater Lincolnshire 230 430 21.1 39.5
Greater Manchester 700 1,375 24.9 48.9
Heart of the South West 395 740 22.5 42.2
Hertfordshire 355 665 30.0 56.1
Humber 215 390 23.1 41.8
Lancashire 400 705 26.7 47.1
Leeds City Region 785 1,495 25.5 48.5
Leicester and Leicestershire 305 530 29.0 50.3
Liverpool City Region 285 555 18.4 35.8
London 2,880 7,065 32.3 79.3
New Anglia 445 760 26.8 45.7
North East 390 730 19.7 36.8
Northern Ireland 475 835 25.2 44.4
Oxfordshire 225 455 32.7 66.2
Scotland 1,085 2,190 20.0 40.3
Sheffield City Region 410 795 21.8 42.4
Solent 385 815 23.8 50.4
South East 1,000 1,955 23.6 46.2
South East Midlands 525 1,010 25.8 49.7
Stoke-on-Trent and Staffordshire 225 485 19.9 42.9
Swindon and Wiltshire 175 315 24.3 43.7
Tees Valley 120 225 17.8 33.4
Thames Valley Berkshire 305 655 33.5 71.9
The Marches 170 350 24.6 50.7
Wales 615 1,200 19.6 38.2
West of England 360 645 31.2 56.0
Worcestershire 150 325 25.3 54.9
York, North Yorkshire and East Riding 330 585 28.4 50.3
TOTAL BUSINESS POPULATIONS DENSITY PER 100K POP
DENSITY OF PIPELINE SCALING BUSINESSES PER 100K POPULATION
Pipeline Scaling Businesses per 100k (15-19.99%)
5 10 15 20 25 30 35
PIPELINE DENSITY PER 100K POPULATION
22 23
SCALEUP INSIGHTS: ONS SCALEUP LANDSCAPE – THE LATEST NATIONAL AND LOCAL LEVEL PICTURE
AUGUST 2020 SCALEUP INSTITUTE | www.scaleupinstitute.org.uk | @scaleupinst | #scaleup
SECTION 3
Drivers of scaleup growth Since 2014, the ScaleUp Institute has consistently identified access to skills, markets, local leadership, finance and infrastructure as the key barriers to scaleup growth.5 This has been reinforced by a growing body of literature on scaleups.6,7 There are many potential drivers of growth. However, there is currently insufficient research available assessing the regional economic drivers of scaleup growth. In a report for the OECD, Audretsch and David said that “the geographical dimension [of high-growth firms] have been largely overlooked.”8
To better understand the factors that drive scaleup growth the ScaleUp Institute collaborated on a project with Arup. We interviewed a sample of scaleup leaders across the UK, carried out a detailed review of recent academic literature and conducted an in-depth statistical analysis of growth factors.
“What, if any, place-based drivers of scaleup growth can be identified in the UK?” was the question to which we sought answers.
We gathered both qualitative and quantitative evidence. This mixed methods approach allowed us to dig deeper into local drivers of growth than before.
Qualitative analysisIn collaboration with Arup, we conducted semi-structured in-depth interviews across a range of local areas from high performing to developing growth paths (Oxford, West of England, TVB, North East, Leeds, Scotland, Cornwall, Greater Manchester). Local leaders consistently identified these areas as key drivers of scaleup growth:
Knowledge sharing - where individuals, businesses and institutions build informal networks which enable knowledge, skills and experience to be spread more widely.
• Active network of peers.
• Strong local supply chains with links between small and large firms
• Access to qualified non-executive board members
Active University Engagement
• Providing relevant training
• Research collaboration
• Interaction between scaleups and graduates
Local Ambitions
• A strong sense of local identity and ambition
• Support and goodwill from the wider group of local stakeholders
Quantitative analysisInformed by this evidence and insight, we identified a number of potential factors linked to scaleup growth, as measured by the average increase in scaleup density between 2013-2018. We used data from the Census, ONS and Beauhurst, at a local authority district (LAD) level. Regression analysis allowed us to isolate the effects of specific factors. We used spatially lagged variables to control for spillover effects from neighbouring areas. We also controlled for GVA and GVA growth.
From our analysis, we found three main factors driving scaleup growth - equity finance, skills and sectoral clustering. A number of other factors demonstrated no clear relationship with scaleup growth - SME bank lending rates, proportion of large firms, start-up density and start-up survival rate. We used spatially lagged variables for each factor which account for the effects from neighbouring areas. We also accounted for the starting GVA of the area and GVA growth. The effects remained robust even after controlling for these factors.
5 The Scale-up Report 2014.
6 Teruel, M. and De Wit, G. (2017). Determinants of high-growth firms: why do some countries have more high-growth firms than others?. In Exploring the Entrepreneurial Society, Edward Elgar Publishing.
7 Brown, R., Mawson, S., and Mason, C., (2017). Myth-busting and entrepreneurship policy: the case of high growth firms. Entrepreneurship and Regional Development.
8 Audretsch, David B, (2012). Determinants of high-growth entrepreneurship. In Report prepared for the OECD/DBA International Workshop on “High-Growth Firms: local policies and local determinants.
FACTORS AND THEIR ROLE IN SCALEUP DENSITY GROWTH 2013-2018
Factor Description Relationship with scaleup density growth 2013-2018
Skills Proportion of 16-24 year olds with Level 4+ qualifications. This comes from the most recent Census data (2011) and provides an appropriate lag between the time that young people acquire skills and when they enter the workforce.
Positive
Sectoral Clustering Proportion of companies from the most concentrated sector in a given LAD, obtained using ONS IDBR data.
Positive up to a saturation level
Equity Visible SME equity funding per 100k population in 2013-2014, providing an appropriate period of time for funded SMEs to become scaleups. This data was obtained from Beauhurst’s high growth company database.
Positive
Lending SME bank lending per 100k population in 2013-2014, providing an appropriate period of time for funded SMEs to become scaleups. This was obtained using UK Finance data.
No clear relationship
Large Firms Proportion of firms with 250+ employees in a given LAD. This was obtained using ONS IDBR data.
No clear relationship
Start-up density Start-ups per 100k population in 2012. This time lag is necessary to give start-ups a suitable amount of time to become scaleups. This was obtained using ONS IDBR data.
No clear relationship
Start-up survival rate Proportion of start-ups from 2012 surviving after 5 years. This was obtained using ONS IDBR data.
No clear relationship
Public Transport Time to get to key services using public transport (England only data), obtained using Gov.uk data.
No clear relationship
24 25
SCALEUP INSIGHTS: ONS SCALEUP LANDSCAPE – THE LATEST NATIONAL AND LOCAL LEVEL PICTURE
AUGUST 2020 SCALEUP INSTITUTE | www.scaleupinstitute.org.uk | @scaleupinst | #scaleup
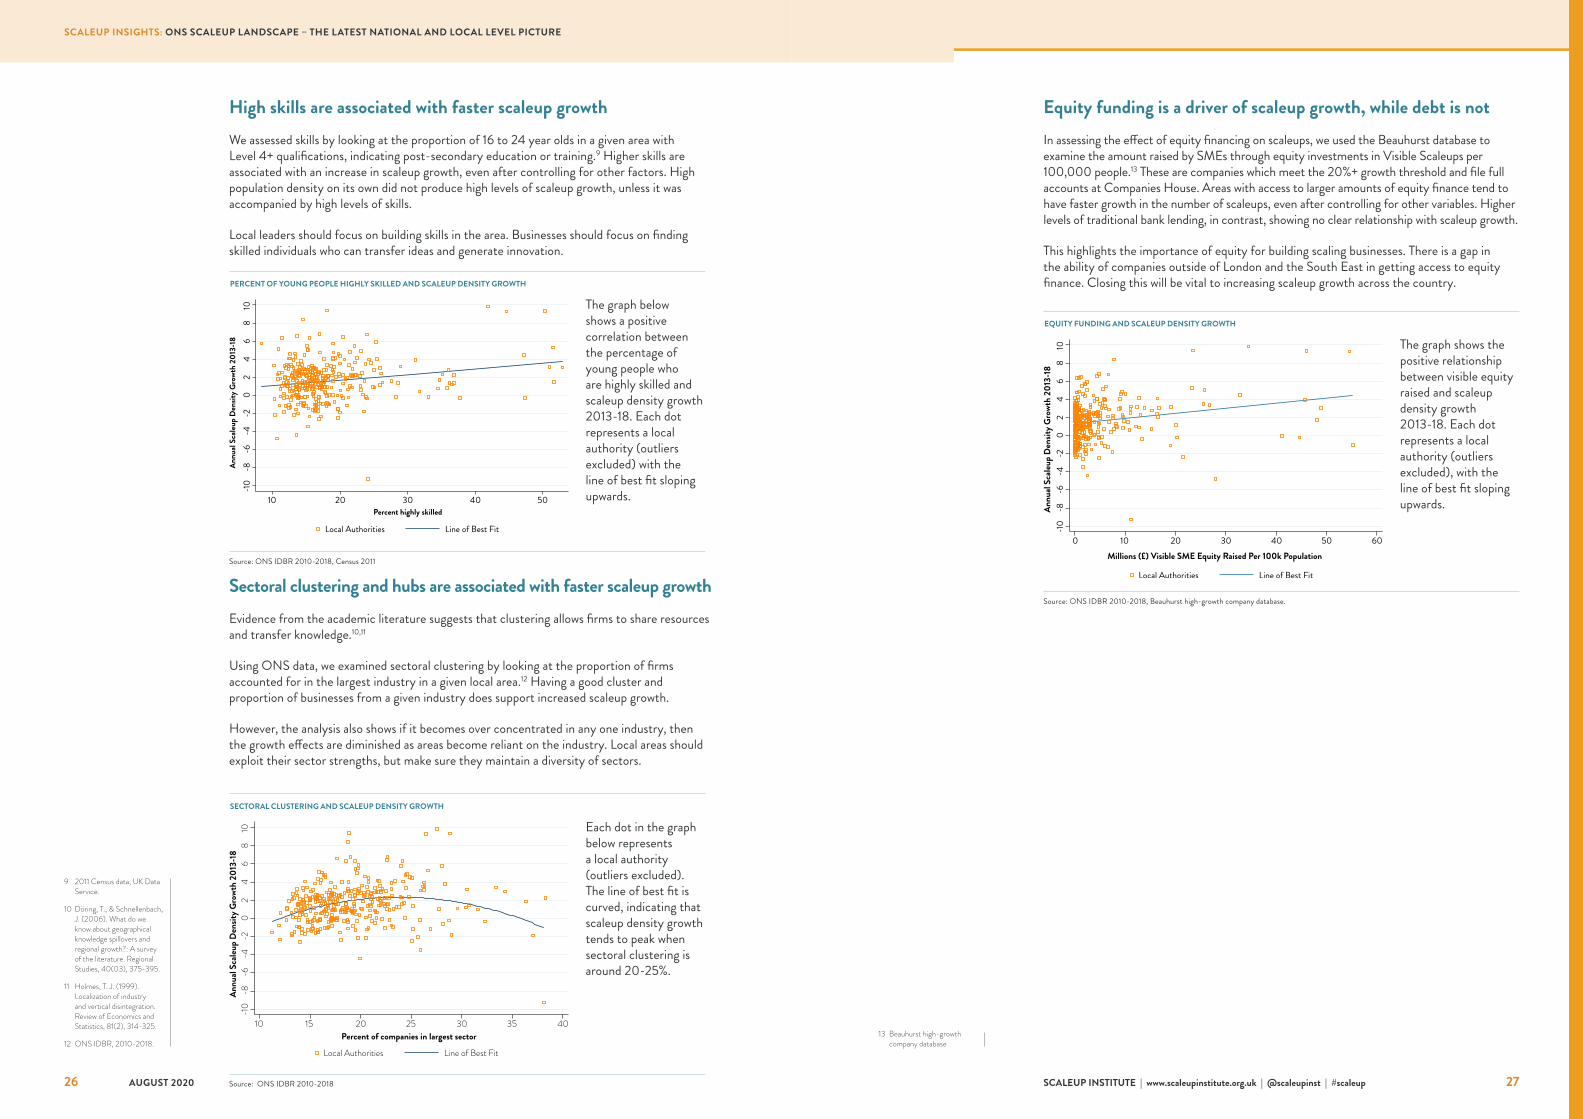
Sectoral clustering and hubs are associated with faster scaleup growthEvidence from the academic literature suggests that clustering allows firms to share resources and transfer knowledge.10,11
Using ONS data, we examined sectoral clustering by looking at the proportion of firms accounted for in the largest industry in a given local area.12 Having a good cluster and proportion of businesses from a given industry does support increased scaleup growth.
However, the analysis also shows if it becomes over concentrated in any one industry, then the growth effects are diminished as areas become reliant on the industry. Local areas should exploit their sector strengths, but make sure they maintain a diversity of sectors.
Equity funding is a driver of scaleup growth, while debt is notIn assessing the effect of equity financing on scaleups, we used the Beauhurst database to examine the amount raised by SMEs through equity investments in Visible Scaleups per 100,000 people.13 These are companies which meet the 20%+ growth threshold and file full accounts at Companies House. Areas with access to larger amounts of equity finance tend to have faster growth in the number of scaleups, even after controlling for other variables. Higher levels of traditional bank lending, in contrast, showing no clear relationship with scaleup growth.
This highlights the importance of equity for building scaling businesses. There is a gap in the ability of companies outside of London and the South East in getting access to equity finance. Closing this will be vital to increasing scaleup growth across the country.
-10
-8-6
-4-2
02
46
810
Annu
al Sc
aleup
Den
sity G
rowt
h 20
13-1
8
10 15 20 25 30 35 40Percent of companies in largest sector
Local Authorities Line of Best Fit
SECTORAL CLUSTERING AND SCALEUP DENSITY GROWTH
Source: ONS IDBR 2010-2018
Each dot in the graph below represents a local authority (outliers excluded). The line of best fit is curved, indicating that scaleup density growth tends to peak when sectoral clustering is around 20-25%.
-10
-8-6
-4-2
02
46
810
Annu
al Sc
aleup
Den
sity G
rowt
h 20
13-1
8
0 10 20 30 40 50 60Millions (£) Visible SME Equity Raised Per 100k Population
Local Authorities Line of Best Fit
EQUITY FUNDING AND SCALEUP DENSITY GROWTH
Source: ONS IDBR 2010-2018, Beauhurst high-growth company database.
The graph shows the positive relationship between visible equity raised and scaleup density growth 2013-18. Each dot represents a local authority (outliers excluded), with the line of best fit sloping upwards.
9 2011 Census data, UK Data Service.
10 Döring, T., & Schnellenbach, J. (2006). What do we know about geographical knowledge spillovers and regional growth?: A survey of the literature. Regional Studies, 40(03), 375-395.
11 Holmes, T. J. (1999). Localization of industry and vertical disintegration. Review of Economics and Statistics, 81(2), 314-325.
12 ONS IDBR, 2010-2018. 13 Beauhurst high-growth
company database
-10
-8-6
-4-2
02
46
810
Annu
al Sc
aleup
Den
sity G
rowt
h 20
13-1
8
10 20 30 40 50Percent highly skilled
Local Authorities Line of Best Fit
PERCENT OF YOUNG PEOPLE HIGHLY SKILLED AND SCALEUP DENSITY GROWTH
Source: ONS IDBR 2010-2018, Census 2011
The graph below shows a positive correlation between the percentage of young people who are highly skilled and scaleup density growth 2013-18. Each dot represents a local authority (outliers excluded) with the line of best fit sloping upwards.
High skills are associated with faster scaleup growthWe assessed skills by looking at the proportion of 16 to 24 year olds in a given area with Level 4+ qualifications, indicating post-secondary education or training.9 Higher skills are associated with an increase in scaleup growth, even after controlling for other factors. High population density on its own did not produce high levels of scaleup growth, unless it was accompanied by high levels of skills.
Local leaders should focus on building skills in the area. Businesses should focus on finding skilled individuals who can transfer ideas and generate innovation.
26 27
SCALEUP INSIGHTS: ONS SCALEUP LANDSCAPE – THE LATEST NATIONAL AND LOCAL LEVEL PICTURE
AUGUST 2020 SCALEUP INSTITUTE | www.scaleupinstitute.org.uk | @scaleupinst | #scaleup
In 2019, we refreshed our recommendations for further scaleup action. Taken together, we were confident that they would make the UK the most attractive place in the world for scaleups. These actions remain critical in 2020. Indeed, the Covid-19 pandemic makes them even more so. As the world adjusts to a new normal, the ability to identify and support scaleups through the unlocking of existing Government data and dramatically enhancing intra-governmental, local and private sector engagement with them will ensure that the UK has a powerful engine of future growth.
The ScaleUp Institute is pledged to make the UK the best place in the world for ambitious leaders to choose to scale their business and we will work tirelessly with all those who share our ambition.
Scaleups are the growth and innovation champions of the UK economy. If the UK is to innovate and grow out of the current crisis into recovery, and achieve trade success in a reframed international context, it is vital to increase the number of scaleups and remove the growth barriers that they face.
The core tenets of a UK ecosystem tailored towards scaling needs at a local level must be the foundation upon which a path to recovery is charted.
To this end we must further embed clear segmentation of our business population to the way that programmes are developed, ensuring support that is available is clearer to navigate. Peer-to-peer networks remain the single most important form of external help that scaleups value, so we must place further emphasis on getting the right peer networks in place in local areas. It will also be important to harness the impact that effective clusters have in overcoming market barriers and driving growth at a local level. We must ensure that this growth has the fuel of local easily accessible talent and equity including innovation and institutional patient capital. By building upon what works, we should also consider what to enhance and accelerate to provide the best tools for business growth.
29SCALEUP INSTITUTE | www.scaleupinstitute.org.uk | @scaleupinst | #scaleup 29
SCALEUP INSIGHTS: ONS SCALEUP LANDSCAPE – THE LATEST NATIONAL AND LOCAL LEVEL PICTURE
SCALEUP INSTITUTE | www.scaleupinstitute.org.uk | @scaleupinst | #scaleup28 AUGUST 2020
Looking forward: Achieving our potential, driving economic growth and recovery This report has been written during the peak of the COVID-19 pandemic. This impact is not reflected in the ONS data available to analyse, but warning signs for the UK economy are in the data which need to be taken seriously. Even without the massive economic impact of the lockdown the annualised rate of scaleup growth is slowing. In recent years – as scaleups have consistently warned – market access is becoming harder. Complacency and delay are not options.
SCALEUP INSIGHTS: ONS SCALEUP LANDSCAPE – THE LATEST NATIONAL AND LOCAL LEVEL PICTURE
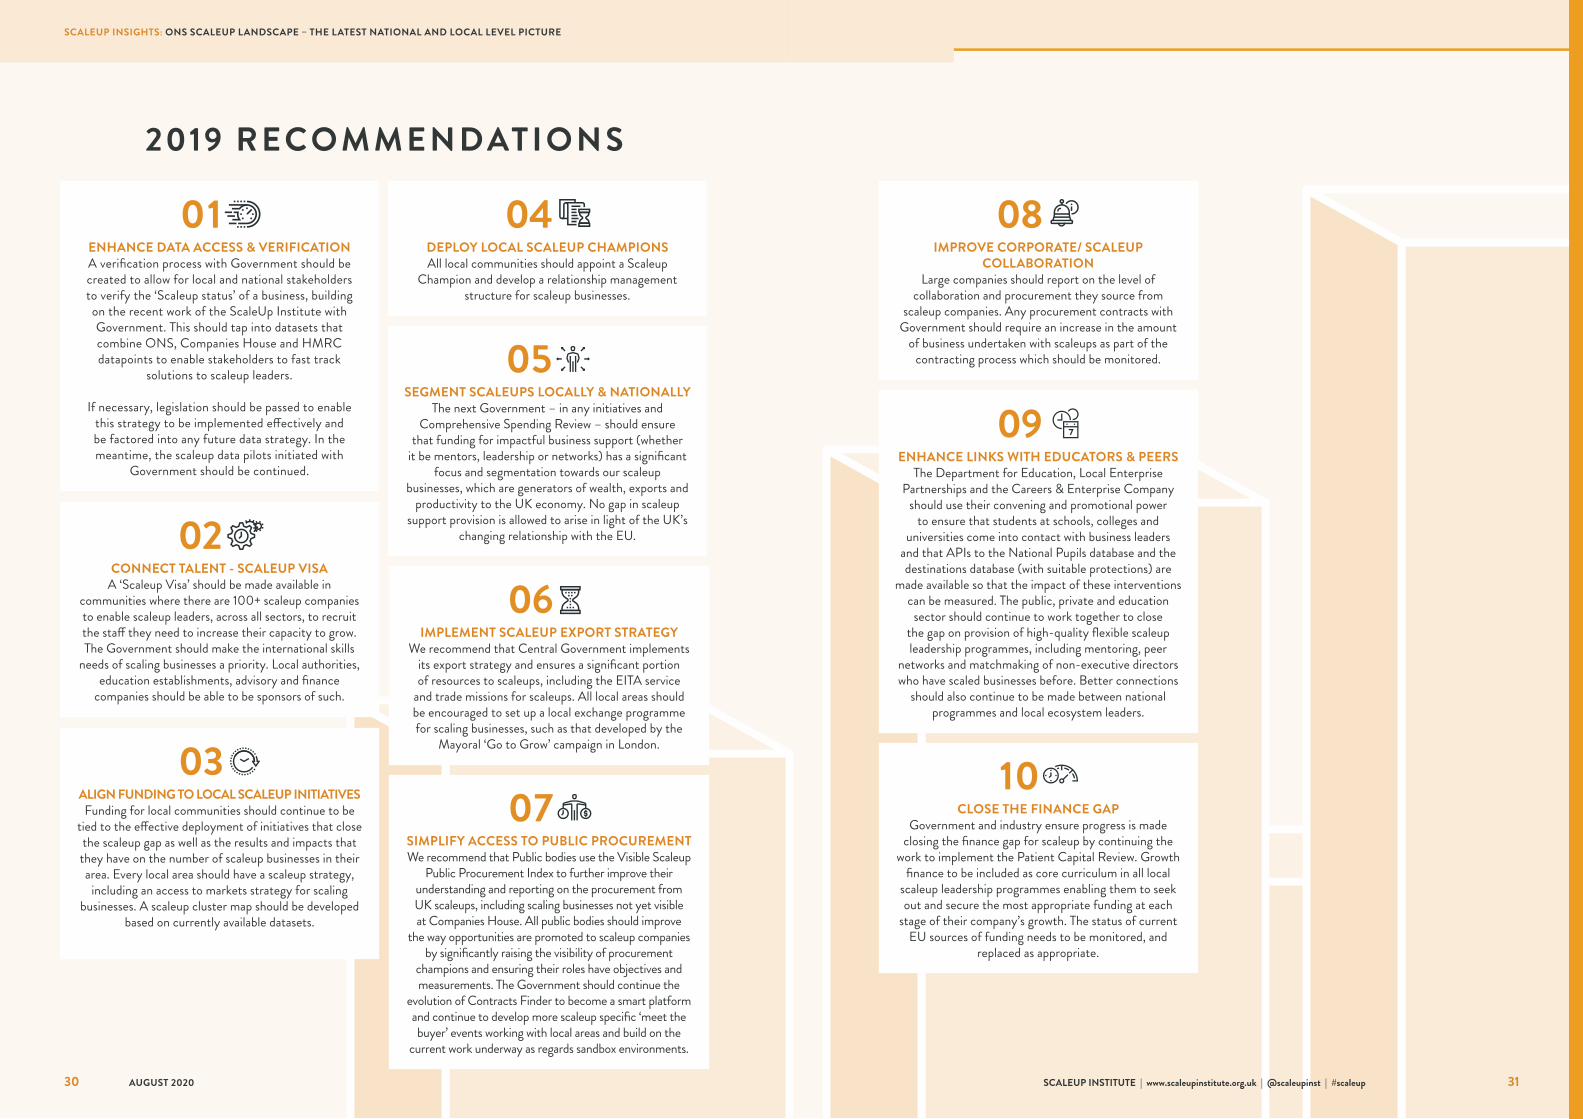
ENHANCE DATA ACCESS & VERIFICATION A verification process with Government should be created to allow for local and national stakeholders to verify the ‘Scaleup status’ of a business, building on the recent work of the ScaleUp Institute with Government. This should tap into datasets that combine ONS, Companies House and HMRC datapoints to enable stakeholders to fast track
solutions to scaleup leaders.
If necessary, legislation should be passed to enable this strategy to be implemented effectively and be factored into any future data strategy. In the meantime, the scaleup data pilots initiated with
Government should be continued.
01
CONNECT TALENT - SCALEUP VISA A ‘Scaleup Visa’ should be made available in
communities where there are 100+ scaleup companies to enable scaleup leaders, across all sectors, to recruit the staff they need to increase their capacity to grow. The Government should make the international skills
needs of scaling businesses a priority. Local authorities, education establishments, advisory and finance
companies should be able to be sponsors of such.
02
SEGMENT SCALEUPS LOCALLY & NATIONALLY The next Government – in any initiatives and
Comprehensive Spending Review – should ensure that funding for impactful business support (whether
it be mentors, leadership or networks) has a significant focus and segmentation towards our scaleup
businesses, which are generators of wealth, exports and productivity to the UK economy. No gap in scaleup
support provision is allowed to arise in light of the UK’s changing relationship with the EU.
05
IMPLEMENT SCALEUP EXPORT STRATEGY We recommend that Central Government implements
its export strategy and ensures a significant portion of resources to scaleups, including the EITA service
and trade missions for scaleups. All local areas should be encouraged to set up a local exchange programme for scaling businesses, such as that developed by the
Mayoral ‘Go to Grow’ campaign in London.
06
SIMPLIFY ACCESS TO PUBLIC PROCUREMENT We recommend that Public bodies use the Visible Scaleup
Public Procurement Index to further improve their understanding and reporting on the procurement from UK scaleups, including scaling businesses not yet visible at Companies House. All public bodies should improve
the way opportunities are promoted to scaleup companies by significantly raising the visibility of procurement
champions and ensuring their roles have objectives and measurements. The Government should continue the
evolution of Contracts Finder to become a smart platform and continue to develop more scaleup specific ‘meet the buyer’ events working with local areas and build on the
current work underway as regards sandbox environments.
07ALIGN FUNDING TO LOCAL SCALEUP INITIATIVES Funding for local communities should continue to be
tied to the effective deployment of initiatives that close the scaleup gap as well as the results and impacts that they have on the number of scaleup businesses in their area. Every local area should have a scaleup strategy,
including an access to markets strategy for scaling businesses. A scaleup cluster map should be developed
based on currently available datasets.
03
ENHANCE LINKS WITH EDUCATORS & PEERS The Department for Education, Local Enterprise
Partnerships and the Careers & Enterprise Company should use their convening and promotional power
to ensure that students at schools, colleges and universities come into contact with business leaders
and that APIs to the National Pupils database and the destinations database (with suitable protections) are
made available so that the impact of these interventions can be measured. The public, private and education
sector should continue to work together to close the gap on provision of high-quality flexible scaleup leadership programmes, including mentoring, peer
networks and matchmaking of non-executive directors who have scaled businesses before. Better connections
should also continue to be made between national programmes and local ecosystem leaders.
09
CLOSE THE FINANCE GAP Government and industry ensure progress is made
closing the finance gap for scaleup by continuing the work to implement the Patient Capital Review. Growth
finance to be included as core curriculum in all local scaleup leadership programmes enabling them to seek out and secure the most appropriate funding at each
stage of their company’s growth. The status of current EU sources of funding needs to be monitored, and
replaced as appropriate.
10
IMPROVE CORPORATE/ SCALEUP COLLABORATION
Large companies should report on the level of collaboration and procurement they source from
scaleup companies. Any procurement contracts with Government should require an increase in the amount
of business undertaken with scaleups as part of the contracting process which should be monitored.
08
30 31
SCALEUP INSIGHTS: ONS SCALEUP LANDSCAPE – THE LATEST NATIONAL AND LOCAL LEVEL PICTURE
AUGUST 2020 SCALEUP INSTITUTE | www.scaleupinstitute.org.uk | @scaleupinst | #scaleup
DEPLOY LOCAL SCALEUP CHAMPIONS All local communities should appoint a Scaleup
Champion and develop a relationship management structure for scaleup businesses.
04
2019 RECOMMENDATIONS
THE SCALEUP INSTITUTE
The ScaleUp Institute is a private sector-led, not-for-profit organisation focused on collaborating with policy makers, corporates, finance players, educators and government at a local and national level.
Our mission is to help the UK to become the best place in the world to grow a business as well as start one, and enable our existing high-growth businesses to scale up even further.
The ScaleUp Institute101 Euston RoadLondonNW1 2RA
[email protected] @scaleupinst