Embed Size (px)
Citation preview

1
Scaling analysis of hand tremor movements in essential tremor patients
1Blesic S,
1Maric J,
2Dragasevic N,
1Milanovic S,
2Kostic V,
1,3Ljubisavljevic M
1Institute for Medical Research, Laboratory for Neurophysiology, P.O.Box 102, 11129 Belgrade,
Serbia 2Institute of Neurology, Clinical Center of Serbia, Medical School, University of Belgrade,
Dr.Subotića 6, 11000 Belgrade, Serbia 3Faculty of Medicine and Health Sciences, Department of Physiology, UAE University, Al Ain,
United Arab Emirates
Corresponding author:
Milos Ljubisavljevic
Institute for Medical Research
PO Box 102
11129 Belgrade
Serbia
Phone: + 381 60 3314704
Fax: + 381 11 2643691
E-mail: [email protected]
Running title: Effects of load in essential tremor
*ManuscriptClick here to download Manuscript: Blesic et al Revised.docx Click here to view linked References

2
Abstract
Recent evidence suggests that the dynamic-scaling behavior of the time-series of signals
extracted from separate peaks of tremor spectra may reveal existence of multiple independent
sources of tremor. Here we have studied dynamic characteristics of the time-series of hand
tremor movements in essential tremor (ET) patients using the detrended fluctuation analysis
(DFA) method. Hand accelerometry was recorded with (500 g) and without weight loading under
postural conditions in 25 ET patients and 20 normal subjects. The time series comprised of peak-
to-peak (PtP) intervals were extracted from regions around the first three main frequency
components of power spectra (PwS) of the recorded tremors. The data were compared between
the load and no-loadcondition on dominant (related to tremor severity) and non-dominant tremor
side and with the normal (physiological) oscillations in healthy subjects. Our analysis shows that,
in ET, the dynamic characteristics of the main frequency component of recorded tremors exhibit
scaling behavior. Furthermore, they show that the two main components of ET tremor frequency
spectra, otherwise indistinguishable without load, become significantly different after inertial
loading and that they differ between the tremor sides (related to tremor severity). These results
show that scaling, a time-domain analysis, help revealing tremor features previously not revealed
by frequency-domain analysis and suggests that distinct oscilatory central circuits may generate
the tremor in ET patients.
Keywords: Tremor, essential tremor, Fourier analysis and DFA method, load, tremor asymmetry

3
Introduction
Essential tremor (ET) is one of the most common movement disorders (Findley, 1994;
Louis et al., 1998b; Louis et al., 1998a; Louis, 2005; Elble, 2002; Benito-Leon & Louis, 2007),
characterized by bilateral, typically asymmetric, kinetic-postural tremor in the upper limbs
(Louis et al., 1998b; Hellwig et al., 2003). The tremulous oscillations in ET are approximately
sinusoidal (Gao & Tung, 2002; Timmer et al., 1996; Sapir et al., 2003), with a peak frequency
between 4 and 12 Hz (Raethjen et al., 2000a; Louis, 2005). However, the tremor spectra
(frequency domain analysis) usually display complex structure with more than one characteristic
peak frequency (Timmer et al., 1996). This type of harmonic structure in the frequency domain
is believed to originate either from a single oscillatory period with nonlinear dynamics,
suggesting single oscillatory origin, or from superposition of multiple independent modes of
oscillation, which would suggest multiple oscillatory origins.
It has been proposed (Sapir et al., 2003) that probing the difference in dynamic-scaling
behavior (in values of functions characterizing the dynamic behavior) of time-series of signals
extracted from separate peaks of tremor spectra may reveal existence of multiple independent
sources of tremor. This approach has suggested the existence of multiple oscillatory origins in
tremor of Parkinson’s disease (Sapir et al., 2003). Earlier studies of ET, utilizing different
methodologies, have also suggested the presence of multiple oscillators in ET (Findley, 1994;
Raethjen et al., 2000a; O'Suilleabhain & Matsumoto, 1998; Gao & Tung, 2002).
In the present study, we aimed to examine the characteristics of ET dynamics by scaling
analysis. Scaling analysis has been successfully used in the past to reveal the complex dynamic
behavior of different physiological signals (Goldberger, 1996), such as the heartbeats
(Makikallio et al., 1998), human gait (Hausdorff et al., 1995), neuron spiking (Blesic et al.,
1999) and other processes. We used Detrended Fluctuation Analysis (DFA) to analyze ET hand
tremor time-series comprised of peak-to-peak (PtP) intervals, extracted from regions around the
first three main frequency components of the tremor power spectra (PwS). Our assumption was
that if multiple oscillators are causing ET, the scaling analysis of separate peaks of ET spectra
would yield different scaling patterns. We examined the effects of external weight load on the
scaling characteristics of ET, since it has been shown that inertial loading induces a reduction in

4
tremor amplitude by reducing the mechanical resonance and mechanical reflex tremor frequency
(Elble, 1986; Findley, 1994; Elble, 2003; Raethjen et al., 2000b; Raethjen et al., 2004). We
hypothesized that if tremor of mechanical reflex origin has influence on the scaling properties of
ET, external inertial loading would suppress it, allowing elucidation of the frequency-invariant
central tremor component by scaling analysis (Elble, 2003; Elble, 1986; Louis & Pullman, 2001;
Raethjen et al., 2004). Finally, we compared the ET scaling properties between tremor-dominant
and non-dominant side of the patients, assuming that they may also reveal different scaling
patterns. The results were eventually compared with scaling characteristics of tremor obtained
from healthy-control subjects.
Materials and Methods
Tremor was recorded in 25 ET patients, aged 24–78 years (mean 63 ± 13 SD, see Table
1). The findings in ET patients were compared with corresponding data recorded in 20 healthy
subjects (range 30-72 years, mean age 46 ± 13 SD), who had no history of neurological disease.
The patients were recruited from the Institute of Neurology, Clinical Center of Serbia. All
patients underwent routine neurological examination that excluded other neurological
abnormalities. The diagnosis was confirmed by independent movement disorder specialists,
based on the Movement Disorders Society TRIG criteria (Findley, 1994) and the Consensus
Statement of the Movement Disorder Society on Tremor (Deuschl et al., 1998). The severity of
tremor was independently rated using the ET Tremor Assessment Form (range 15 – 59; mean 39
± 15 SD; see Table 1). All patients except one were right-handed, while all healthy-control
subjects were right-handed. The right hand was reported as dominant side (with respect to tremor
severity) by 11 patients, the left hand by 6 patients, while the remaining 8 patients could not
differentiate between sides (see Table 1). Each subject gave informed consent to participate in
this study, acknowledging that the employed methods had been clearly explained, and that they
understood them prior to the study. All procedures were approved by the Local Ethics
Committee, and all the precautions were taken to comply with the Helsinki Declaration of the
World Medical Associations.
Postural tremor of the horizontally extended hands was recorded with forearm pronated
and fingers outstretched. Subjects were comfortably seated in an armchair during the entire

5
experiment, and were instructed to keep their eyes closed during recordings. All patients had
their tremor-related therapy withdrawn at least 24 hours prior to experiment. All subjects were
instructed not to use alcohol, caffeine beverages, or tea during this period. Tremulous activity
was recorded by two-axial piezoresistive accelerometers, which were fastened to middle fingers
of both hands. The accelerometer had a sensitivity of 174 mV/g (g being the acceleration of
gravity). Hand tremor was recorded firstly without and then with the 500g-wrist cuff loading.
The experimental protocol was designed based on established research records (Elble,
2003; Raethjen et al., 2000a; Raethjen et al., 2000b; Louis & Pullman, 2001; Raethjen et al.,
2004) and personal clinical experience. In order to avoid fatigue three successive 2 minutes
epochs were recorded in each condition. A 5-minute break followed each of the 2 minutes
recording epoch. Tremor recordings were repeated after 48 hours in 7 patients and 5 healthy
individuals, in order to assess the reproducibility of data.
The accelerometer's signal was amplified and sampled at a rate of 100 Hz (CED
1401plus, CED, UK). Once stored on the computer the records were initially subjected to Fourier
analysis (FFT, 2048 points, Hanning window, Matlab, Math Works Inc., Natick, MA, USA), and
the peak frequencies of the power spectra and the total power of the records were calculated, in
the range between 1 and 25 Hz (see Fig. 1b). Since FFT was used only to estimate the positions
of local maxima (dominant peak and its’ multiples), it was not necessary to apply any
mathematical improvements to the conventional methods of PwS computation (Timmer et al.,
1996). The peak frequencies, or modes, were estimated by smoothing the PwSs and
determination of significant peaks, or local maxima, of the smoothed functions (Timmer et al.,
2000). We have analyzed the first three PwS modes. In order to include the frequency regions
around peaks (dominant and its two multiples; see Fig. 1c), the recorded data were band-pass
filtered (using the square pass filter). The length of a frequency region was estimated so as to
include the whole structure under the peak, that is, to begin and finish at or asymptotically near
the PwS baseline, before and after the peak. Thereafter, the peak-to-peak (PtP) time series,
suitable for DFA analysis, were extracted from the decomposed filtered series (see Fig. 1d). The
total number of the analyzed data points (PtP) of a single mode was of the order of 103 data, in
all of the analyzed cases. Detrended fluctuation analysis (DFA), the technique that stems from
the field of statistical physics, was applied to the PtP data. The DFA method (Peng et al., 1994)
computes the dependence of the standard error of a linear interpolation of PtP series PtP(n) on

6
the size of the interpolation segment n, thus calculating the detrended fluctuation function F(n),
which allows quantitative characterization of the dynamics of analyzed data (details of the
method are given elsewhere (Hausdorff et al., 1995;Buldyrev et al., 1995). The function F(n)
increases with increasing the segment length n. A linear relationship on a log-log plot indicates
the presence of power-law scaling behavior of the analyzed data. Under such conditions, the
fluctuations can be characterized by a scaling exponent , the slope of the line relating log F(n)
to log n. The scaling exponent is connected (Stanley et al., 1994) to a scaling exponent of the
related PwS, and the exponent of the related autocorrelation function, by the scaling relation:
= 1 –/2 = (1 +)/2. Thus it characterizes the correlation properties of the analyzed series (also
denote as complementary correlation coefficient). It may happen (Blesic et al., 1999) that in two
neighboring intervals of n the function F(n) displays two different power-law behaviors. The so-
called crossover region is then defined by the values of n where the function F(n) changes its
behavior. For large values of n, beyond the crossover region, the scaling exponent usually
increases (Blesic et al., 2005) and acquires values characteristic for the so-called 1/f noise.
To test the difference between s of different PwS modes and between left and right side,
within the same experimental setting, the Mann-Whitney U test was used, while the effects of
loading were tested using the Wilcoxon matched pairs test. For all statistical analysis the
significance level was set at P<0.05.
Results
In healthy subjects, in contrast to ET patients, the power spectra appeared as broad
functions with indistinguishable spectral peaks in all cases, which made discrimination of
different PwS modes impossible. Further analysis in healthy subjects was therefore performed on
the whole low frequency region (1-25 Hz) of power spectra, in all conditions (load, load-free)
and for both hands. This has limited the comparison between patients and healthy subjects only
to main (low frequency) mode of the ET spectra.
In ET patients, the Fourier analysis showed differences in power spectra of different
tremor sides (related to tremor severity). Assessment of PwS’s local maxima, or dominant
modes, was possible only for tremor dominant arms. In lesser-affected or non-affected arms,

7
power spectra were similar to those seen in healthy subjects, and appeared as broad functions
with at times undistinguishable spectral peaks. Only in patients who could not have originally
differentiated between sides, the shape of Fourier PwSs appeared similar, with clearly
distinguishable PwS modes, irrespective of the analyzed arm. In addition, the shape of the PwSs
in patients with bilateral tremor was indistinguishable from the one seen in patients with only
one affected arm. Thus, further analysis was performed either on dominant tremor side, or on
both tremor sides in patients who could not have differentiated between the arms.
In the majority of ET patients FFT showed main oscillations around 6-7 Hz and the
spectrum which shows peaks at roughly integer multiples of that fundamental frequency. As
already observed in earlier studies (Elble, 2003;Elble, 1986;Louis & Pullman, 2001;Raethjen et
al., 2004) inertial loading did not lead to any significant changes in PwS characteristics. In most
of the analyzed cases, the addition of load, decreased the amplitude and broadened the spectral
peaks of main PwS to a small extent, but failed to produce statistically significant shifts in
frequencies of the three PwS modes. In only 7 patients the analyzed spectral regions were
completely (all three of the analyzed regions of the spectra), or partially (the first and/or the
second region) translated to upper frequencies, while in 2 patients this shift was toward lower
frequencies (by 1Hz). In Fig. 2 these two possible cases of PwS changes after the addition of
wrist cuff load are depicted. These changes did not depend on any of the factors related to the
disorder - patients’ age, handedness, or the duration of tremor.
In all ET patients, the application of DFA revealed scaling behavior (calculated functions
appeared as straight lines on log-log plots) for all analyzed PwS modes. The DFA functions have
also displayed crossover in the observed scaling behavior. The DFA exponents were thus
calculated as slopes of DFA functions in the regions below the crossover point, which covered a
reasonable large segment of PtP enumeration scale (up to two decades of scale). There were no
significant differences in DFA exponent of any PwS mode between patients that presented
with bilateral tremor and those that had tremor only in one-right or left hand (P > 0.05, not
shown in the table). The no-loadcondition, in both unilaterally and bilaterally affected patients,
on the right side, there was a significant difference in the values of DFA exponent of the first
and second PwS mode (P < 0.05), but not between the first and third and the second and third (P
> 0.05) PwS tremor peaks (Table 2). On the left side (in both unilaterally and bilaterally affected

8
patients), there were no significant differences in exponent for the three PwS modes (P >
0.05).
Addition of inertial load induced significant changes in tremor dynamics (values of
calculated DFA functions’ exponent ) in the main (first) spectral mode on both sides. Figure 3
shows changes in DFA functions, for the main spectral mode, in different experimental
conditions (no-loadvs. load) and for different sides. In the right-hand (Fig. 3b) the slopes of lines
showing main spectral mode DFA functions clearly decreased with the addition of load, while in
the left-hand (Fig. 3a) the slopes of lines actually increased with the addition of load. Table 2
summarizes the calculated values of DFA exponents for the left and the right side, for all
spectral modes. Corresponding to changes in the slopes of the DFA functions for the right hand
(depicted in Fig. 3b) the DFA exponents of the main (first) spectral mode (given in Table 2) also
decreased with addition of load. The results of the statistical tests (given in Table 2) show that
the value of the first mode changes significantly (P < 0.01), as the effect of loading, and that,
when the load is added, it differs significantly from the corresponding value of the second mode.
In contrast to the right hand, loading increased significantly the value of the dominant (first)
mode on the left side. In addition, when the load is added, the value of the exponent for the
first mode significantly differed from the corresponding (with load) values of the second and the
third mode (P < 0.05).
The results obtained for the low frequency regions (1-25 Hz) of power spectra of healthy
controls group, depicted in Fig. 4, show the existence of crossover on DFA curves, separating the
small-scale regions with ≈ 0.4 (mean 0.35 ± 0.04), and the large-scale regions, with ≈ 0.5
(mean 0.50 ± 0.05), which is the result typical for the random time series (white noise).
Furthermore, unlike in the ET patients, there were no significant differences between different
experimental conditions (no-loadvs. load) and side (arm). When compared to the results obtained
for the main mode in ET patients in condition without load, the DFA curves in healthy subjects
(see Fig. 4) demonstrate a difference in shape, irrespective of the recording side (right vs. left).
Namely, the healthy DFA functions comprise of two regions, separated by a crossover point,
while in the ET case three regions appear - the two regions that may probably be compared with
the healthy controls, which exist on lower scales, with pertinent crossover point shifted to the

9
left. In addition, the ET DFA functions display the existence of another crossover point and
another region, on higher scales, with DFA exponent 1, the value expected for 1/f noise.
Discussion
In the present study, we investigated the time-series of hand tremor movements in
essential tremor (ET) before and after the addition of wrist-cuff load by the Fourier transform
(FT) and the detrended fluctuation analysis (DFA) methods. More specifically, we have analyzed
the time-series comprised of peak-to-peak (PtP) intervals, extracted from regions around the first
three main frequency components of power spectra (PwS) of the recorded tremors. The results
show that the dynamical characteristics of the main frequency component of recorded tremors in
ET patients exhibit scaling behavior. Furthermore, they show that the dynamical characteristics
of the main frequency components of recorded tremors in ET patients change in value after the
addition of load and that they differ between the sides.
Changes in tremor frequency spectra properties to external loading, have been supposed
to occur due to its mechanical-reflex origin of ET (Elble, 2003; Elble, 1986; Louis & Pullman,
2001; Raethjen et al., 2004), and possibly of the central-neurogenic oscillation that is entrained
by the mechanical-reflex system (Elble, 2003). However, the use of Fourier transform methods
has so far produced inconsistent results to confirm this hypothesis. We assumed that this
characteristic of tremor movements could be assessed by the analysis of time rather than
frequency (shape) domain of analyzed accelerometry records, as this approach proved to bring
new insights before (Gao & Tung, 2002; Timmer et al., 2000; Gao, 2004). We have employed
the DFA method for analysis of the time series tremor data, since it was shown to be a powerful
tool for analysis of complex dynamical properties of different physiological signals (Makikallio
et al., 1998; Makikallio et al., 2001; Hausdorff et al., 1995; Milosevic et al., 2002). The results
show that the main two components of ET tremor frequency spectra become significantly
different after weight loading, while the third component did not seam in any way affected by the
load. Thus, our study confirms that weight loading can help distinguish between different
spectral components of ET. In addition, the results presented here point to the existence of
dynamic separation of tremor components upon the addition of load, suggesting that the first
frequency component may be affected by peripheral reflex mechanisms.

10
The observed scaling effects were different on different tremor sides being asymmetrical
in ET. Analyzed dynamical properties of time series extracted from the regions around the first
frequency component changed after the addition of load in both left- and right-side sample data,
but with a different sign. On the left side, the values of DFA exponents of the main mode
increased with load, whereas on the right-hand side they decreased. Since an increase of scaling
exponents generally points to a more correlated behavior, and the decrease to a more
uncorrelated behavior, the observed difference in scaling between sides may suggest the
difference in central oscilators in these ET patients. The addition of load seams to follow
tremulous activity on the left hand side (ads to correlations within segments of tremor
movements), while it interferes with the established tremor pattern on the right hand side
disrupting it. In addition, the differentiation of the main two components of power spectra on the
right side was significant even without the addition of load. The findings did not directly depend
on patients’ handedness, since the severity of tremor was not related to hand preference in our
sample (Louis et al., 1998b; Biary & Koller, 1985). However, our results were to an extent more
pronounced for the right-side sample data, which is an almost expected outcome, since our
patients were all right-handed. Due to the anatomical and physiological asymmetries in the
nervous system that are associated with handedness, it is possible that our results are reflecting
the greater degree of precision and control of motor programs in the right-hand side, that is
possibly more sensitive to changes induced by tremor (Louis et al., 1998b; Henningsen et al.,
1995).
A possible influence of mechanical transmission from one arm to the other remains to be
assessed, since this could also be the basis of the differences between results for different hands,
especially if one hand’s tremor exceeds the other.
The biological significance of these particular changes, in respect to the actual values of
DFA exponents, and the meaning of their change (increase or decrease in value), could be also
partially assessed by way of comparison with the corresponding findings in normal subjects.
Namely, normal tremor does not produce clearly distinguishable regions in frequency spectra,
and thus could not be analyzed (and compared) in an identical way. For low frequency regions
and/or main PwS mode, we have obtained the difference in number and positions of
corresponding DFA regions (crossover points). In the ET case, these positions were shifted
toward lower scales, and a new region appears on DFA curves on higher scales. In addition, in

11
healthy subjects the dominant scaling behavior happens to be the one that corresponds to the
white noise, or completely random behavior. Generally, the most likely explanation for the
appearance of crossover (Blesic et al., 1999) is that it is the sign of effects of various global
and/or local processes (with longer characteristic time scales) within the organism. Thus, the
difference in behavior of DFA functions between ET patients and healthy controls (difference in
scaling exponents) could be associated with pathologic changes in ET patients, and/or with some
additional mechanism that influences movements in ET patients, and that causes the observed
shift in position and appearance of another crossover.
In conclusion, the present results demonstrate differential effects of mass loading on
scaling (time domain) characteristics of ET series. Furthermore, they show difference in scaling
characteristic between right and left side in ET patients, and thereby suggest possible existance
of multiple oscilators in ET. Finally, the present study provides additional approach in
experimental and clinical studies aiming at indentyfying and characterizing CNS networks
involved in tremor generation, potentially yielding relevant clinical data. Further studies are
needed to establish the precise biological significance of DFA results in the context of tremor,
probably by correlating them with imaging studies.
Acknowledgements
This work was supported by Serbian Ministry of Science Research Grants no. 141020 and
145083.

12
Reference List
Benito-León J (2007). Clinical update: diagnosis and treatment of essential tremor. Lancet
369:1152-1154.
Biary N & Koller W (1985). Handedness and essential tremor. Arch Neurol 42:1082-1083.
Blesic S, Milosevic S, Stratimirovic Dj, Ljubisavljevic M (1999). Detrended fluctuation analysis
of time series of a firing fusimotor neuron. Physica A 268:275-282.
Blesic S, Stratimirovic D, Milosevic S, Ljubisavljevic M (2005). Detecting long-range
correlations in time series of dorsal horn neuron discharges. Ann N Y Acad Sci 1048:385-391.
Buldyrev SV, Goldberger AL, Havlin S, Mantegna RN, Matsa ME, Peng CK, Simons M,
Stanley HE (1995). Long-range correlation properties of coding and noncoding DNA sequences:
GenBank analysis. Phys Rev E Stat Phys Plasmas Fluids Relat Interdiscip Topics 51:5084-5091.
Deuschl G, Bain P, Brin M (1998). Consensus statement of the Movement Disorder Society on
Tremor. Ad Hoc Scientific Committee. Mov Disord 13 Suppl 3:2-23.
Elble RJ (1986). Physiologic and essential tremor. Neurology 36:225-231.
Elble RJ (2002). Essential tremor is a monosymptomatic disorder. Mov Disord 17:633-637.
Elble RJ (2003). Characteristics of physiologic tremor in young and elderly adults. Clin
Neurophysiol 114:624-635.
Findley LJ (1994). Handbook of tremor disorders., eds. Koller W & Findley LJ, Marcel Dekker
Inc, New York.
Gao JB (2004). Analysis of amplitude and frequency variations of essential and Parkinsonian
tremors. Med Biol Eng Comput 42:345-349.

13
Gao JB & Tung WW (2002). Pathological tremors as diffusional processes. Biol Cybern 86:263-
270.
Goldberger AL (1996). Non-linear dynamics for clinicians: chaos theory, fractals, and
complexity at the bedside. Lancet 347:1312-1314.
Hausdorff JM, Peng CK, Ladin Z, Wei JY, Goldberger AL (1995). Is walking a random walk?
Evidence for long-range correlations in stride interval of human gait. J Appl Physiol 78:349-358.
Hellwig B, Schelter B, Guschlbauer B, Timmer J, Lucking CH (2003). Dynamic synchronisation
of central oscillators in essential tremor. Clin Neurophysiol 114:1462-1467.
Henningsen H, Ende-Henningsen B, Gordon AM (1995). Asymmetric control of bilateral
isometric finger forces. Exp Brain Res 105:304-311.
Louis ED (2005). Essential tremor. Lancet Neurol 4:100-110.
Louis ED, Ford B, Lee H, Andrews H, Cameron G (1998a). Diagnostic criteria for essential
tremor: a population perspective. Arch Neurol 55:823-828.
Louis ED & Pullman SL (2001). Comparison of clinical vs. electrophysiological methods of
diagnosing of essential tremor. Mov Disord 16:668-673.
Louis ED, Wendt KJ, Pullman SL, Ford B (1998b). Is essential tremor symmetric? Observational
data from a community-based study of essential tremor. Arch Neurol 55:1553-1559.
Makikallio TH, Huikuri HV, Hintze U, Videbaek J, Mitrani RD, Castellanos A, Myerburg RJ,
Moller M (2001). Fractal analysis and time- and frequency-domain measures of heart rate
variability as predictors of mortality in patients with heart failure. Am J Cardiol 87:178-182.
Makikallio TH, Ristimae T, Airaksinen KE, Peng CK, Goldberger AL, Huikuri HV (1998).
Heart rate dynamics in patients with stable angina pectoris and utility of fractal and complexity
measures. Am J Cardiol 81:27-31.

14
Milosevic S, Blesic S, Stratimirovic D (2002). Beneficial randomness of signals in a neuronal
circuit. Physica A 314:43-52.
O'Suilleabhain PE & Matsumoto JY (1998). Time-frequency analysis of tremors. Brain 121 ( Pt
11):2127-2134.
Peng CK, Buldyrev SV, Havlin S, Simons M, Stanley HE, Goldberger AL (1994). Mosaic
organization of DNA nucleotides. Phys Rev E Stat Phys Plasmas Fluids Relat Interdiscip Topics
49:1685-1689.
Raethjen J, Lauk M, Koster B, Fietzek U, Friege L, Timmer J, Lucking CH, Deuschl G (2004).
Tremor analysis in two normal cohorts. Clin Neurophysiol 115:2151-2156.
Raethjen J, Lindemann M, Schmaljohann H, Wenzelburger R, Pfister G, Deuschl G (2000a).
Multiple oscillators are causing parkinsonian and essential tremor. Mov Disord 15:84-94.
Raethjen J, Pawlas F, Lindemann M, Wenzelburger R, Deuschl G (2000b). Determinants of
physiologic tremor in a large normal population. Clin Neurophysiol 111:1825-1837.
Sapir N, Karasik R, Havlin S, Simon E, Hausdorff JM (2003). Detecting scaling in the period
dynamics of multimodal signals: application to Parkinsonian tremor. Phys Rev E Stat Nonlin
Soft Matter Phys 67:031903.
Stanley HE, Buldyrev SV, Goldberger AL, Goldberger ZD, Havlin S, Mantegna RN, Ossadnik
SM, Peng CK, Simons M (1994). Statistical mechanics in biology: how ubiquitous are long-
range correlations? Physica A 205:214-253.
Timmer J, Lauk M, Deuschl G (1996). Quantitative analysis of tremor time series.
Electroencephalogr Clin Neurophysiol 101:461-468.
Timmer J, Lauk M, Hausler S, Radt V, Koster B, Hellwig B, Guschlbauer B, Lucking CH,
Eichler M, Deuschl G (2000). Cross-spectral analysis of tremor time series. International Journal
of Bifurcation and Chaos 10:2595-2610.

15
Tables and Figure Legends
Table 1 - Mean values and standard deviations of the scaling exponents of the first three PwS
modes in patients with ET, and of the low frequency mode of healthy subjects, for two different
conditions: without (load-free) and with the addition of load. The results of the statistical tests
are given, in two types of recording conditions, for ET patients. Since the p-value-matrix is
symmetrical, only the upper triangle above the diagonal is shown. Statistical significant
differences are denoted by **, for p<0.05, and *, for 0.05<p≤0.1.
Figure 1 – Tremor recording and analysis. a) Typical example of a short segment of recorded
hand tremor from a patient with ET; b) The corresponding power spectrum displays three distinct
frequency modes; c) Filtering of the original series around the three main power spectral modes;
d) Extraction of the peak-to-peak (PtP) intervals series from one of the three filtered tremor
series.
Figure 2 - The power spectra of the recorded tremors in ET patients, before (filled light grey
curve) and after (dark line curve) the addition of wrist-cuff load. Two examples of the obtained
changes in power spectra are depicted – a slight shift toward lower frequencies (left graph), and a
slight shift toward higher frequencies (right graph) regions. The observed changes were
inconsistent and not statistically significant.
Figure 3 - The DFA functions FDFA2(n) of second order, for the series of peak-to-peak (PtP)
intervals, extracted around the first (main) modes of the power spectra of hand tremor from
patients with ET. Straight lines represent the calculated DFA functions in postural conditions
without the added load (no-loadcondition), while the scattered full circled lines represent
corresponding (same patient, same mode) functions calculated after the addition of the wristcuff
load (Load condition). The results are given separately for the dominant (with respect to tremor
severity) left-hand and right-hand side.
Figure 4 - Comparison of the DFA functions FDFA2(n) for the first (main) modes for a patient
with ET and a healthy subject, in postural condition without load. Open circled straight lines
represent the linear least-squares fits (slopes) to DFA functions, while arrows point to the
positions of crossover points. The calculated values of DFA exponents are given, for ET case
(three different DFA regions, separated by crossover points), and a healthy control case (two
DFA regions).

Figure 1Click here to download high resolution image
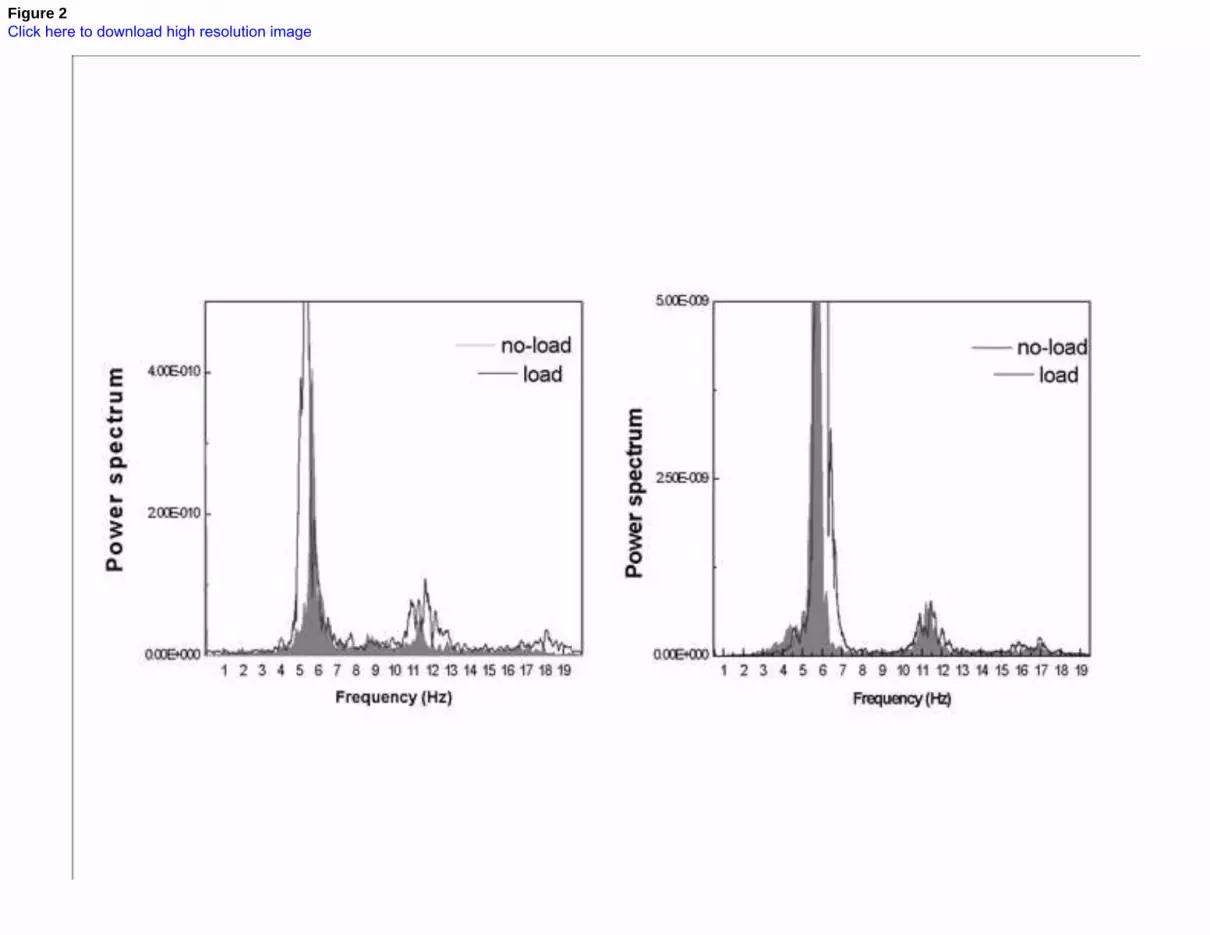
Figure 2Click here to download high resolution image

Figure 3Click here to download high resolution image

Figure 4Click here to download high resolution image

Table 1


