Embed Size (px)
Citation preview
Physica A 273 (1999) 1–18
www.elsevier.com/locate/physa
Scaling features of noncoding DNA
H.E. Stanleya ;∗, S.V. Buldyreva, A.L. Goldbergerb;d, S. Havlinc,C.-K. Penga;b, M. Simonsb
aCenter for Polymer Studies and Department of Physics, Boston University, Boston, MA 02215, USAbCardiovascular Div., Harvard Medical School, Beth Israel Hospital, Boston, MA, USA
cDepartment of Physics, Bar-Ilan University, Ramat-Gan, IsraeldDepartment of Biomedical Engineering, Boston University, Boston, MA, USA
Received 6 September 1999
Abstract
We review evidence supporting the idea that the DNA sequence in genes containing noncoding
regions is correlated, and that the correlation is remarkably long range — indeed, base pairs
thousands of base pairs distant are correlated. We do not �nd such a long-range correlation in
the coding regions of the gene, and utilize this fact to build a Coding Sequence Finder Algorithm,
which uses statistical ideas to locate the coding regions of an unknown DNA sequence. Finally,
we describe brie y some recent work adapting to DNA the Zipf approach to analyzing linguistic
texts, and the Shannon approach to quantifying the “redundancy” of a linguistic text in terms
of a measurable entropy function, and reporting that noncoding regions in eukaryotes display a
larger redundancy than coding regions. Speci�cally, we consider the possibility that this result is
solely a consequence of nucleotide concentration di�erences as �rst noted by Bonhoe�er and his
collaborators. We �nd that cytosine–guanine (CG) concentration does have a strong “background”
e�ect on redundancy. However, we �nd that for the purine–pyrimidine binary mapping rule,
which is not a�ected by the di�erence in CG concentration, the Shannon redundancy for the set
of analyzed sequences is larger for noncoding regions compared to coding regions. c© 1999
Elsevier Science B.V. All rights reserved.
1. Introduction
Scaling concepts have played a key role in our understanding of phenomena occur-
ring near critical points. A scale invariant function f(x) has the remarkable property
that each time x is doubled, the function f(x) changes by the same factor. There is
thus no way to set a characteristic scale for such a function.
∗ Corresponding author. Fax: +1-617-3533783.
E-mail address: [email protected] (H.E. Stanley)
0378-4371/99/$ - see front matter c© 1999 Elsevier Science B.V. All rights reserved.
PII: S 0378 -4371(99)00407 -0
2 H.E. Stanley et al. / Physica A 273 (1999) 1–18
Stated mathematically, if the variable x is increased by an arbitrary factor �, then
the function is changed by a factor �p which is independent of the value of x,
f(�x) = �pf(x) (1)
for all �. A functional equation, such as (1), constrains the set of possible functional
forms of f(x): any function f(x) satisfying (1) must be a power-law, as may be seen
by substituting the choice �= 1=x in (1),
f(x) = Axp: (2)
We say that scale invariance [Eq. (1)] implies power-law behavior [Eq. (2)]. Con-
versely, power-law behavior implies scale invariance, since any function f(x) obeying
(2) also obeys (1) — one can verify this by substitution. Thus, scale invariance is
mathematically equivalent to power-law behavior.
Power laws are found to describe various functions in the vicinity of critical points.
These include not only systems with Hamiltonians (such as the Ising and Heisen-
berg models) but also purely geometric systems, such as percolation. Scaling is also
found to hold for polymeric systems, including both linear and branched polymers.
Here power-law correlations develop in the asymptotic limit in which the number of
monomers approaches in�nity. The list of systems in which power-law correlations
appear has grown rapidly in recent years, including models of rough surfaces, tur-
bulence, and earthquakes. In this talk, I will present recent work suggesting that —
under suitable conditions — the sequence of base pairs or “nucleotides” in noncoding
DNA also displays power-law correlations. The underlying basis of such power-law
correlations is not understood at present, but it is at least possible that this reason is
of as fundamental importance as it is in other systems in nature that have been found
to display power-law correlations.
2. Information coding in DNA
Genomic sequences contain numerous “layers” of information. These include speci�-
cations for mRNA sequences responsible for protein structure, identi�cation of coding
and non-coding parts of the sequence, information necessary for speci�cation of regu-
latory (promoter, enhancer) sequences, information directing protein–DNA interactions,
directions for DNA packaging and unwinding. The genomic sequence is likely the most
sophisticated and e�cient information database created by nature through the dynamic
process of evolution. Equally remarkable is the precise transformation of di�erent lay-
ers of information (replication, decoding, etc.) that occurs in a short time interval.
While means of encoding some of this information is understood (for example, the
genetic code directing amino acid assembly, sequences directing intron/exon splicing,
etc.), relatively little is known about other layers of information encrypted in a DNA
molecule. In the genomes of high eukaryotic organisms, only a small portion of the
total genome length is used for protein coding. The role of introns and intergenomic
H.E. Stanley et al. / Physica A 273 (1999) 1–18 3
sequences constituting a large portion of the genome remains unknown. Furthermore,
only a few quantitative methods are currently available for analyzing such information.
3. Conventional statistical analysis of DNA sequences
DNA sequences have been analyzed using a variety of models that can basically be
considered in two categories. The �rst types are “local” analyses; they take into account
the fact that DNA sequences are produced in sequential order, so the neighboring base
pairs will a�ect the next attaching base pair. This type of analysis, such as n-step
Markov models, can indeed describe some observed short-range correlations in DNA
sequences. The second category of analyses is more “global” in nature, concentrating
on the presence of repeated patterns (such as periodic repeats and interspersed base
sequence repeats) that can be found mostly in eukaryotic genomic sequences. A typical
example of analysis in this category is the Fourier transform analysis which can identify
repeats of certain segments of the same length in base pair sequences [1].
However, DNA sequences are more complicated than these two standard types of
analysis can describe. Therefore, it is crucial to develop new tools for analysis with
a view toward uncovering the mechanisms used to code other types of information in
DNA sequences.
4. Scale-invariant (fractal) analysis of DNA sequences
In the last decade, scaling analysis (fractal) techniques have been developed for
detecting scale-invariant statistical patterns and study physical properties in complex
uids and other random systems. These methods have been successfully applied in
a number of disciplines and to a number of problems including stochastic growth
processes in physics and chemistry, polymer physics, as well as other problems [2–4].
Since DNA sequences are long polymer chains, some general scale-invariant properties
found in polymer physics [5,6] may appear in DNA, and alterations of those general
properties may serve for characterization of DNA sequences.
A useful approach to studying stochastic properties of DNA involves the construc-
tion of a 1 : 1 map of the base pair sequence projected onto a walk — which we term
a “DNA walk” [7,8]. The mapping is then used to obtain a quantitative measure of
the correlation between base pairs over long distances along the DNA chain. In ad-
dition, the technique provides a novel graphical “�ngerprint” representation of DNA
structures.
In this fashion we uncovered in the base pair sequence a remarkably long-range
power-law correlation that is signi�cant because it implies a new scale invariant
(fractal) property of DNA. Such long-range correlations are limited to non-coding se-
quences (introns, regulatory untranscribed gene elements and intergenomic sequences)
and occur in organisms as diverse as hepatitis delta agent, cytomegalovirus, yeast
4 H.E. Stanley et al. / Physica A 273 (1999) 1–18
chromosome and a large number of eukaryotic genes encoding a variety of proteins (see
Refs. [8,9]).
The power-law decay correlations are of interest because they cannot be accounted
for by the standard Markov chain model or other short-range correlations models (which
will only give rise to an exponential decay in correlation). On the other hand, unlike
the standard Fourier transform analysis [1] that detects the periodical repeats described
by a few characteristic length scales, our analysis shows that there exist statistically
self-similar patterns on all length scales.
5. The “DNA walk” or “fractal landscape” representation
In order to study the scale-invariant long-range correlations of the DNA sequences,
we �rst introduced a graphical representation of DNA sequences, which we term a
“fractal landscape” or “DNA walk”. For the conventional one-dimensional random
walk model, a walker moves either up [u(i)=+1] or down [u(i)=−1] one unit length
for each step i of the walk [2]. For the case of an uncorrelated walk, the direction of
each step is independent of the previous steps. For the case of a correlated random
walk, the direction of each step depends on the history (“memory”) of the walker. The
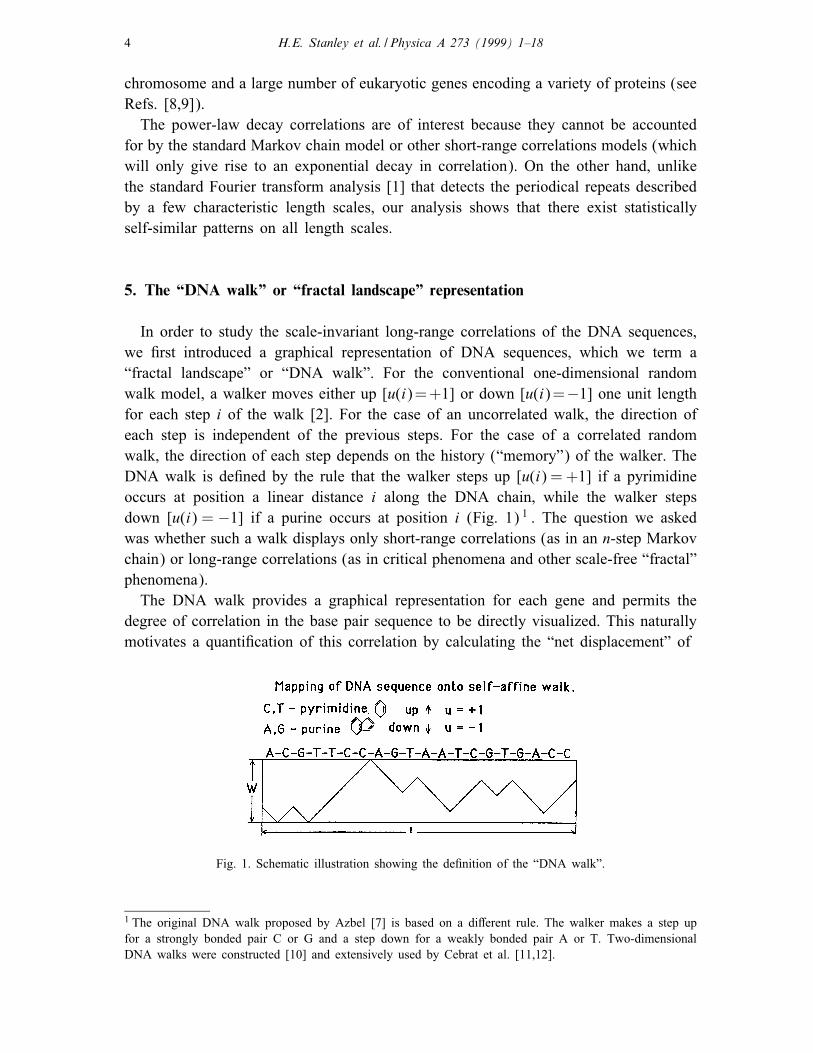
DNA walk is de�ned by the rule that the walker steps up [u(i) = +1] if a pyrimidine
occurs at position a linear distance i along the DNA chain, while the walker steps
down [u(i) = −1] if a purine occurs at position i (Fig. 1) 1 . The question we asked
was whether such a walk displays only short-range correlations (as in an n-step Markov
chain) or long-range correlations (as in critical phenomena and other scale-free “fractal”
phenomena).
The DNA walk provides a graphical representation for each gene and permits the
degree of correlation in the base pair sequence to be directly visualized. This naturally
motivates a quanti�cation of this correlation by calculating the “net displacement” of
Fig. 1. Schematic illustration showing the de�nition of the “DNA walk”.
1 The original DNA walk proposed by Azbel [7] is based on a di�erent rule. The walker makes a step up
for a strongly bonded pair C or G and a step down for a weakly bonded pair A or T. Two-dimensional
DNA walks were constructed [10] and extensively used by Cebrat et al. [11,12].
H.E. Stanley et al. / Physica A 273 (1999) 1–18 5
the walker after ‘ steps, which is the sum of the unit steps u(i) for each step i. Thus,
y(‘) ≡∑‘
i=1 u(i).
An important statistical quantity characterizing any walk [2] is the root mean square
uctuation F(l) about the average of the displacement; F(‘) is de�ned in terms of the
di�erence between the average of the square and the square of the average,
F2(‘) ≡ [�y(‘)−�y(‘)]2 = [�y(‘)]2 −�y(‘)2; (3)
of a quantity �y(‘) de�ned by �y(‘) ≡ y(‘0 + ‘) − y(‘0): Here the bars indi-
cate an average over all positions ‘0 in the gene. Operationally, this is equivalent to
(a) taking a set of calipers set for a �xed distance ‘, (b) moving the beginning
point sequentially from ‘0 = 1 to · · · and (c) calculating the quantity �y(‘) (and
its square) for each value of ‘0, and (d) averaging all of the calculated quantities to
obtain F2(‘). A similar function was �rst used to study correlations in DNA sequences
by Azbel [13].
The mean square uctuation is related to the auto-correlation function C(‘) ≡
u(‘0)=u(‘0 + l) − u(‘0)2through the relation: F2(‘) =
∑‘i=1
∑‘j=1 C(j − i). The cal-
culation of F(‘) can distinguish three possible types of behavior. (i) If the base pair
sequence were random, then C(‘) would be zero on average [except C(0) = 1], so
F(‘) ∼ ‘1=2 (as expected for a normal random walk). (ii) If there were a local cor-
relation extending up to a characteristic range R (such as in Markov chains), then
C(‘) ∼ exp(−‘=R), and for �nite values of ‘ the F(‘) function would signi�cantly
deviate from ‘1=2 [13]; nonetheless the asymptotic behavior F(‘) ∼ ‘1=2 would be
unchanged from the purely random case/. (iii) If there is no characteristic length (i.e.,
if the correlation were “in�nite-range”), then the scaling property of C(‘) would not
be exponential, but would most likely to be a power-law function, and the uctuations
will also be described by a power-law
F(‘) ∼ ‘� (4)
with � 6= 12. In fact, the F(‘) function for real DNA sequences is not a perfect
power-law, which would be true only if the log–log graph of F(‘) were a straight
line. The slope of such a graph �(‘) depends on ‘. Moreover, if a DNA sequence
consists of several large segments of di�erent base pair compositions, the slope �(‘)
would approach 1.0 for large values of ‘ [14,15]. To take into account the DNA
patchiness, the detrended uctuation analysis (DFA) method was developed [16].
The idea of the DFA method is to compute the dependence of the standard error of
a linear interpolation of a DNA walk Fd(‘) on the size of the interpolation segment ‘.
The method takes into account di�erences in local nucleotide content and may be
applied to the entire sequence which has lengthy patches. In contrast with the original
F(‘) function, which has spurious crossovers even for ‘ much smaller than a typical
patch size, the detrended function Fd(‘) shows linear behavior on the log–log plot for
all length scales up to the characteristic patch size, which is of the order of a thousand
nucleotides in the coding sequences. For ‘ close to the characteristic patch size the
log–log plot of Fd(‘) has an abrupt change in its slope.
6 H.E. Stanley et al. / Physica A 273 (1999) 1–18
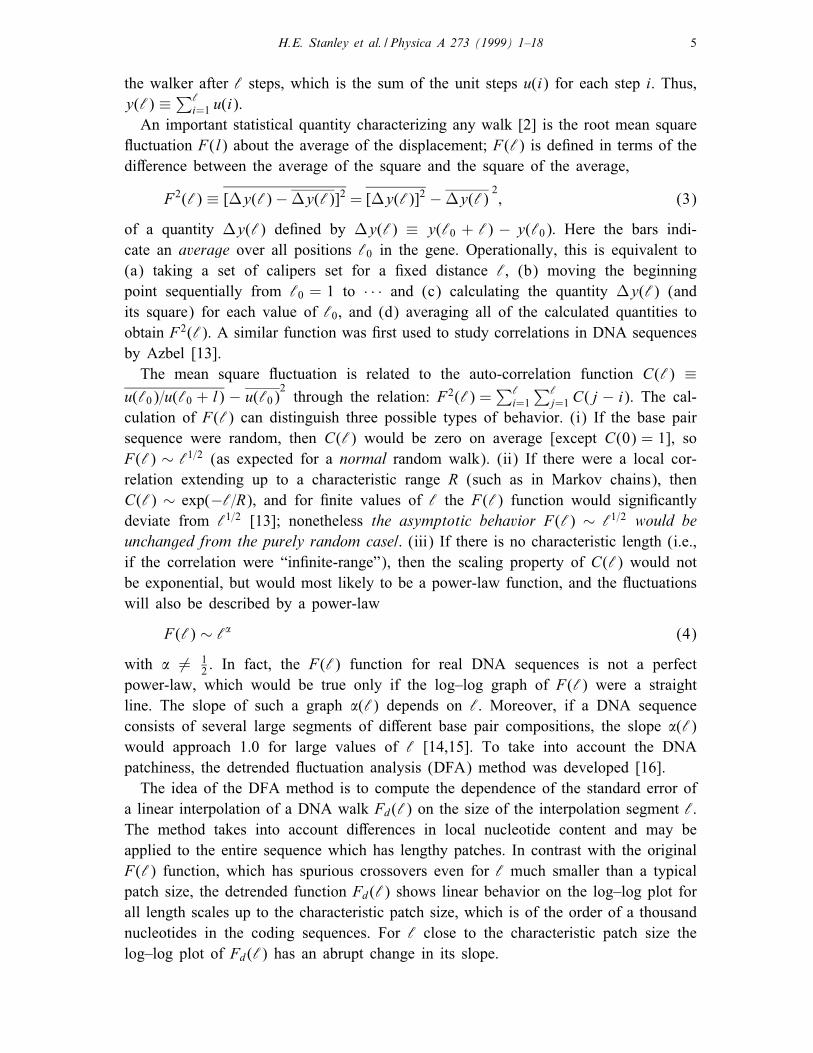
Fig. 2. (a) DNA walk for yeast chromosomes III and VIII. (b) Local exponent �(‘) measured on length
scale ‘. Note that even though the 2 chromosomes have dramatically di�erent landscapes, the �(‘) functions
are similar. Courtesy of Viswanathan [17].
Fig. 2 shows the DFA exponent �(‘) for the nine sequenced chromosomes of
Saccharomyces cerevisiae using the purine–pyrimidine rule and the hydrogen bond
energy rule. Note that although the landscapes look quite di�erent, the LRC expo-
nent �(‘) is very similar for di�erent chromosomes. For ‘¡ 1000 bp the di�erent
chromosomes have almost identical �(‘): This similarity indicates that the correlation
properties of the di�erent chromosomes are almost the same for ‘¡ 1000 bp. Note also
how the �rst couple of peaks in �(‘) roughly coincide for the di�erent chromosomes in
Fig. 2(b). This indicates that the nine chromosomes have similar patch sizes, because
peaks in �(‘) correspond to characteristic patch sizes.
The DFA method clearly supports the di�erence between coding and noncoding se-
quences, showing that the coding sequences are less correlated than noncoding
H.E. Stanley et al. / Physica A 273 (1999) 1–18 7
sequences for the length scales less than 1000, which is close to characteristic patch
size in the coding regions. One source of this di�erence is the tandem repeats (se-
quences such as AAAAAA: : :), which are quite frequent in noncoding sequences and
absent in the coding sequences [17].
6. Coding sequence �nder (CSF) algorithm
To provide an “unbiased” test of the thesis that noncoding regions possess but coding
regions lack long-range correlations, Ossadnik et al. [18] analyzed several arti�cial un-
correlated and correlated “control sequences” of size 105 nucleotides using the GRAIL
neural net algorithm [19]. The GRAIL algorithm identi�ed about 60 putative exons in
the uncorrelated sequences, but only about 5 putative exons in the correlated sequences.
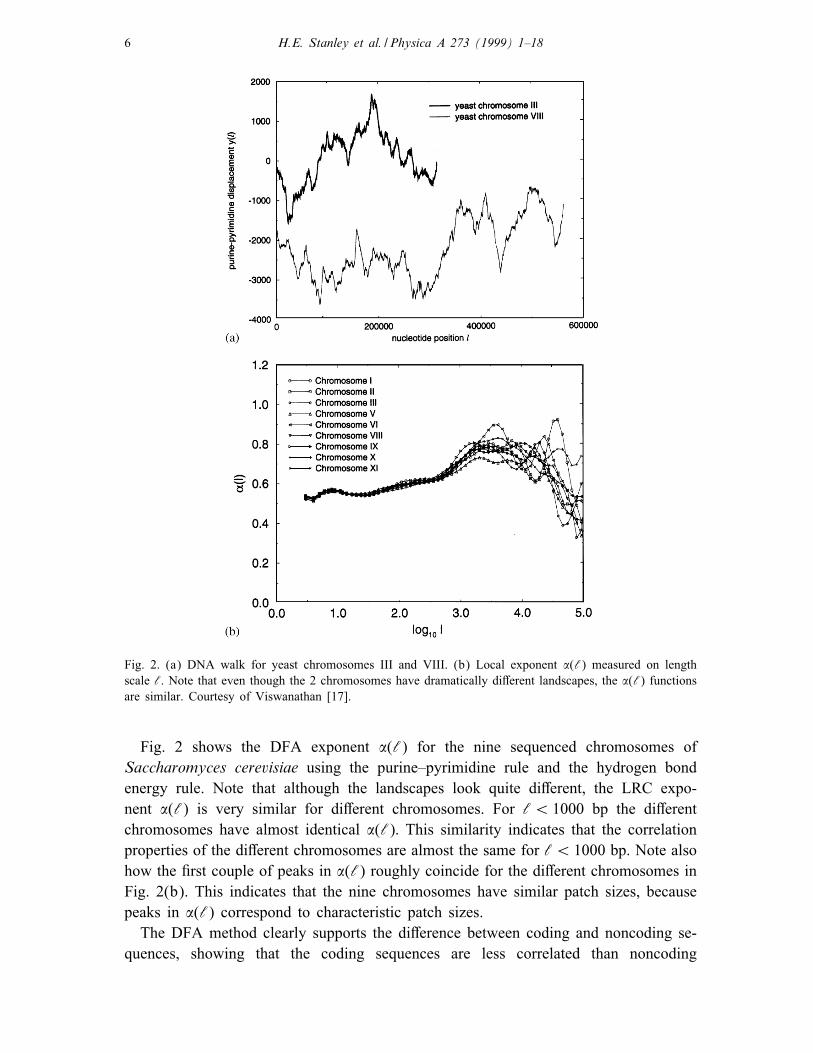
Using the DFA method, we can measure the local value of the correlation exponent
� along the sequence (see Fig. 3) and �nd that the local minima of � as a function
of a nucleotide position usually correspond to coding regions, while the local maxima
correspond to noncoding regions. Statistical analysis using the DFA technique of the
nucleotide sequence data for yeast chromosome III (315, 338 nucleotides) shows the
probability that the observed correspondence between the positions of minima and
coding regions is due to random coincidence is less than 0.0014. Thus, this method
— which we called the “coding sequence �nder” (CSF) algorithm — can be used for
�nding coding regions in the newly sequenced DNA, a potentially important application
of DNA walk analysis.
Fig. 3. (a) Analysis of section of yeast chromosome III using the sliding box Coding Sequence Finder “CSF”
algorithm. The value of the long-range correlation exponent � is shown as a function of position along the
DNA chain. In this �gure, the results for about 10% of the DNA are shown (from base pair #30 000 to base
pair #60 000). Shown as vertical bars are the putative genes and open reading frames; denoted by the letter
“G” are those genes that have been more �rmly identi�ed (March 1993 version of GenBank). Note that the
local value of � typically displays minima where genes are suspected, while between the genes � displays
maxima. This behavior corresponds to the fact that the DNA sequences of coding regions lack power-law
long range correlations (�=0:5 in the idealized limit), while the DNA sequences in between coding regions
possess power-law long range correlations (� ≈ 0:6). Parameter values: w = 800; ‘1 = 8; ‘2 = 64: (b) The
solid curve is the same as in part (a), while the dotted curve is the same analysis applied after 0.5% of the
base pairs have in the same sequence been randomly mutated. With courtesy of Ossadnik [18].
8 H.E. Stanley et al. / Physica A 273 (1999) 1–18
7. Systematic analysis of GenBank database
An open question in computational molecular biology is whether long-range correla-
tions are present in both coding and noncoding DNA or only in the latter. To answer
this question, Buldyrev et al. [20], following the idea of Voss [21], analyzed all 33
301 coding and all 29 453 noncoding eukaryotic sequences — each of length larger
than 512 base pairs (bp) — in the present release of the GenBank to determine
whether there is any statistically signi�cant distinction in their long-range correlation
properties.
They found that standard fast Fourier transform (FFT) analysis indicates that coding
sequences have practically no correlations in the range from 10 to 100 bp (spectral
exponent �± 2SD=0:00± 0:04). Here � is de�ned through the relation S(f) ∼ 1=f�,
where S(f) is the Fourier transform of the correlation function, and � is related to the
long-range correlation exponent � by � = 2� − 1 so that � = 12 corresponds to � = 0
(white noise).
In contrast, for noncoding sequences, the average value of the spectral exponent �
is positive (0:16± 0:05), which unambiguously shows the presence of long-range cor-
relations. They also separately analyzed the 874 coding and 1157 noncoding sequences
which have more than 4096 bp, and found a larger region of power-law behavior.
They calculated the probability that these two data sets (coding and noncoding) were
drawn from the same distribution, and found that it is less than 10−10. They also
obtained independent con�rmation of these �ndings using the DFA method, which is
designed to treat sequences with statistical heterogeneity such as DNAs known mosaic
structure (“patchiness”) arising from non-stationarity of nucleotide concentration. The
near-perfect agreement between the two independent analysis methods, FFT and DFA,
increases the con�dence in the reliability of the conclusion that long-range correlations
exist only in noncoding sequences.
Very recently Arneodo et al. [22–25] studied long-range correlation in DLA se-
quences using wavelet analysis. The wavelet transform can be made blind to “patch-
iness” of genomic sequences. They found the existence of long-range correlations in
noncoding regimes, and no long-range correlations in coding regimes in excellent agree-
ment with Ref. [20].
8. Analysis of noncoding DNA using methods of statistical linguistics
Long-range correlations have been found also in human writings [26,27]. A novel,
a piece of music or a computer program can be regarded as a one-dimensional string
of symbols. These strings can be mapped to a one-dimensional random walk model
similar to the DNA walk allowing calculation of the correlation exponent �. Values of �
between 0.6 and 0.9 were found for various texts.
An interesting hierarchical feature of languages was found in 1949 by Zipf [28].
He observed that the frequency of words as a function of the word order (“rank”)
H.E. Stanley et al. / Physica A 273 (1999) 1–18 9
decays as a power-law (with a power � close to−1) for more than four orders of
magnitude.
In order to adapt the Zipf analysis to DNA, the concept of word must �rst be de�ned.
In the case of coding regions, the words are the 64 3-tuples (“triplets”) which code
for the amino acids, AAA, AAT, ... GGG. However, for noncoding regions, the words
are not known. Therefore, Mantegna et al. [29,30] consider the word length n as a free
parameter, and performs analyses not only for n = 3 but also for all values of n in
the range 3–8. The di�erent n-tuples are obtained for the DNA sequence by shifting
progressively by 1 base a window of length n; hence, for a DNA sequence containing
L base pairs, we obtain L− n+ 1 di�erent words.
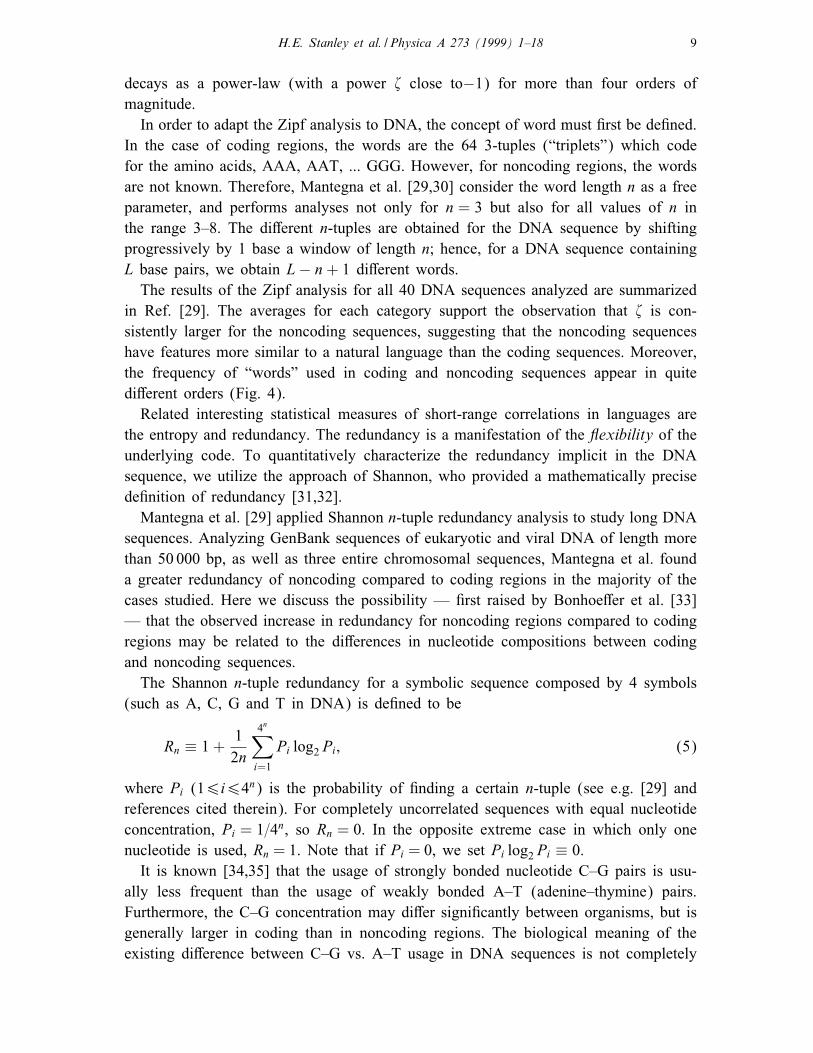
The results of the Zipf analysis for all 40 DNA sequences analyzed are summarized
in Ref. [29]. The averages for each category support the observation that � is con-
sistently larger for the noncoding sequences, suggesting that the noncoding sequences
have features more similar to a natural language than the coding sequences. Moreover,
the frequency of “words” used in coding and noncoding sequences appear in quite
di�erent orders (Fig. 4).
Related interesting statistical measures of short-range correlations in languages are
the entropy and redundancy. The redundancy is a manifestation of the exibility of the
underlying code. To quantitatively characterize the redundancy implicit in the DNA
sequence, we utilize the approach of Shannon, who provided a mathematically precise
de�nition of redundancy [31,32].
Mantegna et al. [29] applied Shannon n-tuple redundancy analysis to study long DNA
sequences. Analyzing GenBank sequences of eukaryotic and viral DNA of length more
than 50 000 bp, as well as three entire chromosomal sequences, Mantegna et al. found
a greater redundancy of noncoding compared to coding regions in the majority of the
cases studied. Here we discuss the possibility — �rst raised by Bonhoe�er et al. [33]
— that the observed increase in redundancy for noncoding regions compared to coding
regions may be related to the di�erences in nucleotide compositions between coding
and noncoding sequences.
The Shannon n-tuple redundancy for a symbolic sequence composed by 4 symbols
(such as A, C, G and T in DNA) is de�ned to be
Rn ≡ 1 +1
2n
4n∑
i=1
Pi log2 Pi ; (5)
where Pi (16i64n) is the probability of �nding a certain n-tuple (see e.g. [29] and
references cited therein). For completely uncorrelated sequences with equal nucleotide
concentration, Pi = 1=4n, so Rn = 0. In the opposite extreme case in which only one
nucleotide is used, Rn = 1. Note that if Pi = 0, we set Pi log2 Pi ≡ 0.
It is known [34,35] that the usage of strongly bonded nucleotide C–G pairs is usu-
ally less frequent than the usage of weakly bonded A–T (adenine–thymine) pairs.
Furthermore, the C–G concentration may di�er signi�cantly between organisms, but is
generally larger in coding than in noncoding regions. The biological meaning of the
existing di�erence between C–G vs. A–T usage in DNA sequences is not completely
10 H.E. Stanley et al. / Physica A 273 (1999) 1–18
H.E. Stanley et al. / Physica A 273 (1999) 1–18 11
understood at the present stage. It is possible that it is related to the mechanism of
DNA duplication during cell division [36,37].
Let us denote p(C), p(G), p(A) and p(T ), the fractional occurrence of each nu-
cleotide. We calculate the n-tuple redundancy of a DNA sequence using the simplest
assumptions of random uncorrelated distribution of nucleotides in the sequences with
p(C)=p(G)=[p(C)+p(G)]=2=x=2 and p(A)=p(T )=[p(A)+p(T )]=2=(1−x)=2:
The probability of certain n-tuple, Pi, therefore, is
Pi =xk(1− x)n−k
2n; (6)
where k is the number of C + G in this n-tuple. The total number of such n-tuples
is Ckn2n, where 2n comes from the fact that one can substitute a base pair by its
complement without changing k.
Thus, the n-tuple redundancy Rn(x) for a given concentration x of C+G is
Rn(x) = 1 +1
2n
n∑
k=0
Cknxk(1− x)n−k
[
k log2 x + (n− k) log2 (1− x)− n]
: (7)
Since∑n
k=0 Ckny
kzn−kk = y(@=@y)(y + z)n = yn(y + z)n−1, it follows that,
Rn(x) =12+ 1
2x log2 x +
12(1− x) log2(1− x): (8)
Thus, Rn(x) is independent of n and has a minimum value of 0 when x = 12also a
maximum value of 12when x = 0 or 1. For real DNA sequences, correlations exist
between base pairs. These correlations lead to an increase of n-tuple redundancy (less
random) with n. Thus, for real DNA sequences, Eq. (8) can be regarded only as the
�rst-order approximation.
Eq. (8) shows that the n-tuple redundancy strongly depends on the CG content. To
examine the e�ect of CG concentration on Rn for actual coding and noncoding DNA
sequences, we apply the following procedure:
(1) Divide the sequence into coding and noncoding subsequences using the infor-
mation from the GenBank database.
(2) Divide each coding and noncoding region into non-overlapping windows of N =
500 bp. Count the numbers of G and C, NC + NG, in this window. Compute the CG
←−−−−−−−−−−−−−−−−−−−−−−−−−−−−−−−−−−−−−−−−−−−−−−−−−−−−−−−−−−−−−−−Fig. 4. Linguistic features of noncoding DNA. (a) Log–log plot of a histogram of word frequency for the
noncoding part of Yeast Chromosome III (≈315 000 bp). The 6-character words are placed in rank order,
where rank 1 corresponds to the most frequently used word, rank 2 to the second most frequently used
word, and so forth. The straight line behavior provides evidence for a structured language in noncoding
DNA. Rainbow color code corresponds to the rank of words in the language of this sequence, which is used
as a “reference language” below. (b) Linear-log plot of word frequency histogram for the coding part of the
same chromosome. The straight line behavior shows that the coding part lacks the statistical properties of
a structured language. The colors are re-arranged, corresponding to the re-arrangements of their rank with
respect to the reference language.
12 H.E. Stanley et al. / Physica A 273 (1999) 1–18
concentration of this window x = (NC + NG)=N . Select the interval of CG concentra-
tions [xK − �x; xK + �x], which contains the obtained value x (we choose xK = 0:05K ,
K = 0; 1; 2; : : : ; 20, and �x = 0:025). Add this window to the K th “bin” of the CG
concentration.
(3) Count the n-tuple occurrences for n=1; 2; 3; 4 in each CG concentration bin for
coding and noncoding subsequences separately (n-tuples were counted as overlapping,
n-base-pair subsequences starting at any position in the sequence). Due to the �nite
length of the present available DNA sequences, we are limited to low values of n to
ensure the convergence of the measurements — implying a severe limitation in the
investigation of higher-order Markovian (or non-Markovian) processes.
(4) Using the de�nition of the n-tuple redundancy in Eq. (5), compute Rn(x) for
each bin of the CG concentration.
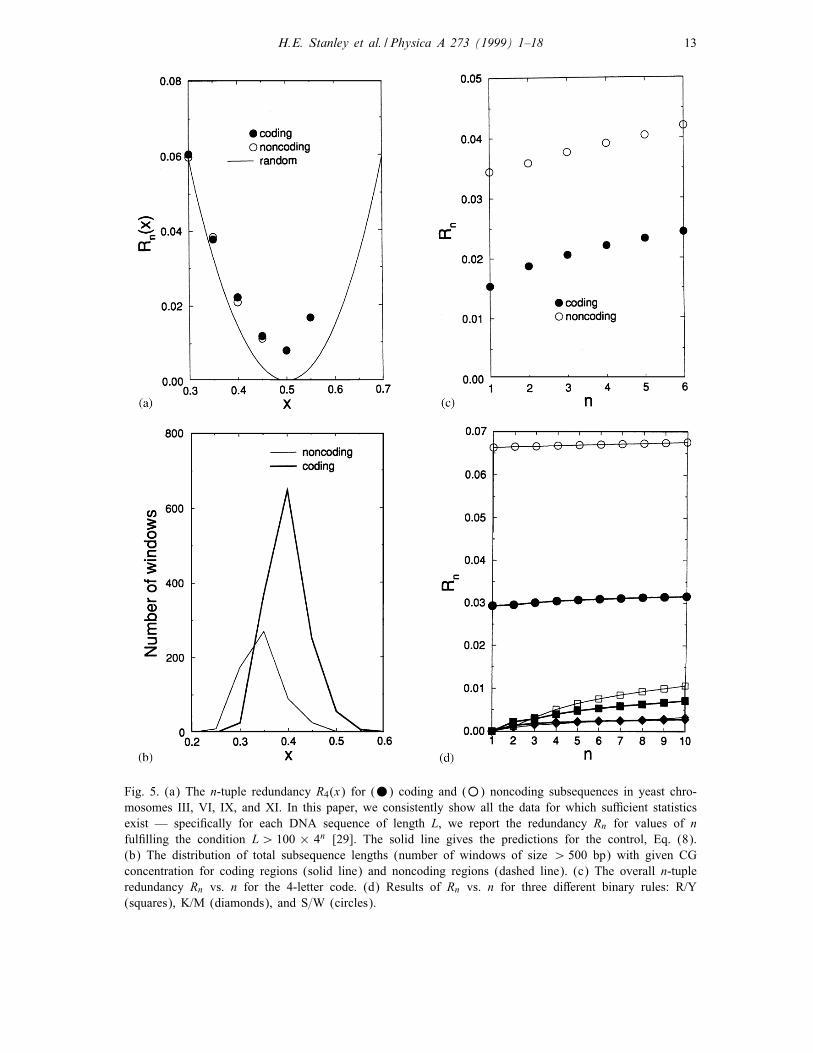
Fig. 5a represents the behavior of R4(x) vs. x for coding and noncoding subsequences
of four complete chromosomes of yeast (III, VI, IX, and XI). We note that R1(x)
(not shown in Fig. 5a) practically coincides with the theoretical estimation (shown
by a continuous line) of Eq. (8). This indicates that concentrations p(A)≈p(T ) and
p(C)≈p(G) for both coding and noncoding subsequences. For n¿ 1, the values of
Rn(x) are signi�cantly larger than the prediction of Eq. (8), indicating the presence of
correlations between nucleotides. Note that the values of Rn(x) for coding and noncod-
ing subsequences display very small di�erences (Fig. 5). However, the histogram of
number of windows with di�erent CG concentration is quite di�erent for coding and
noncoding subsequences (see Fig. 5b). For example, for yeast, the maximum of the
distribution of coding is at xc ≈ 0:4, while for noncoding it is xnc ≈ 0:35. These max-
ima make the main contribution to the overall n-tuple redundancy (computed without
separating di�erent CG concentration regions). Since Rn(xc)¡Rn(xnc), the overall
n-tuple redundancy for coding DNA is expected to be lower than for noncoding DNA
(see Fig. 5c). This is consistent with previous results [29]. Similarly, the CG concentra-
tion has a strong e�ect for most other sequences from the GenBank. We have separately
analyzed groups of sequences belonging to the categories of plants, invertebrates, and
vertebrates.
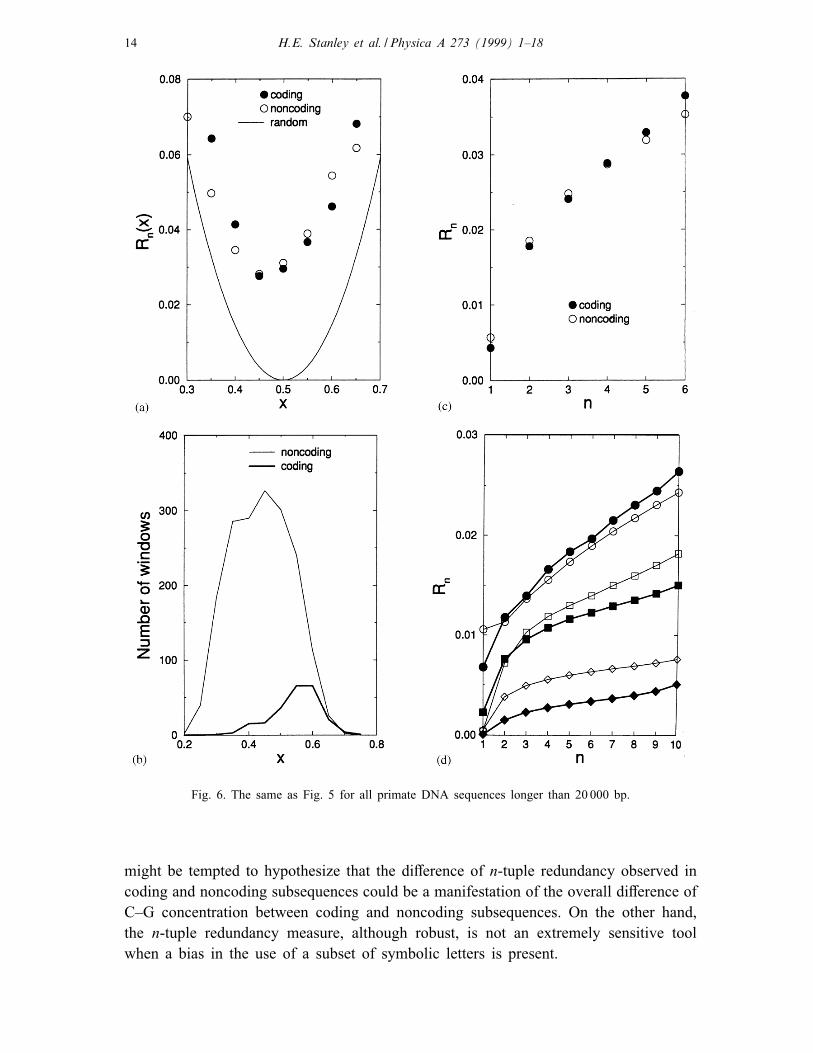
Of particular interest are the long primate sequences (larger than 20 000 bp) presented
in Fig. 6. Note that for primate sequences xc ≈ 0:6, while xnc ≈ 0:4 (see Fig. 6b),
which have roughly the same value of Rn(x), since now xc and xnc are symmetrically
located on di�erent sides of the minima of Rn(x). That may explain why the overall
n-tuple redundancy for coding and noncoding subsequences in primates is practically
indistinguishable (see Fig. 6c). The general term “noncoding DNA” means intergenic
for yeast and intronic DNA for primates (the results for intergenic subsequences for
primates are roughly intermediate between the results obtained for introns and those
for coding DNA). The data for several groups of vertebrates present in the GenBank
are similar to those for primates, while the data for C. elegans are similar to that of
yeast.
These �ndings indicate that the non-uniform nucleotide base concentration has a
signi�cant e�ect on the n-tuple Shannon redundancy. Therefore, at �rst glance one
H.E. Stanley et al. / Physica A 273 (1999) 1–18 13
Fig. 5. (a) The n-tuple redundancy R4(x) for (•) coding and (◦) noncoding subsequences in yeast chro-mosomes III, VI, IX, and XI. In this paper, we consistently show all the data for which su�cient statistics
exist — speci�cally for each DNA sequence of length L, we report the redundancy Rn for values of n
ful�lling the condition L¿ 100 × 4n [29]. The solid line gives the predictions for the control, Eq. (8).
(b) The distribution of total subsequence lengths (number of windows of size ¿ 500 bp) with given CG
concentration for coding regions (solid line) and noncoding regions (dashed line). (c) The overall n-tuple
redundancy Rn vs. n for the 4-letter code. (d) Results of Rn vs. n for three di�erent binary rules: R/Y
(squares), K/M (diamonds), and S=W (circles).
14 H.E. Stanley et al. / Physica A 273 (1999) 1–18
Fig. 6. The same as Fig. 5 for all primate DNA sequences longer than 20 000 bp.
might be tempted to hypothesize that the di�erence of n-tuple redundancy observed in
coding and noncoding subsequences could be a manifestation of the overall di�erence of
C–G concentration between coding and noncoding subsequences. On the other hand,
the n-tuple redundancy measure, although robust, is not an extremely sensitive tool
when a bias in the use of a subset of symbolic letters is present.
H.E. Stanley et al. / Physica A 273 (1999) 1–18 15
To systematically examine whether the di�erences in Rn between coding and non-
coding regions are completely due to variations in CG content, we need to study the
n-tuple redundancy after the e�ect of di�erent concentration is removed. In order to
do this, we map the 4 symbols onto a binary code in which C is one element and G
the other. There are two such binary rules: (i) the R/Y rule, where R denotes a purine
(A or G), and Y denotes a pyrimidine (C or T), and (ii) the K/M rule, where K
denotes G or T and M denotes A or C. As a “control”, we also carry out parallel
studies of the third binary rule that do not distinguish C and G, (iii), the S/W rule,
where S (“strong”) denotes C or G, and W (“weak”) denotes A or T.
We �rst demonstrated that while the C and G concentrations of coding and noncoding
are quite di�erent, the R and Y concentrations are almost identical — as are the
concentrations of K and M. Our results for the function Rn using each of the 3 rules
are shown for representative systems, yeast in Fig. 5d and primates in Fig. 6d.
Perhaps not surprisingly, the S/W rule leads to similar results as the 4-letter rule
(shown in Fig. 5c), thus con�rming that CG concentration makes a strong “background”
contribution to any possible di�erences between noncoding and coding subsequences.
However, for the R/Y rule, Figs. 5d and 6d show that, the noncoding subsequences
have larger redundancy than the coding subsequences. Note that these di�erences are
much smaller than the di�erences generated by CG concentration e�ect, so will not
be visible in 4-symbol analysis. The di�erence in redundancy of coding and noncod-
ing DNA for the RY rule may be related to the abundance of repeats in noncoding
sequences (relative to coding) [38].
In summary, we have seen that nucleotide concentration di�erences may play a ma-
jor role in the n-tuple redundancy statistics, so more sophisticated analysis methods
that take into account this concentration e�ect are required. When we map the DNA
sequences to binary symbolic sequences according to the R/Y rule that is indepen-
dent of C–G concentration, the dominant “background” e�ect of CG concentration is
eliminated. Moreover, we still observe higher n-tuple redundancy for noncoding sub-
sequences. This higher redundancy cannot be simply attributed to the concentration
e�ect.
9. Outlook for the future
There is a mounting body of evidence suggesting that the noncoding regions of DNA
are rather special for at least two reasons:
(1) They display long-range power-law correlations, as opposed to previously be-
lieved exponentially decaying correlations.
(2) They display features common to hierarchically structured languages — speci�-
cally, a linear Zipf plot and a non-zero redundancy.
These results are consistent with the possibility that the noncoding regions of DNA
are not merely “junk” but rather have a purpose. What that purpose could be is the
subject of ongoing investigation. In particular, the apparent increase of � with evolution
[39] could provide insight.
16 H.E. Stanley et al. / Physica A 273 (1999) 1–18
In the event that the purpose is not profound, our results nonetheless may have
important practical value since quanti�able di�erences between coding and noncoding
regions of DNA can be used to help distinguish the coding regions [18]. The results
of the systematic and inclusive analysis of GenBank DNA sequences are notable for
two major reasons.
(i) The GenBank data unambiguously demonstrate that noncoding DNA, but not
coding DNA, possesses long-range correlations. This �nding is made using two in-
dependent, complementary techniques: Fourier analysis and DFA, a modi�cation of
root-mean-square analysis of random walks. Indeed, as shown in Tables I and II of
Ref. [20], the spectral exponent � computed by both techniques for the same sequence,
is nearly identical.
(ii) The GenBank data demonstrate an increase in the complexity of the noncoding
DNA sequences with evolution. The value of � for vertebrates is signi�cantly greater
than that for invertebrates. This �nding based on the full GenBank data set supports
the suggestion based upon a systematic study of the myosin heavy gene family that
there is an apparent increase in the complexity of noncoding DNA for more highly
evolved species compared to less evolved ones [39].
The ultimate meaning of long-range correlations is still not clear. It is possible
that they are related to the spatial con�guration of DNA [40]. It is also possible
that long-range correlations exist also in other systems of biological interest. For ex-
ample, the idea of long-range correlations has been extended to the analysis of the
beat-to-beat intervals in the normal and diseased heart [41–44], to weather [45], and to
human gait [46]. The healthy heartbeat is generally thought to be regulated according
to the classical principle of homeostasis whereby physiologic systems operate to reduce
variability and achieve an equilibrium-like state [47]. We �nd, however, that under nor-
mal conditions, beat-to-beat uctuations in heart rate display the kind of long-range cor-
relations typically exhibited by physical dynamical systems far from equilibrium, such
as those near a critical point. Speci�cally, we �nd evidence for such power-law corre-
lations that extend over thousands of heartbeats in healthy subjects. In contrast, heart
rate time series from patients with severe congestive heart failure show a breakdown
of this long-range correlation behavior, with the emergence of a characteristic short-
range time scale. Similar alterations in correlation behavior may be important in mod-
eling the transition from health to disease in a wide variety of pathologic conditions
[48–50].
Acknowledgements
We are grateful to many individuals, including R.N. Mantegna, M.E. Matsa, S.M.
Ossadnik, and F. Sciortino, for major contributions to those results reviewed here that
represent collaborative research e�orts. We also wish to thank C. Cantor, C. DeLisi,
M. Frank-Kamenetskii, A.Yu. Grosberg, G. Huber, I. Labat, L. Liebovitch, G.S. Michaels,
P. Munson, R. Nossal, R. Nussinov, R.D. Rosenberg, J.J. Schwartz, M. Schwartz,
H.E. Stanley et al. / Physica A 273 (1999) 1–18 17
E.I. Shakhnovich, M.F. Shlesinger, N. Shworak, and E.N. Trifonov for valuable dis-
cussions. Partial support was provided by the National Science Foundation, National
Institutes of Health (Center for Biomedical Signals and Human Genome Project), the
G. Harold and Leila Y. Mathers Charitable Foundation, the National Heart, Lung and
Blood Institute, the National Aeronautics and Space Administration, the Israel-USA
Binational Science Foundation, Israel Academy of Sciences, and (to C-KP) by an
NIH=NIMH Postdoctoral NRSA Fellowship.
References
[1] S. Tavar�e, B.W. Giddings, in: M.S. Waterman (Ed.), Mathematical Methods for DNA Sequences, CRC
Press, Boca Raton, FL, 1989, pp. 117–132, and refs. therein.
[2] E.W. Montroll, M.F. Shlesinger, in: J.L. Lebowitz, E.W. Montroll (Eds.), Nonequilibrium Phenomena
II. From Stochastics to Hydrodynamics, North-Holland, Amsterdam, 1984, pp. 1–121.
[3] H.E. Stanley, N. Ostrowsky (Eds.), On Growth and Form: Fractal and Non-Fractal Pattern in Physics,
Martinus Nijho� Publishers, Dordrecht, 1986.
[4] A. Bunde, S. Havlin (Eds.), Fractals and Disordered Systems, Springer, Berlin, 1991.
[5] P.G. de Gennes, Scaling Concepts in Polymer Physics, Cornell University Press, Ithaca NY, 1979.
[6] J. des Cloiseaux, J. Phys. (Paris) 41 (1980) 223.
[7] M.Y. Azbel, Phys. Rev. Lett. 31 (1973) 589.
[8] C.-K. Peng, S.V. Buldyrev, A.L. Goldberger, S. Havlin, F. Sciortino, M. Simons, H.E. Stanley, Nature
356 (1992) 168.
[9] W. Li, K. Kaneko, Europhys. Lett. 17 (1992) 655.
[10] C.L. Berthelsen, J.A. Glazier, M.H. Skolnick, Phys. Rev. A 45 (1992) 8902.
[11] S. Cebrat, M.R. Dudek, Eur. Phys. J. B 3 and 117 (1998) 271, 78.
[12] S. Cebrat, M.R. Dudek, A. Gierlik, M. Kowalczuk, P. Mackiewicz, Physica A 265 (1999) 78.
[13] M.Y. Azbel, Biopolymers 21 (1982) 1687.
[14] M.Y. Azbel, Phys. Rev. Lett. 75 (1995) 168.
[15] S. Karlin, V. Brendel, Science 259 (1993) 677.
[16] C.-K. Peng, S.V. Buldyrev, S. Havlin, M. Simons, H.E. Stanley, A.L. Goldberger, Phys. Rev. E 49
(1994) 1685.
[17] G.M. Viswanathan, S.V. Buldyrev, S. Havlin, H.E. Stanley, Biophys. J. 72 (1997) 866.
[18] S.M. Ossadnik, S.V. Buldyrev, A.L. Goldberger, S. Havlin, R.N. Mantegna, C.-K. Peng, M. Simons,
H.E. Stanley, Biophys. J. 67 (1994) 64.
[19] E.C. Uberbacher, R.J. Mural, Proc. Nat. Acad. Sci. USA 88 (1991) 11 261.
[20] S.V. Buldyrev, A.L. Goldberger, S. Havlin, R.N. Mantegna, M.E. Matsa, C.-K. Peng, M. Simons, H.E.
Stanley, Phys. Rev. E 51 (1995) 5084.
[21] R. Voss, Phys. Rev. Lett. 68 (1992) 3805.
[22] A. Arneodo, E. Bacry, P.V. Graves, J.F. Mugy, Phys. Rev. Lett. 74 (1995) 3293.
[23] A. Arneodo, Y. d’Aubenton-Carafa, E. Bacry, P.V. Graves, J.F. Muzy, C. Thermes, Physica D 96
(1996) 291.
[24] A. Arneodo, Y. d’Aubenton-Carafa, B. Audit, E. Bacry, J.F. Muzy, C. Thermes, Eur. Phys. J. B 1
(1998) 259.
[25] A. Arneodo, Y. d’Aubenton-Carafa, B. Audit, E. Bacry, J F. Muzy, C. Thermes, Physica A 249 (1998)
439.
[26] A. Schenkel, J. Zhang, Y-C. Zhang, Fractals 1 (1993) 47.
[27] M. Amit, Y. Shmerler, E. Eisenberg, M. Abraham, N. Shnerb, Fractals 2 (1994) 7.
[28] G. K. Zipf, Human Behavior and the Principle of “Least E�ort”, Addison-Wesley, New York, 1949.
[29] R.N. Mantegna, S.V. Buldyrev, A.L. Goldberger, S. Havlin, C.-K. Peng, M. Simons, H.E. Stanley, Phys.
Rev. Lett. 73 (1994) 3169.
[30] R.N. Mantegna, S.V. Buldyrev, A.L. Goldberger, S. Havlin, C.-K. Peng, M. Simons, H.E. Stanley, Phys.
Rev. E 52 (1995) 2939.
18 H.E. Stanley et al. / Physica A 273 (1999) 1–18
[31] L. Brillouin, Science and Information Theory, Academic Press, New York, 1956.
[32] C.E. Shannon, Bell Systems Technol. J. 80 (1951) 50.
[33] S. Bonhoe�er, A.V.M. Herz, M.C. Boerlijst, S. Nee, M.A. Nowak, R.M. May, Phys. Rev. Lett. 76
(1996) 1977.
[34] J.D. Watson, M. Gilman, J. Witkowski, M. Zoller, Recombinant DNA, Scienti�c American Books, New
York, 1992.
[35] W.-H. Li, D. Graur, Fundamentals of Molecular Evolution, Sinauer Associates, Sunderland MA, 1991.
[36] X. Gu, W.-H. Li, J. Mol. Evol. 38 (1994) 468.
[37] S.V. Buldyrev, N.V. Dokholyan, A.L. Goldberger, S. Havlin, C.-K. Peng, H.E. Stanley, G.M.
Viswanathan, Physica A 249 (1998) 430.
[38] S.V. Buldyrev et al., Physica A 273 (1999) 19–32 [these proceedings].
[39] S.V. Buldyrev, A.L. Goldberger, S. Havlin, C.-K. Peng, H.E. Stanley, M.H.R. Stanley, M. Simons,
Biophys. J. 65 (1993) 2673.
[40] A.Yu. Grosberg, Y. Rabin, S. Havlin, A. Neer, Europhys. Lett. 23 (1993) 373.
[41] C.-K. Peng, J. Mietus, J. Hausdor�, S. Havlin, H.E. Stanley, A.L. Goldberger, Phys. Rev. Lett. 70
(1993) 1343.
[42] C.-K. Peng, S. V. Buldyrev, J.M. Hausdor�, S. Havlin, J.E. Mietus, M. Simons, H.E. Stanley, A.L.
Goldberger, in: G.A. Losa, T.F. Nonnenmacher, E.R. Weibel (Eds.), Fractals in Biology and Medicine,
Birkhauser Verlag, Boston, 1994.
[43] C.K. Peng, S. Havlin, H.E. Stanley, A.L. Goldberger, Chaos 5 (1995) 82.
[44] C. K. Peng, J.M. Hausdor�, J.E. Mietus, S. Havlin, H.E. Stanley, A.L. Goldberger, in: U. Frisch, M.F.
Shlesinger, G. Zaslavsky (Eds.), Proceedings of the 1993 International Conference on L�evy Flights,
Springer, Berlin, 1995.
[45] E. Koscielny-Bunde, A. Bunde, S. Havlin, H.E. Roman, Y. Goldreich, H.-J. Schellnhuber, Phys. Rev.
Lett. 81 (1998) 729.
[46] J.M. Hausdor�, C.-K. Peng, Z. Ladin. J.Y. Wei, A.L. Goldberger, J. Appl. Physiol. 78 (1995) 349.
[47] W.B. Cannon, Physiol. Rev. 9 (1929) 399.
[48] P.Ch. Ivanov, M.G. Rosenblum, C.-K. Peng, J. Mietus, S. Havlin, H.E. Stanley, A.L. Goldberger, Nature
383 (1996) 323.
[49] P.Ch. Ivanov, L.A.N. Amaral, A.L. Goldberger, H.E. Stanley, Europhys. Lett. 43 (1998) 363.
[50] P.Ch. Ivanov, L.A.N. Amaral, A.L. Goldberger, S. Havlin, M.G. Rosenblum, Z. Struzik, H.E. Stanley,
Nature 399 (1999) 461.


