Embed Size (px)
Citation preview
L. Marshall et al. DC potential shifts during nocturnal sleep 1167
European Journal of Neuroscience Vol. 10. pp. 1167-1178, 1998
Scalp recorded direct current brain potentials during human sleep Lisa Marshall,1, Matthias Mölle,1, Horst L. Fehm2 and & Jan Born1,3 1 Department of Clinical Neuroendocrinology, Medical University of Lübeck, 23538 Lübeck, Germany, 2Department of Internal Medicine, Medical University of Lübeck, 23538 Lübeck, Germany, 3Department of Physiological Psychology, University of Bamberg, 96045 Bamberg, Germany Abstract The direct current (DC) potential recorded from the scalp of awake humans has been considered a reflection of general changes in cortical excitability. This study examined DC potential shifts in humans during a night of continuous sleep. Standard polysomnographic recordings and skin temperature were measured simultaneously. Contrary to expectations, average DC potential level indicated higher negativity during nonrapid eye movement (NREM) sleep than REM sleep and wakefulness. Moreover, a dynamic regulation of the DC potential level was revealed in association with the NREM-REM sleep cycle comprising four successive phases: (i) a steep NREM transition negative shift during the initial 10-15 min of the NREM sleep period; (ii) a more subtle NREM positive slope during the subsequent NREM sleep period; (iii) a steep REM transition positive shift starting shortly prior to the REM sleep period, and (iv) a REM negative slope ,
characterizing the remaining greater part of the REM sleep period. DC potential changes were only weakly related to changes in slow wave activity (r 2< 0.18). The NREM negative slope and REM positive slope could reflect, respectively, gradually increasing and decreasing cortical excitability resulting from widespread changes in the depolarization of apical dendrites. In contrast, the NREM transition negative shift and the REM transition positive shift may reflect the progression and retrogression, respectively, of a long lasting hyperpolarization in deeply lying neurons. Correspondence: L. Marshall, as abouve. E-mail: [email protected] Introduction
Direct current (DC) potentials recorded from the cortical surface or scalp are considered primarily to be neuronal in origin (e.g. Caspers et al. 1984). Approximations based on electrodynamic principles led to the assumption that widespread cortical activity is essential in producing large amplitude surface potentials in humans (Birbaumer et al. 1990; Elbert 1993). It has become established to associate negative DC or slow potential shifts with widespread synchronized membrane depolarizations of pyramidal apical dendrites. The electrogenesis of positive shifts is less firmly established, and may merely result from a reduction in surface negativity. However, field potentials generated by sources in deeper cortical layers, i.e. widespread hyperpolarization in these layers, may also produce a superficial potential of negative polarity (Mitzdorf 1985; Creutzfeldt 1995). Shifts of the DC potential may also reflect modifications in the recently described slow oscillations (< 1 Hz) emerging in association with synchronized sleep (Steriade et al. 1993a) and/or in the infraslow potential oscillations (T 8 s, and 1 min, Aladjalova 1964).
According to one of the few comprehensive theories, proposed by the group of Birbaumer and Elbert, slow cortical DC potential changes during wakefulness can be described as a measure reflecting a tonic tuning of excitability of cortical neuronal networks, apparently only loosely linked to the faster, oscillatory activity of the electroencephalogram (EEG), and the transitory pro-cessing of discrete elements of incoming information (Elbert & Rockstroh 1987; Birbaumer et al. 1990; for related references: Born et al. 1982; Stamm et al. 1987; McCallum 1993). A distinct regulation of excitability within widespread cortical neuronal networks presumably also occurs in association with sleep, possibly serving functions of cortical information processing specifically related to this state of consciousness, e.g. the formation of memory (Tilley et al. 1992; Cipolli 1995; Sejnowski 1995; Buszáki 1996).
Distinct DC potential shifts in association with different states of sleep and wakefulness have been described in several studies in various animal species (cp. Caspers 1993). DC potential recordings have usually been found to shift toward positive values at the transition from wakefulness to sleep, with increasing positivity occurring with the development of slow wave sleep; negative going shifts from wakefulness to slow wave sleep have, however, also been reported (cp. Bechtereva 1974 for a review). In humans, at the transition from wakefulness to sleep, a negative DC displacement has been found repeatedly (Hoffmann et al. 1988; Marshall et al. 1994, Marshall et al. 1996a). The recording of DC potentials from the human scalp throughout the whole nocturnal sleep period has not been thoroughly documented as yet (Davis et al. 1939). This derives from difficulties in avoiding biological and technical artifacts, e.g. a nonstable recording system, potential drifts related to fluctuations in electrode/electrolyte equilibrium, temperature, blood gas tension, and to drifts related to skin potentials, or movements of the subject (Butler 1993; Caspers 1993). However, provided a thorough control of these artifact sources, extensive investigations have yielded strong evidence that DC potentials recorded from the scalp reflect essentially cortical activity (e.g. Rockstroh & McCallum 1993).
The aim of the present study was to measure DC potential shifts during the entire period of normal nocturnal sleep in humans. Distinct potential levels in relation to the sleep wake activity, as well as to the NREM-REM sleep cycle were awaited. Based on findings in animals, it was hypothesized, (i) that the sleep period would reveal a mean potential level on average more positive than during wakefulness, coherent with a reduced level of cortical excitability during sleep, and (ii) that REM sleep would be associated with transient increases in superficial negativity. Preliminary findings of this experiment have been reported previously in abstract form (Marshall et al. 1996b).
L. Marshall et al. DC potential shifts during nocturnal sleep 1168
Materials and methods Subjects and procedure Eight subjects (four men, four women) aged 25.6 ± 0.9 years (mean ± SEM) voluntarily participated in two night sessions, i.e. one night to accustom subjects to the laboratory and one experimental night. Before the adaptation night, subjects had practised at home during three consecutive nights to sleep throughout the night lying on their back while wearing an orthopaedic cervical collar (Philadelphia, Brevete, Canada), which restrained the head so that its movement in relation to the body was prevented. Volunteers reporting not being able to sleep for at least 5 h in such a fashion at home were excluded from the study before participating in the adaptation night. By such screening, eight subjects had been immediately discarded. Procedures in the adaptation night were identical with those in the experimental night, except in the former, electrodes for DC potential recording were not applied and subjects arrived at the laboratory 2 h later. Application of electrodes for DC potential recording during the adaptation night was deemed unnecessary since once applied, subjects cannot discriminate between electrodes for regular EEG and DC potential recording. Subjects had no history of sleep disturbances, nor did they take any medication at the time of the experiments. They usually went to bed before 24 h and got up between 06:00 and 07:30 h. They had been instructed to go to sleep at 23:00 h, to get up at 06:30 h, not to take a nap on the day of the experimental session, and to restrain from caffeinated and alcoholic drinks in the afternoon of the experimental day. The studies took place in a sleep laboratory at the Medical University of Lübeck, and the experimental protocol was approved by the local ethics committee.
On the experimental day, the subject arrived at the laboratory at 19:00 h to prepare recordings of (i) DC potentials, (ii) skin temperature and (iii) standard polysomnographical measures. At 22:00 h the subject was assigned to bed. The cervical collar (used during home practice) was fitted around the subject s neck and the subject was to position him /herself comfortably in a supine position, whereby head and neck rested in the headshaped cavity of a foam rubber cushion (Bisanz, GauAlgesheim, Germany). Subsequently, the cervical collar was fastened onto the cushion, thus, suppressing head movement. Prior investigations had shown it essential to restrict especially head movements during nocturnal DC potential recordings to exclude artefacts caused by movement and external temperature changes at the recording locations. For this reason, subjects were to maintain their supine position throughout the night, with electrode locations limited to frontal and central cortical areas.
When lights were turned off at 23:00 h, the subject was asked to close his/her eyes, but to maintain wakefulness while lying quietly over the next 10-15 min. To control wakefulness and induce a defined mental state during this period, the subject was to keep mental count of time and gently press a hand held button every estimated 30 s. Withdrawal of the button press device signalled to the subject to try to maintain wakefulness for a few more minutes, and then succumb to sleep. Subjects had been instructed to lie quietly and avoid any gross movements throughout the whole period of experimental recordings. At 06:30 h, a dim light was turned on and subjects gently awakened. They were again given the button press device in order to control wakefulness and induce a stable mental state for another 10-15 min. Since subjects and their polysomnographic recordings were monitored, if subjects awoke spontaneously after 06:00 h they were given the
button press device at that time. In the adaptation night, the procedure was the same as in the experimental night, with the exception of the DC potential measurement. Recording DC potential recordings were obtained from electrodes located at F3, F4, C3, C4 (International 10 20 6System, (Jasper 1958), FC3 and FC4. Locations FC3 and FC4 were positioned halfway between F3 and C3, and F4 and C4, respectively. All electrodes were referenced to linked electrodes attached at the mastoids. The ground electrode was positioned in the centre of the forehead. In applying the electrodes, care was taken to avoid possible contamination from skin potentials (Picton & Hillyard 1972). After rubbing the scalp site thoroughly with alcohol, a clip on electrode socket (Bauer et al. 1989) was attached with collodion, and the scalp punctured with a sterile hypodermic needle until minor bleeding occurred. Electrode gel (Electrode Electrolyte, TECA Corp., NY, USA) was applied to the socket, and the electrode, also filled with gel, was clipped on. Non polarizable Ag/AgCl electrodes (8 mm diameter, ZAK GmbH, Simbach/Inn, Germany) were used. Air bubbles had been previously eliminated from the electrode gel by centrifugation (1300 U/min for 3 h at 10 °C) and care was taken not to produce any air bubbles when clipping electrodes onto their sockets. Electrodes, as well as electrode gel for DC potential recordings, were kept and applied in the same room and at the same ambient temperature as that under recording conditions. Prior to use, DC electrodes had been connected pairwise via electrode gel for at least 7 h to reduce any electrode bias potential (Girton & Kamiya 1974). Electrodes for DC recordings were attached at least 1 h prior to the beginning of experimental recordings, a time sufficient to allow for the skin electrode interface to stabilize. Electrode impedance was measured immediately after application of all electrodes as well as at the very end of the recording session, and was usually below 2 kOhm, and always below 5 kOhm.
A direct current amplifier (Toennies DC/AC amplifier, Jaeger GmbH & Co. KG, Würzburg, Germany, input resistance 2 100 MOhm) was used for recording and amplification of DC potentials. With short circuited input, the amplifier drifts, if present, were below 3 V/h. The amplification was set at 1000 fold, the low pass filter at 10 Hz, and the threshold for automatic DC offset correction at ± 4 mV. Analog DC signals were digitized (CED 1401, Cambridge Electronic Design Ltd, UK) at a rate of 50 Hz per channel and stored on a PC together with a time marker (every 30 s) for off line analysis.
Skin temperature was measured every 32 s from three temperature probes, one near each mastoid reference and one on the scalp in the vicinity of C3 or C4. Temperature data were stored by a digital Mini logger (± 0.1 °C level of accuracy, Mini Mitter, Sunriver, OR, USA). Derivations for standard polysomnographic sleep recordings of EEG (Fz, Cz), electrooculogram, and submental electromyogram were obtained using nonpolarizable Ag/AgCl electrodes (diameter 8 mm, Sensormedics, The Netherlands), signals were amplified by a Nicolet electroencephalograph, and written together with the 30 s time marker on paper for polysomnographic scoring. Data processing and statistical analysis To adapt all data to a common mean time scale, average values of DC potentials and skin temperature were calculated for 30 s epochs. Correspondingly, sleep stages (1, 2, 3, 4, REM sleep, and wake time) and movement artefacts were scored off line for 30 s
L. Marshall et al. DC potential shifts during nocturnal sleep 1169
intervals, according to the criterion of (Rechtschaffen & Kales 1968), using the standard polysomnographical sleep recordings.
With regard to DC potentials, resettings due to the amplifier s automatic DC offset correction were removed by adding the offset value to the successive potential values. Epochs of EEG revealing movement times as defined by (Rechtschaffen & Kales 1968) occurred utmost seldom (three times), and any transient DC potential shift occurring simultaneously was eliminated. Two approaches were chosen to examine the time course of the DC potential: (i) The time course was examined for the total night, composed of a short epoch of wakefulness in the evening, the long interval of nocturnal sleep, and a final short epoch of morning wakefulness. (ii) The time course of the DC potential was also analysed with reference to successive NREM-REM sleep cycles during sleep. For calculating grand means of the DC potential, data points of all subjects were transformed to a common mean time scale based on the mean durations of the respective epochs of wakefulness and sleep time (when the total night was examined), or of NREM and REM sleep (when the relation to the NREM-REM sleep cycle was examined). For analysis of the course of the DC potential during the total night, the average potential during the initial epoch of wakefulness was set to 0 V. Analyses were then conducted for original DC potential values, but also after linear trends had been removed, separately, for each electrode and subject (Hennighausen et al. 1993). Analyses of the DC potential with reference to the NREM-REM sleep cycle were performed after linear trends occurring across the corresponding epoch had been removed from the DC potential data. In these latter analyses, the first 10 data points for a certain time interval of interest were set to 0 V.
Based on classical sleep scoring according to (Rechtschaffen & Kales 1968), for each experimental night, sleep onset latency (with reference to the time when the button press device was withdrawn), total sleep time, time and percentage of time spent in the different sleep stages and in wakefulness were determined. In addition, latencies of sleep stages with reference to sleep onset were determined. The beginning of sleep was defined as the time when a subject passed from wakefulness to sleep stage 1 followed by a period of stage 2 sleep, without intermediate awakening. NREM and REM sleep periods and their completion were defined according to (Feinberg & Floyd 1979), i.e. besides a 15 min minimum for NREM sleep periods, the last NREM sleep period of the night was considered complete if it was followed by 5 min or longer of REM sleep before awakening. Similarly, the last REM sleep period was considered complete if followed by 5 min or longer of NREM sleep. During the night, episodes of REM sleep were considered to constitute a REM sleep period if at least 5 min in duration, except for the first REM sleep period, for which no minimum length was stipulated. A REM sleep episode interrupted by less than 5 min of continuous NREM sleep or wakefulness was treated as a single REM sleep period. Likewise, a NREM sleep episode interrupted by less than 5 min of continuous REM sleep or wakefulness was treated as a single NREM sleep period if, as mentioned above, at least 15 min in duration. The number and duration of awakenings were calculated for the entire interval of sleep, and for the NREM and REM sleep periods. Average durations of the NREM and REM sleep periods, which included the above mentioned short interruptions, were also determined (cp. legends to Figs 4, 6 and 7).
For a more fine grained analysis of the relation between DC potential changes and NREM sleep, slow wave activity
(SWA) was also determined. SWA (i.e. power density within the delta frequency band) represents a continuous measure of NREM sleep intensity (Achermann & Borbély 1987), and in contrast to the discrete sleep stages, lends itself to correlation with the DC potential data. An off line Fast Fourier Transform was used on the DC potential recordings to calculate power density in the 0.49-4 Hz band. One value was obtained for each 30 s epoch, having been computed from five overlapping windows of 10.24 s (512 samples) each. Data from each of the five windows had been multiplied by a raised cosine function before the transform in order to taper the signal towards zero at the extremes of the data window, thus reducing errors induced by edge effects.
Statistical analysis was generally based on analyses of variance followed by contrasts to specify significant effects and interaction terms. With regard to the DC potential (and also SWA), analyses of variance included repeated measures factors representing topography (F3, F4, FC3, FC4, C3, C4) and the different time intervals to be compared. The topographical distribution of potential changes was also tested by introducing a factor representing the frontal to central direction (F, FC, C). For the latter analyses, average values were formed between F3 and F4, FC3 and FC4, and C3 and C4 to obtain F, FC and C, respectively.
The time courses of DC potential shifts and SWA for each electrode location were statistically compared by cross correlation analysis using time lags up to ± 45 min (i.e. 181 time points). Cross correlation coefficients were first calculated separately for each subject and then transformed with Fisher s Z transformation. Mean coefficients r c were then tested for significance using Student s t tests. Sequential time lags with P< 0.05 are indicated in corresponding diagrams by a horizontal line and asterisk. Corresponding cross correlation analyses were performed to investigate a possible influence of temperature changes on the time course of the DC potential. All values in the text are given as mean ± SEM. Results
Sleep parameters are shown in Table 1. Mean sleep
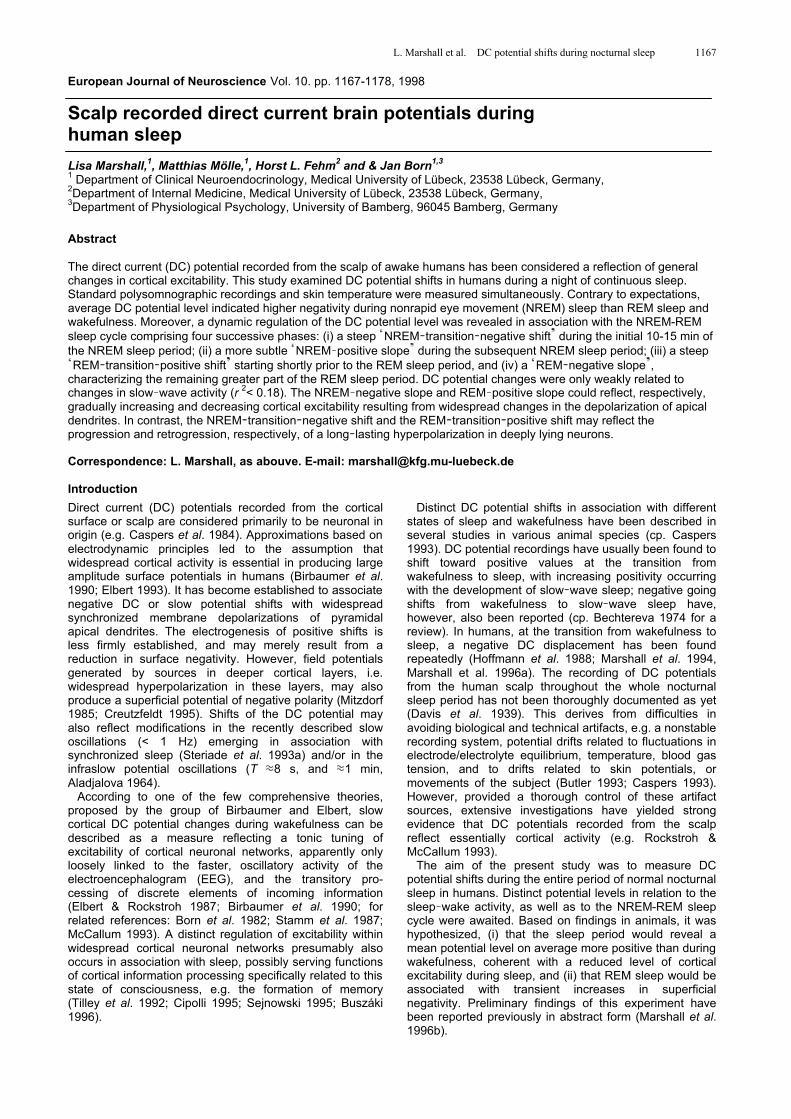
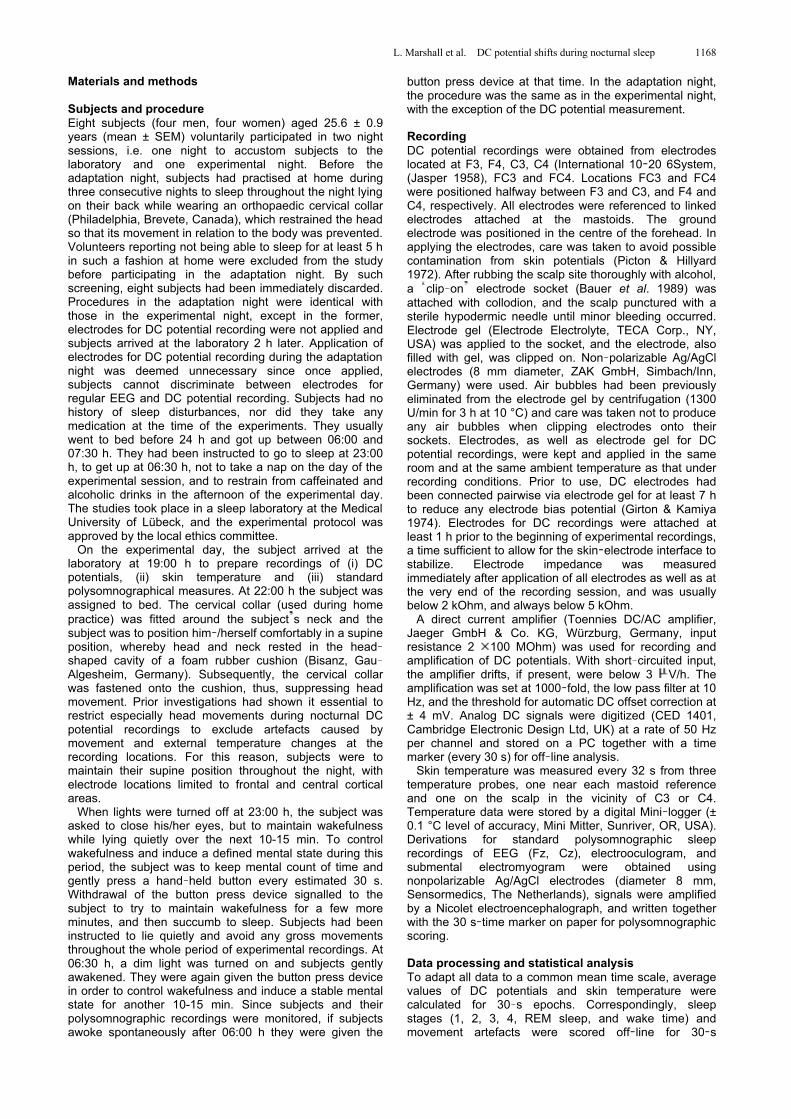
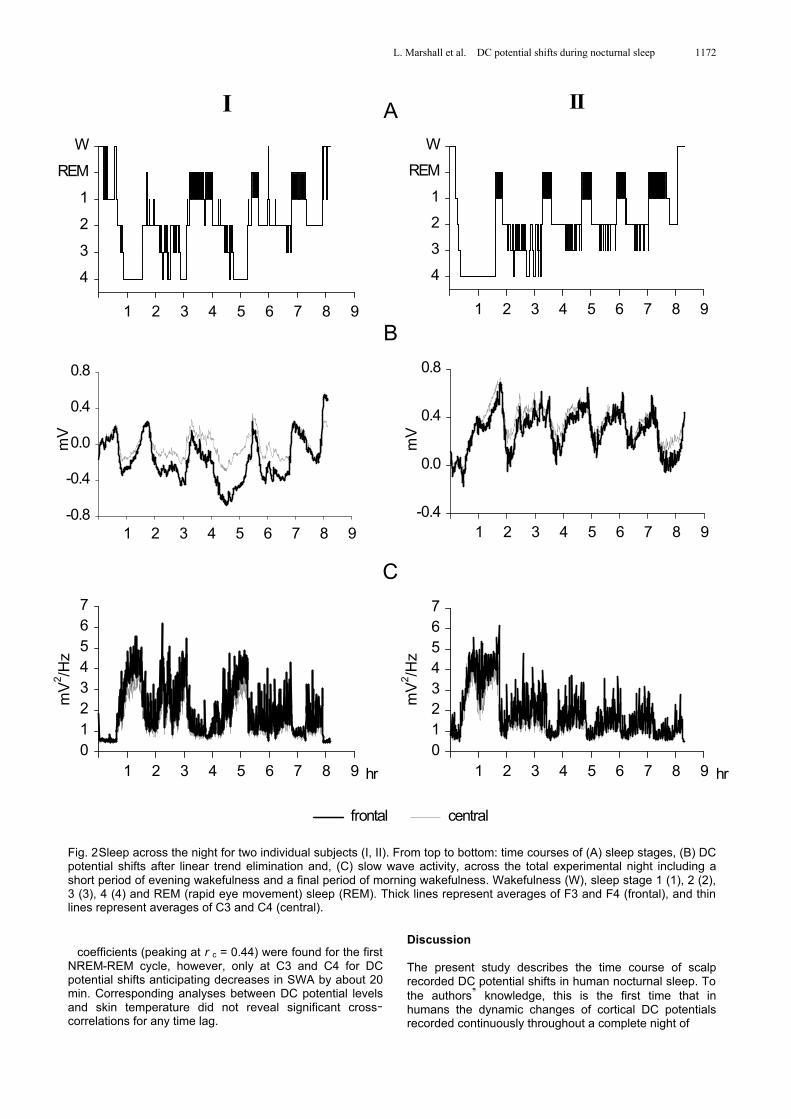
time and time spent in the different sleep stages were very close to typical sleep under laboratory conditions (cp. Hirshkowitz et al. 1992). Sleep onset latency and time spent in sleep stage 1 appeared to be increased, which was probably due to the restrained position of head and body during sleep. Sleep fragmentation, in general, was not a problem, as revealed by a normal mean number of awakenings per night: 5.6 (range 0-15), with a mean duration of 2.6 min (0-6.5 min). The number of awakenings per NREM sleep period, and the number of awakenings and short interruptions per REM sleep period both averaged 0.8/period (range 0-5), with a mean duration of these interruptions of 1.8 min (range 0.5-4.5). Mean duration of the NREM and REM sleep periods averaged 80.2 ± 7.6 min and 13.8 ± 4.5 min for the first, and 81.8 ± 5.2 min and 23.7 ± 4.0 min for the second to fourth NREM and REM sleep cycles. Time course of the DC potential during a total night s sleep Fig. 1reveals the averaged time courses of the DC potential shifts (before and after elimination of linear trends) at frontal and central recording locations, and of SWA. Fig. 2shows respective recordings from two individual nights. Before elimination of linear trends, the averaged DC potential during sleep time tended to be
L. Marshall et al. DC potential shifts during nocturnal sleep 1170
Table 1. Mean time (± SEM) spent in different sleep stages and mean sleep latencies (± SEM) as defined by Rechtschaffen & Kales 1968)
Time Mean (SEM) [min] Mean (SEM) [min] Latencies Mean (SEM) [min]
W 13.3 (5.4) 3.1 (1.3) Sleep onset 18.6 (2.0) S1 53.8 (8.5) 12.5 (2.0) S2 6.8 (2.1) S2 191.7 (6.9) 44.3 (2.3) SWS 32.2 (12.7) S3 43.0 (4.8) 9.9 (1.0) REM 92.8 (20.7) S4 54.8 (12.4) 12.3 (2.8) SWS 97.8 (12.9) 22.2 (2.6) REM 78.3 (7.5) 17.9 (1.5) Total sleep time 434.8 (9.2)
Left: Total sleep time, and time spent in the different sleep stages and in wakefulness in minutes, as well as in percentage of total sleep time. Right: Sleep onset latency with reference to withdrawal of the button press device, and latencies of different sleep stages with reference to sleep onset. Wakefulness (W), sleep stage 1(S1), 2(S2), 3(S3), 4(S4); slow wave sleep (SWS) defined by the sum of sleep stages 3 and 4, REM (rapid eye movement) sleep (REM). n=8.
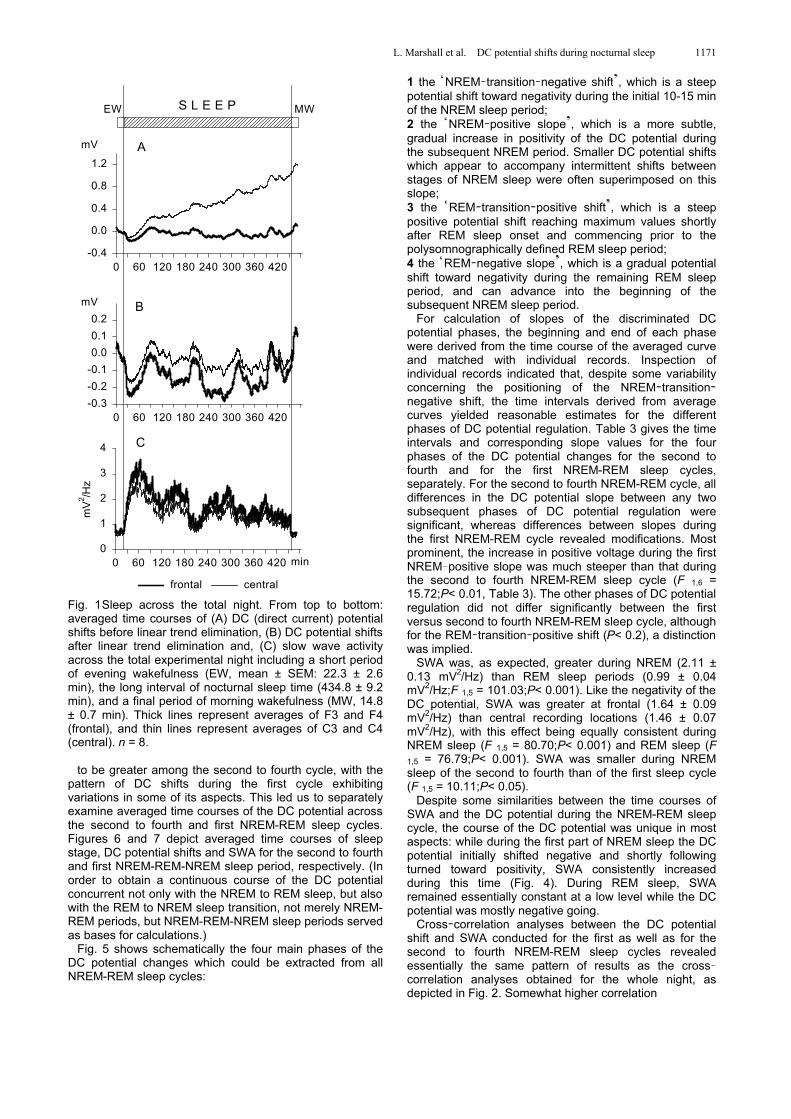
more negative at frontal (F, mean of F3 and F4) than central (C, mean of C3 and C4) recording locations (F 1,7 = 3.79;P< 0.1). The DC potential at fronto central (FC, halfway between frontal and central) and central locations shifted toward positivity during the recording time, i.e. from evening wakefulness, across sleep, to morning wake-fulness (F 3,21 = 9.06;P< 0.05, for the effect of time averaged across FC and C; Fig. 1).
The elimination of linear trends ( Fig. 1B), clarified the distribution of the sleep associated DC potentials. The effect of time concentrated on recordings over frontal sites (F3,21 =4.76;P< 0.05). Here, average DC negativity during total sleep time (-143.1± 74.3 V) was higher than during morning wakefulness (+82.4± 85.0 V;P<0.01, for a pair-wise comparison). Frontocortical DC potential negativity during sleep, particularly over the right hemisphere, was also higher than during evening wakefulness (set to 0 V;P< 0.05). Average DC potential levels between the first and second half of sleep time did not differ at any electrode site. During sleep time, but not during morning wake-fulness, the mean DC potential level at frontal electrode locations was more negative (F: -143.0 ± 90.2 V) than at fronto central (FC: +43.5 ± 114.5 V), or central locations (C:-43.4±103.7 V;P<0.05, for each pairwise comparison).
SWA was higher during the first (1.82 ± 0.14 mV2/Hz) than the second half of sleep time (1.41 ± 0.14 mV2/Hz), and at a minimum during evening (0.66 ± 0.06 mV2/Hz) and morning (0.59 ± 0.04 mV2/Hz) wakefulness (F 3,21 = 37.92;P< 0.001, for effect of time, P< 0.05, for pairwise comparisons between any two of the time intervals except between the two intervals of wakefulness). During sleep, but not during the periods of wakefulness, SWA was more pronounced at frontal (F: 1.10 ± 0.12 mV2/Hz) than frontocentral recording locations (FC: 0.94 ± 0.11 mV2/Hz), and at the latter locations activity was still higher than at central recording locations (C: 0.81 ± 0.10 mV2/Hz;F 2,14 = 67.08;P< 0.001, for effect of topography, and P< 0.001 for pairwise comparisons between any two locations).
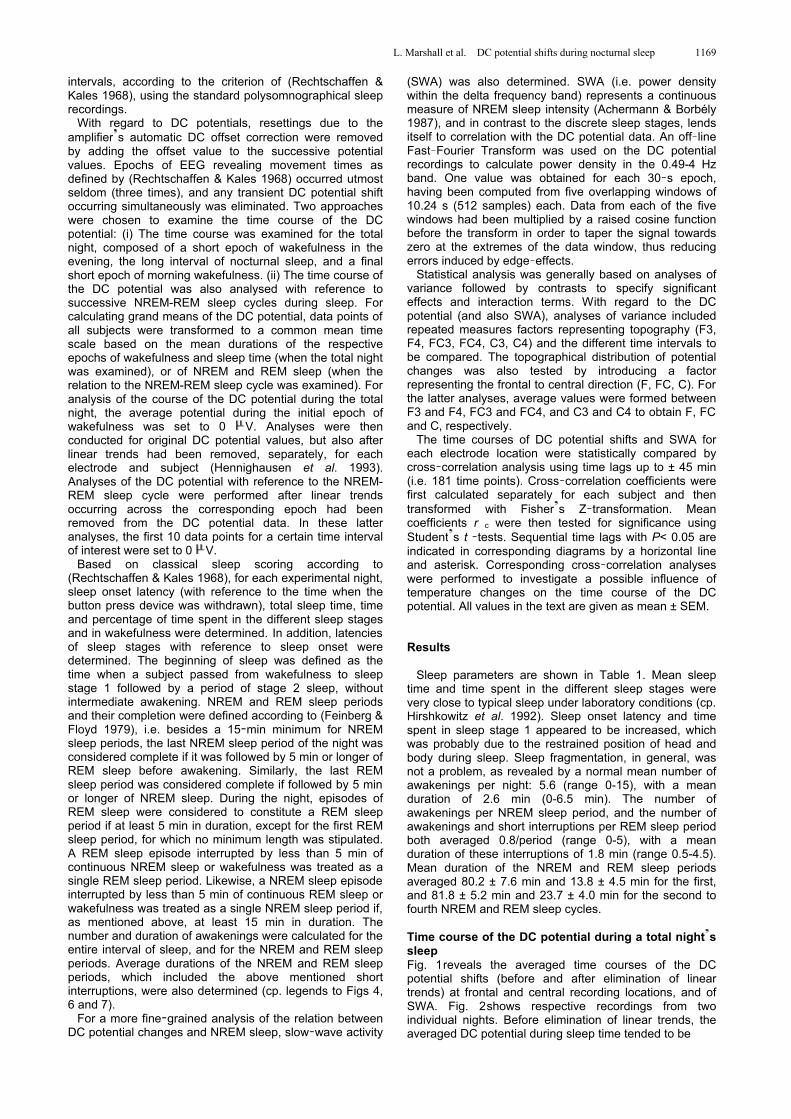
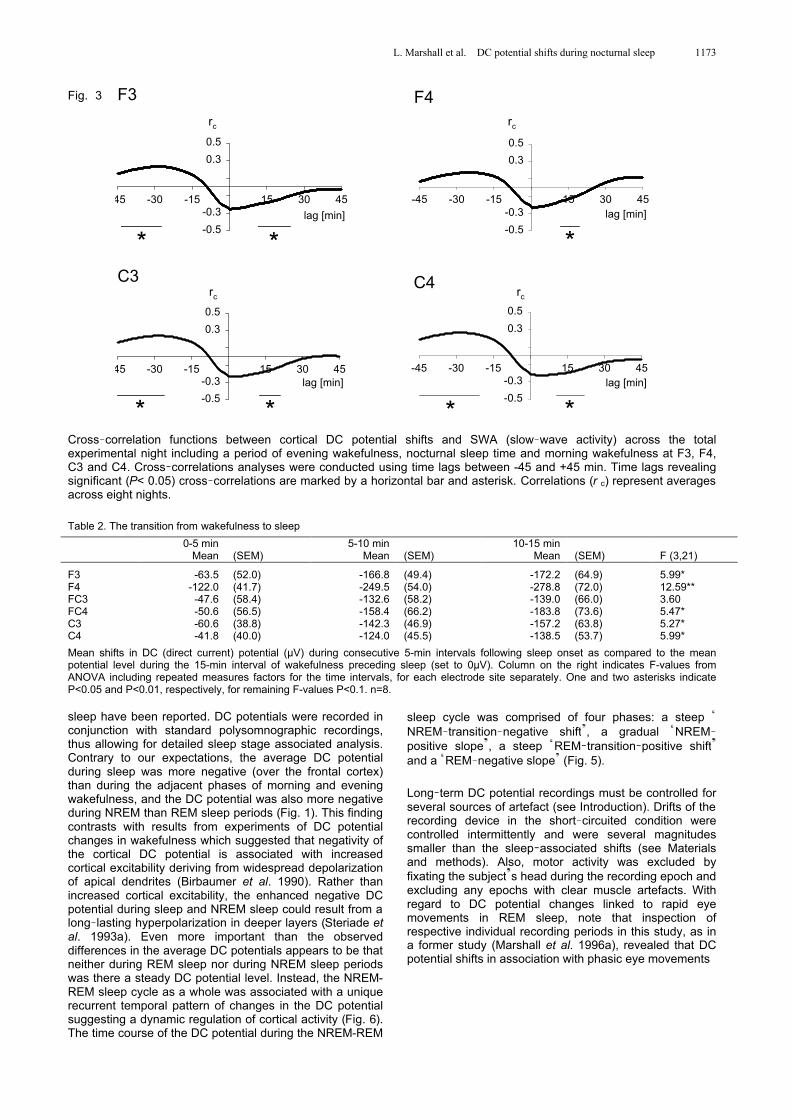
Since topographical differences in the DC potential level as well as in SWA basically only occurred in the frontal to central direction, i.e. between the frontal and central locations, comparisons between the time course of these measures by cross correlation functions will be restricted to these electrode locations. Cross correlation coefficients between DC potential and SWA were generally low. Nevertheless, some of the correlation coefficients reached significance (Fig. 3): cortical DC potential shifts (after elimination of linear trends) anticipated changes in SWA by 10-20 min indicating that DC potential shifts toward positivity were followed by decreases in SWA. However, average correlations at these time lags were still below r c = 0.24, i.e. variances of the DC potential changes explained by prior changes in SWA remained below 6%. Also, crosscorrelations revealed significance for SWA anticipating DC potential shifts by 20-45 min indicating that greater SWA was followed by DC potential shifts directed toward more
positive values. Again, respective correlation coefficients were rather low and did not exceed r c = 0.27.
Changes in skin temperature remained under 0.5 °C throughout all nights, except in two instances when a shift of 0.7 and 1.3 °C at one of the recording sites occurred. Associated DC shifts were transient and artefact conta-mination could be excluded. Cross correlations between mean DC potential levels, after elimination of linear trends, and skin temperature were always less than r c = 0.12 and non significant. Transitions between wakefulness and sleep An analysis restricted to 15 min periods prior to and after sleep onset was performed to examine changes in the DC potential (after elimination of linear trends) at the transition from wakefulness to sleep. As compared to the preceding 15 min mean level of wakefulness, the DC potential levels showed a negative shift across all electrode locations (F 3,21 = 7.13;P< 0.01). Table 2 summarizes the results of this analysis. The shift at frontal locations was again larger, i.e. more negative, than at fronto central (F 1,7 = 4.17;P< 0.08) and central recording sites (F 1,7 = 17.35;P< 0.01). Although the negative DC potential shift upon sleep onset at frontal and fronto central locations appeared to be somewhat more consistent over the right than left hemisphere ( Table 2), the corresponding analyses of variance main effect failed to reach significance (F 1,7 = 3.39;P< 0.11).
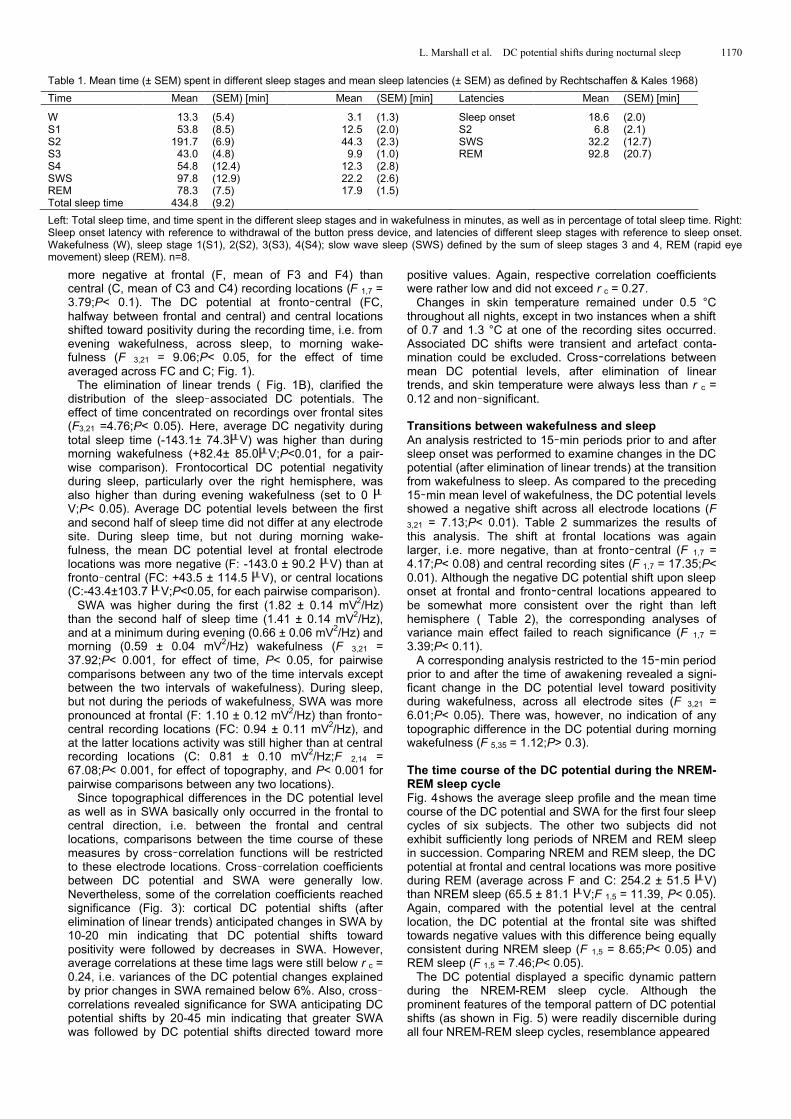
A corresponding analysis restricted to the 15 min period prior to and after the time of awakening revealed a signi-ficant change in the DC potential level toward positivity during wakefulness, across all electrode sites (F 3,21 = 6.01;P< 0.05). There was, however, no indication of any topographic difference in the DC potential during morning wakefulness (F 5,35 = 1.12;P> 0.3). The time course of the DC potential during the NREM-REM sleep cycle Fig. 4shows the average sleep profile and the mean time course of the DC potential and SWA for the first four sleep cycles of six subjects. The other two subjects did not exhibit sufficiently long periods of NREM and REM sleep in succession. Comparing NREM and REM sleep, the DC potential at frontal and central locations was more positive during REM (average across F and C: 254.2 ± 51.5 V) than NREM sleep (65.5 ± 81.1 V;F 1,5 = 11.39, P< 0.05). Again, compared with the potential level at the central location, the DC potential at the frontal site was shifted towards negative values with this difference being equally consistent during NREM sleep (F 1,5 = 8.65;P< 0.05) and REM sleep (F 1,5 = 7.46;P< 0.05).
The DC potential displayed a specific dynamic pattern during the NREM-REM sleep cycle. Although the prominent features of the temporal pattern of DC potential shifts (as shown in Fig. 5) were readily discernible during all four NREM-REM sleep cycles, resemblance appeared
L. Marshall et al. DC potential shifts during nocturnal sleep 1171
0 60 120 180 240 300 360 420
mV
-0.4
0.0
0.4
0.8
1.2
0 60 120 180 240 300 360 420
mV
-0.3
-0.2
-0.1
0.0
0.1
0.2
min0 60 120 180 240 300 360 420
mV
2 /Hz
0
1
2
3
4
EW MW
A
B
C
S L E E P
central frontal
Fig. 1Sleep across the total night. From top to bottom: averaged time courses of (A) DC (direct current) potential shifts before linear trend elimination, (B) DC potential shifts after linear trend elimination and, (C) slow wave activity across the total experimental night including a short period of evening wakefulness (EW, mean ± SEM: 22.3 ± 2.6 min), the long interval of nocturnal sleep time (434.8 ± 9.2 min), and a final period of morning wakefulness (MW, 14.8 ± 0.7 min). Thick lines represent averages of F3 and F4 (frontal), and thin lines represent averages of C3 and C4 (central). n = 8.
to be greater among the second to fourth cycle, with the pattern of DC shifts during the first cycle exhibiting variations in some of its aspects. This led us to separately examine averaged time courses of the DC potential across the second to fourth and first NREM-REM sleep cycles. Figures 6 and 7 depict averaged time courses of sleep stage, DC potential shifts and SWA for the second to fourth and first NREM-REM-NREM sleep period, respectively. (In order to obtain a continuous course of the DC potential concurrent not only with the NREM to REM sleep, but also with the REM to NREM sleep transition, not merely NREM-REM periods, but NREM-REM-NREM sleep periods served as bases for calculations.)
Fig. 5 shows schematically the four main phases of the DC potential changes which could be extracted from all NREM-REM sleep cycles:
1 the NREM transition negative shift , which is a steep potential shift toward negativity during the initial 10-15 min of the NREM sleep period; 2 the NREM positive slope , which is a more subtle, gradual increase in positivity of the DC potential during the subsequent NREM period. Smaller DC potential shifts which appear to accompany intermittent shifts between stages of NREM sleep were often superimposed on this slope; 3 the REM transition positive shift , which is a steep positive potential shift reaching maximum values shortly after REM sleep onset and commencing prior to the polysomnographically defined REM sleep period; 4 the REM negative slope , which is a gradual potential shift toward negativity during the remaining REM sleep period, and can advance into the beginning of the subsequent NREM sleep period.
For calculation of slopes of the discriminated DC potential phases, the beginning and end of each phase were derived from the time course of the averaged curve and matched with individual records. Inspection of individual records indicated that, despite some variability concerning the positioning of the NREM transitionnegative shift, the time intervals derived from average curves yielded reasonable estimates for the different phases of DC potential regulation. Table 3 gives the time intervals and corresponding slope values for the four phases of the DC potential changes for the second to fourth and for the first NREM-REM sleep cycles, separately. For the second to fourth NREM-REM cycle, all differences in the DC potential slope between any two subsequent phases of DC potential regulation were significant, whereas differences between slopes during the first NREM-REM cycle revealed modifications. Most prominent, the increase in positive voltage during the first NREM positive slope was much steeper than that during the second to fourth NREM-REM sleep cycle (F 1,6 = 15.72;P< 0.01, Table 3). The other phases of DC potential regulation did not differ significantly between the first versus second to fourth NREM-REM sleep cycle, although for the REM transition positive shift (P< 0.2), a distinction was implied.
SWA was, as expected, greater during NREM (2.11 ± 0.13 mV2/Hz) than REM sleep periods (0.99 ± 0.04 mV2/Hz;F 1,5 = 101.03;P< 0.001). Like the negativity of the DC potential, SWA was greater at frontal (1.64 ± 0.09 mV2/Hz) than central recording locations (1.46 ± 0.07 mV2/Hz), with this effect being equally consistent during NREM sleep (F 1,5 = 80.70;P< 0.001) and REM sleep (F 1,5 = 76.79;P< 0.001). SWA was smaller during NREM sleep of the second to fourth than of the first sleep cycle (F 1,5 = 10.11;P< 0.05).
Despite some similarities between the time courses of SWA and the DC potential during the NREM-REM sleep cycle, the course of the DC potential was unique in most aspects: while during the first part of NREM sleep the DC potential initially shifted negative and shortly following turned toward positivity, SWA consistently increased during this time (Fig. 4). During REM sleep, SWA remained essentially constant at a low level while the DC potential was mostly negative going.
Cross correlation analyses between the DC potential shift and SWA conducted for the first as well as for the second to fourth NREM-REM sleep cycles revealed essentially the same pattern of results as the crosscorrelation analyses obtained for the whole night, as depicted in Fig. 2. Somewhat higher correlation
L. Marshall et al. DC potential shifts during nocturnal sleep 1172
1 2 3 4 5 6 7 8 9-0.8
-0.4
0.0
0.4
0.8
1 2 3 4 5 6 7 8 901234567
1 2 3 4 5 6 7 8 9
4
3
2
1
REM
W
1 2 3 4 5 6 7 8 9
4
3
2
1
REM
W
1 2 3 4 5 6 7 8 9-0.4
0.0
0.4
0.8
1 2 3 4 5 6 7 8 901234567
mV
mV
2 /Hz
II I
mV
2 /Hz
mV
hr hr
A
B
C
frontal central
Fig. 2Sleep across the night for two individual subjects (I, II). From top to bottom: time courses of (A) sleep stages, (B) DC potential shifts after linear trend elimination and, (C) slow wave activity, across the total experimental night including a short period of evening wakefulness and a final period of morning wakefulness. Wakefulness (W), sleep stage 1 (1), 2 (2), 3 (3), 4 (4) and REM (rapid eye movement) sleep (REM). Thick lines represent averages of F3 and F4 (frontal), and thin lines represent averages of C3 and C4 (central).
coefficients (peaking at r c = 0.44) were found for the first
NREM-REM cycle, however, only at C3 and C4 for DC potential shifts anticipating decreases in SWA by about 20 min. Corresponding analyses between DC potential levels and skin temperature did not reveal significant crosscorrelations for any time lag.
Discussion The present study describes the time course of scalp recorded DC potential shifts in human nocturnal sleep. To the authors knowledge, this is the first time that in humans the dynamic changes of cortical DC potentials recorded continuously throughout a complete night of
L. Marshall et al. DC potential shifts during nocturnal sleep 1173
F3
-45 -30 -15 15 30 45
-0.5
-0.3
0.3
0.5
* *lag [min]
rc
F4
-45 -30 -15 15 30 45
-0.5
-0.3
0.3
0.5
*lag [min]
rc
C4
-45 -30 -15 15 30 45
-0.5
-0.3
0.3
0.5
* *lag [min]
rc
C3
-45 -30 -15 15 30 45
-0.5
-0.3
0.3
0.5
* *lag [min]
rc
Fig. 3
Cross correlation functions between cortical DC potential shifts and SWA (slow wave activity) across the total experimental night including a period of evening wakefulness, nocturnal sleep time and morning wakefulness at F3, F4, C3 and C4. Cross correlations analyses were conducted using time lags between -45 and +45 min. Time lags revealing significant (P< 0.05) cross correlations are marked by a horizontal bar and asterisk. Correlations (r c) represent averages across eight nights.
Table 2. The transition from wakefulness to sleep
0-5 min Mean
(SEM)
5-10 min Mean
(SEM)
10-15 min Mean
(SEM)
F (3,21)
F3 -63.5 (52.0) -166.8 (49.4) -172.2 (64.9) 5.99* F4 -122.0 (41.7) -249.5 (54.0) -278.8 (72.0) 12.59** FC3 -47.6 (58.4) -132.6 (58.2) -139.0 (66.0) 3.60 FC4 -50.6 (56.5) -158.4 (66.2) -183.8 (73.6) 5.47* C3 -60.6 (38.8) -142.3 (46.9) -157.2 (63.8) 5.27* C4 -41.8 (40.0) -124.0 (45.5) -138.5 (53.7) 5.99*
Mean shifts in DC (direct current) potential (µV) during consecutive 5-min intervals following sleep onset as compared to the mean potential level during the 15-min interval of wakefulness preceding sleep (set to 0µV). Column on the right indicates F-values from ANOVA including repeated measures factors for the time intervals, for each electrode site separately. One and two asterisks indicate P<0.05 and P<0.01, respectively, for remaining F-values P<0.1. n=8.
sleep have been reported. DC potentials were recorded in conjunction with standard polysomnographic recordings, thus allowing for detailed sleep stage associated analysis. Contrary to our expectations, the average DC potential during sleep was more negative (over the frontal cortex) than during the adjacent phases of morning and evening wakefulness, and the DC potential was also more negative during NREM than REM sleep periods (Fig. 1). This finding contrasts with results from experiments of DC potential changes in wakefulness which suggested that negativity of the cortical DC potential is associated with increased cortical excitability deriving from widespread depolarization of apical dendrites (Birbaumer et al. 1990). Rather than increased cortical excitability, the enhanced negative DC potential during sleep and NREM sleep could result from a long lasting hyperpolarization in deeper layers (Steriade et al. 1993a). Even more important than the observed differences in the average DC potentials appears to be that neither during REM sleep nor during NREM sleep periods was there a steady DC potential level. Instead, the NREM-REM sleep cycle as a whole was associated with a unique recurrent temporal pattern of changes in the DC potential suggesting a dynamic regulation of cortical activity (Fig. 6). The time course of the DC potential during the NREM-REM
sleep cycle was comprised of four phases: a steep NREM transition negative shift , a gradual NREMpositive slope , a steep REM transition positive shift and a REM negative slope (Fig. 5).
Long term DC potential recordings must be controlled for several sources of artefact (see Introduction). Drifts of the recording device in the short circuited condition were controlled intermittently and were several magnitudes smaller than the sleep associated shifts (see Materials and methods). Also, motor activity was excluded by fixating the subject s head during the recording epoch and excluding any epochs with clear muscle artefacts. With regard to DC potential changes linked to rapid eye movements in REM sleep, note that inspection of respective individual recording periods in this study, as in a former study (Marshall et al. 1996a), revealed that DC potential shifts in association with phasic eye movements
L. Marshall et al. DC potential shifts during nocturnal sleep 1174
0 60 120 180 240 300 360
mV
-0.2-0.10.00.10.20.30.40.5
min0 60 120 180 240 300 360
mV
2 /Hz
0
1
2
3
4
5
0 60 120 180 240 300 360
4
3
2
1
REM
W
A
B
C
central
NREM 1
REM 1
NREM 2
REM 2
NREM 3
REM 3
NREM 4
REM 4
frontal
min
mV
REMNREMNREM
+
-
4
NREM
-tran
sition
-neg
ative
shift
NREM
-pos
itive
slope
REM
-tran
sition
-pos
itive
shift
REM
-neg
ative
slop
e
22 11
3
0 40 80 120 160
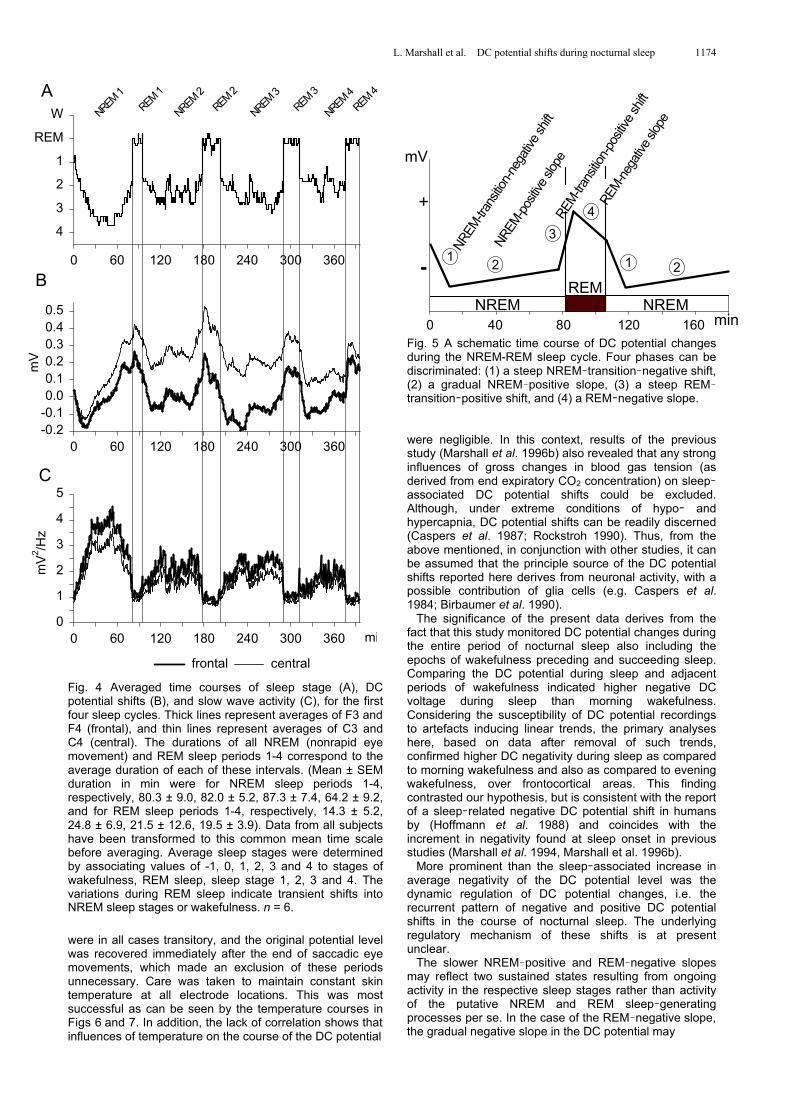
Fig. 4 Averaged time courses of sleep stage (A), DC potential shifts (B), and slow wave activity (C), for the first four sleep cycles. Thick lines represent averages of F3 and F4 (frontal), and thin lines represent averages of C3 and C4 (central). The durations of all NREM (nonrapid eye movement) and REM sleep periods 1-4 correspond to the average duration of each of these intervals. (Mean ± SEM duration in min were for NREM sleep periods 1-4, respectively, 80.3 ± 9.0, 82.0 ± 5.2, 87.3 ± 7.4, 64.2 ± 9.2, and for REM sleep periods 1-4, respectively, 14.3 ± 5.2, 24.8 ± 6.9, 21.5 ± 12.6, 19.5 ± 3.9). Data from all subjects have been transformed to this common mean time scale before averaging. Average sleep stages were determined by associating values of -1, 0, 1, 2, 3 and 4 to stages of wakefulness, REM sleep, sleep stage 1, 2, 3 and 4. The variations during REM sleep indicate transient shifts into NREM sleep stages or wakefulness. n = 6.
were in all cases transitory, and the original potential level was recovered immediately after the end of saccadic eye movements, which made an exclusion of these periods unnecessary. Care was taken to maintain constant skin temperature at all electrode locations. This was most successful as can be seen by the temperature courses in Figs 6 and 7. In addition, the lack of correlation shows that influences of temperature on the course of the DC potential
Fig. 5 A schematic time course of DC potential changes during the NREM-REM sleep cycle. Four phases can be discriminated: (1) a steep NREM transition negative shift, (2) a gradual NREM positive slope, (3) a steep REMtransition positive shift, and (4) a REM negative slope. were negligible. In this context, results of the previous study (Marshall et al. 1996b) also revealed that any strong influences of gross changes in blood gas tension (as derived from end expiratory CO2 concentration) on sleepassociated DC potential shifts could be excluded. Although, under extreme conditions of hypo and hypercapnia, DC potential shifts can be readily discerned (Caspers et al. 1987; Rockstroh 1990). Thus, from the above mentioned, in conjunction with other studies, it can be assumed that the principle source of the DC potential shifts reported here derives from neuronal activity, with a possible contribution of glia cells (e.g. Caspers et al. 1984; Birbaumer et al. 1990).
The significance of the present data derives from the fact that this study monitored DC potential changes during the entire period of nocturnal sleep also including the epochs of wakefulness preceding and succeeding sleep. Comparing the DC potential during sleep and adjacent periods of wakefulness indicated higher negative DC voltage during sleep than morning wakefulness. Considering the susceptibility of DC potential recordings to artefacts inducing linear trends, the primary analyses here, based on data after removal of such trends, confirmed higher DC negativity during sleep as compared to morning wakefulness and also as compared to evening wakefulness, over frontocortical areas. This finding contrasted our hypothesis, but is consistent with the report of a sleep related negative DC potential shift in humans by (Hoffmann et al. 1988) and coincides with the increment in negativity found at sleep onset in previous studies (Marshall et al. 1994, Marshall et al. 1996b).
More prominent than the sleep associated increase in average negativity of the DC potential level was the dynamic regulation of DC potential changes, i.e. the recurrent pattern of negative and positive DC potential shifts in the course of nocturnal sleep. The underlying regulatory mechanism of these shifts is at present unclear.
The slower NREM positive and REM negative slopes may reflect two sustained states resulting from ongoing activity in the respective sleep stages rather than activity of the putative NREM and REM sleep generating processes per se. In the case of the REM negative slope, the gradual negative slope in the DC potential may
L. Marshall et al. DC potential shifts during nocturnal sleep 1175
0 20 40 60 80 100 120 140 160
°C
30
32
34
A
B
Dright mastoid
left mastoid
central
m2
0 20 40 60 80 100 120 140 160
mV
*mV
/Hz
0.0
0.5
1.0
1.5
0 20 40 60 80 100 120 140 160
mV
-0.2
-0.1
0.0
0.1
0.2
0 20 40 60 80 100 120 140 160
4321
REMW
NREM REM NREM
NREM-trans
ition-n
egati
ve sh
ift
NREM-positi
ve slo
pe
REM-trans
ition-p
ositiv
e shif
t
REM-nega
tive slo
pe
min
central frontal
C
0 20 40 60 80 100 120 140 160
mV
2 /Hz
012345
0 20 40 60 80 100 120 140 160
mV
-0.2
0.0
0.2
0.4
0 20 40 60 80 100 120 140 160
4321
REMW
0 20 40 60 80 100 120 140 160
30
32
34
C
D
°C
min
B
A NREM REM NREM
NREM-trans
ition-n
egati
ve sh
ift
NREM-positi
ve slo
pe
REM-trans
ition-p
ositiv
e shif
t
REM-nega
tive slo
pe
right mastoid
left mastoid
central
central frontal
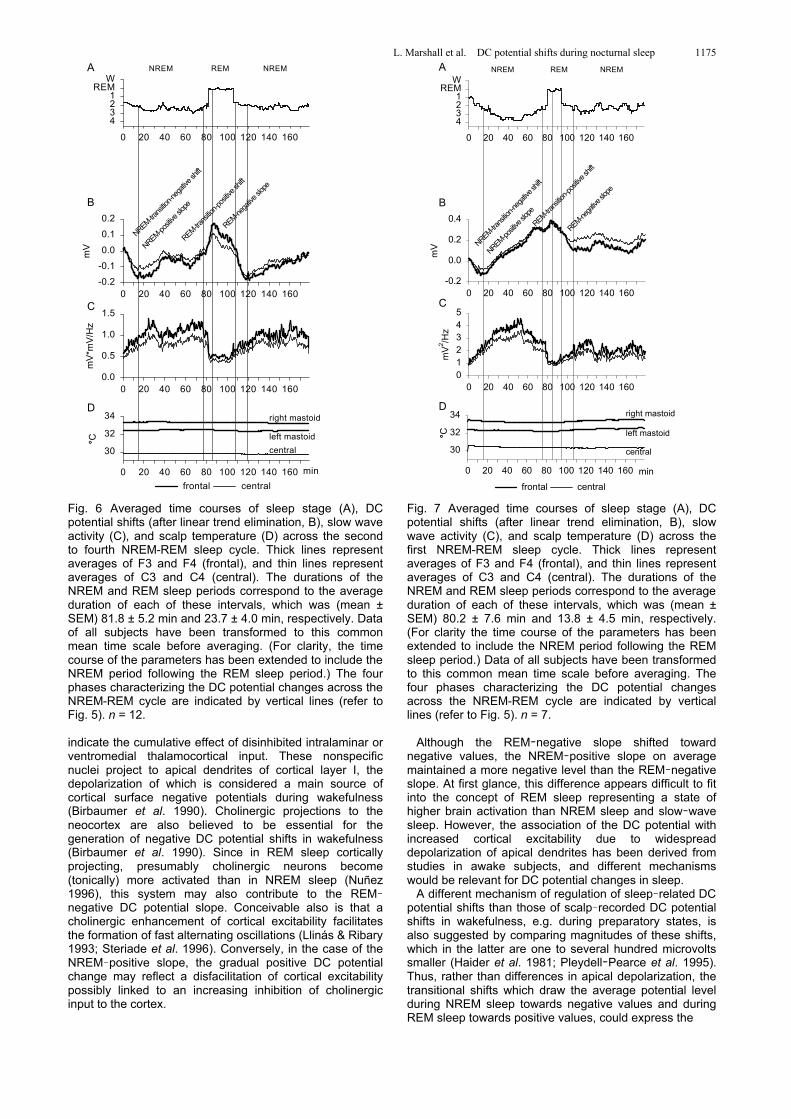
Fig. 6 Averaged time courses of sleep stage (A), DC potential shifts (after linear trend elimination, B), slow wave activity (C), and scalp temperature (D) across the second to fourth NREM-REM sleep cycle. Thick lines represent averages of F3 and F4 (frontal), and thin lines represent averages of C3 and C4 (central). The durations of the NREM and REM sleep periods correspond to the average duration of each of these intervals, which was (mean ± SEM) 81.8 ± 5.2 min and 23.7 ± 4.0 min, respectively. Data of all subjects have been transformed to this common mean time scale before averaging. (For clarity, the time course of the parameters has been extended to include the NREM period following the REM sleep period.) The four phases characterizing the DC potential changes across the NREM-REM cycle are indicated by vertical lines (refer to Fig. 5). n = 12.
indicate the cumulative effect of disinhibited intralaminar or ventromedial thalamocortical input. These nonspecific nuclei project to apical dendrites of cortical layer I, the depolarization of which is considered a main source of cortical surface negative potentials during wakefulness (Birbaumer et al. 1990). Cholinergic projections to the neocortex are also believed to be essential for the generation of negative DC potential shifts in wakefulness (Birbaumer et al. 1990). Since in REM sleep cortically projecting, presumably cholinergic neurons become (tonically) more activated than in NREM sleep (Nuñez 1996), this system may also contribute to the REMnegative DC potential slope. Conceivable also is that a cholinergic enhancement of cortical excitability facilitates the formation of fast alternating oscillations (Llinás & Ribary 1993; Steriade et al. 1996). Conversely, in the case of the NREM positive slope, the gradual positive DC potential change may reflect a disfacilitation of cortical excitability possibly linked to an increasing inhibition of cholinergic input to the cortex.
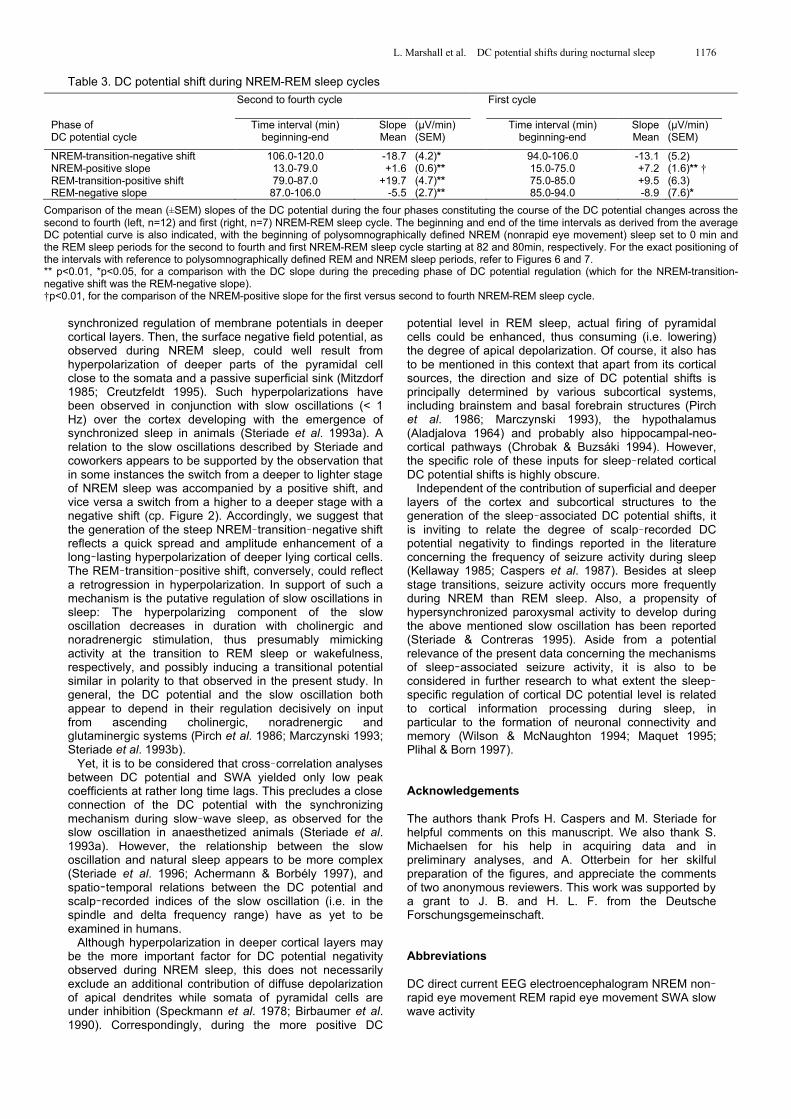
Fig. 7 Averaged time courses of sleep stage (A), DC potential shifts (after linear trend elimination, B), slow wave activity (C), and scalp temperature (D) across the first NREM-REM sleep cycle. Thick lines represent averages of F3 and F4 (frontal), and thin lines represent averages of C3 and C4 (central). The durations of the NREM and REM sleep periods correspond to the average duration of each of these intervals, which was (mean ± SEM) 80.2 ± 7.6 min and 13.8 ± 4.5 min, respectively. (For clarity the time course of the parameters has been extended to include the NREM period following the REM sleep period.) Data of all subjects have been transformed to this common mean time scale before averaging. The four phases characterizing the DC potential changes across the NREM-REM cycle are indicated by vertical lines (refer to Fig. 5). n = 7.
Although the REM negative slope shifted toward
negative values, the NREM positive slope on average maintained a more negative level than the REM negative slope. At first glance, this difference appears difficult to fit into the concept of REM sleep representing a state of higher brain activation than NREM sleep and slow wave sleep. However, the association of the DC potential with increased cortical excitability due to widespread depolarization of apical dendrites has been derived from studies in awake subjects, and different mechanisms would be relevant for DC potential changes in sleep.
A different mechanism of regulation of sleep related DC potential shifts than those of scalp recorded DC potential shifts in wakefulness, e.g. during preparatory states, is also suggested by comparing magnitudes of these shifts, which in the latter are one to several hundred microvolts smaller (Haider et al. 1981; Pleydell Pearce et al. 1995). Thus, rather than differences in apical depolarization, the transitional shifts which draw the average potential level during NREM sleep towards negative values and during REM sleep towards positive values, could express the
L. Marshall et al. DC potential shifts during nocturnal sleep 1176
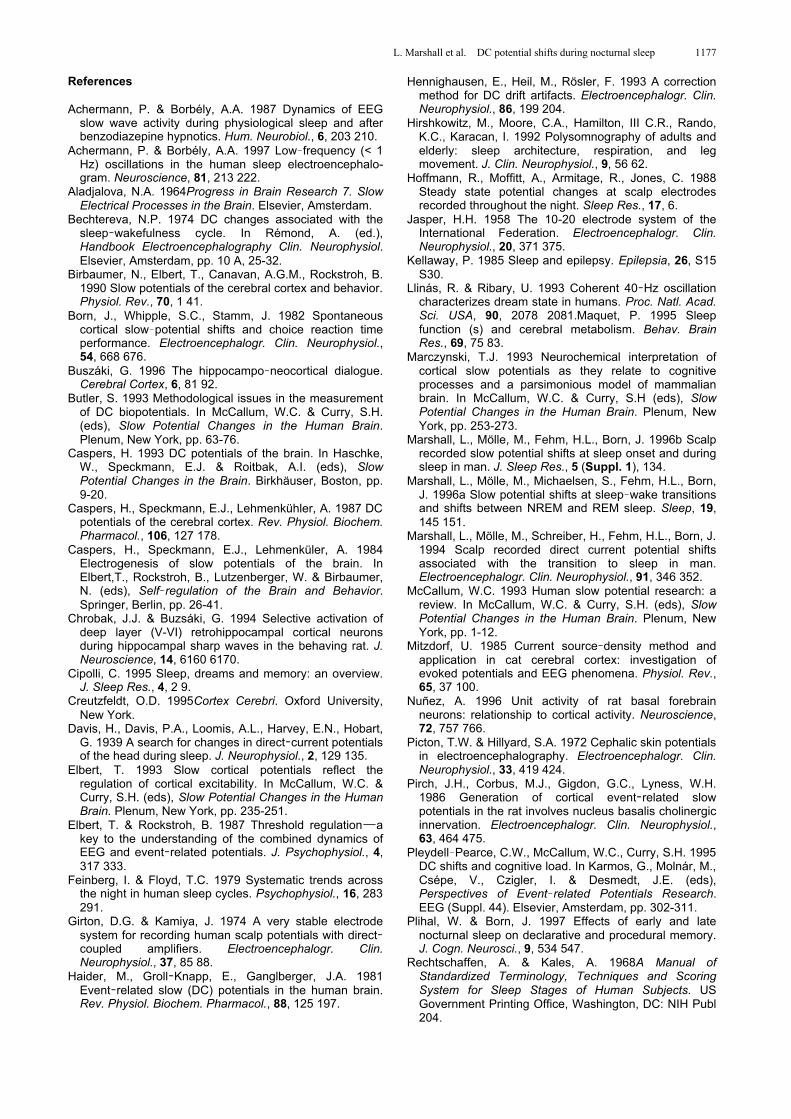
Table 3. DC potential shift during NREM-REM sleep cycles
Second to fourth cycle
First cycle
Phase of DC potential cycle
Time interval (min) beginning-end
Slope Mean
(µV/min) (SEM)
Time interval (min) beginning-end
Slope Mean
(µV/min) (SEM)
NREM-transition-negative shift 106.0-120.0 -18.7 (4.2)* 94.0-106.0 -13.1 (5.2) NREM-positive slope 13.0-79.0 +1.6 (0.6)** 15.0-75.0 +7.2 (1.6)** † REM-transition-positive shift 79.0-87.0 +19.7 (4.7)** 75.0-85.0 +9.5 (6.3) REM-negative slope 87.0-106.0 -5.5 (2.7)** 85.0-94.0 -8.9 (7.6)*
Comparison of the mean (±SEM) slopes of the DC potential during the four phases constituting the course of the DC potential changes across the second to fourth (left, n=12) and first (right, n=7) NREM-REM sleep cycle. The beginning and end of the time intervals as derived from the average DC potential curve is also indicated, with the beginning of polysomnographically defined NREM (nonrapid eye movement) sleep set to 0 min and the REM sleep periods for the second to fourth and first NREM-REM sleep cycle starting at 82 and 80min, respectively. For the exact positioning of the intervals with reference to polysomnographically defined REM and NREM sleep periods, refer to Figures 6 and 7. ** p<0.01, *p<0.05, for a comparison with the DC slope during the preceding phase of DC potential regulation (which for the NREM-transition-negative shift was the REM-negative slope). †p<0.01, for the comparison of the NREM-positive slope for the first versus second to fourth NREM-REM sleep cycle.
synchronized regulation of membrane potentials in deeper cortical layers. Then, the surface negative field potential, as observed during NREM sleep, could well result from hyperpolarization of deeper parts of the pyramidal cell close to the somata and a passive superficial sink (Mitzdorf 1985; Creutzfeldt 1995). Such hyperpolarizations have been observed in conjunction with slow oscillations (< 1 Hz) over the cortex developing with the emergence of synchronized sleep in animals (Steriade et al. 1993a). A relation to the slow oscillations described by Steriade and coworkers appears to be supported by the observation that in some instances the switch from a deeper to lighter stage of NREM sleep was accompanied by a positive shift, and vice versa a switch from a higher to a deeper stage with a negative shift (cp. Figure 2). Accordingly, we suggest that the generation of the steep NREM transition negative shift reflects a quick spread and amplitude enhancement of a long lasting hyperpolarization of deeper lying cortical cells. The REM transition positive shift, conversely, could reflect a retrogression in hyperpolarization. In support of such a mechanism is the putative regulation of slow oscillations in sleep: The hyperpolarizing component of the slow oscillation decreases in duration with cholinergic and noradrenergic stimulation, thus presumably mimicking activity at the transition to REM sleep or wakefulness, respectively, and possibly inducing a transitional potential similar in polarity to that observed in the present study. In general, the DC potential and the slow oscillation both appear to depend in their regulation decisively on input from ascending cholinergic, noradrenergic and glutaminergic systems (Pirch et al. 1986; Marczynski 1993; Steriade et al. 1993b).
Yet, it is to be considered that cross correlation analyses between DC potential and SWA yielded only low peak coefficients at rather long time lags. This precludes a close connection of the DC potential with the synchronizing mechanism during slow wave sleep, as observed for the slow oscillation in anaesthetized animals (Steriade et al. 1993a). However, the relationship between the slow oscillation and natural sleep appears to be more complex (Steriade et al. 1996; Achermann & Borbély 1997), and spatio temporal relations between the DC potential and scalp recorded indices of the slow oscillation (i.e. in the spindle and delta frequency range) have as yet to be examined in humans.
Although hyperpolarization in deeper cortical layers may be the more important factor for DC potential negativity observed during NREM sleep, this does not necessarily exclude an additional contribution of diffuse depolarization of apical dendrites while somata of pyramidal cells are under inhibition (Speckmann et al. 1978; Birbaumer et al. 1990). Correspondingly, during the more positive DC
potential level in REM sleep, actual firing of pyramidal cells could be enhanced, thus consuming (i.e. lowering) the degree of apical depolarization. Of course, it also has to be mentioned in this context that apart from its cortical sources, the direction and size of DC potential shifts is principally determined by various subcortical systems, including brainstem and basal forebrain structures (Pirch et al. 1986; Marczynski 1993), the hypothalamus (Aladjalova 1964) and probably also hippocampal-neo-cortical pathways (Chrobak & Buzsáki 1994). However, the specific role of these inputs for sleep related cortical DC potential shifts is highly obscure.
Independent of the contribution of superficial and deeper layers of the cortex and subcortical structures to the generation of the sleep associated DC potential shifts, it is inviting to relate the degree of scalp recorded DC potential negativity to findings reported in the literature concerning the frequency of seizure activity during sleep (Kellaway 1985; Caspers et al. 1987). Besides at sleep stage transitions, seizure activity occurs more frequently during NREM than REM sleep. Also, a propensity of hypersynchronized paroxysmal activity to develop during the above mentioned slow oscillation has been reported (Steriade & Contreras 1995). Aside from a potential relevance of the present data concerning the mechanisms of sleep associated seizure activity, it is also to be considered in further research to what extent the sleepspecific regulation of cortical DC potential level is related to cortical information processing during sleep, in particular to the formation of neuronal connectivity and memory (Wilson & McNaughton 1994; Maquet 1995; Plihal & Born 1997). Acknowledgements The authors thank Profs H. Caspers and M. Steriade for helpful comments on this manuscript. We also thank S. Michaelsen for his help in acquiring data and in preliminary analyses, and A. Otterbein for her skilful preparation of the figures, and appreciate the comments of two anonymous reviewers. This work was supported by a grant to J. B. and H. L. F. from the Deutsche Forschungsgemeinschaft. Abbreviations DC direct current EEG electroencephalogram NREM nonrapid eye movement REM rapid eye movement SWA slow wave activity
L. Marshall et al. DC potential shifts during nocturnal sleep 1177
References Achermann, P. & Borbély, A.A. 1987 Dynamics of EEG
slow wave activity during physiological sleep and after benzodiazepine hypnotics. Hum. Neurobiol., 6, 203 210.
Achermann, P. & Borbély, A.A. 1997 Low frequency (< 1 Hz) oscillations in the human sleep electroencephalo-gram. Neuroscience, 81, 213 222.
Aladjalova, N.A. 1964Progress in Brain Research 7. Slow Electrical Processes in the Brain. Elsevier, Amsterdam.
Bechtereva, N.P. 1974 DC changes associated with the sleep wakefulness cycle. In Rémond, A. (ed.), Handbook Electroencephalography Clin. Neurophysiol. Elsevier, Amsterdam, pp. 10 A, 25-32.
Birbaumer, N., Elbert, T., Canavan, A.G.M., Rockstroh, B. 1990 Slow potentials of the cerebral cortex and behavior. Physiol. Rev., 70, 1 41.
Born, J., Whipple, S.C., Stamm, J. 1982 Spontaneous cortical slow potential shifts and choice reaction time performance. Electroencephalogr. Clin. Neurophysiol., 54, 668 676.
Buszáki, G. 1996 The hippocampo neocortical dialogue. Cerebral Cortex, 6, 81 92.
Butler, S. 1993 Methodological issues in the measurement of DC biopotentials. In McCallum, W.C. & Curry, S.H. (eds), Slow Potential Changes in the Human Brain. Plenum, New York, pp. 63-76.
Caspers, H. 1993 DC potentials of the brain. In Haschke, W., Speckmann, E.J. & Roitbak, A.I. (eds), Slow Potential Changes in the Brain. Birkhäuser, Boston, pp. 9-20.
Caspers, H., Speckmann, E.J., Lehmenkühler, A. 1987 DC potentials of the cerebral cortex. Rev. Physiol. Biochem. Pharmacol., 106, 127 178.
Caspers, H., Speckmann, E.J., Lehmenküler, A. 1984 Electrogenesis of slow potentials of the brain. In Elbert,T., Rockstroh, B., Lutzenberger, W. & Birbaumer, N. (eds), Self regulation of the Brain and Behavior. Springer, Berlin, pp. 26-41.
Chrobak, J.J. & Buzsáki, G. 1994 Selective activation of deep layer (V-VI) retrohippocampal cortical neurons during hippocampal sharp waves in the behaving rat. J. Neuroscience, 14, 6160 6170.
Cipolli, C. 1995 Sleep, dreams and memory: an overview. J. Sleep Res., 4, 2 9.
Creutzfeldt, O.D. 1995Cortex Cerebri. Oxford University, New York.
Davis, H., Davis, P.A., Loomis, A.L., Harvey, E.N., Hobart, G. 1939 A search for changes in direct current potentials of the head during sleep. J. Neurophysiol., 2, 129 135.
Elbert, T. 1993 Slow cortical potentials reflect the regulation of cortical excitability. In McCallum, W.C. & Curry, S.H. (eds), Slow Potential Changes in the Human Brain. Plenum, New York, pp. 235-251.
Elbert, T. & Rockstroh, B. 1987 Threshold regulation a key to the understanding of the combined dynamics of EEG and event related potentials. J. Psychophysiol., 4, 317 333.
Feinberg, I. & Floyd, T.C. 1979 Systematic trends across the night in human sleep cycles. Psychophysiol., 16, 283 291.
Girton, D.G. & Kamiya, J. 1974 A very stable electrode system for recording human scalp potentials with directcoupled amplifiers. Electroencephalogr. Clin. Neurophysiol., 37, 85 88.
Haider, M., Groll Knapp, E., Ganglberger, J.A. 1981 Event related slow (DC) potentials in the human brain. Rev. Physiol. Biochem. Pharmacol., 88, 125 197.
Hennighausen, E., Heil, M., Rösler, F. 1993 A correction method for DC drift artifacts. Electroencephalogr. Clin. Neurophysiol., 86, 199 204.
Hirshkowitz, M., Moore, C.A., Hamilton, III C.R., Rando, K.C., Karacan, I. 1992 Polysomnography of adults and elderly: sleep architecture, respiration, and leg movement. J. Clin. Neurophysiol., 9, 56 62.
Hoffmann, R., Moffitt, A., Armitage, R., Jones, C. 1988 Steady state potential changes at scalp electrodes recorded throughout the night. Sleep Res., 17, 6.
Jasper, H.H. 1958 The 10-20 electrode system of the International Federation. Electroencephalogr. Clin. Neurophysiol., 20, 371 375.
Kellaway, P. 1985 Sleep and epilepsy. Epilepsia, 26, S15 S30.
Llinás, R. & Ribary, U. 1993 Coherent 40 Hz oscillation characterizes dream state in humans. Proc. Natl. Acad. Sci. USA, 90, 2078 2081.Maquet, P. 1995 Sleep function (s) and cerebral metabolism. Behav. Brain Res., 69, 75 83.
Marczynski, T.J. 1993 Neurochemical interpretation of cortical slow potentials as they relate to cognitive processes and a parsimonious model of mammalian brain. In McCallum, W.C. & Curry, S.H (eds), Slow Potential Changes in the Human Brain. Plenum, New York, pp. 253-273.
Marshall, L., Mölle, M., Fehm, H.L., Born, J. 1996b Scalp recorded slow potential shifts at sleep onset and during sleep in man. J. Sleep Res., 5 (Suppl. 1), 134.
Marshall, L., Mölle, M., Michaelsen, S., Fehm, H.L., Born, J. 1996a Slow potential shifts at sleep wake transitions and shifts between NREM and REM sleep. Sleep, 19, 145 151.
Marshall, L., Mölle, M., Schreiber, H., Fehm, H.L., Born, J. 1994 Scalp recorded direct current potential shifts associated with the transition to sleep in man. Electroencephalogr. Clin. Neurophysiol., 91, 346 352.
McCallum, W.C. 1993 Human slow potential research: a review. In McCallum, W.C. & Curry, S.H. (eds), Slow Potential Changes in the Human Brain. Plenum, New York, pp. 1-12.
Mitzdorf, U. 1985 Current source density method and application in cat cerebral cortex: investigation of evoked potentials and EEG phenomena. Physiol. Rev., 65, 37 100.
Nuñez, A. 1996 Unit activity of rat basal forebrain neurons: relationship to cortical activity. Neuroscience, 72, 757 766.
Picton, T.W. & Hillyard, S.A. 1972 Cephalic skin potentials in electroencephalography. Electroencephalogr. Clin. Neurophysiol., 33, 419 424.
Pirch, J.H., Corbus, M.J., Gigdon, G.C., Lyness, W.H. 1986 Generation of cortical event related slow potentials in the rat involves nucleus basalis cholinergic innervation. Electroencephalogr. Clin. Neurophysiol., 63, 464 475.
Pleydell Pearce, C.W., McCallum, W.C., Curry, S.H. 1995 DC shifts and cognitive load. In Karmos, G., Molnár, M., Csépe, V., Czigler, I. & Desmedt, J.E. (eds), Perspectives of Event related Potentials Research. EEG (Suppl. 44). Elsevier, Amsterdam, pp. 302-311.
Plihal, W. & Born, J. 1997 Effects of early and late nocturnal sleep on declarative and procedural memory. J. Cogn. Neurosci., 9, 534 547.
Rechtschaffen, A. & Kales, A. 1968A Manual of Standardized Terminology, Techniques and Scoring System for Sleep Stages of Human Subjects. US Government Printing Office, Washington, DC: NIH Publ 204.
L. Marshall et al. DC potential shifts during nocturnal sleep 1178
Rockstroh, B. 1990 Hyperventilation induced EEG changes in humans and their modulation by an anticonvulsant drug. Epilepsy Res., 7, 146 154.
Rockstroh, B. & McCallum, W.C. 1993 Theories and significance of SPs. In McCallum, W.C. & Curry, S.H. (eds), Slow Potential Changes in the Human Brain. Plenum, New York, pp. 229-234.
Sejnowski, T.J. 1995 Sleep and memory. Neural Netw., 5, 832 834.
Speckmann, E.J., Caspers, H., Janzen, R.W.C. 1978 Laminar distribution of cortical field potentials in relation to neuronal activities during seizure discharges. In Brazier, M.A.B. & Petsche, H. (eds), Architectonics of the Cerebral Cortex, Raven Press, New York, pp. 191-209.
Stamm, J.S., Whipple, S.C., Born, J. 1987 Effects of spontaneous cortical slow potentials on semantic information processing. Int. J. Psychophysiol., 5, 11 18.
Steriade, M., Amzica, F., Contreras, D. 1996 Synchronization of fast (30-40 Hz) sponataneous cortical rhythms during brain activation. J. Neuroscience, 16, 392 417.
Steriade, M., Amzica, F., Nuñez, A. 1993b Cholinergic and noradrenergic modulation of the slow ( 0.3 Hz) oscillation in neocortical cells. J. Neurophysiol., 70, 1385 1400.
Steriade, M. & Contreras, D. 1995 Relations between cortical and thalamic cellular events during transition from sleep patterns to paroxysmal activity. J. Neuroscience, 15, 623 642.
Steriade, M., Nuñez, A., Amzica, F. 1993a A novel slow (< 1 Hz) oscillation of neocortical neurons in vivo: depolarizing and hyperpolarizing components. J. Neuroscience, 13, 3252 3265.
Tilley, A.J., Brown, S., Donald, M., Ferguson, S., Piccone, J., Plasto, K., Statham, D. 1992 Human sleep and memory processes. In Broughton, R.J. & Ogilvie, R.D. (eds), Sleep, Arousal, and Performance. Birkhäuser, Boston, pp. 117-127.
Wilson, M.A. & McNaughton, B.L. 1994 Reactivation of hippocampal ensemble memories during sleep. Science, 265, 676 679.


