Embed Size (px)
Citation preview

IEEE TRANSACTIONS ON VERY LARGE SCALE INTEGRATION (VLSI) SYSTEMS, VOL. 13, NO. 5, MAY 2005 539
Schedule-Aware Performance Estimation ofCommunication Architecture for Efficient
Design Space ExplorationSungchan Kim, Chaeseok Im, and Soonhoi Ha, Member, IEEE
Abstract—In this paper, we are concerned about performance es-timation of bus-based communication architectures assuming thattask partitioning and scheduling on processing elements are al-ready determined. Since communication overhead is dynamic andunpredictable due to bus contention, a simulation-based approachseems inevitable for accurate performance estimation. However,it is too time-consuming to be used for exploring the wide designspace of bus architectures. We propose a static performance-esti-mation technique based on a queueing analysis assuming that thememory traces and the task schedule information are given. Weuse this static estimation technique as the first step in our designspace exploration framework to prune the design space drasticallybefore applying a simulation-based approach to the reduced de-sign space. Experimental results show that the proposed techniqueis several orders of magnitude faster than a trace-driven simula-tion while keeping the estimation error within 10% consistently invarious communication architecture configurations.
Index Terms—Communication architecture, design space explo-ration, performance estimation, queueing theory.
I. INTRODUCTION
I NSTIABLE demand of system performance makes it in-evitable to integrate more and more processing elements
in a single system-on-a-chip (SoC) to meet the performancerequirements. As a new design paradigm for such high-perfor-mance SoCs, the separation between function and architectureand between communication and computation is recentlyproposed [1], [23]. Adapting this paradigm, it is assumedthat system behavior is modeled as a composition of functionblocks, and communication architecture is determined aftera decision is made on which processing elements are usedand which function blocks are mapped on which processingelements. Therefore, it allows designers to explore communi-cation architectures independently of component selection andmapping.
While diverse interconnection networks are searched for,particularly in the realm of network-on-chip (NoC) design, weare concerned about bus-based communication architecturessince they are still the most widely used due to their simplicity
Manuscript received March 13, 2004; revised June 4, 2004, and October 16,2004. This work was supported by the National Research Laboratory under Pro-gram M1-0104-00-0015, Brain Korea 21 Project, and the IT-SoC project. ICTat Seoul National University provided research facilities for this study.
S. Kim and S. Ha are with the Department of Electrical Engineering andComputer Science, Seoul National University, Seoul 151-742, Korea (e-mail:[email protected]; [email protected]).
C. Im is with Samsung Advanced Institute of Technology, Yongin, Gyeonggi440-600, Korea (e-mail: [email protected]).
Digital Object Identifier 10.1109/TVLSI.2004.842912
Fig. 1. Performance variation due to dynamic bus conflicts on a single busfor two bus request rates: (a) 0.115 (typical for multimedia applications) and(b) 0.17 (highly intensive cases).
and popularity. However, even after a specific bus standard ischosen, the design space of bus architectures can still be huge.For example, we need to determine how many bus segmentsare used with what topologies and which processing elementsand memory banks are allocated to which bus segments. Wealso have to decide memory types and memory system con-figurations. If we include the selection of bus operation clockfrequency and arbitration policy, the design space explodes.
Since a bus is a shared medium between multiple pro-cessing elements that compete with each other for using it,communication overhead is highly unpredictable due to buscontention. Fig. 1 shows the performance variation due to suchdynamic conflicts in terms of bus clock cycles on the single buscomplying with the AMBA AHB specification [21] varyingthe number of processing elements. Each processing element
1063-8210/$20.00 © 2005 IEEE

540 IEEE TRANSACTIONS ON VERY LARGE SCALE INTEGRATION (VLSI) SYSTEMS, VOL. 13, NO. 5, MAY 2005
Fig. 2. Proposed design space exploration flow.
issues bus requests randomly with a given request rate. Therequest rate of 0.1 means that 10% of the total execution timeis used for bus accesses. The average request rate of processingelements in Fig. 1(a) is 11.5%, which is a typical bus requestrate in multimedia applications such as H.263 encoder/de-coder, MP3 decoder, and so on. Fig. 1(b) shows the case ofand average request rate of 17%, which can be thought of asintensive bus traffic. The execution time of each processingelement is divided into two sections: white and dark. The darksection indicates the waiting time for the bus grant while thewhite section shows the actual execution time including thebus access time. The figure shows that the overhead due to busconflicts becomes the dominating factor on the entire executiontime as the number of processing elements increases and thebus request rate becomes higher. Thus, it is critical to considerthe bus conflicts for accurate performance estimation.
In order to explore the wide design space, we need to estimatethe performance of communication architectures fast as well asaccurately. While a simulation-based approach is widely usedfor accurate estimation, it is too slow to explore the huge designspace. To overcome this drawback, our communication archi-tecture exploration framework consists of two techniques: staticperformance estimation and trace-driven simulation. We focuson the static performance estimation technique, which is used toprune the design space drastically before the trace-driven sim-ulation technique is applied. As the static estimation gets moreaccurate, the design space becomes smaller. The proposed staticestimation technique computes the expected waiting time due tobus contention through the queueing analysis.
The remainder of this paper is organized as follows. InSection II, we briefly present our design space explorationframework. Section III reviews some related works andsummarizes our contributions. In Sections IV–VI, the staticestimation methods based on the queueing models for fixed pri-ority, round-robin, and two-level time-division multiple-access(TDMA) arbitration based bus systems are explained, respec-tively. Section VII contains the detailed discussions on theestimation method considering the schedule information andthe extension to multiple bus systems. The effect of schedulecomplexity on the estimation time is discussed in Section VIII.In Section IX, we provide the experimental results and drawconclusions in Section X.
Fig. 3. (a) Behavior specification of an illustrative example. (b) Its single-busimplementation. (c), (d) Dual-bus implementations, which are different in themapping of shared memories SM_arc2 and SM_arc3.
II. PROPOSED DESIGN SPACE EXPLORATION FRAMEWORK
The proposed design space exploration flow is shown inFig. 2. We assume that the task schedule on each processingelement and the memory trace information, including both localand shared memory accesses, from each processing element aregiven. The memory traces are obtained using a cycle-accurateinstruction set simulator for each processor core and an HDLsimulator for ASIC parts after the mapping is completed.
We traverse the design space in an iterative fashion, startingwith a single bus architecture that becomes the only element inthe “set of architecture candidate” initially and the best archi-tectures at the end of each iteration. From the best architectureof the previous iteration, we explore the design space incremen-tally by selecting a processing element and allocating it to a dif-ferent bus or a new bus. For a better understanding of the ex-ploration flow and the target architectures of interest, we use anillustrative example of Fig. 3. The system behavior is specifiedas the block diagram of four functions blocks. The arcs betweenthe function blocks show the execution dependency. Those func-tion blocks are mapped to three processing elements: andare mapped to the processing element PE0, to PE1, and toPE2, respectively.
Fig. 3(b) represents a single bus implementation. Its memorysubsystem contains seven logical memory segments: three localmemory segments and four shared memory segments. Thememory segments LM_PE0, LM_PE1, and LM_PE2 are thelocal memory segments of PE0, PE1, and PE2, respectively.The arcs between function blocks are implemented as sharedmemory segments for intercomponent communication.
In the first iteration, the single bus architecture in Fig. 3(b)becomes the best architecture. Now we go into the second it-eration and generate the candidate architectures by selecting aprocessing element and allocating it to a different bus. Supposethat we select PE2 and allocate it to a new bus resulting in adual bus system. Since all local memory segments should re-side in the same bus as the associated processing elements, thereare four candidate architectures depending on where to put theshared memory segments associated with PE2: SM_arc2 andSM_arc3. The function blocks and use the shared memorysegment SM_arc2 so that it may be allocated to either bus0 orbus1. However, SM_arc0 that is accessed by and shouldremain at bus0. Among four candidate architectures, Fig. 3(c)and (d) shows two candidate architectures. In the case that weselect PE0 and move it to a new bus, we generate 16 different

KIM et al.: SCHEDULE-AWARE PERFORMANCE ESTIMATION OF COMMUNICATION ARCHITECTURE 541
candidate architectures since PE0 is associated with four sharedmemory segments. In this fashion, we can generate 24 candi-date architectures in the second round of iteration by movinga processing element into a new bus and considering all pos-sible shared memory segment allocations. In addition, we con-sider the different priority assignments of processing elementson each bus.
The proposed static estimation technique is applied to all can-didate architectures to select the reduced set of candidate archi-tectures. Suppose that the accuracy of the static estimation is10%. Then we select the top 10% of the candidate architecturesin terms of the estimated performance. Among the reduced setof candidate architectures, we select the best candidate architec-ture through the accurate trace-driven simulation. Then, we goto the next iteration. A more detailed description of the frame-work is beyond the focus of this paper and is given in [20].
III. RELATED WORK AND OUR CONTRIBUTION
Some researchers have considered communication architec-ture selection simultaneously during the synthesis of the com-putation parts of a system and the mapping step. Since the com-munication overhead is needed for the mapping decision, thestatic estimation of the communication architecture has beeninvestigated. Knudsen and Madsen estimated the communica-tion overhead taking into account the data transfer rate varia-tion depending on protocol, configuration, and different oper-ating clock frequencies of components [6], [7]. A technique hasbeen proposed to estimate the communication delay using theworst-case response analysis of the real-time scheduling [8]. Or-tega and Borriello took into account the static information suchas data transfer size, bus protocol overhead, and bus bandwidthto estimate the worst-case bus delay [9]. Nandi and Marculescuproposed the performance measure technique based on a contin-uous-time Markov process [10]. Daveau et al. considered onlystatic information, such as maximum bandwidth of channel,\and average and peak bandwidth of a processing element, toestimate the performance of communication links between pro-cessing elements [11]. Drinic et al. used the profiled statisticsof communication traffics between cores for a given applicationfor core-to-bus assignment [22]. Thepayasuwan and Doboli pro-posed the bus architecture synthesis technique that minimizesthe cost considering bus topology, communication conflict, andbus utilization using a simulated annealing [25]. However, thesetechniques do not model the dynamic effects such as bus con-tention and explore only the limited configuration space.
For the exploration of communication architectures, a simu-lation-based estimation has been widely adopted in many aca-demic research projects [3]–[5], [24] and commercial tools atvarious abstraction levels, at the transaction level [13], [14], orat the pin-level [15]. The simulation-based method gives accu-rate estimation results but pays too heavy a computational costto be used for exploring the large design space. Thus, the re-search based on this method cannot only exploit a few designaxes to reduce the design space.
Lahiri et al. presented the hybrid approach combining staticestimation and simulation [12]. In their work, communicationand computation segments are grouped to make a bus andsynchronization event (BSE) graph from the trace data obtainedafter system cosimulation. They focused on intercomponent
communication activities that are usually localized in time atthe boundary of computation segment. The trace groups arescheduled on a communication media, which are shifted by theestimated delays considering the resource contention. They usesome static analysis to group the traces and apply a trace-drivensimulation with the trace groups. Their approach is similarto ours in that they apply some static analysis to the tracesto reduce the time complexity of the trace-driven simulation.However, their approach converges to the trace-driven simula-tion as the memory traces become larger since the BSE graphsize is dependent on the memory traces. On the other hand,our proposed technique extracts only the statistical parametersfrom the traces. Therefore, the run time of our technique isindependent of the trace size.
Our work is inspired by Brandwajn’s work [2] in which asimple queueing model of an SCSI bus is proposed, which issummarized in Section IV-A. The model produces remarkableresults compared with the simulation results. Since the commu-nication behavior of a processor bus is quite different from thatof an I/O bus, however, their approach cannot be directly ap-plicable. Instead, we make several extensions to improve theestimation accuracy significantly. First, the queueing model it-self is modified for the processor bus system. Second, based onthe fixed priority model, we develop a novel way of modelingother types of buses, such as round-robin and two-level TDMAbuses. The extended models are explained in Sections IV-B, V,and VI, respectively. Third, we make use of the task scheduleinformation by the aid of a system-level specification to con-sider the burstness of bus requests. Finally, the model of a singlebus is extended to a multiple bus system, which makes the pro-posed estimation technique viable for communication architec-ture exploration considering various bus topologies. The detailsare given in Section VII.
The key contributions of this paper can be summarized as fol-lows. First, we propose the efficient static-estimation techniqueusing the queueing model to take into account dynamic behav-iors due to bus contention and dynamic memory traces. Second,by adopting the task schedule information, we make the accu-racy of the estimated entire execution time comparable with thatof the trace-driven simulation. Finally, we enable designers toexplore the wide design space of communication architecturesconsidering the design axes than the previous works.
IV. QUEUEING MODEL OF A FIXED PRIORITY BASED BUS
A. Base Queueing Model for a Single I/O Bus
A base estimation technique using a queueing model for afixed priority based I/O bus is reviewed in this section. Thebasic idea and the notations used here are borrowed from [2].There are processing elementscompeting for the use of a bus. It is assumed that a bus arbi-tration is based on the fixed priorities of processing elements.
is assigned the highest priority. The bus access is assumedto be nonpreemptive.
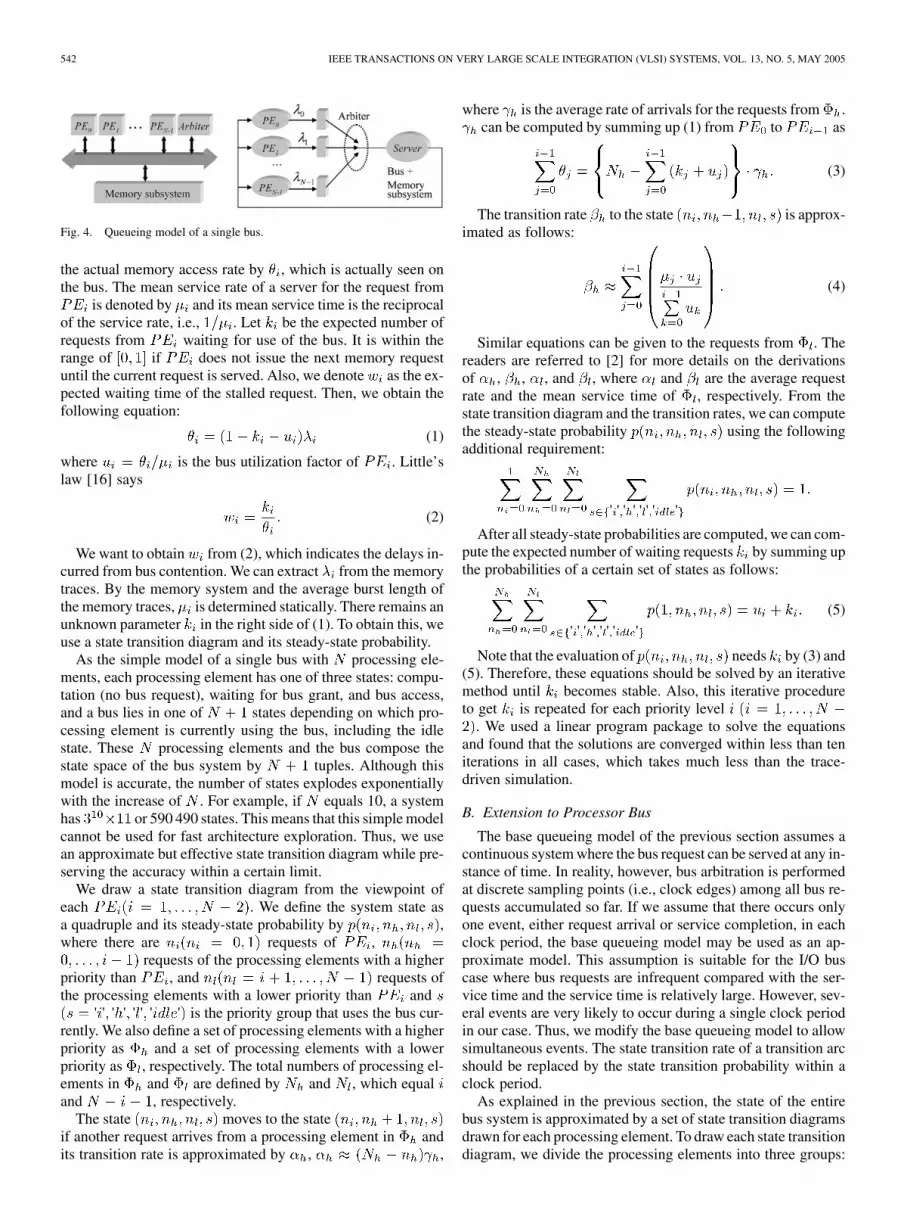
Fig. 4 shows the queueing model of a single bus architec-ture. denotes the rate at which the processing elementissues memory requests. It is computed as the ratio between thememory access counts and the scheduled length of execution. Ifthe execution time is lengthened due to bus contention, the effec-tive arrival rate of requests becomes smaller than . We denote
542 IEEE TRANSACTIONS ON VERY LARGE SCALE INTEGRATION (VLSI) SYSTEMS, VOL. 13, NO. 5, MAY 2005
Fig. 4. Queueing model of a single bus.
the actual memory access rate by , which is actually seen onthe bus. The mean service rate of a server for the request from
is denoted by and its mean service time is the reciprocalof the service rate, i.e., . Let be the expected number ofrequests from waiting for use of the bus. It is within therange of if does not issue the next memory requestuntil the current request is served. Also, we denote as the ex-pected waiting time of the stalled request. Then, we obtain thefollowing equation:
(1)
where is the bus utilization factor of . Little’slaw [16] says
(2)
We want to obtain from (2), which indicates the delays in-curred from bus contention. We can extract from the memorytraces. By the memory system and the average burst length ofthe memory traces, is determined statically. There remains anunknown parameter in the right side of (1). To obtain this, weuse a state transition diagram and its steady-state probability.
As the simple model of a single bus with processing ele-ments, each processing element has one of three states: compu-tation (no bus request), waiting for bus grant, and bus access,and a bus lies in one of states depending on which pro-cessing element is currently using the bus, including the idlestate. These processing elements and the bus compose thestate space of the bus system by tuples. Although thismodel is accurate, the number of states explodes exponentiallywith the increase of . For example, if equals 10, a systemhas or 590 490 states. This means that this simple modelcannot be used for fast architecture exploration. Thus, we usean approximate but effective state transition diagram while pre-serving the accuracy within a certain limit.
We draw a state transition diagram from the viewpoint ofeach . We define the system state asa quadruple and its steady-state probability by ,where there are requests of ,
requests of the processing elements with a higherpriority than , and requests ofthe processing elements with a lower priority than and
' ' ' ' ' ' ' ' is the priority group that uses the bus cur-rently. We also define a set of processing elements with a higherpriority as and a set of processing elements with a lowerpriority as , respectively. The total numbers of processing el-ements in and are defined by and , which equaland , respectively.
The state moves to the stateif another request arrives from a processing element in andits transition rate is approximated by , ,
where is the average rate of arrivals for the requests from .can be computed by summing up (1) from to as
(3)
The transition rate to the state is approx-imated as follows:
(4)
Similar equations can be given to the requests from . Thereaders are referred to [2] for more details on the derivationsof , , , and , where and are the average requestrate and the mean service time of , respectively. From thestate transition diagram and the transition rates, we can computethe steady-state probability using the followingadditional requirement:
' ' ' ' ' ' ' '
After all steady-state probabilities are computed, we can com-pute the expected number of waiting requests by summing upthe probabilities of a certain set of states as follows:
' ' ' ' ' ' ' '
(5)
Note that the evaluation of needs by (3) and(5). Therefore, these equations should be solved by an iterativemethod until becomes stable. Also, this iterative procedureto get is repeated for each priority level
. We used a linear program package to solve the equationsand found that the solutions are converged within less than teniterations in all cases, which takes much less than the trace-driven simulation.
B. Extension to Processor Bus
The base queueing model of the previous section assumes acontinuous system where the bus request can be served at any in-stance of time. In reality, however, bus arbitration is performedat discrete sampling points (i.e., clock edges) among all bus re-quests accumulated so far. If we assume that there occurs onlyone event, either request arrival or service completion, in eachclock period, the base queueing model may be used as an ap-proximate model. This assumption is suitable for the I/O buscase where bus requests are infrequent compared with the ser-vice time and the service time is relatively large. However, sev-eral events are very likely to occur during a single clock periodin our case. Thus, we modify the base queueing model to allowsimultaneous events. The state transition rate of a transition arcshould be replaced by the state transition probability within aclock period.
As explained in the previous section, the state of the entirebus system is approximated by a set of state transition diagramsdrawn for each processing element. To draw each state transitiondiagram, we divide the processing elements into three groups:

KIM et al.: SCHEDULE-AWARE PERFORMANCE ESTIMATION OF COMMUNICATION ARCHITECTURE 543
TABLE ISTATE TRANSITIONS FROM THE STATE (N ;N ;N ; S) TO OTHER STATES
the processing element of interest, those with a higher priority,and those with a low priority. In this approximate model, anevent is defined by a single increment or decrement for eachcoordinate of the state . There are two kinds ofevents which are the bus requests from three priority groupsand the completion of current bus access. Table I shows all pos-sible state transitions in our compromised model. We classifythe transitions into two types, Type 1 and Type 2, dependingon how many events occur during the next clock cycle. Notethat we do not allow the state transition from to
in the compromised model.For the computation of the transition probabilities, we define
two parameters and as the probabilities that at least oneprocessing element issues a new request from and , re-spectively
(6)
In the case that a processing element in is using a bus, thetransition probability from to
becomes .In order to validate the accuracy of our compromised model,
we compare it with a more general but complicated model todeal with simultaneous events. In this model, we also allowa certain priority group to request more than one simultaneousevent. Then the transition from the state to thestate is valid as long as the following constraintsare satisfied:
(7)
The rate of the transition from to, , can be expressed as the product of three
terms, i.e., , where , , and arethe contributions by the events from the three priority groups,respectively. The equations for the terms are given in (8), at thebottom of the next page. indicates the transition rate from
to ignoring other processing elements. The equations for
and are complicated depending on to which case thenext state might belong where:
• number of processing elements reaches or ;• priority group is not granted a bus and new requests occur;• priority group is granted a bus and new requests occur;• service for the request is completed.
Comparisons between the base queueing model, our compro-mised model, and the general model are made in Fig. 5. We usesingle bus systems and randomly generated memory traces inthe comparisons. The general model is configured with the var-ious numbers of maximum simultaneous events 2–4. The esti-mation errors are computed against the trace-driven simulationresults. More detailed explanation on the experimental environ-ment is referred to Section IX-A.
Fig. 5(a) shows that both our compromised model and thegeneral model achieve a significant improvement in accuracycompared with the base model. However, even though the gen-eral model tends to be more accurate with more simultaneousevents, the accuracy improvement is not remarkable. Further-more, as shown in Fig. 5(b), it is observed that no clear distinc-tion exists for the variations of the estimation errors betweenthe compromised and the general models. Fig. 5(c) representsthe execution time of the linear program solver. Execution timesfor solving the models are about the same because the problemsize by the queueing model is not dependent on the number oftransitions but dependent on the number of states. However, themodeling complexity grows exponentially as the number of si-multaneous events grows. Considering those observations, weconfirm that our compromised model can be used effectively.
V. MODELING OF A ROUND-ROBIN-BASED BUS
The queueing model of a fixed priority bus serves as the basemodel for other arbitration schemes. In this section, we presentthe queueing model for a bus with a round-robin arbitrationscheme. The round-robin arbitration is commonly used inon/off-chip bus standards with a hybrid arbitration scheme,incorporating with fixed priority or TDMA arbitration [18],[19].

544 IEEE TRANSACTIONS ON VERY LARGE SCALE INTEGRATION (VLSI) SYSTEMS, VOL. 13, NO. 5, MAY 2005
In the round-robin scheme, contrary to the fixed priorityscheme, the priority of each processing element dynamicallyvaries between the highest and the lowest depending on theposition of the processing element and the distance fromthe most recent processing element accessing a bus in thecircular bus grant order. Processing elements are granted abus in the order that their indexes are wrapped around. Toconstruct a state transition diagram for the round-robin system,we decompose the round-robin system into multiple fixedpriority systems as shown in Fig. 6 to construct a hierar-chical state transition diagram. We defineas the fixed priority based bus system with processingelements and the priorities given in thesequence of . hasthe highest priority. Next, we define - as theround-robin based bus system with processing elements
. Therefore, we have
- - -
A hierarchical state - is entered whencompletes a bus access. Therefore, the state transition rate from
- to - is the product of the servicerate of and the actual bus access rate of in the fixed pri-ority system inside - . If we denote as theactual bus access rate of inside - , it canbe computed by solving the fixed-priority-based system usingthe queueing model proposed in the previous section. In fact,
is equal to of the previous section if the priority
list is identically set. Since the service rate of is consis-tent throughout the execution, the state transition rate from
- to - becomes
(9)
Once all transition rates are determined, we obtain the steady-state probability of each hierarchical state using an additionalrequirement
Now we are ready to compute the expected wait timefor a bus access of on the round-robin-based system. Itis the weighted sum of the expected wait time of ineach hierarchical state - . Thus, we arrive at thefollowing equation:
(10)
VI. MODELING OF A TWO-LEVEL TDMA-BASED BUS
We also use a hierarchical state diagram to model more com-plicated arbitration policies: modeling of a two-level TDMA-based bus is explained in this section. It consists of two arbitra-tion schemes, primary TDMA and secondary round-robin. The
if andif andif and and ' 'if andotherwise.
if and ' '
if and ' '
if and ' '
ifotherwise.
if and ' '
if and ' '
if and ' ',and ' ' or ' '
if and ' ' and ' '
and , or
if and ' ' and ' '
and , andif ,otherwise
(8)

KIM et al.: SCHEDULE-AWARE PERFORMANCE ESTIMATION OF COMMUNICATION ARCHITECTURE 545
Fig. 5. Comparisons between the compromised queueing model and thegeneral queueing models with the various numbers of simultaneous events.
first level of arbitration uses a timing wheel where each slot isstatically reserved for a unique master. A processing elementwith heavy communication requirements may reserve more thanone slot. Although the TDMA-based architecture guarantees afixed bus bandwidth for each processing element, no bus re-quest from the processing element associated with the currentslot means the waste of bus bandwidth. In order to prevent thewaste of this unused slot, another processing element may begranted the bus by round-robin arbitration during the slot.
A two-level TDMA system can also be treated as the com-position of multiple fixed priority systems similarly to theround-robin based system discussed in the previous section.
Fig. 6. State transition diagram of a round-robin arbitration bus.
Consider the example system that has four processing elements. When the total bandwidth of a bus is normal-
ized to 1, is assigned a bandwidth less than 1 andthe sum of the bandwidths of all processing elements becomes1. Suppose that is assigned the current TDMA slot and
has the highest priority in the round-robin order. Thebus grant order for round-robin arbitration is again assumedto be the order of processing element indexes. Therefore, thepriority at the current time slot will be (0,1,2,3), i.e., hasthe highest priority, becomes the second, and so on.
More generally, we define an assignment sequence of timeslots as follows:
where processing elements are assigned and is a set oftime slots that is assigned. We also define the two-levelTDMA based bus system as
-
- -
where - is the hierarchical state inwhich is assigned the current time slot andhas the highest priority in the priority based system with
processing elements except for . Therefore,the overall priority order in - becomes
.Fig. 7(b) shows the example state transition from
- for a given fixed 16-slot assignmentof the TDMA protocol as shown in Fig. 7(a). If is granteda bus in the state - , the next state is one of
- , - , - ,and - depending upon which processingelement gets the next TDMA slot. Overall 12 transitions canbe drawn from - as shown in Fig. 7(b). Butsome destination states are duplicated in the figure. For instance,the transition from - to -can occur by granting the bus to either or . On theother hand, some state transitions are not allowed in the givenslot assignment. For example, when is assigned the cur-

546 IEEE TRANSACTIONS ON VERY LARGE SCALE INTEGRATION (VLSI) SYSTEMS, VOL. 13, NO. 5, MAY 2005
Fig. 7. (a) An example of TDMA slot assignment and (b) the state transitions from bs - according to the slot assignment in (a).
Fig. 8. (a) An example schedule of PE and PE , and PE and its corresponding queueing model, (b) new queueing model after the function block C isfinished at T , and (c) another queueing model after the function block B is finished at T .
rent slot in Fig. 7(b), the next slot can be allocated only toand so that no transitions to - and to
- can be made. Those infeasible transitionsare represented as the dashed lines in Fig. 7(b). In general, forgiven processing elements, there are less thanstate transitions from a certain state.
We define as the probability that can be assignedthe next TDMA slot when is assigned the current slot.In the case of Fig. 7(a), and become 0.67 and 0.33,respectively. Both and are zero. Suppose that thedestination state is - when is granteda bus in - . Then the transition rate from
- to - , ,becomes the product of the actual bus request rate of in
- , the service rate of , and so thatwe get the following equation:
(11)
where is the actual bus request rate of in- and can be obtained by solving the fixed
priority system where and have the highest and thesecond priorities respectively as explained in Section IV. Weobtain the steady state probability of each -with these state transitions rates and an additional requirement:
-
A similar equation as (10) can be used to compute the ex-pected wait time for each processing element.
VII. STATIC ESTIMATION USING SCHEDULE INFORMATION
A. Estimation of Single Bus Systems
This section explains how the task schedule information isused in our estimation method. A simple statistical modelingof the bus requests from a processing element assumes that thebus requests are distributed evenly throughout the whole execu-tion duration of an application. This assumption is one of themain sources of the inaccuracy of simple static statistical mod-eling. Since we assume that the schedule of function blocks ispredetermined, the pattern of bus requests is determined stati-cally as shown in Fig. 8. Note that the initial schedule is madewithout considering the wait time for bus access. We divide theschedule into several time slots in such a way that all processingelements maintain their bus request patterns during each timeslot. Then, we apply the proposed queueing analysis in eachtime slot starting from the beginning of schedule. The shaded re-gions in the figure indicate the remaining sections for the staticestimation.
During the first time slot, three function blocks , , andare executed concurrently on , , and respectively.To evaluate the expected wait delay for bus access from eachprocessing element, a queueing system is constructed as shownin Fig. 8(a). From the proposed queueing analysis, we computehow much the initial schedule length of function blocks is ex-tended due to bus contention. Suppose that the function blockon is finished first at . Then we consider the next time

KIM et al.: SCHEDULE-AWARE PERFORMANCE ESTIMATION OF COMMUNICATION ARCHITECTURE 547
Fig. 9. Schedule-aware performance estimation algorithm for a single bus.
slot where two function blocks and are accessing a bus asshown in Fig. 8(b) and construct another queueing model with
and . This time slot is also lengthened until the func-tion is completed at . After , another queueing modelwith and is made for the evaluation of the remainingschedule. This evaluation process is repeated until the queueingmodel examines all of the scheduled function blocks.
The overall algorithm of the estimation technique for a singlebus is described in Fig. 9. The procedure Estimate_Single_Bushas five inputs. represents the data structure of a singlebus. MT is the memory traces of all processing elements andORI_SCHED is the initial schedule. PL is a set of processingelements and FL is a set of function blocks used. The output,EVAL_SCHED, of this procedure is the updated schedule afterconsidering all bus conflicts and any other overheads.
The main procedure of the queueing analysis is Esti-mate_End_Time. Before the queueing analysis, we firstdetermine which processing elements request a bus by callingthe procedure Get_Current_Fb and compute the statisticalparameters by calling the procedure Get_Stat_Params. Wecompute two statistical parameters of each function block fromthe memory traces MT: they are the memory access rate withno bus conflicts and the mean service time . The memoryaccess rate during the execution of the function block FB onthe processing element PE is formulated as follows:
(12)
where is the total memory access counts andis the execution time of the function block on
the processing element . When computing the mean servicetime, we consider the different burst transfer size according tothe memory access type. For example, code memory access isusually the burst access of which the size equals to the cacheline size, whereas data memory access may have various burstlengths. Therefore, we define a set of memory access typeswith three types: code memory access , data memoryaccess , and shared memory access
Fig. 10. The modeling of communication via a bus bridge.
For each set of access types, we further define a set of bursttransfer types according to the burst transfer length:
- -
There may be more burst transfer types in general. However,for simplicity, we assume only 4 types of burst transfers, whichare used in the ARM720T processor. Then, the mean servicetime for the function block on the processing elementis computed as
(13)
where and are the service time in-cluding the bus overhead as well as the memory access time andthe burst transfer counts of the type in the memory accesstype for the function block allocated on the processingelement respectively.
The final procedure Update_Schedule modifies the initialschedule to obtain the updated schedule, EVAL_SCHED, afterthe current time slot. From the updated schedule, we define thenext time slot and go back to the main iteration body until allfunction blocks are considered. In the case that the number offunction blocks is huge or the schedule length is very long, thetime complexity of our proposed technique approaches to thatof the trace-driven simulation due to too frequent invocationof linear program solver. To reduce this problem, neighboringfunction blocks can be clustered into a group, which is discussedin Section VIII-C.
B. Extension to Multiple Bus Systems
Communications across buses are achieved via a bus bridgein multiple bus systems. A bus bridge plays both roles of a pro-cessing element and a memory as displayed in Fig. 10. We as-sume for simple analysis that no communication passes throughmore than 3 buses.
Fig. 10 shows how the bridge is modeled when a processingelement on the bus src accesses the memory Mem on the busdest. The request rate of the processing element is re-flected to the bus by the request rate of the bridge. Wehave to know the expected waiting time of the processingelement on the bus to compute . At the same time,the bridge looks like a memory from the bus point of view.Therefore, the service rate of the bridge should be com-puted. Let be the expected waiting time of the bridge onthe bus . Then, and are computed as follows:
(14)
where is the overhead associated with the bridge. Onthe other hand, and are obtained from our estimation

548 IEEE TRANSACTIONS ON VERY LARGE SCALE INTEGRATION (VLSI) SYSTEMS, VOL. 13, NO. 5, MAY 2005
TABLE IICOMPLEXITY OF THE PROPOSED ESTIMATION TECHNIQUE
technique after computing and . Therefore, the esti-mation and the bridge modeling are performed iteratively untilall parameters become stable.
VIII. TIME COMPLEXITY
As explained in the previous section, our proposed techniqueprogresses dividing the entire schedule into several time slots inwhich separate queueing models are constructed and to whichthe proposed queueing analysis is applied. Therefore, the timecomplexity of the proposed technique depends on the productof the time complexity of the queueing analysis and the numberof time slots. First, we consider the time complexity of thequeueing analysis.
Table II shows the run time of the proposed estimationtechnique and the maximum and the minimum number of statesvarying the number of processing elements on Xeon 2.8 GHzworkstation running Linux. We used a GNU Scientific Li-brary (GSL) [17] to solve the linear equations of the proposedmethod. In the case of the fixed priority base system, for eachprocessing element , the number of statesis where is the total number of processing elements.The number of states depends on the priority of the processingelement of interest. Since the time complexity of linear programsolver is pseudo-polynomial, the overall time complexity isalso pseudo-polynomial.
As for the round-robin based system, since there exist pri-ority lists for processing elements, the complexity becomesroughly times larger than that of the fixed priority basedsystem. On the other hand, since the two-level TDMA basedsystem with processing elements may have up topriority lists, its complexity is roughly times largerthan the fixed priority case. Note that all three cases still have thepseudo-polynomial time complexity although the overall com-plexity increase as the arbitration scheme becomes complicated.Table II confirms that the proposed technique has the acceptablecomplexity for fast design space exploration.
A. Comparison With Trace-Driven Simulation
While the time complexity of the proposed technique dependson the number of processing elements as discussed above, thatof the trace-driven simulation depends on the trace size as wellas the number of processing elements. Considering those pa-rameters, comparisons are made quantitatively by measuring theexecution time as shown in Fig. 11. The number of processingelements is varied from 2 to 16. The average schedule length ofeach processing element is also varied from 10 cycles to 10cycles. The average bus request rate for each processing ele-ment is set to about 0.12, which is a typical value for multimediaapplications.
Fig. 11. Comparison of time complexity between the proposed technique anda trace-driven simulation technique.
The time complexity of the proposed technique increasesfaster than the trace-driven simulation as the number of pro-cessing elements increases. It explains why the time complexityof the proposed technique is larger when the schedule length isshort and the number of processing elements is 16 in Fig. 11.However the execution time of the trace-driven simulationgrows proportionally to the trace size while that of the proposedapproach remains the same. Therefore the benefit of usingthe proposed technique grows as the length of the time slotincreases.
B. Effects of Schedule Complexity
The time complexity of the proposed technique is also pro-portional to the number of time slots. Since each time slot is de-fined when a function block finishes its execution, the number oftime slots is about the same as the number of scheduled functionblock invocations. In many video applications, the number offunction block invocations can be very large due to the differentexecution rates of function blocks. Fig. 12 shows an H.263 de-coder specification example that is mapped to two processing el-ements: an ARM9 processor and a dedicated hardware for IDCTas specified in Fig. 12(a) and (b), respectively. To decode onemacro block, one invocation of gray function blocks and fourinvocations of black function blocks are required. To decodeone QCIF-formatted frame that consists of 99 macro blocks,the schedule contains the total 6968 invocations of the functionblocks.

KIM et al.: SCHEDULE-AWARE PERFORMANCE ESTIMATION OF COMMUNICATION ARCHITECTURE 549
Fig. 12. The specification of H.263 Decoder and the mapping of functionblocks to: (a) an ARM9 processor and (b) a dedicated IDCT hardware.The groups in (a) and (b) are executed 99 times during decoding one frame.
Fig. 13. Grouping the function blocks in the schedule is required to enhancethe efficiency of the proposed technique.
C. Effects of Schedule Complexity
Fig. 13 shows that the naïve application of the proposed tech-nique is worse than the trace-driven simulation since the av-erage granularity of the function blocks is too small. Therefore,we group the function blocks that are repeatedly executed inthe same sequence. Such grouping also reduces the effectivenumber of time slots. In this example, we group the functionblocks that decode one macro block and apply the proposed es-timation technique to the first invocation of the group. A signifi-cant efficiency gain, about 47 times, is obtained by grouping thefunction blocks as shown in the figure.
IX. EXPERIMENTS
A. Estimation Accuracy of Single Bus Systems
To investigate the accuracy of the proposed static estimationmethod over a wide variety of working conditions, the first set ofexperiments considers a single bus architecture varying numberof processing elements, bus request rates, bus service rates (ormemory access times), and burst lengths. Then we comparedthe estimation results with those obtained from the trace-drivensimulation. Our trace-driven simulator adjusts the time stampsof trace data by accurately modeling the communication archi-tecture that includes buses and memories. More precisely, inthese experiments, the bus model used in our trace-driven simu-lator consists of 4 phases: bus-arbitration, start-address-drive,sequential-burst-transfer, and last-data-drive.
Fig. 14. Burst transfer of four words on our bus model.
Fig. 15. (a) Schedule of function blocks on N processing elements(PE ; PE ; . . . ; PE ) and (b) a single bus architecture that consists ofN processing elements and a memory subsystem.
Fig. 14 shows the burst transfer of four words complying withthis bus model. The part tagged with ’ ’ means the waiting timeof a processing element due to bus conflicts. The parts , ,and are the bus protocol specific overheads and are all set to1 cycle in this experiment. The part consists of more thanone word accesses to the memory. The memory is configuredwith two parameters, which are the initialization cycle for bursttransfer and the access cycle taken for a single word during theburst transfer. For example, they are set to 1 and 2 clock cyclesrespectively in Fig. 14. It is assumed that other control signalsare synchronized with the address bus and are not shown herefor simplicity.
A template example system for our first set of experiments isdescribed in Fig. 15. processing elements are selected and allprocessing elements are busy during the same schedule length,10 000 cycles. In order to maximize bus conflicts, all processingelements are connected to a single bus as shown in Fig. 15(b).The number of processing elements and the memory subsystemaccess time define the configuration points in this architecturetemplate. We vary the number of processing elements from 2to 10. The bus request rate of each processing element ischosen randomly within the range from 0.05 to 0.2. For a se-lected bus request rate, we generated the memory traces fromeach processing element following the Poisson distribution (i.e.,the exponentially distributed inter-arrival times between bus re-quests). While generating the memory traces, we also random-ized the burst lengths. As for the memory subsystem, the burstinitialization overhead is always fixed to 1 cycle. The singleword access time of each processing element is assigned in fourdifferent ways: the identical assignments of 1, 3, and 5 cycles to

550 IEEE TRANSACTIONS ON VERY LARGE SCALE INTEGRATION (VLSI) SYSTEMS, VOL. 13, NO. 5, MAY 2005
Fig. 16. Estimation accuracy according to the number of processing elementsand the memory access time for each arbitration scheme.
all processing elements and the random assignments, among 1,3, and 5 cycles, to each processing element. In the case that is0.1 and memory access time is 1 cycle, the portion of the totalmemory access time over the entire execution time is about 0.36.This portion is almost same as the case of an H.263 encoding al-gorithm, which will be discussed later.
Using these configuration points, 20 example systems wereconstructed for each of three arbitration schemes: fixed priority,round-robin, and two-level TDMA. We performed the proposedstatic analysis and the trace-driven simulation to compare thetotal execution time of the example systems. For each set of ex-periments, we generated the memory traces 10 times. Fig. 16shows the experimental results, which indicate the range of es-timation errors of the completion times. It is observed that theestimation error of the proposed method does not exceed 4%in all cases. These experiments show the robustness of the pro-posed technique on various architecture configurations and ar-bitration schemes.
B. Comparison With Simpler Models
In this section, we show the improvement of our proposedmodel over two simpler estimation models: the base queueingmodel of an I/O bus reviewed in Section IV-A and the intuitiveanalytical model assuming a fixed priority bus system. It is ques-tionable whether there is a simpler static estimation method that
is reasonably accurate. So, we devised an intuitive equation onthe expected waiting time of , , by bus contention, asshown in (15) for a single bus that has processing elements
(15)
where , , and are the total memory access time, thetotal execution time, and the mean service time of respec-tively. At the right side of (15), the first term is the expectedwaiting time due to the bus requests from the priority groupand the second term is the waiting time due to the current out-standing request of the priority group .
The same experimental environment in Fig. 15 is used again.We estimated the performance of 20 communication architec-ture configurations using the base model of an I/O bus and (15).Each experiment was repeated 10 times with randomly gener-ated memory traces. Fig. 17(a)–(c) summarize the estimationresults by three estimation techniques in terms of the absoluteerror range compared with the trace-driven simulation. One bargraph for a given number of processing elements covers all kindof the memory access times mentioned in the previous section.
Although the average estimation error of the base queueingmodel does not exceed 6% as shown in Fig. 17(d), the variationof errors becomes larger rapidly as the number of processingelements increases. The intuitive equation does not produce theacceptable estimation accuracy on the variation of errors as wellas the average error rate. On the other hand, the processor busmodel shows the consistent estimation errors within the rangeof about 1.3% on average.
C. Design Space Exploration of 4-Channel DVR
Next, we validate our proposed technique by applying it to apractical example, 4-channel digital video recorder (DVR). Theraw bit streams from external four sources are encoded sepa-rately by DVR using an H.263 encoding algorithm. Fig. 18(a)shows the specification of an H.263 encoding algorithm. Allfunction blocks of an H.263 encoder except for the motion-es-timation (ME) and the discrete-cosine-transform (DCT) blocksare mapped to one ARM720T. And all and DCT blocksare mapped to the dedicated hardware blocks for ME and DCT,respectively, so that four H.263 encoders share two hardwareblocks. Therefore the initial schedule of each function blockis constructed like Fig. 18(b). Fig. 18(c) summarizes the totalmemory access counts for each processing element. Memorytraces are obtained by encoding a P-frame of QCIF-formattedbit-stream from the same video clip for all channels.
With the DVR example, we verified our proposed explorationflow explained in Section II. Many architecture candidates aregenerated changing the number of buses, the mapping of pro-cessing elements to buses, the move of related shared memorysegments, and the associated bridge connections. Other commu-nication architecture parameters, such as priority assignment,bus data-width, and so on, are fixed to the arbitrary values [20].

KIM et al.: SCHEDULE-AWARE PERFORMANCE ESTIMATION OF COMMUNICATION ARCHITECTURE 551
Fig. 17. The comparison of estimation errors for the example systems ofFig. 15 between: (a) the base queueing model for an I/O bus, (b) the intuitiveequation, and (c) the proposed model for the processor bus. (d) Averageestimation errors according to the estimation techniques.
The results of exploration are summarized in Table III. Thenumber of buses is changed from 1 to 6. For a given numberof buses, the number of bus bridges reflects indirectly the com-plexity of bus topology. In the last two columns on the rightside, the estimation errors compared with the trace-driven sim-ulation are reported with its range and the average absolutevalues. During the exploration over more than 200 architecturesfor each arbitration scheme, our proposed estimation techniquekeeps its accuracy within the range from 6% to 8.5%. The time
Fig. 18. (a) The specification of an H.263 encoding algorithm, (b) the initialschedule of 4-channel digital video recorder (DVR), and (c) the size of memorytraces.
TABLE IIIEXPERIMENTAL RESULTS ABOUT 4-CHANNEL DVR
FOR THREE ARBITRATION SCHEMES
for the trace-driven simulation is about 5 min for one bus archi-tecture with fixed priority arbitration while the proposed schemespends about 1.5 s. Through this experiment, we verified the va-lidity of our proposed static estimation techniques.
X. CONCLUSION
In this paper, we presented an efficient static estimationtechnique of bus architectures based on three commonly usedarbitration schemes: fixed priority, round-robin, and two-levelTDMA. It is based on the queueing model and makes useof the schedule information and the memory traces. Sincethe estimation time is pseudo-polynomial to the number of

552 IEEE TRANSACTIONS ON VERY LARGE SCALE INTEGRATION (VLSI) SYSTEMS, VOL. 13, NO. 5, MAY 2005
processing elements, the number of function blocks, and thenumber of buses used, the proposed technique can be used toprune the large design space before the trace-driven simulation.Experimental results show that our proposed technique is sev-eral orders of magnitude faster than the trace-driven simulationwhile keeping the estimation error within 8% consistently inthe various communication architecture configurations.
The bus architectures we assume in this paper do not havethe advanced features being used in the-state-of-art bus architec-tures such as split-transaction, multiple outstanding bus masters,out-of-order transaction, and so on. Such advanced features willaffect the service rate of the memory system in our simplifiedqueueing model. It will be a future research topic to investigatethe scope of applicability of the proposed technique. Since theobjective of the proposed static analysis is to reduce the designspace, a reasonable amount of inaccuracy is still tolerable to ac-celerate the design space exploration.
So far, we assumed that the schedule of function blocks isknown a priori before static estimation. In a more general caseof multi-task environment, the schedule can be dynamicallyvarying. We are currently extending the estimation technique toaccommodate such dynamically varying cases conservatively.
ACKNOWLEDGMENT
The authors would like to acknowledge the useful commentsand suggestions of the anonymous reviewers who helped im-prove the quality of this paper.
REFERENCES
[1] K. Keutzer, S. Malik, R. Newton, J. Rabaey, and A. Sangiovanni-Vin-centelli, “System-level design: Orthogonalization of concerns and plat-form-based design,” IEEE Trans. Computer-Aided Design Integr. Cir-cuits Syst., vol. 19, no. 12, pp. 1523–1543, Dec. 2000.
[2] A. Brandwajn, “A note on SCSI bus waits,” ACM SIGMETRICS Perf.Eval. Rev., vol. 30, pp. 41–47, Sep. 2002.
[3] P. Lieverse, P. Van der Wolf, E. Deprettere, and K. Vissers, “A method-ology for architecture exploration of heterogeneous signal processingsystems,” in Proc. IEEE Workshop Signal Processing Systems, Oct.1999, pp. 181–190.
[4] J. A. Rowson and A. Sangiovanni-Vincentelli, “Interface based design,”in Proc. Int. Conf. Design Automation, Jun. 1997, pp. 178–183.
[5] K. Hines and G. Borriello, “Optimizing communication in embeddedsystem cosimulation,” in Proc. Int. Symp. Hardware/Software Codesign,Mar. 1997, pp. 121–125.
[6] P. V. Knudsen and J. Madsen, “Communication estimation for hard-ware/software codesign,” in Proc. Int. Symp. Hardware/Software Code-sign, Mar. 1998, pp. 55–59.
[7] P. Knudsen and J. Madsen, “Integrating communication protocol se-lection with partitioning in hardware/software codesign,” in Proc. Int.Symp. System Level Synthesis, Dec. 1998, pp. 111–116.
[8] T. Yen and W. Wolf, “Communication synthesis for distributed em-bedded systems,” in Proc. Int. Conf. Computer Aided Design, Nov.1995, pp. 288–294.
[9] R. B. Ortega and G. Borriello, “Communication synthesis for distributedembedded systems,” in Proc. Int. Conf. Computer Aided Design, Nov.1998, pp. 437–444.
[10] A. Nandi and R. Marculescu, “System level power/performance analysisfor embedded systems design,” in Proc. Int. Conf. Design Automation,Jun. 2001, pp. 599–604.
[11] J. Daveau, T. B. Ismail, and A. A. Jerraya, “Synthesis of system-levelcommunication by an allocation based approach,” in Proc. Int. Symp.System Level Synthesis, Sep. 1995, pp. 150–155.
[12] K. Lahiri, A. Raghunathan, and S. Dey, “System-level performanceanalysis for designing system-on-chip communication architecture,”IEEE Trans. Computer-Aided Design Integr. Circuits Syst., vol. 20, pp.768–783, Jun. 2001.
[13] Synopsys, CoCentric System Studio.. [Online]. Available:http://www.synopsys.com/products/cocentric_studio/cocentric_studio.html
[14] CoWare, N2C Design System.. [Online]. Available: http://www.coware.com/cowareN2C.html
[15] Mentor Graphics. Seamless CVE. [Online]. Available: http://www.men-torg.com/seamless/
[16] S. Stidham, “A last word onL = �W ,” Oper. Res., vol. 22, pp. 417–421,1974.
[17] GNU Scientific Library (GSL), GNU and FSF. [Online]. Available:http://www.gnu.org/software/gsl
[18] Sonics. Sonics Integration Architectures. [Online]. Available: http://www.sonicsinc.com
[19] PCI-SIG, PCI (Peripheral Component Interconnect).. [Online]. Avail-able: http://www.pcisig.com
[20] S. Kim, C. Im, and S. Ha, “Efficient exploration of on-chip bus archi-tectures and memory allocation,” in Proc. Int. Conf. Hardware/SoftwareCodesign and System Synthesis, Sep. 2004, pp. 248–253.
[21] ARM. Advanced Micro Bus Architecture (AMBA).. [Online]. Avail-able: http://www.arm.com/products/solutions/AMBAHomePage.html
[22] M. Drinic, D. Kirovski, S. Meguerdichian, and M. Potkonjak, “Latency-guided on-chip bus network design,” in Proc. Int. Conf. Computer AidedDesign, Nov. 2000, pp. 420–423.
[23] M. Sgroi, M. Sheets, A. Mihal, K. Keutzer, S. Malik, J. Rabaey, andA. Sangiovanni-Vincentelli, “Addressing system-on-a-chip interconnectwoes through communication-based design,” in Proc. Int. Conf. DesignAutomation, Jun. 2001, pp. 667–672.
[24] X. Zhu and S. Malik, “A hierarchical modeling framework for on-chipcommunication architectures,” in Proc. Int. Conf. Computer Aided De-sign, Nov. 2002, pp. 663–671.
[25] N. Thepayasuwan and A. Doboli, “Layout conscious bus architecturesynthesis for deep submicron systems on chip,” in Proc. Design Automa-tion and Test in Europe, Feb. 2004, pp. 10 108–10 115.
Sungchan Kim received the B.S. degrees in material science and engineeringand the M.S. degree in computer engineering from Seoul National University,Seoul, Korea, in 1998 and 2000, respectively, where he is currently workingtoward the Ph.D. degree in electrical engineering and computer science.
His research interests include Hardware/Software codesign, analysis of per-formance and power consumption, and architecture optimization of SoC formultimedia applications.
Chaeseok Im received the B.S. and M.S. degrees in computer engineering andthe Ph.D. degrees in electrical engineering and computer science from SeoulNational University, Seoul, Korea, in 1997, 1999, and 2004, respectively.
He is presently with Samsung Advanced Institute of Technology, Yongin,Gyeonggi, Korea. His research interests include low power multimedia systemdesign, system level energy estimation, and embedded operating systems.
Soonhoi Ha received the B.S. and M.S. degrees in electronics engineering fromSeoul National University, Seoul, Korea, in 1985 and 1987, respectively, andthe Ph.D. in electrical engineering and computer science from University ofCalifornia, Berkeley, CA, in 1992.
He worked for Hyundai Electronics Industries Corporation from 1993 to 1994before he joined the faculty of the school of electrical engineering and computerscience at Seoul National University. He is currently an associate professor.His primary research interests are various aspects of embedded system designincluding Hardware/Software codesign and design methodologies.


