Embed Size (px)
Citation preview

Contents lists available at ScienceDirect
Anthropocene
journal homepage: www.elsevier.com/locate/ancene
Agricultural land use doubled sediment loads in western China’s rivers
Amanda H. Schmidta,⁎, Veronica Sosa Gonzalezb, Paul R. Biermanb, Thomas B. Neilsonb,Dylan H. Roodc,d,e
a Geology Department, Oberlin College, Oberlin, OH, USAb Geology Department and Rubenstein School of the Environment and Natural Resources, University of Vermont, Burlington, VT, USAc Department of Earth Science and Engineering, Imperial College London, South Kensington Campus, London SW7 2AZ, UKd Accelerator Mass Spectrometry Laboratory, Scottish Universities Environmental Research Centre, East Kilbride G75 0QF, UKe Earth Research Institute, University of California, Santa Barbara, CA 93016, USA
A R T I C L E I N F O
Keywords:Be-10Sediment generationSediment yieldErosion index
A B S T R A C T
Land use changes, such as deforestation and agricultural expansion, increase soil erosion on the scale of hill-slopes and small drainage basins. However, the effects of these changes on the sediment load in rivers is poorlyquantified, with a few studies scattered globally, and only 10 data points in the world’s most populous nation,China. At 20 different sites in western China, we compare contemporary fluvial sediment yield data collecteddaily over 4 to 26 years between 1945 and 1987 (median = 19 years) to long-term measures of sedimentgeneration based on new isotopic measurements of in situ 10Be (beryllium-10) in river sediments. We find thatmedian sediment yield at these sites exceeds background sediment generation rates by a factor of two (from 0.13to 5.79 times, median 1.85 times) and that contemporary sediment yield is statistically significantly differentfrom long-term sediment generation rates (p < 0.05). Agricultural land use is directly and significantly pro-portional to the ratio of contemporary sediment yield to long term sediment generation rates (Spearman cor-relation coefficient rho = 0.52, p < 0.05). We support these findings by calculating erosion indices, whichcompare the delivery of meteoric 10Be to each watershed with the export of meteoric 10Be bound to riverinesediment. Erosion indices are also directly and significantly proportional to agricultural land use (rho = 0.58,p < 0.05). Together, these data sets suggest that upstream agricultural land use has significantly increasedsediment supply to rivers in western China, likely increasing turbidity and decreasing ecosystem services such asfisheries.
1. Introduction
The local effects of deforestation and conventional agriculture onerosion, soil productivity (Matson et al., 1997; Montgomery, 2007),river ecosystems (Gellis et al., 2017), and the global carbon budget (Lal,2003) include erosion of soil faster than it forms (Amundson et al.,2015). Comparing long-term rates of sediment generation with currentrates of sediment export (yield) quantifies how land use changes affectwatersheds. Better understanding of human effects on erosion, sedimenttransport, and sediment yield has implications for ecosystem services inriver environments, including habitat for aquatic animals (Gellis et al.,2017), sedimentation of reservoirs (Wang et al., 2005), and nutrientsupply to rivers through nutrients adsorbed to sediment (Walling et al.,2003).
Direct comparisons of short-term sediment yield to long-termsediment generation rates are limited (Covault et al., 2013). Covaultet al.’s (2013) compilation and several subsequent studies (Bartley
et al., 2015; Chappell et al., 2006; Reusser et al., 2015; Schmidt et al.,2011; Vanacker et al., 2014) compare background sediment generationrates to contemporary gauging station data from 16 studies of sedimentyield, of which three were in Europe, five in the United States, two inthe South America, one in Australia, and the remaining five in Asia. TheAsian studies include data from Taiwan (n = 1) (Dadson et al., 2005;Siame et al., 2011), Sri Lanka (n = 9) (Hewawasam et al., 2003), Israel(n = 1) (Clapp et al., 2000), and China. The China studies focus ontributaries to the Yangtze River (n = 5) (Chappell et al., 2006) andYunnan and Tibet (n = 5) (Schmidt et al., 2011), but these 10 datapoints cover only the steep headwater reaches of the rivers draining theregion, which have relatively little agriculture.
With thousands of years of human history, the effect of long-termagricultural land use on sediment supply to rivers in China providesvaluable data on how humans have altered sediment fluxes on theplanet. In this paper, we quantify the landscape-scale effect of long-term agricultural land use in China by comparing the sediment yield in
http://dx.doi.org/10.1016/j.ancene.2017.10.002Received 30 May 2017; Received in revised form 12 October 2017; Accepted 17 October 2017
⁎ Corresponding author.E-mail address: [email protected] (A.H. Schmidt).
Anthropocene xxx (xxxx) xxx–xxx
2213-3054/ © 2017 Elsevier Ltd. All rights reserved.
Please cite this article as: Schmidt, A.H., Anthropocene (2017), https://doi.org/10.1016/j.ancene.2017.10.002

20 rivers (basin area, 31–213,260 km2; median = 5640 km2) to back-ground rates of sediment generation determined using measurements ofin situ produced 10Be (beryllium-10) in river sediment (Bierman andSteig, 1996; Brown et al., 1995; Granger et al., 1996). The sedimentanalyzed for 10Be was collected at or near the gauging stations used toquantify sediment yield (Fig. 2). In addition, because we also measuredmeteoric 10Be for each sample, we are able to provide the first large-scale follow up of the erosion index method proposed by Brown et al.(1988) as a measure of isotopic steady state in a watershed. These dataare important because meteoric 10Be can be measured in any sample,regardless of quartz content of the upstream watershed, making it apotentially powerful tool for assessing human impacts on the environ-ment across a wide range of lithologies.
2. Background
In situ-produced 10Be (10Bei), measured in fluvial sediment, has beenused extensively to quantify rates of erosion and infer background ratesof sediment generation mostly, but not exclusively, in small, headwaterbasins. 10Bei concentration in sediment is inversely related to erosionrate (Bierman and Steig, 1996; Brown et al., 1995; Granger et al., 1996)and erosion and sediment generation rates calculated from measured10Bei concentration are insensitive to human activities, as long as ero-sion does not exceed the depth of the mixed soil layer (∼100 cm)(Bierman and Steig, 1996; Brown et al., 1995; Granger et al., 1996;Reusser et al., 2015; Schmidt et al., 2016; Vanacker et al., 2007; VonBlanckenburg et al., 2004).
Meteoric 10Be (10Bem) forms in the atmosphere through cosmic-rayinduced spallation of nitrogen and oxygen (Lal and Peters, 1967). Onceformed, the isotope adheres to aerosols and is delivered to Earth’ssurface by either precipitation or dry deposition (Graly et al., 2011;Willenbring and von Blanckenburg, 2010). The delivery of 10Bem is afunction of latitude, precipitation rate, and the movement of the isotopewithin the atmosphere (Graly et al., 2011; Willenbring and vonBlanckenburg, 2010). When considered along with contemporarysediment yield data, 10Bem can be used to calculate the erosion index(EI) of a watershed, which reflects the balance between atmosphericdelivery and fluvial export of the isotope; the erosion index is a functionof erosion intensity and sediment transport efficiency (Brown et al.,1988). Brown et al. (1988) found that higher erosion indices were as-sociated with landscapes with more human disturbance upstream of thesample site, but this approach has not been applied beyond the basinsBrown studied (primarily in the southeastern United States with aglobal compilation of 11 continent-scale watersheds as well).
The degree to which chemical weathering (dissolution) is includedin erosion rates measured with 10Bei varies depending on the depth ofthe weathering front in the study area (Fig. 1). If the weathering front isshallow (< 2 m below the surface), then most 10Bei production will co-occur with solution weathering and erosion rates calculated with 10Beiwill include mass loss both through solution and physical transport.However, if the weathering front is deeper than the 2 m penetrationdepth for neutrons producing most 10Bei, then erosion rates calculatedwith 10Bei will reflect primarily physical processes of mass loss (ero-sion) and thus underestimate total mass lost from the system.
Prior comparisons of contemporary sediment yield with long termsediment generation rates determined by 10Bei measurements in detritalsediment come to one of four conclusions: 1) the landscape is in masssteady state (Matmon et al., 2003; Wittmann et al., 2011), i.e., has similarbackground rates of sediment generation and short-term sediment yield;2) dams have reduced contemporary sediment yield (Syvitski et al.,2005) or raised apparent 10Bei-derived sediment generation rates(Reusser et al., 2017); 3) stochastic, high-magnitude, low-frequencyevents not well captured by contemporary sediment yield records in-crease background sediment generation (Covault et al., 2013; Kirchneret al., 2001; Schaller et al., 2001; Schaller et al., 2001); or 4) land usechange has increased contemporary sediment yield (Hewawasam et al.,
2003; Reusser et al., 2015), at least in the smallest watersheds(Vanmaercke et al., 2015). With the exception of 10 data points(Chappell et al., 2006; Schmidt et al., 2011), these studies have not fo-cused on China, despite China’s large population and long history ofintensive human land use.
One major source of uncertainty in these studies is that many relysolely on suspended sediment measurements to estimate contemporarysediment yield. Suspended sediment is only part of the sediment movedout of a system in rivers and relying just on suspended sediment mea-sures without considering bedload (Fig. 1), as many studies do (e.g.,Clapp et al., 2000; Hewawasam et al., 2003; Kirchner et al., 2001;Reusser et al., 2015), means that contemporary sediment yield is un-derestimated. Some studies have bedload data and include these inmeasures of contemporary sediment yield (e.g., Schaller et al., 2001;Vanacker et al., 2014), while other studies apply a correction factor thatincreases sediment yield by an estimate of bedloads for the studiedrivers (e.g., Bartley et al., 2015). Dissolved load is important whenconsidering total mass loss from the system but unlike bedload is notdirectly relevant to the comparison between suspended load and cos-mogenically determined rates of denudation except when substantialchemical weathering and solution loss occurs in the upper 2 meters. Inthat case, cosmogenic erosion rates should exceed rates of sedimenttransport.
3. Study site
Our study focuses on rivers draining from the Tibetan Plateauthrough Yunnan province, China. Due to the thousands of years ofagricultural land use in the area and the long record of Chinese gaugingstation data (Schmidt et al., 2011), this region is ideal for testingwhether land use alters the rate at which rivers export sediment. Oursampling locations are on larger rivers in the northern parts of the studyarea and on smaller rivers in the southern parts. The sampling schemereflects the location of sediment gauging stations (Schmidt et al., 2011).
The geology of the eastern Tibetan Plateau and Yunnan and theresulting landscape are diverse and formed as a result of the India-Asiacollision and the outward expansion of the Tibetan Plateau (Burchfieland Chen, 2012). Our study area includes the sedimentary Qiangtangand Lhasa Terranes in the Tibetan Plateau headwaters of the Salweenand Mekong, and the sedimentary redbeds of the Lanping Simao, theslightly metamorphosed sedimentary and volcanic Baoshan, andChengling-Mengliang terranes to the south (Akciz et al., 2008; Burchfieland Chen, 2012). In addition, the Gaoligong Shan, Chongshan, XuelongShan, and Ailao Shan shear zones all run through the study area (Akcizet al., 2008; Burchfiel and Chen, 2012).
The topography of our study area is as varied as the geology(Figures DR1). We sampled watersheds in the Salween, Mekong, Red,and Irrawaddy catchments. Basins range in size from 7 km2 to189,000 km2 (basin area and topography data from NASA LP-DAAC(2012)). Mean basin elevations range from <1400 to > 4600 m;mean basin slopes range from 14° to 23° for a moving window 90 m2 insize. The largest basins we sampled are on the Yangtze, Mekong, andSalween Rivers; these sites are sampled in their respective gorges andhave relatively steep average basin slopes (≥20°) and large upstreamareas (≥88,000 km2). South in the study area and away from themargins of the Tibetan Plateau, average basin slopes generally decrease(Figure DR1).
Study area climate is monsoonal and dominated by interaction be-tween the East Asian summer monsoon and the Indian summer mon-soon, as well as by topography (Yatagai et al., 2012). Sampled basinsreceive between 500 and 1400 mm of precipitation annually (FigureDR1) (Yatagai et al., 2012). During the monsoon season (June to Sep-tember), 85% of the annual precipitation falls and the rivers transport62% of the annual discharge and 86% of their annual suspendedsediment load (Henck et al., 2010). Soil erosion is intensified during themonsoon months by flooding and runoff (Yang et al., 2010). Broadly
A.H. Schmidt et al. Anthropocene xxx (xxxx) xxx–xxx
2
speaking, rainfall increases from north to south in the study area. Thelarge catchments along the main stem Yangtze, Salween, and MekongRivers are the driest while the smaller catchments on tributaries to theMekong in the southern parts of the study area are the wettest.
None of the watersheds sampled have significant percentages ofglacial cover at the present time, and thus are unlikely to have beensignificantly affected by Holocene glaciation. Holocene climate in theregion has been relatively stable, as evidenced by no major glacial
Fig. 1. (A) Conceptual figure showing how the depth of the weatheringfront affects sediment generation rates derived from 10Bei. If disturbance isshallower than the mixed layer, 10Bei-determined sediment generationrates are not altered by the disturbance. If the weathering front is shallow,10Bei-derived sediment generation rates largely include the effects ofchemical weathering. However, 10Bei-determined sediment generationrates will underestimate the total mass flux from the landscape as theweathering front deepens. Inset shows different integration times for 10Bei,sediment yield, and land use. (B) Distribution of river mass load betweenbed, suspended, and dissolved loads is different for every river. The pro-portions shown are representative of the study region (Summerfield andHulton, 1994). The ratio of sediment yield to 10Bei-derived sedimentgeneration rate will be underestimated if only suspended load, and notbedload, is considered.
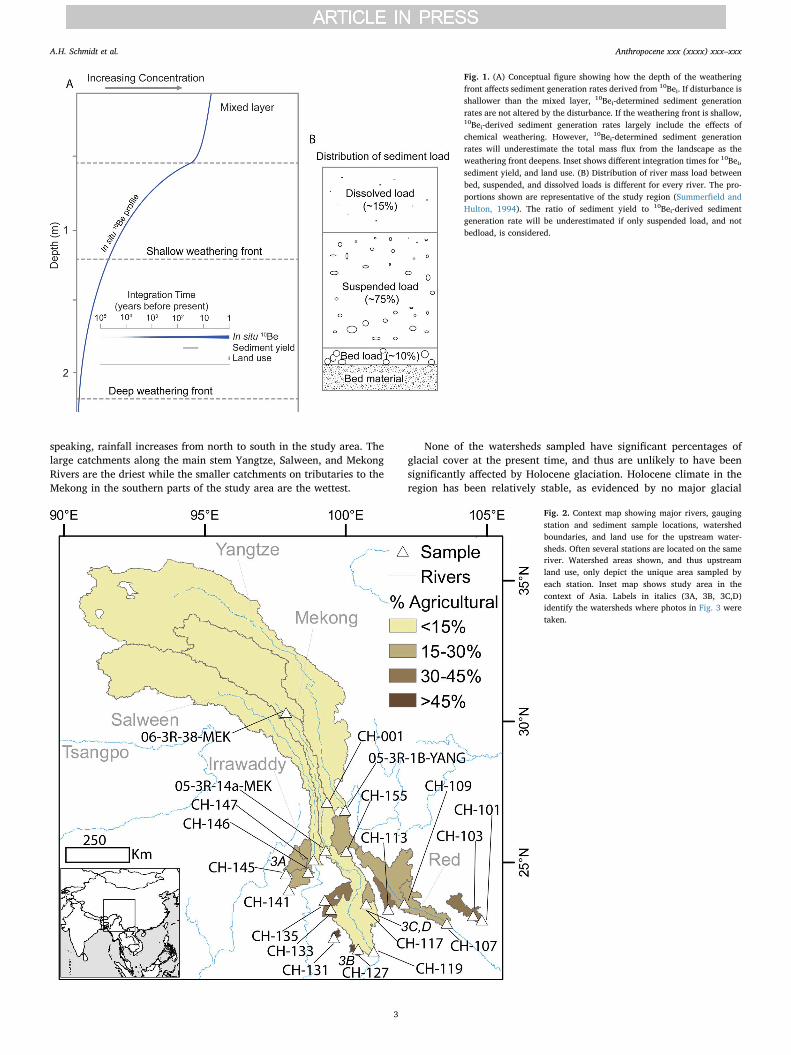
Fig. 2. Context map showing major rivers, gaugingstation and sediment sample locations, watershedboundaries, and land use for the upstream water-sheds. Often several stations are located on the sameriver. Watershed areas shown, and thus upstreamland use, only depict the unique area sampled byeach station. Inset map shows study area in thecontext of Asia. Labels in italics (3A, 3B, 3C,D)identify the watersheds where photos in Fig. 3 weretaken.
A.H. Schmidt et al. Anthropocene xxx (xxxx) xxx–xxx
3

advances (Schäfer et al., 2002). Work in the eastern Tibetan Plateau(Litang area, just north of our study region) suggests that even duringthe last glacial maximum (24–13 ka), glaciers did not extend more than∼10 km further down valley than they do at present (Schäfer et al.,2002). Erosion rates are high enough that any glaciation during thePleistocene has little effect on 10Bei concentrations measured today.
Current land use in our sampled catchments ranges from 0 to 54%agricultural (Fig. 2), with agricultural use generally increasing fromnorth to south (Chen et al., 2015). Thus, the main stem Salween,Yangtze, and Mekong samples, which represent the largest upstreamareas, have minimal (< 5%) agricultural area; in contrast, the water-sheds on the rainier, flatter slopes in the southern parts of the studyarea are the most agricultural. Field observations suggest that agri-cultural land use includes cultivation of rice, sugar cane, bananas, tea,and rubber trees. We observed monocultures on steep slopes, some-times all the way to the river, and slash-and-burn agricultural practices(Fig. 3). In addition, furrows on agricultural fields are frequently par-allel to the hillslope rather than perpendicular; we assume this fur-rowing is to facilitate drainage during the wet growing season.
Human impacts in river channels (dams, gravel mining, irrigationdiversions, channel straightening) are common in the study area(Fig. 3). We mapped dam locations (using Google Earth) upstream ofeach sample site and find that 7 of 20 sample sites have no dams thatare visible on Google Earth within 100 km upstream. The remaining 13sample sites are downstream of dams. The 13 sites are 0.2–43 km(median = 12 km) downstream of dams. Dams in the region post-datethe sediment yield data (Magee, 2006), all of which were collectedprior to 1987. In stream gravel mining is ubiquitous in the region. Wetried to sample upstream of gravel mines where possible, but likelywere downstream of other gravel mining operations. In addition, insome watersheds, major channel alterations such as straightening andwater diversion for irrigation were common. In one extreme case (CH-127), the main channel was not identifiable in parts of the watersheddue to human modification.
China has had a centralized, active land management program formany years. Following catastrophic flooding on the middle YangtzeRiver in 1998, the Chinese government implemented the Natural ForestProtection Program and the Returning Farmland to Forest Program,among the world’s largest payment for ecosystem services programs(Chen et al., 2009). The programs’ goals were to decrease erosion inheadwater regions through controversial bans on deforestation andagriculture on steep slopes and mandatory reforestation of these lands(Brandt et al., 2012; Trac et al., 2007, 2013; Zhang et al., 2014). The1998 Yangtze River floods are blamed by the government on defor-estation and increased agriculture during the Three Great Cuttings (theGreat Leap Forward [late 1950s], Grain as the Key Link [early 1970s],and Opening and Development [mid-1980s]) (Shapiro, 2001; Tracet al., 2007). However, prior large scale research has been inconclusiveon the role of human activity in increasing sediment yield rates (Luet al., 2003a, 2003b; Schmidt et al., 2011). In contrast, small scalestudies of land use and erosion from the 1950s to present suggest thatdeforestation and increases in agriculture have greatly increased ero-sion in western China (Shapiro, 2001; Urgenson et al., 2010). There arethree possible ways to reconcile these data: erosion increased locallybut increases were not widespread enough to increase sediment yield inlarge rivers, eroded material is stored in floodplains and alluvial fansand has not exited the watershed in rivers, or sediment yield was ele-vated during the entire sediment gauging period of record(1950s–1980s) (Schmidt et al., 2011).
4. Methods
4.1. Field methods
We collected medium sand-size (250–850 μm) sediment samplesfrom active river channels and floodplains to analyze for both in situ andmeteoric 10Be (10Bei and 10Bem, respectively) at 20 sites at or nearChinese-operated gauging stations for which there are discharge and
Fig. 3. Watershed field photos (locations labeled in Fig. 2). (A) Reforestation projects have established monocultures along steep slopes. (B) Rice paddies are common. (C) Agriculturalpractices include slash and burn. (D) In river sand/gravel mining is ubiquitous.
A.H. Schmidt et al. Anthropocene xxx (xxxx) xxx–xxx
4

suspended sediment data available for 4 to 26 years between 1945 and1987 (Schmidt et al., 2011). Samples were collected from alluvial riversin landscapes with varying degrees of agricultural land use. Agricultureon river banks and dredging of river channels for gravel were common;when possible, we collected samples upstream of dredging operations.Three samples (05-3R-1b-YANG, 05-3R-14a-MEK, and 06-3R-38-MEK)were collected in 2005 and 2006; all others were collected in 2013 and2014. For most sample sites (all except CH-146, 05-3R-1b-YANG, 05-3R-14a-MEK, 06-3R-38-MEK), we collected between 2 and 4 samples ateach site (in channel and overbank, samples collected 1–3 km apart,and/or in both 2013 and 2014). The 10Bei and 10Bem concentrations wereport for each station represent an uncertainty-weighted average andstandard deviation of these spatial and temporal replicate samples toreduce uncertainty due to variability in sediment moving through therivers (Gonzalez et al., 2017).
4.2. Basin average parameters
We used the 30 m GDEM topographic dataset (NASA LP-DAAC,2012) to determine watershed boundaries as well as effective elevation,slope, and upstream area for each watershed. Rainfall data are takenfrom the APHRODITE dataset (Yatagai et al., 2012). This dataset iscoarser than other available datasets for rainfall in the region, but hasbetter spatial and temporal accuracy (Andermann et al., 2011).
Land use was determined from the Global Land Cover (GLC) dataset(Chen et al., 2015). For each basin, we determined the percent of theupstream area that is agricultural from the “cropland” classification.However, this underestimates cropland for our watersheds becauseorchards are classified as forested. In the field, we observed numerousbanana and rubber plantations in the study area, but these locations areclassified as “forest” in the GLC dataset. Likewise, tea plantations weobserved in the field are classified as shrubs. Thus, percent agriculturalland is a minimum value, particularly in southern parts of the region,where banana and rubber plantations are most common. In addition,because the land use data are based on images taken between 2000 and2010, and the suspended sediment data are for 1945–1987, there is amismatch in time that may induce other errors into the analysis. Givenexpansion of agriculture in China during the 1950s-1970s as well asrecent development, it is likely that any errors in the land use data arenot systematic over or underestimates of agricultural land relative tothe time of the gauging station data.
4.3. 10Be data
Quartz from the samples was isolated and purified through a seriesof acid etches using a modification of the method of Kohl andNishiizumi (1992). 10Bei was extracted from quartz following themethod of Corbett et al. (2016). Each batch contained one processblank and one CRONUS N standard (Jull et al., 2015). Once the quartzwas dissolved in hydrofluoric acid, aliquots were removed and analyzedby inductively coupled plasma-optical emission spectroscopy (ICP-OES)to measure Be and Al content (Corbett et al., 2016; Portenga et al.,2015). 10 samples had Be recovery >100% (range: 102.6–198.1%)(based on the Be carrier added), indicating the presence of native Be inthose samples. For 10Bem analysis, samples were first milled, and asmall (∼0.5 g) aliquot of pulverized material was used for isotopicextraction. We used the method of Stone (1998) to extract 10Bem withthe addition of cation exchange to reduce B interference.
Isotopic ratios were measured using Accelerator Mass Spectrometry(AMS) at the Scottish Universities Environmental Research Centre inEast Kilbride, Scotland (Xu et al., 2015) and normalized to the NISTstandard with an assumed 10Be/9Be ratio of 2.79 × 10⁻¹¹ (Nishiizumiet al., 2007) (Table DR1). Background correction was done using fullprocess blanks, one of which was run with each batch of 10 in situsamples and 14 meteoric samples. For quartz with native 9Be, we usedthe total Be from ICP measurements to calculate 10Be concentration
(Portenga et al., 2015). The final uncertainty of the blank-correctedratio is the uncertainty of the isotopic measurement and the blankpropagated in quadrature.
Background sediment generation rates [tons km−2 yr−1] were cal-culated from 10Bei concentrations using the CRONUS Earth CalculatorVersion 2.3 (http://hess.ess.washington.edu/) (Balco et al., 2008). Tomake this estimate, we calculated the effective elevation of each wa-tershed using the approach of Portenga and Bierman (2011) (TableDR2). We did not adjust calculations for watersheds with dams, butrecognize that this could result in overestimating sediment generationrates for samples taken in close proximity to dams if those dams ef-fectively restrict or cut off sediment supply from upstream− somethingunknowable without extensive fieldwork and details of the dam op-erations (Reusser et al., 2017). We used the time-invariant scalingscheme of Lal (1991) and Stone (2000) and the global production rateof 10Bei (Borchers et al., 2016). To calculate background sedimentgeneration rates, we assume a long-term sediment delivery ratio of one(i.e., all sediment eroded is exported in the rivers and there is no netstorage in the watershed), and that no eroded material is lost in solu-tion. This means that our background sediment generation rates likelyunderestimate actual mass lost because some mass is lost by dissolution.
The assumption of no significant net sediment storage is reasonableover long time scales. In our study area, the mountainous topographyand relatively high 10Bei erosion rates suggest that the percentage ofsediment stored during transport is minimal over geologic time scales(i.e., how long it takes to erode one attenuation length, ∼60 cm ofrock). Field observations confirm that although some catchments retainsome alluvium, including terraces (seen in 5 out of 20 catchments), it isunlikely that total alluvial volume is more than a small percentage ofthe total sediment flux out of these steep, predominately mountainouscatchments.
4.4. Contemporary sediment yield data
We use the contemporary sediment yield for 20 rivers (Schmidtet al., 2011), based on discharge and suspended sediment data fromthe Chinese Ministry of Hydrology (http://www.oberlin.edu/faculty/aschmidt/chdp/index.html). Dissolved and bedload data are notavailable. The Mekong River is reported as having ∼13% of the totalriver mass load as dissolved load and globally bedload is ∼10% ofthe suspended load (Summerfield and Hulton, 1994). We only con-sider the suspended solid river load in this paper. Thus, because weonly have suspended sediment data, reported contemporary sedimentyields are an underestimate of actual contemporary rates of sedimentleaving basins. We recalculated sediment yields from the originaldaily data because in some cases upstream basins and areas werebased on better knowledge of the station location either from thefield (i.e., we found the actual station) or from online resourcesavailable from the Chinese Ministry of Hydrology. Annual sedimentyields are not normally distributed for any station (Figure DR2).Thus, instead of reporting mean annual sediment yield, we usemedian annual sediment yield and report the interquartile range asthe uncertainty to minimize the effects of outlier data. This results ina conservative estimate of contemporary sediment yield that mayunderrepresent the contemporary average because of the importanceof rare but massive events that may be captured in a single year ofdata. We divided the contemporary sediment yield by the back-ground sediment generation rate to obtain a ratio, and discuss ourfindings in terms of this ratio. We do not have the original data forthe Shigu station and so we use mean and standard deviation for allcalculations, as reported by Higgitt and Lu (1996). Because our dataare only suspended sediment data and do not include bedload, we areunderestimating contemporary sediment yield and thus also under-estimating the ratio of contemporary sediment yield to long-termsediment generation.
A.H. Schmidt et al. Anthropocene xxx (xxxx) xxx–xxx
5

4.5. Erosion indices
We calculate erosion indices (EI) (Brown et al., 1988) using theequation,
EI = Mƞ’/Aq, (1)
where M is the annual sediment load (g/yr), ƞ’ is the 10Bem con-centration (atoms/g) in sand-sized material leaving the basin, A is thebasin area (cm2), and q is the atmospheric deposition rate of 10Bem inthe watershed (atoms cm−2 yr−1). The value of q for each watershedwas calculated as per Graly et al. (2011), and contributes 20% un-certainty to the calculations, as they report 20% confidence in deliveryrates at low latitudes. We calculated M using median measured con-temporary suspended sediment load; uncertainty in sediment yield isthe interquartile range in the sediment load. Uncertainties from 10Bem
deposition and sediment load are propagated in quadrature. We onlyhave suspended sediment data for M, thus we are underestimating theerosion indices because bedload is not included.
4.6. Statistical methods
Due to the non-normal distribution of all datasets (annual sedimentyield at each individual station, median contemporary annual sedimentyield among stations, long term sediment yield among stations, and allupstream basin parameters – area, rainfall, slope, and land use), we useonly non-parametric statistics for our analyses. We use the Wilcoxonsigned-rank test (a paired test) to determine if long term sedimentgeneration is different from contemporary sediment yield; this testdistinguishes noise from statistically significant differences betweenpopulations of data. We use the Mann Whitney U test to determine ifmapped agricultural land use among watersheds with the sedimentyield/sediment generation ratio and erosion index >1 is different fromthe land use among watersheds with the sediment yield/sedimentgeneration ratio and erosion index < 1. We use Spearman RankCorrelation to determine correlation coefficients (rho) for regressionanalyses. Rho ranges from −1 to 1, with 0 being no correlation (thenull hypothesis), −1 being a perfect inverse correlation, and 1 being aperfect direct correlation. For more details on statistical methods, in-cluding tests of normality, see the Supporting information.
5. Results
5.1. Ratios of contemporary sediment yield to background sedimentgeneration rates
We find that, on average, sediment is being transported out of thewatersheds we studied approximately twice as rapidly as it is beinggenerated (sediment yield/generation ratios from 0.13 to 5.79,mean= 2.18, median = 1.85). Long term sediment generation rates forour watersheds, calculated from 10Bei and assuming that all eroded ma-terial is exported as sediment, range from 43.3 to 804 tons km−2 yr−1
(median = 288; interquartile range= 195; Table DR3). Contemporarysediment yields calculated from hydrology station data range from 77.2 to1720 tons km−2 yr−1 (median= 455, interquartile range = 504; seefigure DR2 for box plots showing the distribution of all annual data foreach station) (Schmidt et al., 2011). There is a statistically significantdifference between the contemporary sediment yields and long term se-diment generation rates when considering the population of all stations(n = 20, p < 0.05). Ratios of contemporary sediment yields and longterm sediment generation rates range from 0.13 to 5.79 (median = 1.85,interquartile range = 2.45). For 14 out of 20 sites that we compared, thecontemporary sediment yield is higher than the sediment generation rate(Fig. 3B). Of the six remaining sites with higher long term sedimentgeneration rates (ratios range from 0.13 to 0.92), three drain the high, flatTibetan Plateau and the sparsely populated and rapidly eroding gorges ofthe Three Rivers Region (specifically, the Salween and Mekong Rivers)and three are samples taken within 2 km downstream of dams (as ex-pected from the analysis of Reusser et al., 2017).
We find that the watersheds with contemporary sediment yieldshigher than long-term rates of sediment generation have, on average, amedian of 25% agricultural land (interquartile range = 19%; n = 14),compared to a median agricultural land use of 11% in watershedswhere the contemporary sediment yield is lower than the long termsediment generation rate (interquartile range = 19%; n = 6).Furthermore, we find that upstream agricultural land use is directly andsignificantly correlated with the sediment yield/sediment generationratio (Spearman rank correlation rho = 0.52, p < 0.05, Fig. 5). Nei-ther rainfall nor agricultural land use are correlated with contemporarysediment yield (|rho|≤ 0.28, p > 0.05, Fig. 5) and contemporarysediment yield and long term sediment generation rate are not corre-lated with each other (rho = 0.32, p = 0.36).
Fig. 4. Summary of results. Spatial variations in (A) sediment yield/sediment generationratios and (B) erosion indices are shown across the study area. Upper right insets show thestructure of the data depicted on each map. Lower left insets show agricultural land as afunction of sediment yield/sediment generation ratios and erosion indices grouped toabove and below one. For boxplots, the median is the middle line, the 25th and 75thpercentiles are the edges, and whiskers extend to include all samples within 1.5 times therange of the box; outliers fall outside this range. Grey points are data summarized byboxplots. Under the histograms are summary statistics for the data in the figure. Std. is thestandard deviation; IQR is the interquartile range. See table DR3 for data.
A.H. Schmidt et al. Anthropocene xxx (xxxx) xxx–xxx
6

5.2. Meteoric 10Be erosion indices
Taken at face value, erosion indices (EI; Fig. 4C) suggest that less10Bem is exported from than delivered to many of the watersheds wesampled (EIs ranges from 0.18 to 2.50; median = 0.65, interquartilerange = 0.68); 14 of the 20 sites have EI < 1 indicating net storage.However, this metric is flawed; the erosion indices we calculate areminima because we analyzed the medium sand fraction of riverinesediment (for direct comparison with 10Bei data) and 10Bem has an af-finity for fine grain material (Singleton et al., 2017; Wittmann et al.,2012) (see Supporting information). There is no reliable means tocorrect for the grain-size bias because we do not know and could notmeasure the grain-size specific sediment yield over time for each riverwe sampled; thus, sampling fine grain material would not address thisissue. In addition, by only using suspended sediment in the EI calcu-lation (M in the numerator), we are further underestimating EI becausebedload is not considered.
We can work around this limitation by considering the relationshipbetween measured EI and the fraction of upstream land under culti-vation. We find a direct and significant correlation between percentagricultural use and erosion index in our sampled watersheds(Spearman correlation coefficient rho = 0.58, p < 0.01, Fig. 5). Fur-thermore, agricultural land use in basins exporting more 10Bem than isbeing delivered (EI > 1: median = 34% agricultural land, inter-quartile range = 12%, n = 6) is greater than in basins exporting less10Bem than is being delivered (EI < 1: median = 19% agriculturalland, interquartile range = 32%, n = 14) (p = 0.05 for a Mann-Whitney U test).
6. Discussion
Our new data from China suggest that contemporary sediment yieldis elevated by a median factor of two compared to background sedimentgeneration rates (ratios from 0.13 to 5.79, mean = 2.18,median = 1.85). Below, we explore the processes that could be causingthe increase in contemporary sediment yield. We then put our data intocontext with a global compilation of studies that compare con-temporary sediment yield to background sediment generation rates.Finally, we consider the additional information that can be gained fromthe 10Bem-derived erosion indices.
6.1. Ratios of contemporary sediment yield to background sedimentgeneration
The sediment generation and sediment yield data are consistentwith deforestation and agricultural land use increasing contemporarysediment yields over background rates of sediment generation.Fourteen of the twenty watersheds analyzed have sedimentyield/sediment generation ratios > 1 (median = 1.85). Our field ob-servations of monocultures on steep slopes, in many cases reaching theriver banks, agriculture in floodplains, and “slash and burn” practicessupport the observation that land use increases contemporary sedimentyield by rapidly, frequently, and directly supplying sediment to riverchannels (Fig. 3).
Six of the twenty watersheds have sediment yield/sediment gen-eration ratios < 1. Three of these watersheds (CH-127, CH-146, andCH-155) are the only watersheds with samples taken less than 2 kmdownstream of dams. Proximity to dams is likely affecting the supply ofsediment and altering the 10Bei-derived erosion rates by disconnecting
Fig. 5. Derived erosion parameters as a function ofaverage upstream basin parameters. From top tobottom, erosion parameters are: 10Bei-derived longterm sediment generation rates, contemporary sedi-ment yield (median of annual sediment yields foreach station), sediment yield/sediment generationratio, and erosion index (from sediment yield and10Bem concentrations). From left to right, upstreamparameters are: area, mean annual precipitation(MAP), mean basin slope, and fraction of the up-stream area mapped as agricultural land use. TheSpearman correlation coefficient (rho) is shown foreach plot. * indicates significance at p < 0.05, **indicates p < 0.01.
A.H. Schmidt et al. Anthropocene xxx (xxxx) xxx–xxx
7

the sample site from the upstream environment, especially because anyavailable terrace sediment is unlikely to be reworked over such a shortdistance (Reusser et al., 2017). In addition, one of these watersheds(CH-127) contains primarily agricultural land used for rice cultivationin paddies. In this case, the entire watershed is filled with dams that areimpeding the movement of sediment out of the system. Becausesediment yield data predate 1987 and most dams in the region post-date 1987 (Magee, 2006), we have not corrected the 10Bei productionrate calculations for the samples taken in close proximity to dams. If wewere to do that, we would be comparing erosion rates for the area onlydownstream of the dam to sediment yield data for the entire watershed.Instead, we recognize that sediment generation rates for watershedswhere samples are taken in close proximity to dams are likely too high(Reusser et al., 2017), and thus sediment yield/sediment generationratios for these watersheds are too low.
The other three samples with sediment yield/sediment generationratios < 1 (0.13–0.73) are unlike other samples in our data set becausethey were taken on the main stem Salween and Mekong Rivers (CH-119, CH-147, 05-3R-14a-MEK; area > 85,000 km2, agricultural landuse ≤1%). Several factors unique to these samples may account fortheir low sediment yield/sediment generation ratios. Overall, there islittle agriculture in the main stem Salween and Mekong basins (≤1%).However, two large Yangtze and Mekong watersheds (area> 77,000 km2) have low agricultural land use (≤2%) and sedimentyield/sediment generation ratio > 1 (2.10 and 1.08, respectively).Thus, it seems unlikely that low agricultural land use is the only ex-planation for the low sediment yield/sediment generation ratios for themain stem Salween and Mekong samples. Sediment storage in theselarge river systems may buffer against increased sediment yield re-sulting from land use change (Schmidt et al., 2011). However, largebasins on the Yangtze and Red Rivers (area > 26,000 km2) havesediment yield/sediment generation ratios > 2 (2.10–4.10).
We conclude that the most likely explanation for the low sedimentyield/sediment generation ratios at the main stem Mekong and Salweenlocations is the high erosion rate through the Three Rivers Regiongorge. The rapidly eroding gorges in the Three Rivers Region (Hencket al., 2011) add enough sediment that they swamp any upstream land-use signal in samples taken from that area because stochastic events notcaptured in short-term sediment yield records bias contemporarysediment yields downward (Kirchner et al., 2001). The large water-sheds on the Mekong, Red, and Yangtze Rivers with higher sedimentyield/sediment generation ratios (1.08-4.10) have lower backgrounderosion rates (≤0.12 mm/yr) than the three watersheds draining theMekong and Salween gorges of the Three Rivers Region(0.14–0.30 mm/yr).
6.2. Influence of human activity on sediment yield/sediment generationratios
The influence of topography, climate, and land use on sediment yield/sediment generation ratios is complicated – because these boundary con-ditions likely affect both long term sediment generation and contemporarysediment yield estimates, but perhaps in different ways. We find that noneof the parameters we considered (slope, rainfall, agricultural land use, basinarea, or sediment generation rates) are correlated with contemporarysediment yield (|rho|≤ 0.32, p > 0.05, Fig. 5). This could be becauseprecipitation, agricultural land use, and basin slope are often found to bedrivers of high sediment yields (e.g., Higgitt and Lu, 1996; Reusser et al.,2015; Schmidt et al., 2011), but because slope is inversely proportional toprecipitation and agricultural land use in this region, the parameters ef-fectively cancel each other out.
As with studies of background erosion rates in eastern Tibet (Hencket al., 2011; Hetzel, 2013; Kirby and Harkins, 2013; Ouimet et al.,2009), we find that long term sediment generation is best, and directly,correlated with mean basin slope (rho = 0.62, p < 0.01; Fig. 5). Al-though neither contemporary sediment yield nor long term sediment
generation are correlated with rainfall or agricultural land use, thesediment yield/sediment generation ratio is positively correlated withboth (rho ≥ 0.51, p < 0.05); rainfall and agricultural land use aresignificantly, strongly, and directly proportional to each other(rho = 0.95, p < 0.01; Figure DR3). Thus, it could be that rainfall isdriving patterns in both land use (because people prefer to farm inplaces with more rain) and sediment yield/sediment generation ratio.However, if rainfall were the driving factor, we would expect to see asignal of rainfall in the long term sediment generation, as prior studiesin other regions have (Dixon et al., 2009; Reiners et al., 2003), but wedo not. Therefore, agricultural land use is likely the primary driver ofthe trends in sediment yield/sediment generation ratio we observe.More specifically, we conclude that the correlation we observe betweensediment yield/sediment generation ratio and agriculture is driven byincreases in contemporary sediment yield relative to background ratesof sediment generation in watersheds with low slope, high rainfall, andthus high rates of agriculture.
6.3. Comparison to global data
Studies comparing contemporary sediment yield to millennial-timescale measures of sediment generation, including this study, varyconsiderably in their findings (Fig. 6; Table 1). Landscape sedimentyield/sediment generation ratios approaching one are typically con-sidered to be in mass steady state (Willett and Brandon, 2002). Studiesof the Amazon Basin, the Yangtze Basin, and the Great Smoky Moun-tains, although there is a lot of scatter in the data, find ratios that areclose to one (Chappell et al., 2006; Matmon et al., 2003; Wittmann andvon Blanckenburg, 2009; Wittmann et al., 2011).
Deviations from steady state in which ratios are > 1 are common inareas where human agricultural land use has altered the landscape(Bartley et al., 2015; Hewawasam et al., 2003; Regard et al., 2016;Reusser et al., 2015; Vanacker et al., 2014; Vanmaercke et al., 2015).Hewawasam et al. (2003) report a median sediment yield/sedimentgeneration ratio of 6.24 for watersheds ranging from 16 to 731 km2.Their maximum ratios are > 30 and from watersheds up to 731 km2.Reusser et al. (2015) find that hundreds of years of intensive agriculturein the eastern US elevated contemporary sediment yield by a medianfactor of 2.78 relative to millennial rates of sediment generation forwatersheds up to 16,376 km2. In the same area, they report even higherhillslope erosion rates (based on the work of Trimble (1977) and Costa(1975)) and that most of the eroded hillslope sediment is stored ascolluvium in toe slopes (Reusser et al., 2015). A study in Europe com-pared contemporary sediment yield measurements in agricultural ba-sins to the modeled sediment yield of those same basins if they wereundisturbed, forested landscapes (Vanmaercke et al., 2015).Vanmaercke et al. (2015) find a strong human influence on sedimentyield in small watersheds (< 100 km2), but not in watersheds>∼103 km2.
For the new China data, we find sediment yield/sediment genera-tion ratios up to 5.79 for watersheds as large as 213,260 km2. However,the bulk of our watersheds with ratios > 1 (12 of 14) are for water-sheds smaller than 40,000 km2. We find a statistically significant dif-ference in basin area for basins with sediment yield/sediment genera-tion ratios > 1 compared to <1 (p < 0.05, Mann-Whitney U test).Thus, it seems that in a variety of climates and locations, agriculturalland use can increase sediment yield in the short term, even for largewatersheds, although large watersheds are more likely to buffer againstfluctuations in sediment yield (Vanmaercke et al., 2015).
Deviations from steady state where sediment yield/sediment gen-eration ratios are < 1 frequently happen in small watersheds. Thesestudies interpret the low ratios as evidence that infrequent, large masswasting events are driving long term rates of erosion and sedimenttransport (Covault et al., 2011; Ferrier et al., 2005; Kirchner et al.,2001; Meyer et al., 2010a, 2010b; Regard et al., 2016; Schaller et al.,2001; Siame et al., 2011; Warrick and Farnsworth, 2009). We find some
A.H. Schmidt et al. Anthropocene xxx (xxxx) xxx–xxx
8

Fig. 6. Sediment yield/sediment generation ratiosvary considerably depending on both basin area andstudy location. Dashed line represents a ratio of one,i.e., contemporary sediment yield equals backgroundtimescale sediment generation. (A) Prior analysisfinds ratios ranging from 0.009 to 34.4 (mean = 2.0,median = 0.60). For the largest areas, ratios < 1 areattributed to dams trapping sediment. For smallerbasins, ratios < 1 are attributed to high-magnitude,low-frequency events that increase background ratesbut are not captured in shorter sediment yield re-cords (stochastic events). Ratios ∼1 are attributed tolandscape steady state. Ratios > 1 are attributed toland use. (B) Box plots showing watershed mea-surements by continent (as reported in Bartley et al.,2015; Bierman et al., 2005; Clapp et al., 2002; Clift,2006; Covault et al., 2013, 2011; Ferrier et al., 2005;Hewawasam et al., 2003; Kirchner et al., 2001;Lupker et al., 2012; Meyer et al., 2010a, 2010b;Milliman and Meade, 1983; Regard et al., 2016;Reusser et al., 2015; Schaller et al., 2001; Schmidtet al., 2011; Siame et al., 2011; Vanacker et al., 2014;Warrick and Farnsworth, 2009; Wittmann et al.,2009, 2011). (C) Boxplots and data points for Asiananalyses organized by location. (D) Boxplots forNorth American analyses organized by location.
Table 1Summary of prior studies comparing short-term sediment yield to longer-term sediment generation. We have turned all data into sediment yield/sediment generation ratios as defined inour methods section. Many, but not all, of these studies were previously compiled in Covault et al. (2013). Individual data points summarized in this table are in table DR4.
Study Location Number ofsamples
Median watershed area (km2) (range inparentheses for studies with more than onesample)
Median sediment yield to sediment generationratio (range in parentheses for studies withmore than one sample)
Bartley et al. (2015)a Australia 6 13,365 (14–36,140) 1.97 (0.25–7.47)Bierman et al. (2005) New Mexico 5 7122 (1117–16,153) 1.85 (0.34–2.50)Chappell et al. (2006) Yangtze River basin,
ChinaNot reported Not reported Only ranges reported (0.17–2.33)
Clapp et al. (2002) Israel 1 0.6 1.38Clift (2006); Milliman and
Meade (1983)bYangtze, Indus, Pearl,Mekong, Red Rivers attheir outlets
5 795,000 (143,700–1,808,500) 4.93 (0.49–15.93)
Covault et al. (2011); Warrickand Farnsworth (2009)c
California 5 894 (339–1851) 0.10 (0.0086–0.61)
Ferrier et al. (2005) California 10 4.62 (0.21–720.45) 0.25 (0.037–1.51)Hewawasam et al. (2003) Sri Lanka 9 106.77 (16–731.33) 6.24 (2.61–34.35)Kirchner et al. (2001) Idaho 30 1.55 (0.22–34,773.1) 0.06 (0.021–0.25)Meyer et al. (2010a) Germany 2 120.2 (64.7–175.7) 0.69 (0.69 − 1.68)Meyer et al. (2010b)a Germany 6 170.95 (88.9–396.8) 0.29 (0.19–0.66)Lupker et al. (2012) Ganges River 8 109,850 (7600−935,000) 0.74 (0.16−1.53)Reusser et al. (2015) Eastern US 10 7612.5 (2987–16,376) 2.78 (1.81–8.33)Schaller et al. (2001) Western Europe 11 12,676 (432–40,600) 0.23 (0.04–0.84)Schmidt et al. (2011)d Tsang Po River, Tibet 1 203,904 0.20Siame et al. (2011) Taiwan 1 376.4 2.3Syvitski et al. (2005)e Global 25 1.70 × 10⁷ (105–108) 0.89 (0.30–3.33)Vanacker et al. (2014)a Europe 18 1.31 (0.1–276) 3.79 (0.07–243)Wittmann and von Blanckenburg
(2009)Amazon basin 12 96,000 (1600–954,000) 1.20 (0.23–14.81)
Wittmann et al. (2011) Amazon basin 8 782,500 (213,000–5,088,000) 1.38 (0.12–2.17)
a They report contemporary sediment yield as the sum of suspended, dissolved, and bedload, so reported contemporary loads are higher than for most studies, which just considersuspended loads.
b We compiled this comparison from data published in these two papers. The data compare suspended sediment to delta deposition rates.c These data are compiled in Covault et al. (2013) but not either of the original papers.d Schmidt et al. (2011) report data for five watersheds based on four sample/gauging station pairs. One of the watersheds they report is for the nested area between two sample/
gauging station pairs. We only report one data point here from that paper because we are using the other three samples from their study in this paper with new 10Bem data.e This is a global modelling study.
A.H. Schmidt et al. Anthropocene xxx (xxxx) xxx–xxx
9

of the largest examples of these effects on landscapes in our main stemSalween and Mekong watersheds, which are among the steepest wa-tersheds we sampled (mean basin slope ≥22°).
Deviations from steady state where sediment yield/sediment gen-erations ratios are < 1 in larger watersheds are interpreted as evidenceof sediment storage over decades (Covault et al., 2013; Schmidt et al.,2011; Syvitski et al., 2005). Syvitski et al. (2005) compiled sedimentyield/sediment generation ratios at the continental scale and argue thatdams along rivers are artificially depressing contemporary sedimentyields and thus lowering the sediment yield/sediment generation ratio(Fig. 6). We see the effects of dams on 10Bei-derived sediment yields inthree of our sites with low ratios, primarily due to overestimatingsediment generation for samples collected in close proximity to dams(Reusser et al., 2017).
6.4. Meteoric 10Be-derived erosion indices
The positive correlation between EI and agricultural land use is con-sistent with agriculture increasing the export of sediment and 10Bem. Thiscorrelation is driven by the modest positive correlation between 10Bemand agricultural land use (rho = 0.41, p = 0.08); EI is also controlled bycontemporary sediment yield, but there are no statistically significantcorrelations for contemporary sediment yield and any of the upstreambasin factors considered (Fig. 5). The analysis of different agriculturalland use for erosion indices greater and less than one again suggest thatagriculture mobilizes sediment and the associated 10Bem, and then de-livers that sediment to rivers. Our findings echo those of Brown et al. ineastern North America, who found that erosion indices increased in areaswith intensive agriculture (Brown et al., 1988). Erosion indices alsoprovide evidence of the sediment buffering effects of small dams (Walterand Merritts, 2008); for example, some watersheds with low erosion in-dices and high agricultural land use have widespread rice paddies. Theserice paddies act as small dams and reduce the out-flux of 10Bem throughtemporary sediment storage (e.g., CH-127, shown in Fig. 3B).
7. Conclusions
Here, using data from 20 rivers draining a variety of Chineselandscapes, we show that land use change (human impact) increasedcontemporary sediment yield to a median of twice the background ratesediment generation. Using erosion indices, we show that 10Bem ispreferentially lost from most of the watersheds studied, particularlythose with higher rates of agricultural land use. Agricultural land use isdirectly proportional to the ratio of contemporary sediment export tosediment generation and to erosion indices, suggesting a strong agri-cultural influence on the loss of sediment from these watersheds. Sucherosion in response to land-use change is likely to have adversely af-fected ecosystem services in the study area by increasing river sedimentload in rivers, altering benthic environments and potentially buryingspawning grounds (Gellis et al., 2017), increasing siltation behind dams(Wang et al., 2005), and increasing sediment associated nutrients inriver sediment (Walling et al., 2003).
Acknowledgements
Supported by funding from the US National Science Foundationawarded to A. H. Schmidt (NSF-EAR-1114166), P. Bierman (NSF-EAR-1114159), and D. H. Rood (NSF-EAR-1114436). Field work was alsosupported by a State Key Laboratory Open Fund (China) Grant to A. H.Schmidt. We thank D. McPhillips for collecting and providing sampleY13-01-DM, J. Martin for GIS assistance, the staff of the AMS laboratoryat SUERC for support during isotopic analyses, I. Larsen, D.Montgomery, G. Govers, G. Balco, and five anonymous reviewers forfeedback on early versions of the manuscript, H. Glasman-Deal foreditorial comments, and C.M. Zhang, R.J. Wei, J.A. Bower, A. Singleton,and Y. Qiu for field assistance.
Appendix A. Supplementary data
Supplementary data associated with this article can be found, in theonline version, at https://doi.org/10.1016/j.ancene.2017.10.002.
References
Akciz, S., Burchfiel, B.C., Crowley, J.L., Yin, J.Y., Chen, L.Z., 2008. Geometry, kinematics,and regional significance of the Chong Shan shear zone, Eastern Himlayan Syntaxis,Yunnan, China. Geosphere 4 (1), 292–314. http://dx.doi.org/10.1130/GES00111.1.
Amundson, R., Berhe, A.A., Hopmans, J.W., Olson, C., Sztein, A.E., Sparks, D.L., 2015.Soil and human security in the 21st century. Science 348 (6235).
Andermann, C., Bonnet, S., Gloaguen, R., 2011. Evaluation of precipitation data setsalong the Himalayan front. Geochem. Geophys. Geosy. 12 (7), Q07023.
Balco, G., Stone, J.O., Lifton, N.A., Dunai, T.J., 2008. A complete and easily accessiblemeans of calculating surface exposure ages or erosion rates from 10Be and 26Almeasurements. Quat. Geochronol. 3, 174–195.
Bartley, R., Croke, J., Bainbridge, Z.T., Austin, J.M., Kuhnert, P.M., 2015. Combiningcontemporary and long-term erosion rates to target erosion hot-spots in the GreatBarrier Reef Australia. Anthropocene 10, 1–12.
Bierman, P.R., Steig, E.J., 1996. Estimating rates of denudation using cosmogenic isotopeabundances in sediment. Earth Surf. Processes Landf. 21, 125–139.
Bierman, P.R., Reuter, J.M., Pavich, M.J., Gellis, A.C., Caffee, M.W., Larsen, J., 2005.Using cosmogenic nuclides to contrast rates of erosion and sediment yield in a semi-arid, arroyo-dominated landscape, Rio Puerco Basin, New Mexico. Earth Surf.Processes Landf. 30, 935–953.
Borchers, B., Marrero, S., Balco, G., Caffee, M., Goehring, B., Lifton, N., Nishiizumi, K.,Phillips, F., Schaefer, J., Stone, J., 2016. Geological calibration of spallation pro-duction rates in the CRONUS-Earth project. Quat. Geochronol. 31, 188–198.
Brandt, J., Kuemmerle, T., Li, H., Ren, G., Zhu, J., Radeloff, V.C., 2012. Using Landsatimagery to map forest change in southwest China in response to the national loggingban and ecotourism development. Remote Sens. Environ. 121, 358–369.
Brown, L., Pavich, M.J., Hickman, R.E., Klein, J., Middleton, R., 1988. Erosion of theeastern United States observed with 10Be. Earth Surf. Processes Landf. 13, 441–457.
Brown, E.T., Stallard, R.F., Larsen, M.C., Raisbeck, G.M., Yiou, F., 1995. Denudation ratesdetermined from the accumulation of in-situ produced 10Be in the LuquilloExperimental Forest Puerto Rico. Earth Planet. Sci. Lett. 129, 193–202.
Burchfiel, B.C., Chen, Z., 2012. Tectonics of the Southeastern Tibetan Plateau and ItsAdjacent Foreland 210 The Geological Society of America, Boulder, CO.
Chappell, J., Zheng, H.B., Fifield, K., 2006. Yangtse River sediments and erosion ratesfrom source to sink traced with cosmogenic Be-10: sediments from major rivers.Palaeogeogr. Palaeoclimatol. Palaeoecol. 241 (1), 79–94.
Chen, X., Lupi, F., He, G., Liu, J., 2009. Linking social norms to efficient conservationinvestment in payments for ecosystem services. Proc. Natl. Acad. Sci. 106 (28),11812–11817. http://dx.doi.org/10.1073/pnas.0809980106.
Chen, J., Chen, J., Liao, A., Cao, X., Chen, L., He, C., Han, G., Peng, S., Lu, M., Zhang, W.,Tong, X., Mills, J., 2015. Global land cover mapping at 30 m resolution: a POK-basedoperational approach. ISPRS J. Photogramm. Remote Sens. 103, 7–27.
Clapp, E.M., Bierman, P.R., Schick, A.P., Lekach, J., Enzel, Y., Caffee, M.W., 2000.Sediment yield exceeds sediment production in arid region drainage basins. Geology28 (11), 995–998.
Clapp, E., Bierman, P.R., Caffee, M., 2002. Using 10Be and 26Al to determine sedimentgeneration rates and identify sediment source areas in an arid region drainage basin.Geomorphology 45, 89–104.
Clift, P.D., 2006. Controls on the erosion of Cenozoic Asia and the flux of clastic sedimentto the ocean. Earth Planet. Sci. Lett. 241 (3), 571–580.
Corbett, L.B., Bierman, P.R., Rood, D.H., 2016. An approach for optimizing in situ cos-mogenic 10Be sample preparation. Quat. Geochronol. 33, 24–34.
Costa, J.E., 1975. Effects of agriculture on erosion and sedimentation in piedmont pro-vince, maryland. Geol. Soc. Am. Bull. 86 (9), 1281–1286.
Covault, J.A., Romans, B.W., Graham, S.A., Fildani, A., Hilley, G.E., 2011. Terrestrialsource to deep-sea sink sediment budgets at high and low sea levels: insights fromtectonically active Southern California. Geology 39 (7), 619–622.
Covault, J.A., Craddock, W.H., Romans, B.W., Fildani, A., Gosai, M., 2013. Spatial andtemporal variations in landscape evolution: historic and longer-term sediment fluxthrough global catchments. J. Geol. 121 (1), 35–56.
Dadson, S., Hovius, N., Pegg, S., Dade, W.B., Horng, M.J., Chen, H., 2005. Hyperpycnalriver flows from an active mountain belt. J. Geophys. Res. Earth Surf. 110 (F4).http://dx.doi.org/10.1029/2004JF000244.
Dixon, J.L., Heimsath, A.M., Amundson, R., 2009. The critical role of climate and sa-prolite weathering in landscape evolution. Earth Surf. Processes Landf. 11,1507–1521.
Ferrier, K.L., Kirchner, J.W., Finkel, R.C., 2005. Erosion rates over millennial and decadaltimescales at Caspar Creek and Redwood Creek, Northern California Coast Ranges.Earth Surf. Processes Landf. 30 (8), 1025–1038.
Gellis, A.C., Fuller, C.C., Van Metre, P.C., 2017. Sources and ages of fine-grained sedimentto streams using fallout radionuclides in the Midwestern United States. J. Environ.Manage. 194, 73–85.
Gonzalez, V.S., Schmidt, A.H., Bierman, P.R., Rood, D.H., 2017. Spatial and temporalreplicability of meteoric and insitu 10Be concentrations in fluvial sediment. Earth Surf.Processes Landf. http://dx.doi.org/10.1002/esp.4205.
Graly, J.A., Reusser, L.J., Bierman, P.R., 2011. Short and long-term delivery rates ofmeteoric 10Be to terrestrial soils. Earth Planet. Sci. Lett. 302 (3–4), 329–336. http://dx.doi.org/10.1016/j.epsl.2010.12.020.
A.H. Schmidt et al. Anthropocene xxx (xxxx) xxx–xxx
10

Granger, D.E., Kirchner, J.W., Finkel, R.C., 1996. Spatially averaged long-term erosionrates measured from in-situ produced cosmogenic nuclides in alluvial sediment. J.Geol. 104, 249–257.
Henck, A.C., Montgomery, D.R., Huntington, K.W., Liang, C., 2010. Monsoon control ofeffective discharge, Yunnan and Tibet. Geology 38 (11), 975–978.
Henck, A.C., Huntington, K.W., Stone, J.O., Montgomery, D.R., Hallet, B., 2011. Spatialcontrols on erosion in the Three Rivers Region, southeastern Tibet and southwesternChina. Earth Planet. Sci. Lett. 303, 71–83.
Hetzel, R., 2013. Active faulting, mountain growth, and erosion at the margins of theTibetan Plateau constrained by in situ-produced cosmogenic nuclides.Tectonophysics 582, 1–24.
Hewawasam, T., Von Blanckenburg, F., Schaller, M., Kubik, P.W., 2003. Increase ofhuman over natural erosion rates in tropical highlands constrained by cosmogenicnuclides. Geology 33 (7), 597–600.
Higgitt, D.L., Lu, X., 1996. Patterns of sediment yield in the Upper Yangtze basin, China.In: Walling, D.E., Webb, B.W. (Eds.), Erosion and Sediment Yield: Global andRegional Perspectivites, Volume IAHS Pub. No. 236. IAHS Press, Wallingford,Oxfordshire, pp. 205–214.
Jull, A.J.T., Scott, E.M., Bierman, P., 2015. The CRONUS-Earth inter-comparison forcosmogenic isotope analysis. Quat. Geochronol. 26, 3–10. http://dx.doi.org/10.1016/j.quageo.2013.09.003.
Kirby, E., Harkins, N., 2013. Distributed deformation around the eastern tip of the Kunlunfault. Int. J. Earth Sci. 102 (7), 1759–1772.
Kirchner, J.W., Finkel, R.C., Riebe, C.S., Granger, D.E., Clayton, J.L., King, J.G., Megahan,W.F., 2001. Mountain erosion over 10 yr, 10 ky., and 10 my. time scales. Geology 29(7), 591–594.
Kohl, C.P., Nishiizumi, K., 1992. Chemical isolation of quartz for measurement of in-situproduced cosmogenic nuclides. Geochim. Cosmochim. Acta 56, 3583–3587.
Lal, D., Peters, B., 1967. Cosmic Ray Produced Radioactivity on the Earth. Springer,Berlin, pp. 551–612.
Lal, D., 1991. Cosmic ray labeling of erosion surfaces: in situ nuclide production rates anderosion models. Earth Planet. Sci. Lett. 104, 424–439.
Lal, R., 2003. Soil erosion and the global carbon budget. Environ. Int. 29 (4), 437–450.Lu, X.X., Ashmore, P., Wang, J., 2003a. Sediment yield mapping in a large river basin: the
Upper Yangtze, China. Environ. Model. Softw. 18 (4), 339–353.Lu, X.X., Ashmore, P., Wang, J.F., 2003b. Seasonal water discharge and sediment load
changes in the Upper Yangtze, China. Mt. Res. Dev. 23 (1), 56–64.Lupker, M., Blard, P.H., Lave, J., France-Lanord, C., Leanni, L., Puchol, N., Charreau, J.,
Bourles, D., 2012. Be-10-derived Himalayan denudation rates and sediment budgetsin the Ganga basin. Earth Planet. Sci. Lett. 333, 146–156.
Magee, D., 2006. Powershed politics: Yunnan hydropower under Great Western devel-opment. China Q. 185, 23–41.
Matmon, A., Bierman, P.R., Larsen, J., Southworth, S., Pavich, M.J., Finkel, R.C., Caffee,M.W., 2003. Erosion of an ancient mountain range, the Great Smoky Mountains,North Carolina and Tennessee. Am. J. Sci. 303, 517–855.
Matson, P.A., Parton, W.J., Power, A.G., Swift, M.J., 1997. Agricultural intensificationand ecosystem properties. Science 277 (5325), 504–509.
Meyer, H., Hetzel, R., Fugenschuh, B., Strauss, H., 2010a. Determining the growth rate oftopographic relief using in situ-produced Be-10: A case study in the Black Forest,Germany. Earth Planet. Sci. Lett. 290 (3), 391–402.
Meyer, H., Hetzel, R., Strauss, H., 2010b. Erosion rates on different timescales derivedfrom cosmogenic 10Be and river loads: implications for landscape evolution in theRhenish Massif, Germany. Int. J. Earth Sci. 99 (2), 395–412.
Milliman, J.D., Meade, R.H., 1983. World-wide delivery of river sediment to the oceans. J.Geol. 91 (1), 1–21.
Montgomery, D.R., 2007. Soil erosion and agricultural sustainability. Proc. Natl. Acad.Sci. U. S. A. 104 (33), 13268–13272.
NASA LP-DAAC, 2012. ASTER GDEM. NASA Land Processes Distributed Active ArchiveCenter (LP DAAC). LP DAAC.
Nishiizumi, K., Imamura, M., Caffee, M.W., Southon, J.R., Finkel, R.C., McAninch, J.,2007. Absolute calibration of 10Be AMS standards. Nuclear Instrum. Methods B 258(2), 403–413.
Ouimet, W.B., Whipple, K.X., Granger, D.E., 2009. Beyond threshold hillslopes: channeladjustment to base-level fall in tectonically active mountain ranges. Geology 37 (7),579–582.
Portenga, E.W., Bierman, P.R., 2011. Understanding earth’s eroding surface with 10Be.GSA Today 21 (8), 4–10. http://dx.doi.org/10.1130/g111a.1.
Portenga, E.W., Bierman, P.R., Duncan, C., Corbett, L.B., Kehrwald, N.M., Rood, D.H.,2015. Erosion rate of the Bhutanese Himalaya determined using in situ-produced10Be. Geomorphology 233, 112–126.
Regard, V., Carretier, S., Boeglin, J.L., Ndam Ngoupayou, J.R., Dzana, J.G., BedimoBedimo, J.P., Riotte, J., Braun, J.J., 2016. Denudation rates on cratonic landscapes:comparison between suspended and dissolved fluxes, and 10Be analysis in the Nyongand Sanaga River basins, south Cameroon. Earth Surf. Processes Landf. 41 (12),1671–1683. http://dx.doi.org/10.1002/esp.3939.
Reiners, P.W., Ehlers, T.A., Mitchell, S.G., Montgomery, D.R., 2003. Coupled spatialvariations in precipitation and long-term erosion rates across the WashingtonCascades. Nature 426 (6967), 645–647.
Reusser, L.J., Bierman, P.R., Rood, D.H., 2015. Quantifying human impacts on rates oferosion and sediment transport at a landscape scale. Geology 43 (2), 171–174.
Reusser, L.J., Bierman, P.R., Rizzo, D.M., Portenga, E.W., Rood, D.H., 2017.Characterizing landscape-scale erosion using 10Be in detrital fluvial sediment: slope-based sampling strategy detects the effect of widespread dams. Water Resour. Res. 53(5), 4476–4486. http://dx.doi.org/10.1002/2016WR019774.
Schäfer, J.M., Tschudi, S., Zhao, Z., Wu, X., Ivy-Ochs, S., Wieler, R., Baur, H., Kubik, P.W.,Schlüchter, C., 2002. The limited influence of glaciations in Tibet on global climate
over the past 170 000 yr. Earth Planet. Sci. Lett. 194 (3), 287–297.Schaller, M., von Blanckenburg, F., Hovius, N., Kubik, P.W., 2001. Large-scale erosion
rates from in situ-produced cosmogenic nuclides in European river sediments. EarthPlanet. Sci. Lett. 188 (3), 441–458.
Schmidt, A.H., Montgomery, D.R., Huntington, K.W., Liang, C., 2011. The question ofcommunist land degradation: new evidence from local erosion and basin-wide sedi-ment yield in Southwest China and Southeast Tibet. Ann. Assoc. Am. Geogr. 101 (3),1–20.
Schmidt, A.H., Neilson, T.B., Bierman, P.R., Rood, D.H., Ouimet, W.B., Sosa Gonzalez, V.,2016. Influence of topography and human activity on apparent in situ 10Be-derivederosion rates in Yunnan, SW China. Earth Surf. Dyn. 4 (4), 819–830. http://dx.doi.org/10.5194/esurf-4-819-2016.
Shapiro, J., 2001. Mao's War Against Nature: Politics and the Environment inRevolutionary China. Cambridge University Press, Cambridge.
Siame, L.L., Angelier, J., Chen, R.F., Godard, V., Derrieux, F., Bourlès, D.L., Braucher, R.,Chang, K.J., Chu, H.T., Lee, J.C., 2011. Erosion rates in an active orogen (NE-Taiwan): A confrontation of cosmogenic measurements with river suspended loads.Quat. Geochronol. 6 (2), 246–260. http://dx.doi.org/10.1016/j.quageo.2010.11.003.
Singleton, A.A., Schmidt, A.H., Bierman, P.R., Rood, D.H., Neilson, T.B., Greene, E.S.,Bower, J.A., Perdrial, N., 2017. Effects of grain size, mineralogy, and acid-extractablegrain coatings on the distribution of the fallout radionuclides 7Be, 10Be, 137Cs, 210Pbin river sediment. Geochim. Cosmochim. Acta 197, 71–86.
Stone, J., 1998. A rapid fusion method for separation of beryllium-10 from soils andsilicates. Geochim. Cosmochim. Acta 62 (3), 555–561.
Stone, J.O., 2000. Air pressure and cosmogenic isotope production. J. Geophys. Res. 105(B10), 23,573–523,579.
Summerfield, M., Hulton, N., 1994. Natural controls of fluvial denudation rates in majorworld drainage basins. J. Geophys. Res. Solid Earth 7, 13871–13883.
Syvitski, J.P.M., Vorosmarty, C.J., Kettner, A.J., Green, P., 2005. Impact of humans on theflux of terrestrial sediment to the global coastal ocean. Science 308 (5720), 376–380.
Trac, C.J., Harrell, S., Hinckley, T.M., Henck, A.C., 2007. Reforestation programs inSouthwest China: reported success, observed failures, and the reasons why. J. Mt. Sci.4 (4), 275–292. http://dx.doi.org/10.1007/s11629-007-0275-1.
Trac, C.J., Schmidt, A.H., Harrell, S., Hinckley, T.M., 2013. Is the returning farmland toforest program a success? Three case studies from Sichuan. Environ. Pract. 15 (3),350–366.
Trimble, S.W., 1977. Fallacy of stream equilibrium in contemporary denudation studies.Am. J. Sci. 277 (7), 876–887.
Urgenson, L.S., Hagmann, R.K., Henck, A.C., Harrell, S., Hinckley, T.M., Shepler, S.J.,Grub, B.L., Chi, P.M., 2010. Social-ecological resilience of a Nuosu community-linkedwatershed, southwest Sichuan, China. Ecol. Soc. 15 (4)(p. 2) http://www.ecologyandsociety.org/vol15/iss4/art2/.
Vanacker, V., Von Blanckenburg, F., Govers, G., Molina, A., Poesen, J., Deckers, J., Kubik,P., 2007. Restoring dense vegetation can slow mountain erosion to near naturalbenchmark levels. Geology 35 (4), 303–306.
Vanacker, V., Bellin, N., Molina, A., Kubik, P.W., 2014. Erosion regulation as a function ofhuman disturbances to vegetation cover: a conceptual model. Landsc. Ecol. 29 (2),293–309.
Vanmaercke, M., Poesen, J., Govers, G., Verstraeten, G., 2015. Quantifying human im-pacts on catchment sediment yield: a continental approach. Global Planet. Change130, 22–36. http://dx.doi.org/10.1016/j.gloplacha.2015.04.001.
Von Blanckenburg, F., Hewawasam, T., Kubik, P.W., 2004. Cosmogenic nuclide evidencefor low weathering and denudation in the wet, tropical highlands of Sri Lanka. J.Geophys. Res.: Earth Surf. 109 (F3), F03008. http://dx.doi.org/10.1029/2003JF000049.
Walling, D., Owens, P., Carter, J., Leeks, G., Lewis, S., Meharg, A., Wright, J., 2003.Storage of sediment-associated nutrients and contaminants in river channel andfloodplain systems. Appl. Geochem. 18 (2), 195–220.
Walter, R.C., Merritts, D.J., 2008. Natural streams and the legacy of water-powered mills.Science 5861, 299–304.
Wang, G., Wu, B., Wang, Z.Y., 2005. Sedimentation problems and management strategiesof Sanmenxia reservoir, Yellow River, China. Water Resour. Res. 41 (9), W09417.
Warrick, J.A., Farnsworth, K.L., 2009. Sources of sediment to the coastal waters of theSouthern California Bight. Geol. Soc. Am. Spec. Pap. 454, 39–52.
Willenbring, J.K., von Blanckenburg, F., 2010. Meteoric cosmogenic Beryllium-10 ad-sorbed to river sediment and soil: applications for Earth-surface dynamics. Earth Sci.Rev. 98 (1–2), 105–122. http://dx.doi.org/10.1016/j.earscirev.2009.10.008.
Willett, S.D., Brandon, M.T., 2002. On steady states in mountain belts. Geology 30 (2),175–178.
Wittmann, H., von Blanckenburg, F., 2009. Cosmogenic nuclide budgetng of floodplainsediment transfer. Geomorphology 109, 246–256.
Wittmann, H., von Blanckenburg, F., Guyot, J.L., Maurice, L., Kubik, P.W., 2009. Fromsource to sink: preserving the cosmogenic 10Be-derived denudation rate signal of theBolivian Andes in sediment of the Beni and Mamoré foreland basins. Earth Planet.Sci. Lett. 288, 463–474.
Wittmann, H., von Blanckenburg, F., Maurice, L., Guyot, J.L., Filizola, N., Kubik, P.W.,2011. Sediment production and delivery in the Amazon River basin quantified by insitu-produced cosmogenic nuclides and recent river loads. Geol. Soc. Am. Bull. 123(5–6), 934–950. http://dx.doi.org/10.1130/b30317.1.
Wittmann, H., Von Blanckenburg, F., Bouchez, J., Dannhaus, N., Naumann, R., Christl,M., Gaillardet, J., 2012. The dependence of meteoric 10Be concentrations on particlesize in Amazon River bed sediment and the extraction of reactive 10Be/9Be ratios.Chem. Geol. 318–319, 126–138. http://dx.doi.org/10.1016/j.chemgeo.2012.04.031.
Xu, S., Freeman, S.P.H.T., Rood, D.H., Shanks, R.P., 2015. Decadal Be-10, Al-26 and Cl-36QA measurements on the SUERC 5MV accelerator mass spectrometer. Nucl. Instrum.Methods Phys. Res. Sect. B-Beam Interact. Mater. Atoms 361, 39–42.
A.H. Schmidt et al. Anthropocene xxx (xxxx) xxx–xxx
11

Yang, Z.S., Yang, L.F., Zhang, B.S., 2010. Soil erosion and its basic characteristics at KarstRocky-desertified land consolidation area: a case study at Muzhe Village of XichouCounty in Southeast Yunnan, China. J. Mt. Sci. 7 (1), 55–72.
Yatagai, A., Kamiguchi, K., Arakawa, O., Hamada, A., Yasutomi, N., Kitoh, A., 2012.APHRODITE: Constructing a long-term daily gridded precipitation dataset for Asia
based on a dense network of rain gauges. Bull. Am. Meteorol. Soc. 39 (9), 1401–1415.Zhang, J., Pham, T., Kalacska, M., Turner, S., 2014. Using Landsat Thematic Mapper
records to map land cover change and the impacts of reforestation programmes in theborderlands of southeast Yunnan, China: 1990–2010. Int. J. Appl. Earth Obs. Geoinf.31, 25–36.
A.H. Schmidt et al. Anthropocene xxx (xxxx) xxx–xxx
12


![[scores] Faure,Schmidt - Pavane - saxophone quartet - full score - by odi](https://img.pdfslide.net/doc/110x75/634d28527c06afa1b60cf55f/scores-faureschmidt-pavane-saxophone-quartet-full-score-by-odi.jpg)