Embed Size (px)
Citation preview

School Accountability Report Card
https://sarconline.org/public/print/43696256068167/2020-2021[2/8/2022 10:44:33 AM]
VIEW TRANSLATION DISCLAIMER
Select Language
Powered by Translate
Herman (Leonard) Intermediate2020—2021 School Accountability Report Card
Reported Using Data from the 2020—2021 School YearCalifornia Department of Education
Address:5955 Blossom Ave. San Jose, CA , 95123-4032
Principal:Ms. Christy Flores, Principal
Phone:(408) 226-1886
Grade Span:5-8
By February 1 of each year, every school in California is required by state law to publish a SchoolAccountability Report Card (SARC).The SARC contains information about the condition andperformance of each California public school. Under the Local Control Funding Formula (LCFF) all localeducational agencies (LEAs) are required to prepare a Local Control and Accountability Plan (LCAP),which describes how they intend to meet annual school-specific goals for all pupils, with specificactivities to address state and local priorities. Additionally, data reported in an LCAP is to be consistentwith data reported in the SARC.
For more information about SARC requirements, see the California Department of Education (CDE)SARC web page at https://www.cde.ca.gov/ta/ac/sa/.
For more information about the LCFF or LCAP, see the CDE LCFF web page athttps://www.cde.ca.gov/fg/aa/lc/.
About Conditions Outcomes Engagement Other

School Accountability Report Card
https://sarconline.org/public/print/43696256068167/2020-2021[2/8/2022 10:44:33 AM]
For additional information about the school, parents/guardians and community members shouldcontact the school principal or the district office.
DataQuest
DataQuest is an online data tool located on the CDE DataQuest web page athttps://dq.cde.ca.gov/dataquest/ that contains additional information about this school andcomparisons of the school to the district and the county. Specifically, DataQuest is a dynamicsystem that provides reports for accountability (e.g., test data, enrollment, high school graduates,dropouts, course enrollments, staffing, and data regarding English learners).
California School Dashboard
The California School Dashboard (Dashboard) https://www.caschooldashboard.org/ reflects California’snew accountability and continuous improvement system and provides information about how LEAs andschools are meeting the needs of California’s diverse student population. The Dashboard containsreports that display the performance of LEAs, schools, and student groups on a set of state and localmeasures to assist in identifying strengths, challenges, and areas in need of improvement.
About This School
Ms. Christy Flores, Principal
Principal, Herman (Leonard) Intermediate
About Our SchoolContact
Herman (Leonard) Intermediate 5955 Blossom Ave. San Jose, CA 95123-4032
Phone: (408) 226-1886Email: [email protected]

School Accountability Report Card
https://sarconline.org/public/print/43696256068167/2020-2021[2/8/2022 10:44:33 AM]
Contact Information (School Year 2021—2022)
Last updated: 1/26/22
District Contact Information (School Year 2021—2022)District NameOak Grove Elementary
Phone Number(408) 227-8300
SuperintendentManzo, José
Email [email protected]
Websitewww.ogsd.net
School Contact Information (School Year 2021—2022)School NameHerman (Leonard) Intermediate
Street5955 Blossom Ave.
City, State, ZipSan Jose, CA , 95123-4032
Phone Number(408) 226-1886
PrincipalMs. Christy Flores, Principal
Email [email protected]
Websitehttps://herman.ogsd.net
County-District-School (CDS)Code43696256068167

School Accountability Report Card
https://sarconline.org/public/print/43696256068167/2020-2021[2/8/2022 10:44:33 AM]
School Description and Mission Statement (School Year 2021—2022)
Herman Intermediate School and the AdVENTURE/STEM Program’s mission is to create a 21st-centurymiddle school that engages students, staff and thecommunity. We are devoted to providing an exceptional educational organization where, at the core,we have a safe, respectful and responsible, student centeredlearning environment. We have created a rigorous 21st-century academic program balanced with thedevelopment of personal relationships betweenour students, staff, and community. Our academic program focuses on common core instruction withan emphasis on project-based learning and the integrationof technology. We use our equity lens and the cycle of inquiry to develop high expectations for allstudents as we evaluate student performance through ourprofessional learning communities model as a vehicle for continuous improvement to adjust ourinstruction. We strive to ensure that all students leave Herman asresponsible, active, global citizens in the digital age, ready for college, career and beyond.In order to meet the ever-changing demands of student needs, Herman has a specialized program forstudents in grades 5-8 within our campus, focused onScience, Technology, Engineering and Math called the AdVENTURE program. The program supportsstudents to become lifelong learners, adept in the use ofcritical thinking and 21st-century skills through an integrated curriculum.Our vital signs of student progress include possession of high-level technological skills, critical thinkingand problem-solving, accelerating learning for all studentgroups, acquisition of positive life-skills, self-responsibility and initiative, participation and collaborationin school activities.During this unprecedented year we had the task of reintroducing students to an in-person learningmodel that would continue to offer a strong academic program in conjunction withsocial-emotional learning platforms. Herman and AdVENTURE have accomplished thisgoalimplementing an advisory period and creating a structured social emotional learning compontentusing various technology tools to foster the engagement, socializationand emotional well-being of our students.
Last updated: 1/26/22
Student Enrollment by Grade Level (School Year 2020—2021)
Grade Level Number of Students
Grade 5 62
Grade 6 62

School Accountability Report Card
https://sarconline.org/public/print/43696256068167/2020-2021[2/8/2022 10:44:33 AM]
Grade 7 309
Grade 8 312
Total Enrollment 745
Last updated: 1/26/22
Student Enrollment by Student Group (School Year 2020—2021)
Student Group Percent of Total Enrollment
Female 52.10%
Male 47.90%
Non-Binary 0.00%
American Indian or Alaska Native 0.10%
Asian 24.40%
Black or African American 3.50%
Filipino 3.20%
Hispanic or Latino 35.00%
Native Hawaiian or Pacific Islander 1.20%

School Accountability Report Card
https://sarconline.org/public/print/43696256068167/2020-2021[2/8/2022 10:44:33 AM]
Two or More Races 8.60%
White 23.90%
Student Group (Other) Percent of Total Enrollment
English Learners 8.10%
Foster Youth 0.10%
Homeless 0.30%
Migrant 0.10%
Socioeconomically Disavantaged 16.80%
Students with Disabilities 8.90%
A. Conditions of Learning
State Priority: Basic
The SARC provides the following information relevant to the State priority: Basic (Priority 1):
Degree to which teachers are appropriately assigned and fully credentialed in the subject area andfor the pupils they are teaching;Pupils have access to standards-aligned instructional materials; andSchool facilities are maintained in good repair
Teacher Preparation and Placement (School Year 2020—2021)
Authorization/AssignmentSchool
NumberSchoolPercent
DistrictNumber
DistrictPercent
StateNumber
StatePercent
Fully (Preliminary or Clear)Credentialed for Subject andStudent Placement (properlyassigned)

School Accountability Report Card
https://sarconline.org/public/print/43696256068167/2020-2021[2/8/2022 10:44:33 AM]
Intern Credential Holders ProperlyAssigned
Teachers Without Credentials andMisassignments (“ineffective” underESSA)
Credentialed Teachers AssignedOut-of-Field (“out-of-field” underESSA)
Unknown
Total Teaching Positions
Note: The data in this table is based on Full Time Equivalent (FTE) status. One FTE equals one staffmember working full time; one FTE could also represent two staff members who each work 50 percentof full time. Additionally, an assignment is defined as a position that an educator is assigned to based onsetting, subject, and grade level. An authorization is defined as the services that an educator isauthorized to provide to students.
Last updated:
Teachers Without Credentials and Misassignments (School Year 2020—2021)
Authorization/Assignment Number
Permits and Waivers
Misassignments
Vacant Positions
Total Teachers Without Credentials and Misassignments
Last updated:
Credentialed Teachers Assigned Out-of-Field (considered "out-of-field" under ESSA) (School Year 2020—2021)
Indicator Number

School Accountability Report Card
https://sarconline.org/public/print/43696256068167/2020-2021[2/8/2022 10:44:33 AM]
Credentialed Teachers Authorized on a Permit or Waiver
Local Assignment Options
Total Out-of-Field Teachers
Last updated:
Class Assignments (School Year 2020—2021)
Indicator Percent
Misassignments for English Learners (a percentage of all the classes with English learnerstaught by teachers that are misassigned)
No credential, permit or authorization to teach (a percentage of all the classes taught byteachers with no record of an authorization to teach)
Last updated:Note: For more information refer to the Updated Teacher Equity Definitions web page athttps://www.cde.ca.gov/pd/ee/teacherequitydefinitions.asp.
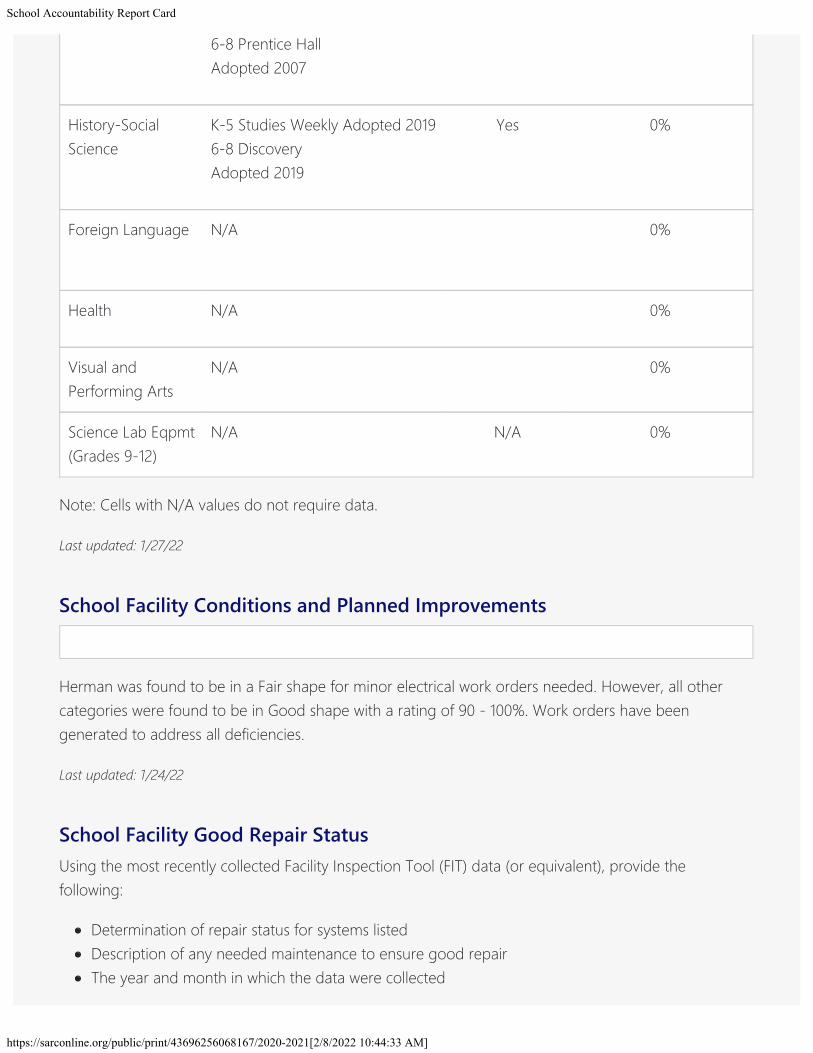
Quality, Currency, Availability of Textbooks and Other Instructional Materials(School Year 2021—2022)Year and month in which the data were collected: August 2021
Subject
Textbooks and OtherInstructional Materials/year of
Adoption
From MostRecent
Adoption?
Percent StudentsLacking Own Assigned
Copy
Reading/LanguageArts
3-8: Expeditionary Learning Yes 0%
Mathematics K-5: EngageNYAdopted 20156-8: College Prep Math (CPM)Adopted 2015
Yes 0%
Science K-5 Harcourt ScienceAdopted 2001
No 0%
School Accountability Report Card
https://sarconline.org/public/print/43696256068167/2020-2021[2/8/2022 10:44:33 AM]
6-8 Prentice HallAdopted 2007
History-SocialScience
K-5 Studies Weekly Adopted 20196-8 DiscoveryAdopted 2019
Yes 0%
Foreign Language N/A
0%
Health N/A 0%
Visual andPerforming Arts
N/A 0%
Science Lab Eqpmt(Grades 9-12)
N/A N/A 0%
Note: Cells with N/A values do not require data.
Last updated: 1/27/22
School Facility Conditions and Planned Improvements
Herman was found to be in a Fair shape for minor electrical work orders needed. However, all othercategories were found to be in Good shape with a rating of 90 - 100%. Work orders have beengenerated to address all deficiencies.
Last updated: 1/24/22
School Facility Good Repair StatusUsing the most recently collected Facility Inspection Tool (FIT) data (or equivalent), provide thefollowing:
Determination of repair status for systems listedDescription of any needed maintenance to ensure good repairThe year and month in which the data were collected

School Accountability Report Card
https://sarconline.org/public/print/43696256068167/2020-2021[2/8/2022 10:44:33 AM]
The rate for each system inspectedThe overall rating
Year and month of the most recent FIT report: January 2022
System Inspected Rating Repair Needed and Action Taken or Planned
Systems: Gas Leaks,Mechanical/HVAC, Sewer
Good No issues.
Interior: Interior Surfaces Good No issues.
Cleanliness: Overall Cleanliness,Pest/Vermin Infestation
Good Work order placed for pest management to servicetraps.
Electrical: Electrical Poor Two deficiencies found to replace light diffuser andrelamps needed. All work orders have been
generated.
Restrooms/Fountains: Restrooms,Sinks/Fountains
Good No issues.
Safety: Fire Safety, HazardousMaterials
Good No issues.
Structural: Structural Damage,Roofs
Good No issues.
External: Playground/SchoolGrounds,Windows/Doors/Gates/Fences
Good Work order to remove graffiti.
Overall Facility RateYear and month of the most recent FIT report: January 2022
Overall Rating Fair
Last updated: 1/24/22

School Accountability Report Card
https://sarconline.org/public/print/43696256068167/2020-2021[2/8/2022 10:44:33 AM]
B. Pupil Outcomes
State Priority: Pupil Achievement
The SARC provides the following information relevant to the State priority: Pupil Achievement (Priority4):
Statewide assessments (i.e., California Assessment of Student Performance and Progress[CAASPP] System includes the Smarter Balanced Summative Assessments for students in thegeneral education population and the California Alternate Assessments [CAAs] for English languagearts/literacy [ELA] and mathematics given in grades three through eight and grade eleven. Onlyeligible students may participate in the administration of the CAAs. CAAs items are aligned withalternate achievement standards, which are linked with the Common Core State Standards [CCSS]for students with the most significant cognitive disabilities).
The CAASPP System encompasses the following assessments and student participationrequirements: 1. Smarter Balanced Summative Assessments and CAAs for ELA in grades three througheight and grade eleven. 2. Smarter Balanced Summative Assessments and CAAs for mathematics in grades threethrough eight and grade eleven. 3. California Science Test (CAST) and CAAs for Science in grades five, eight, and once in highschool (i.e., grade ten, eleven, or twelve).
SARC Reporting in the 2020–2021 School Year OnlyWhere the most viable option, LEAs were required to administer the statewide summativeassessments for ELA and mathematics. Where a statewide summative assessment was not the mostviable option for the LEA (or for one or more grade-level[s] within the LEA) due to the pandemic,LEAs were allowed to report results from a different assessment that met the criteria established bythe State Board of Education (SBE) on March 16, 2021. The assessments were required to be:
Aligned with CA CCSS for ELA and mathematics;Available to students in grades 3 through 8, and grade 11; andUniformly administered across a grade, grade span, school, or district to all eligible students.
Options: Note that the CAAs could only be administered in-person following health and safetyrequirements. If it was not viable for the LEA to administer the CAAs in person with health andsafety guidelines in place, the LEA was directed to not administer the tests. There were no other

School Accountability Report Card
https://sarconline.org/public/print/43696256068167/2020-2021[2/8/2022 10:44:33 AM]
assessment options available for the CAAs. Schools administered the Smarter Balanced SummativeAssessments for ELA and mathematics, other assessments that meet the SBE criteria, or acombination of both, and they could only choose one of the following:
Smarter Balanced ELA and mathematics summative assessments;Other assessments meeting the SBE criteria; orCombination of Smarter Balanced ELA and mathematics summative assessments and otherassessments.
College and Career Ready: The percentage of students who have successfully completed coursesthat satisfy the requirements for entrance to the University of California and the California StateUniversity, or career technical education sequences or programs of study.
CAASPP Test Results in ELA and Mathematics for All StudentsGrades Three through Eight and Grade Eleven taking and completing a state-administeredassessmentPercentage of Students Meeting or Exceeding the State Standard
Subject
School2019-2020
School2020–2021
District2019-2020
District2020–2021
State2019-2020
State2020–2021
English Language Arts / Literacy(grades 3-8 and 11)
N/A N/A N/A N/A N/A N/A
Mathematics (grades 3-8 and 11) N/A N/A N/A N/A N/A N/A
Note: The 2019–2020 data cells with N/A values indicate that the 2019–2020 data are not available dueto the COVID-19 pandemic and resulting summative test suspension. The Executive Order N-30-20 wasissued which waived the assessment, accountability, and reporting requirements for the 2019–2020school year.Note: The 2020–2021 data cells have N/A values because these data are not comparable to other yeardata due to the COVID-19 pandemic during the 2020–2021 school year. Where the CAASPPassessments in ELA and/or mathematics is not the most viable option, the LEAs were allowed toadminister local assessments. Therefore, the 2020–2021 data between school years for the school,district, state are not an accurate comparison. As such, it is inappropriate to compare results of the2020–2021 school year to other school years.
Last updated: 1/26/22CAASPP Test Results in ELA by Student Group for students taking and completing a state-administered assessment Grades Three through Eight and Grade Eleven

School Accountability Report Card
https://sarconline.org/public/print/43696256068167/2020-2021[2/8/2022 10:44:33 AM]
(School Year 2020—2021)
Student GroupTotal
EnrollmentNumberTested
PercentTested
PercentNot
Tested
PercentMet or
Exceeded
All Students 732 NT NT NT NT
Female 384 NT NT NT NT
Male 348 NT NT NT NT
American Indian or Alaska Native -- NT NT NT NT
Asian 182 NT NT NT NT
Black or African American 26 NT NT NT NT
Filipino 21 NT NT NT NT
Hispanic or Latino 254 NT NT NT NT
Native Hawaiian or Pacific Islander -- NT NT NT NT
Two or More Races 64 NT NT NT NT
White 175 NT NT NT NT
English Learners 52 NT NT NT NT
Foster Youth -- NT NT NT NT
Homeless
Military 0 0 0 0 0
Socioeconomically Disadvantaged 155 NT NT NT NT
Students Receiving Migrant EducationServices
0 0 0 0 0
Students with Disabilities 70 NT NT NT NT
Note: N/T values indicate that this school did not test students using the CAASPP for ELA.Note: Double dashes (--) appear in the table when the number of students is ten or less, either because
School Accountability Report Card
https://sarconline.org/public/print/43696256068167/2020-2021[2/8/2022 10:44:33 AM]
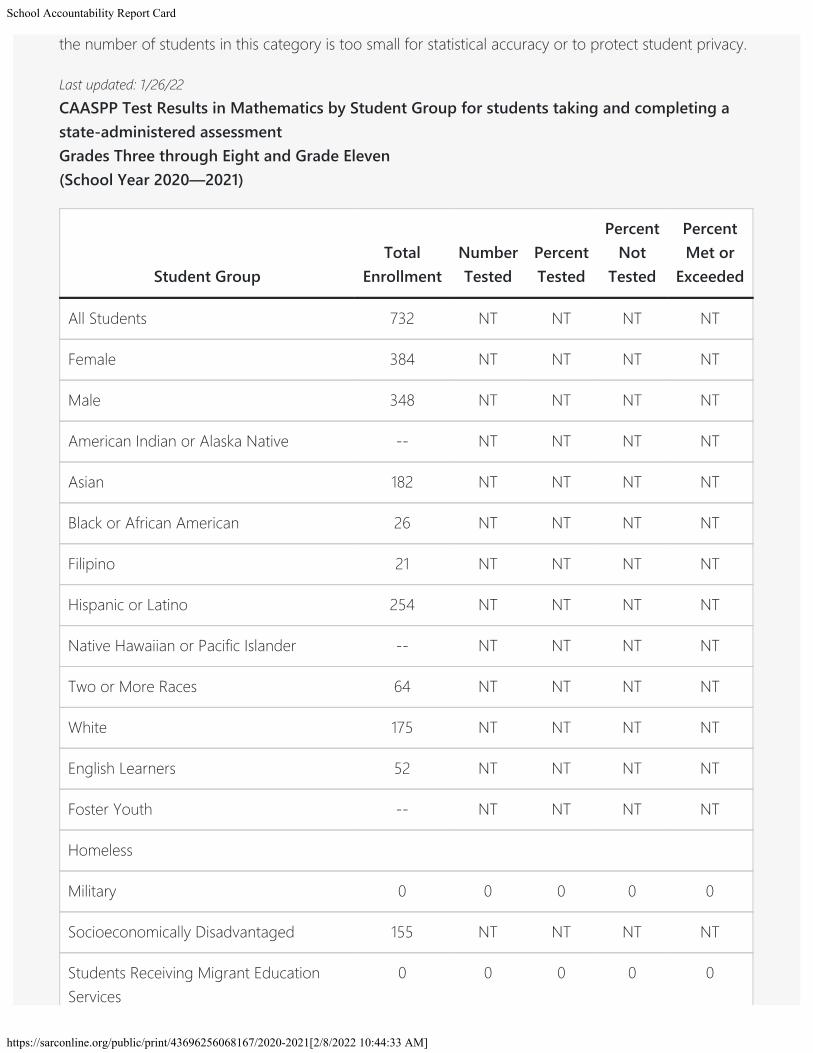
the number of students in this category is too small for statistical accuracy or to protect student privacy.
Last updated: 1/26/22CAASPP Test Results in Mathematics by Student Group for students taking and completing astate-administered assessmentGrades Three through Eight and Grade Eleven (School Year 2020—2021)
Student GroupTotal
EnrollmentNumberTested
PercentTested
PercentNot
Tested
PercentMet or
Exceeded
All Students 732 NT NT NT NT
Female 384 NT NT NT NT
Male 348 NT NT NT NT
American Indian or Alaska Native -- NT NT NT NT
Asian 182 NT NT NT NT
Black or African American 26 NT NT NT NT
Filipino 21 NT NT NT NT
Hispanic or Latino 254 NT NT NT NT
Native Hawaiian or Pacific Islander -- NT NT NT NT
Two or More Races 64 NT NT NT NT
White 175 NT NT NT NT
English Learners 52 NT NT NT NT
Foster Youth -- NT NT NT NT
Homeless
Military 0 0 0 0 0
Socioeconomically Disadvantaged 155 NT NT NT NT
Students Receiving Migrant EducationServices
0 0 0 0 0

School Accountability Report Card
https://sarconline.org/public/print/43696256068167/2020-2021[2/8/2022 10:44:33 AM]
Students with Disabilities 70 NT NT NT NT
Note: N/T values indicate that this school did not test students using the CAASPP for Mathematics.Note: Double dashes (--) appear in the table when the number of students is ten or less, either becausethe number of students in this category is too small for statistical accuracy or to protect student privacy.
Last updated: 1/26/22Local Assessment Test Results in ELA by Student GroupAssessment Name(s): iReady Diagnostic Reading AssessmentGrades Three through Eight and Grade Eleven (School Year 2020—2021)
Student GroupTotal
EnrollmentNumberTested
PercentTested
PercentNot
Tested
PercentAt or
AboveGradeLevel
All Students 731 688 94 6 75
Female 383 355 93 7 81
Male 348 333 96 4 68
American Indian or Alaska Native -- -- -- -- --
Asian 182 179 98 2 87
Black or African American 26 23 88 12 52
Filipino 41 38 93 7 84
Hispanic or Latino 253 227 90 10 62
Native Hawaiian or Pacific Islander 9 9 100 0 33
Two or More Races 47 45 96 4 87
White 173 167 97 3 45
English Learners 52 50 96 4 24
Foster Youth -- -- -- -- --
Homeless -- -- -- -- --

School Accountability Report Card
https://sarconline.org/public/print/43696256068167/2020-2021[2/8/2022 10:44:33 AM]
Military -- -- -- -- --
Socioeconomically Disadvantaged 21 18 86 14 61
Students Receiving Migrant EducationServices
1 1 100 0 100
Students with Disabilities 81 68 84 16 29
*At or above the grade-level standard in the context of the local assessment administered.Note: LEAs/schools will populate this table for schools in cases where the school administered a localassessment.Note: LEAs/schools will populate double dashes (--) in this table when the number of students is ten orless, either because the number of students in this category is too small for statistical accuracy or toprotect student privacy.Note: In cases where the school administered only the CAASPP assessment, LEAs/schools will populatethis table with “N/A” values in all cells, meaning this table is Not Applicable for this school.
Last updated: 1/27/22CAASPP Test Results in Science for All StudentsGrades Five, Eight and High SchoolPercentage of Students Meeting or Exceeding the State Standard
Subject
School2019-2020
School2020–2021
District2019-2020
District2020–2021
State2019-2020
State2020–2021
Science (grades 5, 8, and highschool)
N/A NT N/A NT N/A 28.72
Note: The 2019–2020 data cells with N/A values indicate that the 2019–2020 data are not available dueto the COVID-19 pandemic and resulting summative testing suspension. The Executive Order N-30-20was issued which waived the assessment, accountability, and reporting requirements for the 2019–2020school year.Note: For any 2020–2021 data cells with N/T values indicate that this school did not test students usingthe CAASPP Science.
Last updated: 1/27/22CAASPP Test Results in Science by Student GroupGrades Five, Eight and High School (School Year 2020—2021)

School Accountability Report Card
https://sarconline.org/public/print/43696256068167/2020-2021[2/8/2022 10:44:33 AM]
Student GroupTotal
EnrollmentNumberTested
PercentTested
PercentNot
Tested
PercentMet or
Exceeded
All Students 369 NT NT NT NT
Female 184 NT NT NT NT
Male 185 NT NT NT NT
American Indian or Alaska Native 0 0 0 0 0
Asian 82 NT NT NT NT
Black or African American 11 NT NT NT NT
Filipino 11 NT NT NT NT
Hispanic or Latino 142 NT NT NT NT
Native Hawaiian or Pacific Islander -- NT NT NT NT
Two or More Races 28 NT NT NT NT
White 90 NT NT NT NT
English Learners 31 NT NT NT NT
Foster Youth -- NT NT NT NT
Homeless
Military 0 0 0 0 0
Socioeconomically Disadvantaged 82 NT NT NT NT
Students Receiving Migrant EducationServices
0 0 0 0 0
Students with Disabilities 39 NT NT NT NT
Note: N/T values indicate that this school did not test students using the CAASPP for Science.
Last updated: 1/27/22Career Technical Education (CTE) Programs (School Year 2020—2021)

School Accountability Report Card
https://sarconline.org/public/print/43696256068167/2020-2021[2/8/2022 10:44:33 AM]
null
Last updated: 1/27/22
State Priority: Other Pupil Outcomes
The SARC provides the following information relevant to the State priority: Other Pupil Outcomes(Priority 8):
Pupil outcomes in the subject area of physical education
California Physical Fitness Test Results (School Year 2020—2021)
Grade Level
Percentage ofStudents Meeting
Four of SixFitness Standards
Percentage ofStudents Meeting
Five of SixFitness Standards
Percentage ofStudents Meeting
Six of SixFitness Standards
5 N/A N/A N/A
7 N/A N/A N/A
9 N/A N/A N/A
Note: Due to the COVID-19 crisis, the Physical Fitness Test was suspended during the 2020–2021 schoolyear and therefore no data are reported.
Last updated: 1/26/22
C. Engagement
State Priority: Parental Involvement
The SARC provides the following information relevant to the State priority: Parental Involvement (Priority3):
Efforts the school district makes to seek parent input in making decisions for the school district andeach school site

School Accountability Report Card
https://sarconline.org/public/print/43696256068167/2020-2021[2/8/2022 10:44:33 AM]
Opportunities for Parental Involvement (School Year 2021-2022)
Research findings tell us that students do better academically when parents take an active role in theirchildren’s learning, and students are more successful inschool when schools have strong linkages with, and respond to, the needs of the communities theyserve. Strategies to increase parent involvement at HermanIntermediate School includes the following:Materials sent home are translated into one or more languagesParent education/events are provided on a monthly basisFamily Engagement events are provided throughout the yearParent leadership opportunities are provided through our Parent Faculty Group, School Site Council,GATE Parent Meetings, Site English Learner Advisory Council,HABLA group, and through our District Advisory CouncilAcademic Counselors are assigned to every student for support and communicationOnline meetings using Zoom and Google MeetsWeekly newsletters are sent out via Parentsquare to keep parents and students informed of events andinformation regarding programs, activities and updatesSurveys are sent to parents to involve them in decision making.
State Priority: Pupil Engagement
The SARC provides the following information relevant to the State priority: Pupil Engagement (Priority5):
High school dropout rates; andHigh school graduation ratesChronic Absenteeism
Chronic Absenteeism by Student Group(School Year 2020—2021)
Student GroupCumulativeEnrollment
ChronicAbsenteeism
EligibleEnrollment
ChronicAbsenteeism
Count
ChronicAbsenteeism
Rate
All Students 762 757 36 4.8
Female 398 395 19 4.8

School Accountability Report Card
https://sarconline.org/public/print/43696256068167/2020-2021[2/8/2022 10:44:33 AM]
Male 364 362 17 4.7
American Indian or Alaska Native 186 184 2 4.7
Asian 1 1 0 0.0
Black or African American 28 28 5 17.9
Filipino 24 24 0 0.0
Hispanic or Latino 270 267 25 9.4
Native Hawaiian or Pacific Islander 9 9 1 11.1
Two or More Races 64 64 0 0.0
White 180 180 3 1.7
English Learners 65 62 10 16.1
Foster Youth 2 2 2 100.0
Homeless 3 3 2 66.7
Socioeconomically Disadvantaged 177 175 29 16.6
Students Receiving MigrantEducation Services
1 1 0 0.0
Students with Disabilities 76 76 14 18.4
Last updated:
State Priority: School Climate
The SARC provides the following information relevant to the State priority: School Climate (Priority 6):
Pupil suspension rates;Pupil expulsion rates; andOther local measures on the sense of safety
Suspensions and Expulsions(data collected between July through June, each full school year respectively)
School School District District State State

School Accountability Report Card
https://sarconline.org/public/print/43696256068167/2020-2021[2/8/2022 10:44:33 AM]
Rate 2018-2019 2020–2021 2018-2019 2020–2021 2018-2019 2020–2021
Suspensions 7.68% 0.00% 2.81% 0.02% 3.47% 0.20%
Expulsions 0.00% 0.00% 0.00% 0.00% 0.08% 0.00%
Note: Data collected during the 2020–21 school year may not be comparable to earlier years of thiscollection due to differences in learning mode instruction in response to the COVID-19 pandemic.
Suspensions and Expulsions for School Year 2019—2020 Only(data collected between July through February, partial school year due to the COVID-19pandemic)
RateSchool
2019-2020District
2019-2020State
2019-2020
Suspensions 1.66% 0.84% 2.45%
Expulsions 0.00% 0.00% 0.05%
Note: The 2019–2020 suspensions and expulsions rate data are not comparable to other year databecause the 2019–2020 school year is a partial school year due to the COVID-19 crisis. As such, it wouldbe inappropriate to make any comparisons in rates of suspensions and expulsions in the 2019–2020school year compared to other school years.
Last updated: 1/26/22Suspensions and Expulsions by Student Group(School Year 2020—2021)
Student GroupSuspensions
RateExpulsions
Rate
All Students 0 0
Female 0 0
Male 0 0
Non-Binary 0 0
American Indian or Alaska Native 0 0
Asian 0 0

School Accountability Report Card
https://sarconline.org/public/print/43696256068167/2020-2021[2/8/2022 10:44:33 AM]
Black or African American 0 0
Filipino 0 0
Hispanic or Latino 0 0
Native Hawaiian or Pacific Islander 0 0
Two or More Races 0 0
White 0 0
English Learners 0 0
Foster Youth 0 0
Homeless 0 0
Socioeconomically Disadvantaged 0 0
Students Receiving Migrant Education Services 0 0
Students with Disabilities 0 0
Last updated:School Safety Plan (School Year 2021-2022)
The school site council is responsible for developing the school site safety plan or for delegating theresponsibility to a school safety planning committee. (Ed. Code 35294.1). The Herman School SiteCouncil last reviewed on 1/19/22.
The School Safety Planning Committee shall make an assessment of the current status of school crimecommitted on campus and at school-related functions and of appropriate strategies and programs thatwill provide or maintain a high level of school safety. (Ed. Code 35924.2)While the School Safety Planning Committee reviews school, district and community crime data trendssuch as the California Safe School Assessment, other data can bring value to the discussions. Such datamay include:Mental Health DataState, District or Site Surveys (such as the Youth Risk Behavior Survey)Disciplinary DataCommunity Police Data

School Accountability Report Card
https://sarconline.org/public/print/43696256068167/2020-2021[2/8/2022 10:44:33 AM]
Herman Intermediate strives to provide a safe and healthy environment for our students and staff.
Herman Intermediate School is one of 18 schools in the Oak Grove School District in South San Jose.Each year our Safe School’s Plan is reviewed and modified by our School Site Council to address fourcomponents: goals, areas of pride and desired change, specific objectives, and activities to supportthese objectives. This plan addresses school safety, increased student performance, emergencypreparedness, bullying and harassment, school discipline and school incentives, health, and an extensivetobacco, drugs, alcohol prevention program. To this end, there are continuous improvement processesand collaborative efforts that provide comprehensive health education and a strong academicfoundation within a safe and secure learning environment that ensures success for all students.
Last updated: 1/26/22
D. Other SARC informationThe information in this section is required to be in the SARC but is not included in the state priorities forLCFF.
Average Class Size and Class Size Distribution (Elementary) School Year 2018—2019
GradeLevel
Average ClassSize
Number of Classes*1-20
Number of Classes*21-32
Number of Classes33+
K
1
2
3
4
5 32.00 12
6 32.00 12
Other** 0
* Number of classes indicates how many classes fall into each size category (a range of total studentsper class).
School Accountability Report Card
https://sarconline.org/public/print/43696256068167/2020-2021[2/8/2022 10:44:33 AM]
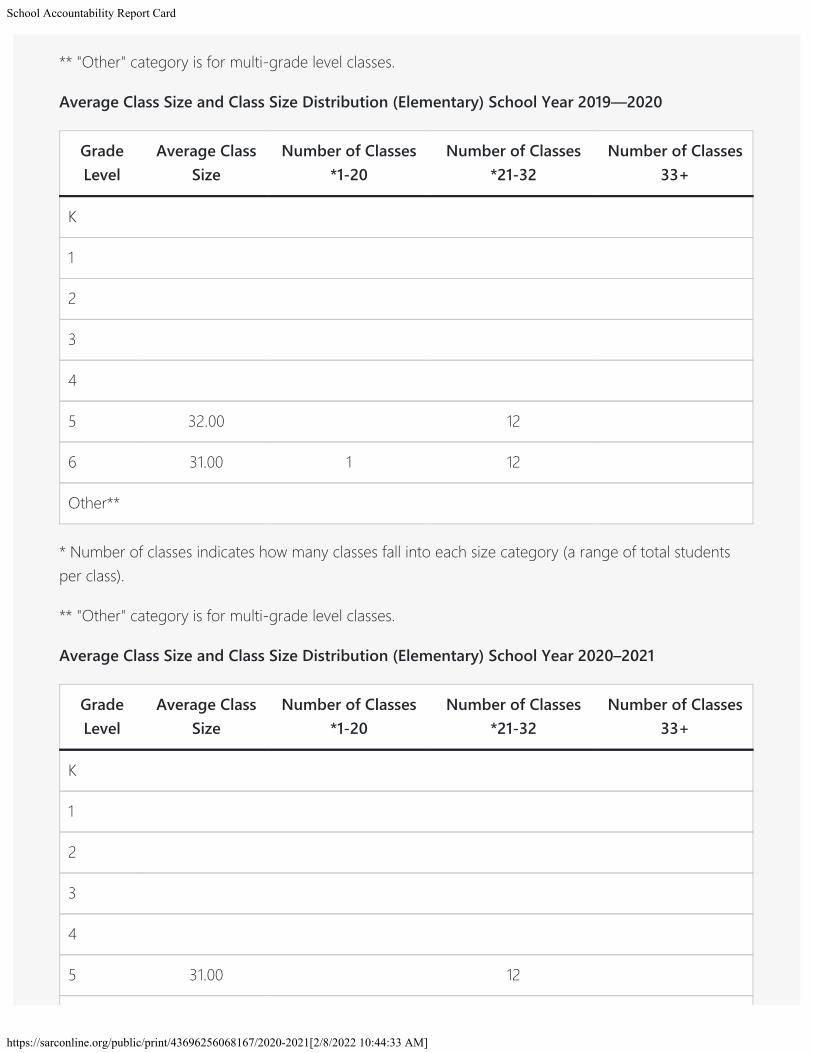
** "Other" category is for multi-grade level classes.
Average Class Size and Class Size Distribution (Elementary) School Year 2019—2020
GradeLevel
Average ClassSize
Number of Classes*1-20
Number of Classes*21-32
Number of Classes33+
K
1
2
3
4
5 32.00 12
6 31.00 1 12
Other**
* Number of classes indicates how many classes fall into each size category (a range of total studentsper class).
** "Other" category is for multi-grade level classes.
Average Class Size and Class Size Distribution (Elementary) School Year 2020–2021
GradeLevel
Average ClassSize
Number of Classes*1-20
Number of Classes*21-32
Number of Classes33+
K
1
2
3
4
5 31.00 12

School Accountability Report Card
https://sarconline.org/public/print/43696256068167/2020-2021[2/8/2022 10:44:33 AM]
6 29.00 1 12
Other**
* Number of classes indicates how many classes fall into each size category (a range of total studentsper class).
** "Other" category is for multi-grade level classes.
Average Class Size and Class Size Distribution (Secondary) (School Year 2018—2019)
SubjectAverage Class
SizeNumber of Classes
*1-22Number of Classes
*23-32Number of Classes
33+
English 24.00 9 19 4
Math 27.00 5 16 6
Science 25.00 6 18 5
SocialScience
31.00 1 15 8
* Number of classes indicates how many classrooms fall into each size category (a range of totalstudents per classroom). At the secondary school level, this information is reported by subject arearather than grade level.
Average Class Size and Class Size Distribution (Secondary) (School Year 2019—2020)
SubjectAverage Class
SizeNumber of Classes
*1-22Number of Classes
*23-32Number of Classes
33+
English 20.00 21 11 2
Math 20.00 5 18 3
Science 29.00 4 10 10
SocialScience
28.00 5 17 3
* Number of classes indicates how many classrooms fall into each size category (a range of totalstudents per classroom). At the secondary school level, this information is reported by subject arearather than grade level.

School Accountability Report Card
https://sarconline.org/public/print/43696256068167/2020-2021[2/8/2022 10:44:33 AM]
Average Class Size and Class Size Distribution (Secondary) (School Year 2020–2021)
SubjectAverage Class
SizeNumber of Classes
*1-22Number of Classes
*23-32Number of Classes
33+
English 27.00 3 15 3
Math 27.00 3 15 4
Science 29.00 17 3
SocialScience
27.00 3 15 4
Last updated: 1/26/22* Number of classes indicates how many classrooms fall into each size category (a range of totalstudents per classroom). At the secondary school level, this information is reported by subject arearather than grade level.
Ratio of Pupils to Academic Counselor (School Year 2020—2021)
Title Ratio
Pupils to Academic Counselor* 323.9
Last updated: 12/31/99* One full time equivalent (FTE) equals one staff member working full time; one FTE could also representtwo staff members who each work 50 percent of full time.
Student Support Services Staff (School Year 2020—2021)
TitleNumber of FTE* Assigned to
School
Counselor (Academic, Social/Behavioral or CareerDevelopment)
2.30
Library Media Teacher (Librarian) 0.00
Library Media Services Staff (Paraprofessional) 0.60

School Accountability Report Card
https://sarconline.org/public/print/43696256068167/2020-2021[2/8/2022 10:44:33 AM]
Psychologist 1.00
Social Worker 0.00
Nurse 0.00
Speech/Language/Hearing Specialist 0.00
Resource Specialist (non-teaching) 0.00
Other 0.00
Last updated: 12/31/99* One full time equivalent (FTE) equals one staff member working full time; one FTE could also representtwo staff members who each work 50 percent of full time.
Expenditures Per Pupil and School Site Teacher Salaries (Fiscal Year 2019—2020)
Level
TotalExpenditures
Per PupilExpenditures PerPupil (Restricted)
Expenditures PerPupil
(Unrestricted)
AverageTeacherSalary
School Site $12921.00 $3826.00 $9095.00 $87081.00
District N/A N/A $8460.00 $85750.00
Percent Difference –School Site andDistrict
N/A N/A 4.77% 1.02%
State N/A N/A $8443.83 $85863.00
Percent Difference –School Site and State
N/A N/A 4.89% 0.94%
Last updated: 1/26/22Note: Cells with N/A values do not require data.
Types of Services Funded (Fiscal Year 2020–2021)
In addition to implementing the district adopted curriculum with fidelity, Herman and theAdVENTURE/STEM program have ireasearched and purchased several platforms, technologies,

School Accountability Report Card
https://sarconline.org/public/print/43696256068167/2020-2021[2/8/2022 10:44:33 AM]
programs and services to support teachers and students in the classroom. In order to foster studentengagement, we purchased the following:
Peardeck-allows students to interface with Google slides directly
Formative- web-app for classrooms that allows teachers to give liveassignments to students, allowing instant teaching adjustments and long-term student data tracking
WE Video-a cloud-based editing platform that allows users of all skill levels the opportunity to createprofessional style vieos, podcasts and more.
Listenwise-platform purchased to engage students in listening activities and critical thinking
Flocabulary-creates educational songs, videos and materials to support students in all subject areas
Sown to Grown-platform to improve student social, emotional and academic health through an easyand engaging reflection and feedback process
Raz Kids-a guided reading program with interactive ebooks, downloadable books and reading quizzes
Rocketlit-differentiated, standards-based science and history readings for students
Breakout EDU-builds critical thinking and social and emotional skills necessar to solve complex problems
Scholastic-books and literary resources for students
Project Lead the Way-to invest in our students STEM learnings such as computer science, robotics andengineering
Additionally, we have budgeted 3 planning/release days for each teacher to work collaboratively indepartments to improve upon their curriculum and instructional design.
Last updated: 1/26/22Teacher and Administrative Salaries (Fiscal Year 2019—2020)
CategoryDistrictAmount
State Average For Districts In SameCategory
Beginning Teacher Salary $53709.00 $52060.00
Mid-Range Teacher Salary $84060.00 $84043.00
Highest Teacher Salary $103129.00 $107043.00
Average Principal Salary (Elementary) $141017.00 $133582.00

School Accountability Report Card
https://sarconline.org/public/print/43696256068167/2020-2021[2/8/2022 10:44:33 AM]
Average Principal Salary (Middle) $145187.00 $138803.00
Average Principal Salary (High) $0.00 --
Superintendent Salary $298043.00 $240628.00
Percent of Budget for Teacher Salaries 35.00% 35.00%
Percent of Budget for AdministrativeSalaries
5.00% 5.00%
For detailed information on salaries, see the CDE Certificated Salaries & Benefits web page athttps://www.cde.ca.gov/ds/fd/cs/.
Last updated:Advanced Placement (AP) Courses (School Year 2020—2021)
Percent of Students in AP Courses 0.00%
Subject Number of AP Courses Offered*

School Accountability Report Card
https://sarconline.org/public/print/43696256068167/2020-2021[2/8/2022 10:44:33 AM]
Computer Science 0
English 0
Fine and Performing Arts 0
Foreign Language 0
Mathematics 0
Science 0
Social Science 0
Total AP Courses Offered* 0.00%
Last updated: 1/26/22* Where there are student course enrollments of at least one student.
Professional Development
Measure2019-2020
2020–2021
2021-2022
Number of school days dedicated to Staff Development andContinuous Improvement
3 3 3
AddendumOn July 14, 2021, the California State Board of Education (SBE) determined that the CaliforniaDepartment of Education (CDE) will use the SARC Web Application as the mechanism to conduct a one-time data collection of the LEA-level aggregate test results of all school’s local assessments administeredduring the 2020–2021 school year in order to meet the federal Every Students Succeeds Act (ESSA)reporting requirement for the Local Educational Agency Accountability Report Cards (LARCs).
Each local educational agency (LEA) is responsible for preparing and posting their annual LARC inaccordance with the federal ESSA. As a courtesy, the CDE prepares and posts the LARCs on behalf of allLEAs.
Only for the 2020–2021 school year and the 2020–2021 LARCs, LEAs are required to report theiraggregate local assessments test results at the LEA-level to the CDE by populating the tables below viathe SARC Web Application. These data will be used to meet the LEAs’ federal requirement for theirLARCs. Note that it is the responsibility of the school and LEA to ensure that all student privacy and
School Accountability Report Card
https://sarconline.org/public/print/43696256068167/2020-2021[2/8/2022 10:44:33 AM]
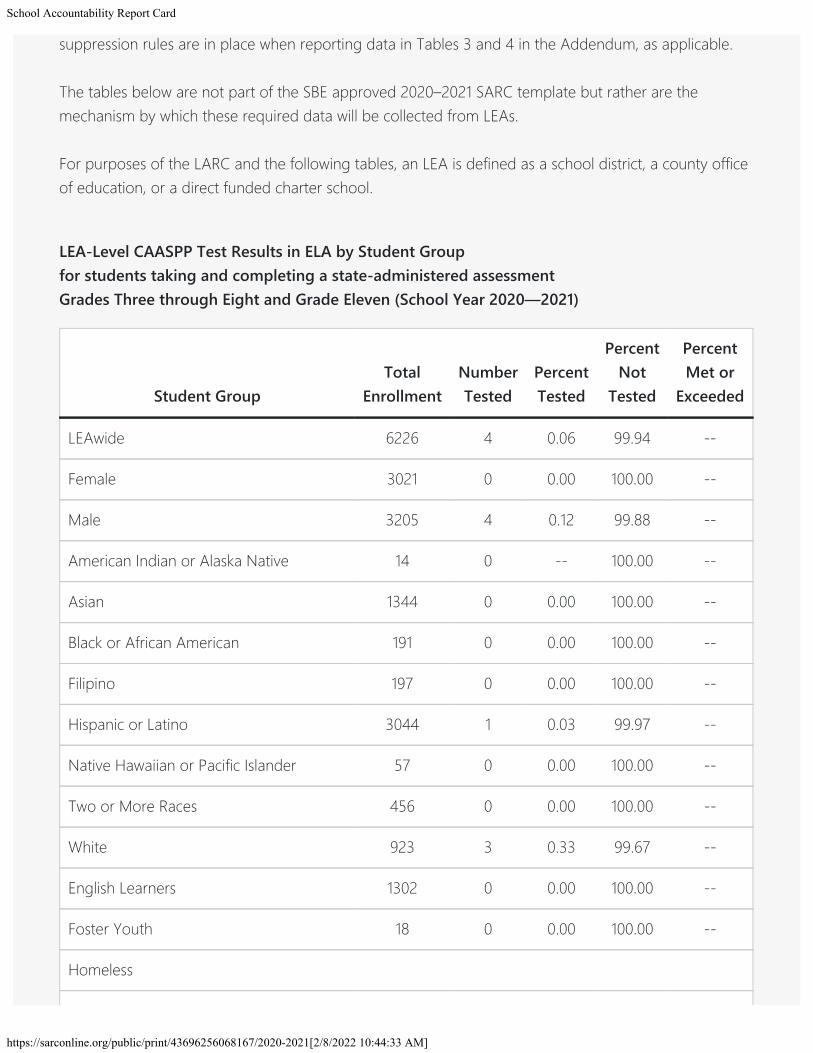
suppression rules are in place when reporting data in Tables 3 and 4 in the Addendum, as applicable.
The tables below are not part of the SBE approved 2020–2021 SARC template but rather are themechanism by which these required data will be collected from LEAs.
For purposes of the LARC and the following tables, an LEA is defined as a school district, a county officeof education, or a direct funded charter school.
LEA-Level CAASPP Test Results in ELA by Student Group for students taking and completing a state-administered assessmentGrades Three through Eight and Grade Eleven (School Year 2020—2021)
Student GroupTotal
EnrollmentNumberTested
PercentTested
PercentNot
Tested
PercentMet or
Exceeded
LEAwide 6226 4 0.06 99.94 --
Female 3021 0 0.00 100.00 --
Male 3205 4 0.12 99.88 --
American Indian or Alaska Native 14 0 -- 100.00 --
Asian 1344 0 0.00 100.00 --
Black or African American 191 0 0.00 100.00 --
Filipino 197 0 0.00 100.00 --
Hispanic or Latino 3044 1 0.03 99.97 --
Native Hawaiian or Pacific Islander 57 0 0.00 100.00 --
Two or More Races 456 0 0.00 100.00 --
White 923 3 0.33 99.67 --
English Learners 1302 0 0.00 100.00 --
Foster Youth 18 0 0.00 100.00 --
Homeless

School Accountability Report Card
https://sarconline.org/public/print/43696256068167/2020-2021[2/8/2022 10:44:33 AM]
Military 0 0 0 0 0
Socioeconomically Disadvantaged 2286 1 0.04 99.96 --
Students Receiving Migrant EducationServices
-- -- -- -- --
Students with Disabilities 817 4 0.49 99.51 --
Note: N/T values indicate that the schools in this LEA did not test students using the CAASPP for ELA.Note: Double dashes (--) appear in the table when the number of students is ten or less, either becausethe number of students in this category is too small for statistical accuracy or to protect student privacy.
Last updated: 1/27/22LEA-Level CAASPP Test Results in Mathematics by Student Group for students taking and completing a state-administered assessmentGrades Three through Eight and Grade Eleven (School Year 2020—2021)
Student GroupTotal
EnrollmentNumberTested
PercentTested
PercentNot
Tested
PercentMet or
Exceeded
LEAwide 6226 4 0.06 99.94 --
Female 3021 0 0.00 100.00 --
Male 3205 4 0.12 99.88 --
American Indian or Alaska Native 14 0 -- 100.00 --
Asian 1344 0 0.00 100.00 --
Black or African American 191 0 0.00 100.00 --
Filipino 197 0 0.00 100.00 --
Hispanic or Latino 3044 1 0.03 99.97 --
Native Hawaiian or Pacific Islander 57 0 0.00 100.00 --
Two or More Races 456 0 0.00 100.00 --
White 923 3 0.33 99.67 --
English Learners 1302 0 0.00 100.00 --

School Accountability Report Card
https://sarconline.org/public/print/43696256068167/2020-2021[2/8/2022 10:44:33 AM]
Foster Youth 18 0 0.00 100.00 --
Homeless
Military 0 0 0 0 0
Socioeconomically Disadvantaged 2286 1 0.04 99.96 --
Students Receiving Migrant EducationServices
-- -- -- -- --
Students with Disabilities 817 4 0.49 99.51 --
Note: N/T values indicate that the schools in this LEA did not test students using the CAASPP forMathematics.Note: Double dashes (--) appear in the table when the number of students is ten or less, either becausethe number of students in this category is too small for statistical accuracy or to protect student privacy.
Last updated: 1/28/22LEA-Level Local Assessment Test Results in ELA by Student GroupAssessment Name/s: iReady Diagnostic Reading AssessmentGrades Three through Eight and Grade Eleven (School Year 2020—2021)
Student GroupTotal
EnrollmentNumberTested
PercentTested
PercentNot
Tested
PercentAt or
AboveGradeLevel
LEAwide 6181 5771 93 7 56
Female 3006 2806 93 7 60
Male 3175 2965 93 7 52
American Indian or Alaska Native 12 11 92 8 64
Asian 1334 1292 97 3 78
Black or African American 192 170 89 11 42
Filipino 412 398 97 3 71
Hispanic or Latino 2960 2674 90 10 39

School Accountability Report Card
https://sarconline.org/public/print/43696256068167/2020-2021[2/8/2022 10:44:33 AM]
Native Hawaiian or Pacific Islander 59 57 97 3 40
Two or More Races 293 284 97 3 70
White 910 876 96 4 68
English Learners 1275 1168 92 8 17
Foster Youth -- -- -- -- --
Homeless -- -- -- -- --
Military -- -- -- -- --
Socioeconomically Disadvantaged 821 751 91 9 27
Students Receiving Migrant EducationServices
45 43 96 4 2
Students with Disabilities 903 809 90 10 23
*At or above the grade-level standard in the context of the local assessment administered.Note: LEAs/schools will populate this table for schools in cases where the school administered a localassessment.Note: LEAs/schools will populate double dashes (--) in this table when the number of students is ten orless, either because the number of students in this category is too small for statistical accuracy or toprotect student privacy.Note: In cases where all the schools in this LEA administered only the CAASPP for ELA assessment,LEAs/schools will populate this table with “N/A” values in all cells, meaning this table is Not Applicablefor this LEA.
Last updated: 1/27/22LEA-Level Assessment Test Results in Mathematics by Student GroupAssessment Name/s: iReady Diagnostic Math AssessmentGrades Three through Eight and Grade Eleven (School Year 2020—2021)
Student GroupTotal
EnrollmentNumberTested
PercentTested
PercentNot
Tested
PercentAt or
AboveGradeLevel
LEAwide 6192 5833 94 6 41

School Accountability Report Card
https://sarconline.org/public/print/43696256068167/2020-2021[2/8/2022 10:44:33 AM]
Female 3011 2843 94 6 41
Male 3181 2990 94 6 40
American Indian or Alaska Native 12 11 92 8 36
Asian 1336 1300 97 3 72
Black or African American 192 172 90 10 26
Filipino 413 402 97 3 52
Hispanic or Latino 2964 2708 91 9 21
Native Hawaiian or Pacific Islander 59 57 97 3 14
Two or More Races 294 286 97 3 52
White 913 888 97 3 50
English Learners 1278 1170 92 6 13
Foster Youth -- -- -- -- --
Homeless -- -- -- -- --
Military -- -- -- -- --
Socioeconomically Disadvantaged 821 758 92 8 16
Students Receiving Migrant EducationServices
46 42 91 9 13
Students with Disabilities 814 721 89 11 13
*At or above the grade-level standard in the context of the local assessment administered.Note: LEAs/schools will populate this table for schools in cases where the school administered a localassessment.Note: LEAs/schools will populate double dashes (--) in this table when the number of students is ten orless, either because the number of students in this category is too small for statistical accuracy or toprotect student privacy.Note: In cases where all the schools in this LEA administered only the CAASPP for Mathematicsassessment, LEAs/schools will populate this table with “N/A” values in all cells, meaning this table is NotApplicable for this LEA.

School Accountability Report Card
https://sarconline.org/public/print/43696256068167/2020-2021[2/8/2022 10:44:33 AM]
Last updated: 1/27/22
California Department of Education 1430 N Street
Sacramento, CA 95814