Embed Size (px)
Citation preview

112
Science access students: An exploration of their cognitive test anxiety
Yougan Aungamuthu Shaun Ramroop
[email protected] [email protected]
University of KwaZulu Natal University of KwaZulu Natal
South Africa South Africa
ABSTRACT
Test anxiety amongst Science access students is often not given the due attention
that it deserves and this can be a potentially leading factor of success or failure
amongst Science access students as they prepare for entrance to read for a degree.
The current study focuses on cognitive test anxiety which refers to the worry filled
thoughts a student encounters during or after an assessment with regards to their
performance on that assessment. Data was collected using the Cognitive Test
Anxiety (CTA) questionnaire ( and analyzed using an index based on the median
that classified the students as high or low anxiety groups. Current literature suggests
that there are a number of different variables associated with cognitive test anxiety.
Via a logistic regression model, a relationship between student's cognitive test
anxiety and five variables (gender, matric points, matric mathematics mark, lecture
group and number of modules passed by students in their mid-year university
examinations) was investigated. With respect to the CTA of Science access
students, the variables matric mathematics mark and matric points were found to be
the influential variables.
Keywords: Cognitive Test Anxiety (CTA), factors, median, high anxiety, low
anxiety, logistic regression.

113
INTRODUCTION
Education is pivotal in transforming the socio-economic landscape of South Africa;
historically, a landscape shaped by the legacy of apartheid wherein inequity of
resources marginalised the education of Black learners. For South Africa to develop
and progress there is a dire need to ensure that the country produces graduates, in
particular, more Black graduates . This is a challenge given that the majority of
government schools are dysfunctional . Further, various national and international
assessments in mathematics and science suggest that well-resourced schools
outperform their under-resourced counterparts . In order to facilitate meaningful
access to higher education for students who manage to qualify for university
admission, issues associated with student transition and learning need to be
examined and understood so as to develop appropriate responses that would
enable students to maximise their learning goals and minimise dropout and failure.
As such, this paper explores the test anxiety of Science Access students; students
who come from historically disadvantaged schools and communities that were
marginalised by apartheid in South Africa. Based on matric marks in the national
matric examinations, Science Access students do not qualify for acceptance into an
undergraduate Science degree. However, Science Access students gain access to
study for a science degree through a Science Access programme run by the
university. Selection into the Science Access programme is based on students
having attended a school classified as under resourced by the Department of Basic
Education; other criteria for selection are discussed in section 3.2. Science Access
students have to pass five modules in the programme so as to be eligible for
admission to a science degree the following year. The Science Access programme
seeks to prepare students for the rigors of academia through modules in Maths,
Biology, Physics, Chemistry and Scientific Communication. For a further description
of Science Access students, refer to Downs (2010), Pillay (2009), Reynolds (2008),
and Rollnick (2010).
Aungamuthu, Ramroop: Science access students
114
Based on conversations with Science Access students, the purpose of which was to
elicit reasons for poor test performances, students cited anxiety, worry, and 'going
blank' during tests, as well as reasons related to finance. The researchers in this
study therefore decided to survey and measure student levels of test anxiety and go
beyond what may be construed as anecdotal evidence. Coupled with students'
disadvantaged schooling backgrounds and the high stakes associated with
university, the researchers considered this a reasonable approach since, in most
cases, Science Access students are first generation university students who may
not be privy to the cultural capital necessary to negotiate various aspects of
university life.
LITERATURE REVIEW AND THEORETICAL FRAMEWORK
Literature Review
The literature review aims to answer three questions:
·What is cognitive test anxiety?
There are various definitions and models of test anxiety which suggest that test
anxiety is a multi-dimensional construct . Research has identified three dimensions
of test anxiety, namely, a physiological dimension; a behavioural dimension, and a
cognitive dimension . This study focuses on the cognitive dimension of test anxiety
which refers to the worry-filled thoughts that a person has prior, during, or after an
assessment with regards to their performance .
·What research evidence is there that cognitive test anxiety is
associated with academic performance?
Test anxiety is an important variable at all levels in education systems . However,
cognitive test anxiety has been repeatedly linked with decreased academic
performance . Students with high levels of cognitive anxiety tend to have negative
thoughts about their abilities thereby inhibiting their achievements . Negative worry-
type thoughts restrict students' working memory and so their ability to concentrate
Journal For Educational Studies 13 (2) 2014

115
and to remember information is impeded . Other symptoms of cognitive test anxiety
are feelings of nervousness and discomfort before lectures, inability to recall
information during tests, lack of interest in a subject, and doubting one's abilities to
complete tasks; all of which inhibit academic performance .
·Who is at risk of high levels of test anxiety?
Many variables are associated with high test anxiety. While some researchers
contend that females report higher levels of cognitive test anxiety than males , other
studies have found gender to have no statistically significant effect . However, found
that low achieving males reported higher levels of cognitive test anxiety than low
achieving females, thereby indicating that gender is a contentious variable.
Besides gender, socioeconomic variables like type of school (public versus private)
and the education level of parents have been shown to affect test anxiety . In
addition student level variables like self-efficacy beliefs, self-control, test scores,
and motivation have been linked to test anxiety . In this study, test scores were
operationalised by considering students' marks obtained at school level
assessments (matric final exam marks) and university mid-year examination
performance.
While much of the research in test anxiety centres on student level variables, few
studies explore the effects that context variables like classroom environment or
teacher attributes have on the levels of student anxiety . This study examines
whether or not there is a classroom effect associated with cognitive test anxiety by
analysing the latter in relation to the lecture groups which students are randomly
assigned to on registration. This is further discussed in section 3.2 below.
Theoretical Framework: Cognitive Interference Model
The cognitive test anxiety (CTA) questionnaire (Cassady &Johnson, 2002) was
used to collect data for this study. From a theory perspective, the CTA questionnaire
is based on the cognitive interference model of cognitive test anxiety (Cassady &
Aungamuthu, Ramroop: Science access students

116
Johnson, 2002). Within such a perspective, people with high levels of test anxiety
cannot control intrusive thoughts during a test; thoughts which distract them from
appropriate tests prompts thereby preventing meaningful concentration on test
questions .
METHODOLOGY
Research question
This study stemmed from conversations with Science Access students and their
tutors; conversations regarding poor academic performance in mathematics. During
student consultation times, underperforming students would report that they felt
nervous about tests, in some cases forgetting their work in test situations, and
generally feeling worried about their performance. Thus, as an intervention strategy,
the researchers in this study explored the extent to which test anxiety impacts on
student academic performance. One of the researchers in the study is also the
module coordinator for the Foundation Mathematics module; part of the
coordinator's responsibility being to monitor student performance and make
appropriate interventions. The following research questions are answered in this
study:
·How is cognitive test anxiety distributed among Science Access students?
This question was statistically explored in four ways. Firstly, to find out if
there was a relationship between cognitive test anxiety and student matric
exam performance. Students' matric points and matric mathematics marks
were used as indicators of performance in matric. Secondly, the existence of
a link between gender and cognitive test anxiety was investigated. Thirdly,
the classroom environment was examined by looking for differences in the
distribution of cognitive test anxiety based on lecture group membership.
Lastly, student performance in mid-year university examinations was
analysed against student cognitive test anxiety. This was done by looking at
the number of modules a student passed in the exam in relation to their levels
of cognitive test anxiety.
Journal For Educational Studies 13 (2) 2014

117
·Are there differences in examination performance between the low and high
cognitive test anxiety groups? This question was answered by looking at
students' mid-year exam marks for each module and testing for differences in
performance based on cognitive test anxiety status (test anxiety status is
further described in Section 3.3 below).
·What factors are associated with cognitive test anxiety? This question was
answered by modelling the relationship between cognitive test anxiety and
the five independent variables described below.
Characteristics of the respondents based on independent variables
Within the Foundation Programme stream of the Science Access programme at the
University of KwaZulu-Natal (UKZN), Foundation Mathematics is offered as one of
five compulsory modules making up the Foundation Programme. For this study all
registered students in the Foundation Programme on the Pietermaritzburg campus
of UKZN were targeted as respondents. However, seven students were absent on
the day that data collection took place, thus reducing the number of respondents to
eighty five. Lecturers of the Foundation Maths module explained to students that
participation was voluntary and students could withdraw from participation at any
time. Further, the aims of the research were discussed with students. Lecturers
emphasised that the information collected from the survey was not going to be used
towards students' marks. Forty five respondents were female and forty were male;
gender was one of the independent variables used in the analysis.
Matric points were the second independent variable used. Matric is the name given
to the twelfth year of schooling in the South African basic education system. Students
sit for exams towards the end of their matric year and the marks obtained for these
exams are used as criteria for entrance to tertiary institutions. For example, at UKZN
points are awarded on six matric subjects (excluding the matric subject Life
Orientation) as follows:
Aungamuthu, Ramroop: Science access students

118
·8 points for each matric subject mark in the range 90% to100%;
·7 points for each matric subject mark in the range 80% to 89%;
·6 points for each matric subject mark in the range 70% to 79%; and so on
down to
·1 point for a mark in the range 0% to 29%.
For admission into the Foundation Programme, students require at least sixteen
matric points (excluding points for Life Orientation), and at least a 30% mark in matric
mathematics and one other science subject at matric level. 80% of the sample had
matric points in the range 22 to 28; 3.5% had points less than 22; 7% had points
greater than 28; and the matric points of eight students or 9.4% of the sample were
not available on the university administration system.
The matric maths mark of the sample, a third independent variable, was distributed
as follows: 31.7% of the sample scored below 40%; 25.9% of the sample scored in
the range 40% to 49%; 25.9% of the sample scored in the range 50% to 67%; and the
remaining 16.5% of the sample's marks were not available on the university student
management system. The mean matric maths mark was 43.5%, the median was
42%, the lowest mark was 19%, and the highest mark was 67%.
A fourth independent variable was the lecture group to which participants belonged.
This was used to explore whether or not the classroom environment was associated
with cognitive test anxiety. Forty three students belonged to lecture group one and
forty two students belonged to lecture group two. At the beginning of the academic
year, students are randomly allocated to lecture groups by the UKZN administration.
Students attend all academic-related activities in their respective groups.
Lastly, a fifth independent variable considered in this study was the number of
modules passed by students in the mid-year university examinations. Students sit
for examinations in four of their five modules; in one module, Scientific
Journal For Educational Studies 13 (2) 2014

119
Communication, no exam is written but there is continuous assessment. The
number of modules passed variable is an indicator of academic risk i.e. the more
modules passed, the less risk of academic failure and university drop-out. 53% of the
sample passed all five modules in the Foundation programme; 22% passed four
modules; 11% passed three modules, and 11% also passed two modules, whilst the
remainder of the sample passed one module. Underlying this variable was the mark
scored by each student in each of the five modules; this was used to probe for any
relationships between cognitive test anxiety and individual modules.
In summary, with the exception of the variable lecture group, all independent
variables used in this study were student level variables. With the exception of the
variable gender, all student level variables were included as indicators of student
academic ability. However, owing to the disadvantaged nature of Science Access
students' schooling, we recognise this assumption as a bias in our study.
Research instrument
A cognitive test anxiety (CTA) survey was administered to students during one of
their mathematics lectures in the second semester of 2013. The survey was
administered on the day that students were writing a test in Biology which was also
five days before their Mathematics test; this was done to ascertain students'
thoughts and feelings within a test taking scenario .
With regards to validity and reliability, the CTA survey was pilot tested and exhibits
internal consistency of : a=0.91 which has been shown to correlate with other
anxiety instruments . state that there are a number of different reliability coefficients.
One of the most commonly used is Cronbach's alpha, which is based on the average
correlation of items within a test if the items are standardised. If the items are not
standardised, it is based on the average covariance among the items. Cronbach's
alpha which can range from 0 to 1 was also calculated as part of the reliability test to
Aungamuthu, Ramroop: Science access students
120
assess how consistent the results were and whether we would get similar results to
generalise if we increased the sample size. A value of 0.7 or higher is a very good
value that can lead to the assumption that the same results would be obtained if the
survey was carried out with a larger sample of respondents. In this study, Cronbach's
alpha equalled 0.838 indicating good internal consistency. Further, the Guttmann
Split Half coefficient was 0.781 which further indicated good internal consistency.
The items in the survey fell into three categories related to test taking and
preparation periods :
·The following are examples of items which covered the first category, namely
comparing self to other students:
While taking an important examination, I find myself wondering
whether the other students are doing better than I am.
I have less difficulty than the average college student in getting test
instructions straight
·The second category, namely engaging in thinking irrelevant to the test or
test preparation, contained the following items:
During tests, I find myself thinking of the consequences of failing.
During tests, the thought frequently occurs to me that I may not be
too bright.
·The third category, namely having thoughts grounded in worry or missing
cues in test questions, had items like:
I lose sleep over worrying about examinations.
At the beginning of a test, I am so nervous that I often can't think
straight.
The CTA survey had items which had to be reverse-coded for high anxiety; these
were item numbers 3, 5, 8, 9, 10, 13, 17, 18 and 21. In other words, for the
aforementioned items, a score of 1, 2, 3 or 4 would be reverse-coded to 4, 3, 2 or 1
respectively.
Journal For Educational Studies 13 (2) 2014

121
Once reverse-coding was completed, a cognitive test anxiety score for each
participant was calculated by summing up their responses across each of the twenty
seven Likert scale survey items; each sum represented the cognitive test anxiety
score of a participant. Participants were then ranked in ascending order, based on
their cognitive test anxiety scores. The median CTA score was calculated; scores
greater than the median were classified as high anxiety while scores less than the
median were classified as low anxiety. A score of at least 72 on the CTA survey was
considered to reflect high anxiety ; the median CTA score in this study fell in that
interval.
Data analysis
Descriptive and inferential statistical techniques were used to analyse the survey
data. These techniques are described below. Gender, matric points, matric maths,
and lecture groupings were used as independent variables; cognitive test anxiety, as
scored on the CTA survey, was used as the dependent variable.
Descriptive and inferential statistics
We considered cross-tabulations and chi-square tests of independence between
the nominal variables (gender, group, and number of modules passed) and anxiety
status. state that there are two main types of chi-square test.The chi-square test for
the goodness of fit applies to the analysis of a single categorical variable, and the
chi-square test for independence or relatedness applies to the analysis of the
relationship between two categorical variables.
We also considered the mean and median of the matric score and matric
mathematics mark broken down by the anxiety status, along with the independent
sample t-test. Before applying the independent sample t-test, we performed the
Kolmogorov Smirnov test to ascertain whether the variables follow a normal
distribution; if normality of the data holds true then the use of a parametric test such
as the independent sample t-test is permissible. At the 5% significance level, we
Aungamuthu, Ramroop: Science access students

122
rejected the null hypothesis if p-values were less than 0.05 and conclude that the
tested variables do not come from a normal distribution. The implication for this is
that as far as the scores were concerned, we were required to use non-parametric
statistics. Tests such as the Mann-Whitney U test, chi-square, and Kruskal Wallis
test will be used if necessary. However for p-values are greater than 0.05 we will
accept the null hypothesis and we conclude that these variables come from a
normal distribution and we can use parametric techniques such as independent
sample t-test.
Logistic regression
According to the goal of any model building technique is to find the best fitting and
most parsimonious model to describe the relationship between an outcome
(dependent or response) and a set of independent (predictor, explanatory, or
covariate) variables. In the general linear model of which multiple regression is a part
of, we make the crucial assumption that the response and explanatory variables are
all continuous. But what if the explanatory and response variable are not
continuous? One would then usually make use of dummy variables to accommodate
explanatory variables that are categorical, but this can become cumbersome and
tedious. As a result the family of the general linear model was extended to the
generalised linear models to accommodate categorical explanatory variables as
well as continuous and non- continuous explanatory variables. points out that such
a model is part of an increasingly important family of models being used in recent
advancements in the areas of genetics, business, and medicine, just to mention a
few. Logistic regression is a special case of the generalised linear model where the
outcome variable is binary or dichotomous. In the current scientific setting the
outcome variable, y, is the anxiety level which is classified as either high anxiety or
low anxiety.
We now consider the logistic regression or the logit model. states that the logit
model is popular because the coefficients have a simple interpretation in terms of the
Journal For Educational Studies 13 (2) 2014

123
odds ratios, it has desirable sampling properties, and can be easily generalised to
allow for multiple unordered categories for the dependent variable. The logistic
regression uses the logit transformation of the probability, ð, of the event of interest
which is high anxiety, given as:
In the above equation, the âs are regression coefficients, and Xs are a set of
predictors along with the intercept term, â . The âs are typically estimated by the 0
maximum likelihood (ML) method, which is preferred over the weighted least
squares approach. Statistically the Hosmer-Lemeshow test is accepted as being a
test for the goodness of fit between the model and the data. The interpretation of this
test is such that if the p-value in the test is non-significant at the 5% level, this
indicates a good fit of the model to the data; if the p-value is significant, then the
model does not fit the data well.
Thus when we apply the logistic model to our data we have:
logit(ð)=â + â *no. of module passed+ â *matric score + â *matric mathematics 0 1 2 3
mark+ â *Gender+ â *group4 5
describes the odds of an event as the ratio of the expected number of times that an
event will occur to the expected number of times it will not occur. The interpretation of
the results is rendered using the odds ratio, OR. If â is the logistic regression
coefficient estimate for predictor X, then exp(â) is the OR corresponding to X. The
complementary interpretation is the sign of the coefficients: the positive coefficient
shows the increase of the chances for the given category of X relative to its reference
category, and the negative coefficients shows the decrease.
kk XXX bbbbp
pp ++++=÷
ø
öçè
æ
-= ...
1ln)(logit 22110
Aungamuthu, Ramroop: Science access students

124
parsimonious model. The procedure of stepwise logistic regression involves starting
with a single explanatory variable and then sequentially adding explanatory
variables one at a time in order to assess their impact and influence on the model.
This is done by noting changes in the values of the log-likelihood and noting if its p-
value is less than 0.05. Explanatory variables that are not statistically significant are
excluded from the model whilst the explanatory variables that are significant in their
influence with respect to the responses variable, are retained in the model .
Limitations
Firstly, the survey instrument used was not conducted in the mother tongue of the
students; the instrument was in the language of instruction, namely English.
Language has been shown to affect student performance . Respondents took
between thirty and forty minutes to complete the twenty seven item survey; two to
three times longer than the maximum time suggested for completion by Cassady
and Johnson (2002). The maths lecturer on duty assisted students with
understanding difficult words and questions so as to moderate the effects of the
language.
Secondly, the small sample size is a limitation in this study; this is partly due to
resource constraints. A larger sample size consisting of a greater number of
students across the various campuses of UKZN might strengthen the results of this
study. However, it must be noted that this study was exploratory in nature.
Thirdly, the measurement of several covariates such as race, financial background,
teacher variables, and perseverance levels, may allow for a greater degree of
explanatory power in the model developed in this study.
Finally, this study is based in UKZN; a broader study that extends to additional
universities in the other provinces might provide better estimates of the levels of
anxiety amongst students for a wider regional context. The results of the current
study are limited to UKZN and cannot be generalised to the rest of South Africa.
We carried out a stepwise logistic regression in order to find the best fitting and
Journal For Educational Studies 13 (2) 2014

125
RESULTS
How is cognitive test anxiety distributed among Science Access students?
This question was answered by examining cognitive test anxiety levels against each
of the independent variables described in the methodology section. As described in
Section 3.3 above, the median was used as a cut-off point to classify student anxiety
status. The median cognitive test anxiety score was 75; three units higher than the
lower bound suggested by Cassady (2004) for high anxiety.
Table 1a below revealed, with regards to matric points, that the high anxiety group
scored higher on average than the low anxiety group. The difference in the mean
matric point was 0.449 units suggestive of not a vast difference. This was confirmed
by an independent sample t-test which revealed that there was no significant
difference in the mean matric points between high anxiety and low anxiety groups: t
(75) = 0.769, p >0.05.
Further, with respect to the students' matric mathematics, the low anxiety group
scored higher on average than the high anxiety group. This difference was
statistically significant: t (69) = -4.787, p < 0.05. The Kolmogorov Smirnov test
revealed that the variables being tested followed the normal distribution which
meant that the independent sample t-test was appropriate (see Table 1b).
TABLE 1a: DESCRIPTIVE STATISTICS
Anxiety status Statistic Std. Error
Matric points
Low anxiety
group
Mean
25.351 .4012
Median
26.000
High anxiety
group
Mean
25.800 .4209
Median
26.000
Matric
mathematics
Low anxiety
group
Mean 48.800 1.621
Median 50.000
High anxiety
group
Mean 38.250 1.496
Median 37.000
Aungamuthu, Ramroop: Science access students

126
TABLE 1b: RESULTS OF THE KOLMOGOROV SMIRNOV TEST
Kolmogorov-Smirnov Z
Asymp. Sig. (2-tailed)
Matric points
1.199
.113
Matric mathematics
mark
.712 .691
The cross tabulation in Table 2 below reveals that there were less females (20%)
with low anxiety than females with high anxiety (32.9%). A substantially higher
percentage of males (30.6%) had low anxiety whilst 16.5% had high anxiety. The
cross tabulation thus reveals that with respect to low anxiety, males (30.6%) were
less anxious than females (20%) whilst with respect to high anxiety, more females
(23.9%) had high anxiety than males (16.5%). The chi-square test statistic was
6.278 (1 degree of freedom) and a p-value=0.012 which is significant at the 5% level
showing a significant relationship between gender and anxiety status.
TABLE 2: GENDER BY ANXIETY STATUS CROSSTABULATION
Anxiety status
Total
Low
anxiety
group
High anxiety
group
GenderFemale
20.0%
32.9%
52.9%
Male 30.6% 16.5% 47.1%
Total 50.6% 49.4% 100.0%
Journal For Educational Studies 13 (2) 2014
127
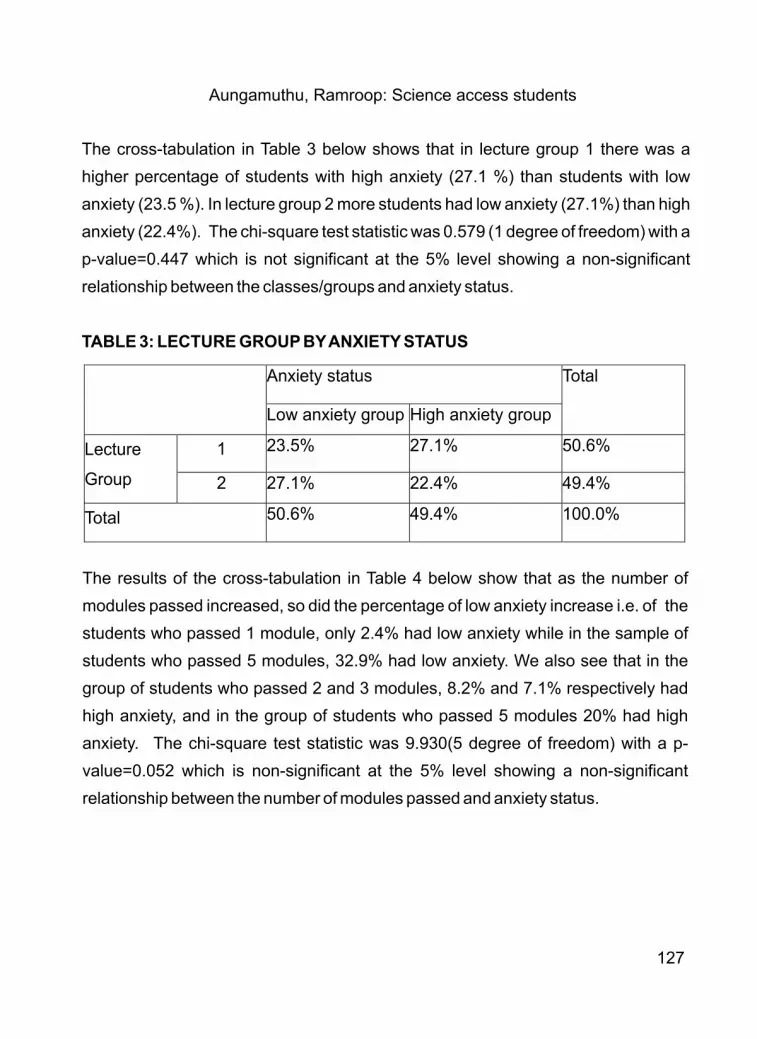
The cross-tabulation in Table 3 below shows that in lecture group 1 there was a
higher percentage of students with high anxiety (27.1 %) than students with low
anxiety (23.5 %). In lecture group 2 more students had low anxiety (27.1%) than high
anxiety (22.4%). The chi-square test statistic was 0.579 (1 degree of freedom) with a
p-value=0.447 which is not significant at the 5% level showing a non-significant
relationship between the classes/groups and anxiety status.
TABLE 3: LECTURE GROUP BY ANXIETY STATUS
Anxiety status Total
Low anxiety group High anxiety group
Lecture
Group
1
23.5%
27.1%
50.6%
2
27.1%
22.4%
49.4%
Total 50.6%
49.4%
100.0%
The results of the cross-tabulation in Table 4 below show that as the number of
modules passed increased, so did the percentage of low anxiety increase i.e. of the
students who passed 1 module, only 2.4% had low anxiety while in the sample of
students who passed 5 modules, 32.9% had low anxiety. We also see that in the
group of students who passed 2 and 3 modules, 8.2% and 7.1% respectively had
high anxiety, and in the group of students who passed 5 modules 20% had high
anxiety. The chi-square test statistic was 9.930(5 degree of freedom) with a p-
value=0.052 which is non-significant at the 5% level showing a non-significant
relationship between the number of modules passed and anxiety status.
Aungamuthu, Ramroop: Science access students

128
TABLE 4: NUMBER OF MODULES PASSED BY ANXIETY STATUS
Anxiety status Total
Low
anxiety
group
High
anxiety
group
No.of modules
passed
.00
1.2%
1.2%
1.00
2.4%
2.4%
2.00
2.4%
8.2%
10.6%
3.00
3.5%
7.1%
10.6%
4.00 9.4% 12.9% 22.4%
5.00 32.9% 20.0% 52.9%
Total 50.6% 49.4% 100.0%
The almost significant result between anxiety status and number of modules passed
prompted the researchers to investigate the relationship between cognitive test
anxiety and each of the modules students are assessed on. This is discussed under
the next research question.
Is there a difference in examination performance between the low cognitive
test anxiety group and the high cognitive test anxiety group?
Table 5 indicates that students from the low anxiety test group scored higher, on
average, than their counterparts from the high anxiety test group.
TABLE 5: Descriptive statistics of exam modules by anxiety status
Module
Anxiety status
N Mean
Std. Error Mean
Chemistry
High anxiety group
42 53.833
1.619
Low anxiety group
43 58.395
1.395
Maths
High anxiety group
42 51.905
1.997
Low anxiety group
43 64.930
1.773
PhysicsHigh anxiety group 42 50.429 1.339
Low anxiety group 43 56.023 1.514
BiologyHigh anxiety group 42 66.643 1.271
Low anxiety group 43 68.558 1.411
Scientific
Writing
High anxiety group 42 54.357 .8070
Low anxiety group 43 55.605 1.102
Journal For Educational Studies 13 (2) 2014

129
The results of the Komogorov Smirnov test for normality are illustrated in Table 6.
The Komogorov Smirnov test revealed that the variables being tested followed the
normal distribution which meant that the independent sample t-test could be applied
to the data.
TABLE 6: RESULTS OF THE KOLMOGOROV SMIRNOV TEST
Module
Kolmogorov-
Smirnov Z
Asymp. Sig. (2 -
tailed)
Chemistry .870
.435
Maths
.743
.638
Physics
.863
.445
Biology
1.007
.263
Scientific
Writing
1.239
.093
Table 7 below summarises the results of the t-tests. At the 5% significant level we
find that there are differences in the mean score of the two anxiety groups with
respect to Chemistry, Mathematics, and Physics (p-value < 0.05), and no
differences in the mean score with respect to Biology and Scientific Writing (p-
value > 0.05).
Aungamuthu, Ramroop: Science access students

130
Module
Levene's Test for
Equality of Variances
F
Sig.
t
df
Sig. (2-
tailed)
Chemistry
Equal variances
assumed
.007
.931
- 2.138
83
.035
Equal variances not
assumed
- 2.134
80.931
.036
Maths
Equal variances
assumed
.473
.494
- 4.883
83
.000
Equal variances not
assumed
- 4.877 81.610 .000
Physics
Equal variances
assumed
.501 .481 - 2.763 83 .007
Equal variances not
assumed
- 2.767
82.010
.007
Biology
Equal variances
assumed
.880
. 351
- 1.007
83
.317
Equal variances not
assumed
- 1.008
82.306
.316
Scientific
Writing
Equal variances
assumed
3.414
.068
- .910
83
.366
Equal variances not
assumed
- .913 76.562 .364
TABLE 7: Results of the independent sample t-test
Journal For Educational Studies 13 (2) 2014

131
What factors are associated with cognitive test anxiety?
The results, see Table 6 and 7 below, reveal that the matric points and the matric
mathematics mark are significant at the 5% level and are associated with high
anxiety. Since these variables are continuous and not categorical there is no
comparison with any levels within the variable and hence the odds ratios are not
interpreted. The matric points and matric mathematics mark are also critical in
preparing students to handle the modules and pressures of tertiary education. The
Hosmer-Lemeshow test was 3.135 (8 degrees of freedom) with a non-significant p-
value of 0.926, implying that the data fits the model well. The critical findings of the
logistic regression show that the matric points and the matric mathematics mark are
key factors associated with student level of anxiety. The variables of gender, group,
and number of modules passed were found not to be influential in the model and
were excluded by the stepwise logistic regression. Several interactions between the
explanatory variables were assessed but none of them were found to be significant
and are thus not present in the model.
Table 6: Logistics regression results
Variable B S.E. Wald Sig. Exp(B)
95% C.I.for
EXP(B)
Matric points .267
.125
4.574
.032*
1.306
1.023
1.668
Matric
mathematics
mark
-.144
.037 14.882
.000*
.865
.804
.931
Constant -.489 2.828 .030 .863 .614
*-significant at the 5% level
Aungamuthu, Ramroop: Science access students

132
TABLE 7: Results of the changes in the log-likelihood if the variables are remove
Variable Model Log
Likelihood
Change in -2
Log Likelihood
df Sig. of the
Change
Step 1Matric
mathematic mark
-47.139
18.394
1
.000
Step 2
Matric points
-37.995
5.400
1
.020
Matric
mathematic mark
-46.784
22.978
1
.000
DISCUSSION
The first research question examined the association between cognitive test anxiety
and each of the independent variables (matric points, matric maths, gender, lecture
group, and number of modules passed in the June university examinations). An
independent sample t-test revealed that there was no significant difference in the
mean matric points between the high anxiety and low anxiety groups; however there
was a significant difference in the mean matric maths score between the two groups.
A chi-square test of independence found gender to be significantly associated with
cognitive test anxiety but lecture group and number of modules passed in the June
exam were not significantly related to cognitive test anxiety. This finding suggests
that some student level variables are associated with cognitive test anxiety,
specifically matric maths and gender.
The second research question investigated whether or not academic performance
in the June university examinations differed between the two cognitive test anxiety
groups. Specifically, were there any modules in which the low anxiety group
outperformed their high anxiety counterparts? An independent sample t-test
showed significant difference in mean performance between the two groups in
Chemistry, Mathematics and Physics; no significant differences were found in
Biology or Scientific Communication modules. This suggests that some content or
Journal For Educational Studies 13 (2) 2014

133
learning areas are more likely to evoke cognitive test anxiety than other learning
areas.
The third research question examined the factors that contribute to cognitive test
anxiety. A stepwise logistic regression model was applied to the data and revealed
matric maths and matric points to be significant predictors of cognitive test anxiety.
Gender, lecture group, and number of modules passed were not significant
predictors in the fitted model. This suggests that students' matric experience is
related to cognitive test anxiety. If we assume matric to be the capstone of student
school experience then this study indicates that the knowledge and learning gained
at school level is associated with student cognitive test anxiety levels. This would
underscore the importance of having access to good quality primary and secondary
school education.
The implications of this study for higher education is that modules which are
mathematical in nature or that require applications of mathematics concepts and
algorithms need to provide support mechanisms to help students manage their
cognitive test anxiety. For example, students may benefit from an emotional
intelligence workshop where anxiety coping strategies can be taught . Counselling
and support groups, where coping strategies are discussed and practised, need to
be provided for highly anxious students . Students may also benefit from study skills
workshops which teach them how to organise their study time . In addition, students
with low matric points or matric maths marks need to be supported with appropriate
academic and psychosocial interventions.
From a methodological perspective, our findings show:
·Depending on the statistical test used, a variable may be significant or not.
For example, in this study the variable gender was statistically significant
when the chi-square test was used. However, it was not significant in the
Aungamuthu, Ramroop: Science access students

134
logistic regression model. This might explain the discrepancy with regards
to the relationship between gender and cognitive test anxiety, as alluded to
in the literature review. Similarly, the variable 'matric points' was significant
in the logistic regression model but not significant in the independent
sample t-test.
·Statistical significance can be influenced by the way in which a variable is
operationalised. For example, in this study, one indicator of student
performance was the variable 'number of modules passed' which was
found not to be significantly associated with cognitive test anxiety.
However, other variables such as 'matric maths' and some of the individual
module exam marks which are also indicators of student performance,
were found to be statistically significant.
CONCLUSION AND RECOMMENDATIONS
This study examined the cognitive test anxiety (CTA) of Science Access students;
students who are from historically marginalised communities as a result of
apartheid. During conversations with students and demonstrators during tutorials,
lectures, and consultation sessions, students spoke of 'going blank' during tests and
simply feeling anxious about a test as reasons for their poor performance. The CTA
survey was administered to students and statistically analysed to explore the
extent of students' claims regarding anxiety in relation to their academic
performance.
The analysis revealed significant differences in performance between high and low
anxiety groups of students with regard to their matric mathematics marks and
gender. Statistical difference in performance between the two groups was also
found in modules that had mathematical content or that required students to apply
mathematical ideas. In addition, stepwise logistic regression revealed that students'
matric mathematics marks and matric points were associated with CTA thereby
emphasising the importance of students having access to good quality schooling.
Journal For Educational Studies 13 (2) 2014

135
The implications for higher education are that mechanisms which support students
in their management of cognitive test anxieties should be identified and provided,
especially to students who study modules with mathematical content and students
with low matric points or low marks in matric maths.
Based on the results of this study, recommendations for further research are:
·Researching techniques and support mechanisms that help students to
cope with and manage their cognitive test anxieties.
·Identifying sources of cognitive test anxiety. For example variables related
to the classroom environment, teacher attributes, and the wider university
environment need to be statistically modelled. Such information can be used
to help higher education model and manage risk behaviours such as drop-
out rates and failure.
References
ndAgresti, A. (2002). Categorical Data Analysis (2 ed.).
New York: Wiley and Sons.
Akanbi, S. T. (2013). Comparisons of Test Anxiety Level of Senior Secondary
School Students across Gender, Year of Study, School Type and Parental
Educational Background. Ife PsychologIA, 21(1), 40-54.
Akinsola, E. F., & Nwajei, A. D. (2013). Test Anxiety, Depression and Academic
Performance: Assessment and Management Using Relaxation and Cognitive
Restructuring Techniques. Psychology, 4(6A1), 18-24.
Allison, P. D. (2005). Logistic Regression using SAS: Theory and Applications.
SAS Institute Inc: Cary, NC.
Bembenutty, H. (2009). Test Anxiety and Academic Delay of Gratification.
College Student Journal, 43(1), 10-21.
Bertrams, A., Englert, C., Dickhäuser, O., & Baumeister, R. F. (2013). Role of
self-control strength in the relation between anxiety and cognitive performance.
Aungamuthu, Ramroop: Science access students

Emotion, 13(4), 668-680. doi: 10.1037/a0031921
Bonaccio, S., & Reeve, C. L. (2010). The Nature and Relative Importance of
Students' Perceptions of the Sources of Test Anxiety. Learning and Individual
Differences 20, 617-625.
Cassady, J. C., & Johnson, R. E. (2002). Cognitive Test Anxiety and Academic
Performance. Contemporary Educational Psychology, 27, 270-295.
Christiansen, I. M., & Aungamuthu, Y. (2012). Language issues, "misconceptions"
and confusion: A qualitative analysis of KZN grade 6 learners' responses on a
mathematics test. Education as Change, 16(1), 51-67.
Department of Basic Education. (2013). Diagnostic report: Annual National
Assessment 2012. Pretoria: Government Printer.
Department of Education. (2009). Ministerial Committee Report on a National
Education Evaluation and Development Unit. Government Gazette 526(32133).
Downs, C. (2010). Increasing equity and compensating historically academically
disadvantaged students at a tertiary level: benefits of a Science Foundation
Programme as a way of access. Teaching in Higher Education, 15(1), 97-107.
Edirisingha, P. (2009). Swimming in the deep-end: an e-mentoring approach to
help mature students' transition to higher education. European Journal of Open,
Distance and E-Learning,, 1, 1-9.
Eum, K., & Rice, K. G. (2011). Test anxiety, perfectionism, goal orientation, and
academic performance. [Article]. Anxiety, Stress & Coping, 24(2), 167-178. doi:
10.1080/10615806.2010.488723
Furlan, L. A., Cassady, J. C., & Perez, E. R. (2009). Adapting the Cognitive Test
Anxiety Scale for use with Argentinean University Students. International Journal
of Testing, 9, 3-19.
Hlalele, D. (2012). Exploring rural high school learners' experience of
mathematics anxiety in academic settings. South African Journal of Education,
32, 267-278. ndHosmer, D. W., & Lemeshow, S. (2000). Applied Logistic Regression (2 ed.).
136
Journal For Educational Studies 13 (2) 2014

137
New York: Wiley and Sons.
Hughes, G. (2007). Using blended learning to increase learner support and
improve retention. Teaching in Higher Education, 12(3), 349-363. .
Khalid, R., & Hasan, S. S. (2009). Test Anxiety in High and Low Achievers.
Pakistani Journal of Psychoogical Research, 24(3-4), 97-114.
Larson, H. A., & Rose, J. R. (2011). Effects of Deep Breathing and Muscle
Relaxation on ACT Scores. Eastern Education Journal, 40(1), 11-22.
Moloi, M. Q., & Chetty, M. (2010). The SACMEQ III Project in South Africa: A
Study of the Conditions of Schooling and the Quality of Education. . Pretoria:
Government Printer.
Morrow, W. (2007). Learning to teach in South Africa. Cape Town: HSRC Press.
Moseki, M., & Schulze, S. (2010). Promoting self-regulated learning to improve
achievement: A case study in higher education. Africa Education Review, 7(2),
356-375.
Mullis, I. V. S., Martin, M. O., Foy, P., & Arora, A. (2012). Timss 2011 International
Results in Mathematics. Massachusetts: TIMSS & PIRLS International Study
Center.
Nadinloyi, K. B., Sadeghi, H., Garamaleki, N. S., Rostami, H., & Hatami, G.
(2013). Efficacy of Cognitive Therapy in the Treatment of Test Anxiety. Procedia
Social and Behavioral Sciences, 84, 303-307.
Nyroos, M., & Wiklund-Hörnqvist, C. (2011). Introducing National Tests in
Swedish Primary Education: Implications for Test Anxiety. Electronic Journal of
Research in Educational Psychology, 9(3), 995-1022.
Pillay, S. (2009). Collaborative learning of Mathematics by educationally
disadvantaged students in Higher Education. MEd Unpublished, University of
KwaZulu-Natal, Durban.
Putwain, D. W., & Best, N. (2012). Do highly test anxious students respond
differentially to fear appeals made prior to a test?
Research in Education, 88, 1-10.
Aungamuthu, Ramroop: Science access students

138
Rana, R. A., & Mahmood, N. (2010). The Relationship between Test Anxiety and
Academic Achievement. [Article]. Bulletin of Education & Research, 32(2), 63-74.
Reynolds, J. (2008). Changing from a separate to a semi-integrated foundation
programme: curriculum implications. Education As Change, 12(1), 81-93.
Rollnick, M. (2010). Identifying Potential for Equitable Access to Tertiary Level
Science: Digging for Gold. New York: Springer.
Seabi, J. (2011). Relating learning strategies, self-esteem, intellectual functioning
with academic achievement among first-year engineering students. South African
Journal of Psychology, 41(2), 239-249.
Singh, I., & Jha, A. (2013). Anxiety, Optimism and Academic Achievement among
Students of Private Medical and Engineering Colleges: A Comparative Study.
Journal of Educational and Developmental Psychology, 3(1), 222-233.
Sommer, M., & Dumont, K. (2011). Psychosocial factors predicting academic
performance of students at a historically disadvantaged university. . South
African Journal of Psychology, 41(3), 386-395.
Soudien, C. (2010). Grasping the nettle? South African higher education and its
transformative imperatives. South African Journal of Higher Education, 24(5),
881-896.
Strydom, M. A. A., Pretorius, P. J., & Joubert, G. (2012). Depression and anxiety
among Grade 11 and 12 learners attending schools in central Bloemfontein.
South African Journal of Psychology, 18(3), 84-88.
Vitasari, P., Wahab, M. N. A., Othman, A., & Awang, M. G. (2010). A Research for
Identifying Study Anxiety Sources among University Students. International
Education Studies, 3(2), 189-196.
Wang, Y.-H., & Liao, H.-C. (2012). Anxiety of University Students in Taiwan about
the General English Proficiency Test. [Article]. Social Behavior & Personality: An
International Journal, 40(1), 63-74. doi: 10.2224/sbp.2012.40.1.63
Journal For Educational Studies 13 (2) 2014


