Embed Size (px)
Citation preview

DOI: 10.1542/peds.2005-0242 2005;116;e125-e144 PediatricsShipman
Evelyn P. Whitlock, Selvi B. Williams, Rachel Gold, Paula R. Smith and Scott A. for the US Preventive Services Task Force
Screening and Interventions for Childhood Overweight: A Summary of Evidence
http://www.pediatrics.org/cgi/content/full/116/1/e125located on the World Wide Web at:
The online version of this article, along with updated information and services, is
rights reserved. Print ISSN: 0031-4005. Online ISSN: 1098-4275. Grove Village, Illinois, 60007. Copyright © 2005 by the American Academy of Pediatrics. All and trademarked by the American Academy of Pediatrics, 141 Northwest Point Boulevard, Elkpublication, it has been published continuously since 1948. PEDIATRICS is owned, published, PEDIATRICS is the official journal of the American Academy of Pediatrics. A monthly
. Provided by Univ Of Arizona on May 17, 2010 www.pediatrics.orgDownloaded from

SPECIAL ARTICLE
Screening and Interventions for Childhood Overweight: A Summary ofEvidence for the US Preventive Services Task Force
Evelyn P. Whitlock, MD, MPH*‡; Selvi B. Williams, MD*‡§; Rachel Gold, PhD, MPH*‡§;Paula R. Smith, RN, BSN*‡; and Scott A. Shipman, MD, MPH‡§
ABSTRACT. Background. Childhood and adolescentoverweight and obesity are related to health risks, med-ical conditions, and increased risk of adult obesity, withits attendant effects on morbidity and mortality rates.The prevalence of childhood overweight and obesity hasmore than doubled in the past 25 years.
Purpose. This evidence synthesis examines the evi-dence for the benefits and harms of screening and earlytreatment of overweight among children and adolescentsin clinical settings.
Methods. We developed an analytic framework and 7key questions representing the logical evidence connect-ing screening and weight control interventions withchanges in overweight and behavioral, physiologic, andhealth outcomes in childhood or adulthood. We searchedthe Cochrane Library from 1996 to April 2004. Wesearched Medline, PsycINFO, DARE, and CINAHL from1966 to April 2004. One reviewer abstracted relevant in-formation from each included article into standardizedevidence tables, and a second reviewer checked key ele-ments. Two reviewers quality-graded each article withUS Preventive Services Task Force criteria.
Results. Although BMI is a measure of relativeweight rather than adiposity, it is recommended widelyfor use among children and adolescents to determineoverweight and is the currently preferred measure. Therisk of adult overweight from childhood overweight pro-vides the best available evidence to judge the clinicalvalidity of BMI as an overweight criterion for childrenand adolescents. BMI measures in childhood track toadulthood moderately or very well, with stronger track-ing seen for children with >1 obese parent and childrenwho are more overweight or older. The probability ofadult obesity (BMI of >30 kg/m2) is >50% among chil-dren >13 years of age whose BMI percentiles meet orexceed the 95th percentile for age and gender. BMI-basedoverweight categorization for individuals, particularlyfor racial/ethnic minorities with differences in body com-position, may have limited validity because BMI mea-sures cannot differentiate between increased weight forheight attributable to relatively greater fat-free mass
(muscle, bone, and fluids) and that attributable to greaterfat. No trials of screening programs to identify and totreat childhood overweight have been reported. Limitedresearch is available on effective, generalizable interven-tions for overweight children and adolescents that can beconducted in primary care settings or through primarycare referrals.
Conclusions. BMI measurements of overweight amongolder adolescents identify those at increased risk of de-veloping adult obesity. Interventions to treat overweightadolescents in clinical settings have not been shown tohave clinically significant benefits, and they are notwidely available. Screening to categorize overweightamong children under age 12 or 13 who are not clearlyoverweight may not provide reliable risk categorizationfor adult obesity. Screening in this age group is compro-mised by the fact that there is little generalizable evi-dence for primary care interventions. Because existingtrials report modest short- to medium-term improve-ments (�10–20% decrease in percentage of overweightor a few units of change in BMI), however, overweightimprovements among children and adolescents seempossible. Pediatrics 2005;116:e125–e144. URL: www.pediatrics.org/cgi/doi/10.1542/peds.2005-0242; adoles-cents, children, obesity, intervention, overweight, screen-ing.
ABBREVIATIONS. USPSTF, US Preventive Services Task Force;NHANES, National Health and Nutrition Examination Survey;CDC, Centers for Disease Control and Prevention.
Obesity/overweight has been declared an epi-demic1–3 and a “public health crisis” amongchildren worldwide4 due to an alarming in-
crease in its prevalence. Overweight among children(defined by experts as a BMI of �95th percentile forage and gender)5,6 �2 years of age has at least dou-bled in the past 25 years (Fig 1). The age- and gender-specific mean BMIs and the proportion of childrenwith BMIs of �95th percentile increased markedlyamong children from the mid-1970s to the 1990s,with almost all of this increase occurring amongchildren in the upper half of the BMI distribution.7Therefore, �50% of children appear to have “obesitysusceptibility genes” on which environmentalchanges have acted in the past 25 years.8
Because increases in mean BMI have occurred pri-marily because of increases in the upper half of theBMI distribution,7,9 weight-related health conse-quences will become increasingly common amongchildren. The health consequences of childhoodoverweight and obesity include pulmonary, ortho-pedic, gastroenterologic, neurologic, and endocrine
From the *Center for Health Research, Kaiser Permanente, Portland, Ore-gon; ‡Oregon Evidence-Based Practice Center, Portland, Oregon; and §Or-egon Health and Science University, Portland, Oregon.Accepted for publication Feb 4, 2005.doi:10.1542/peds.2005-0242The authors of this article are responsible for its contents, including anyclinical or treatment recommendations. No statement in this article shouldbe construed as an official position of the US Agency for Healthcare Re-search and Quality or the US Department of Health and Human Services.No conflict of interest declared.Address correspondence to Evelyn P. Whitlock, MD, MPH, Center forHealth Research, Kaiser Permanente, 3800 N Interstate Ave, Portland, OR97227. E-mail: [email protected] (ISSN 0031 4005). Published in the public domain by theAmerican Academy of Pediatrics.
www.pediatrics.org/cgi/doi/10.1542/peds.2005-0242 PEDIATRICS Vol. 116 No. 1 July 2005 e125. Provided by Univ Of Arizona on May 17, 2010 www.pediatrics.orgDownloaded from

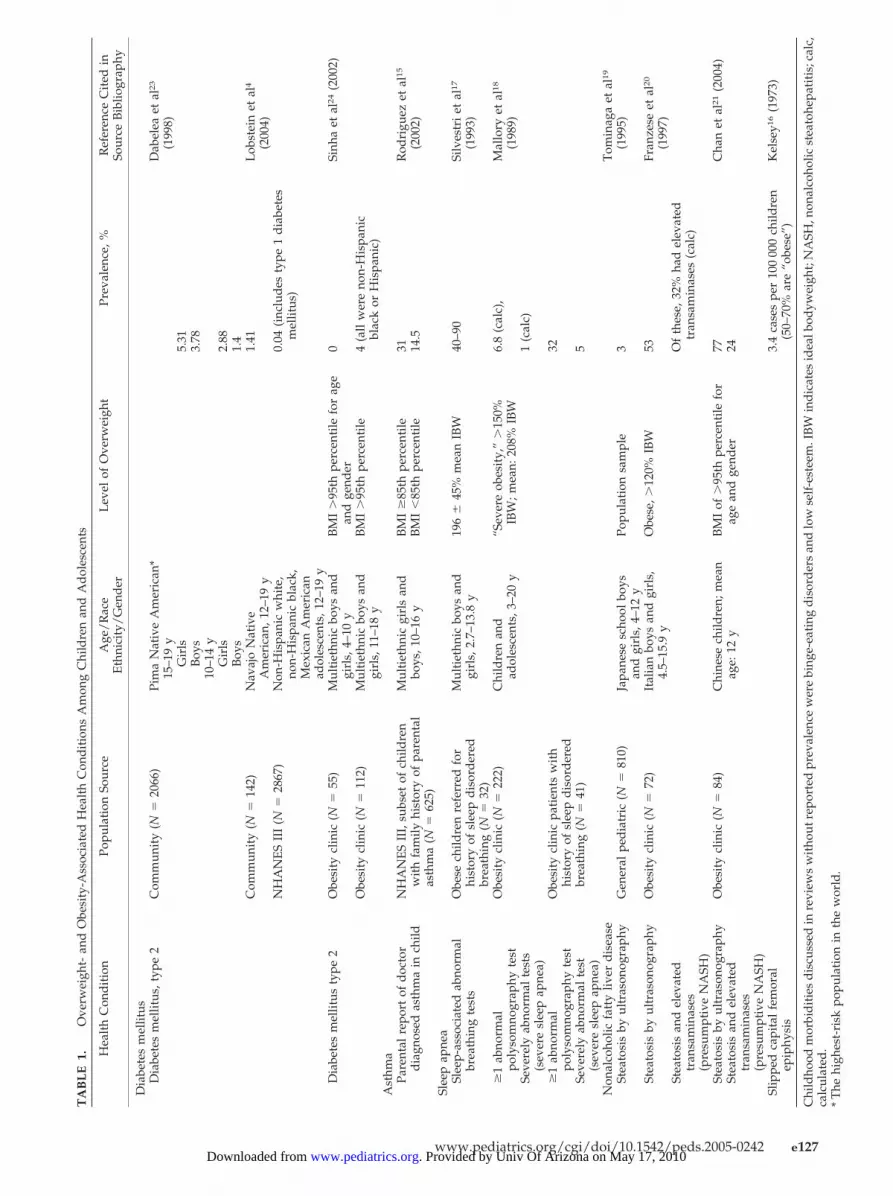
conditions and cardiovascular risk factors.4,10–15
Tables 1 and 2 contain the limited prevalence data forkey morbidities and risk factors available from recentsummaries. Rarely, severe childhood obesity is asso-ciated with immediate morbidity resulting from con-ditions such as slipped capital femoral epiphysis,16
whereas steatohepatitis and sleep apnea are morecommon.17–21 Medical conditions new to this agegroup, such as type 2 diabetes mellitus,22 represent“adult” morbidities that are now seen more fre-quently among overweight adolescents.23 Most med-ical complications, however, do not become clinicallyapparent for decades.10
Overweight is associated with a higher prevalenceof intermediate metabolic consequences and risk fac-tors, such as insulin resistance, elevated blood lipidlevels, increased blood pressure, and impaired glu-cose tolerance.24–29 Perhaps the most significantshort-term morbidities for overweight/obese chil-dren are psychosocial and include social marginal-ization, decreased self-esteem, and decreased qualityof life.30–33 Risk factors for developing childhoodoverweight include increased parental adiposity, lowparental education, social deprivation, and perhapsinfant feeding patterns, early or more rapid puberty,extreme birth weights, gestational diabetes, and var-ious social and environmental factors, such as child-hood diet and time spent in sedentary behaviors.4
The US Preventive Services Task Force (USPSTF)makes recommendations about clinical preventiveservices to assist primary care clinicians using an ex-plicit, evidence-based approach. In 1996, the USPSTFrecommended periodic height and weight measure-ments for all patients (B recommendation).34 Com-paring height and weight measures against appro-priate age and gender normative values to determineadditional evaluation, intervention, or referral wasrecommended, with BMI (�85th percentile) for ado-lescents and weight and height (or length, as appro-priate) plotted on growth charts or compared with
average weight tables for age, gender, and height foryounger children. Previously, the USPSTF has notmade separate recommendations about screening cri-teria or specific interventions for overweight or obesityin childhood populations. To assist the USPSTF inmaking its recommendation, the Oregon Evidence-Based Practice Center undertook a systematic reviewand summary of the strength of the evidence con-cerning screening and interventions for overweightin childhood populations. We combined the findingsof prior fair- or good-quality35 systematic evidencereviews with fair- to good-quality studies not cov-ered in these reviews or published subsequently.
METHODS
TerminologyBecause BMI is the primary clinical measure and is a measure
of relative weight, we adopted the use of the term “overweight”for children, as opposed to obesity.7 Considering the limitations ofBMI in defining adiposity and concerns about labeling (stigma orconcern resulting from being labeled obese), overweight is moreaccurate than obesity when the designation is based on a BMIvalue alone. Using accepted conventions, we use “overweight” todescribe those with �95th percentile BMI for age and gender and“at risk for overweight” to describe those in the 85th to 95thpercentile for age and gender.5,6
Key Questions and Analytic FrameworkWe developed an analytic framework (Fig 2) and 7 key ques-
tions, with USPSTF methods, to guide our literature search.35 Thefirst key question examined direct evidence that screening toidentify and to treat overweight among children and adolescentsimproves age-appropriate behavioral, anthropometric, or physio-logic measures. Because we found no evidence addressing this keyquestion, we searched for indirect evidence for key questions 2through 6, to estimate the benefits and harms of overweightscreening and interventions. Key question 2 concerned appropri-ate standards for overweight among children and adolescents, theoverweight prevalence based on appropriate standards, and va-lidity of clinical screening tests for predicting poorer health out-comes and obesity in adulthood. Key question 3 examined adverseeffects of screening for overweight. Key questions 4 and 5 exam-ined the efficacy of behavioral counseling, pharmacotherapeutic,and surgical interventions for improving age-appropriate anthro-
0%
5%
10%
15%
20%
1963-
1965
1966-
1970
1971-
1974
1976-
1980
1988-
1994
1999-
2002
2-5 yrs.
6-11 yrs.
12-19 yrs.
Fig 1. Overweight trends among children and adolescents.45
e126 CHILDHOOD OVERWEIGHT SCREENING AND INTERVENTIONS. Provided by Univ Of Arizona on May 17, 2010 www.pediatrics.orgDownloaded from
TA
BL
E1.
Ove
rwei
ght-
and
Obe
sity
-Ass
ocia
ted
Hea
lth
Con
dit
ions
Am
ong
Chi
ldre
nan
dA
dol
esce
nts
Hea
lth
Con
dit
ion
Popu
lati
onSo
urce
Age
/R
ace
Eth
nici
ty/
Gen
der
Lev
elof
Ove
rwei
ght
Prev
alen
ce,%
Ref
eren
ceC
ited
inSo
urce
Bib
liogr
aphy
Dia
bete
sm
ellit
usD
iabe
tes
mel
litus
,typ
e2
Com
mun
ity
(N�
2066
)Pi
ma
Nat
ive
Am
eric
an*
Dab
elea
etal
23
(199
8)15
–19
yG
irls
5.31
Boy
s3.
7810
–14
yG
irls
2.88
Boy
s1.
4C
omm
unit
y(N
�14
2)N
avaj
oN
ativ
eA
mer
ican
,12–
19y
1.41
Lob
stei
net
al4
(200
4)N
HA
NE
SII
I(N
�28
67)
Non
-His
pani
cw
hite
,no
n-H
ispa
nic
blac
k,M
exic
anA
mer
ican
adol
esce
nts,
12–1
9y
0.04
(inc
lud
esty
pe1
dia
bete
sm
ellit
us)
Dia
bete
sm
ellit
usty
pe2
Obe
sity
clin
ic(N
�55
)M
ulti
ethn
icbo
ysan
dgi
rls,
4–10
yB
MI
�95
thpe
rcen
tile
for
age
and
gend
er0
Sinh
aet
al24
(200
2)
Obe
sity
clin
ic(N
�11
2)M
ulti
ethn
icbo
ysan
dgi
rls,
11–1
8y
BM
I�
95th
perc
enti
le4
(all
wer
eno
n-H
ispa
nic
blac
kor
His
pani
c)A
sthm
aPa
rent
alre
port
ofd
octo
rN
HA
NE
SII
I,su
bset
ofch
ildre
nM
ulti
ethn
icgi
rls
and
BM
I�
85th
perc
enti
le31
Rod
rigu
ezet
al15
dia
gnos
edas
thm
ain
child
wit
hfa
mily
hist
ory
ofpa
rent
alas
thm
a(N
�62
5)bo
ys,1
0–16
yB
MI
�85
thpe
rcen
tile
14.5
(200
2)
Slee
pap
nea
Slee
p-as
soci
ated
abno
rmal
brea
thin
gte
sts
Obe
sech
ildre
nre
ferr
edfo
rhi
stor
yof
slee
pd
isor
der
edbr
eath
ing
(N�
32)
Mul
tiet
hnic
boys
and
girl
s,2.
7–13
.8y
196
�45
%m
ean
IBW
40–9
0Si
lves
tri
etal
17
(199
3)
�1
abno
rmal
poly
som
nogr
aphy
test
Obe
sity
clin
ic(N
�22
2)C
hild
ren
and
adol
esce
nts,
3–20
y“S
ever
eob
esit
y,”
�15
0%IB
W;m
ean:
208%
IBW
6.8
(cal
c),
Mal
lory
etal
18
(198
9)Se
vere
lyab
norm
alte
sts
(sev
ere
slee
pap
nea)
1(c
alc)
�1
abno
rmal
poly
som
nogr
aphy
test
Obe
sity
clin
icpa
tien
tsw
ith
hist
ory
ofsl
eep
dis
ord
ered
brea
thin
g(N
�41
)
32
Seve
rely
abno
rmal
test
(sev
ere
slee
pap
nea)
5
Non
alco
holic
fatt
yliv
erd
isea
seT
omin
aga
etal
19
(199
5)St
eato
sis
byul
tras
onog
raph
yG
ener
alpe
dia
tric
(N�
810)
Japa
nese
scho
olbo
ysan
dgi
rls,
4–12
yPo
pula
tion
sam
ple
3
Stea
tosi
sby
ultr
ason
ogra
phy
Obe
sity
clin
ic(N
�72
)It
alia
nbo
ysan
dgi
rls,
4.5–
15.9
yO
bese
,�12
0%IB
W53
Fran
zese
etal
20
(199
7)St
eato
sis
and
elev
ated
tran
sam
inas
es(p
resu
mpt
ive
NA
SH)
Of
thes
e,32
%ha
del
evat
edtr
ansa
min
ases
(cal
c)
Stea
tosi
sby
ultr
ason
ogra
phy
Obe
sity
clin
ic(N
�84
)C
hine
sech
ildre
n;m
ean
age:
12y
BM
Iof
�95
thpe
rcen
tile
for
age
and
gend
er77
Cha
net
al21
(200
4)St
eato
sis
and
elev
ated
tran
sam
inas
es(p
resu
mpt
ive
NA
SH)
24
Slip
ped
capi
tal
fem
oral
epip
hysi
s3.
4ca
ses
per
100
000
child
ren
(50–
70%
are
“obe
se”)
Kel
sey1
6(1
973)
Chi
ldho
odm
orbi
dit
ies
dis
cuss
edin
revi
ews
wit
hout
repo
rted
prev
alen
cew
ere
bing
e-ea
ting
dis
ord
ers
and
low
self
-est
eem
.IB
Win
dic
ates
idea
lbod
ywei
ght;
NA
SH,n
onal
coho
licst
eato
hepa
titi
s;ca
lc,
calc
ulat
ed.
*T
hehi
ghes
t-ri
skpo
pula
tion
inth
ew
orld
.
www.pediatrics.org/cgi/doi/10.1542/peds.2005-0242 e127. Provided by Univ Of Arizona on May 17, 2010 www.pediatrics.orgDownloaded from

TA
BL
E2.
Ove
rwei
ght-
and
Obe
sity
-Ass
ocia
ted
Ris
kFa
ctor
sfo
rC
hild
ren
and
Ad
oles
cent
s
Ris
kFa
ctor
Popu
lati
onSo
urce
Age
/R
ace
Eth
nici
ty/
Gen
der
Lev
elof
Ove
rwei
ght
(Per
cent
ileof
BM
Ifo
rA
gean
dG
end
erif
Giv
en)
Prev
alen
ce,%
Ref
eren
ceC
ited
inSo
urce
Bib
liogr
aphy
Impa
ired
gluc
ose
tole
ranc
eIm
pair
edgl
ucos
eto
lera
nce
Obe
sity
clin
ic(N
�55
)M
ulti
ethn
icbo
ysan
dgi
rls,
4–10
y�
95th
25Si
nha
etal
24(2
002)
Obe
sity
clin
ic(N
�11
2)M
ulti
ethn
icbo
ysan
dgi
rls,
11–1
8y
�95
th21
Sinh
aet
al24
(200
2)
Hyp
erin
sulin
emia
Insu
linle
vels
�95
thpe
rcen
tile
Bog
alus
aH
eart
Stud
yB
lack
and
whi
tebo
ysan
dgi
rls,
5–10
y�
95th
�4
Free
dm
anet
al25
(200
2)95
th–9
7th
10�
97th
27M
etab
olic
synd
rom
eH
yper
tens
ion,
hype
rtri
glyc
erid
emia
,lo
wH
DL
chol
este
rol,
hype
rins
ulin
emia
NH
AN
ES
Ad
oles
cent
boys
and
girl
s,12
–19
y�
85th
0.1
Coo
ket
al26
(200
3)85
th–9
5th
6.8
�95
th28
.7W
ith
�3
of:S
BP
orD
BP
�95
thpe
rcen
tile
,tri
glyc
erid
es�
95th
perc
enti
le,2
-hG
TT
�14
0m
g/d
L,
BM
Iz
scor
e�
2.0
(97t
hpe
rcen
tile
),H
DL
chol
este
rol
�5t
hpe
rcen
tile
Obe
sesa
mpl
e(N
�43
9)41
%w
hite
,31%
blac
k,27
%H
ispa
nic,
4–20
y
zsc
ore:
2–2.
538
.7W
eiss
etal
27(2
004)
zsc
ore:
�2.
549
.7ov
eral
l(3
9in
blac
ks)
Hyp
erte
nsio
nH
yper
tens
ion
Popu
lati
onba
sed
Mul
tiet
hnic
boys
and
girl
s,5–
11y
Obe
seU
pto
30Fi
guer
oa-C
olon
etal
29
(199
7)H
yper
tens
ion
Mus
cati
neH
eart
Stud
y(�
6600
)5–
18y
Com
mun
ity
dis
trib
utio
n1
(60%
ofth
ese
had
rela
tive
wei
ght
�12
0%)
Die
tz28
(199
8)
Incr
ease
dSB
Pm
easu
res
�95
thpe
rcen
tile
Bog
alus
aH
eart
Stud
yB
lack
and
whi
tebo
ysan
dgi
rls,
5–10
y�
952–
7Fr
eed
man
etal
25(2
002)
95th
–97t
h12
�97
th22
Incr
ease
dD
BP
�95
thpe
rcen
tile
Bog
alus
aH
eart
Stud
yB
lack
and
whi
tebo
ysan
dgi
rls,
5–10
y�
95th
2–7
Free
dm
anet
al25
(200
2)95
th–9
7th
9�
97th
14D
islip
idem
iaL
DL
chol
este
rol
�13
0m
g/d
LB
ogal
usa
Hea
rtSt
udy
(N�
3599
)B
lack
and
whi
tebo
ysan
dgi
rls,
5–10
y�
85th
8–10
acro
ssal
lpe
rcen
tile
sFr
eed
man
etal
25(2
002)
85th
–94t
h18
95th
–97t
h12
�97
th23
HD
Lch
oles
tero
l�
35m
g/d
LB
ogal
usa
Hea
rtSt
udy
Bla
ckan
dw
hite
boys
�85
th5–
8an
dno
nlin
ear
Free
dm
anet
al25
(200
2)(N
�35
99)
and
girl
s,5–
10y
85th
–94t
h8
95th
–97t
h7
�97
th18
TG
leve
ls�
130
mg/
dL
Bog
alus
aH
eart
Stud
y(N
�35
99)
Bla
ckan
dw
hite
boys
and
girl
s,5–
10y
�85
th2–
6Fr
eed
man
etal
25(2
002)
85th
–94t
h10
95th
–97t
h10
�97
th21
Ris
kfa
ctor
sd
iscu
ssed
inre
view
sw
itho
utre
port
edpr
eval
ence
wer
em
enst
rual
dis
ord
ers,
poly
cyst
icov
aria
nsy
ndro
me,
earl
ym
atur
atio
n(g
irls
),la
tem
atur
atio
n(b
oys)
.HD
Lin
dic
ates
high
-den
sity
lipop
rote
in;L
DL
,low
-den
sity
lipop
rote
inT
G,t
rigl
ycer
ide;
SBP,
syst
olic
bloo
dpr
essu
re;D
BP,
dia
stol
icbl
ood
pres
sure
;GT
T, �
-glu
tam
yltr
ansf
eras
e.
e128 CHILDHOOD OVERWEIGHT SCREENING AND INTERVENTIONS. Provided by Univ Of Arizona on May 17, 2010 www.pediatrics.orgDownloaded from

pometric, physiologic, and health outcomes, and key question 6addressed intervention-associated harms. The relationship be-tween intervention-associated improvements in intermediatehealth measures and decreased morbidity in childhood or adult-hood (key question 7) was examined only in the presence ofadequate evidence for intervention efficacy (key questions 4 and5). We did not examine key question 7 because of limited andinconsistent evidence for key questions 4 and 5. Review methodsare summarized below and detailed elsewhere.36
Literature Search StrategyWe developed literature search strategies and terms for each
key question and conducted 4 separate literature searches (for keyquestions 1 and 2, for key questions 4 and 5, for key question 3,and for key question 6) in Medline, PsycINFO, CINAHL, and theCochrane Library, to update the literature from previous good-quality systematic reviews (key questions 4, 5, and 6) or to exam-ine comprehensively literature from 1966 to the present (key ques-tions 1, 2, and 3). Literature searches were supplementedextensively with source material from experts in the field, bibli-ographies of included trials, and other reviews. We also conductedlimited hand-searching of pediatric obesity-focused editions ofselected journals. A single investigator reviewed abstracts. A sec-ond investigator reviewed all excluded abstracts for all key ques-tions, except key question 2. Because of this search’s large yield,we conducted blinded dual reviews for a random subset (27%),with acceptable agreement (97.5%) between reviewers. Inter-re-viewer discrepancies were resolved through consensus.
Article Review and Data AbstractionWith prespecified inclusion criteria,36 we reviewed 2162 ab-
stracts and 353 complete articles for key questions 1 and 2, 949abstracts and 198 complete articles for key questions 4 and 5, and1176 abstracts and 36 complete articles for key questions 3 and 6.We included 0 articles for key question 1, 41 articles for keyquestion 2, 0 articles for key question 3, 22 articles for key ques-tions 4 and 5, and 4 articles for key question 6. Two investigators
quality-rated all included articles and those excluded for qualityreasons, using the USPSTF criteria.35
One primary reviewer abstracted relevant information fromincluded studies into standardized evidence tables.36 To be withinthe USPSTF scope, interventions needed to be conducted in pri-mary care or be feasible for primary care conduct or referral(defined elsewhere),36 and they were categorized as pharmaceu-tical, surgical, or behavioral counseling interventions. Abstractedbehavioral counseling intervention details included setting, typeof professional delivering the intervention, parent/family partic-ipation, intervention components, number and type of contacts,and intervention duration.37 Comprehensive behavioral treat-ments were those using a combination of behavioral modification(eg, self-monitoring, stimulus control, or cognitive-behavioraltechniques), dietary modification (eg, Traffic Light Diet,38 reducedglycemic load, or reduced-fat or reduced-energy diets), and phys-ical activity components (broadly specified as aerobic, callisthenic,lifestyle, or decreased sedentary behaviors).37
Studies needed to report weight outcomes, preferably as BMI orBMI percentile changes, to be included. We also recorded allreported behavioral, physiologic, and health outcomes specifiedon our analytic framework (Fig 2).
Literature SynthesisThere were insufficient homogeneous studies for any key ques-
tion to allow quantitative synthesis. To better illustrate the studyparticipants’ degree of overweight and the treatment impact ofclinical interventions on overweight, we converted baseline mea-sures and outcomes to BMI percentiles and plotted the results onthe Centers for Disease Control and Prevention (CDC) growthcharts. Treatment effects that were typical of interventions in thisage group (10–20% reductions in percent overweight after 1 year)were modeled and plotted for 8-, 10-, and 12-year-old girls. Weplotted reported mean BMI treatment effects at �6 months for 6trials with adolescents included in our review (1 adolescent trialdid not report BMI or percent overweight outcomes). These meth-ods are described in more detail elsewhere.36 With the USPSTF
Fig 2. Screening and interventions for overweight in childhood: analytic framework and key questions (KQs).
www.pediatrics.org/cgi/doi/10.1542/peds.2005-0242 e129. Provided by Univ Of Arizona on May 17, 2010 www.pediatrics.orgDownloaded from

approach,35 we summarized the overall quality of the evidence foreach key question.
RESULTS
Key Question 1: Is There Direct Evidence ThatScreening (and Intervention) for Overweight AmongChildren/Adolescents Improves Age-AppropriateBehavioral or Physiologic Measures or HealthOutcomes?
Our searches found no studies addressing this keyquestion, and neither did examination of all individ-ual trials included in previous systematic evidencereviews.39–43
Key Question 2
Key Question 2a: What Are Appropriate Standards forOverweight Among Children/Adolescents and What Is thePrevalence of Overweight Based on These Standards?
Eight nationally representative, health examina-tion surveys that included children have been con-ducted in the United States since 1963.44,45 Thesesurveys have gathered a variety of anthropometricmeasures for a range of ages (2 months to 18 years),providing growth references46 and trend analyses ofchanges within the population over time. To provideuseful trend analyses, measures must be valid, mustbe gathered consistently in surveys, and must use asingle source for comparison. Because of these limi-tations, almost all data on prevalence and trendsamong US children are based on BMI measures cal-culated from standardized weight and height infor-mation.47
BMI measurements for an individual, or for deter-mination of population prevalence, must be com-pared with a reference population to determine theage- and gender-specific percentile ranking. Al-though multiple reference data sets to determinechildhood BMI percentiles are available, where pos-sible we used the CDC 2000 gender-specific BMIgrowth charts (for ages 2–19 years).48 Prevalence es-timates and trend information were taken primarilyfrom the National Health and Nutrition ExaminationSurvey (NHANES) program conducted from 1971 to2000, which provides the most comprehensive dataavailable on boys and girls of age 6 months through19 years, with recent over-sampling of black andMexican American children. These prevalence esti-mates use the CDC 2000 gender-specific BMI growthcharts as their reference data set to assign BMI per-centiles.
PrevalenceWith the BMI �95th percentile, overweight prev-
alence in 1999–2002 was 10% among 2- to 5-year-oldchildren and 16% among �6-year-old children49
(Fig 3). For children 2 to 5 years of age, the preva-lences were similar for all racial/ethnic subgroupsand both genders but were lower than those for olderchildren in the same racial/ethnic subgroups.Among children 6 to 11 years of age, differenceswere seen between racial/ethnic subgroups, withsignificantly more Mexican American (21.8%) andnon-Hispanic black (19.8%) children being catego-
rized as overweight, compared with non-Hispanicwhite children (13.5%) (P � .05). Gender-specific dif-ferences were also apparent, with the highest prev-alence of overweight among 6- to 11-year-old chil-dren being noted for Mexican American boys(26.5%); the prevalence was significantly higher thanthose for non-Hispanic black boys (17%), non-His-panic white boys (14%), and Mexican American girls(17.1%) and was similar to that for non-Hispanicblack girls (22.8%). Among youths 12 to 19 years ofage, significantly more non-Hispanic black (21.1%)and Mexican American (22.5%) youths had over-weight BMI measurements than did non-Hispanicwhite youths (13.7%) (P � .05), with no differencesbetween male and female youths.
Key Question 2b: What Clinical Screening Tests forOverweight in Childhood Are Reliable and Valid in PredictingObesity in Adulthood?
We found 19 fair- or good-quality, longitudinal,cohort studies (in 20 publications) that reported onBMI and other weight status measurements in child-hood and adulthood.50–69 BMI measurements inchildhood and adulthood correlated with each otheras well as, or better than, other overweight measures,such as Ponderal Index or skinfold measurements, inchildhood and adulthood correlated. Table 3 illus-trates that BMI tracking from childhood to adult-hood varies according to age.50–52,55,62,63 Single BMImeasures track reasonably well from childhood andadolescence (ages 6–18) into young adulthood (ages20–37), as evidenced by longitudinal studies show-ing low/moderate (r � 0.2–0.4) or moderate/high(0.5–0.8) correlations between childhood and adultBMI measures. Increased tracking (r � 0.6 or ele-vated odds of adult obesity) is seen for older children(after age 8),55 particularly with sexual maturity,70,71
for younger children (ages 6–12) who are more over-weight (usually above the 95th or 98th percen-tile),36,72 and for children with an obese parent.12,56
Data on tracking for children before the age of 12 arenot extensive. Gender differences in tracking are notconsistent across ages or within age categories. Lim-ited data are available comparing white and blackchildren. Table 4 illustrates the probability of adultobesity (BMI of �30 kg/m2) at various BMI percen-tiles for children of various ages, taken from ourlarger report.36 A �50% probability of adult obesityis seen generally for children �13 years of age withBMI measures of �95th percentile. Combiningyounger and older children in these analyses mayobscure the increased probability of adult obesitywith older ages of childhood overweight.
Key Question 2c: What Clinical Screening Tests forOverweight in Childhood Are Reliable and Valid for PoorHealth Outcomes in Adulthood?
Although many (n � 11) US studies50,54,57,65–67,73–77
examined the risks associated with childhood over-weight and adult outcomes, including socioeco-nomic outcomes, mortality rates, and a range ofadult cardiovascular risk factors and morbidities,studies rarely controlled for adult BMI, a criticalconfounder.36 In one study that did, the apparent
e130 CHILDHOOD OVERWEIGHT SCREENING AND INTERVENTIONS. Provided by Univ Of Arizona on May 17, 2010 www.pediatrics.orgDownloaded from

association between elevated BMI at age 10 and sev-eral elevated adult cardiovascular risk factors (totalcholesterol level, low-density lipoprotein and high-density lipoprotein cholesterol levels, insulin level,and systolic and diastolic blood pressure) in the Bo-galusa Heart Study was eliminated after controllingfor adult BMI.57
Key Question 3: Does Screening Have Adverse Effects,Such as Labeling or Unhealthy Psychological orBehavioral Consequences?
We found no direct evidence on the harms ofscreening. Potential harms include labeling, inducedself-managed dieting with its negative sequelae,poorer self-concept, poorer health habits, disorderedeating, and negative impact from parental con-cerns.5,13,32,78–84
Key Question 4: Do Interventions (BehavioralCounseling, Pharmacotherapy, or Surgery) That AreFeasible to Conduct in Primary Care Settings orAvailable for Primary Care Referral Lead to ImprovedIntermediate Behavioral or Physiologic Measures, Withor Without Weight-Related Measures?
Behavioral Counseling InterventionsThe most extensive treatment literature for child-
hood overweight involves behavioral counseling in-terventions. Behavioral counseling interventions in-clude behavioral modification, special diets, and/oractivity components delivered to children and/orparents as individuals or in groups by primary careclinicians or related health care staff members, tohelp patients adopt, change, or maintain health be-haviors affecting overweight and related outcomes.85
Fig 3. Prevalence of overweight and at risk for overweight, 1999–2002. NHW indicates non-Hispanic white; NHB, non-Hispanic black;MA, Mexican American.
www.pediatrics.org/cgi/doi/10.1542/peds.2005-0242 e131. Provided by Univ Of Arizona on May 17, 2010 www.pediatrics.orgDownloaded from

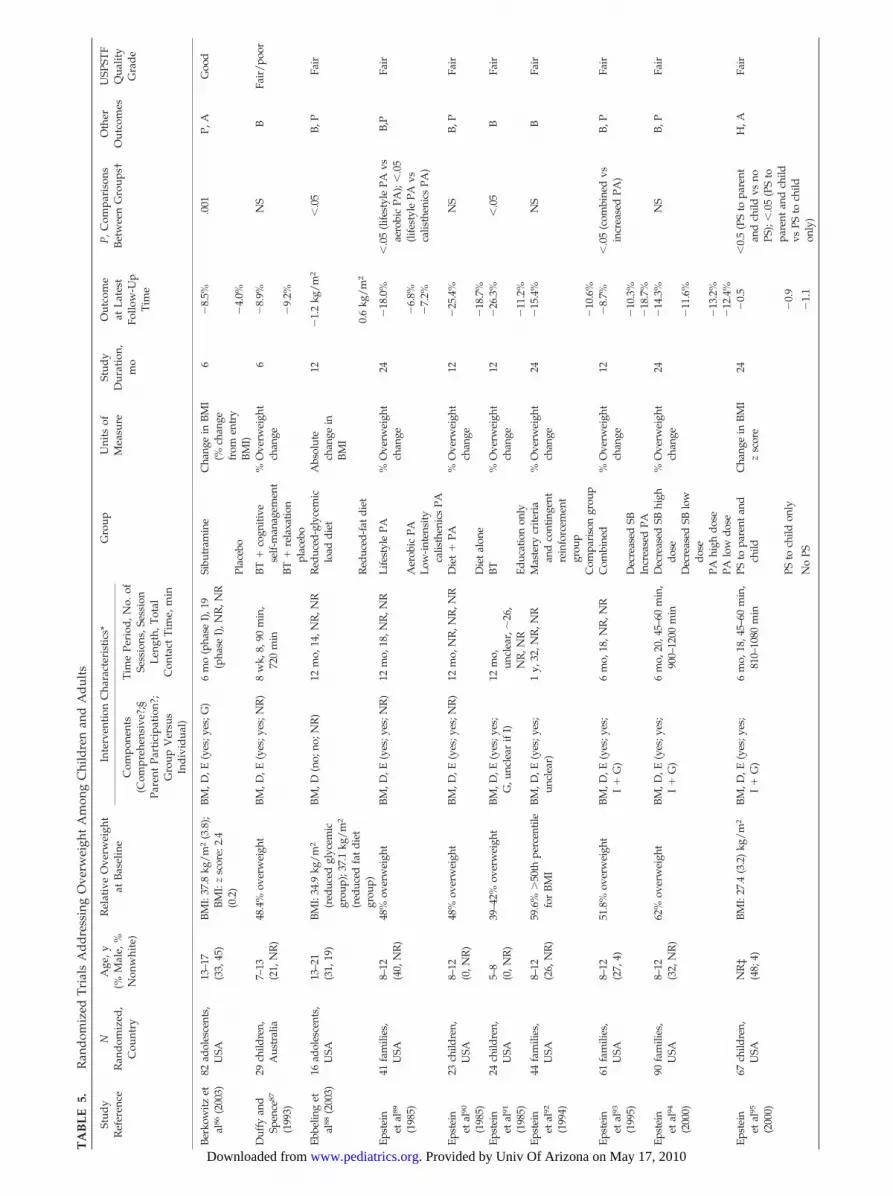
We considered all trials published since 1985 fromWestern industrialized nations (n � 22 from 23 pub-lications) that addressed interventions feasible forprimary care conduct or primary care referral (in-cluding one that combined comprehensive behav-ioral treatment with pharmacotherapy, which is de-scribed separately below) (Table 5). 86–108 We limitedour search to post-1985 trials, because of the dramaticincreases in overweight among children that oc-
curred during the 1980s and 1990s, suggesting a verydifferent treatment environment.1,8,109 A previousgood-quality, systematic review including 16 of thesetrials concluded that this behavioral counselingtreatment literature is limited, with marginal-qualitytrials involving small samples of primarily white,school-aged children receiving short-term, noncom-parable, nongeneralizable interventions.40 Thesetrials typically tested intensive, often family-based,
TABLE 3. Effects of Age and Race on the Correlation of Childhood With Young Adult BMI
Reference Population Childhood Age, y Probability
Male Female
Effect of age on correlationGuo et al55 (1994) 100% white (n � 555) 3 0.18 0.22Lauer and Clark62 (1989) 100% white (n � 109
observations)7–8 0.57 0.45
Lauer and Clark62 (1989) 100% white (n � 603observations)
9–10 0.63 0.61
Clarke and Lauer63 (1993) 100% white (n � 1286observations)
9–10 0.61 0.59
Lauer and Clark62 (1989) 100% white (n � 1018observations)
11–12 0.67 0.65
Guo et al55 (1994) 100% white (n � 555) 13 0.5 0.65Lauer and Clark62 (1989) 100% white (n � 1041
observations)13–14 0.64 0.68
Clarke and Lauer63 (1993) 100% white (n � 1104observations)
13–14 0.7 0.7
Lauer and Clarke62 (1989) 100% white (n � 615observations)
17–18 0.74 0.73
Clarke and Lauer63 (1993) 100% white (n � 631observations)
17–18 0.81 0.72
Effect of race on correlationHulman et al51 (1998) 100% black (n � 137) 13 0.37 0.37Wattigney et al52 (1995) 100% black (n � 147) 13–17 0.69 0.72Wattigney et al52 (1995) 100% white (n � 327) 13–17 0.63 0.48Freedman et al50 (2004) 67% white (n � 2212) 14–17 0.76 0.73
TABLE 4. Probability of Adult Obesity (BMI of �30 kg/m2) Based on Childhood BMI Percentile Measures at Various Ages
Study ID OverweightMeasure inChildhood,
BMIPercentile
Child’s AgeWhen
Measured, y
Adult’s AgeWhen
Measured, y
Probability ofAdult Overweight(Male and Female
Combined)
Probability ofAdult
Overweight(Male)
Probability ofAdult
Overweight(Female)
Gortmaker et al66
(1993) (n � 10 039),80% white, 14%black, 6% Hispanic51% female
�95th 16–24 23–31 0.77* 0.66*
Freedman et al57 (2001)(n � 2617), 67%white, 32% black,57% female
�50th 5–17 18–37 0.07
Freedman et al57 (2001)(as above)
85th–94th 5–17 18–37 0.51
Freedman et al57 (2001)(as above)
�95th 5–17 18–37 0.77
Guo et al58 (2002)(n � 347), 100%white, 52% female
�75th 3 35 0.1 0.14�85th 0.1 0.17�95th 0.2 0.24
Guo et al58 (2002)(as above)
�75th 8 35 0.1 0.16�85th 0.1 0.23�95th 0.2 0.46
Guo et al58 (2002)(as above)
�75th 13 35 0.2 0.16�85th 0.2 0.27�95th 0.5 0.64
Guo et al58 (2002)(as above)
�75th 18 35 0.2 0.15�85th 0.3 0.26�95th 0.8 0.68
* In this study, adult overweight was defined as �95th percentile on NHANES.
e132 CHILDHOOD OVERWEIGHT SCREENING AND INTERVENTIONS. Provided by Univ Of Arizona on May 17, 2010 www.pediatrics.orgDownloaded from
TA
BL
E5.
Ran
dom
ized
Tri
als
Ad
dre
ssin
gO
verw
eigh
tA
mon
gC
hild
ren
and
Ad
ults
Stud
yR
efer
ence
NR
and
omiz
ed,
Cou
ntry
Age
,y(%
Mal
e,%
Non
whi
te)
Rel
ativ
eO
verw
eigh
tat
Bas
elin
eIn
terv
enti
onC
hara
cter
isti
cs*
Gro
upU
nits
ofM
easu
reSt
udy
Dur
atio
n,m
o
Out
com
eat
Lat
est
Follo
w-U
pT
ime
P,C
ompa
riso
nsB
etw
een
Gro
ups†
Oth
erO
utco
mes
USP
STF
Qua
lity
Gra
de
Com
pone
nts
(Com
preh
ensi
ve?;
§Pa
rent
Part
icip
atio
n?;
Gro
upV
ersu
sIn
div
idua
l)
Tim
ePe
riod
,No.
ofSe
ssio
ns,S
essi
onL
engt
h,T
otal
Con
tact
Tim
e,m
in
Berk
owitz
etal
86(2
003)
82ad
oles
cent
s,U
SA13
–17
(33,
45)
BMI:
37.8
kg/m
2(3
.8);
BMI:
zsc
ore:
2.4
(0.2
)
BM,D
,E(y
es;y
es;G
)6
mo
(pha
seI)
,19
(pha
seI)
,NR
,NR
Sibu
tram
ine
Cha
nge
inBM
I(%
chan
gefr
omen
try
BMI)
6�
8.5%
.001
P,A
Goo
d
Plac
ebo
�4.
0%
Duf
fyan
dSp
ence
87
(199
3)
29ch
ildre
n,A
ustr
alia
7–13
(21,
NR
)48
.4%
over
wei
ght
BM,D
,E(y
es;y
es;N
R)
8w
k,8,
90m
in,
720
min
BT�
cogn
itive
self-
man
agem
ent
%O
verw
eigh
tch
ange
6�
8.9%
NS
BFa
ir/p
oor
BT�
rela
xatio
npl
aceb
o�
9.2%
Ebbe
ling
etal
88(2
003)
16ad
oles
cent
s,U
SA13
–21
(31,
19)
BMI:
34.9
kg/m
2
(red
uced
glyc
emic
grou
p);3
7.1
kg/m
2
(red
uced
fat
diet
grou
p)
BM,D
(no;
no;N
R)
12m
o,14
,NR
,NR
Red
uced
-gly
cem
iclo
addi
etA
bsol
ute
chan
gein
BMI
12�
1.2
kg/m
2�
.05
B,P
Fair
Red
uced
-fat
diet
0.6
kg/m
2
Epst
ein
etal
89
(198
5)
41fa
mili
es,
USA
8–12
(40,
NR
)48
%ov
erw
eigh
tBM
,D,E
(yes
;yes
;NR
)12
mo,
18,N
R,N
RLi
fest
yle
PA%
Ove
rwei
ght
chan
ge24
�18
.0%
�.0
5(li
fest
yle
PAvs
aero
bic
PA);
�.0
5(li
fest
yle
PAvs
calis
then
ics
PA)
B,P
Fair
Aer
obic
PA�
6.8%
Low
-inte
nsity
calis
then
ics
PA�
7.2%
Epst
ein
etal
90
(198
5)
23ch
ildre
n,U
SA8–
12(0
,NR
)48
%ov
erw
eigh
tBM
,D,E
(yes
;yes
;NR
)12
mo,
NR
,NR
,NR
Die
t�
PA%
Ove
rwei
ght
chan
ge12
�25
.4%
NS
B,P
Fair
Die
tal
one
�18
.7%
Epst
ein
etal
91
(198
5)
24ch
ildre
n,U
SA5–
8(0
,NR
)39
–42%
over
wei
ght
BM,D
,E(y
es;y
es;
G,u
ncle
arif
I)12
mo,
uncl
ear,
�26
,N
R,N
R
BT%
Ove
rwei
ght
chan
ge12
�26
.3%
�.0
5B
Fair
Educ
atio
non
ly�
11.2
%Ep
stei
net
al92
(199
4)
44fa
mili
es,
USA
8–12
(26,
NR
)59
.6%
�50
thpe
rcen
tile
for
BMI
BM,D
,E(y
es;y
es;
uncl
ear)
1y,
32,N
R,N
RM
aste
rycr
iteri
aan
dco
ntin
gent
rein
forc
emen
tgr
oup
%O
verw
eigh
tch
ange
24�
15.4
%N
SB
Fair
Com
pari
son
grou
p�
10.6
%Ep
stei
net
al93
(199
5)
61fa
mili
es,
USA
8–12
(27,
4)51
.8%
over
wei
ght
BM,D
,E(y
es;y
es;
I�
G)
6m
o,18
,NR
,NR
Com
bine
d%
Ove
rwei
ght
chan
ge12
�8.
7%�
.05
(com
bine
dvs
incr
ease
dPA
)B,
PFa
ir
Dec
reas
edSB
�10
.3%
Incr
ease
dPA
�18
.7%
Epst
ein
etal
94
(200
0)
90fa
mili
es,
USA
8–12
(32,
NR
)62
%ov
erw
eigh
tBM
,D,E
(yes
;yes
;I
�G
)6
mo,
20,4
5–60
min
,90
0–12
00m
inD
ecre
ased
SBhi
ghdo
se%
Ove
rwei
ght
chan
ge24
�14
.3%
NS
B,P
Fair
Dec
reas
edSB
low
dose
�11
.6%
PAhi
ghdo
se�
13.2
%PA
low
dose
�12
.4%
Epst
ein
etal
95
(200
0)
67ch
ildre
n,U
SAN
R‡
(48;
4)BM
I:27
.4(3
.2)
kg/m
2BM
,D,E
(yes
;yes
;I
�G
)6
mo,
18,4
5–60
min
,81
0–10
80m
inPS
topa
rent
and
child
Cha
nge
inBM
Iz
scor
e24
�0.
5�
0.5
(PS
topa
rent
and
child
vsno
PS);
�.0
5(P
Sto
pare
ntan
dch
ildvs
PSto
child
only
)
H,A
Fair
PSto
child
only
�0.
9
No
PS�
1.1
. Provided by Univ Of Arizona on May 17, 2010 www.pediatrics.orgDownloaded from

TA
BL
E5.
Con
tinu
ed
Stud
yR
efer
ence
NR
and
omiz
ed,
Cou
ntry
Age
,y(%
Mal
e,%
Non
whi
te)
Rel
ativ
eO
verw
eigh
tat
Bas
elin
eIn
terv
enti
onC
hara
cter
isti
cs*
Gro
upU
nits
ofM
easu
reSt
udy
Dur
atio
n,m
o
Out
com
eat
Lat
est
Follo
w-U
pT
ime
P,C
ompa
riso
nsB
etw
een
Gro
ups†
Oth
erO
utco
mes
USP
STF
Qua
lity
Gra
de
Com
pone
nts
(Com
preh
ensi
ve?;
§Pa
rent
Part
icip
atio
n?;
Gro
upV
ersu
sIn
div
idua
l)
Tim
ePe
riod
,No.
ofSe
ssio
ns,S
essi
onL
engt
h,T
otal
Con
tact
Tim
e,m
in
Epst
ein
etal
96
(200
1)
67fa
mili
es,
USA
8–12
(52,
NR
)60
.2%
over
wei
ght
(com
pare
dw
ith50
thpe
rcen
tile
BMI
for
age
and
gend
er);
BMI:
27.4
kg/m
2
(3.6
kg/m
2 )
BM,D
,E(y
es;y
es:I
�G
)6
mo,
20,3
0m
in,
600
min
Incr
ease
dPA
Cha
nge
inab
solu
teBM
I(s
tatis
tical
com
pari
sons
,do
neon
%ov
erw
eigh
tch
ange
)
12G
irls
;�0.
27kg
/m2 ;
boys
;�
0.65
kg/m
2
�.0
1(in
tera
ctio
nof
grou
pby
gend
er);
�.0
01(b
oys
inco
mbi
ned
grou
pvs
girl
sin
com
bine
dgr
oup)
;�
.05
(boy
sin
com
bine
dgr
oup
vsgi
rls
inin
crea
sed
PAgr
oup)
Non
eFa
ir
Com
bine
din
crea
sed
PA�
decr
ease
dSB
Gir
ls:1
.0kg
/m
2 ;bo
ys:
�1.
76kg
/m2
Flod
mar
ket
al97
(199
3)44
child
ren,
(plu
s50
mat
ched
cont
rol
subj
ects
),Sw
eden
10–1
1(4
8,N
R)
24.7
kg/m
2(f
amily
ther
apy
grou
p);
25.5
kg/m
2
(con
vent
iona
ltr
eatm
ent
grou
p);
25.1
kg/m
2(c
ontr
olgr
oup)
D,E
(no;
yes;
I)14
–18
mo,
5(�
6fa
mily
ther
apy
sess
ions
),N
R,N
R
Fam
ilyth
erap
yC
hang
ein
BMI
26–3
01.
1kg
/m2
�.0
5(f
amily
ther
apy
vsun
trea
ted
cont
rols
ubje
cts)
PFa
ir
Con
vent
iona
ltr
eatm
ent
1.6
kg/m
2
Mat
ched
cont
rol
subj
ects
,un
trea
ted
2.8
kg/m
2
Gol
anet
al98
(199
8)60
child
ren,
Isra
el6–
11(3
8,N
R)
39.1
%ov
erw
eigh
t(c
onve
ntio
nal
grou
p);3
9.6%
(par
ents
agen
tsof
chan
gegr
oup)
BM,D
,E(y
es;n
o*;G
�I)
1y,
30,6
0m
in,
1800
min
Con
vent
iona
l:ch
ildre
nre
spon
sibl
efo
row
nw
eigh
tlo
ss
%O
verw
eigh
tch
ange
12�
8.1%
�.0
5N
one
Fair
Pare
nts
excl
usiv
eag
ents
ofch
ange
�14
.7%
Gra
ves
etal
99
(198
8)
40ch
ildre
n,U
SA6–
12(N
R,N
R)
52–5
6%ov
erw
eigh
tBM
,D,E
(yes
;yes
;G)
8w
k,8,
60m
in,
480
min
BT�
pare
ntPS
%O
verw
eigh
tch
ange
6�
24.5
%�
.05
(PS
vsBT
only
);�
.05
(PS
vsin
stru
ctio
non
ly)
BFa
irBT
only
�10
.2%
Inst
ruct
ion
only
�9.
5%Is
rael
etal
100
(198
5)33
child
ren,
USA
8–12
(30,
NR
)45
.88%
over
wei
ght
(par
ent
trai
ning
grou
p),5
3.13
%(B
Ton
ly),
56.0
2%(c
ontr
olsu
bjec
ts)
BM,D
,E(y
es;y
es;G
)12
mo,
17,2
60-m
inse
ssio
ns,�
930
min
BT�
pare
nttr
aini
ngin
child
man
agem
ent
%O
verw
eigh
tch
ange
12�
10.2
%�
.001
BFa
ir/p
oor
BTon
ly�
1.3%
Wai
t-lis
tco
ntro
lsu
bjec
tsN
R
Isra
elet
al10
1
(199
4)36
fam
ilies
,U
SA8–
13(N
R,N
R)
48.1
%ov
erw
eigh
t(e
nhan
ced
child
invo
lvem
ent
grou
p),4
6.0%
(sta
ndar
dtr
eatm
ent
grou
p)
BM,D
,E(y
es;y
es;G
)26
wk,
17,9
0m
in,
1530
min
Enha
nced
child
invo
lvem
ent
%O
verw
eigh
tch
ange
36�
4.8%
NS
Non
eFa
ir/p
oor
Stan
dard
trea
tmen
t(p
aren
tspr
imar
ilyre
spon
sibl
e)
6.4%
Kan
get
al10
3
(200
2)/
Gut
inet
al10
2
(200
2)
80ad
oles
cent
s,U
SA13
–16
(33,
69)
40.7
%bo
dyfa
t(w
hite
boys
),45
.8%
body
fat(
whi
tegi
rls)
,43
.9%
body
fat
(bla
ckbo
ys),
45.2
%bo
dyfa
t(bl
ack
girl
s)
BM,E
(no;
no;G
)8
mo,
160,
60m
info
rLS
E,va
riab
lefo
rPA
NR
LSE
�hi
ghin
tens
ityPA
Cha
nge
in%
body
fat
8�
2.9%
NS
B,P
Fair
/poo
r
LSE
�m
oder
ate
PA�
1.4%
LSE
�0.
1%
. Provided by Univ Of Arizona on May 17, 2010 www.pediatrics.orgDownloaded from

TA
BL
E5.
Con
tinu
ed
Stud
yR
efer
ence
NR
and
omiz
ed,
Cou
ntry
Age
,y(%
Mal
e,%
Non
whi
te)
Rel
ativ
eO
verw
eigh
tat
Bas
elin
eIn
terv
enti
onC
hara
cter
isti
cs*
Gro
upU
nits
ofM
easu
reSt
udy
Dur
atio
n,m
o
Out
com
eat
Lat
est
Follo
w-U
pT
ime
P,C
ompa
riso
nsB
etw
een
Gro
ups†
Oth
erO
utco
mes
USP
STF
Qua
lity
Gra
de
Com
pone
nts
(Com
preh
ensi
ve?;
§Pa
rent
Part
icip
atio
n?;
Gro
upV
ersu
sIn
div
idua
l)
Tim
ePe
riod
,No.
ofSe
ssio
ns,S
essi
onL
engt
h,T
otal
Con
tact
Tim
e,m
in
Mel
lin etal
104
(198
7)
66ad
oles
cent
s,U
SA12
–18
(21,
22)
30–3
7%ov
erw
eigh
tBM
,D,E
(yes
;yes
;G)
14w
k,16
,90
min
,14
40m
inSH
APE
DO
WN
grou
p(c
ogni
tive,
beha
vior
al,
affe
ctiv
etr
eatm
ent)
%O
verw
eigh
tch
ange
15�
9.9%
NR
(bet
wee
n-gr
oup
com
pari
son;
15m
ovs
base
line:
�.0
1,SH
APE
DO
WN
;N
S,co
ntro
lgr
oup)
B,H
Fair
No
trea
tmen
t,co
ntro
lsub
ject
s�
0.1%
Sael
ens
etal
105
(200
2)
44ad
oles
cent
s,U
SA12
–16
(59,
30)
BMI:
30.7
(3.1
)kg
/m2
BM,D
,E(y
es;n
o;1)
4m
o,13
,10–
20m
in,
�20
0m
inH
ealth
yha
bits
inte
rven
tion
%O
verw
eigh
tch
ange
and
chan
gein
BMI
(sta
tistic
alan
alys
eson
BMI
zsc
ores
)
7�
2.4%
,0.
1kg
/m2
NS
B,A
Goo
d
Typi
calc
are
4.1%
,1.
4kg
/m2
Sene
diak
and
Spen
ce10
6
(198
5)
45ch
ildre
n,U
SA6–
13(�
66,N
R)
37.2
2%ov
erw
eigh
tBM
,D,E
(yes
;yes
;G)
4w
k,8,
90m
in,
720
min
Rap
id-s
ched
ule
BT%
Ove
rwei
ght
chan
ge6
�14
.7%
�.0
5(r
apid
and
grad
uals
ched
ule
BTgr
oups
com
bine
dvs
nons
peci
ficco
ntro
lsub
ject
s);
NS
(com
pari
son
ofra
pid
vsgr
adua
lsch
edul
eBT
grou
ps)
BFa
ir/p
oor
Gra
dual
lyde
crea
sing
sche
dule
BT
�18
.3%
Non
spec
ific
trea
tmen
t,co
ntro
lsub
ject
s
�10
.9%
Wai
t-lis
tco
ntro
lsu
bjec
tsN
R
Wad
den
etal
107
(199
0)
47gi
rls,
USA
12–1
6(0
,100
[all
blac
k])
95.1
kg;B
MI:
35.6
kg/m
2
BM,D
,E(y
es;y
es;G
)10
mo,
22,6
0m
in(f
irst
16se
ssio
ns),
othe
rsN
R,�
960
min
Mot
her
and
child
toge
ther
Cha
nge
inw
eigh
t6
1.7
kgN
SP,
HFa
ir/p
oor
Chi
ldal
one
3.0
kgM
othe
ran
dch
ildse
para
te3.
5kg
Whi
te10
8
(200
3)/
Will
iam
son,
unpu
blis
hed
data
57ad
oles
cent
s,U
SA11
–15
(0,1
00)
BMI:
36.3
4kg
/m2 ;
98.3
BMI
perc
entil
eBM
,D,E
(yes
;yes
:I)
6m
o,4
and
wee
kly
Web
-site
logi
ns,
NR
,NR
Beha
vior
alC
hang
ein
%bo
dyfa
t,ch
ange
inBM
I
6�
1.12
%;�
0.19
kg/m
2
�.0
5(%
body
fat)
;�
.05
(cha
nge
inBM
I)
BG
ood
Educ
atio
non
ly0.
43%
;0.6
5kg
/m
2
NH
Sin
dic
ates
Nat
iona
lHea
lth
Serv
ice;
NS,
nots
igni
fica
nt;B
M,b
ehav
ior
mod
ific
atio
n;D
,spe
cial
die
t;E
,exe
rcis
epr
ogra
m;G
,gro
up;I
,ind
ivid
ual;
othe
rou
tcom
es:B
,beh
avio
ral;
P,ph
ysio
logi
c;H
,chi
ldho
odhe
alth
outc
omes
;A,a
dve
rse
effe
cts;
NR
,not
repo
rted
;LSE
,lif
esty
leed
ucat
ion;
BT
,beh
avio
ral
ther
apy;
TC
,tot
alch
oles
tero
l;SB
,sed
enta
rybe
havi
or;P
A,p
hysi
cal
acti
vity
;PS,
prob
lem
solv
ing.
*Fo
rm
ost
inte
nsiv
ein
terv
enti
on,w
hich
islis
ted
firs
t.†
Ifm
ulti
ple
com
pari
sons
,the
npr
esen
ted
only
ifP
�.0
5.‡
The
actu
alnu
mbe
rw
asno
tre
port
ed;t
hem
ean
(SD
)w
as10
.3(1
.1)
year
s.§
Inte
rven
tion
that
uses
aco
mbi
nati
onof
beha
vior
mod
ific
atio
npr
oced
ures
,asp
ecia
ld
iet,
and
anex
erci
sepr
ogra
m.
. Provided by Univ Of Arizona on May 17, 2010 www.pediatrics.orgDownloaded from

interventions conducted in specialty obesity clinicsettings to address overweight among school-agedchildren who were �40% to 50% above ideal weight.Figure 4 models the short-term (1-year) results fromthese types of studies, translated to BMI percentiles.
Figure 5 demonstrates results from all behavioralcounseling studies among adolescents86,88,104,105,107,108
that reported, or could be translated into, BMI per-centiles. Most studies addressed extremely over-weight patients, with short-term results showingmodest to no change in BMI percentiles. Only 2good-quality studies among adolescents were partic-ularly relevant to primary care.105,108
One short-term, primary care-conducted trial thatused a computer-based approach to generate tai-lored plans for counseling obese (above the adult
BMI cutoff of 30 kg/m2) adolescents (12–16 years ofage) showed small but significant improvements105
(Fig 5). An Internet-based, short-term trial targeting57 overweight (mean BMI: 36.37 kg/m2), non-His-panic black, female youths (11–15 years of age) with�1 obese biological parent resulted in statisticallysignificant differences in weight and BMI.108 Al-though both trials showed small but statistically sig-nificant benefits in BMI measures at 6 to 12 months,it is not clear that these BMI changes would haveclinical benefits.
Considering other intermediate outcomes in addi-tion to weight, more than one half (n � 13) of fair-or good-quality trials86,88–94,97,99,104,105,108 reportedintermediate behavioral (n � 11) or physiologic (n �7) measures (Table 5). Two good-quality trials105,108
Fig 4. Modeled effects of behavioral weight loss treatment on BMI among children 8 to 13 years of age, using CDC US growth charts(BMI-for-age percentiles for girls 2–20 years of age). Large black circles indicate the mean BMI of study participants at a given age at thetime of entry into a typical behavioral counseling weight loss trial. The bracket to the right of each circle indicates the typical range of meanparticipant BMI values 1 year after trial entry. Top and bottom bars of brackets indicate 10% and 20% reductions in percent overweight(converted to BMI), respectively, which was the typical range of weight lost. Source: National Center for Health Statistics in collaborationwith the National Center for Chronic Disease Prevention and Health Promotion, 2000.
e136 CHILDHOOD OVERWEIGHT SCREENING AND INTERVENTIONS. Provided by Univ Of Arizona on May 17, 2010 www.pediatrics.orgDownloaded from

reported behavioral changes but no physiologic out-comes. Although one108 indicated reduced total dailyenergy intake in the active treatment group, neitherindicated changes in physical activity. One fair-qual-ity study reported reductions in targeted dietarycomponents (fat or glycemic load of diet), but notenergy,88 whereas other fair-quality studies89–94,99,104
measured changes in eating behaviors, physical ac-tivity, and sedentary behaviors but did not provide aclear picture because of differences in subjects, inter-ventions, and measures.
No good-quality trials of behavioral treatment re-ported intermediate physiologic outcomes, such aslipid or lipoprotein levels, glucose tolerance, orblood pressure, or physical fitness measures. Onlyone trial of at least fair quality reported intermediate
physiologic measures. An intensive, 6-month, behav-ioral, weight control program comparing a reduced-glycemic load diet with a reduced-fat diet increasedinsulin resistance scores (measured with the homeo-static model) significantly less in the reduced-glyce-mic load diet group than the reduced-fat diet group(�0.4 � 0.9 vs 2.6 � 1.2, P � .03).88 Insulin resistanceincreases with sexual maturation, however, whichwas not assessed. These results are also limited bybaseline differences between groups and lack of con-sideration of physical activity as a confounder.Among the fair-quality studies that measured phys-ical work capacity or physical fitness, most reportedsome improvement when physical activity or seden-tary behaviors were addressed in the interven-tion.89,90,93,94
Fig 5. Effects of behavioral weight loss treatment on BMI among adolescents, using CDC US growth charts (BMI-for-age percentiles forgirls 2–20 years of age). Boxes represent mean BMI at entry for each behavioral counseling intervention trial. The white box indicates astudy of behavioral counseling plus sibutramine. Numbers inside boxes identify studies in the reference list. Arrows indicate the meanchange in BMI at study follow-up assessment 6 months or later. No arrow indicates that the mean BMI for the treatment group did notchange significantly. Source: National Center for Health Statistics in collaboration with the National Center for Chronic DiseasePrevention and Health Promotion, 2000.
www.pediatrics.org/cgi/doi/10.1542/peds.2005-0242 e137. Provided by Univ Of Arizona on May 17, 2010 www.pediatrics.orgDownloaded from

PharmacotherapyOne randomized, placebo-controlled trial of sib-
utramine within a comprehensive behavioral treat-ment program for adolescents showed superiorweight change outcomes after 6 months (4.6-kggreater weight loss; 95% CI: 2.0–7.4 kg) in an intent-to-treat analysis86 (Fig 5). With continued use, weightloss at 6 months was maintained through 12 months.It is not clear whether the additional short-termweight change achieved with the addition of sibutra-mine to a comprehensive behavioral treatment pro-gram among adolescents86 would provide a net ben-efit, because changes in serum lipid levels, seruminsulin levels, serum glucose levels, and homeostaticmodel of insulin sensitivity values did not differbetween groups. Among all trial completers (63–76%of all participants) at 12 months, significant improve-ments from baseline were seen in high-density li-poprotein cholesterol levels, serum insulin levels,and homeostatic model of insulin sensitivity values.Blood pressure was not improved, and in some casesincreased blood pressure was a reason for discontin-uation. The rate of adverse effects and discontinua-tion was fairly high (12% discontinued and 28% re-duced the medication) (see also key question 6). Wefound no evidence for metformin use for weightloss/disease prevention among normoglycemicobese adolescents with weight outcomes after �3months, nor did we find acceptable evidence on al-ternative or complementary therapies.
SurgeryNo acceptable quality evidence is available for
adolescents, evaluating surgical approaches to over-weight. There are no controlled treatment outcomedata on bariatric surgery approaches among adoles-cents.
Key Question 5: Do Interventions Lead to ImprovedAdult Health Outcomes, Reduced Childhood MorbidityRates, and/or Improved Psychosocial and FunctionalChildhood Outcomes?
Few (n � 3) studies reported health outcomes asdefined in our analytic framework,94,104,107 and only2 were rated at least fair quality (Table 5). In onefair-quality trial, depression scores measured withreliable and valid instruments showed improvementfrom baseline among treated adolescent girls but notcontrol subjects, whereas reliably measured self-es-teem scores improved from baseline in bothgroups.104 In a second fair-quality study, signifi-cantly fewer children 8 to 12 years of age, receivingcomprehensive behavioral treatment, had elevatedtotal behavior problem scores or elevated internaliz-ing behavior problem scores at the 24-month fol-low-up assessment than at baseline.95
Key Question 6: Do Interventions Have AdverseEffects, Such as Stigmatization, Binging or PurgingBehaviors, Eating Disorders, Suppressed Growth, orExercise-Induced Injuries?
Behavioral Counseling InterventionsAdverse effect reporting for behavioral counseling
interventions was limited to 3 of 22 intervention
trials. Potential eating problems or weight manage-ment behaviors were the only harms addressed in2 trials. One good-quality trial reported no adverseeffects on problematic eating (using validated mea-sures for dietary restraint, eating disinhibition, prob-lematic weight management behaviors, weight con-cerns, and eating disorder psychopathologic features)after primary care-based comprehensive behavioraltreatment for 37 of 44 adolescent trial completers.105
One fair-quality trial reported no effect on eatingdisorder symptoms, weight dissatisfaction, or purg-ing/restricting behaviors among 47 children 8 to12 years of age in a family-based comprehensivebehavioral treatment program, using a reliable mea-sure (Kids’ Eating Disorder Survey).95,110 Differencesbetween boys (no effect) and girls (elevated totalscores) were not significant but may be revealed instudies with larger sample sizes.
PharmacotherapyIn the placebo-controlled phase of the sibutramine
trial,86 44% of patients (19 of 43 patients) in the activemedication group reduced or discontinued the med-ication because of elevated blood pressure, pulserate, or both, which were the main adverse eventsreported.
SurgeryWe attempted to estimate the rate of harms from
the uncontrolled cohort literature, but loss to fol-low-up monitoring (25–60% at 4–24 months)111–113
and inadequate reporting prevented us from makingreasonable estimates of surgery-associated harms.
Summary of Evidence QualityTable 6 summarizes the overall quality of evi-
dence, according to USPSTF criteria,35 for each keyquestion addressed in this review (see Appendix).The overall evidence is poor for the direct effects ofscreening (and intervention) programs (key question1), screening harms (key question 3), and bariatricsurgery (key questions 4 and 5). The overall evidenceis fair/poor for behavioral counseling interventions(key questions 4 and 5), because of small, noncom-parable, short-term studies with limited generaliz-ability that reported health or intermediate out-comes, such as cardiovascular risk factors, rarely.Trials are particularly inadequate for nonwhite sub-jects and children 2 to 5 years of age. Fair/poorevidence is available for behavioral counseling inter-vention harms because of very limited reporting (keyquestion 6). Fair evidence supports childhood BMIas a risk factor for adult overweight, although dataare limited for nonwhite subjects (key question 2b),and data addressing BMI as a risk factor for adultmorbidities generally do not control for confoundingby adult BMI (key question 2c). Good evidence isavailable for overweight prevalence based on BMImeasures in all groups, except Native American andAsian groups (key question 2a).
CONCLUSIONSOverweight has at least doubled among children
and adolescents in the United States in the past 25
e138 CHILDHOOD OVERWEIGHT SCREENING AND INTERVENTIONS. Provided by Univ Of Arizona on May 17, 2010 www.pediatrics.orgDownloaded from

years and is particularly common among racial/ethnic minorities. This increase represents a majorpublic health concern, with the potential for futurehealth risks and growing burdens on the health caresystem. In terms of evidence, however, little haschanged since a 1998 Journal of Pediatrics editorialconcluded that, “In the case of obesity, the primarycare physician is left in the uncomfortable (but famil-iar) position of needing to do something now for thepatient and family seeking help, regardless of theuncertainty about the nature of the disease and theabsence of a cure.”114 Given the nature of the prob-lem, effective solutions will likely require substantialcollaboration between the medical and public healthcommunities.115 Greater understanding of how toexpand the appropriate role of clinicians in commu-nity public health, such as through advocating nec-essary environmental and political changes, wouldbe helpful.116,117
A major limitation for clinicians addressing over-weight among children, most of whom are not mor-bidly overweight, is the uncertain criteria for deter-mining clinically significant overweight. AlthoughBMI is the best clinically available measure of over-weight, uncertainty in its application to individualpatients remains, because of limited knowledge ofthe current and future health effects of BMI and thepossible limits in the applicability of current BMIcutoff points, particularly for minority race/ethnic-ity. Understanding normal variations in body com-position with age, gender, race/ethnicity, sexual ma-turity, and other factors will be critical for definingaccurately unhealthy excess fat or other componentsof overweight, and appropriate measurement meth-ods. Similarly, as has been done elsewhere, examin-ing the sensitivity and specificity of BMI percentilecutoff values for identifying overweight children,with large representative samples of US children ofall ages and races/ethnicities, would increase ourunderstanding of BMI as a screening tool.118
The risk for overweight children becoming over-weight or obese adults has been judged as the best
available criterion to judge the clinical validity ofBMI in the pediatric age group.119 Adult BMI hasbeen associated clearly with morbidity and mortalityrates, particularly at higher BMI levels, althoughthere is no single threshold for increased healthrisks.120 Adolescents in �95th percentile for age- andgender-specific BMI clearly have an increased prob-ability of adult obesity, and early interventions couldbe very beneficial. Recent intervention research tar-geting this age group primarily addressed subjectswho were very overweight, with some studies show-ing short-term (6–12-month) weight-related im-provements. The treatment evidence in this agegroup could be strengthened with larger trials test-ing generalizable interventions that can demonstratesustained effects on overweight status and weight-related outcomes. Many trials among adolescentshave targeted minorities specifically107,108 or enrolledreasonable proportions in their studies,86,102,105 andthis should continue. Trials among mildly over-weight adolescents, as well as those more severelyaffected, are needed. With limited to no evidenceavailable, experts agree that surgical approachesshould be considered only for adolescents with ex-treme morbid obesity, and pharmacologic ap-proaches should be limited to a second-tier approachafter failed behavioral counseling.111,121
In contrast, current data suggest that a substantialproportion of children under age 12 or 13, even withBMIs of �95th percentile, will not develop adultobesity. Children 8 to 12 years of age have been themost well studied for behavioral overweight treat-ment, but we still have very limited informationabout interventions that would be applicable to pri-mary care. No current, randomized, controlled trialof clinical interventions of any type is available forchildren 2 to 5 years of age.
For all ages, there is very limited evidence forbehavioral or other overweight treatment that is fea-sible for primary care delivery or referral. Few stud-ies have taken place in primary care setting; mosthave been conducted in research or specialty obesity
TABLE 6. Summary of Evidence Quality for Key Questions Addressing Childhood and Adolescent Overweight
Key Question Study Hierarchy Overall USPSTF Quality
1. Screening Poor2a. Prevalence II-2 Good but lacking for specific nonwhite racial/ethnic subgroups2b and 2c. Screening tests as a risk factor II-2 Fair; data for BMI as a risk factor for adult overweight from
childhood overweight are the most valid but are very limitedfor nonwhite subjects; data for BMI as a risk factor for adultmorbidities generally do not control for confounding byadult BMI
3. Screening harms Poor; because of lack of screening studies, possible harms canonly be inferred from other sources
4 and 5. BCI interventions I Fair/poor; data are limited by very small samples,noncomparable interventions, and not using intent-to-treatanalyses; little reporting of intermediate outcomes, includingrisk factor changes or changes in health outcomes; poorgeneralizability because of specialist interventions not widelyavailable and addressing mostly 8–12 y; no data for 2–5 y;few trials include nonwhite subjects
4 and 5. Pharmacotherapy with BCI I Fair; one good quality trial with adolescents4 and 5. Surgery Poor6. Intervention harms I, II-2 Fair/poor; very limited reporting of harms for BCI
interventions.
BCI indicates behavioral counseling.
www.pediatrics.org/cgi/doi/10.1542/peds.2005-0242 e139. Provided by Univ Of Arizona on May 17, 2010 www.pediatrics.orgDownloaded from
clinics with intensive, comprehensive, behavioraltreatment. Experts have cautioned that behavioraltherapy represents an expertise-driven approach toimproving diet and physical activity with behavioralprinciples and is not simply an add-on to a diet andexercise plan.122 If larger studies confirm that behav-ioral skills and approaches are key to treatment suc-cess, then creation of referral clinics or involvementof clinic team members with behavioral medicine/psychology weight management expertise will becritical.
Experts recommend referring certain children topediatric obesity treatment centers for expert man-agement. These include children who are massivelyoverweight (defined through clinical judgment)5 orwho have a BMI exceeding the 95th percentile, withassociated severe morbidities that require immediateweight loss. For asymptomatic children with a BMIof �95th percentile, experts recommend an in-depthmedical assessment to detect treatable causes of obe-sity, risk factors, and comorbidities. For childrenwhose BMI falls between the 85th and 95th percen-tiles for age and gender, they also recommend clin-ical evaluations for secondary effects of overweight,such as hypertension and hyperlipidemia. We didnot find adequate evidence meeting our criteria toaddress the impact of BMI screening and/or treat-ment of overweight (or at risk for overweight) on anyof these risks factors or morbidities.
Experts emphasize talking to families about en-ergy balance behaviors that might help prevent obe-sity and would also promote other aspects of healthand likely cause no harms.123 These behaviors in-clude limiting television viewing, encouraging out-door play, and limiting the consumption of sugar-sweetened soft drinks. For interested clinicians,pragmatic approaches for all children (particularlyyoung children) that emphasize the “healthy lifestyleprescription” approach over targeting overweightidentification seem appropriate, because we foundlimited evidence for secondary prevention or treat-ment. However, clinicians should be aware that oth-ers have found limited evidence for the effectivenessof primary prevention in clinical settings.124
Given the current evidence, BMI measurementsamong older adolescents may provide an early rea-sonable indication of future adult health risks attrib-utable to obesity. BMI measurements for youngerchildren should be performed as a growth-monitor-ing tool that might indicate future risk for adultoverweight and its attendant morbidities, with re-duced emphasis on defining current overweight.Children, particularly those �13 years of age, with-out clinical weight-related morbidities would notnecessarily be labeled overweight but might be con-sidered at risk or at high risk, depending on the BMIlevel. Experts recommend regular longitudinal mon-itoring and careful documentation of BMI amongchildren and adolescents.125 Such monitoring willlikely prove even more valuable as our understand-ing grows about the predictive value of levels andpatterns of growth and overweight status changesover time and about effective ways to address pat-
terns that indicate overweight that affects currenthealth or a high future risk of adult overweight.
In the absence of direct evidence of the effects ofscreening on improved weight and health outcomesamong children and/or adults, we evaluated indirectevidence for screening and intervention. In the cur-rent literature, evidence linkages between screeningand intervention are hampered by divergent defini-tions of overweight. It is important that a consistentdefinition of overweight be accepted, to encouragerapid progress in our understanding of how to ad-dress this critical problem.
Limited evidence on normal body compositionamong children and adolescents and lack of criterionstandards for adiposity among children hamperedour ability to determine the test characteristics (sen-sitivity and specificity) of clinically feasible screeningtests. Valid, feasible, body composition measures forchildren are becoming established,126 which shouldallow examination of the sensitivity and specificity ofBMI percentiles and overweight in US populations,as elsewhere.118 Similarly, clearly establishing cur-rent or future health consequences of elevated BMI(and other overweight measures) for boys and girlsof all ages and racial/ethnic origins will enable fu-ture diagnostic research. By confining our review ofchildhood BMI and adult health consequences tolongitudinal US studies, we gained some advantagesfrom more similar overweight definitions, measure-ments, and reference standards72 but might haveeliminated applicable data unnecessarily. Becausethe reviewed research was primarily among non-Hispanic white subjects, its applicability to minoritygroups, in which the prevalence of overweight isincreasing particularly, may be limited.
We did not locate adequate longitudinal data re-lating childhood weight status to childhood healthoutcomes; therefore, we did not review it formally.Current literature is primarily cross-sectional, pre-sents relative risks without absolute risks, or reportson the relationship of growth measures (or changesin the measures over time) to intermediate measures,such as blood pressure or lipid levels, rather thanhealth outcomes.
Although we made an effort to review severalareas of the literature comprehensively, some areaswere not reviewed. We did not review any evidencefor children �2 years of age, although this is anactive area for research. We did not attempt to ex-amine risk factors for childhood overweight, but oth-ers have done so.71 Similarly, research on changingchildren’s daily life habits that might also affect orprevent pediatric overweight, such as changing di-etary intake, increasing physical activity, or limitingactivities such as television viewing, that did notaddress weight effects directly was beyond the scopeof this study.
There are critical research gaps in answering themost basic questions needed to enable clinicians toengage strategies to prevent current and futureweight-related morbidities among children. Despitethe fact that many of these gaps were pointed out�10 years ago,127 little subsequent research has ad-dressed the most clinically relevant questions. In ad-
e140 CHILDHOOD OVERWEIGHT SCREENING AND INTERVENTIONS. Provided by Univ Of Arizona on May 17, 2010 www.pediatrics.orgDownloaded from

dition to the clinical research already underway toaddress childhood overweight prevention and treat-ment, we strongly urge the research community toprioritize research studies that would supply neededevidence to address the key questions formulated forthis report, to guide pragmatic clinical and publichealth prevention strategies. Some of these studiescould involve reporting from existing, good-quality,cross-sectional and longitudinal cohort studies, inaddition to new studies and clinical trials. For a morecomplete list of research recommendations, readerscan consult the full review.36
ACKNOWLEDGMENTSThis report was prepared by the Oregon Evidence-Based Prac-
tice Center under contract 290-02-0024 (task order 2) from theAgency for Healthcare Research and Quality.
We thank Daphne Plaut, MLS, Tracy Beil, MS, Betsy Garlitz,MD, and Kevin Lutz, MFA, for assistance in the preparation of thismanuscript. We thank the reviewers of the full evidence report forcontributions to this project. We also relied on guidance from ourUS Preventive Services Task Force liaisons at key points through-out the review process, including Janet Allan, PhD, RN, CS,FAAN; Mark Johnson MD, MPH; Jonathan Klein, MD, MPH;Virginia Moyer, MD, MPH; Judith Ockene, PhD; Steven Teutsch,MD, MPH; and former USPSTF liaison C. Tracy Orleans, PhD.
REFERENCES1. Flegal KM. The obesity epidemic in children and adults: current evi-
dence and research issues. Med Sci Sports Exerc. 1999;31(suppl):S509–S514
2. Kohn M, Booth M. The worldwide epidemic of obesity in adolescents.Adolesc Med State Art Rev. 2003;14:1–9
3. Sokol RJ. The chronic disease of childhood obesity: the sleeping gianthas awakened. J Pediatr. 2000;136:711–713
4. Lobstein T, Baur L, Uauy R. Obesity in children and young people: acrisis in public health. Obes Rev. 2004;(suppl 1):4–85
5. Barlow SE, Dietz WH. Obesity evaluation and treatment: Expert Com-mittee recommendations: the Maternal and Child Health Bureau,Health Resources and Services Administration and the Department ofHealth and Human Services. Pediatrics. 1998;102(3). Available at:www.pediatrics.org/cgi/content/full/102/3/e29
6. Himes JH, Dietz WH. Guidelines for overweight in adolescent preven-tive services: recommendations from an expert committee: the ExpertCommittee on Clinical Guidelines for Overweight in Adolescent Pre-ventive Services. Am J Clin Nutr. 1994;59:307–316
7. Troiano RP, Flegal KM. Overweight children and adolescents: descrip-tion, epidemiology, and demographics. Pediatrics. 1998;101:497–504
8. Koplan JP, Dietz WH. Caloric imbalance and public health policy.JAMA. 1999;282:1579–1581
9. Dwyer JT, Stone EJ, Yang M, et al. Prevalence of marked overweightand obesity in a multiethnic pediatric population: findings from theChild and Adolescent Trial for Cardiovascular Health (CATCH) study.J Am Diet Assoc. 2000;100:1149–1156
10. Must A, Strauss RS. Risks and consequences of childhood and adoles-cent obesity. Int J Obes Relat Metab Disord. 1999;23(suppl 2):S2–S11
11. Must A. Morbidity and mortality associated with elevated bodyweight in children and adolescents. Am J Clin Nutr. 1996;63(suppl):445S–447S
12. Reilly JJ, Methven E, McDowell ZC, et al. Health consequences ofobesity. Arch Dis Child. 2003;88:748–752
13. Zametkin AJ, Zoon CK, Klein HW, Munson S. Psychiatric aspects ofchild and adolescent obesity: a review of the past 10 years. J Am AcadChild Adolesc Psychiatry. 2004;43:134–150
14. Must A, Anderson SE. Effects of obesity on morbidity in children andadolescents. Nutr Clin Care. 2003;6:4–12
15. Rodriguez MA, Winkleby MA, Ahn D, Sundquist J, Kraemer HC.Identification of population subgroups of children and adolescentswith high asthma prevalence: findings from the Third National Healthand Nutrition Examination Survey. Arch Pediatr Adolesc Med. 2002;156:269–275
16. Kelsey JL. Epidemiology of slipped capital femoral epiphysis: a reviewof the literature. Pediatrics. 1973;51:1042–1050
17. Silvestri JM, Weese-Mayer DE, Bass MT, Kenny AS, Hauptman SA,Pearsall SM. Polysomnography in obese children with a history ofsleep-associated breathing disorders. Pediatr Pulmonol. 1993;16:124–129
18. Mallory GB Jr, Fiser DH, Jackson R. Sleep-associated breathing disor-ders in morbidly obese children and adolescents. J Pediatr. 1989;115:892–897
19. Tominaga K, Kurata JH, Chen YK, et al. Prevalence of fatty liver inJapanese children and relationship to obesity: an epidemiological ul-trasonographic survey. Dig Dis Sci. 1995;40:2002–2009
20. Franzese A, Vajro P, Argenziano A, et al. Liver involvement in obesechildren: ultrasonography and liver enzyme levels at diagnosis andduring follow-up in an Italian population. Dig Dis Sci. 1997;42:1428–1432
21. Chan DF, Li AM, Chu WC, et al. Hepatic steatosis in obese Chinesechildren. Int J Obes Relat Metab Disord. 2004;28:1257–1263
22. Rosenbloom AL, Joe JR, Young RS, Winter WE. Emerging epidemic oftype 2 diabetes in youth. Diabetes Care. 1999;22:345–354
23. Dabelea D, Hanson RL, Bennett PH, Roumain J, Knowler WC, PettittDJ. Increasing prevalence of type II diabetes in American Indian chil-dren. Diabetologia. 1998;41:904–910
24. Sinha R, Fisch G, Teague B, et al. Prevalence of impaired glucosetolerance among children and adolescents with marked obesity. N EnglJ Med. 2002;346:802–810
25. Freedman DS, Srinivasan SR, Berensen GS. Risk of cardiovascularcomplication. In: Burniat W, Cole T, Lissau I, Poskitt EME, eds. Childand Adolescent Obesity Causes and Consequences, Prevention and Manage-ment. Cambridge, United Kingdom: Cambridge University Press; 2002:221–239
26. Cook S, Weitzman M, Auinger P, Nguyen M, Dietz WH. Prevalence ofa metabolic syndrome phenotype in adolescents: findings from theThird National Health and Nutrition Examination Survey, 1988–1994.Arch Pediatr Adolesc Med. 2003;157:821–827
27. Weiss R, Dziura J, Burgert TS, et al. Obesity and the metabolic syn-drome in children and adolescents. N Engl J Med. 2004;350:2362–2374
28. Dietz WH. Health consequences of obesity in youth: childhood pre-dictors of adult disease. Pediatrics. 1998;101:518–525
29. Figueroa-Colon R, Franklin FA, Lee JY, Aldridge R, Alexander L.Prevalence of obesity with increased blood pressure in elementaryschool-aged children. South Med J. 1997;90:806–813
30. Dietz WH. Childhood weight affects adult morbidity and mortality.J Nutr. 1998;128(suppl):411S–414S
31. French SA, Story M, Perry CL. Self-esteem and obesity in children andadolescents: a literature review. Obes Res. 1995;3:479–490
32. Strauss RS. Childhood obesity and self-esteem. Pediatrics. 2000;105(1).Available at: www.pediatrics.org/cgi/content/full/105/1/e15
33. Strauss RS, Pollack HA. Social marginalization of overweight children.Arch Pediatr Adolesc Med. 2003;157:746–752
34. US Preventive Services Task Force. Guide to Clinical Preventive Services.2nd ed. Baltimore, MD: Williams & Wilkins; 1996
35. Harris RP, Helfand M, Woolf SH, et al. Current methods of the USPreventive Services Task Force: a review of the process. Am J Prev Med.2001;20(suppl):21–35
36. Whitlock EP, Williams SB, Gold R, Smith P, Shipman S. Screening andInterventions for Childhood Overweight: A Systematic Review for the USPreventive Services Task Force: Systematic Evidence Review. Rockville,MD: Agency for Healthcare Research and Quality; 2005
37. Haddock CK, Shadish WR, Klesges RC, Stein RJ. Treatments for child-hood and adolescent obesity. Ann Behav Med. 1994;16:235–244
38. Epstein LH, Roemmich JN, Raynor HA. Behavioral therapy in thetreatment of pediatric obesity. Pediatr Clin North Am. 2001;48:981–993
39. Glenny AM, O’Meara S, Melville A, Sheldon TA, Wilson C. Thetreatment and prevention of obesity: a systematic review of the liter-ature. Int J Obes Relat Metab Disord. 1997;21:715–737
40. Summerbell CD, Ashton V, Campbell KJ, Edmunds L, Kelly S, WatersE. Interventions for treating obesity in children. Cochrane Database SystRev. 2003;(3):CD001872
41. Reilly JJ, Wilson ML, Summerbell CD, Wilson DC. Obesity: diagnosis,prevention, and treatment: evidence based answers to common ques-tions. Arch Dis Child. 2002;86:392–394
42. Reilly JJ, McDowell ZC. Physical activity interventions in the preven-tion and treatment of paediatric obesity: systematic review and criticalappraisal. Proc Nutr Soc. 2003;62:611–619
43. McLean N, Griffin S, Toney K, Hardeman W. Family involvement inweight control, weight maintenance and weight-loss interventions: asystematic review of randomised trials. Int J Obes Relat Metab Disord.2003;27:987–1005
www.pediatrics.org/cgi/doi/10.1542/peds.2005-0242 e141. Provided by Univ Of Arizona on May 17, 2010 www.pediatrics.orgDownloaded from

44. Kuczmarski RJ. Trends in body composition for infants and children inthe U.S. Crit Rev Food Sci Nutr. 1993;33:375–387
45. Ogden CL, Flegal KM, Carroll MD, Johnson CL. Prevalence and trendsin overweight among US children and adolescents, 1999–2000. JAMA.2002;288:1728–1732
46. WHO Working Group. Use and interpretation of anthropometric in-dicators of nutritional status. Bull World Health Organ. 1986;64:929–941
47. Ogden CL, Carroll MD, Flegal KM. Epidemiologic trends in over-weight and obesity. Endocrinol Metab Clin North Am. 2003;32:741–760
48. Kuczmarski RJ, Ogden CL, Guo SS, et al. 2000 CDC growth charts forthe United States: methods and development. Vital Health Stat 11.2002;(246):1–190
49. Hedley AA, Ogden CL, Johnson CL, Carroll MD, Curtin LR, FlegalKM. Prevalence of overweight and obesity among US children, ado-lescents, and adults, 1999–2002. JAMA. 2004;291:2847–2850
50. Freedman DS, Khan LK, Serdula MK, Dietz WH, Srinivasan SR, Be-renson GS. Inter-relationships among childhood BMI, childhoodheight, and adult obesity: the Bogalusa Heart Study. Int J Obes RelatMetab Disord. 2004;28:10–16
51. Hulman S, Kushner H, Katz S, Falkner B. Can cardiovascular risk bepredicted by newborn, childhood, and adolescent body size? An ex-amination of longitudinal data in urban African Americans. J Pediatr.1998;132:90–97
52. Wattigney WA, Webber LS, Srinivasan SR, Berenson GS. The emer-gence of clinically abnormal levels of cardiovascular disease risk factorvariables among young adults: the Bogalusa Heart Study. Prev Med.1995;24:617–626
53. Garn SM, Lavelle M. Two-decade follow-up of fatness in early child-hood. Am J Dis Child. 1985;139:181–185
54. Lauer RM, Clarke WR, Burns TL. Obesity in childhood: the MuscatineStudy. Zhonghua Min Guo Xiao Er Ke Yi Xue Hui Za Zhi. 1997;38:432–437
55. Guo SS, Roche AF, Chumlea WC, Gardner JD, Siervogel RM. Thepredictive value of childhood body mass index values for overweightat age 35 y. Am J Clin Nutr. 1994;59:810–819
56. Whitaker RC, Wright JA, Pepe MS, Seidel KD, Dietz WH. Predictingobesity in young adulthood from childhood and parental obesity.N Engl J Med. 1997;337:869–873
57. Freedman DS, Khan LK, Dietz WH, Srinivasan SR, Berenson GS.Relationship of childhood obesity to coronary heart disease risk factorsin adulthood: the Bogalusa Heart Study. Pediatrics. 2001;108:712–718
58. Guo SS, Wu W, Chumlea WC, Roche AF. Predicting overweight andobesity in adulthood from body mass index values in childhood andadolescence. Am J Clin Nutr. 2002;76:653–658
59. Freedman DS, Shear CL, Burke GL, et al. Persistence of juvenile-onsetobesity over eight years: the Bogalusa Heart Study. Am J Public Health.1987;77:588–592
60. Casey VA, Dwyer JT, Coleman KA, Valadian I. Body mass index fromchildhood to middle age: a 50-y follow-up. Am J Clin Nutr. 1992;56:14–18
61. Lauer RM, Lee J, Clarke WR. Factors affecting the relationship betweenchildhood and adult cholesterol levels: the Muscatine Study. Pediatrics.1988;82:309–318
62. Lauer RM, Clarke WR. Childhood risk factors for high adult bloodpressure: the Muscatine Study. Pediatrics. 1989;84:633–641
63. Clarke WR, Lauer RM. Does childhood obesity track into adulthood?Crit Rev Food Sci Nutr. 1993;33:423–430
64. Valdez R, Greenlund KJ, Wattigney WA, Bao W, Berenson GS. Use ofweight-for-height indices in children to predict adult overweight: theBogalusa Heart Study. Int J Obes Relat Metab Disord. 1996;20:715–721
65. Sinaiko AR, Donahue RP, Jacobs DR Jr, Prineas RJ. Relation of weightand rate of increase in weight during childhood and adolescence tobody size, blood pressure, fasting insulin, and lipids in young adults:the Minneapolis Children’s Blood Pressure Study. Circulation. 1999;99:1471–1476
66. Gortmaker SL, Must A, Perrin JM, Sobol AM, Dietz WH. Social andeconomic consequences of overweight in adolescence and youngadulthood. N Engl J Med. 1993;329:1008–1012
67. Srinivasan SR, Bao W, Wattigney WA, Berenson GS. Adolescent over-weight is associated with adult overweight and related multiple car-diovascular risk factors: the Bogalusa Heart Study. Metab Clin Exp.1996;45:235–240
68. Lauer RM, Clarke WR, Mahoney LT, Witt J. Childhood predictors forhigh adult blood pressure: the Muscatine Study. Pediatr Clin North Am.1993;40:23–40
69. Webber LS, Cresanta JL, Croft JB, Srinivasan SR, Berenson GS. Tran-sitions of cardiovascular risk from adolescence to young adulthood:
the Bogalusa Heart Study, II: alterations in anthropometric bloodpressure and serum lipoprotein variables. J Chronic Dis. 1986;39:91–103
70. Power C, Lake JK, Cole TJ. Body mass index and height from child-hood to adulthood in the 1958 British born cohort. Am J Clin Nutr.1997;66:1094–1101
71. Parsons TJ, Power C, Logan S, Summerbell CD. Childhood predictorsof adult obesity: a systematic review. Int J Obes Relat Metab Disord.1999;(suppl 8):S1–107
72. Power C, Lake JK, Cole TJ. Measurement and long-term health risks ofchild and adolescent fatness. Int J Obes Relat Metab Disord. 1997;21:507–526
73. Must A, Jacques PF, Dallal GE, Bajema CJ, Dietz WH. Long-termmorbidity and mortality of overweight adolescents: a follow-up of theHarvard Growth Study of 1922 to 1935. N Engl J Med. 1992;327:1350–1355
74. Nieto FJ, Szklo M, Comstock GW. Childhood weight and growth rateas predictors of adult mortality. Am J Epidemiol. 1992;136:201–213
75. Lauer RM, Lee J, Clarke WR. Predicting adult cholesterol levels frommeasurements in childhood and adolescence: the Muscatine Study.Bull NY Acad Med. 1989;65:1127–1142
76. Srinivasan SR, Myers L, Berenson GS. Predictability of childhoodadiposity and insulin for developing insulin resistance syndrome (syn-drome X) in young adulthood: the Bogalusa Heart Study. Diabetes.2002;51:204–209
77. Bao W, Srinivasan SR, Wattigney WA, Bao W, Berenson GS. Useful-ness of childhood low-density lipoprotein cholesterol level in predict-ing adult dyslipidemia and other cardiovascular risks: the BogalusaHeart Study. Arch Intern Med. 1996;156:1315–1320
78. Kaplan KM, Wadden TA. Childhood obesity and self-esteem. J Pediatr.1986;109:367–370
79. Davison KK, Birch LL. Weight status, parent reaction, and self-conceptin five-year-old girls. Pediatrics. 2001;107:46–53
80. Cameron JW. Self-esteem changes in children enrolled in weight man-agement programs. Issues Compr Pediatr Nursing. 1999;22:75–85
81. Erickson SJ, Robinson TN, Haydel KF, Killen JD. Are overweightchildren unhappy? Body mass index, depressive symptoms, and over-weight concerns in elementary school children. Arch Pediatr AdolescMed. 2000;154:931–935
82. Berkey CS, Rockett HR, Gillman MW, Field AE, Colditz GA. Longitu-dinal study of skipping breakfast and weight change in adolescents.Int J Obes Relat Metab Disord. 2003;27:1258–1266
83. Strauss RS, Mir HM. Smoking and weight loss attempts in overweightand normal-weight adolescents. Int J Obes Relat Metab Disord. 2001;25:1381–1385
84. Fulkerson JA, French SA. Cigarette smoking for weight loss or controlamong adolescents: gender and racial/ethnic differences. J AdolescHealth. 2003;32:306–313
85. Whitlock EP, Orleans CT, Pender N, Allan J. Evaluating primary carebehavioral counseling interventions: an evidence-based approach.Am J Prev Med. 2002;22:267–284
86. Berkowitz RI, Wadden TA, Tershakovec AM, Cronquist JL. Behaviortherapy and sibutramine for the treatment of adolescent obesity: arandomized controlled trial. JAMA. 2003;289:1805–1812
87. Duffy G, Spence SH. The effectiveness of cognitive self-management asan adjunct to a behavioural intervention for childhood obesity: aresearch note. J Child Psychol Psychiatry. 1993;34:1043–1050
88. Ebbeling CB, Leidig MM, Sinclair KB, Hangen JP, Ludwig DS. Areduced-glycemic load diet in the treatment of adolescent obesity. ArchPediatr Adolesc Med. 2003;157:773–779
89. Epstein LH, Wing RR, Koeske R, Valoski A. A comparison of lifestyleexercise, aerobic exercise, and calisthenics on weight loss in obesechildren. Behav Ther. 1985;16:356
90. Epstein LH, Wing RR, Penner BC, Kress MJ. Effect of diet and con-trolled exercise on weight loss in obese children. J Pediatr. 1985;107:358–361
91. Epstein LH. Effects of family-based behavioral treatment on obese5-to-8-year-old children. Behav Ther. 1985;16:212
92. Epstein LH, McKenzie SJ, Valoski A, Klein KR, Wing RR. Effects ofmastery criteria and contingent reinforcement for family-based childweight control. Addict Behav. 1994;19:135–145
93. Epstein LH, Valoski AM, Vara LS, et al. Effects of decreasing sedentarybehavior and increasing activity on weight change in obese children.Health Psychol. 1995;14:109–115
94. Epstein LH, Paluch RA, Gordy CC, Dorn J. Decreasing sedentarybehaviors in treating pediatric obesity. Arch Pediatr Adolesc Med. 2000;154:220–226
e142 CHILDHOOD OVERWEIGHT SCREENING AND INTERVENTIONS. Provided by Univ Of Arizona on May 17, 2010 www.pediatrics.orgDownloaded from

95. Epstein LH, Paluch RA, Gordy CC, Saelens BE, Ernst MM. Problemsolving in the treatment of childhood obesity. J Consult Clin Psychol.2000;68:717–721
96. Epstein LH, Paluch RA, Raynor HA. Sex differences in obese childrenand siblings in family-based obesity treatment. Obes Res. 2001;9:746–753
97. Flodmark CE, Ohlsson T, Ryden O, Sveger T. Prevention of progres-sion to severe obesity in a group of obese schoolchildren treated withfamily therapy. Pediatrics. 1993;91:880–884
98. Golan M, Weizman A, Apter A, Fainaru M. Parents as the exclusiveagents of change in the treatment of childhood obesity. Am J Clin Nutr.1998;67:1130–1135
99. Graves T, Meyers AW, Clark L. An evaluation of parental problem-solving training in the behavioral treatment of childhood obesity.J Consult Clin Psychol. 1988;56:246–250
100. Israel AC, Stolmaker L, Andrian CAG. The effects of training parentsin general child management skills on behavioral weight loss programfor children. Behav Ther. 1985;16:169–180
101. Israel AC, Guile CA, Baker JE, Silverman WK. An evaluation of en-hanced self-regulation training in the treatment of childhood obesity.J Pediatr Psychol. 1994;19:737–749
102. Gutin B, Barbeau P, Owens S, et al. Effects of exercise intensity oncardiovascular fitness, total body composition, and visceral adiposityof obese adolescents. Am J Clin Nutr. 2002;75:818–826
103. Kang HS, Gutin B, Barbeau P, et al. Physical training improves insulinresistance syndrome markers in obese adolescents. Med Sci SportsExerc. 2002;34:1920–1927
104. Mellin LM, Slinkard LA, Irwin CE Jr. Adolescent obesity intervention:validation of the SHAPEDOWN program. J Am Diet Assoc. 1987;87:333–338
105. Saelens BE, Sallis JF, Wilfley DE, Patrick K, Cella JA, Buchta R. Behav-ioral weight control for overweight adolescents initiated in primarycare. Obes Res. 2002;10:22–32
106. Senediak C, Spence SH. Rapid versus gradual scheduling of therapeu-tic contact in a family based behavioural weight control programmefor children. Behav Psychother. 1985;13:287
107. Wadden TA, Stunkard AJ, Rich L, Rubin CJ, Sweidel G, McKinney S.Obesity in black adolescent girls: a controlled clinical trial of treatmentby diet, behavior modification, and parental support. Pediatrics. 1990;85:345–352
108. White MA. Mediators of Weight Loss in an Internet-Based Intervention forAfrican-American Adolescent Girls [dissertation]. Baton Rouge, LA: Lou-isiana State University; 2003.
109. Strauss RS, Pollack HA. Epidemic increase in childhood overweight,1986–1998. JAMA. 2001;286:2845–2848
110. Epstein LH, Paluch RA, Saelens BE, Ernst MM, Wilfley DE. Changes ineating disorder symptoms with pediatric obesity treatment. J Pediatr.2001;139:58–65
111. Inge TH, Garcia V, Daniels S, et al. A multidisciplinary approach to theadolescent bariatric surgical patient. J Pediatr Surg. 2004;39:442–447
112. Stanford A, Glascock JM, Eid GM, et al. Laparoscopic Roux-en-Ygastric bypass in morbidly obese adolescents. J Pediatr Surg. 2003;38:430–433
113. Strauss RS, Bradley LJ, Brolin RE. Gastric bypass surgery in adoles-cents with morbid obesity. J Pediatr. 2001;138:499–504
114. Charney E. Childhood obesity: the measurable and the meaningful.J Pediatr. 1998;132:193–195
115. Institute of Medicine (US). Committee on Prevention of Obesity inChildren and Youth. Preventing Childhood Obesity: Health in the Balance.Washington, DC: National Academies Press; 2005
116. Stettler N. Comment: the global epidemic of childhood obesity: is therea role for the paediatrician? Obes Rev. 2004;5(suppl 1):1–3
117. Gruen RL, Pearson SD, Brennan TA. Physician-citizens: public rolesand professional obligations. JAMA. 2004;291:94–98
118. Reilly JJ, Dorosty AR, Emmett PM. Identification of the obese child:adequacy of the body mass index for clinical practice and epidemiol-ogy. Int J Obes Relat Metab Disord. 2000;24:1623–1627
119. Dietz WH, Robinson TN. Use of the body mass index (BMI) as ameasure of overweight in children and adolescents. J Pediatr. 1998;132:191–193
120. Pi-Sunyer FX. Medical hazards of obesity. Ann Intern Med. 1993;119:655–660
121. Daniels S. Pharmacological treatment of obesity in paediatric patients.Paediatr Drugs. 2001;3:405–410
122. Stunkard A. Diet, exercise and behavior therapy: a cautionary tale.Obes Res. 1996;4:293–294
123. Whitaker RC. Obesity prevention in pediatric primary care: four be-haviors to target. Arch Pediatr Adolesc Med. 2003;157:725–727
124. Campbell K, Waters E, O’Meara S, Kelly S, Summerbell C. Interven-tions for preventing obesity in children. Cochrane Database Syst Rev.2002;(2):CD001871
125. Krempf M, Louvet JP, Allanic H, Miloradovich T, Joubert JM, Attali JR.Weight reduction and long-term maintenance after 18 months treat-ment with orlistat for obesity. Int J Obes Relat Metab Disord. 2003;27:591–597
126. Sopher AB, Thornton JC, Wang J, Pierson RN Jr, Heymsfield SB,Horlick M. Measurement of percentage of body fat in 411 children andadolescents: a comparison of dual-energy X-ray absorptiometry with afour-compartment model. Pediatrics. 2004;113:1285–1290
127. Robinson TN. Defining obesity in children and adolescents: clinicalapproaches. Crit Rev Food Sci Nutr. 1993;33:313–320
www.pediatrics.org/cgi/doi/10.1542/peds.2005-0242 e143. Provided by Univ Of Arizona on May 17, 2010 www.pediatrics.orgDownloaded from
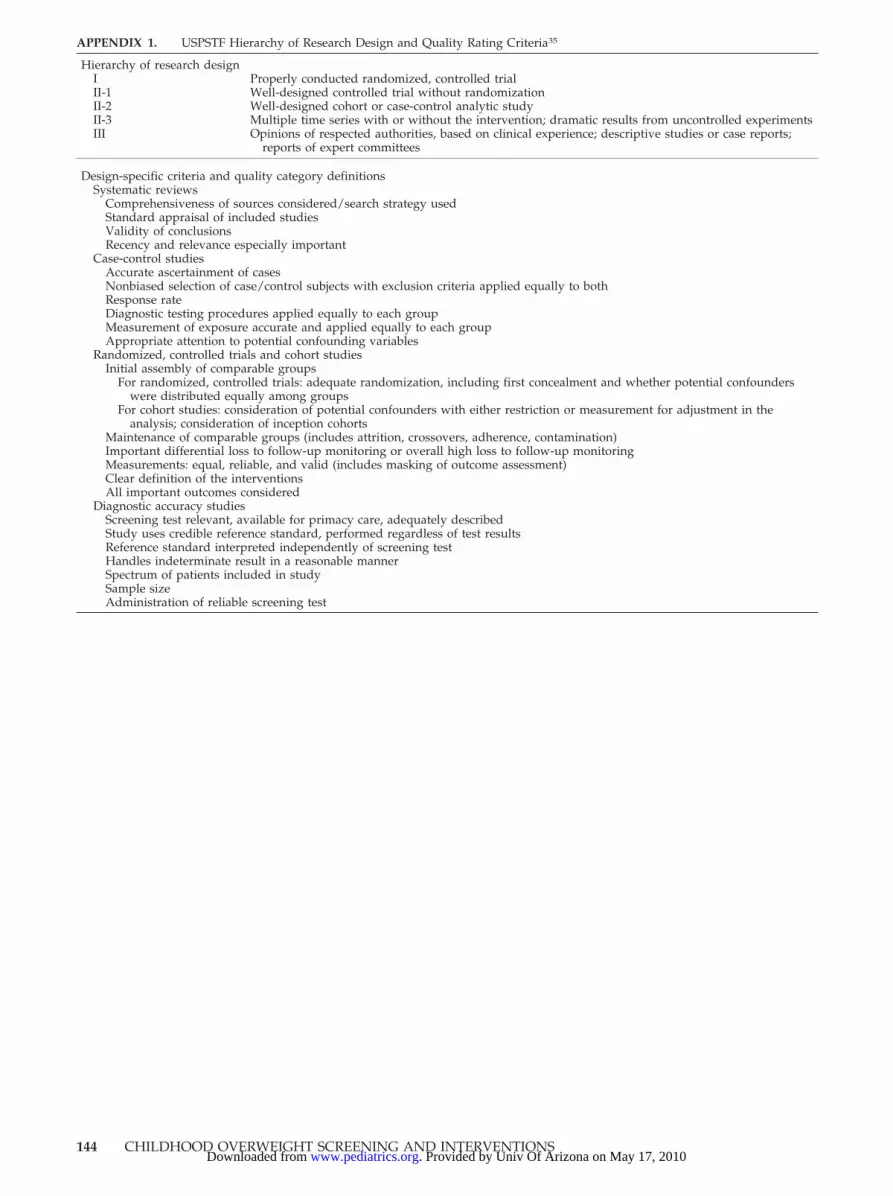
APPENDIX 1. USPSTF Hierarchy of Research Design and Quality Rating Criteria35
Hierarchy of research designI Properly conducted randomized, controlled trialII-1 Well-designed controlled trial without randomizationII-2 Well-designed cohort or case-control analytic studyII-3 Multiple time series with or without the intervention; dramatic results from uncontrolled experimentsIII Opinions of respected authorities, based on clinical experience; descriptive studies or case reports;
reports of expert committees
Design-specific criteria and quality category definitionsSystematic reviews
Comprehensiveness of sources considered/search strategy usedStandard appraisal of included studiesValidity of conclusionsRecency and relevance especially important
Case-control studiesAccurate ascertainment of casesNonbiased selection of case/control subjects with exclusion criteria applied equally to bothResponse rateDiagnostic testing procedures applied equally to each groupMeasurement of exposure accurate and applied equally to each groupAppropriate attention to potential confounding variables
Randomized, controlled trials and cohort studiesInitial assembly of comparable groups
For randomized, controlled trials: adequate randomization, including first concealment and whether potential confounderswere distributed equally among groups
For cohort studies: consideration of potential confounders with either restriction or measurement for adjustment in theanalysis; consideration of inception cohorts
Maintenance of comparable groups (includes attrition, crossovers, adherence, contamination)Important differential loss to follow-up monitoring or overall high loss to follow-up monitoringMeasurements: equal, reliable, and valid (includes masking of outcome assessment)Clear definition of the interventionsAll important outcomes considered
Diagnostic accuracy studiesScreening test relevant, available for primacy care, adequately describedStudy uses credible reference standard, performed regardless of test resultsReference standard interpreted independently of screening testHandles indeterminate result in a reasonable mannerSpectrum of patients included in studySample sizeAdministration of reliable screening test
144 CHILDHOOD OVERWEIGHT SCREENING AND INTERVENTIONS. Provided by Univ Of Arizona on May 17, 2010 www.pediatrics.orgDownloaded from

DOI: 10.1542/peds.2005-0242 2005;116;e125-e144 PediatricsShipman
Evelyn P. Whitlock, Selvi B. Williams, Rachel Gold, Paula R. Smith and Scott A. for the US Preventive Services Task Force
Screening and Interventions for Childhood Overweight: A Summary of Evidence
& ServicesUpdated Information
http://www.pediatrics.org/cgi/content/full/116/1/e125including high-resolution figures, can be found at:
References
http://www.pediatrics.org/cgi/content/full/116/1/e125#BIBLfree at: This article cites 105 articles, 47 of which you can access for
Citations
eshttp://www.pediatrics.org/cgi/content/full/116/1/e125#otherarticlThis article has been cited by 14 HighWire-hosted articles:
Subspecialty Collections
mhttp://www.pediatrics.org/cgi/collection/nutrition_and_metabolis
Nutrition & Metabolismfollowing collection(s): This article, along with others on similar topics, appears in the
Permissions & Licensing
http://www.pediatrics.org/misc/Permissions.shtmltables) or in its entirety can be found online at: Information about reproducing this article in parts (figures,
Reprints http://www.pediatrics.org/misc/reprints.shtml
Information about ordering reprints can be found online:
. Provided by Univ Of Arizona on May 17, 2010 www.pediatrics.orgDownloaded from


