Embed Size (px)
Citation preview
The Astrophysical Journal Supplement Series, 204:5 (14pp), 2013 January doi:10.1088/0067-0049/204/1/5C© 2013. The American Astronomical Society. All rights reserved. Printed in the U.S.A.
SDSS DR7 WHITE DWARF CATALOG
S. J. Kleinman1, S. O. Kepler2, D. Koester3, Ingrid Pelisoli2, Viviane Pecanha2, A. Nitta1,J. E. S. Costa2, J. Krzesinski4, P. Dufour5, F.-R. Lachapelle5, P. Bergeron5, Ching-Wa Yip6,
Hugh C. Harris7, Daniel J. Eisenstein8, L. Althaus9, and A. Corsico91 Gemini Observatory, 670 North A’ohoku Place, Hilo, HI 96720, USA
2 Instituto de Fısica, Universidade Federal do Rio Grande do Sul, Porto Alegre, RS, Brazil3 Institut fur Theoretische Physik und Astrophysik, Universitat Kiel, D-24098 Kiel, Germany
4 Mt. Suhora Observatory, Pedagogical University of Cracow, ul. Podchorazych 2, 30-084 Cracow, Poland5 Departement de Physique, Universite de Montreal, C. P. 6128, Succ. Centre-Ville, Montreal, Quebec H3C 3J7, Canada
6 Department of Physics and Astronomy, The Johns Hopkins University, 3701 San Martin Drive, Baltimore, MD 21218, USA7 United States Naval Observatory, Flagstaff Station, 10391 West Naval Observatory Road, Flagstaff, AZ 86001-8521, USA; [email protected]
8 Harvard Smithsonian Center for Astrophysics, 60 Garden Street, MS #20, Cambridge, MA 02138, USA9 Facultad de Ciencias Astronomicas y Geofısicas, Paseo del Bosque S/N, (1900) La Plata, Argentina
Received 2012 June 3; accepted 2012 October 19; published 2012 December 20
ABSTRACT
We present a new catalog of spectroscopically confirmed white dwarf stars from the Sloan Digital Sky Survey(SDSS) Data Release 7 spectroscopic catalog. We find 20,407 white dwarf spectra, representing 19,712 stars,and provide atmospheric model fits to 14,120 DA and 1011 DB white dwarf spectra from 12,843 and 923 stars,respectively. These numbers represent more than a factor of two increase in the total number of white dwarfstars from the previous SDSS white dwarf catalogs based on DR4 data. Our distribution of subtypes varies fromprevious catalogs due to our more conservative, manual classifications of each star in our catalog, supplementingour automatic fits. In particular, we find a large number of magnetic white dwarf stars whose small Zeeman splittingsmimic increased Stark broadening that would otherwise result in an overestimated log g if fit as a non-magneticwhite dwarf. We calculate mean DA and DB masses for our clean, non-magnetic sample and find the DB meanmass is statistically larger than that for the DAs.
Key words: catalogs – magnetic fields – stars: luminosity function, mass function – surveys – white dwarfs
Online-only material: color figures, machine-readable table
1. INTRODUCTION
The Sloan Digital Sky Survey (SDSS; York et al. 2000)has had impacts in astronomy far beyond its main mission ofexploring the three-dimensional structure of our universe. TheSloan Extension for Galactic Exploration and Understandingsurvey (SEGUE; Lee et al. 2008), part of the second-generationSDSS surveys, extended the survey’s mission to unravelingthe nature and structure of our own Milky Way galaxy bytargeting mostly new fields in and around the Galactic disk.As a result, the spatial distribution of the new (largely Galacticdisk) white dwarf stars in this catalog will be very different fromthose in the earlier catalogs from SDSS Data Release 1 (DR1;Kleinman et al. 2004) and Data Release 4 (DR4; Eisensteinet al. 2006a) where the focus was on extragalactic objects andthe Galactic disk was purposefully avoided. The study of whitedwarf stars has benefited greatly from the increased number ofobjects provided by the SDSS, there being 66 papers between2005 and 2012 reported by the SAO/NASA Astrophysics DataSystem, for example, with “SDSS” and “white dwarf” in thetitle. Numerous other papers refer to SDSS-discovered whitedwarf stars without indicating so in the title. The first full whitedwarf catalog from SDSS data (Kleinman et al. 2004), based onSDSS DR1 (Abazajian et al. 2003), roughly doubled the numberof then known white dwarf stars. Using data from the SDSSDR4 (Adelman-McCarthy et al. 2006), Eisenstein et al. (2006a)reported over 9000 spectroscopically confirmed white dwarfstars from the SDSS, again roughly doubling the combinednumber of white dwarf stars known after SDSS DR1. With therelease of Data Release 7 from the SDSS (DR7; Abazajian et al.
2009), we again roughly double the number of identified whitedwarf stars compared to those in the DR4 sample.
The first release of SEGUE data started in SDSS Data Release6 (Adelman-McCarthy et al. 2008), with more released in SDSSDR7 (Abazajian et al. 2009). In the original SDSS survey, whitedwarf spectra were obtained primarily as a bi-product of otherhigh-priority categories of targets. Almost all were hot whitedwarf stars because white dwarf stars cooler than ≈7000 Khave colors similar to the more numerous FGK main-sequencestars which were specifically not targeted. Most of the whitedwarf stars in the survey were not targeted for spectroscopyas white dwarf star candidates and were instead rejects fromtargeting algorithms for other kinds of objects; Kleinman et al.(2004) and Harris et al. (2003) discuss the details of the DR1target selection and the makeup of the white dwarf spectroscopicsample. The SEGUE survey, however, specifically targets stars(see http://www.sdss3.org/dr8/algorithms/segueii/segue_target_selection.php) and cool white dwarf stars were effectively tar-geted for the first time using their reduced proper motions. Thenet result is that the number of white dwarf stars observed perSDSS spectroscopic plate has remained roughly constant at25/plate through each SDSS Data Release, although the se-lection mechanism is significantly different.
Here, we report on the white dwarf catalog built from theSDSS DR7. We have applied automated techniques supple-mented by complete, consistent human identifications of eachcandidate white dwarf spectrum. We make use of the latest SDSSreductions and white dwarf model atmosphere improvements inour spectral fits, providing log g and Teff determinations for eachidentified clean DA and DB where we use the word “clean” to
1

The Astrophysical Journal Supplement Series, 204:5 (14pp), 2013 January Kleinman et al.
identify spectra that show only features of non-magnetic, non-mixed, DA or DB stars. Our catalog includes all white dwarfstars from the earlier Kleinman et al. (2004) and Eisenstein et al.(2006a) catalogs, although occasionally with different identifi-cations, as discussed below.
Looking for infrared excesses around DA white dwarf stars,Girven et al. (2011) use a photometric method to identify DAwhite dwarf stars with g < 19 from the SDSS and find 4636spectroscopically confirmed DAs in DR7 with another 5819expected DAs in the photometric sample. Our sample is notmagnitude-selected (although classifications typically get moreuncertain for g ≈ 19.5 and below) and includes DB and all otherwhite dwarf subtypes as well. We do not, however, considercandidate white dwarf stars that do not have SDSS spectra.
We note that although we did not fit white dwarf plus main-sequence models to our apparently composite spectra, others(Silvestri et al. 2006; Marsh et al. 2011; Girven et al. 2011;Koester et al. 2011; Debes et al. 2011; Steele et al. 2011;Rebassa-Mansergas et al. 2012) have specifically studied thesespectra.
2. CANDIDATE SELECTION
SDSS DR7 contains over 1.6 million spectra and we didnot have the facilities to fit and identify each spectrum. Wetherefore had to extract a smaller subsample of candidates fromthese spectra that we could later fit and examine as possiblewhite dwarf stars. To form our candidate sample, we employedtwo different techniques. First, we reproduced the candidateselection from Eisenstein et al. (2006a), but implemented itcompletely within the SDSS DR7 Catalog Archive Server(CAS)10 as an SQL query. This query returned 24,189 objects.
Second, we used the SDSS and SEGUE target classificationand spectrum analysis fields and selected any object that waseither targeted as a possible white dwarf star or whose spectrumwas determined to likely be any kind of white dwarf star. Thisquery returned 48,198 spectrum IDs. Both queries are listed infull in the Appendix and queried all available DR7 spectra viathe specObjAll table.
Combined, these queries resulted in 53,408 unique spectra,of which 5209 uniquely satisfied the Eisenstein et al. (2006a)criteria, 29,218 uniquely satisfied the new target/classificationcriteria, and 18 981 spectra satisfied both. Later, we discoveredthat 4362 sky spectra made our sample (they should have beenexplicitly excluded from our queries, but were not), so thesewere deleted and the resulting sample size became 49,046spectra. Ultimately, 4% of the objects which were selected onlyby the targeting criteria, 36% of those selected only by theEisenstein et al. (2006a) criteria, and 90% of those that satisfiedboth criteria were labeled as white dwarf stars. The combined setof criteria is a very powerful way to identify white dwarf spectrain the SDSS, accounting for 83% of our identified white dwarfstars. Only 17% of the identified white dwarf stars, therefore,satisfied just one of the two selection criteria.
We further pared our sample by using lists of previously iden-tified SDSS spectra. We removed the known quasars (Schneideret al. 2010), BL Lac objects (Plotkin et al. 2010), and once wehad run through our DA and DB model-fitting program, we fitthe rejects with galaxy and quasar templates (Yip et al. 2004a,2004b) to remove these objects from further consideration. Thisprocess removed an additional 6892 spectra, resulting in a finalsample of 42,154 spectra.
10 http://cas.sdss.org/dr7
3. WHITE DWARF ATMOSPHERE MODELS
The mechanics of our autofit fitting program, which fitsthe observed spectra to our synthetic model spectral grid byχ2 minimization, remain the same as described in Kleinmanet al. (2004) and Eisenstein et al. (2006a), but substantialimprovements have been made to our atmospheric model grid,both in the model physics and the parameters of the grid itself.
We use updated Koester (Koester et al. 2009a; Koester 2010)model atmospheres, with the following significant changes sinceKleinman et al. (2004).
1. For the 10 lowest Balmer and Lyman lines, the standardVCS tables (Lemke 1997) were replaced with new tablescalculated by Tremblay & Bergeron (2009). These calcula-tions consistently include the Hummer–Mihalas occupationprobability formalism in the profile calculation.
2. The Stark broadening profiles from Beauchamp et al.(1997) for hydrogen have been convolved with the neutralbroadening profiles to add another dimension for the neutralparticle density to the broadening tables. For the threelowest Balmer lines, we used the self-broadening data ofBarklem et al. (2000). For the higher series members, weused the sum of resonance (Ali & Griem 1965) and vander Waals broadening (Unsold 1968). For the helium lines,we used self-broadening data from Leo et al. (1995) andMullampht et al. (1991). For the remaining lines, simpleestimates for resonance and van der Waals broadeningwere used.
3. The Holtsmark microfield distribution was replaced by theHooper (1966, 1968) distribution using the approximationsin Nayfonov et al. (1999). This distribution includes correla-tions between the charged perturber particles. The changesin the occupation probabilities for higher Balmer lines,where the occupation probability varies between 0.1 and1.0, are quite significant.
4. For the DBs, we now use the ML2/α = 1.25 approxi-mation. We find that this value best describes the locationof the DBV instability strip (Montgomery 2007; Corsicoet al. 2009; Montgomery et al. 2010). Montgomery et al.(2010), in particular, exclude values of α < 0.8 throughtheir analysis of the convection zone for the pulsating DBwhite dwarf, GD 358 while Bergeron et al. (2011) justifythis value in their atmospheric modeling.
5. For the DAs, we use ML2/α = 0.6. Note that with the useof these improved Stark profiles, Tremblay et al. (2010)showed that a slightly more efficient convective energytransport with α = 0.8 should be used, although we feelour atmospheric parameters with α = 0.6 are appropriatein the present context.
Our model grid now extends to log g = 10.0 and is denserthan that used in Eisenstein et al. (2006a) and Kleinman et al.(2004). For DAs, the grid extends in log g from 5.0 to 10.0 insteps of 0.25 while Teff goes from 6000 K to 10,000 K in stepsof 250 K, 10,000 K to 14,000 K in steps of 100 K, 14,000 Kto 20,000 K in steps of 250 K, 20,000 K to 50,000 K in stepsof 1000 K, and 50,000 K to 100,000 K in steps of 2500 K. TheDB grid runs from log g = 7.0 to 10.0 in steps of 0.25, withTeff extending from 10,000 K to 18,000 K in steps of 250 K andfrom 18,000 K to 50,000 K in steps of 1000 K.
4. SPECTRAL FITTING
Once we completed our candidate list, we fit all 42,154candidate white dwarf spectra and colors with our autofit code
2

The Astrophysical Journal Supplement Series, 204:5 (14pp), 2013 January Kleinman et al.
described in Kleinman et al. (2004) and Eisenstein et al. (2006a).Autofit fits only clean DA and DB models, so does not recognizeother types of white dwarf stars. In addition to the best-fittingmodel parameters, it also outputs a goodness-of-fit estimate andseveral quality control checks and flags for other features notedin the spectrum or fit.
We took the output from autofit and separated the resultsinto good DA and DB fits (14,271 spectra) and all else (27,883spectra). We looked at all the good DA and DB fits to verifythey were indeed normal DAs and DBs and made about 1000 IDchanges. In almost all cases, we agreed each spectrum was oneof a DA or DB white dwarf star, but found they also containedadditional spectral features not fit by our models, resulting innew identifications like DAB, DAH, DA+M, etc. We also lookedat each spectrum autofit failed to classify as a DA or DB dwarfstar, identifying some as other white dwarf subtypes while mostwere simply other non-white-dwarf stellar spectra.
4.1. Spectral Classification
Since autofit can only classify clean DA and DB spectra,we knew we would have to look at its rejected spectra forother white dwarf spectral types. Because we were interested inobtaining accurate mass distributions for our DA and DB stars,we were conservative in labeling a spectrum as a clean DAor DB. That is, we were liberal in adding additional subtypesand uncertainty notations if we saw signs of other elements,companions, or magnetic fields in the spectra. While some ofour mixed white dwarf subtypes would probably be identifiedas clean DAs or DBs with better signal-to-noise (S/N) spectra,few of our identified clean DAs or DBs would likely be foundto have additional spectral features within our detection limit.
To aid searching for other white dwarf subtypes beyondthe DAs and DBs, we selected all objects that had not beensuccessfully fitted as a DA or DB star by autofit and then furtherselected only those with (g − r) < 0.5, (u − g) < 0.8, andg < 19.5. The color cuts helped to limit interlopers since mostwhite dwarf stars fall within these ranges and the magnitudecut simply helps ensure a S/N high enough to allow spectralidentification. We thus obtained a list of 7864 objects that werethen spectrally classified as discussed below. In general, welooked for the following features to aid in the classification foreach specified white dwarf subtype.
1. Balmer lines—normally broad and with a Balmer decre-ment (DA but also DAB, DBA, DZA, and subdwarfs).
2. He i 4471 Å (DB, subdwarfs).3. He ii 4686 Å (DO, PG1159, subdwarfs).4. C2 Swan band or atomic CI lines (DQ).5. Ca ii H and K (DZ, DAZ).6. CII 4367Å (HotDQ).7. Zeeman splitting (magnetic DA)8. Featureless spectrum with significant proper motion (DC).9. Flux increasing in the red (binary, most probably M
companion).
Many of the stars analyzed in this way turned out to be genuineDA or DB white dwarf stars that had been rejected by autofitfor lack of S/N, too many bad pixels in the spectra, uncertaincolors, etc. Many were also multi-subtype white dwarf stars likeDAH, DBA, DAZ, DBZ or DA+M and DB+M.
We found many objects with both strong Balmer lines andHe i lines. These objects are likely double-degenerate binariescomposed of a DA and a DB white dwarf, but following standardnomenclature, we simply classified them as DAB or DBA, as
appropriate. Another group of objects had Balmer lines lessdeep than what is expected for DA white dwarf stars with theirderived effective temperatures. These stars are also most likelydouble degenerates consisting of a DA and a DC white dwarfstar, but were classified as DAs. Tremblay et al. (2011) analyzethese potential double degenerates.
We also found a group of stars to have a very steep Balmerdecrement (i.e., only a broad Hα and sometimes Hβ is observedwhile the other lines are absent) that could not be fit with a purehydrogen grid. We find that these objects are best explained ashelium-rich DAs, as confirmed by fits with a grid of helium-rich white dwarf stars with traces of hydrogen (see Dufouret al. 2007a). These white dwarf stars are most probably formerDZAs where all the metals have gravitationally settled while thehydrogen still floats at the surface.
For the other spectral types (DC, DZ, DQ and HotDQ),we used an appropriate grid and fitted the spectroscopic andphotometric data (see Dufour et al. 2005, 2007a, 2007b; Koester& Wilken 2006; Dufour et al. 2008 for details) to confirm theclassification. Objects that could not be fitted using one of thegrids were thus easily spotted and put in the non-white dwarfcategory.
We finally note that the white dwarf color space also containsmany hot subdwarfs. It is difficult, just by looking at a spectrum,to tell a low-mass white dwarf from a subdwarf. To guide us inthe classification of hot stars, we superposed over the observedspectra a log g = 7 model at the effective temperature given bya fit to the ugriz colors. We then rejected objects showing linesmuch less broad than the synthetic spectrum. We also declareda subdwarf to be anything labeled as a subdwarf (“SD”), DB, orDA by our autofit code with a log g of 6.5 or less and human-classified as either a subdwarf or a DA or a DB. Since the autofit-measured values of Teff and log g are not reliable for anythingother than a clean DA/DB spectrum, anything that passed theautofit subdwarf criteria but was human-classified as anythingother than a subdwarf or clean DA/DB was not classified as asubdwarf. So, for example, some DAMs in our catalog that havelow autofit log g values may actually be subdwarf + M systems.
4.2. Classification Results
Table 1 lists the number of each type of white dwarf starwe identified. Table 2 lists the columns of data provided in ourelectronic catalog file (in comma separated variable format).The full catalog is available in the online version of the journal.
5. SAMPLE COMPLETENESS
As discussed in the Kleinman et al. (2004) and Eisenstein et al.(2006a) catalogs, the spectroscopic sample of white dwarf starsfrom the SDSS is not at all complete. That is, not every whitedwarf star in the SDSS photometric survey has a correspondingSDSS spectrum. There are many complex biases and selectioneffects based on the many different criteria used to obtain thesewhite dwarf spectra. Each individual criterion has a differentpriority when it comes to designating objects in a given part ofthe sky for follow-up spectroscopy, Since the selection criteria,weights, and biases, however, are all known, the completenessof our spectroscopic white dwarf sample is knowable, but isbeyond the focus of this work.
Since we did not look at, or even fit, every SDSS spectrumin DR7, we do need to estimate how complete our catalog iscompared to the overall, but unknown, SDSS spectroscopicwhite dwarf sample. Did we recover every white dwarf with
3

The Astrophysical Journal Supplement Series, 204:5 (14pp), 2013 January Kleinman et al.
Figure 1. Comparisons of our autofit version auto32 fits to atmospheric values in the literature. The diagonal line shows the one-to-one correspondence. The blackcircles are DAs and the blue squares, DBs. The larger scatter seen above Teff ≈ 50,000 K is due to our models assuming local thermodynamic equilibrium (LTE)whereas non-LTE (NLTE) models are needed for these temperatures.
(A color version of this figure is available in the online journal.)
Table 1Numbers of Identified White Dwarf Types
No. of Stars No. of Spectra Type
12 843 14 120 DAs923 1011 DBs628 681 DAH10 22 DBH91 101 Other magnetic559 605 DC409 447 DZ220 243 DQ61 65 DO/PG 11591735 1951 WD+MSa
124 141 WDmixb
951 1020 WDuncc
Notes.a These spectra show both a white dwarf star and a companion, non-white dwarfspectrum, usually a main-sequence M star.b These stars are mixed white dwarf subtypes. We did not attempt to resolve ifthe observed features resulted from single star or multiple star systems.c These spectra were identified as uncertain white dwarf stars.
a spectrum in DR7? One way we can address this question is tosee how many of the Kleinman et al. (2004) and Eisenstein et al.(2006a) white dwarf stars we recovered in our new catalog sinceour candidate selection and fitting were done independently ofthe earlier catalogs.
When comparing our catalog with Table 11 from Eisensteinet al. (2006a), we found 241 missing out of 10,090 objects orabout 2.4%. We then added the missing spectra to our candidatelist and proceeded to analyze them along with the rest of ourcandidates. A spot check of these objects showed that they do notpass the color cuts described in Section 3.1 of Eisenstein et al.(2006a) in either the SDSS DR4 or DR7 database. Eisensteinet al. (2006a) used some preliminary photometry in the earlycandidate selection process and did not redo the candidateselection once the released DR4 photometry became available,so this likely explains why we did not pick them up in ourcandidate list. The completeness of this catalog, therefore, oughtto be at least as good as that of Eisenstein et al. (2006a).
Doing a similar test with Table 5 from Kleinman et al.(2004) resulted in 258 white dwarf stars from the DR1 catalog
not making our candidate list. Fifty-three of them belong toPlate–MJD pairs which are not part of DR7 and 72 stars werethe same as those missing from the Eisenstein et al. (2006a) DR4catalog. So, combined, there were 183 out of 2971 stars fromthe DR1 catalog, or ≈6% not included in either our originalcandidate list or in the DR4 catalog. The candidate selectionparameter space in the DR1 catalog (Kleinman et al. 2004),though, was much more extensive than that used in the DR4catalog (Eisenstein et al. 2006a), and thus, here so that missingparameter space, if included here, would probably result inanother 600 or so white dwarf stars, most of which would becooler and overlap the A and F main-sequence star region.
5.1. Literature Comparison
Figure 1 shows the comparison for 195 DAs and 10 DBsbetween our autofit determinations and those in the literature(Oke et al. 1984; Finley et al. 1997; Friedrich et al. 2000;Claver et al. 2001; Gianninas et al. 2005; Liebert et al. 2005;Lisker et al. 2005; Kawka & Vennes 2006; Kepler et al.2006; Voss et al. 2007; Kilic et al. 2007; Lajoie & Bergeron2007; Stroeer et al. 2007; Holberg et al. 2008; Gansicke et al.2008; Nebot Gomez-Moran et al. 2009; Pyrzas et al. 2009;Allende Prieto et al. 2009; Kilic et al. 2010; Girven et al.2010; Kulkarni & van Kerkwijk 2010). We have not includedin the comparison the values from DR1 or DR4. The figureclearly shows that our fit parameters are generally in very goodagreement with those from the literature, where overlap doesoccur.
Gianninas et al. (2011) obtained S/N � 50 spectra of 177white dwarfs in common with our sample and estimated Teffand log g values for those using the Montreal group atmosphereswith ML2/α = 0.8 convection theory, fitting the line profilesonly. In Figure 2, we plot their determinations and ours for the162 white dwarfs that do not show a companion in our spectra.The agreement is good in spite of the different spectra, differentmodels, and different fitting procedures. For stars hotter thanTeff ≈ 50,000 K the differences are larger because our modelsassume local thermodynamical equilibrium (LTE).
5.2. Consistency
Before rationalizing our identifications and removing thesubdwarf spectra, we found 1683 objects in our catalog with
4

The Astrophysical Journal Supplement Series, 204:5 (14pp), 2013 January Kleinman et al.
Table 2Columns Provided in Data Tables
Column No. Heading Description
1 Name SDSS object name (SDSS 2000J+)2 Plate SDSS plate number3 MJD SDSS Modified Julian date4 Fiber SDSS FiberID5 RA Right ascension6 Dec Declination7 SN_g SDSS g-band signal-to-noise ratio8 u_psf SDSS u-band PSF magnitude9 u_err SDSS u-band PSF magnitude uncertainty10 u_flag SDSS u-band quality control flaga
11 g_psf SDSS g-band PSF magnitude12 g_err SDSS g-band PSF magnitude uncertainty13 g_flag SDSS g-band quality control flaga
14 r_psf SDSS r-band PSF magnitude15 r_err SDSS r-band PSF magnitude uncertainty16 r_flag SDSS r-band quality control flaga
17 i_psf SDSS i-band PSF magnitude18 i_err SDSS i-band PSF magnitude uncertainty19 i_flag SDSS i-band quality control flaga
20 z_psf SDSS z-band PSF magnitude21 z_err SDSS z-band PSF magnitude uncertainty22 z_flag SDSS z-band quality control flaga
23 PM SDSS proper motion (0.01 arsec yr−1)24 PM_angle SDSS proper motion angle (+north through east)25 PM_match SDSS proper motion match (1 = successful match within 1.0 arsec)26 A_g SDSS g-band extinction27 GMT SDSS mjd_r (GMT when row 0 of r measurement read)28 AutoType autofit ID29 T_eff autofit Teff
30 T_err autofit Teff uncertainty31 log_g autofit log g
32 log_gerr autofit log g uncertainty33 chisq autofit χ2 fit measurement34 uniq unique numberb
35 Mass Calculated mass for clean DAs and DBs only36 Mass_err Mass uncertainty37 humanID Human ID assigned this spectrum
a The photometric flag values are processed versions of the flagsband parameter in the SDSS database. It has been logically anded withthe appropriate values to highlight objects that have the following quality control flags set: EDGE, PEAKCENTER, NOPROFILE,BAD_COUNTS_ERROR, INTERP_CENTER, DEBLEND_NOPEAK, PSF_FLUX_INTERP, SATURATED, and NOTCHECKED. Ifthe value is non-zero, then the corresponding SDSS magnitude is suspect.b The unique number is assigned to identify duplicate spectra of the same object. For objects with only one spectrum, the value of thiscolumn is uniq. For objects with more than one spectrum, the value will be dup-xxxx where xxxx is a running number, the same for allspectra of the same object. The spectrum with the highest signal-to-noise ratio for objects with duplicate spectra will be identified withan a at the end of its dup-xxxx name.
(This table is available in its entirety in a machine-readable form in the online journal. A portion is shown here for guidance regardingits form and content.)
more than one spectrum in DR7. There are a total of 3591spectra for these 1683 objects, so most duplicates have only twospectra in total. Two objects have seven DR7 spectra, the most ofall the duplicates. Each duplicate spectrum was independentlyfit by autofit and by eye so we could use the duplicate IDs asa consistency check to our results. Figure 3 shows the resultingcomparison from our autofit results. The average absolute valueof the difference in Teff is 680 K and the average absolute valueof the difference in log g is 0.16.
Of the set of 3591 duplicate spectra, only 242 of themhad human identifications that disagreed with each other. Twohundred and twelve of these agreed in the dominant subtypewith 13 differing only by our uncertainty note, a “:”, indicatingan uncertain identification of the indicated spectral feature. One
hundred and forty-one identifications differed by an additionalsubtype or a subtype and a “:”, and 58 differed by morethan one subtype. The remaining 30 identifications, ≈0.8%of the sample, disagreed in dominant subtype and are mostlyDAB/DBA, DA/DC, and DA/SDB pairs. We examined eachone of these disagreeing IDs and selected the best identification(usually that of the highest S/N spectrum) and applied it to allspectra for each object. In general, we found our classificationswere different only for low S/N spectra.
We also compared our identifications with those made in theEisenstein et al. (2006a) DR4 catalog. Of the 10,090 WDs in theDR4 catalog, 8527 of our IDs agreed; 1563 of them disagreed.Of these 1563 disagreements, 1330 agreed in dominant subtype,with 254 differing only by a “:”, 591 by an additional subtype
5

The Astrophysical Journal Supplement Series, 204:5 (14pp), 2013 January Kleinman et al.
0 20000 40000 60000 80000 100000 0
20000
40000
60000
80000
100000
7 7.5 8 8.5 9 9.5 7
7.5
8
8.5
9
9.5
Figure 2. Comparisons of our autofit fits to atmospheric values in Gianninas et al. (2011).
-0.6
-0.4
-0.2
0
0.2
Tprim (K)
-1
-0.5
0
0.5
1
Figure 3. autofit comparisons of fits to duplicate spectra of clean DA and DB white dwarf stars in our catalog. Solid squares represent objects where the duplicatemeasurements differ by less than 3σ , the ×’s between 3σ and 5σ , and the hollow squares >5σ .
or a subtype and a “:”, and 485 by more than one subtype. Twohundred and twenty-seven, ≈2%, disagree in dominant subtype.Eisenstein et al. (2006a) did not hand-identify each object in thecatalog, relying on autofit to accurately report clean DA and DBsand to identify which subset of objects to look at individually.
Thus, this level of disagreement between our two catalogs seemsconsistent with our 100% hand-checked identifications.
Comparisons of our autofit parameters of the DR4 stars inDR7 with the DR4 fits is a measure of the changes to both ourautofit models and the DR7 SDSS spectral reductions. Figures 4
6

The Astrophysical Journal Supplement Series, 204:5 (14pp), 2013 January Kleinman et al.
10000 15000 20000 25000 30000 35000 40000
6
7
8
9
10
DR4
10000 15000 20000 25000 30000 35000 40000
6
7
8
9
10
DR7
Teff (K)
log(
g)
Figure 4. Comparison of DA log g vs. Teff autofit values for DR4 stars also in DR7. The top panel shows the DR4 values while the bottom panels show our newdeterminations. Our improved model physics have reduced the rise to higher log g at lower temperatures to a bump, improving, but not completely eliminating thiswell-known model artifact (e.g., Tremblay et al. 2010).
15000 20000 25000 30000 35000 40000 45000
7
8
9
10
DR4
DR7
15000 20000 25000 30000 35000 40000 45000
7
8
9
10
Teff (K)
log(
g)
Figure 5. Comparison of DB log g vs. Teff autofit values for DR4 stars also in DR7. The top panel shows the DR4 values while the bottom panels show our newdeterminations.
7

The Astrophysical Journal Supplement Series, 204:5 (14pp), 2013 January Kleinman et al.
50 40 30 20 10 00
0.02
0.04
0.06
0.08
S/N
Figure 6. Percentage of identified magnetic white dwarf spectra as a functionof spectral signal to noise.
and 5 show the DA and DB log g and Teff distributions for theDR7 objects in DR4. The biggest changes occur at the cool endof the DA distribution where the DR4 fit values rise to higherlog g with lower Teff , a change due to the improved input modelneutral broadening physics discussed earlier. Our new modelgrid’s increase in range in log g and Teff is also clearly evidentin these figures.
6. RESULTS
Besides producing the catalog itself, which we hope willspawn many future papers and much analysis, we report hereon the increased number of magnetic white dwarf stars foundin this catalog, compared with those previous. We also lookat the mass distribution of our DA and DB samples and find adecidedly non-Gaussian DA mass distribution and a statisticallysignificant difference in mean mass between the DAs and theDBs. As in Eisenstein et al. (2006a) and Eisenstein et al. (2006b),we again find no statistically significant DB gap.
6.1. Magnetic Fields and Zeeman Splittings
When examining each candidate spectrum, we found hun-dreds of stars with Zeeman splittings indicating magnetic fieldsabove 3 MG (the limit below which we do not think we canaccurately identify) that if not identified as magnetic in origin,would have rendered inaccurate autofit Teff and too high log gdeterminations. We ended up classifying 628 DAHs, 10 DBHs,and 91 mixed atmosphere magnetics, compared to only 60 mag-netic white dwarf stars of all types identified in Eisenstein et al.(2006a).
Schmidt et al. (2003) found 53 magnetic white dwarf stars inDR1 and Vanlandingham et al. (2005) found 52 in DR3 data.Most of these stars did not make the Eisenstein et al. (2006a)DR4 catalog because they did not meet the candidate selectioncriteria.
We also identified several hundred possible magnetic starswith low S/N spectra that made solid identifications difficult.These objects are accounted for in the WDunc category in
010203
0
20
40
60
S/N
Figure 7. Number of identified DAH stars as a function of spectral signal tonoise.
Table 1. Wishing to not bias our mass distribution with amagnetic sample, we chose to label them uncertain magnetic(DH:) stars since even fields as low as ≈3 or more MG willaffect autofit gravity determinations substantially.
Kulebi et al. (2009) independently found 44 of our newly clas-sified magnetic DAs and fitted the SDSS spectra to atmosphericmodels including off-centered dipoles, assuming log g = 8.
Here, we are reporting the number of magnetic white dwarfsstars relative to those non-magnetic to be roughly 3.5%. Thisnumber is in reasonable agreement with Schmidt & Smith(1995), for example, but is significantly larger than the ≈0.1%and 1.5% reported in the DR4 (Eisenstein et al. 2006a) and DR1(Kleinman et al. 2004) catalogs, respectively. The DR4 catalogwas based primarily on computer identifications, supplementedby only partial human checks, thereby explaining part ofthe reason for the lower numbers of magnetic white dwarfidentifications in Eisenstein et al. (2006a). Beyond this cause,however, the algorithm we used to manually identify possiblemagnetic white dwarf stars developed significantly since theDR1 and DR4 catalogs. Combined with our desire to develop aclean sample for mass estimation, we ended up with the larger,though plausible, percentage gain of magnetic white dwarf starsseen here.
To validate our identification methods, we conducted severalblind simulations where we hand-identified model spectra withvarying amounts of added noise and magnetic field strength(from 0 to 800 MG). These simulations are reported in moredetail in Kepler et al. (2012), but the summary result is thatour human identifications were proven valid for spectra withS/N > 8 and B > 2MG. In addition, at the very largestmagnetic field strengths, we found we are not identifying all themagnetic white dwarf stars, instead labeling them as unknownstars or sometimes, DC. Figure 6 shows the percentage ofidentified magnetic DA white dwarf stars as a function ofspectral S/N and Figure 7 shows the absolute number of DAHidentifications per S/N bin. These plots suggest that belowS/N < 8, at least half of our ≈280 DAH identifications arelikely magnetic and that spectra below ≈S/N < 8 ought to
8

The Astrophysical Journal Supplement Series, 204:5 (14pp), 2013 January Kleinman et al.
be confirmed with higher S/N and possibly higher resolutionspectra before declaring them magnetic or not.
6.2. Mean Masses
To calculate the mass of our identified clean DA and DBstars from the Teff and log g values obtained from our fits,we used the mass–radius relations of Renedo et al. (2010) forcarbon–oxygen DA white dwarfs. These relations are basedon full evolutionary calculations appropriate for the study ofhydrogen-rich DA white dwarfs that take into account the fullevolution of progenitor stars from the zero-age main sequencethrough the core hydrogen-burning phase, the helium-burningphase, and the thermally pulsing asymptotic giant branch phase.The stellar mass values of the resulting sequences are: 0.525,0.547, 0.570, 0.593, 0.609, 0.632, 0.659, 0.705, 0.767, 0.837,and 0.878 M�. These sequences are supplemented by sequencesof 0.935 and 0.98 M� calculated specifically for this work. Forhigh-gravity white dwarf stars, we employed the mass–radiusrelations for oxygen/neon core white dwarf stars given inAlthaus et al. (2005) in the mass range from 1.06 to 1.36 M�with a step of 0.02 M�. For the low-gravity white dwarfstars, we used the evolutionary calculations of Althaus et al.(2009b) for helium-core white dwarf stars. These sequences arecharacterized by stellar mass values of 0.22, 0.25, 0.303, 0.40,and 0.452 M�. They were complemented with the sequences of0.169 and 0.196 M� taken from Althaus et al. (2010).
For DB white dwarf stars, we relied on the evolutionarycalculations of hydrogen-deficient white dwarf stars of 0.515,0.530, 0.542, 0.565, 0.584, 0.609, 0.664, 0.741, and 0.870 M�computed by Althaus et al. (2009a). These sequences constitutean improvement over previous calculations. In particular, theyhave been derived from the born-again episode responsible forthe hydrogen deficiency. For high-gravity DBs, we used theoxygen/neon evolutionary sequences described above for thecase of a hydrogen-deficient composition.
These evolutionary sequences constitute a complete and ho-mogeneous grid of white dwarf models that captures the corefeatures of progenitor evolution, in particular the internal chemi-cal structures expected in the different types of white dwarf stars.
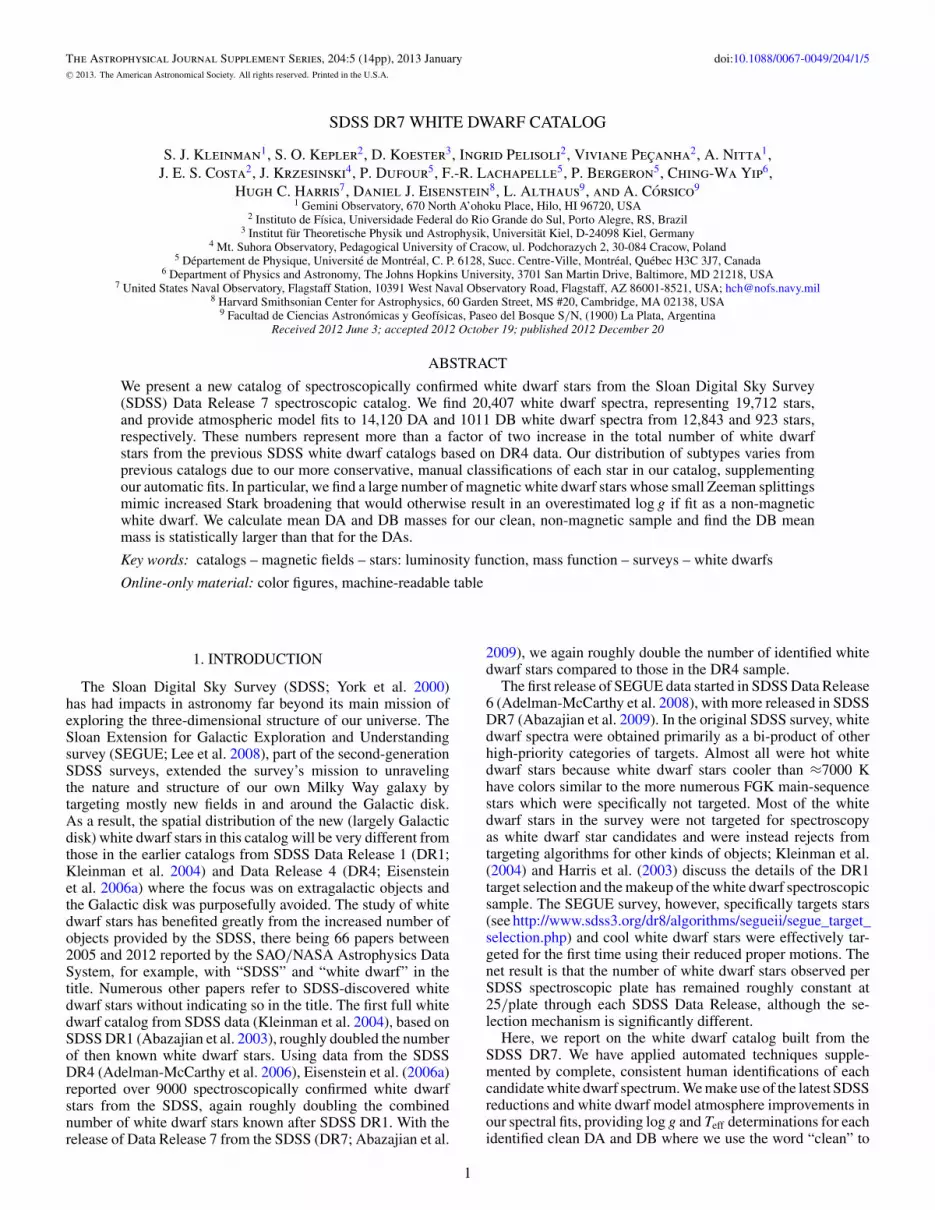
To calculate reliable mass distributions, we selected only thebest S/N spectra with temperatures well fit by our models. Wefind reliable classifications can be had from spectra with S/N� 15, in agreement with Tremblay et al. (2011). We classified14,120 spectra as clean DAs, but selecting the highest S/Nspectra for those with duplicate spectra, we are left with 12,813clean DA stars. Of these DAs, 3577 have a spectrum withS/N � 15, with a mean S/N = 25 ± 10. Using this sample,we obtain 〈MDA〉 = 0.623 ± 0.002 M�.
This mean mass estimate is incorrect, however, if we believethe apparent increase in fit log g at low Teff is an artifact of ourmodels and not inherent in the stars. Although Liebert et al.(2003), Kepler et al. (2007, 2010), Tremblay et al. (2011), andGianninas et al. (2011) all show an increase in measured log gfor DAs with measured temperatures of order 12,000–13,000 Kor less, this increase is probably due to missing physics inthe models and not due to the stars, since the photometricdeterminations and gravitational redshifts (Koester & Knist2006; Falcon et al. 2010) do not show this log g increase.
We therefore further restricted our sample to those DAs witha measured Teff > 13,000 K, and from a sample of now 2217objects, we determined 〈MTeff>13,000K
DA 〉 = 0.593 ± 0.002 M�.Our mean DA mass is smaller than that of Tremblay &
Bergeron (2009), even though we are using the same Stark
broadening and microfield as they are. Our sample is five timeslarger, however, and we have removed suspected magneticDAs from our sample, which would otherwise increase ourmeasured mean mass. Limoges & Bergeron (2010), with thesame models as Tremblay & Bergeron (2009), obtained amean mass of 0.606 ± 0.135 M� for their KISO survey DAsample, and 0.758 ± 0.192 M� for their DB sample. Falconet al. (2010) determined the mean ensemble mass of a sampleof 449 DAs observed in the ESO SN Ia progenitor survey(SPY) project, using their mean gravitational redshift and found〈M〉 = 0.647 ± 0.014 M�, a value substantially higher thanours. This value is independent of the line profiles themselvesand therefore should not be affected by linear magnetic fieldeffects. At the resolution of the SPY data (Koester et al. 2001),Koester et al. (2009b) were able to identify fields larger than90 kG, so the contribution of nonlinear magnetic effects shouldalso be negligible. Gianninas et al. (2011), using ML2/α = 0.8models, find 〈M〉 = 0.638 M� by fitting line profiles for highS/N spectra for stars hotter than Teff = 13,000 K. Romeroet al. (2012) also report a mean mass of 0.636 M� for theirasteroseismological analysis of 44 bright pulsating DA (ZZ Ceti,or DAV) stars.
If ≈10% of our S/N > 15, Teff > 13,000 K stars werenon-magnetic with masses of order 0.9 M�, our mean DAmass would rise to ≈0.63 M�, more consistent with previousmeasurements. Such a number, though, would require all ouridentified magnetic stars, and then some, to be both massiveand non-magnetic, so our lower mass estimate can be onlypartially explained by our magnetic white dwarf identifications.Additionally, we note that the Tremblay et al. (2011) re-analysisof the DR4 white dwarf stars resulted in a measurement of〈MDA〉 = 0.613 M�, again lower than most previous studiesand similar to our new measurement.
The 1011 spectra we classified as clean DBs belong to 923stars. One hundred and ninety-one of these have a spectralS/N � 15, with a mean S/N = 23 ± 7. Using this high S/Nsample, we obtain 〈MDB〉 = 0.685±0.013 M�. Restricting thissample to just those hotter than Teff = 16,000 K, again assumingthe increase in measured log g seen below this temperature isan artifact of the models and not inherent to the stars, we obtain140 stars, resulting in 〈MTeff>16,000K
DB 〉 = 0.676 ± 0.014 M�.The masses of DAs and DBs are therefore statistically different,as also found by Kepler et al. (2007), Tremblay et al. (2010),and Bergeron et al. (2011). This difference is consistent withthe possibility that DBs come through a very late thermal pulsephase, which burns the remaining surface H after reaching thewhite dwarf cooling phase. Figure 8 shows the obtained masshistograms for our final DA and DB samples.
6.3. DB Gap
Liebert et al. (1986) and Liebert et al. (1987) show that of thetotal of 98 DBs known then, none were known in the temperaturerange 30,000 � Teff � 45,000 K. They created the term DBgap for this observed dearth of helium-dominated atmospherewhite dwarfs in this temperature region. Subsequent DB studiesdid not find more than one star in this temperature range, untilthe 10–28 DBs and DOs found in DR4 by Eisenstein et al.(2006b). Hugelmeyer & Dreizler (2009) show that non-LTE(NLTE) effects change the measured Teff by less than 15% overthose obtained by LTE atmosphere models like we use, too smalla difference to move all the stars within the DB gap, outside of it.
Of the 923 stars we classified as clean DBs, we find 9 hotterthan Teff = 45,000 K, 30 with 45,000 K � Teff � 30,000 K, and
9
The Astrophysical Journal Supplement Series, 204:5 (14pp), 2013 January Kleinman et al.
0
100
200
300
400
15.00
0
10
20
30
Figure 8. Histogram of the masses for S/N �15 clean DAs (upper panel) hotterthan Teff = 13,000 K and DBs (lower panel) hotter than Teff = 16,000 K.
231 with 30,000 K � Teff � 20,000 K. If we restrict ourselvesto only the 57 (of the 923) stars with S/N � 25, we find 1 hotterthan Teff = 45,000 K, 3 with 45,000 K � Teff � 30,000 K,and 18 with 30,000 K � Teff � 20,000 K, following the ratioexpected from their ages (1/6:1/18:1, Althaus et al. 2009a, e.g.).
Our numbers are in line with the Eisenstein et al. (2006a)finding that there is a decrease in the number, although not agap, of DBs around 30,000–45,000 K in relation to the hotterDO range.
As evidenced in Bergeron et al. (2011), for example, fittinga large sample such as this with model DB stars consistingof pure helium atmospheres, as we have done here, is notcompletely correct. Even small (i.e., undetectable) amounts oftrace hydrogen in the helium layer of a DB can cause significanterrors to Teff and log g determinations made by fitting purehelium outer atmospheres. Hence, our results here are indicativeof an avenue worth exploring, but more detailed fitting may beneeded to arrive at more concrete conclusions.
7. CONCLUSIONS AND DISCUSSION
By classifying all our candidate white dwarf spectra by eye,supplemented by our autofit fitting of our DA and DB spectra, weroughly doubled the number of previously known white dwarfstars and formed a large sample of clean DA and DB spectra inorder to study their mass distributions. Our identifications areconservative in that we wanted to make sure we had a cleanDA and DB samples for our mass analyses, so we erred, ifat all, on the side of overinterpreting the spectra rather thanunderinterpreting them. As a result, we identified a number oflow-field magnetic white dwarf stars that represent a five-foldincrease in the number of known magnetic white dwarf stars. Wenonetheless believe these identifications are correct and suggestthat previous mass distribution analyses may have been biasedtoward higher masses, given that these low-field magnetic starswere not previously recognized as magnetic in earlier massdistribution measurements.
6 7 8 9 10
0
200
400
600
log g [cgs]
DBs
DAs
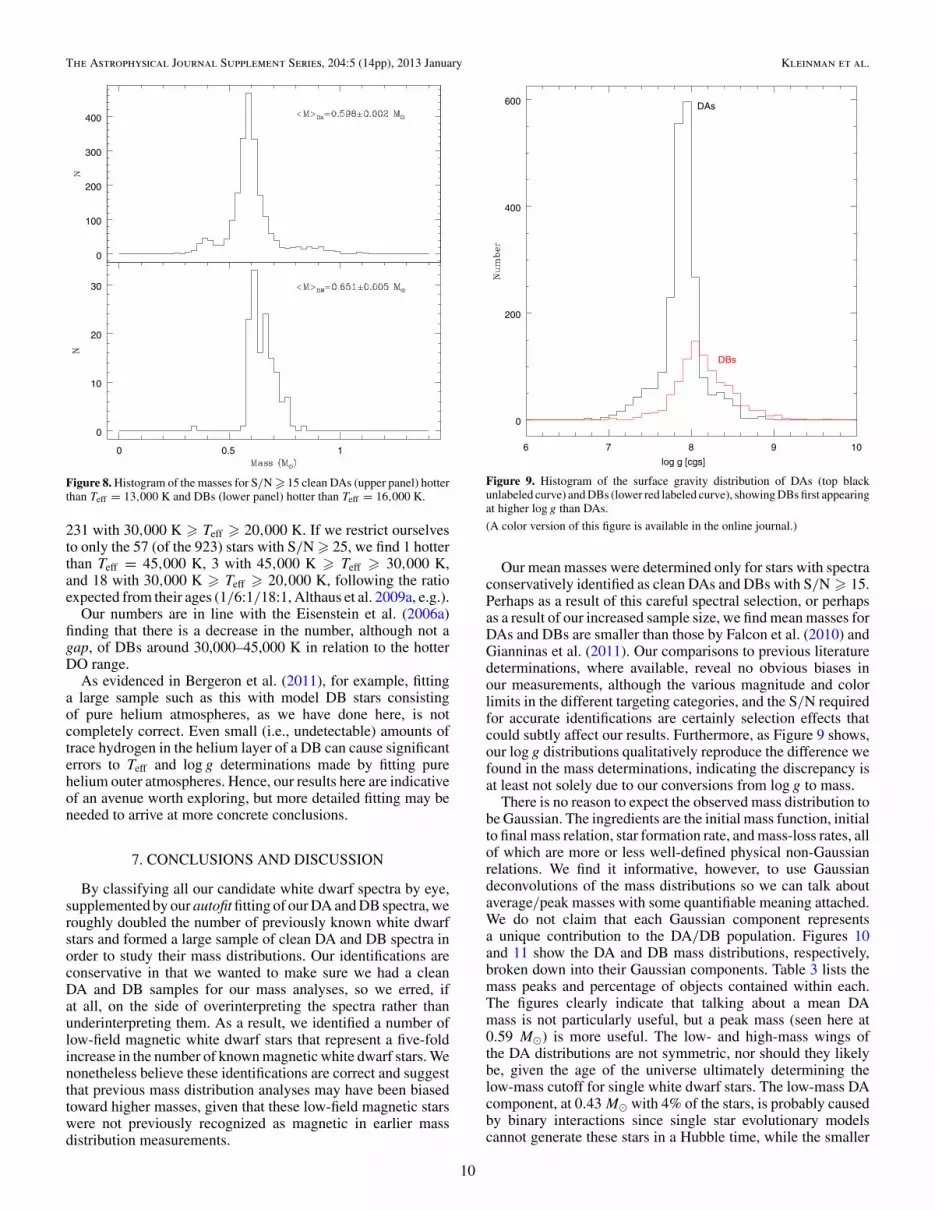
Figure 9. Histogram of the surface gravity distribution of DAs (top blackunlabeled curve) and DBs (lower red labeled curve), showing DBs first appearingat higher log g than DAs.
(A color version of this figure is available in the online journal.)
Our mean masses were determined only for stars with spectraconservatively identified as clean DAs and DBs with S/N � 15.Perhaps as a result of this careful spectral selection, or perhapsas a result of our increased sample size, we find mean masses forDAs and DBs are smaller than those by Falcon et al. (2010) andGianninas et al. (2011). Our comparisons to previous literaturedeterminations, where available, reveal no obvious biases inour measurements, although the various magnitude and colorlimits in the different targeting categories, and the S/N requiredfor accurate identifications are certainly selection effects thatcould subtly affect our results. Furthermore, as Figure 9 shows,our log g distributions qualitatively reproduce the difference wefound in the mass determinations, indicating the discrepancy isat least not solely due to our conversions from log g to mass.
There is no reason to expect the observed mass distribution tobe Gaussian. The ingredients are the initial mass function, initialto final mass relation, star formation rate, and mass-loss rates, allof which are more or less well-defined physical non-Gaussianrelations. We find it informative, however, to use Gaussiandeconvolutions of the mass distributions so we can talk aboutaverage/peak masses with some quantifiable meaning attached.We do not claim that each Gaussian component representsa unique contribution to the DA/DB population. Figures 10and 11 show the DA and DB mass distributions, respectively,broken down into their Gaussian components. Table 3 lists themass peaks and percentage of objects contained within each.The figures clearly indicate that talking about a mean DAmass is not particularly useful, but a peak mass (seen here at0.59 M�) is more useful. The low- and high-mass wings ofthe DA distributions are not symmetric, nor should they likelybe, given the age of the universe ultimately determining thelow-mass cutoff for single white dwarf stars. The low-mass DAcomponent, at 0.43 M� with 4% of the stars, is probably causedby binary interactions since single star evolutionary modelscannot generate these stars in a Hubble time, while the smaller
10

The Astrophysical Journal Supplement Series, 204:5 (14pp), 2013 January Kleinman et al.
0.2 0.4 0.6 0.8 1 1.2 1.4
0
100
200
300
400
Figure 10. Histogram of the masses for S/N � 15 clean DAs hotter thanTeff = 13,000 K and its Gaussian decomposition.
(A color version of this figure is available in the online journal.)
0.2 0.4 0.6 0.8 1 1.2 1.4
0
10
20
Figure 11. Histogram of the masses for S/N � 15 clean DBs hotter thanTeff = 16,000 K and its Gaussian decomposition.
(A color version of this figure is available in the online journal.)
high-mass peak at 0.82 M� is likely due to mergers. The peakof the DB mass distribution (Figure 11) at ≈0.6 M� is similarthat of the DA distribution although the overall shape is quitedifferent.
The Teff distributions shown in Figure 12 do not reveal a DBgap, i.e., we do detect stars with He i-dominated atmosphereshotter than Teff = 30,000 K, but there does seem to be a decreaseof cooler DBs, which simply become DCs, DQs, DZs as theycool below ≈10,000 K.
0
200
400
600
800
1000
60000 50000 40000 30000 20000 10000
0
50
100
DAs
DBs
Figure 12. Histogram of the Teff distribution for our DA (top) and DB (lower)samples.
Table 3Gaussian Components of Observed DA and DB Mass Distributions
Component Mean Strength(M�) (%)
DA
1 0.589 562 0.587 253 0.822 134 0.389 6
DB
1 0.693 392 0.640 353 0.599 26
Although our measured mean mass for our DB sample ishigher than that of our DAs, the mass distributions show thatthe largest number of DBs have masses similar to peak DAdistribution. The high-mass tail of the DB distribution could bethe result of a varying number of thermal pulses or of varyingmetallicity in the DB progenitors. It may also be that the highermass DB progenitors are simply more prone to experience avery late thermal pulse than are lower mass DB progenitors.The trace low-mass component in the DB distribution may beassociated with AM CVn stars, double He WDs, and a result ofbinary evolution.
We thank Matt Burleigh for thorough and useful commentsduring the referee process. This work was partially supported bythe Gemini Observatory which is operated by the Associationof Universities for Research in Astronomy, Inc., on behalf of theinternational Gemini partnership of Argentina, Australia, Brazil,Canada, Chile, the United Kingdom, and the United States ofAmerica. Funding for the SDSS and SDSS-II has been providedby the Alfred P. Sloan Foundation, the Participating Institutions,the National Science Foundation, the U.S. Department of
11

The Astrophysical Journal Supplement Series, 204:5 (14pp), 2013 January Kleinman et al.
Energy, the National Aeronautics and Space Administration,the Japanese Monbukagakusho, the Max Planck Society, andthe Higher Education Funding Council for England. The SDSSWeb Site is http://www.sdss.org/.
The SDSS is managed by the Astrophysical Research Con-sortium for the Participating Institutions. The Participating In-stitutions are the American Museum of Natural History, As-trophysical Institute Potsdam, University of Basel, Universityof Cambridge, Case Western Reserve University, Universityof Chicago, Drexel University, Fermilab, the Institute for Ad-vanced Study, the Japan Participation Group, Johns HopkinsUniversity, the Joint Institute for Nuclear Astrophysics, the
Kavli Institute for Particle Astrophysics and Cosmology, theKorean Scientist Group, the Chinese Academy of Sciences(LAMOST), Los Alamos National Laboratory, the Max-Planck-Institute for Astronomy (MPIA), the Max-Planck-Institute forAstrophysics (MPA), New Mexico State University, Ohio StateUniversity, University of Pittsburgh, University of Portsmouth,Princeton University, the United States Naval Observatory, andthe University of Washington. P.D. is a CRAQ postdoctoral fel-low. This work was supported in part by NSERC Canada andFQRNT Quebec. S.O.K., I.P., V.P., and J.E.S. were supportedby FAPERGS and CNPq-Brazil.
Facility: Sloan
APPENDIX
SQL QUERY LISTINGS
This is the SQL code used to reproduce the Eisenstein et al. (2006a) candidate selection criteria.SELECTs.plate, s.mjd, s.fiberid,p.ObjId, p.psfMag_u, p.psfMag_g, p.psfMag_r, p.psfMag_i, p.psfMag_z,p.ra, p.dec, s.z, u.propermotion, t.bsz, t.zbclass
FROM SpecObjAll s INNER JOIN PhotoObjAll p ON s.bestObjId=p.ObjIDLEFT OUTER JOIN sppParams t on s.specObjID=t.specObjIDLEFT OUTER JOIN USNO u on s.bestObjID=u.ObjID
WHERE p.psfMag_u <21.5
AND p.extinction_r <=0.6
AND–either −2 <u−g < 0.833 − 0.667(g−r), −2 < g−r < 0.2( ((p.psfMag_u-p.psfMag_g between −2 and
(0.833-0.667*(p.psfMag_g-p.psfMag_r)))and (p.psfMag_g-p.psfMag_r between -2 and 0.2))
OR – or 0.2<g-r<1, |(r-i)-0.363(g-r)|>0.1,– ( (u-g<0.7) or (u-g<2.5(g-r)-0.5)((p.psfMag_g-p.psfMag_r between 0.2 and 1)
and (Abs((p.psfMag_r-p.psfMag_i)-0.363*(p.psfMag_g-p.psfMag_r))>0.1)and ( ((p.psfMag_u-p.psfMag_g)<0.7)
or ((p.psfMag_u-p.psfMag_g)<2.5*(p.psfMag_g-p.psfMag_r)-0.5) )))
AND—the following is for specBS only; – low redshift and not a galaxy(((t.bsz <0.003)
and (t.zbclass <> ’GALAXY’))
OR– flags for all filters are OK((p.flags_u | p.flags_g | p.flags_r | p.flags_i | p.flags_z) &
(dbo.fPhotoFlags(’INTERP_CENTER’) |dbo.fPhotoFlags(’COSMIC_RAY’) |dbo.fPhotoFlags(’EDGE’) |dbo.fPhotoFlags(’SATURATED’))=0)
AND — small measured z with a good z determination(( (Abs(s.z)<0.003) and
((s.zwarning&1)=0))OR — large measured z, but with a high proper motion( (Abs(s.z)>0.003) and(Abs(u.propermotion)>30) )))
ORDER BY s.plate, s.mjd, s.fiberid
12

The Astrophysical Journal Supplement Series, 204:5 (14pp), 2013 January Kleinman et al.
The SQL code below was used to for the second half of candidate generation as discussed in the text.– find all objects targeted as WD, HOTSTD,– classified as CV, CWD, WD, WDm,SELECT t.plate, t.mjd, t.fiberID,
s.targettype, s.seguetargetclass,s.sptypea, s.zbsubclass,s.flag,t.primTarget, t.secTarget, t.seguePrimTarget, t.segueSecTarget
FROM sppParams s left outer join specObjAll tON
t.specobjid=s.specobjidWHERE— SEGUE TARGETing
(s.targettype LIKE ’SEGUE_WD%’) OR(s.targettype = ’STAR_WHITE_DWARF’) OR(s.targettype = ’HOT_STD’) OR(s.seguetargetclass = ’HOT’) OR(s.seguetargetclass = ’WD’) OR
— SEGUE CLASSIFICATIONS(s.sptypea LIKE ’%WD%’) OR(s.sptypea LIKE ’%CV%’) OR(s.zbsubclass LIKE ’%WD%’) OR(s.zbsubclass LIKE ’%CV%’) OR(s.flag LIKE ’D%’) — likely WD(s.flag LIKE ’d%’) — likely SD
— TARGETing from SpecObj (primTarget should be same as targettype)((t.primTarget & 0x000A0000) > 1) OR – WD or CATY_VAR((t.secTarget & 0x00000200) >1) OR – HOT_STD((t.seguePrimTarget & 0x000A0000) > 1) OR – WD or CATY_VAR((t.segueSecTarget & 0x00000200) >1) – HOT_STD
ORDER by t.plate, t.mjd, t.fiberID
REFERENCES
Abazajian, K., Adelman-McCarthy, J. K., Ageros, M. A., et al. 2003, AJ,126, 2081
Abazajian, K. N., Adelman-McCarthy, J. K., Ageros, M. A., et al. 2009, ApJS,182, 543
Adelman-McCarthy, J. K., Ageros, M. A., Allam, S. S., et al. 2006, ApJS,162, 38
Adelman-McCarthy, J. K., Augeros, M. A., Allam, S. S., et al. 2008, ApJS,175, 297
Allende Prieto, C., Hubeny, I., & Smith, J. A. 2009, MNRAS, 396, 759Ali, A. W., & Griem, H. R. 1965, PhRv, 140, A1044Althaus, L. G., Garcıa-Berro, E., Isern, J., & Corsico, A. H. 2005, A&A,
441, 689Althaus, L. G., Panei, J. A., Miller Bertolami, M. M., et al. 2009a, ApJ,
704, 1605Althaus, L. G., Panei, J. A., Romero, A. D., et al. 2009b, A&A, 502, 207Althaus, L. G., Serenelli, A. M., & Benvenuto, O. G. 2010, MNRAS, 323, 471Barklem, P. S., Piskunov, N., & O’Mara, B. J. 2000, A&A, 363, 1091Beauchamp, A., Wesemael, F., & Bergeron, P. 1997, ApJS, 108, 559Bergeron, P., Wesemael, F., Dufour, P., et al. 2011, ApJ, 737, 28Claver, C. F., Liebert, J., Bergeron, P., & Koester, D. 2001, ApJ, 563, 987Corsico, A. H., Althaus, L. G., Miller Bertolami, M. M., & Garcia-Berro, E.
2009, JPhCS, 172, 012075Debes, J. H., Hoard, D. W., Wachter, S., Leisawitz, D. T., & Cohen, M.
2011, ApJS, 197, 38Dufour, P., Bergeron, P., & Fontaine, G. 2005, ApJ, 627, 404Dufour, P., Bergeron, P., Liebert, J., et al. 2007a, ApJ, 663, 1291Dufour, P., Fontaine, G., Liebert, J., Schmidt, G. D., & Behara, N. 2008, ApJ,
683, 978Dufour, P., Liebert, J., Fontaine, G., & Behara, N. 2007b, Natur, 450, 522Eisenstein, D. J., Liebert, J., Harris, H. C., et al. 2006a, ApJS, 167, 40Eisenstein, D. J., Liebert, J., Koester, D., et al. 2006b, AJ, 132, 676Falcon, R. E., Winget, D. E., Montgomery, M. H., & Williams, K. A. 2010, ApJ,
712, 585Finley, D. S., Koester, D., & Basri, G. 1997, ApJ, 488, 375
Friedrich, S., Koester, D., Christlieb, N., Reimers, D., & Wisotzki, L. 2000,A&A, 363, 1040
Gansicke, B. T., Koester, D., Marsh, T. R., Rebassa-Mansergas, A., & South-worth, J. 2008, MNRAS, 391, L103
Gianninas, A., Bergeron, P., & Fontaine, G. 2005, ApJ, 631, 1100Gianninas, A., Bergeron, P., & Ruiz, M. T. 2011, ApJ, 743, 138Girven, J., Gansicke, B. T., Kulebi, B., et al. 2010, MNRAS, 404, 159Girven, J., Gansicke, B. T., Steeghs, D., & Koester, D. 2011, MNRAS,
417, 1210Harris, H. C., Liebert, J., Kleinman, S. J., et al. 2003, AJ, 126, 1023Holberg, J. B., Bergeron, P., & Gianninas, A. 2008, AJ, 135, 1239Hooper, C. F. 1966, PhRv, 149, 77Hooper, C. F. 1968, PhRv, 165, 215Hugelmeyer, S. D., & Dreizler, S. 2009, JPhCS, 172, 012048Kawka, A., & Vennes, S. 2006, ApJ, 643, 402Kepler, S. O., Castanheira, B. G., Costa, A. F. M., & Koester, D. 2006, MNRAS,
372, 1799Kepler, S. O., Kleinman, S. J., Nitta, A., et al. 2007, MNRAS, 375, 1315Kepler, S. O., Kleinman, S. J., Pelisoli, I., et al. 2010, in AIP Conf. Proc., 1273,
17th European White Dwarf Workshop, ed. K. Werner & T. Rauch (Melville,NY: AIP), 19
Kepler, S. O., Pelisoli, I., Jordan, S., et al. 2012, MNRAS, submittedKilic, M., Allende Prieto, C., Brown, W. R., & Koester, D. 2007, ApJ, 660, 1451Kilic, M., Munn, J. A., Williams, K. A., et al. 2010, ApJ, 715, L21Kleinman, S. J., Harris, H. C., Eisenstein, D. J., et al. 2004, ApJ, 607, 426Koester, D. 2010, Mem. Soc. Astron. Ital., 81, 921Koester, D., Girven, J., Gansicke, B. T., & Dufour, P. 2011, A&A, 530, A114Koester, D., Kepler, S. O., Kleinman, S. J., & Nitta, A. 2009a, JPhCS,
172, 012006Koester, D., & Knist, S. 2006, A&A, 454, 951Koester, D., Napiwotzki, R., Christlieb, N., et al. 2001, A&A, 378, 556Koester, D., Voss, B., Napiwotzki, R., et al. 2009b, A&A, 505, 441Koester, D., & Wilken, D. 2006, A&A, 453, 1051Kulebi, B., Jordan, S., Euchner, F., Gansicke, B. T., & Hirsch, H. 2009, A&A,
506, 1341Kulkarni, S. R., & van Kerkwijk, M. H. 2010, ApJ, 719, 1123
13

The Astrophysical Journal Supplement Series, 204:5 (14pp), 2013 January Kleinman et al.
Lajoie, C.-P., & Bergeron, P. 2007, ApJ, 667, 1126Lee, Y. S., Beers, T. C., Sivarani, T., et al. 2008, AJ, 136, 2022Lemke, M. 1997, A&AS, 122, 285Leo, P. J., Peach, G., & Whittingham, I. B. 1995, JPhB, 28, 591Liebert, J., Bergeron, P., & Holberg, J. B. 2005, ApJS, 156, 47Liebert, J., Fontaine, G., & Wesemael, F. 1987, MmSAI, 58, 17Liebert, J., Kirkpatrick, J. D., Cruz, K. L., et al. 2003, AJ, 125, 343Liebert, J., Wesemael, F., Hansen, C. J., et al. 1986, ApJ, 309, 241Limoges, M.-M., & Bergeron, P. 2010, ApJ, 714, 1037Lisker, T., Heber, U., Napiwotzki, R., et al. 2005, A&A, 430, 223Marsh, T. R., Gansicke, B. T., Steeghs, D., et al. 2011, ApJ, 736, 95Montgomery, M. H. 2007, CoAst, 150, 253Montgomery, M. H., Provencal, J. L., Kanaan, A., et al. 2010, ApJ, 716, 84Mullamphy, D. F. T., Peach, G., & Whittingham, I. B. 1991, JPhB, 24, 3709Nayfonov, A., Dappen, W., Hummer, D. G., & Mihalas, D. 1999, ApJ, 526, 451Nebot Gomez-Moran, A., Schwope, A. D., Schreiber, M. R., et al. 2009, A&A,
495, 561Oke, J. B., Weidemann, V., & Koester, D. 1984, ApJ, 281, 276Plotkin, R. M., Anderson, S. F., Brandt, W. N., et al. 2010, AJ, 139, 390Pyrzas, S., Gansicke, B. T., Marsh, T. R., et al. 2009, MNRAS, 394, 978Rebassa-Mansergas, A., Nebot Gomez-Moran, A., Schreiber, M. R., et al.
2012, MNRAS, 419, 806
Renedo, I., Althaus, L. G., Miller Bertolami, M. M., et al. 2010, ApJ,717, 183
Romero, A. D., Corsico, A. H., Althaus, L. G., et al. 2012, MNRAS,420, 1462
Schmidt, G. D., Harris, H. C., Liebert, J., et al. 2003, ApJ, 595, 1101Schmidt, G. D., & Smith, P. S. 1995, ApJ, 448, 305Schneider, D. P., Richards, G. T., Hall, P. B., et al. 2010, AJ, 139, 2360Silvestri, N. M., Hawley, S. L., West, A. A., et al. 2006, AJ, 131, 1674Steele, P. R., Burleigh, M. R., Dobbie, P. D., et al. 2011, MNRAS, 416, 2768Stroeer, A., Heber, U., Lisker, T., et al. 2007, A&A, 462, 269Tremblay, P.-E., & Bergeron, P. 2009, ApJ, 696, 1755Tremblay, P.-E., Bergeron, P., & Gianninas, A. 2011, ApJ, 730, 128Tremblay, P.-E., Bergeron, P., Kalirai, J. S., & Gianninas, A. 2010, ApJ,
712, 1345Unsold, A. 1968, Physik der Sternatmospharen (Berlin: Springer)Vanlandingham, K. M., Schmidt, G. D., Eisenstein, D. J., et al. 2005, AJ,
130, 734Voss, B., Koester, D., Napiwotzki, R., Christlieb, N., & Reimers, D. 2007,
arXiv:0706.2936Yip, C. W., Connolly, A. J., Szalay, A. S., et al. 2004a, AJ, 128, 585Yip, C. W., Connolly, A. J., Vanden Berk, D. E., et al. 2004b, AJ, 128, 2603York, D. G., Adelman, J., Anderson, J. E., et al. 2000, AJ, 120, 1579
14


