Embed Size (px)
Citation preview
International Journal of Coal Geology 90–91 (2012) 110–125
Contents lists available at SciVerse ScienceDirect
International Journal of Coal Geology
j ourna l homepage: www.e lsev ie r .com/ locate / i j coa lgeo
Seal evaluation and confinement screening criteria for beneficial carbon dioxidestorage with enhanced coal bed methane recovery in the Pocahontas Basin, Virginia
Ryan P. Grimm a,⁎, Kenneth A. Eriksson a, Nino Ripepi b, Cortland Eble c, Stephen F. Greb c
a Department of Geosciences, Virginia Tech, Blacksburg, VA 24061, USAb Virginia Center for Coal and Energy Research, Virginia Tech, Blacksburg, VA 24061, USAc Kentucky Geological Survey, University of Kentucky, Lexington, KY 40506, USA
⁎ Corresponding author at: Chevron Energy Techn77002, USA. Tel.: +1 585 733 3585; fax: +1 540 231 3
E-mail address: [email protected] (R.P. Gri
0166-5162/$ – see front matter © 2011 Elsevier B.V. Alldoi:10.1016/j.coal.2011.11.002
a b s t r a c t
a r t i c l e i n f oArticle history:Received 10 September 2010Received in revised form 6 November 2011Accepted 7 November 2011Available online 17 November 2011
Keywords:Seal characterizationCarbon sequestrationEnhanced coal bed methaneAppalachian BasinCarbon dioxide
The geological storage of carbon dioxide in Appalachian basin coal seams is one possible sink for sequestra-tion of greenhouse gases, with the added benefit of enhanced-coal bed methane (ECBM) recovery. The Poca-hontas Basin (part of the central Appalachian Basin) of southwestern Virginia is a major coal bed methane(CBM) province with production mostly from coal beds in the Lower Pennsylvanian Pocahontas and NewRiver formations. As part of the Southeast Regional Carbon Sequestration Partnership's Phase II research pro-gram, a CO2-injection demonstration well was installed into Lower Pennsylvanian coal bed-methane produc-ing strata in southwest Virginia. Samples of siliciclastic lithologies above coal beds in this Oakwood Field well,and from several other cores in the Nora Field were taken to establish a baseline of the basic confinementproperties of overlying strata to test seal competency at local and regional scales.Strata above CBM-producing coal beds in the Pocahontas and New River formations consist of dark-grayshales; silty gray shales; heterolithic siltstones, sandstones, and shales; lithic sandstones, and quartzose sand-stones. Standard measurements of porosity, permeability and petrography were used to evaluate potentialleakage hazards and any possible secondary storage potential for typical lithologies. Both lithic- andquartz-rich sandstones exhibit only minor porosity, with generally low permeability (b0.042 mD). Intercon-nected porosity and permeability are strongly impacted by diverse cementation types and compaction. Ana-lyzed siliciclastic lithologies are considered tight, with limited primary matrix permeability risks for leakage,providing an ensemble of redundant CO2-ECBM traps.One of the most promising confining intervals above the major coal bed-methane producing interval is theHensley Shale Member. Analyses of 1500 geophysical logs in southwest Virginia indicate that this unit ismoderately thick (>50 ft, 15 m), laterally continuous (>3000 km2), and a homogenous shale, whichcoarsens upward into siltstone and sandstone, or is truncated by sandstone. Calculations from two mercuryinjection capillary porosimetry tests of the shale indicate that a displacement entry pressure of 207 psi(1427 kPa) would generate an estimated seal capacity of 1365 ft (416 m) of CO2 before buoyant leakage.Scanning electron microscopy indicates a microfabric of narrow pore throats between quartz grains floatingin a clay matrix. Modeled median pore throat size between micro-fabric matrix grains for the shale is estimat-ed at 0.26 μm. These characteristics indicate that the shale, where fractures and joints are limited, would bean adequate regional confining interval for deeper CO2 storage with ECBM.
© 2011 Elsevier B.V. All rights reserved.
1. Introduction
A potential method for reducing the amount of anthropogenic car-bon dioxide (CO2) released to the atmosphere is carbon capture, uti-lization and storage in maturing hydrocarbon reservoirs (Gale, andFreund, 2001; Pacala and Socolow, 2004; Stevens and Gale, 2000).The expansion of carbon storage research in geological reservoirsthrough industrial, academic, and government carbon management
ology Company, Houston, TX386.mm).
rights reserved.
studies has defined subsurface confinement and seal characterizationas vitally important to ensure the goals of subsurface carbon storageover geologically significant timescales and to provide screening cri-teria for the rollout of CO2-enhanced hydrocarbon recovery and stor-age technologies (Benson and Cole, 2008; Cook, 2006; Hovorka, 1999;Reichle et al., 1999; USDOE-NETL, 2008a; Vrolijk et al., 2011).
In the Appalachian region of the United States, research into po-tential geological storage reservoirs is especially relevant becausemuch of this region relies on coal-fired electricity generation and,thus, has high per capita CO2 emissions (USDOE NatCarb Atlas,2008). The central Appalachian basin has several types of potentialgeologic storage options, including deep, unmineable coal seams.
111R.P. Grimm et al. / International Journal of Coal Geology 90–91 (2012) 110–125
This technique may allow for simultaneous carbon storage with theadded economic benefit of utilizing injected CO2 for the enhanced re-covery of coal bed methane (ECBM) (Gentzis, 2000; Pashin et al.,2009; van Bergen et al., 2006). Conventional methods of coal bedmethane (CBM) production leave economic volumes of methaneadsorbed in the coal reservoir after depressurization and production.With ECBM, gaseous carbon dioxide would be injected into coalseams with declining CBM production through permeability path-ways within cleats, adsorbing within available coal matrix space todisplace remaining methane to production wells. This process of sub-surface CO2 injection for secondary recovery of CBM is somewhatcomparable to miscible flooding techniques that have been profitablyutilized for enhanced recovery in mature oil fields for several decades(Blunt et al., 1993; Koperna and Riestenberg, 2009; Mavor et al.,2002; Orr and Taber, 1984; Taber et al., 1997; Wong and Gunter,1999). Once CO2 is detected in offset production wells, gas separatorswould be used on production wells to split off any CO2 that was pro-duced with the diluted methane for re-injection and pressure man-agement elsewhere in the field.
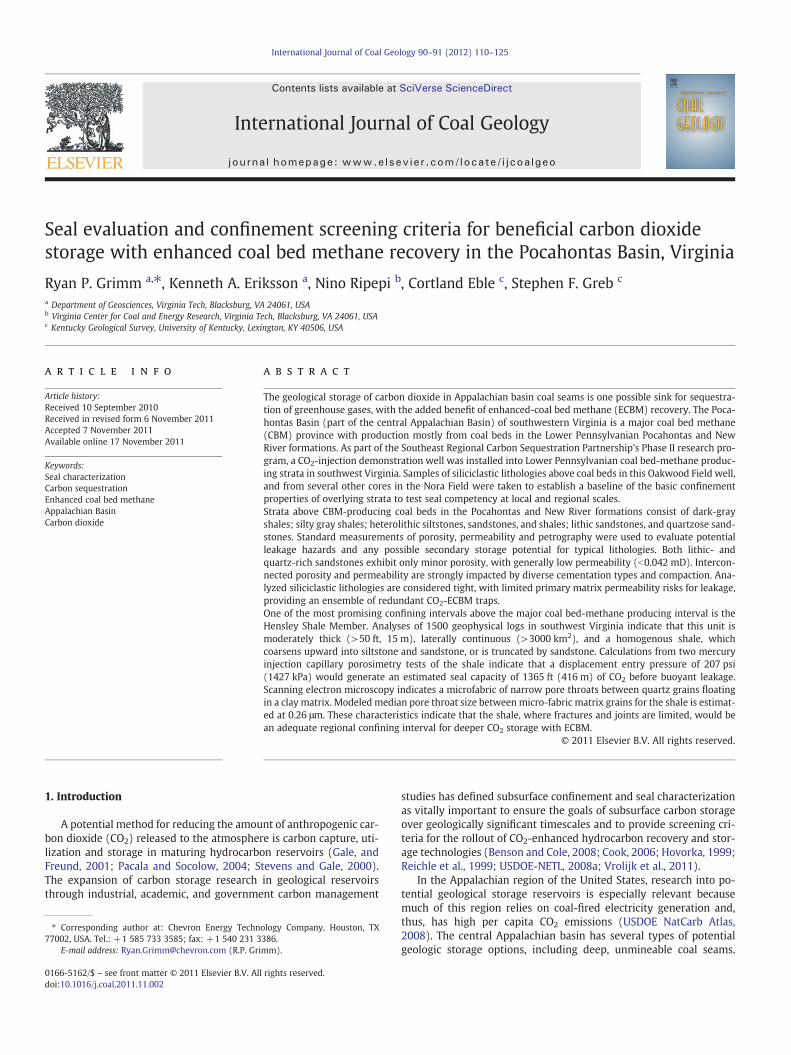
Within Central Appalachia, CBM is produced primarily from Lower(Early) Pennsylvanian coal seams of the Pocahontas and New RiverFormations in the Pocahontas Basin of southwestern Virginia, andsouthern West Virginia (Fig. 1). Production of coal bed methanefrom several of these primary CBM fields has been in slow declinein southwestern Virginia since peaking around 2001 (Milici et al.,2010), providing a potential study area to test ECBM recovery tech-nologies. Recent investigations by the U.S. Department of Energy'sSoutheast Regional Carbon Sequestration Partnership (SECARB) sug-gest that these coal-bearing sedimentary rocks have potential to useof CO2 for ECBM production (USDOE-NETL, 2008a). SECARB estimates1.3 billion tons of technically feasible CO2 storage capacity in coalbeds of the Pocahontas Basin, with enhanced recovery potentially in-creasing CBM reserves by an additional 2.5 Tcf (Ripepi, 2009). In
Fig. 1. Regional map illustrating the distribution of Carboniferous sedimentary rocks in the Amap shows major structures within the Pocahontas Basin, including the Middlesboro SynclClair and Pine Mountain thrust faults. The Russell Fork Fault (bold) as well as minor Bradshfeatures (Adapted from Cecil et al., 1985; Henika, 1994; Mitra, 1988.
2009, a test well was drilled in southwest Virginia, as part ofSECARB's Phase II research program to inject small amounts of CO2
into coal beds of the Pocahontas and Lee Formations and to deter-mine the potential of this technology in the Pocahontas Basin(Ripepi, 2009). Aside from technical details about the actual coalreservoirs, evaluations were also needed for seal capacity, structuralintegrity, and secondary trapping effectiveness of the overlying stra-ta to ensure injected CO2 would adequately remain enclosed withinthe coal reservoirs and not leak to the potable water aquifers or tothe surface.
The objectives of this investigation are to gather and evaluate theprimary petrophysical, geochemical and confinement properties ofsealing units hosting CBM-producing coal beds in the Pocahontasbasin. These seal assessment properties will provide a baseline to bet-ter predict potential pathways, minimize probability of loss of CO2 tothe surface and establish expected behaviors of injected CO2 in a the-oretical ECBM system. Such results are critical for developing a re-gional leakage risk screening model suitable for ECBM site andtarget selection in central Appalachia.
2. Geologic setting
2.1. Structural setting
The Appalachian Basin is a northeast–southwest trending Paleozo-ic foreland basin, formed as a collective result of repeated collisionaltectonism during the Taconic, Acadian, and Alleghanian orogenies.Accommodation for a 2.8 km thick wedge of early Pennsylvanianthrough early Permian terrestrial and marginal marine siliciclasticrocks was provided by thrust-load induced subsidence of the Lauren-tian Craton, initiated during the onset of the Alleghanian orogeny(Ettensohn, 2004; Rice and Schwietering, 1988). Pennsylvanian-agesedimentary units are preserved in three depocenters in the greater
ppalachian Basin (shaded region); hatched area denotes the Pocahontas Basin. Detailedine structure of the principal study area, bounded by the Hunter Valley–Clinchport–St.aw, Coeburn and Glamorgan faults have measurable lateral and vertical displacement

112 R.P. Grimm et al. / International Journal of Coal Geology 90–91 (2012) 110–125
Appalachian Basin, namely, the northern Appalachian (Dunkard)Basin, the central Appalachian basin (including the PocahontasBasin) and the southern Appalachian basin (including the BlackWarrior Basin) (Fig. 1; Arkle, 1974; Greb et al., 2008).
The Pocahontas Basin is a narrow, structurally-defined northeast–southwest trending basin, spanning nearly 40,000 km2 of Tennessee,Kentucky, Virginia, and West Virginia, within which the early Penn-sylvanian Pocahontas Formation is preserved (Fig. 1). The Virginiaportion of the Pocahontas Basin is exposed on the Pine MountainBlock and areas to the northeast of the thrust sheet. The northwesternlimit of the thrust sheet is marked by the Pine Mountain Thrust Fault,in Kentucky, which constitutes the Alleghanian structural front. Thesoutheastern margin of the block is the Hunter Valley–St. Clair FaultZone and older folded Paleozoic rocks (Fig. 1). The Pine MountainBlock is bounded to the northeast by the Bishop-Bradshaw linea-ment/Cambria Fault (Henika, 1994). These faults have been mappedat the surface and in the subsurface as thin-skin faults offsetting Car-boniferous and Devonian strata, are parallel to the primary north-westward vergence direction of other Valley and Ridge structures(Henika, 1994), and have been recognized as the result of footwalldisplacement along lateral thrust detachments that obliquely rampfrom the Cambrian Rome Formation to an upper-level detachmentin the Devonian shale (Mitra, 1988; Rich, 1934). Portions of thestudy area are transected by several north–south-oriented, strike–slip faults, including the Russell Fork Fault (Fig. 1). A variety of thin-skinned folds of compressional origin have been identified withinthe Pocahontas Basin (Henika, 1994). These structural features influ-ence gas and water production in the CBM system (Conrad, personalcommunication) and may create zones that both aid carbon storageefforts (e.g. increase coal permeability, structural closure) and in-crease leakage risks (e.g. shallow faults or joints in seal units). Severalstructural closures in the Nora Field of southwest Virginia containproducing gas fields (from deeper Mississippian and Devonian non-coal reservoirs) or gas fields under development and would be largeenough for future CO2 storage when the gas in the fields is depleted.
2.2. Stratigraphy
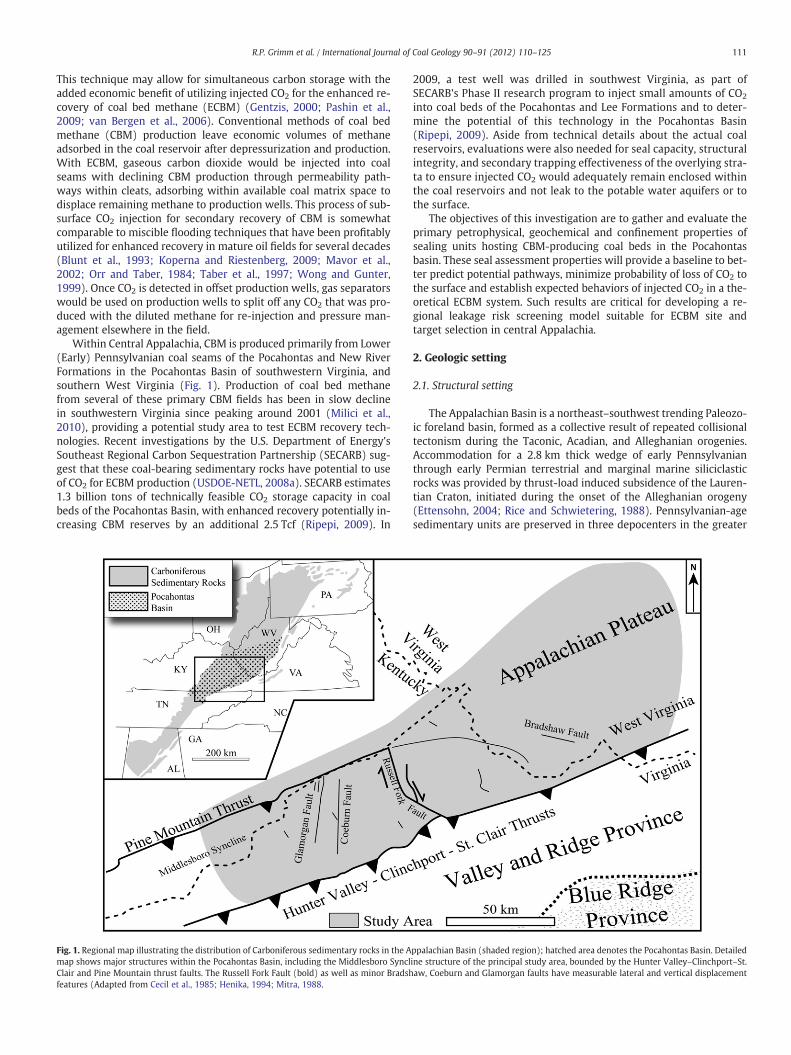
Early Pennsylvanian sedimentary rocks of the Lee, Pocahontas,and New River Formations unconformably overlie the late Mississip-pian Bluestone Formation and attain a maximum thickness of approx-imately 2950 ft (900 m) along the southeast margin of thePocahontas Basin of Virginia and West Virginia (Blake and Beuthin,2008; Chesnut, 1994; Englund and Thomas, 1990; Englund et al.,1979; Korus, 2002). Quartzarenite dominates the Lee Formation,interfingering with coal-bearing, compositionally immature, silici-clastic strata that dominate the Pocahontas and New River Forma-tions (Englund et al., 1986; Rice, 1985; Rice and Schwietering, 1988).
Chesnut (1992) developed a stratigraphic nomenclature for the cen-tral Appalachian basin based on marine flooding surfaces and wide-spread quartzose sandstones. Although not formally adopted inVirginia, the criterion used in the Kentucky nomenclature is used hereinto further recognize regional subdivisions within the Early Pennsylva-nian interval and define the potential future for CO2-ECBM within spe-cific, genetically related and correlatable zones for evaluation.
Several widespread, marine-influenced, shale horizons subdividethe equivalent-aged Breathitt Group of Kentucky into eight third-order sequences that can be traced into southwestern Virginia(Chesnut, 1992, 1994). The Early Pennsylvanian part of the groupcontains at least four sequences, in ascending order, the Pocahontas,Bottom Creek, Alvy Creek and Grundy Formations (Fig. 2), equivalentto the Pocahontas and Lee/New River Formations of West Virginia. Atthe base of the Bottom Creek, Alvy Creek, and Grundy Formations aremarine-influenced shales, the Dark Ridge, Hensley and Dave BranchShale members respectively (Fig. 2; Bodek, 2006; Chesnut, 1992,1994). These members consist of dark gray shale, which coarsens
upwards into interbedded shale, siltstone and sandstone, or may betruncated by sandstone. Shales in these members are potential con-fining units for seal evaluation in the ECBM system.
2.3. Southwest Virginia CBM
The majority of coal bed methane production in the PocahontasBasin is clustered in the Oakwood and Nora fields of Virginia(Fig. 1). Exploration for CBM began in 1988 with Equitable Resourcesdevelopment of the Nora Field in Dickenson County, Virginia followedby CONSOL Energy developing the Oakwood Field in Buchanan Coun-ty, Virginia. From 1988 to 1999, over 5400 CBMwells were drilled andbrought on-line as producing CBM gas wells in southwest Virginia(Virginia Deparment of Mines, Minerals and Energy, 2009).
Coal zones in the Pocahontas, Bottom Creek and Alvy Creek Forma-tions are completed at depths as shallow as 375 ft (115 m), but mostCBM production ranges from 1000 ft (300 m) to more than 2000 ft(610 m) due to lower hydrostatic pressure in shallower zones (Lewis,1999; Nolde and Spears, 1998; Zuber, 1998). Coalbed methane wellstypically target six to fifteen seams, penetrating a minimum of15–40 ft (4.5–12 m) of net coal. The most significant producing seamsin the Pocahontas Basin are the Pocahontas No. 1 to 9, Lower Horsepen,Beckley, War Creek, Middle and Upper Horsepen, Middle and UpperSeaboard, Greasy Creek and Jawbone horizons (Fig. 2).
In the Pocahontas Basin, successful well completion practices arecommonly vertical, limited entry cased-hole completions followedwith multi-stage foam frac stimulations (Zuber, 1998). Cased-holecompletions maintain wellbore integrity, as a cemented well casingis typically installed completely through all the target coal bearingunits. The casing is then perforated with directional charges in theproduction horizon to link the well to the gas-bearing coal reservoirs.CBM wells are then almost universally stimulated using nitrogenfoam and water–sand hydraulic fracture techniques to access the nat-ural permeability of the coal seam surrounding the well while avoid-ing chemical damage to the coal formation (Loomis, 1997). Wells inthe Nora Field are drilled on a 24 ha (60 acre) spacing, with comple-tions in seven to ten individual coal intervals (Zuber, 1998). In theOakwood Field, multi-seam wells are completed ahead of under-ground coal mining and in deep, currently unmineable coal seams(Ripepi, 2009). The Oakwood Field produces CBM from 15 to 25coal seams with four- to six-stage hydraulic fracture treatments(Rodvelt et al., 2009). Where thicker coal seams are present, multilat-eral horizontal wells have been implemented to increase productivi-ty, predominantly in the Loup Creek Field of Wyoming County,West Virginia (Ripepi, 2009).
Adsorbed gas contents in Virginia coals range from 282 to 688 cubicfeet (8.0–19.5 m3) of gas per short ton of coal (Conrad et al., 2006;Diamond et al., 1986). Estimates for the average gas in place for an indi-vidual CBM well in the Nora Field is approximately 675 MMcf/well(19,100 m3/well) (Zuber, 1998). With a vertical well recovery factorof 30–60%, production volumes of 200 to 400 MMcf/well (5600 to11,300 m3/well) are anticipated (Zuber, 1998). Proven CBM reservesin Virginia account for nearly 12% of the national CBM reserves, current-ly near 1.8 trillion cubic feet (Tcf) (USDOE-EIA, 2009). The original gasin-place resource in the Pocahontas Basin has been estimated at7.1 Tcf (Kelafant and Boyer, 1988; Lyons, 1998; Nolde and Spears,1998), with 3.6 Tcf deemed technically recoverable (Milici et al., 2003;Milici et al., 2010). Annual CBM production for 2009 was a record 113billion cubic feet (bcf), with more than half of the state total producedfrom the Oakwood Field alone (VDMME, 2009).
3. Seal evaluation
Seals and trap integrity are a critical component in the evaluationand development of a CO2 enhanced coal bed methane recovery pro-ject. In an ECBM sequestration system, the first CO2 trapping
Fig. 2. Stratigraphic column and type logs illustrating the stratigraphic order, hydrology and typical gamma ray and bulk density (RHOB) geophysical well log responses to the li-thologies of major stratigraphic units and minor sub-units and drillers terms of the Early Pennsylvanian interval of the Pocahontas Basin. Coal bed methane reservoirs for CO2 en-hanced production are in the Pocahontas, Bottom Creek and Alvy Creek Formations. Well number 3042 is from Dickenson County, Virginia and gamma ray and RHOB log valuesincrease to the right.
113R.P. Grimm et al. / International Journal of Coal Geology 90–91 (2012) 110–125
mechanism would be the coal itself, through adsorption of CO2 ontointernal surfaces in the coal matrix (Fig. 3A). Several field and labora-tory studies have demonstrated that the coal matrix has a stronger af-finity for CO2 than for CH4, at a ratio of approximately 2:1 or greater atelevated pressure (Gale and Freund, 2001; Gluskoter et al., 2002;Mastalerz et al., 2004; Nelson et al., 2005; Ripepi, 2009). Additionaltrapping mechanisms also need to be investigated when the coalswells or CO2 leaks from the coal into surrounding strata. Thesetraps include the structural and capillary trapping of free gas and
solubility trapping through the slow dissolution of CO2 into boundmicropore waters in coal cleats within the reservoir and overlyingstrata (Fig. 3B), hydrodynamic trapping, adsorption within organicshales, and potentially, slow, long termmineral trapping as CO2 reactswith rock units bounding the coal seams (Fig. 3C; Nelson et al., 2005).These mechanisms might occur in the laterally variable lithofaciesimmediately above each coal bed reservoir, and/or in more regional,low-permeability shales, which occur at the base of the Early Pennsyl-vanian formations.
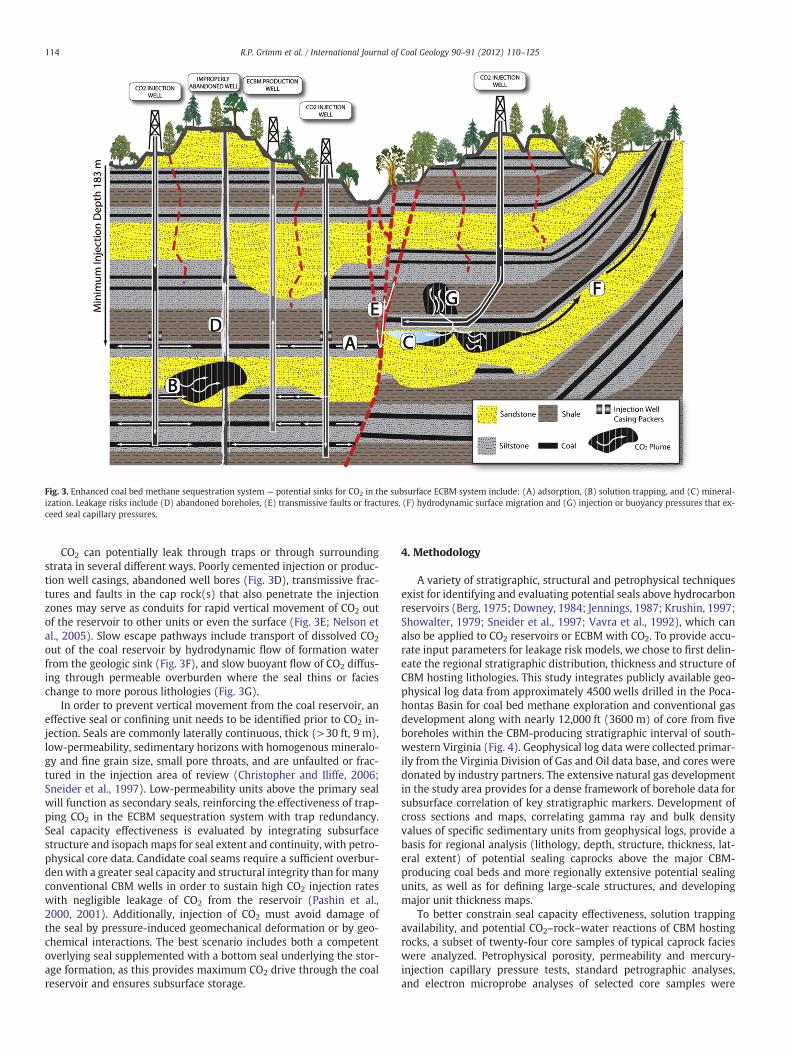
Fig. 3. Enhanced coal bed methane sequestration system — potential sinks for CO2 in the subsurface ECBM system include: (A) adsorption, (B) solution trapping, and (C) mineral-ization. Leakage risks include (D) abandoned boreholes, (E) transmissive faults or fractures, (F) hydrodynamic surface migration and (G) injection or buoyancy pressures that ex-ceed seal capillary pressures.
114 R.P. Grimm et al. / International Journal of Coal Geology 90–91 (2012) 110–125
CO2 can potentially leak through traps or through surroundingstrata in several different ways. Poorly cemented injection or produc-tion well casings, abandoned well bores (Fig. 3D), transmissive frac-tures and faults in the cap rock(s) that also penetrate the injectionzones may serve as conduits for rapid vertical movement of CO2 outof the reservoir to other units or even the surface (Fig. 3E; Nelson etal., 2005). Slow escape pathways include transport of dissolved CO2
out of the coal reservoir by hydrodynamic flow of formation waterfrom the geologic sink (Fig. 3F), and slow buoyant flow of CO2 diffus-ing through permeable overburden where the seal thins or facieschange to more porous lithologies (Fig. 3G).
In order to prevent vertical movement from the coal reservoir, aneffective seal or confining unit needs to be identified prior to CO2 in-jection. Seals are commonly laterally continuous, thick (>30 ft, 9 m),low-permeability, sedimentary horizons with homogenous mineralo-gy and fine grain size, small pore throats, and are unfaulted or frac-tured in the injection area of review (Christopher and Iliffe, 2006;Sneider et al., 1997). Low-permeability units above the primary sealwill function as secondary seals, reinforcing the effectiveness of trap-ping CO2 in the ECBM sequestration system with trap redundancy.Seal capacity effectiveness is evaluated by integrating subsurfacestructure and isopachmaps for seal extent and continuity, with petro-physical core data. Candidate coal seams require a sufficient overbur-den with a greater seal capacity and structural integrity than for manyconventional CBM wells in order to sustain high CO2 injection rateswith negligible leakage of CO2 from the reservoir (Pashin et al.,2000, 2001). Additionally, injection of CO2 must avoid damage ofthe seal by pressure-induced geomechanical deformation or by geo-chemical interactions. The best scenario includes both a competentoverlying seal supplemented with a bottom seal underlying the stor-age formation, as this provides maximum CO2 drive through the coalreservoir and ensures subsurface storage.
4. Methodology
A variety of stratigraphic, structural and petrophysical techniquesexist for identifying and evaluating potential seals above hydrocarbonreservoirs (Berg, 1975; Downey, 1984; Jennings, 1987; Krushin, 1997;Showalter, 1979; Sneider et al., 1997; Vavra et al., 1992), which canalso be applied to CO2 reservoirs or ECBM with CO2. To provide accu-rate input parameters for leakage risk models, we chose to first delin-eate the regional stratigraphic distribution, thickness and structure ofCBM hosting lithologies. This study integrates publicly available geo-physical log data from approximately 4500 wells drilled in the Poca-hontas Basin for coal bed methane exploration and conventional gasdevelopment along with nearly 12,000 ft (3600 m) of core from fiveboreholes within the CBM-producing stratigraphic interval of south-western Virginia (Fig. 4). Geophysical log data were collected primar-ily from the Virginia Division of Gas and Oil data base, and cores weredonated by industry partners. The extensive natural gas developmentin the study area provides for a dense framework of borehole data forsubsurface correlation of key stratigraphic markers. Development ofcross sections and maps, correlating gamma ray and bulk densityvalues of specific sedimentary units from geophysical logs, provide abasis for regional analysis (lithology, depth, structure, thickness, lat-eral extent) of potential sealing caprocks above the major CBM-producing coal beds and more regionally extensive potential sealingunits, as well as for defining large-scale structures, and developingmajor unit thickness maps.
To better constrain seal capacity effectiveness, solution trappingavailability, and potential CO2–rock–water reactions of CBM hostingrocks, a subset of twenty-four core samples of typical caprock facieswere analyzed. Petrophysical porosity, permeability and mercury-injection capillary pressure tests, standard petrographic analyses,and electron microprobe analyses of selected core samples were
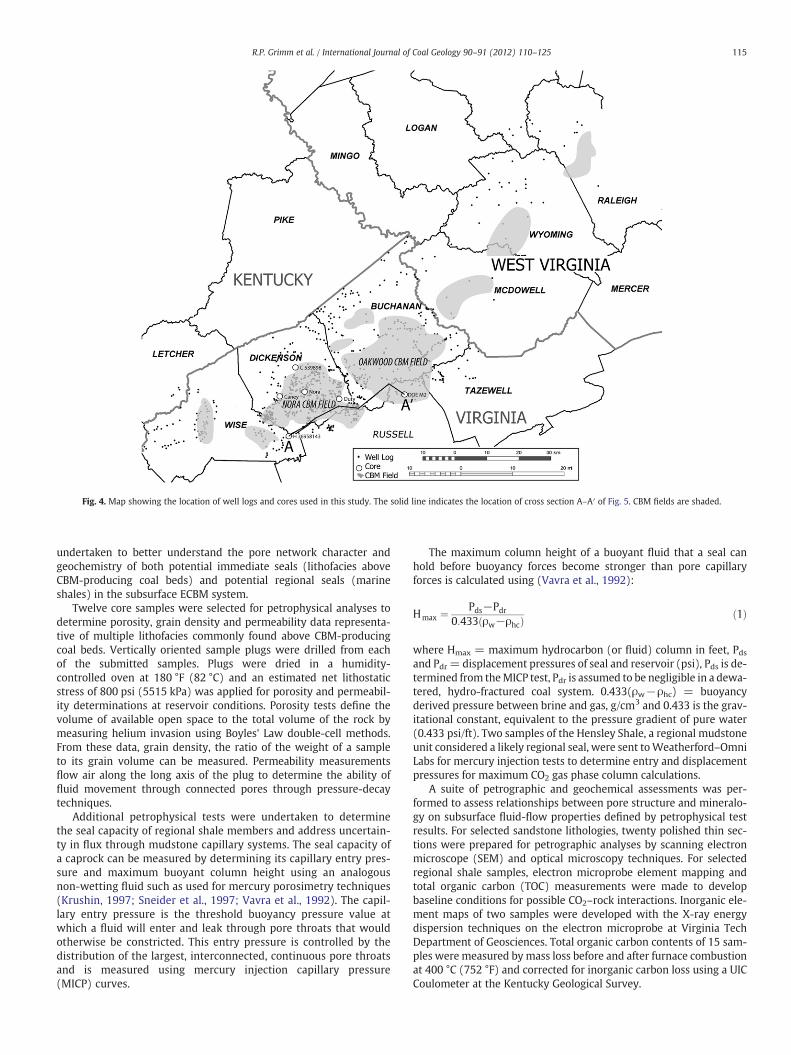
Fig. 4. Map showing the location of well logs and cores used in this study. The solid line indicates the location of cross section A–A′ of Fig. 5. CBM fields are shaded.
115R.P. Grimm et al. / International Journal of Coal Geology 90–91 (2012) 110–125
undertaken to better understand the pore network character andgeochemistry of both potential immediate seals (lithofacies aboveCBM-producing coal beds) and potential regional seals (marineshales) in the subsurface ECBM system.
Twelve core samples were selected for petrophysical analyses todetermine porosity, grain density and permeability data representa-tive of multiple lithofacies commonly found above CBM-producingcoal beds. Vertically oriented sample plugs were drilled from eachof the submitted samples. Plugs were dried in a humidity-controlled oven at 180 °F (82 °C) and an estimated net lithostaticstress of 800 psi (5515 kPa) was applied for porosity and permeabil-ity determinations at reservoir conditions. Porosity tests define thevolume of available open space to the total volume of the rock bymeasuring helium invasion using Boyles' Law double-cell methods.From these data, grain density, the ratio of the weight of a sampleto its grain volume can be measured. Permeability measurementsflow air along the long axis of the plug to determine the ability offluid movement through connected pores through pressure-decaytechniques.
Additional petrophysical tests were undertaken to determinethe seal capacity of regional shale members and address uncertain-ty in flux through mudstone capillary systems. The seal capacity ofa caprock can be measured by determining its capillary entry pres-sure and maximum buoyant column height using an analogousnon-wetting fluid such as used for mercury porosimetry techniques(Krushin, 1997; Sneider et al., 1997; Vavra et al., 1992). The capil-lary entry pressure is the threshold buoyancy pressure value atwhich a fluid will enter and leak through pore throats that wouldotherwise be constricted. This entry pressure is controlled by thedistribution of the largest, interconnected, continuous pore throatsand is measured using mercury injection capillary pressure(MICP) curves.
The maximum column height of a buoyant fluid that a seal canhold before buoyancy forces become stronger than pore capillaryforces is calculated using (Vavra et al., 1992):
Hmax ¼ Pds−Pdr0:433 ρw−ρhcð Þ ð1Þ
where Hmax = maximum hydrocarbon (or fluid) column in feet, Pdsand Pdr = displacement pressures of seal and reservoir (psi), Pds is de-termined from theMICP test, Pdr is assumed to be negligible in a dewa-tered, hydro-fractured coal system. 0.433(ρw−ρhc) = buoyancyderived pressure between brine and gas, g/cm3 and 0.433 is the grav-itational constant, equivalent to the pressure gradient of pure water(0.433 psi/ft). Two samples of the Hensley Shale, a regional mudstoneunit considered a likely regional seal, were sent toWeatherford–OmniLabs for mercury injection tests to determine entry and displacementpressures for maximum CO2 gas phase column calculations.
A suite of petrographic and geochemical assessments was per-formed to assess relationships between pore structure and mineralo-gy on subsurface fluid-flow properties defined by petrophysical testresults. For selected sandstone lithologies, twenty polished thin sec-tions were prepared for petrographic analyses by scanning electronmicroscope (SEM) and optical microscopy techniques. For selectedregional shale samples, electron microprobe element mapping andtotal organic carbon (TOC) measurements were made to developbaseline conditions for possible CO2–rock interactions. Inorganic ele-ment maps of two samples were developed with the X-ray energydispersion techniques on the electron microprobe at Virginia TechDepartment of Geosciences. Total organic carbon contents of 15 sam-ples were measured by mass loss before and after furnace combustionat 400 °C (752 °F) and corrected for inorganic carbon loss using a UICCoulometer at the Kentucky Geological Survey.
116 R.P. Grimm et al. / International Journal of Coal Geology 90–91 (2012) 110–125
5. Results
5.1. Subsurface mapping results
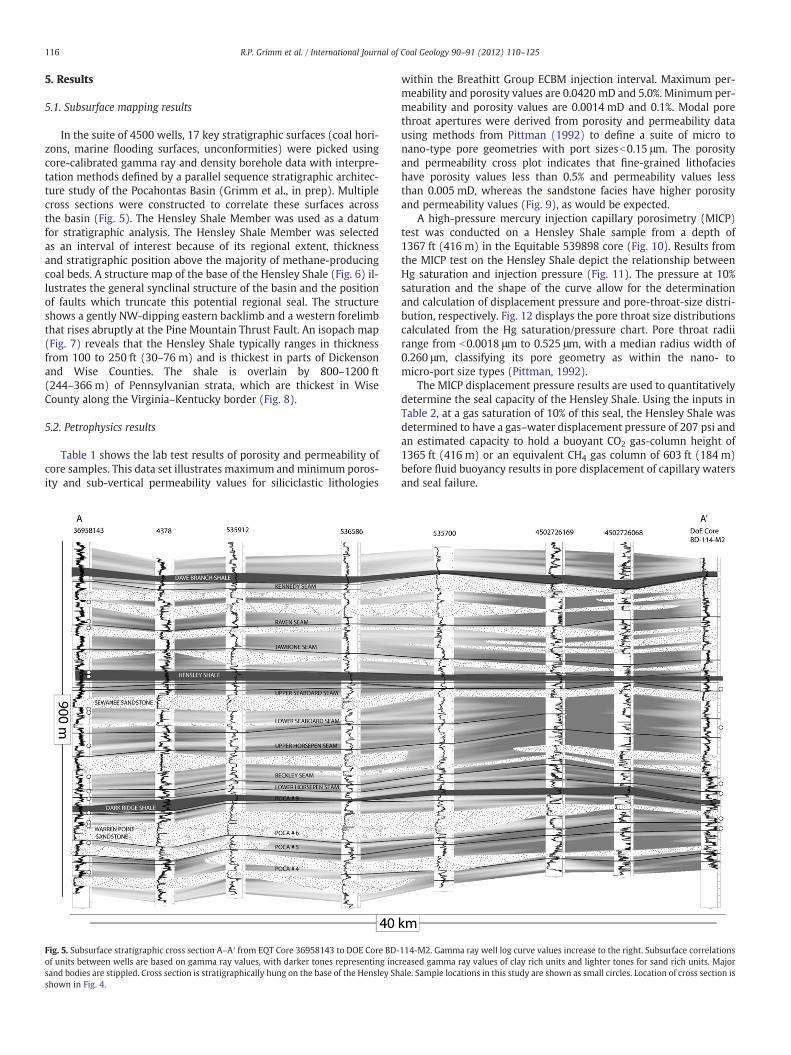
In the suite of 4500 wells, 17 key stratigraphic surfaces (coal hori-zons, marine flooding surfaces, unconformities) were picked usingcore-calibrated gamma ray and density borehole data with interpre-tation methods defined by a parallel sequence stratigraphic architec-ture study of the Pocahontas Basin (Grimm et al., in prep). Multiplecross sections were constructed to correlate these surfaces acrossthe basin (Fig. 5). The Hensley Shale Member was used as a datumfor stratigraphic analysis. The Hensley Shale Member was selectedas an interval of interest because of its regional extent, thicknessand stratigraphic position above the majority of methane-producingcoal beds. A structure map of the base of the Hensley Shale (Fig. 6) il-lustrates the general synclinal structure of the basin and the positionof faults which truncate this potential regional seal. The structureshows a gently NW-dipping eastern backlimb and a western forelimbthat rises abruptly at the Pine Mountain Thrust Fault. An isopach map(Fig. 7) reveals that the Hensley Shale typically ranges in thicknessfrom 100 to 250 ft (30–76 m) and is thickest in parts of Dickensonand Wise Counties. The shale is overlain by 800–1200 ft(244–366 m) of Pennsylvanian strata, which are thickest in WiseCounty along the Virginia–Kentucky border (Fig. 8).
5.2. Petrophysics results
Table 1 shows the lab test results of porosity and permeability ofcore samples. This data set illustrates maximum andminimum poros-ity and sub-vertical permeability values for siliciclastic lithologies
Fig. 5. Subsurface stratigraphic cross section A–A′ from EQT Core 36958143 to DOE Core BD-of units between wells are based on gamma ray values, with darker tones representing incsand bodies are stippled. Cross section is stratigraphically hung on the base of the Hensley Shshown in Fig. 4.
within the Breathitt Group ECBM injection interval. Maximum per-meability and porosity values are 0.0420 mD and 5.0%. Minimum per-meability and porosity values are 0.0014 mD and 0.1%. Modal porethroat apertures were derived from porosity and permeability datausing methods from Pittman (1992) to define a suite of micro tonano-type pore geometries with port sizesb0.15 μm. The porosityand permeability cross plot indicates that fine-grained lithofacieshave porosity values less than 0.5% and permeability values lessthan 0.005 mD, whereas the sandstone facies have higher porosityand permeability values (Fig. 9), as would be expected.
A high-pressure mercury injection capillary porosimetry (MICP)test was conducted on a Hensley Shale sample from a depth of1367 ft (416 m) in the Equitable 539898 core (Fig. 10). Results fromthe MICP test on the Hensley Shale depict the relationship betweenHg saturation and injection pressure (Fig. 11). The pressure at 10%saturation and the shape of the curve allow for the determinationand calculation of displacement pressure and pore-throat-size distri-bution, respectively. Fig. 12 displays the pore throat size distributionscalculated from the Hg saturation/pressure chart. Pore throat radiirange from b0.0018 μm to 0.525 μm, with a median radius width of0.260 μm, classifying its pore geometry as within the nano- tomicro-port size types (Pittman, 1992).
The MICP displacement pressure results are used to quantitativelydetermine the seal capacity of the Hensley Shale. Using the inputs inTable 2, at a gas saturation of 10% of this seal, the Hensley Shale wasdetermined to have a gas–water displacement pressure of 207 psi andan estimated capacity to hold a buoyant CO2 gas-column height of1365 ft (416 m) or an equivalent CH4 gas column of 603 ft (184 m)before fluid buoyancy results in pore displacement of capillary watersand seal failure.
114-M2. Gamma ray well log curve values increase to the right. Subsurface correlationsreased gamma ray values of clay rich units and lighter tones for sand rich units. Majorale. Sample locations in this study are shown as small circles. Location of cross section is

Fig. 6. Regional structure contour map of the base of the Hensley Shale interval. Elevations are in feet relative to sea level.
117R.P. Grimm et al. / International Journal of Coal Geology 90–91 (2012) 110–125
5.3. Petrographic and elemental mapping results
Optical petrography determined the dominant mineralogy andporosity types for the sandstone and siltstone samples in the ECBM
Fig. 7. Regional isopach map of the Hen
interval. Quartzarenite porosities are commonly formed from intra-granular dissolution of framework grains. Common diagenetic ce-ments include early, pore-lining, fine crystalline siderite followed bypore-filling, coarse, quartz overgrowths (Fig. 13). Sublitharenite is
sley Shale. Thicknesses are in feet.
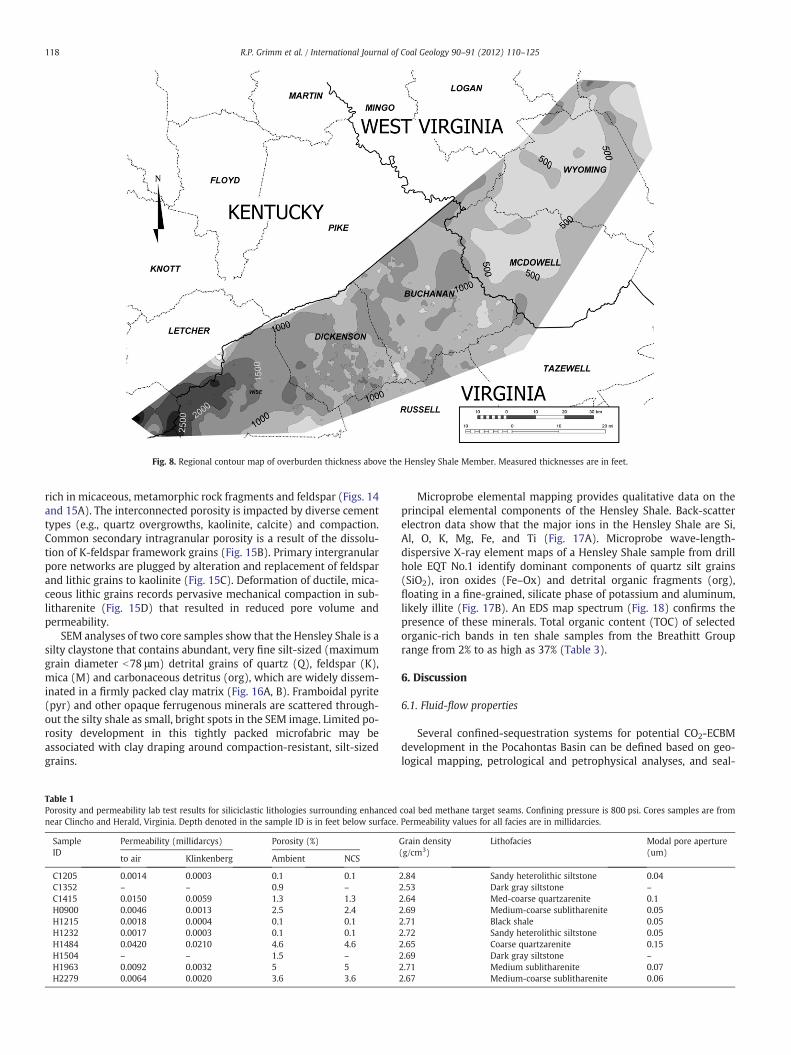
Fig. 8. Regional contour map of overburden thickness above the Hensley Shale Member. Measured thicknesses are in feet.
118 R.P. Grimm et al. / International Journal of Coal Geology 90–91 (2012) 110–125
rich in micaceous, metamorphic rock fragments and feldspar (Figs. 14and 15A). The interconnected porosity is impacted by diverse cementtypes (e.g., quartz overgrowths, kaolinite, calcite) and compaction.Common secondary intragranular porosity is a result of the dissolu-tion of K-feldspar framework grains (Fig. 15B). Primary intergranularpore networks are plugged by alteration and replacement of feldsparand lithic grains to kaolinite (Fig. 15C). Deformation of ductile, mica-ceous lithic grains records pervasive mechanical compaction in sub-litharenite (Fig. 15D) that resulted in reduced pore volume andpermeability.
SEM analyses of two core samples show that the Hensley Shale is asilty claystone that contains abundant, very fine silt-sized (maximumgrain diameter b78 μm) detrital grains of quartz (Q), feldspar (K),mica (M) and carbonaceous detritus (org), which are widely dissem-inated in a firmly packed clay matrix (Fig. 16A, B). Framboidal pyrite(pyr) and other opaque ferrugenous minerals are scattered through-out the silty shale as small, bright spots in the SEM image. Limited po-rosity development in this tightly packed microfabric may beassociated with clay draping around compaction-resistant, silt-sizedgrains.
Table 1Porosity and permeability lab test results for siliciclastic lithologies surrounding enhancednear Clincho and Herald, Virginia. Depth denoted in the sample ID is in feet below surface.
SampleID
Permeability (millidarcys) Porosity (%)
to air Klinkenberg Ambient NCS
C1205 0.0014 0.0003 0.1 0.1C1352 – – 0.9 –
C1415 0.0150 0.0059 1.3 1.3H0900 0.0046 0.0013 2.5 2.4H1215 0.0018 0.0004 0.1 0.1H1232 0.0017 0.0003 0.1 0.1H1484 0.0420 0.0210 4.6 4.6H1504 – – 1.5 –
H1963 0.0092 0.0032 5 5H2279 0.0064 0.0020 3.6 3.6
Microprobe elemental mapping provides qualitative data on theprincipal elemental components of the Hensley Shale. Back-scatterelectron data show that the major ions in the Hensley Shale are Si,Al, O, K, Mg, Fe, and Ti (Fig. 17A). Microprobe wave-length-dispersive X-ray element maps of a Hensley Shale sample from drillhole EQT No.1 identify dominant components of quartz silt grains(SiO2), iron oxides (Fe–Ox) and detrital organic fragments (org),floating in a fine-grained, silicate phase of potassium and aluminum,likely illite (Fig. 17B). An EDS map spectrum (Fig. 18) confirms thepresence of these minerals. Total organic content (TOC) of selectedorganic-rich bands in ten shale samples from the Breathitt Grouprange from 2% to as high as 37% (Table 3).
6. Discussion
6.1. Fluid-flow properties
Several confined-sequestration systems for potential CO2-ECBMdevelopment in the Pocahontas Basin can be defined based on geo-logical mapping, petrological and petrophysical analyses, and seal-
coal bed methane target seams. Confining pressure is 800 psi. Cores samples are fromPermeability values for all facies are in millidarcies.
Grain density(g/cm3)
Lithofacies Modal pore aperture(um)
2.84 Sandy heterolithic siltstone 0.042.53 Dark gray siltstone –
2.64 Med-coarse quartzarenite 0.12.69 Medium-coarse sublitharenite 0.052.71 Black shale 0.052.72 Sandy heterolithic siltstone 0.052.65 Coarse quartzarenite 0.152.69 Dark gray siltstone –
2.71 Medium sublitharenite 0.072.67 Medium-coarse sublitharenite 0.06
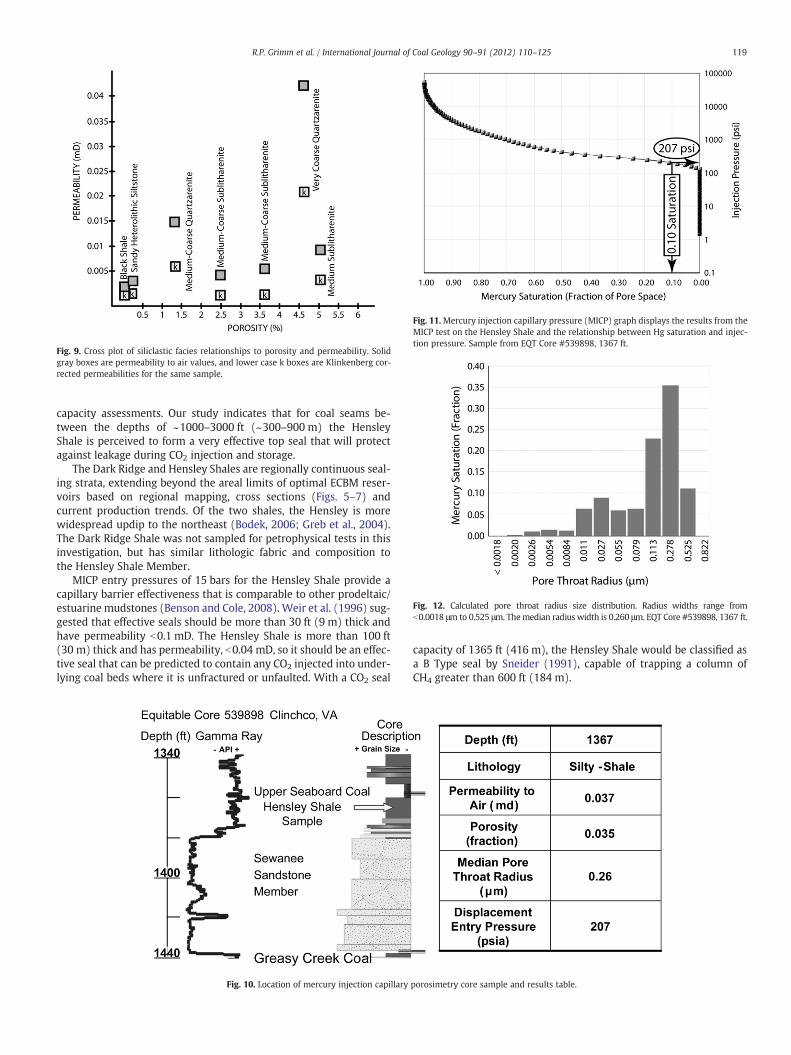
Fig. 11.Mercury injection capillary pressure (MICP) graph displays the results from theMICP test on the Hensley Shale and the relationship between Hg saturation and injec-tion pressure. Sample from EQT Core #539898, 1367 ft.
Fig. 12. Calculated pore throat radius size distribution. Radius widths range fromb0.0018 μm to 0.525 μm. Themedian radius width is 0.260 μm. EQT Core #539898, 1367 ft.
Fig. 9. Cross plot of siliclastic facies relationships to porosity and permeability. Solidgray boxes are permeability to air values, and lower case k boxes are Klinkenberg cor-rected permeabilities for the same sample.
119R.P. Grimm et al. / International Journal of Coal Geology 90–91 (2012) 110–125
capacity assessments. Our study indicates that for coal seams be-tween the depths of ~1000–3000 ft (~300–900 m) the HensleyShale is perceived to form a very effective top seal that will protectagainst leakage during CO2 injection and storage.
The Dark Ridge and Hensley Shales are regionally continuous seal-ing strata, extending beyond the areal limits of optimal ECBM reser-voirs based on regional mapping, cross sections (Figs. 5–7) andcurrent production trends. Of the two shales, the Hensley is morewidespread updip to the northeast (Bodek, 2006; Greb et al., 2004).The Dark Ridge Shale was not sampled for petrophysical tests in thisinvestigation, but has similar lithologic fabric and composition tothe Hensley Shale Member.
MICP entry pressures of 15 bars for the Hensley Shale provide acapillary barrier effectiveness that is comparable to other prodeltaic/estuarine mudstones (Benson and Cole, 2008). Weir et al. (1996) sug-gested that effective seals should be more than 30 ft (9 m) thick andhave permeability b0.1 mD. The Hensley Shale is more than 100 ft(30 m) thick and has permeability, b0.04 mD, so it should be an effec-tive seal that can be predicted to contain any CO2 injected into under-lying coal beds where it is unfractured or unfaulted. With a CO2 seal
Fig. 10. Location of mercury injection capillary
capacity of 1365 ft (416 m), the Hensley Shale would be classified asa B Type seal by Sneider (1991), capable of trapping a column ofCH4 greater than 600 ft (184 m).
porosimetry core sample and results table.
Table 2Input parameters for seal capacity estimation.
Seal displacement pressure (psi) 207Reservoir displacement pressure (psi) 0Density of reservoir water (g cm−3) 1.05Reservoir injection density of CO2 (g cm−3) at 1800 psi, 65 °F 0.70
120 R.P. Grimm et al. / International Journal of Coal Geology 90–91 (2012) 110–125
The Alvy Creek and Grundy Formations (upper New River Forma-tion) may act as secondary supplemental seals, providing an addition-al 500–2500 ft (152–762 m) of multiple, stacked, low-permeability
Fig. 13. A. EQT#36958143 Borehole gamma ray log signature and core description for depQuartz grains (Q) are rimmed with opaque euhedral siderite (sid), minor quartz overgrow
Fig. 14. A. EQT#36958143 Corehole gamma ray log signature and core description for dep2279 ft. Mineral assemblages in sublitharenites include a tightly packed fabric of monocryfragments (MRF) and feldspars (K). Field of view is 1 mm.
siliciclastic units above the Hensley top seal, increasing the effectivethickness of the overlying confining unit (Fig. 8). The petrophysicaland geochemical analyses of shale and sandstone samples withinthe Pocahontas and Bottom Creek Formations show they have muchlower relative permeabilities (b0.01–0.04 mD) compared to pub-lished permeabilities of productive Pocahontas Formation coalseams (>0.1–27 mD, Hunt and Steele, 1991) and so should be equallysignificant intraformational seals. Regionally, some quartzarenite in-tervals of the Lee Formation are called “salt sands” because they con-tain significant brine, and therefore may have higher permeabilitythan are indicated from results in this study. These thick
th interval 1740–1970 ft. B. Photomicrograph of the quartzarenite sampled at 1963 ft.ths and isolated pockets of secondary porosity (Φ). Field of view is 1 mm.
th interval 2140–2420 ft. B. Polarized photomicrograph of a sublitharenite sampled atstalline (Qm) and polycrystalline quartz grains (Qp) with common metamorphic rock
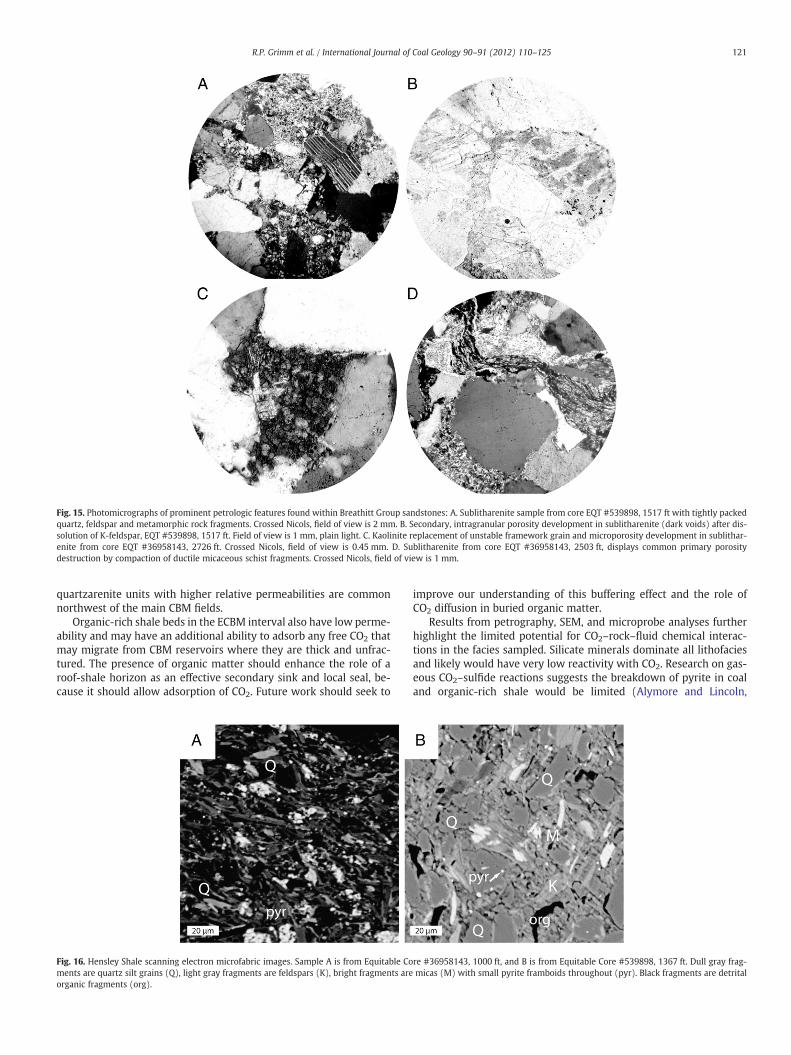
Fig. 15. Photomicrographs of prominent petrologic features found within Breathitt Group sandstones: A. Sublitharenite sample from core EQT #539898, 1517 ft with tightly packedquartz, feldspar and metamorphic rock fragments. Crossed Nicols, field of view is 2 mm. B. Secondary, intragranular porosity development in sublitharenite (dark voids) after dis-solution of K-feldspar, EQT #539898, 1517 ft. Field of view is 1 mm, plain light. C. Kaolinite replacement of unstable framework grain and microporosity development in sublithar-enite from core EQT #36958143, 2726 ft. Crossed Nicols, field of view is 0.45 mm. D. Sublitharenite from core EQT #36958143, 2503 ft, displays common primary porositydestruction by compaction of ductile micaceous schist fragments. Crossed Nicols, field of view is 1 mm.
121R.P. Grimm et al. / International Journal of Coal Geology 90–91 (2012) 110–125
quartzarenite units with higher relative permeabilities are commonnorthwest of the main CBM fields.
Organic-rich shale beds in the ECBM interval also have low perme-ability and may have an additional ability to adsorb any free CO2 thatmay migrate from CBM reservoirs where they are thick and unfrac-tured. The presence of organic matter should enhance the role of aroof-shale horizon as an effective secondary sink and local seal, be-cause it should allow adsorption of CO2. Future work should seek to
Fig. 16. Hensley Shale scanning electron microfabric images. Sample A is from Equitable Coments are quartz silt grains (Q), light gray fragments are feldspars (K), bright fragments areorganic fragments (org).
improve our understanding of this buffering effect and the role ofCO2 diffusion in buried organic matter.
Results from petrography, SEM, and microprobe analyses furtherhighlight the limited potential for CO2–rock–fluid chemical interac-tions in the facies sampled. Silicate minerals dominate all lithofaciesand likely would have very low reactivity with CO2. Research on gas-eous CO2–sulfide reactions suggests the breakdown of pyrite in coaland organic-rich shale would be limited (Alymore and Lincoln,
re #36958143, 1000 ft, and B is from Equitable Core #539898, 1367 ft. Dull gray frag-micas (M) with small pyrite framboids throughout (pyr). Black fragments are detrital
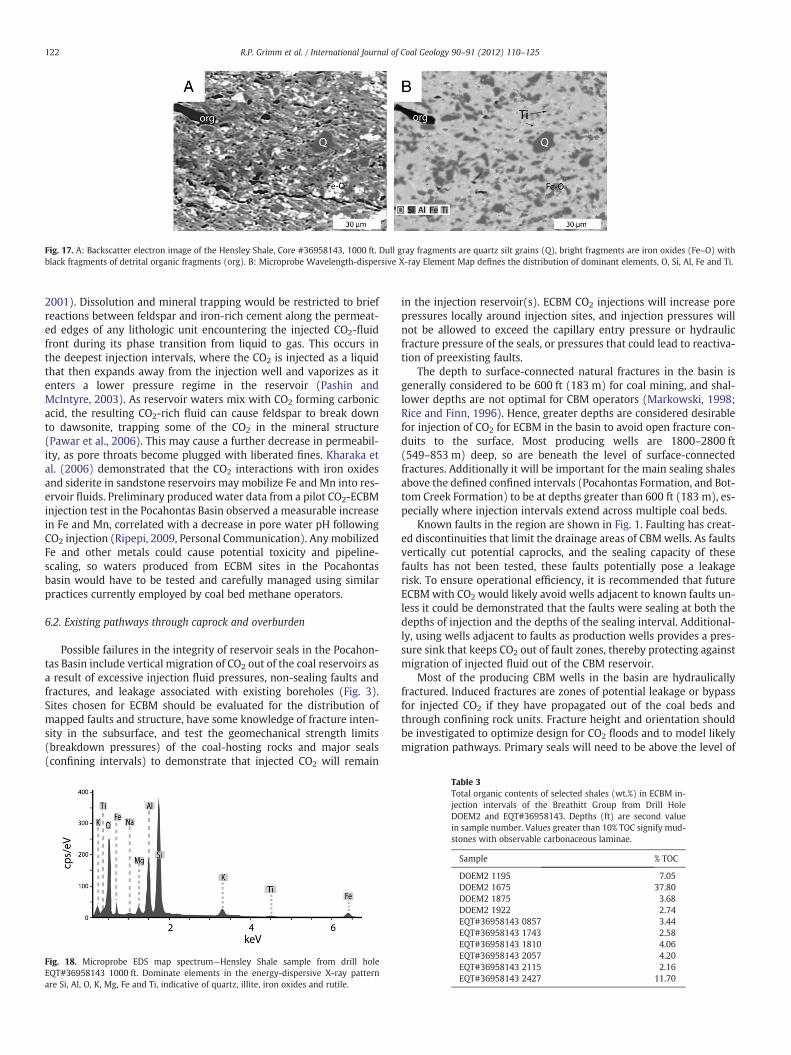
Fig. 17. A: Backscatter electron image of the Hensley Shale, Core #36958143, 1000 ft. Dull gray fragments are quartz silt grains (Q), bright fragments are iron oxides (Fe–O) withblack fragments of detrital organic fragments (org). B: Microprobe Wavelength-dispersive X-ray Element Map defines the distribution of dominant elements, O, Si, Al, Fe and Ti.
122 R.P. Grimm et al. / International Journal of Coal Geology 90–91 (2012) 110–125
2001). Dissolution and mineral trapping would be restricted to briefreactions between feldspar and iron-rich cement along the permeat-ed edges of any lithologic unit encountering the injected CO2-fluidfront during its phase transition from liquid to gas. This occurs inthe deepest injection intervals, where the CO2 is injected as a liquidthat then expands away from the injection well and vaporizes as itenters a lower pressure regime in the reservoir (Pashin andMcIntyre, 2003). As reservoir waters mix with CO2 forming carbonicacid, the resulting CO2-rich fluid can cause feldspar to break downto dawsonite, trapping some of the CO2 in the mineral structure(Pawar et al., 2006). This may cause a further decrease in permeabil-ity, as pore throats become plugged with liberated fines. Kharaka etal. (2006) demonstrated that the CO2 interactions with iron oxidesand siderite in sandstone reservoirs may mobilize Fe and Mn into res-ervoir fluids. Preliminary produced water data from a pilot CO2-ECBMinjection test in the Pocahontas Basin observed a measurable increasein Fe and Mn, correlated with a decrease in pore water pH followingCO2 injection (Ripepi, 2009, Personal Communication). AnymobilizedFe and other metals could cause potential toxicity and pipeline-scaling, so waters produced from ECBM sites in the Pocahontasbasin would have to be tested and carefully managed using similarpractices currently employed by coal bed methane operators.
6.2. Existing pathways through caprock and overburden
Possible failures in the integrity of reservoir seals in the Pocahon-tas Basin include vertical migration of CO2 out of the coal reservoirs asa result of excessive injection fluid pressures, non-sealing faults andfractures, and leakage associated with existing boreholes (Fig. 3).Sites chosen for ECBM should be evaluated for the distribution ofmapped faults and structure, have some knowledge of fracture inten-sity in the subsurface, and test the geomechanical strength limits(breakdown pressures) of the coal-hosting rocks and major seals(confining intervals) to demonstrate that injected CO2 will remain
Fig. 18. Microprobe EDS map spectrum—Hensley Shale sample from drill holeEQT#36958143 1000 ft. Dominate elements in the energy-dispersive X-ray patternare Si, Al, O, K, Mg, Fe and Ti, indicative of quartz, illite, iron oxides and rutile.
in the injection reservoir(s). ECBM CO2 injections will increase porepressures locally around injection sites, and injection pressures willnot be allowed to exceed the capillary entry pressure or hydraulicfracture pressure of the seals, or pressures that could lead to reactiva-tion of preexisting faults.
The depth to surface-connected natural fractures in the basin isgenerally considered to be 600 ft (183 m) for coal mining, and shal-lower depths are not optimal for CBM operators (Markowski, 1998;Rice and Finn, 1996). Hence, greater depths are considered desirablefor injection of CO2 for ECBM in the basin to avoid open fracture con-duits to the surface. Most producing wells are 1800–2800 ft(549–853 m) deep, so are beneath the level of surface-connectedfractures. Additionally it will be important for the main sealing shalesabove the defined confined intervals (Pocahontas Formation, and Bot-tom Creek Formation) to be at depths greater than 600 ft (183 m), es-pecially where injection intervals extend across multiple coal beds.
Known faults in the region are shown in Fig. 1. Faulting has creat-ed discontinuities that limit the drainage areas of CBMwells. As faultsvertically cut potential caprocks, and the sealing capacity of thesefaults has not been tested, these faults potentially pose a leakagerisk. To ensure operational efficiency, it is recommended that futureECBMwith CO2 would likely avoid wells adjacent to known faults un-less it could be demonstrated that the faults were sealing at both thedepths of injection and the depths of the sealing interval. Additional-ly, using wells adjacent to faults as production wells provides a pres-sure sink that keeps CO2 out of fault zones, thereby protecting againstmigration of injected fluid out of the CBM reservoir.
Most of the producing CBM wells in the basin are hydraulicallyfractured. Induced fractures are zones of potential leakage or bypassfor injected CO2 if they have propagated out of the coal beds andthrough confining rock units. Fracture height and orientation shouldbe investigated to optimize design for CO2 floods and to model likelymigration pathways. Primary seals will need to be above the level of
Table 3Total organic contents of selected shales (wt.%) in ECBM in-jection intervals of the Breathitt Group from Drill HoleDOEM2 and EQT#36958143. Depths (ft) are second valuein sample number. Values greater than 10% TOC signify mud-stones with observable carbonaceous laminae.
Sample % TOC
DOEM2 1195 7.05DOEM2 1675 37.80DOEM2 1875 3.68DOEM2 1922 2.74EQT#36958143 0857 3.44EQT#36958143 1743 2.58EQT#36958143 1810 4.06EQT#36958143 2057 4.20EQT#36958143 2115 2.16EQT#36958143 2427 11.70
123R.P. Grimm et al. / International Journal of Coal Geology 90–91 (2012) 110–125
hydraulic fracturing prior to any CO2 injection. This is especially im-portant as operators have occasionally stimulated seams abovethese regional seals, such as the Jawbone Coal seam thereby increas-ing the local risk for leakage if hydraulic fracturing treatments did notremain in seam.
Although the maximum seal capacity estimated for the HensleyShale is greater than the thickness of the net ECBM coal reservoirs,this capacity is static, and the temporary high pressures that couldbe generated during injection should be carefully monitored toavoid flow out of the injection zone. As there is no established injec-tion pressure limit for the Pocahontas Basin, injection designs mustcarefully history match and remain below formational break-downpressures experienced during hydraulic fracture treatments at sur-rounding wells. Breakdown pressures for the Pennsylvanian intervalat the Russell County ECBM injection well ranged from 0.92 to1.22 psi/ft. Applying this breakdown pressure range to the measureddepth range of the regional Hensley Shale (800–1200 ft) suggests in-jection shut-in pressures will likely not be allowed to exceed ~750–1400 psi (5200–9600 kPa) above the base of this confining unit.
Our approach to the calculation of seal capacity for the CO2–
water–rock system assumes that CO2 is in a gaseous phase with ashale–CO2 contact angle of 0°. For those areas where coals are morethan 2000 ft (610 m) deep or at pressures in excess of 1073 psi(7400 kPa), CO2 may be injected as a supercritical fluid in the reser-voir, and the contact angle with the lithologic seal may be non-zeroand its capacity estimates for threshold pressure and column heightsmay be reduced. Additional studies may be helpful to better under-stand seal behavior for these phase differences in CO2.
Limited information exists to currently assess the degree to whichformation water saturations may positively enhance or negativelyimpact the ultimate seal capacity of an ECBM project in the Pocahon-tas Basin. Data from CBM water production suggests that PocahontasBasin coals are moderately drier and potentially more hydrologicallyisolated from regional aquifer systems than other coal bed methaneaccumulations in the Dunkard or Black Warrior Basins (Harlow andLeCain, 1993; Milici et al., 2010; Nolde and Spears, 1998). Furtherstudies should seek to quantify formation water contents.
Additional leakage risk from existing gas wells is possible consid-ering the dense spacing of wells in some areas. Old wells provide themost rapid potential escape path for injected CO2 (Fig. 3). More than9000 wells (Pennsylvanian CBM and deeper Mississippian and Devo-nian natural gas and oil) have been completed in the study area, andthese penetrate the sealing strata analyzed in this study. Corrosion ofvintage casing and well cements with CO2-enriched fluids poses aknown leakage risk in the geological storage of carbon dioxide (IEAGHG, 2005). Other seal-penetration risks include unregulated(unmapped) exploration boreholes from coal mining, CBM core-sampling, pre-regulation gas wells, and mine workings. The south-west Virginia CBM area contains active coal mines operating at depthsof 2200–2500 ft (671–762 m). Any future injection of CO2 for ECBMwould likely have to exclude areas of active or potential future coalmining. Mine map locations, known well locations, and known com-pletion techniques for existing wells, should be compiled into an in-ventory of potential leakage hazards in the area of a predicted CO2-ECBM plume, would be a desirable prerequisite prior to injection.
7. Conclusions
CO2-ECBM provides a potential market-based method to producerevenue from coal bed methane while simultaneously storing atmo-spheric greenhouse gases. An understanding of confining seal charac-teristics is fundamental to determining the feasibility, design, andcontainment risks of CO2-ECBM in the southwest Virginia CBM field.The geological characteristics of the lower Pennsylvanian strata sur-rounding CBM-producing coal beds have been effective fornaturally-trapping coal bed methane, and preliminary analyses in
this investigation indicate they should be favorable for confiningCO2 with ECBM.
Based on this study, it is recommended that CO2-ECBM storageand recovery be conducted in the stratigraphic interval below theHensley Shale where this confinement horizon is greater than 600 ft(183 m) below the surface and is above the level of hydraulic fractur-ing in CBM wells. These conditions evidently will provide adequateprotection against leakage into underground sources of drinkingwater and the atmosphere. Sites should also be away from faultsand active mining areas, and should be in areas where past boreholeand well locations are known, and well casing histories are well un-derstood and have integrity. Careful site selection with these param-eters will allow the ECBM injection zone to be hydrologically isolatedby several thick, overlying, extensive shale-seal barriers and low-matrix permeability sandstone baffles that will restrict the verticalmigration of excess CO2, liberated CH4, and mobilized brine metals.
Acknowledgments
This ongoing research is performed under the direction of the Vir-ginia Center for Coal Energy Research, as part of the Southeast Re-gional Carbon Sequestration Partnership Phase II: Task 10Characterization of Potential Sites for a Large-Volume Carbon Seques-tration Test in Coal Seams with Enhanced Coal Bed Methane Recoveryin Central Appalachia. This project is funded by the U.S. Departmentof Energy through the National Energy Technology Laboratory, Sub-grant No. DE-PS26-05NT42255 as supplied by the Southern States En-ergy Board for Regional Carbon Sequestration Partnerships-Phase II.Support also was provided by the Department of Geosciences, Virgin-ia Tech. Cross sections and maps were prepared using GeographixSoftware by Landmark. Geochemical, petrophysical and petrographicanalyses were conducted by Kentucky Geological Survey, Weather-ford Labs and Virginia Tech Department of Geosciences MicroprobeLab. Reviews provided by William Henika, Jack Pashin and DavidMorse significantly improved an earlier version of this manuscript.
References
Alymore, M.G., Lincoln, F.J., 2001. Mechanochemical milling-induced reactions be-tween gases and sulfide minerals: II. Reactions of CO2 with arsenopyrite, pyrrhotiteand pyrite. Journal of Alloys and Compounds 314 (1–2), 103–113.
Arkle, T., 1974. Stratigraphy of the Pennsylvanian and Permian systems of the centralAppalachians. In: Briggs, G. (Ed.), Carboniferous of the Southeastern United States:Geological Society of America Special Paper, 148, pp. 5–30.
Benson, S.M., Cole, D.R., 2008. CO2 sequestration in deep sedimentary formations.Elements 4, 325–331.
Berg, R.R., 1975. Capillary pressures in stratigraphic traps. American Association ofPetroleum Geologists Bulletin 59, 939–956.
Blake, B.M., Beuthin, J.D., 2008. Deciphering the mid-carboniferous eustatic event in thecentral Appalachian foreland basin, southern West Virginia, USA. Resolving theLate Paleozoic Ice Age in Time and Space 441, 249–260.
Blunt, M., Fayers, F.J., Orr, F.M., 1993. Carbon dioxide in enhanced oil recovery. EnergyConversion Management 34, 1197–1204.
Bodek, R.J., 2006. Sequence Stratigraphic Architecture of Early Pennsylvanian, Coal-bearing Strata of the Cumberland Block a Case Study from Dickenson County.Blacksburg, Va., University Libraries, Virginia Polytechnic Institute and State Uni-versity, Virginia.
Cecil, C.B., Stanton, R.W., Neuzil, S.G., Dulong, F.T., Ruppert, L.F., Pierce, B.S., 1985. Paleo-climate controls on Late Paleozoic sedimentation and peat formation in the CentralAppalachian Basin (USA). International Journal of Coal Geology 5, 195–230.
Chesnut Jr., D.R., 1992. Stratigraphic and structural framework of the carboniferousrocks of the central Appalachian Basin in Kentucky: Kentucky Geological Survey,series. 11. Bulletin 3 (42 pp).
Chesnut Jr., D.R., 1994. Eustatic and tectonic control of deposition of the Lower andMiddle Pennsylvanian strata of the Central Appalachian Basin. Concepts in Sedi-mentology and Paleontology 4, 51–64.
Christopher, C.A., Iliffe, J., 2006. Reservoir seals: how they work and how to choose agood one. Proceedings, CO2SC Symposium, Lawrence Berkeley National Laboratory,Berkeley, California, March 20–22, 2006.
Conrad, J.M., Miller, M.J., Phillips, J., Ripepi, N., 2006. Characterization of Central Appa-lachian Basin CBM development: potential for carbon sequestration and enhancedCBM recovery. 2006 International Coalbed Methane Symposium, Preprint 0625,Tuscaloosa, AL.
124 R.P. Grimm et al. / International Journal of Coal Geology 90–91 (2012) 110–125
Cook, P., 2006. Site characterization for CO2 geological storage. International Sympo-sium on Site Characterization for CO2 Geological Storage-CO2SC., 20–22 March2006., Berkeley, CA, USA.
Diamond, W.P., LaScola, J.C., Hyman, D.M., 1986. Results of direct-method determina-tion of the gas content of U.S. coal beds. U.S. Department of Interior, Bureau ofMines, Information Circular 9067 (95 pp).
Downey, M.W., 1984. Evaluating seals for hydrocarbon accumulations. American Asso-ciation of Petroleum Geologists Bulletin 68, 1752–1763.
Englund, K.J., Thomas, R.E., 1990. Late Paleozoic depositional trends in the centralAppalachian Basin. U.S. Geological Survey Bulletin, Report: B.
Englund, K.J., Arndt, H.H., Henry, T.W., 1979. Proposed Pennsylvanian System Strato-type. Falls Church, Va., American Geological Institute, Virginia and West Virginia,p. 136 (vi).
Englund, K.J., Windolph Jr., J.F., Thomas, R.E., 1986. Origin of thick, low-sulphur coalin the Lower Pennsylvanian Pocahontas Formation, Virginia and West Virginia.Special Paper Geological Society of America 210, 49–61.
Ettensohn, F.R., 2004. Modeling the nature and development of major Paleozoic clasticwedges in the Appalachian Basin, USA. Journal of Geodynamics 37, 657–681.
Gale, J., Freund, P., 2001. Coalbed methane enhancement with CO2 sequestrationworldwide potential. Environmental Geosciences 8, 210.
Gentzis, T., 2000. Subsurface sequestration of carbon dioxide—an overview fromanAlberta(Canada) perspective. International Journal of Coal Geology 43, 287–305.
Gluskoter, H., Stanton, R.W., Flores, R.M., Warwick, P.D., 2002. Adsorption of carbon di-oxide and methane in low-rank coals and the potential for sequestration of carbondioxide. Environmental Geosciences 9 (3), 160–161.
Greb, S.F., Chesnut Jr., D.R., Eble, C.F., 2004. Temporal changes in coal-bearing deposi-tional sequences (Lower and Middle Pennsylvanian) of the central AppalachianBasin, USA: coal-bearing strata: sequence stratigraphy, paleoclimate, and tectonicsof coal-bearing strata. American Association of Petroleum Geologists, Studies inGeology 51, 89–120.
Greb, S.F., Pashin, J.C., Martino, R.L., Eble, C.F., 2008. Appalachian sedimentary cyclesduring the Pennsylvanian: changing influences of sea-level, climate and tectonics.In: Fielding, C.R., Frank, T.D., Isbell, J.L., eds., Resolving the Late Paleozoic Ice Age inTime and Space: Geological Society of America. Special Paper 441, 235–248.
Harlow, G.E., LeCain Jr., G.D., 1993. Hydraulic characteristics of, and ground-waterflow in, coal-bearing rocks of Southwestern Virginia. U.S. Geological Survey,Water Supply Paper 2388.
Henika, W.S., 1994. Internal structure of the coal bearing portion of the CumberlandOverthrust Block in Southwestern Virginia and adjoining areas, in geology andmineral resources of the Southwestern Virginia Coalfield. Virginia Division ofMineral Resources Publication 131, 100–120.
Hovorka, S.D., 1999. Optimal geological environments for carbon dioxide disposal insaline aquifers in the United States. Bureau of Economic Geology Report for DOE.(55 pp).
Hunt, A.M., Steele, D.J., 1991. Coalbed methane technology development in the Appala-chian basin. Topical Report, prepared for Gas Research Institute, Contract Number5089-214-1783, Chicago, IL. (111 pp).
IEA GHG (International Energy Agency Greenhouse Gas R&D Programme), 2005. Reporton Wellbore Integrity Workshop, Houston. http://www.co2captureandstorage.info/docs/wbifinalreport.pdf (accessed May 2010).
Jennings, J.J., 1987. Capillary pressure techniques: application to exploration and devel-opment geology. American Association of Petroleum Geologists Bulletin 71,1196–1209.
Kelafant, J.R., Boyer, C.M., 1988. A geologic assessment of natural gas from coal seams inthe central Appalachian basin. Topical Report (January 1988–November 1988)Prepared Under Contract No. 5084-214-1066. Gas Research Institute, Chicago,IL. (66 pp).
Kharaka, Y.K., Cole, D.R., Hovorka, S.D., Gunter, W.D., Knauss, K.G., Freifeld, B.M., 2006.Gas–water–rock interactions in Frio Formation following CO2 injection: implica-tions for the storage of greenhouse gases in sedimentary basins. Geology 34,577–580.
Koperna, G.J., Riestenberg, D.E., 2009. Carbon dioxide enhanced coal bed methane andstorage: is there promise? SPE International Conference on CO2 Capture, Storageand Utilization. 2–4 November 2009., San Diego California, USA.
Korus, J.T., 2002. The Lower Pennsylvanian New River Formation a Nonmarine Recordof Glacioeustasy in a Foreland Basin. University Libraries, Virginia PolytechnicInstitute and State University, Blacksburg, Va. (61 pp).
Krushin, J.T., 1997. Seal capacity of non-smectite shale. In: Surdam, R.C. (Ed.), Seals,Traps, and the Petroleum System: American Association of Petroleum GeologistsMemoir, 67, pp. 31–67.
Lewis, R.T., 1999. Coalbed methane production of the Buck Knob anticline field, WiseCounty, Virginia. American Association of Petroleum Geologists Bulletin 83, 1370.
Loomis, I. 1997 Experiments concerning the Commercial Extraction of Methane fromCoal bed Reservoirs, Ph.D. Dissertation, Virginia Polytechinic Institute and StateUniversity, Blacksburg, VA, 535 p.
Lyons, P.C., 1998. The central and northern Appalachian Basin—a frontier region forcoal bed methane development. International Journal of Coal Geology 38, 61–87.
Markowski, A.K., 1998. Coal bed methane resource potential and current prospects inPennsylvania. International Journal of Coal Geology 38, 137–159.
Mastalerz, M., Gluskoter, H., Rupp, J., 2004. Carbon dioxide and methane sorption inhigh volatile bituminous coals from Indiana, USA. International Journal of Coal Ge-ology 60, 43–55.
Mavor, M.J., Gunter, W.D., Robinson, J.R., Law, D.H.S., Gale, J., 2002. Testing for CO2
sequestration and enhanced methane production from coal. IEA Greenhouse GasR&D Programme Source Society of Petroleum Engineers Gas Technology Symposium,30 April–2 May 2002, Calgary, Alberta, Canada.
Milici, R.C., Ryder, R.T., Swezey, C.S., Charpentier, R.R., Cook, T.A., Crovelli, R.A., Klett,T.R., Pollastro, R.M., Schenk, C.J., 2003. Assessment of undiscovered oil and gasresources of the Appalachian Basin Province. U.S. Geological Survey Fact SheetFS-009-03. (4 pp).
Milici, R.C., Hatch, J.R., Pawlewicz, M.J., 2010. Coalbed methane resources of the Appa-lachian basin, eastern USA. International Journal of Coal Geology 82, 160–174.
Mitra, G., 1988. 3-Dimensional geometry and kinematic evolution of the Pine MountainThrust System, Southern Appalachians. Geological Society of America Bulletin 100,72–95.
Nelson, C.R., Steadman, E.N., Harju, J.A., 2005. Geologic CO2 sequestration potential ofthe Wyodak-Anderson coal zone in the Powder River Basin. Plains CO2 Reduction(PCOR) Partnership Topical Report for U.S. Department of Energy; Energy andEnvironmental Research Center: University of North Dakota, August.
Nolde, J.E., Spears, D., 1998. A preliminary assessment of in place coal bed methaneresources in the Virginia portion of the central Appalachian Basin. InternationalJournal of Coal Geology 38, 115–136.
Orr, F.M., Taber, J.J., 1984. Use of carbon dioxide in enhanced oil recovery. Science 224,563–569.
Pacala, S., Socolow, R., 2004. Stabilization wedges: solving the climate problem for thenext 50 years with current technologies. Science 305, 968–972.
Pashin, J.C., McIntyre, M.R., 2003. Temperature–pressure conditions in coalbed meth-ane reservoirs of the Black Warrior basin, Alabama, U.S.A: implications for carbonsequestration and enhanced coalbed methane recovery. International Journal ofCoal Geology 54, 167–183.
Pashin, J.C., Groshong Jr., R.H., Carroll, R.E., 2000. Carbon sequestration potential ofcoalbed methane reservoirs: toward a global, market-based environmental solu-tion. In: Dhar, B.B., Gautam, N.N. (Eds.), Mining Policy Initiatives. A.P.H. PublishingCorporation, Mining Geological and Metallurgical Institute of India, Delhi Branch,New Delhi, pp. 153–173.
Pashin, J.C., Groshong Jr., R.H., Carroll, R.E., 2001. Carbon sequestration potential ofcoalbed methane reservoirs in the Black Warrior basin: a preliminary look. Tusca-loosa, Alabama, University of Alabama, College of Continuing Studies, 2001 Inter-national Coalbed Methane Symposium Proceedings, pp. 51–62.
Pashin, J.C., McIntyre, M.R., Carroll, R.E., Groshong Jr., R.H., Bustin, R.M., 2009. Carbonsequestration and enhanced recovery potential of mature coalbed methane reser-voirs in the Black Warrior basin. In: Grobe, M., Pashin, J.C., Dodge, R.L. (Eds.), Car-bon Dioxide Sequestration in Geological Media: State of the Science: AmericanAssociation of Petroleum Geologists: Studies in Geology, 59, pp. 125–147.
Pawar, R.J., Warpinski, N.R., Lorenz, J.C., Benson, R.D., Grigg, R.B., Stubbs, B.A., Stauffer,P.H., Krumhansl, J.L., Cooper, S.P., Svec, R.K., 2006. Overview of a CO2 sequestrationfield test in theWest Pearl Queen reservoir, NewMexico. Environmental Geosciences13, 163–180.
Pittman, E.D., 1992. Relationship of porosity and permeability to various parametersderived from mercury injection–capillary pressure curves for sandstone. Bulletinof the American Association of Petroleum Geologists 76, 191–198.
Reichle, D., Houghton, J., Kane, B., Ekmann, J., Benson, S., Clarke, J., Dahlman, R., Hendrey,G., Herzog, H., Hunter-Cevera, J., 1999. Carbon Sequestration, State of the Science.US Department of Energy, Office of Science, Office of Fossil Energy, Washington.(1999).
Rice, C.L., 1985. Terrestrial vs marine depositional model—a new assessment of subsur-face Lower Pennsylvanian rocks of Southwestern Virginia. Geology 13, 786–789.
Rice, D.D., Finn, T.M., 1996. Geologic framework and description of coal bed gas plays:Appalachian basin province. In: Gautier, D.L., Dolton, G.L., Takahaski, K.I., Varnes,K.L. (Eds.), 1995 National Assessment of United States Oil and Gas Resources —
Results, Methodology, and Supporting Data, U.S. Geological Survey Digital DataSeries DDS-30, CD-ROM, Denver, CO (134 pp).
Rice, C.L., Schwietering, J.F., 1988. Fluvial deposition in the Central Appalachians duringthe Early Pennsylvanian. U.S. Geological Survey Bulletin, Report: B. .
Rich, J.L., 1934. Mechanics of low-angle overthrust faulting as illustrated by Cumber-land thrust block, Virginia, Kentucky, and Tennessee. American Association ofPetroleum Geologists Bulletin 18, 1584–1596.
Ripepi, N.S., 2009. Carbon Dioxide Storage in Coal seams with Enhanced Coal BedMethane Recovery Geologic Evaluation, Capacity Assessment and Field Validationof the Central Appalachian Basin. University Libraries, Virginia Polytechnic Insti-tute and State University, Blacksburg, Va. (247 pp).
Rodvelt, G.D., Moyers, W.L., Malamisura, P.R., Hagy, C.W., Greer, S., 2009. Recomple-tions in a Virginia coal bed–methane field yield additional gas. SPE Eastern RegionalMeeting, 23–25 September 2009, Charleston, West Virginia, USA.
Showalter, T.T., 1979. Mechanics of secondary hydrocarbon migration and entrapment.American Association of Petroleum Geologists Bulletin 63, 723–760.
Sneider, R.M., 1991. Evaluation of reservoirs and seals. American Association of Petro-leum Geologists, Education Dept. Short Course Notes. Midland, TX. (347pp).
Sneider, R.M., Sneider, J.S., Bolger, G.W., Neasham, J.W., 1997. Comparison of sealcapacity determinations: conventional cores vs. cuttings. In: Surdam, R.C. (Ed.),Seals, Traps, and the Petroleum System: American Association of PetroleumGeologists Memoir, 67, pp. 1–12.
Stevens, S.H., Gale, J., 2000. Geologic CO2 sequestration may benefit upstream Industry.Oil Gas Journal 15, 40–44.
Taber, J.J., Martin, R.S., Seright, R.S., 1997. EOR screening criteria revisited—part 1: intro-duction to screening criteria and enhanced recovery field projects. SPE ReservoirEngineering 12 (3), 189–198.
United States Department of Energy—Energy Information Administration, 2009. CoalBed Methane Proved Reservesaccessed August 15, 2010: http://www.eia.gov/dnav/ng/ng_enr_coalbed_s1_a.htm.
United States Department of Energy—National Energy Technology Laboratory, 2008.Phase II CO2 Sequestration in Coal Seams Factsheet—Central Appalachian Coal Seam

125R.P. Grimm et al. / International Journal of Coal Geology 90–91 (2012) 110–125
Project. http://www.netl.doe.gov/publications/proceedings/08/rcsp/factsheets/5-SECARB_Central%20Appalachian_Coal.pdf (Accessed August 15, 2010).
United States Department of Energy—National Energy Technology Laboratory., 2008. Car-bon Sequestration Atlas of the United States and Canada—Atlas II. http://www.netl.doe.gov/technologies/carbon_seq/refshelf/atlas/index.html (accessed May 17, 2010).
van Bergen, F.B., Pagnier, H., Kryztolik, P., 2006. Field experiment of enhanced coalbedmethane–CO2 in the upper Silesian basin of Poland. Environmental Geosciences 13,201–224.
Vavra, C.L., Kaldi, J.G., Sneider, R.M., 1992. Geological applications of capillary pressure:a review. American Association of Petroleum Geologists Bulletin 76, 840–850.
Virginia Department of Mines, Minerals and Energy, 2009. Gas and Oil ProductionStatistics. http://www.dmme.virginia.gov/DGO/Production/gasoilproductionstats.shtml(accessed August 13, 2010).
Vrolijk, P., Maze, W., Teletze, G., Jones, T.E., 2011. Subsurface CO2 storage in geologictraps—procedures for evaluating trap adequacy. Energy Procedia 4, 4617–4624.
Weir, G.J., White, S.P., Kissling, W.M., 1996. Reservoir storage and containment ofgreenhouse gases. Transport in Porous Media 23, 37–60.
Wong, S., Gunter, B., 1999. Testing CO2-enhanced coal bed methane recovery. Green-house Issues 45 (14 pp).
Zuber, M.D., 1998. Production characteristics and reservoir analysis of coal bed meth-ane reservoirs. International Journal of Coal Geology 38, 27–45.