Embed Size (px)
Citation preview

arX
iv:h
ep-e
x/03
0302
4 v1
17
Mar
200
3
EUROPEAN ORGANIZATION FOR NUCLEAR RESEARCH
CERN–EP/2002-076
8 August 2002
Search for an LSP gluino at LEP
with the DELPHI detector
DELPHI Collaboration
Abstract
In some supersymmetric models, the gluino (g) is predicted to be light andstable. In that case, it would hadronize to form R-hadrons. In these models,the missing energy signature of the lightest supersymmetric particle is no longervalid, even if R-parity is conserved. Therefore, such a gluino is not constrainedby hadron collider results, which looked for the decay g → qqχ0
1.Data collected by the DELPHI detector in 1994 at 91.2 GeV have been analysedto search for qqgg events. No deviation from Standard Model predictions isobserved and a gluino mass between 2 and 18 GeV/c2 is excluded at the 95%confidence level in these models. Then, R-hadrons produced in the squarkdecays were searched for in the data collected by DELPHI at the centre-of-massenergies of 189 to 208 GeV, corresponding to an overall integrated luminosityof 609 pb−1. The observed number of events is in agreement with the StandardModel predictions. Limits at 95% confidence level are derived on the squarkmasses from the excluded regions in the plane (mq1
,mg):
mt1 > 90 GeV/c2, and mb1> 96 GeV/c2 for purely left squarks.
mt1 > 87 GeV/c2, and mb1> 82 GeV/c2 independent of the mixing angle.
(Eur. Phys. J. C26 (2003) 505)

ii
J.Abdallah24, P.Abreu22, W.Adam50, P.Adzic11, T.Albrecht17, T.Alderweireld2, R.Alemany-Fernandez8,
T.Allmendinger17, P.P.Allport23, U.Amaldi28, N.Amapane44, S.Amato47, E.Anashkin35, A.Andreazza27, S.Andringa22,
N.Anjos22, P.Antilogus26, W-D.Apel17, Y.Arnoud14, S.Ask25, B.Asman43, J.E.Augustin24, A.Augustinus8, P.Baillon8,
A.Ballestrero45, P.Bambade20, R.Barbier26, D.Bardin16, G.Barker17, A.Baroncelli38, M.Battaglia8, M.Baubillier24,
K-H.Becks52, M.Begalli6, A.Behrmann52, E.Ben-Haim20, N.Benekos31, A.Benvenuti5, C.Berat14, M.Berggren24,
L.Berntzon43, D.Bertrand2, M.Besancon39, N.Besson39, D.Bloch9, M.Blom30, M.Bluj51, M.Bonesini28, M.Boonekamp39,
P.S.L.Booth23, G.Borisov21, O.Botner48, B.Bouquet20, T.J.V.Bowcock23, I.Boyko16, M.Bracko42, R.Brenner48,
E.Brodet34, P.Bruckman18, J.M.Brunet7, L.Bugge32, P.Buschmann52, M.Calvi28, T.Camporesi8, V.Canale37, F.Carena8,
N.Castro22, F.Cavallo5, M.Chapkin41, Ph.Charpentier8, P.Checchia35, R.Chierici8, P.Chliapnikov41, J.Chudoba8,
S.U.Chung8, K.Cieslik18, P.Collins8, R.Contri13, G.Cosme20, F.Cossutti46, M.J.Costa49, B.Crawley1, D.Crennell36,
J.Cuevas33, J.D’Hondt2, J.Dalmau43, T.da Silva47, W.Da Silva24, G.Della Ricca46, A.De Angelis46, W.De Boer17,
C.De Clercq2, B.De Lotto46 , N.De Maria44, A.De Min35, L.de Paula47, L.Di Ciaccio37, A.Di Simone38, K.Doroba51,
J.Drees52,8, M.Dris31, G.Eigen4, T.Ekelof48, M.Ellert48, M.Elsing8, M.C.Espirito Santo8, G.Fanourakis11,
D.Fassouliotis11,3, M.Feindt17, J.Fernandez40 , A.Ferrer49, F.Ferro13, U.Flagmeyer52, H.Foeth8, E.Fokitis31,
F.Fulda-Quenzer20, J.Fuster49, M.Gandelman47, C.Garcia49, Ph.Gavillet8, E.Gazis31, T.Geralis11, R.Gokieli8,51,
B.Golob42, G.Gomez-Ceballos40, P.Goncalves22 , E.Graziani38, G.Grosdidier20, K.Grzelak51, J.Guy36, C.Haag17,
A.Hallgren48, K.Hamacher52, K.Hamilton34, J.Hansen32, S.Haug32, F.Hauler17, V.Hedberg25, M.Hennecke17, H.Herr8,
J.Hoffman51, S-O.Holmgren43, P.J.Holt8, M.A.Houlden23, K.Hultqvist43, J.N.Jackson23, G.Jarlskog25, P.Jarry39,
D.Jeans34, E.K.Johansson43, P.D.Johansson43, P.Jonsson26, C.Joram8, L.Jungermann17, F.Kapusta24, S.Katsanevas26,
E.Katsoufis31, G.Kernel42, B.P.Kersevan8,42, A.Kiiskinen15, B.T.King23, N.J.Kjaer8, P.Kluit30, P.Kokkinias11,
C.Kourkoumelis3, O.Kouznetsov16 , Z.Krumstein16, M.Kucharczyk18, J.Lamsa1, G.Leder50, F.Ledroit14, L.Leinonen43,
R.Leitner29, J.Lemonne2, V.Lepeltier20, T.Lesiak18, W.Liebig52, D.Liko50, A.Lipniacka43, J.H.Lopes47, J.M.Lopez33,
D.Loukas11, P.Lutz39, L.Lyons34, J.MacNaughton50 , A.Malek52, S.Maltezos31, F.Mandl50, J.Marco40, R.Marco40,
B.Marechal47, M.Margoni35, J-C.Marin8, C.Mariotti8, A.Markou11, C.Martinez-Rivero40, J.Masik12,
N.Mastroyiannopoulos11, F.Matorras40, C.Matteuzzi28 , F.Mazzucato35 , M.Mazzucato35, R.Mc Nulty23, C.Meroni27,
W.T.Meyer1, E.Migliore44, W.Mitaroff50, U.Mjoernmark25, T.Moa43, M.Moch17, K.Moenig8,10, R.Monge13,
J.Montenegro30, D.Moraes47, S.Moreno22, P.Morettini13, U.Mueller52, K.Muenich52, M.Mulders30, L.Mundim6,
W.Murray36, B.Muryn19, G.Myatt34, T.Myklebust32, M.Nassiakou11, F.Navarria5, K.Nawrocki51, R.Nicolaidou39,
M.Nikolenko16,9, A.Oblakowska-Mucha19, V.Obraztsov41, A.Olshevski16, A.Onofre22, R.Orava15, K.Osterberg15,
A.Ouraou39, A.Oyanguren49, M.Paganoni28, S.Paiano5, J.P.Palacios23, H.Palka18, Th.D.Papadopoulou31 , L.Pape8,
C.Parkes23, F.Parodi13, U.Parzefall8, A.Passeri38, O.Passon52, L.Peralta22, V.Perepelitsa49, A.Perrotta5, A.Petrolini13,
J.Piedra40, L.Pieri38, F.Pierre39, M.Pimenta22, E.Piotto8, T.Podobnik42, V.Poireau39, M.E.Pol6, G.Polok18,
P.Poropat†46, V.Pozdniakov16, N.Pukhaeva2,16 , A.Pullia28, J.Rames12, L.Ramler17, A.Read32, P.Rebecchi8, J.Rehn17,
D.Reid30, R.Reinhardt52, P.Renton34 , F.Richard20, J.Ridky12, M.Rivero40, D.Rodriguez40, A.Romero44, P.Ronchese35,
E.Rosenberg1, P.Roudeau20, T.Rovelli5, V.Ruhlmann-Kleider39, D.Ryabtchikov41 , A.Sadovsky16, L.Salmi15, J.Salt49,
A.Savoy-Navarro24, U.Schwickerath8, A.Segar34, R.Sekulin36, M.Siebel52, A.Sisakian16, G.Smadja26, O.Smirnova25,
A.Sokolov41, A.Sopczak21, R.Sosnowski51, T.Spassov8, M.Stanitzki17, A.Stocchi20, J.Strauss50, B.Stugu4,
M.Szczekowski51, M.Szeptycka51 , T.Szumlak19, T.Tabarelli28, A.C.Taffard23, F.Tegenfeldt48 , J.Timmermans30,
L.Tkatchev16 , M.Tobin23, S.Todorovova12 , A.Tomaradze8, B.Tome22, A.Tonazzo28, P.Tortosa49, P.Travnicek12,
D.Treille8, G.Tristram7, M.Trochimczuk51, C.Troncon27, M-L.Turluer39, I.A.Tyapkin16, P.Tyapkin16, S.Tzamarias11,
V.Uvarov41, G.Valenti5, P.Van Dam30, J.Van Eldik8, A.Van Lysebetten2 , N.van Remortel2, I.Van Vulpen30, G.Vegni27,
F.Veloso22, W.Venus36, F.Verbeure2, P.Verdier26, V.Verzi37, D.Vilanova39, L.Vitale46, V.Vrba12, H.Wahlen52,
A.J.Washbrook23, C.Weiser17, D.Wicke8, J.Wickens2, G.Wilkinson34, M.Winter9, M.Witek18, O.Yushchenko41,

iii
A.Zalewska18, P.Zalewski51, D.Zavrtanik42, N.I.Zimin16, A.Zintchenko16 , M.Zupan11
1Department of Physics and Astronomy, Iowa State University, Ames IA 50011-3160, USA2Physics Department, Universiteit Antwerpen, Universiteitsplein 1, B-2610 Antwerpen, Belgiumand IIHE, ULB-VUB, Pleinlaan 2, B-1050 Brussels, Belgiumand Faculte des Sciences, Univ. de l’Etat Mons, Av. Maistriau 19, B-7000 Mons, Belgium
3Physics Laboratory, University of Athens, Solonos Str. 104, GR-10680 Athens, Greece4Department of Physics, University of Bergen, Allegaten 55, NO-5007 Bergen, Norway5Dipartimento di Fisica, Universita di Bologna and INFN, Via Irnerio 46, IT-40126 Bologna, Italy6Centro Brasileiro de Pesquisas Fısicas, rua Xavier Sigaud 150, BR-22290 Rio de Janeiro, Braziland Depto. de Fısica, Pont. Univ. Catolica, C.P. 38071 BR-22453 Rio de Janeiro, Braziland Inst. de Fısica, Univ. Estadual do Rio de Janeiro, rua Sao Francisco Xavier 524, Rio de Janeiro, Brazil
7College de France, Lab. de Physique Corpusculaire, IN2P3-CNRS, FR-75231 Paris Cedex 05, France8CERN, CH-1211 Geneva 23, Switzerland9Institut de Recherches Subatomiques, IN2P3 - CNRS/ULP - BP20, FR-67037 Strasbourg Cedex, France
10Now at DESY-Zeuthen, Platanenallee 6, D-15735 Zeuthen, Germany11Institute of Nuclear Physics, N.C.S.R. Demokritos, P.O. Box 60228, GR-15310 Athens, Greece12FZU, Inst. of Phys. of the C.A.S. High Energy Physics Division, Na Slovance 2, CZ-180 40, Praha 8, Czech Republic13Dipartimento di Fisica, Universita di Genova and INFN, Via Dodecaneso 33, IT-16146 Genova, Italy14Institut des Sciences Nucleaires, IN2P3-CNRS, Universite de Grenoble 1, FR-38026 Grenoble Cedex, France15Helsinki Institute of Physics, HIP, P.O. Box 9, FI-00014 Helsinki, Finland16Joint Institute for Nuclear Research, Dubna, Head Post Office, P.O. Box 79, RU-101 000 Moscow, Russian Federation17Institut fur Experimentelle Kernphysik, Universitat Karlsruhe, Postfach 6980, DE-76128 Karlsruhe, Germany18Institute of Nuclear Physics,Ul. Kawiory 26a, PL-30055 Krakow, Poland19Faculty of Physics and Nuclear Techniques, University of Mining and Metallurgy, PL-30055 Krakow, Poland20Universite de Paris-Sud, Lab. de l’Accelerateur Lineaire, IN2P3-CNRS, Bat. 200, FR-91405 Orsay Cedex, France21School of Physics and Chemistry, University of Lancaster, Lancaster LA1 4YB, UK22LIP, IST, FCUL - Av. Elias Garcia, 14-1o, PT-1000 Lisboa Codex, Portugal23Department of Physics, University of Liverpool, P.O. Box 147, Liverpool L69 3BX, UK24LPNHE, IN2P3-CNRS, Univ. Paris VI et VII, Tour 33 (RdC), 4 place Jussieu, FR-75252 Paris Cedex 05, France25Department of Physics, University of Lund, Solvegatan 14, SE-223 63 Lund, Sweden26Universite Claude Bernard de Lyon, IPNL, IN2P3-CNRS, FR-69622 Villeurbanne Cedex, France27Dipartimento di Fisica, Universita di Milano and INFN-MILANO, Via Celoria 16, IT-20133 Milan, Italy28Dipartimento di Fisica, Univ. di Milano-Bicocca and INFN-MILANO, Piazza della Scienza 2, IT-20126 Milan, Italy29IPNP of MFF, Charles Univ., Areal MFF, V Holesovickach 2, CZ-180 00, Praha 8, Czech Republic30NIKHEF, Postbus 41882, NL-1009 DB Amsterdam, The Netherlands31National Technical University, Physics Department, Zografou Campus, GR-15773 Athens, Greece32Physics Department, University of Oslo, Blindern, NO-0316 Oslo, Norway33Dpto. Fisica, Univ. Oviedo, Avda. Calvo Sotelo s/n, ES-33007 Oviedo, Spain34Department of Physics, University of Oxford, Keble Road, Oxford OX1 3RH, UK35Dipartimento di Fisica, Universita di Padova and INFN, Via Marzolo 8, IT-35131 Padua, Italy36Rutherford Appleton Laboratory, Chilton, Didcot OX11 OQX, UK37Dipartimento di Fisica, Universita di Roma II and INFN, Tor Vergata, IT-00173 Rome, Italy38Dipartimento di Fisica, Universita di Roma III and INFN, Via della Vasca Navale 84, IT-00146 Rome, Italy39DAPNIA/Service de Physique des Particules, CEA-Saclay, FR-91191 Gif-sur-Yvette Cedex, France40Instituto de Fisica de Cantabria (CSIC-UC), Avda. los Castros s/n, ES-39006 Santander, Spain41Inst. for High Energy Physics, Serpukov P.O. Box 35, Protvino, (Moscow Region), Russian Federation42J. Stefan Institute, Jamova 39, SI-1000 Ljubljana, Slovenia and Laboratory for Astroparticle Physics,
Nova Gorica Polytechnic, Kostanjeviska 16a, SI-5000 Nova Gorica, Slovenia,and Department of Physics, University of Ljubljana, SI-1000 Ljubljana, Slovenia
43Fysikum, Stockholm University, Box 6730, SE-113 85 Stockholm, Sweden44Dipartimento di Fisica Sperimentale, Universita di Torino and INFN, Via P. Giuria 1, IT-10125 Turin, Italy45INFN,Sezione di Torino, and Dipartimento di Fisica Teorica, Universita di Torino, Via P. Giuria 1,
IT-10125 Turin, Italy46Dipartimento di Fisica, Universita di Trieste and INFN, Via A. Valerio 2, IT-34127 Trieste, Italy
and Istituto di Fisica, Universita di Udine, IT-33100 Udine, Italy47Univ. Federal do Rio de Janeiro, C.P. 68528 Cidade Univ., Ilha do Fundao BR-21945-970 Rio de Janeiro, Brazil48Department of Radiation Sciences, University of Uppsala, P.O. Box 535, SE-751 21 Uppsala, Sweden49IFIC, Valencia-CSIC, and D.F.A.M.N., U. de Valencia, Avda. Dr. Moliner 50, ES-46100 Burjassot (Valencia), Spain50Institut fur Hochenergiephysik, Osterr. Akad. d. Wissensch., Nikolsdorfergasse 18, AT-1050 Vienna, Austria51Inst. Nuclear Studies and University of Warsaw, Ul. Hoza 69, PL-00681 Warsaw, Poland52Fachbereich Physik, University of Wuppertal, Postfach 100 127, DE-42097 Wuppertal, Germany
† deceased
1
1 Introduction
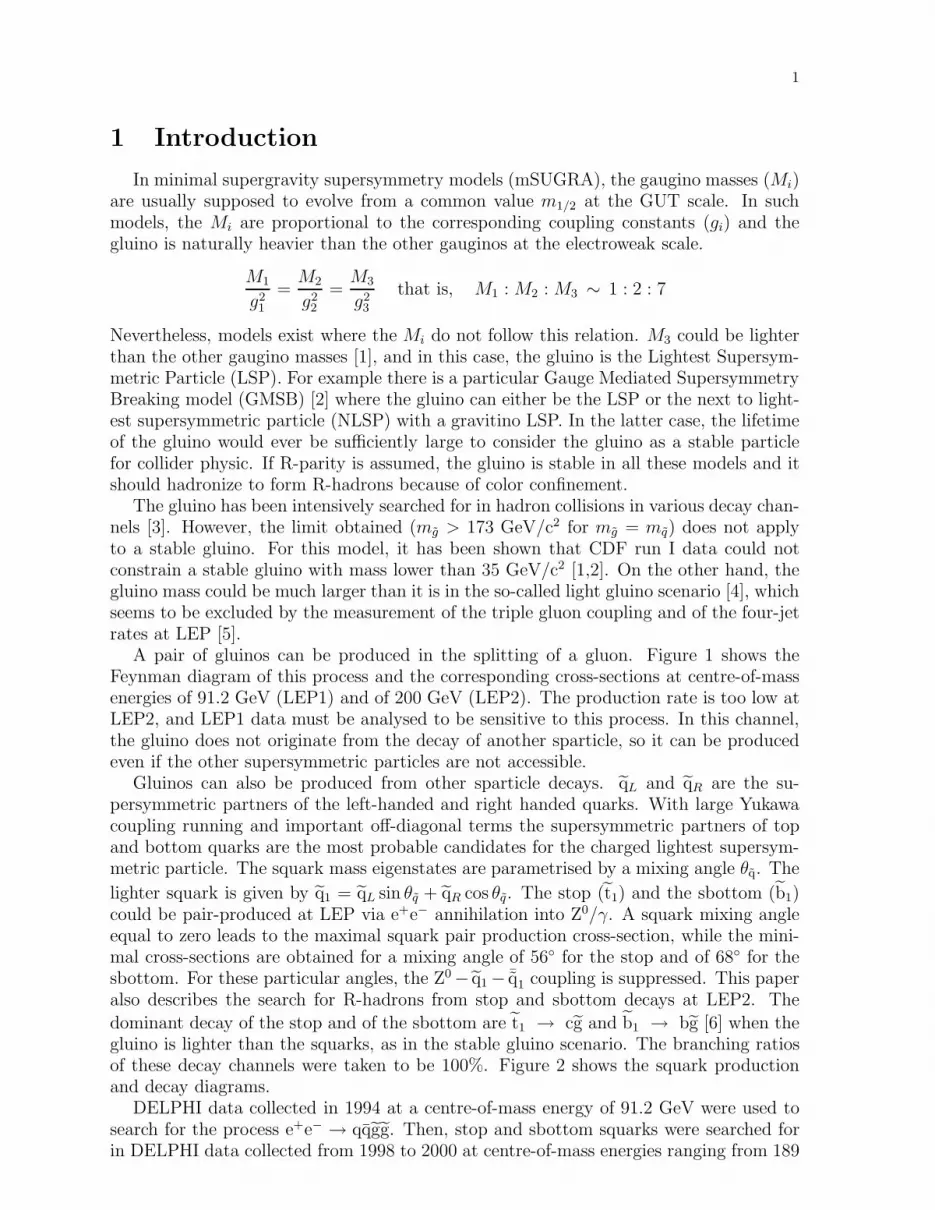
In minimal supergravity supersymmetry models (mSUGRA), the gaugino masses (Mi)are usually supposed to evolve from a common value m1/2 at the GUT scale. In suchmodels, the Mi are proportional to the corresponding coupling constants (gi) and thegluino is naturally heavier than the other gauginos at the electroweak scale.
M1
g21
=M2
g22
=M3
g23
that is, M1 : M2 : M3 ∼ 1 : 2 : 7
Nevertheless, models exist where the Mi do not follow this relation. M3 could be lighterthan the other gaugino masses [1], and in this case, the gluino is the Lightest Supersym-metric Particle (LSP). For example there is a particular Gauge Mediated SupersymmetryBreaking model (GMSB) [2] where the gluino can either be the LSP or the next to light-est supersymmetric particle (NLSP) with a gravitino LSP. In the latter case, the lifetimeof the gluino would ever be sufficiently large to consider the gluino as a stable particlefor collider physic. If R-parity is assumed, the gluino is stable in all these models and itshould hadronize to form R-hadrons because of color confinement.
The gluino has been intensively searched for in hadron collisions in various decay chan-nels [3]. However, the limit obtained (mg > 173 GeV/c2 for mg = mq) does not applyto a stable gluino. For this model, it has been shown that CDF run I data could notconstrain a stable gluino with mass lower than 35 GeV/c2 [1,2]. On the other hand, thegluino mass could be much larger than it is in the so-called light gluino scenario [4], whichseems to be excluded by the measurement of the triple gluon coupling and of the four-jetrates at LEP [5].
A pair of gluinos can be produced in the splitting of a gluon. Figure 1 shows theFeynman diagram of this process and the corresponding cross-sections at centre-of-massenergies of 91.2 GeV (LEP1) and of 200 GeV (LEP2). The production rate is too low atLEP2, and LEP1 data must be analysed to be sensitive to this process. In this channel,the gluino does not originate from the decay of another sparticle, so it can be producedeven if the other supersymmetric particles are not accessible.
Gluinos can also be produced from other sparticle decays. qL and qR are the su-persymmetric partners of the left-handed and right handed quarks. With large Yukawacoupling running and important off-diagonal terms the supersymmetric partners of topand bottom quarks are the most probable candidates for the charged lightest supersym-metric particle. The squark mass eigenstates are parametrised by a mixing angle θq. The
lighter squark is given by q1 = qL sin θq + qR cos θq. The stop (t1) and the sbottom (b1)could be pair-produced at LEP via e+e− annihilation into Z0/γ. A squark mixing angleequal to zero leads to the maximal squark pair production cross-section, while the mini-mal cross-sections are obtained for a mixing angle of 56◦ for the stop and of 68◦ for thesbottom. For these particular angles, the Z0 − q1 − ¯q1 coupling is suppressed. This paperalso describes the search for R-hadrons from stop and sbottom decays at LEP2. The
dominant decay of the stop and of the sbottom are t1 → cg and b1 → bg [6] when thegluino is lighter than the squarks, as in the stable gluino scenario. The branching ratiosof these decay channels were taken to be 100%. Figure 2 shows the squark productionand decay diagrams.
DELPHI data collected in 1994 at a centre-of-mass energy of 91.2 GeV were used tosearch for the process e+e− → qqgg. Then, stop and sbottom squarks were searched forin DELPHI data collected from 1998 to 2000 at centre-of-mass energies ranging from 189

2
(a) (b)
e+
e−
γ,Z0
q
q
gg
g
10-4
10-3
10-2
10-1
1
10
10 2
10 3
0 5 10 15 20 25 30 35 40
g∼ mass (GeV/c2)
Cro
ss s
ectio
n (p
b)
σ(qqg∼g∼)
Ecms = 91.2 GeVEcms = 200 GeV
Figure 1: (a) Gluon splitting into a pair of gluinos. (b) Comparison of the cross-section(pb) of this process at centre-of-mass energies of 91.2 GeV (LEP1) and of 200 GeV(LEP2).
to 208 GeV. The three analyses presented in this paper are therefore searches for:
e+e− → qqg → qqgg
e+e− → t1¯t1 → cgcg
e+e− → b1¯b1 → bgbg
all giving the same topology of two standard jets plus two gluino jets. The gluino couldeither fragment to neutral R◦ states (gg, guu, ...) or to charged R± states (gud,...). IfP is the probability that a gluino fragments to a charged R-hadron, then for P = 1,R-hadrons are identified by an anomalous ionizing energy loss in the tracking chambers,and for P = 0, the gluino hadronizes into neutral states which reach the calorimeterswhere they deposit a part of their energy. The missing energy carried away by the LSPis reduced compared with usual SUSY models with R-parity conservation. For neutralR-hadrons, the estimate of the experimental sensitivity depends on the model used tocalculate the energy loss in the calorimeters.
2 The DELPHI detector
The description of the DELPHI detector and its performance can be found in refer-ences [7,8]. We only summarize here the parts relevant to the analysis.
Charged particles are reconstructed in a 1.2 T magnetic field by a system of cylindricaltracking detectors. The closest to the beam is the Vertex Detector (VD) which consistsof three cylindrical layers of silicon detectors at radii 6.3 cm, 9.0 cm and 11.0 cm. Theymeasure coordinates in the Rφ plane 1. In addition, the inner and the outer layers aredouble-sided giving also a z measurement. VD is the barrel part of the Silicon Tracker
1The DELPHI coordinate system is defined with z along the e− beam direction; θ and φ are the polar and azimuthalangles and R is the radial distance from the z axis.

3
e+
e−
γ,Z0
¯t1
t1
c
g
c
g
e+
e−
γ,Z0
¯b1
b1
b
g
b
g
(a) (b)
Figure 2: Stop (a) and sbottom (b) production and decay at LEP2.
(ST), which extends the polar angle acceptance down to 10 degrees. The Inner Detector(ID) is a drift chamber with inner radius 12 cm and outer radius 22 cm covering polarangles between 15◦ and 165◦. The principal tracking detector of DELPHI is the TimeProjection Chamber (TPC). It is a cylinder of 30 cm inner radius, 122 cm outer radiusand 2.7 m length. Each end-plate is divided into 6 sectors, with 192 sense wires to al-low the dE/dx measurement, and with 16 circular pad rows which provide 3-dimensionaltrack reconstruction. The TPC covers polar angles from 20◦ to 160◦. Finally, the OuterDetector (OD) consists of drift cells at radii between 192 cm and 208 cm, covering polarangles between 43◦ and 137◦. In addition, two planes of drift chambers perpendicular tothe beam axis (Forward Chambers A and B) are installed in the endcaps covering polarangles 11◦ < θ < 33◦ and 147◦ < θ < 169◦.
The electromagnetic calorimeters are the High density Projection Chamber (HPC) inthe barrel region (40◦ < θ < 140◦) and the Forward Electromagnetic Calorimeter (FEMC)in the endcaps (11◦ < θ < 36◦ and 144◦ < θ < 169◦). In the forward and backward re-gions, the Scintillator TIle Calorimeter (STIC) extends the coverage down to 1.66◦ fromthe beam axis. The number of radiation lengths are respectively 18, 20 and 27 in theHPC, the FEMC and the STIC. In the gap between the HPC and the FEMC, hermetic-ity taggers made of single layer scintillator-lead counters are used to veto events withelectromagnetic particles which would otherwise escape detection. Between the HPCmodules, gaps at θ = 90◦ and gaps in φ are also instrumented with such taggers. Finally,the hadron calorimeter (HCAL) covers polar angle between 11◦ < θ < 169◦. The ironthickness in the HCAL is 110 cm which corresponds to 6.6 nuclear interaction lengths.
3 Data and Monte Carlo samples
The total integrated luminosity collected by the DELPHI detector in 1994 at the Z0
peak (√
s = 91.2 GeV) was 46 pb−1. It corresponded to around 1.6 million hadronic Z0
events. The Standard Model hadronic background was estimated with the JETSET 7.3 [9]program tuned to reproduce LEP1 data [10]. The program described in [1] was used tosimulate the e+e− → qqgg signal.
4
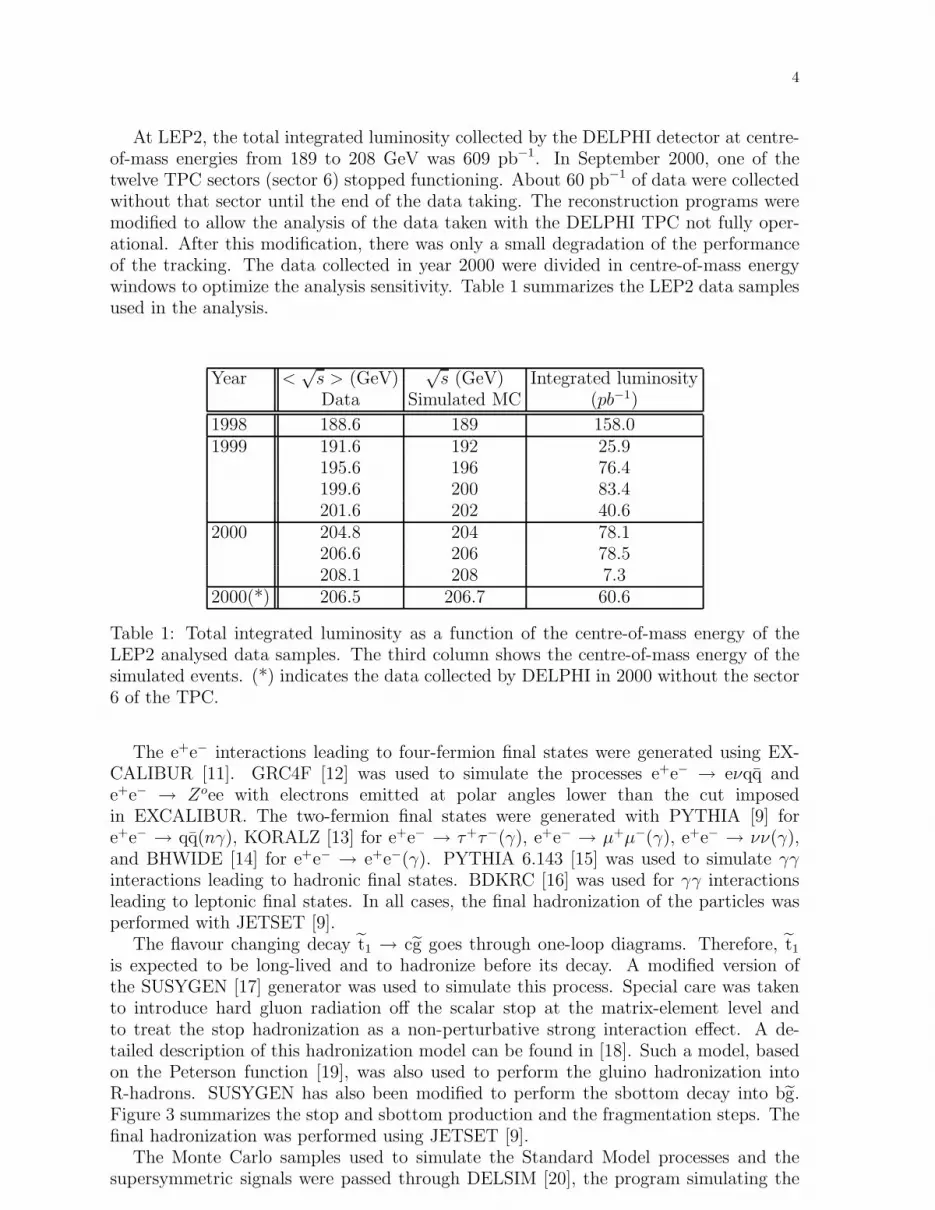
At LEP2, the total integrated luminosity collected by the DELPHI detector at centre-of-mass energies from 189 to 208 GeV was 609 pb−1. In September 2000, one of thetwelve TPC sectors (sector 6) stopped functioning. About 60 pb−1 of data were collectedwithout that sector until the end of the data taking. The reconstruction programs weremodified to allow the analysis of the data taken with the DELPHI TPC not fully oper-ational. After this modification, there was only a small degradation of the performanceof the tracking. The data collected in year 2000 were divided in centre-of-mass energywindows to optimize the analysis sensitivity. Table 1 summarizes the LEP2 data samplesused in the analysis.
Year <√
s > (GeV)√
s (GeV) Integrated luminosityData Simulated MC (pb−1)
1998 188.6 189 158.01999 191.6 192 25.9
195.6 196 76.4199.6 200 83.4201.6 202 40.6
2000 204.8 204 78.1206.6 206 78.5208.1 208 7.3
2000(*) 206.5 206.7 60.6
Table 1: Total integrated luminosity as a function of the centre-of-mass energy of theLEP2 analysed data samples. The third column shows the centre-of-mass energy of thesimulated events. (*) indicates the data collected by DELPHI in 2000 without the sector6 of the TPC.
The e+e− interactions leading to four-fermion final states were generated using EX-CALIBUR [11]. GRC4F [12] was used to simulate the processes e+e− → eνqq ande+e− → Zoee with electrons emitted at polar angles lower than the cut imposedin EXCALIBUR. The two-fermion final states were generated with PYTHIA [9] fore+e− → qq(nγ), KORALZ [13] for e+e− → τ+τ−(γ), e+e− → µ+µ−(γ), e+e− → νν(γ),and BHWIDE [14] for e+e− → e+e−(γ). PYTHIA 6.143 [15] was used to simulate γγinteractions leading to hadronic final states. BDKRC [16] was used for γγ interactionsleading to leptonic final states. In all cases, the final hadronization of the particles wasperformed with JETSET [9].
The flavour changing decay t1 → cg goes through one-loop diagrams. Therefore, t1
is expected to be long-lived and to hadronize before its decay. A modified version ofthe SUSYGEN [17] generator was used to simulate this process. Special care was takento introduce hard gluon radiation off the scalar stop at the matrix-element level andto treat the stop hadronization as a non-perturbative strong interaction effect. A de-tailed description of this hadronization model can be found in [18]. Such a model, basedon the Peterson function [19], was also used to perform the gluino hadronization intoR-hadrons. SUSYGEN has also been modified to perform the sbottom decay into bg.Figure 3 summarizes the stop and sbottom production and the fragmentation steps. Thefinal hadronization was performed using JETSET [9].
The Monte Carlo samples used to simulate the Standard Model processes and thesupersymmetric signals were passed through DELSIM [20], the program simulating the

5
t∼
1
t∼−
1
g∼
g∼
g
g
gg
u−
u−
u
u
c
c−
u−
u
Ro
Ro
t∼
1
t∼−
1
g∼
g∼
g
g
gg
u−
u−
u
u
c
c−
u−
u
Ro
Ro
b∼
1
b∼−
1
g∼
b
g∼
b−
g
g
g
g
R0
R0
b∼
1
b∼−
1
g∼
b
g∼
b−
g
g
g
g
R0
R0
Figure 3: Production and decay of the stop and sbottom squarks. Ellipses indicate thecolor singlet and the color string stretched between the partons.
full DELPHI detector response. They were subsequently processed with the same recon-struction program as the real data. The number of generated events was always severaltimes higher than the number expected for the integrated luminosity collected.
4 R-hadron simulation
In the analysis, two generic R-hadron states were considered: one charged denoted R±
and one neutral, R◦, which corresponds to the glueballino, a gg state. It is important tounderstand how an R◦ would manifest itself in the detector. We refer to the results ofreference [1]. The energy loss in the scattering on a nucleon R◦N → R◦X is given by:
∆E =m2
X − m2N + |t|
2mN
where |t| is the usual momentum transfer invariant for the R◦ and mX is the mass of thesystem produced in the R◦N → R◦X collision. The average energy loss in the reactionR◦N → R◦X is then given by:
〈∆E〉 =
∫ √s−mR◦
mNdmX
∫ |t|max(mX )
|t|min(mX )d|t|∆E dσ
d|t|dmX∫ √s−mR◦
mNdmX
∫ |t|max(mX )
|t|min(mX )d|t| dσ
d|t|dmX
where s = M2R◦ +m2
N +2γMR◦mN describes the collision energy. The following functionsare defined:
γ = (1 − β2)−1/2
|t|min,max(mX) = 2[E(mN )E(mX) ∓ p(mN)p(mX) − M2R◦ ]
E(m) = (s + M2R◦ − m2)/(2
√s)
p(m) = λ1/2(s, M2R◦ , m2)/(2
√s)
λ(a, b, c) = a2 + b2 + c2 − 2(ab + ac + bc)

6
From the results of studies in [1], the differential cross-section dσd|t|dmX
is taken as:
dσ
d|t|dmX∝
{1, if |t| ≤ 1 GeV2
0, if |t| > 1 GeV2
The average number of collisions of an R◦ particle in the calorimeters is given by thedepth of the calorimeter in units of equivalent iron interaction lengths, λT . In DELPHI,the electromagnetic calorimeter’s thickness represents around 1 λT while this value is6.6 λT for the hadronic calorimeter. We have adopted a correction factor for the inter-action length of 9/16 as suggested in reference [1]: a factor CA/CF = 9/4 comes fromthe colour octet nature of the R◦ constituents increasing the σR◦N cross-section as com-pared to σπN , while a factor 〈r2
R◦〉/〈r2π〉 = 1/4 takes into account the relative size of the
R-hadrons as compared to standard hadrons. On average, neutral R-hadrons should un-dergo 4.3 collisions in DELPHI calorimeters. Figure 4 shows the total energy loss by anR◦ after 4 collisions in iron.
The difficulty in separating the signal of a neutral R-hadron from the backgroundincreases with the amount of energy lost in the calorimeters. The choice of the interac-tion model made here is conservative in this respect. The R◦ scatters were subsequentlytreated in the DELPHI detector simulation as K0
L with the energy that the R◦ shoulddeposit in four collisions according to the above formula.
The charged R-hadrons were treated as heavy muons to reproduce the anomalousdE/dx signature. In this case, only the tracking information was used to calculate theR-hadron momentum.
10-1
1
10
10 2
0 10 20 30 40 50 60 70 80 90 100
Rhadron energy (GeV)
Ave
rage
Ene
rgy
Los
s (G
eV)
m=1
m=5
m=10
m=20m=40
m=60
m=80
Figure 4: Average energy loss by neutral R-hadrons in the DELPHI calorimeters as afunction of their initial energy for different mass cases.

7
5 Particle Identification and analysis method
5.1 Particle Identification and event preselection
Particle selection was identical for LEP1 and LEP2 data. Reconstructed chargedparticles were required to have momenta above 100 MeV/c with ∆p/p < 1, where ∆p isthe momentum error, and impact parameter below 5 cm in the transverse plane and below10 cm/ sin θ in the beam direction. More stringent cuts were applied for tracks withoutTPC information. A cluster in the calorimeters was selected as a neutral particle if notassociated to a charged particle and if the cluster energy was greater than 500 MeV in theHPC, 400 MeV in the FEMC, 300 MeV in the STIC or 900 MeV in the HAC. Particleswere then clustered into jets with the DURHAM algorithm [21]. b-quarks were taggedusing a probabilistic method based on the impact parameters of tracks with respect tothe main vertex. A combined b-tagging variable was defined by including the propertiesof secondary vertices [22].
Events were then kept if there were at least two charged particles, and at least onewith a transverse momentum above 1.5 GeV/c, and if the transverse energy 2 exceeded4 GeV.
5.2 Neural networks
A neural network allows one discriminating variable to be constructed from the set ofvariables given as input. The form used here contains three layers of nodes: the inputlayer where each neuron corresponds to a discriminating variable, the hidden layer, andthe output layer which is the response of the neural network. The layers were connectedin a “feed forward” architecture. The back-propagation algorithm was used to trainthe network with simulated events. This entails minimising a χ2 to adjust the neurons’weights and connections. An independent validation sample was also used not to overtrainthe network. The outputs of neural networks were used to isolate events containing twoneutral R-hadrons at LEP2.
5.3 General description of the analyses
The LEP1 and LEP2 data analyses have all the same final states which consists oftwo jets and two gluino jets. Depending on the probability P that the gluino hadronizesinto a charged R-hadron, three topologies are possible:
• charged: e+e− → qqR±R±
• mixed: e+e− → qqR±R◦
• neutral: e+e− → qqR◦R◦
For LEP1 data, the search analyses corresponding to the charged and the mixed topolo-gies were identical, while they were optimised separately for LEP2 data. For these twotopologies, the LEP1 and LEP2 analyses were only based on anomalous ionizing energyloss, and no quark tagging was applied.
For the neutral topology, LEP1 data were analyzed using sequential cuts without try-ing to tag the quark flavor. Since there are b-quarks in the final state of the sbottomdecay, the b-quark tagging improves the isolation of this signal from the Standard Modelbackgrounds. Therefore, the b-tagging variable was used in the stop and sbottom search
2The transverse energy is defined as the sum of√
p2
T+ m2 over all particles; pT is the transverse momentum.

8
analyses at LEP2 in the neutral topology. This variable was included into the neuralnetworks which were used to isolate the stop and the sbottom signals.
6 Search for a stable gluino at LEP1
6.1 Search for qqR±R± and qqR±R◦ events
The same analysis based on the dE/dx measurement was performed to identifyqqR±R± and qqR±R◦ events.
In the preselection step, events were required to contain at least 5 charged particles.At least one of these had to satisfy the following conditions. The track was required to bereconstructed including a TPC track element and to have a momentum above 10 GeV/c.At least 80 wires of the TPC were required to have been included in the dE/dx mea-surement. The dE/dx had to be either greater than 1.8 mip (units of energy loss fora minimum ionizing particle), or less than the dE/dx expected for a particle of massequal to 1 GeV/c2. The Y23 variable is the ycut value in the DURHAM algorithm forwhich the number of jets changes between two and three. qqR±R± and qqR±R◦ eventscontain three or four jets. Thus, Y23 was required to be less than 0.01. Figure 5 shows acomparison between simulated and real data at this level.
A R± candidate had to satisfy the following conditions: it had to be reconstructedwith the VD, the ID and the TPC detectors, and the dE/dx measurement had to bebased on at least 80 wires of the TPC. In addition, the energy of the other particles ina 15◦ cone around the R± candidate had to be less than 2 GeV. Finally, its associatedelectromagnetic energy had to be less than 5 GeV.
The final selection was performed by cuts in the plane (P,dE/dx). Figure 6 shows theexpected dE/dx as a function of the particle momentum. The analysis was separatedinto two mass windows:
• mg < 14 GeV/c2:Here, charged R-hadrons were identified by low dE/dx values. The R± candidateswere selected if their momentum was greater than 15 GeV/c, and if their dE/dx wasless than the dE/dx expected for a particle of mass equal to 3 GeV/c2.
• mg ≥ 14 GeV/c2:In this mass window, R-hadrons were identified by high dE/dx values. The R±
candidates were selected if their dE/dx was greater than 2 mip.
The final selection was performed by requiring at least one charged R-hadron candidatein either mass window. Table 2 contains the number of events selected after each cutof this analysis. For mg < 14 GeV/c2, 5 events were selected when 4.2 were expected.These numbers are 12 and 13.5 in the mg ≥ 14 GeV/c2 mass window. Unlike the expectedsignal, all selected candidates in the data have only one particle with anomalous dE/dx.Figure 7 shows the signal detection efficiencies. For qqR±R±, they ranged from a fewpercent for gluino masses close to 2 GeV/c2 to around 50% for gluino masses of the orderof 25 GeV/c2. qqR±R◦ efficiencies were about half of the qqR±R± ones.
6.2 Search for qqR◦R◦events
The search for qqR◦R◦ events was performed at LEP1 with a sequential cut analysis.It was based on the search for the small part of missing energy carried away by the neutralR-hadrons. Hadronic events were first selected by requiring at least 5 charged particles.

9
After forcing the events into two jets, the acollinearity 3 was required to be greater than20◦ to reduce the huge number of background Standard Model Z0 → qq events.
The following cuts were applied to reduce the number of hadronic γγ interactions.The number of tracks reconstructed with the TPC had to be greater than 4, and theenergy of the particles with tracks reconstructed using only the VD and ID detectors hadto be less than 20% of the total energy. The energies in 40◦ and 20◦ cones around thebeam axis were required to be less than 40% and 10% of the total energy respectively.The transverse energy had to be greater than 20 GeV.
Hadronic events with missing energy were then selected in the barrel region of thedetector. The visible mass was required to be less than 60 GeV/c2. The thrust axisand the missing momentum had to point in the polar regions [37◦, 143◦] and [45◦, 135◦]respectively. Figure 8 shows a comparison between data and simulation at this level ofthe selection.
The Y23 quantity was then required to be less than 0.01 and events had to contain lessthan 20 charged particles. In order to reduce the number of events with two back-to-backjets, the acoplanarity 4 was required to be greater than 10◦ and the thrust to be less than0.95. The final cut was bi-dimensional. The value of the variable Mjet1/Ejet1+Mjet2/Ejet2
was calculated from the two jets reconstructed with the DURHAM algorithm. Eventswere rejected if this variable was greater than 0.45 and if the acollinearity was less than50◦. Table 3 shows the number of events after each cut of the qqR◦R◦ analysis. 12 eventswere selected in the data while 10.6 were expected in the hadronic background. Signalefficiencies as a function of the gluino mass are shown in figure 7. They ranged from afew percent for low gluino masses to around 20% for mg = 18 GeV/c2.
7 Search for a stable gluino at LEP2
7.1 Preselection
A common preselection for the charged and neutral R-hadron analyses was applied toreduce the background coming from soft γγ interactions. The cuts are the same for thestop and sbottom analysis at all centre-of-mass energies ranging from 189 to 208 GeV.
First, events were forced into two jets. To select hadronic events, the number ofcharged particles reconstructed with the TPC was required to be greater than three, andthe energy in the STIC to be less than 70% of the total visible energy. The polar angle ofthe thrust axis had to be in the interval [20◦, 160◦]. Then, quality cuts were applied. Thefraction of good tracks was defined as the ratio between the number of charged particlesremaining after the track selection divided by this number before the selection. It hadto be greater than 35%. In addition, the scalar sum of particle momenta reconstructedwith the TPC was required to be greater than 55% of the total reconstructed energyand the number of charged particles to be greater than six. To remove radiative events,the energy of the most energetic neutral particle had to be less than 40 GeV. Table 4contains the number of events after each of these cuts.
For the qqR±R± and qqR±R◦ analyses, charged R-hadron candidates were defined atthis level. They had to be reconstructed with the VD, ID and TPC detectors and theirmomentum was required to be greater than 10 GeV/c. At least 80 sense wires of the TPCwere required to have contributed to the measurement of their dE/dx. Their associatedelectromagnetic energy was required to be less than 5 GeV, and the energy of the other
3The acollinearity of two jets is defined as the complement of the angle between their directions.4The acoplanarity of two jets is defined as the complement of the angle between their directions projected onto the
plane perpendicular to z.

10
charged particles in a 15◦ cone around a candidate had to be less than 5 GeV. In 2000 ,the dE/dx could not be used in sector 6 of the TPC for almost any of the data. For thissample, charged R-hadron candidates in this sector were removed.
7.2 Search for qqR±R± events
The search for qqR±R± events was exactly the same for the stop and the sbottomanalyses. Events were selected if they contained at least two charged R-hadron candi-dates. Figure 9 shows the momentum and the dE/dx distribution of the selected R±
candidates. Table 4 shows the number of selected events.The analysis was then separated into three windows in gluino mass, and cuts in the
plane (P,dE/dx) were applied:
• mg ≤ 30 GeV/c2:events had to contain at least one charged R-hadron candidate with momentumgreater than 20 GeV/c, and with dE/dx less than the dE/dx expected for a particleof mass equal to 3 GeV/c2.
• 30 GeV/c2 < mg < 60 GeV/c2:events were selected if they contained at least two charged R-hadron candidateswith dE/dx both greater than the dE/dx expected for a particle of mass equalto 30 GeV/c2, and less than the dE/dx expected for a particle of mass equal to60 GeV/c2. Moreover, this dE/dx had also to be either less than the dE/dx expectedfor a particle of mass equal to 1 GeV/c2, or greater than 1.8 mip.
• mg ≥ 60 GeV/c2:events were kept if they contained at least two charged R-hadron candidates withdE/dx greater than the dE/dx expected for a particle of mass equal to 60 GeV/c2.
In all LEP2 data which were analysed, no events were selected in any of these windows.The number of expected Standard Model background events were 0.115, 0.009 and 0.011in the analyses for mg ≤ 30 GeV/c2, 30 GeV/c2 < mg < 60 GeV/c2 and mg ≥ 60 GeV/c2
respectively. Table 5 contains the number of events expected for the different centre-of-mass energies. Figure 10 shows the signal detection efficiencies near the kinematical limit(mq1
= 90 GeV/c2). The difference between stop and sbottom efficiencies is not large.The highest efficiencies were always obtained for high gluino masses, where the dE/dx isvery high.
7.3 Search for qqR±R◦ events
The search for qqR±R◦ events was also the same for the stop and sbottom analyses.Events were selected if they contained at least one charged R-hadron candidate. Figure 11shows the momentum and the dE/dx distribution of the selected R± candidates. Table 4shows the number of selected events.
The analysis was then separated into three gluino mass windows, and cuts in the plane(P,dE/dx) were applied:
• mg ≤ 30 GeV/c2:events had to contain at least one charged R-hadron candidate with momentumgreater than 20 GeV/c, and with dE/dx less than the dE/dx expected for a particleof mass equal to 3 GeV/c2.
• mg ≥ 60 GeV/c2:events were kept if they contained at least one charged R-hadron candidate with

11
dE/dx greater than the dE/dx expected for a particle of mass equal to 60 GeV/c2,and greater than 2 mip.
• 30 GeV/c2 < mg < 60 GeV/c2:events selected in either of the above windows (higher or lower mg) were accepted.
Three, nine and six events were selected in the mass windows mg ≤ 30 GeV/c2,30 GeV/c2 < mg < 60 GeV/c2 and mg ≥ 60 GeV/c2 respectively. The number ofexpected background events were 1.6, 8.2 and 6.6. All selected events in the data aremore likely Standard Model instead than signal like. In particular, they do not follow anymass iso-curve in the (P,dE/dx) plane. Table 6 contains the number of selected events asa function of the centre-of-mass energy. Figure 12 shows the signal detection efficienciesnear the kinematical limit (mq1
= 90 GeV/c2). The highest efficiencies were obtained forhigh gluino masses where the dE/dx is very high.
7.4 Search for qqR◦R◦ events
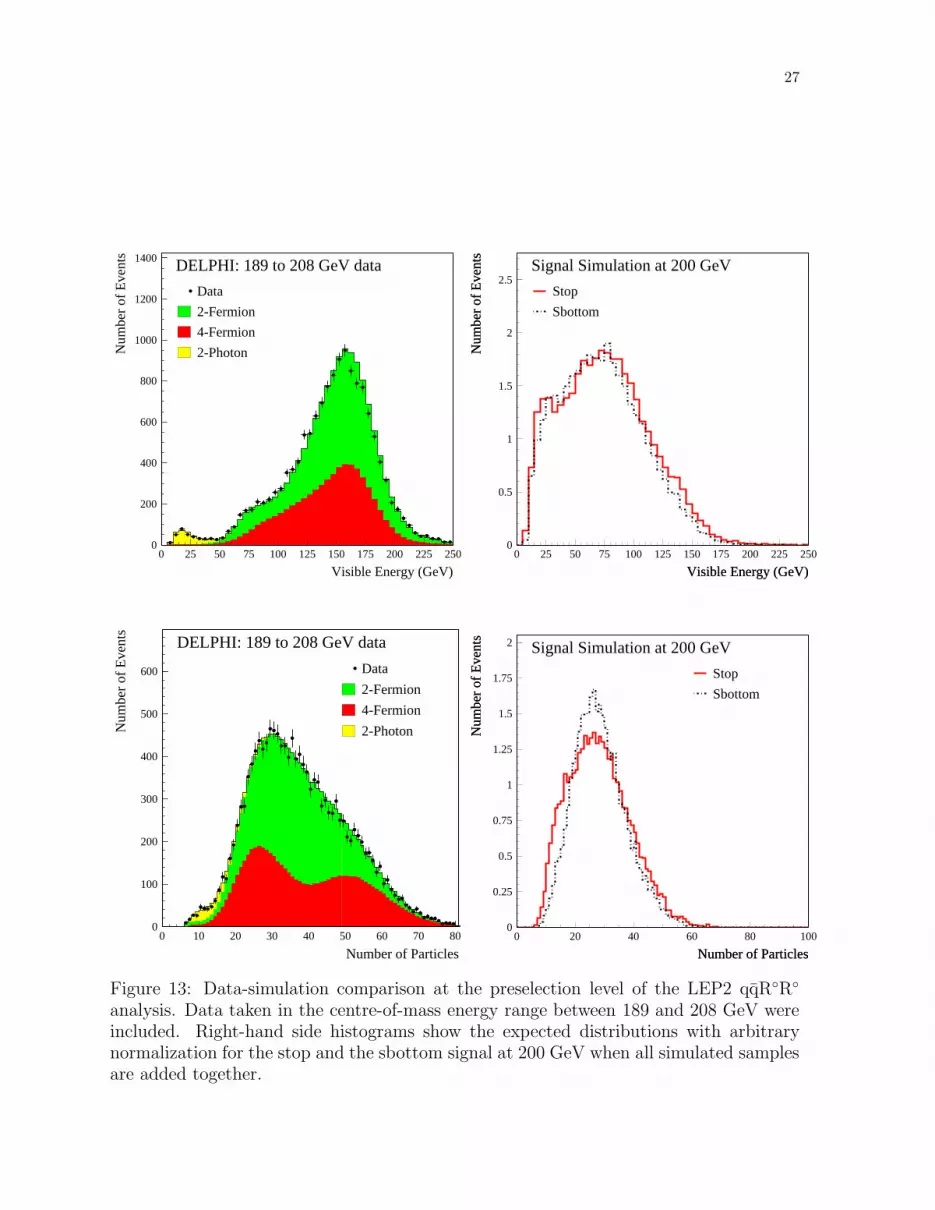
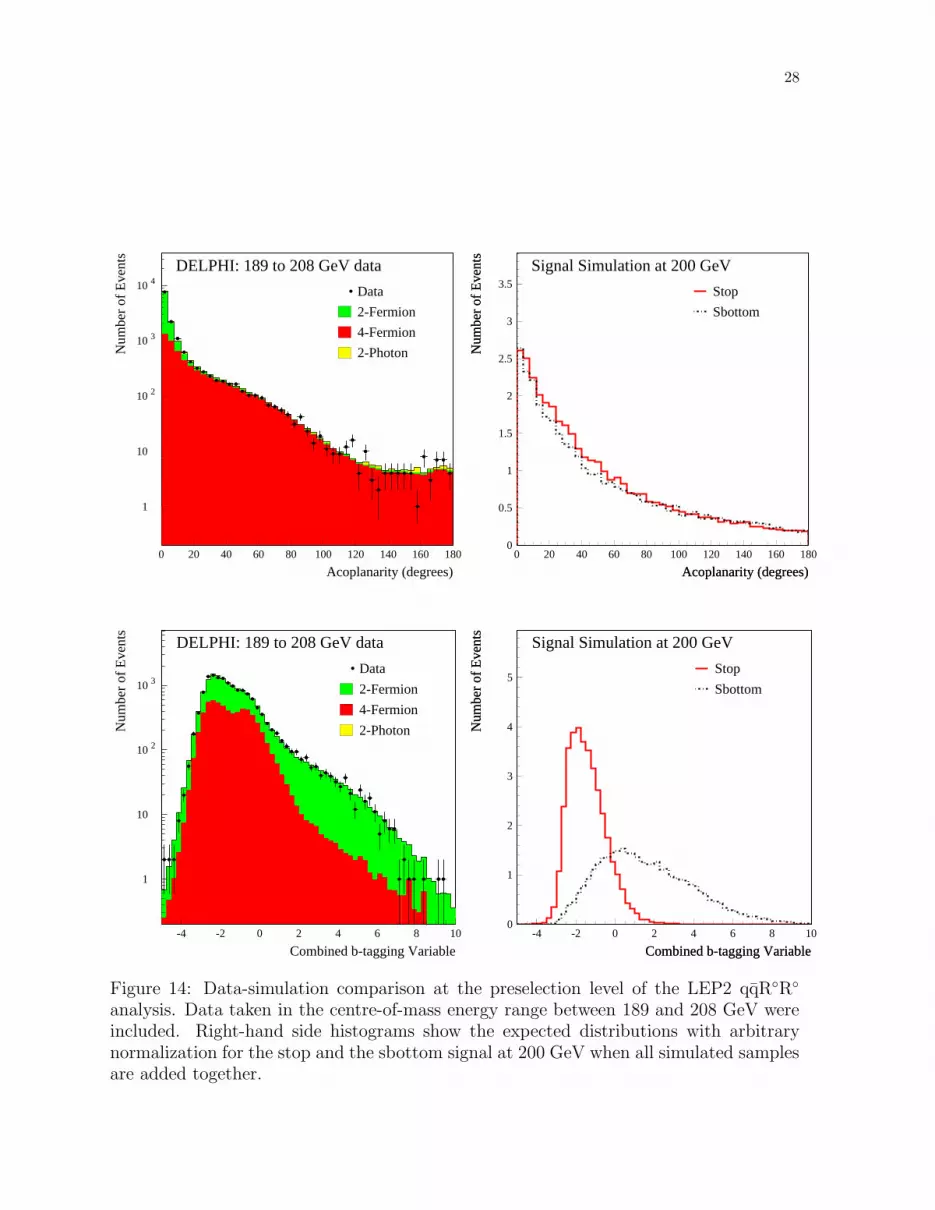
After the preselection described in section 7.1, the transverse missing momentum wasrequired to be greater than 4 GeV/c, the angle of the missing momentum had to point inthe polar angle region [20◦, 160◦], and the energy in a 40◦ cone around the beam axis wasrequired to be less than 40% of the event energy. A veto algorithm was then applied basedon the hermeticity taggers at polar angles close to 40◦ and 90◦. Figures 13 and 14 showdata Monte Carlo comparisons following this selection and table 7 gives the observed andexpected event numbers at the different steps.
The stop and sbottom analyses were then separated for different ranges of the massdifference ∆m between the squark and the gluino:
• ∆m ≤ 20 GeV/c2 :For high gluino masses, the energy deposited by the neutral R-hadrons is quite small.In this respect, the gluino is not so different from a neutralino, and the q1 → qgevents resemble q1 → qχ0
1 events.• ∆m > 20 GeV/c2 :
In this case, the gluino deposits more energy.
The neural networks were trained to isolate the qqR◦R◦ signal in both ∆m windows.They were trained separately on stop signals or sbottom signals. The neural networkstructure was the same for the stop and the sbottom searches. It consisted of 10 inputnodes, 10 hidden nodes and 3 output nodes.
For ∆m ≤ 20 GeV/c2, the 10 input variables were: the ratio between the transversemissing momentum and the visible energy, the transverse energy, the visible mass, thesoftness defined as Mjet1/Ejet1+Mjet2/Ejet2, the acollinearity, the quadratic sum of trans-
verse momenta of the jets√
(P jet1t )2 + (P jet2
t )2, the acoplanarity, the sum of the first and
third Fox-Wolfram moments, the polar angle of the missing momentum and finally thecombined b-tagging probability [22].
For ∆m > 20 GeV/c2, the 10 input variables were: the charged energy, the transversecharged energy, the visible mass, the thrust, the effective centre-of-mass energy [23], theacollinearity, the acoplanarity, the sum of the first and third Fox-Wolfram moments, thesum of the second and fourth Fox-Wolfram moments, and finally the combined b-taggingprobability.
The neural networks were trained to discriminate the signal from the combined two-fermion and four-fermion backgrounds, and from the γγ interactions leading to hadronic

12
final states. The first output node was trained to identify both Z0 → qq and four-fermionevents. The second node identified the γγ interactions leading to hadronic final states.And the third node was trained to select the signal. The three output nodes were usefulin the training of the network, but the selection was made according to the output ofthe signal node only. Figure 15 shows the number of events as a function of the signalefficiency for the two mass analysis windows of the stop and the sbottom analysis. Thenumber of real events was in agreement with the Standard Model predictions over the fullrange of the neural network outputs. The optimisations of the final cuts were performedby minimising the expected confidence level of the signal hypothesis [24].
Tables 8 and 9 contain the numbers of events selected in the stop and sbottom anal-yses. Combining all data from 189 to 208 GeV, 32 and 11 events were selected in thestop analysis for ∆m > 20 GeV/c2 and ∆m ≤ 20 GeV/c2, while the expected numberof events were 30.1 and 11.1. In the sbottom analysis, no candidates were observed for∆m > 20 GeV/c2 and five were selected for ∆m ≤ 20 GeV/c2. The expected number ofevents were 3.0 and 5.3. Figure 16 shows the signal detection efficiencies for the stop andfor the sbottom (mq1
= 90 GeV/c2). They are very low when the gluino mass is closeto zero.
8 Results
No excess of events was observed in any analysis performed at LEP1 or at LEP2 in thestable gluino scenario. Results were therefore combined to obtain excluded regions at 95%confidence level in the parameter space. The limits were computed using the likelihoodratio method described in [24]. For different values of the parameter P describing theprobability that the gluino hadronizes to a charged R-hadron, the relative cross-sectionsfor the different channels were given by:
σ(R±R±) = P 2σσ(R±R◦) = 2P (1 − P )σσ(R◦R◦) = (1 − P )2σ
where σ was either the e+e− → qqgg cross section at LEP1, the t1¯t1 or the b1
¯b1 cross-
section at LEP2.For the LEP1 analysis, results were interpreted in terms of excluded gluino masses for
different P. Figure 17 shows the excluded region at 95% confidence level. From this figure,a stable gluino with mass between 2 and 18 GeV/c2 is excluded regardless of the chargeof the R-hadrons. The minimum upper limit, 18 GeV/c2, is obtained for intermediatevalues of P (between 0.2 and 0.45), while an upper limit of 23 GeV/c2 is obtained forP=1.
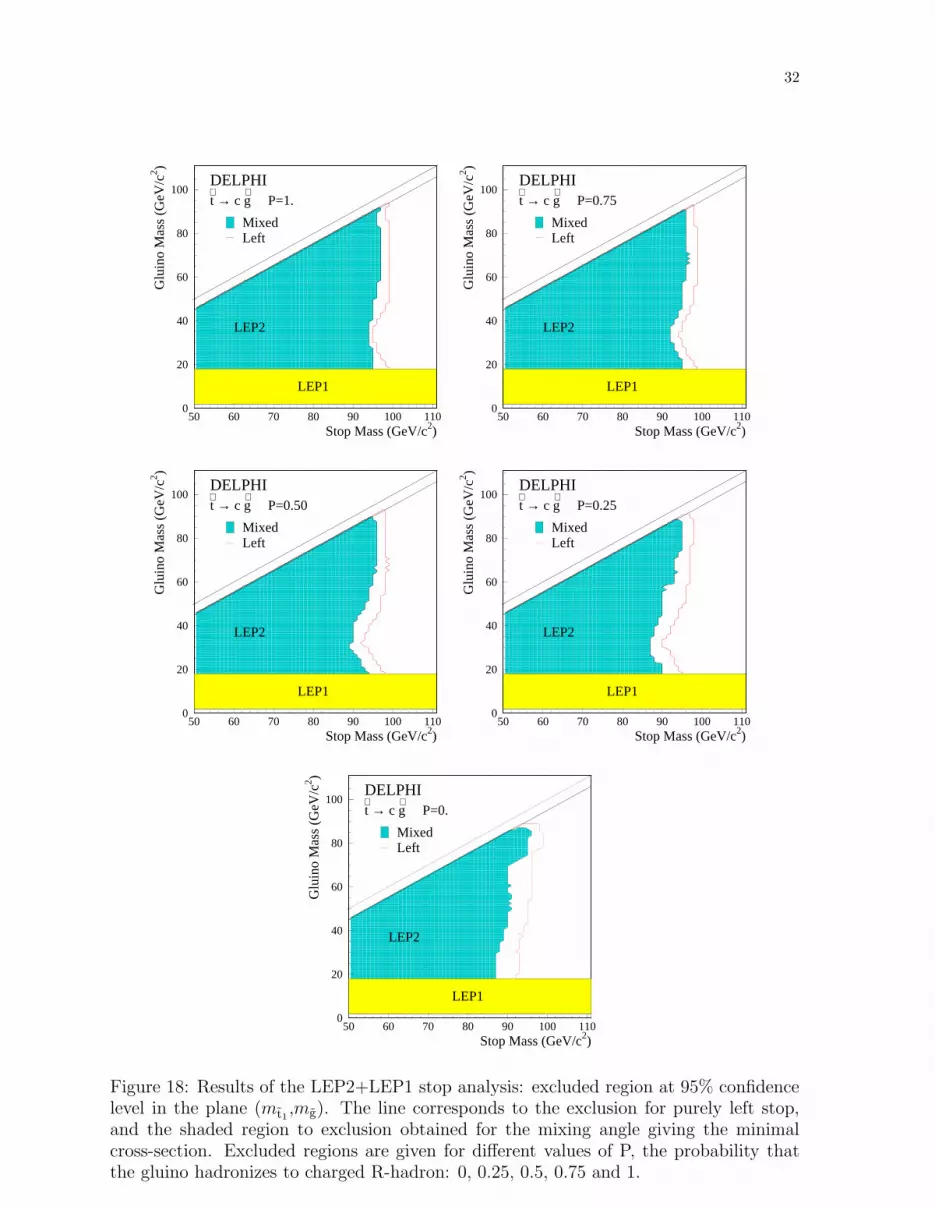
For the LEP2 analysis, excluded regions in the planes (mt1 ,mg) and (mb1,mg) were
derived for five different values of P: 0., 0.25, 0.5, 0.75 and 1. Moreover, the stop andsbottom cross-sections were calculated for two cases. In the first case, the squark mixingangle was set to zero which corresponds to the maximal cross-sections. In the secondcase, the mixing angle was equal to 56◦ for the stop and to 68◦ for the sbottom, whichgives the minimal cross-sections. Squark masses below 50 GeV/c2 were not taken intoaccount in these analyses. Figures 18 and 19 show the excluded regions thus obtained.In the case of minimal cross-sections, a hole appears in the sbottom exclusion histogramsaround (60 GeV/c2, 50GeV/c2) in the plane (mb1
,mg) for intermediate values of P. It canbe explained by different effects:

13
• In the analyses searching for charged R-hadrons, the signal detection efficiencies aresmall in this region of the (mq1
,mg) plane, because the dE/dx distribution of thecharged R-hadrons as a function of the momentum crosses the band correspondingto Standard Model particles (cf Figure 6).
• When the Z0−q1−¯q1 coupling is suppressed, the squark pair production cross-sectionis much more reduced for the sbottom than for the stop.
• The visible energy of qqR◦R◦ events becomes small for low values of ∆M . At∆M = 5 GeV/c2, this has no effect on the stop exclusion results, because of thec-quark which is lighter than the b-quark.
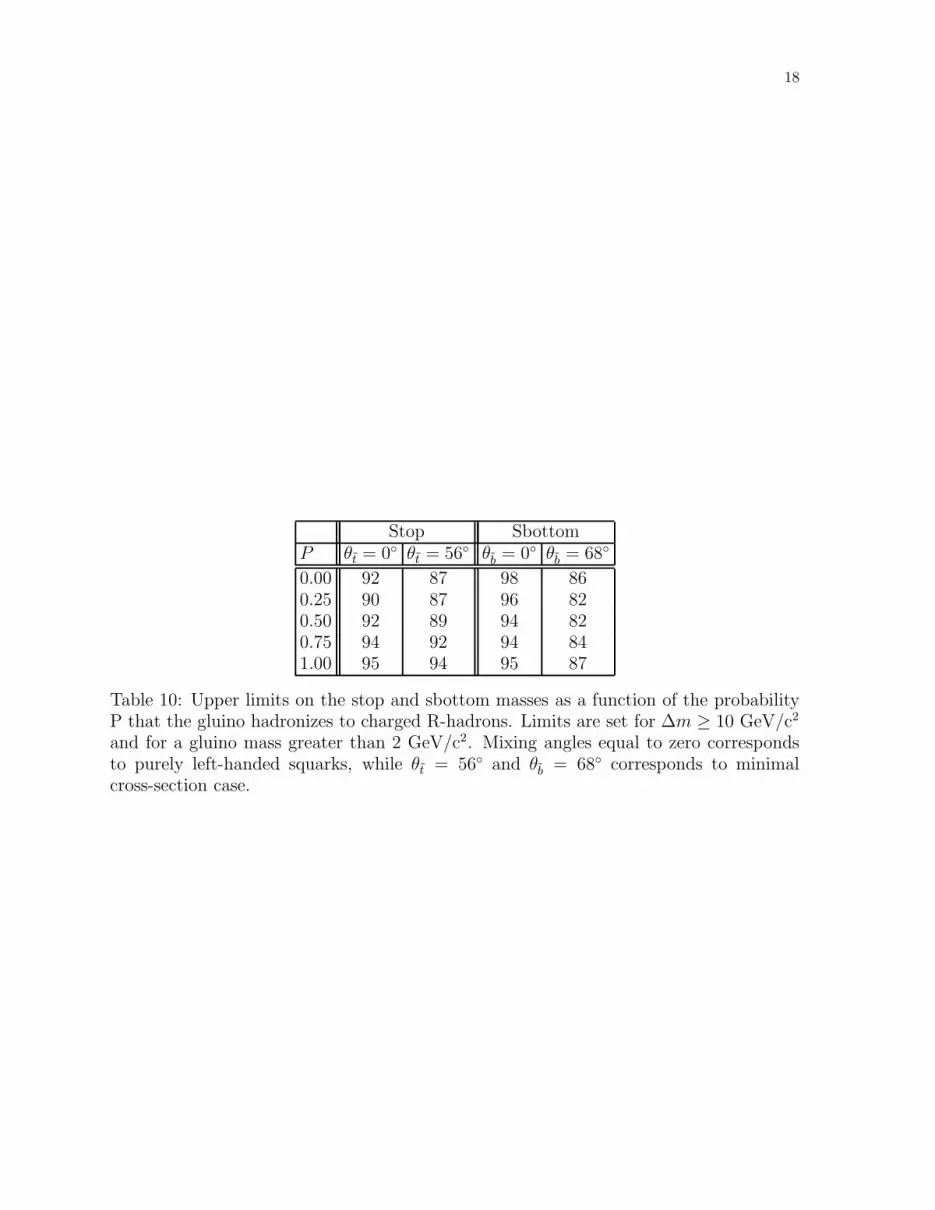
Lower limits on the stop and sbottom masses are given in table 10 for ∆m ≥ 10 GeV/c2
and for a gluino mass greater than 2 GeV/c2 for different values of P.
9 Conclusion
The analysis of the LEP1 data collected in 1994 excludes at 95% confidence level astable gluino with mass between 2 and 18 GeV/c2. These limits are valid for any chargeof the produced R-hadrons.
Stop and sbottom squarks have been searched for in the 609 pb−1 collected by DELPHIat centre-of-mass energies ranging from 189 to 208 GeV. In the stable gluino scenario,
the dominant decays are t1 → cg and b1 → bg. No deviation from Standard Modelpredictions was observed. The observed limits at 95% confidence level are:
• mt1 > 90 GeV/c2, and mb1> 96 GeV/c2 for purely left squarks.
• mt1 > 87 GeV/c2, and mb1> 82 GeV/c2 independent of the mixing angle.
Acknowledgments
We are greatly indebted to our technical collaborators, to the members of the CERN-SL Division for the excellent performance of the LEP collider, and to the funding agenciesfor their support in building and operating the DELPHI detector.
We acknowledge in particular the support ofAustrian Federal Ministry of Science and Traffics, GZ 616.364/2-III/2a/98,FNRS–FWO, Belgium,FINEP, CNPq, CAPES, FUJB and FAPERJ, Brazil,Czech Ministry of Industry and Trade, GA CR 202/96/0450 and GA AVCR A1010521,Danish Natural Research Council,Commission of the European Communities (DG XII),Direction des Sciences de la Matiere, CEA, France,Bundesministerium fur Bildung, Wissenschaft, Forschung und Technologie, Germany,General Secretariat for Research and Technology, Greece,National Science Foundation (NWO) and Foundation for Research on Matter (FOM),The Netherlands,Norwegian Research Council,State Committee for Scientific Research, Poland, 2P03B06015, 2P03B1116 andSPUB/P03/178/98,JNICT–Junta Nacional de Investigacao Cientıfica e Tecnologica, Portugal,Vedecka grantova agentura MS SR, Slovakia, Nr. 95/5195/134,Ministry of Science and Technology of the Republic of Slovenia,

14
CICYT, Spain, AEN96–1661 and AEN96-1681,The Swedish Natural Science Research Council,Particle Physics and Astronomy Research Council, UK,Department of Energy, USA, DE–FG02–94ER40817.
References
[1] H. Baer, K. Cheung, J.F. Gunion, Phys. Rev. D59 (1999) 075002.[2] A. Mafi, S. Raby, Phys. Rev. D62 (2000) 35003.
A. Mafi, S. Raby, Phys. Rev. D63 (2001) 55010.[3] CDF Collaboration, F. Abe et al., Phys. Rev. Lett. 79 (357) 1997.
D0 Collaboration, S., Abachi et al., Phys. Rev. Lett. 83 (4937) 1999.[4] G.R. Farrar, Nucl. Phys. Proc. Suppl. 62 (1998) 485.[5] ALEPH Collaboration, R. Barate et al., Z. Phys. C76 (1997) 1.
DELPHI Collaboration, P. Abreu et al., Phys. Lett. B414 (1997) 401.L3 Collaboration, M. Acciarri et al., Phys. Lett. B489 (2000) 65.OPAL Collaboration, G. Abbiendi et al., E. Phys. J. C20 (2001) 601.
[6] K. Hikasa, M.Kobayashi, Phys. Rev. D36 (1987) 724.[7] DELPHI Collaboration, P. Aarnio et al., Nucl. Instr. and Meth. A303 (1991) 233.[8] DELPHI Collaboration, P. Abreu et al., Nucl. Instr. and Meth. A378 (1996) 57.[9] T. Sjostrand, Comp. Phys. Comm. 82 (1994) 74.
[10] DELPHI Collaboration, P. Abreu et al., Z. Phys. C73 (1996) 11.[11] F.A. Berends, R. Pittau, R. Kleiss, Comp. Phys. Comm. 85 (1995) 437.[12] J. Fujimoto et al., Comp. Phys. Comm. 100 (1997) 128.[13] S. Jadach, B.F.L. Ward, Z. Was, Comp. Phys. Comm. 124 (2000) 23.[14] S. Jadach, W. Placzek, B.F.L. Ward, Phys. Lett. B390 (1997) 298.[15] C. Friberg, T. Sjostrand, JHEP 9 (2000) 10.[16] F.A. Berends, P.H. Daverveldt, R. Kleiss, Comp. Phys. Comm. 40 (1986) 271.[17] S. Katsanevas, P. Morawitz, Comp. Phys. Comm. 112 (1998) 227.[18] M. Drees, J.P. Eboli, E. Phys. J. C10 (1999) 337.[19] C. Peterson, D. Schatter, I. Scmitt, P.M. Zerwas, Phys. Rev. D27 (1983) 105.[20] DELPHI Collaboration, P. Aarnio et al., Nucl. Instr. and Meth. 303 (1991) 233.[21] S. Catani et al., Phys. Lett. B269 (91) 432.[22] G. Borisov, Nucl. Instr. and Meth. A417 (1998) 384.[23] P. Abreu et al., Nucl. Instr. and Meth. A427 (1999) 487.[24] A. Read, CERN Report 2000-05, p. 81 (2000).

15
Data Z0 → qqbackground
anomalous dE/dx 99322 97170 ± 200Y23 24566 25794 ± 1041 R± candidate 421 464 ± 14low dE/dx (mg< 14) 5 4.2 ± 1.3high dE/dx (mg≥ 14) 12 13.5 ± 2.4
Table 2: Number of events selected after each cut of the charged R-hadron analysis atLEP1.
Data Z0 → qqbackground
Acolinearity 41231 34853 ± 120NTPC 38977 33807 ± 120%EV D−ID 36877 32419 ± 120E40/Evis 19309 15311 ± 80E20/Evis 16664 13480 ± 75Et 16317 13453 ± 75Mvis 5932 6353 ± 52| cos θthrust| 5384 5725 ± 49| cos θPmis| 2527 2294 ± 31Y23 214 194 ± 9Nchar. 183 161 ± 8Acoplanarity 134 115 ± 7Thrust 105 81.7 ± 5.9Acol. vs Mjet1/Ejet1 + Mjet2/Ejet2 12 10.6 ± 2.1
Table 3: Number of events selected after each cut of the qqR◦R◦ analysis at LEP1.

16
Cuts Data Simulation 4-fermions 2-fermions γγ
NTPC 175436 164146 ± 105 12418 ± 13 50391 ± 24 101338 ± 102ESTIC/Evis. 145810 141362 ± 95 12062 ± 13 48170 ± 24 81131 ± 91θthrust 54838 54933 ± 45 9739 ± 10 31510 ± 23 13685 ± 38PTPC 48475 48846 ± 43 9141 ± 10 27580 ± 23 12126 ± 35Ncha. 45816 46227 ± 37 9040 ± 9 26969 ± 16 10219 ± 32Emax.
neu. 41880 42113 ± 37 8802 ± 9 23108 ± 16 10203 ± 321 R± candidate 2187 2279.1 ± 6.3 1746.8 ± 4.6 470.3 ± 3.4 62.6 ± 2.62 R± candidates 74 79.2 ± 0.8 75.2 ± 0.7 3.4 ± 0.3 0.5 ± 0.2
Table 4: Number of events after each cut of the LEP2 preselection. 189 to 208 GeV dataare added.
mg ≤ 30 GeV/c2 30 GeV/c2 < mg < 60 GeV/c2 mg ≥ 60 GeV/c2
√s Data Simulation Data Simulation Data Simulation
188.7 0 0.029±0.016 0 0.001±0.001 0 0.003±0.003191.6 0 0.005±0.004 0 0.001±0.001 0 0.001±0.001195.6 0 0.025±0.020 0 0.001±0.001 0 0.001±0.001199.6 0 0.007±0.007 0 0.001±0.001 0 0.001±0.001201.7 0 0.011±0.007 0 0.001±0.001 0 0.001±0.001204.8 0 0.009±0.009 0 0.001±0.001 0 0.001±0.001206.7 0 0.012±0.009 0 0.001±0.001 0 0.001±0.001208.1 0 0.000±0.000 0 0.001±0.001 0 0.001±0.001206.5(*) 0 0.017±0.013 0 0.001±0.001 0 0.001±0.001total 0 0.115±0.033 0 0.009±0.003 0 0.011±0.004
Table 5: Number of events selected by the qqR±R± analysis at LEP2. (*) indicates 2000data taken without sector 6 working.
mg ≤ 30 GeV/c2 30 GeV/c2 < mg < 60 GeV/c2 mg ≥ 60 GeV/c2
√s Data Simulation Data Simulation Data Simulation
188.7 0 0.577±0.101 0 2.514±0.264 0 1.937±0.243191.6 0 0.030±0.011 1 0.454±0.132 1 0.425±0.131195.6 2 0.135±0.042 2 0.783±0.097 0 0.648±0.088199.6 0 0.266±0.071 1 1.333±0.158 1 1.068±0.141201.7 0 0.097±0.025 2 0.489±0.056 2 0.392±0.050204.8 1 0.208±0.051 1 0.961±0.106 0 0.753±0.093206.6 0 0.187±0.040 1 0.848±0.089 1 0.661±0.079208.1 0 0.011±0.005 0 0.095±0.014 0 0.085±0.013206.5(*) 0 0.083±0.025 1 0.679±0.074 1 0.596±0.070total 3 1.59±0.15 9 8.16±0.39 6 6.57±0.36
Table 6: Number of events selected by the qqR±R◦ analysis at LEP2. (*) indicates 2000data taken without sector 6 working.

17
Cuts Data simulation 4-fermions 2-fermions γγ
P mis.t 26423 26938 ± 20 8117 ± 8 18012 ± 15 809 ± 9
θPmis.16379 16821 ± 15 7191 ± 6 9088 ± 12 542 ± 8
E400/Evis. 14694 15231 ± 14 6395 ± 6 8471 ± 12 364 ± 6Hermeticity 14422 14651 ± 14 6150 ± 6 8140 ± 12 361 ± 6
Table 7: qqR◦R◦ analysis at LEP2: number of events after each selection cut. Data with√s in the range 189 GeV-208 GeV are included.
∆M > 20 GeV/c2 ∆M ≤ 20 GeV/c2
√s Data Simulation Data Simulation
188.7 4 6.634±0.741 6 3.685±1.158191.6 4 1.054±0.115 0 0.482±0.097195.6 5 3.532±0.236 3 1.408±0.256199.6 7 4.324±0.270 0 1.617±0.280201.7 1 2.055±0.140 0 0.836±0.138204.8 4 4.432±0.302 0 1.197±0.268206.6 5 4.287±0.290 2 1.227±0.272208.1 0 0.418±0.031 0 0.117±0.026206.5(*) 2 3.411±0.203 0 0.556±0.072total 32 30.2±1.0 11 11.1±1.3
Table 8: Number of events selected by the stop qqR◦R◦ analysis. (*) indicates 2000 datataken without sector 6 working.
∆M > 20 GeV/c2 ∆M ≤ 20 GeV/c2
√s Data Simulation Data Simulation
188.7 0 1.038±0.657 3 2.475±1.139191.6 0 0.085±0.026 0 0.180±0.058195.6 0 0.314±0.088 1 0.571±0.178199.6 0 0.295±0.094 0 0.663±0.195201.7 0 0.225±0.049 1 0.319±0.096204.8 0 0.295±0.040 0 0.428±0.174206.6 0 0.312±0.05 0 0.379±0.175208.1 0 0.022±0.005 0 0.037±0.017206.5(*) 0 0.417±0.054 0 0.281±0.160total 0 3.0±0.7 5 5.3±1.2
Table 9: Number of events selected by the sbottom qqR◦R◦ analysis. (*) indicates 2000data taken without sector 6 working.
18
Stop SbottomP θt = 0◦ θt = 56◦ θb = 0◦ θb = 68◦
0.00 92 87 98 860.25 90 87 96 820.50 92 89 94 820.75 94 92 94 841.00 95 94 95 87
Table 10: Upper limits on the stop and sbottom masses as a function of the probabilityP that the gluino hadronizes to charged R-hadrons. Limits are set for ∆m ≥ 10 GeV/c2
and for a gluino mass greater than 2 GeV/c2. Mixing angles equal to zero correspondsto purely left-handed squarks, while θt = 56◦ and θb = 68◦ corresponds to minimalcross-section case.

19
(a) (b)
10
10 2
10 3
10 4
0 10 20 30 40 50
Momentum (GeV/c)
Num
ber
of e
vent
s
DELPHI: LEP1
Data
Z0 background
qq–R+/-R-/+ signal
qq–RoR+/- signal
1
10
10 2
10 3
10 4
0 10 20 30 40 50 60 70 80 90
Energy in 15o Cone (GeV)
Num
ber
of e
vent
s
DELPHI: LEP1
Data
Z0 background
qq–R+/-R-/+ signal
qq–RoR+/- signal
(c) (d)
1
10
10 2
10 3
10 4
0 10 20 30 40 50 60 70
Electromagnetic Energy (GeV)
Num
ber
of e
vent
s
DELPHI: LEP1
Data
Z0 background
qq–R+/-R-/+ signal
qq–RoR+/- signal
1
10
10 2
10 3
10 4
0 10 20 30 40 50 60
Hadronic Energy (GeV)
Num
ber
of e
vent
s
DELPHI: LEP1
Data
Z0 background
qq–R+/-R-/+ signal
qq–RoR+/- signal
Figure 5: Comparison between data and simulation in the search for charged R-hadronsat LEP1. The plots show characteristic distributions before the selection of the chargedR-hadron candidates: (a) the momentum, (b) the total energy in a 15◦ degree conearound the particle, (c) its electromagnetic and (d) hadronic energy. Dotted lines show theqqR±R± and qqR±R◦ signal distributions with arbitrary normalization when all simulatedsamples are added together.

20
0.5
1
1.5
2
2.5
3
3.5
4
4.5
5
10 20 30 40 50 60 70 80 90 100
Momentum (GeV/c)
dE/d
x (m
ip)
m=me
m=1
m=30
m=50
m=3 m=10
m=70
Standard tracks
Mgluino = 10 GeV/c2
Mgluino = 70 GeV/c2
Figure 6: The lines show the theoritical ionization energy loss as a function of the momen-tum of the particle for different mass cases (GeV/c2). The black points are reconstructedtracks coming from Z0 → qq events generated at
√s =200 GeV, while the stars and
the triangles correspond to R± tracks with mass of 10 and 70 GeV/c2respectively. ThedE/dx is expressed in units of energy loss for a minimum ionizing particle.

21
0
0.1
0.2
0.3
0.4
0.5
0.6
0.7
0 5 10 15 20 25
Gluino mass (GeV/c2)
Eff
icie
ncy
DELPHI: LEP1
qq–R+/-R-/+ signal
qq–R+/-R0 signal
qq–R0R0 signal
Figure 7: Signal detection efficiencies in the LEP1 data analyses as a function of thegluino mass for the three signal topologies qqR±R±, qqR±R◦ and qqR◦R◦. The searchfor charged R-hadrons was optimized separately for low gluino masses (< 14 GeV/c2)and for high gluino masses (≥ 14 GeV/c2).

22
(a) (b)
0
200
400
600
800
1000
0 20 40 60 80 100
Visible Energy (GeV)
Num
ber
of e
vent
s
DELPHI: LEP1
Dataqq
– background
qq–RoRo signal
0
200
400
600
800
1000
0 10 20 30 40 50 60 70 80
Visible Mass(GeV/c2)
Num
ber
of e
vent
s
DELPHI: LEP1
Dataqq
– background
qq–RoRo signal
(c) (d)
0
50
100
150
200
250
300
350
400
0 20 40 60 80 100 120 140 160 180
Acoplanarity (degrees)
Num
ber
of e
vent
s
DELPHI: LEP1
Dataqq
– background
qq–RoRo signal
0
50
100
150
200
250
300
0.5 1 1.5 2 2.5 3 3.5 4
-log10(Y23)
Num
ber
of e
vent
s
DELPHI: LEP1
Dataqq
– background
qq–RoRo signal
Figure 8: Comparison between data and simulation in the qqR◦R◦ analysis at LEP1. (a)visible energy, (b) visible mass, (c) acoplanarity (d) DURHAM distance Y23. Dotted linesshow the qqR◦R◦ signal distributions with arbitrary normalization when all simulatedsamples are added together.

23
0
2.5
5
7.5
10
12.5
15
17.5
20
0 20 40 60 80 100
Num
ber
of E
vent
s
Momentum (GeV/c)
DELPHI: 189 to 208 GeV data
Data
2-Fermion
4-Fermion
2-Photon
0
1
2
3
4
5
6
7
8
9
0 20 40 60 80 100
Num
ber
of E
vent
s
Momentum (GeV/c)
Num
ber
of E
vent
s
Momentum (GeV/c)
Signal Simulation at 200 GeV
Stop
Sbottom
1
10
10 2
0 0.5 1 1.5 2 2.5 3 3.5 4 4.5 5
Num
ber
of E
vent
s
dE/dx (mip)
DELPHI: 189 to 208 GeV data
Data
2-Fermion
4-Fermion
2-Photon
0
0.5
1
1.5
2
2.5
3
3.5
4
4.5
0 0.5 1 1.5 2 2.5 3 3.5 4 4.5 5
Num
ber
of E
vent
s
dE/dx (mip)
Num
ber
of E
vent
s
dE/dx (mip)
Signal Simulation at 200 GeV
Stop
Sbottom
Figure 9: Momentum and dE/dx of the charged R-hadron candidates selected by theqqR±R± analysis at LEP2. Data taken in the centre-of-mass energy range between 189and 208 GeV were included. Right-hand side histograms show the expected distributionsfor one possible stop and sbottom signal (mq1
= 90 GeV/c2, mg = 60 GeV/c2) at√s = 200 GeV with arbitrary normalization.

24
(a)
0
0.1
0.2
0.3
0.4
0.5
0.6
0.7
0.8
0.9
1
0 10 20 30 40 50 60 70 80 90 100
Gluino mass (GeV/c2)
Eff
icie
ncy
qq–R+/-R-/+ analysis - M(t
∼1) = 90 GeV/c2
Mg∼ ≤ 30 GeV/c2
30 < Mg∼ < 60 GeV/c2
Mg∼ ≥ 60 GeV/c2
∆m =
5 G
eV/c
2(b)
0
0.1
0.2
0.3
0.4
0.5
0.6
0.7
0.8
0.9
1
0 10 20 30 40 50 60 70 80 90 100
Gluino mass (GeV/c2)
Eff
icie
ncy
qq–R+/-R-/+ analysis - M(b
∼1) = 90 GeV/c2
Mg∼ ≤ 30 GeV/c2
30 < Mg∼ < 60 GeV/c2
Mg∼ ≥ 60 GeV/c2
∆m =
5 G
eV/c
2
Figure 10: Signal detection efficiencies at√
s =200 GeV for the stop (a) and sbottom(b) qqR±R± analysis as a function of the gluino mass (mq1
= 90 GeV/c2). ∆M is themass difference between the squark and the gluino. Vertical lines show the limits of themass analysis window. The last one ends at ∆M = 5 GeV/c2 which corresponds the lastsimulated signal points.

25
1
10
10 2
10 3
10 4
0 20 40 60 80 100
Num
ber
of E
vent
s
Momentum (GeV/c)
DELPHI: 189 to 208 GeV data
Data
2-Fermion
4-Fermion
2-Photon
0
1
2
3
4
5
6
7
8
0 20 40 60 80 100
Num
ber
of E
vent
s
Momentum (GeV/c)
Num
ber
of E
vent
s
Momentum (GeV/c)
Signal Simulation at 200 GeV
Stop
Sbottom
1
10
10 2
10 3
0 0.5 1 1.5 2 2.5 3 3.5 4 4.5 5
Num
ber
of E
vent
s
dE/dx (mip)
DELPHI: 189 to 208 GeV data
Data
2-Fermion
4-Fermion
2-Photon
0
0.5
1
1.5
2
2.5
3
3.5
0 0.5 1 1.5 2 2.5 3 3.5 4 4.5 5
Num
ber
of E
vent
s
dE/dx (mip)
Num
ber
of E
vent
s
dE/dx (mip)
Signal Simulation at 200 GeV
Stop
Sbottom
Figure 11: Momentum and dE/dx of the charged R-hadron candidates selected by theqqR±R◦ analysis at LEP2. Data taken in the centre-of-mass energy range between 189and 208 GeV were included. Right-hand side histograms show the expected distributionsfor one possible stop and sbottom signal (mq1
= 90 GeV/c2, mg = 60 GeV/c2) at√s = 200 GeV with arbitrary normalization.

26
(a)
0
0.1
0.2
0.3
0.4
0.5
0.6
0.7
0.8
0.9
1
0 10 20 30 40 50 60 70 80 90 100
Gluino mass (GeV/c2)
Eff
icie
ncy
qq–R+/-Ro analysis - M(t
∼1) = 90 GeV/c2
Mg∼ ≤ 30 GeV/c2
30 < Mg∼ < 60 GeV/c2
Mg∼ ≥ 60 GeV/c2
∆m =
5 G
eV/c
2(b)
0
0.1
0.2
0.3
0.4
0.5
0.6
0.7
0.8
0.9
1
0 10 20 30 40 50 60 70 80 90 100
Gluino mass (GeV/c2)
Eff
icie
ncy
qq–R+/-Ro analysis - M(b
∼1) = 90 GeV/c2
Mg∼ ≤ 30 GeV/c2
30 < Mg∼ < 60 GeV/c2
Mg∼ ≥ 60 GeV/c2
∆m =
5 G
eV/c
2
Figure 12: Signal detection efficiencies at√
s =200 GeV for the stop (a) and sbottom(b) qqR±R◦ analysis as a function of the gluino mass (mq1
= 90 GeV/c2).∆M is themass difference between the squark and the gluino. Vertical lines show the limits of themass analysis window. The last one ends at ∆M = 5 GeV/c2 which corresponds the lastsimulated signal points.
27
0
200
400
600
800
1000
1200
1400
0 25 50 75 100 125 150 175 200 225 250
Num
ber
of E
vent
s
Visible Energy (GeV)
DELPHI: 189 to 208 GeV data
Data
2-Fermion
4-Fermion
2-Photon
0
0.5
1
1.5
2
2.5
0 25 50 75 100 125 150 175 200 225 250
Num
ber
of E
vent
s
Visible Energy (GeV)
Num
ber
of E
vent
s
Visible Energy (GeV)
Signal Simulation at 200 GeV
Stop
Sbottom
0
100
200
300
400
500
600
0 10 20 30 40 50 60 70 80
Num
ber
of E
vent
s
Number of Particles
DELPHI: 189 to 208 GeV data
Data
2-Fermion
4-Fermion
2-Photon
0
0.25
0.5
0.75
1
1.25
1.5
1.75
2
0 20 40 60 80 100
Num
ber
of E
vent
s
Number of Particles
Num
ber
of E
vent
s
Number of Particles
Signal Simulation at 200 GeV
Stop
Sbottom
Figure 13: Data-simulation comparison at the preselection level of the LEP2 qqR◦R◦
analysis. Data taken in the centre-of-mass energy range between 189 and 208 GeV wereincluded. Right-hand side histograms show the expected distributions with arbitrarynormalization for the stop and the sbottom signal at 200 GeV when all simulated samplesare added together.
28
1
10
10 2
10 3
10 4
0 20 40 60 80 100 120 140 160 180
Num
ber
of E
vent
s
Acoplanarity (degrees)
DELPHI: 189 to 208 GeV data
Data
2-Fermion
4-Fermion
2-Photon
0
0.5
1
1.5
2
2.5
3
3.5
0 20 40 60 80 100 120 140 160 180
Num
ber
of E
vent
s
Acoplanarity (degrees)
Num
ber
of E
vent
s
Acoplanarity (degrees)
Signal Simulation at 200 GeV
Stop
Sbottom
1
10
10 2
10 3
-4 -2 0 2 4 6 8 10
Num
ber
of E
vent
s
Combined b-tagging Variable
DELPHI: 189 to 208 GeV data
Data
2-Fermion
4-Fermion
2-Photon
0
1
2
3
4
5
-4 -2 0 2 4 6 8 10
Num
ber
of E
vent
s
Combined b-tagging Variable
Num
ber
of E
vent
s
Combined b-tagging Variable
Signal Simulation at 200 GeV
Stop
Sbottom
Figure 14: Data-simulation comparison at the preselection level of the LEP2 qqR◦R◦
analysis. Data taken in the centre-of-mass energy range between 189 and 208 GeV wereincluded. Right-hand side histograms show the expected distributions with arbitrarynormalization for the stop and the sbottom signal at 200 GeV when all simulated samplesare added together.

29
(a) (b)
10
10 2
10 3
10 4
0.1 0.2 0.3 0.4 0.5 0.6 0.7
Efficiency t∼ (95,20) at 200 GeV
Num
ber
of E
vent
s
DELPHI: 189 to 208 GeV datadatatotal background MCqq(γ)WWhadronic γγ
1
10
10 2
10 3
10 4
0.15 0.2 0.25 0.3 0.35 0.4 0.45 0.5 0.55
Efficiency t∼ (95,85) at 200 GeV
Num
ber
of E
vent
s
DELPHI: 189 to 208 GeV datadatatotal background MCqq(γ)WWhadronic γγ
(c) (d)
10
10 2
10 3
10 4
0.3 0.35 0.4 0.45 0.5 0.55 0.6 0.65 0.7
Efficiency b∼ (100,20) at 200 GeV
Num
ber
of E
vent
s
DELPHI: 189 to 208 GeV datadatatotal background MCqq(γ)WWhadronic γγ
1
10
10 2
10 3
10 4
0.2 0.25 0.3 0.35 0.4 0.45 0.5
Efficiency b∼ (90,80) at 200 GeV
Num
ber
of E
vent
s
DELPHI: 189 to 208 GeV datadatatotal background MCqq(γ)WWhadronic γγ
Figure 15: Numbers of events as a function of the signal efficiencies for the stop and sbot-tom analysis. Data taken in the centre-of-mass energy range between 189 and 208 GeVwere included. (a) stop analysis for ∆m > 20 GeV/c2 and (b) for ∆m ≤ 20 GeV/c2, (c)sbottom analysis for ∆m > 20 GeV/c2 and (b) for ∆m ≤ 20 GeV/c2. The squark andgluino mass values used for the signal detection efficiencies are indicated on the x axis,(mq,mg).

30
(a)
0
0.1
0.2
0.3
0.4
0.5
0.6
0.7
0.8
0.9
1
0 10 20 30 40 50 60 70 80 90 100
Gluino mass (GeV/c2)
Eff
icie
ncy
qq–RoRo analysis - M(t
∼1) = 90 GeV/c2
∆m > 20 GeV/c2
∆m ≤ 20 GeV/c2
∆m =
20
GeV
/c2
∆m =
5 G
eV/c
2
(b)
0
0.1
0.2
0.3
0.4
0.5
0.6
0.7
0.8
0.9
1
0 10 20 30 40 50 60 70 80 90 100
Gluino mass (GeV/c2)
Eff
icie
ncy
qq–RoRo analysis - M(b
∼1) = 90 GeV/c2
∆m > 20 GeV/c2
∆m ≤ 20 GeV/c2
∆m =
20
GeV
/c2
∆m =
5 G
eV/c
2
Figure 16: Signal detection efficiencies at√
s =200 GeV for the stop (a) and sbottom (b)qqR◦R◦ analysis as a function of the gluino mass (mq1
= 90 GeV/c2).

31
0
0.1
0.2
0.3
0.4
0.5
0.6
0.7
0.8
0.9
1
0 5 10 15 20 25 30 35 40 45 50
Gluino Mass (GeV/c2)
P(g∼ →
R+
/-)
DELPHI91.2 GeV - L=46 pb-1
Observed
Expected
Figure 17: Results of the LEP1 analysis: excluded region at 95% confidence level in theplane (mg,P). P is the probability that the gluino hadronizes to a charged R-hadron. Theshaded region corresponds to the observed exclusion and the line to the expected one.
32
0
20
40
60
80
100
50 60 70 80 90 100 110
LEP1
LEP2
Stop Mass (GeV/c2)
Glu
ino
Mas
s (G
eV/c
2 )
DELPHIt∼ → c g
∼ P=1.
MixedLeft
0
20
40
60
80
100
50 60 70 80 90 100 110
LEP1
LEP2
Stop Mass (GeV/c2)
Glu
ino
Mas
s (G
eV/c
2 )
DELPHIt∼ → c g
∼ P=0.75
MixedLeft
0
20
40
60
80
100
50 60 70 80 90 100 110
LEP1
LEP2
Stop Mass (GeV/c2)
Glu
ino
Mas
s (G
eV/c
2 )
DELPHIt∼ → c g
∼ P=0.50
MixedLeft
0
20
40
60
80
100
50 60 70 80 90 100 110
LEP1
LEP2
Stop Mass (GeV/c2)
Glu
ino
Mas
s (G
eV/c
2 )DELPHIt∼ → c g
∼ P=0.25
MixedLeft
0
20
40
60
80
100
50 60 70 80 90 100 110
LEP1
LEP2
Stop Mass (GeV/c2)
Glu
ino
Mas
s (G
eV/c
2 )
DELPHIt∼ → c g
∼ P=0.
MixedLeft
Figure 18: Results of the LEP2+LEP1 stop analysis: excluded region at 95% confidencelevel in the plane (mt1 ,mg). The line corresponds to the exclusion for purely left stop,and the shaded region to exclusion obtained for the mixing angle giving the minimalcross-section. Excluded regions are given for different values of P, the probability thatthe gluino hadronizes to charged R-hadron: 0, 0.25, 0.5, 0.75 and 1.

33
0
20
40
60
80
100
50 60 70 80 90 100 110
LEP1
LEP2
Sbottom Mass (GeV/c2)
Glu
ino
Mas
s (G
eV/c
2 )
DELPHIb∼ → b g
∼ P=1.00
MixedLeft
0
20
40
60
80
100
50 60 70 80 90 100 110
LEP1
LEP2
Sbottom Mass (GeV/c2)
Glu
ino
Mas
s (G
eV/c
2 )
DELPHIb∼ → b g
∼ P=0.75
MixedLeft
0
20
40
60
80
100
50 60 70 80 90 100 110
LEP1
LEP2
Sbottom Mass (GeV/c2)
Glu
ino
Mas
s (G
eV/c
2 )
DELPHIb∼ → b g
∼ P=0.50
MixedLeft
0
20
40
60
80
100
50 60 70 80 90 100 110
LEP1
LEP2
Sbottom Mass (GeV/c2)
Glu
ino
Mas
s (G
eV/c
2 )DELPHIb∼ → b g
∼ P=0.25
MixedLeft
0
20
40
60
80
100
50 60 70 80 90 100 110
LEP1
LEP2
Sbottom Mass (GeV/c2)
Glu
ino
Mas
s (G
eV/c
2 )
DELPHIb∼ → b g
∼ P=0.
MixedLeft
Figure 19: Results of the LEP2+LEP1 sbottom analysis: excluded region at 95% con-fidence level in the plane (mb1
,mg). The line corresponds to the exclusion for purelyleft sbottom, and the shaded region to exclusion obtained for the mixing angle giving theminimal cross-section. Excluded regions are given for different values of P, the probabilitythat the gluino hadronizes to charged R-hadron: 0, 0.25, 0.5, 0.75 and 1.


