Embed Size (px)
Citation preview
TABLE OF CONTENTS
Company Profile of 10 Securities.............3Aftab Automobiles Bangladesh Limited........3Confidence cement limited...................4Global Insurance............................6Mercantile Bank.............................8National Credit and Commerce Bank ltd......10Figure; Price movement of NCC bank Ltd for last one year...................................11Peoples Leasing and Finance Limited........11Purabi General Insurance Limited:..........13Summit Power Ltd:..........................14Uttara Bank Limited........................16Union Capital BD Limited...................17
Security Character of Chosen Securities.....19Portfolio Selection.........................25
Introduction
Course: Invest ManagementCourse Teacher: Samia Islam
Security portfolios are the combination of the securities to
make investment. Investment requires certain knowledge on
analyzing the historical and the theoretical returns and the risk
characteristic. The purpose of this paper is to show how to
calculate the risk and return of the securities and to analyze
the risk return characteristics. The other objectives are to
derive the optimal risky portfolio and the complete portfolio
which is the combination of the risky and risk free securities.
Then the comparison between the returns of arbitrarily chosen
portfolio and calculated portfolio. The profile of the securities
selected are also included in this paper for the ease of
fundamental analysis of the securities. The CAPM and SIM returns
2 | P a g ePrepared by- Roll: 1555, 1559, 1664, 1665, 1666
Company Profile of 10Securities
Course: Invest ManagementCourse Teacher: Samia Islam
are also derived to see the underpriced and overpriced securities
according to the theoretical return.
Aftab Automobiles Bangladesh Limited
Aftab Automobiles Limited provides assembling and bus body building
services. The company offers its assembling services for various vehicles. It
is also involved in manufacturing and marketing a range of products, including
automotive, industrial, and solar batteries; home, office, industrial, and
medical furniture; and various paint products comprising distemper, enamel
paint, weather coat, plastic emulsion, A.C primer, navacem, and thinner. Aftab
3 | P a g ePrepared by- Roll: 1555, 1559, 1664, 1665, 1666
Course: Invest ManagementCourse Teacher: Samia Islam
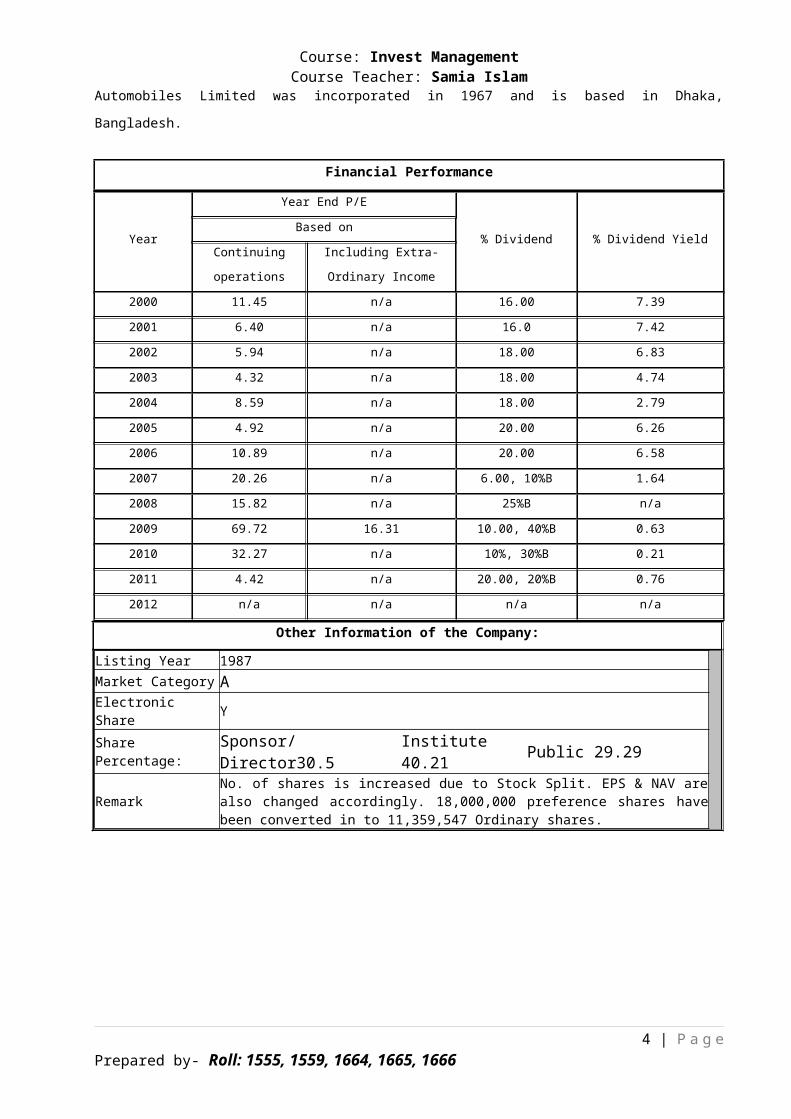
Automobiles Limited was incorporated in 1967 and is based in Dhaka,
Bangladesh.
Financial Performance
Year
Year End P/E
% Dividend % Dividend YieldBased on
Continuing
operations
Including Extra-
Ordinary Income
2000 11.45 n/a 16.00 7.39
2001 6.40 n/a 16.0 7.42
2002 5.94 n/a 18.00 6.83
2003 4.32 n/a 18.00 4.74
2004 8.59 n/a 18.00 2.79
2005 4.92 n/a 20.00 6.26
2006 10.89 n/a 20.00 6.58
2007 20.26 n/a 6.00, 10%B 1.64
2008 15.82 n/a 25%B n/a
2009 69.72 16.31 10.00, 40%B 0.63
2010 32.27 n/a 10%, 30%B 0.21
2011 4.42 n/a 20.00, 20%B 0.76
2012 n/a n/a n/a n/a
Other Information of the Company:
Listing Year 1987Market Category AElectronicShare Y
SharePercentage:
Sponsor/Director30.5
Institute40.21 Public 29.29
RemarkNo. of shares is increased due to Stock Split. EPS & NAV arealso changed accordingly. 18,000,000 preference shares havebeen converted in to 11,359,547 Ordinary shares.
4 | P a g ePrepared by- Roll: 1555, 1559, 1664, 1665, 1666
Course: Invest ManagementCourse Teacher: Samia Islam
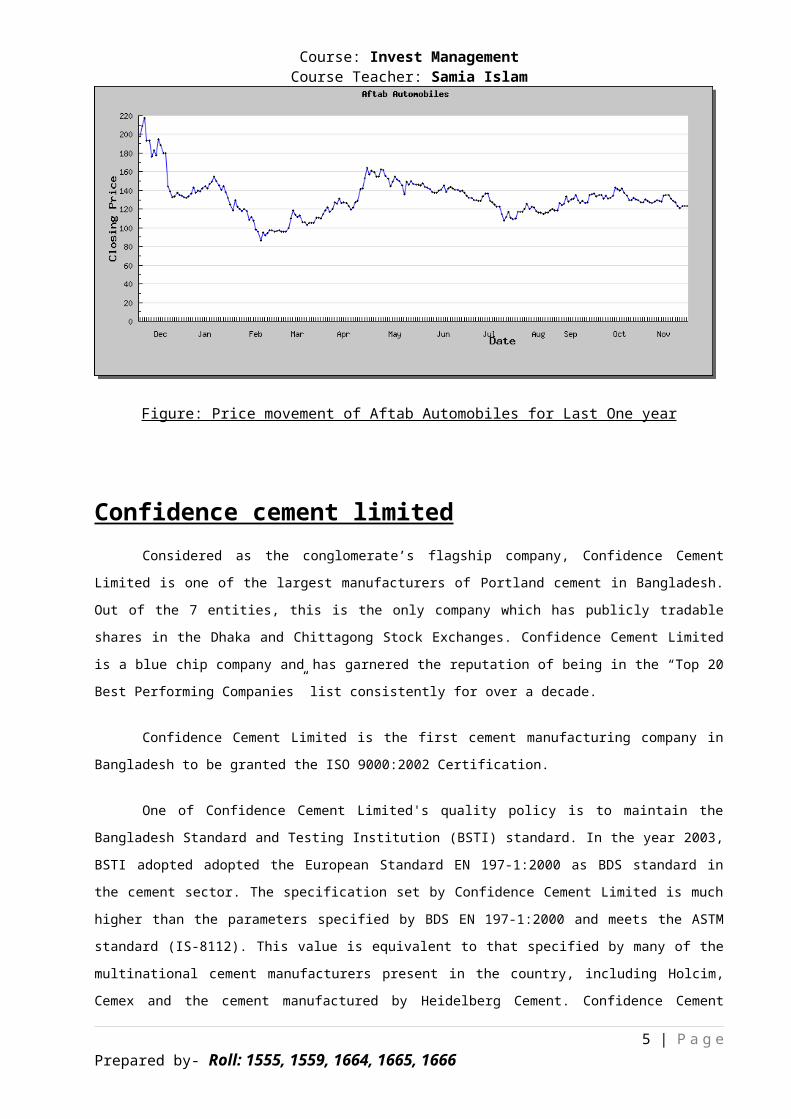
Figure: Price movement of Aftab Automobiles for Last One year
Confidence cement limitedConsidered as the conglomerate’s flagship company, Confidence Cement
Limited is one of the largest manufacturers of Portland cement in Bangladesh.
Out of the 7 entities, this is the only company which has publicly tradable
shares in the Dhaka and Chittagong Stock Exchanges. Confidence Cement Limited
is a blue chip company and has garnered the reputation of being in the “Top 20
Best Performing Companies” list consistently for over a decade.
Confidence Cement Limited is the first cement manufacturing company in
Bangladesh to be granted the ISO 9000:2002 Certification.
One of Confidence Cement Limited's quality policy is to maintain the
Bangladesh Standard and Testing Institution (BSTI) standard. In the year 2003,
BSTI adopted adopted the European Standard EN 197-1:2000 as BDS standard in
the cement sector. The specification set by Confidence Cement Limited is much
higher than the parameters specified by BDS EN 197-1:2000 and meets the ASTM
standard (IS-8112). This value is equivalent to that specified by many of the
multinational cement manufacturers present in the country, including Holcim,
Cemex and the cement manufactured by Heidelberg Cement. Confidence Cement
5 | P a g ePrepared by- Roll: 1555, 1559, 1664, 1665, 1666
Course: Invest ManagementCourse Teacher: Samia Islam
Limited (CCL) is the first private sector cement manufacturing company in
Bangladesh established in early 90’s with having 4,80,000 M/T annual
production capacity at Chittagong, 16 K.M away from Chittagong port, besides
Dhaka Chittagong highway.
The company has deployed over 100 tripper trucks and bulk carriers for
the carriage of cement, which is the highest in number in Bangladesh.
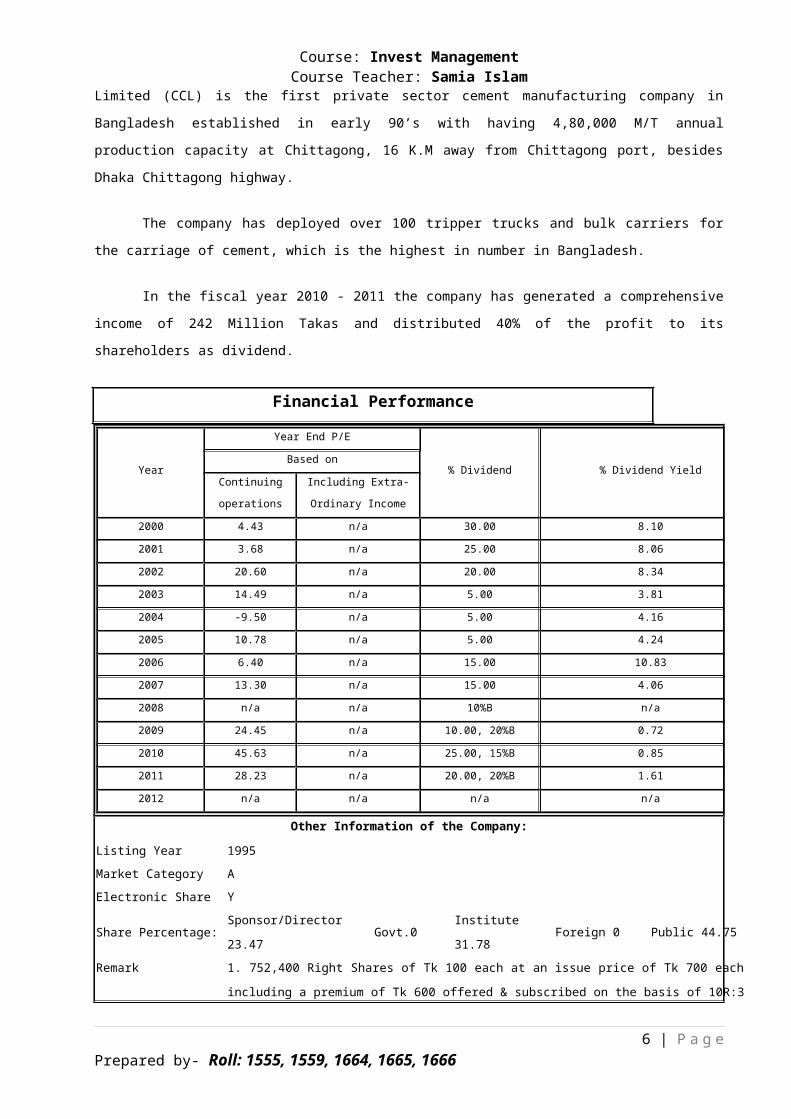
In the fiscal year 2010 - 2011 the company has generated a comprehensive
income of 242 Million Takas and distributed 40% of the profit to its
shareholders as dividend.
Financial Performance
Year
Year End P/E
% Dividend % Dividend YieldBased on
Continuing
operations
Including Extra-
Ordinary Income
2000 4.43 n/a 30.00 8.10
2001 3.68 n/a 25.00 8.06
2002 20.60 n/a 20.00 8.34
2003 14.49 n/a 5.00 3.81
2004 -9.50 n/a 5.00 4.16
2005 10.78 n/a 5.00 4.24
2006 6.40 n/a 15.00 10.83
2007 13.30 n/a 15.00 4.06
2008 n/a n/a 10%B n/a
2009 24.45 n/a 10.00, 20%B 0.72
2010 45.63 n/a 25.00, 15%B 0.85
2011 28.23 n/a 20.00, 20%B 1.61
2012 n/a n/a n/a n/a
Other Information of the Company:
Listing Year 1995Market Category AElectronic Share Y
Share Percentage:Sponsor/Director
23.47Govt.0
Institute
31.78Foreign 0 Public 44.75
Remark 1. 752,400 Right Shares of Tk 100 each at an issue price of Tk 700 each
including a premium of Tk 600 offered & subscribed on the basis of 10R:3
6 | P a g ePrepared by- Roll: 1555, 1559, 1664, 1665, 1666
Course: Invest ManagementCourse Teacher: Samia Islam
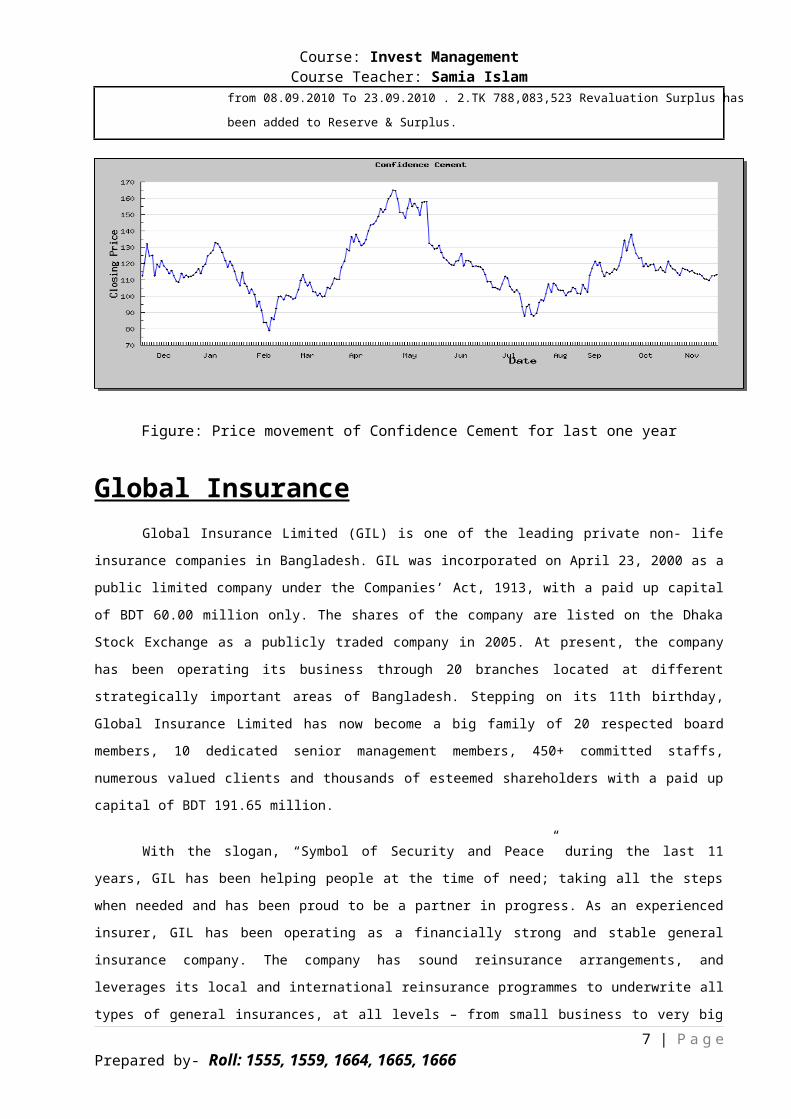
from 08.09.2010 To 23.09.2010 . 2.TK 788,083,523 Revaluation Surplus has
been added to Reserve & Surplus.
Figure: Price movement of Confidence Cement for last one year
Global InsuranceGlobal Insurance Limited (GIL) is one of the leading private non- life
insurance companies in Bangladesh. GIL was incorporated on April 23, 2000 as a
public limited company under the Companies’ Act, 1913, with a paid up capital
of BDT 60.00 million only. The shares of the company are listed on the Dhaka
Stock Exchange as a publicly traded company in 2005. At present, the company
has been operating its business through 20 branches located at different
strategically important areas of Bangladesh. Stepping on its 11th birthday,
Global Insurance Limited has now become a big family of 20 respected board
members, 10 dedicated senior management members, 450+ committed staffs,
numerous valued clients and thousands of esteemed shareholders with a paid up
capital of BDT 191.65 million.
With the slogan, “Symbol of Security and Peace” during the last 11
years, GIL has been helping people at the time of need; taking all the steps
when needed and has been proud to be a partner in progress. As an experienced
insurer, GIL has been operating as a financially strong and stable general
insurance company. The company has sound reinsurance arrangements, and
leverages its local and international reinsurance programmes to underwrite all
types of general insurances, at all levels – from small business to very big7 | P a g e
Prepared by- Roll: 1555, 1559, 1664, 1665, 1666
Course: Invest ManagementCourse Teacher: Samia Islam
business. Hence GIL has achieved an excellent market reputation with the
leading position in the non- life insurance business industry of the country.
Global Insurance has a combination of both local and foreign shareholders.
Sound risk management has always been at the heart of management. This
discipline aided the management in managing various risks incorporated with
insurance business efficiently since the year of its inception. Whether it is
financial risk arising from the change in the value of company’s investments
and insurance liability, or credit risk from our investment in bonds and other
security, management is capable of monitoring and managing those risks
efficiently.
To coup with the challenge of 21st century GIL has taken initiative to
fully computerize its operation by the end of 2011. It will enhance its
servicing capacity upto international level.
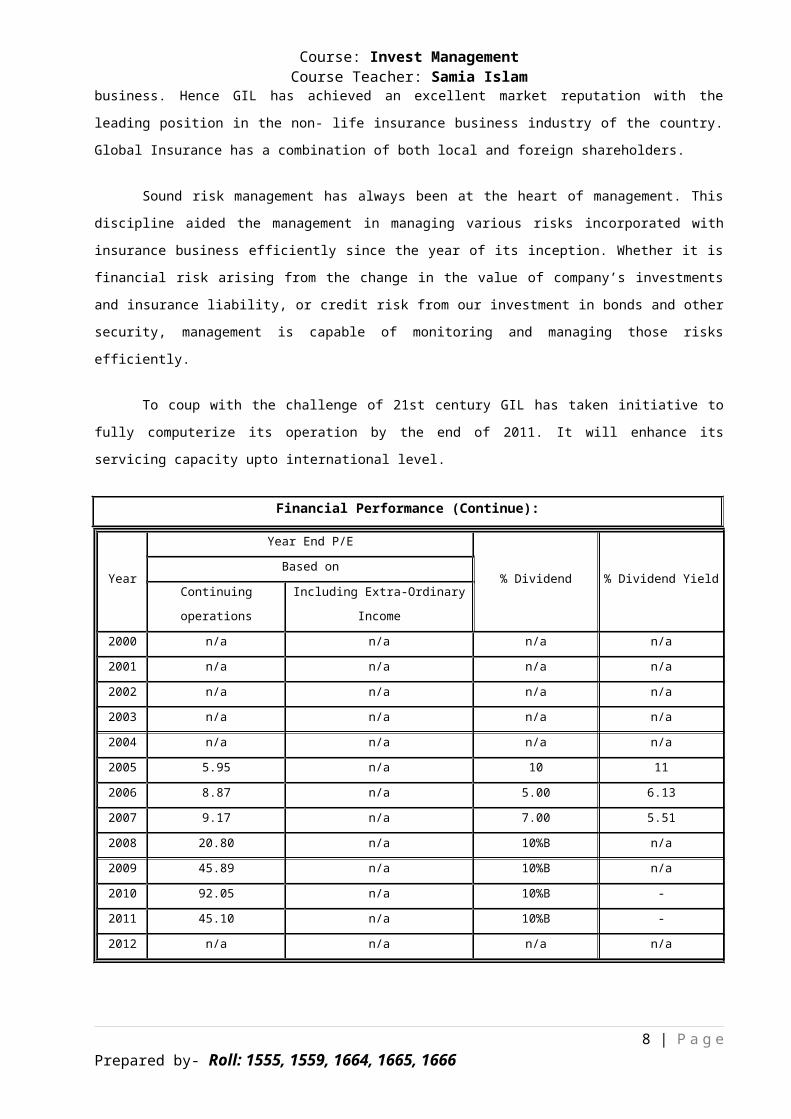
Financial Performance (Continue):
Year
Year End P/E
% Dividend % Dividend YieldBased on
Continuing
operations
Including Extra-Ordinary
Income
2000 n/a n/a n/a n/a
2001 n/a n/a n/a n/a
2002 n/a n/a n/a n/a
2003 n/a n/a n/a n/a
2004 n/a n/a n/a n/a
2005 5.95 n/a 10 11
2006 8.87 n/a 5.00 6.13
2007 9.17 n/a 7.00 5.51
2008 20.80 n/a 10%B n/a
2009 45.89 n/a 10%B n/a
2010 92.05 n/a 10%B -
2011 45.10 n/a 10%B -
2012 n/a n/a n/a n/a
8 | P a g ePrepared by- Roll: 1555, 1559, 1664, 1665, 1666
Course: Invest ManagementCourse Teacher: Samia IslamOther Information of the Company:
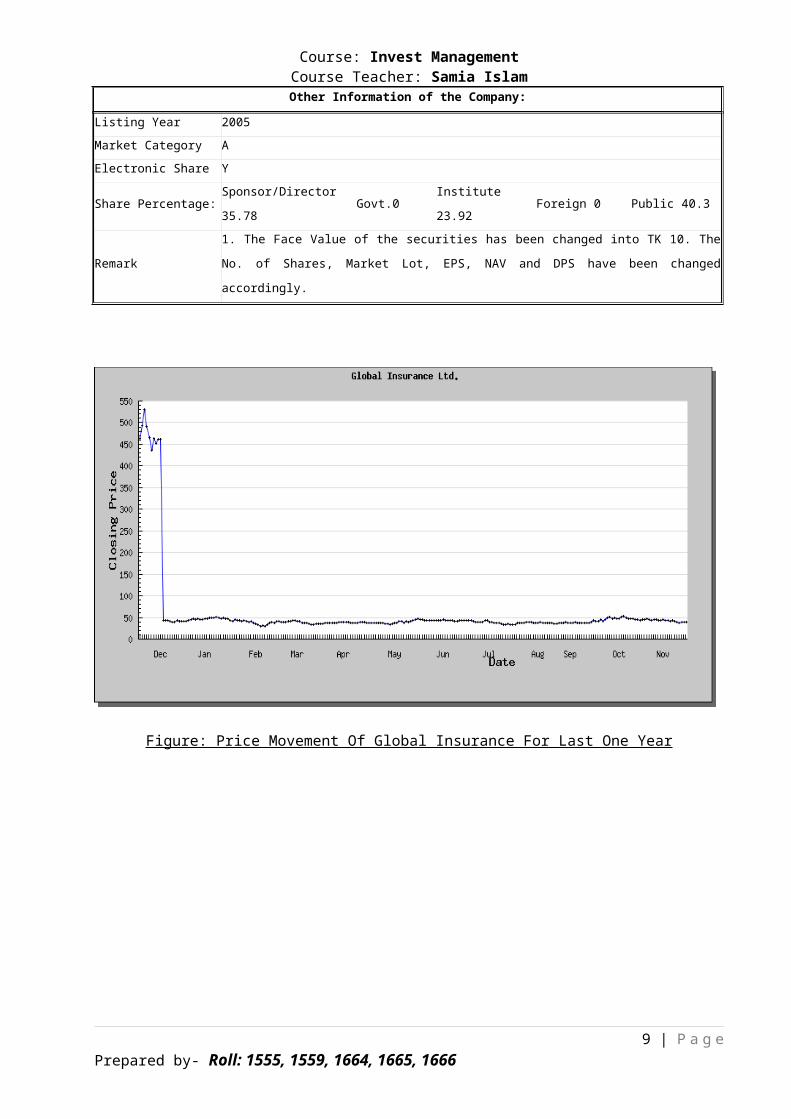
Listing Year 2005Market Category AElectronic Share Y
Share Percentage:Sponsor/Director
35.78Govt.0
Institute
23.92Foreign 0 Public 40.3
Remark
1. The Face Value of the securities has been changed into TK 10. The
No. of Shares, Market Lot, EPS, NAV and DPS have been changed
accordingly.
Figure: Price Movement Of Global Insurance For Last One Year
9 | P a g ePrepared by- Roll: 1555, 1559, 1664, 1665, 1666
Course: Invest ManagementCourse Teacher: Samia Islam
Mercantile Bank
Mercantile Bank Limited is a commercial bank headquartered in Dhaka,
Bangladesh. It was established on 20 May 1999; and commenced commercial
banking operation on 2 June 1999. It is a public limited company with limited
liability under the bank companies act, 1991. Its share is listed in Dhaka
Stock Exchange and Chittagong Stock Exchange. The bank provide products and
services in retail banking, corporate finance, Islamic Finance, asset
management, equity brokerage and security. It has 80 branches in Bangladesh
and employ around 1,600 employees
Vision
Would make finest corporate citizen.
Mission
Will become most caring, focused for equitable growth based on
diversified deployment of resources, and nevertheless would remain
healthy and gainfully profitable Bank.
Objectives
Strategic objectives
to achieve positive Economic Value Added (EVA) each year.
to be market leader in product innovation.
to be one of the top three Financial Institutions in Bangladesh in terms
of cost efficiency.
to be one of the top five Financial Institutions in Bangladesh in terms
of market share in all significant market segments we serve.
Financial objectives
to achieve 20% return on shareholders' equity or more, on average.
10 | P a g ePrepared by- Roll: 1555, 1559, 1664, 1665, 1666

Course: Invest ManagementCourse Teacher: Samia Islam
11 | P a g ePrepared by- Roll: 1555, 1559, 1664, 1665, 1666
Course: Invest ManagementCourse Teacher: Samia Islam
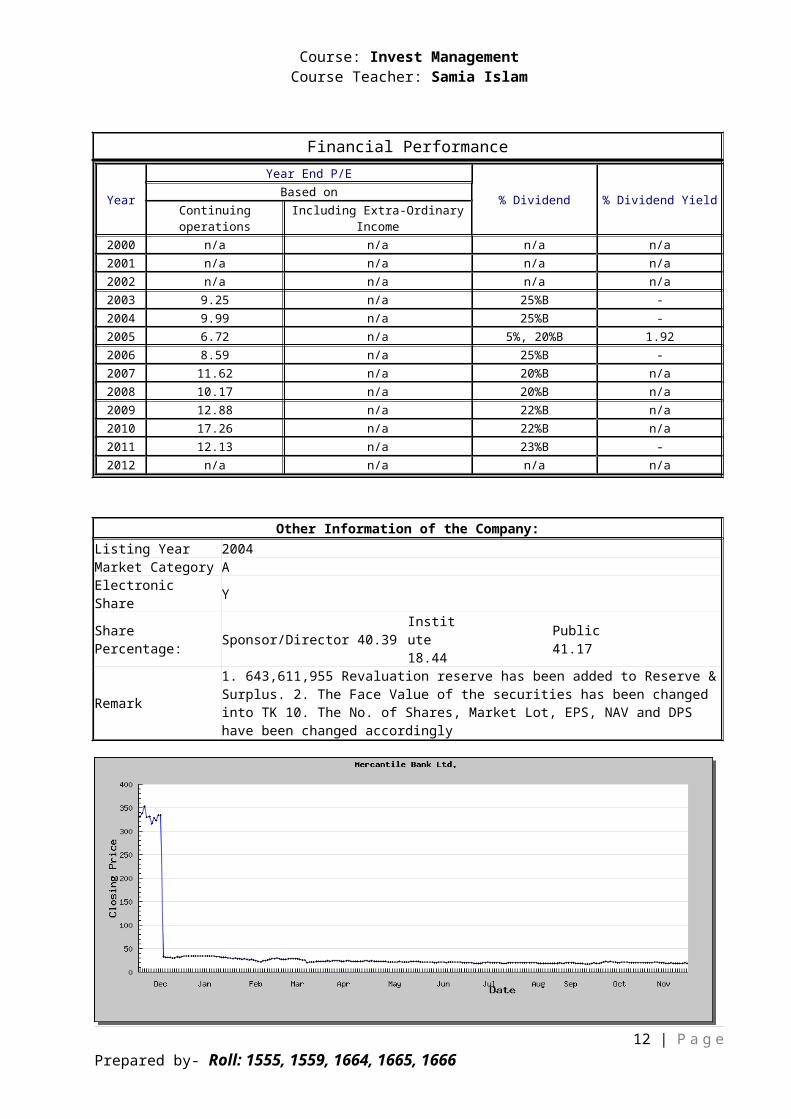
Financial Performance
Year
Year End P/E
% Dividend % Dividend YieldBased onContinuingoperations
Including Extra-OrdinaryIncome
2000 n/a n/a n/a n/a2001 n/a n/a n/a n/a2002 n/a n/a n/a n/a2003 9.25 n/a 25%B -2004 9.99 n/a 25%B -2005 6.72 n/a 5%, 20%B 1.922006 8.59 n/a 25%B -2007 11.62 n/a 20%B n/a2008 10.17 n/a 20%B n/a2009 12.88 n/a 22%B n/a2010 17.26 n/a 22%B n/a2011 12.13 n/a 23%B -2012 n/a n/a n/a n/a
Other Information of the Company:Listing Year 2004Market Category AElectronic Share Y
Share Percentage: Sponsor/Director 40.39
Institute 18.44
Public 41.17
Remark
1. 643,611,955 Revaluation reserve has been added to Reserve &Surplus. 2. The Face Value of the securities has been changed into TK 10. The No. of Shares, Market Lot, EPS, NAV and DPS have been changed accordingly
12 | P a g ePrepared by- Roll: 1555, 1559, 1664, 1665, 1666
Course: Invest ManagementCourse Teacher: Samia Islam
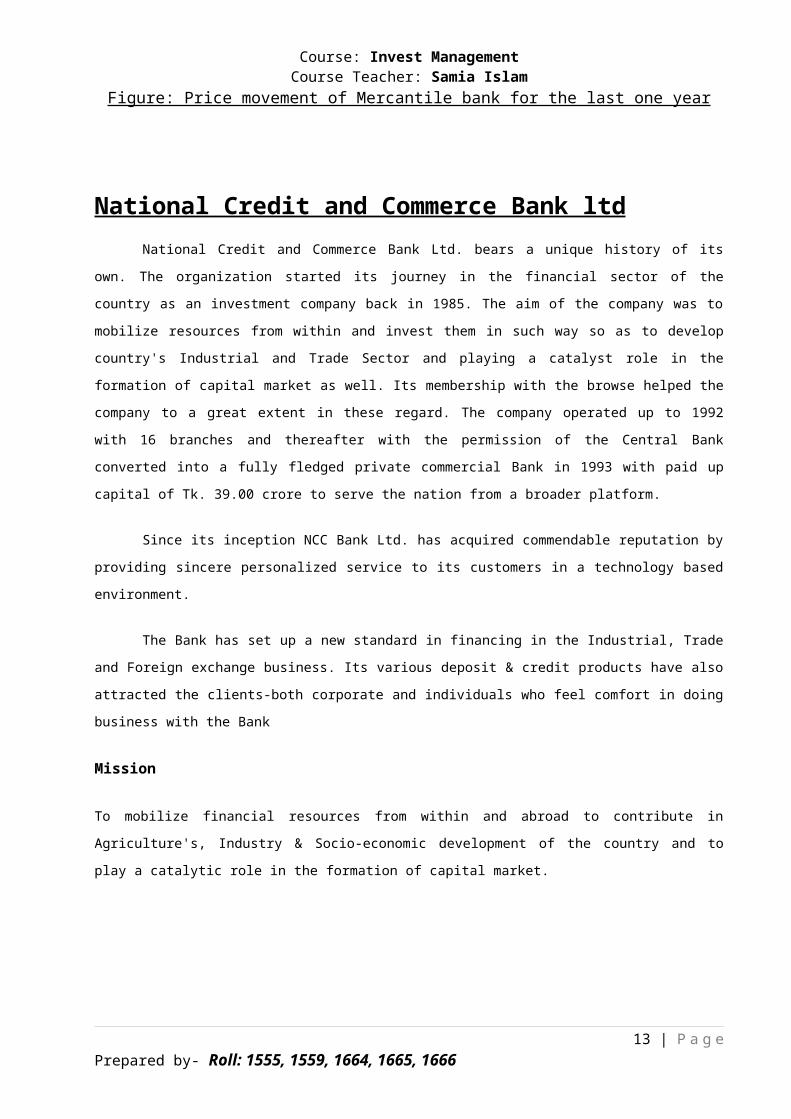
Figure: Price movement of Mercantile bank for the last one year
National Credit and Commerce Bank ltdNational Credit and Commerce Bank Ltd. bears a unique history of its
own. The organization started its journey in the financial sector of the
country as an investment company back in 1985. The aim of the company was to
mobilize resources from within and invest them in such way so as to develop
country's Industrial and Trade Sector and playing a catalyst role in the
formation of capital market as well. Its membership with the browse helped the
company to a great extent in these regard. The company operated up to 1992
with 16 branches and thereafter with the permission of the Central Bank
converted into a fully fledged private commercial Bank in 1993 with paid up
capital of Tk. 39.00 crore to serve the nation from a broader platform.
Since its inception NCC Bank Ltd. has acquired commendable reputation by
providing sincere personalized service to its customers in a technology based
environment.
The Bank has set up a new standard in financing in the Industrial, Trade
and Foreign exchange business. Its various deposit & credit products have also
attracted the clients-both corporate and individuals who feel comfort in doing
business with the Bank
Mission
To mobilize financial resources from within and abroad to contribute in
Agriculture's, Industry & Socio-economic development of the country and to
play a catalytic role in the formation of capital market.
13 | P a g ePrepared by- Roll: 1555, 1559, 1664, 1665, 1666
Course: Invest ManagementCourse Teacher: Samia Islam
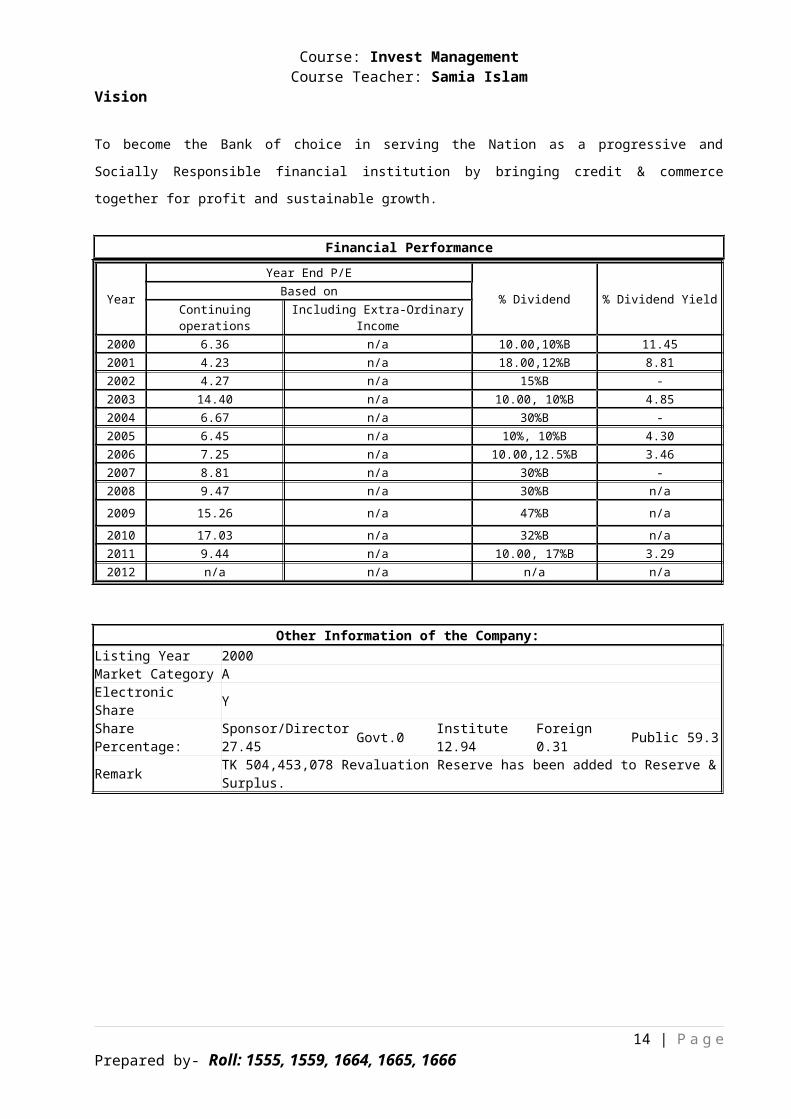
Vision
To become the Bank of choice in serving the Nation as a progressive and
Socially Responsible financial institution by bringing credit & commerce
together for profit and sustainable growth.
Financial Performance
Year
Year End P/E
% Dividend % Dividend YieldBased onContinuingoperations
Including Extra-OrdinaryIncome
2000 6.36 n/a 10.00,10%B 11.452001 4.23 n/a 18.00,12%B 8.812002 4.27 n/a 15%B -2003 14.40 n/a 10.00, 10%B 4.852004 6.67 n/a 30%B -2005 6.45 n/a 10%, 10%B 4.302006 7.25 n/a 10.00,12.5%B 3.462007 8.81 n/a 30%B -2008 9.47 n/a 30%B n/a2009 15.26 n/a 47%B n/a2010 17.03 n/a 32%B n/a2011 9.44 n/a 10.00, 17%B 3.292012 n/a n/a n/a n/a
Other Information of the Company:Listing Year 2000Market Category AElectronic Share Y
Share Percentage:
Sponsor/Director27.45 Govt.0 Institute
12.94Foreign 0.31 Public 59.3
Remark TK 504,453,078 Revaluation Reserve has been added to Reserve &Surplus.
14 | P a g ePrepared by- Roll: 1555, 1559, 1664, 1665, 1666
Course: Invest ManagementCourse Teacher: Samia Islam
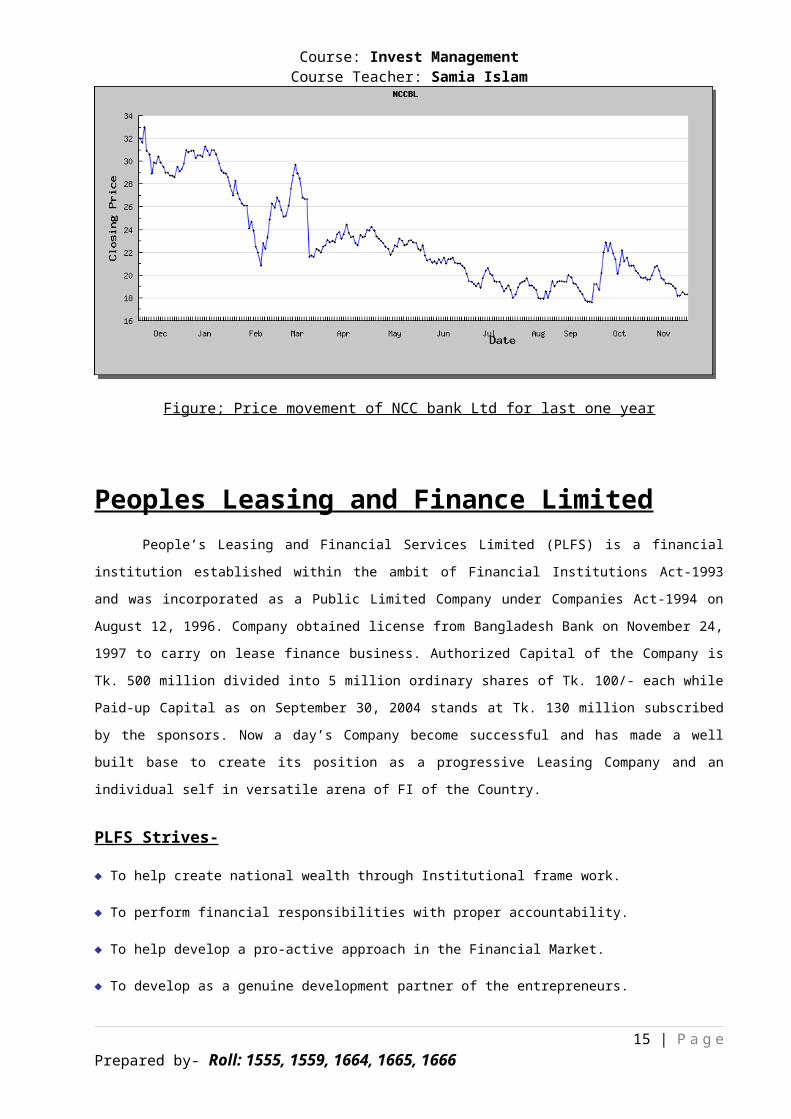
Figure; Price movement of NCC bank Ltd for last one year
Peoples Leasing and Finance LimitedPeople’s Leasing and Financial Services Limited (PLFS) is a financial
institution established within the ambit of Financial Institutions Act-1993
and was incorporated as a Public Limited Company under Companies Act-1994 on
August 12, 1996. Company obtained license from Bangladesh Bank on November 24,
1997 to carry on lease finance business. Authorized Capital of the Company is
Tk. 500 million divided into 5 million ordinary shares of Tk. 100/- each while
Paid-up Capital as on September 30, 2004 stands at Tk. 130 million subscribed
by the sponsors. Now a day’s Company become successful and has made a well
built base to create its position as a progressive Leasing Company and an
individual self in versatile arena of FI of the Country.
PLFS Strives-
♦ To help create national wealth through Institutional frame work.
♦ To perform financial responsibilities with proper accountability.
♦ To help develop a pro-active approach in the Financial Market.
♦ To develop as a genuine development partner of the entrepreneurs.
15 | P a g ePrepared by- Roll: 1555, 1559, 1664, 1665, 1666
Course: Invest ManagementCourse Teacher: Samia Islam
♦ To achieve organizational excellence through sound Human Resource Management(HRM).
♦ To develop a mutual cooperation of high quality and strategically balanced portfolio in the Financial Market.
♦ To mobilize various sources of fund for its marketing operations.
♦ To develop and provide a wide range of financial services to the customers.
♦ To ensure good Corporate Governance and sound human relations practices.
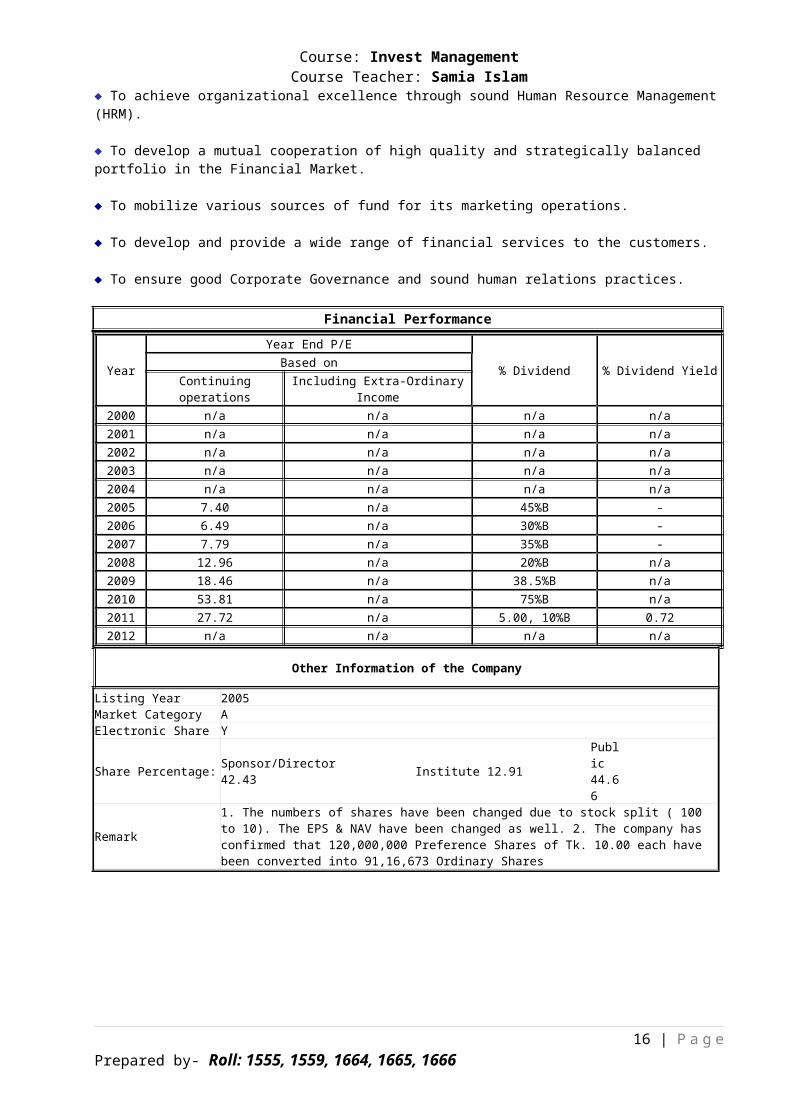
Financial Performance
Year
Year End P/E
% Dividend % Dividend YieldBased onContinuingoperations
Including Extra-OrdinaryIncome
2000 n/a n/a n/a n/a2001 n/a n/a n/a n/a2002 n/a n/a n/a n/a2003 n/a n/a n/a n/a2004 n/a n/a n/a n/a2005 7.40 n/a 45%B -2006 6.49 n/a 30%B -2007 7.79 n/a 35%B -2008 12.96 n/a 20%B n/a2009 18.46 n/a 38.5%B n/a2010 53.81 n/a 75%B n/a2011 27.72 n/a 5.00, 10%B 0.722012 n/a n/a n/a n/a
Other Information of the Company
Listing Year 2005Market Category AElectronic Share Y
Share Percentage: Sponsor/Director 42.43 Institute 12.91
Public 44.66
Remark
1. The numbers of shares have been changed due to stock split ( 100 to 10). The EPS & NAV have been changed as well. 2. The company has confirmed that 120,000,000 Preference Shares of Tk. 10.00 each have been converted into 91,16,673 Ordinary Shares
16 | P a g ePrepared by- Roll: 1555, 1559, 1664, 1665, 1666
Course: Invest ManagementCourse Teacher: Samia Islam
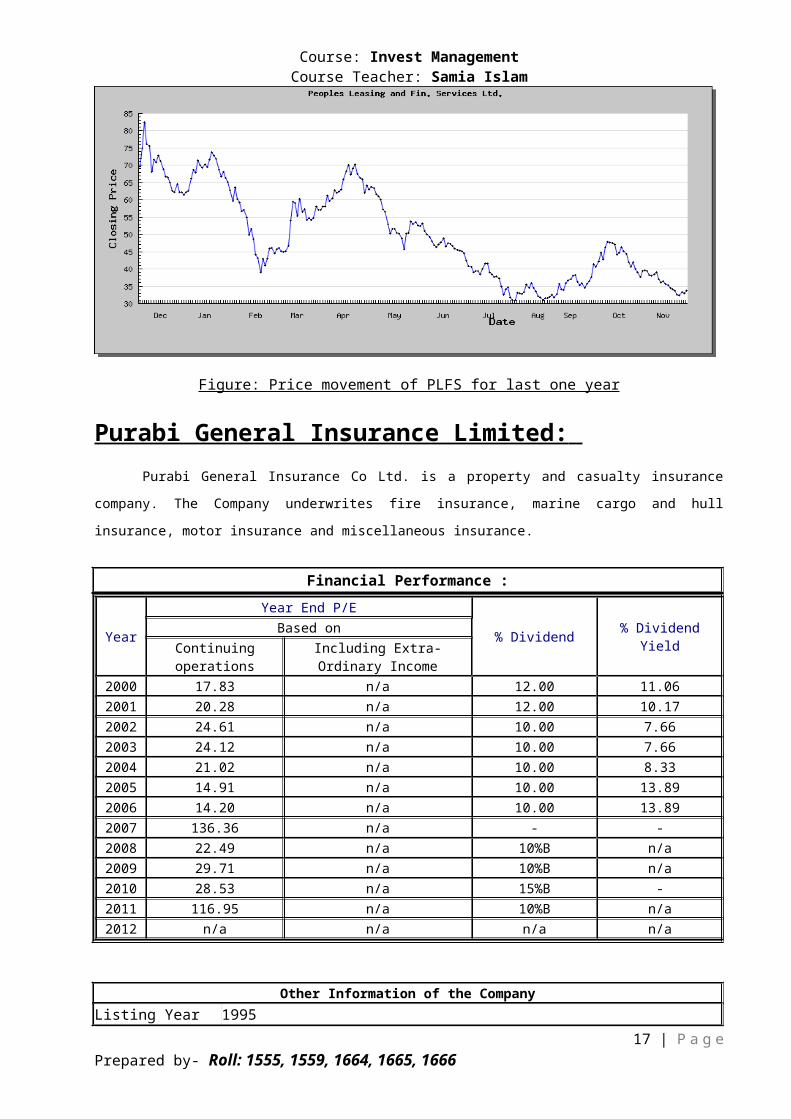
Figure: Price movement of PLFS for last one year
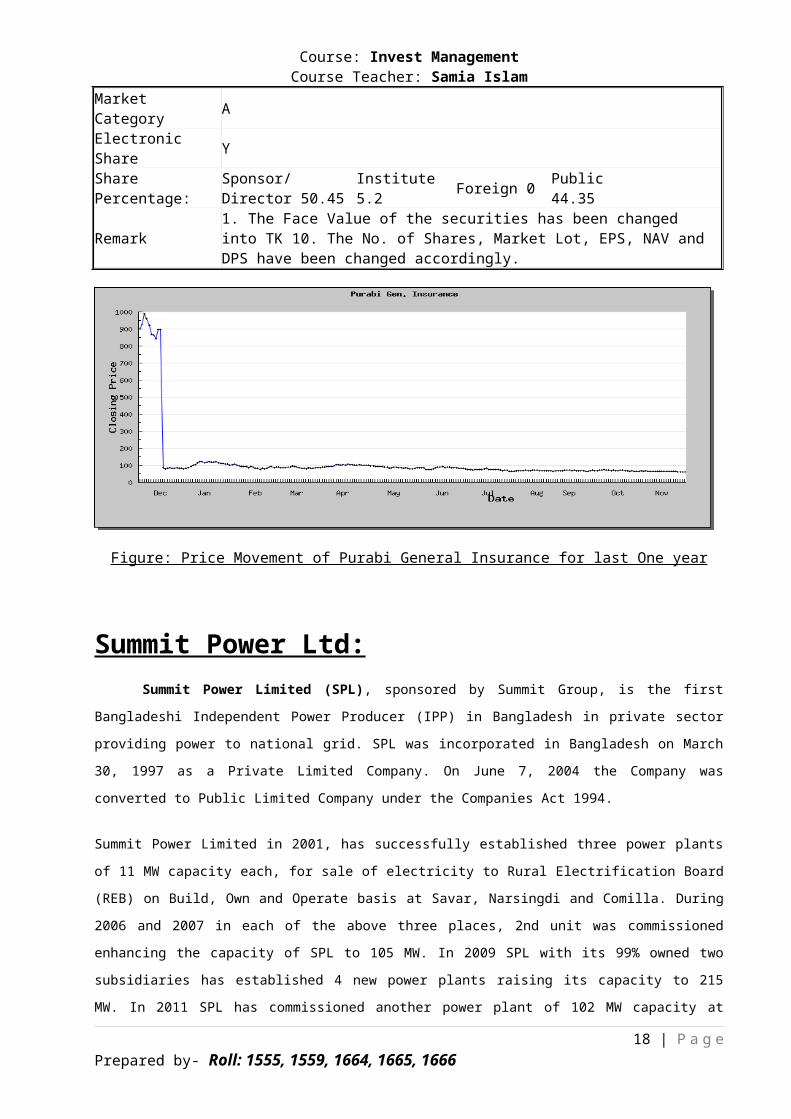
Purabi General Insurance Limited: Purabi General Insurance Co Ltd. is a property and casualty insurance
company. The Company underwrites fire insurance, marine cargo and hull
insurance, motor insurance and miscellaneous insurance.
Financial Performance :
Year
Year End P/E
% Dividend % DividendYield
Based onContinuingoperations
Including Extra-Ordinary Income
2000 17.83 n/a 12.00 11.062001 20.28 n/a 12.00 10.172002 24.61 n/a 10.00 7.662003 24.12 n/a 10.00 7.662004 21.02 n/a 10.00 8.332005 14.91 n/a 10.00 13.892006 14.20 n/a 10.00 13.892007 136.36 n/a - -2008 22.49 n/a 10%B n/a2009 29.71 n/a 10%B n/a2010 28.53 n/a 15%B -2011 116.95 n/a 10%B n/a2012 n/a n/a n/a n/a
Other Information of the CompanyListing Year 1995
17 | P a g ePrepared by- Roll: 1555, 1559, 1664, 1665, 1666
Course: Invest ManagementCourse Teacher: Samia Islam
Market Category A
Electronic Share Y
Share Percentage:
Sponsor/Director 50.45
Institute 5.2 Foreign 0 Public
44.35
Remark1. The Face Value of the securities has been changed into TK 10. The No. of Shares, Market Lot, EPS, NAV and DPS have been changed accordingly.
Figure: Price Movement of Purabi General Insurance for last One year
Summit Power Ltd:Summit Power Limited (SPL), sponsored by Summit Group, is the first
Bangladeshi Independent Power Producer (IPP) in Bangladesh in private sector
providing power to national grid. SPL was incorporated in Bangladesh on March
30, 1997 as a Private Limited Company. On June 7, 2004 the Company was
converted to Public Limited Company under the Companies Act 1994.
Summit Power Limited in 2001, has successfully established three power plants
of 11 MW capacity each, for sale of electricity to Rural Electrification Board
(REB) on Build, Own and Operate basis at Savar, Narsingdi and Comilla. During
2006 and 2007 in each of the above three places, 2nd unit was commissioned
enhancing the capacity of SPL to 105 MW. In 2009 SPL with its 99% owned two
subsidiaries has established 4 new power plants raising its capacity to 215
MW. In 2011 SPL has commissioned another power plant of 102 MW capacity at
18 | P a g ePrepared by- Roll: 1555, 1559, 1664, 1665, 1666
Course: Invest ManagementCourse Teacher: Samia Islam
Narayanganj under Summit Narayanganj Power Limited, where SPL has 55%
ownership.
In the year 2011 Summit Power Limited has consolidated its position
further by acquiring 53,955,326 numbers of ordinary shares of Khulna Power
Company Limited (KPCL). It gives SPL the status of 18.7% of the ownership of
KPCL and with that status an additional capacity of 50 MW (approximately) has
been added with that of SPL being the total capacity of 367 MW.
Considering the immense opportunities, the company is striving to
establish more power plants around the country. The fast-growing company has
set a mission to expand the company with a power generation capacity to the
tune of 1000 MW, which is a modest 20% of the electricity requirement in
Bangladesh.
Objectives
• Generate and provide uninterrupted reasonably priced electricity to our
customers.
• Efficient utilization of capital, machines, material and human resources.
• Continuous improvement of customer satisfaction and resource management.
Vision
To provide quality & uninterrupted electricity to the vast majority of rural
Bangladesh for their personal, social & economic development.
Mission
"Empowering Bangladesh, we can & we will." To expand the company into a power
generation capacity to the tune of 1000 MW which is 20% of the electricity
requirement of Bangladesh and maintain that level.
Information of the Company:Listing Year 2005Market Category AElectronic Share YShare Percentage: Sponsor/Director Govt.0 Institute Foreign 0.61 Public 19.01
19 | P a g ePrepared by- Roll: 1555, 1559, 1664, 1665, 1666
Course: Invest ManagementCourse Teacher: Samia Islam
51.37 29.01
Remark
1. TK 794,231,503 Revaluation Surplus has been added to Reserve. 2. No. of Share has been changed due to stock split.NAV & EPS have also been changed. 3. The paid up capital of the company has been increased by 3,000,000,000 Preference shares converting into 25,361,973 ordinary shares. 4. EPS for 2010 is calculated based on weighted average no. of shares.
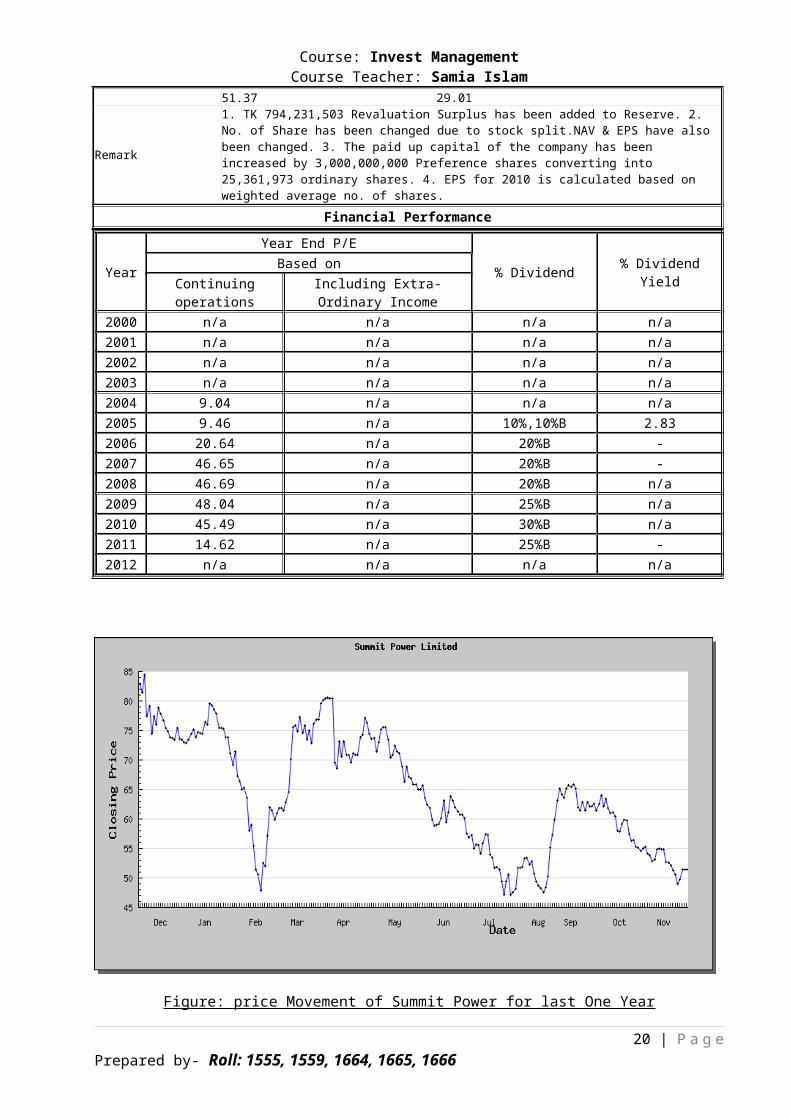
Financial Performance
Year
Year End P/E
% Dividend % DividendYield
Based onContinuingoperations
Including Extra-Ordinary Income
2000 n/a n/a n/a n/a2001 n/a n/a n/a n/a2002 n/a n/a n/a n/a2003 n/a n/a n/a n/a2004 9.04 n/a n/a n/a2005 9.46 n/a 10%,10%B 2.832006 20.64 n/a 20%B -2007 46.65 n/a 20%B -2008 46.69 n/a 20%B n/a2009 48.04 n/a 25%B n/a2010 45.49 n/a 30%B n/a2011 14.62 n/a 25%B -2012 n/a n/a n/a n/a
Figure: price Movement of Summit Power for last One Year
20 | P a g ePrepared by- Roll: 1555, 1559, 1664, 1665, 1666
Course: Invest ManagementCourse Teacher: Samia Islam
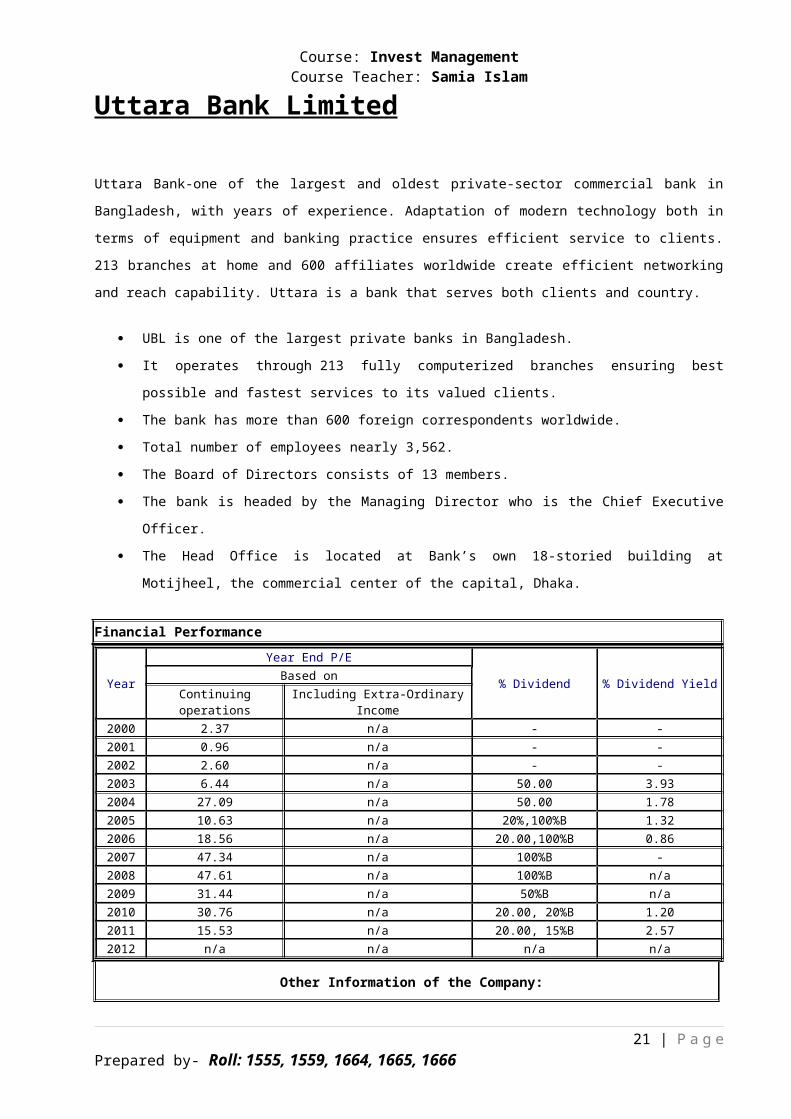
Uttara Bank Limited
Uttara Bank-one of the largest and oldest private-sector commercial bank in
Bangladesh, with years of experience. Adaptation of modern technology both in
terms of equipment and banking practice ensures efficient service to clients.
213 branches at home and 600 affiliates worldwide create efficient networking
and reach capability. Uttara is a bank that serves both clients and country.
UBL is one of the largest private banks in Bangladesh.
It operates through 213 fully computerized branches ensuring best
possible and fastest services to its valued clients.
The bank has more than 600 foreign correspondents worldwide.
Total number of employees nearly 3,562.
The Board of Directors consists of 13 members.
The bank is headed by the Managing Director who is the Chief Executive
Officer.
The Head Office is located at Bank’s own 18-storied building at
Motijheel, the commercial center of the capital, Dhaka.
Financial Performance
Year
Year End P/E
% Dividend % Dividend YieldBased onContinuingoperations
Including Extra-OrdinaryIncome
2000 2.37 n/a - -2001 0.96 n/a - -2002 2.60 n/a - -2003 6.44 n/a 50.00 3.932004 27.09 n/a 50.00 1.782005 10.63 n/a 20%,100%B 1.322006 18.56 n/a 20.00,100%B 0.862007 47.34 n/a 100%B -2008 47.61 n/a 100%B n/a2009 31.44 n/a 50%B n/a2010 30.76 n/a 20.00, 20%B 1.202011 15.53 n/a 20.00, 15%B 2.572012 n/a n/a n/a n/a
Other Information of the Company:
21 | P a g ePrepared by- Roll: 1555, 1559, 1664, 1665, 1666
Course: Invest ManagementCourse Teacher: Samia Islam
Listing Year 1984Market Category AElectronic Share Y
Share Percentage: Sponsor/Director 10.23 Govt.0 Institute
8.65 Foreign 0 Public 81.12
Remark
1. TK 1,631,599,235 Revaluation Reserve has been added to Reserve & Surplus. 2. Government nominates the first eight directors and there is no obligation for nominated directors to own shares in his/her ownname. 3. The Number of Shares have been changed due to Stock Split (100 TO 10). The EPS & NAV have also been changed.
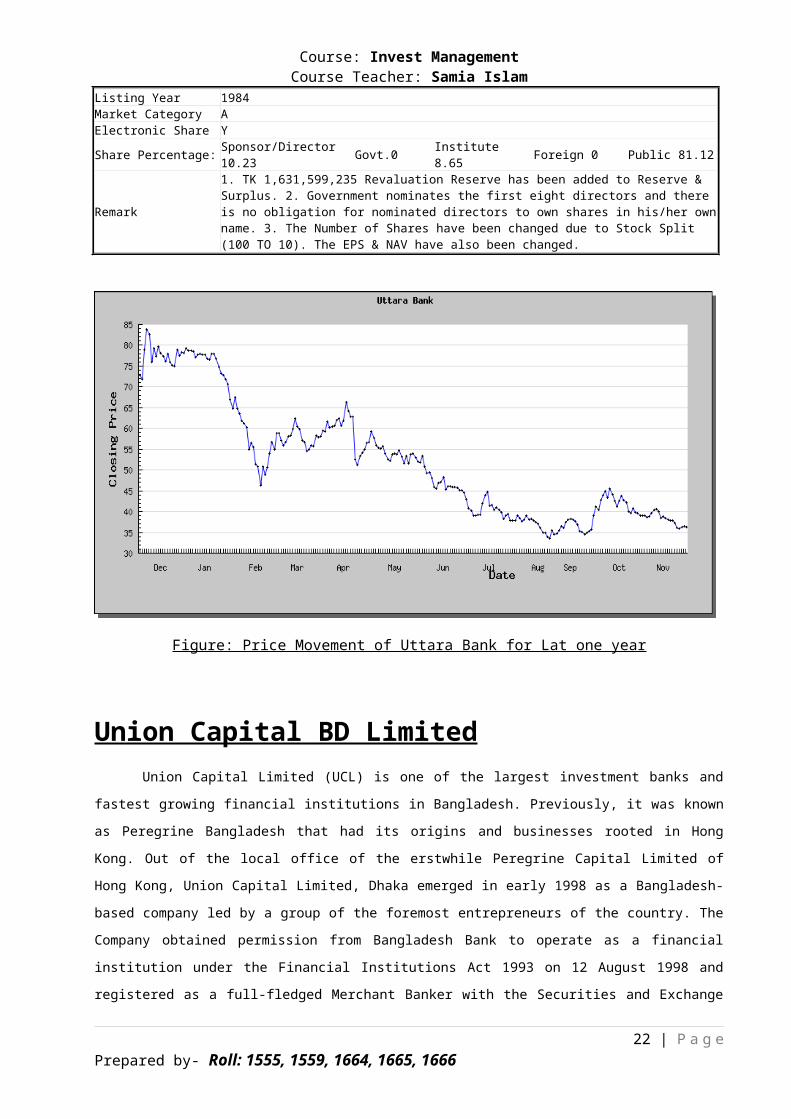
Figure: Price Movement of Uttara Bank for Lat one year
Union Capital BD LimitedUnion Capital Limited (UCL) is one of the largest investment banks and
fastest growing financial institutions in Bangladesh. Previously, it was known
as Peregrine Bangladesh that had its origins and businesses rooted in Hong
Kong. Out of the local office of the erstwhile Peregrine Capital Limited of
Hong Kong, Union Capital Limited, Dhaka emerged in early 1998 as a Bangladesh-
based company led by a group of the foremost entrepreneurs of the country. The
Company obtained permission from Bangladesh Bank to operate as a financial
institution under the Financial Institutions Act 1993 on 12 August 1998 and
registered as a full-fledged Merchant Banker with the Securities and Exchange
22 | P a g ePrepared by- Roll: 1555, 1559, 1664, 1665, 1666
Course: Invest ManagementCourse Teacher: Samia Islam
Commission on April 10, 2002. The Company went for Initial Public Offering in
May 2007 and listed it shares in both Dhaka and Chittagong Stock Exchanges in
July 2007.
Since inception, Union Capital Limited has been engaged in the
development of country's financial and capital market. The Company within a
short span of time has proved its worth as a most forward-working vigorous
organization achieving success with its wide network and strong local base.
Listed on both the Dhaka and Chittagong Stock Exchange, Union Capital
limited is an integrated financial service provider offering comprehensive
range of products and services in our local market.Union Capital’s core
competencies cover Lease Finance, Term Finance, SME Finance, Public Issue of
Shares, Portfolio Management, Margin Loan, Fund Raising, Corporate
Restructuring, Share Trading, Advisory Service, Deposit Management and many
more.We believe that we can best provide the service our customers need by
utilizing the strengths of our people combining our diversified services-
continuing to set the standard for our industry.
Other Information of the Company:Listing Year 2007Market Category AElectronic Share Y
Share Percentage:
Sponsor/Director59
Institute 17 Foreign 0
Public 24
Remark TK 505,500,000 Revaluation Reserve has been added to Reserve &Surplus.
Financial Performance
Year
Year End P/E
% Dividend % DividendYield
Based onContinuingoperations
Including Extra-Ordinary Income
2000 n/a n/a n/a n/a2001 n/a n/a n/a n/a2002 n/a n/a n/a n/a2003 n/a n/a n/a n/a
23 | P a g ePrepared by- Roll: 1555, 1559, 1664, 1665, 1666
Security Character of ChosenSecurities
Course: Invest ManagementCourse Teacher: Samia Islam
2004 n/a n/a n/a n/a2005 n/a n/a n/a n/a2006 n/a n/a n/a n/a2007 18.65 n/a 30%B -2008 57.62 n/a 20%B n/a2009 42.07 n/a 30%B n/a2010 41.13 n/a 75%B n/a2011 35.59 n/a 10.00, 10%B 1.652012 n/a n/a n/a n/a
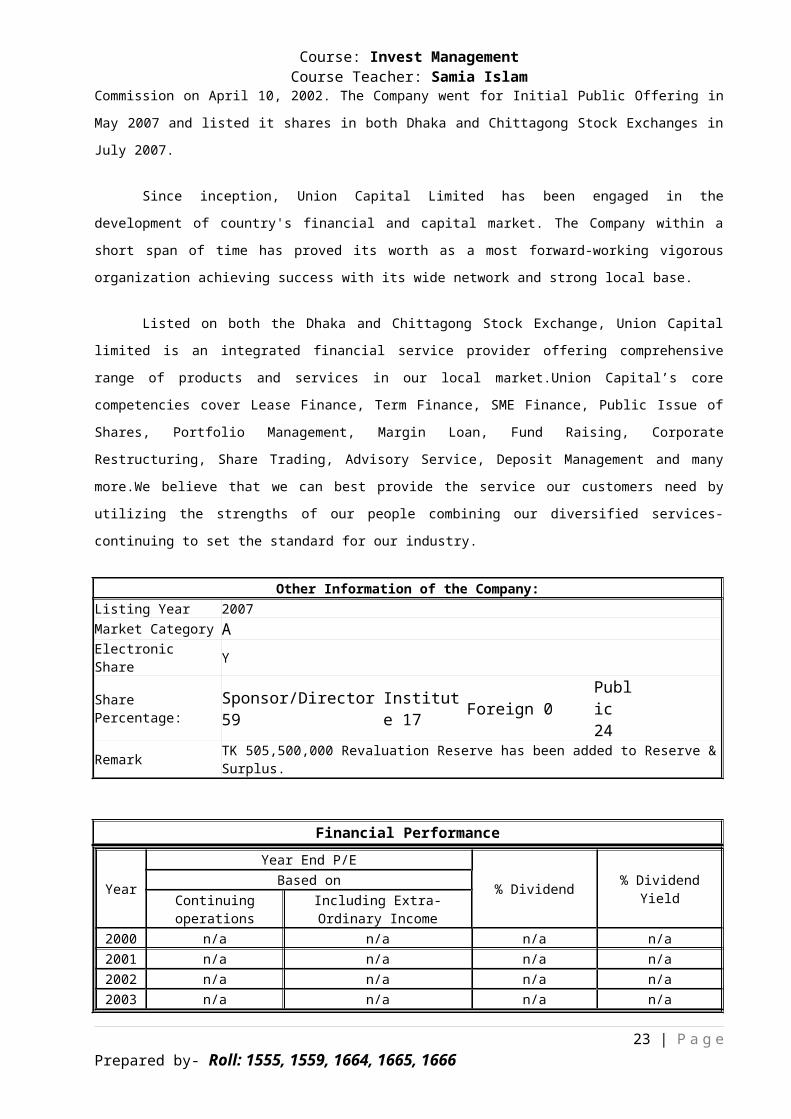
Figure: The price movement of Union Capital For Last One Year
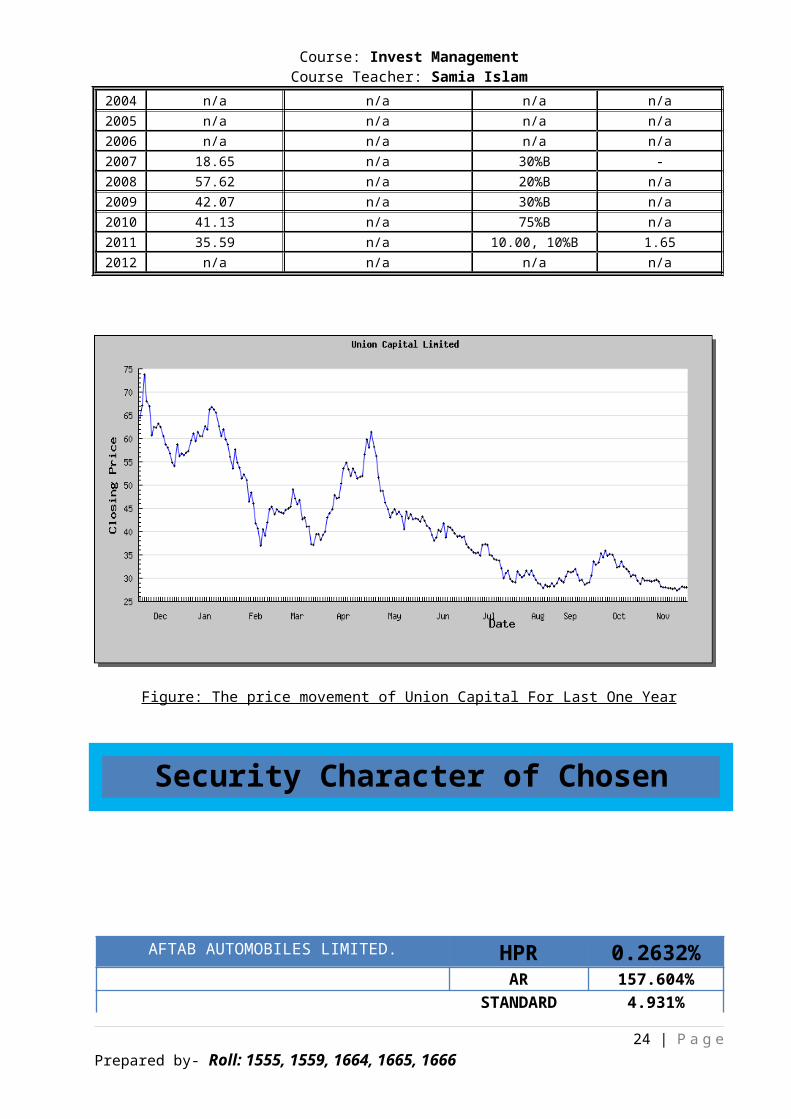
AFTAB AUTOMOBILES LIMITED. HPR 0.2632%AR 157.604%
STANDARD 4.931%
24 | P a g ePrepared by- Roll: 1555, 1559, 1664, 1665, 1666
Course: Invest ManagementCourse Teacher: Samia Islam
DEVIATIONVARIANCE 0.243%
-15.000%-10.000% -5.000% 0.000% 5.000% 10.000% 15.000% 20.000% 25.000%
-0.40000
-0.30000
-0.20000
-0.10000
0.00000
0.10000
0.20000
0.30000
0.40000
0.50000
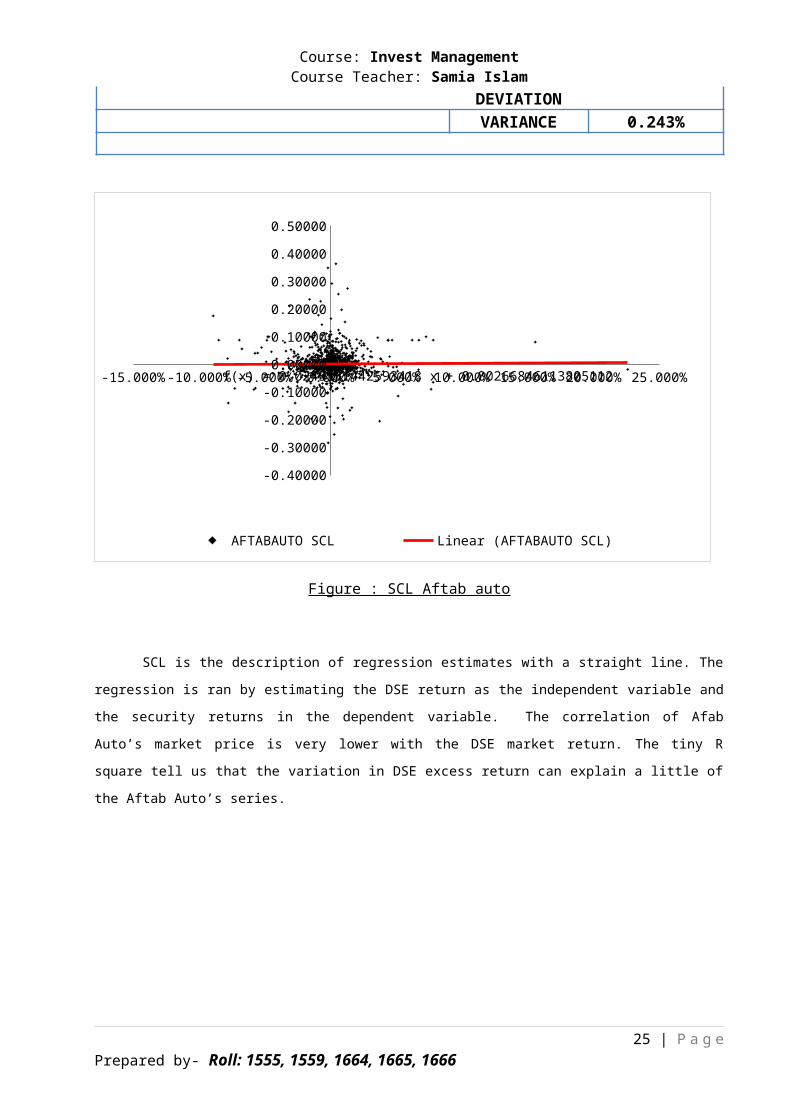
f(x) = 0.0243131442593418 x + 0.00266846113805112
AFTABAUTO SCL Linear (AFTABAUTO SCL)
Figure : SCL Aftab auto
SCL is the description of regression estimates with a straight line. The
regression is ran by estimating the DSE return as the independent variable and
the security returns in the dependent variable. The correlation of Afab
Auto’s market price is very lower with the DSE market return. The tiny R
square tell us that the variation in DSE excess return can explain a little of
the Aftab Auto’s series.
25 | P a g ePrepared by- Roll: 1555, 1559, 1664, 1665, 1666
Course: Invest ManagementCourse Teacher: Samia Islam
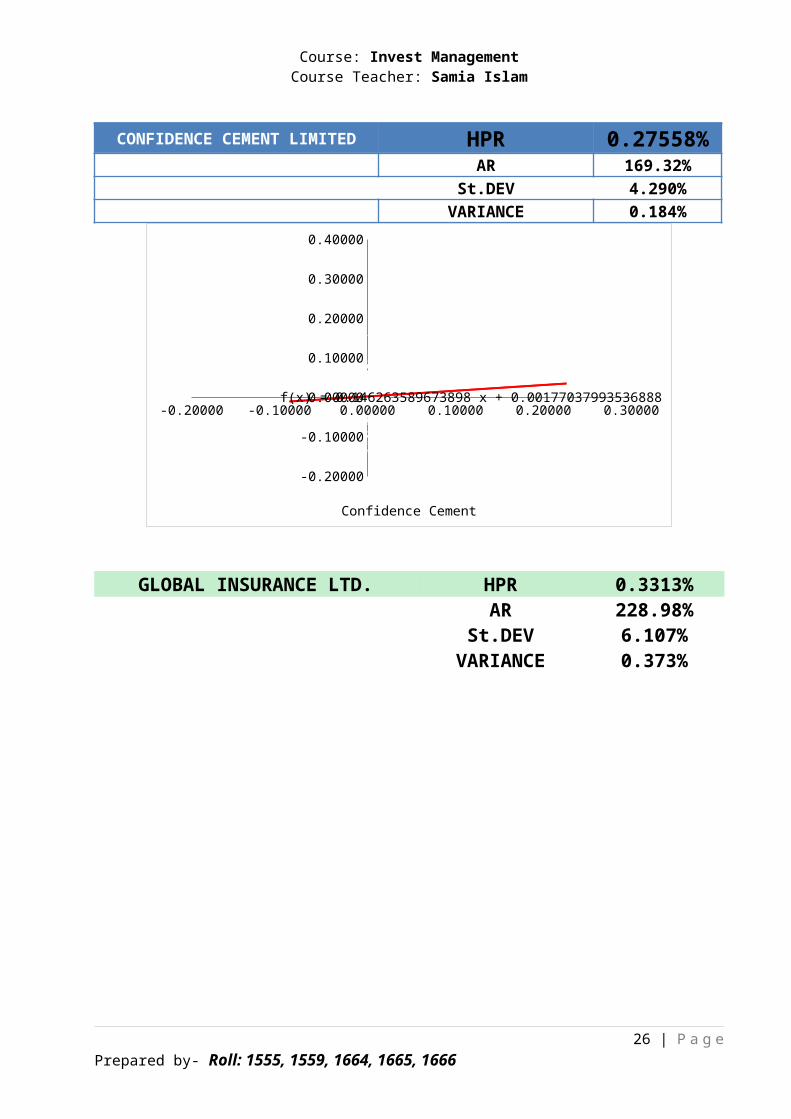
CONFIDENCE CEMENT LIMITED HPR 0.27558%AR 169.32%
St.DEV 4.290%VARIANCE 0.184%
-0.20000 -0.10000 0.00000 0.10000 0.20000 0.30000
-0.20000
-0.10000
0.00000
0.10000
0.20000
0.30000
0.40000
f(x) = 0.146263589673898 x + 0.00177037993536888
Confidence Cement
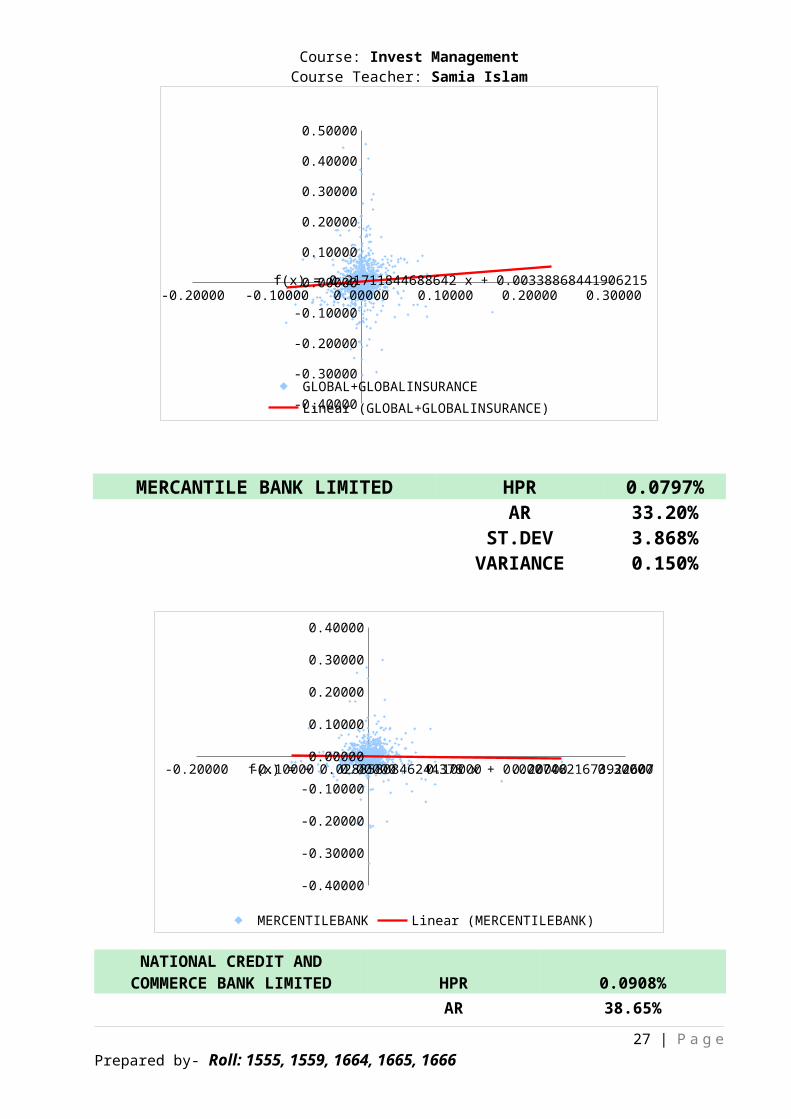
GLOBAL INSURANCE LTD. HPR 0.3313%AR 228.98%
St.DEV 6.107%VARIANCE 0.373%
26 | P a g ePrepared by- Roll: 1555, 1559, 1664, 1665, 1666
Course: Invest ManagementCourse Teacher: Samia Islam
-0.20000 -0.10000 0.00000 0.10000 0.20000 0.30000
-0.40000
-0.30000
-0.20000
-0.10000
0.00000
0.10000
0.20000
0.30000
0.40000
0.50000
f(x) = 0.21711844688642 x + 0.00338868441906215
GLOBAL+GLOBALINSURANCELinear (GLOBAL+GLOBALINSURANCE)
MERCANTILE BANK LIMITED HPR 0.0797%AR 33.20%
ST.DEV 3.868%VARIANCE 0.150%
-0.20000 -0.10000 0.00000 0.10000 0.20000 0.30000
-0.40000
-0.30000
-0.20000
-0.10000
0.00000
0.10000
0.20000
0.30000
0.40000
f(x) = − 0.0288580846244378 x + 0.00074621673922607
MERCENTILEBANK Linear (MERCENTILEBANK)
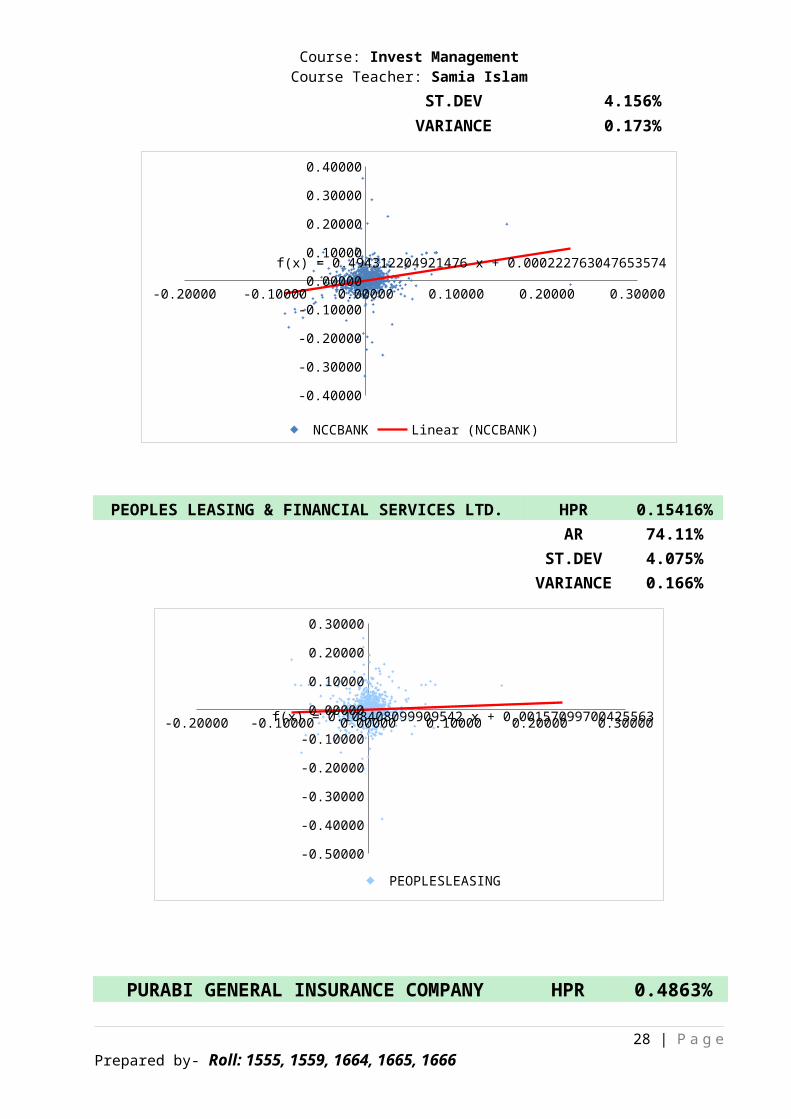
NATIONAL CREDIT ANDCOMMERCE BANK LIMITED HPR 0.0908%
AR 38.65%27 | P a g e
Prepared by- Roll: 1555, 1559, 1664, 1665, 1666
Course: Invest ManagementCourse Teacher: Samia Islam
ST.DEV 4.156%VARIANCE 0.173%
-0.20000 -0.10000 0.00000 0.10000 0.20000 0.30000
-0.40000
-0.30000
-0.20000
-0.10000
0.00000
0.10000
0.20000
0.30000
0.40000
f(x) = 0.494312204921476 x + 0.000222763047653574
NCCBANK Linear (NCCBANK)
PEOPLES LEASING & FINANCIAL SERVICES LTD. HPR 0.15416%AR 74.11%
ST.DEV 4.075%VARIANCE 0.166%
-0.20000 -0.10000 0.00000 0.10000 0.20000 0.30000
-0.50000
-0.40000
-0.30000
-0.20000
-0.10000
0.00000
0.10000
0.20000
0.30000
f(x) = 0.108408099909542 x + 0.00157099700425563
PEOPLESLEASING
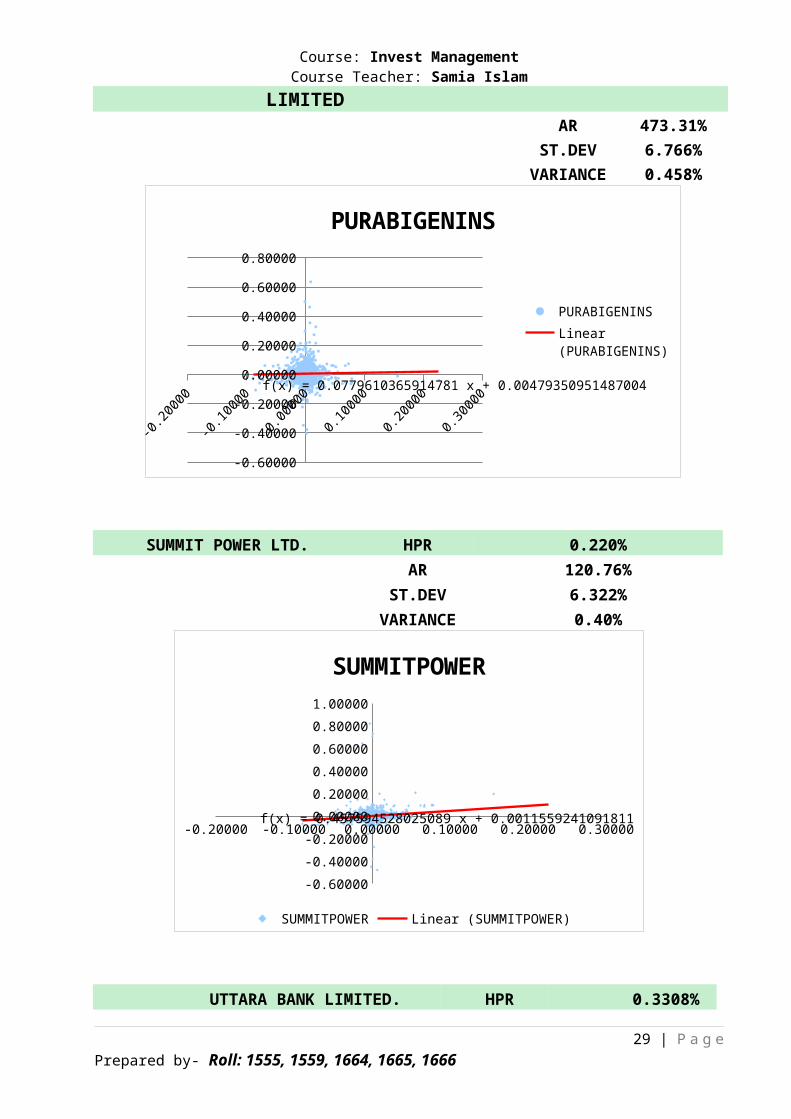
PURABI GENERAL INSURANCE COMPANY HPR 0.4863%
28 | P a g ePrepared by- Roll: 1555, 1559, 1664, 1665, 1666
Course: Invest ManagementCourse Teacher: Samia Islam
LIMITEDAR 473.31%
ST.DEV 6.766%VARIANCE 0.458%
-0.60000
-0.40000
-0.20000
0.00000
0.20000
0.40000
0.60000
0.80000
f(x) = 0.0779610365914781 x + 0.00479350951487004
PURABIGENINS
PURABIGENINSLinear (PURABIGENINS)
SUMMIT POWER LTD. HPR 0.220%AR 120.76%
ST.DEV 6.322%VARIANCE 0.40%
-0.20000 -0.10000 0.00000 0.10000 0.20000 0.30000
-0.60000-0.40000-0.200000.000000.200000.400000.600000.800001.00000
f(x) = 0.457594528025089 x + 0.0011559241091811
SUMMITPOWER
SUMMITPOWER Linear (SUMMITPOWER)
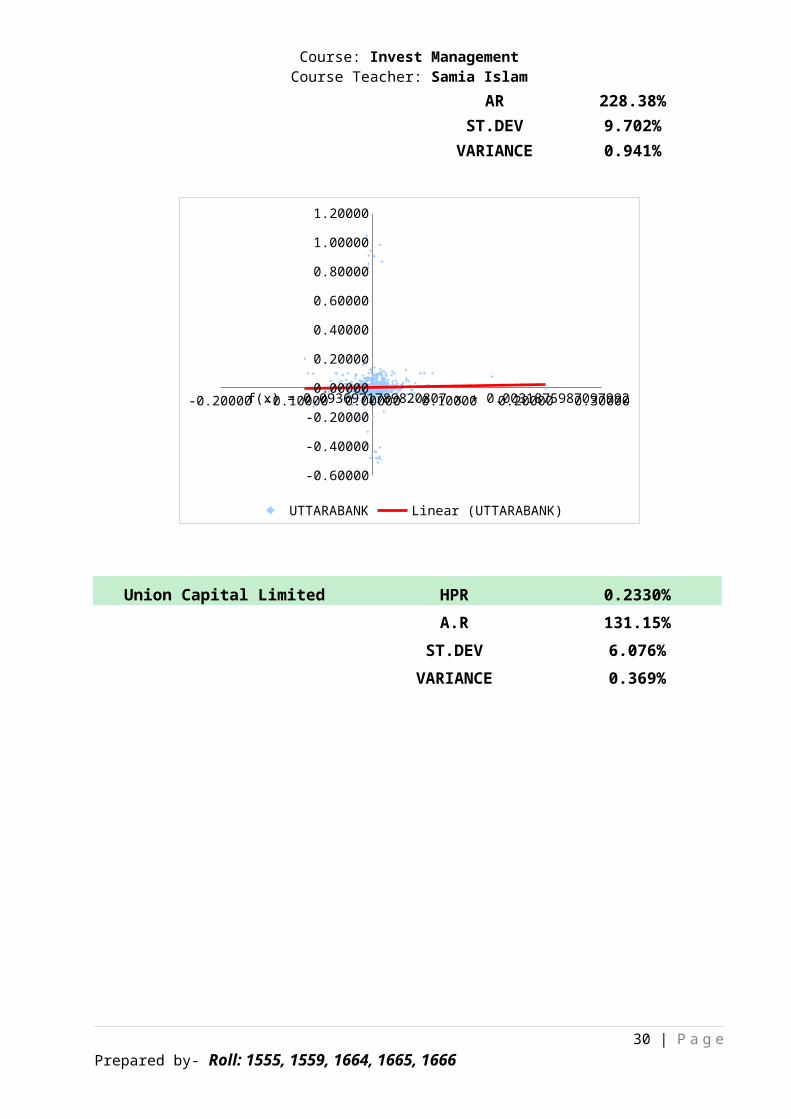
UTTARA BANK LIMITED. HPR 0.3308%
29 | P a g ePrepared by- Roll: 1555, 1559, 1664, 1665, 1666
Course: Invest ManagementCourse Teacher: Samia Islam
AR 228.38%ST.DEV 9.702%VARIANCE 0.941%
-0.20000 -0.10000 0.00000 0.10000 0.20000 0.30000
-0.60000
-0.40000
-0.20000
0.00000
0.20000
0.40000
0.60000
0.80000
1.00000
1.20000
f(x) = 0.0936971789820807 x + 0.0031875987097992
UTTARABANK Linear (UTTARABANK)
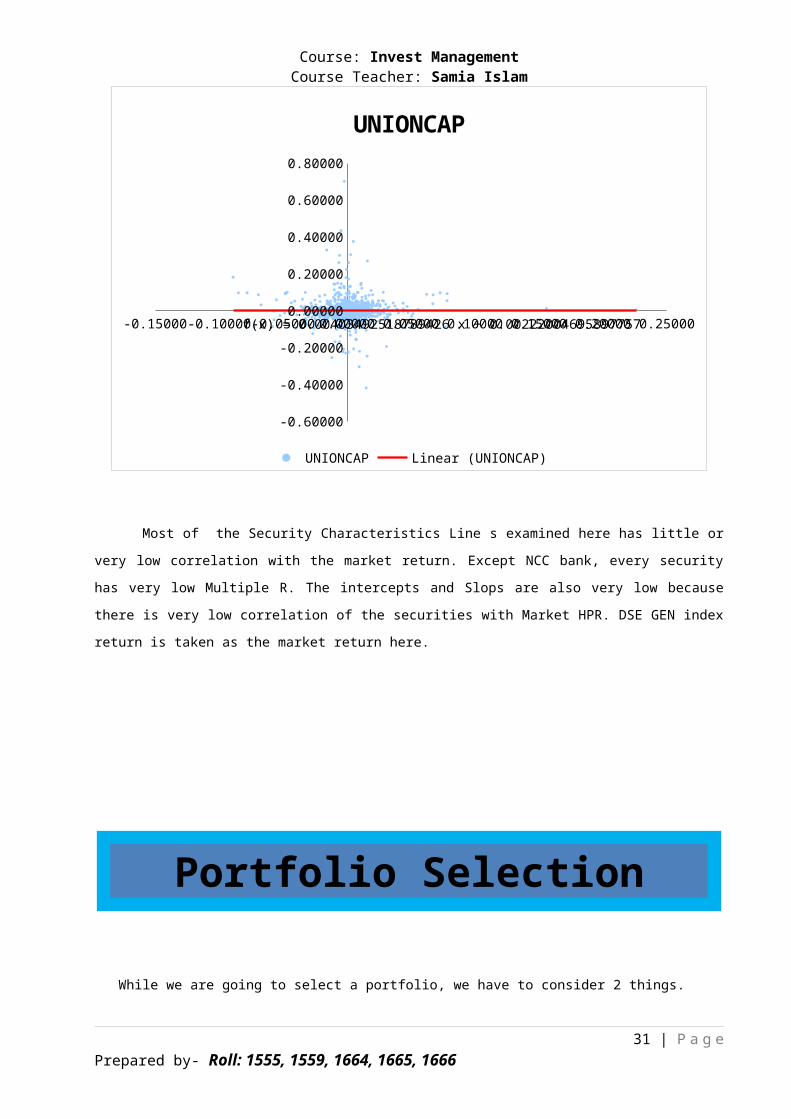
Union Capital Limited HPR 0.2330%A.R 131.15%
ST.DEV 6.076%VARIANCE 0.369%
30 | P a g ePrepared by- Roll: 1555, 1559, 1664, 1665, 1666
Portfolio Selection
Course: Invest ManagementCourse Teacher: Samia Islam
-0.15000-0.10000-0.05000 0.00000 0.05000 0.10000 0.15000 0.20000 0.25000
-0.60000
-0.40000
-0.20000
0.00000
0.20000
0.40000
0.60000
0.80000
f(x) = 0.00403492518789426 x + 0.00222004695897757
UNIONCAP
UNIONCAP Linear (UNIONCAP)
Most of the Security Characteristics Line s examined here has little or
very low correlation with the market return. Except NCC bank, every security
has very low Multiple R. The intercepts and Slops are also very low because
there is very low correlation of the securities with Market HPR. DSE GEN index
return is taken as the market return here.
While we are going to select a portfolio, we have to consider 2 things.
31 | P a g ePrepared by- Roll: 1555, 1559, 1664, 1665, 1666
Course: Invest ManagementCourse Teacher: Samia Islam
1. The securities are negatively correlated
2. The RTV of the securities are highest or comparatively higher.
The negatively correlated securities are chosen for the well equipped
diversification of the portfolio. When the securities are negatively
correlated, then the risk of the securities are get lower. Negatively
correlated securities diversify the investment risk.
The securities with the highest RTV brigs the highest return in associate
with the higher risks. So, investment in the securities with higher RTV and
could be diversified by investing in the securities with negative correlation.
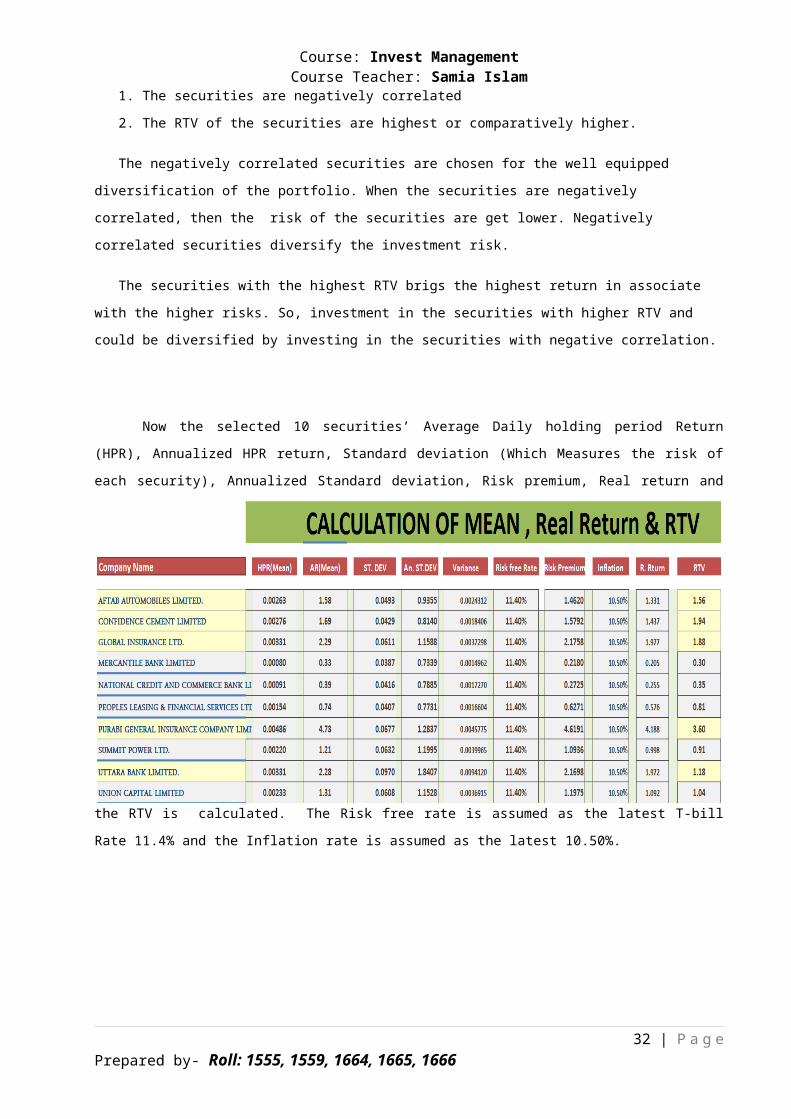
Now the selected 10 securities’ Average Daily holding period Return
(HPR), Annualized HPR return, Standard deviation (Which Measures the risk of
each security), Annualized Standard deviation, Risk premium, Real return and
the RTV is calculated. The Risk free rate is assumed as the latest T-bill
Rate 11.4% and the Inflation rate is assumed as the latest 10.50%.
32 | P a g ePrepared by- Roll: 1555, 1559, 1664, 1665, 1666
Course: Invest ManagementCourse Teacher: Samia Islam
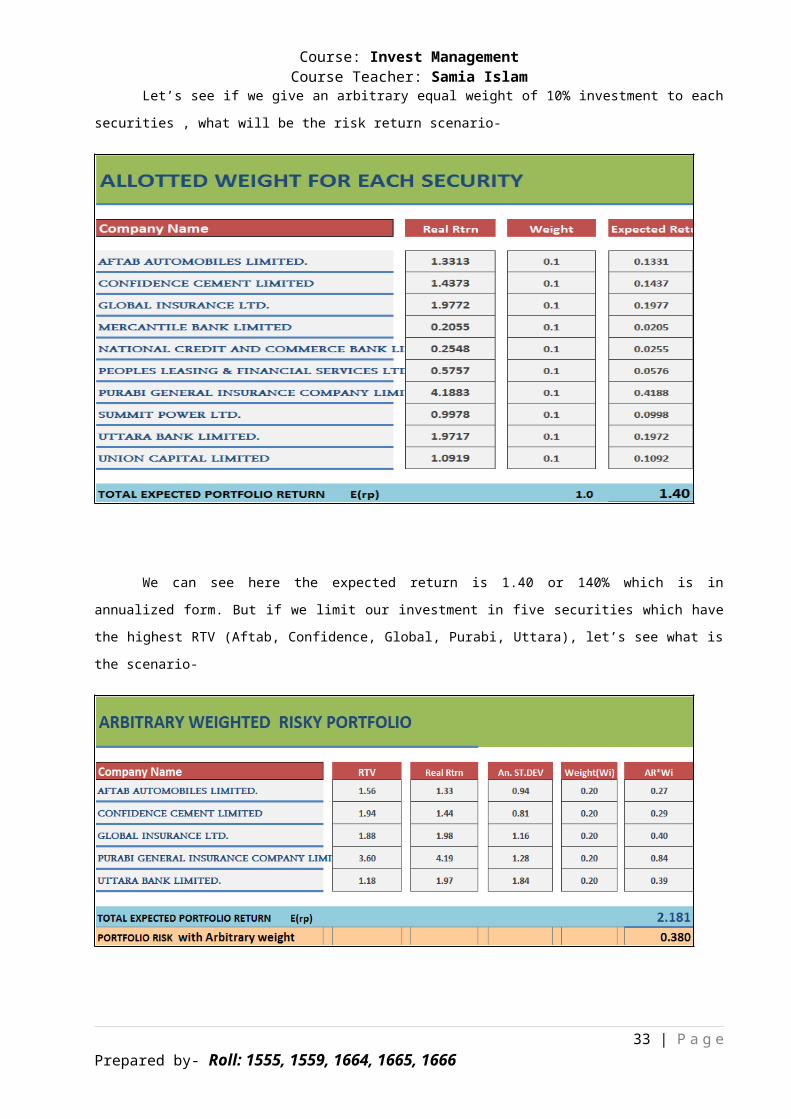
Let’s see if we give an arbitrary equal weight of 10% investment to each
securities , what will be the risk return scenario-
We can see here the expected return is 1.40 or 140% which is in
annualized form. But if we limit our investment in five securities which have
the highest RTV (Aftab, Confidence, Global, Purabi, Uttara), let’s see what is
the scenario-
33 | P a g ePrepared by- Roll: 1555, 1559, 1664, 1665, 1666

Course: Invest ManagementCourse Teacher: Samia Islam
We can see here the return goes higher than that of investing in 10
securities. This is made with an arbitrary equal weight of investment. The
portfolio risk is 38% and the return is 218.1%
34 | P a g ePrepared by- Roll: 1555, 1559, 1664, 1665, 1666
Course: Invest ManagementCourse Teacher: Samia Islam
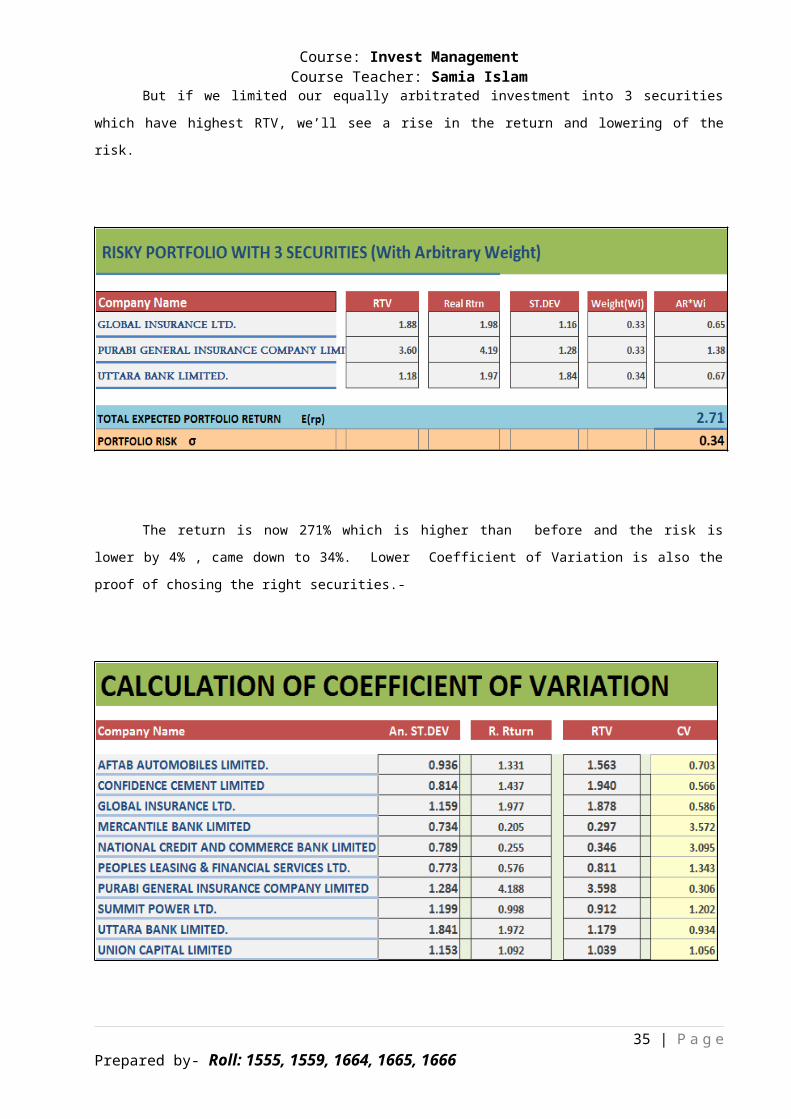
But if we limited our equally arbitrated investment into 3 securities
which have highest RTV, we’ll see a rise in the return and lowering of the
risk.
The return is now 271% which is higher than before and the risk is
lower by 4% , came down to 34%. Lower Coefficient of Variation is also the
proof of chosing the right securities.-
35 | P a g ePrepared by- Roll: 1555, 1559, 1664, 1665, 1666
Course: Invest ManagementCourse Teacher: Samia Islam
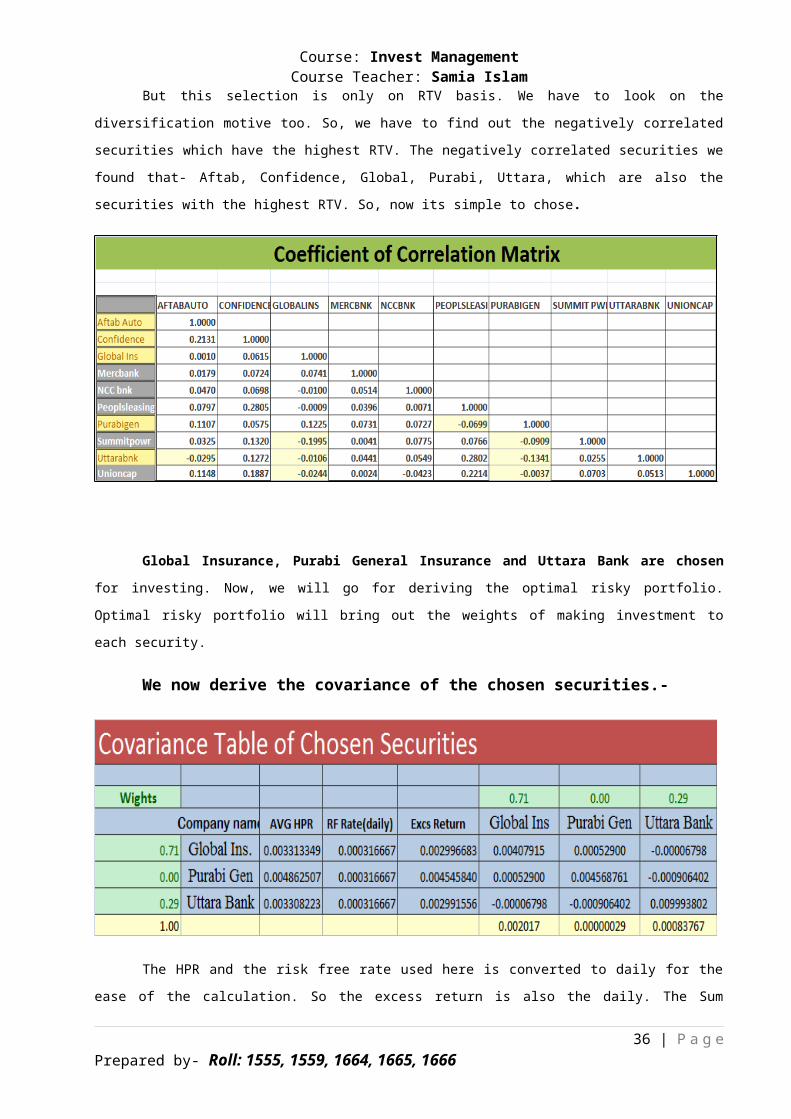
But this selection is only on RTV basis. We have to look on the
diversification motive too. So, we have to find out the negatively correlated
securities which have the highest RTV. The negatively correlated securities we
found that- Aftab, Confidence, Global, Purabi, Uttara, which are also the
securities with the highest RTV. So, now its simple to chose.
Global Insurance, Purabi General Insurance and Uttara Bank are chosen
for investing. Now, we will go for deriving the optimal risky portfolio.
Optimal risky portfolio will bring out the weights of making investment to
each security.
We now derive the covariance of the chosen securities.-
The HPR and the risk free rate used here is converted to daily for the
ease of the calculation. So the excess return is also the daily. The Sum
36 | P a g ePrepared by- Roll: 1555, 1559, 1664, 1665, 1666
Course: Invest ManagementCourse Teacher: Samia Islam
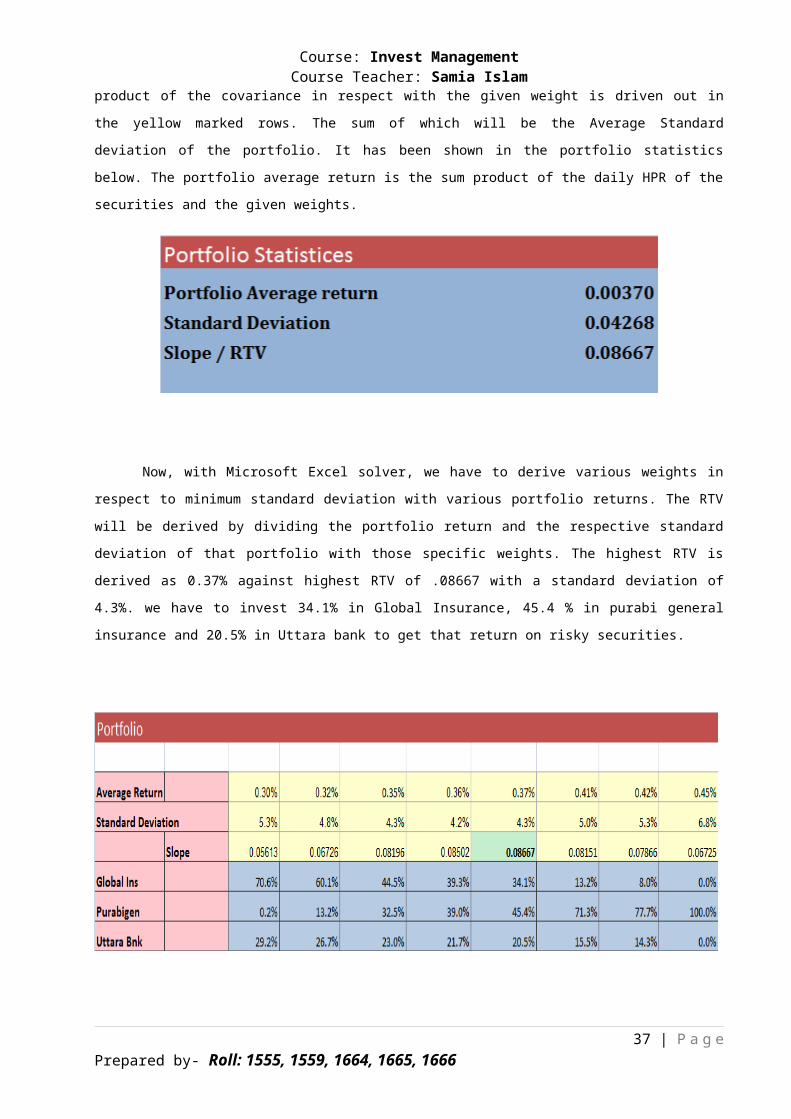
product of the covariance in respect with the given weight is driven out in
the yellow marked rows. The sum of which will be the Average Standard
deviation of the portfolio. It has been shown in the portfolio statistics
below. The portfolio average return is the sum product of the daily HPR of the
securities and the given weights.
Now, with Microsoft Excel solver, we have to derive various weights in
respect to minimum standard deviation with various portfolio returns. The RTV
will be derived by dividing the portfolio return and the respective standard
deviation of that portfolio with those specific weights. The highest RTV is
derived as 0.37% against highest RTV of .08667 with a standard deviation of
4.3%. we have to invest 34.1% in Global Insurance, 45.4 % in purabi general
insurance and 20.5% in Uttara bank to get that return on risky securities.
37 | P a g ePrepared by- Roll: 1555, 1559, 1664, 1665, 1666
Course: Invest ManagementCourse Teacher: Samia Islam
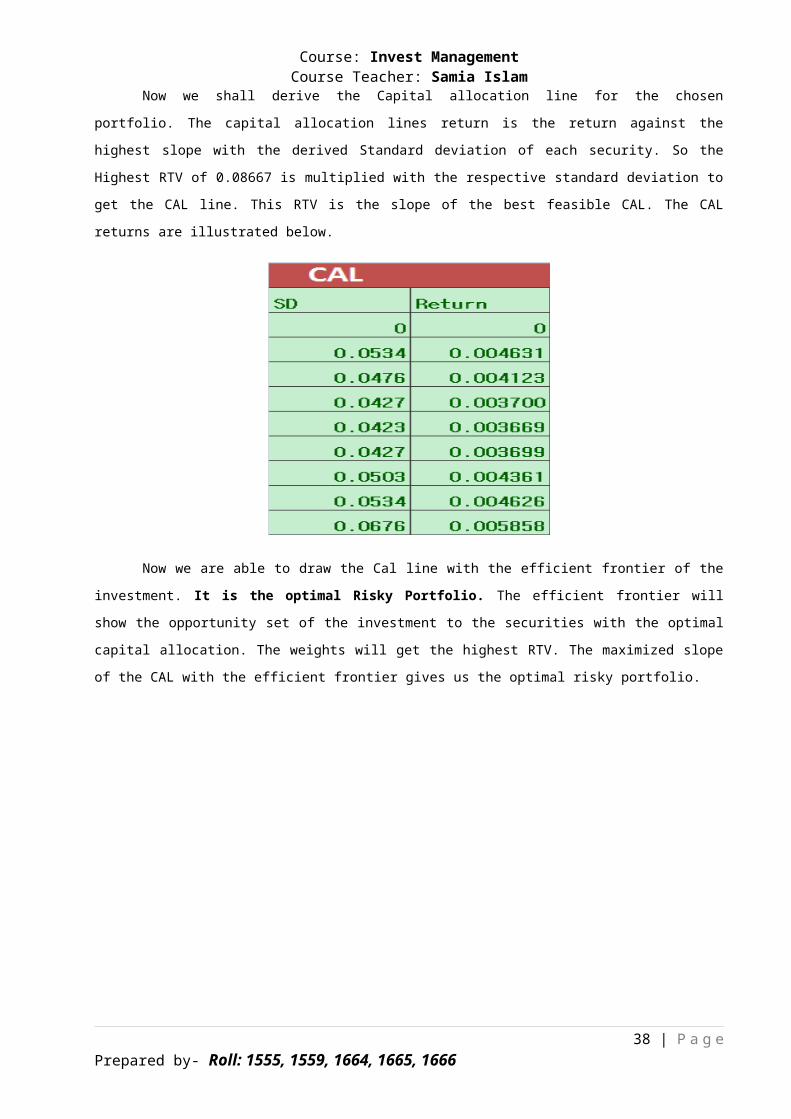
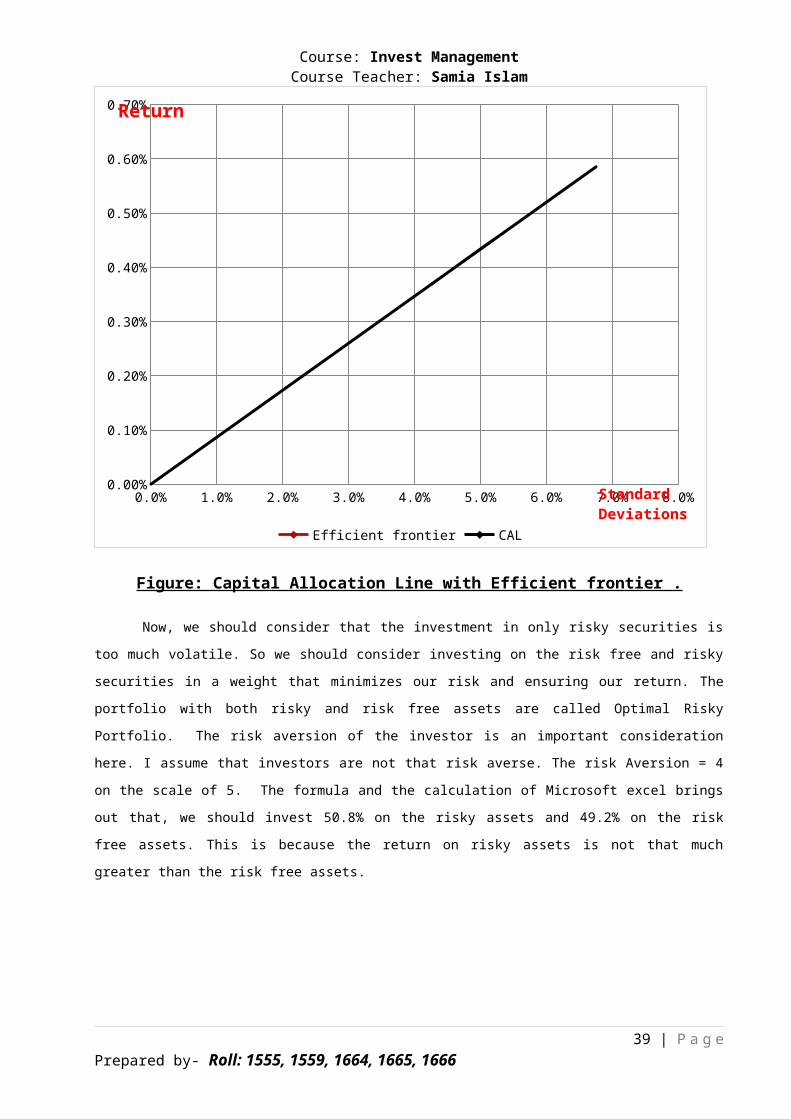
Now we shall derive the Capital allocation line for the chosen
portfolio. The capital allocation lines return is the return against the
highest slope with the derived Standard deviation of each security. So the
Highest RTV of 0.08667 is multiplied with the respective standard deviation to
get the CAL line. This RTV is the slope of the best feasible CAL. The CAL
returns are illustrated below.
Now we are able to draw the Cal line with the efficient frontier of the
investment. It is the optimal Risky Portfolio. The efficient frontier will
show the opportunity set of the investment to the securities with the optimal
capital allocation. The weights will get the highest RTV. The maximized slope
of the CAL with the efficient frontier gives us the optimal risky portfolio.
38 | P a g ePrepared by- Roll: 1555, 1559, 1664, 1665, 1666
Course: Invest ManagementCourse Teacher: Samia Islam
0.0% 1.0% 2.0% 3.0% 4.0% 5.0% 6.0% 7.0% 8.0%0.00%
0.10%
0.20%
0.30%
0.40%
0.50%
0.60%
0.70%
Efficient frontier CAL
Standard Deviations
Return
Figure: Capital Allocation Line with Efficient frontier .
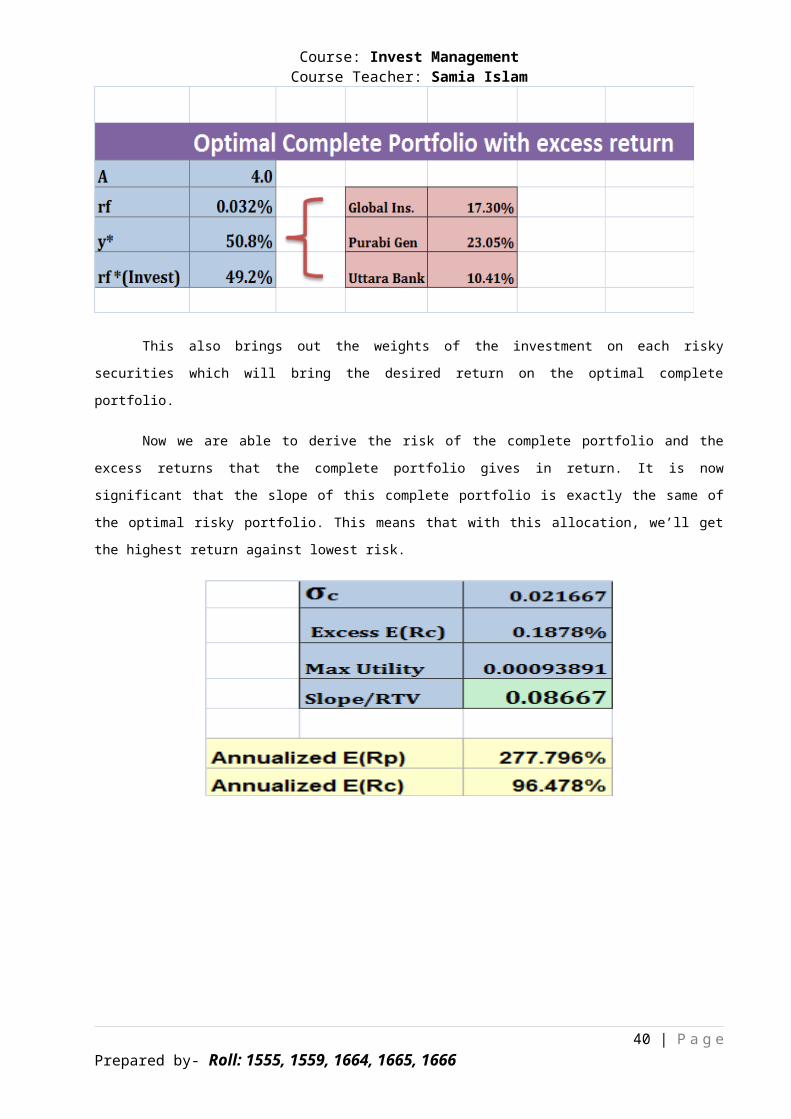
Now, we should consider that the investment in only risky securities is
too much volatile. So we should consider investing on the risk free and risky
securities in a weight that minimizes our risk and ensuring our return. The
portfolio with both risky and risk free assets are called Optimal Risky
Portfolio. The risk aversion of the investor is an important consideration
here. I assume that investors are not that risk averse. The risk Aversion = 4
on the scale of 5. The formula and the calculation of Microsoft excel brings
out that, we should invest 50.8% on the risky assets and 49.2% on the risk
free assets. This is because the return on risky assets is not that much
greater than the risk free assets.
39 | P a g ePrepared by- Roll: 1555, 1559, 1664, 1665, 1666
Course: Invest ManagementCourse Teacher: Samia Islam
This also brings out the weights of the investment on each risky
securities which will bring the desired return on the optimal complete
portfolio.
Now we are able to derive the risk of the complete portfolio and the
excess returns that the complete portfolio gives in return. It is now
significant that the slope of this complete portfolio is exactly the same of
the optimal risky portfolio. This means that with this allocation, we’ll get
the highest return against lowest risk.
40 | P a g ePrepared by- Roll: 1555, 1559, 1664, 1665, 1666
Course: Invest ManagementCourse Teacher: Samia Islam
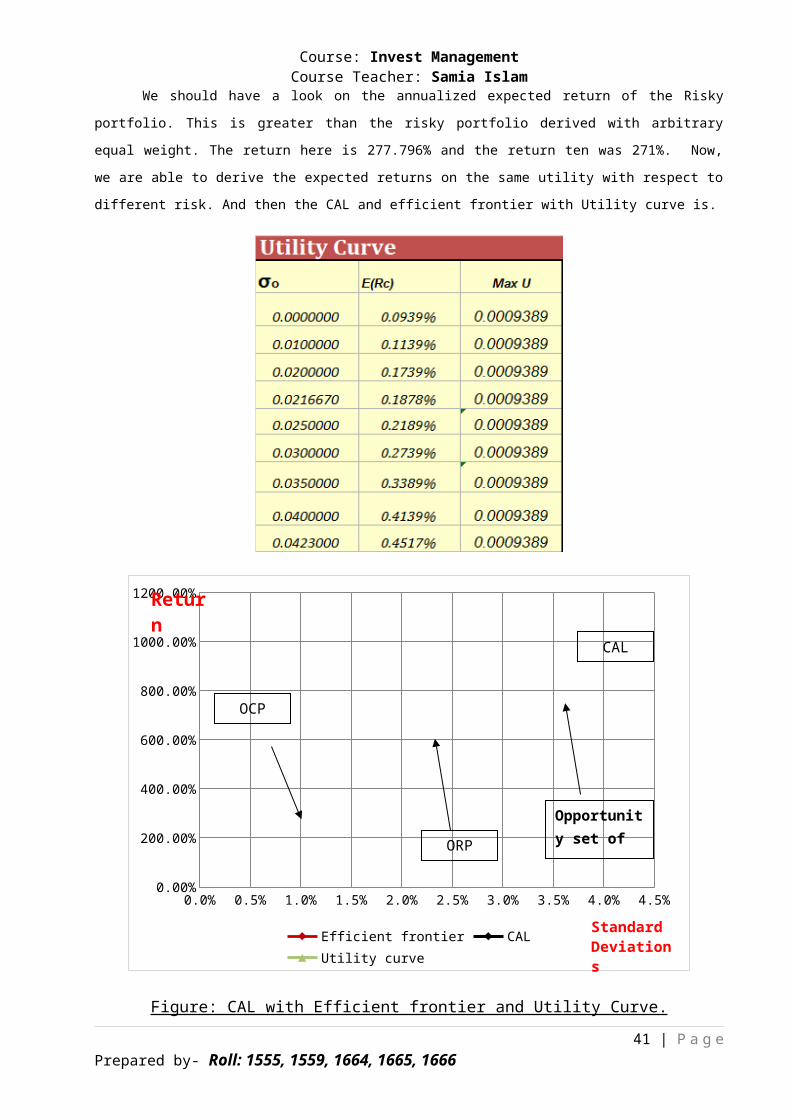
We should have a look on the annualized expected return of the Risky
portfolio. This is greater than the risky portfolio derived with arbitrary
equal weight. The return here is 277.796% and the return ten was 271%. Now,
we are able to derive the expected returns on the same utility with respect to
different risk. And then the CAL and efficient frontier with Utility curve is.
0.0% 0.5% 1.0% 1.5% 2.0% 2.5% 3.0% 3.5% 4.0% 4.5%0.00%
200.00%
400.00%
600.00%
800.00%
1000.00%
1200.00%
Efficient frontier CALUtility curve
Standard Deviations
Return
Figure: CAL with Efficient frontier and Utility Curve.41 | P a g e
Prepared by- Roll: 1555, 1559, 1664, 1665, 1666
OCP
ORP
Opportunity set of risky
CAL
Course: Invest ManagementCourse Teacher: Samia Islam
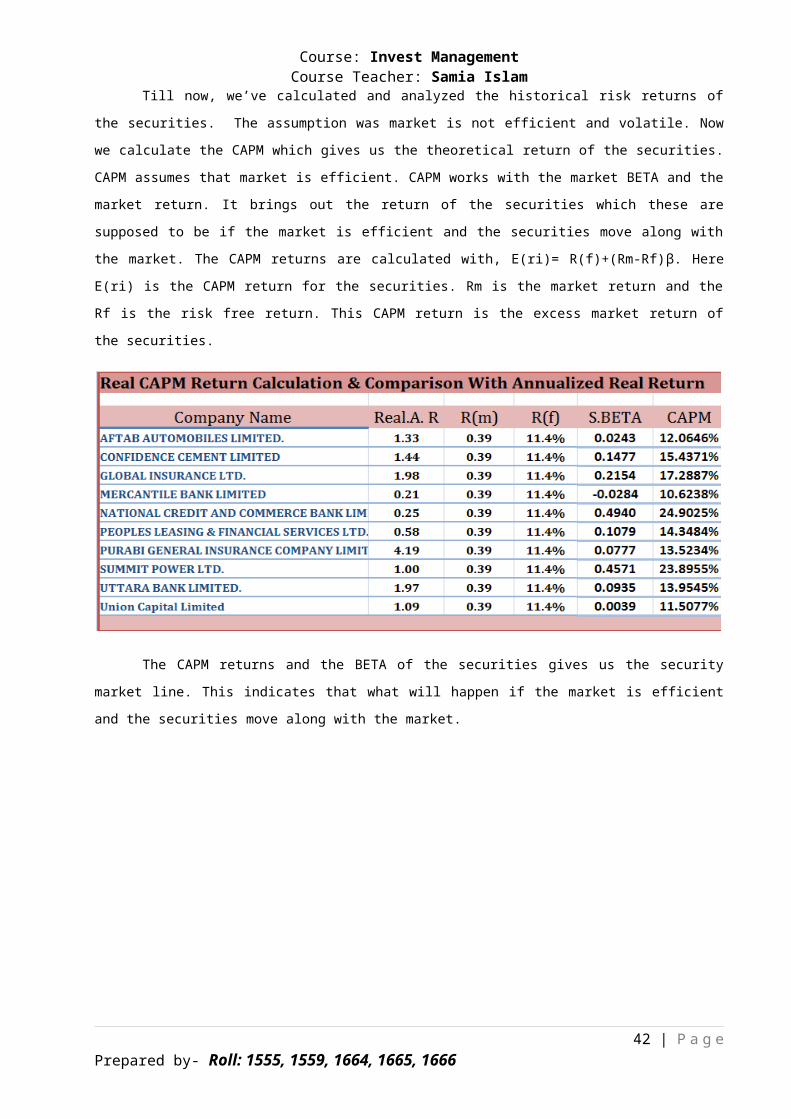
Till now, we’ve calculated and analyzed the historical risk returns of
the securities. The assumption was market is not efficient and volatile. Now
we calculate the CAPM which gives us the theoretical return of the securities.
CAPM assumes that market is efficient. CAPM works with the market BETA and the
market return. It brings out the return of the securities which these are
supposed to be if the market is efficient and the securities move along with
the market. The CAPM returns are calculated with, E(ri)= R(f)+(Rm-Rf)ϐ. Here
E(ri) is the CAPM return for the securities. Rm is the market return and the
Rf is the risk free return. This CAPM return is the excess market return of
the securities.
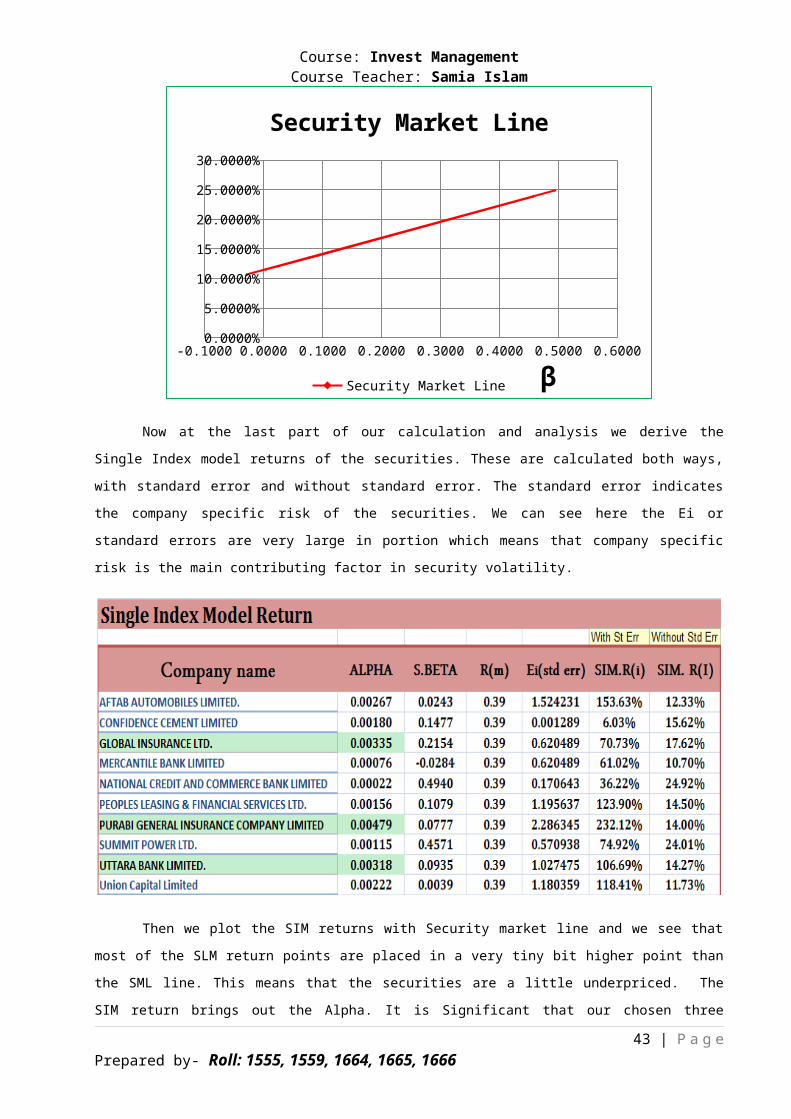
The CAPM returns and the BETA of the securities gives us the security
market line. This indicates that what will happen if the market is efficient
and the securities move along with the market.
42 | P a g ePrepared by- Roll: 1555, 1559, 1664, 1665, 1666
Course: Invest ManagementCourse Teacher: Samia Islam
-0.1000 0.0000 0.1000 0.2000 0.3000 0.4000 0.5000 0.60000.0000%
5.0000%
10.0000%
15.0000%
20.0000%
25.0000%
30.0000%
Security Market Line
Security Market Line ϐNow at the last part of our calculation and analysis we derive the
Single Index model returns of the securities. These are calculated both ways,
with standard error and without standard error. The standard error indicates
the company specific risk of the securities. We can see here the Ei or
standard errors are very large in portion which means that company specific
risk is the main contributing factor in security volatility.
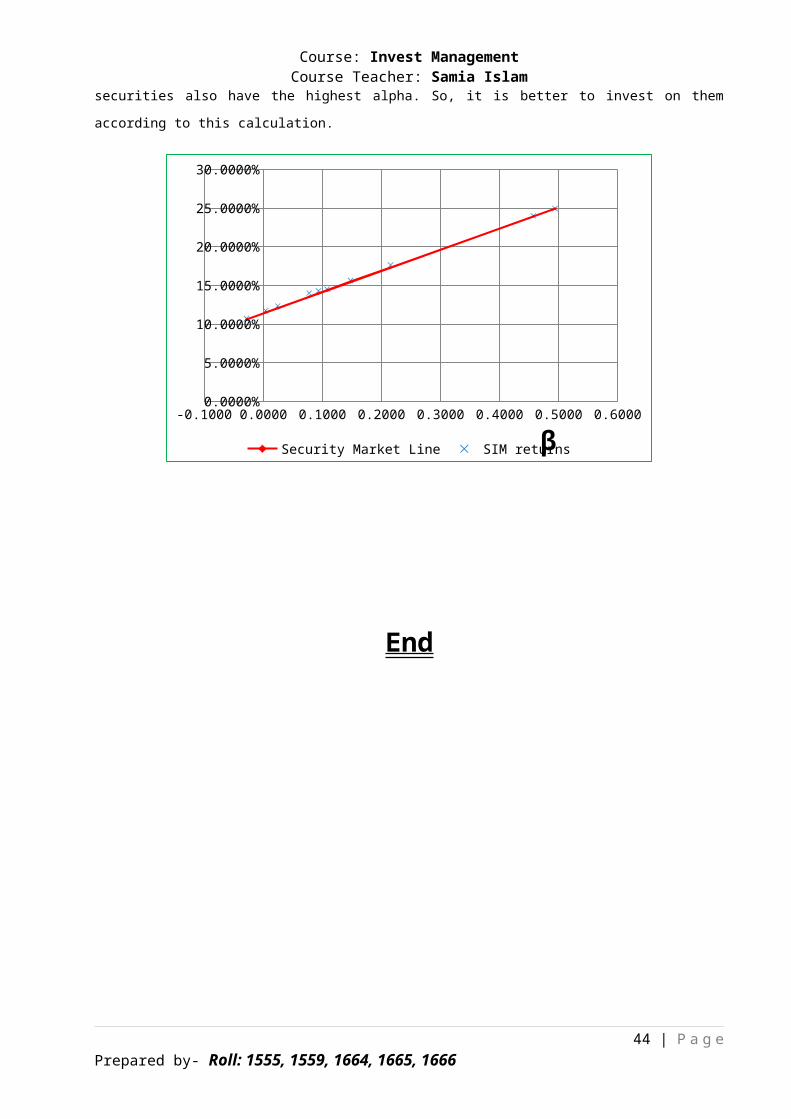
Then we plot the SIM returns with Security market line and we see that
most of the SLM return points are placed in a very tiny bit higher point than
the SML line. This means that the securities are a little underpriced. The
SIM return brings out the Alpha. It is Significant that our chosen three
43 | P a g ePrepared by- Roll: 1555, 1559, 1664, 1665, 1666
Course: Invest ManagementCourse Teacher: Samia Islam
securities also have the highest alpha. So, it is better to invest on them
according to this calculation.
-0.1000 0.0000 0.1000 0.2000 0.3000 0.4000 0.5000 0.60000.0000%
5.0000%
10.0000%
15.0000%
20.0000%
25.0000%
30.0000%
Security Market Line SIM returnsϐ
End
44 | P a g ePrepared by- Roll: 1555, 1559, 1664, 1665, 1666