Embed Size (px)
Citation preview

USDOT Disclaimer:
The following is a Booz Allen Hamilton, Inc. (BAH) report documenting its analysis of the V2V Security Credentials Management System (SCMS) developed for DOT by the Crash Avoidance Metrics Partnership (CAMP). CAMP is a consortium of motor vehicle manufacturers that has cooperatively and pre-competitively developed vehicle-to-vehicle (V2V) communication technologies and safety applications.
BAH used as the basis for its analysis a “snapshot” of the SCMS design as it existed in April 2013, as CAMP’s SCMS design continues to evolve and is not yet final. Discrete aspects of the design may have changed somewhat since April 2013. However, the changes do not substantially impact the substance of BAH’s policy analysis. The DOT expects to make public CAMP’s final SCMS design in late 2014 or early 2015.
Security Credentials Management System (SCMS) Design and Analysis for the Connected Vehicle System
DRAFT December 27, 2013
DRAFT
Intelligent Transportation Systems Joint Program Office U.S. Department of Transportation, Research and Innovative Technology Administration
SCMS Design and Analysis for the Connected Vehicle System | i
Produced by Booz Allen Hamilton, Inc. for the Intelligent Transportation Systems Joint Program Office Research and Innovative Technology Administration U.S. Department of Transportation
Notice This document is disseminated under the sponsorship of the Department of Transportation in the interest of information exchange. The United States Government assumes no liability for its contents or use thereof.
DRAFT
Intelligent Transportation Systems Joint Program Office U.S. Department of Transportation, Research and Innovative Technology Administration
SCMS Design and Analysis for the Connected Vehicle System | ii
Technical Report Documentation Page
1. Report No.
FHWA-JPO- 2. Government Accession No.
3. Recipient’s Catalog No.
4. Title and Subtitle
Security Credentials Management System (SCMS) Design and Analysis for the Connected Vehicle System
5. Report Date
12/27/2013 6. Performing Organization Code
7. Author(s)
Lawrence Frank, Dominie Garcia, Eric Hurley, Andrea Kiernan, Nick Nahas, and Richard Walsh
8. Performing Organization Report No.
9. Performing Organization Name And Address Booz Allen Hamilton, Inc. 8283 Greensboro Drive McLean, VA 22102
10. Work Unit No. (TRAIS)
11. Contract or Grant No. DTFH61-11-D-00019
12. Sponsoring Agency Name and Address Research and Innovative Technology Administration Intelligent Transportation Systems, Joint Program Office 1200 New Jersey Ave SE Washington, DC 20590
13. Type of Report and Period Covered Formal Deliverable 11/12/2013 – 12/27/2013 14. Sponsoring Agency Code
15. Supplementary Notes
16. Abstract This report presents an analysis by Booz Allen Hamilton (Booz Allen) of the technical design for the Security Credentials Management System (SCMS) intended to support communications security for the connected vehicle system. The SCMS technical design was developed by the Crash Avoidance Metrics Partnership (CAMP) and was current as of December 2013. The report provides findings related to several documented aspects of the SCMS design for full deployment, the assumptions used in the analysis, and any implications. The team focused on the following broad topic areas: technical design, governance, privacy, misbehavior, and costs. The team examined the various components, or functions, of the SCMS and reviewed the public key infrastructure (PKI) architecture upon which the system is built. The governance analysis outlines the three high level governance options (i.e., public, public-private partnership, and private), with a focus on the scenario where the SCMS is owned/operated by private industry organizations. For privacy, the team conducted an analysis of the risk of vehicle tracking, bounded by a specific set of parameters. The analysis highlights the level of difficulty that a malicious user would face in attempting to track a vehicle with data from the basic safety message (BSM). Although misbehavior detection and management is still largely under development for the SCMS, the team reviewed what is known and the report includes several outstanding questions related to misbehavior. The team developed cost estimates based on technical functionality and several assumptions about such topics as processing power, facilities, staffing needs, and growth of the system over time. The team also developed a cost model to assist decision makers in understanding how costs can vary across a range of scenarios. The report concludes with a list of outstanding items that need to be addressed prior to system deployment. 17. Key Words connected vehicle system, connected vehicle program, security credentials management system, certificate management, certificate management entity, vehicle-to-vehicle, vehicle-to-infrastructure, public key infrastructure
18. Distribution Statement
19. Security Classif. (of this report)
20. Security Classif. (of this page)
21. No. of Pages
158
22. Price
Form DOT F 1700.7 (8-72) Reproduction of completed page authorized
DRAFT
Intelligent Transportation Systems Joint Program Office U.S. Department of Transportation, Research and Innovative Technology Administration
SCMS Design and Analysis for the Connected Vehicle System | iii
Table of Contents
Acronym List………………. ................................................................. 1 Executive Summary ............................................................................. 1
SCMS Technical Design ................................................................................. 1 Preliminary Governance Analysis .................................................................. 2 Privacy and Misbehavior ................................................................................ 3 Costs………. ................................................................................................... 4 Outstanding Topics.......................................................................................... 4
Chapter 1 Introduction ........................................................................ 5 Overview….. .................................................................................................... 5 Purpose and Goals ......................................................................................... 5
Part I SCMS Overview ........................................................................ 9 Chapter 2 CAMP’s Technical Design for the SCMS ...................... 10
Public Key Infrastructure Framework .......................................................... 10 CAMP’s Technical Design of the SCMS ...................................................... 12 CAMP’s Deployment Design ........................................................................ 13
Chapter 3 SCMS Functions .............................................................. 15 Pseudonym Functions .................................................................................. 15 Bootstrap Functions ...................................................................................... 20 PKI Architecture and Hierarchy .................................................................... 24
Part II SCMS Governance ................................................................ 27 Chapter 4 Preliminary Governance Analysis ................................. 28
SCMS Industry Model ................................................................................... 28 SCMS Industry Context ................................................................................ 30 Industry Governance versus Organizational Governance ......................... 32 Industry Governance Options ...................................................................... 33 Comparative Industry Governance Examples ............................................ 35
Chapter 5 SCMS Manager Analysis ................................................. 39 Organization Design Planning ..................................................................... 39 SCMS Manager Organization Design Considerations............................... 40 Conceptual SCMS Manager Structure ........................................................ 45
Part III Controls, Privacy, and Misbehavior ................................... 49 Chapter 6 SCMS Controls and Auditing ......................................... 50
Physical, Procedural, and Technical Controls ............................................. 50 Audit Practices for the SCMS ...................................................................... 55
Chapter 7 Options for User or Vehicle Information Linkage ........ 58 Option 1: No Linkage between User PII and the SCMS ............................ 59 Option 2a: Linkage between User PII and the Enrollment Certificate ....... 60 Option 2b: Linkage between User PII and Short-Term Certificates .......... 61
DRAFT
Intelligent Transportation Systems Joint Program Office U.S. Department of Transportation, Research and Innovative Technology Administration
SCMS Design and Analysis for the Connected Vehicle System | iv
Option 3: Linkage between Vehicle Make/Model/Year and/or OBE Production Lot and the Enrollment Certificate ....................... 61
Privacy Approaches in Comparative Industries .......................................... 62 Chapter 8 Framework for Analyzing the Risk of Vehicle Tracking64
Risks to Privacy ............................................................................................. 64 Effectiveness of Tracking Measures ............................................................ 71
Chapter 9 Misbehavior ...................................................................... 82 Misbehavior within the SCMS PKI ............................................................... 82 Misbehavior Authority Function .................................................................... 83 Misbehavior Detection .................................................................................. 84 Misbehavior Investigation and Revocation ................................................. 85 The Certificate Revocation List (CRL) ......................................................... 89 Consequences for Malfeasance .................................................................. 92 Industry Approaches to Addressing Misbehavior ....................................... 93 Outstanding Issues/Questions ..................................................................... 94
Part IV Technical Specifications and Costs .................................. 96 Chapter 10 Technical Specifications ............................................... 97
Cryptographic Operations ............................................................................ 98 Data Sizes of the SCMS Functions ............................................................. 99 Server Requirements .................................................................................. 101 Server Software Platforms ......................................................................... 102 Backward Compatibility of the System ...................................................... 103
Chapter 11 Cost Methodology ........................................................ 104 PKI Industry Findings .................................................................................. 104 Cost Drivers ………………………………………………………………...104 Cost Model Flexibility For Users ................................................................ 112 Categories of Costs .................................................................................... 114 Sensitivity Analysis Findings ...................................................................... 123 Total Costs for SCMS ................................................................................. 124 Efficiencies and Cost Savings .................................................................... 127 Industry Comparison ................................................................................... 128 Costs Summary........................................................................................... 129
Part V Outstanding Issues ............................................................. 130 Chapter 12 Topics for Future Consideration ................................ 131 Appendix A Definition of Terms ..................................................... 135 Appendix B BSM Elements ............................................................. 141 Appendix C NHTSA Fleet Roll-Out Scenarios ............................. 142 Appendix D Detailed SCMS Costs ................................................. 147 Appendix E VIIC Policy Report ...................................................... 147 Appendix F References ................................................................... 177
DRAFT
Intelligent Transportation Systems Joint Program Office U.S. Department of Transportation, Research and Innovative Technology Administration
SCMS Design and Analysis for the Connected Vehicle System | v
List of Tables Table 1. SCMS Industry Stakeholders ........................................................... 41 Table 2. Common Physical and Procedural Controls for PKIs ...................... 53 Table 3. Specific Physical and Procedural Controls for PKIs ........................ 53 Table 4. Common Technical Controls for PKIs .............................................. 54 Table 5. Levels of Assurance ......................................................................... 54 Table 6. SCMS Information Linkage Options ................................................ 59 Table 7. BSM Data ......................................................................................... 75 Table 8. Example Vehicle Dimensions........................................................... 75 Table 9. Vehicle Distribution Percentage by Size .......................................... 78 Table 10. Risks to Privacy .............................................................................. 81 Table 11. Certificate Batches for Initial and Full Deployment ........................ 98 Table 12. Data Load for PCA and RA .......................................................... 100 Table 13. Data Load for ECA, Root CA, Intermediate CA, and LA ............. 100 Table 14. Data Load for MA, LOP, and DCM ............................................... 101 Table 15. Hardware Estimates for Functions in Years 1, 10, 25, and 40 .... 102 Table 16. Numbers of Locations Per SCMS Function ................................. 107 Table 17. SCMS Location Examples ............................................................ 111 Table 18. Cost Considerations for Building Data Centers ............................ 111 Table 19. Costs of Hardware for Scenario 4, 20 Certificates Per Week,
Two-Year Downloads ................................................................... 116 Table 20. Cost of Hardware for Scenario 4, 20 Certificates Per Week,
Three-Year Downloads ................................................................. 117 Table 21. Costs of Software for Scenario 4, 20 Certificates Per Week,
Two-Year Downloads ................................................................... 118 Table 22. Costs of Software for Scenario 4, 20 Certificates Per Week,
Three-Year Downloads ................................................................. 118 Table 23. Cost of FTEs per Function per Team in Year 40 ......................... 122 Table 24. Scenario 1 .................................................................................... 143 Table 25. Scenario 2 .................................................................................... 144 Table 26. Scenario 3 .................................................................................... 145 Table 27. Scenario 4 .................................................................................... 146 Table 28. NHTSA Scenario 1 ....................................................................... 148 Table 29. NHTSA Scenario 2 ....................................................................... 149 Table 30. NHTSA Scenario 3 ....................................................................... 150 Table 31. NHTSA Scenario 4 ....................................................................... 151 Table 32. Total System Costs: Scenario 1, Option 2, Annual Downloads ... 152 Table 33. Total System Costs: Scenario 1, Option 2, Every Two
Year Downloads ........................................................................... 153 Table 34. Total System Costs: Scenario 1, Option 2, Every Three
Year Downloads ........................................................................... 154 Table 35. Total System Costs: Scenario 2, Option 2, Annual Downloads ... 155
DRAFT
Intelligent Transportation Systems Joint Program Office U.S. Department of Transportation, Research and Innovative Technology Administration
SCMS Design and Analysis for the Connected Vehicle System | vi
Table 36. Total System Costs: Scenario 2, Option 2, Every Two Year Downloads ........................................................................... 156
Table 37. Total System Costs: Scenario 2, Option 2, Every Three Year Downloads ........................................................................... 157
Table 38. Total System Costs: Scenario 3, Option 2, Annual Downloads ... 158 Table 39. Total System Costs: Scenario 3, Option 2, Every Two
Year Downloads ........................................................................... 159 Table 40. Total System Costs: Scenario 3, Option 2, Every Three
Year Downloads ........................................................................... 160 Table 41. Total System Costs: Scenario 4, Option 2, Annual Downloads ... 161 Table 42. Total System Costs: Scenario 4, Option 2, Every Two
Year Downloads ........................................................................... 162 Table 43. Total System Costs: Scenario 4, Option 2, Every Three
Year Downloads ........................................................................... 163 Table 44. Cost Per OBE: Scenario 1, Option 2, Annual Downloads ........... 168 Table 45. Cost Per OBE: Scenario 1, Option 2, Every Two
Year Downloads ........................................................................... 168 Table 46. Cost Per OBE: Scenario 1, Option 2, Every Three
Year Downloads ........................................................................... 168 Table 47. Cost Per OBE: Scenario 2, Option 2, Annual Downloads ........... 169 Table 48. Cost Per OBE: Scenario 2, Option 2, Every Two
Year Downloads ........................................................................... 169 Table 49. Cost Per OBE: Scenario 2, Option 2, Every Three
Year Downloads ........................................................................... 169 Table 50. Cost Per OBE: Scenario 3, Option 2, Annual Downloads ........... 170 Table 51. Cost Per OBE: Scenario 3, Option 2, Every Two
Year Downloads ........................................................................... 170 Table 52. Cost Per OBE: Scenario 3, Option 2, Every Three
Year Downloads ........................................................................... 170 Table 53. Cost Per OBE: Scenario 4, Option 2, Annual Downloads ........... 171 Table 54. Cost Per OBE: Scenario 4, Option 2, Every Two
Year Downloads ........................................................................... 171 Table 55. Cost Per OBE: Scenario 4, Option 2, Every Three
Year Downloads ........................................................................... 171
List of Figures Figure 1. CAMP SCMS Technical Design for Full Deployment .................... 12 Figure 2. Short-Term Certificate Generation Process for Full Deployment .. 18 Figure 3. Bootstrap Process .......................................................................... 23 Figure 4. SCMS Industry Model..................................................................... 29 Figure 5. SCMS Industry Context .................................................................. 31 Figure 6. Certificate Generation Production Chain........................................ 32 Figure 7. SCMS Manager Organization Structure Diagram.......................... 47
DRAFT
Intelligent Transportation Systems Joint Program Office U.S. Department of Transportation, Research and Innovative Technology Administration
SCMS Design and Analysis for the Connected Vehicle System | vii
Figure 8. Probability of Detection ................................................................... 73 Figure 9. Technical Approach......................................................................... 74 Figure 10. Sample Geographic Regions in California ................................... 77 Figure 11. Concord and San Francisco Infrastructure Maps ........................ 79 Figure 12. Probability of Detection for Varying Time Window of Sniffer
Operation ..................................................................................... 80 Figure 13. Probability of Detection for Varying Daily Traffic Levels ............... 81 Figure 14. Misbehavior Investigation Process ............................................... 87 Figure 15. Revocation Process ...................................................................... 89 Figure 16. Facility Build-Out Costs .............................................................. 120 Figure 17. Comparison of Total Costs by Location: Scenario 4, 20
Certificates Per Week, Two-Year Downloads* .......................... 124 Figure 18. Total System Costs Over 40 Years ............................................. 125 Figure 19. NPV at Three and Seven Percent .............................................. 125 Figure 20. Annual Cost for Total OBE .......................................................... 126 Figure 21. Cost of SCMS per OBE .............................................................. 126 Figure 22. Total System Costs in Net Present Value: Scenario 4,
Option 2, Two Year Downloads ................................................. 164 Figure 23. Initial and Annual Facilities Costs across all SCMS Functions:
Scenario 4, Option 2, Every Two Year Downloads ................... 165 Figure 24. Total OBE Costs: Scenario 4, Option 2, Two Year Downloads .. 166 Figure 25. Cost Per OBE Per Device: Scenario 4, Option 2, Every
Two Year Downloads ................................................................. 167
Acronym List - DRAFT
Intelligent Transportation Systems Joint Program Office U.S. Department of Transportation, Research and Innovative Technology Administration
SCMS Design and Analysis for the Connected Vehicle System | 1
Acronym List
ASD After-Market Safety Device BSM Basic Safety Message CA Certificate Authority CAMP Crash Avoidance Metrics Partnership CDDS Communications Data Delivery System CME Certificate Management Entity CP Certificate Policy CPU Central Processing Unit CRL Certificate Revocation List DCM Device Configuration Manager DSRC/WAVE Dedicated Short Range Communications/Wireless Access in Vehicular Environments ECC Elliptic Curve Cryptography ECDSA Elliptical Curve Digital Signature Algorithm ECA Enrollment Certificate Authority FTE Full Time Equivalent HSM Hardware Security Module IBLM Internal Blacklist Manager IEEE Institute of Electrical and Electronics Engineers ITS Intelligent Transportation Systems JPO Joint Program Office LA Linkage Authority LOP Location Obscurer Proxy MA Misbehavior Authority NHTSA National Highway Traffic Safety Administration NPV Net Present Value O&M Operations & Maintenance OBE On Board Equipment PCA Pseudonym Certificate Authority PCI Payment Card Industry PII Personally Identifiable Information PKI Public Key Infrastructure PM Point Multiplication RA Registration Authority RITA Research and Innovative Technology Administration RSE Roadside Equipment SCMS Security Credentials Management System SHA Standard Hash Algorithm SME Subject Matter Expert SOP Standard Operating Procedure TJC The Joint Commission USDOT United States Department of Transportation V2I Vehicle-to-Infrastructure V2V Vehicle-to-Vehicle V2X Vehicle-to-Device VIIC Vehicle Infrastructure Integration Consortium VIN Vehicle Identification Number
Executive Summary - DRAFT
Intelligent Transportation Systems Joint Program Office U.S. Department of Transportation, Research and Innovative Technology Administration
SCMS Design and Analysis for the Connected Vehicle System | 1
Executive Summary
Connected vehicle research has been a major focus of the United States Department of Transportation (USDOT) over the last decade. USDOT has established a multimodal research program on wireless communication among vehicles and with infrastructure with the potential to improve transportation safety dramatically, and to advance mobility and environmental goals. The communications used in a connected vehicle system can reduce crashes through advisories and warnings presented to the driver by the vehicle.1 A connected vehicle system is envisioned to provide a V2V messaging environment on U.S. roadways in the future. USDOT has outlined principles for a connected vehicle system, including user protections such as ensuring “secure and trusted information exchange among users.”2 To support secure communications, a public key infrastructure (PKI) system known as the Security Credentials Management System (SCMS) will be established. The Crash Avoidance Metrics Partnership (CAMP), a consortium of motor vehicle manufacturers, has developed a technical design for the SCMS that identifies the functions and activities required to operate the system, and how they interact. Booz Allen Hamilton (Booz Allen) has analyzed the CAMP technical design of the SCMS and evaluated several related topics. This report focuses on the full deployment design and related assumptions. The Booz Allen team (“the team”) provides findings related to all documented aspects of the SCMS design and its implications for topics such as governance, security controls, privacy, misbehavior, and costs.
SCMS Technical Design The CAMP design for the technical architecture of the SCMS is predicated on a PKI, ensuring the highest levels of security and privacy risk mitigations available. PKI involves the creation and management of digital certificates that ensure the validity of messages, enabling users to trust one another and the system as a whole.3 A PKI allows for users unknown to each other to communicate securely with each other and with a back-end security system that produces the digital certificates. In this way, it is appropriate for the connected vehicle system that will enable V2V communication between vehicles that have not had any prior interaction. Given the scale and reach of the connected vehicle system, traditional PKI design functions have been changed and augmented for increased protection of communications. The additional functions
1 Research and Innovative Technology Administration (RITA) website, Connected Vehicle Research, http://www.its.dot.gov/connected_vehicle/connected_vehicles_FAQs.htm. 2 RITA website, Principles for a Connected Vehicle Environment: Discussion Document, http://www.its.dot.gov/connected_vehicle/principles_connectedvehicle_environment.htm. 3 USDOT, RITA, “Security Approach for V2V/V2I Communications Delivery System,” Aug. 2011.
Executive Summary - DRAFT
Intelligent Transportation Systems Joint Program Office U.S. Department of Transportation, Research and Innovative Technology Administration
SCMS Design and Analysis for the Connected Vehicle System | 2
added to the PKI design for the SCMS (e.g., linkage authorities, location obscurer proxy, device configuration manager) provide more security against attacks and mitigate risks, such as the possibility of vehicle tracking. These new functions also imply greater complexity and costs which must be well understood and planned for prior to deployment. Another critical element to a PKI design is the hierarchy of the system and how trust is anchored and managed. There are elements of the trust hierarchy, such as the root certificate authority, that have been specified in the latest CAMP design. However, other aspects are still to be determined and will be critical to specify prior to deployment, including the method by which certificates for the SCMS functions are generated and distributed.
Preliminary Governance Analysis USDOT is evaluating options for governance structures for the SCMS industry. At a high level, industry governance options could be public, public-private partnership, and private. The team reviewed the options and expanded on a scenario where private organizations would own and operate the SCMS functions. As in any private industry, private SCMS owners/operators would be subject to any relevant federal and state regulations, policies, and standards (e.g., technical and security standards), but beyond that there is the potential for self-governance through mutual agreements. Both CAMP and the Booz Allen team believe the SCMS manager function will likely play a significant role in governance of the SCMS industry. The team examined comparative industry examples that exist today (e.g., payment card and hospital industries). Key lessons learned are that:
• Organizations in private industries have come together to set voluntary privacy and security standards to protect sensitive data.
• Adherence to existing laws and regulations represents the minimum standard of participation in these industries. However, many organizations seek compliance with voluntary industry-developed standards (beyond what is required by law) to increase the trust of customers and gain a competitive edge.
• Often private industries practice self-governance through a trade association, consortium, or board of directors. Representation from a broad set of industry members who develop standards can provide a collaborative system that addresses critical issues at an industry-wide level.
Separate from the overarching industry governance is the governance of each specific organization within the industry, known as organizational governance. The team refers to the specific organizations within the SCMS industry that own and operate the SCMS functions as Certificate Management Entities (CMEs). As no decisions have been made regarding ownership and operation of any part of the system, or the number of organizations that could be involved in the future, the team did not complete an analysis of CME organizational governance. However, the team did evaluate the SCMS manager from an organizational design perspective to understand how it could be structured to accomplish its mission and execute its activities to support interoperability and standards development. We believe shared ownership/operation of the SCMS manager would be a potential option that avoids conflicts of interest, allows for involvement from all interested industry participants, and minimizes excessive involvement in the organization design and operation of CMEs. We also developed a conceptual diagram of the organizational structure of the
Executive Summary - DRAFT
Intelligent Transportation Systems Joint Program Office U.S. Department of Transportation, Research and Innovative Technology Administration
SCMS Design and Analysis for the Connected Vehicle System | 3
SCMS manager, which can be used by planners as a starting point for implementation of the organization.
Privacy and Misbehavior Although a full privacy analysis was not completed by this team, the team was asked to evaluate certain elements of privacy in the SCMS. The team conducted a privacy analysis for a limited set of scenarios using specific parameters to investigate the risk of vehicle location tracking associated with V2V communications in the connected vehicle system.4 The purpose of this analysis is to estimate the risk of a malicious user’s (MU’s) capability to track a vehicle through the connected vehicle system by collecting and analyzing data included in the basic safety message (BSM) in order to potentially trace back to an individual or specific vehicle. The key findings of this analysis can be summarized as:
• Critical a priori information is needed to have significant probability of detection (i.e., the target vehicle’s make and model; the network area in which the intercept will take place; and the time window during which the intercept will take place). Without these pieces of information, the probability of detection will not be significant.
• The probability of detection is lower when there is more traffic. As the number of vehicles that are passing through a sniffer’s footprint increases, it will become more difficult to detect the target vehicle.
• Target vehicles that have “more distinct” vehicle dimensions improve the probability of detection.
• A shorter a priori intercept time window will increase the probability of detection if the MU knows, a priori, the time window during which the intercept of the target vehicle will take place.
The misbehavior authority (MA) is a key element of the SCMS PKI. This function investigates, identifies, and revokes misbehaving users (including both malfunctioning V2V equipment and malfeasant users), providing users with greater confidence in the safety, security, and reliability of the system. There are many outstanding issues related to the technical operation of the MA, which are currently under development by technical teams. We have included notional estimates of the functionality and costs of this function, based on the initial concepts about how it will operate. Another important outstanding issue is the potential need to form a linkage between motor vehicle information and the enrollment certificate of the vehicle’s on board equipment (OBE), primarily for purposes of identifying and correcting V2V equipment malfunction. This type of linkage could involve the vehicle identification number (VIN), vehicle make/model/year, OBE production lot, or other types of information. A determination has not been made about whether, and to what extent, the SCMS will need to create an information linkage, but the National Highway Traffic Safety Administration (NHTSA) has indicated that it believes that a minimal amount of linkage will be necessary for the agency to carry out its enforcement functions.
4 This risk analysis was performed under specific parameters and is one analysis that needs to be considered as part of a full risk analysis that USDOT may complete in the future.
Executive Summary - DRAFT
Intelligent Transportation Systems Joint Program Office U.S. Department of Transportation, Research and Innovative Technology Administration
SCMS Design and Analysis for the Connected Vehicle System | 4
Costs The team developed a cost model for use by USDOT in estimating total costs for the system based on multiple cost drivers. The model features numerous adjustable inputs to evaluate different scenarios. To estimate costs for the SCMS, it is important to understand all of the elements needed for the SCMS to generate and distribute certificates. Most of the estimates are based on CAMP’s technical design and analysis, although several of the operations are not yet fully specified. The team had to make multiple assumptions for cost estimation, which we highlight throughout the report. All numbers and calculations are initial estimates and are presented in the present day’s numbers, per existing technology. Estimates can and should be updated with the understanding of new information as the technical design is refined. As of December 2013, the total net present cost of the system is estimated at $2.9B over a 40-year period under a specific set of assumptions and parameters (NHTSA roll-out scenario 4, 20 reusable, overlapping certificates per week, with two-year downloads at a seven percent discount rate). The major cost drivers of the system are listed below:
• Hardware: Types of hardware and volume to meet system requirements • Software: Types of software and volume of licenses that will be required for system
development and operation • Facilities: Facilities necessary to house hardware and personnel, including number of
facilities, space requirements, and potential construction or lease costs • Personnel: Personnel costs, in terms of skill set, level of effort, and salary necessary to
develop the system and maintain it into the future It should be noted that different system roll-out possibilities in terms of numbers of OBE in new vehicles and numbers of after-market safety devices (ASDs) will impact final costs. An addendum to this report includes a full complement of scenarios with different input assumptions to illustrate how cost estimates can vary.
Outstanding Topics Given that the SCMS is still very much under development on many fronts, we outline multiple outstanding topics regarding the SCMS that should be considered prior to system implementation. These topics include:
• Who will own and operate the system? • Where and how will bootstrapping occur? • Will there be user or vehicle information linking within the system? If so, where and
how will that happen? • What are the technical, physical, and procedural controls that should be included in
the SCMS PKI certificate policy (CP) to protect the system? • What type of communications among SCMS functions will be put in place to ensure
that it can support constant transfers of data and communications? Throughout this report, the Booz Allen team outlines implications for pieces of the CAMP design or decisions that are still in process and identifies their impacts on the SCMS. As further analyses are completed by CAMP, updates to the design should be made accordingly.
Chapter 1 Introduction - DRAFT
Intelligent Transportation Systems Joint Program Office U.S. Department of Transportation, Research and Innovative Technology Administration
SCMS Design and Analysis for the Connected Vehicle System | 5
Chapter 1 Introduction
Overview
The United States Department of Transportation (USDOT) has established a multimodal research program on wireless communication among vehicles and with infrastructure with the potential to improve transportation safety dramatically, and to advance mobility and environmental goals. The connected vehicle program, as this research is known, is led by the Intelligent Transportation Systems Joint Program Office (ITS JPO) within the Research and Innovative Technology Administration (RITA) with support from four other modal agencies5 within USDOT. The ITS JPO contracted with Booz Allen Hamilton (Booz Allen) to analyze alternative approaches and models for the Security Credentials Management System (SCMS) and the individual Certificate Management Entities (CMEs) within the system that could administer the functions required to support the connected vehicle system. The CMEs must ensure the security of communications and protect the privacy of system users appropriately, with the goal of building user trust. To be viable, the CMEs must meet key principles established by the USDOT,6 including:
• Security and ability to detect and respond to attacks • Privacy protection at the appropriate level • Support of transportation safety • Cost effectiveness • Extensibility across applications at a national scale
Each of these key principles will support the facilitation of a secure communications system that could support vehicle-to-vehicle (V2V) and vehicle-to-infrastructure (V2I) communications to enable safety, mobility, and environmental applications for the public good.
Purpose and Goals The purpose of this analysis was to research and analyze the SCMS technical design proposed by the Crash Avoidance Metrics Partnership (CAMP), and to work directly with CAMP to understand aspects of the design that are still under development.7 This collaboration enabled the Booz Allen
5 Federal Highway Administration, Federal Motor Carrier Safety Administration, Federal Transit Administration, and National Highway Traffic Safety Administration. 6 RITA website, Principles for a Connected Vehicle Environment: Discussion Document, http://www.its.dot.gov/connected_vehicle/principles_connectedvehicle_environment.htm. 7 CAMP is collaborating with other organizations in this work and several technical groups have contributed to the technical design upon which we base our analyses. For the sake of parsimony, we will refer to the design in this
Chapter 1 Introduction - DRAFT
Intelligent Transportation Systems Joint Program Office U.S. Department of Transportation, Research and Innovative Technology Administration
SCMS Design and Analysis for the Connected Vehicle System | 6
team (“the team”) to develop additional details for many facets of the CAMP design; analyze the technical feasibility of the public key infrastructure (PKI) architecture; and consider risks associated with security assurance, privacy, and other topics. While the team is not responsible for approval of CAMP’s technical design, we use it as the basis for our analysis and have outlined gaps, questions, and any implications throughout the report. This report is divided into five parts: Part I: SCMS Overview includes Chapters 2 – 3, which provide an overview of CAMP’s full deployment design and detailed descriptions of the SCMS functions that will be used to support security and privacy of communications within the system. The first goal of Part I is to introduce the foundation upon which the system is built. CAMP’s SCMS design is based on a PKI scheme and reflects the processes associated with creating, managing, distributing, using, storing, and revoking the digital certificates that will be exchanged by vehicles engaging in V2V and V2I communication. CAMP’s SCMS design also demonstrates how the SCMS functions will interact with each other, as reviewed in Chapter 3. During the analysis of CAMP’s SCMS design and the functions required to operate the system, it became apparent that multiple decisions related to SCMS operations, such as bootstrap and any differences between initial and full deployment, require additional research and examination. For the SCMS to meet the security needs of the connected vehicle system, various functions must work together to exchange information securely and efficiently. Determining the role and activities of each of the functions within the SCMS will be critical to its success. Part II: SCMS Governance includes Chapters 4 and 5 which investigate how the SCMS may operate within the context of a non-public governance structure. The team first outlines the three general forms of industry governance (i.e., public, public-private partnership, and private). We then review examples of private industry self-governance, and use them as reference points for analyzing the options for the SCMS.8 We also evaluate the role of the SCMS manager from an organizational design point-of-view to better understand options for how it could be implemented in the future. The goal of Part II is to illustrate different ways that industries in the private sector organize themselves, how self-governance takes place, and how these examples can serve as models for a future SCMS. Part II is also intended to support decision-makers who are considering governance options for the SCMS. For example, some of the findings from this analysis can help inform policies about federal or state restrictions on ownership and operation of the SCMS functions, and what kinds of standards and practices need to be set and monitored throughout the industry. The reason to explore different ownership and governance options is to understand the limitations and benefits of different options for how an industry can be set up and maintained to achieve the desired outcomes. The key lessons learned are that there are multiple options open to industry owners and operators, and that private industry self-governance is feasible for the SCMS. Comparative examples offer report as “the CAMP design,” but we acknowledge that CAMP is not the sole contributor to its development. We have also referenced materials produced by the Vehicle Infrastructure Integration Consortium (VIIC), including the document presented in Appendix E of this report. 8 The exploration of private industry examples is not intended to be a fully exhaustive analysis of the inner workings of each industry, but rather an exploration of the self-governance and organizational structures that characterize these industries, and how they could relate to the future industry surrounding the SCMS.
Chapter 1 Introduction - DRAFT
Intelligent Transportation Systems Joint Program Office U.S. Department of Transportation, Research and Innovative Technology Administration
SCMS Design and Analysis for the Connected Vehicle System | 7
insights about how existing private industry owners/operators can effectively self-govern to ensure security, privacy, and other standards remain consistent across an industry and evolve as technology and policy needs dictate. The organization structure diagram of the SCMS manager included in Chapter 5 can serve as a starting point for planners, as it includes this team’s current thoughts on how the functional components of the SCMS manager could be organized. Part III: Controls, Privacy, and Misbehavior includes Chapters 6 – 9. We evaluate how PKI controls can be used to prevent internal and external malfeasance. We also provide an analysis on two issues related to privacy: potential linkage of information and the ability to track back to an individual or vehicle using information collected from basic safety messages (BSMs). Finally, we analyze the processes associated with misbehavior detection and management to understand the role and impact they will have on the system. We first examined the potential linkage between the SCMS and some sort of user or vehicle information for the purposes of following up on technical malfunction of V2V equipment or user malfeasance. The second aspect of privacy we evaluated was the ability to collect information from BSMs using sniffers and then track back to a particular vehicle or individual. The analysis specifically highlights the level of difficulty that a malicious user (MU) in the system would face in attempting to track a vehicle using this method under a certain set of parameters. The team also analyzed misbehavior detection and management, an integral piece of the SCMS that is still in nascent stages of development. Although the processes associated with the misbehavior authority (MA) are not detailed at length in the technical design provided by CAMP, the team developed some high-level operational concepts and outlined outstanding questions that should be answered prior to implementation. The fundamental lesson illustrated in Part III related to misbehavior is that to fully understand how misbehavior will be addressed within the system, much more analysis will be required. We understand that this is currently under evaluation by CAMP. The primary finding related to privacy and the risk of tracking is that the burden to collect, isolate, and link BSMs back to a particular vehicle or individual seems inordinately high to justify a sole MU using this as a way to track one or a few individuals, especially when compared against the ways of tracking a particular vehicle or individual that already exist today. Additional analysis that models and simulates some of the technical details of how this might happen has revealed more about the scale of potential attacks and the feasibility of conducting such an attack. A full assessment of risks may be undertaken by USDOT prior to implementation of the connected vehicle system. Part IV: SCMS Technical Specifications and Costs includes Chapters 10 – 11, which summarize cost estimates for the technical elements (i.e., hardware and software), locations, and personnel that are required for effective operation of the SCMS. To understand hardware and software needs, we developed estimates for the functions that are involved in creating, generating, and distributing certificates. We also analyzed multiple options for locations across the U.S., which included examining additional cost factors such as power requirements, building and leasing costs, and other miscellaneous facility costs. Finally, we estimated the number and type of personnel required to operate each function within the system. The significant lessons learned from these chapters are that cost estimation at this point in the development and evolution of the connected vehicle system is challenging, in large part because some of the critical operations of the system are yet to be specified. At this point in time, it is clear that cryptographic hardware (hardware security modules [HSMs], which will perform fast cryptographic

Chapter 1 Introduction - DRAFT
Intelligent Transportation Systems Joint Program Office U.S. Department of Transportation, Research and Innovative Technology Administration
SCMS Design and Analysis for the Connected Vehicle System | 8
transactions and protect private keys) and other hardware, such as standard servers, are major cost drivers of the system. The amount of hardware needed varies greatly depending on the numbers of certificates that need to be produced. We also know that the registration authority (RA) and the pseudonym certificate authority (PCA) have similarly high costs over time because of the intense hardware needs due to the complexity and intensity of the cryptographic processes they must perform. This may change based on future research and development of the MA, as well as how the market for this type of hardware changes. Part V: Outstanding Issues includes Chapter 12 which provides an overview of outstanding topics that decision-makers should consider before implementation of the SCMS. As outlined, the technical teams that have been developing the design of the system have made significant progress to identify refinements of functions, numbers of certificates, and processes by which certificates are produced. However, many areas of analysis are still required prior to the implementation of the system.
Part I SCMS Overview - DRAFT
Intelligent Transportation Systems Joint Program Office U.S. Department of Transportation, Research and Innovative Technology Administration
SCMS Design and Analysis for the Connected Vehicle System | 9
Part I SCMS Overview
Chapter 2 CAMP’s Technical Design for the SCMS - DRAFT e
Intelligent Transportation Systems Joint Program Office U.S. Department of Transportation, Research and Innovative Technology Administration
SCMS Design and Analysis for the Connected Vehicle System | 10
Chapter 2 CAMP’s Technical Design for the SCMS
CAMP and its partners have developed a technical architecture design for the SCMS, divided into two stages of deployment known as “initial deployment” and “full deployment.” Although we mention some basic details regarding initial deployment, the Booz Allen team does not focus on initial deployment in our analysis of CAMP’s design. This is because it is still under development by CAMP and because the full extent of the needs and implications of the system are best understood by modeling and analyzing the full deployment design. Full deployment is the basis for discussion of the various system components in the next chapter and throughout the report. The cost model for the SCMS (discussed in Chapters 10 and 11) is also based on the system at full deployment. The design presented in this chapter was released in an April 2013 report by CAMP and as of December 2013 is the most current design.9 CAMP’s design continues to evolve as their analysis continues.10 While the Booz Allen team’s analysis is grounded in CAMP’s design, we delve into more detail on several aspects of the system and the related technical and policy implications. To enhance the value of our analysis and address stakeholder concerns, we have found it necessary to further explore certain aspects of the system beyond the level of detail specified in CAMP’s design.11 Before we discuss the CAMP design, it is helpful first to understand the PKI system upon which the SCMS is based.
Public Key Infrastructure Framework For the connected vehicle system to work effectively, users of the system must be able to trust the validity of messages received from other system users. Establishing the basis of this trust network as well as other physical and software design considerations across the system are the key elements of a security design for the connected vehicle system. Currently, the connected vehicle program assumes use of a PKI scheme to achieve the security goals related to establishing trust among users. The use of PKI in this system involves the creation and management of digital certificates that certify the sources of messages, which enables users to trust one another and the system as a whole.12 There are different parts of the SCMS that will send and receive messages throughout the connected vehicle system. The PKI components that work together to provision the digital certificates exchanged
9 CAMP, “Task 5 Extension: Security Credentials Management System: Draft 0.5,” April 2013. 10 As of the writing of this report, the April 2013 CAMP report was not available for public release, but the aspects reviewed herein are authorized for distribution. 11 The word “design” is used to refer to the CAMP technical design for initial and full deployment. Later in the report, the word “model” is used to refer to Booz Allen’s analysis of the industry context in which the SCMS is envisioned to operate. 12 RITA, “Security Approach for V2V/V2I Communications Delivery System.”
Chapter 2 CAMP’s Technical Design for the SCMS - DRAFT e
Intelligent Transportation Systems Joint Program Office U.S. Department of Transportation, Research and Innovative Technology Administration
SCMS Design and Analysis for the Connected Vehicle System | 11
by vehicles in V2V communication are called SCMS functions – or simply “functions” – in this report. The functions are introduced in the next section as part of the CAMP design, and detailed by the Booz Allen team in the next chapter. On board equipment (OBE) is the device built into the vehicle that interfaces with the vehicle’s sensors and transmits and receives messages from other vehicles for V2V communication, and from roadside equipment (RSE) for V2I communication. The OBE is considered the hub of communications and processing for the vehicle. Final design specifications for the OBE and RSE have not yet been set. Additionally, after-market safety devices (ASDs) may enable older vehicles to participate in the connected vehicle system. Policies for if and when ASDs will be used have not been set. PKI uses cryptography to provide authentication, integrity and confidentiality when sending messages between different users. There are two types of cryptography that CAMP has proposed for use by the SCMS: asymmetric and symmetric. In asymmetric cryptography, there are two keys that are mathematically linked in such a way that what is encrypted with one key can be decrypted with the other. Although the keys are mathematically linked, it is extremely difficult to derive one key based on knowledge of the other. This property allows one key, the “public key,” to be widely distributed while the other key, the “private key,” is held only by the owner. When asymmetric cryptography is used, the PKI provides the assurance that the public key is valid by putting the public key in a certificate signed by the PKI. In this way, a sender and a receiver do not need to have any prior interaction to securely send and receive messages and trust that the messages are authentic. Symmetric cryptography uses a single key to encrypt and decrypt, which poses a challenge when controlling key distribution because it is important that only the required parties have the correct keys. Asymmetric cryptographic operations (encryption and decryption) are computationally harder than operations when using symmetric cryptography.13 CAMP has proposed that all messages inside the SCMS (i.e., between the SCMS functions) shall use symmetric cryptography and message authentication code (known as “MAC”) using the symmetric key for encryption and authentication. Symmetric cryptography requires a key distribution mechanism for the participating actors to ensure that only the right entities have the shared key. Within the SCMS, this is a technically feasible solution because the functions will periodically distribute new keys to each other, based on their long standing relationships. However, it would not be a feasible solution for communications between the OBE and the SCMS due to the scale of the system and number of users, and the fact that most users are unknown to each other and to the SCMS. CAMP specifies that asymmetric cryptography is used for the certificates for V2V messages, and for messages or other transmissions between the OBE and the SCMS. Asymmetric cryptography is important for communications between OBE, because the V2V communications environment is one in which drivers will need to trust that they can exchange messages with other drivers even if they have not interacted with them before. The reasons for not employing asymmetric cryptography for messaging inside the SCMS are speed and cost. Messages sent using symmetric encryption can be decrypted and read faster than those using asymmetric encryption, and they require less processing – which means less hardware and power. For the SCMS to effectively serve the entire vehicle fleet, time and cost are important considerations.
13 Most cryptographic solutions use a combination of both symmetric and asymmetric cryptography.
Chapter 2 CAMP’s Technical Design for the SCMS - DRAFT e
Intelligent Transportation Systems Joint Program Office U.S. Department of Transportation, Research and Innovative Technology Administration
SCMS Design and Analysis for the Connected Vehicle System | 12
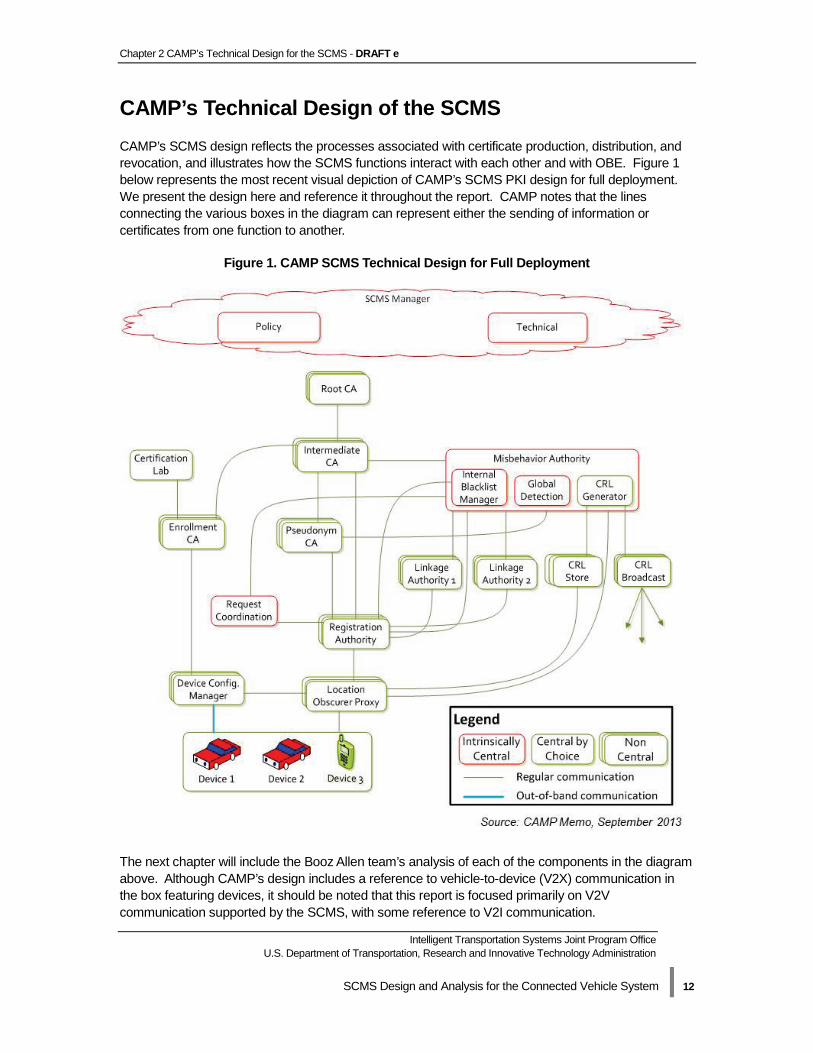
CAMP’s Technical Design of the SCMS CAMP’s SCMS design reflects the processes associated with certificate production, distribution, and revocation, and illustrates how the SCMS functions interact with each other and with OBE. Figure 1 below represents the most recent visual depiction of CAMP’s SCMS PKI design for full deployment. We present the design here and reference it throughout the report. CAMP notes that the lines connecting the various boxes in the diagram can represent either the sending of information or certificates from one function to another.
Figure 1. CAMP SCMS Technical Design for Full Deployment
The next chapter will include the Booz Allen team’s analysis of each of the components in the diagram above. Although CAMP’s design includes a reference to vehicle-to-device (V2X) communication in the box featuring devices, it should be noted that this report is focused primarily on V2V communication supported by the SCMS, with some reference to V2I communication.
Chapter 2 CAMP’s Technical Design for the SCMS - DRAFT e
Intelligent Transportation Systems Joint Program Office U.S. Department of Transportation, Research and Innovative Technology Administration
SCMS Design and Analysis for the Connected Vehicle System | 13
Throughout the report, the Booz Allen team refers to the different participants in the connected vehicle system. Participants relevant to the SCMS include:
• “User” refers to those who use OBE or ASDs in vehicles, primarily drivers. We anticipate in the future that more devices will be included, such as mobile phones or other nomadic devices, and their operators will also be referred to as users.
• “CME owner/operator,” most often used in the shortened form “owner/operator,” refers to the entities that will have legal and operational control over individual organizations that run SCMS functions. Examples of these owners/operators are auto manufacturers, other private organizations, or organizations operating under public-private partnerships. CAMP does not refer to CME owners/operators because their analyses are focused on the technical architecture.
Two notes on nomenclature are included below:
• There are different types of digital certificates that support trusted communications within the SCMS PKI. Those certificates that are used in V2V messaging between OBE are known as pseudonym certificates and are characterized by a short certificate life span that we discuss in more detail in Chapter 3. It is important to note here that throughout the report, these certificates are referred to as “short-term certificates.” Other types of digital certificates (e.g., the enrollment certificate and CME certificates) are also discussed in Chapter 3.
• The use of the terms “OBE” and “device” are interchangeable in this report; both are used to describe the equipment within a vehicle that enables V2V communication.
CAMP’s Deployment Design The following is a discussion of additional technical considerations related to CAMP’s technical design. Although significant changes to this design are not anticipated at this point, it is important to note that there are still a few operational aspects that are under development (namely misbehavior detection and management) and for which current analysis relies on assumptions. It is unlikely that future changes in these assumptions will affect the core activities of the SCMS functions detailed in the following chapter. Rather, changes in assumptions are more likely to affect the integrated nature of the system, or nonoperational aspects of the system, as well as operating costs.
CAMP Initial and Full Deployment Design
CAMP has developed a phased deployment design featuring “initial deployment” and “full deployment.” The CAMP design featured in Figure 1 above reflects the system at full deployment, with all necessary functions. As stated above, the full deployment design is our focus of this report. The design for initial deployment is not included in this report, but can be thought of as a simplification of the full deployment design and represents an initial implementation of the SCMS lasting for the first three years of the system’s operation. During initial deployment, some functions within the SCMS may not yet be established or may operate differently, and communication between the OBE and SCMS will be limited or nonexistent. Even though all functions may not be required for initial deployment, it is important that the initial deployment design components have the ability to support the eventual migration to full deployment. The phased deployment approach is intended to bring users into the connected vehicle system as connectivity

Chapter 2 CAMP’s Technical Design for the SCMS - DRAFT e
Intelligent Transportation Systems Joint Program Office U.S. Department of Transportation, Research and Innovative Technology Administration
SCMS Design and Analysis for the Connected Vehicle System | 14
evolves and some of the more nuanced SCMS functions are developed further and readied for full deployment by system owners/operators. The short-term certificates used by OBE for V2V and V2I communication are distributed by the SCMS to OBE periodically. Because there will be no communications between the SCMS and OBE during initial deployment after the OBE’s initial entry to the system, the OBE must download sufficient certificates to last until initial deployment ends and full deployment begins. More about this initial entry to the system, known as the bootstrap process, is included in the next chapter. Short-term certificate distribution from the SCMS to OBE will differ between initial and full deployment: Initial Deployment: CAMP has specified OBE will download three-year batches of short-term certificates when they join the system during initial deployment. The certificates will be reusable, overlapping, and divided into sets that are valid for one week of the three-year period. The term “overlapping” in this context refers to the fact that any certificate can be used at any time during its week-long validity period. Key implications of this design are as follows:
• The batch size of 3,000 certificates is based on a set of approximately 20 certificates being used per week, which equates to three years’ worth of weeks.
• There may be some discretion about how many certificates will be designated for a one-week period. This would be based on the choice of the user, auto manufacturers, or some other SCMS owners/operators. For this analysis, Booz Allen followed the assumption that there will be 20 certificates per week.
• Depending on the number of certificates designated for one week, they will be reused an uncertain number of times. There is no predetermined order of use.
• A certificate expires when its week-long validity period ends. Full Deployment: CAMP’s design for full deployment specifies that each OBE will receive batches of certificates valid for a period of less than three years from the time they are requested by the OBE. The frequency of the download of certificate batches for full deployment will impact the number of certificates that the device receives per batch. Although CAMP is still evaluating download frequency options for full deployment, they have indicated that it could be one, two, or three years. Regardless of download frequency, the number of certificates the OBE receives per batch will be based on the OBE receiving 20 certificates per week. Therefore, a one-year batch of certificates would include 1,000 certificates, a two-year batch would include 2,000 certificates, and a three-year batch would include 3,000 certificates. A potential feature of the connected vehicle system that could alter the certificate distribution process for full deployment is the notion of “topping off” the certificate batch that exists on each OBE. CAMP is evaluating ways that a device could download new certificates opportunistically throughout the period before a new full batch would be required, rather than waiting until the end of the period to download a new full batch. This could occur if a user were to visit a location where short-term certificates were available for download by the OBE (potentially a dealership or mechanic). In effect, this would “top off” the batch of certificates that already exists on the device and obviate the need for the device to download a large batch of certificates at the end of the one- to three-year period. This feature is not currently part of the design, but may be added in the future. As discussed above, throughout the remainder of the report we highlight several technical and policy implications based on CAMP’s design that we believe require further exploration. We begin in the next chapter by reviewing each of the SCMS functions that CAMP has specified in its full deployment design.
Chapter 3 SCMS Functions - DRAFT
Intelligent Transportation Systems Joint Program Office U.S. Department of Transportation, Research and Innovative Technology Administration
SCMS Design and Analysis for the Connected Vehicle System | 15
Chapter 3 SCMS Functions
As discussed in the previous chapter, PKI is the basis of the SCMS technical design proposed by CAMP. The SCMS can be thought of as one PKI system with multiple processes executed by different functions. This team refers to two different types of SCMS functions: pseudonym functions and bootstrap functions. In this chapter we define all SCMS functions and describe the certificate generation process and bootstrap process. We also include a discussion of how trust is managed within the context of the SCMS PKI architecture. For the SCMS to meet the security needs of the connected vehicle system, the various functions must work together to exchange information securely and efficiently.
Pseudonym Functions The team refers to the functions responsible for creating the short-term certificates used by OBE in V2V messaging as “pseudonym functions.” The term “pseudonym” is used to indicate that short-term certificates contain no information about users, but still allow users to participate in the connected vehicle system, in essence allowing use of a pseudonym.14 Pseudonym functions create, manage, distribute, monitor, and revoke short-term certificates for vehicles. These functions are listed below in alphabetical order:
• Intermediate Certificate Authority (intermediate CA) • Linkage Authority (LA) • Location Obscurer Proxy (LOP) • Misbehavior Authority (MA) • Pseudonym Certificate Authority (PCA) • Registration Authority (RA) • Request Coordination • Root Certificate Authority (root CA) • SCMS Manager
What follows are descriptions of the pseudonym functions based on CAMP’s technical design.15 Intermediate Certificate Authority (intermediate CA) receives its certificate from the root CA and issues certificates to PCAs (and possibly an enrollment certificate authority [ECA]). It may issue certificates to other CMEs. The intermediate CA does not hold the same authority as the root CA in that it cannot self-sign a certificate. The intermediate CA provides flexibility in the system because it obviates the need for the highly protected root CA to establish contact with every
14 CAMP uses the term “pseudonym” when referencing the pseudonym certificate authority function to correspond with the terminology used by the Car 2 Car Communications Consortium. 15 CAMP, “Task 5 Extension: Security Credentials Management System: Draft 0.5,” 23-26.
Chapter 3 SCMS Functions - DRAFT
Intelligent Transportation Systems Joint Program Office U.S. Department of Transportation, Research and Innovative Technology Administration
SCMS Design and Analysis for the Connected Vehicle System | 16
SCMS entity as they are added to the system over time. Additionally, the use of intermediate CAs lessens the impact of an attack by maintaining protection of the root CA. Linkage Authority (LA) has been designed to come in pairs, which we refer to as LA1 and LA2. The LAs for most operations communicate only with the RA and provide values, known as linkage values, in response to a request by the RA. The RA provides the linkage values to the PCA to calculate a certificate ID; the linkage value is the mechanism to connect all short-term certificates from a specific device for ease of revocation in the event of misbehavior. Location Obscurer Proxy (LOP) obscures the location of OBE seeking to communicate with the SCMS functions, so that the functions are not aware of the geographic location of a specific vehicle. All communications from the OBE to the SCMS components must pass through the LOP. Additionally, the LOP may shuffle misbehavior reports that are sent from the OBE to the MA during full deployment. This function reduces risks to user privacy but does not impact security. Misbehavior Authority (MA) acts as the central function to process misbehavior reports and produce and publish the certificate revocation list (CRL).16 It works with the PCA, RA, and LAs to acquire necessary information about a certificate to create entries on the CRL through the CRL generator. The MA eventually may perform global misbehavior detection, involving investigations or other processes to identify levels of misbehavior in the system. The MA is not an external law enforcement function, but rather an internal SCMS function intended to detect when messages are not plausible or when there is potential technical malfunction or user malfeasance within the system. The extent to which the CMEs share externally the “bad actor” information generated by the MA – either with individuals whose credentials the system has revoked or with law enforcement – will depend on law, organizational policy, and/or contractual obligations applicable to the CMEs and their component functions. Pseudonym Certificate Authority (PCA) issues the short-term certificates exchanged by OBE in V2V communication that support trust between users of the system. Short-term certificates issued by the PCA are the security credentials that allow the receiver of a message to validate the signature of the sender (which authenticates the message). In addition to issuing certificates, the PCA collaborates with the MA, RA, and LAs to identify linkage values to place on the CRL if misbehavior has been detected. Registration Authority (RA) receives certificate requests from the OBE (by way of the LOP), requests and receives linkage values from the LAs, shuffles requests, and sends certificate requests to the PCA. During the certificate generation process, the RA performs the necessary key expansions before the PCA performs the final key expansions. It also acts as the final conduit to batching short-term certificates for distribution to the OBE. Request Coordination is critical in preventing an OBE from receiving multiple batches of certificates from different RAs. The request coordination function coordinates activities with the RAs to ensure that certificate requests during a given time period are responded to appropriately and without duplication. Note that this function is only necessary if there is more than one RA to which an OBE
16 The CRL is further discussed in Chapter 9.

Chapter 3 SCMS Functions - DRAFT
Intelligent Transportation Systems Joint Program Office U.S. Department of Transportation, Research and Innovative Technology Administration
SCMS Design and Analysis for the Connected Vehicle System | 17
can submit requests within the SCMS. The technical process behind this function is still under development. Root Certificate Authority (root CA) is the master root for all other CAs; it is the “center of trust” of the PKI system.17 It issues certificates to subordinate CAs in a hierarchical fashion, providing their authentication within the system so all other users and functions know they can be trusted. The root CA produces a self-signed certificate (verifying its own trustworthiness) and provides it to other entities, using out-of-band communications. This enables trust that can be verified between ad hoc or disparate devices because they share a common trust point. It is likely that the root CA will operate in a separate, offline environment because compromise of this function would be a catastrophic event for the system. SCMS Manager is the function that will provide the policy and technical standards for the entire SCMS industry. Just as any large-scale industry ensures consistency and standardization of technical specifications, standard operating procedures (SOPs), and other industry-wide practices such as auditing, the SCMS manager would perform and monitor these types of activities. This can happen in a number of ways. Often in commercial industries, volunteer industry consortiums take on this role. In other industries, or in public or quasi-public industries, this role may be assumed by a regulatory or other legal or policy body. Regardless of how the SCMS manager is implemented, it is expected that a central administrative body would be established. The expectation is that the SOPs, audit standards, and other practices set by this body would be executed and complied with by each CME. It is also assumed that any guidance, practices, SOPs, auditing standards, or additional industry-wide procedures would comply with any federal guidance or regulation. Chapter 5 includes a discussion of the basic functions we expect the SCMS manager to perform.
Misbehavior Authority Activities
CAMP included in their SCMS design more descriptions of functions that work with the MA to create, store, and distribute CRL information. CAMP states that each of these are separate functions that work together. However, the Booz Allen team believes that these are activities within the MA rather than entirely separate functions. We make this distinction because it influences the ultimate organizational design and model development. The definitions below outline processes that the MA carries out to ensure any misbehavior throughout the SCMS is addressed appropriately. More information about the MA can be found in Chapter 9. Certificate Revocation List (CRL) Generator is an activity within the MA that compiles and signs the CRL, which contains linkage values of misbehaving devices. The CRL is intended to be distributed to all OBE so that each device can identify misbehaving or malfunctioning devices in the system and ignore messages from them. CAMP states that CRLs are signed by the CRL generator and then sent to the CRL broadcast and CRL store. CRL Broadcast is the activity of broadcasting the current CRL for download by OBE. CRL Store is the location on the network where the CRL is stored and distributed upon request.
17 CAMP, “Task 5 Extension: Security Credentials Management System: Draft 0.5,” 26.
Chapter 3 SCMS Functions - DRAFT
Intelligent Transportation Systems Joint Program Office U.S. Department of Transportation, Research and Innovative Technology Administration
SCMS Design and Analysis for the Connected Vehicle System | 18
Global Detection is an activity within the MA that collects misbehavior reports from OBE (and potentially other data not yet defined), investigates to detect when messages are not plausible or when there is potential malfunction or malfeasance within the system, and decides which devices should be revoked. The processes of how misbehavior reports are investigated have not yet been defined. Internal Blacklist Manager (IBLM) is an activity within the MA that works with the RA(s) to provide updates on the devices that should not be granted certificates. The IBLM sends out encrypted linkage information (possibly to the request coordination function) that allows the RA to identify the enrollment certificate of the corresponding device and put it on the internal blacklist. Although the IBLM takes part in creating entries for the internal blacklist, the RA maintains the internal blacklist itself.
Short-Term Certificate Generation Process
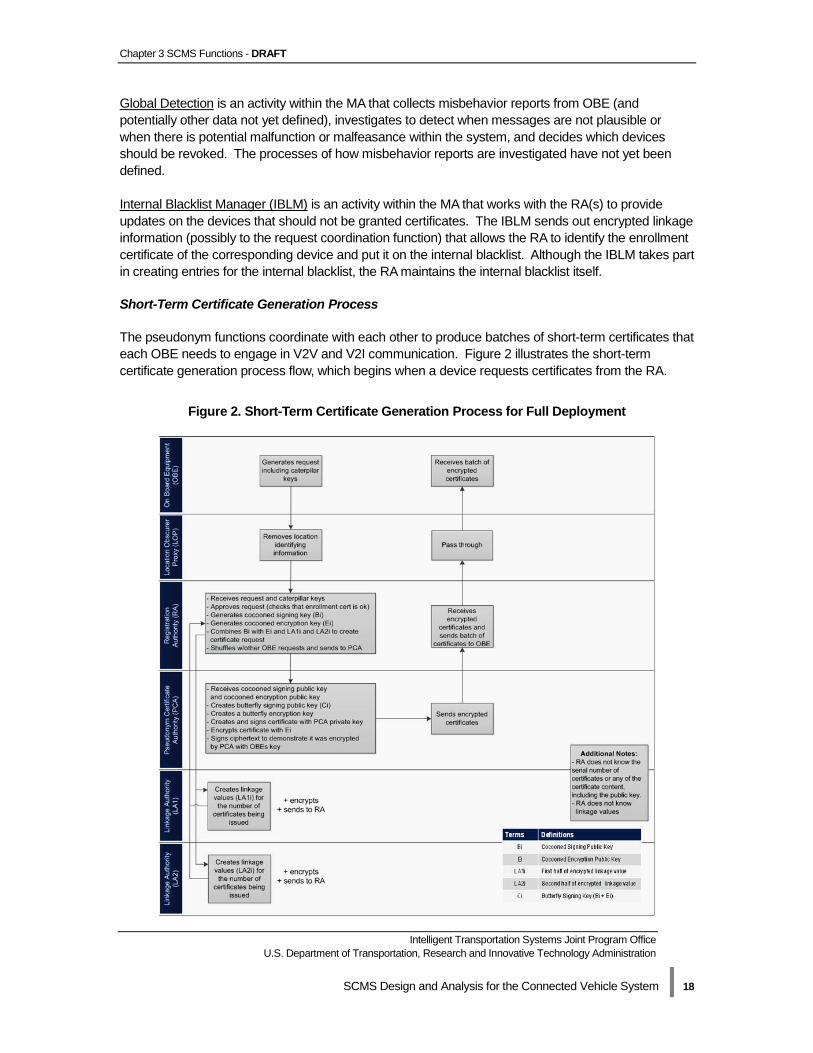
The pseudonym functions coordinate with each other to produce batches of short-term certificates that each OBE needs to engage in V2V and V2I communication. Figure 2 illustrates the short-term certificate generation process flow, which begins when a device requests certificates from the RA.
Figure 2. Short-Term Certificate Generation Process for Full Deployment
Chapter 3 SCMS Functions - DRAFT
Intelligent Transportation Systems Joint Program Office U.S. Department of Transportation, Research and Innovative Technology Administration
SCMS Design and Analysis for the Connected Vehicle System | 19
The short-term certificate generation processes described in Figure 2 can be summarized in the following points:
• After being activated, the OBE receives its enrollment certificate. The enrollment certificate verifies that the device is eligible to participate in the system. The OBE then will create signing and encryption caterpillar key pairs.
• The OBE prepares a certificate request for its batch of short-term certificates. The OBE includes the public caterpillar keys in the request, and signs the request with its enrollment certificate. The OBE then sends the request to the RA by way of the LOP.
• Once the RA receives the request, it will first check against the internal blacklist to ensure that the OBE’s enrollment certificate is valid.
• If the OBE is not on the internal blacklist, the RA expands the caterpillar keys into a set of signing and encryption cocoon keys.
o For initial deployment: 3,000 certificates are created for the OBE o For full deployment: 1,000, 2,000, or 3,000 certificates are created for the OBE,
depending on the frequency of batch download (still to be determined in the technical design)
• The RA sends a request for linkage values to LA1 and LA2. • The LAs will each produce a common identifier per batch of certificates as well as
individual values for each certificate and then send them to the RA. • The RA will add these encrypted linkage values to the signing and encryption public
keys that it generates and will send them to the PCA in sets so that each of the linkage values are represented for LA1 and LA2. The RA will collect several requests from different OBE and shuffle them so that when it sends a request to the PCA, there is no way for the PCA to identify which requests correspond to which OBE.
• The PCA will create and issue the final short-term certificates based on key expansion, encrypt each certificate with the encryption public key, and send them to the RA for distribution.
• The RA receives the encrypted certificates from the PCA. Once all certificates for an OBE have been obtained, the RA will batch them according to the original requests from OBE, and send the certificates to the OBE via the LOP.
Note that the MA function was not included in this process flow because it is still being designed, but the team has included conceptual process flows for MA activities in Chapter 9.
Linkage Authority Details
CAMP worked with its security experts to develop the LA function specifically for the connected vehicle SCMS to address the scale and security needs of the system. Traditional PKI systems do not feature LAs. Because of the large number of short-term certificates, the system needs an efficient method of revocation in the event of misbehavior. An LA will produce a linkage value for each certificate with a common identifier that links all certificates within a batch. In the event of misbehavior, the linkage value will be placed on a CRL and signify revocation of an entire batch of certificates. In this way, the CRL generator does not have to list the certificate numbers for every certificate individually on the CRL, thus significantly reducing the size of CRLs. The current assumption is that there will be a CRL
Chapter 3 SCMS Functions - DRAFT
Intelligent Transportation Systems Joint Program Office U.S. Department of Transportation, Research and Innovative Technology Administration
SCMS Design and Analysis for the Connected Vehicle System | 20
distributed to OBE; if the policy decision is made that there will be no CRL, then there is no need for the LAs. CAMP took the position that two LAs are necessary to reduce privacy risks to system participants. As of December 2013, they believed that one LA alone would have access to too much information about an OBE, leaving system participants more vulnerable to attack by LA “insiders” (i.e., LA staff). CAMP has previously asserted that a second LA ensures that no single authority, function, or entity has sufficient information to link multiple certificates to a specific vehicle for tracking purposes. We agree with this position and have included two LAs in our analysis of the SCMS at full deployment. For each certificate set, the RA requests that the LAs provide linkage values. Each LA first generates a single value for each certificate set. It then calculates a value for a specific time period and uses that value to encrypt the time period identifier. This process results in a number of unique values, dependent on the batch size, for short-term certificates. Each LA provides this set of values to the RA for combination with the cocooned keys generated by the RA. The linkage values chain forward in time (i.e., the value of the “next” certificate linkage value is created using the previous value, but the process cannot be reversed). If a single LA created the certificate identifier, that entity would have the knowledge required to track a vehicle’s location no matter how often the vehicle changes certificates (see next section). When the PCA receives the certificate request from the RA, it uses the pair of linkage values to generate a certificate identifier for each certificate. The method used to create the certificate identifier and the large quantity of certificates being issued makes it extremely difficult for an individual LA to identify which certificate used a specific linkage value. In the event of a need to revoke a set of certificates, the RA, in combination with the PCA and the LAs, will have to identify the set of values used to create the certificate. The resulting value is provided to the MA that will place it on the CRL via the CRL generator and internal blacklist via the IBLM. The Booz Allen team’s understanding of the revocation process is outlined in Chapter 9.
Pseudonym Certificate Life Span
The requirement of short life spans for the pseudonym certificates used in V2V communication has been specified as a security measure. A short certificate life span decreases the likelihood that a vehicle can be tracked.18 No final decisions have been made to specify the life span, but there has been discussion of variation in life span of short-term certificates used within a given week. Certificate life span does have a significant impact on the overall cost and scalability of the system at full deployment. The number of certificates required per OBE per day, month, or year is the primary driver for scaling the SCMS processing requirements.
Bootstrap Functions
Distinct from the pseudonym functions that execute the short-term certificate processes are the functions that carry out the bootstrap process, referred to as “bootstrap functions.” The bootstrap process establishes the initial connection between OBE and the SCMS. This process is characterized
18 RITA, “Security Approach for V2V/V2I Communications Delivery System.”
Chapter 3 SCMS Functions - DRAFT
Intelligent Transportation Systems Joint Program Office U.S. Department of Transportation, Research and Innovative Technology Administration
SCMS Design and Analysis for the Connected Vehicle System | 21
by its chief component, the ECA, which is responsible for assigning an enrollment certificate to each OBE. The bootstrap functions are listed below in alphabetical order:
• Certification Lab • Device Configuration Manager (DCM) • Enrollment Certificate Authority (ECA)
What follows are descriptions of the bootstrap functions based on CAMP’s technical design and the Booz Allen team’s analysis.19 Certification Lab relates to two functions – one within the scope of the SCMS and one that would be under different governance. Certification labs within the purview of SCMS will inform the ECA that a set of OBE (and potentially ASDs) are tested and eligible to receive an enrollment certificate during the bootstrap process. The external certification lab would perform tests of batches of devices for performance and compliance with federal or industry standards. It should be noted that final definitions of the certification lab function have not been settled and could change as the system and its components are refined. Device Configuration Manager (DCM) coordinates initial trust distribution with the OBE by passing on CME certificates and provides the OBE with information it needs to request an enrollment certificate. The DCM also ensures that a device is cleared to receive its enrollment certificate from the ECA, and corresponds directly with each OBE during the bootstrap process. The DCM is also responsible for giving devices access to new trust information, such as updates to CME certificates that will occur over time, and potentially relaying certain technical and policy decisions from the SCMS manager. Enrollment Certificate Authority (ECA) is the function that issues enrollment certificates to new OBE or to existing devices if they are re-entering the system after revocation. Once the ECA receives a request from the OBE for its enrollment certificate, the ECA checks the request against the internal blacklist to ensure that the device is not prohibited from receiving an enrollment certificate. The ECA then produces the enrollment certificate and sends it to the OBE. Once the OBE has a valid enrollment certificate, it is able to request and receive short-term certificates from the SCMS. Before we discuss the bootstrap process flow, a discussion of the enrollment certificate and linking information related to each user or their vehicle is necessary.
Enrollment Certificate and Information Linkage
For a device to request short-term certificates there must be a supporting authentication mechanism that allows the SCMS to verify that the device can be trusted. An enrollment certificate is assigned to each OBE for this purpose. When an OBE possesses a valid enrollment certificate, both the CMEs and other OBE know that it is a trusted user within the SCMS PKI. A secure bootstrap process is necessary for devices to obtain enrollment certificates.
19 CAMP, “Task 5 Extension: Security Credentials Management System: Draft 0.5,” 23-26.
Chapter 3 SCMS Functions - DRAFT
Intelligent Transportation Systems Joint Program Office U.S. Department of Transportation, Research and Innovative Technology Administration
SCMS Design and Analysis for the Connected Vehicle System | 22
Our team discusses the bootstrap functions separately from the pseudonym functions because of the potential connection to the vehicle identification number (VIN), the vehicle’s make/model/year and/or OBE production lot, user personally identifiable information (PII), or any other information that could be used to link an enrollment certificate to a specific vehicle, OBE, or user. CAMP did not make this distinction in their April report, and described the pseudonym functions and the bootstrap functions together. If the decision to collect user or vehicle information is made, we maintain that the ECA should have both organizational separation from other CMEs and internal controls to separate access to any sensitive data from all other components of the system. Options for potential information linkage are fully discussed in Chapter 7.
Enrollment Certificate Life Span
The enrollment certificate periodically will expire and need to be renewed. CAMP has suggested that the life span of the enrollment certificate is unlimited. This decision has not been finalized and still requires discussion as it influences the size of the internal blacklist20 and therefore is a cost issue. We propose an approach in which the enrollment certificate does have an expiration date (e.g., the life span of the vehicle) and renewal would occur automatically. This would not require users to take action for the renewal process to occur. Preventing the expiration of an enrollment certificate also will ensure that a user’s participation in the system is not interrupted. Neither CAMP nor this team has yet detailed the technical process for reissuance of an enrollment certificate. This process will in large part turn on policy decisions about lifespan of the enrollment certificate and implications for misbehavior. Implications of enrollment certificate lifespan include:
• A shorter life span of the enrollment certificate would require a mechanism for automated rekeying of the enrollment certificate to ensure no additional burden on the user.
• A longer life span would still require some form of rekey and may cause the internal blacklist to grow very large due to a growing number of entries from vehicles removed from the fleet prior to expiration.
• Regardless of what life span is chosen, the timeframe needs to be such that the enrollment certificate will not expire at the same time that the OBE’s batch of certificates expires.
Bootstrap Process Flow
The bootstrap process entails an OBE communicating with the ECA by way of the DCM to receive needed security credentials of all the CMEs and to obtain its enrollment certificate. The DCM checks that the device is certified by a certification lab, and if so, provides the OBE with necessary information and facilitates trust distribution by delivering CME certificates (discussed later in this chapter). When the OBE requests an enrollment certificate from the ECA during the bootstrap process, the DCM authenticates the request to the ECA, verifying the OBE’s eligibility to receive an enrollment certificate and the binding of the public key to the specified OBE. If the OBE is eligible, the ECA produces an enrollment certificate and sends it to the OBE via the DCM. The team’s proposed bootstrap process flow aligns with that proposed by CAMP. Figure 3 below is the bootstrap process as we currently understand it.
20 The internal blacklist is further discussed in Chapter 9.
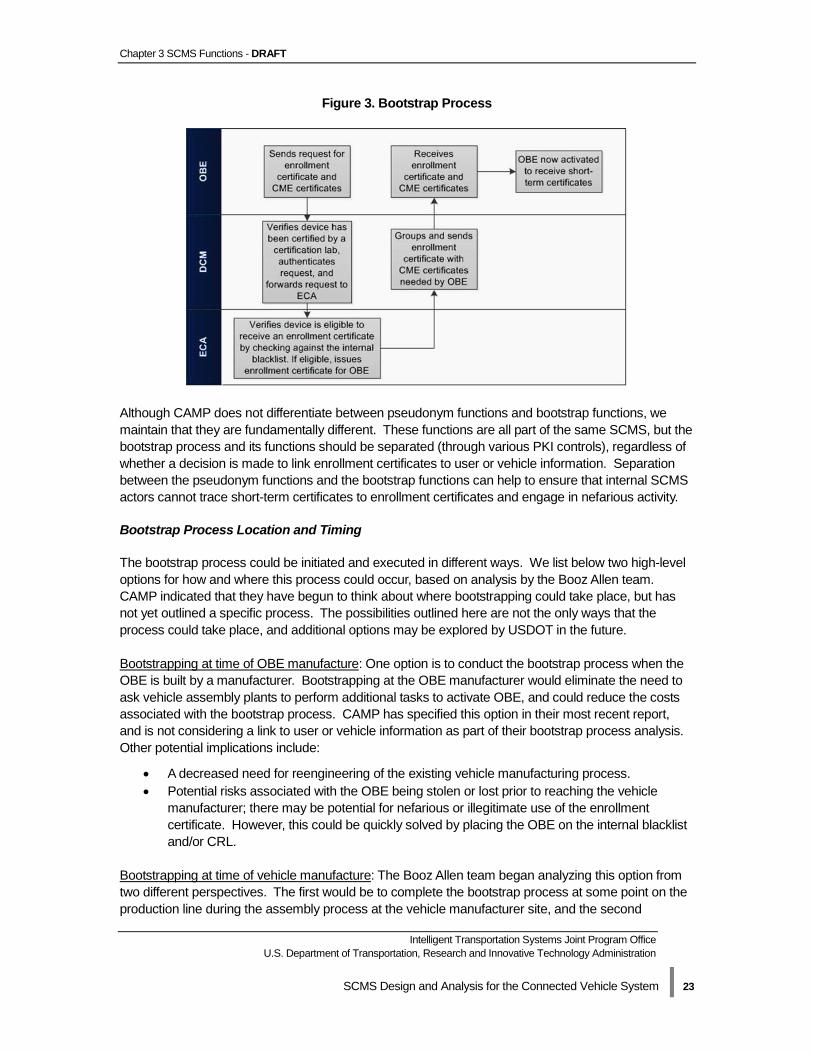
Chapter 3 SCMS Functions - DRAFT
Intelligent Transportation Systems Joint Program Office U.S. Department of Transportation, Research and Innovative Technology Administration
SCMS Design and Analysis for the Connected Vehicle System | 23
Figure 3. Bootstrap Process
Although CAMP does not differentiate between pseudonym functions and bootstrap functions, we maintain that they are fundamentally different. These functions are all part of the same SCMS, but the bootstrap process and its functions should be separated (through various PKI controls), regardless of whether a decision is made to link enrollment certificates to user or vehicle information. Separation between the pseudonym functions and the bootstrap functions can help to ensure that internal SCMS actors cannot trace short-term certificates to enrollment certificates and engage in nefarious activity.
Bootstrap Process Location and Timing
The bootstrap process could be initiated and executed in different ways. We list below two high-level options for how and where this process could occur, based on analysis by the Booz Allen team. CAMP indicated that they have begun to think about where bootstrapping could take place, but has not yet outlined a specific process. The possibilities outlined here are not the only ways that the process could take place, and additional options may be explored by USDOT in the future. Bootstrapping at time of OBE manufacture: One option is to conduct the bootstrap process when the OBE is built by a manufacturer. Bootstrapping at the OBE manufacturer would eliminate the need to ask vehicle assembly plants to perform additional tasks to activate OBE, and could reduce the costs associated with the bootstrap process. CAMP has specified this option in their most recent report, and is not considering a link to user or vehicle information as part of their bootstrap process analysis. Other potential implications include:
• A decreased need for reengineering of the existing vehicle manufacturing process. • Potential risks associated with the OBE being stolen or lost prior to reaching the vehicle
manufacturer; there may be potential for nefarious or illegitimate use of the enrollment certificate. However, this could be quickly solved by placing the OBE on the internal blacklist and/or CRL.
Bootstrapping at time of vehicle manufacture: The Booz Allen team began analyzing this option from two different perspectives. The first would be to complete the bootstrap process at some point on the production line during the assembly process at the vehicle manufacturer site, and the second

Chapter 3 SCMS Functions - DRAFT
Intelligent Transportation Systems Joint Program Office U.S. Department of Transportation, Research and Innovative Technology Administration
SCMS Design and Analysis for the Connected Vehicle System | 24
perspective would be at the end of the production line. Altering the existing vehicle assembly process is challenging. Although the back-end process of requesting the enrollment certificate typically would not take longer than a few minutes, even mere seconds can increase the cost of vehicle production substantially, and require significant changes to the assembly plant facilities. Other potential implications include:
• A need for wired or wireless capability on the production line. Securing wireless communication is more difficult than securing wired communication.
• A need for additional staff to install the device as part of the assembly process. • A need for technical staff to test, trouble shoot, and ensure the device is functioning correctly. • A potential need for reengineering the vehicle production process.
Discussions with additional OEMs and further technical and security analyses are necessary to understand the full set of implications of this method for the bootstrap process. For both options outlined here, it should be noted that any linkage to user or vehicle information would need to be factored into the process if the decision to form such a linkage is made by USDOT or system owners/operators. A linkage would likely occur after the vehicle and OBE are integrated.
OBE Automation and Software
Much of the discussion to date about the SCMS functions has been based on an implicit assumption that as much automation as possible will be built into the OBE and its software. This includes programs that will automatically communicate with the RA for requests, reports, renewals of enrollment certificates and short-term certificates, and other related activities. As of the writing of this report, we believe that the following OBE processes are subject to automation:
• Certificate batch requests • Enrollment certificate auto renewal (if applicable) • CRL requests • OBE and CRL processing • Local misbehavior detection through (1) plausibility checks to ensure that the device
itself is not misbehaving and (2) plausibility checks on incoming messages and automatic rejection of messages coming from misbehaving devices
• Sending of misbehavior reports to the MA for global detection (during full deployment)
• Periodic communication with the DCM for updates (e.g., downloading new CME certificates)
PKI Architecture and Hierarchy In a hierarchical PKI containing multiple CAs, the root CA exists at the top of the hierarchy and is the most trusted component upon which all system parties rely. All trust for system components and subscribers is inherited and delegated from the root CA through certificate issuance. Before taking advantage of the PKI trust framework, each relying party will need to establish a trust relationship with the root CA of the PKI system. Typically, this trust is established when each relying party adds or installs the trust anchor to its own trust store either in the form of the self-signed root CA certificate which includes the root CA public key. A trust store holds the CME certificates (described below) for all other entities within the SCMS. Trust store management is a process that provides rules to import and update certificates trusted by the system for validation of a digital signature. Once
Chapter 3 SCMS Functions - DRAFT
Intelligent Transportation Systems Joint Program Office U.S. Department of Transportation, Research and Innovative Technology Administration
SCMS Design and Analysis for the Connected Vehicle System | 25
trust has been established with the root CA, each relying party can validate PKI certificates issued under the root CA cryptographically against the root CA’s public key and CRL. The basic premise is that just as vehicles and infrastructure in the system need to be “trusted” through the use of short-term certificates that accompany messages, the SCMS functions also need to be “trusted” by the vehicles or infrastructure receiving certificate batches from them. And SCMS functions need to trust one another as well. Therefore, most SCMS functions are granted their own certificates, which we refer to as “CME certificates.” The OBE should examine the certificate of any digitally signed message it receives before it accepts the message as valid to ensure that:
• The certificate has not expired • The CME that issued the certificate is trusted • The certificate is not listed on a CRL
CME certificates do not need to be short-lived as do the short-term certificates intended for the OBE, as vehicle location tracking is not a risk for the SCMS functions. Additionally, not every SCMS function requires a CME certificate. The LOP, for example, serves as a sort of firewall that does not originate any message traffic, but rather passes signed messages between the OBE and SCMS functions after stripping out location information (e.g., IP headers). Because the LOP does not actually share information with the OBE or SCMS functions, it does not require a CME certificate. During the bootstrap process, the OBE will need to receive the CME certificates for all functions with which it communicates. At a minimum, the CME certificates for the root CA, intermediate CA, RA (or request coordination if there are multiple RAs), MA, and DCM would be delivered to the OBE when it is authenticated. We assume that any actor in the system with which the OBE communicates will have some sort of certificate validating its trustworthiness. The OBE design must incorporate mechanisms to do trust store management. Trust store management is needed when the CME certificates expire and as new entities or functions are added to the system. Even in scenarios involving long-term CME certificates, at some point, some subset of devices will outlive even the longest lived certificate and require an update. In addition, it is reasonable to expect that as penetration of the devices into the fleet increases, additional CMEs will be added to the system, and these will also need to be verified and trusted as part of the SCMS. The system needs to balance the complexity of the PKI hierarchy with the risk associated with a compromise of one of the CAs. A single root CA is very simple to implement, but a system failure or compromise can be catastrophic because it could invalidate all of the certificates in the system. Using multiple root CAs limits the damage that can be caused by any single attack or other adverse system event. The introduction of one or more intermediate CAs can also help to reduce the impact of an attack. As previously mentioned in this chapter, the intermediate CA is an extension of the root CA that can authorize other CMEs (e.g., provide them with CME certificates), but it does not hold the same authority as the root CA because it cannot self-sign a certificate. In the event of an attack or other adverse event that corrupts the certificates of OBE or SCMS functions that were authorized by an intermediate CA, the entire system is not compromised. The root CA would ideally have been protected from the attack because it remains offline while the intermediate CA distributes trust on its behalf.
Chapter 3 SCMS Functions - DRAFT
Intelligent Transportation Systems Joint Program Office U.S. Department of Transportation, Research and Innovative Technology Administration
SCMS Design and Analysis for the Connected Vehicle System | 26
The intermediate CA is optional. If there is an intermediate CA, then there is no communication between the root CA and the signing CA level.21 In the SCMS PKI hierarchy, the intermediate CA communicates up with the root CA and down to the signing CAs. If there are no intermediate CAs, the signing CAs will communicate directly with the root CA. CAMP has suggested that there may be no intermediate CA during initial deployment, but that it may be introduced in the system during full deployment. CME certificates will be distributed during bootstrap and in any updates delivered to the OBE by the DCM. The general concept of what would be needed for trust distribution is outlined below, based on traditional PKI and assurance of a secure trust environment. More detailed analysis can provide additional specification.
• The root CA would generate a key and self-sign its certificate. It would manually be loaded into the trust store of each other SCMS component.
• Any SCMS function that is online at initial deployment of the system would request a long-term CME certificate from the root CA (or intermediate CA if there is one during initial deployment).
• The root CA (or intermediate CA) would produce the CME certificates for the functions that have requested them.
• The CME certificates would be manually delivered to each function to be uploaded into their trust stores.
• The root CA would then go offline. From this point forward, the intermediate CA would have the authority to produce and sign certificates for new CMEs as they come online. The team assumes a manual process for delivering CME certificates.
• The root CA would come up (be powered on) periodically to sign new CME certificates and CRLs, which would be manually copied and moved to the appropriate CME or CRL repository.
Every PKI has a specific policy or set of policies governing its operations. In a traditional PKI such as the one that issues the certificates on Federal Government personal identity verification cards, the policy is documented in what is referred to as a certificate policy (CP). The CP is a document that describes the roles and responsibilities for implementing the PKI, the rules governing how certificates are obtained, the technical requirements for generation and protection of private keys and certificates, and the requirements for audit records and periodic compliance audits. Industries throughout the world that use PKI systems generally follow the X.509 standard as a template for their CPs. The CP for the SCMS PKI has not yet been developed, but the functions, processes, and trust hierarchy discussed in this chapter will need to be incorporated.
21 Communication to and from the root CA only happens periodically. When the root CA is offline, any communications to the root CA are received by an online system, and information is then “sneakerneted" to and from the root CA itself.
Part II SCMS Governance - DRAFT
Intelligent Transportation Systems Joint Program Office U.S. Department of Transportation, Research and Innovative Technology Administration
SCMS Design and Analysis for the Connected Vehicle System | 27
Part II SCMS Governance
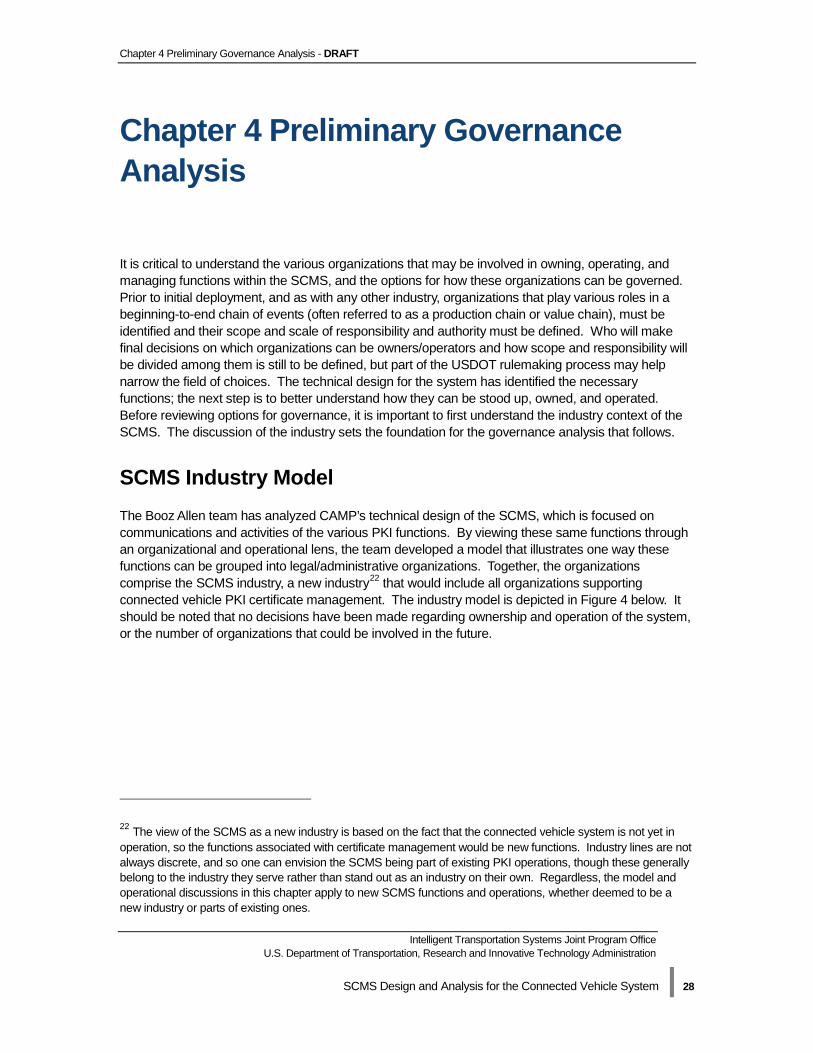
Chapter 4 Preliminary Governance Analysis - DRAFT
Intelligent Transportation Systems Joint Program Office U.S. Department of Transportation, Research and Innovative Technology Administration
SCMS Design and Analysis for the Connected Vehicle System | 28
Chapter 4 Preliminary Governance Analysis
It is critical to understand the various organizations that may be involved in owning, operating, and managing functions within the SCMS, and the options for how these organizations can be governed. Prior to initial deployment, and as with any other industry, organizations that play various roles in a beginning-to-end chain of events (often referred to as a production chain or value chain), must be identified and their scope and scale of responsibility and authority must be defined. Who will make final decisions on which organizations can be owners/operators and how scope and responsibility will be divided among them is still to be defined, but part of the USDOT rulemaking process may help narrow the field of choices. The technical design for the system has identified the necessary functions; the next step is to better understand how they can be stood up, owned, and operated. Before reviewing options for governance, it is important to first understand the industry context of the SCMS. The discussion of the industry sets the foundation for the governance analysis that follows.
SCMS Industry Model The Booz Allen team has analyzed CAMP’s technical design of the SCMS, which is focused on communications and activities of the various PKI functions. By viewing these same functions through an organizational and operational lens, the team developed a model that illustrates one way these functions can be grouped into legal/administrative organizations. Together, the organizations comprise the SCMS industry, a new industry22 that would include all organizations supporting connected vehicle PKI certificate management. The industry model is depicted in Figure 4 below. It should be noted that no decisions have been made regarding ownership and operation of the system, or the number of organizations that could be involved in the future.
22 The view of the SCMS as a new industry is based on the fact that the connected vehicle system is not yet in operation, so the functions associated with certificate management would be new functions. Industry lines are not always discrete, and so one can envision the SCMS being part of existing PKI operations, though these generally belong to the industry they serve rather than stand out as an industry on their own. Regardless, the model and operational discussions in this chapter apply to new SCMS functions and operations, whether deemed to be a new industry or parts of existing ones.
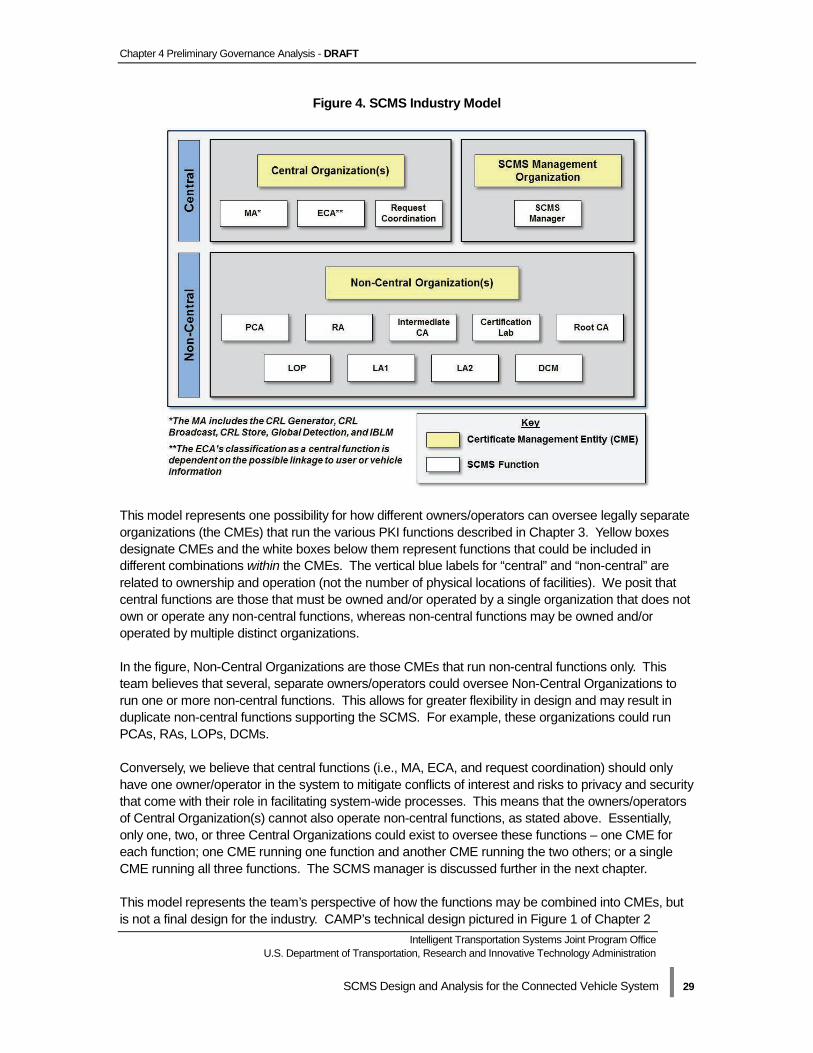
Chapter 4 Preliminary Governance Analysis - DRAFT
Intelligent Transportation Systems Joint Program Office U.S. Department of Transportation, Research and Innovative Technology Administration
SCMS Design and Analysis for the Connected Vehicle System | 29
Figure 4. SCMS Industry Model
This model represents one possibility for how different owners/operators can oversee legally separate organizations (the CMEs) that run the various PKI functions described in Chapter 3. Yellow boxes designate CMEs and the white boxes below them represent functions that could be included in different combinations within the CMEs. The vertical blue labels for “central” and “non-central” are related to ownership and operation (not the number of physical locations of facilities). We posit that central functions are those that must be owned and/or operated by a single organization that does not own or operate any non-central functions, whereas non-central functions may be owned and/or operated by multiple distinct organizations. In the figure, Non-Central Organizations are those CMEs that run non-central functions only. This team believes that several, separate owners/operators could oversee Non-Central Organizations to run one or more non-central functions. This allows for greater flexibility in design and may result in duplicate non-central functions supporting the SCMS. For example, these organizations could run PCAs, RAs, LOPs, DCMs. Conversely, we believe that central functions (i.e., MA, ECA, and request coordination) should only have one owner/operator in the system to mitigate conflicts of interest and risks to privacy and security that come with their role in facilitating system-wide processes. This means that the owners/operators of Central Organization(s) cannot also operate non-central functions, as stated above. Essentially, only one, two, or three Central Organizations could exist to oversee these functions – one CME for each function; one CME running one function and another CME running the two others; or a single CME running all three functions. The SCMS manager is discussed further in the next chapter. This model represents the team’s perspective of how the functions may be combined into CMEs, but is not a final design for the industry. CAMP’s technical design pictured in Figure 1 of Chapter 2

Chapter 4 Preliminary Governance Analysis - DRAFT
Intelligent Transportation Systems Joint Program Office U.S. Department of Transportation, Research and Innovative Technology Administration
SCMS Design and Analysis for the Connected Vehicle System | 30
differentiated between “intrinsically central” and “not intrinsically central” functions. These are primarily technical terms, and do not necessarily translate directly into how functions will or should be implemented from an organizational standpoint. We have not used CAMP’s terms in this part of the analysis. The Booz Allen team and CAMP have taken different approaches to classifying the ECA as central or non-central. In CAMP’s most recent report, they noted that the ECA can be non-central. The Booz Allen team recognizes that at this stage in the development of the SCMS, no decision has been made regarding a potential SCMS linkage to user or vehicle information. Such a linkage impacts how the Booz Allen team views the ECA. If the ECA performs any kind of linkage to user information, then we believe it should be run as a central function (i.e., it should not be owned or operated by any organization that runs other parts of the system).23 In this scenario, it is important for the ECA to be legally separate to decrease the possibility of any bad actor linking sensitive information with the short-term certificates used for V2V communications. If it is decided that no identifying information connection will be made, this team believes that the ECA could be a non-central function. A discussion of information linkage options for the SCMS is included in Chapter 7. The SCMS industry model developed by this team is intended to illustrate our understanding of how the functions can be owned and operated. It is helpful to also understand the wider industry context in which the SCMS will operate, and the organizations with which it will likely interact.
SCMS Industry Context Defining the boundaries of an industry is often more of an art than a science. A company or organization’s activities can involve transactions with partners from a range of different industries. Since the activities of organizations change in response to customer needs and market conditions, industry boundaries are rarely static. In most cases, organizations will align themselves with an industry considered to be the best fit, for legal and tax purposes. At the most basic level, we could define the SCMS industry simply as the CME organizations outlined in Figure 1 that create, store, track, and dispose of certificates. However, this view would be rather narrow, as it does not include organizations that are aligned to other industries but that are critical components of SCMS processes (e.g., bootstrap, device certification). To account for those additional parties with a significant role in security credentials management for the connected vehicle system, the team also includes for consideration the manufacturers of RSE, ASD, and OBE; certification labs that test OBE (and potentially ASDs); 24 organizations supporting the Communications Data Delivery System (CDDS25); auto manufacturers; and others. Although these organizations are not technically a part of the SCMS, their involvement with the SCMS will be subject to the policies and rules set by
23 Note that this implies that any information linkage that may exist in the SCMS would occur only within the ECA. 24 The CAMP SCMS technical design designates the certification lab as an SCMS function. The Booz Allen team has separated it as a unique entity within the industry because its operations are distinct from the other functions which focus more specifically on PKI operations. 25 The CDDS is the network of wireless communications technologies over which V2V and V2I messages will be transmitted, including the communications between the SCMS and OBE. USDOT is considering the use of DSRC, cellular, and Wi-Fi as part of this network of messaging among OBE, the SCMS, and RSE.
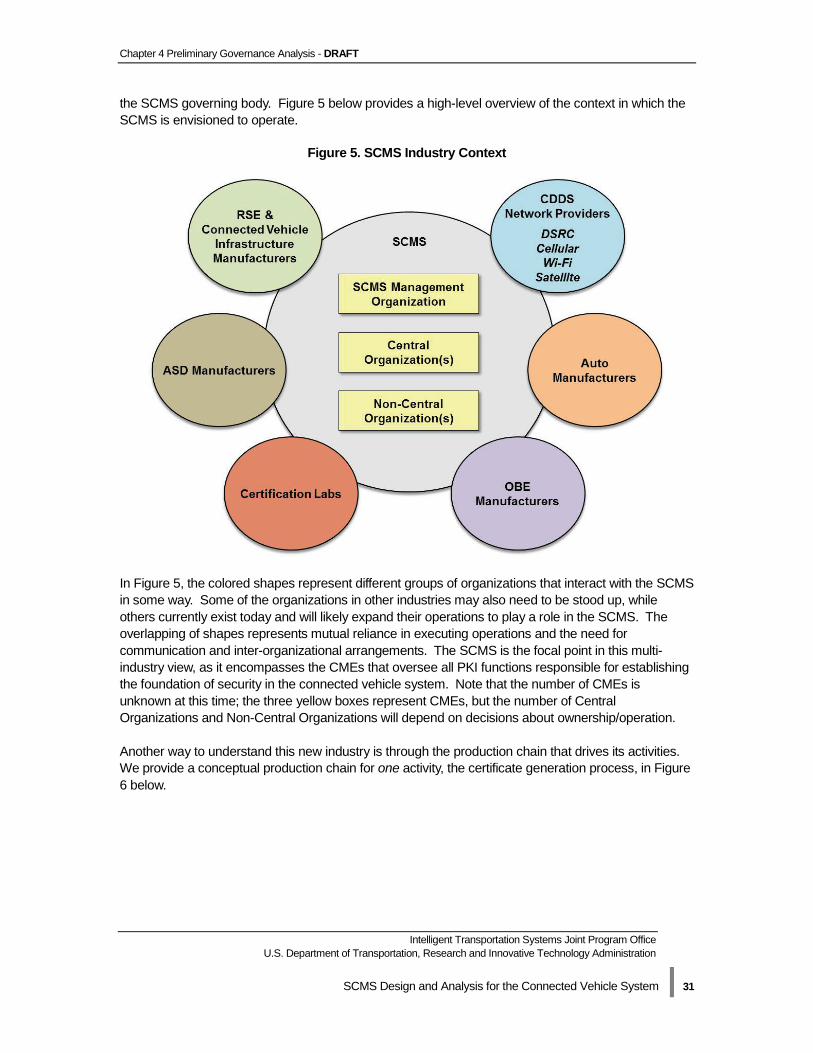
Chapter 4 Preliminary Governance Analysis - DRAFT
Intelligent Transportation Systems Joint Program Office U.S. Department of Transportation, Research and Innovative Technology Administration
SCMS Design and Analysis for the Connected Vehicle System | 31
the SCMS governing body. Figure 5 below provides a high-level overview of the context in which the SCMS is envisioned to operate.
Figure 5. SCMS Industry Context
In Figure 5, the colored shapes represent different groups of organizations that interact with the SCMS in some way. Some of the organizations in other industries may also need to be stood up, while others currently exist today and will likely expand their operations to play a role in the SCMS. The overlapping of shapes represents mutual reliance in executing operations and the need for communication and inter-organizational arrangements. The SCMS is the focal point in this multi-industry view, as it encompasses the CMEs that oversee all PKI functions responsible for establishing the foundation of security in the connected vehicle system. Note that the number of CMEs is unknown at this time; the three yellow boxes represent CMEs, but the number of Central Organizations and Non-Central Organizations will depend on decisions about ownership/operation. Another way to understand this new industry is through the production chain that drives its activities. We provide a conceptual production chain for one activity, the certificate generation process, in Figure 6 below.
Chapter 4 Preliminary Governance Analysis - DRAFT
Intelligent Transportation Systems Joint Program Office U.S. Department of Transportation, Research and Innovative Technology Administration
SCMS Design and Analysis for the Connected Vehicle System | 32
Figure 6. Certificate Generation Production Chain
The certificate generation process is one of the primary duties of the CMEs within the SCMS. This process has been analyzed at length by this team and technical teams in previous analyses, but the intention of Figure 6 is to focus on the high-level view of the activity within the context of the SCMS industry and parallel industries. The row of chevrons across the top of the figure names the different steps in the process, while the colored boxes below represent the industry participants that are involved in each step. It is clear that there will be interfaces with other industry participants, and that disparate pieces of the connected vehicle system, with different owners and operators, will need to interact. Although Figures 5 and 6 demonstrate how different industry participants are involved, the discussions of governance in this report are related primarily to the policies and standards that will be adopted for the SCMS.
Industry Governance versus Organizational Governance There are different levels of governance that take place in any industry. We use the term “industry governance” to refer to the standards, policies, compliance requirements, and shared expectations for all organizations that play a role in an industry. Separately, “organizational governance” takes place at the level of each organization involved in the industry. It is carried out by the owners of specific organizations (e.g., companies, nonprofit entities). Distinguishing between these two levels of governance is important; the way an industry is governed will often impact the way that organizational governance takes place. These terms are distinguished below for clarity:
The team largely focuses on industry governance in this report; however, we do explore the organizational governance of the SCMS manager in Chapter 5. This is because the SCMS manager is the most likely candidate within the SCMS technical design to play a leading role in industry governance, although the extent of that role is still under investigation. Many of the questions that will be answered by the industry governance structure for the SCMS are included here:
• How and by whom are decisions made about various policies, standards, requirements, and practices?

Chapter 4 Preliminary Governance Analysis - DRAFT
Intelligent Transportation Systems Joint Program Office U.S. Department of Transportation, Research and Innovative Technology Administration
SCMS Design and Analysis for the Connected Vehicle System | 33
• Who has the authority to mandate and enforce compliance with the policies, standards, and industry requirements?
• Who makes up the overseeing financial, legal, management, and executive operations of the entities in the SCMS?
• Is there a central industry body and, if so, who oversees it? Who is part of this central industry body?
• How do the various entities interact with each other? • How is risk and liability allocated across the organizations? • Who will own the intellectual property (data and software) of the system and how will it be
licensed (allocated) among responsible entities?
Industry Governance Options There are three fundamental options for industry governance: public, public-private partnership, and private. These descriptions relate to the level of involvement of the Federal (and often State) Government in the oversight, setting of policies, rules, standards, procedures, and operational practices, as well as the funding sources and compliance authority within the industry.26
Public Governance
A public governance structure is one determined and administered by a Federal or State Government. The appropriate government agency or agencies decide on standards, policies, requirements, organizational interactions, rules of access and partnership, and other compliance and enforcement policies. When establishing new public activities, operations could potentially be added to existing federal or state departments or agencies with similar missions, or new structures could be established altogether. Under a public governance model, the resource needs and other organizational design elements that are inherent in the implementation of new activities will be based on legislative authority of an agency. The implications of this type of governance structure include, but are not limited to:
• The government or its agents decide and enforce policies about ownership of and access to data, communications protocols, sources of funds, and user protections, among other aspects of the new activities and organizations.
• The government or its agents perform administration and management of the industry organizations and their functions, interactions, and connections with users.
• The government determines misbehavior consequences and carries out potential prosecution.
• Funding comes from public sources. • Policies will be based on compliance with all federal standards for management and
organizational operations.
Public-Private Partnership Governance 26 The descriptions of various industry governance models come from the following references: Drucker, P. The Practice of Management. New York: Harper & Row, 1954; Fayol, H. General and Industrial Management. London: Pitman, 1949; Lawrence, P. R., and J. W. Lorsch. Organization and Environment. Cambridge: Harvard Graduate School of Business Administration, 1967; Mintzberg, H. The Structuring of Organizations. Englewood Cliffs, NJ: Prentice Hall, 1979. Additional sources are referenced throughout the descriptions.
Chapter 4 Preliminary Governance Analysis - DRAFT
Intelligent Transportation Systems Joint Program Office U.S. Department of Transportation, Research and Innovative Technology Administration
SCMS Design and Analysis for the Connected Vehicle System | 34
A hybrid oversight structure is one that combines relevant elements of both public and private structures. The ways in which these elements can be combined are myriad and open to discussion; the government and its partners must decide on which areas of oversight, authority, responsibility, roles, and enforcement each entity will have under its purview. A hybrid governance structure would share the rule and decision-making roles and the enforcement and standards setting between government and private organizations or their representatives.27 In addition, the funding levels and the funding sources will be in large part determined and drawn from the split of activities between the different public and private parties that are involved. No matter what the implementation of a public-private partnership, the general practice is for the Federal and/or State Government to hold the ultimate authority and decision-making power, with various responsibilities delegated to its private partner(s). The implications of this kind of governance structure include:
• There is a need for tight coordination between government and private industry. • There is a need for clear lines of authority between the two types of oversight. • Cost implications are uncertain as funding sources and levels depend on which parts of the
industry are overseen by public entities and which are overseen by private entities.
Private Governance
In a private governance structure, industry players will need to maintain compliance with and enforcement of existing federal and state industry regulations, but they may also form a coalition or interagency group to select and enforce additional standards and processes. In this form of self-governance, together the organizations decide on standards, codes of conduct, expectations, and other norms that guide business processes and the activities of the production chain. In addition, an interagency group would likely decide on and participate in recommendations about resource management and costs for the industry and its governing body. Many commercial industries today operate in this way, supplementing public mandates and laws with governing bodies that act as ethics, standards, code-making, and enforcement bodies. Corporate self-regulation has been analyzed for years as an effective alternative to direct regulation from the government.28 An important feature of a private governance structure is that it reduces the involvement of the Federal Government and therefore reduces the disruption to private business operations and the cost to the taxpayers for managing, administering, and enforcing rules within and across the industry.29 The implications of this kind of governance structure include:
• Costs would likely be lower and implementation processes would likely be more streamlined due to the lack of federal workplace regulations and processes.
• There is a need for clear monitoring and enforcement of standards and processes, potentially with an additional level of oversight or review/audit to be able to illustrate, to all players, that self-governance is meeting the coalition/interagency group’s requirements.
• There is a need for agreements across jurisdictions, organizations, and areas of oversight so as to ensure smooth operations and reduced communications or collaboration challenges.
27 Catherine E. Rudder, “Private Governance as Public Policy: A Paradigmatic Shift,” The Journal of Politics 70, no. 4 (2008): 901, http://www.jstor.org/stable/30219474. 28 Anil K. Gupta and Lawrence J. Lad, “Industry Self-regulation: An Economic, Organizational, and Political Analysis,” The Academy of Management Review 8, no. 3 (1983): 417, http://www.jstor.org/stable/257830. 29 John C. Ruhnka and Heidi Boerstler, “Governmental Incentives for Corporate Self-Regulation,” Journal of Business Ethics 17, no. 3 (1998): 310, http://www.jstor.org/stable/25073080.
Chapter 4 Preliminary Governance Analysis - DRAFT
Intelligent Transportation Systems Joint Program Office U.S. Department of Transportation, Research and Innovative Technology Administration
SCMS Design and Analysis for the Connected Vehicle System | 35
Private Governance for the SCMS
The Booz Allen team was asked to evaluate the scenario where private organizations, such as companies, will own and operate the SCMS functions reviewed in the previous chapter. These function owners/operators will be subject to any relevant federal and state regulations, policies, and standards (e.g., technical and security standards), but beyond that, there is the potential for self-governance through mutual agreements. The SCMS manager function will likely play a prominent role in self-governance under a private scenario. We include a deeper discussion of the SCMS manager in Chapter 5.
Comparative Industry Governance Examples The team explored several private industries to glean lessons related to self-governance that could be applied to the envisioned SCMS industry. There is no one-to-one match for the SCMS; the connected vehicle PKI system will reach a scale and number of users that is unprecedented. However, different private industries demonstrate similar features. There exist today several industries featuring technical systems that serve millions of individual customers while maintaining security and privacy at appropriate levels and complying with the law. Here we review the high level findings from our analysis of two industries – the payment card industry and the hospital industry – for their relevance to the SCMS.
Payment Card Industry Findings
Payment cards are used by millions of consumers to electronically pay merchants for goods or services. The term “payment cards” refers to credit cards, debit cards, and prepaid cards, among others.30 Like the future SCMS, companies known as payment card brands (e.g., Visa Inc. ®31) operate massive data systems that bring together different parties (i.e., acquiring banks and issuing banks) to exchange information and sensitive data. Though regulations do play a role in guiding certain aspects of the industry’s operations, such as setting the interchange fee ceiling, the industry’s self-governance through the Payment Card Industry (PCI) Security Standards Council (SSC) has been instrumental in the development of security standards intended to benefit cardholders and all who are involved in payment card transactions. The PCI SSC is an open global forum and a prominent trade association founded by the five leading international payment card brands: American Express®,32 Discover Financial Services®,33 JCB International, MasterCard Worldwide®,34 and Visa. The organization was formed in the mid-2000s by these private companies after data breaches revealed that security was inconsistent at different points during payment transactions. Although PCI SSC is not a governmental body, it was encouraged by
30 Federal Reserve Bank of Philadelphia, Consumer Topics: What You Need to Know About Payment Cards, http://www.philadelphiafed.org/consumer-resources/topics/index.cfm?tab=2. 31 Visa Inc.® is a registered trademark of Visa International Service Association. 32 American Express® is a registered trademark of the American Express Company. 33 Discover® is a registered trademark of Discover Financial Services. 34 MasterCard® is a registered trademark of MasterCard Worldwide.

Chapter 4 Preliminary Governance Analysis - DRAFT
Intelligent Transportation Systems Joint Program Office U.S. Department of Transportation, Research and Innovative Technology Administration
SCMS Design and Analysis for the Connected Vehicle System | 36
the Federal Government through the National Technology Transfer and Advancement Act of 1995, which advocated for the development and adoption of voluntary standards from the private sector.35 PCI SSC operates as a non-profit organization run by an Executive Committee comprised of representatives from the five founding brands, as well as a Board of Advisors featuring representatives from numerous other industries. Any interested stakeholder can participate in the PCI SSC at different levels of membership, each of which requires an annual fee. The role of the PCI SSC is limited to setting industry-wide security standards and auditing standards through collaboration and consensus among members, and providing education and training to the larger industry. PCI SSC does not play an enforcement role; enforcement of the standards through compliance programs, and imposing of non-compliance penalties such as fines, is the responsibility of individual payment card brands.36 The standards developed by the PCI SSC, most notably PCI Data Security Standard (DSS), are widely applicable because money collection through payment card transactions touches such a vast array of industries. PCI DSS lists 12 requirements related to safe practices for how cardholder data must be stored, processed, and transmitted in the systems of merchants and service providers (i.e., third parties who process credit card transactions with consumers). The standard also requires system scans as well as internal and external compliance audits, depending on transaction volume. The five leading payment card brands have made PCI DSS compliance mandatory in their agreements with merchants and service providers, in effect making the voluntary industry standard a requirement. Adherence to existing laws and regulations37 represents the minimum standard of participation in any industry, but the PCI SSC illustrates that private companies can develop additional standards, practices, and procedures to augment regulations and respond to consumer concerns. One could envision a similar situation for the SCMS – a minimum set of security and/or privacy thresholds set by government, with additional shared practices, procedures, compliance auditing, and further evolution of standards to meet a wider set of consumer (and possible governmental) concerns or needs defined by industry. A governing body (potentially the SCMS manager in the case of the SCMS industry) provides an opportunity for representatives from all interested parties to have a say in the development of these standards and policies, ensuring stakeholder perspectives are well represented. Different options for industry self-governing bodies are further discussed in Chapter 5. Although violations of the security of payment cards do still occur and there are critics of the details of PCI DSS,38 the industry continues to respond and evolve as technical needs change. The fundamental lesson we can glean from this example is that there are ways in which private
35 Martin Bradley and Alexander Dent, “Payment Card Industry Data Security Standard (PCI DSS) – What It Is and Its Impact on Retail Merchants,” 2010, 4, http://www.computerweekly.com/feature/The-real-cost-of-PCI-DSS-compliance. 36 PCI SSC, For Merchants, https://www.pcisecuritystandards.org/merchants/index.php. 37 Regulations at both the Federal and State levels impact the payment card industry. Examples include the Financial Services Modernization Act of 1999 (Gramm-Leach-Bliley Act, P.L. 106-102); the Dodd-Frank Wall Street Reform and Consumer Protection Act (P.L. 111-203); the Credit Card Accountability, Responsibility, and Disclosure Act of 2009 (Credit CARD Act, P.L. 111-24); and the Electronic Fund Transfer Act of 1978 (EFTA, 15 USC 1693 et seq.). 38 Martin Bradley and Alexander Dent, “Payment Card Industry Data Security Standard (PCI DSS) – What It Is and Its Impact on Retail Merchants,” 5-7.
Chapter 4 Preliminary Governance Analysis - DRAFT
Intelligent Transportation Systems Joint Program Office U.S. Department of Transportation, Research and Innovative Technology Administration
SCMS Design and Analysis for the Connected Vehicle System | 37
organizations have come together to set privacy and security standards to ensure protection against unauthorized access to sensitive data.
Hospital Industry Findings
Hospitals are facilities where physicians and staff provide treatment for sick or injured patients, and where medical procedures are performed on an in-patient or out-patient basis. The hospital industry can provide a relevant example of self-governance for the SCMS; although it is heavily influenced by federal and state regulations, it is primarily a private industry. Hospitals may operate as either for-profit or nonprofit entities. Like the SCMS, user privacy and information security is critical, and hospitals must continuously serve a range of consumers – there is consistently high demand. Despite its complexity, the industry manages the various levels of healthcare laws and regulations. After successfully acquiring a license to operate from the relevant state government, any hospital seeking to be certified as a provider to patients who qualify for Medicare and Medicaid must prove that it meets the Medicare Conditions of Participation (CoPs), a set of operating standards developed by the Centers for Medicaid and Medicare Services (CMS). Hospitals can be evaluated by the relevant CMS State Survey Agency for compliance with the CoPs, or they can seek accreditation from a CMS-approved accreditation organization.39 The term “accreditation” in this industry refers to the voluntary evaluation that a hospital can undergo to confirm that it is compliant with these federal standards. Accreditation organizations that create hospital standards and audit processes illustrate how private industry can supplement basic safety and medical standards developed by the Federal and/or State Government. Many hospitals voluntarily seek accreditation, beyond what is required by the CoPs and regulations,40 to demonstrate the quality of their services and increase trust among existing and potential customers. In addition, the accreditation process can help a hospital by improving its business operations, enhancing staff education through professional advice and counsel, and potentially reducing liability insurance costs, among other benefits.41 One example of an approved accreditation organization is The Joint Commission (TJC). TJC, founded in 1951, is perhaps the most prominent accreditation organization, as it is “the nation’s oldest and largest standards-setting and accrediting body in healthcare.”42 TJC operates as an independent, nonprofit organization that accredits and certifies more than 20,000 healthcare
39 Currently there are four CMS-approved accreditation organizations for hospitals: Center for Improvement in Healthcare Quality, Det Norske Veritas Healthcare, Inc., Healthcare Facilities Accreditation Program, and The Joint Commission. 40 Regulations at both the Federal and State levels impact the hospital industry. Examples include the Emergency Medical Treatment & Labor Act (EMTALA), part of the Consolidated Omnibus Budget Reconciliation Act of 1985 (COBRA, P.L. 99-272); the Health Insurance Portability and Accountability Act of 1996 (HIPAA, P.L. 104-191); the Health Information Technology for Economic and Clinical Health (HITECH) Act, part of the American Recovery and Reinvestment Act of 2009 (ARRA, P.L. 111-5); and the Patient Protection and Affordable Care Act of 2010 (PPACA, P.L. 111-48). 41 The Joint Commission, Facts about the Joint Commission, http://www.jointcommission.org/facts_about_the_joint_commission/. 42 Ibid.
Chapter 4 Preliminary Governance Analysis - DRAFT
Intelligent Transportation Systems Joint Program Office U.S. Department of Transportation, Research and Innovative Technology Administration
SCMS Design and Analysis for the Connected Vehicle System | 38
organizations and programs (hospitals and others) in the U.S.43 Many state governments have recognized the value of TJC accreditation and incorporated it into their requirements for state licensure. TJC is led by a board of commissioners made up of 32 members from a range of backgrounds across healthcare, business, and public policy (e.g., physicians, administrators, a labor representative, a consumer advocate, and various others).44 The commission is organized into eight committees that collaborate on different areas of standards development. Each year, the commission releases new standards manuals that hospitals must meet to gain voluntary accreditation from TJC. The hospital accreditation guidelines specify requirements for inspections (i.e., audits – referred to as “surveys”) every three years by a TJC surveyor; surveys may also be unannounced. Hospitals that fail to meet the standards can operate, but lose accreditation status, which may impact their eligibility as a Medicare provider. Accreditation by TJC allows a hospital to display the Gold Seal of Approval®,45 which can give the organization a competitive edge in the marketplace. Many of the results of TJC surveys are made available online to consumers, which increases the transparency of the accreditation process and helps potential patients make informed decisions about where to seek treatment. Although the industry lacks a central self-governing organization, these independent, private accreditation bodies that provide credibility to individual hospitals can potentially be modeled for the SCMS. Like the approved accreditation organizations, new organizations in the SCMS industry could add to any future government-initiated regulations and standards by providing technical and policy standards that increase safety for users and improve the security of the CMEs within the SCMS. More information about auditing within the SCMS can be found in Chapter 6. As demonstrated by the payment card and hospital industries, there are numerous ways that private industry organizations have developed to self-govern and address critical concerns and needs of their customers or users. Often these are the same concerns that a government entity would have. It is in the best interest of organizations to develop and adhere to strong protections to maintain their ability to meet user needs, stay in business, work with other organizations that are critical to their operations, and avoid unnecessary and burdensome future consequences. A central governing body with representation from a broad set of industry members that develops needed standards can provide a collaborative system to ensure that all stakeholders are represented and critical issues are addressed at an industry-wide level. The private industry examples we evaluated here can also be analyzed for how privacy is addressed in these industries. We touch on this topic further in Chapter 7.
43 The Joint Commission, About the Joint Commission, http://www.jointcommission.org/about_us/about_the_joint_commission_main.aspx. 44 The Joint Commission, Facts about the Board of Commissioners, http://www.jointcommission.org/facts_about_the_board_of_commissioners/. 45 The Gold Seal of Approval® is a registered trademark of The Joint Commission.

Chapter 5 SCMS Manager Analysis - DRAFT
Intelligent Transportation Systems Joint Program Office U.S. Department of Transportation, Research and Innovative Technology Administration
SCMS Design and Analysis for the Connected Vehicle System | 39
Chapter 5 SCMS Manager Analysis
As stated previously, the team is conducting this analysis under the assumption that the SCMS industry will be private (rather than public or public-private hybrid), and that the SCMS manager will serve as the industry governance body. In CAMP’s technical design, this central function is intended to serve as the body that sets policy46 and technical standards for the entire SCMS. We believe that the other organizations that interact with the SCMS will also be subject to the policies of the SCMS manager, ensuring consistency and interoperability. The specification of a private governance structure is a first critical step in understanding how the industry will operate. The next step is to investigate the role of the SCMS manager at a deeper level. By analyzing lessons learned from the private industry examples and accounting for what has already been specified by technical teams, we can begin to define the organizational design of this industry governance body. In analyzing the potential organizational governance structure of the SCMS manager, we build on the discussion of the SCMS industry governance in the last chapter and focus on a more granular level of governance of one organization. Up until this point, we have used the term “function” to refer to the SCMS PKI functions described in Chapter 3 (referred to as pseudonym functions and bootstrap functions). The word “function” is also used in organizational governance analysis to describe the different areas of operations within a specific organization. In this chapter alone, we discuss the “organizational functions” of the SCMS manager. We have elected to use this terminology because it is the commonly used in organization design theory. Elsewhere in the report, the term “function” refers to the SCMS PKI functions previously reviewed.
Organization Design Planning Prior to examining the role and structure of the SCMS manager in depth, it is important to understand what is needed to design a new organization and how the organization design process can work. Planners face many questions when contemplating how to stand up a new organization, some of which include:
• What will be the organizational structure? • What function(s) should the organization perform? • What is the purpose and mission of the organization? • What are the most critical organizational elements that need to be in place? • Who will take on leadership roles in the organization? • How can the new organization be high-performing, directed, and efficient from the onset? • What are the various roles and responsibilities of the different functions and layers of internal
hierarchy or structure?
46 By “policy,” we are referring to policies that specify business operations and procedures, rather than laws and regulations.

Chapter 5 SCMS Manager Analysis - DRAFT
Intelligent Transportation Systems Joint Program Office U.S. Department of Transportation, Research and Innovative Technology Administration
SCMS Design and Analysis for the Connected Vehicle System | 40
• How will the organization be funded and pay for its operations? Organizational design is a multi-dimensional approach to examining an organization’s purpose, strategy, and functions to ensure that resources are managed and aligned appropriately and that the structure is reflective of the organization’s needs. A clear and robust organization design plan can aid the future owners/operators of the SCMS manager as they:
1. Analyze organizational inputs such as relevant laws and regulations and stakeholder needs and capabilities
2. Determine the purpose and strategy of the organization o An organization’s strategy drives its structure. Developing a focused mission and vision
is an important early step in forming a strategy. o Stakeholder analysis can support this process and inform other parts of the design
process by providing an understanding of how various stakeholder needs can be met 3. Identify the various organizational functions and production chain that support the
organization’s activities o Definition of the functions of the organization and the production chain (i.e., sequence of
activities) necessary to accomplish those functions will help to determine how the purpose and strategy will be pursued
o Conceptual organizational models can be developed to analyze possible structures and roles and responsibilities, as well as the pros and cons of different approaches
4. Allocate resources to meet the organization’s needs o Resources such as budget, workforce, IT systems, and physical infrastructure should be
allocated based on relative priority and value to the organization 5. Specify how execution and management will occur
o This includes how business processes of the organization are set, communicated, and overseen and who is responsible for management and operations
6. Produce organizational outputs – the products and/or services provided by the organization In the following section we review what is known at this time about the organization design for the SCMS manager in each of the six areas listed above.
SCMS Manager Organization Design Considerations The work to date by this team and technical groups such as CAMP47 has included some references to different requirements for the SCMS manager organization. We first describe these requirements as they align to the organizational design elements outlined in the previous section. Later in this chapter, we draw upon the previously reviewed private industry examples to analyze an illustrative organizational model that could be used for the SCMS manager.
Organizational Inputs
Organizational inputs for the SCMS manager can come from a number of different sources – stakeholders, Federal and/or State Governments, international standards groups, etc. At this point, the most relevant input for the SCMS manager is the Federal Motor Vehicle Safety Standard (FMVSS)
47 CAMP, “Task 5 Extension: Security Credentials Management System: Draft 0.5.”
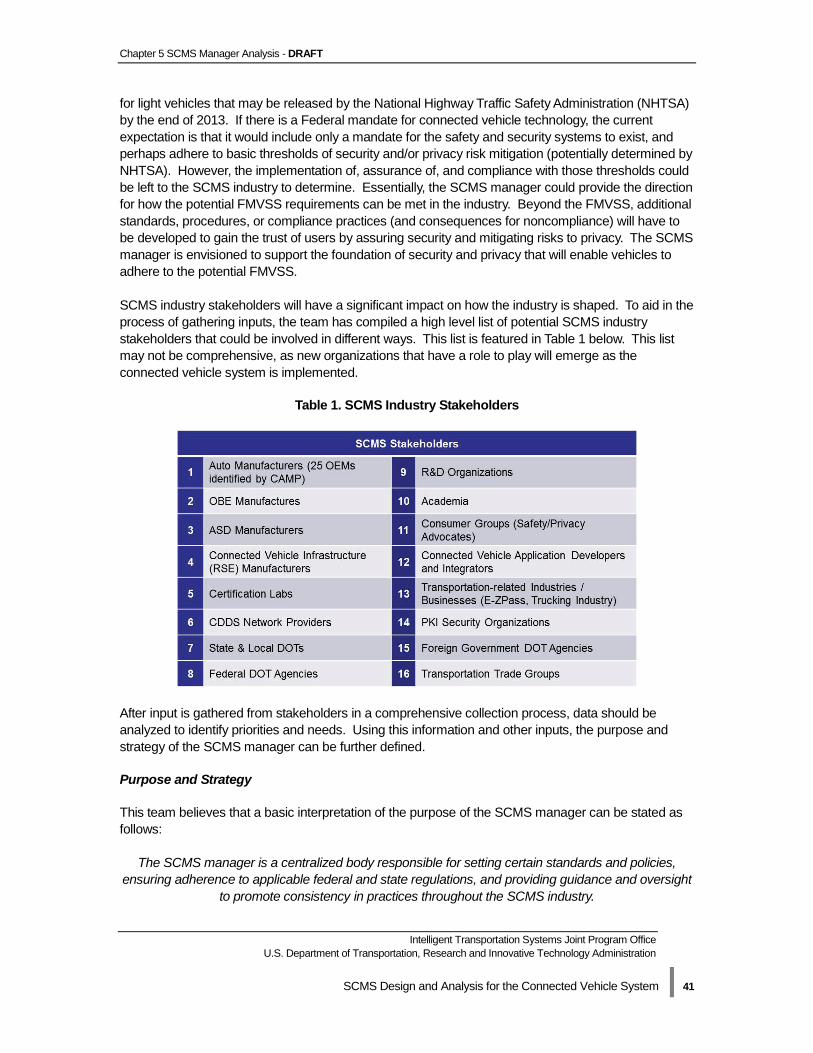
Chapter 5 SCMS Manager Analysis - DRAFT
Intelligent Transportation Systems Joint Program Office U.S. Department of Transportation, Research and Innovative Technology Administration
SCMS Design and Analysis for the Connected Vehicle System | 41
for light vehicles that may be released by the National Highway Traffic Safety Administration (NHTSA) by the end of 2013. If there is a Federal mandate for connected vehicle technology, the current expectation is that it would include only a mandate for the safety and security systems to exist, and perhaps adhere to basic thresholds of security and/or privacy risk mitigation (potentially determined by NHTSA). However, the implementation of, assurance of, and compliance with those thresholds could be left to the SCMS industry to determine. Essentially, the SCMS manager could provide the direction for how the potential FMVSS requirements can be met in the industry. Beyond the FMVSS, additional standards, procedures, or compliance practices (and consequences for noncompliance) will have to be developed to gain the trust of users by assuring security and mitigating risks to privacy. The SCMS manager is envisioned to support the foundation of security and privacy that will enable vehicles to adhere to the potential FMVSS. SCMS industry stakeholders will have a significant impact on how the industry is shaped. To aid in the process of gathering inputs, the team has compiled a high level list of potential SCMS industry stakeholders that could be involved in different ways. This list is featured in Table 1 below. This list may not be comprehensive, as new organizations that have a role to play will emerge as the connected vehicle system is implemented.
Table 1. SCMS Industry Stakeholders
After input is gathered from stakeholders in a comprehensive collection process, data should be analyzed to identify priorities and needs. Using this information and other inputs, the purpose and strategy of the SCMS manager can be further defined.
Purpose and Strategy
This team believes that a basic interpretation of the purpose of the SCMS manager can be stated as follows:
The SCMS manager is a centralized body responsible for setting certain standards and policies, ensuring adherence to applicable federal and state regulations, and providing guidance and oversight
to promote consistency in practices throughout the SCMS industry.
Chapter 5 SCMS Manager Analysis - DRAFT
Intelligent Transportation Systems Joint Program Office U.S. Department of Transportation, Research and Innovative Technology Administration
SCMS Design and Analysis for the Connected Vehicle System | 42
The SCMS manager will influence both technical and policy aspects of the entire SCMS industry. Defining the specific mission, vision, and goals (both short-term and long-term) of the organization should be top priorities for the planners of the SCMS manager. The strategy of any organization is rooted in its purpose and defines its direction and goals. Based on our current understanding, elements of the strategy for the SCMS manager will likely include, but are not limited to, the following:
• Develop industry-wide policies and standards that assure interoperability of technology and maintain security and privacy in CME operations
• Set performance requirements for all industry participants • Enforce compliance with requirements, standards, and policies throughout the SCMS • Assure open, informative, and consistent dissemination of information to all stakeholders
Organizational Functions and Production Chain
Although every responsibility of the SCMS manager has not yet been defined, the team has reviewed the latest SCMS analyses from CAMP and the Vehicle Infrastructure Integration Consortium (VIIC) from an organizational design perspective to develop an initial list of its organizational functions. The finalized design requirements will need to be set by planners responsible for developing the structure and policies of the SCMS manager. We believe that responsibilities of the SCMS manager can be categorized according to the following functional areas:
• Policies, Procedures, and Standards Development – Within the Policies, Procedures, and Standards Development function, there will likely be a split between technical and policy duties where policy will include management, auditing, security, privacy, etc. The examples provided below include both technical and policy areas of standards, procedures, and policies. o International coordination sub-function
It is anticipated that the connected vehicle system will eventually cross national borders. This implies that the SCMS manager should be able to accommodate cross-border coordination with any foreign certificate management governing bodies that may exist or come into being in North America. Harmonization of standards across borders will be imperative in ensuring interoperability of the system.
Harmonization with other countries (i.e., those outside North America) is also anticipated to be part of the international connected vehicle system, and this sub-function would maintain that level of coordination and communication.
o CP (certificate policy) development and maintenance sub-function As part of the technical oversight, there will be a need to develop, adopt, and
maintain the SCMS PKI CP, which is the basis for how the PKI system is designed and implemented. This sub-function can ensure that the policy is written and updated in accordance with any related PKI standards, such as X.509. Regular updates (i.e., annual) should be made to the CP and applied throughout the SCMS PKI.
o System Resilience & Redundancy sub-function Redundancy, which will impact the number of facility locations of CMEs, will be
needed to ensure that the system continues to run efficiently even during circumstances when the system is down (e.g., natural disasters). Ensuring that system architects can respond quickly and effectively will support system resiliency.
Chapter 5 SCMS Manager Analysis - DRAFT
Intelligent Transportation Systems Joint Program Office U.S. Department of Transportation, Research and Innovative Technology Administration
SCMS Design and Analysis for the Connected Vehicle System | 43
o Issuing policy decisions and technical guidelines Publishing the device certification policy and other technical guidelines, which will
potentially be based on a NHTSA regulation, will be required. Updating these policies as needed is critical to ensuring all parties are in compliance.
o Establishing and enforcing minimum level of security requirements Creating, maintaining, and enforcing a minimum level of security for multiple pieces
of the system will ensure that all parties adhere to strict requirements. Minimum levels of security are needed for devices and SCMS components, distribution of information and messages, new security formats or protocols, setting classes of misbehavior, and other areas.
o Overseeing and facilitating trust distribution procedures for the system Trust distribution within the system will be included in the SCMS CP since it allows
SCMS functions to sign certificates and authorize users to participate in the system. Therefore, responsibilities such as managing root CAs and specifying security standards for them, approving and adding new CMEs, revoking and removing existing CMEs and informing affected system components will be the responsibility of the SCMS manager.
• Financial Management – Financial management is concerned with planning, organizing, and controlling finances within the organization. Providing information to make decisions, managing risk, and improving operational controls are just a few objectives that the SCMS manager should try and meet. Having sound financial management practices in place will ensure the SCMS manager carries out its transactions in accordance with applicable legislation or other regulations, particularly since there could be funding from different sources (e.g., tax revenues).
• Marketing and Communications – Communications and outreach to both internal and external stakeholders will occur periodically to notify affected devices when policies, standards, or security protocols change, or to communicate policy and technical decisions (i.e., rules and guidelines) to all CMEs. Communication with all stakeholders is essential in ensuring adoption, user buy-in, and that the SCMS manager meets its mission.
• Compliance and Oversight – After developing the CP and defining the technical and policy standards that must be followed by all CMEs, the SCMS manager could create an auditing program that would meet the requirements of the CP and any additional standards. Auditing is what validates that the security measures spelled out on paper in the CP are actually in practice at the organizational level by CMEs. Additional information about auditing within the SCMS is included in Chapter 6. Enforcement of penalties for noncompliance may go beyond the authority of the SCMS manager, especially if criminal activity is involved. General oversight by the SCMS manager will ensure that CMEs are sharing information in accordance with the CP.
• Privacy Protection – Because maintaining user privacy at an appropriate level is paramount to maintain user trust, the team split privacy protection into its own separate function for the SCMS manager. o The SCMS manager could develop a privacy policy to outline how privacy should be
managed and how risks to privacy should be mitigated throughout the industry. CMEs should be audited in accordance with the privacy policy and technical protections outlined in the SCMS CP.
o If a decision is made to collect identifying information (e.g., VIN, vehicle make/model/year and/or OBE production lot) as part of a user’s participation in the connected vehicle system, the SCMS manager will need to account for this connection in its privacy policy
Chapter 5 SCMS Manager Analysis - DRAFT
Intelligent Transportation Systems Joint Program Office U.S. Department of Transportation, Research and Innovative Technology Administration
SCMS Design and Analysis for the Connected Vehicle System | 44
o Depending on any potential regulation set by NHTSA, there may also be a regulatory compliance aspect to protecting the privacy of users.
In Chapter 4, the team reviewed the production chain for one activity within the SCMS industry – the certificate generation process. Defining a detailed production chain for the SCMS manager itself will help planners understand how inputs to the organization are translated into outputs. Though developing a production chain is out of scope for this analysis, it would be useful moving forward to understand the transactions within the divisions of the SCMS manager and with external parties.
Resources
Resources for any organization can be classified into various categories – budget and funding, workforce, IT systems, physical infrastructure, assets, etc. As previously mentioned, planners should allocate resources based on relative priority and value to the organization, which can be derived from a carefully constructed purpose and strategy. Private industry governance organizations may be comprised of some full time staff and some volunteer representatives from industry. Funding is sometimes raised through fees for membership in the industry governance organization, although the full implications of membership fees would need to be better understood to ensure that they are not seen as a barrier to participation. While a principle of the connected vehicle system is that there will be no subscription fees to users for safety applications,48 at this point in the analysis, development of a full resource plan for the SCMS manager is still premature. It will be heavily influenced by owners/operators of the system.
Execution and Management
The study of organization design can assist planners with the crucial step of setting policies for execution and management within a new organization. An organization’s management and system of executing on the mission will identify who is responsible for running the organization and setting internal operational policies and standards, the processes these leaders must follow, and the performance standards to which they will be held. Execution and management functions in private industry are often structured differently than in the public sector, as the industry is somewhat responsible for designing itself. CAMP refers to execution and management at a high level in their most recent report. When describing the standup of the SCMS manager, they note that, “An appropriately credible organization establishes the SCMS manager body, with guidelines as to its scope, terms of reference, powers, procedures and responsibilities. The SCMS manager is staffed with its initial personnel and issues initial policies.”49 At this point, the “appropriately credible organization” has not yet been set, but it will likely come together following the potential FMVSS and may be initiated by auto manufacturers. It is important to note that in the absence of specific government guidance, industries develop organically and all players arrive at equilibrium structures based on acceptability to those within the industry. Execution and management are closely tied to ownership and operation. The SCMS manager could set rules and guidelines about who is eligible to own and operate the CMEs and how those 48 RITA website, Principles for a Connected Vehicle Environment: Discussion Document, http://www.its.dot.gov/connected_vehicle/principles_connectedvehicle_environment.htm. 49 CAMP, “Task 5 Extension: Security Credentials Management System: Draft 0.5,” 85.
Chapter 5 SCMS Manager Analysis - DRAFT
Intelligent Transportation Systems Joint Program Office U.S. Department of Transportation, Research and Innovative Technology Administration
SCMS Design and Analysis for the Connected Vehicle System | 45
owners/operators will interact with existing private companies that are part of the industry (e.g., auto manufacturers). Relatedly, the SCMS manager could determine if existing organizations themselves can also become owners/operators of SCMS CMEs. The discussion of ownership/operation relates back to Chapter 4, and is worth describing in more detail here. Figure 4 in Chapter 4 depicts this team’s industry model for the SCMS, and identifies how we believe the SCMS functions should be categorized as central or non-central. This distinction is important as it impacts ownership/operation decisions and ultimately the integrity of the system. We believe that the same organization that runs a non-central function (such as an individual auto manufacturer operating a RA, PCA, etc.) should not also independently and exclusively own or operate a central function, such as the SCMS manager. The need for separation is based on the potential of a fundamental conflict of interest and the reasons why a function would be classified as central in the first place. Central functions are responsible for executing activities that involve and impact the entire system (e.g., misbehavior investigation, revocation, and bootstrapping). It is best practice in many (if not all) industries to avoid having the same organization monitor itself and its competitors or partners. Ownership and operation of non-central functions could take various forms. Although there are potential advantages to having different owners (e.g., each auto manufacturer) oversee large CMEs comprised of all the non-central functions, this team believes that running such a CME should not be a condition of ownership. For example, an organization that owns or operates one or more LOPs should not necessarily have to operate all of the other non-central functions. At this point in the analysis, we believe that owners/operators of the non-central functions could include varied organizations – auto manufacturers and others. The processes by which any potential owners/operators are vetted for eligibility to play a role in the system, and any necessary qualifications, have not been specified at this time.
Organizational Outputs
The outputs of an organization define the fundamental reason why it exists – to deliver value to customers or users. The SCMS manager will be relied upon for outputs in the form of the policies and standards it adopts and develops. The decisions the SCMS manager makes regarding PKI processes, such as trust distribution, can be considered an output as well. The SCMS manager is also envisioned to audit the CMEs, which could involve the production of compliance guidelines and provisioning of auditing services. Training and certification programs are provided by the central governance authority in some industries, and could be offered by the SCMS manager to CME owners/operators who want to ensure they are meeting and exceeding security and privacy requirements. Any guidance, product, or service that is produced by the organizational functions outlined earlier in this section can be considered an output of the SCMS manager.
Conceptual SCMS Manager Structure Private industry self-governance is often facilitated through a central body vested with the authority to carry out specific responsibilities (e.g., creation of standards, approval of new industry members). The extent of the authority varies based on any laws or regulations that supersede the governing body, and the mutual agreement of industry members (or a cohort of industry members with the power to shape the industry). Existing industry models can be helpful for decision-makers who are analyzing governance options. Some of the potential models that could be implemented for the organization design of the SCMS manager include:
Chapter 5 SCMS Manager Analysis - DRAFT
Intelligent Transportation Systems Joint Program Office U.S. Department of Transportation, Research and Innovative Technology Administration
SCMS Design and Analysis for the Connected Vehicle System | 46
• Trade Association: A trade association focused on training and advocacy in the SCMS industry could support such activities as data-gathering surveys, lobbying, certifications development, and dissemination of market information. However, such an association would lack the authority to execute any true governance. Industry players would be largely on their own to operate their businesses as part of the SCMS, and would rely on individual agreements/alliances, as well as laws and regulations (if any), for guidance.
• Industry Consortium: A consortium responsible for setting mandatory industry standards could be positioned to be stronger than a trade association. Comprised of equal representation of the different participants in the market (as illustrated in Figure 5 in Chapter 4), the consortium could collaborate to form mutual agreements that would be required by all participants in the industry. All standards developed would be designed to meet or exceed any relevant laws and regulations. Routine audits would be an ideal requirement as part of compliance with standards and any additional voluntary accreditation.
• Industry Board of Directors: A board of directors elected by the industry to set standards would be a step beyond an industry consortium. In this arrangement, industry participants would elect a board that could be comprised of a mix of industry participants, representatives from academia, PKI and ITS experts, representatives from government, etc. The board would have final discretion in setting standards, but could collect feedback and execute work through the use of committees or working groups. Compliance with standards would be mandatory, and enforcement of the standards could also be a duty of the board.
These self-governance models represent some of the options that could be implemented for the SCMS manager, but they are not the only options. The bodies listed above can be adjusted with more or less authority and responsibilities to achieve different purposes and the models can be combined in myriad ways. Fundamentally, the evolution of self-governance is dependent on the acceptance of any structure by the “governed” parties. As previously discussed in Chapter 4, the payment card and hospital industries are characterized by multiple groups that take on some of the roles outlined above, but only a small number of entities in each industry perform self-governance (i.e., both industries have various trade associations that provide networking opportunities and training, while other organizations are responsible for setting industry-wide standards). These self-governance groups fall somewhere between the industry consortium and the industry board of directors examples listed above in terms of authority.
SCMS Manager Organizational Structure
Based on the team’s analysis of industry examples and organization design considerations, we believe shared ownership/operation of the SCMS manager would be a potential option that avoids conflicts of interest, allows for a broad set of stakeholders to be represented and engaged, and minimizes excessive involvement in the organization design and operation of non-central CMEs. It is likely that the private organizations that own/operate the other SCMS CMEs will have a part in influencing how the SCMS manager is structured and may have a part in its operation. Representatives from other participants in the SCMS industry may also be candidates for involvement. Figure 7 below illustrates a top-level view of a possible SCMS manager structure developed by this team.
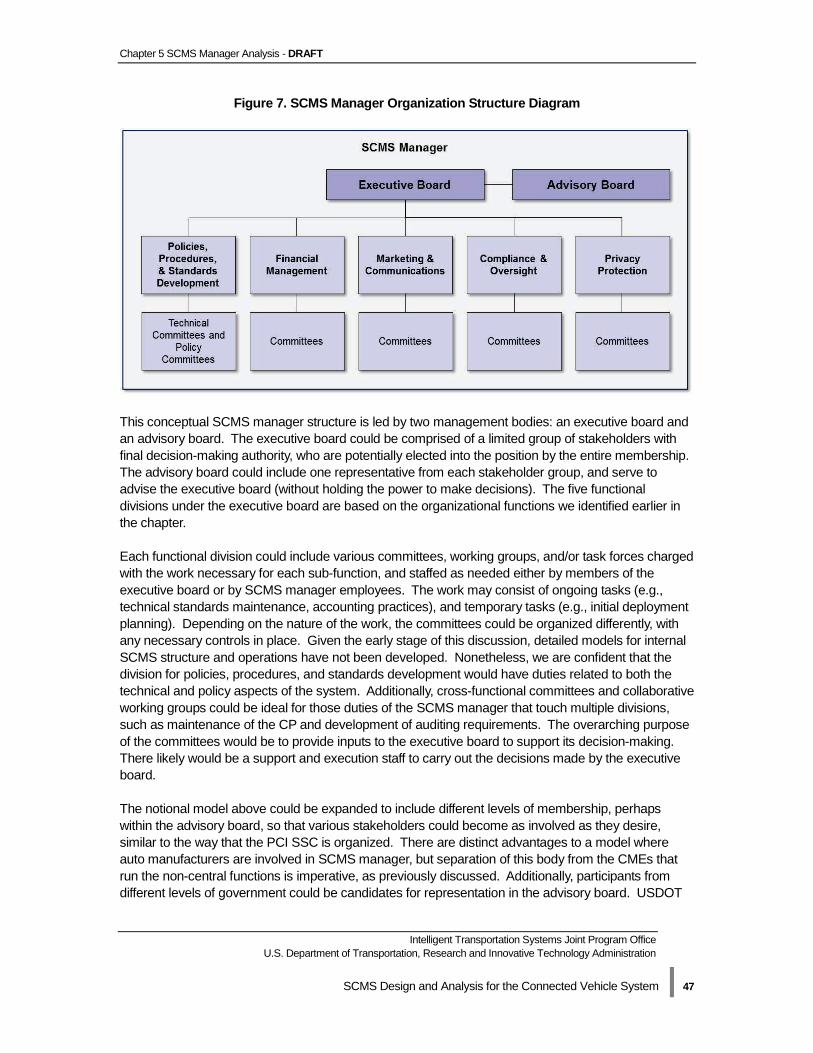
Chapter 5 SCMS Manager Analysis - DRAFT
Intelligent Transportation Systems Joint Program Office U.S. Department of Transportation, Research and Innovative Technology Administration
SCMS Design and Analysis for the Connected Vehicle System | 47
Figure 7. SCMS Manager Organization Structure Diagram
This conceptual SCMS manager structure is led by two management bodies: an executive board and an advisory board. The executive board could be comprised of a limited group of stakeholders with final decision-making authority, who are potentially elected into the position by the entire membership. The advisory board could include one representative from each stakeholder group, and serve to advise the executive board (without holding the power to make decisions). The five functional divisions under the executive board are based on the organizational functions we identified earlier in the chapter. Each functional division could include various committees, working groups, and/or task forces charged with the work necessary for each sub-function, and staffed as needed either by members of the executive board or by SCMS manager employees. The work may consist of ongoing tasks (e.g., technical standards maintenance, accounting practices), and temporary tasks (e.g., initial deployment planning). Depending on the nature of the work, the committees could be organized differently, with any necessary controls in place. Given the early stage of this discussion, detailed models for internal SCMS structure and operations have not been developed. Nonetheless, we are confident that the division for policies, procedures, and standards development would have duties related to both the technical and policy aspects of the system. Additionally, cross-functional committees and collaborative working groups could be ideal for those duties of the SCMS manager that touch multiple divisions, such as maintenance of the CP and development of auditing requirements. The overarching purpose of the committees would be to provide inputs to the executive board to support its decision-making. There likely would be a support and execution staff to carry out the decisions made by the executive board. The notional model above could be expanded to include different levels of membership, perhaps within the advisory board, so that various stakeholders could become as involved as they desire, similar to the way that the PCI SSC is organized. There are distinct advantages to a model where auto manufacturers are involved in SCMS manager, but separation of this body from the CMEs that run the non-central functions is imperative, as previously discussed. Additionally, participants from different levels of government could be candidates for representation in the advisory board. USDOT

Chapter 5 SCMS Manager Analysis - DRAFT
Intelligent Transportation Systems Joint Program Office U.S. Department of Transportation, Research and Innovative Technology Administration
SCMS Design and Analysis for the Connected Vehicle System | 48
agencies and state and local government agencies could play a role in the governance organization by providing input and sharing knowledge about connected vehicle updates.
SCMS Industry Governance versus CME Organizational Governance
The team believes that the method of separation of the SCMS manager – as a central function – from the CMEs that house pseudonym and bootstrap functions will have to be clearly defined. Separation between the central governance authority and the industry players is critical in implementing strong oversight of all aspects of the industry. Separation is also important to support fair competition and independent strategy, which characterize private industry. We believe that the SCMS manager can be responsible for definition and oversight of certain standards, policies, procedures, and operational practices that apply across the industry. The SCMS manager, however, should not play a role in making organizational governance decisions that impact the competitiveness and independence of owners/operators, such as how the root CA or PCA choose to set their employee organizational structure. How those organizations are overseen and how compliance with industry standards and practices is monitored and ensured would likely be functions of the SCMS manager, but decisions about internal operations, structure, practices, or other organizational design elements of an individual CME should be the responsibility of said CME’s owners/operators. The team believes it is possible for the SCMS manager to be the private, self-governing body responsible for setting many of the policies and standards that will apply across the SCMS and to other organizations that interact with the SCMS industry. There are many variables that will affect the structure and responsibilities of the SCMS manager, but ownership/operation decisions are perhaps the most impactful. Once it is determined who the owners/operators of the system will be, the details of the mission, structure, goals, etc. of the SCMS manager can be specified, and the body can be established.

Part III Controls, Privacy, and Misbehavior - DRAFT
Intelligent Transportation Systems Joint Program Office U.S. Department of Transportation, Research and Innovative Technology Administration
SCMS Design and Analysis for the Connected Vehicle System | 49
Part III Controls, Privacy, and Misbehavior
Chapter 6 SCMS Controls and Auditing - DRAFT
Intelligent Transportation Systems Joint Program Office U.S. Department of Transportation, Research and Innovative Technology Administration
SCMS Design and Analysis for the Connected Vehicle System | 50
Chapter 6 SCMS Controls and Auditing
The SCMS is intended to provide a trusted system of secure communications that supports effective connected vehicle messaging while maintaining user privacy appropriately. To ensure that the processes associated with the SCMS are secure, it is important to understand the threats and vulnerabilities that exist and how they can be prevented. The categorization and estimation of various technical risks to the system is beyond the scope of this report. A more technical risk assessment would be useful in determining how the SCMS should respond to different levels of attacks. In this chapter we discuss considerations for security assurance within the SCMS – the controls that can be used to prevent internal and external malfeasance and how auditing can verify that controls and business processes are operating correctly. For the SCMS, there is a significant challenge in defining a “security baseline” because of the novelty of the system and the anticipated full deployment scale. However, understanding what can be done to address threats to the system is a critical first step. The specific controls chosen for the SCMS PKI should be outlined as part of the SCMS CP when it is developed. As previously defined in Chapter 3, the CP of a PKI is a document that outlines the policies for how certificates are created and used, along with details and guidelines about organizational design elements such as access to data and internal controls. Every PKI must have a CP. The X.509 standard for PKI is typically referenced for a CP template.50
Physical, Procedural, and Technical Controls Physical, procedural, and technical controls are key features of a PKI system that should be implemented within the SCMS. The splitting of functions into legally separate organizations is one method of guarding against inappropriate data sharing between functions within the CMEs, but alone it does not provide a sufficient level of control. Separation should not be seen as a substitute for specifying detailed security controls needed to mitigate potential risks such as vehicle location tracking that would stem from the sharing of data either within or outside of the CMEs. Nor is physical separation always necessary to ensure data or functions that need to be operated independently are kept apart. Separate security domains and personnel can be reliably utilized inside a single organization if robust physical, procedural, and technical controls exist. Additionally, strict auditing procedures and the penalties for violation of the controls should be carefully enforced. The principal avenues of attack that need to be addressed are reviewed below: 50 While the SCMS is not intended to follow the X.509 standard for every element of its design (e.g., the SCMS will use IEEE 1609.2 certificates), it is currently the most common standard used in PKI systems, and therefore is used as a starting point in this chapter to understand how controls can be designed and integrated into the PKI system being developed for the SCMS. The X.509 standard is available for download by authorized users from the International Telecommunication Union Telecommunication Standardization Sector (ITU-T) at http://www.itu.int/ITU-T/recommendations/rec.aspx?rec=X.509.
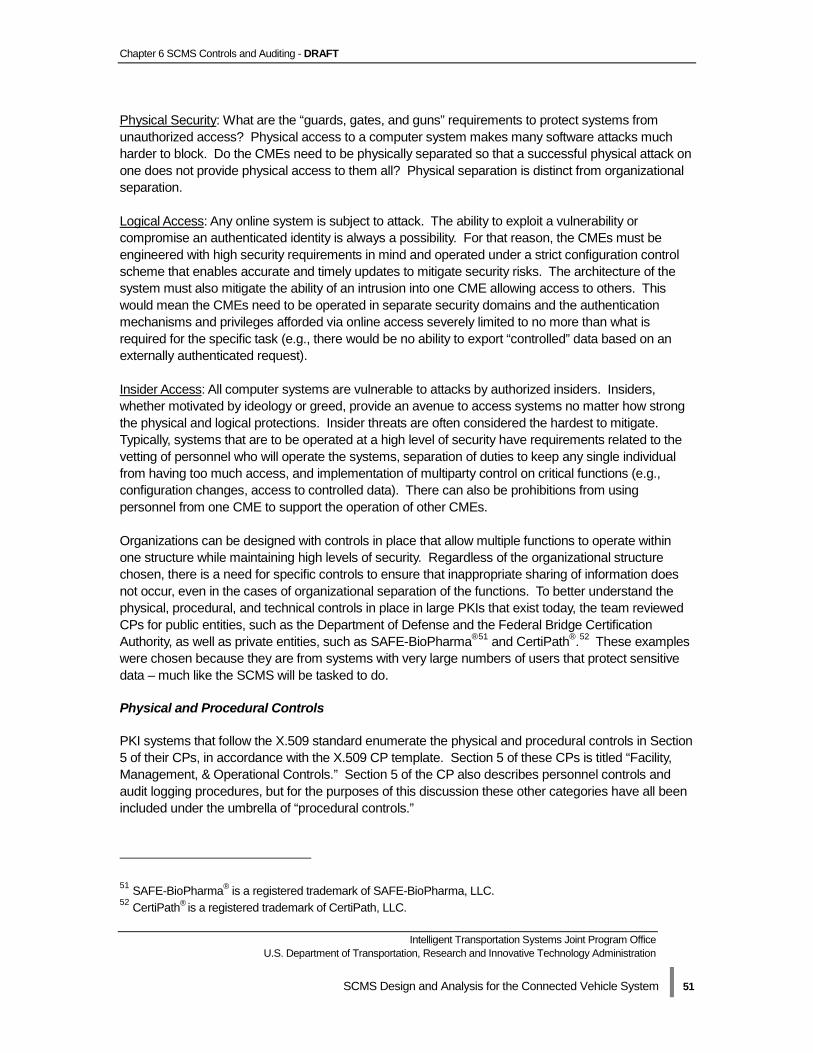
Chapter 6 SCMS Controls and Auditing - DRAFT
Intelligent Transportation Systems Joint Program Office U.S. Department of Transportation, Research and Innovative Technology Administration
SCMS Design and Analysis for the Connected Vehicle System | 51
Physical Security: What are the “guards, gates, and guns” requirements to protect systems from unauthorized access? Physical access to a computer system makes many software attacks much harder to block. Do the CMEs need to be physically separated so that a successful physical attack on one does not provide physical access to them all? Physical separation is distinct from organizational separation. Logical Access: Any online system is subject to attack. The ability to exploit a vulnerability or compromise an authenticated identity is always a possibility. For that reason, the CMEs must be engineered with high security requirements in mind and operated under a strict configuration control scheme that enables accurate and timely updates to mitigate security risks. The architecture of the system must also mitigate the ability of an intrusion into one CME allowing access to others. This would mean the CMEs need to be operated in separate security domains and the authentication mechanisms and privileges afforded via online access severely limited to no more than what is required for the specific task (e.g., there would be no ability to export “controlled” data based on an externally authenticated request). Insider Access: All computer systems are vulnerable to attacks by authorized insiders. Insiders, whether motivated by ideology or greed, provide an avenue to access systems no matter how strong the physical and logical protections. Insider threats are often considered the hardest to mitigate. Typically, systems that are to be operated at a high level of security have requirements related to the vetting of personnel who will operate the systems, separation of duties to keep any single individual from having too much access, and implementation of multiparty control on critical functions (e.g., configuration changes, access to controlled data). There can also be prohibitions from using personnel from one CME to support the operation of other CMEs. Organizations can be designed with controls in place that allow multiple functions to operate within one structure while maintaining high levels of security. Regardless of the organizational structure chosen, there is a need for specific controls to ensure that inappropriate sharing of information does not occur, even in the cases of organizational separation of the functions. To better understand the physical, procedural, and technical controls in place in large PKIs that exist today, the team reviewed CPs for public entities, such as the Department of Defense and the Federal Bridge Certification Authority, as well as private entities, such as SAFE-BioPharma®51 and CertiPath®.52 These examples were chosen because they are from systems with very large numbers of users that protect sensitive data – much like the SCMS will be tasked to do.
Physical and Procedural Controls
PKI systems that follow the X.509 standard enumerate the physical and procedural controls in Section 5 of their CPs, in accordance with the X.509 CP template. Section 5 of these CPs is titled “Facility, Management, & Operational Controls.” Section 5 of the CP also describes personnel controls and audit logging procedures, but for the purposes of this discussion these other categories have all been included under the umbrella of “procedural controls.”
51 SAFE-BioPharma® is a registered trademark of SAFE-BioPharma, LLC. 52 CertiPath® is a registered trademark of CertiPath, LLC.

Chapter 6 SCMS Controls and Auditing - DRAFT
Intelligent Transportation Systems Joint Program Office U.S. Department of Transportation, Research and Innovative Technology Administration
SCMS Design and Analysis for the Connected Vehicle System | 52
Physical controls are intended to address the physical design elements of PKI equipment and the security of facilities and stored data. These controls are likely to involve the materials used to construct buildings or containers (e.g., steel, concrete), the types of locks necessary for different classes of information, and the environmental conditions in which hardware and software should be housed (e.g., temperature of facility). For example, a physical control often employed for the root CA is physical separation, which involves the root CA being operated in an offline environment, never connected to a network. Any kind of information that must be shared from the root CA across the SCMS must be burned to a disk by authorized personnel and physically carried to an online system for distribution. Procedural controls provide direction for how processes are executed within the PKI. This type of control defines trusted roles, the responsibilities of staff, and the number of persons required to complete a task, among other things. The separation of roles is a procedural control that ensures that no single person can fool the system into allowing unauthorized access. For instance, in traditional PKI systems, the individual in the role of a security officer typically sets privileges on the CA but is unable to log into the system directly. System login requires a system administrator to first authenticate that the correct individual is attempting to log in. This two person control prevents the security officer from setting his or her own privileges. In a more general example included in the CP for the Federal Bridge Certification Authority, when multiple parties are required for logical access to sensitive information, all parties must be in a trusted role and at least one of the individuals present must be an administrator.53 This type of control can be employed in an organizational model for a CME that features multiple functions collocated in the same organization. Many controls are common across different PKI systems regardless of the information that is being protected. Examples of these controls are described in Table 2. Other controls are often tailored to the specific needs of the organization that manages the PKI. Some specific examples of physical and procedural controls tailored to specific organizational needs are listed in Table 3. Where available the team listed actual examples, but note that some information is not publicly available and the CP template for X.509 PKIs can be referenced as a starting point. All examples used in the subsequent tables are intended for illustrative purposes only.
53 United States Federal Public Key Infrastructure Policy Authority, X.509 Certificate Policy For The Federal Bridge Certification Authority (version 2.25), http://www.idmanagement.gov/documents/certificate-policy-federal-bridge-certificate-authority.
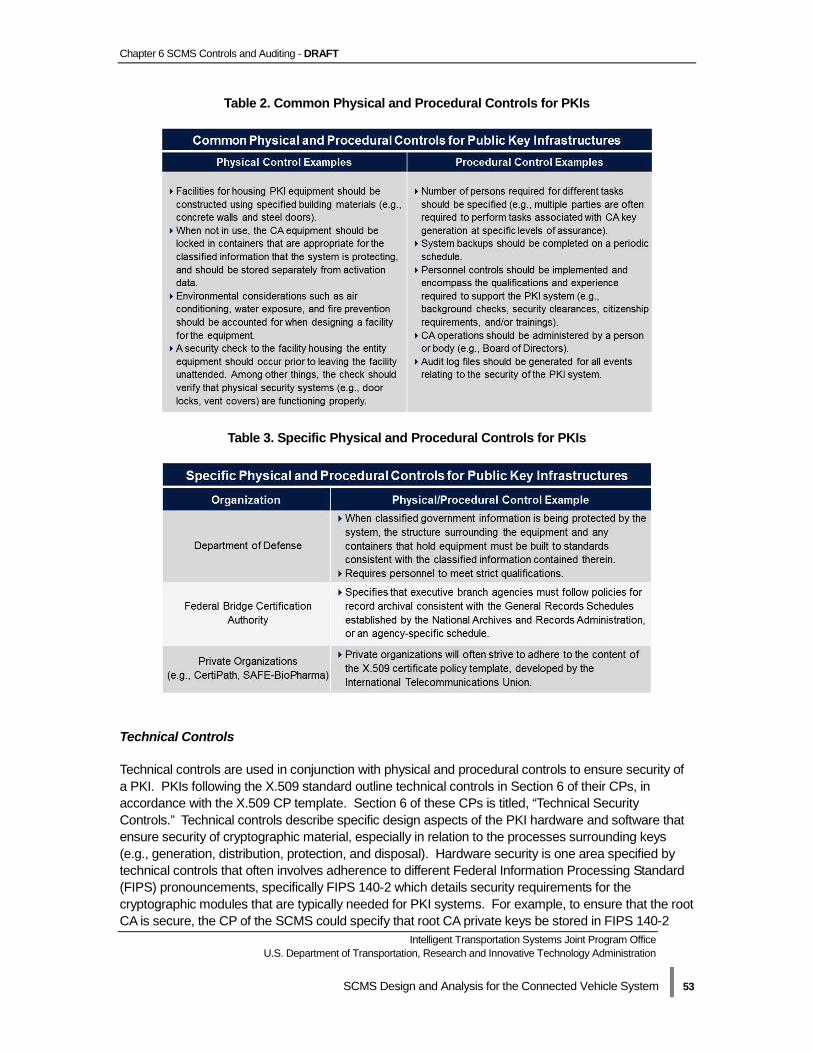
Chapter 6 SCMS Controls and Auditing - DRAFT
Intelligent Transportation Systems Joint Program Office U.S. Department of Transportation, Research and Innovative Technology Administration
SCMS Design and Analysis for the Connected Vehicle System | 53
Table 2. Common Physical and Procedural Controls for PKIs
Table 3. Specific Physical and Procedural Controls for PKIs
Technical Controls
Technical controls are used in conjunction with physical and procedural controls to ensure security of a PKI. PKIs following the X.509 standard outline technical controls in Section 6 of their CPs, in accordance with the X.509 CP template. Section 6 of these CPs is titled, “Technical Security Controls.” Technical controls describe specific design aspects of the PKI hardware and software that ensure security of cryptographic material, especially in relation to the processes surrounding keys (e.g., generation, distribution, protection, and disposal). Hardware security is one area specified by technical controls that often involves adherence to different Federal Information Processing Standard (FIPS) pronouncements, specifically FIPS 140-2 which details security requirements for the cryptographic modules that are typically needed for PKI systems. For example, to ensure that the root CA is secure, the CP of the SCMS could specify that root CA private keys be stored in FIPS 140-2
Chapter 6 SCMS Controls and Auditing - DRAFT
Intelligent Transportation Systems Joint Program Office U.S. Department of Transportation, Research and Innovative Technology Administration
SCMS Design and Analysis for the Connected Vehicle System | 54
Level 3 or higher hardware security modules (HSMs), which perform fast cryptographic transactions and protect private keys. Adherence to relevant FIPS pronouncements is commonly accepted as a best practice in PKI systems. Table 4 describes technical controls that are common among the PKI systems analyzed. The specific technical controls based on the unique design of the SCMS will need to be more fully specified as the CP for the connected vehicle system is authored and the organizations are stood up.
Table 4. Common Technical Controls for PKIs
An aspect of CPs that is closely tied to technical controls is the different “levels of assurance.” Levels of assurance are based on FIPS and are listed in a CP to define the amount of trust associated with a particular credential issued by the PKI, as well as the security provided by the PKI itself. In this way, the level of assurance of the credential is a major part of defining the way the holder of the credential participates in the PKI system. Different levels of assurance are associated with different technical controls. For example, a PKI system operating at a more advanced level of assurance might require that signing keys be generated in hardware cryptographic modules that meet higher FIPS standards than those PKI systems operating at a more basic level of assurance. Establishing the appropriate number of assurance levels for the SCMS PKI will be an important part of the development of the CP. Table 5 lists the different assurance levels that are used among four industry PKIs.
Table 5. Levels of Assurance
It is important to also consider elements of the system that are unprecedented and that may require new or specialized controls. Examples of unique elements of the SCMS that must be taken into account include the LAs and the separation of misbehavior detection and management into a

Chapter 6 SCMS Controls and Auditing - DRAFT
Intelligent Transportation Systems Joint Program Office U.S. Department of Transportation, Research and Innovative Technology Administration
SCMS Design and Analysis for the Connected Vehicle System | 55
separate function (MA) as opposed to being executed by the CA or RA. As previously mentioned, this team’s current understanding is that all non-central functions could potentially be run in one or more CMEs. Ultimately, it is controls that make this possible by supporting the needed security and privacy of functions regardless of where they are aligned organizationally.
Audit Practices for the SCMS As previously discussed, trust is pivotal to the success of the connected vehicle system, and is a hallmark of PKI. If any policies that may guide the SCMS are loosely enforced and controls are ineffective, the entire trust relationship upon which the SCMS is built could collapse due to security breaches or attacks. For this reason, we recommend that auditing procedures are clearly defined in the SCMS CP and maintained by the SCMS manager, potentially through the collaboration working groups mentioned in Chapter 5. On a basic level, an audit involves an impartial third party evaluating some aspect of an organization or system for compliance with policies, regulations, or some other defined set of standards. Organizations across the public and private sectors are routinely audited. Business processes that are commonly examined through audits include:
• Accounting and finance practices • Tax reporting processes • Hiring and other activities related to personnel • Records management • IT system security • Privacy protection for sensitive data
Auditing of the SCMS by system owners/operators will support trust in the system in various ways:
• Confirmation that CME business practices are in compliance with any policies, procedures, standards, or contractual requirements related to the operation of the PKI
• Evaluation of the effectiveness of the physical, procedural, and technical controls • Reduction of misbehavior by detecting human malfeasance and discouraging bad actors from
attacking the system • Appropriate technical risk mitigation by identifying IT vulnerabilities that could lead to
operational failure In general, PKI systems are audited in two ways: (1) through the capture of information, often through audit logging, and (2) through compliance audits. The previously mentioned CP will specify details such as the system activities that must be recorded in audit logs (e.g., the certificate authority [CA] exchanging messages with the RA) and the eligibility guidelines for serving as a compliance auditor (e.g., no PKI staff can also serve as an auditor). A separate document known as the Certification Practice Statement will provide more in-depth details about how audits should occur on a location by location basis (e.g., by CME). Essentially the Certification Practice Statement is a document that details the technical implementation for how the requirements set in the CP are accomplished. Routine internal auditing and self-assessment practices are complemented by external audits conducted by a compliance auditor. External audits can uncover what the organization itself may have missed during internal audits. Audit reports authored by compliance auditors are submitted to appropriate oversight bodies for review.

Chapter 6 SCMS Controls and Auditing - DRAFT
Intelligent Transportation Systems Joint Program Office U.S. Department of Transportation, Research and Innovative Technology Administration
SCMS Design and Analysis for the Connected Vehicle System | 56
Auditing in the Payment Card Industry and Hospital Industry
The auditing methods used in the payment card industry and hospital industry (discussed in Chapter 4) are worth reviewing here as part of a discussion of potential approaches that could be adopted for the SCMS. In the payment card industry, PCI DSS specifies auditing requirements to ensure compliance with the security standard. The standard specifies requirements for system scans and internal or external audits, based on the entity’s transaction volume and other factors. Vulnerability scans are required for all merchant and service provider systems, and must be carried out by an Approved Scanning Vendor (ASV). PCI SSC approves ASVs to operate as third parties providing validation of compliance with scanning requirements.54 For auditing, smaller merchants and service providers that process fewer transactions can generally complete a self-assessment questionnaire each year where they attest that their systems are compliant. Larger merchants and service providers with high transaction volumes must be audited through an on-site assessment from a Qualified Security Assessor (an entity approved by PCI SSC to validate compliance with PCI DSS55). After a self-assessment or compliance audit has been completed, the merchant or service provider must send the compliance report to the payment brands with which it is under contract, in accordance with the stipulations in each brands’ compliance program. As reviewed in Chapter 4, the hospital industry relies on accreditation organizations approved by the Federal Government to verify that they are in compliance with Medicare CoPs. But hospitals gain more than just a passing or failing grade from audits (known as “surveys” in the hospital industry). Accreditation agencies can help hospitals that are struggling to meet standards with additional training for staff, recommendations for improvement, and other resources that may not be available with a more basic compliance audit. Hospitals must pay these third parties for accreditation, but the benefits they gain can result in increased patient safety and improved operations. In a similar way to these industries, the SCMS manager could outsource the auditing function to a third party provider or providers that have specific expertise in ITS and PKI, and that could provide training and assistance to CMEs that do not meet the security standards set in the CP. This would limit the responsibilities that the SCMS manager would have to assume, potentially saving resources.
Auditing Standards
To effectively audit the SCMS, numerous standards can be leveraged to design specific auditing criteria. Early PKI standards were developed to support the use of PKI in the financial services industry, but more recent guidance exists across industries. Federal agency IT systems seeking approval to join the Federal PKI must be audited to ensure that controls meet criteria outlined in National Institute of Standards and Technology (NIST) Special Publication 800-53A, Guide for Assessing the Security Controls of Federal Information Systems and Organizations. Alternatively, the Department of Defense adheres specifically to the direction for auditing of its PKI systems that is specified in the Department of Defense Information Assurance Certification and Accreditation Process, 54 PCI SSC, Approved Scanning Vendors, https://www.pcisecuritystandards.org/approved_companies_providers/approved_scanning_vendors.php. 55 PCI SSC, Qualified Security Assessor Companies, https://www.pcisecuritystandards.org/approved_companies_providers/qualified_security_assessors.php.

Chapter 6 SCMS Controls and Auditing - DRAFT
Intelligent Transportation Systems Joint Program Office U.S. Department of Transportation, Research and Innovative Technology Administration
SCMS Design and Analysis for the Connected Vehicle System | 57
known as DIACAP. Outside of the public sector, trade organizations may develop auditing standards, templates, and other guidance. The ISACA®,56 once known as the Information Systems Audit and Control Association, is an industry organization dedicated to the development and global use of knowledge and practices for information systems.57 One of the resources provided by this nonprofit is auditing guidelines for IT systems. While the specification of exact levels and types of controls for the SCMS is premature at this point, selecting methods to protect data and functions within the system are critical for implementation planning. This chapter provides an outline of the types of controls available to the SCMS operators, along with some examples of how other industries have set some of these controls. Additional analysis and drafting of controls, vetting by security design experts, and authoring of the SCMS PKI CP would be appropriate next steps in preparing the SCMS design and organizations for eventual deployment.
56 ISACA® is a registered trademark of ISACA. 57 ISACA, ISACA website: http://www.isaca.org/About-ISACA/History/Pages/default.aspx.
Chapter 7 Options for User or Vehicle Information Linkage - DRAFT
Intelligent Transportation Systems Joint Program Office U.S. Department of Transportation, Research and Innovative Technology Administration
SCMS Design and Analysis for the Connected Vehicle System | 58
Chapter 7 Options for User or Vehicle Information Linkage
A guiding principle in the design of the connected vehicle system is that it must adequately maintain user privacy at an appropriate level.58 The level of privacy that can be supported by the system is closely related to the mitigation of technical security risks. A comprehensive privacy analysis of a system like the SCMS involves numerous elements and analyses, but for this report the Booz Allen team focused on two specific aspects of privacy. The first is the potential linkage between the SCMS and some sort of user or vehicle information for the purposes of addressing safety and security problems caused by malfunctioning V2V equipment. The second aspect of privacy we evaluated is the risk associated with a vehicle’s location being tracked through V2V Dedicated Short Range Communications (DSRC), which is included in Chapter 8. This chapter reviews the Booz Allen team’s analysis of different options for linking motor vehicle information to the enrollment certificate of the vehicle’s OBE, primarily for purposes of identifying and correcting V2V equipment malfunction. This type of linkage could involve VIN, the vehicle’s make/model/year, the OBE production lot, or other types of information; theoretically even the user’s personally identifying information (PII). The linkage could be added as a preliminary step in the bootstrap process that enables devices to participate in the connected vehicle system. A determination has not been made about whether, and to what extent, the SCMS will need to create an information linkage, but NHTSA has indicated that it believes that a minimal amount of linkage will be necessary in order for the agency to carry out its enforcement functions. The team’s initial discussions with NHTSA on the topic of user privacy focused on ways to link certificates to user information as a means of identifying “bad actors” in the V2V system, which include both malfeasant individual participants and malfunctioning equipment. USDOT originally tasked the team with investigating the privacy and security implications of two options: a system without a linkage to user PII (defined as information that links, directly or indirectly, to an individual system user), as well as a system with a PII linkage under two separate methods. More recently, USDOT identified a third option designed to meet the needs of V2V equipment safety that would not involve a linkage to user PII, but rather to the vehicle’s make/model/year and/or the production lot of the vehicle’s OBE. These three options are outlined in Table 6.
58 RITA website, Principles for a Connected Vehicle Environment: Discussion Document, http://www.its.dot.gov/connected_vehicle/principles_connectedvehicle_environment.htm.
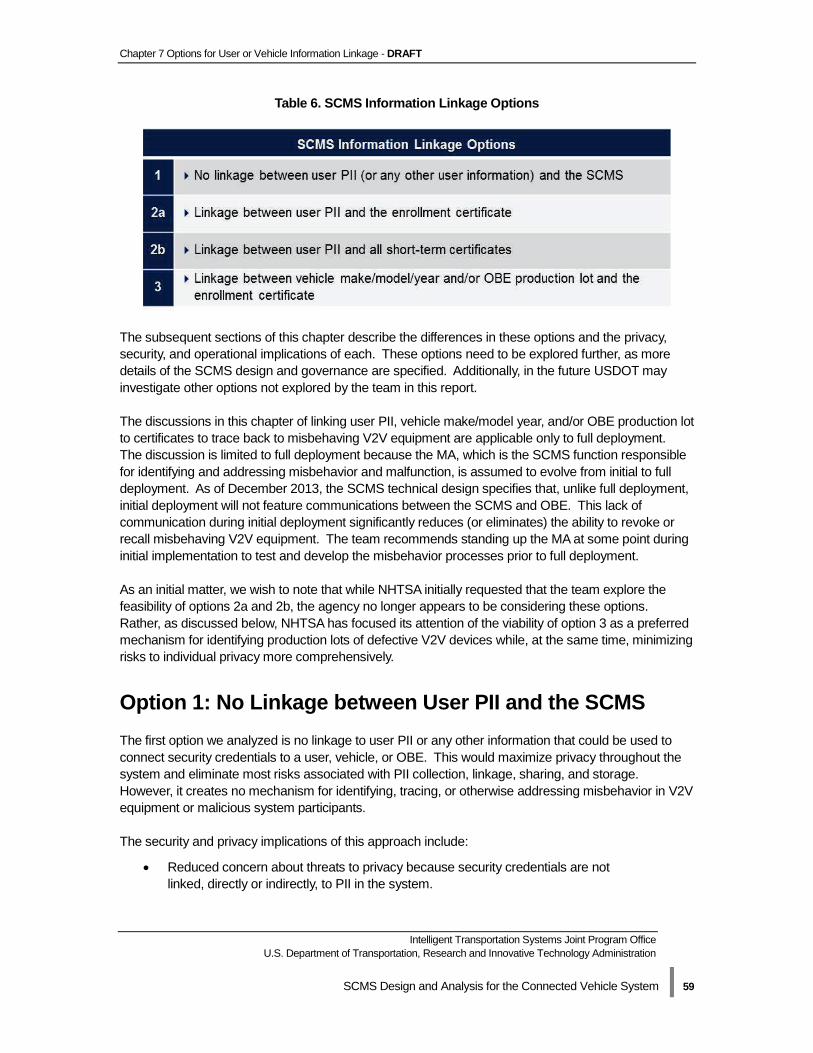
Chapter 7 Options for User or Vehicle Information Linkage - DRAFT
Intelligent Transportation Systems Joint Program Office U.S. Department of Transportation, Research and Innovative Technology Administration
SCMS Design and Analysis for the Connected Vehicle System | 59
Table 6. SCMS Information Linkage Options
The subsequent sections of this chapter describe the differences in these options and the privacy, security, and operational implications of each. These options need to be explored further, as more details of the SCMS design and governance are specified. Additionally, in the future USDOT may investigate other options not explored by the team in this report. The discussions in this chapter of linking user PII, vehicle make/model year, and/or OBE production lot to certificates to trace back to misbehaving V2V equipment are applicable only to full deployment. The discussion is limited to full deployment because the MA, which is the SCMS function responsible for identifying and addressing misbehavior and malfunction, is assumed to evolve from initial to full deployment. As of December 2013, the SCMS technical design specifies that, unlike full deployment, initial deployment will not feature communications between the SCMS and OBE. This lack of communication during initial deployment significantly reduces (or eliminates) the ability to revoke or recall misbehaving V2V equipment. The team recommends standing up the MA at some point during initial implementation to test and develop the misbehavior processes prior to full deployment. As an initial matter, we wish to note that while NHTSA initially requested that the team explore the feasibility of options 2a and 2b, the agency no longer appears to be considering these options. Rather, as discussed below, NHTSA has focused its attention of the viability of option 3 as a preferred mechanism for identifying production lots of defective V2V devices while, at the same time, minimizing risks to individual privacy more comprehensively.
Option 1: No Linkage between User PII and the SCMS The first option we analyzed is no linkage to user PII or any other information that could be used to connect security credentials to a user, vehicle, or OBE. This would maximize privacy throughout the system and eliminate most risks associated with PII collection, linkage, sharing, and storage. However, it creates no mechanism for identifying, tracing, or otherwise addressing misbehavior in V2V equipment or malicious system participants. The security and privacy implications of this approach include:
• Reduced concern about threats to privacy because security credentials are not linked, directly or indirectly, to PII in the system.
Chapter 7 Options for User or Vehicle Information Linkage - DRAFT
Intelligent Transportation Systems Joint Program Office U.S. Department of Transportation, Research and Innovative Technology Administration
SCMS Design and Analysis for the Connected Vehicle System | 60
• No mechanism for NHTSA to link potential safety defects suggested by trends in misbehavior reports collected by the MA to production lots of OBE or other motor vehicle equipment.
• No ability for system owners/operators and/or government officials to enforce legal or policy consequences for malicious users by tracing malfeasance or misbehavior back to a specific individual, vehicle, or device.
Some users might feel most secure participating in a V2V system that links to no PII. However, it remains an open question whether system users, as a whole, will lose confidence in the security of a connected vehicle system that lacks the capacity to identify bad actors such as hackers who may use the system for malicious purposes. Over time, the inherent immunity for bad actors and lack of an effective mechanism to identify and repair specific malfunctioning V2V devices could impair user acceptance and jeopardize the potential safety benefits of V2V technology.
Option 2a: Linkage between User PII and the Enrollment Certificate Our investigation of option 2a revealed that there are multiple ways that the SCMS could create a link to PII that would facilitate identification of defective devices and bad actors. One way would be linking PII (individual user, vehicle, or device/OBE information) to an OBE’s enrollment certificate at the time of bootstrap (i.e., during initial device activation). If the SCMS links to user PII during bootstrap, the team recommends that the entity managing the bootstrap process (the ECA) be separate and isolated from the rest of the SCMS functions (i.e., the pseudonym functions that manage, administer, and assign short-term certificates, and that manage misbehavior detection). Chapter 3 includes a detailed discussion about the bootstrap process. User PII collected in this manner at the time of initial activation would enable various SCMS entities to work together to link misbehavior reports suggesting device malfunction or participant malfeasance to specific devices in need of repair and/or individuals who may be violating policy, regulations, or laws against attacks on the system. The team’s recommendation is that information linking user PII to the enrollment certificate (or that may be used to create such a linkage) be kept in a separate database accessed only in accordance with policy or law. Under option 2a, any PII linkage would never be part of the data included in any certificate stored on the device (e.g., the enrollment certificate) or that is exchanged between devices (e.g., short-term certificates). Under option 2a, the SCMS would need to set SCMS-wide policy and organizational rules governing access to user PII and ensure that appropriate controls are in place to mitigate risks to privacy stemming from collection of such PII (such as ensuring adequate technical separation and limiting access appropriately). Arguably, this linkage option could entail collection of no more, and possibly much less PII, than other PII collections that take place in connection with existing federal and state registration and certification systems today. The operational implications of option 2a are as follows:
• No user PII is included in any certificates. • The linkage to user PII is managed by the ECA alone during the bootstrap process; it
is separate in all ways from all other SCMS functions. • The only time a connection back to user PII is needed from an SCMS function is
when misbehaving devices or users are to be identified for compliance and policy enforcement, or for NHTSA enforcement or recall purposes. Policy decisions not yet

Chapter 7 Options for User or Vehicle Information Linkage - DRAFT
Intelligent Transportation Systems Joint Program Office U.S. Department of Transportation, Research and Innovative Technology Administration
SCMS Design and Analysis for the Connected Vehicle System | 61
made will determine whether, when, and how to connect back to vehicles, devices, or users.
• Technical, policy, and administrative or legal controls will exist to provide separation of the bootstrap process and ECA from the pseudonym functions.
• No ongoing connection to activation databases is needed for determining authentication.
• Rules of access for employees within the ECA must guide who has access to user PII.
• If a link is formed to user PII, current laws in many states and at the federal level may require notice and consent for data collection, retention, and transfer between entities.
Option 2b: Linkage between User PII and Short-Term Certificates Like option 2a, option 2b involves linkage to user PII. However, while option 2a specifies that this information will be sequestered within a database managed by the ECA, option 2b involves linking to PII within the short-term certificates that are exchanged in daily, unencrypted V2V communications between OBE. A SCMS in which short-term certificates are directly linked to user PII still would be subject to procedural and technical controls related to how and when user PII could be accessed or shared with outside organizations (e.g., law enforcement agencies), in accordance with the law, regulations, and system policies. However, the privacy and security risks inherent in this type of system, particularly the risk of vehicle tracking, would be significantly higher than with the approaches detailed in options 1, 2a, and 3 (described later in this chapter). Because the PII would be embedded in the certificates sent multiple times per second, there are much greater opportunities for hacking, tracking, and linking to individuals than with any other option. The team recognizes that this option has potential benefits, including that misbehavior detection and management processes could become more efficient. Option 2b would not require that the MA function coordinate with the ECA to trace misbehavior back to a specific vehicle, device, or individual, and could instead identify misbehaving V2V equipment and malicious users directly through a captured short-term certificate. However, the team has determined that, due to the substantial privacy and security risks inherent in 2b (especially increased hacking and potential vehicle location tracking), it is not being considered by NHTSA or any stakeholder group. The team, based on previous analyses and discussions with the USDOT, does not believe the option of directly linking user PII to short-term certificates would satisfy the privacy and security needs of the system. Therefore, we do not view this option as viable at this time.
Option 3: Linkage between Vehicle Make/Model/Year and/or OBE Production Lot and the Enrollment Certificate After evaluating options 1, 2a, and 2b, USDOT asked the team to review the option of linking a vehicle’s make/model/year and/or OBE production lot to the enrollment certificate, potentially during the bootstrap process. USDOT is in the process of determining whether linkage to make/model/year
Chapter 7 Options for User or Vehicle Information Linkage - DRAFT
Intelligent Transportation Systems Joint Program Office U.S. Department of Transportation, Research and Innovative Technology Administration
SCMS Design and Analysis for the Connected Vehicle System | 62
and/or OBE production lot will facilitate NHTSA’s mission-critical functions such as defect investigations or recalls, or for NHTSA to notify V2V system participants with revoked certificates of possible equipment malfunctions and the need to be reauthorized to regain access to the system. Having access to data about make/model/year and/or OBE production lot would assist NHTSA in handling complaints from users related to aspects of the system’s operation that impact the driver, especially those related to safety. Option 3 would not involve linkage to user PII or a specific piece of equipment, and would rely on close coordination between OBE manufacturers and auto manufacturers. Under option 3, assuming that bootstrap occurs at the OBE manufacturers, OBE manufacturers would send to auto manufacturers a range of enrollment certificates tied to a specific production lot of OBE. Auto manufacturers then would link these enrollment certificates to the make/model/year of the vehicle in which the OBE is placed. Auto manufacturers could securely store this information in a fashion similar to how they store other data as required by law (e.g., tire data specified by the Transportation Recall Enhancement, Accountability, and Documentation [TREAD] Act). In the event of an inquiry from NHTSA or in compliance with Early Warning Reporting requirements,59 if applicable, auto manufacturers could submit relevant data to NHTSA for analysis, consistent with operating procedures. The Booz Allen team has not analyzed option 3 at length, but believes it is a promising and viable approach in terms of safety, privacy, and system operation. Because the linkage involves only a range of OBE, and an information exchange between the device manufacturer and auto manufacturer, there is no need for linkage to a specific OBE, vehicle, or user (i.e. no need for linkage to PII). We believe the option would have nearly the same privacy implications as option 1. At this time, we believe that option 3 seems to meet NHTSA’s safety enforcement needs in a way that option 1 does not and minimizes risks to user privacy in a way that option 2 does not.
Privacy Approaches in Comparative Industries As discussed in Chapter 4, private industry examples of self-governance are useful in analyzing governance options for the SCMS. In the same way, we can observe how different industries approach user privacy to understand what is commonly accepted and to identify important considerations for the SCMS. Sensitive information such as user PII is collected for different purposes in many industries, and several methodologies are employed to mitigate risks and protect it at an appropriate level. It is common for public and private organizations alike to rely on privacy regulations, industry guidelines, and technical security measures to mitigate risks to unauthorized access to user PII that is collected as part of business processes. Private organizations often look to federal laws and regulations as a basis, or a reference point, on which to build their own privacy policies. In the electronic tolling industry, the collection of driver PII and payment data expedites the process of moving vehicles through toll plazas. The E-ZPass®60 Interagency Group (IAG) allows the different toll authorities that make up the E-ZPass network to institute their own policies for management of driver PII. However, to be in full compliance with the 59 Information about Early Warning Reporting requirements for auto manufacturers can be found online at http://www-odi.nhtsa.dot.gov/ewr/. 60 E-ZPass® is a registered trademark of the Port Authority of New York and New Jersey.

Chapter 7 Options for User or Vehicle Information Linkage - DRAFT
Intelligent Transportation Systems Joint Program Office U.S. Department of Transportation, Research and Innovative Technology Administration
SCMS Design and Analysis for the Connected Vehicle System | 63
IAG standards, member toll authorities must (at a minimum) comply with a privacy policy that is based largely on the requirements of the Drivers Privacy Protection Act.61 In addition, each toll operator must comply with the state and local regulations that control PII collection, storage, and access. The primary trade association of the payment card industry, the PCI SSC, is an example of a group of private organizations that has created a body to establish industry-specific privacy guidelines. Payment brand companies such as Visa and MasterCard worked together to establish the PCI DSS to ensure that merchants and service providers protect cardholder data to the greatest extent possible. The PCI DSS includes 12 requirements that touch on issues such as network security, auditing requirements, and physical access to data. Other industries, such as the electronic tolling industry, have incorporated the PCI DSS standard into their evaluation of privacy in payment transactions with customers. Although each company will create its own privacy policy to cover its unique service offerings and needs, PCI DSS is a common thread throughout. Privacy laws and regulations, as well as voluntary self-regulation of privacy by private industry groups, are all central to the mitigation of privacy risks related to PII. However, technical security measures are what support the policies, as discussed in Chapter 6. Organizations employ technical defenses such as a PKI and data encryption, antivirus protection, and external system scans to safeguard data and prevent security breaches. This chapter has reviewed multiple options for creating a link between the SCMS and information about a user or vehicle, including no linkage at all. As decision-makers weigh the benefits and drawbacks of the different options, it is important to consider the implications for the misbehavior detection and management process. The lack of an effective misbehavior management and detection scheme could threaten user confidence just as much – or more – than a linkage to user or vehicle information. In the next chapter we explore another topic related to privacy: the risk of a vehicle being tracked through V2V DSRC communications.
61 Title XXX of the Violent Crime Control and Law Enforcement Act of 1994 (P.L. 103-322).
Chapter 8 Framework for Analyzing the Risk of Vehicle Tracking - DRAFT
Intelligent Transportation Systems Joint Program Office U.S. Department of Transportation, Research and Innovative Technology Administration
SCMS Design and Analysis for the Connected Vehicle System | 64
Chapter 8 Framework for Analyzing the Risk of Vehicle Tracking
The risk of a vehicle’s location being tracked within the connected vehicle system has been given attention by USDOT and various stakeholder groups. As part of this report, USDOT requested that Booz Allen perform a technical analysis of this discrete privacy issue, including an initial modeling of a particular scenario under which BSM data may be used for vehicle location tracking. This risk analysis was performed under specific parameters and is just one element that needs to be considered as part of a full risk analysis that USDOT may complete in the future. The risk is rooted in the transmittal of BSM data used in V2V DSRC communications. The current design for the BSM specifies that it will contain a number of data elements62 (listed in Appendix B), some of which have the potential to be used to link sequences of messages despite the brief life span of short-term certificates. The BSM contains historical information in the vehicle’s path history field for up to 300 meters, which defines a vehicle’s driving trajectory and is critical to predicting a collision. Other data elements in the BSM that may be used for tracking purposes include the Global Positioning System (GPS) location at the time of the message, the vehicle’s speed, and the vehicle’s dimensions. Using the information received from BSMs of other vehicles, a vehicle is able to evaluate whether there is any collision risk when engaging in such maneuvers as passing another vehicle or changing lanes. It should be noted that the data on the BSM is currently under evaluation by USDOT to identify risks to privacy. The analyses indicate an extremely high burden for any malicious user (MU) to capture BSM data, isolate an individual vehicle, and track the path of that vehicle or trace back to an individual person. As with all systems, insider access would provide some advantages in this case, but not enough to indicate a significantly higher risk based on probability of success. Additional analysis, based on a better understanding of potential additional data on the BSM and the ability to model other scenarios and input multiple variables into a simulation, would provide a more detailed risk assessment. This information could potentially reveal more information about the range of expected probabilities of success of attacks (e.g., attempts to track or trace vehicles or individuals).
Risks to Privacy In developing this report, PKI subject matter experts examined risks to privacy based on the OBE use of DSRC technology to send one-way unencrypted BSMs, and the various options being considered for communications between OBE and the SCMS. Risk is commonly defined as likelihood multiplied by impact. The likelihood of a MU carrying out any of the actions outlined in this section is debated,
62 CAMP, “Model Deployment Safety Device DSRC BSM Communication Minimum Performance Requirements,” Oct. 2011.

Chapter 8 Framework for Analyzing the Risk of Vehicle Tracking - DRAFT
Intelligent Transportation Systems Joint Program Office U.S. Department of Transportation, Research and Innovative Technology Administration
SCMS Design and Analysis for the Connected Vehicle System | 65
and the impact may or may not be substantial enough to result in any sort of physical, emotional, or financial harm. The team’s technical privacy analysis is intended to answer four fundamental questions:
1. Is it possible to collect information from BSMs that can be used to track back to a particular vehicle or individual?
2. If so, how can it be done? 3. What would it take to perform such an activity? 4. What might be the motivations to undertake this effort?
To answer these four questions, the team analyzed multiple scenarios at a high level. Guiding questions for these analyses include:
• Is it possible for someone to collect mobile data location points? • What types of data points exist? • How might data location points be used to track the path and/or location of a vehicle? • How might someone connect a vehicle path to identifiable information? • Why would someone be motivated to collect and use these data to track back to an individual
vehicle or person? • Is any particular method of tracking easier than others?
The team’s discussions and analyses based on these questions and alternatives to tracking vehicles and individuals are included below. These high-level analyses led us to understand the ways that BSM data could be used to potentially track a vehicle.
Options for Collecting Mobile Data Location Points
The collection of BSM data at various points or nodes in the V2V context requires the use of a receiver. Since the DSRC system broadcasts data for receipt by any conforming radio receiver, one way to collect information is to place a receiver at any convenient location on the road where there is at least a small amount of protection from the environment, and a power source if the receiver is not battery powered. For this to be useful as a listening station, or sniffer, it would need to either have local storage or retransmit the data using other means. Another way to collect mobile data points is through DSRC-enabled RSE. Documentation regarding the RSE that are envisioned to be part of the V2V/V2I environment has not described functionality that store BSMs and/or infrastructure request messages. However, some RSE specialists63 identified the possibility of RSE operating as the collection point for “probe data” and periodically retransmitting received messages to some central repository. If the RSE do not store information, access to the RSE itself would not constitute an exposure risk; the attacker would have to make some modification to the function of the RSE to gather data. Assuming that RSE have DSRC receivers (and the RSE are networked64), malicious use of the RSE could cause it to act similarly to an installed sniffer (i.e., 63 Kyle Garrett and Bryan Krueger. Synesis Partners. Phone Interview. 9 July 2013. 64 “Network”, as used here means connected to a communications system that would allow someone to access it – regardless of whether they are authorized to do so or not. The more connected RSE are, the easier it is for an unauthorized party to try and misuse data that RSE “listen” to or store, since there are remote ways to access not just one unit but an entire network of them. If RSE are not networked at all, they are almost as hard to use as a sniffer, which at some point someone would need to physically access to gather data.

Chapter 8 Framework for Analyzing the Risk of Vehicle Tracking - DRAFT
Intelligent Transportation Systems Joint Program Office U.S. Department of Transportation, Research and Innovative Technology Administration
SCMS Design and Analysis for the Connected Vehicle System | 66
capture and forward messages without regard for content or intent). Although this could be done by an insider or a malicious intruder, it is not clear how difficult it would be to hack into a network-connected RSE. Hacking is typically easier for an insider as they likely already have some level of authorized access. It should be noted that receiving messages from any single point provides extremely limited information. Assuming the target vehicle does not change certificates in the course of driving through the DSRC range – approximately 300 meters65 – any single radio receiver would only know the track across a 600-meter stretch of road (i.e., the receiver initially picks up a vehicle at approximately 300 meters and loses contact with the vehicle when it has gone 300 meters past the RSE or sniffer). A receiver that captures messages would have no mechanism to link the information to a specific vehicle unless it was also linked to a video device that could capture vehicle identifying information (e.g., license plate) and then correlate the BSM data to the video information. This is trivial if there is only one vehicle but becomes more complicated as more vehicles are simultaneously in the reception area. If someone has access to a series of RSE (if they have storage) or sniffers, it could allow for additional range in the tracking of a vehicle. Within the span of time where the OBE uses the same certificate, the vehicle’s track is trivial to identify. Across certificate intervals where the OBE has changed certificates and other identifying information, there is some probability that a vehicle passing the second point is the same. If there are more vehicles on the road, there is a lower probability of achieving an actual linkage. Additionally, it should be taken into account that the target vehicle may change routes (e.g., turn) before passing the next point in the series of RSE or sniffers, which would disrupt the attacker’s ability to track the vehicle. The number of points needed to produce an accurate depiction of any vehicle’s path is highly dependent on both the length of the vehicle’s route and the frequency/timing of the change in the vehicle’s short-term certificates.
Using Mobile Data Points to Track a Vehicle’s Paths and Locations
As described previously, the BSM has a path history field that provides a limited amount of historical path information for the vehicle. The intent of the path history is to allow a receiving vehicle to have enough information to generate a valid expected path and determine the potential for safety warnings based on the content of a single message. The path history is not extensive; it only provides a relatively short path of approximately 300 meters. By extension, if a sniffer captured the first message from a vehicle when it comes into DSRC range, it will have the vehicle’s path for the previous 300 meters plus the entire path while the vehicle is in range of the DSRC receiver. This would enable the listener to know the path of the vehicle for up to 900 meters (i.e., the original 300 meters in the path history plus the 600 meters covered by the vehicle while in range of the sniffer) by capturing all of the BSMs from the vehicle during one trip through one RSE footprint. Subsequently we discuss two methods for tracking a vehicle’s path and location based on current technology: visual spectrum (i.e., cameras that include still photography and video) and electronic spectrum (i.e., capture of electronic emanations from the car itself or on-board electronics such as cell
65 Based on time and resource constraints, we limited our analysis to sniffers that are DSRC enabled and thus have the same listening range as an RSE (300 meters). We recognize this does not encompass the full universe of listening options.

Chapter 8 Framework for Analyzing the Risk of Vehicle Tracking - DRAFT
Intelligent Transportation Systems Joint Program Office U.S. Department of Transportation, Research and Innovative Technology Administration
SCMS Design and Analysis for the Connected Vehicle System | 67
phones). Our discussion is limited to the most common and thus potentially threatening methods that may be used to track a vehicle, but are not completely exhaustive of all potential tracking methods. Visual
• Traffic cameras, which provide a continual visual record of an intersection or a section of highway, indiscriminately capture any entity that comes into the camera’s field of view and does so regardless of behavior. Depending on the field of view and the specific quality of the camera and lenses in use, images could provide the make, model, color, license plate data, number of passengers, and possibly even facial images of vehicle occupants. Access to this data is generally governed by laws and limited to authorized individuals, but is included here as a comparison of how data can be captured that could be used to track a vehicle or user.
• Speed or traffic light enforcement cameras coupled with detection equipment could be used to capture a targeted vehicle’s image when the sensor inputs are triggered. Enforcement cameras typically are focused to capture the vehicle license plate for specific identification of the vehicle. They also time stamp the image and superimpose other data (e.g., speed). Access to this data is generally governed by laws and limited to authorized individuals, but is included here as a comparison of how data can be captured that could be used to track a vehicle or user.
Electronic
• Any unshielded electronic equipment emits information that, with appropriate equipment that is tuned to the proper frequency, can be captured for analysis. Some emanations are intentional (e.g., cell phones, Wi-Fi) while others are a by-product of the use of electricity in the device (these are referred to as “tempest emanations”). While capturing tempest emanations is a potential means for tracking a vehicle, it is usually technically difficult66 and likely not worth the amount of effort it would take when other, more easily captured emanations are available.
• Using captured E-ZPass identifiers and other similar technology allows road signs to display the expected time to travel the distance from one point to another. The identifier is captured when the vehicle passes an initial sensor and then again at some point down the road. The system calculates an elapsed time, averages the time across a number of vehicles, and discards those which have not reappeared within some standard deviation of time.
• Tire pressure sensors on some vehicles emit radio signals that can be captured from some small distance away. This also includes identifiers to ensure that the receiver can discriminate between the expected sensors and those on neighboring cars. Since there is no protection on this data, if captured, the identifiers can be used to uniquely track the vehicle.
• The addition of Wi-Fi and the use of devices (e.g., cell phones, Bluetooth®67) add additional sources of emissions, all of which provide identification information that would allow an observer to track a vehicle’s path by linking similar data points together.
66 Because tempest emanations can only be captured in close proximity to their source (a vehicle, in this case) someone attempting to capture these data would have to be physically close to the vehicle for extended periods of time, implying visual and physical tracking ability. 67 Bluetooth® is a registered trademark of Bluetooth SIG, Inc.
Chapter 8 Framework for Analyzing the Risk of Vehicle Tracking - DRAFT
Intelligent Transportation Systems Joint Program Office U.S. Department of Transportation, Research and Innovative Technology Administration
SCMS Design and Analysis for the Connected Vehicle System | 68
A wide range of point collection methods could be used to identify when a vehicle is passing by a specific point in space, however none of them alone have the ability to identify a vehicle path beyond the area circumscribed by the localized data collected. Adding some type of centralized collection and analysis of the point collection methods can be used to develop a longer and more detailed path. E-ZPass is an example of a system with centralized collection of point data, although it is not used for developing path information. A MU could re-create a specific vehicle path by capturing E-ZPass identifiers at a series of pick-up points along the highway and transferring them to a central analysis site. Other methods can allow a malicious party to obtain location and path information with less dependency on a specific location (e.g., collecting data from a system such as OnStar®68 or capturing GPS data from a cell phone or cellular capability within the vehicle).
Sources of Mobile Data Location Points
There are multiple ways that one can collect mobile data location points. Visual observation of a vehicle provides a location data point, capture of electronic information provides location as well as other potential identifying information, and sniffing of the BSM provides size, location, speed, and direction in the message plus the historical path information, as noted. Messages sent from the OBE to the SCMS, regardless of the network through which they are transmitted, include a geographic identifier (network address). This is why each message goes through the LOP where the geographic identifier from the message is removed, ensuring that no internal SCMS functions can become aware of the geographic location of a device or user. Other potential identifying information in messages from the OBE to the SCMS is assumed to be encrypted. Only if a sniffer had the appropriate decryption key could it obtain useful information from the content of these messages. The use of controls within the connected vehicle system PKI is intended to protect such information as decryption keys.
Number of Mobile Data Location Points to Track the Path
Determining that a vehicle frequents a specific location only requires a single sensor. However, capturing BSMs will not make it possible to identify that it is the same vehicle unless the OBE happens to choose the same certificate it had used previously at that location. Currently, the connected vehicle system design allows the vehicle to use the same 20 certificates for a week-long period, re-using them as needed over time and changing them at random based on algorithms that we assume will be developed by each auto manufacturer. Identifying the path a vehicle follows has a number of variables, which make it difficult to specify how many sensors would be needed. A large part of the problem with tracking a vehicle is the need to predict the path the vehicle will take or place sensors on many potential paths. With no prior knowledge of behavior, the probability that a vehicle will change its path (i.e., turn) is fairly high. In an environment with a significant number of potential turning points, it is more likely that any vehicle will turn onto a separate (unmonitored) path. Further discussion is included subsequently in the section titled, “Conceptual Measure of Tracking Effectiveness.” There are also two other variables that need to be considered when tracking a path: the length of the path and the type of tracking. Visual tracking requires that, at a minimum, there be one sensor for every path, while line of sight electronic monitoring would require essentially the same number of 68 OnStar® is a registered trademark of OnStar, LLC.
Chapter 8 Framework for Analyzing the Risk of Vehicle Tracking - DRAFT
Intelligent Transportation Systems Joint Program Office U.S. Department of Transportation, Research and Innovative Technology Administration
SCMS Design and Analysis for the Connected Vehicle System | 69
monitoring points. Non–line-of-sight sensors could provide the same coverage with fewer, more centrally placed sensors. The use of a single identifier makes tracking the movement of a vehicle through time and across some paths much easier. Systems like OnStar and E-ZPass broadcast with such an identifier. BSM messages use an identifier that changes frequently. Because of that, the ability to perform path tracking using BSM certificates is less reliable and subject to variability based on the density of traffic in the area. If there is only a single car on the road broadcasting messages, no matter how many times it changes its certificate, it can be tracked as long as it stays within the range of the sniffer/sensor. When there are multiple vehicles on the road, the use of vehicle-specific information such as size, path history, location, speed, and direction can provide additional cues to help pinpoint the specific vehicle and link messages across changes in certificates. The combination of visual and electronic monitoring is probably the most likely to provide a valid identification of a specific vehicle by correlating specific broadcast data with visual behavioral information.
Connecting Vehicle Information to PII
Connecting information about a particular motor vehicle to PII can occur but typically only through access to the right resources provided by some kind of legal authority. Note that possessing the VIN alone does not mean that any PII about the owner is at risk, as the VIN is almost universally displayed on the driver side dashboard and is visible from outside the car. Generally, linking a license plate, VIN, or vehicle make/model/year information to owner PII requires access to controlled information resources, such as internal state department of motor vehicle or police databases. If the entity wanting to make that match has the system access, then it is trivial to make the connection back to a driver. Searches on publically available web pages (e.g., Google™69) usually do not provide a link between an individual and their vehicle (i.e., name linked to VIN/license plate). There are however numerous websites that allow an individual with a subscription and a VIN to look up data on a specific vehicle (e.g., CARFAX®70). The data available through these sites includes accidents (if reported) or other repairs made to the vehicle but do not include information about the owner or the address of the vehicle. Certain proprietary databases, such as those owned by research companies like Westlaw®71 or data marketing companies such as Polk®,72 do include some driver PII. There is no guarantee that this PII is up to date, and the databases are usually protected, but it is feasible that an individual with access could use a VIN or other data to identify a previous or current vehicle owner. Although not typically available to the public, data such as facial images and license plates are available to approved users of state department of motor vehicle databases. Over the last several years, approved users (i.e., police agencies) have been using license plate information to send traffic citations for photo-enforced traffic violations. Some states have drivers’ license databases that now include facial images that could be used for facial recognition in conjunction with a violation. Car manufacturers also have logs of the identifiers for certain components (e.g., tire pressure radio transmitters) for the use of recalls or important safety information. This information could allow any of these entities to map to the VIN of the vehicle. 69 Google® is a registered trademark of Google, Inc. 70 CARFAX® is a registered trademark of CARFAX, Inc. 71 Westlaw® is a registered trademark of Thomson Reuters. 72 Polk® is a registered trademark of R.L. Polk.

Chapter 8 Framework for Analyzing the Risk of Vehicle Tracking - DRAFT
Intelligent Transportation Systems Joint Program Office U.S. Department of Transportation, Research and Innovative Technology Administration
SCMS Design and Analysis for the Connected Vehicle System | 70
Another way to connect the details of a vehicle’s path to PII is through a sniffer capturing BSMs. If at some point the holder of the data would be able to determine the home address by tracking or following the vehicle, an individual could obtain the home owner’s name, as sales records for properties are public information and available through web searches for the address. Note that if the property is rented, the name listed on the publically available sales record is likely that of the landlord, not the actual individual who occupies the property. Knowing that a vehicle typically arrives at a frequented location from a specific direction can also provide assistance to the sniffer looking to capture identity information. Path history information could assist in providing support for narrowing the search for a point of origin. Then, using previously captured path information, the receiver position can be sequentially moved closer to the origin using the path trace information in the BSM. Coupling this information with physical observation enables the sniffer to sort out the target vehicle from other vehicles that travel on a similar route. Since most trips are of relatively short duration, the average number of hops would not be exceedingly large. The threats posed by sniffers would need to be analyzed further, but may not be any more of a threat than existing tactics for tracking vehicles – and in fact they may be much less of a threat.
Simplicity of Collecting Data Location Points
Assuming that RSE are network-enabled and also have DSRC receivers, the “easiest” method of tracking a vehicle would be to tap into the RSE control network and redirect received messages to a server for analysis. The term “easiest” in this case is based on the fact that the receivers are in place and therefore it requires no on-site manpower to deploy the receivers, making it the “easiest” method for an insider to accomplish. The level of difficulty of hacking the system from the outside is hard to determine at this time, as the system is still being designed. Regardless, the number of messages needed to determine a vehicle’s path is still unknown, as is the effort involved in sorting through thousands of messages to separate out individual vehicle paths. Another method to collect the BSM data is to put up sniffers to capture the BSMs. These would not imply hacking into the RSE network, but would have the capability to capture the data that may be captured by the RSE. The scope of potential risk here is based on collection and analysis of BSMs being shared between vehicles with OBE within a given footprint.
Motivation to Collect Data Location Points
Regardless of the method used to collect data location points, the motivation would likely be either criminal or commercial, with the most likely reason being monetary gain. Criminal motivation would include the ability of the attacker to determine the vehicle’s travel pattern and home location, which they can then use to locate and burglarize the home. A commercial use would be to use the pattern information for some type of impact claims for advertising revenue or targeted selling.
Easier and Cheaper Ways to Collect Information
The identification of easier and cheaper ways to collect data location points using existing technology or methods depends on the goal. If the goal is to identify a specific vehicle coming to a specific place, then almost every other method is easier than linking certificates to the BSM (i.e., in-person viewing is very easy, photographic evidence is the next easiest, and monitoring for data like E-ZPass identifiers is slightly more difficult). If a MU has access to the appropriate databases, he or she may be able to access PII of the vehicle owners. Performing a physical inspection of the vehicle can reveal the VIN,

Chapter 8 Framework for Analyzing the Risk of Vehicle Tracking - DRAFT
Intelligent Transportation Systems Joint Program Office U.S. Department of Transportation, Research and Innovative Technology Administration
SCMS Design and Analysis for the Connected Vehicle System | 71
a photo can capture the license plate information, and electronic monitoring can obtain an E-ZPass value. Capturing and deciphering BSMs does not provide any of that information. If the goal is to track a vehicle to its home location, it is probably easier to physically follow the vehicle as all other methods described previously require a significant amount of instrumenting roadways to determine the path. Using BSMs may make it slightly easier because the BSM includes some path history, however, the attacker would still need to be able to pick up the location of the vehicle at the right time. Therefore, the attacker still requires multiple locations to capture sighting or electronic information to identify a path. At this time, since multiple variables still need to be determined (i.e., the number of RSE required), costs have not been included in this analysis. As noted in this discussion, many variables exist that make it difficult to actually track a vehicle using only one method. The next section identifies elements that are required to estimate the probability of being able to detect a vehicle. To fully understand each option’s level of relative risk, additional empirical modeling that is outside the scope of this task is needed; however below we describe the methodology used to provide a sample of such data.
Effectiveness of Tracking Measures The purpose of the analysis presented herein is to quantify the risk of a MU’s capability to track a vehicle through the penetration of the connected vehicle network by using a sniffer device or hacking into a connected RSE with storage73 to intercept the target vehicle’s (i.e., the vehicle of interest) BSM (basic safety message). As stated at the beginning of this chapter, this risk analysis was performed under specific parameters and is just one element that needs to be considered as part of a full risk analysis. This scenario is examined through a simulation of a sample of both suburban and urban roads. Additionally, this study considers what information the MU needs to know about the target in addition to the BSM to detect the target. This information is referred to as a priori information – information that is known prior to receiving any BSMs. This study defines the probability of detection as the ability of the MU to ascertain the target vehicle from BSMs collected by a sniffer. For the purpose of this study, the probability of detection is defined as the MU’s ability to “guess” which BSM came from the target vehicle after disambiguating the target BSM by using the known vehicle dimensions of the target vehicle’s make and model (this is assuming that the MU knows the make/model of the vehicle of interest). The key findings of this simulation can be summarized as:
1. Critical a priori information is needed to have significant probability of detection – There are three critical pieces of a priori information that a MU needs to identify a target. They are:
a) The target vehicle’s make and model b) The network area in which the intercept attempt will take place c) The time window during which the intercept will take place
73 For the sake of conciseness, the use of a “sniffer” throughout the rest of this analysis refers to sniffers as well as access to RSE networks or storage if they exist.

Chapter 8 Framework for Analyzing the Risk of Vehicle Tracking - DRAFT
Intelligent Transportation Systems Joint Program Office U.S. Department of Transportation, Research and Innovative Technology Administration
SCMS Design and Analysis for the Connected Vehicle System | 72
Without these pieces of information, the probability of detection will not be significant. For example, if there is no scope to geography or time window in which the intercept takes place (i.e., the target could be anywhere in the U.S. at any time), then it would be improbable for the MU to know where to penetrate the network.
2. Probability of detection is lower when there is more traffic – As the number of vehicles that are passing through a sniffer’s footprint increases; the more difficult it will be to detect the target vehicle. This could be counter intuitive in the case that the MU knows a priori that the target vehicle could be in a large geographic area. In this case, it could be reasonable for a MU to penetrate the network at a location with a dense traffic environment. However, the MU will likely receive a volume of BSMs that will be difficult to disambiguate.
3. Target vehicles with ‘more distinct’ vehicle dimensions improve the probability of detection – More distinct vehicle make/models will make it easier for a MU to detect since the dimensions (i.e., information included in the BSM) will also be unusual or distinct from other vehicles’ dimensions. For example, a Porsche Cayman in a low income rural area will be much easier to detect than a Toyota Camry in a middle-class suburban area because the Porsche Cayman is “more distinct.”
4. A shorter a priori intercept time window will increase the probability of detection – If the MU knows, a priori, the time window during which the intercept of the target vehicle will take place, it will be easier to disambiguate the BSM, thus making detection more probable.
These key findings are presented analytically in Figure 8 below, which represents the probability of detection’s sensitivity to the time window of intercept. The vertical axis represents the probability of detection, while the horizontal axis represents the a priori intercept time window. The graph on the left displays the simulated results for the suburban location while the graph on the right represents the simulated results for the urban location. The graph series represents the probability of detection for a representative vehicle (based on the vehicle with the maximum U.S. sales for its class) for each of the vehicle classes. It is important to note that vehicle traffic will be proportional to the time window. As the a priori time window increases, an increased amount of traffic will be observed. Additional evidence of this relationship is provided in the technical approach below, however these observations can be used to support key finding number two above.
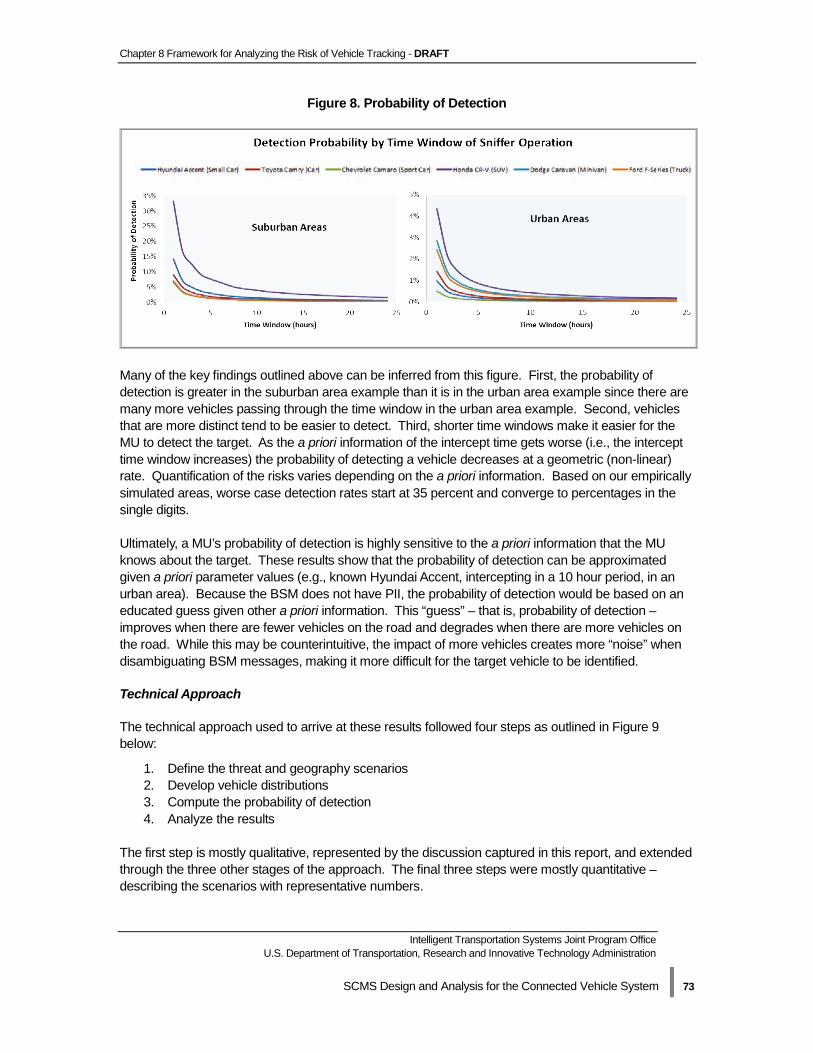
Chapter 8 Framework for Analyzing the Risk of Vehicle Tracking - DRAFT
Intelligent Transportation Systems Joint Program Office U.S. Department of Transportation, Research and Innovative Technology Administration
SCMS Design and Analysis for the Connected Vehicle System | 73
Figure 8. Probability of Detection
Many of the key findings outlined above can be inferred from this figure. First, the probability of detection is greater in the suburban area example than it is in the urban area example since there are many more vehicles passing through the time window in the urban area example. Second, vehicles that are more distinct tend to be easier to detect. Third, shorter time windows make it easier for the MU to detect the target. As the a priori information of the intercept time gets worse (i.e., the intercept time window increases) the probability of detecting a vehicle decreases at a geometric (non-linear) rate. Quantification of the risks varies depending on the a priori information. Based on our empirically simulated areas, worse case detection rates start at 35 percent and converge to percentages in the single digits. Ultimately, a MU’s probability of detection is highly sensitive to the a priori information that the MU knows about the target. These results show that the probability of detection can be approximated given a priori parameter values (e.g., known Hyundai Accent, intercepting in a 10 hour period, in an urban area). Because the BSM does not have PII, the probability of detection would be based on an educated guess given other a priori information. This “guess” – that is, probability of detection – improves when there are fewer vehicles on the road and degrades when there are more vehicles on the road. While this may be counterintuitive, the impact of more vehicles creates more “noise” when disambiguating BSM messages, making it more difficult for the target vehicle to be identified.
Technical Approach
The technical approach used to arrive at these results followed four steps as outlined in Figure 9 below:
1. Define the threat and geography scenarios 2. Develop vehicle distributions 3. Compute the probability of detection 4. Analyze the results
The first step is mostly qualitative, represented by the discussion captured in this report, and extended through the three other stages of the approach. The final three steps were mostly quantitative – describing the scenarios with representative numbers.
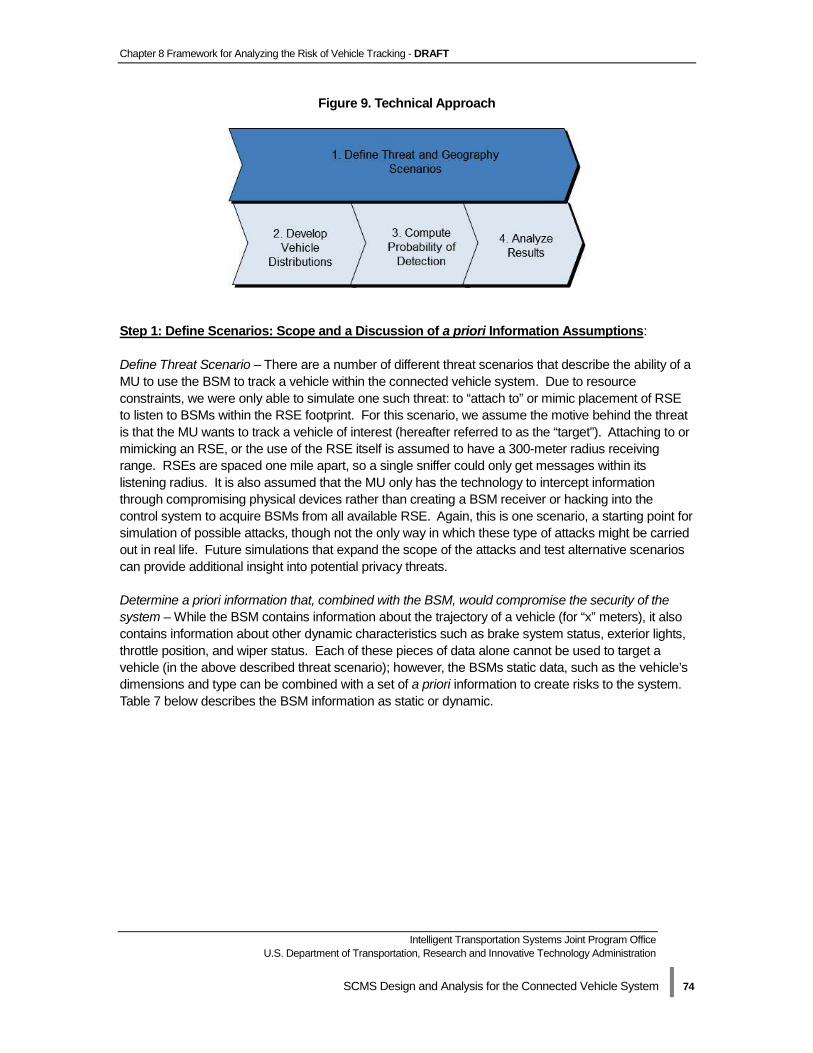
Chapter 8 Framework for Analyzing the Risk of Vehicle Tracking - DRAFT
Intelligent Transportation Systems Joint Program Office U.S. Department of Transportation, Research and Innovative Technology Administration
SCMS Design and Analysis for the Connected Vehicle System | 74
Figure 9. Technical Approach
Step 1: Define Scenarios: Scope and a Discussion of a priori Information Assumptions: Define Threat Scenario – There are a number of different threat scenarios that describe the ability of a MU to use the BSM to track a vehicle within the connected vehicle system. Due to resource constraints, we were only able to simulate one such threat: to “attach to” or mimic placement of RSE to listen to BSMs within the RSE footprint. For this scenario, we assume the motive behind the threat is that the MU wants to track a vehicle of interest (hereafter referred to as the “target”). Attaching to or mimicking an RSE, or the use of the RSE itself is assumed to have a 300-meter radius receiving range. RSEs are spaced one mile apart, so a single sniffer could only get messages within its listening radius. It is also assumed that the MU only has the technology to intercept information through compromising physical devices rather than creating a BSM receiver or hacking into the control system to acquire BSMs from all available RSE. Again, this is one scenario, a starting point for simulation of possible attacks, though not the only way in which these type of attacks might be carried out in real life. Future simulations that expand the scope of the attacks and test alternative scenarios can provide additional insight into potential privacy threats. Determine a priori information that, combined with the BSM, would compromise the security of the system – While the BSM contains information about the trajectory of a vehicle (for “x” meters), it also contains information about other dynamic characteristics such as brake system status, exterior lights, throttle position, and wiper status. Each of these pieces of data alone cannot be used to target a vehicle (in the above described threat scenario); however, the BSMs static data, such as the vehicle’s dimensions and type can be combined with a set of a priori information to create risks to the system. Table 7 below describes the BSM information as static or dynamic.
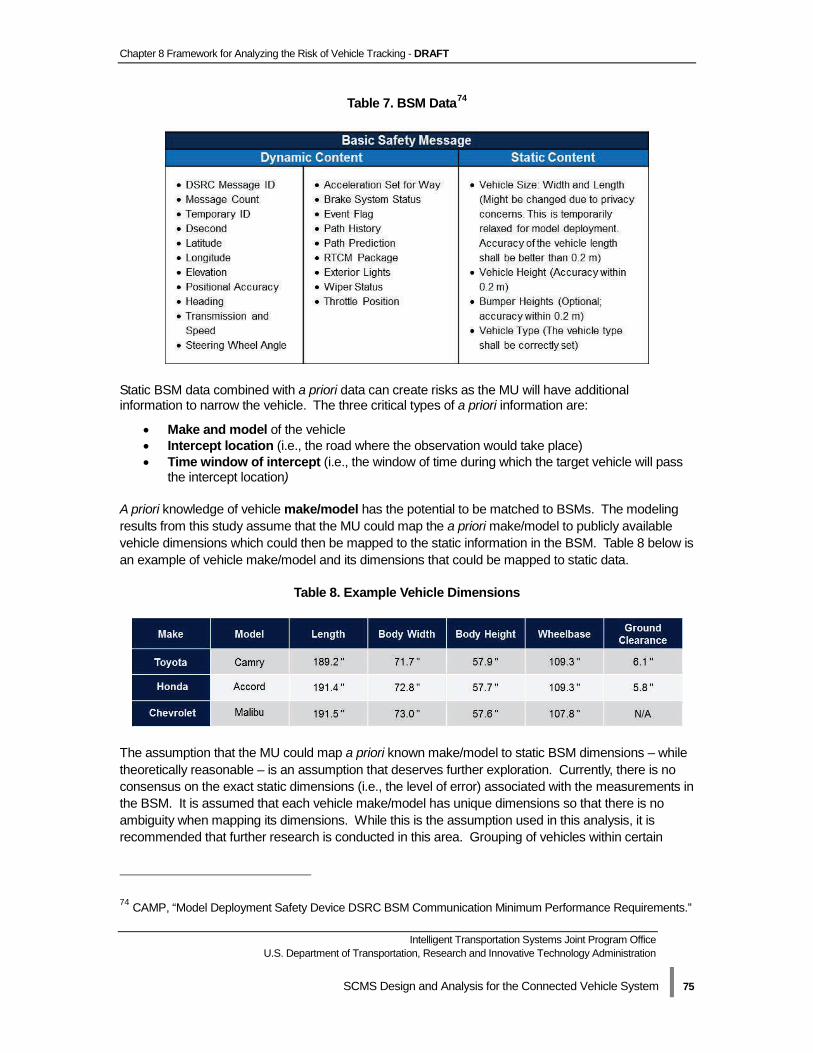
Chapter 8 Framework for Analyzing the Risk of Vehicle Tracking - DRAFT
Intelligent Transportation Systems Joint Program Office U.S. Department of Transportation, Research and Innovative Technology Administration
SCMS Design and Analysis for the Connected Vehicle System | 75
Table 7. BSM Data74
Static BSM data combined with a priori data can create risks as the MU will have additional information to narrow the vehicle. The three critical types of a priori information are:
• Make and model of the vehicle • Intercept location (i.e., the road where the observation would take place) • Time window of intercept (i.e., the window of time during which the target vehicle will pass
the intercept location) A priori knowledge of vehicle make/model has the potential to be matched to BSMs. The modeling results from this study assume that the MU could map the a priori make/model to publicly available vehicle dimensions which could then be mapped to the static information in the BSM. Table 8 below is an example of vehicle make/model and its dimensions that could be mapped to static data.
Table 8. Example Vehicle Dimensions
The assumption that the MU could map a priori known make/model to static BSM dimensions – while theoretically reasonable – is an assumption that deserves further exploration. Currently, there is no consensus on the exact static dimensions (i.e., the level of error) associated with the measurements in the BSM. It is assumed that each vehicle make/model has unique dimensions so that there is no ambiguity when mapping its dimensions. While this is the assumption used in this analysis, it is recommended that further research is conducted in this area. Grouping of vehicles within certain
74 CAMP, “Model Deployment Safety Device DSRC BSM Communication Minimum Performance Requirements.”

Chapter 8 Framework for Analyzing the Risk of Vehicle Tracking - DRAFT
Intelligent Transportation Systems Joint Program Office U.S. Department of Transportation, Research and Innovative Technology Administration
SCMS Design and Analysis for the Connected Vehicle System | 76
dimension ranges may be one way to help dissipate threats to figuring out make or model from the BSM. Vehicle intercept location is the next important piece of a priori information. If the MU knows the target’s dimensions (and can trace them in the BSM), the MU would also need to know the geographic scope, otherwise, the target’s dimension information alone is not helpful. In the case where there is no scope to vehicle intercept location, the MU would have to “guess” where to tap into the RSE or place a parallel sniffer. The probability of “guessing” correctly would be very difficult. If the threat scenario required a listening tower, then the MU could potentially know a general geographic range to place the sniffer. However, for the purposes of addressing the threat scenario in this study, it is assumed that the MU knows a priori where on the road network the intercept would take place. Time window of intercept is the final assumed piece of a priori information. Without scope of knowing the intercept time window, the MU would have to “guess” the target’s BSM from BSMs collected over a time horizon of years. Conversely, if the MU knows a priori the time of intercept down to the second, that combined with make/model and location could make it easier to identify a target. Choose Sample Geographic Regions – Based on vehicle distribution data, North San Francisco, Concord, and Pleasant Hill in California were selected to represent urban and suburban areas.75 The map below in Figure 10 depicts these regions along with the median household income which is indicated by color and color density. While Concord and Pleasant Hills are suburban areas, residents have higher incomes than median U.S. household incomes. This income distribution is important to the distribution of vehicles in the region.
75 Sangho Choo and Patricia L. Mokhtarian, “The Relationship of Vehicle Type Choice to Personality, Lifestyle, Attitudinal and Demographic Variables,” Department of Civil and Environmental Engineering, University of California Davis, 2002.

Chapter 8 Framework for Analyzing the Risk of Vehicle Tracking - DRAFT
Intelligent Transportation Systems Joint Program Office U.S. Department of Transportation, Research and Innovative Technology Administration
SCMS Design and Analysis for the Connected Vehicle System | 77
Figure 10. Sample Geographic Regions in California
Step 2: Develop Vehicle Distributions: Vehicle distributions are important when calculating the probability of detection. In order to derive the regional vehicle distributions, a four-step approach was utilized:
1. First, a list of vehicle brands that sold cars to the U.S. public in 2012 was created.76 2. The second step included researching detailed sales per model, for a total of 21 auto
manufacturers that covered more than 85 percent of the new vehicle markets in the U.S. in 2012.
3. Once the detailed list of makes/models sold in the U.S. in 2012 was established, we analyzed research to evaluate how vehicle selection preferences differ between urban and suburban areas. This analysis allowed us to construct a distribution of traffic across six vehicle size categories (small cars, cars, sport cars, sport utility vehicles, minivans and trucks) for the urban and suburban areas selected for this analysis.
4. Finally, we calculated percentages of each car model over its respective size group. Once calculated, these percentages were multiplied by the total number of vehicles of that size group, both for urban and suburban areas. As shown in Table 9 below, these calculations allowed us to approximate the expected number of each car model in the selected geographies.
76 Wall Street Journal. What’s Moving: U.S. Auto Sales, http://wap.wsj.com/mdc/public/page/2_3022-autosales.html.
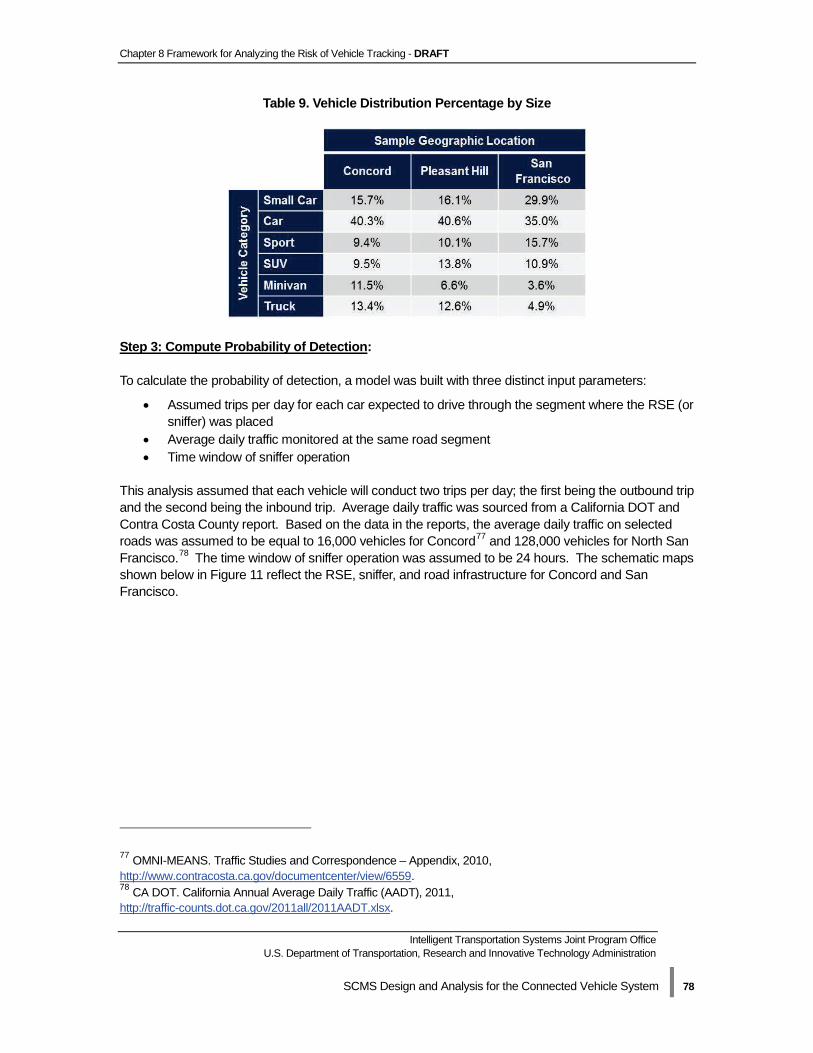
Chapter 8 Framework for Analyzing the Risk of Vehicle Tracking - DRAFT
Intelligent Transportation Systems Joint Program Office U.S. Department of Transportation, Research and Innovative Technology Administration
SCMS Design and Analysis for the Connected Vehicle System | 78
Table 9. Vehicle Distribution Percentage by Size
Step 3: Compute Probability of Detection: To calculate the probability of detection, a model was built with three distinct input parameters:
• Assumed trips per day for each car expected to drive through the segment where the RSE (or sniffer) was placed
• Average daily traffic monitored at the same road segment • Time window of sniffer operation
This analysis assumed that each vehicle will conduct two trips per day; the first being the outbound trip and the second being the inbound trip. Average daily traffic was sourced from a California DOT and Contra Costa County report. Based on the data in the reports, the average daily traffic on selected roads was assumed to be equal to 16,000 vehicles for Concord77 and 128,000 vehicles for North San Francisco.78 The time window of sniffer operation was assumed to be 24 hours. The schematic maps shown below in Figure 11 reflect the RSE, sniffer, and road infrastructure for Concord and San Francisco.
77 OMNI-MEANS. Traffic Studies and Correspondence – Appendix, 2010, http://www.contracosta.ca.gov/documentcenter/view/6559. 78 CA DOT. California Annual Average Daily Traffic (AADT), 2011, http://traffic-counts.dot.ca.gov/2011all/2011AADT.xlsx.

Chapter 8 Framework for Analyzing the Risk of Vehicle Tracking - DRAFT
Intelligent Transportation Systems Joint Program Office U.S. Department of Transportation, Research and Innovative Technology Administration
SCMS Design and Analysis for the Connected Vehicle System | 79
Figure 11. Concord and San Francisco Infrastructure Maps
Once the input variables were decided, the observed traffic for the two road segments was calculated and multiplied with the vehicle model distribution developed in Step 3. The expected traffic for each car model was estimated for the respective road segments. Following this, the probability of detection for each single car was calculated by dividing one (1) by the expected traffic for that vehicle’s model in each of the road segments. A probability of detection was estimated for every car model. Finally, the median of the individual probabilities of detection of each car model was used to estimate the aggregate probability of detection for all vehicle models as a whole. The above are summarized in the following equations:
Step 4: Analyze Results: To analyze the results and derive meaningful conclusions, two of the input parameters were changed incrementally and their effects on the probability of detection were analyzed. Those two parameters were “time window of sniffer operation” and “daily traffic.” As can be observed in Figure 12 below, increasing the time window leads to a decrease in the probability of detection since the amount of traffic that will be captured by the sniffer will increase significantly, thus limiting the ability to pick the correct vehicle out of the total population. Limiting the time window requires the MU to possess information of higher accuracy as per the instant that the targeted vehicle will cross the point of observation. At the same time, it is worth noting that the curve for an urban setting is lower than that for a suburban setting. This stems from the fact that in urban
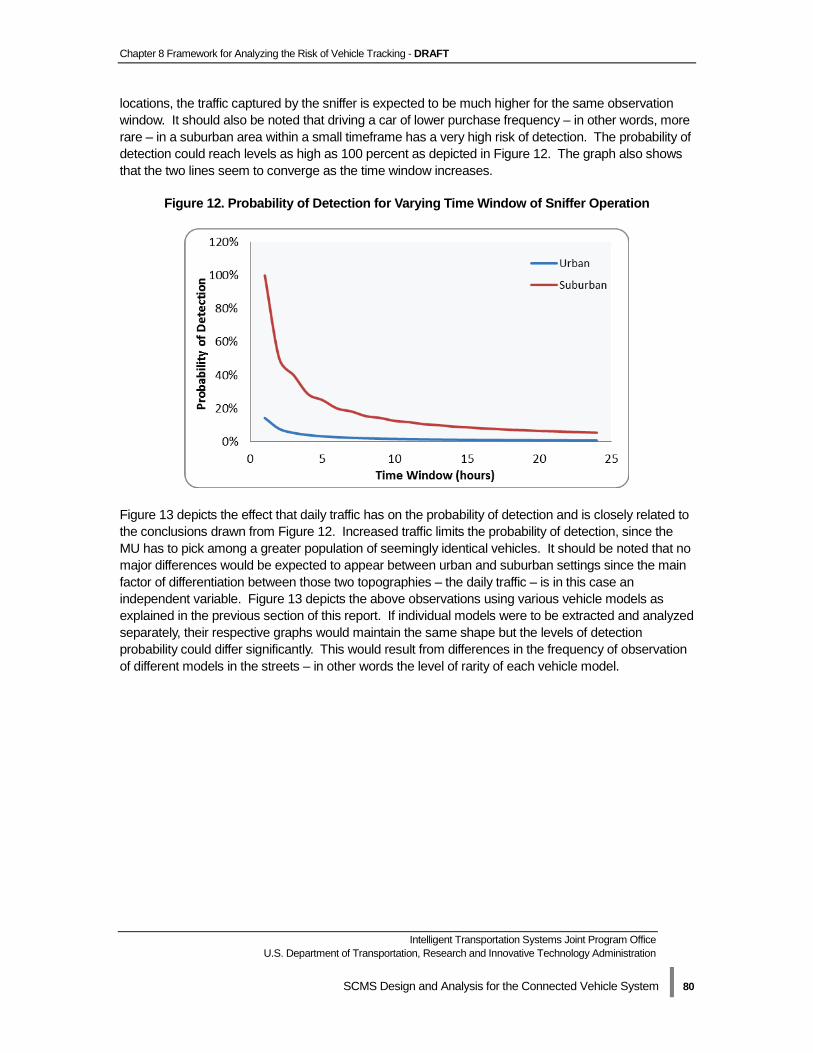
Chapter 8 Framework for Analyzing the Risk of Vehicle Tracking - DRAFT
Intelligent Transportation Systems Joint Program Office U.S. Department of Transportation, Research and Innovative Technology Administration
SCMS Design and Analysis for the Connected Vehicle System | 80
locations, the traffic captured by the sniffer is expected to be much higher for the same observation window. It should also be noted that driving a car of lower purchase frequency – in other words, more rare – in a suburban area within a small timeframe has a very high risk of detection. The probability of detection could reach levels as high as 100 percent as depicted in Figure 12. The graph also shows that the two lines seem to converge as the time window increases.
Figure 12. Probability of Detection for Varying Time Window of Sniffer Operation
Figure 13 depicts the effect that daily traffic has on the probability of detection and is closely related to the conclusions drawn from Figure 12. Increased traffic limits the probability of detection, since the MU has to pick among a greater population of seemingly identical vehicles. It should be noted that no major differences would be expected to appear between urban and suburban settings since the main factor of differentiation between those two topographies – the daily traffic – is in this case an independent variable. Figure 13 depicts the above observations using various vehicle models as explained in the previous section of this report. If individual models were to be extracted and analyzed separately, their respective graphs would maintain the same shape but the levels of detection probability could differ significantly. This would result from differences in the frequency of observation of different models in the streets – in other words the level of rarity of each vehicle model.
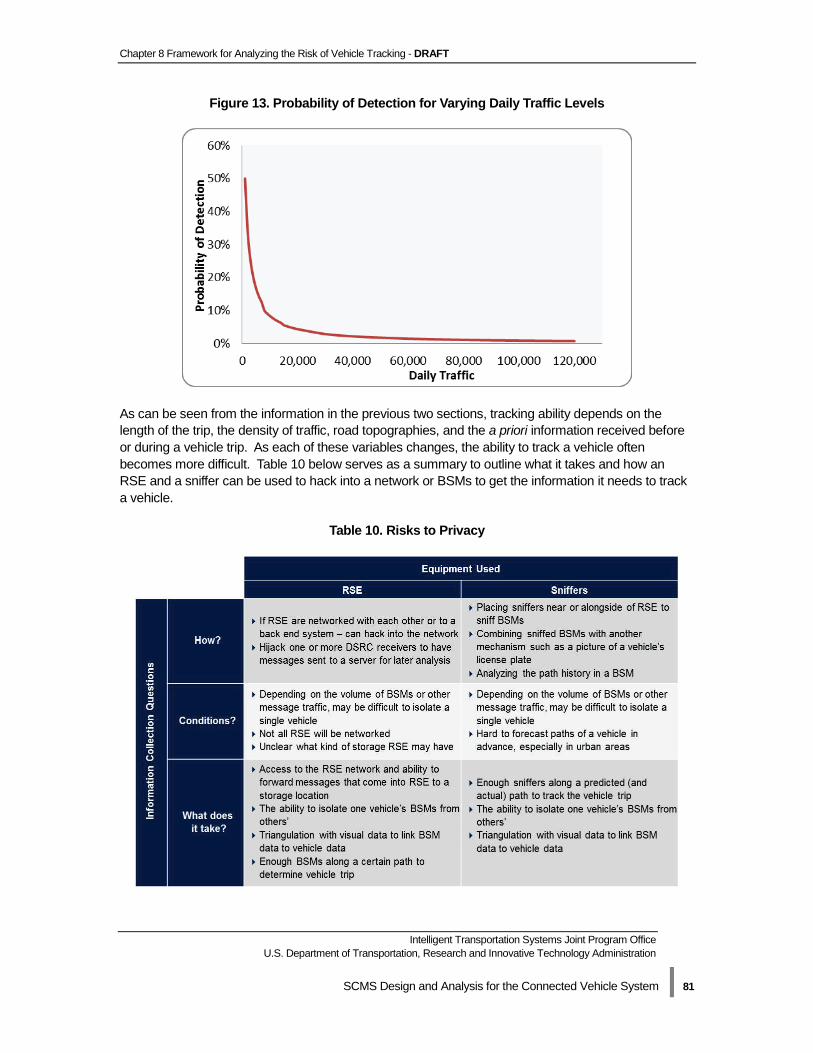
Chapter 8 Framework for Analyzing the Risk of Vehicle Tracking - DRAFT
Intelligent Transportation Systems Joint Program Office U.S. Department of Transportation, Research and Innovative Technology Administration
SCMS Design and Analysis for the Connected Vehicle System | 81
Figure 13. Probability of Detection for Varying Daily Traffic Levels
As can be seen from the information in the previous two sections, tracking ability depends on the length of the trip, the density of traffic, road topographies, and the a priori information received before or during a vehicle trip. As each of these variables changes, the ability to track a vehicle often becomes more difficult. Table 10 below serves as a summary to outline what it takes and how an RSE and a sniffer can be used to hack into a network or BSMs to get the information it needs to track a vehicle.
Table 10. Risks to Privacy
Chapter 9 Misbehavior - DRAFT
Intelligent Transportation Systems Joint Program Office U.S. Department of Transportation, Research and Innovative Technology Administration
SCMS Design and Analysis for the Connected Vehicle System | 82
Chapter 9 Misbehavior
The MA function has been identified as an integral piece of the SCMS. The team discusses some of the high-level, preliminary concepts related to the MA function that we have developed through conversations with CAMP and input from Booz Allen PKI subject matter experts (SMEs). Although progress has been made, several MA processes are still largely under development and could have a significant impact on the operations and cost estimates of the system. In this chapter we review the misbehavior detection and management processes that CAMP has outlined, incorporate additional research on the misbehavior function, and outline outstanding issues.
Misbehavior within the SCMS PKI In traditional PKI systems, misbehavior detection and management is carried out by the CA and/or the RA, and is limited to investigating misbehavior among the users of the system, whose identity is generally known by the CA. In addition, the actions that constitute “misbehavior” and that lead to certificate revocation are clearly defined in traditional PKI systems. In the SCMS, the MA function is responsible for misbehavior detection and management, and the actions that constitute “misbehavior” are still being analyzed and developed. We have mentioned before that the PKI for the connected vehicle system has characteristics that will require a unique technical design that differs from standard approaches to PKI. Outlined below are key reasons why directly comparative examples for misbehavior detection and management of PKI systems are not available for or applicable to the SCMS.
• Privacy needs: Most SCMS functions are not envisioned to have access to specific information about users to protect user privacy. This makes following up on misbehavior difficult and increases the technical complexity of the process, which is still under development.
• Separation of certain functions: To support user privacy and system security, the separation of certain functions (e.g., central and non-central functions) is recommended. For those functions that can be combined within a CME, the use of strict physical, procedural, and technical controls is needed. As outlined previously, the use of controls is intended to safeguard user information by preventing any internal or external party from having the information it needs to engage in malfeasance (e.g., trip tracking).
• System scale: Both the number of vehicles envisioned for full deployment (250 million) and the number of short-term certificates needed per vehicle are far greater than what exists for other systems.79 These scale issues directly impact the ability of an authority (such as the MA) to create and publish CRLs, as discussed later in this chapter.
79 The current largest U.S. PKI system is maintained by the Department of Defense, which hosts approximately 4.5 million users. Certificate validity in the Department of Defense PKI is months to years compared to that of the SCMS short-term certificates which is currently assumed to be five minutes.
Chapter 9 Misbehavior - DRAFT
Intelligent Transportation Systems Joint Program Office U.S. Department of Transportation, Research and Innovative Technology Administration
SCMS Design and Analysis for the Connected Vehicle System | 83
• New functions: The SCMS includes new functions such as the LAs and LOP that currently do not exist in any other PKI system. With this new complexity come different challenges with how information is sent and shared among functions.
For these reasons, the misbehavior detection that takes place in traditional PKI systems is not entirely applicable to the SCMS. Although there are no one-to-one industry examples, later in the chapter we discuss industry examples of how misbehavior is approached.
Misbehavior Authority Function The MA function is critical for maintaining the integrity of the SCMS, as it is responsible for identifying potential misbehavior in the connected vehicle system and working with other SCMS functions to remove bad actors. The CAMP technical design does not yet contain fully developed misbehavior detection and management processes or the technical architecture specifying how misbehavior will be detected locally (in vehicle) and globally (system-wide). Both CAMP and the Booz Allen team agree that the MA is a central function that should be separated from the PCA and RA. The Booz Allen team believes that, from an organizational standpoint, the MA could be combined within the same CME as certain other central functions, as long as appropriate physical, procedural, and technical controls are put in place (see Chapter 6). Specifically, the team has suggested that a CME (working name: “Central Organization”) could house the MA, ECA, and request coordination function. Further analysis of the implications of ownership/operation options will also influence the recommendation about how many functions can or should be combined into one entity. As discussed in Chapter 3, CAMP’s technical design architecture includes various functions within the MA that this team believes could more accurately be described as activities within the MA. These activities include the IBLM, global detection, CRL generator, CRL store, and CRL broadcast. We believe that the classification of the MA as central implies that all of these activities should also be centrally run within the MA. We also believe that designating any part of the MA as non-central would create an incongruity with implications for how the MA function can be overseen. If one part of a central function is non-central, there is a greater level of complexity in terms of organizational design and security that must be dealt with by the owner/operator of the MA. Numerous assumptions exist related to how the MA will operate during initial deployment versus full deployment. Assumptions for each phase of the deployment are discussed subsequently and further explained in the remainder of this chapter.
Assumptions for Initial Deployment
In the early stages of the connected vehicle system, the MA function is likely to exist more as a testing and development function. The overarching purpose of the MA will be to design and develop global detection functionality, and determine how it can be incorporated into the system for full deployment. Because initial deployment will not feature communications between the SCMS and OBE, the MA will not be as fully operational as it will be for full deployment. The MA functionality will likely grow over the first three years of deployment, and during this time might use opt-in connectivity with OBE for initial testing of functionality and processes that are to be launched during full deployment. The team assumes that the IBLM within the MA, and the RA (or request coordination function), will maintain the internal blacklist during initial deployment but that it will be smaller than it is anticipated to be during full
Chapter 9 Misbehavior - DRAFT
Intelligent Transportation Systems Joint Program Office U.S. Department of Transportation, Research and Innovative Technology Administration
SCMS Design and Analysis for the Connected Vehicle System | 84
deployment. The most current information about the internal blacklist and the CRL is included later in this chapter.
Assumptions for Full Deployment
Based on CAMP’s design, the MA function during full deployment will gather misbehavior reports from the OBE and conduct global detection to identify malfeasance from a system-wide perspective. The MA will then work with other functions (namely the PCA, RA, LAs, and ECA) to create the internal blacklist and CRL. The Booz Allen team has worked with CAMP to divide the MA processes for full deployment into a process that describes the identification and investigation of misbehavior, and a process that describes revocation via the internal blacklist and CRL. Misbehavior detection by the OBE is what initiates these processes, as described in the following section.
Misbehavior Detection Misbehavior detection takes place at the local and global levels. For V2V communications, local misbehavior detection is conducted by the OBE in each vehicle. Global detection is an activity of the MA.
Local Detection
The current technical design and discussions indicate that much of the anticipated misbehavior is expected to be detected and dealt with by the OBE. The current design features expectations that the OBE will be able to detect and reject or ignore most of the plausible erroneous messages coming from other vehicles. Clearly, this implies significant processing, operating power, and sophistication from OBE and eventually ASDs. Subsequent development and analysis of algorithms and programming needs for the OBE will need to focus on the questions of how the devices will be able to engage in broad and technically complex misbehavior detection functions. In addition, there is an assumption from technical teams that self-diagnosis and shut down in the case of malfunction will also be available on OBE, thus providing a mechanism for removal of misbehaving OBE from the system that does not involve the MA or other system-wide functions. In order to deal with misbehaving OBE that are not detected at the local level, additional specifications have to be developed about system-wide misbehavior detection. During full deployment, the OBE will send misbehavior reports to the MA, which will review and process the reports as part of yet to be defined global detection processes. Misbehavior reports will include message identifiers for all potentially bad messages that the OBE is not able to deal with itself. The frequency of report delivery has not been established. These reports will inform the MA of messages that were flagged by the OBE through local misbehavior detection of potential technical malfunction or malfeasance. CAMP has indicated that the content and format of misbehavior reports are not finalized as of this time, but that they may include:
• BSMs received from other vehicles that the reporting device believes may represent misbehavior (also referred to as “suspicious BSMs”)
• Random BSMs (contained in a “casual report”) • Alert-related BSMs • The reporter’s certificate • The reporter’s signature • The certificate ID of the suspected certificate
Chapter 9 Misbehavior - DRAFT
Intelligent Transportation Systems Joint Program Office U.S. Department of Transportation, Research and Innovative Technology Administration
SCMS Design and Analysis for the Connected Vehicle System | 85
Because there are costs associated with data transfer and processing at each step in the process for every misbehavior report that is sent by the OBE, the content of the reports and the frequency by which they are sent should be carefully considered by technical teams. Local detection ends when the misbehavior report is sent to the MA and global detection begins.
Global Detection
Previous designs for the SCMS included a discussion of a more comprehensive process for identifying types of misbehavior, referred to as global detection. The CAMP design as of December 2013 included it in the technical architecture diagram, but did not explain it in detail. Global detection has been a challenge over the course of the development of the SCMS due in large part to the system’s unprecedented scale and design as well as the lack of understanding of the amount of misbehavior that will be present in the system (i.e., the misbehavior rate). The team views global detection as the process that the MA executes when analyzing content from a misbehavior report, in addition to any other inputs the MA may have, to determine whether revocation of a specific enrollment certificate through placement on the CRL is necessary. Placement of an enrollment certificate on the internal blacklist would remove a bad actor from the system by rejecting requests from the misbehaving OBE for new certificate batches. If the technical design does evolve to include more high-level, comparative misbehavior detection, the necessary algorithms and processing capabilities will have to be built to address this functionality. Hardware and software specifications to support misbehavior reporting would ideally be accounted for in the design of OBE prior to initial deployment, so that new vehicles manufactured during initial deployment would have the capability to fully participate in the system when full deployment begins. For these reasons, it is important for the baseline details of global detection to be specified prior to initial deployment, even if global detection is not planned to take place until full deployment.
Misbehavior Investigation and Revocation Booz Allen proposes the division of the MA processes into two separate areas: identification and investigation (simply referred to as “investigation”), and revocation. We worked with internal SMEs to illustrate how the SCMS functions are likely to interact during each process. At the current time, there is a greater understanding of the revocation process than there is of the investigation process.
Investigation
The investigation process begins with an OBE sending a misbehavior report (based on previously discussed local detection performed on the device) to the MA, which the MA may then use as part of its global detection processes. When the MA receives misbehavior reports, it first compares the content of the misbehavior report against the current CRL to evaluate whether devices identified through local detection are already known to the system as misbehaving or malfunctioning. If reported OBE are not already on a CRL, the MA is assumed to engage in global detection. Global detection could involve the MA comparing content of the misbehavior report against a data store of previously reported, unrevoked certificate IDs (or messages), among other processes. If an OBE contained in a misbehavior report has been previously reported, the MA may be able to analyze the types of malfeasance or malfunction that have occurred with a particular OBE through time. As mentioned previously, the specific details of the global detection process are largely unknown.

Chapter 9 Misbehavior - DRAFT
Intelligent Transportation Systems Joint Program Office U.S. Department of Transportation, Research and Innovative Technology Administration
SCMS Design and Analysis for the Connected Vehicle System | 86
To this point the team has assumed that only the ECA would have access to the enrollment certificate of each OBE. However, if global detection will rely on historical data about past misbehavior or malfunction, there will need to be some way of linking certificate IDs through time. If the MA were to have access to the enrollment certificate for the purposes of global detection, the additional risk in this team’s view of a data breach is minimal. The full impact of expanding access to the enrollment certificate should be included in the analysis of global detection processes. The criteria that the MA will use during global detection to evaluate misbehavior has not been specified. Misbehavior criteria – and the consequences associated with different levels or types of misbehavior – is a policy issue for the SCMS. The point at which the decision is made to initiate any sort of consequences for misbehavior (e.g., revocation) is also unclear. This team assumes that this decision takes place after the MA has processed misbehavior reports from the OBE, as well as any other data it may possess from previously submitted misbehavior reports. After working with internal SMEs and CAMP, we developed the process flow in Figure 14 that reflects our current understanding of this process.
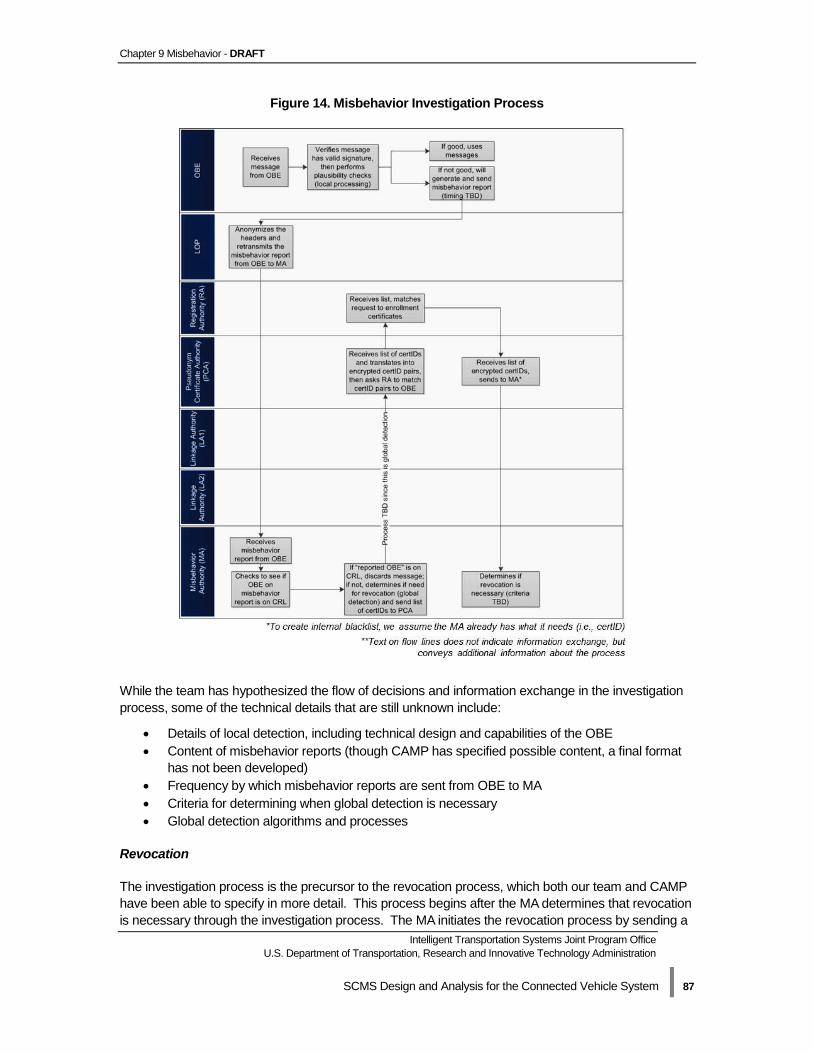
Chapter 9 Misbehavior - DRAFT
Intelligent Transportation Systems Joint Program Office U.S. Department of Transportation, Research and Innovative Technology Administration
SCMS Design and Analysis for the Connected Vehicle System | 87
Figure 14. Misbehavior Investigation Process
While the team has hypothesized the flow of decisions and information exchange in the investigation process, some of the technical details that are still unknown include:
• Details of local detection, including technical design and capabilities of the OBE • Content of misbehavior reports (though CAMP has specified possible content, a final format
has not been developed) • Frequency by which misbehavior reports are sent from OBE to MA • Criteria for determining when global detection is necessary • Global detection algorithms and processes
Revocation
The investigation process is the precursor to the revocation process, which both our team and CAMP have been able to specify in more detail. This process begins after the MA determines that revocation is necessary through the investigation process. The MA initiates the revocation process by sending a

Chapter 9 Misbehavior - DRAFT
Intelligent Transportation Systems Joint Program Office U.S. Department of Transportation, Research and Innovative Technology Administration
SCMS Design and Analysis for the Connected Vehicle System | 88
request for the PCA to gather necessary data for the content of the internal blacklist and CRL. The MA, RA, and request coordination collaborate to create the internal blacklist, and the MA, PCA, and LAs collaborate to create the CRL. The process ends when the internal blacklist is stored by the RA (or request coordination) and when the CRL is stored and/or distributed to the OBE. There are still a number of outstanding questions in the revocation process. One question is how the number of RAs in the system affects the way that the internal blacklist is maintained and shared (if necessary). Because the RA keeps a matching list of certificate requests to enrollment certificates, it had been assumed that the RA would maintain the internal blacklist. However, if there are multiple distinct RAs in the SCMS, the way the internal blacklist is managed will have to change to ensure all RAs can access it. CAMP’s latest technical design introduces a request coordination function intended to coordinate certificate requests from OBE among multiple RAs. CAMP has suggested the request coordination function can also maintain the internal blacklist, and this team agrees that this is a realistic option if multiple RAs are present in the system. The Booz Allen team believes that two assumptions are necessary to make this idea feasible. First, the RA must send the enrollment certificate ID of a misbehaving device (that the RA obtains by working with the PCA) to the request coordination function so that it can create an entry for the internal blacklist. The second assumption is that the request coordination accepts misbehavior information from the RA alone. For example, if the RA sends the request coordination function an enrollment certificate ID of a misbehaving device, the request coordination function (1) accepts the information because it trusts that the RA is sending true information and (2) creates an entry on the internal blacklist for the enrollment certificate ID that was sent. A risk in this process is that the RA could maliciously send false revocation decisions to the request coordination function. The process flow in Figure 15 below represents the revocation process. The inherent assumption in this flow is that there will be multiple RAs, so we have displayed the request coordination function as the maintainer of the internal blacklist. As noted below the process flow, text on the flow lines that reads, “Internal Blacklist” and “CRL” is not meant to signify an exchange of information, but rather the steps that are related to the creation of these items.
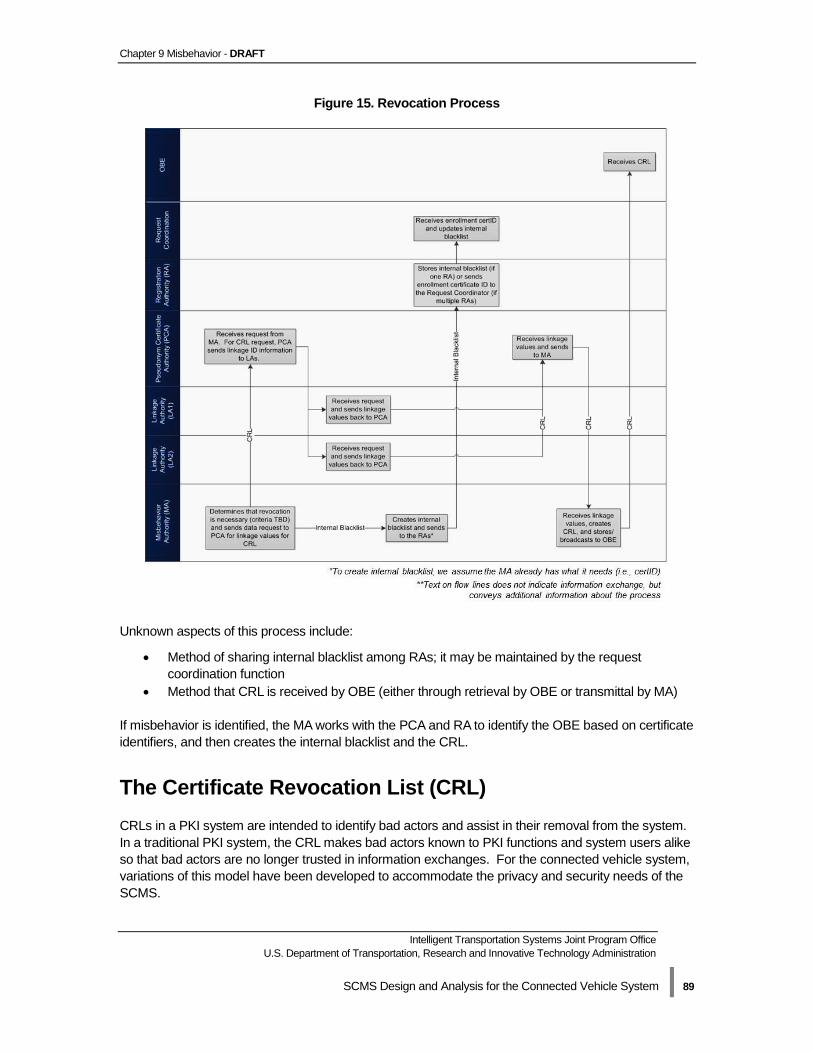
Chapter 9 Misbehavior - DRAFT
Intelligent Transportation Systems Joint Program Office U.S. Department of Transportation, Research and Innovative Technology Administration
SCMS Design and Analysis for the Connected Vehicle System | 89
Figure 15. Revocation Process
Unknown aspects of this process include:
• Method of sharing internal blacklist among RAs; it may be maintained by the request coordination function
• Method that CRL is received by OBE (either through retrieval by OBE or transmittal by MA) If misbehavior is identified, the MA works with the PCA and RA to identify the OBE based on certificate identifiers, and then creates the internal blacklist and the CRL.
The Certificate Revocation List (CRL) CRLs in a PKI system are intended to identify bad actors and assist in their removal from the system. In a traditional PKI system, the CRL makes bad actors known to PKI functions and system users alike so that bad actors are no longer trusted in information exchanges. For the connected vehicle system, variations of this model have been developed to accommodate the privacy and security needs of the SCMS.
Chapter 9 Misbehavior - DRAFT
Intelligent Transportation Systems Joint Program Office U.S. Department of Transportation, Research and Innovative Technology Administration
SCMS Design and Analysis for the Connected Vehicle System | 90
As previously mentioned, there is an internal CRL known as the internal blacklist, and a second CRL that is planned to be distributed for use by OBE. The internal blacklist contains enrollment certificate IDs of misbehaving or malfunctioning devices and is maintained internally by the SCMS. The RA checks the internal blacklist before issuing new batches of short-term certificates to ensure that the OBE requesting the certificates is trustworthy. The second CRL, known as “the CRL,” is what is referred to in the technical architecture from CAMP’s April 2013 report. This CRL is intended to be developed by the MA (in coordination with the PCA and LAs) during the revocation process outlined above, and then stored by the CRL store and/or sent out to OBE by the CRL broadcast. This CRL contains linkage values from certificates of OBE that are known misbehavers in the system. Each OBE will compare the messages it receives during V2V communication against the CRL so that it can ignore messages from misbehaving OBE. In this way, the CRL supports trust in the system.
CRL Analysis
All groups involved in this research agree that the internal blacklist is necessary for the SCMS to function, but there is some debate about how the CRL intended for OBE can be effective without overburdening the system. The current working assumption is that a full CRL will be distributed to all OBE on a daily basis. However, final decisions about the CRL have not been made, and are currently being evaluated in parallel projects and by other technical teams. The crux of the issue with the CRL is its size. The size of the CRL will determine how easily it can be maintained by the SCMS and transmitted over the CDDS (Communications Data Delivery System) to all vehicles. The CDDS project has completed an analysis of the CRL that discusses three factors that directly influence its size:80 Certificate download frequency and size of CRL: This first factor refers to the batches of short-term certificates that each OBE must download from the SCMS to engage in trusted V2V communication. Because the CRL lists the linkage values of the certificates of a misbehaving device, all OBE that receive the CRL will know to ignore any bad messages they receive. For this reason, there is a negative relationship between the certificate download frequency and the need for an updated CRL. If new certificate batches are distributed very frequently, then the CRL would not be needed. For example, a daily certificate batch update for all OBE would mean that certificates on malfunctioning devices would become invalid after one day, and theoretically no new certificates would be distributed to the misbehaving device after it is detected by the MA and placed on the internal blacklist. Conversely, if certificates batches are distributed infrequently (e.g., yearly), a CRL is necessary because certificates on misbehaving devices will be valid until revocation of the OBE enrollment certificate takes place. The tradeoff here is that frequent CRL distribution is burdensome to the system, and the longer the period of certificate updates, the larger the CRL can potentially grow. A middle ground in this analysis has been the idea of an “incremental” CRL. The incremental CRL would involve the SCMS only distributing new entries to the CRL since the last download was made. This could allow for more ease in distribution of CRL information to OBE, while still distributing the information necessary to reduce risk of an OBE accepting bad messages. The analyses regarding the CRL content and distribution frequency are still underway by different teams, and a full risk analysis in this area has not been completed to date. 80 RITA, “Communications Data Delivery System Analysis for Connected Vehicles: Revision and Update to Modeling of Promising Network Options,” April 2013.

Chapter 9 Misbehavior - DRAFT
Intelligent Transportation Systems Joint Program Office U.S. Department of Transportation, Research and Innovative Technology Administration
SCMS Design and Analysis for the Connected Vehicle System | 91
One consideration to help with this issue is limiting the size of the CRL. As of December 2013, CAMP was considering limiting the size of the CRL to 10,000 entries. This would help reduce the burden on the system, but several questions are implied by this approach, including:
• What kinds of misbehavior are placed on the CRL? There must be a system of prioritization for misbehavior, to aid in efficient revocation of the devices.
• How are OBE removed from the CRL? • Is this an appropriate number based on realistic estimates of misbehavior rates? No analysis
has yet been done to justify estimates of misbehavior rates Misbehavior rate: The misbehavior rate in the system will impact the amount of processing that is required. If there are a high number of bad actors in the system sending malicious messages, or a high occurrence of technical malfunction that lead to message errors, there will need to be more entries on the internal blacklist and CRL. The more entries that are placed on the CRLs, the greater in size they become. The misbehavior rate for this unprecedented system is difficult to estimate. At this time, CAMP has indicated that these rates will likely be adjusted with additional analysis. We have also incorporated the use of different misbehavior rates into our cost model for estimation purposes.
CRL Impact
If the CRL is too large, it becomes a bandwidth and cost burden for the connected vehicle system. With a large CRL, the SCMS functions involved in its production and maintenance will require additional hardware and support. The CDDS that transmits the CRL will also have to accommodate the large download to each OBE across the entire system. Ultimately, a CRL that is too large could be at risk for being ineffective as it would not reach OBE in time to assist them with ignoring bad messages. It is evident how large of an impact the misbehavior rate will have on the processing needs of the MA, and overall costs for the SCMS (i.e., other functions involved in the investigation and revocation processes will also require more processing power if misbehavior rates are high). Even with the introduction of the LAs to produce linkage values that will reduce the number of entries that are needed on the CRL when a misbehaving device is identified, the CRL could become unwieldy and jam the system. As described by the CDDS team, the three primary ways to reduce the size of the CRL are:81
• Balance certificate lifetime with CRL size • Eliminate redundancy in the CRL • Update the CRL incrementally
As decisions are made about the CRL, any increased risk of OBE accepting bad messages should be taken into account.
Assumptions for the CRL and Internal Blacklist
There are many technical assumptions about the CRL at this stage of development:
• There will be at least two CRLs – the internal blacklist used by the RA and the CRL used by OBE. Technical and policy specifications about the connection between the internal blacklist and CRL have not yet been determined.
81 Ibid.
Chapter 9 Misbehavior - DRAFT
Intelligent Transportation Systems Joint Program Office U.S. Department of Transportation, Research and Innovative Technology Administration
SCMS Design and Analysis for the Connected Vehicle System | 92
• The RA will use the internal blacklist during initial and full deployment. • The CRL will be used for full deployment. • The RA or request coordination function will maintain a database of the certificate
requests from OBE which include enrollment certificate information. The RA will check the internal blacklist prior to distributing batches of short-term certificates to prevent misbehaving OBE from receiving them.
• Technical teams have not determined the frequency of CRL publication or the CDDS through which it is accessed. An examination of the tradeoffs between communication needs and potential risks associated with different CRL publication options will likely be part of that analysis.
• The linkage value from the LA allows for efficient revocation of all certificates in a batch.
• A discussion is currently underway about the possibility of updating CRLs with changes since the previous publication, rather than repeatedly creating new CRLs (i.e., “incremental” updates). The design and implications of this option are still being developed by teams that are tasked with technical architecture design (CAMP and others).
• During full deployment, each OBE will hold a dynamic list of revoked certificates based on the most recent CRL downloaded.
Consequences for Malfeasance A key policy question that has not yet been addressed involves enforcement against misbehaving system participants or other bad actors. What are the consequences for intentionally trying to influence or negatively affect the system? Will enforcement actions take place solely within the SCMS or will enforcement involve external legal action, either civil or criminal? Discussions later in this chapter mention consequences in comparative industries such as users being fined, jailed, and permanently revoked from the system. As the comparative industry examples outline, well-defined consequences are necessary to deter malfeasance and malicious attacks from occurring. As noted previously in Chapter 7, there are ways for the SCMS to link to user or vehicle information to identify the user, vehicle, and/or OBE linked to a misbehaving enrollment certificate and alert the appropriate authority. Any user or vehicle information would be protected through physical, procedural, and technical controls and sequestered within the ECA, separate from all other SCMS functions. For example, access to user information could be limited to instances in which an administrative or judicial order requires disclosure of such information, in connection with an enforcement action. Or, the enforcement policies governing the system might limit access to user information to a specific function or role within the SCMS once clear evidence of malfeasance has been identified. If a policy decision is made that implies the need to trace certain kinds of misbehavior back to users or vehicles to which OBE or ASDs are registered, then there will have to be an additional level of coordination with the ECA. If no user or vehicle information is collected anywhere in the system, there is no way to link an OBE device back to a vehicle or individual. For this reason, even when there is ample evidence of malicious, widespread damage to the system or hacking caused by a specific device, there would be no way to identify or take action against the bad actor who caused the damage – in effect, the system would be unable to manage the malfeasance in an effective manner. In such cases, the only
Chapter 9 Misbehavior - DRAFT
Intelligent Transportation Systems Joint Program Office U.S. Department of Transportation, Research and Innovative Technology Administration
SCMS Design and Analysis for the Connected Vehicle System | 93
enforcement option available to those overseeing the SCMS would be to revoke the authentication of the device from which the malfeasant behavior emanated in the system. A note about suspension: the idea of suspension was initially considered by this team as an additional method of removing a device’s ability to participate in the system. At this time, it is not currently under discussion by technical teams. CAMP has noted that there is currently no method in the technical design to undo a revocation. The Booz Allen team agrees that this does not need to be a part of the technical design at this time.
Regaining Access to the System after Misbehavior has Occurred
An area of uncertainty is what process and policies will permit OBE to get back into the connected vehicle system once the issue that led to their placement on a CRL has been resolved. CAMP and other teams analyzing the technical architecture have proposed various options at a very conceptual level, although none have been vetted for technical feasibility. This team outlines a few here with some implications to the SCMS and the users. Replacement of OBE: CAMP has proposed that the user would need to replace the physical device within the vehicle, implying that the only way for a user to get back into the system is if they purchase or otherwise acquire new equipment. This puts a large burden on the user and could result in reduction of participation due to costs, inconvenience, and potential shortages of OBE. The logistical details of how and where the reinstallation process would occur are not clear. Additionally, the design of the OBE has not been specified and may differ among auto manufacturers. The OBE could consist of distributed functionality throughout the vehicle (i.e., outside of a single box) which may complicate the reinstallation process. It would be critical for appropriate OBE disposal procedures to be developed so that nefarious parties cannot use discarded certificates on removed OBE to launch attacks. A potential benefit of this approach would be that all traces of malicious certificates would be completely removed from the vehicle. Replacement of enrollment certificate: Providing a new enrollment certificate to reactivate the device is also an option, and the process by which that can happen is to be determined through technical and policy decisions. If a new enrollment certificate has to be provided, then a new batch of short-term certificates will also have to be downloaded. The idea is that whichever process is followed for the initial download of those certificates will be replicated. An important concern for this approach is that, prior to the assignment of a new enrollment certificate and delivery of new certificates, any and all corrupted certificates must be removed from the device. Regardless of the option chosen to bring users back into the connected vehicle system after misbehavior has occurred, all enrollment data must be appropriately managed by the SCMS. The CMEs will have to update all systems and CRLs to reflect the removal of a device from the CRL as well as the removal of a corrupted enrollment certificate. This includes updating data in the ECA regarding enrollment certificates and OBE, if applicable.
Industry Approaches to Addressing Misbehavior Misbehavior in one form or another is an issue across industries. Differences exist in the processes used by industries to address misbehavior. Generally, both laws (federal and state) and industry guidelines (e.g., best practices or standards developed by a trade association) are developed to deter
Chapter 9 Misbehavior - DRAFT
Intelligent Transportation Systems Joint Program Office U.S. Department of Transportation, Research and Innovative Technology Administration
SCMS Design and Analysis for the Connected Vehicle System | 94
potential malfeasant users from launching an attack on the system. These methods provide different approaches to how an organization or system can or should involve enforcement external to the system, either criminal or civil. As noted previously in the payment card industry, merchants and service providers must agree to comply with the PCI DSS, a set of guidelines designed to ensure that systems are secure against attackers. If a merchant is found to be in violation of the PCI DSS, a merchant’s compliance status can be revoked; the act of penalizing merchants or service providers is dictated by the voluntary agreement that the merchant has with the specific payment card brands with which it is under contract (e.g., Visa, MasterCard). External law enforcement officials would not be involved unless a merchant’s lack of compliance led to misbehavior in the form of criminal activity, such as identity theft or credit card fraud. Within the healthcare industry, examples of misbehavior can be seen when nefarious internal actors tamper with patient data, or when external attackers steal sensitive patient PII. Users of electronic health records (EHR) in this industry are subject to Health Insurance Portability and Accountability Act (HIPAA) legal requirements, which mandate strict standards for the handling of information collected about patients. To prevent unauthorized access to information or data breaches, EHR users must meet system specifications and undergo compliance audits from the Department of Health and Human Services. Preventative measures such as these are intended to prevent misbehavior from occurring in the first place. HIPAA violations can lead to external law enforcement actions and result in administrative or criminal sanctions (e.g., fines, license revocation, and imprisonment).
Outstanding Issues/Questions The team outlines below the remaining questions related to the misbehavior detection and revocation processes that have arisen over the course of this analysis. Outstanding questions that must be addressed include:
• What is the universe of potential attacks on the system and what is the probability and consequence of each attack occurring?
• What level of local detection can the OBE actually perform? • What are the details of global detection? How will the MA process and analyze misbehavior
reports from OBE? • How frequently is the CRL broadcast to OBE? • How will the CRLs be published? What will be needed for storage and access? • Is a CRL even needed? What are the trade-offs between having one and not having one? • What are likely misbehavior rates?
o Cost estimates have been used for misbehavior rates of 0.1 percent, 0.5 percent, and 1 percent. At this point in the analysis, these are very nascent estimates that should be updated further as more work in the area of misbehavior detection and management is completed.
• How will criteria for revocation of enrollment certificates be defined? Will there be a need for rating of misbehavior to identify what necessitates revocation and what calls for some other type of response, if any?
• Will there be a need (and ability) to trace misbehavior back to particular OBE, vehicle, and/or individual?
• What are the processing needs of all the parts of the MA?

Chapter 9 Misbehavior - DRAFT
Intelligent Transportation Systems Joint Program Office U.S. Department of Transportation, Research and Innovative Technology Administration
SCMS Design and Analysis for the Connected Vehicle System | 95
o Some initial estimations have been included in the cost model • What are the additional processing needs of other functions (PCA, RA, and LA) based on the
misbehavior processes outlined thus far? o Some estimations have been included in the cost model
• What policy and oversight standards and rules will govern various operations and enforcement of misbehavior?

Part IV Technical Specifications and Costs - DRAFT
Intelligent Transportation Systems Joint Program Office U.S. Department of Transportation, Research and Innovative Technology Administration
SCMS Design and Analysis for the Connected Vehicle System | 96
Part IV Technical Specifications and Costs

Chapter 10 Technical Specifications - DRAFT
Intelligent Transportation Systems Joint Program Office U.S. Department of Transportation, Research and Innovative Technology Administration
SCMS Design and Analysis for the Connected Vehicle System | 97
Chapter 10 Technical Specifications
An important task in evaluating implementation of the connected vehicle system is specifying the various elements needed for the SCMS to operate, most significantly for cost estimation purposes. To do this, it is important to understand all of the needs of the system, including physical locations, power requirements, personnel, and management. The bulk of the costs for this PKI system are found in the hardware and software required for effective operation. To understand the hardware and software needs of the system, the team developed estimates for the functions involved in generating and distributing certificates. Most of the technical specifications included in this chapter come from CAMP’s technical design and analysis, although at this time, several of the operations are yet to be fully specified. The team’s collaboration with CAMP and technical experts yielded various assumptions that are used in these estimates. All numbers and calculations are initial estimates and are presented in the present day’s numbers, per existing technology. Estimates can and should be updated as new information becomes available. In this chapter we provide estimates of the types and numbers of hardware needed to produce certificates at various points along a hypothetical future deployment path. We present numbers for years 1, 10, 25, and 40 to provide a sense of the range of requirements over time. The team used roll-out numbers derived by NHTSA for our estimates, and developed a detailed cost model based on these numbers and the technical estimates presented in this chapter.82 Detailed assumptions and numbers from the NHTSA estimates are included in Appendix C. NHTSA’s four roll-out scenarios used in this report are based on the following assumptions:
• The fleet model is a projection based on historic Polk registration data, vehicle sales, and the NHTSA-developed scrappage schedule.
• The scrappage schedule is derived from Polk registration data. • Scrappage is assumed to be unaffected by the presence or absence of OBE and ASDs. • For simplicity, there is no distinction between calendar year and model year.
A description of each roll-out scenario is included below: Scenario 1: OBE on all new vehicles starting in Model Year (MY) 2020, no phase-in, no ASDs
• 100 percent of MY 2020 are OBE equipped • No ASD deployment
Scenario 2: OBE on all new vehicles starting in MY 2020, no phase-in but includes ASDs
• 100 percent of MY 2020 are OBE equipped • ASD deployment for vehicles with MY 2015-2019
o Starting in 2020 and continuing for a total of five years o Five percent of applicable old vehicles for the first two years o 10 percent of applicable old vehicles for the remaining three years
82 Data from NHTSA includes light-duty vehicles only.
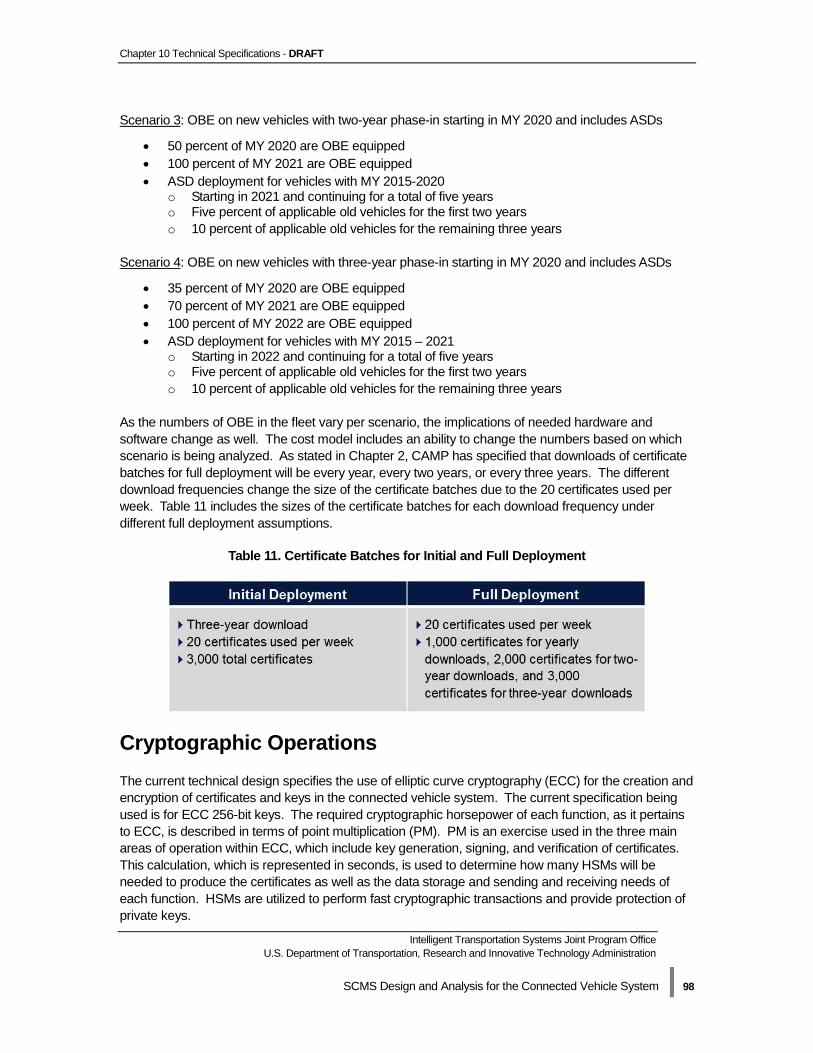
Chapter 10 Technical Specifications - DRAFT
Intelligent Transportation Systems Joint Program Office U.S. Department of Transportation, Research and Innovative Technology Administration
SCMS Design and Analysis for the Connected Vehicle System | 98
Scenario 3: OBE on new vehicles with two-year phase-in starting in MY 2020 and includes ASDs
• 50 percent of MY 2020 are OBE equipped • 100 percent of MY 2021 are OBE equipped • ASD deployment for vehicles with MY 2015-2020
o Starting in 2021 and continuing for a total of five years o Five percent of applicable old vehicles for the first two years o 10 percent of applicable old vehicles for the remaining three years
Scenario 4: OBE on new vehicles with three-year phase-in starting in MY 2020 and includes ASDs
• 35 percent of MY 2020 are OBE equipped • 70 percent of MY 2021 are OBE equipped • 100 percent of MY 2022 are OBE equipped • ASD deployment for vehicles with MY 2015 – 2021
o Starting in 2022 and continuing for a total of five years o Five percent of applicable old vehicles for the first two years o 10 percent of applicable old vehicles for the remaining three years
As the numbers of OBE in the fleet vary per scenario, the implications of needed hardware and software change as well. The cost model includes an ability to change the numbers based on which scenario is being analyzed. As stated in Chapter 2, CAMP has specified that downloads of certificate batches for full deployment will be every year, every two years, or every three years. The different download frequencies change the size of the certificate batches due to the 20 certificates used per week. Table 11 includes the sizes of the certificate batches for each download frequency under different full deployment assumptions.
Table 11. Certificate Batches for Initial and Full Deployment
Cryptographic Operations The current technical design specifies the use of elliptic curve cryptography (ECC) for the creation and encryption of certificates and keys in the connected vehicle system. The current specification being used is for ECC 256-bit keys. The required cryptographic horsepower of each function, as it pertains to ECC, is described in terms of point multiplication (PM). PM is an exercise used in the three main areas of operation within ECC, which include key generation, signing, and verification of certificates. This calculation, which is represented in seconds, is used to determine how many HSMs will be needed to produce the certificates as well as the data storage and sending and receiving needs of each function. HSMs are utilized to perform fast cryptographic transactions and provide protection of private keys.
Chapter 10 Technical Specifications - DRAFT
Intelligent Transportation Systems Joint Program Office U.S. Department of Transportation, Research and Innovative Technology Administration
SCMS Design and Analysis for the Connected Vehicle System | 99
Research and discussions with PKI and HSM experts indicate that the most secure hardware currently available for use in these cryptographic operations would be HSMs, which could be used for those functions that must perform cryptographic operations. Information about the most efficient HSM on the market indicates that it has the maximum capability to execute 1,000 Elliptical Curve Digital Signature Algorithm (ECDSA) cryptographic operations per second with ECC 256-bit keys.83 However, given that systems generally are not able to operate at maximum performance at all times, and to account for different needs of the systems, PKI experts recommend that the team assumes 75 percent of maximum capacity (750 cryptographic operations per second) to estimate the total number of HSMs needed for the various functions. This allows for any downtime needed for the equipment. An additional note is warranted here: there has been initial discussion about the possibility of using non-HSM servers and processors to perform some of the functions that the HSMs are being estimated to perform now. Estimating how many central processing units (CPUs) (i.e., standard non–crypto-based servers) will be needed for the various functions are dependent on the technical design and early estimates of processing capacity. Quad Core (2.67 GHz) processors are used for these estimates, which are based on industry standards to produce the number of certificates required in the system. The technical and cost implications of this alternative approach are currently being discussed.
Data Sizes of the SCMS Functions Based on the certificate production process described in Chapter 3 and the overall PKI structure, the team estimated the total data load sizes that drive the hardware and software needs for each function. The current assumption is that all keys associated with encryption are compressed 96 bytes, and keys used for hashing are estimated to be 256-bit Standard Hash Algorithm (SHA). 256-bit SHA is a function of SHA-2, a set of standard cryptographic hash functions, designed as a novel hash function computed with 32-bit words.84 The team has worked with CAMP’s technical design team to understand and develop certificate and data load sizes for each function within the SCMS. This collaboration ensured that both teams are working with the same numbers, which is crucial since the certificate and data load sizes are used to estimate hardware and software needs within the system. Specifically, we developed certificate and data load sizes for the PCA, RA, LA, MA, LOP, ECA, DCM, root CA, and intermediate CA. Certificate and data load sizes and costs of the MA, LOP, and DCM are still notional, as the technical processes behind these functions are still being investigated and specified. Tables 12, 13, and 14 outline the data load sizes used to calculate processing needs throughout the SCMS. Note that the data loads required for misbehavior processes are broken out separately in the table; some of these processes are still under development. Our assumptions for estimating processing needs include the following:
• The industry standard of eight bits per byte is used. • PMs were used for estimating the processing needs for cryptographic operations.
83 Based on the team’s research, the SafeGuard CryptoServer Se-Series by Utimaco Safeware®, specifically the Safeguard Se50 PCIe, Se400 PCIe, or Se1000 PCIe products, present the fastest ECC processing times. All SafeGuard Products are registered trademarks of Utimaco Software AG. 84 RITA, “Security Approach for V2V/V2I Communications Delivery System.”
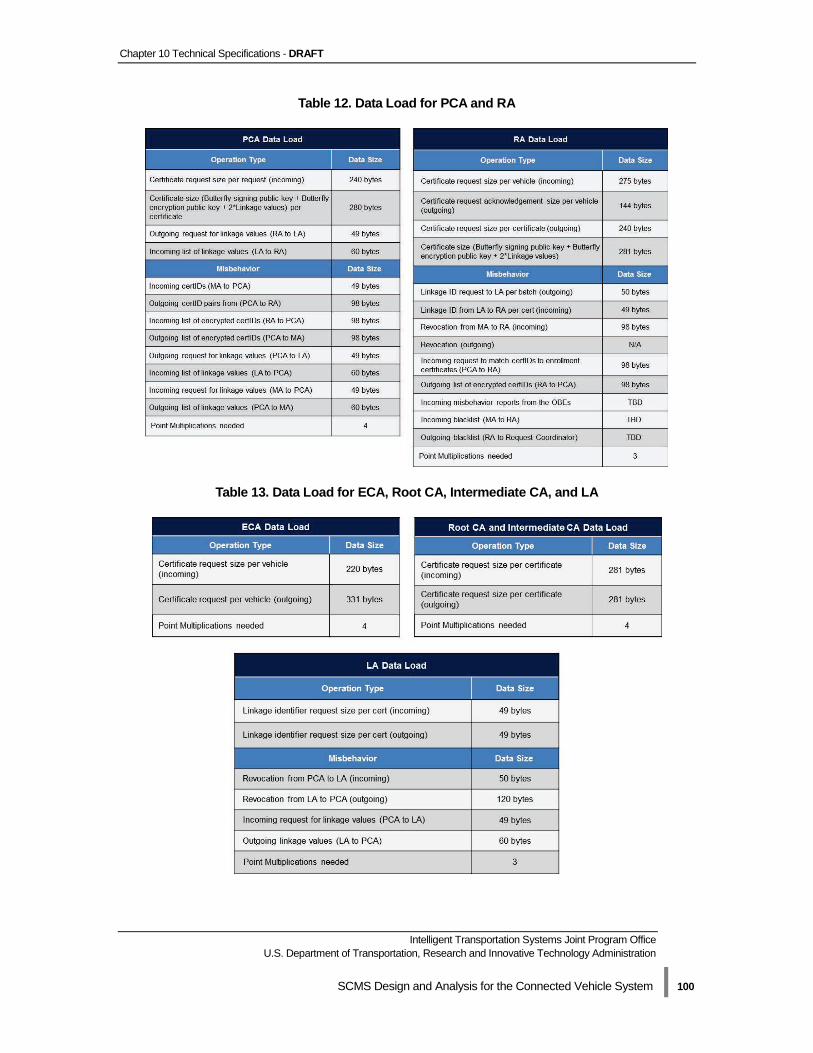
Chapter 10 Technical Specifications - DRAFT
Intelligent Transportation Systems Joint Program Office U.S. Department of Transportation, Research and Innovative Technology Administration
SCMS Design and Analysis for the Connected Vehicle System | 100
Table 12. Data Load for PCA and RA
Table 13. Data Load for ECA, Root CA, Intermediate CA, and LA
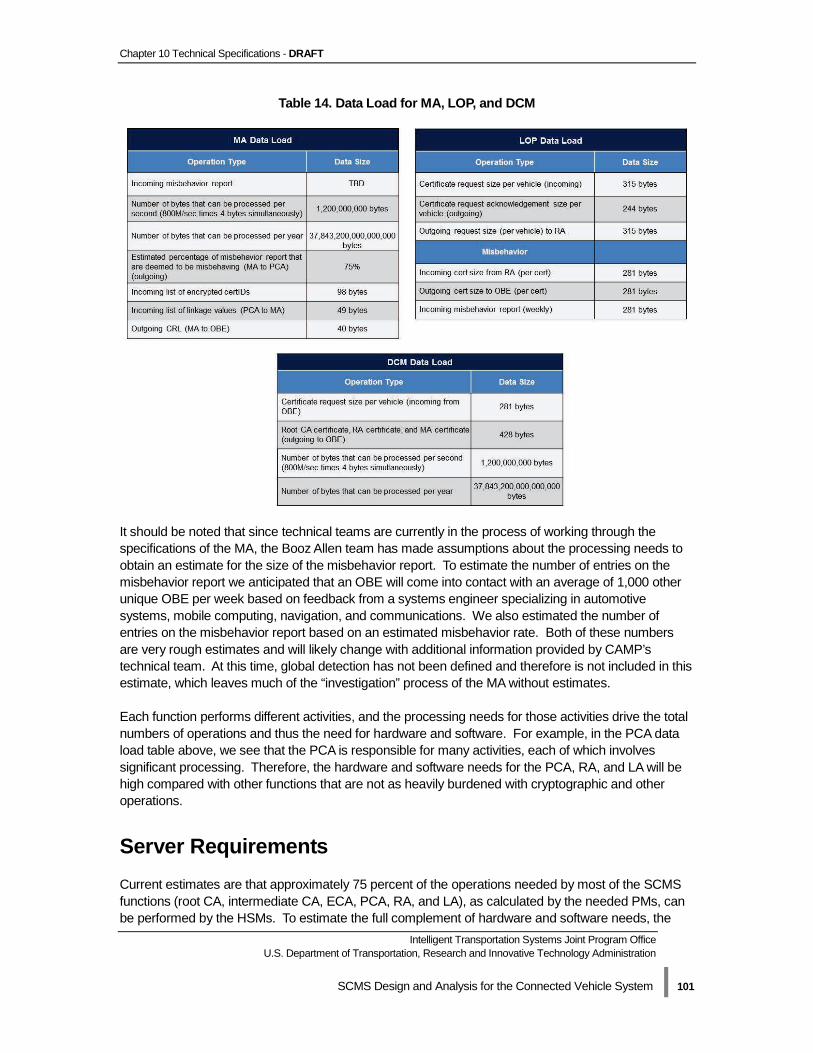
Chapter 10 Technical Specifications - DRAFT
Intelligent Transportation Systems Joint Program Office U.S. Department of Transportation, Research and Innovative Technology Administration
SCMS Design and Analysis for the Connected Vehicle System | 101
Table 14. Data Load for MA, LOP, and DCM
It should be noted that since technical teams are currently in the process of working through the specifications of the MA, the Booz Allen team has made assumptions about the processing needs to obtain an estimate for the size of the misbehavior report. To estimate the number of entries on the misbehavior report we anticipated that an OBE will come into contact with an average of 1,000 other unique OBE per week based on feedback from a systems engineer specializing in automotive systems, mobile computing, navigation, and communications. We also estimated the number of entries on the misbehavior report based on an estimated misbehavior rate. Both of these numbers are very rough estimates and will likely change with additional information provided by CAMP’s technical team. At this time, global detection has not been defined and therefore is not included in this estimate, which leaves much of the “investigation” process of the MA without estimates. Each function performs different activities, and the processing needs for those activities drive the total numbers of operations and thus the need for hardware and software. For example, in the PCA data load table above, we see that the PCA is responsible for many activities, each of which involves significant processing. Therefore, the hardware and software needs for the PCA, RA, and LA will be high compared with other functions that are not as heavily burdened with cryptographic and other operations.
Server Requirements Current estimates are that approximately 75 percent of the operations needed by most of the SCMS functions (root CA, intermediate CA, ECA, PCA, RA, and LA), as calculated by the needed PMs, can be performed by the HSMs. To estimate the full complement of hardware and software needs, the
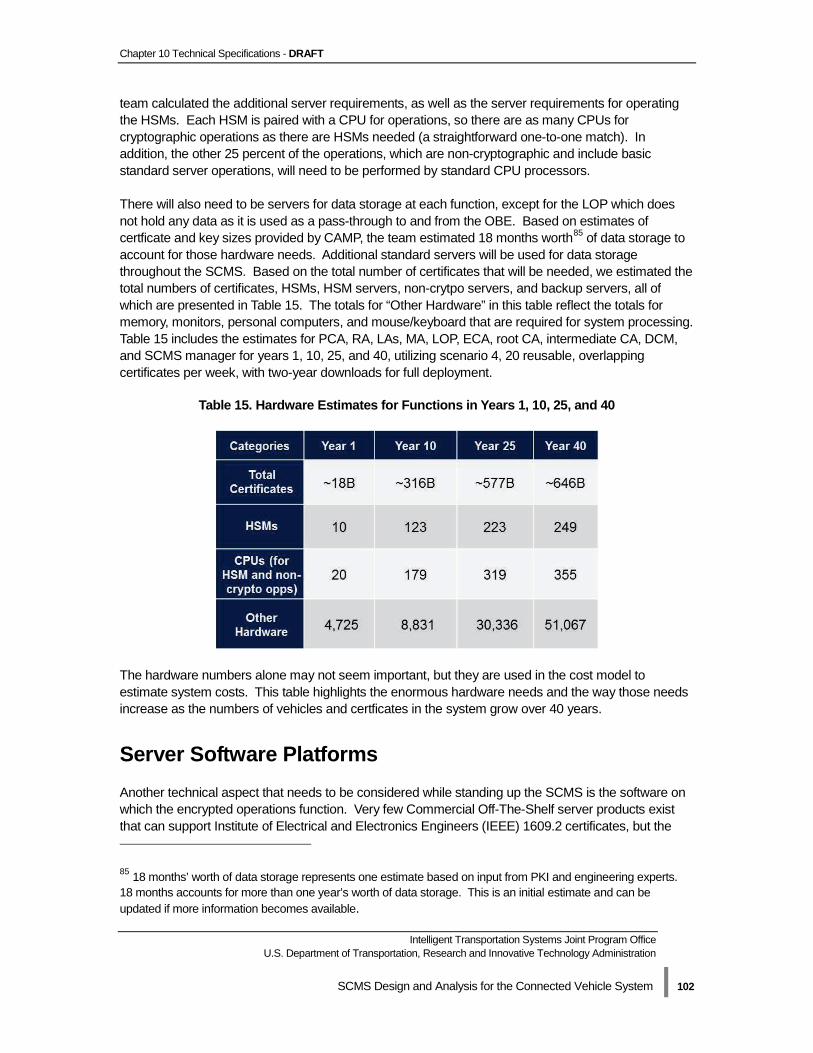
Chapter 10 Technical Specifications - DRAFT
Intelligent Transportation Systems Joint Program Office U.S. Department of Transportation, Research and Innovative Technology Administration
SCMS Design and Analysis for the Connected Vehicle System | 102
team calculated the additional server requirements, as well as the server requirements for operating the HSMs. Each HSM is paired with a CPU for operations, so there are as many CPUs for cryptographic operations as there are HSMs needed (a straightforward one-to-one match). In addition, the other 25 percent of the operations, which are non-cryptographic and include basic standard server operations, will need to be performed by standard CPU processors. There will also need to be servers for data storage at each function, except for the LOP which does not hold any data as it is used as a pass-through to and from the OBE. Based on estimates of certficate and key sizes provided by CAMP, the team estimated 18 months worth85 of data storage to account for those hardware needs. Additional standard servers will be used for data storage throughout the SCMS. Based on the total number of certificates that will be needed, we estimated the total numbers of certificates, HSMs, HSM servers, non-crytpo servers, and backup servers, all of which are presented in Table 15. The totals for “Other Hardware” in this table reflect the totals for memory, monitors, personal computers, and mouse/keyboard that are required for system processing. Table 15 includes the estimates for PCA, RA, LAs, MA, LOP, ECA, root CA, intermediate CA, DCM, and SCMS manager for years 1, 10, 25, and 40, utilizing scenario 4, 20 reusable, overlapping certificates per week, with two-year downloads for full deployment.
Table 15. Hardware Estimates for Functions in Years 1, 10, 25, and 40
The hardware numbers alone may not seem important, but they are used in the cost model to estimate system costs. This table highlights the enormous hardware needs and the way those needs increase as the numbers of vehicles and certficates in the system grow over 40 years.
Server Software Platforms Another technical aspect that needs to be considered while standing up the SCMS is the software on which the encrypted operations function. Very few Commercial Off-The-Shelf server products exist that can support Institute of Electrical and Electronics Engineers (IEEE) 1609.2 certificates, but the 85 18 months’ worth of data storage represents one estimate based on input from PKI and engineering experts. 18 months accounts for more than one year’s worth of data storage. This is an initial estimate and can be updated if more information becomes available.
Chapter 10 Technical Specifications - DRAFT
Intelligent Transportation Systems Joint Program Office U.S. Department of Transportation, Research and Innovative Technology Administration
SCMS Design and Analysis for the Connected Vehicle System | 103
team has analyzed potential options (described below). These estimates include software development and customization, as well as data management. Security Innovation®86 sells the Aerolink™87 product, which is available as a Linux®88 package or Windows®89 library. Escrypt, Inc. has the CycurV2X®90 product, which comes in software form, but is primarily marketed for use in embedded systems such as vehicle OBE. Additionally, there are open source libraries such as OpenSSL™91 and Bouncy Castle,92 which can be modified to support IEEE 1609.2 certificates. Although a wide variety of data is available surrounding existing CA products for X.509 PKI certificates, most of the data is irrelevant because existing CA Commercial Off-The-Shelf products do not support IEEE 1609.2 certificates. Additionally, proxy products that exist to interface between end users and the CA for authentication and certificate issuance are not designed to support the level of privacy and complexity associated with the current design. The development of the SCMS components will entail a significant research and development (R&D) effort. Although a prototype system containing PCA, LA1, LA2, and RA was used by the Safety Pilot Model Deployment team, development will still need to occur to ultimately enable a system capable of handling annual certificate issuance of billions of certificates per year during full deployment. The software products will need to be able to utilize a significant number of HSMs, which may entail additional R&D or integration efforts. The other challenge with the sheer volume of the system is managing the data across all of the distributed system components. Database management for this system will require planning and integration.
Backward Compatibility of the System Because total connected vehicle system deployment could potentially take 20 years or longer, it is imperative that the technology and business choices used for the implementation of the SCMS are able to evolve and adjust to future technologies at all levels (within the SCMS and for the communications network as well). Consideration will need to be given to how components of the SCMS can adjust to new technologies in mobile data hardware, software and services, and providers so that no element of the system becomes incapable of operating effectively in the future. Backward compatibility can be planned for in a number of ways, such as restricting future development of the system to operate on original equipment and needs, or by providing updates and retrofit options to original or early adopters as future technologies and system capabilities become available. Using current benchmarks from other technology-intensive industries can provide a starting point for any additional research into foreseeable changes in technological capabilities to provide sensitivity and scenario analyses around technical specifications as well as costs related to backward compatibility.
86 Security Innovation®
is a registered trademark of Security Innovation, Inc. 87 Aerolink™ is a trademark of Security Innovation, Inc. 88 Linux® is a registered trademark of Linus Torvalds in the U.S. and other countries. 89 Windows® is a registered trademark of Microsoft Corporation in the U.S. and other countries. 90 CycurV2X® is a registered trademark of escrypt, Inc. 91 OpenSSL™ is a trademark of The Open SSL Project. 92 Bouncy Castle free cryptography software is available from The Legion of the Bouncy Castle website.
Chapter 11 Cost Methodology - DRAFT
Intelligent Transportation Systems Joint Program Office U.S. Department of Transportation, Research and Innovative Technology Administration
SCMS Design and Analysis for the Connected Vehicle System | 104
Chapter 11 Cost Methodology
While working collaboratively with CAMP’s technical design team, we developed specifications about the functions involved in generating and distributing certificates. Understanding technology requirements (i.e., processing speeds of HSMs, data sizes of certificates, the number of servers required) for each function allows the team to analyze costs across all functions within the SCMS. For cost purposes, in this chapter we take into consideration all of the elements that are essential to ensuring this system will work efficiently while still maintaining the appropriate level of security required. As of December 2013, the total net present cost of the system is estimated to be $2.9B over a 40-year period under a specific set of assumptions and parameters (NHTSA roll-out scenario 4, 20 reusable, overlapping certificates per week, with two-year downloads at a seven percent discount rate). Please note that some of the totals highlighted below are very notional as additional details and functionality to the model still need to be developed. The Addendum to Appendix D that is referenced throughout this chapter provides additional cost estimates by function and cost category along with the results of several sensitivity analyses we performed. All functions were estimated individually and do not account for any type of cost efficiencies.
PKI Industry Findings The PKI system that will be implemented for the connected vehicle system is unique and includes elements that do not currently exist in typical PKIs, implying that brand new organizations will have to be stood up. This will require heavy customization at an enterprise level to support the primary costs of software, hardware, licensing, and development. The system will require substantial startup costs and annual operation and maintenance costs. As part of the team’s research efforts to identify the cost elements of modern PKI systems, we held discussions with several vendors within the PKI community, including VeriSign, SafeNet, Entrust, and Department of Defense PKI experts. Though there is no precedent for the scope and scale of the SCMS, we were able to isolate the elements of existing PKI systems, identify their technical components, and define the personnel required to develop and maintain the network. At full market penetration, over 250 million vehicles would be equipped with OBE, utilizing over 646 billion certificates per year.
Cost Drivers Based on current assumptions, cost drivers are hardware and software requirements, personnel needs, and associated facilities, depending on the function. Several key points provide high-level estimates of the costs associated with this system:
• Types of software and volume of licenses that will be required for system development and operation
• Types of hardware and volume to meet system requirements
Chapter 11 Cost Methodology - DRAFT
Intelligent Transportation Systems Joint Program Office U.S. Department of Transportation, Research and Innovative Technology Administration
SCMS Design and Analysis for the Connected Vehicle System | 105
• System roll-out possibilities in terms of numbers of OBE in new vehicles and numbers of ASDs
• Personnel costs, in terms of skill set, level of effort, and salary necessary to develop the system and maintain it into the future
• Facilities necessary to house hardware and personnel, including number of facilities, space requirements, and potential construction or lease costs
The team estimated costs for the following functions: PCA, RA, LA, MA, LOP, ECA, root CA, intermediate CA, DCM, and SCMS manager. Costs for the MA, LOP, and DCM are notional at this time because the functionality and processes of these functions are still being developed by CAMP’s technical team. As the technical teams designing the system continue to develop the processes and functions of the MA, LOP, and DCM, cost estimates should be adjusted accordingly. To best estimate the costs of the functions listed above, the following assumptions were used. All costs presented throughout this section are nominal (they have not been adjusted for inflation or discount rates). The cost analysis and the cost model focus on certificate distribution following 20 reusable, overlapping certificates per week, in accordance with CAMP’s technical design for the SCMS as of December 2013.
General Assumptions
• Estimates are provided for a period of 40 years to match the vehicle fleet data provided by NHTSA.
• Net present value (NPV) was calculated using discount rates of three and seven percent, which align with the recommended discounts rates of OMB Circular A-94.
• 3,000 short-term certificates will be issued per a three-year period to a unit of OBE for initial deployment.
• 3,000 short-term certificates will be issued per three-year period to a unit of OBE for full deployment.
• 2,000 short-term certificates will be issued per two-year period to a unit of OBE for full deployment.
• 1,000 short-term certificates will be issued per one-year period to a unit of OBE for full deployment.
• The cost of the OBE is beyond the scope of this analysis and is excluded from this estimation.
Hardware Assumptions
• IEEE 1609.2 certificates, chosen by CAMP, are the certificate type used in this system. The certificate type influences the estimates for the number of servers and processors required to support data loads and cryptographic processes.
• Cryptographic standards at 256-bit ECC are used to estimate the number of HSMs required. Maximum performance of this hardware is 1,000 cryptographic operations per second;93 however, in line with best practices currently being used within the PKI industry, performance should not be estimated at the maximum potential. For this reason, we assume performance
93 Utimaco®, SafeGuard® CryptoServer Se-Series Benchmarks website: http://hsm.utimaco.com/nc/en/products /se-series.
Chapter 11 Cost Methodology - DRAFT
Intelligent Transportation Systems Joint Program Office U.S. Department of Transportation, Research and Innovative Technology Administration
SCMS Design and Analysis for the Connected Vehicle System | 106
to be 75094 cryptographic operations per second to allow for problematic equipment or other unforeseen strains on the system.
• As a rule of thumb, software and hardware supporting cryptographic operations account for 75 percent of the system costs. The remaining 25 percent of system costs support other administrative and non-cryptographic processing functions, including shuffling and bundling of certificates.
Software Assumptions
• Software estimates are provided on a per license basis for the software platform and database software. The platform will likely support multiple servers under one license but is assumed to be limited to a point. Database software is assumed to support one entire physical location per license.
• Hardware and software will be fully refreshed in the fifth year of use, resulting in cost surges in those years. Cost curves for hardware and software can be applied to this estimate per function using gradual, medium, and steep percentages.
Facility Assumptions
• The PCA, RA, LA, MA, and LOP functions have heavy data processing and hardware needs that require data centers. The cost model accounts for the possibility to build or lease data center space for these functions, and cost estimates are based on square footage and power needs.
• The ECA, root CA, intermediate CA, DCM, and SCMS manager functions can operate using commercial office space since they do not require intense data processing. The cost model accounts for the possibility to lease commercial office space, and estimates are based on square footage at three different sizes (i.e., 2,000, 5,000, and 10,000 square feet).
• The number of locations for each function has been estimated as seen in Table 16 below. For the analyses provided in this report, Richland, WA is used as the baseline for all functions, except for the SCMS manager which is Washington, DC. Richland was chosen to represent an area other than Washington, DC, which had been used as the baseline for all previous estimates. We included some initial estimates for numbers of locations for each function, showing growth over time where relevant. These are very initial estimates, and should be updated as the variables that impact the eventual numbers of locations are more clearly defined.
94 HSM performance was estimated at 750 cryptographic operations per second based on judgment by PKI industry SMEs.
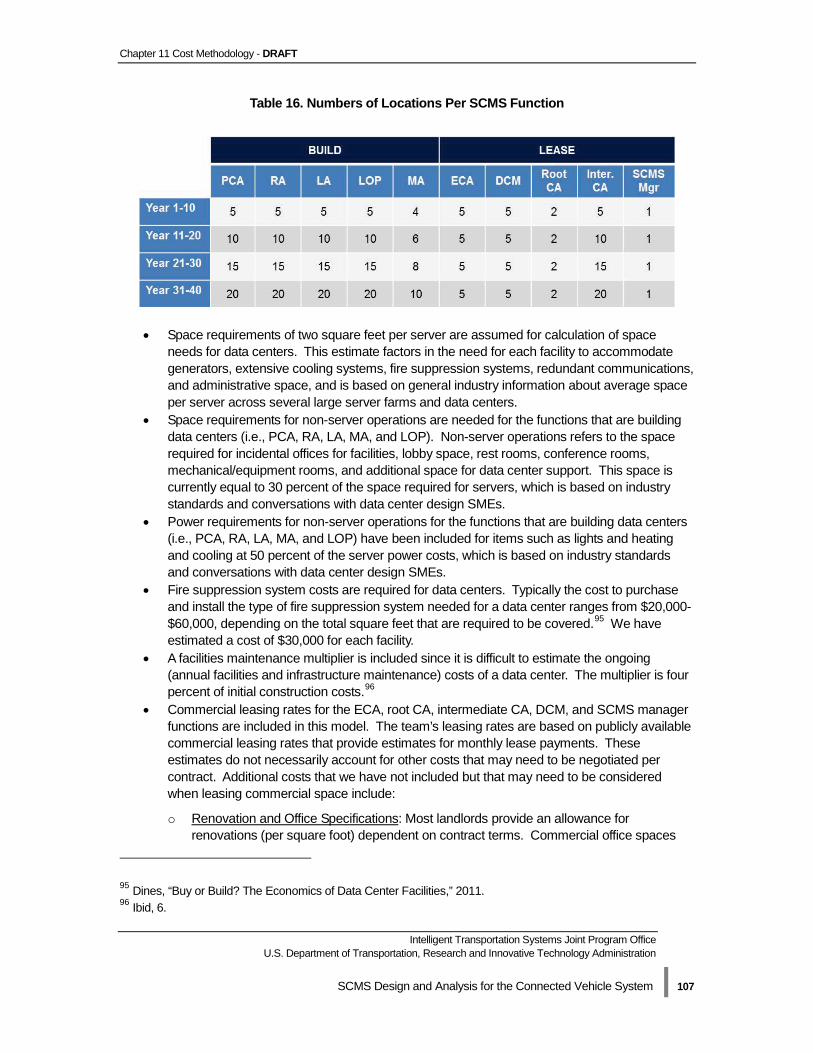
Chapter 11 Cost Methodology - DRAFT
Intelligent Transportation Systems Joint Program Office U.S. Department of Transportation, Research and Innovative Technology Administration
SCMS Design and Analysis for the Connected Vehicle System | 107
Table 16. Numbers of Locations Per SCMS Function
• Space requirements of two square feet per server are assumed for calculation of space needs for data centers. This estimate factors in the need for each facility to accommodate generators, extensive cooling systems, fire suppression systems, redundant communications, and administrative space, and is based on general industry information about average space per server across several large server farms and data centers.
• Space requirements for non-server operations are needed for the functions that are building data centers (i.e., PCA, RA, LA, MA, and LOP). Non-server operations refers to the space required for incidental offices for facilities, lobby space, rest rooms, conference rooms, mechanical/equipment rooms, and additional space for data center support. This space is currently equal to 30 percent of the space required for servers, which is based on industry standards and conversations with data center design SMEs.
• Power requirements for non-server operations for the functions that are building data centers (i.e., PCA, RA, LA, MA, and LOP) have been included for items such as lights and heating and cooling at 50 percent of the server power costs, which is based on industry standards and conversations with data center design SMEs.
• Fire suppression system costs are required for data centers. Typically the cost to purchase and install the type of fire suppression system needed for a data center ranges from $20,000-$60,000, depending on the total square feet that are required to be covered.95 We have estimated a cost of $30,000 for each facility.
• A facilities maintenance multiplier is included since it is difficult to estimate the ongoing (annual facilities and infrastructure maintenance) costs of a data center. The multiplier is four percent of initial construction costs.96
• Commercial leasing rates for the ECA, root CA, intermediate CA, DCM, and SCMS manager functions are included in this model. The team’s leasing rates are based on publicly available commercial leasing rates that provide estimates for monthly lease payments. These estimates do not necessarily account for other costs that may need to be negotiated per contract. Additional costs that we have not included but that may need to be considered when leasing commercial space include:
o Renovation and Office Specifications: Most landlords provide an allowance for renovations (per square foot) dependent on contract terms. Commercial office spaces
95 Dines, “Buy or Build? The Economics of Data Center Facilities,” 2011. 96 Ibid, 6.
Chapter 11 Cost Methodology - DRAFT
Intelligent Transportation Systems Joint Program Office U.S. Department of Transportation, Research and Innovative Technology Administration
SCMS Design and Analysis for the Connected Vehicle System | 108
are leased according to class, which generally correlates with the need for renovation. Class A is the highest rated and is generally accepted as an updated modern space. Class B is considered intermediate, and may be second-generation space (i.e., a new tenant moves directly into an old tenant’s space without major changes). Class C is the lowest rated space and would likely require a major renovation.
o Utilities: Cost may or may not be included in the monthly rate, based on contract terms. o Length of Contract: Monthly rate may fluctuate substantially depending on the length of
contract commitment.
• Data centers can be categorized into four separate “Tiers” based on the amount of ongoing operation that can be assured on an annual basis.97 The cost model was not built around the specification of a particular Tier, however the cost model does include many elements that would allow it to qualify between a Tier II and Tier III data center. These elements include but are not limited to building type, staffing levels, power needed per square foot, and cooling needs amongst others. Specifications for Tiers I through IV are as follows:
o Tier I: Ideal for medium sized businesses since they have better capacity, reliability, performance, and manageability than a simple office setting, however they do not account for redundancy. Tier 1 data centers have an annual impact of maintenance and outages totaling 28.8 hours per year; 99.67% availability is assured.
o Tier II: Upgraded form of Tier I data center with some redundant components. Tier II data centers have an annual impact of maintenance and outages totaling 22 hours per year; 99.75% availability is assured.
o Tier III: These data centers are built for concurrent maintainability and redundancy since they provide multiple cooling and power sources. Tier III data centers have an annual impact of maintenance and outages totaling 1.6 hours per year; 99.98% availability is assured.
o Tier IV: Provide the most robust data centers possible since they include fault tolerance for every single data center system or component. Tier IV data centers have an annual impact of maintenance and outages totaling 0.4 hours per year; 99.99% availability is assured.
• To account for redundancy in the system, a disaster recovery plan for the SCMS needs to include specifications for backup systems for all system components, alternative power sources, and specialized personnel for operations of disaster recovery implementation, among other preparatory measures. NIST recommends that a cost-benefit analysis be conducted during the planning process to identify a contingency strategy that is most appropriate for the organization. While the team’s current cost model includes additional costs for backup systems, there has not been a specific disaster recovery plan included as part of the technical design. With more information and development of such specifications, the cost model should be adjusted.
Full Time Equivalent Employees (FTEs) Assumptions
• To stand up the SCMS, a highly diverse staff with backgrounds in the areas of systems engineering, PKI, and IT consulting will be required. To determine personnel costs, the team selected likely job functions that would be required to develop and support the system over its
97 W. Turner, et al. “Cost Model: Dollars per kW plus Dollars per Square Foot of Computer Floor,” 2008.
Chapter 11 Cost Methodology - DRAFT
Intelligent Transportation Systems Joint Program Office U.S. Department of Transportation, Research and Innovative Technology Administration
SCMS Design and Analysis for the Connected Vehicle System | 109
lifetime. The team obtained salaries from the Bureau of Labor Statistics (BLS) website (www.bls.gov/oes), an industry recognized agency. While we highlight six specific cities as sample locations in the next section, salaries are calculated for the locations at the state level due to the nature of how BLS information is presented and to maintain consistency across estimates.
• Personnel costs are estimated using the average rate across a team of individuals supporting one particular function, with 2,080 hours in a year. Note that 2,080 hours is an industry standard and does not imply that an employee does not have time off, but rather is the hourly conversion of annual salaries.
• Several functions are assumed to require around the clock staffing (e.g., PCA, RA, LA, MA, and LOP), based on PKI industry practices. As such, staff at these facilities are assumed to work in eight-hour shifts, with three crews supporting a facility on a daily basis. Operations and maintenance (O&M) for these functions reflects 21 shifts per week since there will be three shifts per day to support a 24-hour operation. The team assumes that the ECA, Root CA, Intermediate CA, DCM, and SCMS manager will have one shift per day and therefore those columns within each function sheet in the cost model reflect five shifts per week for O&M.
• For each location (specified in the next section), the team assumes two employees per function except for the LOP and SCMS manager. Because the LOP is a largely automated function, we assume one employee per location. The SCMS manager is unique in that it provides the oversight and management of the entire system. Therefore, in years 1–10, we estimated 10 employees for DC and any other location, in years 11–20 we estimated 10 employees for DC and five per any other location, and in years 21–40 we estimated 20 employees for DC and five for any other location. It is likely that more than two employees will be needed at every location when the system is actually implemented (some may need more, some may need less), however this is simply a figure to estimate staffing costs across functions.
• The number of help desk FTE is currently set to 40, however there is additional flexibility within the cost model (described below) that allows a user to manipulate the “Incident Rate” and “Average Time Per Call” to obtain better estimates of the staff that will be needed.
Location Assumptions
The team has built into the cost model the flexibility to choose different numbers of facilities across six different sample locations. The cost factors that will vary by location are the building or lease costs for facilities, the cost of power, and staff salaries. Sensitivity analyses can be completed to better understand how these variables impact system costs, and we have built the ability to conduct those sensitivity analyses into the full cost model. It is clear that different ownership/operation models will affect the number of locations. For example, higher numbers of owners/operators who must maintain legally separate CMEs will require higher numbers of locations for separate facilities. Estimates within the cost model are currently set using rates for the Richland, WA area. To provide a larger perspective on the costs in other locations, the team analyzed costs for specific elements over multiple locations. The following characteristics were taken into consideration when the sample locations in Table 17 were chosen:
• Availability of energy

Chapter 11 Cost Methodology - DRAFT
Intelligent Transportation Systems Joint Program Office U.S. Department of Transportation, Research and Innovative Technology Administration
SCMS Design and Analysis for the Connected Vehicle System | 110
o Electricity costs were estimated using the average rate ($/kWh) of the five-year period from 2007-2011 for a state’s annual retail price of electricity to industrial customers. This information was gathered from multiple sources made available to the public by the U.S. Energy Information Administration, an agency within the Department of Energy.
• Availability of fiber optic networks
o Information about fiber optic network availability is generally not publicly available. The team researched different providers across the U.S. and used information that was available to ensure that network access does exist for the illustrative locations. The team assumed that there is sufficient fiber bandwidth connectivity in each location for new data center operations.
• Cost of data center facilities (construction vs. leasing)
o The cost to construct a data center facility will vary based on geographic location because of different prices of construction materials and property values. For each location, rates for the base building construction costs per square foot were estimated using a commercial data center construction website which provides cost estimates by city.98
o The costs to lease a data center facility will also vary based on geographic location and the options of colocation and wholesale lease agreements. Colocation involves renting a limited amount of server rack space in a data center owned by a provider. Wholesale leasing involves a tenant renting an entire data center for solely their own use. Both include costs for initial build-out/setup fees, monthly lease cost (by kWh or square foot), and monthly power costs. The team chose to model a wholesale lease agreement because we assume that this type of arrangement is more secure than colocation, due to the higher degree of control of access to the facility and computer room floor where server operations take place. We have assumed that there is wholesale leasing space available for the sizes of facilities that the SCMS will require, but it should be noted that data center facilities are not as widely available as commercial office space. Alternate arrangements may need to be negotiated by the future owners/operators of the functions. Due to the lack of publicly available data center leasing rates in the locations outlined below, an estimate of $14 per square foot was used.99
The team considered both urban and suburban areas in its review.
98 Reed Construction Data, LLC website, http://www.reedconstructiondata.com/rsmeans/models/data-center/list/. 99 Estimates for wholesale leasing were based on discussions with internal data center design SMEs and publicly available information about wholesale leasing rates from Digital Realty Trust, Inc.
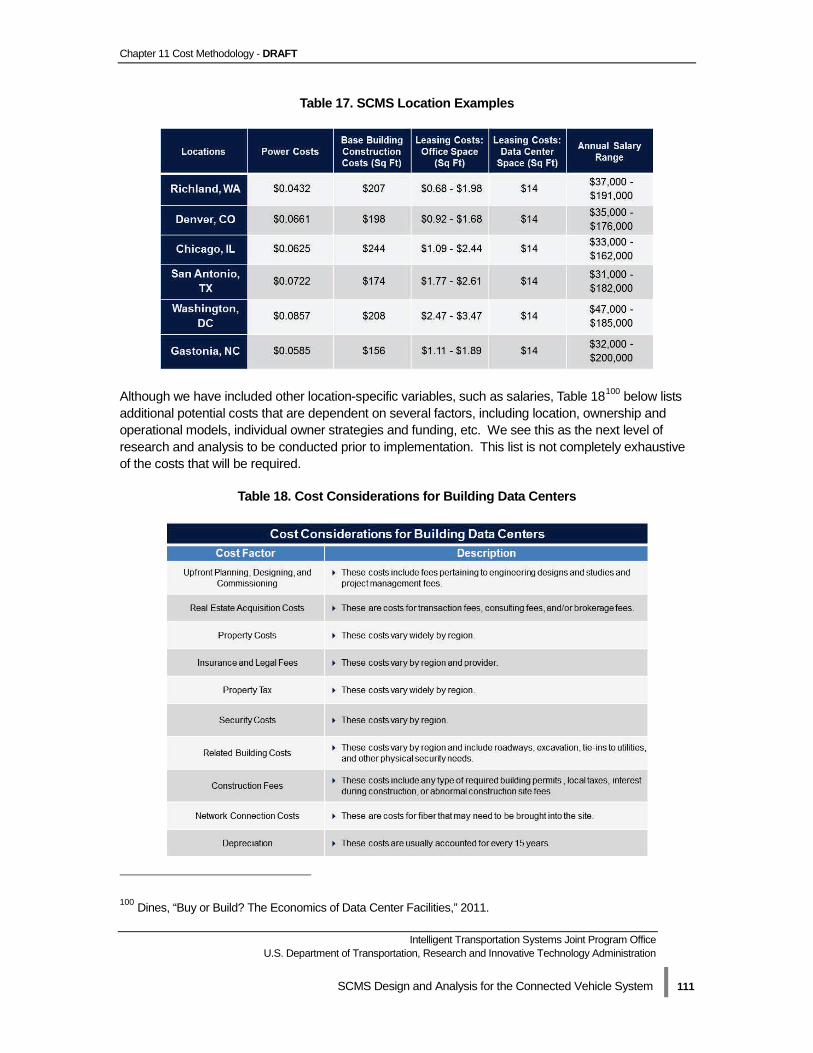
Chapter 11 Cost Methodology - DRAFT
Intelligent Transportation Systems Joint Program Office U.S. Department of Transportation, Research and Innovative Technology Administration
SCMS Design and Analysis for the Connected Vehicle System | 111
Table 17. SCMS Location Examples
Although we have included other location-specific variables, such as salaries, Table 18100 below lists additional potential costs that are dependent on several factors, including location, ownership and operational models, individual owner strategies and funding, etc. We see this as the next level of research and analysis to be conducted prior to implementation. This list is not completely exhaustive of the costs that will be required.
Table 18. Cost Considerations for Building Data Centers
100 Dines, “Buy or Build? The Economics of Data Center Facilities,” 2011.
Chapter 11 Cost Methodology - DRAFT
Intelligent Transportation Systems Joint Program Office U.S. Department of Transportation, Research and Innovative Technology Administration
SCMS Design and Analysis for the Connected Vehicle System | 112
Cost Model Flexibility For Users To accommodate ongoing development in the SCMS technical design, we have built in several layers of flexibility in the cost model. This flexibility allows users to manipulate specific variables within the model to demonstrate the impact on costs. All fields that have the ability to be changed are highlighted in yellow throughout the cost model. The first sheet the user has the ability to manipulate is the Certificate Number Inputs sheet. This sheet contains four tables across the top that significantly impact calculations for the number of vehicles in the system and the frequency with which certificates are downloaded. Together, these factors influence the number of certificates that need to be generated and distributed by the SCMS. There is also a table that allows the user to set the rate at which misbehavior will occur in the system, which impacts the costs associated with managing user malfeasance and technical malfunction. The full implications of this last table are still under development by CAMP.101 As the user selects the desired parameters in the tables across the top of the sheet, the content of the “Total Number of Certificates” table in the middle of the sheet will change to reflect their choices. The “Total Number of Certificates” table describes the total number of vehicles with OBE in the system, as well as the total number of certificates needed for these vehicles (divided up into different periods of time). The four tables at the top of the sheet that the user manipulates are described below:
• “Initial Deployment” table: This table describes how the SCMS will operate during initial deployment, the first three years of the connected vehicle system’s operation. A one-time download of 3,000 short-term certificates for each OBE, regardless of when it enters the system during the initial three-year deployment period will be performed.
• “Full Deployment” table: This table describes how the SCMS will operate during full deployment, which follows initial deployment and continues indefinitely. The user has the ability to choose the certificate download frequency in this table. The certificate download frequency cell reflects how often users will download full batches of certificates and by definition also implies the number of certificates that will be included in a batch. All changes then cascade through the “Total Number of Certificates” table in the sheet.
• “Deployment Scenario” table: This table refers to the NHTSA roll-out scenario that dictates how OBE and ASD will penetrate the vehicle fleet over the 40-year period. As mentioned previously, this data is drawn from the Fleet – NHTSA sheet. The user can choose from any of the four NHTSA scenarios and observe how each scenario impacts the total number of certificates needed during any given year. For the purposes of our estimates, we have chosen NHTSA scenario 4 because it includes both new vehicles and a phase-in of ASDs which allows for a larger penetration of vehicles into the system each year.
• “Possible Misbehavior Rates (%)” table: This table represents a functionality that the team included in the cost model, but that is still being developed by CAMP. The misbehavior rate refers to the way that user malfeasance or technical malfunction affects the system; it allows the user to estimate the percentage of certificates that would need to be replaced after an OBE (and the certificates it has downloaded) has been revoked due to misbehavior. The
101 At this point, the misbehavior rate does not drive any calculations in the model; the table serves as a placeholder for calculations that can be added in the future to calculate misbehavior authority costs when more is known about this function.

Chapter 11 Cost Methodology - DRAFT
Intelligent Transportation Systems Joint Program Office U.S. Department of Transportation, Research and Innovative Technology Administration
SCMS Design and Analysis for the Connected Vehicle System | 113
misbehavior rate has been analyzed at a high level across this project and other related projects, but is still notional. The dropdown menu available to the user lists four potential misbehavior rates (0 percent, 0.1 percent, 0.5 percent, and 1 percent), however, it should be noted that these rates are not currently linked to anything in the cost model. As specifications for the misbehavior detection and management process are completed, functionality can be built out in the model to increase the accuracy of estimations.
We have created Location Rate sheets for each location. Each of these sheets include salary information by title and functional team based on rates from the BLS website, the base building construction costs per square foot to be used when estimating the cost to build a data center, the cost of power ($/kW hour), and leasing rates for both data center space and traditional office space in each of our six representative locations (noted above). The salary information by location and the cost of power are both calculated at the state level, rather than the city level, based on availability of data. We have also created a Location Inputs sheet. This sheet is function-specific and allows the user to input the number of locations for each function, for each of the 10-year periods (i.e., years 1-10, 11-20, 21-30, and 31-40) across all of the locations outlined above. For the PCA, RA, LA, MA, and LOP functions, the user has the option to either build data centers in each location or lease data center space. For the ECA, root CA, intermediate CA, DCM, and SCMS manager, the user has the option to lease traditional office space since these functions do not perform processing-intensive activities for the SCMS. The leasing rates reflected in the cost model are based on rates obtained from LoopNet®102 (www.loopnet.com) and Showcase (www.showcase.com). As a reminder, the numbers that are entered into the Location Inputs sheet for each function and location also directly impact the number of employees (i.e., for every one location we assume two employees, except for the LOP and SCMS manager functions as described above). The variables that are manipulated in the Location Inputs sheet will calculate costs by taking information from both the Location Rate sheets and specific function sheets within the cost model. As changes are made in the Location Inputs sheet, the user will see the impact and/or change in salaries, base building construction costs, cost of power, and leasing rates for traditional office space across multiple locations throughout the cost model. These changes and impacts will be rolled into the full cost model estimations, based on a user’s chosen parameters and inputs, cascading through the entire model to arrive at totals. To reflect the anticipation that technology costs per unit of hardware and software within the SCMS will change over time, the team created a new sheet in the cost model. The Cost Curve Inputs sheet allows the user to estimate the reduction in costs over a 40-year period by selecting different cost curves. Similar to the Location Inputs sheet, the Cost Curve Inputs sheet is also listed by function. Each of the components listed per function on this sheet includes estimates for four cost curves, or different rates of change in technology costs over time (represented by yellow cells): no change in technology costs over time, a gradual change, a medium change, or a steep change. The cost curves that we have included in the cost model are estimates based on research about average changes over time based on the last two-three decades of data. Although costs for technology do in general decrease over time, they do not do so indefinitely. As new capabilities and
102 LoopNet® is a registered trademark of LoopNet, Inc.
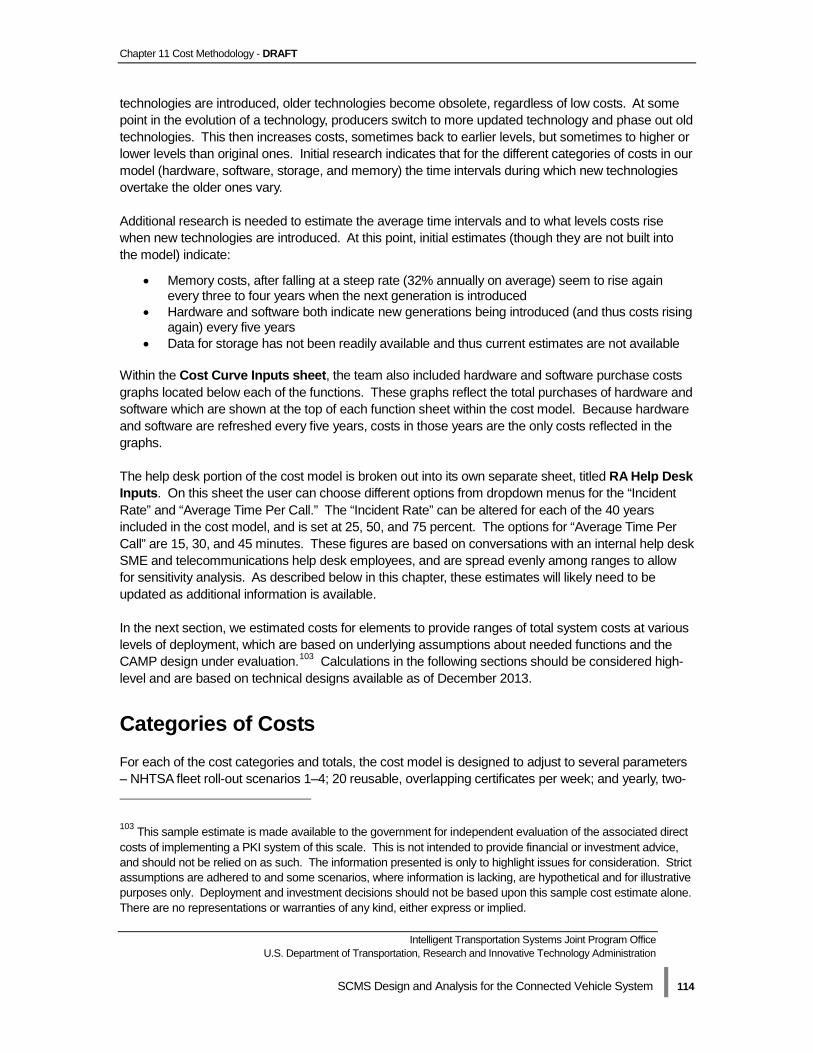
Chapter 11 Cost Methodology - DRAFT
Intelligent Transportation Systems Joint Program Office U.S. Department of Transportation, Research and Innovative Technology Administration
SCMS Design and Analysis for the Connected Vehicle System | 114
technologies are introduced, older technologies become obsolete, regardless of low costs. At some point in the evolution of a technology, producers switch to more updated technology and phase out old technologies. This then increases costs, sometimes back to earlier levels, but sometimes to higher or lower levels than original ones. Initial research indicates that for the different categories of costs in our model (hardware, software, storage, and memory) the time intervals during which new technologies overtake the older ones vary. Additional research is needed to estimate the average time intervals and to what levels costs rise when new technologies are introduced. At this point, initial estimates (though they are not built into the model) indicate:
• Memory costs, after falling at a steep rate (32% annually on average) seem to rise again every three to four years when the next generation is introduced
• Hardware and software both indicate new generations being introduced (and thus costs rising again) every five years
• Data for storage has not been readily available and thus current estimates are not available Within the Cost Curve Inputs sheet, the team also included hardware and software purchase costs graphs located below each of the functions. These graphs reflect the total purchases of hardware and software which are shown at the top of each function sheet within the cost model. Because hardware and software are refreshed every five years, costs in those years are the only costs reflected in the graphs. The help desk portion of the cost model is broken out into its own separate sheet, titled RA Help Desk Inputs. On this sheet the user can choose different options from dropdown menus for the “Incident Rate” and “Average Time Per Call.” The “Incident Rate” can be altered for each of the 40 years included in the cost model, and is set at 25, 50, and 75 percent. The options for “Average Time Per Call” are 15, 30, and 45 minutes. These figures are based on conversations with an internal help desk SME and telecommunications help desk employees, and are spread evenly among ranges to allow for sensitivity analysis. As described below in this chapter, these estimates will likely need to be updated as additional information is available. In the next section, we estimated costs for elements to provide ranges of total system costs at various levels of deployment, which are based on underlying assumptions about needed functions and the CAMP design under evaluation.103 Calculations in the following sections should be considered high-level and are based on technical designs available as of December 2013.
Categories of Costs For each of the cost categories and totals, the cost model is designed to adjust to several parameters – NHTSA fleet roll-out scenarios 1–4; 20 reusable, overlapping certificates per week; and yearly, two- 103 This sample estimate is made available to the government for independent evaluation of the associated direct costs of implementing a PKI system of this scale. This is not intended to provide financial or investment advice, and should not be relied on as such. The information presented is only to highlight issues for consideration. Strict assumptions are adhered to and some scenarios, where information is lacking, are hypothetical and for illustrative purposes only. Deployment and investment decisions should not be based upon this sample cost estimate alone. There are no representations or warranties of any kind, either express or implied.

Chapter 11 Cost Methodology - DRAFT
Intelligent Transportation Systems Joint Program Office U.S. Department of Transportation, Research and Innovative Technology Administration
SCMS Design and Analysis for the Connected Vehicle System | 115
year, or three-year downloads of certificate batches for full deployment. In this chapter we include one example of several of the cost categories, with additional tables and numbers presented in Appendix D. These parameters were chosen to reflect the scenario that had the longest deployment of new vehicles including ASDs. The examples we present in the report, unless otherwise specified, are defined by the following:
• Fleet roll-out scenario 4: OBE on new vehicles with three-year phase-in starting in MY 2020 and includes ASDs
• 20 reusable, overlapping certificates per week at full deployment • Two-year download of certificate batches during full deployment (2,000 certificates)
It should be noted that changing the fleet roll-out scenarios does not have a large impact on the costs of the system. This is because each scenario includes some portion of new vehicles but some scenarios include a smaller portion of new vehicles but add in ASDs. The most significant changes in costs are brought on by adjusting the certificate download frequency. Choosing different certificate download frequencies changes the number of certificates that each user receives. Because the system costs are driven by the number of the certificates needed at a given time, changing download frequencies causes costs throughout the model to fluctuate, often significantly. As described above in the previous section, the number of facilities that are assigned per function will also show a change in the costs. Another important parameter of the model is the refresh for both hardware and software of the system every five years. To account for this, the team separated hardware and software purchase costs from O&M costs. The cost model works as follows:
• Purchase hardware and software in one year for the needs of the system five years in the future. For example, in year 0 (initial build out) the cost model reflects costs of purchasing hardware for the needs of the system in year 5. This provides the system with excess capacity to grow without having to purchase hardware and software on a continuous basis, and also allows for the possibility of faster growth than what is anticipated.
• Estimated hardware O&M in each year according to the needs of that year only – implying that there will be some hardware and software that is unused.
o Hardware O&M percentages are estimated at 10 percent of capacity o Software O&M percentages are estimated at 18 percent of capacity
• These two points are reflected in the cost model in that every five years (starting with year 0, then year 5, 10, and so on) the costs surge for hardware and software.
Hardware
Hardware costs are driven by the types of hardware and volume necessary to meet the requirements of the system at different stages of roll-out. The need to support high volumes of cryptographic operations translates to the procurement of hundreds of HSMs across multiple functions. The HSMs would be accompanied by the same number of quad core servers, along with an array of other hardware which include memory, storage, monitors, keyboard and mouse combinations, and personal computers. Through conversations with SafeNet, PKI experts, and other HSM providers, it was determined that annual O&M costs for hardware can be estimated at 10 percent of the purchase price as a rule of thumb for IT implementations.
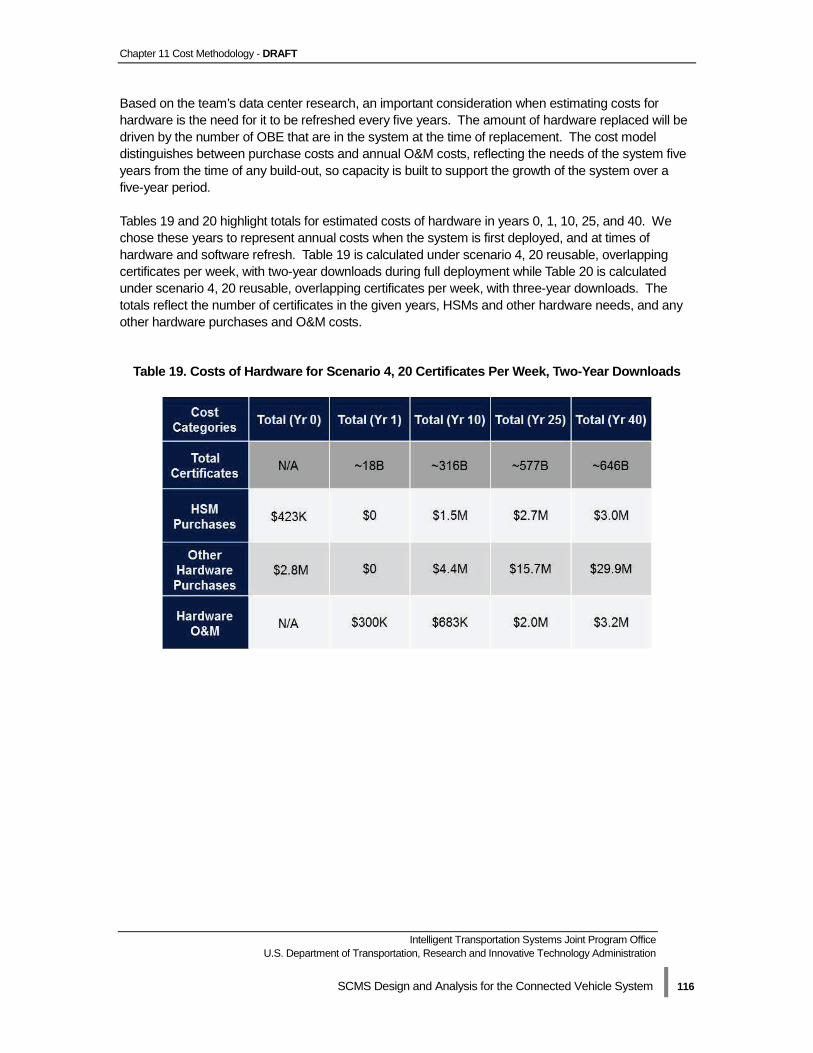
Chapter 11 Cost Methodology - DRAFT
Intelligent Transportation Systems Joint Program Office U.S. Department of Transportation, Research and Innovative Technology Administration
SCMS Design and Analysis for the Connected Vehicle System | 116
Based on the team’s data center research, an important consideration when estimating costs for hardware is the need for it to be refreshed every five years. The amount of hardware replaced will be driven by the number of OBE that are in the system at the time of replacement. The cost model distinguishes between purchase costs and annual O&M costs, reflecting the needs of the system five years from the time of any build-out, so capacity is built to support the growth of the system over a five-year period. Tables 19 and 20 highlight totals for estimated costs of hardware in years 0, 1, 10, 25, and 40. We chose these years to represent annual costs when the system is first deployed, and at times of hardware and software refresh. Table 19 is calculated under scenario 4, 20 reusable, overlapping certificates per week, with two-year downloads during full deployment while Table 20 is calculated under scenario 4, 20 reusable, overlapping certificates per week, with three-year downloads. The totals reflect the number of certificates in the given years, HSMs and other hardware needs, and any other hardware purchases and O&M costs.
Table 19. Costs of Hardware for Scenario 4, 20 Certificates Per Week, Two-Year Downloads
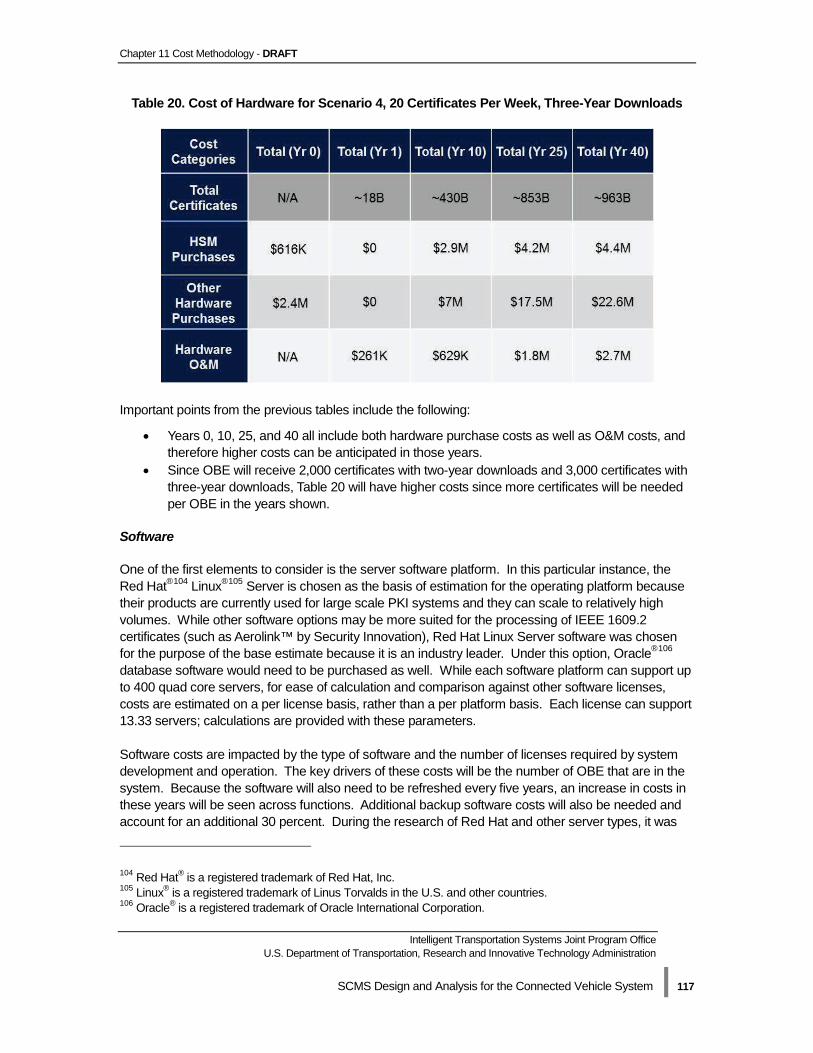
Chapter 11 Cost Methodology - DRAFT
Intelligent Transportation Systems Joint Program Office U.S. Department of Transportation, Research and Innovative Technology Administration
SCMS Design and Analysis for the Connected Vehicle System | 117
Table 20. Cost of Hardware for Scenario 4, 20 Certificates Per Week, Three-Year Downloads
Important points from the previous tables include the following:
• Years 0, 10, 25, and 40 all include both hardware purchase costs as well as O&M costs, and therefore higher costs can be anticipated in those years.
• Since OBE will receive 2,000 certificates with two-year downloads and 3,000 certificates with three-year downloads, Table 20 will have higher costs since more certificates will be needed per OBE in the years shown.
Software
One of the first elements to consider is the server software platform. In this particular instance, the Red Hat®104 Linux®105 Server is chosen as the basis of estimation for the operating platform because their products are currently used for large scale PKI systems and they can scale to relatively high volumes. While other software options may be more suited for the processing of IEEE 1609.2 certificates (such as Aerolink™ by Security Innovation), Red Hat Linux Server software was chosen for the purpose of the base estimate because it is an industry leader. Under this option, Oracle®106 database software would need to be purchased as well. While each software platform can support up to 400 quad core servers, for ease of calculation and comparison against other software licenses, costs are estimated on a per license basis, rather than a per platform basis. Each license can support 13.33 servers; calculations are provided with these parameters. Software costs are impacted by the type of software and the number of licenses required by system development and operation. The key drivers of these costs will be the number of OBE that are in the system. Because the software will also need to be refreshed every five years, an increase in costs in these years will be seen across functions. Additional backup software costs will also be needed and account for an additional 30 percent. During the research of Red Hat and other server types, it was
104 Red Hat® is a registered trademark of Red Hat, Inc. 105 Linux® is a registered trademark of Linus Torvalds in the U.S. and other countries. 106 Oracle® is a registered trademark of Oracle International Corporation.
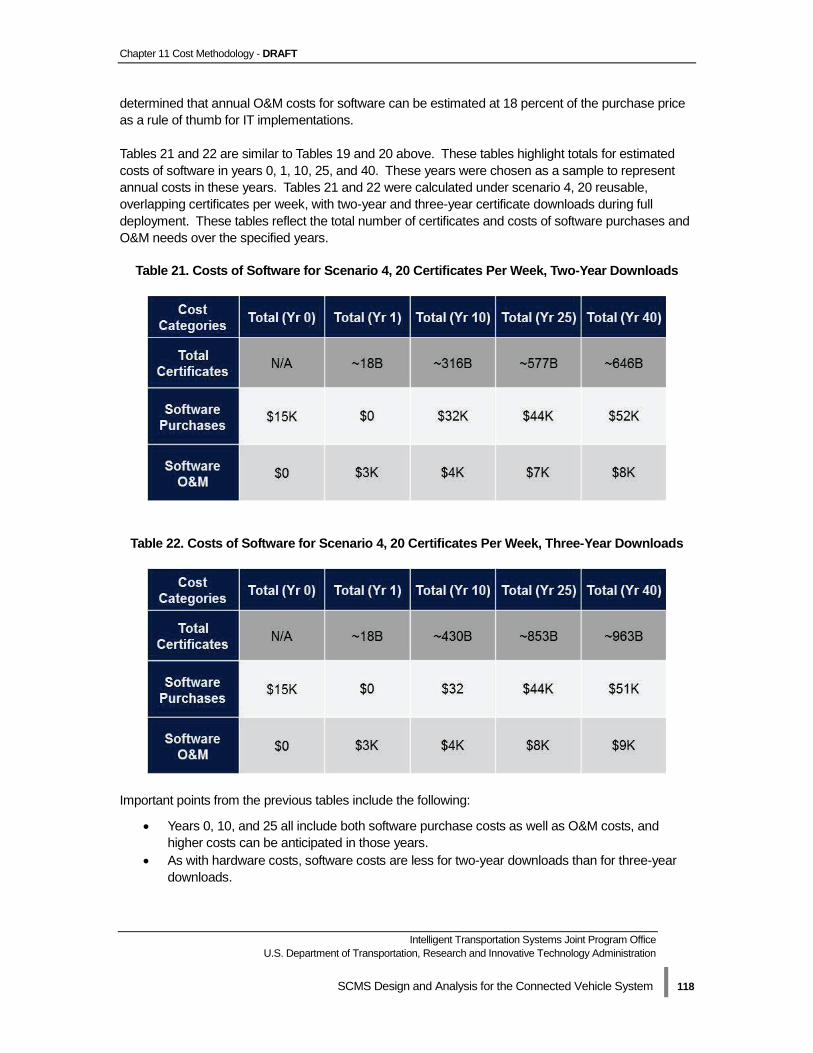
Chapter 11 Cost Methodology - DRAFT
Intelligent Transportation Systems Joint Program Office U.S. Department of Transportation, Research and Innovative Technology Administration
SCMS Design and Analysis for the Connected Vehicle System | 118
determined that annual O&M costs for software can be estimated at 18 percent of the purchase price as a rule of thumb for IT implementations. Tables 21 and 22 are similar to Tables 19 and 20 above. These tables highlight totals for estimated costs of software in years 0, 1, 10, 25, and 40. These years were chosen as a sample to represent annual costs in these years. Tables 21 and 22 were calculated under scenario 4, 20 reusable, overlapping certificates per week, with two-year and three-year certificate downloads during full deployment. These tables reflect the total number of certificates and costs of software purchases and O&M needs over the specified years.
Table 21. Costs of Software for Scenario 4, 20 Certificates Per Week, Two-Year Downloads
Table 22. Costs of Software for Scenario 4, 20 Certificates Per Week, Three-Year Downloads
Important points from the previous tables include the following:
• Years 0, 10, and 25 all include both software purchase costs as well as O&M costs, and higher costs can be anticipated in those years.
• As with hardware costs, software costs are less for two-year downloads than for three-year downloads.

Chapter 11 Cost Methodology - DRAFT
Intelligent Transportation Systems Joint Program Office U.S. Department of Transportation, Research and Innovative Technology Administration
SCMS Design and Analysis for the Connected Vehicle System | 119
Facilities
The facilities costs in the cost model reflect the space necessary to house the software, hardware, and personnel who maintain the system as well as the space requirements, energy costs, and construction or leasing costs. As previously mentioned, certain functions with substantial processing needs will require data center space (PCA, RA, LA, MA, and LOP). Other functions can operate in commercial office space (ECA, root CA, intermediate CA, DCM, and SCMS manager). When considering those functions that require data centers, the team examined construction costs for large data centers and server farms built by such companies as Google and Microsoft®.107 Based on public information, the size of a data center depends on the amount of equipment it houses, computing requirements, data load balancing requirements, and power requirements, among other elements. For example, Google operates a server farm in Oregon that includes several facilities of roughly 70,000 square feet each; housing approximately 45,000 servers each. This equates to roughly 1.5 square feet of space per server, including the necessary generators, cooling systems, wiring, and space for administrative functions. Through this research we have estimated two square feet per server for our cost model. Leasing rates for data centers are assumed to follow a wholesale leasing model, which refers to an arrangement where an entire data center is leased by one tenant. Future decisions about ownership and operation of the system may impact how data center space is acquired and used. However, because no decisions have been made related to owners/operators, we did not assume that existing data center space could be leveraged outside of leasing agreements. Those functions requiring commercial office space are assumed to lease the space they need. Commercial space leasing rates were estimated using commercial listings for IT office space through LoopNet®108 (www.loopnet.com) and Showcase (www.showcase.com), both popular commercial real estate listing services. The team included the average square foot per facility (as it changes for each function), the average price per square foot per month, and the initial cost of one facility build out. The cost of building out the facility is necessary even when leasing because this system requires specific hardware, software, and security needs. Through analysis of data center providers, the team determined that facilities and infrastructure are useable for a period of 10 years based on the specific type of data centers and equipment that are necessary. Similar to the method used in planning and estimating for software and hardware refresh, facilities initial costs were estimated to be determined by the needs of the system 10 years in the future. There are two basic elements to these costs: data center infrastructure and procurement costs (internal build-out), and construction costs. For data center infrastructure and procurement costs, the team estimated a total refresh (or new build out of these internal needs) based on the needs 10 years in the future. To calculate the construction costs, the 107 Microsoft® is a registered trademark of Microsoft Corporation. 108 LoopNet® is a registered trademark of LoopNet, Inc.
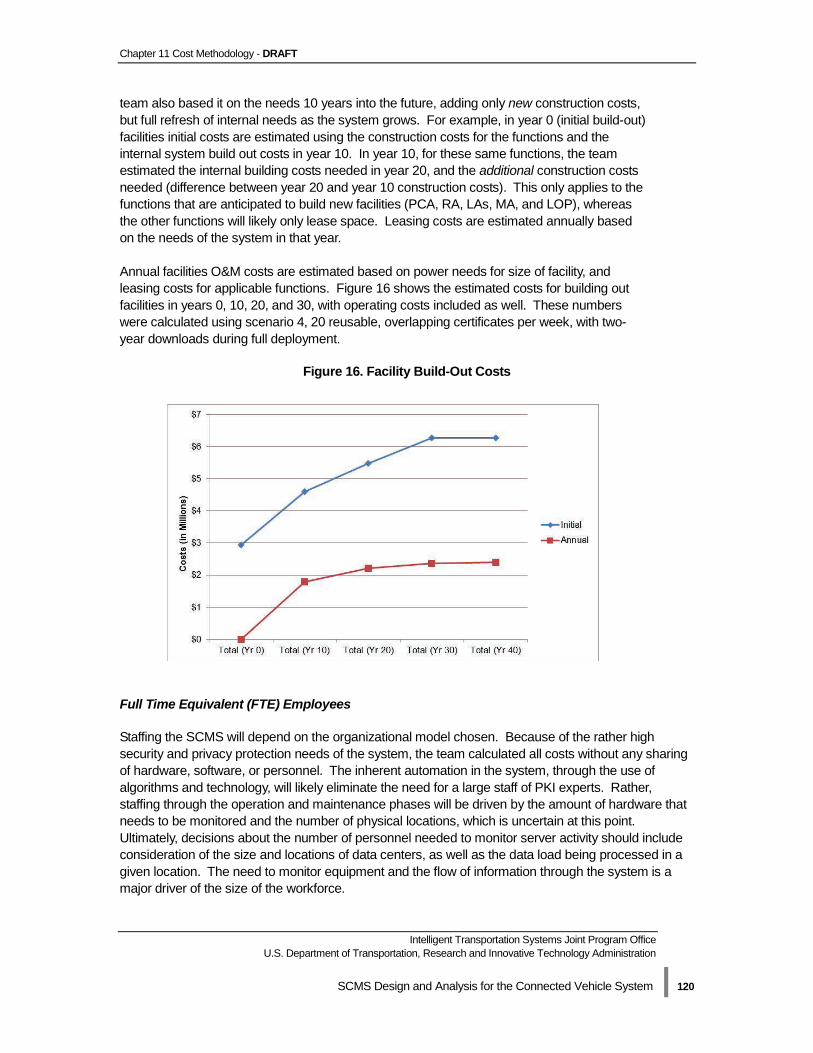
Chapter 11 Cost Methodology - DRAFT
Intelligent Transportation Systems Joint Program Office U.S. Department of Transportation, Research and Innovative Technology Administration
SCMS Design and Analysis for the Connected Vehicle System | 120
team also based it on the needs 10 years into the future, adding only new construction costs, but full refresh of internal needs as the system grows. For example, in year 0 (initial build-out) facilities initial costs are estimated using the construction costs for the functions and the internal system build out costs in year 10. In year 10, for these same functions, the team estimated the internal building costs needed in year 20, and the additional construction costs needed (difference between year 20 and year 10 construction costs). This only applies to the functions that are anticipated to build new facilities (PCA, RA, LAs, MA, and LOP), whereas the other functions will likely only lease space. Leasing costs are estimated annually based on the needs of the system in that year. Annual facilities O&M costs are estimated based on power needs for size of facility, and leasing costs for applicable functions. Figure 16 shows the estimated costs for building out facilities in years 0, 10, 20, and 30, with operating costs included as well. These numbers were calculated using scenario 4, 20 reusable, overlapping certificates per week, with two-year downloads during full deployment.
Figure 16. Facility Build-Out Costs
Full Time Equivalent (FTE) Employees
Staffing the SCMS will depend on the organizational model chosen. Because of the rather high security and privacy protection needs of the system, the team calculated all costs without any sharing of hardware, software, or personnel. The inherent automation in the system, through the use of algorithms and technology, will likely eliminate the need for a large staff of PKI experts. Rather, staffing through the operation and maintenance phases will be driven by the amount of hardware that needs to be monitored and the number of physical locations, which is uncertain at this point. Ultimately, decisions about the number of personnel needed to monitor server activity should include consideration of the size and locations of data centers, as well as the data load being processed in a given location. The need to monitor equipment and the flow of information through the system is a major driver of the size of the workforce.

Chapter 11 Cost Methodology - DRAFT
Intelligent Transportation Systems Joint Program Office U.S. Department of Transportation, Research and Innovative Technology Administration
SCMS Design and Analysis for the Connected Vehicle System | 121
A help desk function will also need to be staffed. In this system, due to the relationship between the RA and the OBE, it may be feasible to position a help desk function within the RA. For this estimate, the team assumed that a help desk component will accompany an RA at each physical location. In CAMP’s analysis of a help desk, they developed a formula for FTE estimation that was focused on 250 million vehicles (full deployment) and required a defined incident rate and mean time to repair (i.e., the average length of a service call). The Booz Allen team agrees that the help desk staff will likely need to be substantially larger to accommodate the needs of the SCMS however, we assert that more information is needed before a specific incident rate and mean time to repair can be determined. Some (though not all) questions that need to be discussed include:
• Who in the system would actually be using the helpdesk (e.g., individual users or system technicians)?
• How would calls or requests for help from individuals be routed through owners/operators of the system?
• Are there ways to off-load some helpdesk staff and costs to technical locations that might be used for servicing?
After reviewing our original approach to estimating staff required for the help desk, we conducted additional research in the areas of telecommunications and PKI help desk services. Through that research we found that PKI implementation help desk needs are highly variable. There are several types of issues PKI systems may face; one source estimated that there will be one help desk call for every three users in PKI implementation.109 In addition, the length of time each service call takes depends on the issue in question – simple support issues will take less time than technical malfunctions that may require feedback from an engineer or computer scientist. Certain elements will need to be calculated to understand expected telecommunication costs and efficiencies when the program is implemented: industry help desk call cost averages, economies of scale achieved from user base, call duration, call types, and the number of employees available to support calls. Because of the unprecedented scale and unique design of the SCMS, these estimates are difficult to determine. In addition, we believe additional research into technical support for automotive-related concerns might be an area that provides a more applicable model. Coordinating with the automotive manufacturers would be one way to approach this. As stated above, we have revised our approach to help desk FTE estimation in the cost model to accommodate greater flexibility for the user to test different variables, based on their preferences. As the numbers in the dropdown menus for the “Incident Rate” and “Average Time Per Call” are changed on the sheet, the number of help desk employees on the RA sheet is updated accordingly and can range from 179 to 88,000 which reflect an increase in costs of $23M to $12B over a 40-year period. Given this large range, and the need to better understand where and how a helpdesk function for the SCMS might operate, we have set the default at our original number of 40. Clearly, as one includes helpdesk staff of thousands of employees, it will have a significant impact on the system’s total costs, and is not part of the underlying functionality. At this point, facility estimates for help desk FTE have not been included in the cost model. 109 Jon Oltsik, “The True Costs of E-mail Encryption,” June 2010, http://www.trendmicro.com/cloud-content/us/pdfs/business/white-papers/wp_true-costs-of-email-encryption_analyst-esg.pdf.
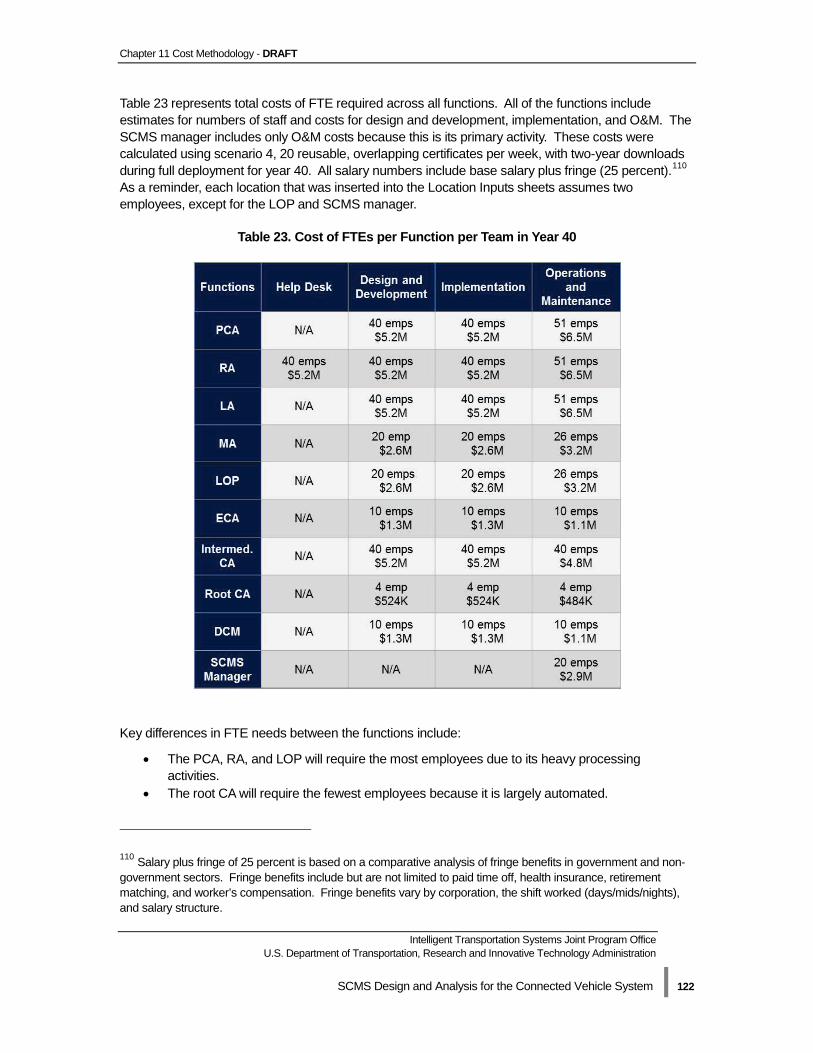
Chapter 11 Cost Methodology - DRAFT
Intelligent Transportation Systems Joint Program Office U.S. Department of Transportation, Research and Innovative Technology Administration
SCMS Design and Analysis for the Connected Vehicle System | 122
Table 23 represents total costs of FTE required across all functions. All of the functions include estimates for numbers of staff and costs for design and development, implementation, and O&M. The SCMS manager includes only O&M costs because this is its primary activity. These costs were calculated using scenario 4, 20 reusable, overlapping certificates per week, with two-year downloads during full deployment for year 40. All salary numbers include base salary plus fringe (25 percent).110 As a reminder, each location that was inserted into the Location Inputs sheets assumes two employees, except for the LOP and SCMS manager.
Table 23. Cost of FTEs per Function per Team in Year 40
Key differences in FTE needs between the functions include:
• The PCA, RA, and LOP will require the most employees due to its heavy processing activities.
• The root CA will require the fewest employees because it is largely automated. 110 Salary plus fringe of 25 percent is based on a comparative analysis of fringe benefits in government and non-government sectors. Fringe benefits include but are not limited to paid time off, health insurance, retirement matching, and worker’s compensation. Fringe benefits vary by corporation, the shift worked (days/mids/nights), and salary structure.
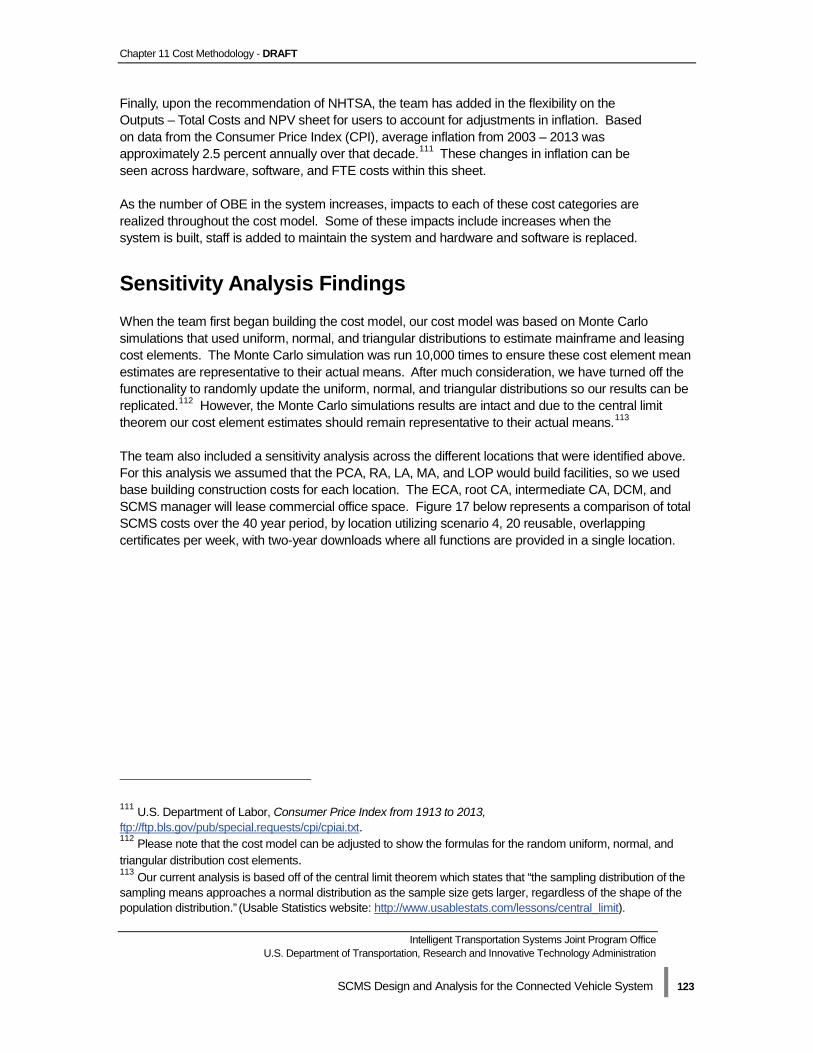
Chapter 11 Cost Methodology - DRAFT
Intelligent Transportation Systems Joint Program Office U.S. Department of Transportation, Research and Innovative Technology Administration
SCMS Design and Analysis for the Connected Vehicle System | 123
Finally, upon the recommendation of NHTSA, the team has added in the flexibility on the Outputs – Total Costs and NPV sheet for users to account for adjustments in inflation. Based on data from the Consumer Price Index (CPI), average inflation from 2003 – 2013 was approximately 2.5 percent annually over that decade.111 These changes in inflation can be seen across hardware, software, and FTE costs within this sheet. As the number of OBE in the system increases, impacts to each of these cost categories are realized throughout the cost model. Some of these impacts include increases when the system is built, staff is added to maintain the system and hardware and software is replaced.
Sensitivity Analysis Findings When the team first began building the cost model, our cost model was based on Monte Carlo simulations that used uniform, normal, and triangular distributions to estimate mainframe and leasing cost elements. The Monte Carlo simulation was run 10,000 times to ensure these cost element mean estimates are representative to their actual means. After much consideration, we have turned off the functionality to randomly update the uniform, normal, and triangular distributions so our results can be replicated.112 However, the Monte Carlo simulations results are intact and due to the central limit theorem our cost element estimates should remain representative to their actual means.113 The team also included a sensitivity analysis across the different locations that were identified above. For this analysis we assumed that the PCA, RA, LA, MA, and LOP would build facilities, so we used base building construction costs for each location. The ECA, root CA, intermediate CA, DCM, and SCMS manager will lease commercial office space. Figure 17 below represents a comparison of total SCMS costs over the 40 year period, by location utilizing scenario 4, 20 reusable, overlapping certificates per week, with two-year downloads where all functions are provided in a single location.
111 U.S. Department of Labor, Consumer Price Index from 1913 to 2013, ftp://ftp.bls.gov/pub/special.requests/cpi/cpiai.txt. 112 Please note that the cost model can be adjusted to show the formulas for the random uniform, normal, and triangular distribution cost elements. 113 Our current analysis is based off of the central limit theorem which states that “the sampling distribution of the sampling means approaches a normal distribution as the sample size gets larger, regardless of the shape of the population distribution.” (Usable Statistics website: http://www.usablestats.com/lessons/central_limit).
Chapter 11 Cost Methodology - DRAFT
Intelligent Transportation Systems Joint Program Office U.S. Department of Transportation, Research and Innovative Technology Administration
SCMS Design and Analysis for the Connected Vehicle System | 124
Figure 17. Comparison of Total Costs by Location: Scenario 4, 20 Certificates Per Week, Two-Year Downloads*
* The SCMS manager function is assumed to always be located in Washington, DC. Therefore the $27.1M in SCMS total costs is excluded. Finally we provided a preliminary analysis around the misbehavior rate. This analysis is preliminary since CAMP only recently began analyzing the specifications of the MA to define its processing needs and identify the processes for the CRL and global detection. For the analysis, the team considered three misbehavior rates: 0.5 percent, 0.1 percent, and 1 percent. Since the misbehavior rates have not been tied to any of the MA functionality described above in Chapter 9, the sensitivity analysis provided in the cost model does not have an impact at this time. As further specifications are made available from CAMP, the cost model should be updated to reflect impacts of the misbehavior rate.
Total Costs for SCMS Total costs for each of the SCMS functions were calculated to show the costs over the 40 years for which costs are estimated. The totals represented below in Figure 18 are obtained by utilizing scenario 4, 20 reusable, overlapping certificates per week, with two-year downloads for full deployment over the 40-year time period. The PCA has the highest cost due to the large amount of hardware that is needed to produce the certificates needed for each OBE. RA and LA costs are also high due to the heavy processing needs of these functions. As elements within the cost model change (i.e., changing the certificate download frequency from two years to three years, changing the number of locations), each of these costs change as well.
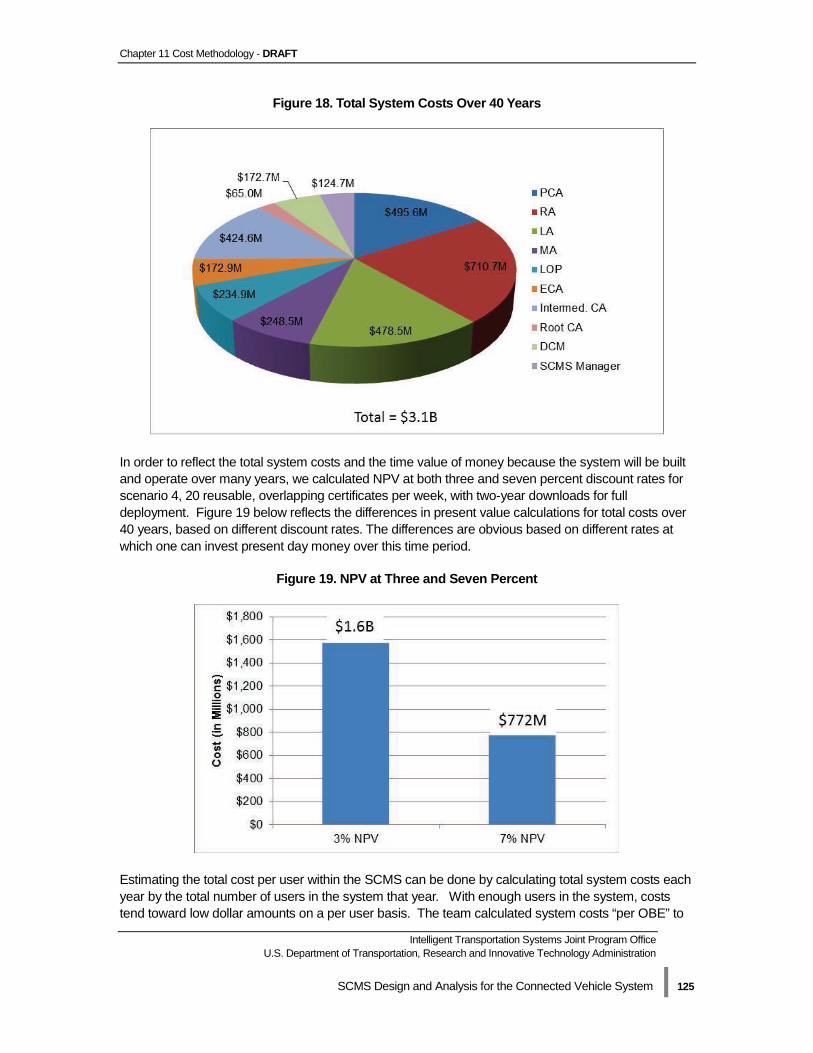
Chapter 11 Cost Methodology - DRAFT
Intelligent Transportation Systems Joint Program Office U.S. Department of Transportation, Research and Innovative Technology Administration
SCMS Design and Analysis for the Connected Vehicle System | 125
Figure 18. Total System Costs Over 40 Years
In order to reflect the total system costs and the time value of money because the system will be built and operate over many years, we calculated NPV at both three and seven percent discount rates for scenario 4, 20 reusable, overlapping certificates per week, with two-year downloads for full deployment. Figure 19 below reflects the differences in present value calculations for total costs over 40 years, based on different discount rates. The differences are obvious based on different rates at which one can invest present day money over this time period.
Figure 19. NPV at Three and Seven Percent
Estimating the total cost per user within the SCMS can be done by calculating total system costs each year by the total number of users in the system that year. With enough users in the system, costs tend toward low dollar amounts on a per user basis. The team calculated system costs “per OBE” to
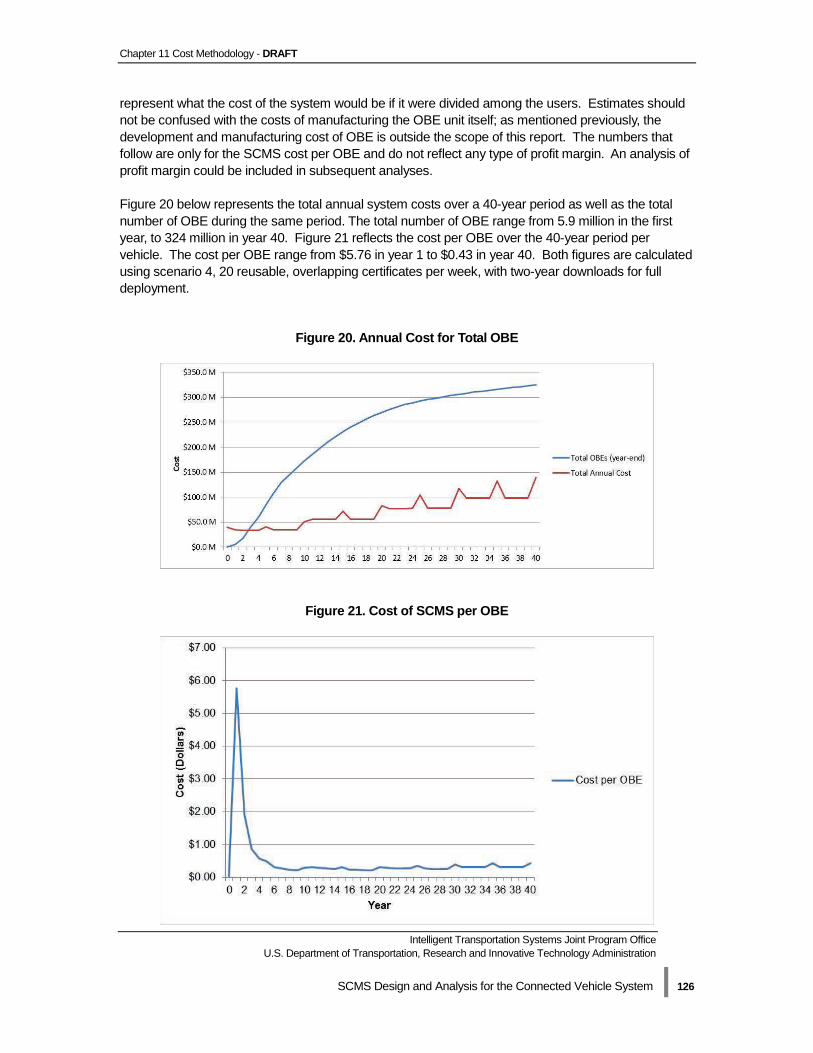
Chapter 11 Cost Methodology - DRAFT
Intelligent Transportation Systems Joint Program Office U.S. Department of Transportation, Research and Innovative Technology Administration
SCMS Design and Analysis for the Connected Vehicle System | 126
represent what the cost of the system would be if it were divided among the users. Estimates should not be confused with the costs of manufacturing the OBE unit itself; as mentioned previously, the development and manufacturing cost of OBE is outside the scope of this report. The numbers that follow are only for the SCMS cost per OBE and do not reflect any type of profit margin. An analysis of profit margin could be included in subsequent analyses. Figure 20 below represents the total annual system costs over a 40-year period as well as the total number of OBE during the same period. The total number of OBE range from 5.9 million in the first year, to 324 million in year 40. Figure 21 reflects the cost per OBE over the 40-year period per vehicle. The cost per OBE range from $5.76 in year 1 to $0.43 in year 40. Both figures are calculated using scenario 4, 20 reusable, overlapping certificates per week, with two-year downloads for full deployment.
Figure 20. Annual Cost for Total OBE
Figure 21. Cost of SCMS per OBE
Chapter 11 Cost Methodology - DRAFT
Intelligent Transportation Systems Joint Program Office U.S. Department of Transportation, Research and Innovative Technology Administration
SCMS Design and Analysis for the Connected Vehicle System | 127
SCMS Communications Costs
Currently, the costs of network communications are not included in these totals as they are outside the scope of this project. However, other projects (e.g., CDDS) analyzed these costs as part of their analysis. Choices about system wide and policy decisions will impact operations and costs of the various functions and network costs of SCMS and could be part of further analysis provided by these teams. Future analysis could provide cost estimates for misbehavior rates and its impact on costs to also include the impact the CRL has on costs.
Efficiencies and Cost Savings Cost estimations for the PKI system are driven primarily by certificate issuance requirements and the kind of computing power and resources necessary to support those requirements. Certain software, hardware, facilities, and resource costs cannot be avoided, regardless of organizational model, but they can be affected by sharing some resources and combining certain functions. As discussed previously, hardware is a high cost driver that is challenging to minimize due to the heavy computing requirements and need for separate systems for several functions. The costs of servers, HSMs, and memory are difficult to reduce under any organizational scenario. Regardless of organizational structure, processing and encryption requirements will remain the same. The PCA currently bears the greatest cost burden of all the functions, primarily due to high processing needs and FTE staff to perform its activities. Any time functions are collocated within CMEs, select facilities, equipment, and resources may be shared. Collocation of functions organizationally can even lead to the cross training of personnel across functions, as long as they adhere to the necessary controls and policies. For example, the industry model to which we refer throughout this report illustrates how multiple functions (noted in Figure 4 of Chapter 4) could be run by a single organization. This could support the possibility for these entities to share facilities and staff. Another way that savings can be realized is through the power of purchasing in bulk. The preceding estimates on the price of servers are given on a per unit basis without the application of a wholesale discount. It is not unreasonable to think that a discount of at least 25 percent on the cost of hardware could be achieved. A full realization of cost savings among different industry models would require additional analysis. As different ownership and operational models of the CMEs are explored, different groupings and stand-up of various entities and physical locations for them will also be explored. The discussion of which functions and their operations should be central or non-central will also impact this estimation. Future work could include various ownership and centralization scenarios as they impact the cost estimates, and also consider different geographic locations and numbers of physical locations for many of the non-central functions, and the impact of these differing scenarios on costs.

Chapter 11 Cost Methodology - DRAFT
Intelligent Transportation Systems Joint Program Office U.S. Department of Transportation, Research and Innovative Technology Administration
SCMS Design and Analysis for the Connected Vehicle System | 128
Industry Comparison The connected vehicle system will ultimately reach approximately 250 million users in-vehicle, and likely more with the inclusion of nomadic mobile devices. To serve such a large group of users effectively and efficiently, an appropriate level of administrative functionality, network infrastructure, and customer service must be achieved. While no existing PKI system can compare with the size and amount of data transactions that will be supported through the connected vehicle system, the wireless telecommunications (telecom) industry may be an appropriate comparison for gaining a sense of total system costs, based only on scale, infrastructure needs, and user volume. The team examined the U.S. wireless telecom industry in general and looked in more depth at three of the industry leaders: Verizon®114 Wireless (Verizon), AT&T®115 Inc. (AT&T), and Sprint®116 Nextel (Sprint), to develop a summary of industry financials. The wireless telecom industry realized $198.7 billion in revenue for the year 2011 from 322.9 million subscribers.117 This translates to an average of $615 in revenue per user. Three companies currently account for just over 80 percent of the market share: Verizon, AT&T, and Sprint.
• Verizon represents roughly 38 percent of the market. For the five years ending with 2011, Verizon averaged $57.4 billion in revenue, with an average subscriber base of 88.8 million, yielding average annual revenue per subscriber of $649.69 over that period.118
o Capital expenditures for the company have ranged from $7.2 billion to $9 billion per year over the last three years.119
• AT&T is a very large and diversified carrier, representing 30 percent of the market. For the five years ending with 2011, AT&T averaged $48.4 billion in revenue, with an average subscriber base of 86.2 million, yielding average annual revenue per subscriber of $561.71 over that period.120
o Capital expenditures for the company have ranged from $7.9 billion to $9.6 billion per year over the last three years.121
• Sprint has the smallest market share of the three, with 14 percent. For the five years ending with 2011, Sprint averaged $27.9 billion in revenue, with an average subscriber base of 43.9 million, yielding average annual revenue per subscriber of $635.85 over that period.122
o Capital expenditures for the company have ranged from $1.6 billion to $6.3 annually over the last five years.123
114 Verizon® is a registered trademark of Verizon Trademark Services, LLC. 115 AT&T® is a registered trademark of AT&T Intellectual Property, Inc. 116 Sprint® is a registered trademark of Sprint Communications Company L.P. U.S. Telecom, Inc. 117 Dale Schmidt, “IBISWorld Industry Report 51332: Wireless Telecommunications Carriers in the US,” 2012. 118 Ibid. 119 Verizon Wireless. 2011 10-K Report. Retrieved July 3, 2012 from the SEC online Edgar database. 120 Dale Schmidt, IBISWorld Industry Report. 121 AT&T Inc. 2011 Annual Report. Retrieved July 3, 2012 from the SEC online Edgar database. 122 Dale Schmidt, “IBISWorld Industry Report 51332: Wireless Telecommunications Carriers in the US.” 123 Sprint Nextel. 2011 10-K Report. Retrieved July 3, 2012 from the SEC online Edgar database.
Chapter 11 Cost Methodology - DRAFT
Intelligent Transportation Systems Joint Program Office U.S. Department of Transportation, Research and Innovative Technology Administration
SCMS Design and Analysis for the Connected Vehicle System | 129
Although the systems, their intended usage, and their operations are not completely analogous, this comparison can yield some insights into the willingness of users to pay for valued services (on average up to $50 per month), and the extent of capital, operating, marketing, and other costs for a nationwide infrastructure and user services. Additional research into this, and other potentially comparative industries, to understand cost categories and expenses needs to be conducted to aid in any commercial feasibility study for the connected vehicle system.
Costs Summary In addition to the costs referenced throughout this chapter, there are other costs that still need to be developed based on technical design specifications that are in the process of being established. These costs include any further changes to misbehavior (the MA in general) and determining the number of locations for each of the functions. Depending on the final specifications chosen, these costs could have a large impact on the total costs of the system. While the estimates provided in this report are preliminary and are based on current technical design specifications, they are informative in thinking about decisions related to policy and standing up SCMS organizations. The establishment of such a unique system will require the procurement of large amounts of equipment, large capital investments in facilities, and the retention of a specialized, dedicated staff. The main cost drivers are hardware and software requirements, personnel needs, and associated facilities, depending on the function, and are in large part determined by the number of certificates in the system at any given time. Additional areas for consideration are the physical locations of the organizational components, the ownership structure of each function, and whether the functions are central or non-central. Analysis of these considerations and others outlined within this chapter will allow the system to provide privacy of its users and secure communications between vehicles while gaining user trust.
Part V Outstanding Issues - DRAFT
Intelligent Transportation Systems Joint Program Office U.S. Department of Transportation, Research and Innovative Technology Administration
SCMS Design and Analysis for the Connected Vehicle System | 130
Part V Outstanding Issues

Chapter 12 Topics for Future Consideration - DRAFT
Intelligent Transportation Systems Joint Program Office U.S. Department of Transportation, Research and Innovative Technology Administration
SCMS Design and Analysis for the Connected Vehicle System | 131
Chapter 12 Topics for Future Consideration
The technical teams developing the design for the SCMS have made significant progress to identify refinements of functions, numbers of certificates, and processes by which certificates are produced. These specifications enabled the Booz Allen team to provide analyses of technical operations, industry and organizational governance models, privacy implications and misbehavior investigation and revocation processes, and costs. As of the writing of this report, the system is in the early stages of design and development and therefore it will likely be years before implementation begins. Nonetheless, the team’s analyses revealed several areas that still require attention before implementation plans are developed. Some of the areas that require more significant analyses include: Owners and Operators: In Chapter 4 we reviewed governance options in general and discussed in more depth the scenario where the SCMS is privately owned and operated. The underlying question of who will own and operate the SCMS CMEs is still outstanding and is critical to answer before implementation, as the industry may rely on self-governance. A separate analysis needs to be completed to determine:
• Who is eligible to be an owner/operator of SCMS functions? • Will an owner/operator of a non-central function also be allowed to be an individual
owner/operator of a central function? • How many locations of each function will exist? This is likely dependent on processing
needs, redundancy needs, and ownership structure. • In what geographic location(s) will each function reside?
Bootstrap Process: Since the bootstrap process establishes the initial connection between OBE and the SCMS, determining where this process will occur is a critical question. Additional questions about splitting the “initialization” and “enrollment” processes should be considered as well. We outlined two different options for when and where bootstrapping could occur: (1) at time of OBE manufacture and (2) at time of vehicle assembly. There are benefits and drawbacks to each. After a conversation with an auto manufacturer, it became clear that completing the bootstrap process at some point on the vehicle production line would require a re-engineering of the manufacturing process and could increase costs for auto manufacturers. Executing bootstrap at the OBE manufacturer could be integrated as the OBE production line is designed in the future, but the risk of loss of manufactured electronics between the shipping and storage process can result in enrollment certificates being accessible to MUs. There are other benefits and drawbacks that the team was not able to explore during this analysis. Further discussions with auto manufacturers, as well as additional technical and security analyses, are necessary to understand the full set of implications of the different options for the bootstrap process. User or Vehicle Information Linking: The options for how this process will take place in the system is dependent on the type of user or vehicle information that is chosen by the system owners/operators
Chapter 12 Topics for Future Consideration - DRAFT
Intelligent Transportation Systems Joint Program Office U.S. Department of Transportation, Research and Innovative Technology Administration
SCMS Design and Analysis for the Connected Vehicle System | 132
and/or USDOT. The potential need for linkage of security credentials to user or vehicle information is a policy decision not yet made by USDOT and/or the system owners/operators; the decision is contingent upon whether USDOT and/or the system owners/operators have legitimate business needs for such linkage. Without any sort of user or vehicle information in the system, it is impossible to link back to malfeasant users or sources of technical malfunction. Any type of user or vehicle information that is collected could be equal to (or less than) what is already collected by state departments of motor vehicles. Using an existing system could alleviate concerns with standing up a new collection database and may be less costly. Additional research regarding technical and cost considerations of integrating the bootstrap process would need to be conducted to further analyze this possibility. Decision-makers will also need to decide what type of user or vehicle information will be collected (if any) and how it is collected during the bootstrap process. Determining at what point during the bootstrap process this information could be collected (i.e., at the time of initialization, at the dealership) should be a priority. Processes for collecting, securely maintaining, and utilizing this information will be required to ensure security of the system. Technical, Physical, and Procedural Controls: Technical, physical, and procedural controls have been identified throughout the team’s analyses as an integral part of standing up the SCMS. Utilizing controls could potentially allow all non-central functions to be run in one or more CMEs. Controls make this possible by supporting the needed security and privacy of functions regardless of where they are aligned organizationally. The question of who will set and enforce the controls still remains. CAMP, VIIC, and the Booz Allen team agree that the SCMS manager will likely be responsible for setting practices and standards for all CMEs and ensuring compliance with any policies and regulations that apply to the system. As the owners/operators of the SCMS manager are identified and as decision-makers consider who will have the ultimate responsibility of setting and enforcing these controls, there are a few other topics that need to be addressed prior to implementation. These include the FIPS security level (i.e., levels of assurance) and auditing standards, practices, and enforcement. All controls should be clearly outlined in the SCMS PKI CP. If any policies that may guide the SCMS are loosely enforced and controls are ineffective, the entire trust relationship upon which the SCMS is built could collapse due to security breaches or attacks from MU’s. Therefore, it is critical that controls are included as part of the implementation of the SCMS. Communication among SCMS Functions (or CMEs): It is important to ensure that a communication network, presumably a hardline, is in place with sufficient capacity to provide for the constant data transfer and communications that will be needed between and among SCMS functions. There are many unknowns that impact this issue, including the number and location of owners/operators, the CMEs they run and which functions are included in their CMEs, and the availability of fiber optic bandwidth. The underlying question is how to account for the telecommunications structure within the SCMS and what it costs. This issue should be addressed in parallel with other cost analyses at similar levels of depth and may require an analysis of the fiber optic backbone beyond publicly available information. Comprehensive Risk Analysis: As with any large, complex, technical system, several risks exist for the SCMS. Several of these risks have been studied in various projects, including the one presented in this report. However, no comprehensive compilation and analysis of the full universe of threats and risks to the system has been completed to date. We believe bringing all of these analyses together for

Chapter 12 Topics for Future Consideration - DRAFT
Intelligent Transportation Systems Joint Program Office U.S. Department of Transportation, Research and Innovative Technology Administration
SCMS Design and Analysis for the Connected Vehicle System | 133
a more comprehensive view of risks associated with the SCMS would be valuable to decision makers. The risks or threats that may contribute to such a report could include:
• Risks to privacy, such as those we explored in Chapter 8. Additional simulations of more scenarios to attempt an estimate of the probability and impact of attacks on the system would be beneficial.
• Risks to security presented by either internal bad actors or external hackers. • Risk to effective operations as presented by lack of ability to detect misbehavior and/or
disseminate the identifiers of those misbehavers to users via the CRL. • Risk to the integrity of the system from not identifying bad actors or not being able to
effectively remove them from the system. Additionally, the following areas should also be analyzed prior to implementation:
• Frequency of certificate download: Key issue for full deployment design as it significantly impacts that number of certificates that need to be produced. At this point, we understand that the vision is for one-year, two-year, or three-year batches, but these options need to be explored further considering the potential impacts on CRL size, among other technical design implications.
• OBE end of life: What will be the policies associated with destruction or return of OBE? • HSM vs. CPU: Initial discussions about the possibility of using non-HSM servers and
processors to perform some of the functions that the HSMs are being estimated to perform now have taken place. What are the implications for the SCMS (i.e., lag time of processors, ability to be flexible if needed to produce certificates)?
• V2I and V2X expansion: Although beyond the scope of this report, it is important to understand the plans and expectations for expansion beyond V2V as other users, security requirements, and infrastructure will have to be part of the trusted system. How that will happen is a multi-faceted topic that should be given significant attention. It may be less expensive and require less reconfiguration if the plans for system expansion are built into the initial deployment of the system, however, this would require additional analysis.
• Disaster recovery plan: For large-scale mission critical systems such as the SCMS, a disaster recovery plan is necessary to define the actions to be taken in the event of a crisis. A sound disaster recovery plan enables an organization to respond to emergency situations rapidly by establishing the priority of response activities and providing guidance to complete those activities. The goal is to restore mission critical systems to normal operating levels as soon as possible. A disaster recovery plan for the SCMS needs to include specifications for backup systems for all system components, alternative power sources, and specialized personnel for operations of disaster recovery implementation, among other preparatory measures.
Finally, as CAMP begins its development and analysis of the misbehavior detection and management processes, we acknowledge the need to further analyze the organizational, policy, and cost implications of the MA function, specifically around the investigation process. In Chapter 9 we include a detailed discussion of the current concept of misbehavior detection and management, along with a detailed list of outstanding organizational, policy, and technical questions. With new analyses from CAMP, these concepts may change. The cost model also includes some high-level estimates based on the conceptual information that exists now and can easily be adjusted once new information is received. As we have highlighted throughout this report, misbehavior detection and management is a central element of any PKI system, and one of the most important elements of the connected vehicle PKI in particular because it helps users trust in the safety, security, and reliability of the system.

Chapter 12 Topics for Future Consideration - DRAFT
Intelligent Transportation Systems Joint Program Office U.S. Department of Transportation, Research and Innovative Technology Administration
SCMS Design and Analysis for the Connected Vehicle System | 134
Success of the connected vehicle system will be measured, at least in part, by the reaction of users. The greatest safety benefits will be realized when a majority of (if not all) drivers on the road are integrated into the system. Through additional analysis by technical teams, the areas outlined above should be further explored to ensure a strong and secure SCMS. It is important also to consider when decisions in these areas should be made, relative to initial deployment and full deployment, as different implications exist with both options. As new information is available, updates to the design should be made and processes and policies can then begin to be developed.
Appendix A Definition of Terms - DRAFT
Intelligent Transportation Systems Joint Program Office U.S. Department of Transportation, Research and Innovative Technology Administration
SCMS Design and Analysis for the Connected Vehicle System | 135
Appendix A Definition of Terms
Basic Safety Message (BSM)
The outgoing message sent by a vehicle that communicates information and data about its current state to neighboring vehicles. That information or data is used by V2V safety applications in the neighboring vehicles to warn users of crash imminent situations.
Bootstrap Functions
The functions that carry out the bootstrap process, including the ECA, DCM, and the certification lab. The Booz Allen team considers these functions to be separate from the “pseudonym functions.”
Butterfly Keys A set of public keys related to a single private key generated by the RA and
PCA. There are two: one for signing and one for encryption. The signing keys are used to validate BSMs signed by the OBE. The encryption keys are used to encrypt the certificates for transmission back to the OBE.
Caterpillar Keys A pair of public and private key pairs generated by the OBE. There are two
per set of OBE certificates requested. One pair is used for signing and one pair is used for encrypting. The public parts are sent to the RA where each is expanded into a set of keys that are sent to the PCA as part of each certificate request.
Certificate Authority (CA)
In PKI systems, the CA is a trusted component authorized to create, sign, and issue public key certificates.
Certificate Identifier
A unique identifier in each certificate calculated from the linkage values specific to that certificate provided by the LAs.
Certificate Management Entity (CME)
The certificate issued to an SCMS function (e.g., PCA, RA, LA) that authenticates its trustworthiness to all other entities and users in the system.
Certificate Policy (CP)
The document that describes the roles and responsibilities for implementing a PKI, the rules governing how certificates are obtained, the technical requirements for generation and protection of private keys and certificates, and the requirements for periodic compliance audits and audit records.
Certificate Revocation List (CRL)
A list of certificate identifiers that the MA identifies to be misbehaving due to technical malfunction or user malfeasance.
Appendix A Definition of Terms - DRAFT
Intelligent Transportation Systems Joint Program Office U.S. Department of Transportation, Research and Innovative Technology Administration
SCMS Design and Analysis for the Connected Vehicle System | 136
Certificate Revocation List Broadcast (CRL Broadcast)
An activity within the MA, the CRL broadcast is the function that makes the CRL available to devices via broadcast.
Certificate Revocation List Generator (CRL Generator)
An activity within the MA, the CRL generator is the function that creates and publishes CRLs so that other system components can access and download them.
Certificate Revocation List Store (CRL Store)
An activity within the MA, the location on the network where the CRL is stored and distributed upon request.
Certification Lab A function that tests devices (e.g., OBE, ASDs) and tells the ECA that units of
a particular type or class are eligible for enrollment certificates. Note that there may be additional types of certification labs, outside the purview of the SCMS, that will perform tests of batches of devices for performance and compliance with federal or industry standards.
Cocoon Keys A pair of public and private key sets generated by the RA from the caterpillar
keys passed from the OBE. The purpose is to expand the caterpillar key into something the PCA can use to return information that only the OBE can read.
Connected Vehicle Program
The USDOT research program focused on the combination of applications, services, and systems necessary to provide safety, mobility, and environmental data to users.
Connected Vehicle System
The deployed system of connected vehicle devices, infrastructure, and back-end functions that will enable safety, mobility, and environment applications to be used by transportation system users.
Cryptography The combination of mathematical algorithms and computer science intended
to protect users, networks, and messages sent throughout a network by encrypting messages. Only authorized users of the network have the necessary information or credentials to access the data within the network.
Dedicated Short Range Communications (DSRC or WAVE)
The one-way or two-way short- to medium-range wireless communication channels specifically designed for automotive use and a corresponding set of protocols and standards. DSRC is referred to as WAVE in other literature, which stands for Wireless Communication in Vehicular Environments.
Device Configuration Manager (DCM)
A function that is critical to the activation of devices. The DCM is responsible for providing end-user devices and internal SCMS functions with access to new information, such as updates to the CME certificates of one or more authorities, and relaying policy decisions or technical guidelines issued by the SCMS manager.

Appendix A Definition of Terms - DRAFT
Intelligent Transportation Systems Joint Program Office U.S. Department of Transportation, Research and Innovative Technology Administration
SCMS Design and Analysis for the Connected Vehicle System | 137
Elliptic Curve Cryptography (ECC)
A public key cryptography method that utilizes points found within a curve group to create keys. The point selected from the curve is multiplied by a random number numerous times.
Enrollment Certificate
The certificate used to demonstrate the trustworthiness of the OBE. The enrollment certificate authenticates the device to be part of the SCMS and thus receive a batch of pseudonym certificates (also known as “short-term certificates”). Enrollment certificates are distributed by the ECA.
Enrollment Certificate Authority (ECA)
The function that activates or initializes the OBE by issuing an enrollment certificate.
Global Detection An activity within the MA which collects misbehavior reports from the OBE,
investigates (through processes that have not yet been defined) to detect when messages are not plausible or when there is potential malfunction or malfeasance within the system, and decides which devices should be revoked.
Hardware Security Module (HSM)
A hardware component that provides a layer of security that consistently protects communications, credentials, and requests by safeguarding and facilitating procedures for encoding, decoding, verification, and electronic signature. It also accelerates the number of cryptographic transactions per second.
Intermediate Certificate Authority (Intermediate CA)
A CA that issues certificates for all CAs below it, and that is not a root CA. Its value is that it shields the root CA from traffic and attacks. It may also allow for greater flexibility in permission granting.
Internal Blacklist Manager (IBLM)
An activity within the MA that creates entries for the internal blacklist for the system. The IBLM works with the RA(s), and possibly the request coordination function, to provide updates on the devices that should not be granted certificates. The internal blacklist itself is maintained in the system by the RA.
Linkage Authority (LA)
The function responsible for generation and creation of linkage values, which are added to certificates to achieve efficient revocation.
Location Obscurer Proxy (LOP)
A networking entity which acts as a pass-through function for communication between the OBE and the SCMS. The LOP removes the location of the requesting device from the messages sent to SCMS functions, such as the RA and MA. Once the MA specifications are complete, the LOP may also be responsible for shuffling misbehavior reports.
Misbehavior The reference to technical errors, device malfunction, and human
malfeasance that have a negative impact on the effectiveness of the SCMS.
Appendix A Definition of Terms - DRAFT
Intelligent Transportation Systems Joint Program Office U.S. Department of Transportation, Research and Innovative Technology Administration
SCMS Design and Analysis for the Connected Vehicle System | 138
Misbehavior Authority (MA)
The SCMS function responsible for detecting, tracking, and managing potential threats to the SCMS and connected vehicle system. The MA is also responsible for CRL creation, management, and publishing through the CRL generator activity. Other activities within the MA include CRL store, CRL broadcast, and IBLM.
On Board Equipment (OBE)
The user equipment that provides an interface to vehicular sensors for safety measures, as well as a wireless communication interface to the LOP for SCMS processes.
Personally Identifiable Information (PII)
Any form of information that can be used to identify, contact, or locate an individual person, directly or indirectly.
Point Multiplication The operation of successively adding a point along an elliptic curve to itself
repeatedly. It is used in elliptic curve cryptography as a means of producing a key, performing a signing operation, or encrypting an object.
Private Key In public key encryption, the key held secretly by the subject of a PKI
certificate that contains a related public key. This key is not made available to any other entity. In signing operations, the private key is used for encryption and the public key is used for decryption. In encryption operations, the opposite is true.
Pseudonym Certificate
The short-term digital certificate used in V2V safety message exchange to indicate to the receiver that the sender is trustworthy. The OBE downloads and stores batches of pseudonym certificates. In this report, these certificates are referred to as “short-term” certificates.
Public Key Infrastructure (PKI)
A set of hardware, software, people, policies, and procedures needed to create, manage, distribute, use, store, and revoke digital certificates. PKI has been chosen as the mechanism to provide integrity and authentication within the connected vehicle system. This system creates and manages digital certificates that bind an identity to its public key to certify the sources of the messages. PKI is the foundation of the SCMS technical design.
Public Key In public key encryption, the public key is the counterpart to the corresponding
private key (which is not distributed to anyone) and is used by relying parties to verify possession of the private key. In signing operations, the private key is used for encryption and the public key is used for decryption. In encryption operations, the opposite is true.
Registration Authority (RA)
The function responsible for certificate batching and issuance and cocooned key generation. In many cases this function is an intermediary between the PCA and other functions, as well as between the OBE and the PCA. At this point in time, it is believed that the RA will also create the internal blacklist of bad enrollment certificates.
Appendix A Definition of Terms - DRAFT
Intelligent Transportation Systems Joint Program Office U.S. Department of Transportation, Research and Innovative Technology Administration
SCMS Design and Analysis for the Connected Vehicle System | 139
Request Coordination
A functional element that prevents an OBE from receiving multiple batches of certificates from different RAs during a given time period by coordinating OBE requests among RAs. The technical processes behind this function are still under development.
Roadside Equipment (RSE)
An infrastructure node that serves as an intermediary in V2I two-way communications between devices (e.g., OBE, ASDs) and the SCMS. RSE may also send its own messages to devices.
Root Certificate Authority (Root CA)
The master CA that provides the signatures on the certificates for its subsidiary CAs. The root CA possesses a self-signed certificate that contains its own public key to differentiate itself from other CAs.
Security Credentials Management System (SCMS)
The set of organizations that house the various PKI functions necessary for executing certificate management processes.
Security Credentials Management System Manager (SCMS Manager)
A function responsible for setting practices and standards for all CMEs. The SCMS manager is tasked with overseeing the operation of all SCMS functions to ensure compliance in accordance with policies and regulations.
Server Farm A collection of computer servers or processors maintained to accomplish
computational needs associated with key generation, certificate production, signing, verification, encryption, and data storage.
Sniffer A listening device that can legitimately or illegitimately capture data being
transmitted through a network. Trust Distribution The way that the root CA allows for other SCMS functions to sign certificates
and authorize users to participate in the system. Rules regarding trust distribution would be specified in the SCMS CP when it is developed.
Trust Management The process of establishing and managing trust within the PKI system and the
associated procedures, policies, and technical controls. Trust distribution and trust store management are components of trust management.
Trust Store Management
A process that provides procedures to system components and devices to import and edit certificates trusted by the system for validation of a digital signature.
Vehicle-to- Device (V2X)
The wireless communication exchange of messages and data between vehicles, infrastructure, and capable nomadic devices within the connected vehicle system.

Appendix A Definition of Terms - DRAFT
Intelligent Transportation Systems Joint Program Office U.S. Department of Transportation, Research and Innovative Technology Administration
SCMS Design and Analysis for the Connected Vehicle System | 140
Vehicle-to-Infrastructure (V2I)
The wireless exchange of critical safety and operational data between vehicles and highway infrastructure, intended primarily to avoid motor vehicle accidents but also to enable a wide range of other safety, mobility, and environmental benefits.
Vehicle-to-Vehicle (V2V)
A dynamic wireless exchange of data between vehicles in close proximity that offers the opportunity for significant safety improvements.
X.509 Certificate In cryptography, X.509 is an International Telecommunications Union
Telecommunication Standardization Sector (ITU-T) standard for public key certificates and attribute certificates. This international standard defines a framework for how certificates are formatted, revoked, and managed, among other things.124
1609.2 Certificate A type of public key certificate developed by IEEE that is planned to be used
for the connected vehicle environment PKI system.
124 ITU-T, X.509 website: http://www.itu.int/ITU-T/recommendations/rec.aspx?rec=X.509.
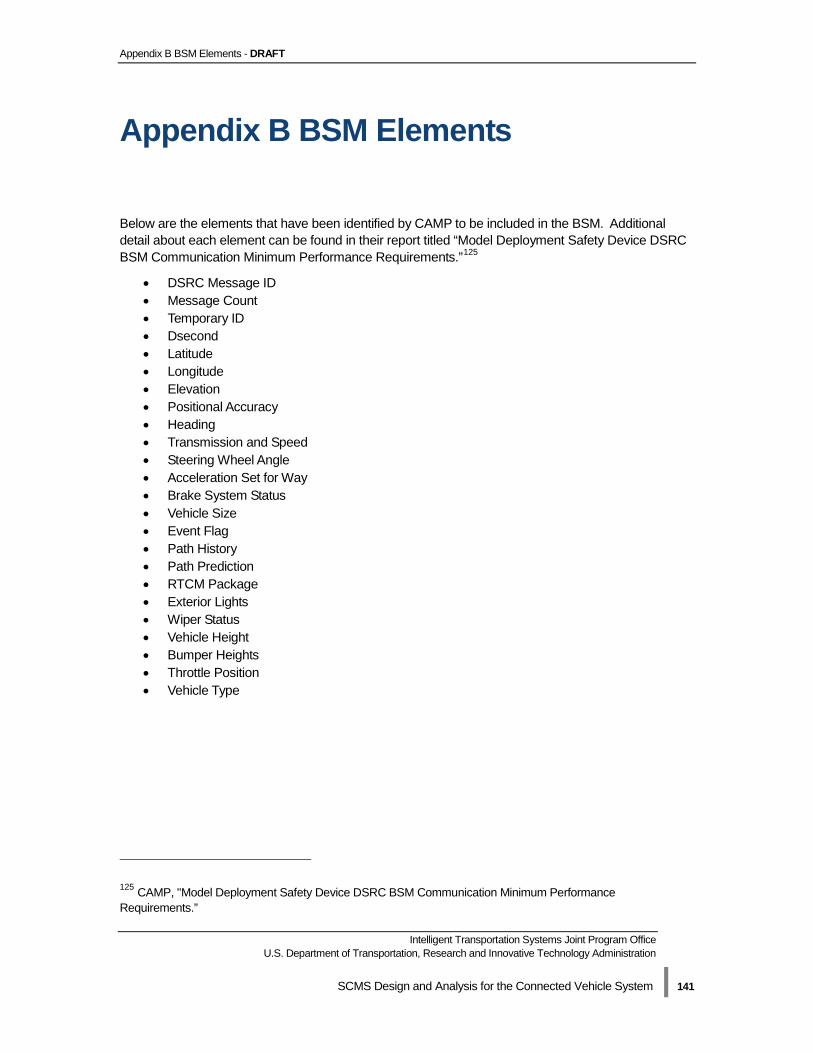
Appendix B BSM Elements - DRAFT
Intelligent Transportation Systems Joint Program Office U.S. Department of Transportation, Research and Innovative Technology Administration
SCMS Design and Analysis for the Connected Vehicle System | 141
Appendix B BSM Elements
Below are the elements that have been identified by CAMP to be included in the BSM. Additional detail about each element can be found in their report titled “Model Deployment Safety Device DSRC BSM Communication Minimum Performance Requirements.”125
• DSRC Message ID • Message Count • Temporary ID • Dsecond • Latitude • Longitude • Elevation • Positional Accuracy • Heading • Transmission and Speed • Steering Wheel Angle • Acceleration Set for Way • Brake System Status • Vehicle Size • Event Flag • Path History • Path Prediction • RTCM Package • Exterior Lights • Wiper Status • Vehicle Height • Bumper Heights • Throttle Position • Vehicle Type
125 CAMP, "Model Deployment Safety Device DSRC BSM Communication Minimum Performance Requirements.”
Appendix C NHTSA Fleet Roll-Out Scenarios - DRAFT
Intelligent Transportation Systems Joint Program Office U.S. Department of Transportation, Research and Innovative Technology Administration
SCMS Design and Analysis for the Connected Vehicle System | 142
Appendix C NHTSA Fleet Roll-Out Scenarios
This Appendix includes the four scenarios that were provided from NHTSA. These scenarios represent different penetration rates of both new vehicle and ASDs as outlined in Chapter 10. All scenarios follow the same assumptions:
• The fleet model is a projection based on historic Polk registration data, vehicle sales, and NHTSA-developed scrappage schedule.
• The scrappage schedule is derived from Polk registration data. • Scrappage is assumed to be unaffected by the presence or absence of OBE and ASDs. • For simplicity, there is no distinction between calendar year and model year.
Scenario tables begin on the following page.
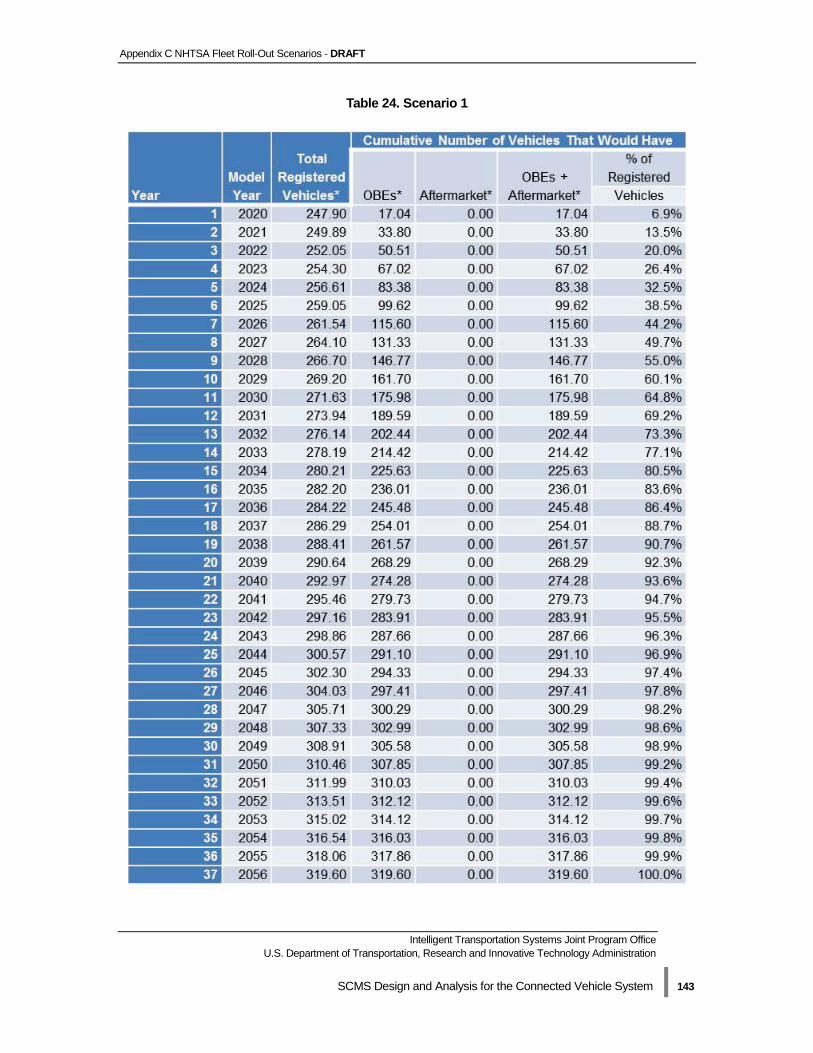
Appendix C NHTSA Fleet Roll-Out Scenarios - DRAFT
Intelligent Transportation Systems Joint Program Office U.S. Department of Transportation, Research and Innovative Technology Administration
SCMS Design and Analysis for the Connected Vehicle System | 143
Table 24. Scenario 1
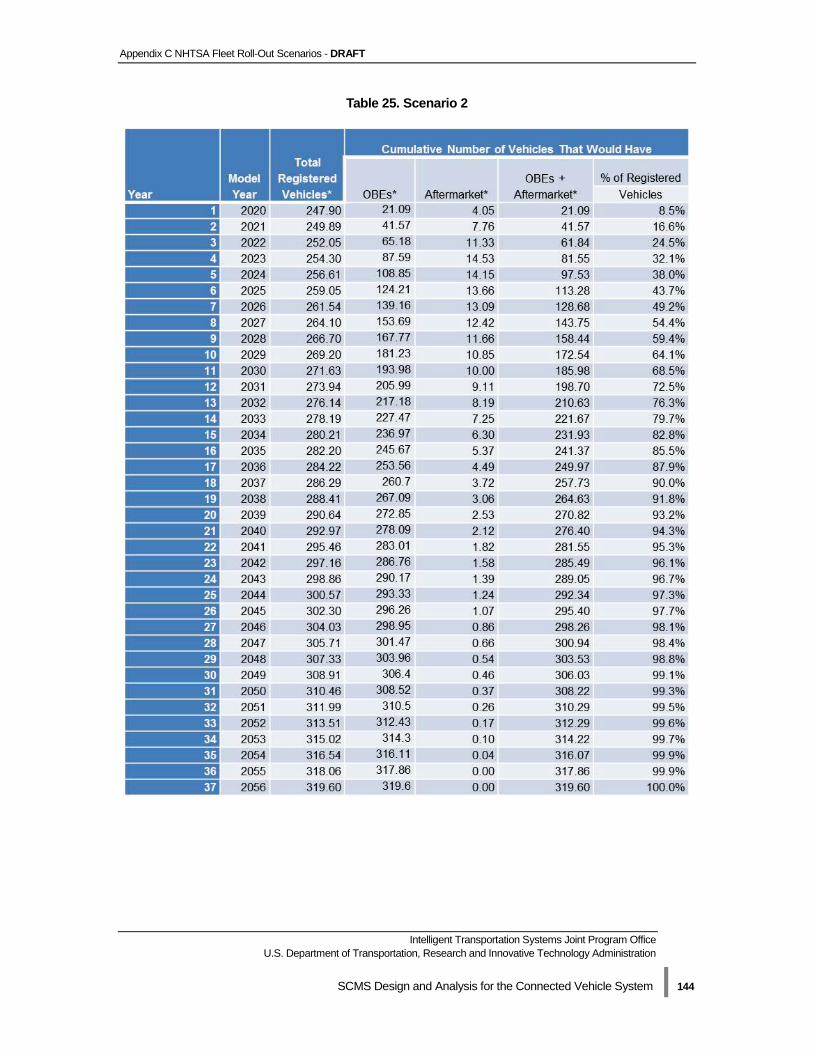
Appendix C NHTSA Fleet Roll-Out Scenarios - DRAFT
Intelligent Transportation Systems Joint Program Office U.S. Department of Transportation, Research and Innovative Technology Administration
SCMS Design and Analysis for the Connected Vehicle System | 144
Table 25. Scenario 2
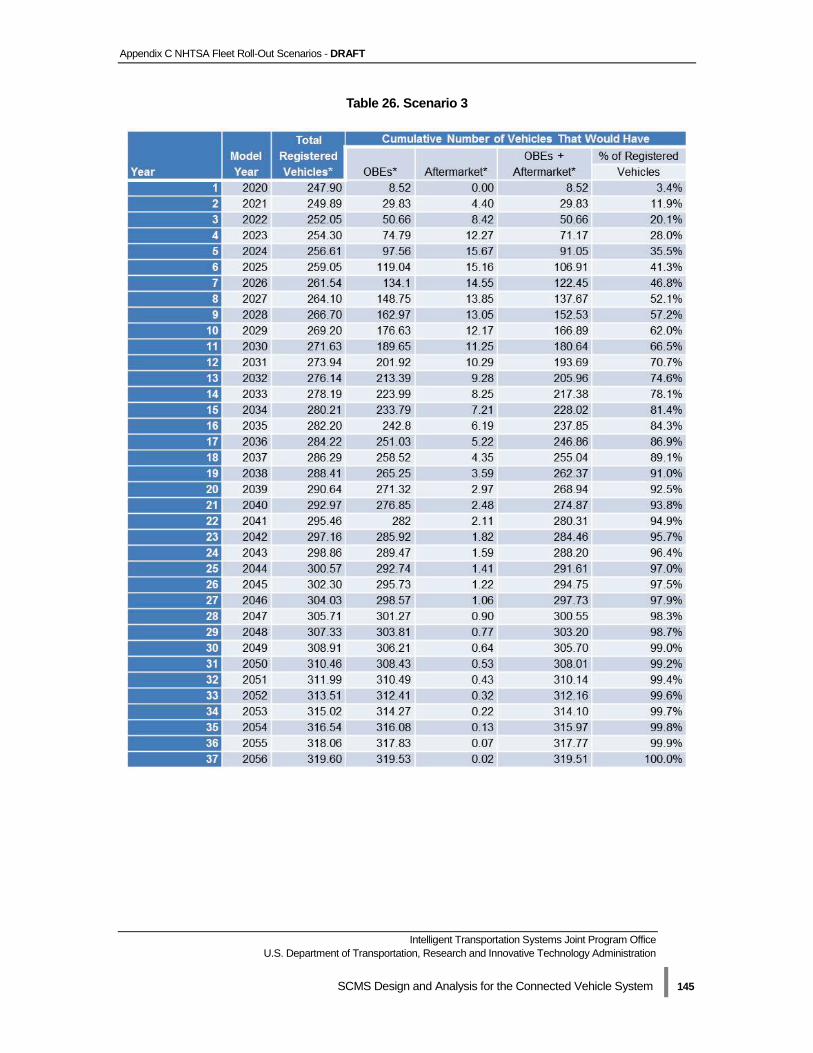
Appendix C NHTSA Fleet Roll-Out Scenarios - DRAFT
Intelligent Transportation Systems Joint Program Office U.S. Department of Transportation, Research and Innovative Technology Administration
SCMS Design and Analysis for the Connected Vehicle System | 145
Table 26. Scenario 3
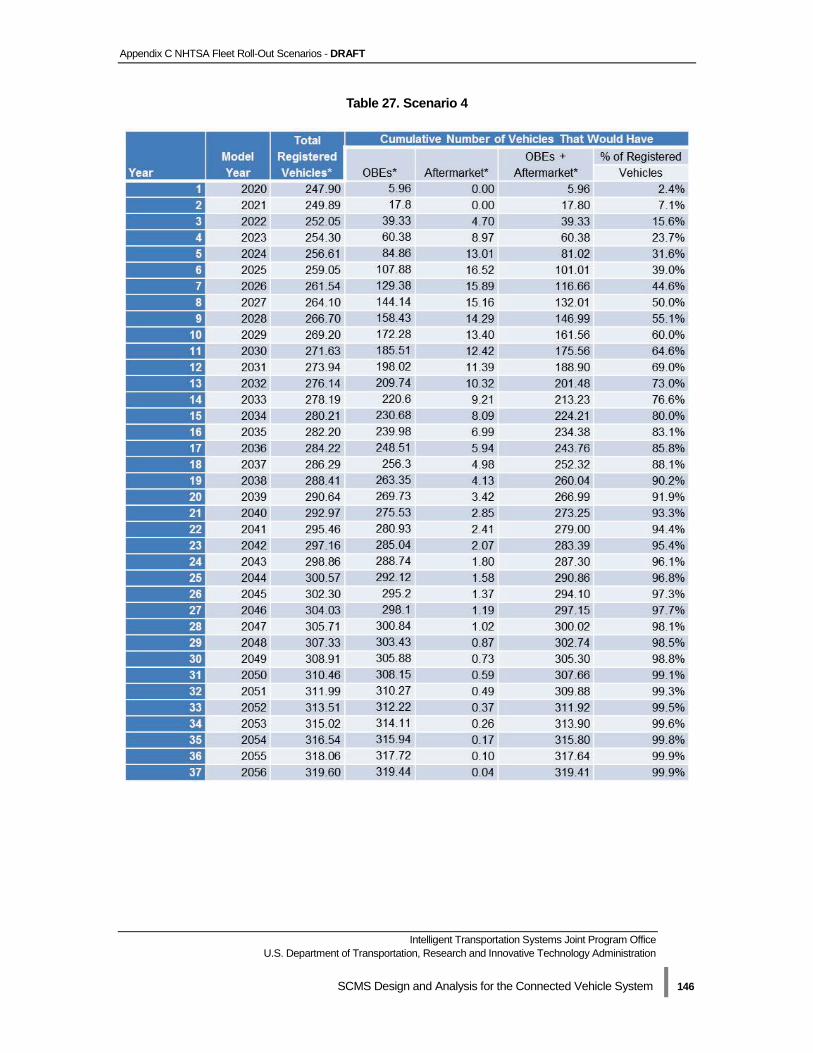
Appendix C NHTSA Fleet Roll-Out Scenarios - DRAFT
Intelligent Transportation Systems Joint Program Office U.S. Department of Transportation, Research and Innovative Technology Administration
SCMS Design and Analysis for the Connected Vehicle System | 146
Table 27. Scenario 4
Appendix D Detailed SCMS Costs - DRAFT
Intelligent Transportation Systems Joint Program Office U.S. Department of Transportation, Research and Innovative Technology Administration
SCMS Design and Analysis for the Connected Vehicle System | 147
Appendix D Detailed SCMS Costs
The content of this Appendix was finalized in May 2013. Appendix D includes two sets of tables. The first set of tables reflects the four scenarios that were provided from the National Highway Traffic Safety Administration (NHTSA). As shown below in Tables 28-31, these NHTSA scenarios represent different penetration rates of both new vehicles and after-market devices, referred to as “after-market”, (if applicable) over a 37-year period. The difference between the scenarios can be seen in the “Percent of Registered Vehicles” column where the total percentage of vehicles equipped for each year is reflected. All scenarios used the same assumptions:
• Fleet model is a projection based on historic Polk®126 registration data, vehicle sales, and NHTSA developed scrappage schedule
• Scrappage schedule is derived from Polk registration data • Scrappage are assumed to be unaffected by the presence or absence of On Board
Equipment (OBE) and after-market devices • For simplicity, there is no distinction between calendar year and model year
The second set of tables reflects total costs of the Security Credentials Management System (SCMS) using different combinations of the NHTSA scenarios, Crash Avoidance Metrics Partnership (CAMP) Option 2 (20 certificates per week), and different frequency of certificate downloads (i.e., yearly, every two years, or every three years) over a 40-year period. The NHTSA fleet estimates were extrapolated to 40 years to allow for calculations of hardware and software refresh every five years and new facility build-out every 10 years. Tables 32-55 reflect the following:
• Tables 32-43 Total System Costs • Tables 44-55: Costs Per OBE
Figures placed within the second set of tables reflect the following:
• Figure 22 reflects total system costs based on Net Present Value (NPV) calculations using both three and seven percent discount rates.
• Figure 23 reflects initial and annual facility costs across all SCMS functions. • Figure 24 reflects the annual system cost per OBE based on the number of OBE in the
system in a particular year. • Figure 25 reflects the total system cost per OBE.
Calculations in these tables and figures are derived from the ‘BAH Cost Model for CMEs_FINAL_12_27_13’, should be considered high level, and are based on technical designs available at the time of the estimate.
126 Polk® is a registered trademark of R.L. Polk & Co.
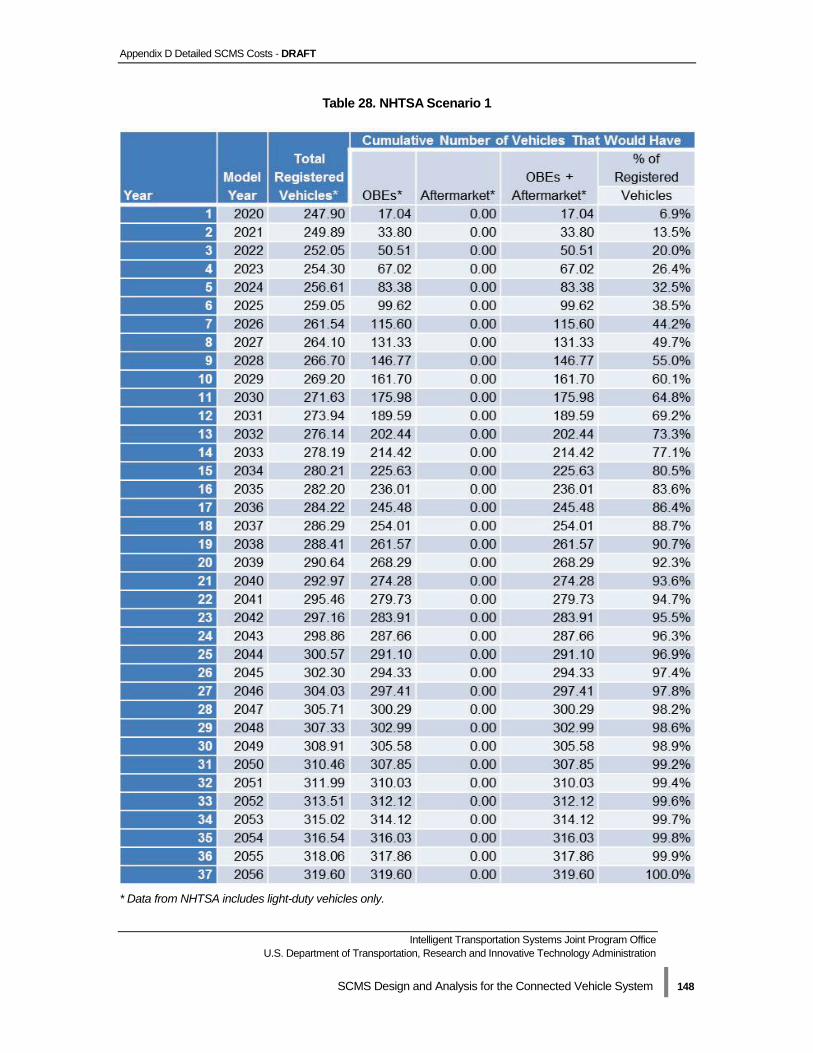
Appendix D Detailed SCMS Costs - DRAFT
Intelligent Transportation Systems Joint Program Office U.S. Department of Transportation, Research and Innovative Technology Administration
SCMS Design and Analysis for the Connected Vehicle System | 148
Table 28. NHTSA Scenario 1
* Data from NHTSA includes light-duty vehicles only.
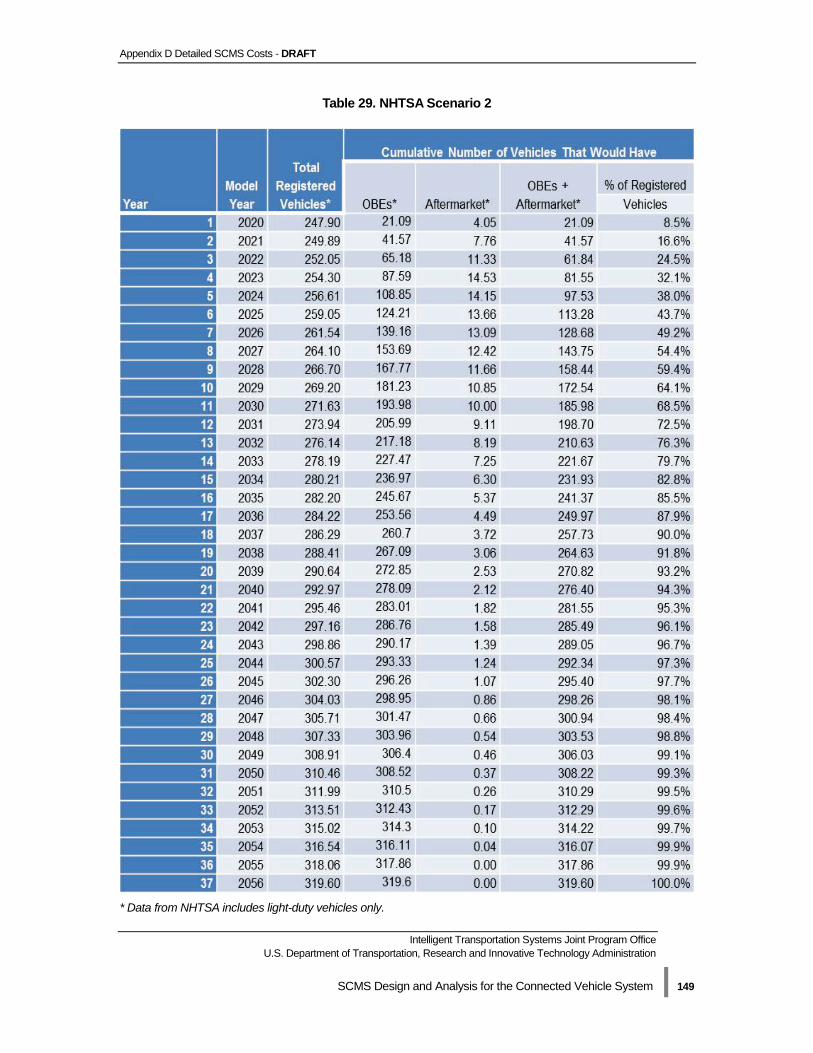
Appendix D Detailed SCMS Costs - DRAFT
Intelligent Transportation Systems Joint Program Office U.S. Department of Transportation, Research and Innovative Technology Administration
SCMS Design and Analysis for the Connected Vehicle System | 149
Table 29. NHTSA Scenario 2
* Data from NHTSA includes light-duty vehicles only.
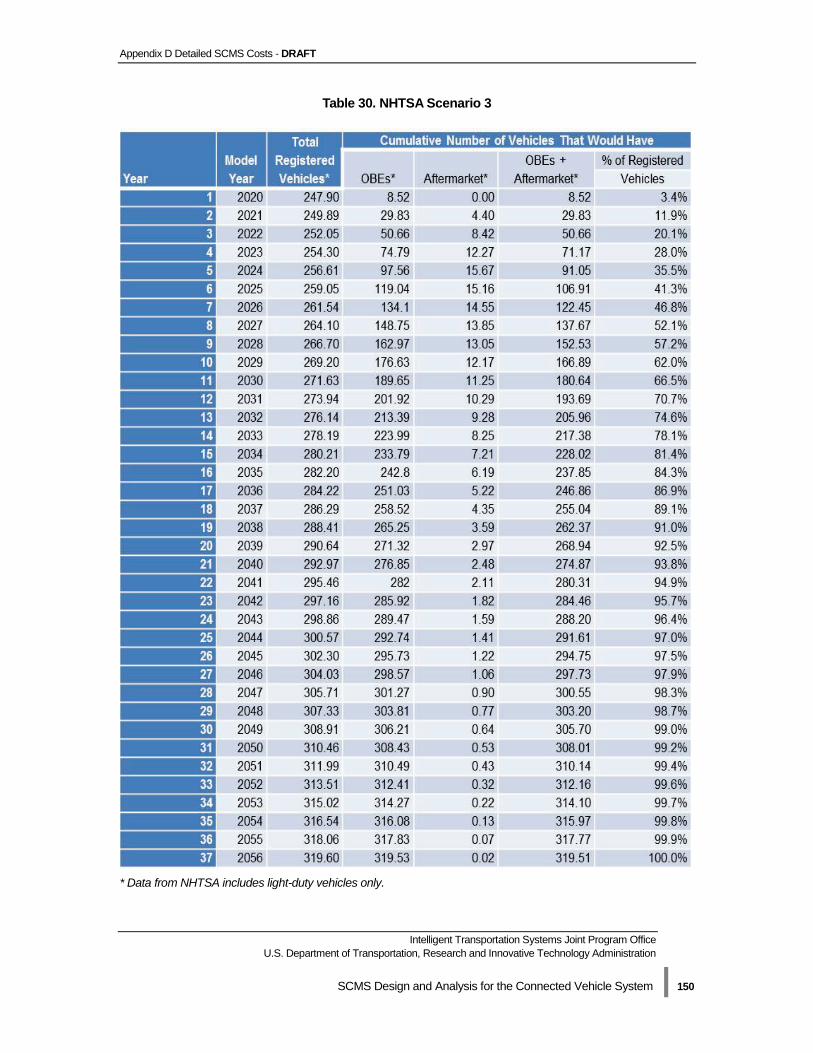
Appendix D Detailed SCMS Costs - DRAFT
Intelligent Transportation Systems Joint Program Office U.S. Department of Transportation, Research and Innovative Technology Administration
SCMS Design and Analysis for the Connected Vehicle System | 150
Table 30. NHTSA Scenario 3
* Data from NHTSA includes light-duty vehicles only.
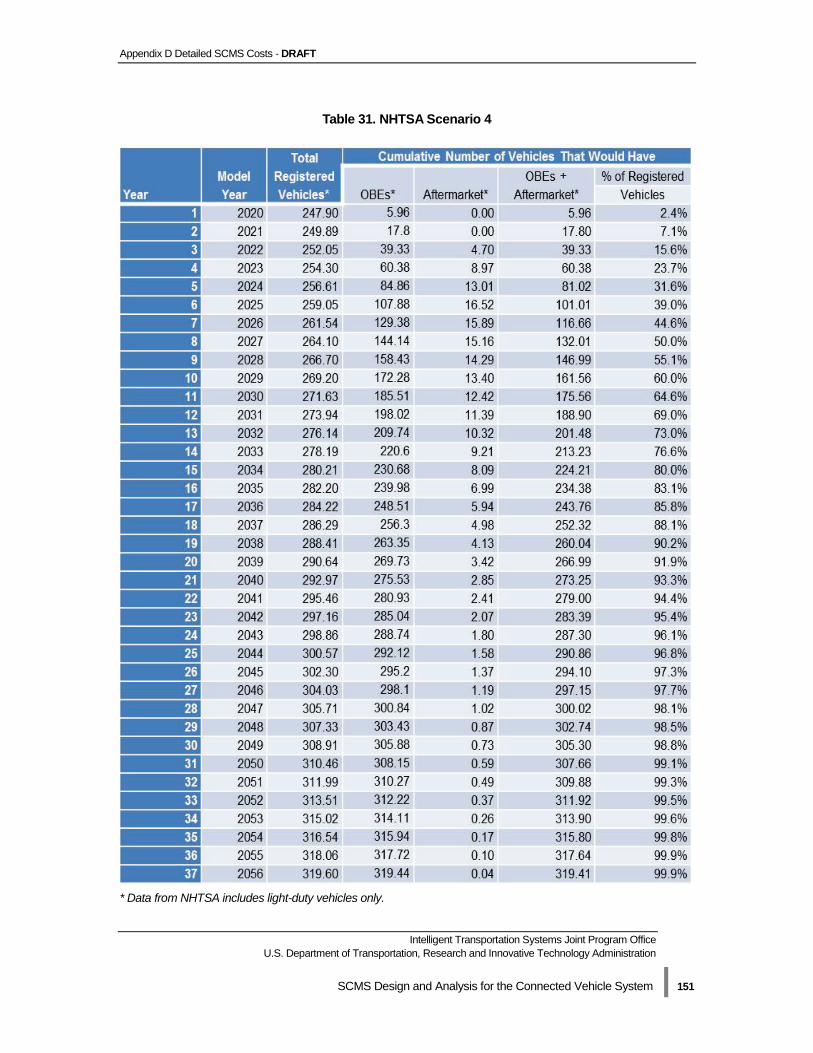
Appendix D Detailed SCMS Costs - DRAFT
Intelligent Transportation Systems Joint Program Office U.S. Department of Transportation, Research and Innovative Technology Administration
SCMS Design and Analysis for the Connected Vehicle System | 151
Table 31. NHTSA Scenario 4
* Data from NHTSA includes light-duty vehicles only.
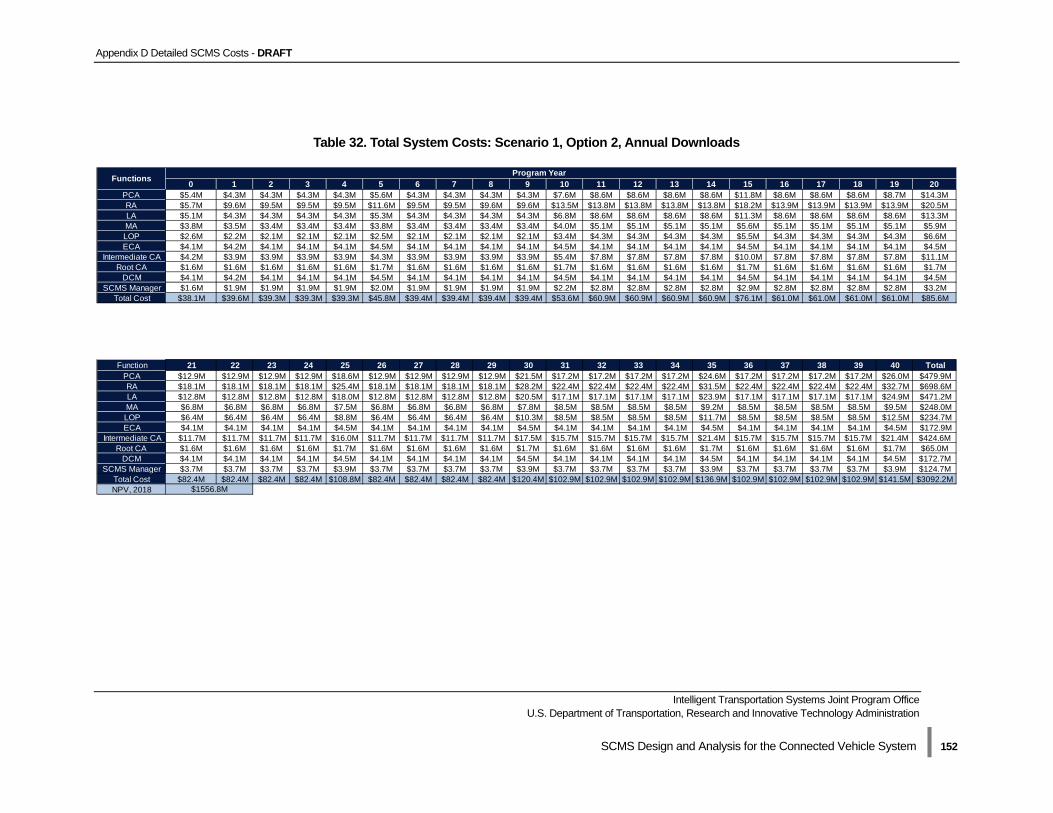
Appendix D Detailed SCMS Costs - DRAFT
Intelligent Transportation Systems Joint Program Office U.S. Department of Transportation, Research and Innovative Technology Administration
SCMS Design and Analysis for the Connected Vehicle System | 152
Table 32. Total System Costs: Scenario 1, Option 2, Annual Downloads
0 1 2 3 4 5 6 7 8 9 10 11 12 13 14 15 16 17 18 19 20PCA $5.4M $4.3M $4.3M $4.3M $4.3M $5.6M $4.3M $4.3M $4.3M $4.3M $7.6M $8.6M $8.6M $8.6M $8.6M $11.8M $8.6M $8.6M $8.6M $8.7M $14.3MRA $5.7M $9.6M $9.5M $9.5M $9.5M $11.6M $9.5M $9.5M $9.6M $9.6M $13.5M $13.8M $13.8M $13.8M $13.8M $18.2M $13.9M $13.9M $13.9M $13.9M $20.5MLA $5.1M $4.3M $4.3M $4.3M $4.3M $5.3M $4.3M $4.3M $4.3M $4.3M $6.8M $8.6M $8.6M $8.6M $8.6M $11.3M $8.6M $8.6M $8.6M $8.6M $13.3MMA $3.8M $3.5M $3.4M $3.4M $3.4M $3.8M $3.4M $3.4M $3.4M $3.4M $4.0M $5.1M $5.1M $5.1M $5.1M $5.6M $5.1M $5.1M $5.1M $5.1M $5.9MLOP $2.6M $2.2M $2.1M $2.1M $2.1M $2.5M $2.1M $2.1M $2.1M $2.1M $3.4M $4.3M $4.3M $4.3M $4.3M $5.5M $4.3M $4.3M $4.3M $4.3M $6.6MECA $4.1M $4.2M $4.1M $4.1M $4.1M $4.5M $4.1M $4.1M $4.1M $4.1M $4.5M $4.1M $4.1M $4.1M $4.1M $4.5M $4.1M $4.1M $4.1M $4.1M $4.5M
Intermediate CA $4.2M $3.9M $3.9M $3.9M $3.9M $4.3M $3.9M $3.9M $3.9M $3.9M $5.4M $7.8M $7.8M $7.8M $7.8M $10.0M $7.8M $7.8M $7.8M $7.8M $11.1MRoot CA $1.6M $1.6M $1.6M $1.6M $1.6M $1.7M $1.6M $1.6M $1.6M $1.6M $1.7M $1.6M $1.6M $1.6M $1.6M $1.7M $1.6M $1.6M $1.6M $1.6M $1.7M
DCM $4.1M $4.2M $4.1M $4.1M $4.1M $4.5M $4.1M $4.1M $4.1M $4.1M $4.5M $4.1M $4.1M $4.1M $4.1M $4.5M $4.1M $4.1M $4.1M $4.1M $4.5MSCMS Manager $1.6M $1.9M $1.9M $1.9M $1.9M $2.0M $1.9M $1.9M $1.9M $1.9M $2.2M $2.8M $2.8M $2.8M $2.8M $2.9M $2.8M $2.8M $2.8M $2.8M $3.2M
Total Cost $38.1M $39.6M $39.3M $39.3M $39.3M $45.8M $39.4M $39.4M $39.4M $39.4M $53.6M $60.9M $60.9M $60.9M $60.9M $76.1M $61.0M $61.0M $61.0M $61.0M $85.6M
Function 21 22 23 24 25 26 27 28 29 30 31 32 33 34 35 36 37 38 39 40 TotalPCA $12.9M $12.9M $12.9M $12.9M $18.6M $12.9M $12.9M $12.9M $12.9M $21.5M $17.2M $17.2M $17.2M $17.2M $24.6M $17.2M $17.2M $17.2M $17.2M $26.0M $479.9MRA $18.1M $18.1M $18.1M $18.1M $25.4M $18.1M $18.1M $18.1M $18.1M $28.2M $22.4M $22.4M $22.4M $22.4M $31.5M $22.4M $22.4M $22.4M $22.4M $32.7M $698.6MLA $12.8M $12.8M $12.8M $12.8M $18.0M $12.8M $12.8M $12.8M $12.8M $20.5M $17.1M $17.1M $17.1M $17.1M $23.9M $17.1M $17.1M $17.1M $17.1M $24.9M $471.2MMA $6.8M $6.8M $6.8M $6.8M $7.5M $6.8M $6.8M $6.8M $6.8M $7.8M $8.5M $8.5M $8.5M $8.5M $9.2M $8.5M $8.5M $8.5M $8.5M $9.5M $248.0MLOP $6.4M $6.4M $6.4M $6.4M $8.8M $6.4M $6.4M $6.4M $6.4M $10.3M $8.5M $8.5M $8.5M $8.5M $11.7M $8.5M $8.5M $8.5M $8.5M $12.5M $234.7MECA $4.1M $4.1M $4.1M $4.1M $4.5M $4.1M $4.1M $4.1M $4.1M $4.5M $4.1M $4.1M $4.1M $4.1M $4.5M $4.1M $4.1M $4.1M $4.1M $4.5M $172.9M
Intermediate CA $11.7M $11.7M $11.7M $11.7M $16.0M $11.7M $11.7M $11.7M $11.7M $17.5M $15.7M $15.7M $15.7M $15.7M $21.4M $15.7M $15.7M $15.7M $15.7M $21.4M $424.6MRoot CA $1.6M $1.6M $1.6M $1.6M $1.7M $1.6M $1.6M $1.6M $1.6M $1.7M $1.6M $1.6M $1.6M $1.6M $1.7M $1.6M $1.6M $1.6M $1.6M $1.7M $65.0M
DCM $4.1M $4.1M $4.1M $4.1M $4.5M $4.1M $4.1M $4.1M $4.1M $4.5M $4.1M $4.1M $4.1M $4.1M $4.5M $4.1M $4.1M $4.1M $4.1M $4.5M $172.7MSCMS Manager $3.7M $3.7M $3.7M $3.7M $3.9M $3.7M $3.7M $3.7M $3.7M $3.9M $3.7M $3.7M $3.7M $3.7M $3.9M $3.7M $3.7M $3.7M $3.7M $3.9M $124.7M
Total Cost $82.4M $82.4M $82.4M $82.4M $108.8M $82.4M $82.4M $82.4M $82.4M $120.4M $102.9M $102.9M $102.9M $102.9M $136.9M $102.9M $102.9M $102.9M $102.9M $141.5M $3092.2MNPV, 2018 $1556.8M
Program YearFunctions

Appendix D Detailed SCMS Costs - DRAFT
Intelligent Transportation Systems Joint Program Office U.S. Department of Transportation, Research and Innovative Technology Administration
SCMS Design and Analysis for the Connected Vehicle System | 153
Table 33. Total System Costs: Scenario 1, Option 2, Every Two Year Downloads
0 1 2 3 4 5 6 7 8 9 10 11 12 13 14 15 16 17 18 19 20PCA $5.9M $4.3M $4.3M $4.3M $4.3M $6.1M $4.4M $4.4M $4.4M $4.4M $9.0M $8.7M $8.7M $8.7M $8.7M $12.8M $8.8M $8.8M $8.8M $8.8M $16.1MRA $6.1M $9.6M $9.5M $9.5M $9.5M $12.0M $9.6M $9.6M $9.6M $9.6M $14.6M $13.9M $13.9M $13.9M $13.9M $19.0M $13.9M $13.9M $14.0M $14.0M $21.9MLA $5.3M $4.3M $4.3M $4.3M $4.3M $5.5M $4.3M $4.3M $4.3M $4.3M $7.5M $8.6M $8.6M $8.6M $8.6M $11.8M $8.6M $8.6M $8.6M $8.6M $14.1MMA $3.9M $3.5M $3.4M $3.4M $3.4M $3.8M $3.4M $3.4M $3.4M $3.4M $4.1M $5.1M $5.1M $5.1M $5.1M $5.7M $5.1M $5.1M $5.1M $5.1M $6.0MLOP $2.6M $2.2M $2.1M $2.1M $2.1M $2.5M $2.1M $2.1M $2.1M $2.1M $3.4M $4.3M $4.3M $4.3M $4.3M $5.5M $4.3M $4.3M $4.3M $4.3M $6.7MECA $4.1M $4.2M $4.1M $4.1M $4.1M $4.5M $4.1M $4.1M $4.1M $4.1M $4.5M $4.1M $4.1M $4.1M $4.1M $4.5M $4.1M $4.1M $4.1M $4.1M $4.5M
Intermediate CA $4.2M $3.9M $3.9M $3.9M $3.9M $4.3M $3.9M $3.9M $3.9M $3.9M $5.4M $7.8M $7.8M $7.8M $7.8M $10.0M $7.8M $7.8M $7.8M $7.8M $11.1MRoot CA $1.6M $1.6M $1.6M $1.6M $1.6M $1.7M $1.6M $1.6M $1.6M $1.6M $1.7M $1.6M $1.6M $1.6M $1.6M $1.7M $1.6M $1.6M $1.6M $1.6M $1.7M
DCM $4.1M $4.2M $4.1M $4.1M $4.1M $4.5M $4.1M $4.1M $4.1M $4.1M $4.5M $4.1M $4.1M $4.1M $4.1M $4.5M $4.1M $4.1M $4.1M $4.1M $4.5MSCMS Manager $1.6M $1.9M $1.9M $1.9M $1.9M $2.0M $1.9M $1.9M $1.9M $1.9M $2.2M $2.8M $2.8M $2.8M $2.8M $2.9M $2.8M $2.8M $2.8M $2.8M $3.2M
Total Cost $39.3M $39.7M $39.3M $39.3M $39.4M $46.9M $39.5M $39.5M $39.5M $39.6M $56.8M $61.1M $61.1M $61.2M $61.2M $78.3M $61.2M $61.2M $61.3M $61.3M $89.8M
Function 21 22 23 24 25 26 27 28 29 30 31 32 33 34 35 36 37 38 39 40 TotalPCA $13.1M $13.1M $13.1M $13.1M $19.8M $13.1M $13.1M $13.1M $13.1M $23.5M $17.4M $17.4M $17.4M $17.4M $25.9M $17.4M $17.4M $17.4M $17.4M $28.0M $495.4MRA $18.2M $18.2M $18.2M $18.2M $26.3M $18.2M $18.2M $18.2M $18.2M $29.8M $22.5M $22.5M $22.5M $22.5M $32.4M $22.5M $22.5M $22.5M $22.5M $34.2M $710.5MLA $12.9M $12.9M $12.9M $12.9M $18.5M $12.9M $12.9M $12.9M $12.9M $21.4M $17.2M $17.2M $17.2M $17.2M $24.6M $17.2M $17.2M $17.2M $17.2M $25.8M $478.4MMA $6.8M $6.8M $6.8M $6.8M $7.5M $6.8M $6.8M $6.8M $6.8M $7.9M $8.5M $8.5M $8.5M $8.5M $9.2M $8.5M $8.5M $8.5M $8.5M $9.6M $248.5MLOP $6.4M $6.4M $6.4M $6.4M $8.8M $6.4M $6.4M $6.4M $6.4M $10.3M $8.5M $8.5M $8.5M $8.5M $11.7M $8.5M $8.5M $8.5M $8.5M $12.5M $234.9MECA $4.1M $4.1M $4.1M $4.1M $4.5M $4.1M $4.1M $4.1M $4.1M $4.5M $4.1M $4.1M $4.1M $4.1M $4.5M $4.1M $4.1M $4.1M $4.1M $4.5M $172.9M
Intermediate CA $11.7M $11.7M $11.7M $11.7M $16.0M $11.7M $11.7M $11.7M $11.7M $17.5M $15.7M $15.7M $15.7M $15.7M $21.4M $15.7M $15.7M $15.7M $15.7M $21.4M $424.6MRoot CA $1.6M $1.6M $1.6M $1.6M $1.7M $1.6M $1.6M $1.6M $1.6M $1.7M $1.6M $1.6M $1.6M $1.6M $1.7M $1.6M $1.6M $1.6M $1.6M $1.7M $65.0M
DCM $4.1M $4.1M $4.1M $4.1M $4.5M $4.1M $4.1M $4.1M $4.1M $4.5M $4.1M $4.1M $4.1M $4.1M $4.5M $4.1M $4.1M $4.1M $4.1M $4.5M $172.7MSCMS Manager $3.7M $3.7M $3.7M $3.7M $3.9M $3.7M $3.7M $3.7M $3.7M $3.9M $3.7M $3.7M $3.7M $3.7M $3.9M $3.7M $3.7M $3.7M $3.7M $3.9M $124.7M
Total Cost $82.7M $82.7M $82.7M $82.8M $111.5M $82.8M $82.8M $82.8M $82.8M $124.9M $103.3M $103.3M $103.3M $103.3M $139.8M $103.3M $103.3M $103.3M $103.3M $146.1M $3127.5MNPV, 2018 $1574.4M
Program YearFunctions

Appendix D Detailed SCMS Costs - DRAFT
Intelligent Transportation Systems Joint Program Office U.S. Department of Transportation, Research and Innovative Technology Administration
SCMS Design and Analysis for the Connected Vehicle System | 154
Table 34. Total System Costs: Scenario 1, Option 2, Every Three Year Downloads
0 1 2 3 4 5 6 7 8 9 10 11 12 13 14 15 16 17 18 19 20PCA $6.4M $4.4M $4.3M $4.3M $4.3M $6.5M $4.4M $4.4M $4.4M $4.4M $10.3M $8.8M $8.8M $8.8M $8.8M $13.7M $8.9M $8.9M $8.9M $8.9M $17.9MRA $6.5M $9.6M $9.6M $9.5M $9.6M $12.3M $9.6M $9.6M $9.6M $9.6M $15.6M $14.0M $14.0M $14.0M $14.0M $19.7M $14.0M $14.0M $14.0M $14.1M $23.3MLA $5.5M $4.3M $4.3M $4.3M $4.3M $5.7M $4.3M $4.3M $4.3M $4.3M $8.1M $8.6M $8.6M $8.7M $8.7M $12.2M $8.7M $8.7M $8.7M $8.7M $14.9MMA $3.9M $3.5M $3.4M $3.4M $3.4M $3.8M $3.4M $3.4M $3.4M $3.4M $4.1M $5.1M $5.1M $5.1M $5.1M $5.7M $5.1M $5.1M $5.1M $5.1M $6.1MLOP $2.6M $2.2M $2.1M $2.1M $2.1M $2.5M $2.1M $2.1M $2.1M $2.1M $3.4M $4.3M $4.3M $4.3M $4.3M $5.5M $4.3M $4.3M $4.3M $4.3M $6.7MECA $4.1M $4.2M $4.1M $4.1M $4.1M $4.5M $4.1M $4.1M $4.1M $4.1M $4.5M $4.1M $4.1M $4.1M $4.1M $4.5M $4.1M $4.1M $4.1M $4.1M $4.5M
Intermediate CA $4.2M $3.9M $3.9M $3.9M $3.9M $4.3M $3.9M $3.9M $3.9M $3.9M $5.4M $7.8M $7.8M $7.8M $7.8M $10.0M $7.8M $7.8M $7.8M $7.8M $11.1MRoot CA $1.6M $1.6M $1.6M $1.6M $1.6M $1.7M $1.6M $1.6M $1.6M $1.6M $1.7M $1.6M $1.6M $1.6M $1.6M $1.7M $1.6M $1.6M $1.6M $1.6M $1.7M
DCM $4.1M $4.2M $4.1M $4.1M $4.1M $4.5M $4.1M $4.1M $4.1M $4.1M $4.5M $4.1M $4.1M $4.1M $4.1M $4.5M $4.1M $4.1M $4.1M $4.1M $4.5MSCMS Manager $1.6M $1.9M $1.9M $1.9M $1.9M $2.0M $1.9M $1.9M $1.9M $1.9M $2.2M $2.8M $2.8M $2.8M $2.8M $2.9M $2.8M $2.8M $2.8M $2.8M $3.2M
Total Cost $40.3M $39.7M $39.4M $39.4M $39.4M $47.8M $39.5M $39.6M $39.6M $39.7M $59.7M $61.3M $61.3M $61.4M $61.4M $80.4M $61.5M $61.5M $61.5M $61.6M $93.8M
Function 21 22 23 24 25 26 27 28 29 30 31 32 33 34 35 36 37 38 39 40 TotalPCA $13.2M $13.2M $13.2M $13.2M $20.9M $13.2M $13.2M $13.2M $13.3M $25.5M $17.5M $17.5M $17.5M $17.5M $27.1M $17.5M $17.5M $17.5M $17.5M $30.0M $510.1MRA $18.3M $18.3M $18.3M $18.3M $27.2M $18.4M $18.4M $18.4M $18.4M $31.3M $22.6M $22.6M $22.6M $22.6M $33.4M $22.6M $22.6M $22.6M $22.6M $35.8M $721.8MLA $13.0M $13.0M $13.0M $13.0M $19.1M $13.0M $13.0M $13.0M $13.0M $22.2M $17.2M $17.2M $17.2M $17.2M $25.2M $17.2M $17.2M $17.2M $17.2M $26.7M $485.2MMA $6.8M $6.8M $6.8M $6.8M $7.5M $6.8M $6.8M $6.8M $6.8M $8.0M $8.5M $8.5M $8.5M $8.5M $9.3M $8.5M $8.5M $8.5M $8.5M $9.7M $249.1MLOP $6.4M $6.4M $6.4M $6.4M $8.8M $6.4M $6.4M $6.4M $6.4M $10.4M $8.5M $8.5M $8.5M $8.5M $11.8M $8.5M $8.5M $8.5M $8.5M $12.6M $235.0MECA $4.1M $4.1M $4.1M $4.1M $4.5M $4.1M $4.1M $4.1M $4.1M $4.5M $4.1M $4.1M $4.1M $4.1M $4.5M $4.1M $4.1M $4.1M $4.1M $4.5M $172.9M
Intermediate CA $11.7M $11.7M $11.7M $11.7M $16.0M $11.7M $11.7M $11.7M $11.7M $17.5M $15.7M $15.7M $15.7M $15.7M $21.4M $15.7M $15.7M $15.7M $15.7M $21.4M $424.6MRoot CA $1.6M $1.6M $1.6M $1.6M $1.7M $1.6M $1.6M $1.6M $1.6M $1.7M $1.6M $1.6M $1.6M $1.6M $1.7M $1.6M $1.6M $1.6M $1.6M $1.7M $65.0M
DCM $4.1M $4.1M $4.1M $4.1M $4.5M $4.1M $4.1M $4.1M $4.1M $4.5M $4.1M $4.1M $4.1M $4.1M $4.5M $4.1M $4.1M $4.1M $4.1M $4.5M $172.7MSCMS Manager $3.7M $3.7M $3.7M $3.7M $3.9M $3.7M $3.7M $3.7M $3.7M $3.9M $3.7M $3.7M $3.7M $3.7M $3.9M $3.7M $3.7M $3.7M $3.7M $3.9M $124.7M
Total Cost $83.0M $83.1M $83.1M $83.1M $114.1M $83.1M $83.1M $83.1M $83.1M $129.3M $103.7M $103.7M $103.7M $103.7M $142.7M $103.7M $103.7M $103.7M $103.7M $150.7M $3161.0MNPV, 2018 $1590.9M
Program YearFunctions
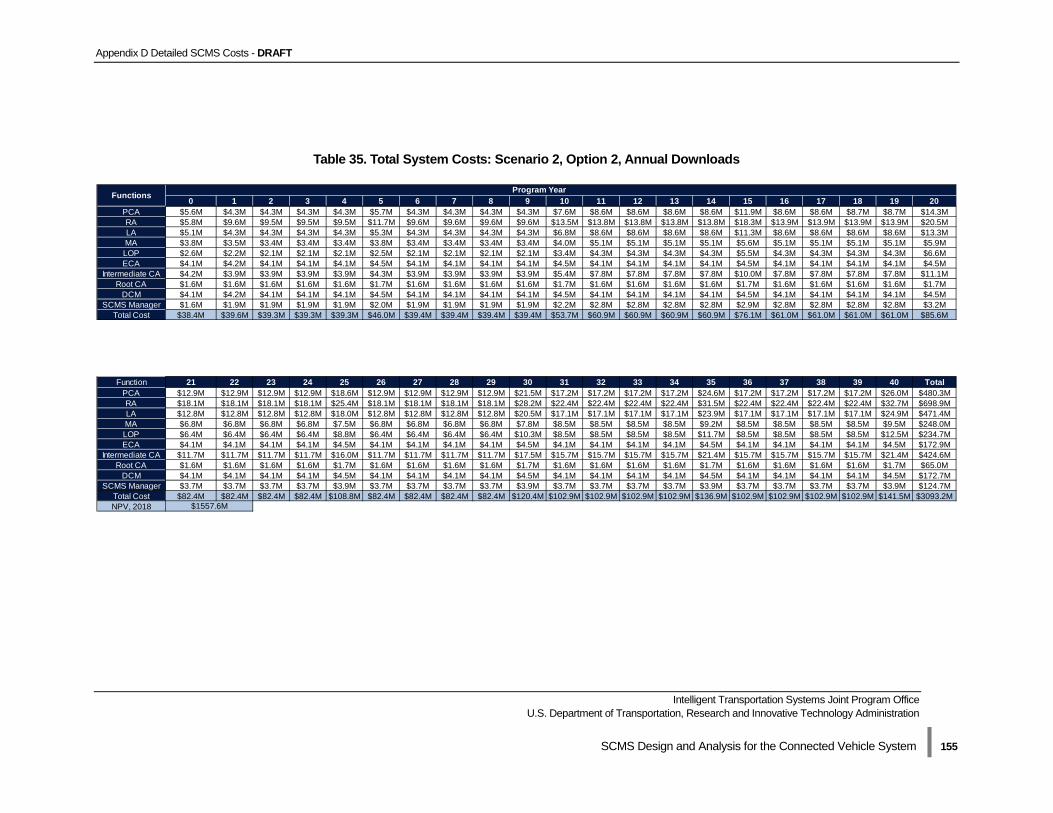
Appendix D Detailed SCMS Costs - DRAFT
Intelligent Transportation Systems Joint Program Office U.S. Department of Transportation, Research and Innovative Technology Administration
SCMS Design and Analysis for the Connected Vehicle System | 155
Table 35. Total System Costs: Scenario 2, Option 2, Annual Downloads
0 1 2 3 4 5 6 7 8 9 10 11 12 13 14 15 16 17 18 19 20PCA $5.6M $4.3M $4.3M $4.3M $4.3M $5.7M $4.3M $4.3M $4.3M $4.3M $7.6M $8.6M $8.6M $8.6M $8.6M $11.9M $8.6M $8.6M $8.7M $8.7M $14.3MRA $5.8M $9.6M $9.5M $9.5M $9.5M $11.7M $9.6M $9.6M $9.6M $9.6M $13.5M $13.8M $13.8M $13.8M $13.8M $18.3M $13.9M $13.9M $13.9M $13.9M $20.5MLA $5.1M $4.3M $4.3M $4.3M $4.3M $5.3M $4.3M $4.3M $4.3M $4.3M $6.8M $8.6M $8.6M $8.6M $8.6M $11.3M $8.6M $8.6M $8.6M $8.6M $13.3MMA $3.8M $3.5M $3.4M $3.4M $3.4M $3.8M $3.4M $3.4M $3.4M $3.4M $4.0M $5.1M $5.1M $5.1M $5.1M $5.6M $5.1M $5.1M $5.1M $5.1M $5.9MLOP $2.6M $2.2M $2.1M $2.1M $2.1M $2.5M $2.1M $2.1M $2.1M $2.1M $3.4M $4.3M $4.3M $4.3M $4.3M $5.5M $4.3M $4.3M $4.3M $4.3M $6.6MECA $4.1M $4.2M $4.1M $4.1M $4.1M $4.5M $4.1M $4.1M $4.1M $4.1M $4.5M $4.1M $4.1M $4.1M $4.1M $4.5M $4.1M $4.1M $4.1M $4.1M $4.5M
Intermediate CA $4.2M $3.9M $3.9M $3.9M $3.9M $4.3M $3.9M $3.9M $3.9M $3.9M $5.4M $7.8M $7.8M $7.8M $7.8M $10.0M $7.8M $7.8M $7.8M $7.8M $11.1MRoot CA $1.6M $1.6M $1.6M $1.6M $1.6M $1.7M $1.6M $1.6M $1.6M $1.6M $1.7M $1.6M $1.6M $1.6M $1.6M $1.7M $1.6M $1.6M $1.6M $1.6M $1.7M
DCM $4.1M $4.2M $4.1M $4.1M $4.1M $4.5M $4.1M $4.1M $4.1M $4.1M $4.5M $4.1M $4.1M $4.1M $4.1M $4.5M $4.1M $4.1M $4.1M $4.1M $4.5MSCMS Manager $1.6M $1.9M $1.9M $1.9M $1.9M $2.0M $1.9M $1.9M $1.9M $1.9M $2.2M $2.8M $2.8M $2.8M $2.8M $2.9M $2.8M $2.8M $2.8M $2.8M $3.2M
Total Cost $38.4M $39.6M $39.3M $39.3M $39.3M $46.0M $39.4M $39.4M $39.4M $39.4M $53.7M $60.9M $60.9M $60.9M $60.9M $76.1M $61.0M $61.0M $61.0M $61.0M $85.6M
Function 21 22 23 24 25 26 27 28 29 30 31 32 33 34 35 36 37 38 39 40 TotalPCA $12.9M $12.9M $12.9M $12.9M $18.6M $12.9M $12.9M $12.9M $12.9M $21.5M $17.2M $17.2M $17.2M $17.2M $24.6M $17.2M $17.2M $17.2M $17.2M $26.0M $480.3MRA $18.1M $18.1M $18.1M $18.1M $25.4M $18.1M $18.1M $18.1M $18.1M $28.2M $22.4M $22.4M $22.4M $22.4M $31.5M $22.4M $22.4M $22.4M $22.4M $32.7M $698.9MLA $12.8M $12.8M $12.8M $12.8M $18.0M $12.8M $12.8M $12.8M $12.8M $20.5M $17.1M $17.1M $17.1M $17.1M $23.9M $17.1M $17.1M $17.1M $17.1M $24.9M $471.4MMA $6.8M $6.8M $6.8M $6.8M $7.5M $6.8M $6.8M $6.8M $6.8M $7.8M $8.5M $8.5M $8.5M $8.5M $9.2M $8.5M $8.5M $8.5M $8.5M $9.5M $248.0MLOP $6.4M $6.4M $6.4M $6.4M $8.8M $6.4M $6.4M $6.4M $6.4M $10.3M $8.5M $8.5M $8.5M $8.5M $11.7M $8.5M $8.5M $8.5M $8.5M $12.5M $234.7MECA $4.1M $4.1M $4.1M $4.1M $4.5M $4.1M $4.1M $4.1M $4.1M $4.5M $4.1M $4.1M $4.1M $4.1M $4.5M $4.1M $4.1M $4.1M $4.1M $4.5M $172.9M
Intermediate CA $11.7M $11.7M $11.7M $11.7M $16.0M $11.7M $11.7M $11.7M $11.7M $17.5M $15.7M $15.7M $15.7M $15.7M $21.4M $15.7M $15.7M $15.7M $15.7M $21.4M $424.6MRoot CA $1.6M $1.6M $1.6M $1.6M $1.7M $1.6M $1.6M $1.6M $1.6M $1.7M $1.6M $1.6M $1.6M $1.6M $1.7M $1.6M $1.6M $1.6M $1.6M $1.7M $65.0M
DCM $4.1M $4.1M $4.1M $4.1M $4.5M $4.1M $4.1M $4.1M $4.1M $4.5M $4.1M $4.1M $4.1M $4.1M $4.5M $4.1M $4.1M $4.1M $4.1M $4.5M $172.7MSCMS Manager $3.7M $3.7M $3.7M $3.7M $3.9M $3.7M $3.7M $3.7M $3.7M $3.9M $3.7M $3.7M $3.7M $3.7M $3.9M $3.7M $3.7M $3.7M $3.7M $3.9M $124.7M
Total Cost $82.4M $82.4M $82.4M $82.4M $108.8M $82.4M $82.4M $82.4M $82.4M $120.4M $102.9M $102.9M $102.9M $102.9M $136.9M $102.9M $102.9M $102.9M $102.9M $141.5M $3093.2MNPV, 2018 $1557.6M
Program YearFunctions

Appendix D Detailed SCMS Costs - DRAFT
Intelligent Transportation Systems Joint Program Office U.S. Department of Transportation, Research and Innovative Technology Administration
SCMS Design and Analysis for the Connected Vehicle System | 156
Table 36. Total System Costs: Scenario 2, Option 2, Every Two Year Downloads
0 1 2 3 4 5 6 7 8 9 10 11 12 13 14 15 16 17 18 19 20PCA $6.1M $4.4M $4.3M $4.3M $4.3M $6.2M $4.4M $4.4M $4.4M $4.4M $9.1M $8.7M $8.7M $8.7M $8.8M $12.9M $8.8M $8.8M $8.8M $8.8M $16.1MRA $6.3M $9.6M $9.5M $9.6M $9.6M $12.1M $9.6M $9.6M $9.6M $9.6M $14.7M $13.9M $13.9M $13.9M $13.9M $19.0M $13.9M $14.0M $14.0M $14.0M $22.0MLA $5.4M $4.3M $4.3M $4.3M $4.3M $5.6M $4.3M $4.3M $4.3M $4.3M $7.5M $8.6M $8.6M $8.6M $8.6M $11.8M $8.6M $8.6M $8.6M $8.6M $14.1MMA $3.9M $3.5M $3.4M $3.4M $3.4M $3.8M $3.4M $3.4M $3.4M $3.4M $4.1M $5.1M $5.1M $5.1M $5.1M $5.7M $5.1M $5.1M $5.1M $5.1M $6.0MLOP $2.6M $2.2M $2.1M $2.1M $2.1M $2.5M $2.1M $2.1M $2.1M $2.1M $3.4M $4.3M $4.3M $4.3M $4.3M $5.5M $4.3M $4.3M $4.3M $4.3M $6.7MECA $4.1M $4.2M $4.1M $4.1M $4.1M $4.5M $4.1M $4.1M $4.1M $4.1M $4.5M $4.1M $4.1M $4.1M $4.1M $4.5M $4.1M $4.1M $4.1M $4.1M $4.5M
Intermediate CA $4.2M $3.9M $3.9M $3.9M $3.9M $4.3M $3.9M $3.9M $3.9M $3.9M $5.4M $7.8M $7.8M $7.8M $7.8M $10.0M $7.8M $7.8M $7.8M $7.8M $11.1MRoot CA $1.6M $1.6M $1.6M $1.6M $1.6M $1.7M $1.6M $1.6M $1.6M $1.6M $1.7M $1.6M $1.6M $1.6M $1.6M $1.7M $1.6M $1.6M $1.6M $1.6M $1.7M
DCM $4.1M $4.2M $4.1M $4.1M $4.1M $4.5M $4.1M $4.1M $4.1M $4.1M $4.5M $4.1M $4.1M $4.1M $4.1M $4.5M $4.1M $4.1M $4.1M $4.1M $4.5MSCMS Manager $1.6M $1.9M $1.9M $1.9M $1.9M $2.0M $1.9M $1.9M $1.9M $1.9M $2.2M $2.8M $2.8M $2.8M $2.8M $2.9M $2.8M $2.8M $2.8M $2.8M $3.2M
Total Cost $39.8M $39.7M $39.4M $39.4M $39.4M $47.3M $39.5M $39.6M $39.6M $39.6M $57.1M $61.1M $61.2M $61.2M $61.2M $78.4M $61.3M $61.3M $61.3M $61.3M $89.8M
Function 21 22 23 24 25 26 27 28 29 30 31 32 33 34 35 36 37 38 39 40 TotalPCA $13.1M $13.1M $13.1M $13.1M $19.8M $13.1M $13.1M $13.1M $13.1M $23.5M $17.4M $17.4M $17.4M $17.4M $25.9M $17.4M $17.4M $17.4M $17.4M $28.0M $496.2MRA $18.2M $18.2M $18.2M $18.2M $26.3M $18.2M $18.2M $18.2M $18.2M $29.8M $22.5M $22.5M $22.5M $22.5M $32.4M $22.5M $22.5M $22.5M $22.5M $34.2M $711.1MLA $12.9M $12.9M $12.9M $12.9M $18.6M $12.9M $12.9M $12.9M $12.9M $21.4M $17.2M $17.2M $17.2M $17.2M $24.6M $17.2M $17.2M $17.2M $17.2M $25.8M $478.8MMA $6.8M $6.8M $6.8M $6.8M $7.5M $6.8M $6.8M $6.8M $6.8M $7.9M $8.5M $8.5M $8.5M $8.5M $9.2M $8.5M $8.5M $8.5M $8.5M $9.6M $248.6MLOP $6.4M $6.4M $6.4M $6.4M $8.8M $6.4M $6.4M $6.4M $6.4M $10.3M $8.5M $8.5M $8.5M $8.5M $11.7M $8.5M $8.5M $8.5M $8.5M $12.5M $234.9MECA $4.1M $4.1M $4.1M $4.1M $4.5M $4.1M $4.1M $4.1M $4.1M $4.5M $4.1M $4.1M $4.1M $4.1M $4.5M $4.1M $4.1M $4.1M $4.1M $4.5M $172.9M
Intermediate CA $11.7M $11.7M $11.7M $11.7M $16.0M $11.7M $11.7M $11.7M $11.7M $17.5M $15.7M $15.7M $15.7M $15.7M $21.4M $15.7M $15.7M $15.7M $15.7M $21.4M $424.6MRoot CA $1.6M $1.6M $1.6M $1.6M $1.7M $1.6M $1.6M $1.6M $1.6M $1.7M $1.6M $1.6M $1.6M $1.6M $1.7M $1.6M $1.6M $1.6M $1.6M $1.7M $65.0M
DCM $4.1M $4.1M $4.1M $4.1M $4.5M $4.1M $4.1M $4.1M $4.1M $4.5M $4.1M $4.1M $4.1M $4.1M $4.5M $4.1M $4.1M $4.1M $4.1M $4.5M $172.7MSCMS Manager $3.7M $3.7M $3.7M $3.7M $3.9M $3.7M $3.7M $3.7M $3.7M $3.9M $3.7M $3.7M $3.7M $3.7M $3.9M $3.7M $3.7M $3.7M $3.7M $3.9M $124.7M
Total Cost $82.7M $82.7M $82.8M $82.8M $111.5M $82.8M $82.8M $82.8M $82.8M $124.9M $103.3M $103.3M $103.3M $103.3M $139.8M $103.3M $103.3M $103.3M $103.3M $146.1M $3129.5MNPV, 2018 $1576.0M
Program YearFunctions

Appendix D Detailed SCMS Costs - DRAFT
Intelligent Transportation Systems Joint Program Office U.S. Department of Transportation, Research and Innovative Technology Administration
SCMS Design and Analysis for the Connected Vehicle System | 157
Table 37. Total System Costs: Scenario 2, Option 2, Every Three Year Downloads
0 1 2 3 4 5 6 7 8 9 10 11 12 13 14 15 16 17 18 19 20PCA $6.7M $4.4M $4.3M $4.3M $4.4M $6.7M $4.4M $4.4M $4.5M $4.5M $10.5M $8.8M $8.8M $8.8M $8.9M $13.8M $8.9M $8.9M $8.9M $8.9M $17.9MRA $6.8M $9.6M $9.6M $9.6M $9.6M $12.5M $9.6M $9.6M $9.7M $9.7M $15.7M $14.0M $14.0M $14.0M $14.0M $19.8M $14.0M $14.0M $14.1M $14.1M $23.3MLA $5.7M $4.3M $4.3M $4.3M $4.3M $5.8M $4.3M $4.3M $4.4M $4.4M $8.2M $8.6M $8.7M $8.7M $8.7M $12.3M $8.7M $8.7M $8.7M $8.7M $15.0MMA $3.9M $3.5M $3.4M $3.4M $3.4M $3.8M $3.4M $3.4M $3.4M $3.4M $4.1M $5.1M $5.1M $5.1M $5.1M $5.7M $5.1M $5.1M $5.1M $5.1M $6.1MLOP $2.6M $2.2M $2.1M $2.1M $2.1M $2.5M $2.1M $2.1M $2.1M $2.1M $3.4M $4.3M $4.3M $4.3M $4.3M $5.5M $4.3M $4.3M $4.3M $4.3M $6.7MECA $4.1M $4.2M $4.1M $4.1M $4.1M $4.5M $4.1M $4.1M $4.1M $4.1M $4.5M $4.1M $4.1M $4.1M $4.1M $4.5M $4.1M $4.1M $4.1M $4.1M $4.5M
Intermediate CA $4.2M $3.9M $3.9M $3.9M $3.9M $4.3M $3.9M $3.9M $3.9M $3.9M $5.4M $7.8M $7.8M $7.8M $7.8M $10.0M $7.8M $7.8M $7.8M $7.8M $11.1MRoot CA $1.6M $1.6M $1.6M $1.6M $1.6M $1.7M $1.6M $1.6M $1.6M $1.6M $1.7M $1.6M $1.6M $1.6M $1.6M $1.7M $1.6M $1.6M $1.6M $1.6M $1.7M
DCM $4.1M $4.2M $4.1M $4.1M $4.1M $4.5M $4.1M $4.1M $4.1M $4.1M $4.5M $4.1M $4.1M $4.1M $4.1M $4.5M $4.1M $4.1M $4.1M $4.1M $4.5MSCMS Manager $1.6M $1.9M $1.9M $1.9M $1.9M $2.0M $1.9M $1.9M $1.9M $1.9M $2.2M $2.8M $2.8M $2.8M $2.8M $2.9M $2.8M $2.8M $2.8M $2.8M $3.2M
Total Cost $41.1M $39.7M $39.4M $39.4M $39.5M $48.3M $39.6M $39.6M $39.7M $39.7M $60.2M $61.3M $61.4M $61.4M $61.5M $80.6M $61.5M $61.5M $61.6M $61.6M $93.9M
Function 21 22 23 24 25 26 27 28 29 30 31 32 33 34 35 36 37 38 39 40 TotalPCA $13.2M $13.2M $13.2M $13.2M $20.9M $13.2M $13.2M $13.3M $13.3M $25.5M $17.5M $17.5M $17.5M $17.5M $27.1M $17.5M $17.5M $17.5M $17.5M $30.0M $511.4MRA $18.3M $18.3M $18.3M $18.4M $27.2M $18.4M $18.4M $18.4M $18.4M $31.3M $22.6M $22.6M $22.6M $22.6M $33.4M $22.6M $22.6M $22.6M $22.6M $35.8M $722.8MLA $13.0M $13.0M $13.0M $13.0M $19.1M $13.0M $13.0M $13.0M $13.0M $22.3M $17.2M $17.2M $17.2M $17.2M $25.2M $17.2M $17.2M $17.2M $17.2M $26.7M $485.9MMA $6.8M $6.8M $6.8M $6.8M $7.5M $6.8M $6.8M $6.8M $6.8M $8.0M $8.5M $8.5M $8.5M $8.5M $9.3M $8.5M $8.5M $8.5M $8.5M $9.7M $249.1MLOP $6.4M $6.4M $6.4M $6.4M $8.8M $6.4M $6.4M $6.4M $6.4M $10.4M $8.5M $8.5M $8.5M $8.5M $11.8M $8.5M $8.5M $8.5M $8.5M $12.6M $235.1MECA $4.1M $4.1M $4.1M $4.1M $4.5M $4.1M $4.1M $4.1M $4.1M $4.5M $4.1M $4.1M $4.1M $4.1M $4.5M $4.1M $4.1M $4.1M $4.1M $4.5M $172.9M
Intermediate CA $11.7M $11.7M $11.7M $11.7M $16.0M $11.7M $11.7M $11.7M $11.7M $17.5M $15.7M $15.7M $15.7M $15.7M $21.4M $15.7M $15.7M $15.7M $15.7M $21.4M $424.6MRoot CA $1.6M $1.6M $1.6M $1.6M $1.7M $1.6M $1.6M $1.6M $1.6M $1.7M $1.6M $1.6M $1.6M $1.6M $1.7M $1.6M $1.6M $1.6M $1.6M $1.7M $65.0M
DCM $4.1M $4.1M $4.1M $4.1M $4.5M $4.1M $4.1M $4.1M $4.1M $4.5M $4.1M $4.1M $4.1M $4.1M $4.5M $4.1M $4.1M $4.1M $4.1M $4.5M $172.7MSCMS Manager $3.7M $3.7M $3.7M $3.7M $3.9M $3.7M $3.7M $3.7M $3.7M $3.9M $3.7M $3.7M $3.7M $3.7M $3.9M $3.7M $3.7M $3.7M $3.7M $3.9M $124.7M
Total Cost $83.1M $83.1M $83.1M $83.1M $114.2M $83.1M $83.1M $83.1M $83.2M $129.4M $103.7M $103.7M $103.7M $103.7M $142.7M $103.7M $103.7M $103.7M $103.7M $150.7M $3164.2MNPV, 2018 $1593.4M
Program YearFunctions

Appendix D Detailed SCMS Costs - DRAFT
Intelligent Transportation Systems Joint Program Office U.S. Department of Transportation, Research and Innovative Technology Administration
SCMS Design and Analysis for the Connected Vehicle System | 158
Table 38. Total System Costs: Scenario 3, Option 2, Annual Downloads
0 1 2 3 4 5 6 7 8 9 10 11 12 13 14 15 16 17 18 19 20PCA $5.5M $4.3M $4.3M $4.3M $4.3M $5.7M $4.3M $4.3M $4.3M $4.3M $7.6M $8.6M $8.6M $8.6M $8.6M $11.9M $8.6M $8.6M $8.7M $8.7M $14.3MRA $5.8M $9.6M $9.5M $9.5M $9.5M $11.7M $9.6M $9.6M $9.6M $9.6M $13.5M $13.8M $13.8M $13.8M $13.8M $18.3M $13.9M $13.9M $13.9M $13.9M $20.5MLA $5.1M $4.3M $4.3M $4.3M $4.3M $5.3M $4.3M $4.3M $4.3M $4.3M $6.8M $8.6M $8.6M $8.6M $8.6M $11.3M $8.6M $8.6M $8.6M $8.6M $13.3MMA $3.8M $3.5M $3.4M $3.4M $3.4M $3.8M $3.4M $3.4M $3.4M $3.4M $4.0M $5.1M $5.1M $5.1M $5.1M $5.6M $5.1M $5.1M $5.1M $5.1M $5.9MLOP $2.6M $2.2M $2.1M $2.1M $2.1M $2.5M $2.1M $2.1M $2.1M $2.1M $3.4M $4.3M $4.3M $4.3M $4.3M $5.5M $4.3M $4.3M $4.3M $4.3M $6.6MECA $4.1M $4.2M $4.1M $4.1M $4.1M $4.5M $4.1M $4.1M $4.1M $4.1M $4.5M $4.1M $4.1M $4.1M $4.1M $4.5M $4.1M $4.1M $4.1M $4.1M $4.5M
Intermediate CA $4.2M $3.9M $3.9M $3.9M $3.9M $4.3M $3.9M $3.9M $3.9M $3.9M $5.4M $7.8M $7.8M $7.8M $7.8M $10.0M $7.8M $7.8M $7.8M $7.8M $11.1MRoot CA $1.6M $1.6M $1.6M $1.6M $1.6M $1.7M $1.6M $1.6M $1.6M $1.6M $1.7M $1.6M $1.6M $1.6M $1.6M $1.7M $1.6M $1.6M $1.6M $1.6M $1.7M
DCM $4.1M $4.2M $4.1M $4.1M $4.1M $4.5M $4.1M $4.1M $4.1M $4.1M $4.5M $4.1M $4.1M $4.1M $4.1M $4.5M $4.1M $4.1M $4.1M $4.1M $4.5MSCMS Manager $1.6M $1.9M $1.9M $1.9M $1.9M $2.0M $1.9M $1.9M $1.9M $1.9M $2.2M $2.8M $2.8M $2.8M $2.8M $2.9M $2.8M $2.8M $2.8M $2.8M $3.2M
Total Cost $38.3M $39.6M $39.3M $39.3M $39.3M $45.9M $39.4M $39.4M $39.4M $39.4M $53.6M $60.9M $60.9M $60.9M $60.9M $76.1M $61.0M $61.0M $61.0M $61.0M $85.6M
Function 21 22 23 24 25 26 27 28 29 30 31 32 33 34 35 36 37 38 39 40 TotalPCA $12.9M $12.9M $12.9M $12.9M $18.6M $12.9M $12.9M $12.9M $12.9M $21.5M $17.2M $17.2M $17.2M $17.2M $24.6M $17.2M $17.2M $17.2M $17.2M $26.0M $480.2MRA $18.1M $18.1M $18.1M $18.1M $25.4M $18.1M $18.1M $18.1M $18.1M $28.2M $22.4M $22.4M $22.4M $22.4M $31.5M $22.4M $22.4M $22.4M $22.4M $32.7M $698.8MLA $12.8M $12.8M $12.8M $12.8M $18.0M $12.8M $12.8M $12.8M $12.8M $20.5M $17.1M $17.1M $17.1M $17.1M $23.9M $17.1M $17.1M $17.1M $17.1M $24.9M $471.3MMA $6.8M $6.8M $6.8M $6.8M $7.5M $6.8M $6.8M $6.8M $6.8M $7.8M $8.5M $8.5M $8.5M $8.5M $9.2M $8.5M $8.5M $8.5M $8.5M $9.5M $248.0MLOP $6.4M $6.4M $6.4M $6.4M $8.8M $6.4M $6.4M $6.4M $6.4M $10.3M $8.5M $8.5M $8.5M $8.5M $11.7M $8.5M $8.5M $8.5M $8.5M $12.5M $234.7MECA $4.1M $4.1M $4.1M $4.1M $4.5M $4.1M $4.1M $4.1M $4.1M $4.5M $4.1M $4.1M $4.1M $4.1M $4.5M $4.1M $4.1M $4.1M $4.1M $4.5M $172.9M
Intermediate CA $11.7M $11.7M $11.7M $11.7M $16.0M $11.7M $11.7M $11.7M $11.7M $17.5M $15.7M $15.7M $15.7M $15.7M $21.4M $15.7M $15.7M $15.7M $15.7M $21.4M $424.6MRoot CA $1.6M $1.6M $1.6M $1.6M $1.7M $1.6M $1.6M $1.6M $1.6M $1.7M $1.6M $1.6M $1.6M $1.6M $1.7M $1.6M $1.6M $1.6M $1.6M $1.7M $65.0M
DCM $4.1M $4.1M $4.1M $4.1M $4.5M $4.1M $4.1M $4.1M $4.1M $4.5M $4.1M $4.1M $4.1M $4.1M $4.5M $4.1M $4.1M $4.1M $4.1M $4.5M $172.7MSCMS Manager $3.7M $3.7M $3.7M $3.7M $3.9M $3.7M $3.7M $3.7M $3.7M $3.9M $3.7M $3.7M $3.7M $3.7M $3.9M $3.7M $3.7M $3.7M $3.7M $3.9M $124.7M
Total Cost $82.4M $82.4M $82.4M $82.4M $108.8M $82.4M $82.4M $82.4M $82.4M $120.4M $102.9M $102.9M $102.9M $102.9M $136.9M $102.9M $102.9M $102.9M $102.9M $141.5M $3092.9MNPV, 2018 $1557.3M
Program YearFunctions

Appendix D Detailed SCMS Costs - DRAFT
Intelligent Transportation Systems Joint Program Office U.S. Department of Transportation, Research and Innovative Technology Administration
SCMS Design and Analysis for the Connected Vehicle System | 159
Table 39. Total System Costs: Scenario 3, Option 2, Every Two Year Downloads
0 1 2 3 4 5 6 7 8 9 10 11 12 13 14 15 16 17 18 19 20PCA $6.0M $4.3M $4.3M $4.3M $4.3M $6.2M $4.4M $4.4M $4.4M $4.4M $9.1M $8.7M $8.7M $8.7M $8.8M $12.9M $8.8M $8.8M $8.8M $8.8M $16.1MRA $6.2M $9.6M $9.5M $9.5M $9.5M $12.1M $9.6M $9.6M $9.6M $9.6M $14.6M $13.9M $13.9M $13.9M $13.9M $19.0M $13.9M $14.0M $14.0M $14.0M $22.0MLA $5.4M $4.3M $4.3M $4.3M $4.3M $5.6M $4.3M $4.3M $4.3M $4.3M $7.5M $8.6M $8.6M $8.6M $8.6M $11.8M $8.6M $8.6M $8.6M $8.6M $14.1MMA $3.9M $3.5M $3.4M $3.4M $3.4M $3.8M $3.4M $3.4M $3.4M $3.4M $4.1M $5.1M $5.1M $5.1M $5.1M $5.7M $5.1M $5.1M $5.1M $5.1M $6.0MLOP $2.6M $2.2M $2.1M $2.1M $2.1M $2.5M $2.1M $2.1M $2.1M $2.1M $3.4M $4.3M $4.3M $4.3M $4.3M $5.5M $4.3M $4.3M $4.3M $4.3M $6.7MECA $4.1M $4.2M $4.1M $4.1M $4.1M $4.5M $4.1M $4.1M $4.1M $4.1M $4.5M $4.1M $4.1M $4.1M $4.1M $4.5M $4.1M $4.1M $4.1M $4.1M $4.5M
Intermediate CA $4.2M $3.9M $3.9M $3.9M $3.9M $4.3M $3.9M $3.9M $3.9M $3.9M $5.4M $7.8M $7.8M $7.8M $7.8M $10.0M $7.8M $7.8M $7.8M $7.8M $11.1MRoot CA $1.6M $1.6M $1.6M $1.6M $1.6M $1.7M $1.6M $1.6M $1.6M $1.6M $1.7M $1.6M $1.6M $1.6M $1.6M $1.7M $1.6M $1.6M $1.6M $1.6M $1.7M
DCM $4.1M $4.2M $4.1M $4.1M $4.1M $4.5M $4.1M $4.1M $4.1M $4.1M $4.5M $4.1M $4.1M $4.1M $4.1M $4.5M $4.1M $4.1M $4.1M $4.1M $4.5MSCMS Manager $1.6M $1.9M $1.9M $1.9M $1.9M $2.0M $1.9M $1.9M $1.9M $1.9M $2.2M $2.8M $2.8M $2.8M $2.8M $2.9M $2.8M $2.8M $2.8M $2.8M $3.2M
Total Cost $39.5M $39.7M $39.4M $39.4M $39.4M $47.2M $39.5M $39.5M $39.6M $39.6M $57.0M $61.1M $61.2M $61.2M $61.2M $78.4M $61.2M $61.3M $61.3M $61.3M $89.8M
Function 21 22 23 24 25 26 27 28 29 30 31 32 33 34 35 36 37 38 39 40 TotalPCA $13.1M $13.1M $13.1M $13.1M $19.8M $13.1M $13.1M $13.1M $13.1M $23.5M $17.4M $17.4M $17.4M $17.4M $25.9M $17.4M $17.4M $17.4M $17.4M $28.0M $495.9MRA $18.2M $18.2M $18.2M $18.2M $26.3M $18.2M $18.2M $18.2M $18.2M $29.8M $22.5M $22.5M $22.5M $22.5M $32.4M $22.5M $22.5M $22.5M $22.5M $34.2M $710.9MLA $12.9M $12.9M $12.9M $12.9M $18.6M $12.9M $12.9M $12.9M $12.9M $21.4M $17.2M $17.2M $17.2M $17.2M $24.6M $17.2M $17.2M $17.2M $17.2M $25.8M $478.7MMA $6.8M $6.8M $6.8M $6.8M $7.5M $6.8M $6.8M $6.8M $6.8M $7.9M $8.5M $8.5M $8.5M $8.5M $9.2M $8.5M $8.5M $8.5M $8.5M $9.6M $248.6MLOP $6.4M $6.4M $6.4M $6.4M $8.8M $6.4M $6.4M $6.4M $6.4M $10.3M $8.5M $8.5M $8.5M $8.5M $11.7M $8.5M $8.5M $8.5M $8.5M $12.5M $234.9MECA $4.1M $4.1M $4.1M $4.1M $4.5M $4.1M $4.1M $4.1M $4.1M $4.5M $4.1M $4.1M $4.1M $4.1M $4.5M $4.1M $4.1M $4.1M $4.1M $4.5M $172.9M
Intermediate CA $11.7M $11.7M $11.7M $11.7M $16.0M $11.7M $11.7M $11.7M $11.7M $17.5M $15.7M $15.7M $15.7M $15.7M $21.4M $15.7M $15.7M $15.7M $15.7M $21.4M $424.6MRoot CA $1.6M $1.6M $1.6M $1.6M $1.7M $1.6M $1.6M $1.6M $1.6M $1.7M $1.6M $1.6M $1.6M $1.6M $1.7M $1.6M $1.6M $1.6M $1.6M $1.7M $65.0M
DCM $4.1M $4.1M $4.1M $4.1M $4.5M $4.1M $4.1M $4.1M $4.1M $4.5M $4.1M $4.1M $4.1M $4.1M $4.5M $4.1M $4.1M $4.1M $4.1M $4.5M $172.7MSCMS Manager $3.7M $3.7M $3.7M $3.7M $3.9M $3.7M $3.7M $3.7M $3.7M $3.9M $3.7M $3.7M $3.7M $3.7M $3.9M $3.7M $3.7M $3.7M $3.7M $3.9M $124.7M
Total Cost $82.7M $82.7M $82.7M $82.8M $111.5M $82.8M $82.8M $82.8M $82.8M $124.9M $103.3M $103.3M $103.3M $103.3M $139.8M $103.3M $103.3M $103.3M $103.3M $146.1M $3128.8MNPV, 2018 $1575.4M
Program YearFunctions

Appendix D Detailed SCMS Costs - DRAFT
Intelligent Transportation Systems Joint Program Office U.S. Department of Transportation, Research and Innovative Technology Administration
SCMS Design and Analysis for the Connected Vehicle System | 160
Table 40. Total System Costs: Scenario 3, Option 2, Every Three Year Downloads
0 1 2 3 4 5 6 7 8 9 10 11 12 13 14 15 16 17 18 19 20PCA $6.5M $4.3M $4.3M $4.3M $4.3M $6.6M $4.4M $4.4M $4.5M $4.5M $10.4M $8.8M $8.8M $8.8M $8.9M $13.8M $8.9M $8.9M $8.9M $8.9M $17.9MRA $6.6M $9.6M $9.6M $9.6M $9.6M $12.4M $9.6M $9.6M $9.6M $9.7M $15.7M $14.0M $14.0M $14.0M $14.0M $19.7M $14.0M $14.0M $14.0M $14.1M $23.3MLA $5.6M $4.3M $4.3M $4.3M $4.3M $5.8M $4.3M $4.3M $4.3M $4.4M $8.2M $8.6M $8.7M $8.7M $8.7M $12.3M $8.7M $8.7M $8.7M $8.7M $15.0MMA $3.9M $3.5M $3.4M $3.4M $3.4M $3.8M $3.4M $3.4M $3.4M $3.4M $4.1M $5.1M $5.1M $5.1M $5.1M $5.7M $5.1M $5.1M $5.1M $5.1M $6.1MLOP $2.6M $2.2M $2.1M $2.1M $2.1M $2.5M $2.1M $2.1M $2.1M $2.1M $3.4M $4.3M $4.3M $4.3M $4.3M $5.5M $4.3M $4.3M $4.3M $4.3M $6.7MECA $4.1M $4.2M $4.1M $4.1M $4.1M $4.5M $4.1M $4.1M $4.1M $4.1M $4.5M $4.1M $4.1M $4.1M $4.1M $4.5M $4.1M $4.1M $4.1M $4.1M $4.5M
Intermediate CA $4.2M $3.9M $3.9M $3.9M $3.9M $4.3M $3.9M $3.9M $3.9M $3.9M $5.4M $7.8M $7.8M $7.8M $7.8M $10.0M $7.8M $7.8M $7.8M $7.8M $11.1MRoot CA $1.6M $1.6M $1.6M $1.6M $1.6M $1.7M $1.6M $1.6M $1.6M $1.6M $1.7M $1.6M $1.6M $1.6M $1.6M $1.7M $1.6M $1.6M $1.6M $1.6M $1.7M
DCM $4.1M $4.2M $4.1M $4.1M $4.1M $4.5M $4.1M $4.1M $4.1M $4.1M $4.5M $4.1M $4.1M $4.1M $4.1M $4.5M $4.1M $4.1M $4.1M $4.1M $4.5MSCMS Manager $1.6M $1.9M $1.9M $1.9M $1.9M $2.0M $1.9M $1.9M $1.9M $1.9M $2.2M $2.8M $2.8M $2.8M $2.8M $2.9M $2.8M $2.8M $2.8M $2.8M $3.2M
Total Cost $40.8M $39.7M $39.4M $39.4M $39.4M $48.2M $39.5M $39.6M $39.7M $39.7M $60.1M $61.3M $61.4M $61.4M $61.4M $80.6M $61.5M $61.5M $61.6M $61.6M $93.9M
Function 21 22 23 24 25 26 27 28 29 30 31 32 33 34 35 36 37 38 39 40 TotalPCA $13.2M $13.2M $13.2M $13.2M $20.9M $13.2M $13.2M $13.2M $13.3M $25.5M $17.5M $17.5M $17.5M $17.5M $27.1M $17.5M $17.5M $17.5M $17.5M $30.0M $511.0MRA $18.3M $18.3M $18.3M $18.4M $27.2M $18.4M $18.4M $18.4M $18.4M $31.3M $22.6M $22.6M $22.6M $22.6M $33.4M $22.6M $22.6M $22.6M $22.6M $35.8M $722.5MLA $13.0M $13.0M $13.0M $13.0M $19.1M $13.0M $13.0M $13.0M $13.0M $22.3M $17.2M $17.2M $17.2M $17.2M $25.2M $17.2M $17.2M $17.2M $17.2M $26.7M $485.7MMA $6.8M $6.8M $6.8M $6.8M $7.5M $6.8M $6.8M $6.8M $6.8M $8.0M $8.5M $8.5M $8.5M $8.5M $9.3M $8.5M $8.5M $8.5M $8.5M $9.7M $249.1MLOP $6.4M $6.4M $6.4M $6.4M $8.8M $6.4M $6.4M $6.4M $6.4M $10.4M $8.5M $8.5M $8.5M $8.5M $11.8M $8.5M $8.5M $8.5M $8.5M $12.6M $235.1MECA $4.1M $4.1M $4.1M $4.1M $4.5M $4.1M $4.1M $4.1M $4.1M $4.5M $4.1M $4.1M $4.1M $4.1M $4.5M $4.1M $4.1M $4.1M $4.1M $4.5M $172.9M
Intermediate CA $11.7M $11.7M $11.7M $11.7M $16.0M $11.7M $11.7M $11.7M $11.7M $17.5M $15.7M $15.7M $15.7M $15.7M $21.4M $15.7M $15.7M $15.7M $15.7M $21.4M $424.6MRoot CA $1.6M $1.6M $1.6M $1.6M $1.7M $1.6M $1.6M $1.6M $1.6M $1.7M $1.6M $1.6M $1.6M $1.6M $1.7M $1.6M $1.6M $1.6M $1.6M $1.7M $65.0M
DCM $4.1M $4.1M $4.1M $4.1M $4.5M $4.1M $4.1M $4.1M $4.1M $4.5M $4.1M $4.1M $4.1M $4.1M $4.5M $4.1M $4.1M $4.1M $4.1M $4.5M $172.7MSCMS Manager $3.7M $3.7M $3.7M $3.7M $3.9M $3.7M $3.7M $3.7M $3.7M $3.9M $3.7M $3.7M $3.7M $3.7M $3.9M $3.7M $3.7M $3.7M $3.7M $3.9M $124.7M
Total Cost $83.0M $83.1M $83.1M $83.1M $114.1M $83.1M $83.1M $83.1M $83.1M $129.4M $103.7M $103.7M $103.7M $103.7M $142.7M $103.7M $103.7M $103.7M $103.7M $150.7M $3163.1MNPV, 2018 $1592.5M
Program YearFunctions

Appendix D Detailed SCMS Costs - DRAFT
Intelligent Transportation Systems Joint Program Office U.S. Department of Transportation, Research and Innovative Technology Administration
SCMS Design and Analysis for the Connected Vehicle System | 161
Table 41. Total System Costs: Scenario 4, Option 2, Annual Downloads
0 1 2 3 4 5 6 7 8 9 10 11 12 13 14 15 16 17 18 19 20PCA $5.5M $4.3M $4.3M $4.3M $4.3M $5.6M $4.3M $4.3M $4.3M $4.3M $7.6M $8.6M $8.6M $8.6M $8.6M $11.9M $8.6M $8.6M $8.6M $8.7M $14.3MRA $5.8M $9.6M $9.5M $9.5M $9.5M $11.7M $9.5M $9.6M $9.6M $9.6M $13.5M $13.8M $13.8M $13.8M $13.8M $18.2M $13.9M $13.9M $13.9M $13.9M $20.5MLA $5.1M $4.3M $4.3M $4.3M $4.3M $5.3M $4.3M $4.3M $4.3M $4.3M $6.8M $8.6M $8.6M $8.6M $8.6M $11.3M $8.6M $8.6M $8.6M $8.6M $13.3MMA $3.8M $3.5M $3.4M $3.4M $3.4M $3.8M $3.4M $3.4M $3.4M $3.4M $4.0M $5.1M $5.1M $5.1M $5.1M $5.6M $5.1M $5.1M $5.1M $5.1M $5.9MLOP $2.6M $2.2M $2.1M $2.1M $2.1M $2.5M $2.1M $2.1M $2.1M $2.1M $3.4M $4.3M $4.3M $4.3M $4.3M $5.5M $4.3M $4.3M $4.3M $4.3M $6.6MECA $4.1M $4.2M $4.1M $4.1M $4.1M $4.5M $4.1M $4.1M $4.1M $4.1M $4.5M $4.1M $4.1M $4.1M $4.1M $4.5M $4.1M $4.1M $4.1M $4.1M $4.5M
Intermediate CA $4.2M $3.9M $3.9M $3.9M $3.9M $4.3M $3.9M $3.9M $3.9M $3.9M $5.4M $7.8M $7.8M $7.8M $7.8M $10.0M $7.8M $7.8M $7.8M $7.8M $11.1MRoot CA $1.6M $1.6M $1.6M $1.6M $1.6M $1.7M $1.6M $1.6M $1.6M $1.6M $1.7M $1.6M $1.6M $1.6M $1.6M $1.7M $1.6M $1.6M $1.6M $1.6M $1.7M
DCM $4.1M $4.2M $4.1M $4.1M $4.1M $4.5M $4.1M $4.1M $4.1M $4.1M $4.5M $4.1M $4.1M $4.1M $4.1M $4.5M $4.1M $4.1M $4.1M $4.1M $4.5MSCMS Manager $1.6M $1.9M $1.9M $1.9M $1.9M $2.0M $1.9M $1.9M $1.9M $1.9M $2.2M $2.8M $2.8M $2.8M $2.8M $2.9M $2.8M $2.8M $2.8M $2.8M $3.2M
Total Cost $38.2M $39.6M $39.3M $39.3M $39.3M $45.9M $39.4M $39.4M $39.4M $39.4M $53.6M $60.9M $60.9M $60.9M $60.9M $76.1M $61.0M $61.0M $61.0M $61.0M $85.6M
Function 21 22 23 24 25 26 27 28 29 30 31 32 33 34 35 36 37 38 39 40 TotalPCA $12.9M $12.9M $12.9M $12.9M $18.6M $12.9M $12.9M $12.9M $12.9M $21.5M $17.2M $17.2M $17.2M $17.2M $24.6M $17.2M $17.2M $17.2M $17.2M $26.0M $480.0MRA $18.1M $18.1M $18.1M $18.1M $25.4M $18.1M $18.1M $18.1M $18.1M $28.2M $22.4M $22.4M $22.4M $22.4M $31.5M $22.4M $22.4M $22.4M $22.4M $32.7M $698.7MLA $12.8M $12.8M $12.8M $12.8M $18.0M $12.8M $12.8M $12.8M $12.8M $20.5M $17.1M $17.1M $17.1M $17.1M $23.9M $17.1M $17.1M $17.1M $17.1M $24.9M $471.2MMA $6.8M $6.8M $6.8M $6.8M $7.5M $6.8M $6.8M $6.8M $6.8M $7.8M $8.5M $8.5M $8.5M $8.5M $9.2M $8.5M $8.5M $8.5M $8.5M $9.5M $248.0MLOP $6.4M $6.4M $6.4M $6.4M $8.8M $6.4M $6.4M $6.4M $6.4M $10.3M $8.5M $8.5M $8.5M $8.5M $11.7M $8.5M $8.5M $8.5M $8.5M $12.5M $234.7MECA $4.1M $4.1M $4.1M $4.1M $4.5M $4.1M $4.1M $4.1M $4.1M $4.5M $4.1M $4.1M $4.1M $4.1M $4.5M $4.1M $4.1M $4.1M $4.1M $4.5M $172.9M
Intermediate CA $11.7M $11.7M $11.7M $11.7M $16.0M $11.7M $11.7M $11.7M $11.7M $17.5M $15.7M $15.7M $15.7M $15.7M $21.4M $15.7M $15.7M $15.7M $15.7M $21.4M $424.6MRoot CA $1.6M $1.6M $1.6M $1.6M $1.7M $1.6M $1.6M $1.6M $1.6M $1.7M $1.6M $1.6M $1.6M $1.6M $1.7M $1.6M $1.6M $1.6M $1.6M $1.7M $65.0M
DCM $4.1M $4.1M $4.1M $4.1M $4.5M $4.1M $4.1M $4.1M $4.1M $4.5M $4.1M $4.1M $4.1M $4.1M $4.5M $4.1M $4.1M $4.1M $4.1M $4.5M $172.7MSCMS Manager $3.7M $3.7M $3.7M $3.7M $3.9M $3.7M $3.7M $3.7M $3.7M $3.9M $3.7M $3.7M $3.7M $3.7M $3.9M $3.7M $3.7M $3.7M $3.7M $3.9M $124.7M
Total Cost $82.4M $82.4M $82.4M $82.4M $108.8M $82.4M $82.4M $82.4M $82.4M $120.4M $102.9M $102.9M $102.9M $102.9M $136.9M $102.9M $102.9M $102.9M $102.9M $141.5M $3092.5MNPV, 2018 $1557.0M
Program YearFunctions

Appendix D Detailed SCMS Costs - DRAFT
Intelligent Transportation Systems Joint Program Office U.S. Department of Transportation, Research and Innovative Technology Administration
SCMS Design and Analysis for the Connected Vehicle System | 162
Table 42. Total System Costs: Scenario 4, Option 2, Every Two Year Downloads
0 1 2 3 4 5 6 7 8 9 10 11 12 13 14 15 16 17 18 19 20PCA $5.9M $4.3M $4.3M $4.3M $4.3M $6.2M $4.4M $4.4M $4.4M $4.4M $9.0M $8.7M $8.7M $8.7M $8.7M $12.8M $8.8M $8.8M $8.8M $8.8M $16.1MRA $6.1M $9.6M $9.5M $9.5M $9.5M $12.1M $9.6M $9.6M $9.6M $9.6M $14.6M $13.9M $13.9M $13.9M $13.9M $19.0M $13.9M $13.9M $14.0M $14.0M $21.9MLA $5.3M $4.3M $4.3M $4.3M $4.3M $5.6M $4.3M $4.3M $4.3M $4.3M $7.5M $8.6M $8.6M $8.6M $8.6M $11.8M $8.6M $8.6M $8.6M $8.6M $14.1MMA $3.9M $3.5M $3.4M $3.4M $3.4M $3.8M $3.4M $3.4M $3.4M $3.4M $4.1M $5.1M $5.1M $5.1M $5.1M $5.7M $5.1M $5.1M $5.1M $5.1M $6.0MLOP $2.6M $2.2M $2.1M $2.1M $2.1M $2.5M $2.1M $2.1M $2.1M $2.1M $3.4M $4.3M $4.3M $4.3M $4.3M $5.5M $4.3M $4.3M $4.3M $4.3M $6.7MECA $4.1M $4.2M $4.1M $4.1M $4.1M $4.5M $4.1M $4.1M $4.1M $4.1M $4.5M $4.1M $4.1M $4.1M $4.1M $4.5M $4.1M $4.1M $4.1M $4.1M $4.5M
Intermediate CA $4.2M $3.9M $3.9M $3.9M $3.9M $4.3M $3.9M $3.9M $3.9M $3.9M $5.4M $7.8M $7.8M $7.8M $7.8M $10.0M $7.8M $7.8M $7.8M $7.8M $11.1MRoot CA $1.6M $1.6M $1.6M $1.6M $1.6M $1.7M $1.6M $1.6M $1.6M $1.6M $1.7M $1.6M $1.6M $1.6M $1.6M $1.7M $1.6M $1.6M $1.6M $1.6M $1.7M
DCM $4.1M $4.2M $4.1M $4.1M $4.1M $4.5M $4.1M $4.1M $4.1M $4.1M $4.5M $4.1M $4.1M $4.1M $4.1M $4.5M $4.1M $4.1M $4.1M $4.1M $4.5MSCMS Manager $1.6M $1.9M $1.9M $1.9M $1.9M $2.0M $1.9M $1.9M $1.9M $1.9M $2.2M $2.8M $2.8M $2.8M $2.8M $2.9M $2.8M $2.8M $2.8M $2.8M $3.2M
Total Cost $39.3M $39.6M $39.3M $39.4M $39.4M $47.1M $39.5M $39.5M $39.5M $39.6M $56.9M $61.1M $61.2M $61.2M $61.2M $78.4M $61.2M $61.3M $61.3M $61.3M $89.8M
Function 21 22 23 24 25 26 27 28 29 30 31 32 33 34 35 36 37 38 39 40 TotalPCA $13.1M $13.1M $13.1M $13.1M $19.8M $13.1M $13.1M $13.1M $13.1M $23.5M $17.4M $17.4M $17.4M $17.4M $25.9M $17.4M $17.4M $17.4M $17.4M $28.0M $495.6MRA $18.2M $18.2M $18.2M $18.2M $26.3M $18.2M $18.2M $18.2M $18.2M $29.8M $22.5M $22.5M $22.5M $22.5M $32.4M $22.5M $22.5M $22.5M $22.5M $34.2M $710.7MLA $12.9M $12.9M $12.9M $12.9M $18.5M $12.9M $12.9M $12.9M $12.9M $21.4M $17.2M $17.2M $17.2M $17.2M $24.6M $17.2M $17.2M $17.2M $17.2M $25.8M $478.5MMA $6.8M $6.8M $6.8M $6.8M $7.5M $6.8M $6.8M $6.8M $6.8M $7.9M $8.5M $8.5M $8.5M $8.5M $9.2M $8.5M $8.5M $8.5M $8.5M $9.6M $248.5MLOP $6.4M $6.4M $6.4M $6.4M $8.8M $6.4M $6.4M $6.4M $6.4M $10.3M $8.5M $8.5M $8.5M $8.5M $11.7M $8.5M $8.5M $8.5M $8.5M $12.5M $234.9MECA $4.1M $4.1M $4.1M $4.1M $4.5M $4.1M $4.1M $4.1M $4.1M $4.5M $4.1M $4.1M $4.1M $4.1M $4.5M $4.1M $4.1M $4.1M $4.1M $4.5M $172.9M
Intermediate CA $11.7M $11.7M $11.7M $11.7M $16.0M $11.7M $11.7M $11.7M $11.7M $17.5M $15.7M $15.7M $15.7M $15.7M $21.4M $15.7M $15.7M $15.7M $15.7M $21.4M $424.6MRoot CA $1.6M $1.6M $1.6M $1.6M $1.7M $1.6M $1.6M $1.6M $1.6M $1.7M $1.6M $1.6M $1.6M $1.6M $1.7M $1.6M $1.6M $1.6M $1.6M $1.7M $65.0M
DCM $4.1M $4.1M $4.1M $4.1M $4.5M $4.1M $4.1M $4.1M $4.1M $4.5M $4.1M $4.1M $4.1M $4.1M $4.5M $4.1M $4.1M $4.1M $4.1M $4.5M $172.7MSCMS Manager $3.7M $3.7M $3.7M $3.7M $3.9M $3.7M $3.7M $3.7M $3.7M $3.9M $3.7M $3.7M $3.7M $3.7M $3.9M $3.7M $3.7M $3.7M $3.7M $3.9M $124.7M
Total Cost $82.7M $82.7M $82.7M $82.8M $111.5M $82.8M $82.8M $82.8M $82.8M $124.9M $103.3M $103.3M $103.3M $103.3M $139.8M $103.3M $103.3M $103.3M $103.3M $146.1M $3128.1MNPV, 2018 $1574.9M
Program YearFunctions

Appendix D Detailed SCMS Costs - DRAFT
Intelligent Transportation Systems Joint Program Office U.S. Department of Transportation, Research and Innovative Technology Administration
SCMS Design and Analysis for the Connected Vehicle System | 163
Table 43. Total System Costs: Scenario 4, Option 2, Every Three Year Downloads
0 1 2 3 4 5 6 7 8 9 10 11 12 13 14 15 16 17 18 19 20PCA $6.4M $4.3M $4.3M $4.3M $4.3M $6.6M $4.4M $4.4M $4.4M $4.5M $10.4M $8.8M $8.8M $8.8M $8.9M $13.8M $8.9M $8.9M $8.9M $8.9M $17.9MRA $6.5M $9.6M $9.5M $9.6M $9.6M $12.4M $9.6M $9.6M $9.6M $9.7M $15.6M $14.0M $14.0M $14.0M $14.0M $19.7M $14.0M $14.0M $14.0M $14.1M $23.3MLA $5.5M $4.3M $4.3M $4.3M $4.3M $5.8M $4.3M $4.3M $4.3M $4.3M $8.1M $8.6M $8.6M $8.7M $8.7M $12.3M $8.7M $8.7M $8.7M $8.7M $14.9MMA $3.9M $3.5M $3.4M $3.4M $3.4M $3.8M $3.4M $3.4M $3.4M $3.4M $4.1M $5.1M $5.1M $5.1M $5.1M $5.7M $5.1M $5.1M $5.1M $5.1M $6.1MLOP $2.6M $2.2M $2.1M $2.1M $2.1M $2.5M $2.1M $2.1M $2.1M $2.1M $3.4M $4.3M $4.3M $4.3M $4.3M $5.5M $4.3M $4.3M $4.3M $4.3M $6.7MECA $4.1M $4.2M $4.1M $4.1M $4.1M $4.5M $4.1M $4.1M $4.1M $4.1M $4.5M $4.1M $4.1M $4.1M $4.1M $4.5M $4.1M $4.1M $4.1M $4.1M $4.5M
Intermediate CA $4.2M $3.9M $3.9M $3.9M $3.9M $4.3M $3.9M $3.9M $3.9M $3.9M $5.4M $7.8M $7.8M $7.8M $7.8M $10.0M $7.8M $7.8M $7.8M $7.8M $11.1MRoot CA $1.6M $1.6M $1.6M $1.6M $1.6M $1.7M $1.6M $1.6M $1.6M $1.6M $1.7M $1.6M $1.6M $1.6M $1.6M $1.7M $1.6M $1.6M $1.6M $1.6M $1.7M
DCM $4.1M $4.2M $4.1M $4.1M $4.1M $4.5M $4.1M $4.1M $4.1M $4.1M $4.5M $4.1M $4.1M $4.1M $4.1M $4.5M $4.1M $4.1M $4.1M $4.1M $4.5MSCMS Manager $1.6M $1.9M $1.9M $1.9M $1.9M $2.0M $1.9M $1.9M $1.9M $1.9M $2.2M $2.8M $2.8M $2.8M $2.8M $2.9M $2.8M $2.8M $2.8M $2.8M $3.2M
Total Cost $40.4M $39.7M $39.4M $39.4M $39.4M $48.0M $39.5M $39.6M $39.6M $39.7M $60.0M $61.3M $61.4M $61.4M $61.4M $80.5M $61.5M $61.5M $61.6M $61.6M $93.9M
Function 21 22 23 24 25 26 27 28 29 30 31 32 33 34 35 36 37 38 39 40 TotalPCA $13.2M $13.2M $13.2M $13.2M $20.9M $13.2M $13.2M $13.2M $13.3M $25.5M $17.5M $17.5M $17.5M $17.5M $27.1M $17.5M $17.5M $17.5M $17.5M $30.0M $510.5MRA $18.3M $18.3M $18.3M $18.4M $27.2M $18.4M $18.4M $18.4M $18.4M $31.3M $22.6M $22.6M $22.6M $22.6M $33.4M $22.6M $22.6M $22.6M $22.6M $35.8M $722.1MLA $13.0M $13.0M $13.0M $13.0M $19.1M $13.0M $13.0M $13.0M $13.0M $22.2M $17.2M $17.2M $17.2M $17.2M $25.2M $17.2M $17.2M $17.2M $17.2M $26.7M $485.5MMA $6.8M $6.8M $6.8M $6.8M $7.5M $6.8M $6.8M $6.8M $6.8M $8.0M $8.5M $8.5M $8.5M $8.5M $9.3M $8.5M $8.5M $8.5M $8.5M $9.7M $249.1MLOP $6.4M $6.4M $6.4M $6.4M $8.8M $6.4M $6.4M $6.4M $6.4M $10.4M $8.5M $8.5M $8.5M $8.5M $11.8M $8.5M $8.5M $8.5M $8.5M $12.6M $235.0MECA $4.1M $4.1M $4.1M $4.1M $4.5M $4.1M $4.1M $4.1M $4.1M $4.5M $4.1M $4.1M $4.1M $4.1M $4.5M $4.1M $4.1M $4.1M $4.1M $4.5M $172.9M
Intermediate CA $11.7M $11.7M $11.7M $11.7M $16.0M $11.7M $11.7M $11.7M $11.7M $17.5M $15.7M $15.7M $15.7M $15.7M $21.4M $15.7M $15.7M $15.7M $15.7M $21.4M $424.6MRoot CA $1.6M $1.6M $1.6M $1.6M $1.7M $1.6M $1.6M $1.6M $1.6M $1.7M $1.6M $1.6M $1.6M $1.6M $1.7M $1.6M $1.6M $1.6M $1.6M $1.7M $65.0M
DCM $4.1M $4.1M $4.1M $4.1M $4.5M $4.1M $4.1M $4.1M $4.1M $4.5M $4.1M $4.1M $4.1M $4.1M $4.5M $4.1M $4.1M $4.1M $4.1M $4.5M $172.7MSCMS Manager $3.7M $3.7M $3.7M $3.7M $3.9M $3.7M $3.7M $3.7M $3.7M $3.9M $3.7M $3.7M $3.7M $3.7M $3.9M $3.7M $3.7M $3.7M $3.7M $3.9M $124.7M
Total Cost $83.0M $83.1M $83.1M $83.1M $114.1M $83.1M $83.1M $83.1M $83.1M $129.3M $103.7M $103.7M $103.7M $103.7M $142.7M $103.7M $103.7M $103.7M $103.7M $150.7M $3162.1MNPV, 2018 $1591.7M
Program YearFunctions
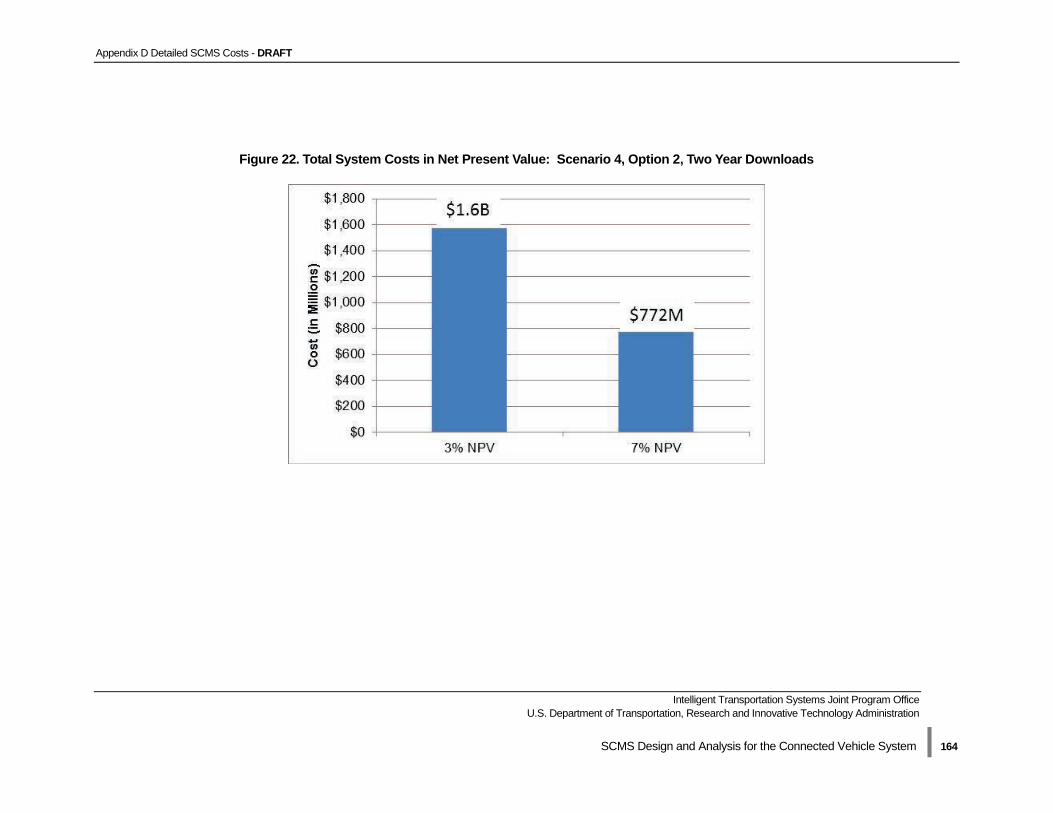
Appendix D Detailed SCMS Costs - DRAFT
Intelligent Transportation Systems Joint Program Office U.S. Department of Transportation, Research and Innovative Technology Administration
SCMS Design and Analysis for the Connected Vehicle System | 164
Figure 22. Total System Costs in Net Present Value: Scenario 4, Option 2, Two Year Downloads
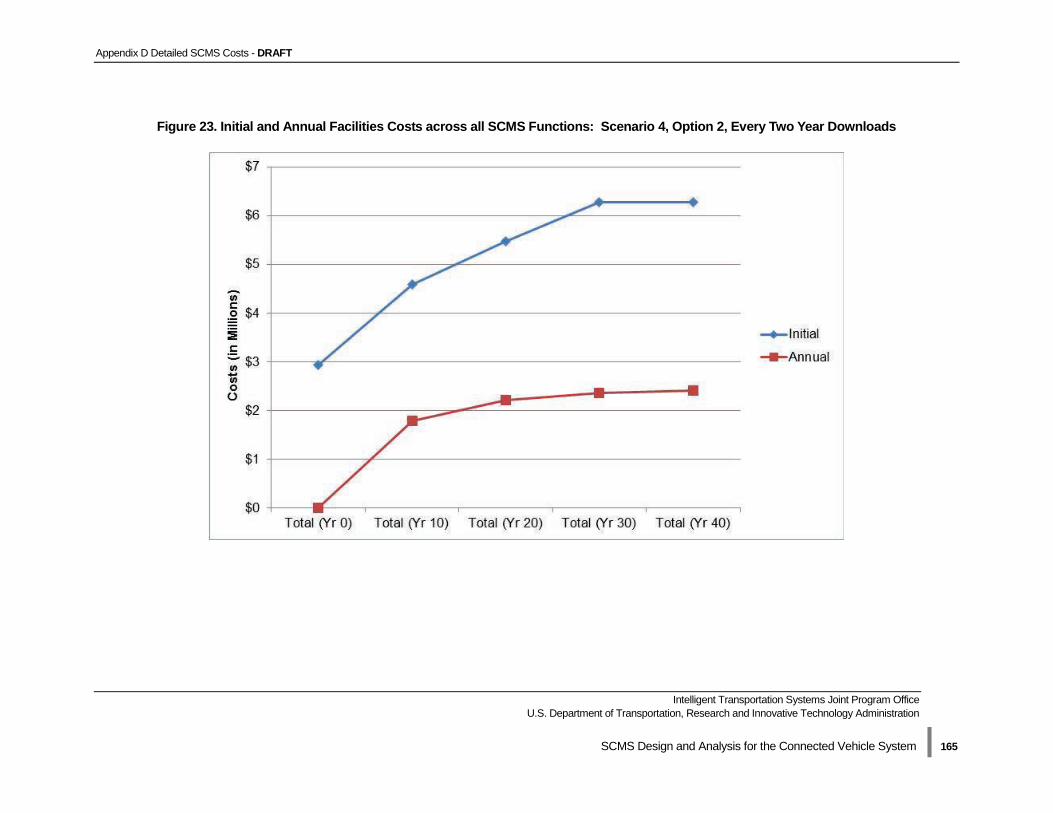
Appendix D Detailed SCMS Costs - DRAFT
Intelligent Transportation Systems Joint Program Office U.S. Department of Transportation, Research and Innovative Technology Administration
SCMS Design and Analysis for the Connected Vehicle System | 165
Figure 23. Initial and Annual Facilities Costs across all SCMS Functions: Scenario 4, Option 2, Every Two Year Downloads
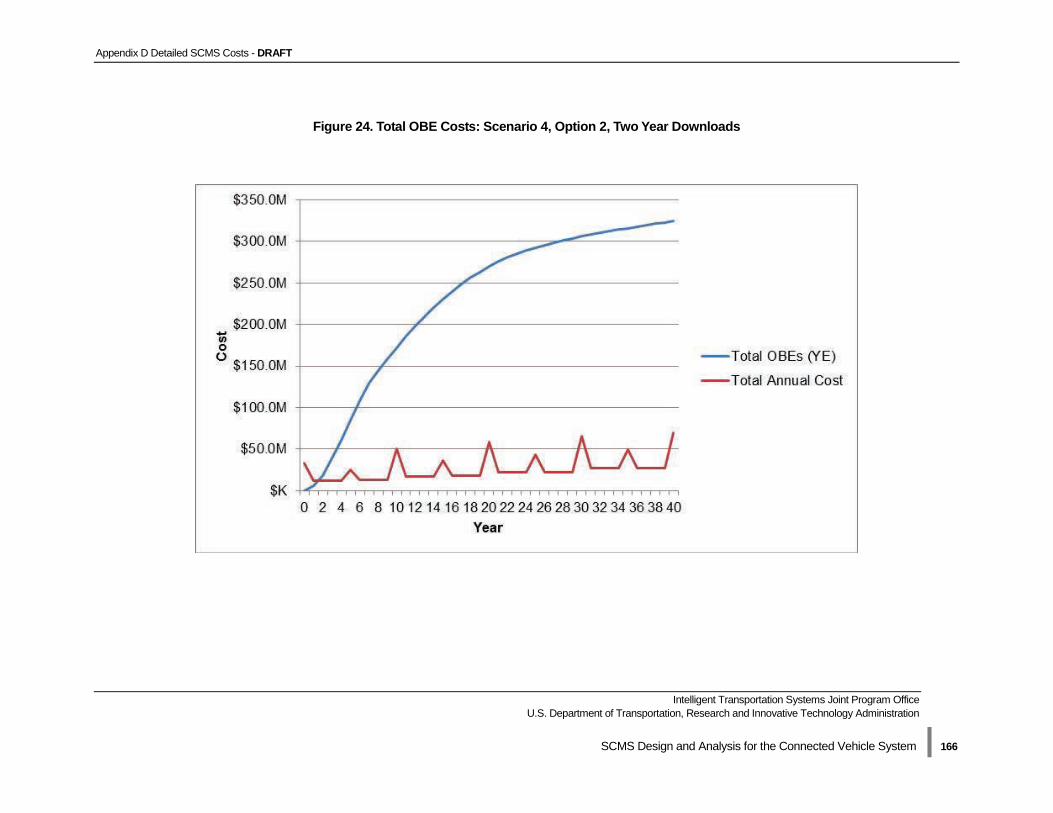
Appendix D Detailed SCMS Costs - DRAFT
Intelligent Transportation Systems Joint Program Office U.S. Department of Transportation, Research and Innovative Technology Administration
SCMS Design and Analysis for the Connected Vehicle System | 166
Figure 24. Total OBE Costs: Scenario 4, Option 2, Two Year Downloads
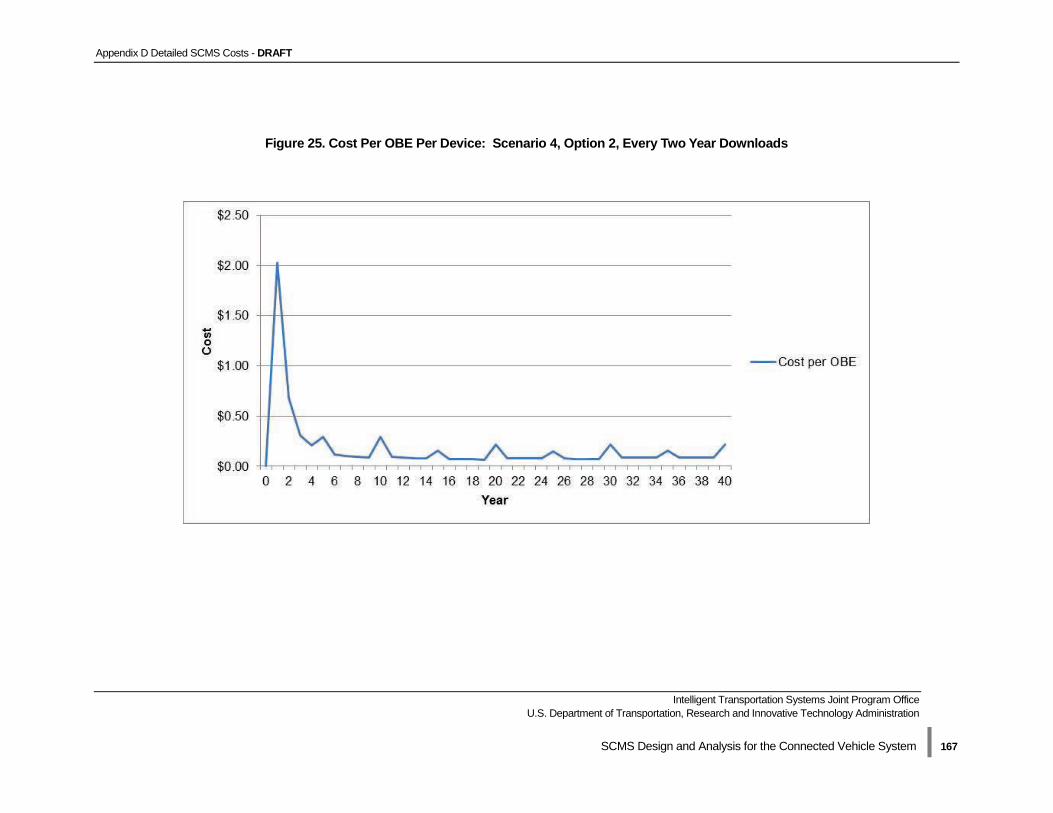
Appendix D Detailed SCMS Costs - DRAFT
Intelligent Transportation Systems Joint Program Office U.S. Department of Transportation, Research and Innovative Technology Administration
SCMS Design and Analysis for the Connected Vehicle System | 167
Figure 25. Cost Per OBE Per Device: Scenario 4, Option 2, Every Two Year Downloads
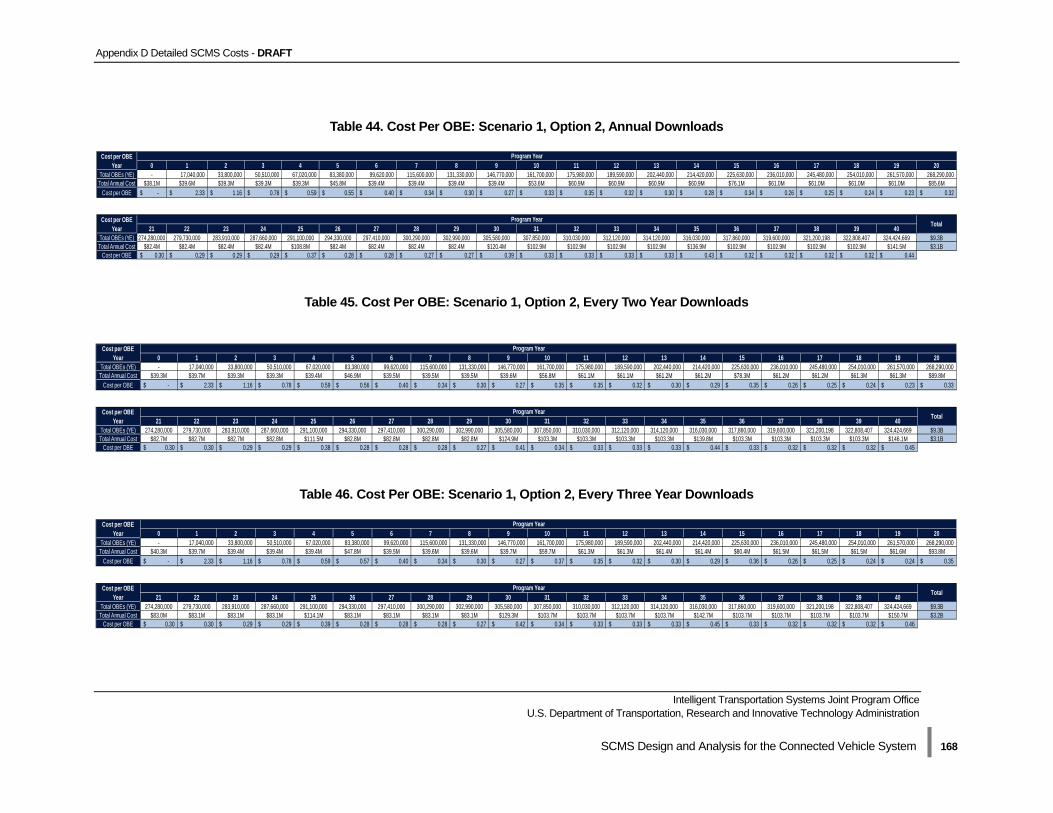
Appendix D Detailed SCMS Costs - DRAFT
Intelligent Transportation Systems Joint Program Office U.S. Department of Transportation, Research and Innovative Technology Administration
SCMS Design and Analysis for the Connected Vehicle System | 168
Table 44. Cost Per OBE: Scenario 1, Option 2, Annual Downloads
Cost per OBEYear 0 1 2 3 4 5 6 7 8 9 10 11 12 13 14 15 16 17 18 19 20
Total OBEs (YE) - 17,040,000 33,800,000 50,510,000 67,020,000 83,380,000 99,620,000 115,600,000 131,330,000 146,770,000 161,700,000 175,980,000 189,590,000 202,440,000 214,420,000 225,630,000 236,010,000 245,480,000 254,010,000 261,570,000 268,290,000 Total Annual Cost $38.1M $39.6M $39.3M $39.3M $39.3M $45.8M $39.4M $39.4M $39.4M $39.4M $53.6M $60.9M $60.9M $60.9M $60.9M $76.1M $61.0M $61.0M $61.0M $61.0M $85.6M
Cost per OBE -$ 2.33$ 1.16$ 0.78$ 0.59$ 0.55$ 0.40$ 0.34$ 0.30$ 0.27$ 0.33$ 0.35$ 0.32$ 0.30$ 0.28$ 0.34$ 0.26$ 0.25$ 0.24$ 0.23$ 0.32$
Cost per OBEYear 21 22 23 24 25 26 27 28 29 30 31 32 33 34 35 36 37 38 39 40
Total OBEs (YE) 274,280,000 279,730,000 283,910,000 287,660,000 291,100,000 294,330,000 297,410,000 300,290,000 302,990,000 305,580,000 307,850,000 310,030,000 312,120,000 314,120,000 316,030,000 317,860,000 319,600,000 321,200,198 322,808,407 324,424,669 $9.3BTotal Annual Cost $82.4M $82.4M $82.4M $82.4M $108.8M $82.4M $82.4M $82.4M $82.4M $120.4M $102.9M $102.9M $102.9M $102.9M $136.9M $102.9M $102.9M $102.9M $102.9M $141.5M $3.1B
Cost per OBE 0.30$ 0.29$ 0.29$ 0.29$ 0.37$ 0.28$ 0.28$ 0.27$ 0.27$ 0.39$ 0.33$ 0.33$ 0.33$ 0.33$ 0.43$ 0.32$ 0.32$ 0.32$ 0.32$ 0.44$
Program Year
Program Year Total
Table 45. Cost Per OBE: Scenario 1, Option 2, Every Two Year Downloads
Cost per OBE
Year 0 1 2 3 4 5 6 7 8 9 10 11 12 13 14 15 16 17 18 19 20Total OBEs (YE) - 17,040,000 33,800,000 50,510,000 67,020,000 83,380,000 99,620,000 115,600,000 131,330,000 146,770,000 161,700,000 175,980,000 189,590,000 202,440,000 214,420,000 225,630,000 236,010,000 245,480,000 254,010,000 261,570,000 268,290,000 Total Annual Cost $39.3M $39.7M $39.3M $39.3M $39.4M $46.9M $39.5M $39.5M $39.5M $39.6M $56.8M $61.1M $61.1M $61.2M $61.2M $78.3M $61.2M $61.2M $61.3M $61.3M $89.8M
Cost per OBE -$ 2.33$ 1.16$ 0.78$ 0.59$ 0.56$ 0.40$ 0.34$ 0.30$ 0.27$ 0.35$ 0.35$ 0.32$ 0.30$ 0.29$ 0.35$ 0.26$ 0.25$ 0.24$ 0.23$ 0.33$
Cost per OBEYear 21 22 23 24 25 26 27 28 29 30 31 32 33 34 35 36 37 38 39 40
Total OBEs (YE) 274,280,000 279,730,000 283,910,000 287,660,000 291,100,000 294,330,000 297,410,000 300,290,000 302,990,000 305,580,000 307,850,000 310,030,000 312,120,000 314,120,000 316,030,000 317,860,000 319,600,000 321,200,198 322,808,407 324,424,669 $9.3BTotal Annual Cost $82.7M $82.7M $82.7M $82.8M $111.5M $82.8M $82.8M $82.8M $82.8M $124.9M $103.3M $103.3M $103.3M $103.3M $139.8M $103.3M $103.3M $103.3M $103.3M $146.1M $3.1B
Cost per OBE 0.30$ 0.30$ 0.29$ 0.29$ 0.38$ 0.28$ 0.28$ 0.28$ 0.27$ 0.41$ 0.34$ 0.33$ 0.33$ 0.33$ 0.44$ 0.33$ 0.32$ 0.32$ 0.32$ 0.45$
Program Year
Program Year Total
Table 46. Cost Per OBE: Scenario 1, Option 2, Every Three Year Downloads
Cost per OBEYear 0 1 2 3 4 5 6 7 8 9 10 11 12 13 14 15 16 17 18 19 20
Total OBEs (YE) - 17,040,000 33,800,000 50,510,000 67,020,000 83,380,000 99,620,000 115,600,000 131,330,000 146,770,000 161,700,000 175,980,000 189,590,000 202,440,000 214,420,000 225,630,000 236,010,000 245,480,000 254,010,000 261,570,000 268,290,000 Total Annual Cost $40.3M $39.7M $39.4M $39.4M $39.4M $47.8M $39.5M $39.6M $39.6M $39.7M $59.7M $61.3M $61.3M $61.4M $61.4M $80.4M $61.5M $61.5M $61.5M $61.6M $93.8M
Cost per OBE -$ 2.33$ 1.16$ 0.78$ 0.59$ 0.57$ 0.40$ 0.34$ 0.30$ 0.27$ 0.37$ 0.35$ 0.32$ 0.30$ 0.29$ 0.36$ 0.26$ 0.25$ 0.24$ 0.24$ 0.35$
Cost per OBEYear 21 22 23 24 25 26 27 28 29 30 31 32 33 34 35 36 37 38 39 40
Total OBEs (YE) 274,280,000 279,730,000 283,910,000 287,660,000 291,100,000 294,330,000 297,410,000 300,290,000 302,990,000 305,580,000 307,850,000 310,030,000 312,120,000 314,120,000 316,030,000 317,860,000 319,600,000 321,200,198 322,808,407 324,424,669 $9.3BTotal Annual Cost $83.0M $83.1M $83.1M $83.1M $114.1M $83.1M $83.1M $83.1M $83.1M $129.3M $103.7M $103.7M $103.7M $103.7M $142.7M $103.7M $103.7M $103.7M $103.7M $150.7M $3.2B
Cost per OBE 0.30$ 0.30$ 0.29$ 0.29$ 0.39$ 0.28$ 0.28$ 0.28$ 0.27$ 0.42$ 0.34$ 0.33$ 0.33$ 0.33$ 0.45$ 0.33$ 0.32$ 0.32$ 0.32$ 0.46$
Program Year
Program Year Total
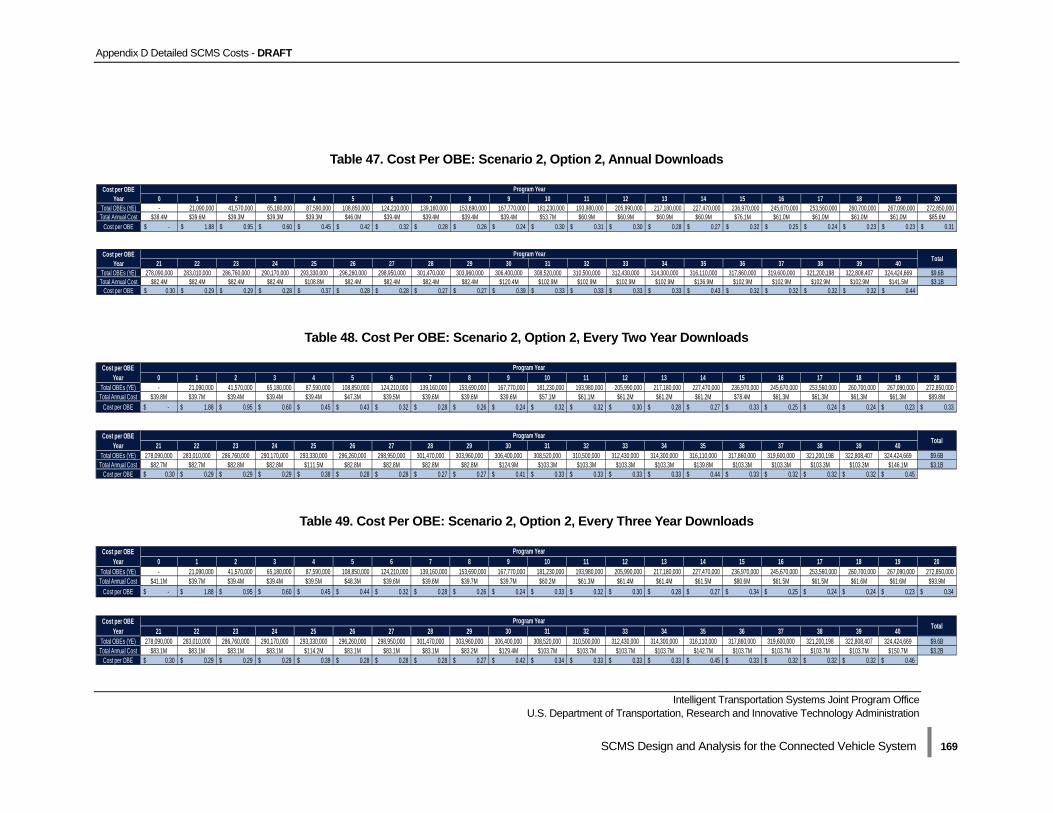
Appendix D Detailed SCMS Costs - DRAFT
Intelligent Transportation Systems Joint Program Office U.S. Department of Transportation, Research and Innovative Technology Administration
SCMS Design and Analysis for the Connected Vehicle System | 169
Table 47. Cost Per OBE: Scenario 2, Option 2, Annual Downloads
Cost per OBEYear 0 1 2 3 4 5 6 7 8 9 10 11 12 13 14 15 16 17 18 19 20
Total OBEs (YE) - 21,090,000 41,570,000 65,180,000 87,590,000 108,850,000 124,210,000 139,160,000 153,690,000 167,770,000 181,230,000 193,980,000 205,990,000 217,180,000 227,470,000 236,970,000 245,670,000 253,560,000 260,700,000 267,090,000 272,850,000 Total Annual Cost $38.4M $39.6M $39.3M $39.3M $39.3M $46.0M $39.4M $39.4M $39.4M $39.4M $53.7M $60.9M $60.9M $60.9M $60.9M $76.1M $61.0M $61.0M $61.0M $61.0M $85.6M
Cost per OBE -$ 1.88$ 0.95$ 0.60$ 0.45$ 0.42$ 0.32$ 0.28$ 0.26$ 0.24$ 0.30$ 0.31$ 0.30$ 0.28$ 0.27$ 0.32$ 0.25$ 0.24$ 0.23$ 0.23$ 0.31$
Cost per OBEYear 21 22 23 24 25 26 27 28 29 30 31 32 33 34 35 36 37 38 39 40
Total OBEs (YE) 278,090,000 283,010,000 286,760,000 290,170,000 293,330,000 296,260,000 298,950,000 301,470,000 303,960,000 306,400,000 308,520,000 310,500,000 312,430,000 314,300,000 316,110,000 317,860,000 319,600,000 321,200,198 322,808,407 324,424,669 $9.6BTotal Annual Cost $82.4M $82.4M $82.4M $82.4M $108.8M $82.4M $82.4M $82.4M $82.4M $120.4M $102.9M $102.9M $102.9M $102.9M $136.9M $102.9M $102.9M $102.9M $102.9M $141.5M $3.1B
Cost per OBE 0.30$ 0.29$ 0.29$ 0.28$ 0.37$ 0.28$ 0.28$ 0.27$ 0.27$ 0.39$ 0.33$ 0.33$ 0.33$ 0.33$ 0.43$ 0.32$ 0.32$ 0.32$ 0.32$ 0.44$
Program Year
Program Year Total
Table 48. Cost Per OBE: Scenario 2, Option 2, Every Two Year Downloads
Cost per OBEYear 0 1 2 3 4 5 6 7 8 9 10 11 12 13 14 15 16 17 18 19 20
Total OBEs (YE) - 21,090,000 41,570,000 65,180,000 87,590,000 108,850,000 124,210,000 139,160,000 153,690,000 167,770,000 181,230,000 193,980,000 205,990,000 217,180,000 227,470,000 236,970,000 245,670,000 253,560,000 260,700,000 267,090,000 272,850,000 Total Annual Cost $39.8M $39.7M $39.4M $39.4M $39.4M $47.3M $39.5M $39.6M $39.6M $39.6M $57.1M $61.1M $61.2M $61.2M $61.2M $78.4M $61.3M $61.3M $61.3M $61.3M $89.8M
Cost per OBE -$ 1.88$ 0.95$ 0.60$ 0.45$ 0.43$ 0.32$ 0.28$ 0.26$ 0.24$ 0.32$ 0.32$ 0.30$ 0.28$ 0.27$ 0.33$ 0.25$ 0.24$ 0.24$ 0.23$ 0.33$
Cost per OBEYear 21 22 23 24 25 26 27 28 29 30 31 32 33 34 35 36 37 38 39 40
Total OBEs (YE) 278,090,000 283,010,000 286,760,000 290,170,000 293,330,000 296,260,000 298,950,000 301,470,000 303,960,000 306,400,000 308,520,000 310,500,000 312,430,000 314,300,000 316,110,000 317,860,000 319,600,000 321,200,198 322,808,407 324,424,669 $9.6BTotal Annual Cost $82.7M $82.7M $82.8M $82.8M $111.5M $82.8M $82.8M $82.8M $82.8M $124.9M $103.3M $103.3M $103.3M $103.3M $139.8M $103.3M $103.3M $103.3M $103.3M $146.1M $3.1B
Cost per OBE 0.30$ 0.29$ 0.29$ 0.29$ 0.38$ 0.28$ 0.28$ 0.27$ 0.27$ 0.41$ 0.33$ 0.33$ 0.33$ 0.33$ 0.44$ 0.33$ 0.32$ 0.32$ 0.32$ 0.45$
Program Year
Program Year Total
Table 49. Cost Per OBE: Scenario 2, Option 2, Every Three Year Downloads
Cost per OBEYear 0 1 2 3 4 5 6 7 8 9 10 11 12 13 14 15 16 17 18 19 20
Total OBEs (YE) - 21,090,000 41,570,000 65,180,000 87,590,000 108,850,000 124,210,000 139,160,000 153,690,000 167,770,000 181,230,000 193,980,000 205,990,000 217,180,000 227,470,000 236,970,000 245,670,000 253,560,000 260,700,000 267,090,000 272,850,000 Total Annual Cost $41.1M $39.7M $39.4M $39.4M $39.5M $48.3M $39.6M $39.6M $39.7M $39.7M $60.2M $61.3M $61.4M $61.4M $61.5M $80.6M $61.5M $61.5M $61.6M $61.6M $93.9M
Cost per OBE -$ 1.88$ 0.95$ 0.60$ 0.45$ 0.44$ 0.32$ 0.28$ 0.26$ 0.24$ 0.33$ 0.32$ 0.30$ 0.28$ 0.27$ 0.34$ 0.25$ 0.24$ 0.24$ 0.23$ 0.34$
Cost per OBEYear 21 22 23 24 25 26 27 28 29 30 31 32 33 34 35 36 37 38 39 40
Total OBEs (YE) 278,090,000 283,010,000 286,760,000 290,170,000 293,330,000 296,260,000 298,950,000 301,470,000 303,960,000 306,400,000 308,520,000 310,500,000 312,430,000 314,300,000 316,110,000 317,860,000 319,600,000 321,200,198 322,808,407 324,424,669 $9.6BTotal Annual Cost $83.1M $83.1M $83.1M $83.1M $114.2M $83.1M $83.1M $83.1M $83.2M $129.4M $103.7M $103.7M $103.7M $103.7M $142.7M $103.7M $103.7M $103.7M $103.7M $150.7M $3.2B
Cost per OBE 0.30$ 0.29$ 0.29$ 0.29$ 0.39$ 0.28$ 0.28$ 0.28$ 0.27$ 0.42$ 0.34$ 0.33$ 0.33$ 0.33$ 0.45$ 0.33$ 0.32$ 0.32$ 0.32$ 0.46$
Program Year
Program Year Total
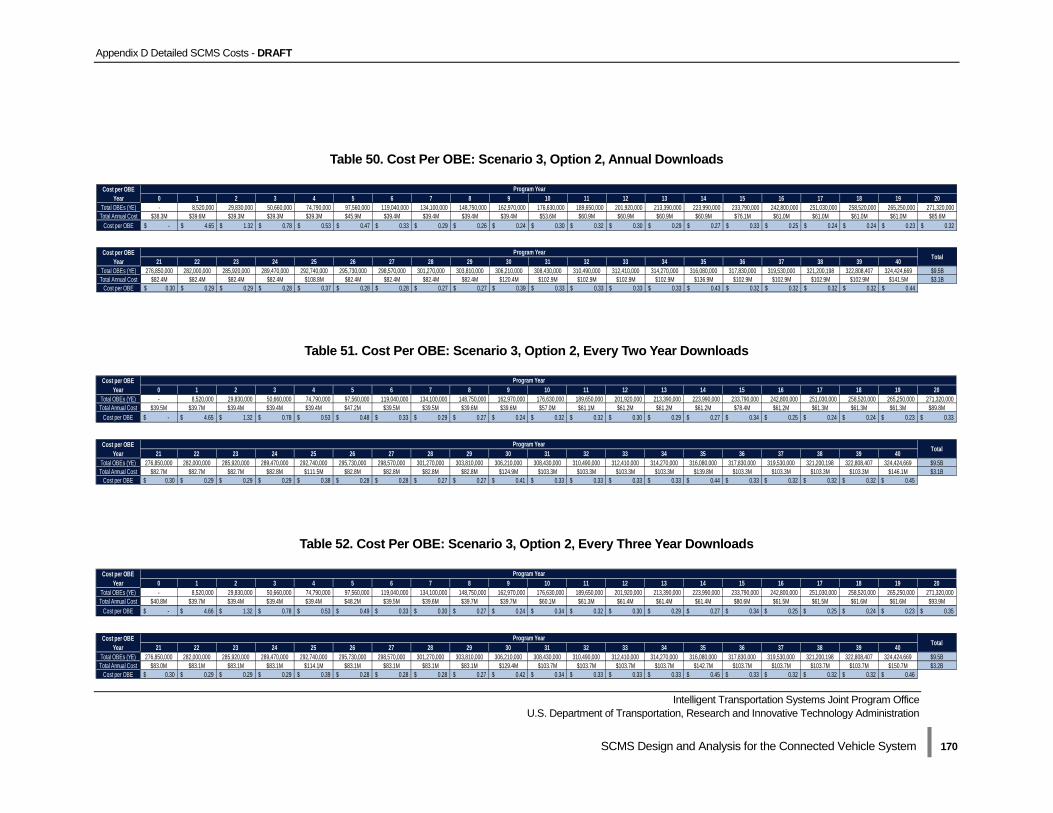
Appendix D Detailed SCMS Costs - DRAFT
Intelligent Transportation Systems Joint Program Office U.S. Department of Transportation, Research and Innovative Technology Administration
SCMS Design and Analysis for the Connected Vehicle System | 170
Table 50. Cost Per OBE: Scenario 3, Option 2, Annual Downloads
Cost per OBEYear 0 1 2 3 4 5 6 7 8 9 10 11 12 13 14 15 16 17 18 19 20
Total OBEs (YE) - 8,520,000 29,830,000 50,660,000 74,790,000 97,560,000 119,040,000 134,100,000 148,750,000 162,970,000 176,630,000 189,650,000 201,920,000 213,390,000 223,990,000 233,790,000 242,800,000 251,030,000 258,520,000 265,250,000 271,320,000 Total Annual Cost $38.3M $39.6M $39.3M $39.3M $39.3M $45.9M $39.4M $39.4M $39.4M $39.4M $53.6M $60.9M $60.9M $60.9M $60.9M $76.1M $61.0M $61.0M $61.0M $61.0M $85.6M
Cost per OBE -$ 4.65$ 1.32$ 0.78$ 0.53$ 0.47$ 0.33$ 0.29$ 0.26$ 0.24$ 0.30$ 0.32$ 0.30$ 0.29$ 0.27$ 0.33$ 0.25$ 0.24$ 0.24$ 0.23$ 0.32$
Cost per OBEYear 21 22 23 24 25 26 27 28 29 30 31 32 33 34 35 36 37 38 39 40
Total OBEs (YE) 276,850,000 282,000,000 285,920,000 289,470,000 292,740,000 295,730,000 298,570,000 301,270,000 303,810,000 306,210,000 308,430,000 310,490,000 312,410,000 314,270,000 316,080,000 317,830,000 319,530,000 321,200,198 322,808,407 324,424,669 $9.5BTotal Annual Cost $82.4M $82.4M $82.4M $82.4M $108.8M $82.4M $82.4M $82.4M $82.4M $120.4M $102.9M $102.9M $102.9M $102.9M $136.9M $102.9M $102.9M $102.9M $102.9M $141.5M $3.1B
Cost per OBE 0.30$ 0.29$ 0.29$ 0.28$ 0.37$ 0.28$ 0.28$ 0.27$ 0.27$ 0.39$ 0.33$ 0.33$ 0.33$ 0.33$ 0.43$ 0.32$ 0.32$ 0.32$ 0.32$ 0.44$
Program Year
Program Year Total
Table 51. Cost Per OBE: Scenario 3, Option 2, Every Two Year Downloads
Cost per OBEYear 0 1 2 3 4 5 6 7 8 9 10 11 12 13 14 15 16 17 18 19 20
Total OBEs (YE) - 8,520,000 29,830,000 50,660,000 74,790,000 97,560,000 119,040,000 134,100,000 148,750,000 162,970,000 176,630,000 189,650,000 201,920,000 213,390,000 223,990,000 233,790,000 242,800,000 251,030,000 258,520,000 265,250,000 271,320,000 Total Annual Cost $39.5M $39.7M $39.4M $39.4M $39.4M $47.2M $39.5M $39.5M $39.6M $39.6M $57.0M $61.1M $61.2M $61.2M $61.2M $78.4M $61.2M $61.3M $61.3M $61.3M $89.8M
Cost per OBE -$ 4.65$ 1.32$ 0.78$ 0.53$ 0.48$ 0.33$ 0.29$ 0.27$ 0.24$ 0.32$ 0.32$ 0.30$ 0.29$ 0.27$ 0.34$ 0.25$ 0.24$ 0.24$ 0.23$ 0.33$
Cost per OBEYear 21 22 23 24 25 26 27 28 29 30 31 32 33 34 35 36 37 38 39 40
Total OBEs (YE) 276,850,000 282,000,000 285,920,000 289,470,000 292,740,000 295,730,000 298,570,000 301,270,000 303,810,000 306,210,000 308,430,000 310,490,000 312,410,000 314,270,000 316,080,000 317,830,000 319,530,000 321,200,198 322,808,407 324,424,669 $9.5BTotal Annual Cost $82.7M $82.7M $82.7M $82.8M $111.5M $82.8M $82.8M $82.8M $82.8M $124.9M $103.3M $103.3M $103.3M $103.3M $139.8M $103.3M $103.3M $103.3M $103.3M $146.1M $3.1B
Cost per OBE 0.30$ 0.29$ 0.29$ 0.29$ 0.38$ 0.28$ 0.28$ 0.27$ 0.27$ 0.41$ 0.33$ 0.33$ 0.33$ 0.33$ 0.44$ 0.33$ 0.32$ 0.32$ 0.32$ 0.45$
Program Year
Program Year Total
Table 52. Cost Per OBE: Scenario 3, Option 2, Every Three Year Downloads
Cost per OBEYear 0 1 2 3 4 5 6 7 8 9 10 11 12 13 14 15 16 17 18 19 20
Total OBEs (YE) - 8,520,000 29,830,000 50,660,000 74,790,000 97,560,000 119,040,000 134,100,000 148,750,000 162,970,000 176,630,000 189,650,000 201,920,000 213,390,000 223,990,000 233,790,000 242,800,000 251,030,000 258,520,000 265,250,000 271,320,000 Total Annual Cost $40.8M $39.7M $39.4M $39.4M $39.4M $48.2M $39.5M $39.6M $39.7M $39.7M $60.1M $61.3M $61.4M $61.4M $61.4M $80.6M $61.5M $61.5M $61.6M $61.6M $93.9M
Cost per OBE -$ 4.66$ 1.32$ 0.78$ 0.53$ 0.49$ 0.33$ 0.30$ 0.27$ 0.24$ 0.34$ 0.32$ 0.30$ 0.29$ 0.27$ 0.34$ 0.25$ 0.25$ 0.24$ 0.23$ 0.35$
Cost per OBEYear 21 22 23 24 25 26 27 28 29 30 31 32 33 34 35 36 37 38 39 40
Total OBEs (YE) 276,850,000 282,000,000 285,920,000 289,470,000 292,740,000 295,730,000 298,570,000 301,270,000 303,810,000 306,210,000 308,430,000 310,490,000 312,410,000 314,270,000 316,080,000 317,830,000 319,530,000 321,200,198 322,808,407 324,424,669 $9.5BTotal Annual Cost $83.0M $83.1M $83.1M $83.1M $114.1M $83.1M $83.1M $83.1M $83.1M $129.4M $103.7M $103.7M $103.7M $103.7M $142.7M $103.7M $103.7M $103.7M $103.7M $150.7M $3.2B
Cost per OBE 0.30$ 0.29$ 0.29$ 0.29$ 0.39$ 0.28$ 0.28$ 0.28$ 0.27$ 0.42$ 0.34$ 0.33$ 0.33$ 0.33$ 0.45$ 0.33$ 0.32$ 0.32$ 0.32$ 0.46$
Program Year
Program Year Total
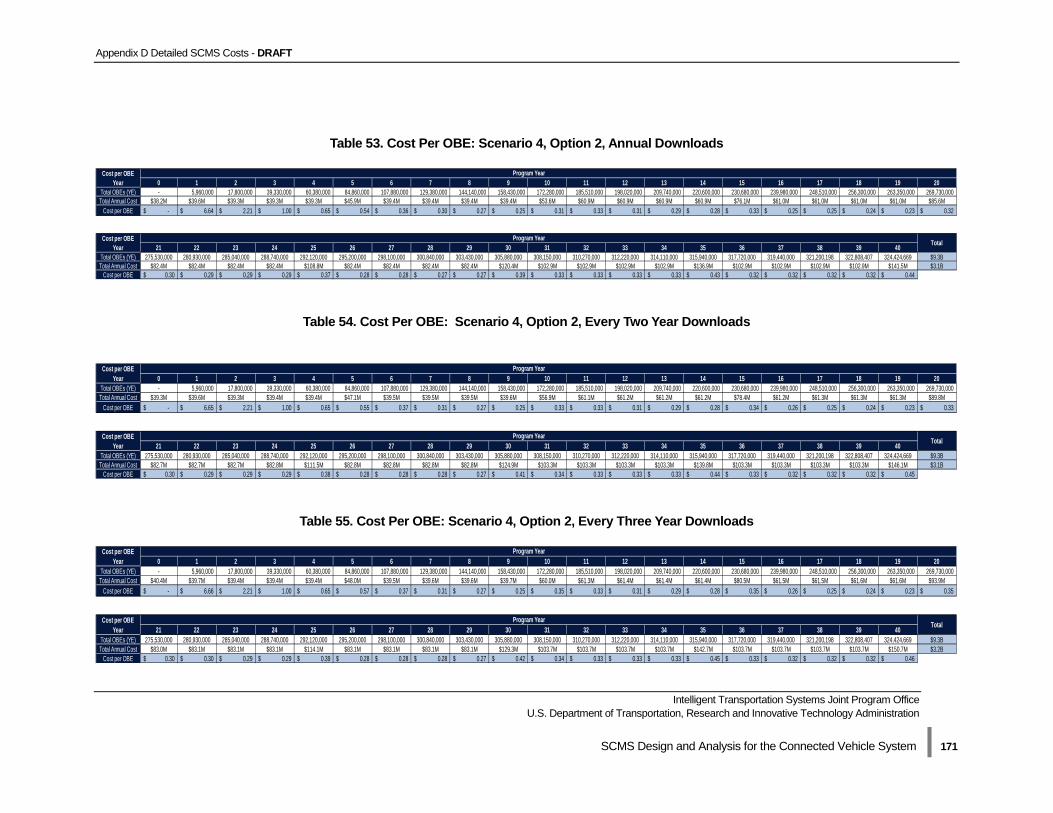
Appendix D Detailed SCMS Costs - DRAFT
Intelligent Transportation Systems Joint Program Office U.S. Department of Transportation, Research and Innovative Technology Administration
SCMS Design and Analysis for the Connected Vehicle System | 171
Table 53. Cost Per OBE: Scenario 4, Option 2, Annual Downloads
Cost per OBEYear 0 1 2 3 4 5 6 7 8 9 10 11 12 13 14 15 16 17 18 19 20
Total OBEs (YE) - 5,960,000 17,800,000 39,330,000 60,380,000 84,860,000 107,880,000 129,380,000 144,140,000 158,430,000 172,280,000 185,510,000 198,020,000 209,740,000 220,600,000 230,680,000 239,980,000 248,510,000 256,300,000 263,350,000 269,730,000 Total Annual Cost $38.2M $39.6M $39.3M $39.3M $39.3M $45.9M $39.4M $39.4M $39.4M $39.4M $53.6M $60.9M $60.9M $60.9M $60.9M $76.1M $61.0M $61.0M $61.0M $61.0M $85.6M
Cost per OBE -$ 6.64$ 2.21$ 1.00$ 0.65$ 0.54$ 0.36$ 0.30$ 0.27$ 0.25$ 0.31$ 0.33$ 0.31$ 0.29$ 0.28$ 0.33$ 0.25$ 0.25$ 0.24$ 0.23$ 0.32$
Cost per OBEYear 21 22 23 24 25 26 27 28 29 30 31 32 33 34 35 36 37 38 39 40
Total OBEs (YE) 275,530,000 280,930,000 285,040,000 288,740,000 292,120,000 295,200,000 298,100,000 300,840,000 303,430,000 305,880,000 308,150,000 310,270,000 312,220,000 314,110,000 315,940,000 317,720,000 319,440,000 321,200,198 322,808,407 324,424,669 $9.3BTotal Annual Cost $82.4M $82.4M $82.4M $82.4M $108.8M $82.4M $82.4M $82.4M $82.4M $120.4M $102.9M $102.9M $102.9M $102.9M $136.9M $102.9M $102.9M $102.9M $102.9M $141.5M $3.1B
Cost per OBE 0.30$ 0.29$ 0.29$ 0.29$ 0.37$ 0.28$ 0.28$ 0.27$ 0.27$ 0.39$ 0.33$ 0.33$ 0.33$ 0.33$ 0.43$ 0.32$ 0.32$ 0.32$ 0.32$ 0.44$
Program Year
Program Year Total
Table 54. Cost Per OBE: Scenario 4, Option 2, Every Two Year Downloads
Cost per OBE
Year 0 1 2 3 4 5 6 7 8 9 10 11 12 13 14 15 16 17 18 19 20Total OBEs (YE) - 5,960,000 17,800,000 39,330,000 60,380,000 84,860,000 107,880,000 129,380,000 144,140,000 158,430,000 172,280,000 185,510,000 198,020,000 209,740,000 220,600,000 230,680,000 239,980,000 248,510,000 256,300,000 263,350,000 269,730,000 Total Annual Cost $39.3M $39.6M $39.3M $39.4M $39.4M $47.1M $39.5M $39.5M $39.5M $39.6M $56.9M $61.1M $61.2M $61.2M $61.2M $78.4M $61.2M $61.3M $61.3M $61.3M $89.8M
Cost per OBE -$ 6.65$ 2.21$ 1.00$ 0.65$ 0.55$ 0.37$ 0.31$ 0.27$ 0.25$ 0.33$ 0.33$ 0.31$ 0.29$ 0.28$ 0.34$ 0.26$ 0.25$ 0.24$ 0.23$ 0.33$
Cost per OBEYear 21 22 23 24 25 26 27 28 29 30 31 32 33 34 35 36 37 38 39 40
Total OBEs (YE) 275,530,000 280,930,000 285,040,000 288,740,000 292,120,000 295,200,000 298,100,000 300,840,000 303,430,000 305,880,000 308,150,000 310,270,000 312,220,000 314,110,000 315,940,000 317,720,000 319,440,000 321,200,198 322,808,407 324,424,669 $9.3BTotal Annual Cost $82.7M $82.7M $82.7M $82.8M $111.5M $82.8M $82.8M $82.8M $82.8M $124.9M $103.3M $103.3M $103.3M $103.3M $139.8M $103.3M $103.3M $103.3M $103.3M $146.1M $3.1B
Cost per OBE 0.30$ 0.29$ 0.29$ 0.29$ 0.38$ 0.28$ 0.28$ 0.28$ 0.27$ 0.41$ 0.34$ 0.33$ 0.33$ 0.33$ 0.44$ 0.33$ 0.32$ 0.32$ 0.32$ 0.45$
Program Year
Program Year Total
Table 55. Cost Per OBE: Scenario 4, Option 2, Every Three Year Downloads
Cost per OBEYear 0 1 2 3 4 5 6 7 8 9 10 11 12 13 14 15 16 17 18 19 20
Total OBEs (YE) - 5,960,000 17,800,000 39,330,000 60,380,000 84,860,000 107,880,000 129,380,000 144,140,000 158,430,000 172,280,000 185,510,000 198,020,000 209,740,000 220,600,000 230,680,000 239,980,000 248,510,000 256,300,000 263,350,000 269,730,000 Total Annual Cost $40.4M $39.7M $39.4M $39.4M $39.4M $48.0M $39.5M $39.6M $39.6M $39.7M $60.0M $61.3M $61.4M $61.4M $61.4M $80.5M $61.5M $61.5M $61.6M $61.6M $93.9M
Cost per OBE -$ 6.66$ 2.21$ 1.00$ 0.65$ 0.57$ 0.37$ 0.31$ 0.27$ 0.25$ 0.35$ 0.33$ 0.31$ 0.29$ 0.28$ 0.35$ 0.26$ 0.25$ 0.24$ 0.23$ 0.35$
Cost per OBEYear 21 22 23 24 25 26 27 28 29 30 31 32 33 34 35 36 37 38 39 40
Total OBEs (YE) 275,530,000 280,930,000 285,040,000 288,740,000 292,120,000 295,200,000 298,100,000 300,840,000 303,430,000 305,880,000 308,150,000 310,270,000 312,220,000 314,110,000 315,940,000 317,720,000 319,440,000 321,200,198 322,808,407 324,424,669 $9.3BTotal Annual Cost $83.0M $83.1M $83.1M $83.1M $114.1M $83.1M $83.1M $83.1M $83.1M $129.3M $103.7M $103.7M $103.7M $103.7M $142.7M $103.7M $103.7M $103.7M $103.7M $150.7M $3.2B
Cost per OBE 0.30$ 0.30$ 0.29$ 0.29$ 0.39$ 0.28$ 0.28$ 0.28$ 0.27$ 0.42$ 0.34$ 0.33$ 0.33$ 0.33$ 0.45$ 0.33$ 0.32$ 0.32$ 0.32$ 0.46$
Program Year
Program Year Total
Appendix E VIIC Policy Report - DRAFT
Intelligent Transportation Systems Joint Program Office U.S. Department of Transportation, Research and Innovative Technology Administration
SCMS Design and Analysis for the Connected Vehicle System | 172
Appendix E VIIC Policy Report
In developing the report, the Booz Allen team referenced this 2011 report by the VIIC to understand security and privacy requirements for the SCMS. We include it here with the permission of USDOT to make it available to the public. This document reflects the views of the VIIC as of 2011; their stance may have changed on any issue herein. We have not edited this report in any way and terminology used by VIIC in developing this 2011 report may not be parallel with the more recent language used by the Booz Allen team.
VIIC Key Policy Issue – Security and Privacy
VIIC Policy Requirements re Security System Design to Support DSRC-Based Communications between Vehicles and Other Devices
Introduction: Aligned with a key VIIC policy issue and in response to requests by CAMP and the USDOT JPO, VIIC has generated this paper to describe its position on security and privacy policy requirements. For security system communications between vehicles/devices, between vehicles/devices and infrastructure, and between any of these and the Security Certificate Management System (SCMS), VIIC members agree that the policy requirements outlined in this document are necessary for successful deployment of DSRC V2x communications. These policy requirements are described at a high level in the following list. Further discussions to facilitate understanding of these requirements are provided in subsequent sections. • Overall System Requirement:
o Privacy by design and policy • Specific System Requirements:
o Anonymity for mandatory services o Non-Trackability for mandatory services o Protection from Attacks on System Integrity o Prevention of Unauthorized Access to Personally Identifiable Information (PII) o No User Fees for mandatory services o Stable, Long-term Policy and Technology with backward compatibility (decades rather than
years) Overall Requirement: • Privacy: The security system design must conform to the Privacy Policies Framework (version
1.0.2), dated February 16, 2007, and build in the major tenets of this document: o build the system, including its security, so that it collects from mobile users only anonymous
data, unless an individual mobile user has consented to collection and transmission of personally-identifiable information (PII);
o administer and operate the system so that anonymous information collected from an individual both does not initially identify that individual and remains unidentified until the information is securely destroyed; and

Appendix E VIIC Policy Report - DRAFT
Intelligent Transportation Systems Joint Program Office U.S. Department of Transportation, Research and Innovative Technology Administration
SCMS Design and Analysis for the Connected Vehicle System | 173
o administer and operate the system so that PII is only collected with the consent of the individual and is transmitted and used only in ways that prevent misuse and leakage of PII, and also prevents unauthorized attacks on the system.
Specific Requirements: • Anonymity for mandatory services
o Real127 anonymity for privately owned/leased vehicles and occupants must be maintained for all mandatory (non-opt-in) services, including:
Security system overhead processes (certificate management, distribution, revocation, and reinstallation processes and associated end-to-end communications)
All mandatory applications and services (safety, mobility, environmental, tax/user fees, etc.) and associated end-to-end communications.
o Provision of mandatory applications and services must not require recipients of these services to identify themselves
• Non-Trackability for mandatory services o For mandatory services, prevent the ability to track specific, identified vehicles across space
and time. • Protection from Attacks on System Integrity
o Prevent the ability for system administrators and/or system hackers to mis-use, manipulate, or de-construct the SCMS, or any other part of the communications system for DSRC, such that it defeats anonymity preservation and/or vehicle tracking prevention techniques for mandatory services. This includes, but is not limited to:
providing secure, end-to-end encryption of vulnerable communications changing security certificates and vehicle IDs every few minutes to prevent
tracking assigning Certificate Signing Requests (CSRs) in an anonymous fashion providing for multiple, organizationally and legally separate SCMS authorities,
with distinct governances, none of whom have sufficient knowledge, information or means necessary for determining which vehicles received/had revoked which certificates, all of which will be prevented by law128 from allowing the re-identification of vehicle/device certification assignments
providing sufficient security (including encryption) to prevent system administrators, users, or hackers from accessing or deriving any PII or vehicle identifying information (VIN, vehicle-specific part numbers (airbag, EDR, etc.), electronic licensing, etc.) in the course of providing or facilitating the provision of mandatory services and applications.
• Prevention of Unauthorized Access to PII o For opt-in services that entail the transmission of vehicle-identifying information and/or
PII, provide sufficient security to prevent unauthorized access during transmission of such information between authorized users and providers. (This should include secure communications transfer protocols, strong encryption, as well as built-in audit trails that record each access to encrypted data containing vehicle-identifying information and/or PII.)
127 For example, collecting personally-identifiable information and then purging it in a second-stage operation is not “real” anonymity, which must provide anonymity end-to-end. 128 Implementation of the Privacy Policies Framework (as well as other policy and technical aspects of DSRC deployment) assumes federal enabling legislation for this purpose. In this particular context, it is assumed that federal enabling legislation will include a clause that forbids the component entities within the SCMS from colluding to defeat or undermine privacy, anonymity, and/or non-trackability protection provisions.

Appendix E VIIC Policy Report - DRAFT
Intelligent Transportation Systems Joint Program Office U.S. Department of Transportation, Research and Innovative Technology Administration
SCMS Design and Analysis for the Connected Vehicle System | 174
NOTE: Unlike for mandatory services, which must be provided on an anonymous basis, opt-in services are subject to lawful intercept procedures (e.g., access subject to warrant or equivalent).
• No User Fees for mandatory services o Provision of mandatory applications and services must not require recipients of these
services to pay a subscription or usage fee for these applications and services. The costs associated with implementation and maintaining the SCMS, except for the in-vehicle costs, should be borne by the government.
• Stable, Long-Term Policy and Technology with backward compatibility (decades not years) o The relevant policies as well as the underlying communications technology must remain
stable or be backward compatible for decades in order to accommodate the long lifecycle of vehicles.
Assessment of CAMP security design relative to these policy requirements: Following a policy review of the CAMP-proposed security system129-130, both in terms of design and operations, the VIIC believes it can satisfy the above policy requirements with adjustment or clarifications in the following areas:
• Fall-Back Certificates • Certificate Revocation List (CRL) • Communication between vehicles/devices and the RA
By segregating responsibilities and information within the SCMS between several legally-separated entities with distinct governances, providing the functions of the Certificate Authority (CA), Registration Authority (RA), and Linkage Authority (LA), the ability to maintain anonymity system-wide is strengthened. The use of a Public Key Infrastructure (PKI) along with linked certificates and the multi-entity SCMS strategy hardens the system integrity from attacks and unauthorized access to any PII. The initial area of concern with the CAMP security system design is with the use of 'fall-back' certificates and trackability. Non-trackability is addressed by changing both the valid certificates and the vehicle ID every five (5) minutes, even when the vehicle is not in use. There is some concern over use of a long-term, fall-back certificate for vehicles that have run out of valid short-term certificates and have not communicated a request for new certificates to the RA. Because a fall-back certificate does not expire for a long period of time (months, years) it would be possible to track a device/vehicle using the same “signature” over that extended period of time, which violates the VII Privacy Policies Framework document. However, without any fall-back certificates a device which had not had an opportunity to communicate with the RA would no longer participate in the cooperative system. VIIC and CAMP are currently looking into alternative solutions. Further discussion of this issue, including discussions with other interested parties, is needed. 129 Interoperability Issues of Vehicle-to-Vehicle Based Safety System Project (V2V-Interoperability) Task 5: Security Management - Subtask 2: Security System Design Specification - September 14, 2011 130 The current security system developed by CAMP under a Cooperative Agreement with USDOT has been optimized for V2V safety, but not for “full deployment.” Full deployment includes both vehicle-to-vehicle and vehicle-to-infrastructure communications, and will include communications mechanisms and content that introduce unique challenges that have yet to be addressed. Further security design and development work is underway to address these further challenges.

Appendix E VIIC Policy Report - DRAFT
Intelligent Transportation Systems Joint Program Office U.S. Department of Transportation, Research and Innovative Technology Administration
SCMS Design and Analysis for the Connected Vehicle System | 175
The next area of concern with the CAMP security system design is the policy 'rules' for vehicles that are broadcasting 'bad' messages. If a vehicle has been broadcasting a 'bad' message and has been reported to the RA by multiple reports, the security certificate's linkage ID will be published and broadcasted on the RA's Certificate Revocation List (CRL). Once on the CRL, the vehicle would still be able to send the 'bad' messages and would no longer be able to send a 'good' message until the device was replaced. The vehicles sending 'good' messages are currently designed to ignore the 'bad' messages. However, since other vehicles are depending on your 'good' message, it is the VIIC's position that a vehicle with a security certificate's linkage ID on the CRL should no longer be allowed to send 'bad' messages. The vehicle should be designed to recognize when it has been placed on the CRL; to cease broadcasting messages, and to provide warning to the driver that the device is inoperable and needs to be serviced as soon as possible. Otherwise, the vehicle will continue to send the 'bad' message, adding to channel congestion, and could possibly have similar concerns over trackabiliy as fall-back certificates. The final area of concern is the communication mechanism between the vehicle/devices and the RA. The policy requirements for no user fees and long-term stable technology relate more directly to the communication system needed to support the security demands for DSRC-based cooperative safety technologies. The DSRC-based safety system is made up of several individual but interconnected communication links. Vehicles/devices will “talk” to each other, the infrastructure, and to the RA. The RA will need to talk to vehicles/devices and to the other entities of the SCMS. All of these communications must maintain anonymity of vehicles and users, and none must require users to pay subscription or transaction fees. It is widely agreed that due to the high availability, low latency demands for cooperative crash avoidance system, 5.9 GHz DSRC is the only viable communication technology available for vehicles/devices to talk to each other and the infrastructure. For communication with the RA, the low latency demands are not relevant. However, the 5.9 GHz DSRC spectrum was specifically set aside to support transportation safety, and as such, it is uniquely capable of delivering communications-based applications that are optimized for the transportation environment. It is VIIC’s position that all of the above policy requirements apply to all communication links between vehicles/devices, the infrastructure, and the RA that support DSRC-based communications. As the DSRC-based system is still under development, it is expected to be executed in a manner consistent with all of the above policy requirements. The current cellular communications system would need to be substantially modified to meet the policy requirements if it was used as the communication mechanism between the vehicles/devices and the SMCS. Open challenges with the use of cellular for this function include the following:
• It is unclear whether/how privacy/anonymity schemes for communications over cellular networks could be implemented (esp. given Communications Assistance for Law Enforcement Act compliance requirements for voice communications services)
• Current cell phone communications identify every terminal as it joins the network thus allowing tracking and recording
• Given the various available cellular network technologies, it’s unclear whether a common, uniform solution can be applied to achieve the privacy/anonymity goals
• It is unclear whether/how technology updates for in-service motor vehicles/devices/infrastructure could be implemented and enforced
• It is unclear how necessary communications with the RA can be ensured using optional, portable devices, such as cell phones, especially when they would have to be connected with the vehicle (by wire or by wireless connection)

Appendix E VIIC Policy Report - DRAFT
Intelligent Transportation Systems Joint Program Office U.S. Department of Transportation, Research and Innovative Technology Administration
SCMS Design and Analysis for the Connected Vehicle System | 176
• It is unclear how costs associated with the use of a commercial wireless medium could be contained by a system designed to enhance public safety without identifying or charging specific beneficiaries (i.e., without undermining end user anonymity)
Appendix F References - DRAFT
Intelligent Transportation Systems Joint Program Office U.S. Department of Transportation, Research and Innovative Technology Administration
SCMS Design and Analysis for the Connected Vehicle System | 177
Appendix F References
Alterman, Peter. The U.S. Federal PKI and the Federal Bridge Certification Authority. Federal PKI Steering Committee and Federal Bridge Certification Authority. 13 May 2001. Web. 22 Feb. 2012. <www.cendi.gov/presentations/alterman_pki_05-13-01.ppt>.
AT&T Inc. 2011 Annual Report. Retrieved July 3, 2012 from the SEC online Edgar database. Bradley, Martin and Alexander Dent. Payment Card Industry Data Security Standard (PCI DSS) –
What It Is and Its Impact on Retail Merchants. Royal Holloway Series 2010. 2010. Web. 17 Oct. 2013. <http://www.computerweekly.com/feature/The-real-cost-of-PCI-DSS-compliance>.
California Department of Public Health. Applications for Licensing and/or Certification of General
Acute Care Hospital. State of California. 2013. Web. 2 Aug. 2013 <http://www.cdph.ca.gov/ pubsforms/forms/pages/healthfacility-gach.aspx>.
California Department of Transportation. 2011 California Annual Average Daily Traffic (AADT). Web. 5
Oct. 2013 <http://traffic-counts.dot.ca.gov/2011all/2011AADT.xlsx>. Centers for Medicare and Medicaid Services. Hospitals. Centers for Medicare and Medicaid Services.
2013. Web. 13 Aug. 2013 <http://www.cms.gov/Medicare/Provider-Enrollment-and-Certification/CertificationandComplianc/Hospitals.html>.
CertiPath. “CertiPath X.509 Certificate Policy” (version 3.15). 2011. Web. 13 Feb. 2012.
<https://www.certipath.com/library/policy-management-authority/policy-documents>. Choo, Sangho and Patricia L. Mokhtarian. “The Relationship of Vehicle Type Choice to Personality,
Lifestyle, Attitudinal and Demographic Variables.” Publication. CA: Department of Civil and Environmental Engineering, University of California Davis. Report UCD-ITS-RR-02-06, Oct. 2002.
CoStar Realty Information, Inc. Your Search for Commercial Real Estate Starts Here (page used for various locations in United States). CoStar Realty Information, Inc. 2013. Web. 16 March 2013. <www.showcase.com>. Crash Avoidance Metrics Partnership. Internal Memo to the National Highway Traffic Safety
Administration to Update the SCMS Technical Design Graphic, Washington, DC. Sept. 2013. Crash Avoidance Metrics Partnership. “Model Deployment Safety Device DSRC BSM Communication
Minimum Performance Requirements.” Publication. MI: Crash Avoidance Metrics Partnership, Oct. 2011.
Crash Avoidance Metrics Partnership. “Task 5 Extension: Security Credentials Management System.”
Publication. MI: Crash Avoidance Metrics Partnership, April 2013.
Appendix F References - DRAFT
Intelligent Transportation Systems Joint Program Office U.S. Department of Transportation, Research and Innovative Technology Administration
SCMS Design and Analysis for the Connected Vehicle System | 178
Crash Avoidance Metrics Partnership. “V2V Communications Security Project: Task 5: Initial & Final Model, Assumptions & Goals Presentation.” USDOT Headquarters, Washington, DC, 2 Aug. 2012.
Det Norske Veritas Healthcare, Inc. DNV Approved by U.S. Health Authorities to Accredit Hospitals.
2008. Web. 1 Aug. 2013 <http://www.dnv.com/press_area/press_releases/2008/dnvapproved byushealthauthoritiestoaccredithospitals.asp>.
Digital Realty Trust, Inc. Digital Realty Announces Fourth Quarter and Full Year 2012 Leasing Results
[Press release]. Feb. 2013. Retrieved from <http://investor.digitalrealty.com/Mobile/file.aspx? IID=4094311&FID=15935609>.
Dines, Rachel. “Build or Buy? The Economics of Data Center Facilities.” Publication. Cambridge, MA:
Forrester Research, Inc., June 2011. Drucker, P. The Practice of Management. New York: Harper & Row, 1954. Element Payment Services. PCI Compliance Levels. Element Payment Services, Inc. 2013. Web. 9
July 2013 <http://www.elementps.com/merchants/pci-dss/compliance-level/>. E-ZPass Interagency Group. "Welcome to the E-ZPass Interagency Group." E-ZPass Group Home
Page. E-ZPass Interagency Group, 2011. Web. 7 Dec. 2011. <http://www.e-zpassiag.com>. Fayol, H. General and Industrial Management. London: Pitman, 1949. Federal Reserve Bank of Philadelphia. Consumer Topics: What You Need to Know About Payment
Cards. Federal Reserve Bank of Philadelphia. Aug. 2010. Web. 14 June 2013 <http://www.philadelphiafed.org/consumer-resources/topics/index.cfm?tab=2>.
Garrett, Kyle and Bryan Krueger. Synesis Partners. Phone Interview. 9 July 2013. Gupta, Anil K. and Lawrence J. Lad. “Industry Self-regulation: An Economic, Organizational, and
Political Analysis.” The Academy of Management Review 8, no. 3 (July 1983): 417, <http://www.jstor.org/stable/257830>.
Health Information Technology for Economic and Clinical Health (HITECH) Act. Title XIII of Division A
and Title IV of Division B of the American Recovery and Reinvestment Act of 2009 (ARRA). Pub. L. no. 111-5 (Feb. 17, 2009). Codified at 42 U.S.C. 300 et seq.; 17901 et seq.
Healthcare Facilities Accreditation Program. Frequently Asked Questions. Healthcare Facilities
Accreditation Program. 2013. Web. 2 Aug. 2013 <http://www.hfap.org/about/faq.aspx>. Healthit.gov. Privacy & Security Policy: HIPAA and Health IT. 2013. Web. 19 June 2013
<http://www.healthit.gov/policy-researchers-implementers/hipaa-and-health-it>. International Telecommunications Union, ITU-T Recommendation X.509, ISO/IEC 9594-8. 13 Nov.
2008. Web. 19 July 2013 <http://www.itu.int/ITU-T/recommendations/rec.aspx?rec=X.509>. ISACA. History of ISACA. ISACA. 2012. Web. 15 Oct. 2012 <http://www.isaca.org/
About-ISACA/History/Pages/default.aspx>. Lawrence, P. R., and J. W. Lorsch. Organization and Environment. Cambridge: Harvard Graduate
School of Business Administration, 1967.
Appendix F References - DRAFT
Intelligent Transportation Systems Joint Program Office U.S. Department of Transportation, Research and Innovative Technology Administration
SCMS Design and Analysis for the Connected Vehicle System | 179
LoopNet, Inc. Search Properties for Lease (page used for various locations in United States). LoopNet, Inc. 2013. Web. 17 March 2013. <http://www.loopnet.com/forlease/>. Measuring Usability, LLC. Fundamentals of Statistics 3: Sampling: The Central Limit Theorem. Web. 5 May 2013 <http://www.usablestats.com/lessons/central_limit>. Mintzberg, H. The Structuring of Organizations. Englewood Cliffs, N.J.: Prentice Hall, 1979. Mixon/Hill, Inc. “Core System Requirements Specification (SyRS) Revision B.” Publication.
Washington, DC: United States Department of Transportation. June 2011. Oltsik, Jon. “The True Costs of E-mail Encryption: Trend Micro IBE (Identify-based) vs. PKI
Encryption.” Enterprise Strategy Group, Inc. June 2010. Web. 1 Nov. 2013 <http://www.trendmicro.com/cloud-content/us/pdfs/business/white-papers/wp_true-costs-of-email-encryption_analyst-esg.pdf>.
OMNI-MEANS. Traffic Impact Analysis, Prepared for Contra Costa County – Appendix. Jan. 2011.
Web. 5 Oct. 2013 <http://www.contracosta.ca.gov/documentcenter/view/6559>. Payment Card Industry Security Standards Council, LLC. Approved Scanning Vendors. Payment
Card Industry Security Standards Council LLC. 2010. Web. 20 July 2013. <https://www.pcisecuritystandards.org/approved_companies_providers/approved_scanning_vendors.php>.
Payment Card Industry Security Standards Council, LLC. For Merchants. Payment Card Industry
Security Standards Council, LLC. 2013. Web. 7 July 2013 <https://www.pcisecuritystandards. org/merchants/index.php>.
Payment Card Industry Security Standards Council, LLC. Organizational Structure. PCI Security
Standards Council, LLC. 2013. Web. 7 July 2013 <https://www.pcisecuritystandards .org/organization_info/org_fact_sheet.php>.
Payment Card Industry Security Standards Council, LLC. PCI Data Security Standard: Requirements
and Security Assessment Procedures, v2.0. PCI Security Standards Council, LLC. 2010. Web. 11 July 2013 <https://www.pcisecuritystandards.org/documents/pci_dss_v2.pdf>.
Payment Card Industry Security Standards Council, LLC. PCI DSS Quick Reference Guide, v2.0. PCI
Security Standards Council, LLC. 2010. Web. 6 July 2013 <https://www.pcisecurity standards.org/documents/PCI%20SSC%20Quick%20Reference%20Guide.pdf>.
Payment Card Industry Security Standards Council, LLC. Qualified Security Assessor Companies.
PCI Security Standards Council, LLC. 2013. Web. 11 July 2013 <https://www.pcisecurity standards.org/approved_companies_providers/qualified_security_assessors.php>.
Payment Card Industry Security Standards Council, LLC. What is the PCI Security Standards
Council? PCI Security Standards Council, LLC. 2006. Web. 20 Sept. 2013 <https://www.pcisecuritystandards.org/security_standards/role_of_pci_council.php>.
Polk. Approach – Data & Technology: Information is Only the Beginning. R.L. Polk & Co, 2012. Web.
31 July 2012. <https://www.polk.com/approach/data_and_technology>.

Appendix F References - DRAFT
Intelligent Transportation Systems Joint Program Office U.S. Department of Transportation, Research and Innovative Technology Administration
SCMS Design and Analysis for the Connected Vehicle System | 180
Reed Construction Data, LLC. Computer Data Center Construction Cost Estimates Available by City (page used for various locations in the United States). Reed Construction Data, LLC, 2012. Web 31 July 2012. <http://www.reedconstructiondata.com/rsmeans/models/data-center/list/>.
Rudder, Catherine E. “Private Governance as Public Policy: A Paradigmatic Shift.” The Journal of
Politics 70, no. 4 (Oct. 2008): 901-906. <http://www.jstor.org/stable/30219474>. Ruhnka, John C. and Heidi Boerstler. “Governmental Incentives for Corporate Self-Regulation.”
Journal of Business Ethics 17, no. 3 (1998): 310, <http://www.jstor.org/stable/25073080>. SAFE-BioPharma Association. “SAFE Certificate Policy” (version 2.4). 2009. 13 Feb. 2012.
<www.safe-biopharma.org/cp-pdf>. Schmidt, Dale. “Wireless Telecommunications Carriers in the US: Industry Report.” IBISWorld. Report
No. 51332. 2012. Print. Sprint Nextel. 2011 10-K Report. Retrieved July 3, 2012 from the SEC online Edgar database. Stevens, Gina. “Federal Information Security and Data Breach Notification Laws.” Congressional
Research Service, RL34120. 28 Jan. 2010. Web. 17 June 2013 <https://opencrs.com/ document/RL34120/2008-04-03/>.
The Joint Commission, About The Joint Commission. The Joint Commission. 2013. Web. 30 July
2013 <http://www.jointcommission.org/about_us/about_the_joint_commission _main.aspx>.
The Joint Commission, Facts about The Board of Commissioners. The Joint Commission. 2013. Web.
01 Aug. 2013 <http://www.jointcommission.org/facts_about_the_board_of_ commissioners/>.
The Joint Commission, Facts about The Joint Commission. The Joint Commission. 2013. Web. 30
July 2013 <http://www.jointcommission.org/facts_about_the_joint_commission/>. The Joint Commission, Facts about Joint Commission Accreditation Standards. The Joint
Commission. 2013. Web. 30 July 2013 <http://www.jointcommission.org/facts_about_ joint_commission_accreditation_standards/>.
Turner IV, W. Pitt and Kenneth G. Brill. “Cost Model: Dollars per kW plus Dollars per Square Foot of
Computer Floor.” Publication. Santa Fe, NM: Uptime Institute, Inc., 2008. United States Department of Defense. “United States Department of Defense X.509 Certificate Policy”
(Version 10.1). United States Department of Defense. Publication. 2010. United States Department of Health & Human Services, Understanding Health Information Privacy.
United States Department of Health & Human Services. 2013. Web. 12 June 2013 <http://www.hhs.gov/ocr/privacy/hipaa/understanding/index.html>.
United States Department of Labor, Bureau of Labor Statistics. “Consumer Price Index.” 20 Nov. 2013.
Web. 13 Dec. 2013 <ftp://ftp.bls.gov/pub/special.requests/cpi/cpiai.txt>. United States Department of Labor, Bureau of Labor Statistics. “May 2011 State Occupational Employment and Wage Estimates.” Occupational Employment Statistics. 12 March 2012.
Web. 20 March 2013 <www.bls.gov/oes/>.

Appendix F References - DRAFT
Intelligent Transportation Systems Joint Program Office U.S. Department of Transportation, Research and Innovative Technology Administration
SCMS Design and Analysis for the Connected Vehicle System | 181
United States Department of Transportation, Federal Motor Carrier Safety Administrations. “Safety
Measurement System (SMS) Methodology” (Version 2.2). Publication. Cambridge: John A. Volpe National Transportation Systems Center. Jan 2012.
United States Department of Transportation, National Highway Traffic Safety Administration, Early
Warning Reporting. Safecar.gov. 2013. Web. 21 Nov. 2013. <http://www-odi.nhtsa.dot. gov/ewr/>.
United States Department of Transportation, Research and Innovative Technology Administration. “An
Approach to Communications Security for a Communications Data Delivery System for V2V/V2I Safety: Technical Description and Identification of Policy and Institutional Issues.” Crash Avoidance Metrics Partnership and John A. Volpe National Transportation Systems Center/ Nov. 2011. Web. 20 Nov. 2013 <http://ntl.bts.gov/lib/43000/43500/43513/FHWA-JPO-11-130_FINAL_Comm_Security_Approach_11_07_11.pdf>.
United States Department of Transportation, Research and Innovative Technology Administration.
“Communications Data Delivery System Analysis for Connected Vehicles: Revision and Update to Modeling of Promising Network Options” Publication. Washington, DC: Research and Innovative Technology Administration, April 2013.
United States Department of Transportation, Research and Innovative Technology Administration.
Connected Vehicle Research: Connected Vehicle Frequently Asked Questions. Intelligent Transportation Systems Joint Program Office. 4 Dec. 2013. Web. 9 Dec. 2013 <http://www.its.dot.gov/connected_vehicle/connected_vehicles_FAQs.htm>.
United States Department of Transportation, Research and Innovative Technology Administration.
“Core System Architecture Document (SAD).” Research and Innovative Technology Administration, July 2011. Web. 20 Nov. 2013 <http://www.its.dot.gov/press/2011/ connected_vehicle_coresystem_docs.htm>.
United States Department of Transportation, Research and Innovative Technology Administration.
Principles for a Connected Vehicle Environment – Discussion Document. Intelligent Transportation Systems Joint Program Office. 18 Apr. 2012. Web. 10 July 2013. <http://www.its.dot.gov/connected_vehicle/principles_connectedvehicle_environment.htm>.
United States Department of Transportation, Research and Innovative Technology Administration.
Security Approach for V2V/V2I Communications Delivery System. Publication. Washington, DC: Crash Avoidance Metrics Partnership and John A. Volpe National Transportation Systems Center. Aug. 2011.
United States Department of Transportation, Research and Innovative Technology Administration.
Security Credential Management System: Security System Design for Cooperative Vehicle-to-Vehicle Crash Avoidance Applications Using 5.9 GHz Dedicated Short Range Communications (DSRC) Wireless Communications. intelligent Transportation Systems Joint Program Office. 13 Apr. 2012. Web. 20 Nov. 2013 <www.its.dot.gov/meetings/pdf/Security_Design20120413.pdf >.
United States Federal Public Key Infrastructure Policy Authority. “X.509 Certificate Policy for The
Federal Bridge Certification Authority” (version 2.25). 2011. Web. 17 Feb. 2012. <http://www.idmanagement.gov/documents/certificate-policy-federal-bridge-certificate-authority>.

Appendix F References - DRAFT
Intelligent Transportation Systems Joint Program Office U.S. Department of Transportation, Research and Innovative Technology Administration
SCMS Design and Analysis for the Connected Vehicle System | 182
United States Federal Trade Commission. How To Comply with the Privacy of Consumer Financial Information Rule of the Gramm-Leach-Bliley Act. United States Federal Trade Commission. July 2002. Web. 11 July 2013 <http://business.ftc.gov/documents/ bus67-how-comply-privacy-consumer-financial-information-rule-gramm-leach-bliley-act#1>.
United States Office of Management and Budget. “Circular A-94: Guidelines and Discount Rates for
Benefit-Cost Analysis of Federal Programs, Appendix C.” Office of Management and Budget. Dec. 2011. Web. 26 Jan. 2012. <http://www.whitehouse.gov/omb/circulars_a094>.
United States Senate Committee on Banking, Housing, & Urban Affairs. Brief Summary of the Dodd-
Frank Wall Street Reform and Consumer Protection Act. United States Senate. July 2010. Web. 8 July 2013. <http://www.banking.senate.gov/public/index.cfm?FuseAction= Issues.View&Issue_id=84D77B9F-C7AB-6FE2-4640-9DD18189FB23>.
Utimaco. “Se-Series”. Utimaco Products. 2012. Web. 30 May 2012 <http://hsm.utimaco.com/nc/en/
products/se-series>. Vehicle Infrastructure Integration Consortium. “VIIC Key Policy Issue – Security and Privacy.”
Publication. VIIC, 6 Oct. 2011. VeriSign, Inc. Reducing Complexity and Total Cost Of Ownership With VeriSign Managed PKI.
Symantec Corporation. 2011. Web. 9 Dec. 2013. <https://www4.symantec.com/mktginfo /whitepaper/user_authentication/whitepaper-cost-effective-pki.pdf>.
Verizon Wireless. 2011 10-K Report. Retrieved July 3, 2012 from the SEC online Edgar database. Visa Inc. Visa International Operating Regulations. Visa, 15 Oct. 2013. Web. 9 Dec. 2013.
<http://usa.visa.com/merchants/operations/op_regulations.html>. Wall Street Journal (2013). “What’s Moving: U.S. Auto Sales.” Oct. 2013. Web. 4 Oct. 2013 <http://wap.wsj.com/mdc/public/page/2_3022-autosales.html>. Weimerskirch, André. Security and Privacy in V2X: Current Approaches for Deployment. Presentation. Escrypt Inc.: Embedded Security, Ann Arbor, MI. Jan. 2012. Yahoo! Finance. Industry Center - Credit Services. Yahoo! Inc. 2013. Web. 13 June 2013
<http://biz.yahoo.com/ic/424.html>. Yahoo! Finance. Industry Center - Hospitals. Yahoo! Inc. 2013. Web. 19 June 2013
<http://biz.yahoo.com/ic/524.html>. .

U.S. Department of Transportation ITS Joint Program Office-HOIT 1200 New Jersey Avenue, SE
Washington, DC 20590
Toll-Free “Help Line” 866-367-7487 www.its.dot.gov
[FHWA Document Number]


