Embed Size (px)
Citation preview

Seeing is Believing? Evidence from a Demonstration Plot Ex-periment in Mozambique Florence Kondylis and Valerie Mueller
We preliminarily find that providing sustainable land management (SLM) training to standard contact farmers and having them maintain demonstration plots within the community on a whole had low impact on the knowledge and adoption of SLM practices. However, the aspect of our intervention that targeted a traditionally disadvantaged group as far as their access to extension services, women, was somewhat successful in terms of improving their SLM knowledge and adoption rates. Having a female contact farmer increased the number of SLM techniques adopted by women by 10 percent. Both male and female farmers in this treatment group identified female (not male) contact farmers as a source of learning for both SLM practices and non SLM-practices suggesting knowledge spillovers. Furthermore, farmers were additionally inclined to teach others what they have learned in the communities with female contact farmers. While we are currently analyzing additional factors that may affect the ability of the intervention to influence behavior, our results have broader implications for improving extension services overall.

2
WORKING PAPER 1 | November 2012
INTRODUCTION Extension workers are commonly used as means of dissemination for agricultural techniques and technologies to agricultural producers. Evidence linking extension services to improved productivity or technological adoption is fraught with empirical identification issues (Birkhaeuser, Evenson, and Feder, 1991). There is no rigorous evidence on what activities, level of intervention and incentive mechanisms are most effective in making extension services work for farmers. Distinctions of gender-differentiated access to services and its implications are especially rare (Ragasa, 2012), despite the growing recogni-tion among international agencies and organizations that targeting women is crucial for the improvement of food security.
We highlight three inefficiencies present in extension networks in developing countries that can jeopardize the dissemi-nation of information and technological adoption in agriculture. Perhaps most important is the quality of the information stemming from a lack of training or knowledge on recent innovations. In her review, Aker (2011) notes the disconnect between research institutions and agricultural extension can stymie innovation. Extension workers additionally are often tasked with managing administrative duties, such as data collection and paper work, whereby knowledge transfer falls to the wayside (Anderson and Feder, 2004). Field visits in distant areas are often affected by time and monetary constraints (Sunding and Zilberman, 2001). Lastly, the source of communication can affect the extent information is absorbed, trusted, and utilized (Munshi, 2004; Bandiera and Rasul, 2006; Feder and Savastano, 2006).
Several of these inefficiencies are prominent in Mozambique. Despite a high level of decentralization, the structure of the extension network does not necessarily guarantee a flow of information from the district to the farmers. Contact farmers form the main link between the farmers and the extension network. While contact farmers may appear more trustworthy and can improve farmer access to information due to proximity or simply by way of presenting information in a more palatable manner, those facilitators may not be equipped to teach new techniques or reach the entire community. Furthermore, public extension agents may be less inclined to visit communities especially without providing a clear set of activities.
Working in partnership with the Government of Mozambique, an intervention was designed to reduce these externali-ties. First, we developed an educational agenda for the extension agents and contact farmers, which was to encourage farmers to use innovative agricultural conservation practices. Second, we improved the quality of the information by inten-sively training both the extension agents and contact farmers on the implementation of these techniques and their corre-sponding benefits. Third, we tried to reduce the contact farmer’s transactional costs associated with reaching farmers in the community. We created a demonstration plot within the community, where extension agents would teach and assist contact farmers in implementing at least one of the agricultural practices of the contact farmer’s choice. At the very least, interested farmers could approach the contact farmer on the demonstration plot and inquire about the techniques. We also provided contact farmers with a toolkit which included a bicycle for reaching more distant farmers within the community.
As described above, the intervention involves tailoring extension services and improving the training and visibility of predominantly male contact farmers. Since the region of focus was the Zambezi valley, it was important to investigate methods for increasing extension access to female farmers since following the civil war many households are female-headed (about 30 percent). Moreover, anecdotal evidence suggests that social stigma decreases married female farmers’ demand for (as well as male contact farmer’s supply of) extension services to married women. This is despite married women generally cultivating their own plots according to tradition, which in most cases are separated from plots of other family members such as husband or other wives. Given separated plots and difficulties to freely interact with contact farmers, married women might suffer low access to improved agricultural practices disseminated through the extension network. We therefore allowed an additional treatment which implemented an additional demonstration plot managed by a woman to reduce social barriers between the extension network and female farmers, be it widows or married women.

3
Clearly, adding a demonstration plot in a community, whether male or female-headed, creates additional supply of ex-tension services in a section of our sample. Since we do not have a counterfactual to separate the effect of a woman managing the additional plot from the effect of having an additional plot, our estimates will pool those two effects. However, we find that SLM knowledge and adoption rates are in fact only affected among women in this treatment group. Furthermore, when we check which sources farmers receive extension services from, male and female farmers always acknowledge learning from the female contact farmers not the men. This evidence preliminarily suggests not only did the female interven-tion have the largest impact on women, it was the only impact we could identify over the broader intervention. Identifying the successful approaches could potentially have broader implications for improving extension services overall.
OVERCOMING INFORMATIONAL BARRIERS TO TECHNOLOGICAL ADOP-TION IN AGRICULTURE It is widely understood that the adoption of agricultural technologies in developing countries is a complex process (Feder, Just, and Zilberman, 1985). Adoption can fail in spite of overcoming innovation hurdles and barriers to access and imple-mentation. Supply-side constraints, such as high acquisition costs and underdeveloped seed delivery systems, discouraged the use of high yield and disease-resistant varietals in Kenya and Africa (Shiferaw, Kebede, and You, 2008; Suri, 2009). Irrationality and time inconsistency can constitute barriers to engage in profitable agricultural investments (Duflo et al, 2009). Liquidity constraints can preclude investment. For example, take up of a high-yielding and labor-intensive rice production method was low due to the complementary labor inputs requirements. Risk aversion (coupled with liquidity constraints) further reduces inclinations to invest (Rosenzweig and Binswanger, 1993; Rosenzweig and Wolpin, 1993; Ghadim, Pannell, Burton, 2005; Dercon and Christiaensen, 2011).
An emerging literature focuses on improving the adoption of agricultural technologies by overcoming information barri-ers. Two concepts from the growth literature have influenced the literature. First, observed productivity growth in the absence of investments and innovation have been widely attributed to the contributions of worker experience over time, otherwise known as learning by doing (Arrow, 1962; Ray, 1998 and Thompson, 2010 for a review). Second, learning can foster overall economic growth through knowledge spillovers (Romer, 1986; Lucas, 1993). Such conclusions inspired a wide range of microeconomic work in education and health, investigating programs that improve learning through interactions with peers (Evans, Oates, and Schwab, 1992; Angrist and Lang, 2004; Miguel and Kremer, 2007; Godlonton and Thornton, 2012).
These same principles have been used to characterize farmers’ adoption responses. Farmers’ choices are derived from a dynamic process, where their beliefs about the profitability of the technology are updated based on observed own im-provements in productivity and their neighbors’ (Besley and Case, 1993; 1994; Rosenzweig and Foster, 1995). As Bardhan and Udry (1999) put it, a technology is characterized by ‘circumstantial sensitivity’, which needs to be overcome by local investment in learning. Ideally, farmers engage in learning-by-doing, experimenting with the new technology and thus adapting it to local circumstances (weather, soil characteristics, institutions, etc.). Yet, in an environment of subsistence farming, low education, high risk aversion, and absence of consumption-smoothing mechanisms, learning-by-doing is limited and can be complemented and stimulated by learning-from-others.1
Foster and Rosenzweig (1995) develop and estimate structural (and reduced-form) models of farmer profitability and adoption, which internalize the influence of own learning and learning from neighbors about high yield seed varieties. They find own learning and learning from neighbors positively affect profit net adoption. These profit effects are attributed to the importance of learning on effective input use to maximize the efficiency of high yield varieties. Furthermore, given their own assets, farmers near wealthier or more-educated farmers (who are more likely to adopt) tend to free ride on the learning of others and delay adoption until profitable.
Munshi (2004) noted the importance of population heterogeneity in measuring the strength of social learning. In particu-lar, variation in soil characteristics and input markets render more variance in extrapolating lessons from neighbor perfor-mance. The reliability of high yield varieties also varies. For example, wheat varieties proved more resilient than rice
1 Hogset and Barrett (2010) exposit the conceptual differences between social learning and social influence. The papers described in this section focus on the former, which pays particularly close attention to the relationships between the farmer and the individual- attributes of his circle of influence with respect to adoption. The latter focuses more on the concentration of adopters at the aggregate level, as the name suggests influencing farmer decisions by the sheer concentration of adopters. The distinction is important as far as informing policy interventions. For example, they suggest passive learners will require interventions that improve ties and visibility of previous adopters, whereas the benefits of innovation should be empha-sized for active learners.

4
varieties suggesting the importance of own and neighbor dominant crop in the diffusion process. Munshi addresses this heterogeneity by focusing on the learning behavior of wheat and rice farmers separately. He further notes that despite distinguishing by dominant crop, there is still the possibility that unobserved serial correlation between inputs can produce unfounded social learning effects. He reduces this possible bias by focusing on lagged yield realizations (rather than profit). Moreover, to reduce the possible bias associated from discrepancies in input access, he restricts the sample to districts that produce both wheat and rice. In conclusion, Munshi finds that rice farmers tend to rely on their own experimentation in basing their adoption decisions, whereas wheat farmers pay closer attention to their neighbors.
Feder and Savastano (2006) test whether the characteristics of the peer farmers (also generalized as opinion leaders) who are tasked with transferring knowledge about integrated pest management to other farmers within communities in Indonesia affect the success of knowledge transfer. Drawing from the sociological literature, they specifically test whether “optimal heterophily” of opinion leaders is conducive for effective knowledge transfer. Underlying this concept is the notion that farmers may be more inclined to learn from leaders who are only slightly superior to them in socio-economic characteris-tics. They indeed discover peer farmers who are excessively different are less successful in the transfer of knowledge to most farmers who do not share their similar characteristics and traits.
Bandiera and Rasul (2006) also explore the linkages between social learning and adoption. Their theoretical model pro-vides a justification for the possibility of nonlinear correlations between access to knowledge through networks and adoption decisions. Learning is decomposed into learning by doing and learning from others, where they are assumed substitutes. If few members with a farmer’s network adopt the technology than the marginal value from learning through own adoption increases. However, if a farmer’s network is saturated with adopters, then the value from learning by doing is reduced, causing a strategic delay in adoption. Thus, the theoretical predictions suggest the correlation between adoption and the number of adopters in one’s network is nonlinear. In their Mozambique study, they find farmers’ decisions to adopt sunflower and the number of adopters in their network follow an inverse-U shaped pattern. They further corroborate the importance of heterogeneity in isolating social learning effects along two dimensions. First, individual adoption decisions are more correlat-ed within family and friends than religion-based networks, and uncorrelated among individuals of different religions. Second, the effects are less pronounced for well-informed farmers, as the informational gains in learning from others are reduced.
Conley and Udry (2010) estimate the impacts of social learning on the fertilizer use of pineapple farmers in Ghana. One of the innovative features of their work is their ability to identify the causal relationship between social learning and adoption decisions in agriculture. By collecting detailed spatial information, they can more adequately control for confounding factors. They also create an exogenous measure of social learning by defining farmer’s information networks from a random sample of farmers. 2 In light of these empirical developments, many of their conclusions are similar to inferences from previous work. Fertilizer adoption in southern Ghana can be stimulated through experiences fellow farmers made with the technology. Similarly, learning is more pronounced for those that are less informed (or less experienced in producing pineapple) and have similar wealth attributes as the adopters in their informational network. They also find that adoption is particularly responsive to the adoption decisions of veteran farmers.
Reviewing the recent work on social learning and technological adoption, we have identified two knowledge gaps that we attempt to address here. First, these studies focus on the adoption of inputs and crop choice. Cultivation techniques are widely encouraged in developing countries as they incur less upfront monetary costs and mitigate the prevalence of soil erosion, improve the efficiency of water use, and increase yields, while generating broader environmental benefits to society. However, their implementation is complex, and many of the benefits (such as improvements in soil quality) are realized over a longer time horizon. Farmers producing at subsistence levels will likely experience particularly high levels of risk aversion with regard to their cultivation decision. Our study offers one of the first examples of measuring social learning effects on the adoption of cultivation technologies through randomizing SLM training and the use of demonstration plots at the communal level.
Second, the literature stresses knowledge transfers hinge on many factors such as family ties, religion, and farmer het-erogeneity. We analyze another possible barrier to social learning: gender. In our setting, married women generally cultivate their own plots which in most cases are separated from plots of other family members such as husband or other wives. Given separated plots and difficulties to freely interact with facilitators, married women might suffer low access to improved
2 Recent work exploits randomized eligibility for the technology within a village (McNiven and Gilligan, 2012) and experimental auctions (Magnan et al., 2012) to improve identification of social learning and technological adoption.

5
agricultural practices disseminated through the extension network.3 We study women farmers’ technology adoption by analyzing the impact of supplying additional women-led demonstration plots. Testing if gender functions as a barrier to social learning and if a gender-specific intervention reduces such barriers constitutes an innovative and novel contribution to the literature of technology adoption in developing countries.
EVALUATION DESIGN The Market-led Smallholders Development in the Zambezi Valley Project (or Smallholders Project) is implemented by the Government of Mozambique with financial and technical support from the World Bank. It was initiated to support continued income growth of smallholder farmers in five districts of the Zambezi Valley: Mutarara (Tete province), Maríngue and Chemba (Sofala province), Mopeia and Morrumbala (Zambézia province). Project activities include agribusiness and market development, and supporting institutional reform by strengthening the agricultural extension network and service quality. In addition, while agricultural growth was on the rise, marking 10.4 percent prior to the project in 2006, the project promoted sustainable growth through encouraging conservation agricultural practices (World Bank, 2007).4
A major aspect of the project is to support the development of the extension network. The project provides three types of technical assistance: each district has a facilitator and environmental specialist, each administrative post (AP) has two extension workers which each serve about 8-10 communities, and lastly each community has a contact farmer. The contact farmer receives direct assistance from the AP extension agents who then receive direct assistance from the district level technical staff. The contact farmers (CFs) provide advice to their peers within their community on a voluntary, demand-driven basis. An important implication is that CFs may not reach the entire community or take initiative in organizing community-wide training sessions. In addition, in the absence of a clear set of activities to be performed within the community, the AP extension agents are less likely to travel to the communities to provide hands-on, field assistance to facilitators and other farmers.
To reconcile some of these issues, we formalized the training of extension agents and contact farmers, focusing on a specific set of agricultural techniques, sustainable land management practices in line with objectives of the Smallholders project. Next, we introduced demonstration plots to further engage CFs with farmers, by improving the quality and access to the knowledge within the community. These demonstration plots would be maintained by the CFs with the technical assis-tance from the local extension agent.
The purpose of the evaluation is to measure whether these interventions affect the farmer knowledge and adoption of sustainable land management (SLM) techniques. In order to measure these effects, we implemented a multi-treatment arm randomized design. A census of communities in five districts was used to randomize treatment and control groups across 200 communities5: 50 communities were assigned to the control group, 150 communities were assigned to treatment 1, and 75 communities were assigned to treatment 2.6 The first treatment group comprises communities who have a male CF who received specialized training and has a demonstration plot. The second treatment group compromises communities that, in addition to having a male CF and a demonstration plot, also have a female CF with a demonstration plot. Male CFs selected the female CFs, who, with the extension agent, they would support in managing her own demonstration plot. In exchange, she was asked to transfer her knowledge with a special mandate to support other women farmers adopt SLM practices. The control group communities each have a male CF who had not received specialized training nor had a demonstration plot.
3 In his study for Burkina Faso, Udry (1996) finds large and significant differences in technology use (fertilizers) across men-controlled and women-controlled plots, leading to large production inefficiencies. In her recent review, Ragasa (2012) documents several case studies which discuss the driving forces behind inequitable access to extension ranging from a lack of female representation among extension agents to sociocultural con-straints. 4 Prior to the period of war and conflict, this area of the country was of high agricultural value. Emphasis on revitalizing the agricultural sector in this region has been placed by directing resources to smallholder farmers through foreign aid and internally through the Zambezi Valley Promotion Agency. 5 We used the census of 291 existing community facilitators and their communities from five districts, conducted in August 2010, to randomize control and treatment group assignment. Within each district, the communities were grouped by geographic proximity (7 km or less). Then, one community was selected from each group randomly 40 times. Of the 40 communities, 10 communities were randomly assigned into the control group, and 30 were randomly assigned into treatment 1. Of the 30 communities in treatment 1, 15 were randomly assigned into treatment 2. 6Although not discussed in detail here, there was a third treatment group that aimed to provide social and material performance incentives for the community facilitator to propagate the technique. We were unable to implement these treatment arms prior to this round of the survey. However, they are currently in the process of being implemented in the field and will be analyzed upon collecting the second survey round in February 2013.

6
In October 2010 (prior to the main planting season), CFs were given extensive training in SLM practices: Mulching, Crop Rotation, Intercropping, Reduced Tillage, Micro-basins, Contour Farming, Row Planting, and Improved fallowing. First, the extension agents were given a three-day training course in SLM techniques. Half of the time, extension agents attended in-class lectures, and the remainder of the course consisted of plot demonstrations. The following week the extension agents taught the same course to train the CFs.7 CFs received a toolkit (bicycle, tools to plow the land, and smaller articles) and the mandate to propagate the techniques which are pertinent to their local area on their demonstration plots.
Prior to the project, farmers in this region engaged in mono-cultural farming, intensive weeding, unstructured intercrop-ping, planting along the slope on inclined plots, and the use of fire to remove weed and previous season crop residues. Most farmers also failed to cover the ground with organic material or apply crop rotation. Mulching maintains soil humidity, suppresses weeds, reduces soil erosion, and enriches the quality of the soil cover.8 Crop rotation improves soil fertility and reduces the proliferation of plagues.9 Intercropping, allows for the cultivation of several crops at once, which implies more efficient land use, while also enhances soil quality and diversifies risk against plagues or shocks (since they affect crops differently).10 Reduced tillage, as the name suggests, prevents opening the soil, such as through plowing, harrowing, or digging.11 Instead, contact farmers were explained to cultivate in micro-basins (approximately 15 cm deep permanent holes), which aid water and nutrient accumulation around the plant. Contour farming is the use of crop rows on slopes along contour lines fortified by stones, sand, grass, or pieces of wood, which reduces water loss and erosion on sloped land. Row planting can improve productivity by improving access to sunlight and facilitates weeding and other cultivation practices by providing space between rows. Improved fallowing reduces the productivity losses from fallowing land by targeted planting of species that enrich soil in a shorter timeframe than traditional fallowing.
The extensiveness of the training provided the CFs with the flexibility to choose one of several SLM techniques to adopt on the demonstration plot. Which techniques are adopted will depend on those that are most relevant to the CF and perhaps his or her peers. This is to say that the techniques implemented on the demonstration plots are not uniform across treatment communities, since the marginal value of adopting a technique will differ by the predominant crops grown, soil quality, topography, and other local conditions. Thus, for the purpose of evaluating the intervention, our key focus will be on how it impacts farmer knowledge in and adoption rates for at least one SLM technique.
Survey Data The National Statistics Institute (INE) of Mozambique was commissioned to collect the survey data. The field work con-
sisted of two phases: pre- and post-harvest. There were five survey instruments: a household knowledge and adoption survey, a household agricultural production survey, a contact farmer survey, a public extensionist survey, and a community survey. The analysis in this paper uses information from the household knowledge and adoption survey. The household survey asked several questions related to household demographics, individual (male and female household heads and their spouses) knowledge of SLM and non-SLM agricultural practices, individual labor allocation, employment, and income, plot-specific characteristics, among others. Self-reported and objective measures of SLM adoption were also documented in this survey. In particular, for two plots in every household, a male and a female-managed plot, the enumerators would identify which SLM techniques were adopted on the plot, if any, and then measure total area of each plot that uses each SLM technique using a GPS.12 Since SLM practices are most visible prior to planting, we conducted this portion of the survey during the months of February through April in 2012. The information was collected for approximately 4,000 households
7 The project had started to disseminate mulching, reduced tillage, row planting, and crop rotation as early as 2008 which appeared to halt the burning of weeds of some contact farmers and increase the application of techniques. However, the formal practice of SLM was sparse at the time of the intervention and most extension agents and contact farmers had not received a formal training on SLM techniques or been instructed to transfer their knowledge to their peers. 8 Even though mulching can be applied to most crops cultivated in the region, the training focused on its application on legumes (pigeon pea, cowpea, common bean, groundnut) and vegetables such as tomato, lettuce, onion, cabbage, cucumber, or pepper. 9 In particular, contact farmers were trained in rotating between crops that use up large quantities of nitrogen (cabbage), phosphorus (maize, sesame, tomato), or potassium (cassava, sweet potato), and in including nitrogen-fixating crops (pigeon pea, cowpea, common bean, groundnut). 10 Staples of the Zambezi Valley region such as maize, sorghum, or cassava were trained to be intercropped with pigeon pea, sesame, cowpea, or groundnut. 11 Reducing tillage implies less work during plot preparation and, again, preserves soil from erosion, water loss, and long-run degradation. 12 In order to select a plot managed by the man and woman of the household, each was asked which plot is most important to himself/herself and primarily his/her responsibility. The enumerators were instructed to report two distinct plots. If either male or female claimed they did not have any responsibility to a particular plot, they were asked to indicate on which plot they spent the most of their time.

7
(Figure 1), including the households of the male and female CFs.13 To improve the precision of reported agricultural produc-tion, we administered the household agricultural production survey (and the remaining surveys) post-harvest during May and June in 2012.
Figure 1: Households in Smallholder Survey
Table 1 provides descriptive statistics of the female and male plot owners in our sample (omitting contact farmers from the analysis).14 A majority of our plot owners are female, due to the high prevalence of female headship in this region (approximately 30 percent).15 The average plot owner is approximately 38 years old with only 2 years of schooling. The majority of the plot owners are married with 3 children, living in a single-room house made of mud and sticks with housing roofs made of tinplate. The descriptive statistics also suggest variation in land assets. The average plot size is 0.8 hectares with a standard deviation of 0.9. Total landholdings consist of 2 hectares on average with a standard deviation of 1.8.
13 We collected a listing of households for each community (enumeration area) to establish a simple random sampling frame for the non-community facilitator households. 14 These variables are also used as explanatory variables in the regression analysis. 15 These figures on consistent with statistics on headship calculated using the 2008 National Agricultural Surveys (TIA).

8
Table 1: Descriptive Statistics of Plot Owners (Independent Variables) Variables Mean S.D.
Male 0.4148 0.4927
Age 37.5965 14.4001
Years of schooling completed 1.9966 2.8100
Single 0.0633 0.2436
Married 0.8445 0.3624
Divorced, separated, or widowed 0.0897 0.2858
Number of children (ages < 15 years) 2.8001 2.0255
Number of males (ages 15-25 years) 0.4125 0.6685
Number of males (ages 26-40 years) 0.3895 0.4992
Number of males (ages 41-55 years) 0.2166 0.4127
Number of males (ages > 55 years) 0.1344 0.3430
Number of females (ages 15-25 years) 0.4626 0.6084
Number of females (ages 26-40 years) 0.4877 0.5295
Number of females (ages 41-55 years) 0.1905 0.4049
Number of females (ages > 55 years) 0.1067 0.3161
Average schooling of family members (ages > 18 years) 2.2064 2.3855
Individual plot size 0.7909 0.9338
Total area of plots that used in 2011/2012 2.0026 1.8010
Number of rooms in the house 1.4409 0.7369
Housing walls made of brick 0.1016 0.3021
Housing walls made of mud 0.2068 0.4051
Housing walls made of palm/bamboo 0.1511 0.3582
Housing walls made of mud and sticks 0.5366 0.4987
Housing roof made of tinplate 0.9119 0.2753
Housing roof made of palm/bamboo 0.0055 0.2835
Number of Observations 6174 6174
While the initial round of the Smallholders’ survey was conducted 15 months after the training, we collected a census of baseline information for 291 CFs in the five districts in August 2010. Table 2 presents the averages of CF characteristics by treatment and control group. There are few differences between the CFs across groups prior to the training, with the excep-tion that conditional on receiving formal training, male CFs in the treatment group tend to have more recent training. They also tend to work more hours.

9
Table 2: Average Characteristics of Community Facilitators Prior to Intervention
Variable Treatment 1 Treated
Treatment 1 Control
Treatment 2 Treated
Treatment 2 Control
Mean differences (p-value)
Treatment 1
Mean differences (p-value) Treat-
ment 2
Age CF 38.88 40.1 39 38.76 0.22 0.43
(148, 0.77) (50, 1.5) (73, 1.11) (75, 1.06) Ever being formally trained
0.350 0.447 0.36 0.34 0.12 0.38 (140, 0.04) (47, 0.07) (69, 0.06) (71, 0.06) Number of years since
training, conditional on formal training
2.16 3.41 2.24 2.08 0.03** 0.40
(51, 0.31) (22, 0.68) (25, 0.46) (26, 0.44)
Experience as CF in years 2.24 2.67 2.32 2.15 0.14 0.35
(144, 0.20) (49, 0.36) (73, 0.31) (71, 0.26) Number of Farmers assisted last 7 days
17.66 20.2 16.9 18.41 0.16 0.28 (147, 1.27) (50, 2.31) (73, 1.99) (74, 1.59)
Number of male farmers among farmers assisted in last 7 days
10.81 11.04 10.82 10.79 0.44 0.49
(147, 0.80) (50, 1.27) (74, 1.27) (73, 0.97) Number of Farmers assisted last 30 days
37.04 38.43 37.52 36.57 0.38 0.42 (133, 2.46) (46, 3.89) (65, 4.17) (68, 2.71)
Number of male farmers among farmers assisted in last 30 days
22.51 22.16 20.99 24.03 0.44 0.11
(148, 1.24) (50, 22.16) (74, 1.77) (74, 1.74) Hours worked as CF in last 7 days
14.81 12.34 15.03 14.59 0.11 0.42 (144, 1.06) (50, 1.64) (73, 1.48) (71, 1.53)
Hours normally working as CF per week
16.48 12.5 17.46 15.49 0.03** 0.17 (143, 1.04) (50, 1.68) (72, 1.51) (71, 1.45)
Total acreage of cultivated land
4.11 3.65 3.6 4.62 0.28 0.12 (144, 0.43) (50, 0.50) (71, 0.34) (73, 0.78)
Number of households in community
530.63 329.19 428.27 629.8 0.15 0.17 (126, 107.53) (42, 93.88) (62, 96.34) (64, 190.11)
Number of plots in community 864.65 782.06 613.52 1106.64 0.42 0.10
(108, 191.38) (32, 277.40) (53, 179.88) (55, 332.07) Notes: Number of observations and standard deviations in parentheses. **, * indicate significance at the 5 and 10 percent critical level.
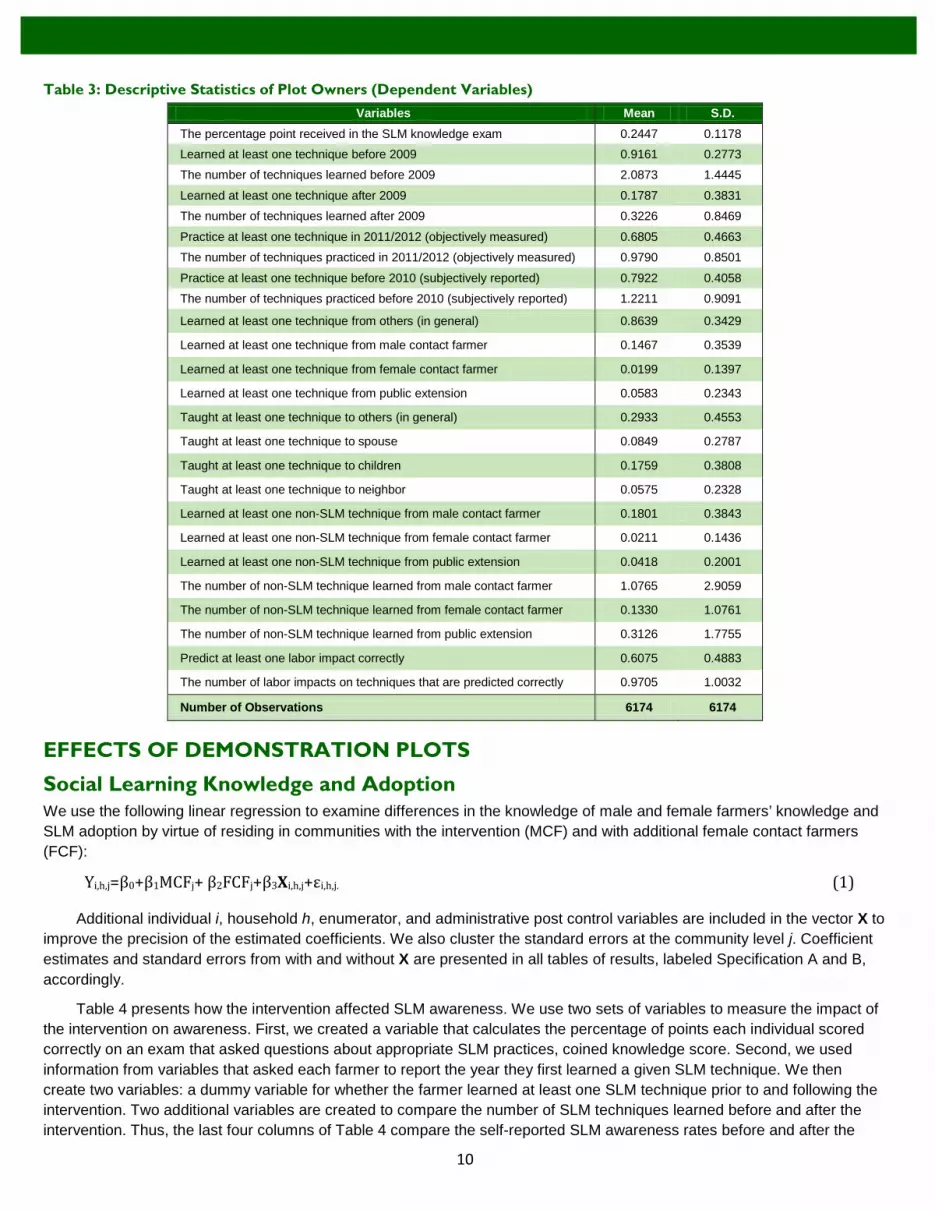
We also provide descriptive statistics on the knowledge and adoption variables used to evaluate the impact of the SLM training and demonstration plot intervention in Table 3. Interestingly, 91 percent of the population had learned at least one SLM technique before the intervention, which can be compared to only 18 percent that had learned at least one technique following the intervention. Prior to the season of training, 79 percent of the farmers practiced at least one technique, com-pared to 68 percent, following the intervention.16 Both of these figures suggest the potential for diminishing application of SLM techniques over time. In what follows, we formalize the contribution of the intervention using the retrospective and present practice variables in regression analysis. We provide sample averages across treatment groups using unconditional regressions where by the intercept can be interpreted as the sample average of the dependent variable among the control group, as well as, using a series of controls to improve the precision of the impact estimates.
16 Although we show the number of techniques adopted in Table 3, we also include the distribution of the number of techniques adopted before and after the intervention in the Appendix. It is clear that fewer techniques are applied on average at the time of and after the intervention.
10
Table 3: Descriptive Statistics of Plot Owners (Dependent Variables) Variables Mean S.D.
The percentage point received in the SLM knowledge exam 0.2447 0.1178 Learned at least one technique before 2009 0.9161 0.2773
The number of techniques learned before 2009 2.0873 1.4445
Learned at least one technique after 2009 0.1787 0.3831
The number of techniques learned after 2009 0.3226 0.8469
Practice at least one technique in 2011/2012 (objectively measured) 0.6805 0.4663
The number of techniques practiced in 2011/2012 (objectively measured) 0.9790 0.8501
Practice at least one technique before 2010 (subjectively reported) 0.7922 0.4058
The number of techniques practiced before 2010 (subjectively reported) 1.2211 0.9091
Learned at least one technique from others (in general) 0.8639 0.3429
Learned at least one technique from male contact farmer 0.1467 0.3539
Learned at least one technique from female contact farmer 0.0199 0.1397
Learned at least one technique from public extension 0.0583 0.2343
Taught at least one technique to others (in general) 0.2933 0.4553
Taught at least one technique to spouse 0.0849 0.2787
Taught at least one technique to children 0.1759 0.3808
Taught at least one technique to neighbor 0.0575 0.2328
Learned at least one non-SLM technique from male contact farmer 0.1801 0.3843
Learned at least one non-SLM technique from female contact farmer 0.0211 0.1436
Learned at least one non-SLM technique from public extension 0.0418 0.2001
The number of non-SLM technique learned from male contact farmer 1.0765 2.9059
The number of non-SLM technique learned from female contact farmer 0.1330 1.0761
The number of non-SLM technique learned from public extension 0.3126 1.7755
Predict at least one labor impact correctly 0.6075 0.4883
The number of labor impacts on techniques that are predicted correctly 0.9705 1.0032
Number of Observations 6174 6174
EFFECTS OF DEMONSTRATION PLOTS
Social Learning Knowledge and Adoption We use the following linear regression to examine differences in the knowledge of male and female farmers’ knowledge and SLM adoption by virtue of residing in communities with the intervention (MCF) and with additional female contact farmers (FCF):
Yi,h,j=β0+β1MCFj+ β2FCFj+β3Xi,h,j+εi,h,j. (1)
Additional individual i, household h, enumerator, and administrative post control variables are included in the vector X to improve the precision of the estimated coefficients. We also cluster the standard errors at the community level j. Coefficient estimates and standard errors from with and without X are presented in all tables of results, labeled Specification A and B, accordingly.
Table 4 presents how the intervention affected SLM awareness. We use two sets of variables to measure the impact of the intervention on awareness. First, we created a variable that calculates the percentage of points each individual scored correctly on an exam that asked questions about appropriate SLM practices, coined knowledge score. Second, we used information from variables that asked each farmer to report the year they first learned a given SLM technique. We then create two variables: a dummy variable for whether the farmer learned at least one SLM technique prior to and following the intervention. Two additional variables are created to compare the number of SLM techniques learned before and after the intervention. Thus, the last four columns of Table 4 compare the self-reported SLM awareness rates before and after the

11
intervention by treatment group in an attempt to measure awareness changes over time using retrospective survey infor-mation.
Table 4: SLM Knowledge Intensity
Knowledge
Score
At least one SLM technique learned before
and in 2009
Number of SLM tech-
niques learned before
and in 2009
At least one SLM technique learned after
2009
Number of SLM tech-
niques learned after
2009 Specification A B A B A B A B A B All FARMERS Male CF -0.003 -0.002 -0.013 -0.019 -0.065 -0.047 -0.006 -0.006 0.041 0.036 (0.014) (0.005) (0.017) (0.015) (0.152) (0.067) (0.021) (0.020) (0.042) (0.044) Female CF 0.014 0.007 0.007 0.007 -0.034 0.014 0.048** 0.040** 0.073 0.060 (0.012) (0.005) (0.018) (0.014) (0.137) (0.061) (0.024) (0.020) (0.052) (0.045) Constant 0.242*** 0.148*** 0.924*** 0.826*** 2.149*** 0.620* 0.165*** 0.191 0.265*** 0.266 (0.012) (0.037) (0.012) (0.140) (0.117) (0.373) (0.016) (0.191) (0.027) (0.379) N 6174 6126 6174 6126 6174 6126 6174 6126 6174 6126 Adj. R-Sq 0.003 0.585 0.000 0.126 0.000 0.482 0.003 0.143 0.003 0.164 FEMALE FARMERS Male CF -0.007 -0.001 -0.030 -0.032* -0.089 -0.037 -0.016 -0.014 0.041 0.032 (0.014) (0.006) (0.020) (0.016) (0.150) (0.070) (0.021) (0.020) (0.043) (0.043) Female CF 0.018 0.009* 0.015 0.011 0.007 0.027 0.054** 0.046** 0.085 0.079* (0.012) (0.005) (0.020) (0.015) (0.133) (0.063) (0.023) (0.020) (0.052) (0.046) Constant 0.239*** 0.107 0.921*** 0.499 2.041*** 0.790 0.172*** 0.070 0.265*** 0.024 (0.012) (0.067) (0.014) (0.378) (0.117) (0.749) (0.016) (0.131) (0.027) (0.267) N 3613 3579 3613 3579 3613 3579 3613 3579 3613 3579 Adj. R-Sq 0.004 0.585 0.001 0.158 0.000 0.484 0.003 0.148 0.003 0.185 MALE FARMERS Male CF 0.002 -0.002 0.010 0.000 -0.034 -0.069 0.008 0.005 0.041 0.044 (0.015) (0.006) (0.018) (0.017) (0.169) (0.077) (0.027) (0.025) (0.053) (0.054) Female CF 0.009 0.004 -0.005 0.000 -0.094 -0.002 0.041 0.035 0.056 0.037 (0.013) (0.006) (0.018) (0.015) (0.154) (0.072) (0.028) (0.024) (0.060) (0.050) Constant 0.246*** 0.154*** 0.927*** 0.981*** 2.303*** 0.574* 0.155*** 0.288 0.266*** 0.484 (0.013) (0.041) (0.014) (0.050) (0.129) (0.314) (0.020) (0.255) (0.036) (0.490) N 2561 2547 2561 2547 2561 2547 2561 2547 2561 2547 Adj. R-Sq 0.001 0.589 -0.001 0.077 0.001 0.481 0.002 0.132 0.001 0.133
Standard errors are clustered at the community level and reported in parentheses. * p<0.10 ** p<0.05 *** p<0.01. Specification A is an unconditional regression.
Specification B includes the following explanatory variables: individual gender, individual age, individual grades completed, individual marital status, number of children (ages 0-15) in the household, the number of males and females in the following age categories (15-25, 26-40, 41-55, and >55) in the household, number of rooms in the house, dummy variables for housing wall and roof materials, average education of adults in household (aged > 25), total household landholdings, enumerator and administrative post dummy variables.
CF = Contact Farmer.
In general, farmers were knowledgeable in at least 1 SLM technique prior to the intervention. For instance, most farm-ers learned at least one SLM technique (92 percent) and on average learned 2 techniques prior the intervention. As we would expect, there are no statistical differences in SLM awareness prior to the intervention between the farmers in the treatment and control groups with one exception. After controlling for various factors, we find a marginally significant nega-tive impact of the intervention (MCF) on the awareness of female farmers prior to 2009. Following the intervention, the learning rate (but not the number of techniques learned) increased among all farmers who were in the communities with female contact farmers (CFs) by 0.04 (which is 24 percent of the mean awareness rate). Upon disaggregating by the gender of the farmer, this effect is only statistically significant for female farmers and slightly larger. We also find a marginally significant effect on the number of techniques adopted by female farmers of 0.079 (or 30 percent of the mean).
Despite the abovementioned results on SLM awareness, the average levels of knowledge intensity are rather low. The average score on the SLM exam was 24 percent for farmers in the control group. Interestingly, there were few discrepancies in the knowledge intensity across male and female farmers. While we do not find robust improvements in knowledge intensi-

12
ty attributable to the intervention (MCF), we do find that female farmers in the communities with additional female CFs improve their knowledge score by 0.009, which is equivalent to a 3.8 percent effect size.
We next examine whether SLM adoption is as widespread as awareness (Table 5). We compare the objective measure of adoption rates (15 months following the intervention) across treatment groups to the self-reported measure of adoption rates prior to the intervention. While approximately 71 percent of farmers in the control group had already adopted at least one SLM technique, this appears to have slightly decreased over the years from 79 percent. One could also attribute the discrepancy in figures to the noise introduced by recalling adoption rates over a year later. With respect to the intervention, we do not witness any impact on adoption rates. However, we find that having the female CF increased the number of SLM techniques adopted by 7.5 percent for the entire sample of farmers and 9.9 percent for the sample of female farmers.
Table 5: SLM Adoption
Objective Measure: At least one SLM
technique adopted in 2011/12
Objective Measure: No. of SLM tech-
niques adopted in 2011/12
Self-reported: at least one SLM technique adopted before 2010
Self-reported: No. of SLM techniques
adopted before 2010 Specification A B A B A B A B All FARMERS Male CF -0.050 -0.014 -0.147 -0.064 -0.004 -0.021 -0.070 -0.068 (0.056) (0.022) (0.111) (0.045) (0.031) (0.020) (0.081) (0.045) Female CF 0.027 0.013 0.071 0.080** 0.011 0.011 0.045 0.049 (0.050) (0.021) (0.095) (0.038) (0.027) (0.019) (0.071) (0.042) Constant 0.708*** 0.809*** 1.062*** 0.769** 0.791*** 0.946*** 1.257*** 0.759*** (0.042) (0.215) (0.091) (0.360) (0.025) (0.053) (0.066) (0.140) N 5465 5422 5465 5422 6174 6126 6174 6126 Adj. R-Sq 0.001 0.459 0.004 0.541 -0.000 0.193 0.001 0.260 FEMALE FARMERS Male CF -0.051 -0.014 -0.161 -0.081 -0.020 -0.030 -0.097 -0.073 (0.057) (0.026) (0.116) (0.051) (0.033) (0.022) (0.084) (0.048) Female CF 0.031 0.009 0.119 0.104** 0.023 0.017 0.082 0.072 (0.051) (0.026) (0.100) (0.047) (0.029) (0.021) (0.073) (0.044) Constant 0.697*** 1.010*** 1.054*** 1.081*** 0.791*** 1.020*** 1.238*** 0.621* (0.044) (0.141) (0.096) (0.222) (0.026) (0.119) (0.069) (0.330) N 3110 3081 3110 3081 3613 3579 3613 3579 Adj. R-Sq 0.001 0.463 0.006 0.545 0.000 0.201 0.002 0.269 MALE FARMERS Male CF -0.049 -0.017 -0.129 -0.046 0.019 -0.009 -0.033 -0.064 (0.060) (0.025) (0.116) (0.048) (0.034) (0.025) (0.086) (0.053) Female CF 0.022 0.020 0.008 0.053 -0.007 0.004 -0.006 0.024 (0.054) (0.023) (0.096) (0.039) (0.029) (0.022) (0.076) (0.050) Constant 0.722*** 0.682** 1.075*** 0.541 0.790*** 0.933*** 1.284*** 0.710*** (0.044) (0.270) (0.093) (0.494) (0.027) (0.064) (0.067) (0.162) N 2355 2341 2355 2341 2561 2547 2561 2547 Adj. R-Sq 0.001 0.506 0.003 0.568 -0.000 0.190 -0.000 0.247
Using the current empirical model, we face the challenge in attributing changes in outcomes to the gender of the CF, since we do not assign a treatment group to have only a single, female CF or two male CFs. It is possible that any effect estimated for β2 actually measures the impact of having two CFs in a community. We observe that the intervention with an additional female CF mainly had a statistically significant impact on female awareness and adoption. Furthermore, for many of the outcomes, we actually find having a male contact farmer negatively impacts adoption, though the effect is not statisti-cally significant. Taken together, these findings are amenable to findings in the social learning literature where social learning is more pronounced among farmers with similar observed attributes. However, to further corroborate these inferences we next examine the learning channels.
Learning Channels Previous empirical work tests for the presence of social learning by regressing adoption on the share of adopters in a farmer’s network. Manski (1993) notes the problem with measuring social influence on adoption, through the concentration of

13
adopters in one’s social network is that there are additional explanations for an estimated correlation. Furthermore, there is the well-known reflection problem where the farmer’s actions likely influence the actions of members of his network render-ing identification of causality difficult.17 The design of our intervention captures social learning between the contact farmer (the messenger) and peers within the community (the recipients of the CFs knowledge and SLM demonstrations). However, the design does not necessarily guarantee the transfer of knowledge between the contact farmers and other members of the community. We therefore show how the source of SLM learning varies, according to farmers, by treatment group.
Table 6: Source of SLM Learning
Anyone Male CF Female CF Extension Agent Specification A B A B A B A B All FARMERS Male CF 0.013 -0.004 0.015 0.016 0.002 0.006 -0.009 -0.013 (0.028) (0.018) (0.023) (0.020) (0.003) (0.005) (0.012) (0.011) Female CF 0.022 0.014 0.025 0.017 0.039*** 0.035*** 0.026** 0.024** (0.021) (0.014) (0.026) (0.023) (0.012) (0.010) (0.013) (0.012) Constant 0.846*** 0.838*** 0.126*** -0.156*** 0.004** -0.054*** 0.055*** -0.119*** (0.023) (0.165) (0.016) (0.056) (0.002) (0.020) (0.010) (0.034) N 6174 6126 6174 6126 6174 6126 6174 6126 Adj. R-Sq 0.001 0.241 0.002 0.149 0.018 0.062 0.002 0.089 FEMALE FARMERS Male CF -0.001 -0.011 0.006 0.014 -0.000 0.005 -0.012 -0.012 (0.029) (0.019) (0.021) (0.018) (0.003) (0.005) (0.010) (0.009) Female CF 0.031 0.022 0.026 0.017 0.036*** 0.032*** 0.024*** 0.022** (0.023) (0.015) (0.023) (0.020) (0.011) (0.009) (0.009) (0.009) Constant 0.855*** 1.030*** 0.107*** -0.075 0.005** 0.049 0.038*** -0.162*** (0.023) (0.140) (0.015) (0.136) (0.002) (0.065) (0.008) (0.047) N 3613 3579 3613 3579 3613 3579 3613 3579 Adj. R-Sq 0.001 0.256 0.001 0.164 0.016 0.064 0.002 0.048 MALE FARMERS Male CF 0.034 0.007 0.028 0.019 0.004 0.007 -0.005 -0.019 (0.030) (0.020) (0.031) (0.027) (0.004) (0.006) (0.021) (0.017) Female CF 0.011 0.005 0.023 0.019 0.043*** 0.039*** 0.028 0.027 (0.023) (0.017) (0.035) (0.031) (0.014) (0.012) (0.022) (0.019) Constant 0.832*** 0.741*** 0.154*** -0.187** 0.003 -0.084*** 0.081*** -0.138*** (0.025) (0.222) (0.022) (0.077) (0.002) (0.025) (0.017) (0.048) N 2561 2547 2561 2547 2561 2547 2561 2547 Adj. R-Sq 0.002 0.229 0.002 0.138 0.021 0.070 0.001 0.133
Standard errors are clustered at the community level and reported in parentheses. * p<0.10 ** p<0.05 *** p<0.01. Specification A is an unconditional regression. Specification B includes the following explanatory variables: individual gender, individual age, individual grades completed, individual marital status, number of children (ages 0-15) in the household, the number of males and females in the following age categories (15-25, 26-40, 41-55, and >55) in the household, number of rooms in the house, dummy variables for housing wall and roof materials, average education of adults in household (aged > 25), total household landholdings, enumerator and administrative post dummy variables. CF abbreviates Contact Farmer.
Table 6 shows to whom farmers attribute the source of their SLM learning. Interestingly, while 84.6 percent of the farm-ers claim to have learned SLM from someone, only 12.6 percent of our sample claims to have learned SLM from male CFs. Since male CFs in the control group were not trained in SLM techniques nor do they have a demonstration plot, it is not surprising that fewer farmers accredit their learning to this source. However, overall farmers in the treatment groups are not accrediting male CFs as the source of their SLM knowledge which remains consistent with the SLM knowledge and adoption analysis. Rather, all farmers (male and female) attribute the female CF as a source of their SLM learning. While the farmers in the same treatment group also claim extension agents provide them with information on SLM techniques, only female farmers declare extension agents as another source of SLM information when the analysis is disaggregated by the gender of
17 Hogset and Barrett (2010) further add the tendency for adopters to over-report adoption rates within their network can produce a false peer effect (projection bias).

14
the farmer. These findings not only confirm that female farmers knowledge and adoption rates are likely influenced by the female CF, but they also suggest that overall female CFs are reaching a wider array of farmers within the community than other potential sources of information.
Given the time elapsed between the intervention and the survey, it is possible that there was more interaction between the CFs and the farmers immediately following the intervention which dwindled by the time of our household survey. For this reason, it is equally important to examine the extent knowledge transfer is sustained through discussions between farmers within the community. Table 7 reports the results from a question which asks farmers to report to whom they taught SLM techniques. An overwhelmingly, 28.7 percent of farmers claimed to teach someone an SLM technique, where the rate is slightly lower for women (22.1 percent) and higher for men (38.4 percent). When men and women are included in the same sample, we find that those in the communities with additional female CFs tend to teach their children (an effect size of 12.9 percent). Upon disaggregating by farmer’s gender, the statistical significance of this effect disappears. However, we do witness that male farmers in the treatment group with female CFs have a higher propensity to teach people SLM techniques (an effect size of 13.3 percent).
Table 7: To Whom Farmers Taught SLM
Anyone Spouse Child Neighbor Specification A B A B A B A B All FARMERS Male CF -0.007 -0.013 -0.018 -0.013 -0.007 -0.008 0.007 -0.003 (0.022) (0.018) (0.013) (0.011) (0.018) (0.015) (0.012) (0.009) Female CF 0.030 0.033** 0.012 0.010 0.027 0.022* 0.001 0.006 (0.020) (0.015) (0.012) (0.009) (0.017) (0.013) (0.012) (0.009) Constant 0.287*** -0.365*** 0.094*** -0.245*** 0.171*** -0.237*** 0.052*** -0.029 (0.017) (0.072) (0.011) (0.040) (0.014) (0.067) (0.009) (0.032) N 6174 6126 6174 6126 6174 6126 6174 6126 Adj. R-Sq 0.001 0.278 0.000 0.190 0.001 0.276 -0.000 0.194 FEMALE FARMERS Male CF 0.003 -0.004 -0.005 -0.004 -0.007 -0.008 0.008 -0.000 (0.022) (0.018) (0.005) (0.005) (0.018) (0.016) (0.012) (0.010) Female CF 0.022 0.022 0.006 0.007 0.028 0.021 0.001 0.005 (0.022) (0.016) (0.005) (0.005) (0.018) (0.013) (0.013) (0.009) Constant 0.221*** -0.207 0.014*** -0.020 0.162*** -0.236 0.042*** 0.037 (0.017) (0.175) (0.004) (0.049) (0.014) (0.152) (0.009) (0.090) N 3613 3579 3613 3579 3613 3579 3613 3579 Adj. R-Sq 0.000 0.301 0.000 0.018 0.001 0.273 -0.000 0.205 MALE FARMERS Male CF -0.023 -0.026 -0.038 -0.024 -0.006 -0.011 0.004 -0.007 (0.032) (0.028) (0.030) (0.024) (0.023) (0.019) (0.016) (0.012) Female CF 0.040 0.051** 0.018 0.019 0.027 0.027 -0.000 0.008 (0.026) (0.023) (0.026) (0.020) (0.020) (0.018) (0.015) (0.013) Constant 0.384*** -0.424*** 0.208*** -0.280*** 0.183*** -0.279*** 0.067*** -0.099** (0.025) (0.083) (0.024) (0.067) (0.018) (0.088) (0.012) (0.042) N 2561 2547 2561 2547 2561 2547 2561 2547 Adj. R-Sq 0.000 0.258 0.001 0.245 0.000 0.280 -0.001 0.192
Standard errors are clustered at the community level and reported in parentheses. * p<0.10 ** p<0.05 *** p<0.01. Specification A is an unconditional regression. Specification B includes the following explanatory variables: individual gender, individual age, individual grades completed, individual marital status, number of children (ages 0-15) in the household, the number of males and females in the following age categories (15-25, 26-40, 41-55, and >55) in the household, number of rooms in the house, dummy variables for housing wall and roof materials, average education of adults in household (aged > 25), total household landholdings, enumerator and administrative post dummy variables. CF abbreviates Contact Farmer.
Knowledge Spillovers Lastly, we examine the potential for knowledge spillovers (Table 8). Since contact farmers are prompted to initiate a dialogue with other farmers over a specific task, we hypothesize that through these discussions it is possible that the transfer of

15
knowledge in other areas might take place. We find that all farmers generally report learning non-SLM information from male contact farmers even more so than extension agents (16 percent compared to 3.6 percent). However, all farmers attribute learning additional information from female contact farmers in the relevant treatment group; men even more so than women. This partially suggests that the female CFs share additional information independent of the male contact farmer and the public extension agent. It also provides evidence for the transfer of knowledge along other dimensions outside the scope of the intervention.
Table 8: Source of Non-SLM Learning
Male FC Female FC Extension Agent Specification A B A B A B All FARMERS Male CF 0.011 0.012 0.003* 0.006 -0.001 -0.002 (0.027) (0.023) (0.001) (0.005) (0.010) (0.009) Female CF 0.032 0.019 0.052*** 0.050*** 0.019 0.017 (0.029) (0.025) (0.012) (0.011) (0.012) (0.011) Constant 0.160*** -0.223*** -0.000*** -0.095*** 0.036*** -0.085*** (0.019) (0.059) (0.000) (0.020) (0.007) (0.032) N 6174 6126 6174 6126 6174 6126 Adj. R-Sq 0.002 0.158 0.031 0.068 0.002 0.079 FEMALE FARMERS Male CF 0.003 0.013 0.001 0.004 -0.007 -0.004 (0.024) (0.020) (0.001) (0.004) (0.009) (0.009) Female CF 0.030 0.017 0.045*** 0.043*** 0.014 0.014 (0.026) (0.022) (0.011) (0.009) (0.009) (0.009) Constant 0.141*** -0.113 0.000*** 0.095 0.029*** -0.105*** (0.018) (0.150) (0.000) (0.094) (0.007) (0.039) N 3613 3579 3613 3579 3613 3579 Adj. R-Sq 0.001 0.186 0.028 0.072 0.001 0.070 MALE FARMERS Male CF 0.021 0.011 0.004* 0.007 0.007 -0.001 (0.035) (0.030) (0.002) (0.006) (0.015) (0.013) Female CF 0.035 0.026 0.061*** 0.058*** 0.026 0.022 (0.038) (0.033) (0.015) (0.014) (0.020) (0.017) Constant 0.188*** -0.256*** -0.000*** -0.103*** 0.045*** -0.094* (0.025) (0.078) (0.000) (0.025) (0.010) (0.049) N 2561 2547 2561 2547 2561 2547 Adj. R-Sq 0.002 0.135 0.036 0.075 0.003 0.108
Standard errors are clustered at the community level and reported in parentheses. * p<0.10 ** p<0.05 *** p<0.01. Specification A is an unconditional regression. Specification B includes the following explanatory variables: individual gender, individual age, individual grades completed, individual marital status, number of children (ages 0-15) in the household, the number of males and females in the following age categories (15-25, 26-40, 41-55, and >55) in the household, number of rooms in the house, dummy variables for housing wall and roof materials, average education of adults in household (aged > 25), total household landholdings, enumerator and administrative post dummy variables. CF abbreviates Contact Farmer.
CONCLUSION We find that providing sustainable land management (SLM) training to extension agents and the standard contact farmers on a whole had low impact on the knowledge and adoption of these practices. However, our intervention that targeted a traditionally disadvantaged group as far as their access to extension services, women, was somewhat successful in terms of improving their SLM knowledge and adoption rates. Both male and female farmers in this treatment group identified female (not male) contact farmers as a source of learning for both SLM practices and non SLM-practices suggesting knowledge spillovers. Furthermore, farmers were additionally inclined to teach others what they have learned in the communities with female contact farmers.
There are additional factors that may affect the ability of the intervention to influence behavior, which have yet to be ex-plored. First and foremost, sustainable land management practices can be labor intensive. Constraints on labor supply may

16
affect adoption rates. We next plan to analyze data we collected on individual labor supply at the plot level to study this potential constraint. Second, since there was quite a bit of traction with respect to the awareness and adoption of SLM techniques prior to the intervention, it is possible that contact farmers focused on the newer techniques. Therefore, further disaggregating techniques may reveal differences in treatment impacts. Third, heterogeneities in access to the contact farmer, for example distance to his home or the demonstration plot, may either influence who the farmer reaches or the ability of farmers to frequent the demonstration plot. We will use additional GPS data collected in the field to further examine the role of transaction costs on effectiveness of the intervention.
The above analysis can be done with data we have already collected. We are currently preparing a second survey round to be conducted in February 2013. We will use this next survey to explore underlying differences in the implementation process across treatments that might have influenced outcomes but were overlooked in the first round. In particular, we would like to learn how female contact farmers may differ from the standard contact farmer, how the female contact farmers were selected, how female and male contact farmers interacted with each other, and whether female farmers are more receptive to this type of learning environment than male farmers. Studying these nuances can help explain how to enhance the current decentralized structure of teaching farmers agricultural practices and encourage adoption.

17
APPENDIX Table A.1: Descriptive Statistics on Technology Adoption
Adopted in 2011/2012 (Objective measure)
Adopted before 2010 (Self-reported)
No. of tech. adopted Number Percent Number Percent
0 1,746 31.95 1,283 20.78
1 2,360 43.18 2,882 46.68
2 1,102 20.16 1,453 23.53
3 242 4.43 483 7.82
4 15 0.27 66 1.07
5 0 0.00 5 0.08
6 0 0.00 1 0.02
7 0 0.00 1 0.02
8 0 0.00 0 0.00
Number of Observations 5,465 5,465 6,174 6,174

18
REFERENCES Aker, J. (2011). “Dial ‘A’ for Agriculture: A Review of Information and Communication Technologies for Agricultural Extension
in Developing Countries.” Center for Global Development Working Paper 269.
Anderson, J. and G. Feder (2004). “Agricultural Extension: Good Intentions and Hard Realities,” The World Bank Research Observer 19(1), pp. 41-60.
Angrist, J. and K. Lang (2004). Does School Integration Generate Peer Effects? Evidence from Boston’s Metco Program. The American Economic Review 94, pp. 1613-1634.
Arrow, K. J. (1962). The Economic Implications of Learning by Doing. Review of Economic Studies 29, pp. 155-73.
Bandiera, O. and I. Rasul (2006). Social Networks and Technology Adoption in Northern Mozambique. Economic Journal 116, pp. 869-902.
Bardhan, P. and C Udry (1999). Development Microeconomics. Oxford: Oxford University Press.
Besley, T. and A. Case (1993). Modeling Technology Adoption in Developing Countries. American Economic Review Papers and Proceedings 83, pp. 396-402.
Besley, T. and A. Case (1994). Diffusion as a Learning Process: Evidence from HYV Cotton. Manuscript. Princeton, N.J.: Princeton University, Department of Economics, 1994.
Birkhaeuser, D., R. Evenson, and G. Feder (1991). “The Economic Impact of Agricultural Extension: A Review,” Economic Development and Cultural Change 39(3), pp. 607-650.
Conley, T. and C. Udry (2010). Learning about a new Technology: Pineapple in Ghana. American Economic Review 100 (1), pp. 35-69.
Dercon, S. and L. Christiaensen (2011). Consumption Risk, Technology Adoption and Poverty Traps: Evidence from Ethiopia. Journal of Development Economics 96(2), pp.159-173.
Duflo, E., M. Kremer, and J. Robinson (2011). Nudging Farmers to Use Fertilizer: Theory and Experimental Evidence from Kenya. American Economic Review 101(6), pp. 2350-90.
Evans, W., W. Oates, and R. Schwab (1992). Measuring Peer Group Effects: A Study of Teenage Behavior. Journal of Political Economy 100, pp. 966-991.
Feder, G., R. Just, and D. Zilberman (1985). Adoption of Agricultural Innovations in Developing Countries: A Survey Eco-nomic Development and Cultural Change 33, pp. 255-298.
Feder, G. and S. Savastano (2006). The Role of Opinion Leaders in the Diffusion of New Knowledge: The Case of Integrated Pest Management. World Development 34(7), pp. 1287-1300.
Foster, A. and M. Rosenzweig (1995). Learning by Doing and Learning from Others: Human Capital and Technical Change in Agriculture. Journal of Political Economy 103 (6), pp. 1176-1209.
Ghadim, A., D. Pannell, M. Burton (2005). Risk, Uncertainty, and Learning in Adoption of Crop innovation. Agricultural Economics 33, 1-9.
Godlonton, S. and R. Thornton (2012). Peer Effects in Learning HIV results. Journal of Development Economics 97, pp. 118-129.
Hogset, H. and C. Barrett (2010). Social Learning, Social Influence, and Projection Bias: A Caution on Inferences Based on Proxy Reporting of Peer Behavior. Economic Development and Cultural Change 58(3), 563-589.
Lucas, R. (1993). Making a Miracle. Econometrica 61, pp. 251-72.
Magnan, N., D. Spielman, T. Lybbert, and K. Gulati (2012). Leveling with Friends: Social Networks and Indian Farmers’ Demand for Agricultural Custom Hire Services. Working Paper.
Manski, C. (1993). Identification of Endogenous Social Effects: The Reflection Problem. Review of Economic Studies 60(3), pp. 531-542.

19
McNiven, S. and D. Gilligan (2012). Networks and Constraints on the Diffusion of a Biofortified Agricultural Technology: Evidence from a Partial Population Experiment, Working Paper.
Miguel, E. and M. Kremer (2007). The Illusion of Sustainability. Quarterly Journal of Economics 122, pp. 1007-1065.
Munshi, K. (2004). Social Learning in a Heterogeneous Population: Technology Diffusion in the Indian Green Revolution. Journal of Development Economics 73, pp. 185-213.
Ragasa, C. (2012). Gender and Institutional Dimensions of Agricultural Technology Adoption: A Review of Literature and Synthesis of 35 Case Studies. Selected Poster prepared for presentation at the International Association of Agricultural Economists (IAAE) Triennial Conference, Foz do Iguacu, Brazil, August 18-24, 2012.
Romer, P. (1986). Increasing Returns and Long-Run Growth. Journal of Political Economy 95, pp. 1002-1037.
Rosenzweig, M. (2010). Microeconomic Approaches to Development: Schooling, Learning, and Growth. Journal of Economic Perspectives 24(3), pp. 81-96.
Rosenzweig, M. and H. Binswanger (1993). Wealth, Weather risk and the Composition and Profitability of Agricultural Investments. The Economic Journal 103(416), pp. 56-78.
Rosenzweig, M. and K. Wolpin (1993). Credit Market Constraints, Consumption Smoothing, and the Accumulation of Durable Production Assets in Low-income Countries: Investments in Bullocks in India. Journal of Political Economy 101(21), pp.223-244.
Shiferaw, B., T. Kebede, and L. You (2008). Technology Adoption under Seed Access Constraints and the Economic Impacts of Improved Pigeonpea Varieties in Tanzania. Agricultural Economics 39, pp. 309-329.
Sunding, D. and D. Zilberman (2001). “The Agricultural Innovation Process: Research and Technology Adoption in a Changing Agricultural Sector. In B. Gardner & G. Rausser (Eds.) Handbook of Agricultural Economics (Vol. 1a, pp. 207-226). Amsterdam: North Holland.
Suri, T. (2011). Selection and Comparative Advantage in Technology Adoption. Econometrica 79(1), 159-209.
Thompson, P. (2010). Learning by Doing. In Handbook of Economics of Technical Change, Bronwyn H. Hall and Nathan Rosenberg, eds. Amsterdam: North-Holland/Elsevier.
Udry (1996). Gender, Agricultural Production, and the Theory of the Household. Journal of Political Economy 104 (5), pp. 1010-1046.
World Bank (2007). Project Appraisal Document on A Proposed Grant from the Global Environment Facility Trust Fund In the Amount of US$6.2 Million to the Republic of Mozambique for a Market-Led Smallholder Development in the Zambezi Valley Project. Agricultural and Rural Development, Sustainable Development Department, Country Department 2, Mozambique Africa Region. Report No. 39806-MZ.

20
INTERNATIONAL FOOD POLICY RESEARCH INSTITUTE
2033 K Street, NW | Washington, DC 20006-1002 USA | T+1.202.862.5600 | F+1.202.457.4439 | Skype: ifprihomeoffice | [email protected]
IFPRI-Maputo
a/c Escritorio do ICRISAT Av. Das FPLM No. 2698 Edifício de Química, 1o andar, IIAM, Maputo, Mozambique Contact: Todd Benson, Senior Research Fellow
This Working Paper has been prepared as an output for the Mozambique Strategy Support Program, funded by USAID, and has not been peer reviewed. Any opinions stated herein are those of the author(s) and do not necessarily reflect the policies or opin-ions of IFPRI.
Copyright © 2012, International Food Policy Research Institute. All rights reserved. To obtain permission to republish, contact [email protected].
About the Authors
Florence Kondylis is a Senior Economist within the Development Impact Evaluation Initiative (DIME) at the World Bank. Her main interests are in development, labor, conflict and agricultural economics. Florence developed and now coordinates a program of impact evaluations in Agricultural Adaptations (AADAPT) in close collaboration with DECRG, PREM gender, and the Africa Gender Team at the Word Bank and a number of academic institutions.
Valerie Mueller is a Research Fellow at the International Food Policy Research Institute. Her main research area involves understanding the role of labor mobility in managing risk and reducing poverty in developing countries. She recently has become involved in impact evaluations that aim to improve the access and quality of extension and other services in rural areas, especially by targeting women.


