Embed Size (px)
Citation preview
IEEE TRANSACTIONS ON MEDICAL IMAGING, VOL. 14, NO. 4, DECEMBER 1995 719
Segmentation of Intravascular Ultrasound Images: A Knowledge-Based Approach
Milan Sonka, Xiangmin Zhang, Maria Siebes, Member, IEEE, Mark S. Bissing, Steven C. DeJong, Steve M. Collins, and Charles R. McKay
Abstract- Intravascular ultrasound imaging of coronary ar- teries provides important information about coronary lumen, wall, and plaque characteristics. Quantitative studies of coro- nary atherosclerosis using intravascular ultrasound and manual identification of wall and plaque borders are limited by the need for observers with substantial experience and the tedious nature of manual border detection. We have developed a method for segmentation of intravascular ultrasound images that identifies the internal and external elastic laminae and the plalque-lumen interface.
The border detection algorithm was evaluated iin a set of 38 intravascular ultrasound images acquired from fresh ca- daveric hearts using a 30 MHz imaging catheter. To assess the performance of our border detection method we compared five quantitative measures of arterial anatomy derived from computer-detected borders with measures derived from borders manually defined by expert observers.
Computer-detected and observer-defined lumen areas corre- lated very well (T = 0.96, y = 1.022+ 0.52), as did plaque areas (T = 0.95, y = 1.07~- 0.48), and percent area stenosis (T = 0.93, y = 0.992- 1.34.) Computer-derived segmental plaque thickness measurements were highly accurate. Our knowledge-based in- travascular ultrasound segmentation method shows substantial promise for the quantitative analysis of in vivo intravascular ultrasound image data.
I. INTRODUCTION
EVERAL imaging approaches exist for assessing coronary S artery disease in vivo and include coronary angiogra- phy, fluoroscopy, fiberoptic angioscopy, ultrafast computed tomography, magnetic resonance angiography, epj cardial ul- trasonography, and intravascular ultrasound [ I]-[3]. While each of these imaging methods has potential advantages, only coronary angiography has found widespread clinical use. It is currently accepted as the definitive method for evaluating the detailed anatomy of the coronary arteries and assessing the severity of coronary disease [4].
Coronary angiography produces projection images or sil- houettes of the vascular lumen from the absorption of X- rays by radiopaque dye injected into the coronary tree. The
Manuscript received August 3, 1994; revised July 31, 1995. This work was supported in part by: 1992/93 Carver Scientific Research Initiative Grants Program, the National American Heart Association Grant-in-Aid 901221, and the American Heart Association, Iowa Affiliate Grant-in-Aid IA-94-GS-65. The Associate Editor responsible for coordinating the review of this paper and recommending its publication was J. S . Duncan.
The authors are with the Departments of Electrical and Computer En- gineering, Internal Medicine, Biomedical Engineering, and Radiology, The University of Iowa, Iowa City, IA 52242.
IEEE Log Number 9415807.
coronary wall and any atherosclerotic plaque that might be present are not directly visualized. Conclusions about the presence and significance of atherosclerosis are inferred from visual assessment of the reduction in vessel lumen diameter with respect to the lumen diameter of a nearby vessel segment that is presumed to be normal. The shortcomings of visual evaluation of lumen dimensions are widely recognized [5]. Even when employed in conjunction with quantitative analysis [6], [7], coronary angiography has several limitations. These include the inability to detect plaque in diffusely diseased ves- sels, inability to determine vessel wall and plaque morphology, inaccuracy in analyzing eccentric lesions, and insensitivity to changes in arterial morphology after catheter-based interven- tional therapy.
Intravascular ultrasound is a catheter-based technique which produces tomographic two-dimensional cross-sectional images of vessel wall architecture and plaque morphology. With intravascular ultrasound, a high-frequency (20-40 MHz) ultra- sound source rotates near the tip of a catheter inserted in the arterial lumen. Either the piezoelectric crystal generating the ultrasound beam is rotated or a mirror deflecting the ultrasound beam is rotated. Alternatively, a stationary multi-element crys- tal array encircling the catheter may be employed. Intravas- cular ultrasound cross-sectional images directly demonstrate arterial lumen, plaque, and wall morphology. Intravascular ultrasound morphology, determined from operator-defined bor- ders, agrees closely with quantitative histologic determination of lumen area and mural thickness [8], [9] and angiographic determination of lumen size [lo]-[12].
Post mortem studies and early in vivo studies have shown that intravascular ultrasound yields important information about vessel morphology that is not obtained from angiogra- phy. For example, it depicts the bulk and eccentric distribution of atherosclerotic plaque in stenotic segments which is often not evident from angiography. In angiographically “normal” segments, the presence of up to 45% area stenoses have been documented by intravascular ultrasound [ 131. The three-dimensional geometry of a stenotic lumen may be difficult to appreciate from a limited number of angiographic projections but is easily visualized during an intravascular ultrasound catheter “pullback” which produces a closely- spaced sequence of high resolution tomographic images [ 131. Fractured eccentric plaque, irregular and fissured plaque surfaces, and stretching or thinning of the wall are frequently seen during intravascular ultrasound imaging but are often missed in angiography [ 141-[ 171.
02784062/95$04.00 0 1995 IEEE
720 ItEEE TRANSACTIONS ON MEDICAL IMAGING, VOL. 14, NO. 4, DECEMBER 1995
Intravascular ultrasound imaging yields complementary morphologic information to contrast angiography. There is substantial enthusiasm in the clinical community for using this emerging imaging method to overcome the shortcomings of angiography and for guiding catheter-based interventions [13], [18]-[20]. Current clinical trials are designed to determine whether quantifying eccentric lumen dimensions and wall thickness, detecting thrombus and calcification, determining disease severity in “normal” reference segments, and constructing longitudinal 3-D image reconstructions of mural structures such as dissections using intravascular ultrasound will positively influence immediate or long-term results of various interventional therapies.
To date, quantitative studies of coronary atherosclerosis have nearly always relied on manual measurements of arte- rial structure dimensions and manual tracing of lumen and wall borders. While a number of studies demonstrate that experienced observers can identify plaque and wall borders in intravascular ultrasound images that agree with histology and angiography [3], [ 131, the utility of analysis approaches relying upon manual border identification is limited by the need for observers with substantial experience and by the tedious nature of manual tracing. Recently, a number of groups have begun to develop computer-based methods for identifying lumen and wall borders [21]-[25]. The most experience has been gained with computer methods that are based on image intensity thresholding. These methods classify each image pixel as belonging to lumen or vessel wall and generally are unable to distinguish between plaque, intima, media, and adventitia. Very little data demonstrating the accuracy of such techniques have been reported [26]. Given the commonly recognized limitations of thresholding approaches to segmentation, it is unlikely that such approaches will be widely adopted for quantitative analysis of lumen and wall morphology from intravascular ultrasound images.
Development of methods for automated identification of lumen and mural structures has been limited in the past by the relatively poor quality of intravascular ultrasound images. Even with the recent substantial improvements in imaging catheters and signal processing hardware, accurate and robust segmentation of intravascular ultrasound images presents a very challenging problem. Studies correlating in vitro and in vivo intravascular ultrasound measurements with histology and angiography suggest that experienced observers can identify important luminal and mural structures. These studies suggest that when combined with appropriate a priori knowledge, the information necessary to perform such identification is present in the image data. This observation together with our accu- mulated experience developing knowledge-based approaches to quantitative coronary angiography using graph searching [27]-[29] forms the impetus for the current work.
The goal of this study was to develop and validate an auto- mated method for the detection of external elastic lamina, in- ternal elastic lamina, and plaque-blood borders in intravascular ultrasound images. Our hypothesis was that by incorporating knowledge about arterial anatomy and intravascular ultrasound image characteristics into the analysis method, computer- detected wall and plaque borders in intravascular ultrasound
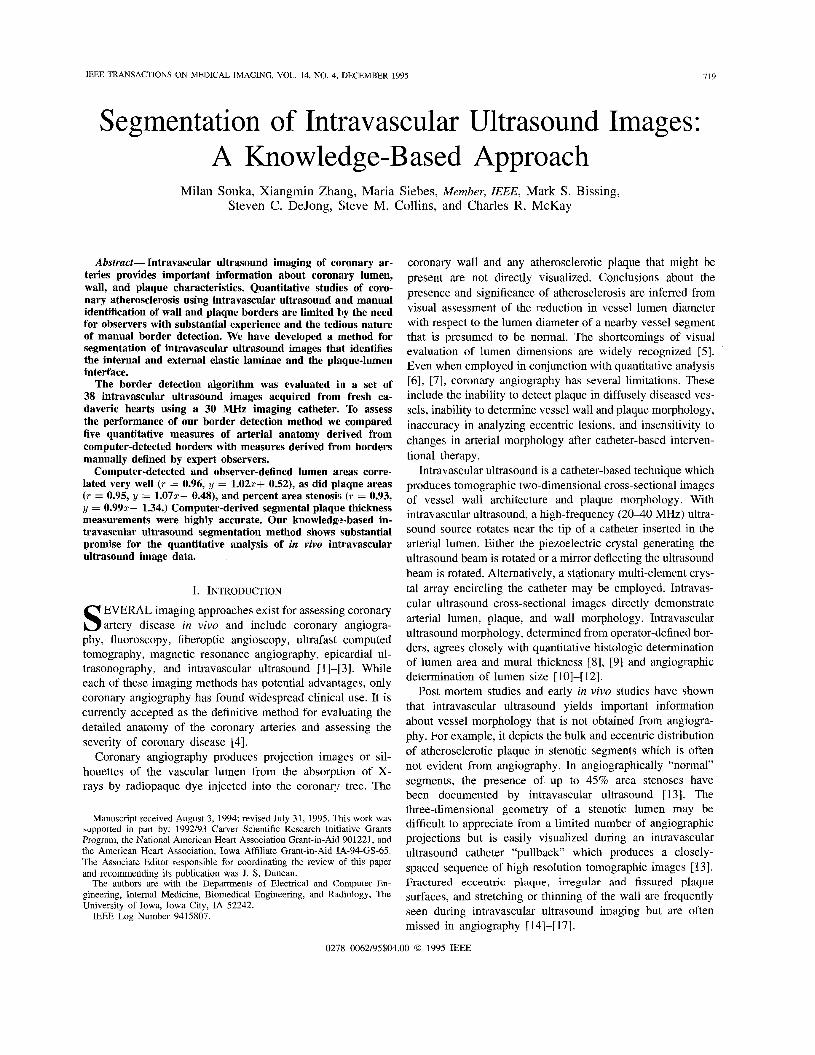
adventitia
intima
ultrasound catheter
plaque
calcium
lipid lake
Fig. 1. to scale).
Schematic cross-sectional anatomy of a diseased coronary vessel (not
images would yield estimates of lumen and arterial wall morphology that correlated well with measurements obtained from borders defined by experienced observers.
R. ARTERIAL WALL AND PLAQUE BORDER DETECTION Our method for automated segmentation of intravascular
ultrasound images uses global image information and heuristic graph searching [30] to identify wall and plaque borders. We have incorporated a priori knowledge of coronary artery anatomy and ultrasound image characteristics into the method for intravascular ultrasound border detection.
A. Depiction of Arterial Wall Morphology in Intravascular Ultrasound Images
Atherosclerosis is characterized by an accumulation of plaque material in the arterial wall. Fig. 1 shows in schematic form the cross-sectional anatomy of a diseased coronary artery. In adults, normal coronary vessel walls (upper portion of Fig. 1) have a thin intimal layer bounded by the internal elastic lamina. The media, composed of smooth muscle cells and a reticular collagen network is located between the internal and external elastic laminae and is of nearly constant thickness, typically 0.1-0.3 mm [lo], [31]-[33]. Outside the external elastic lamina is fibrous and fatty adventitia tissue. With progressive atherosclerosis (bottom portion of Fig. l), intimal cells proliferate, lipid and cholesterol accumulate, fibrosis occurs, and the wall thickens. As intimal plaque thickens, the media may thin and the internal lamina may be disrupted. Initially, eccentric plaque bulk increases the total wall thick- ness and locally distends the wall such that the lumen shape and diameter is maintained (“arterial wall remodeling”). As plaque continues to accumulate, the lumen is compromised, the plaque may become more concentric, and focal areas of calcification and extracellular lipid or cholesterol depositions (“lipid lake”) are seen. Because these morphologic changes can be visualized by intravascular ultrasound, the appearance of intravascular ultrasound images can be complex.
The interaction of ultrasound with coronary arterial struc- tures gives rise to typical image patterns that may be used to identify arterial wall and intramural structures within the ultrasound image (Fig. 2). Intravascular ultrasound images contain both large amplitude signals from specular reflectors at the interface between structures with differing acoustic impedances together with lower amplitude signals or dif-
SONKA et al.: SEGMENTATION OF INTRAVASCULAR ULTRASOL’ND IMAGES 721
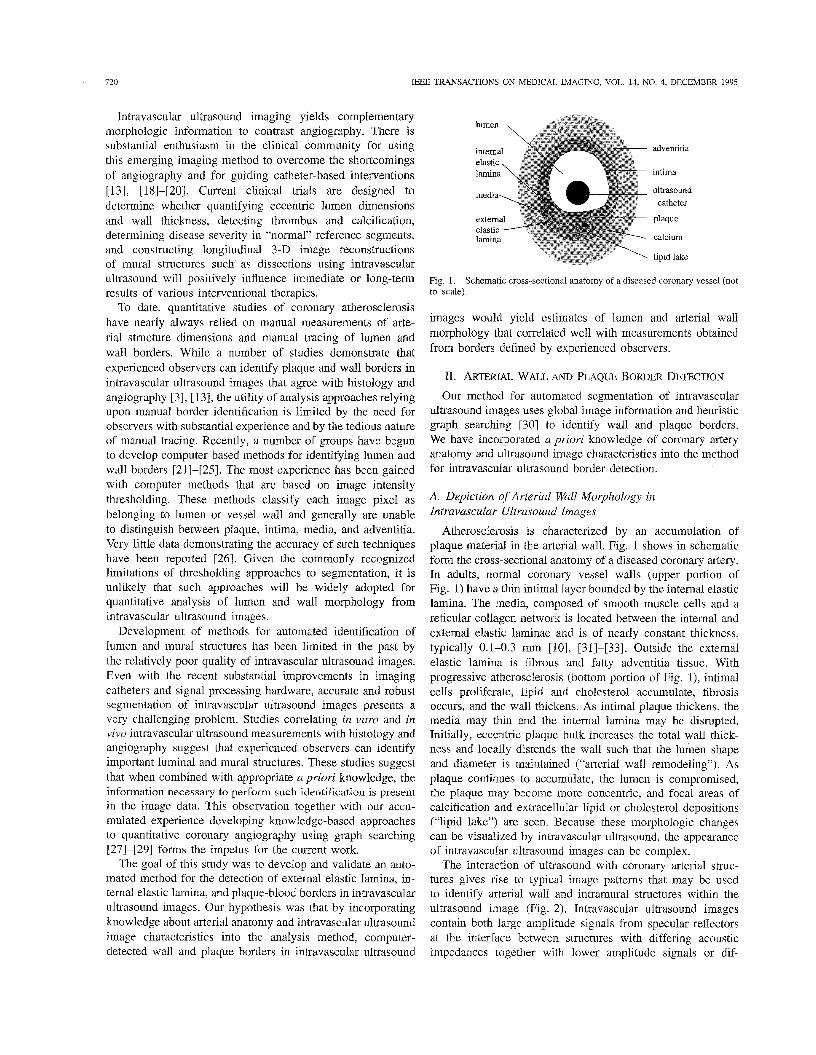
fusely scattered signals arising from regions of nearly uniform acoustic properties. The lumen is typically a dark echo-free region adjacent to the imaging catheter. The lurnen-intima interface constitutes a large acoustic impedance mismatch and produces specular reflections [32]. The internal and external elastic laminae enclose the sonolucent media and produce acoustic impedance mismatches. These layers typically give rise to a double-echo pattem showing a circuml’erentially- oriented parallel bright-dark-bright echo pattern [34] [arrow A in Fig. 2(a)]. The echo-dense responses are from the interfaces of the fibro-elastic internal and external elastic laminae and the homogeneous echo-free media layer. The fibrous adventitia further demarcates the outer wall with abrupt increases in echo-density which parallel the double-echo responses from the laminae and media. With coronary artery disease, the intima thickens and is identified as the echogenic region between the lumen interface and the sonolucent media [arrow B in Fig. 2(a)]. The ultrasonic appearance of atherosclerotic plaque depends on its composition [34]. Fibromuscular lesions appear as echoes of intermediate intensity attached to the intima. Dense fibrous lesions appear as bright echoes. Calcium deposits also give rise to high intensity echoes. Lipid deposits within a lesion are hypoechoic. Analysis of intravascular ultrasound images can be complicated by focal or radial echo patterns which are generated by local changes in plaque density. For example, regions of substantially attenuated signal intensity [arrow C in Fig. 2(a)] may be caused by hiighly echo- reflectant fibrous plaque or calcium deposits which produce acoustic shadowing.
The presence of a variety of artifacts can complicate the interpretation of intravascular images. Blood speckle and near- field artifacts can be identified by observing the real-time video. As the catheter is pulled back, the artifacts persist while the wall morphology changes. A bright near-field “halo” adja- cent to the black circle depicting the catheter’s position results from ultrasound reflections from the catheter itself [arrow D in Fig. 2(a)]. These artifacts and geometric distortion due to an eccentric or angulated catheter position within the vessel may prevent visualization of the double-echo patte m from the media-laminae interfaces. In second generation catheters, a strut or guidewire artifact across the imaging plane obscures or distorts mural details in portions of the arterial wall [arrow E in Fig. 2(a)].
B. Wall and Plaque Border Detection Algorithm
After digitization of S-VHS-recorded intravascular ultra- sound images at a resolution of 512 x 512x 8 (0.03 “/pixel), our border detection method consists of the following steps: A. image preprocessing to remove superimposed calibration markers; B. interactive definition of the region of interest; C. edge detection and coordinate transformation (of the edge image; D. identification of the internal and external laminae and of the plaque-lumen interface; E. mapping (of all three borders back into the original image space and calculation of quantitative measures of arterial morphology.
I ) Removal of Calibration Markers: Calibration marks in- cluded in the image are used for quantitative measurements
(b)
Fig. 2. Intravascular ultrasound image of a diseased coronary vessel. (a) Original image with 0.5-mM. calibration marks showing circumferential plaque that thickens at the 10- to 2-o’clock position. Double-echo response from the intemal and extemal elastic laminae with intervening sonolucent media is seen at the 12-o’clock position (arrow A). The interface between lumen and plaque is depicted by m o w B and is visible at 9- to 6-o’clock. The catheter near-field artifact surrounds the catheter in the middle of the image and obscures the plaque-lumen border from 6- to 9-o’clock. Arrow D. shows a near-field artifact. Arrows C point to regions of signal attenuation caused by fibrotic plaque that is highly reflectant. The dark sonolucent region from 10- to 2-o’clock located inside the plaque is due to echo dropout distal to the fibro-calcific plaque at the lumen-plaque interface. Arrow E shows the strut and guidewire artifact. The complex plaque morphology in this vessel was confirmed with light microscopy. (b) Positions of external elastic lamina, intemal elastic lamina, and coronary lumen defined by an observer.
but can interfere with border identification and need to be removed prior to edge detection. The calibration marks form z
122 EFE TRANSACTIONS ON MEDICAL IMAGING, VOL. 14, NO. 4, DECEMBER 1995
and y image axes of equally spaced dots which intersect at the catheter in the image center. Mark locations are automatically identified in the image based on their expected positions. Within a 7 x 7 neighborhood of each pixel corresponding to the expected marker location, all bright pixels with gray levels above a preset threshold t are substituted with the median value found in this neighborhood. Results of the marker removal step are quite insensitive to the threshold parameter t . A value of t = 50 was used in the experiments reported here.
2) Definition of Region of Interest: Due to the image am- biguities discussed above and the problems of identifying ultrasound imaging artifacts in individual digitized frames, an operator-defined region of interest is identified prior to auto- mated border detection. In each image, an ellipse enclosing the vessel (lumen, plaque, media and a portion of the adventitia) is manually defined by an operator by marking two points on a long axis and two points on a short axis forming an ellipse. A computer-generated ellipse is determined using the best fit criterion to the specified points. If the operator is not fully satisfied, the ellipse may be moved, redefined, or a portion of the ellipse can be manually modified in an arbitrary fashion. The ellipse defines the outer limit of the region of interest. The inner limit is identified by a closed and smoothed polygon connecting several points identified by the operator inside of the vessel lumen near the blood-plaque interface.
3) Edge Detection and Coordinate Transformation: Two edge subimages are generated from the region of interest. For internal and external laminae detection, we utilize a 5 x 5 Sobel-like edge operator which in our images corresponds to an area of 0 . 1 5 ~ 0.15 mm2. The edge operator is applied to the portion of the original image located within and less than 25 pixels from the outer boundary of the region of interest. For computational convenience, the edge subimage is resampled in directions perpendicular to the outlining ellipse. This has the effect of “straightening” the outside boundary of the region of interest. This straightened edge subimage is used for construction of the laminae border detection graph which is searched to identify the external and internal elastic laminae.
For plaque border detection, a 7 x 7 Sobel-like edge opera- tor is applied to the portion of the original image located within the region of interest and less than 25 pixels from the inside boundary of the region of interest. The resulting edge subimage is resampled in directions perpendicular to the inside boundary of the region of interest and used to construct the plaque border detection graph. Different edge detector sizes are used because of different characteristics of the echo response at the plaque and laminae borders.
To calculate edge directions, the original image data cor- responding to the laminae and plaque edge subimages are resampled using the same coordinate transformations used to resample the two edge images. The resampled image data are smoothed in directions perpendicular to the resampling directions (e.g., parallel to the outside or inside boundary of the region of interest). The 3 x 3 Prewitt compass edge operator is applied to the two resampled original images to detect local edge directions.
4) IdentiiJication of Vessel Wall and Plaque Borders: a) Border detection as graph searching: Graph search-
ing approaches to border detection identify an optimal path in a two-dimensional graph [30]. The resampled edge image is used for graph construction. Each pixel of the resampled edge image corresponds to a unique node in the graph. A graph projile is defined as a set of nodeslpixels perpendicular to the straightened boundaries of the region of interest. A cost is associated with each node and is inversely related to the likelihood of the node being part of the desired border. A path through the graph contains one node from each profile and connects pixels at one end of the straightened image (start nodes) to pixels at the other end (end nodes). Each path corresponds to a possible border. The cost of a path is computed from the costs of the nodes on the path. A standard heuristic graph searching technique [30], [35] determines the minimum cost path or optimal border.
The key to identifying accurate borders using graph search- ing is to define an appropriate cost function for nodes in the graph. Since the properties of border pixels forming the extemal elastic lamina, intemal elastic lamina, and plaque differ, we have developed separate cost functions for the detection of each border. In contrast to the usual application of graph searching to border detection where cost is inversely related to edge strength, the cost functions in our ultrasound border detection method are related to a specific expected edge pattern and incorporate a priori knowledge about cross- sectional arterial anatomy. The precise manner in which costs are calculated is described below.
types of a priori information are used to calculate the cost function for the external elastic lamina. The operator- entered outer boundaq of the region of interest is used as a rough model for the shape of the external lamina. This is accomplished by identifying the external lamina from the edge subimage after applying the coordinate transformation and by appropriate calculation of node and path costs. Border shapes that mimic the shape of the model are preferred. This is appropriate since the extemal elastic lamina is known to have an approximately elliptic shape. Because the vessel border is not exactly elliptic and/or the operator-entered ellipse may be inaccurate, the contribution of the model to the cost function represents a compromise between the weight given to the edge information contained in the image data and the weight assigned to the a priori information obtained from the shape of the model.
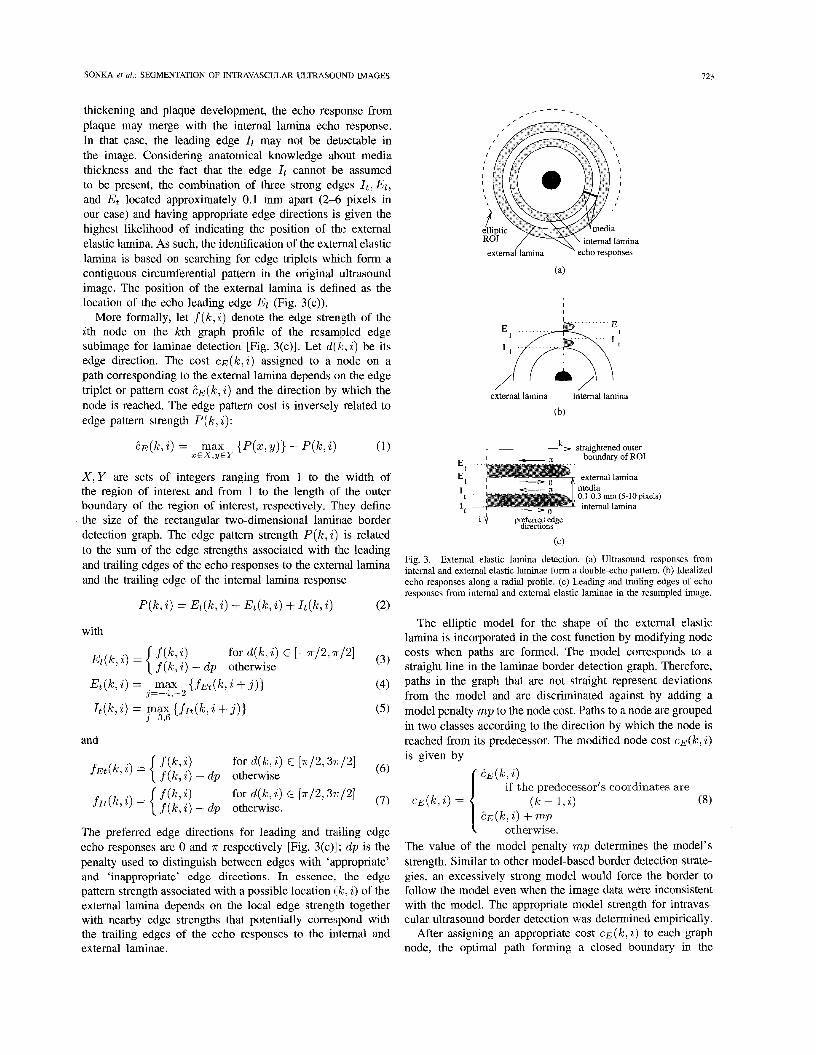
The second type of a priori information incorporated in the cost function is the expected double-echo pattern arising from the interfaces of the media and the surrounding external and intemal elastic laminae. Costs associated with each node are designed to reflect the degree of match between the local edge configuration and the expected double-echo edge pattern. The expected edge configuration is shown in Fig. 3(a) and (b). El is leading edge of the ultrasound echo response and represents the location of the external elastic lamina. Et represents the trailing edge of the echo response to the external lamina. 4 and It represent the leading and trailing edges of the echo response depicting the internal elastic lamina. In the presence of intimal
b) Identification of the external elastic lamina: Two
SONKA er al.: SEGMENTATION OF INTRAVASCULAR ULTRASOUND IMAGES 123
thickening and plaque development, the echo response from plaque may merge with the internal lamina echo response. In that case, the leading edge 4 may not be detectable in the image. Considering anatomical knowledge about media thickness and the fact that the edge 1, cannot be assumed to be present, the combination of three strong edges It , El,
and Et located approximately 0.1 mm apart (2-6 pixels in our case) and having appropriate edge directions is given the highest likelihood of indicating the position of the external elastic lamina. As such, the identification of the external elastic lamina is based on searching for edge triplets which form a contiguous circumferential pattern in the original ultrasound image. The position of the external lamina is defined as the location of the echo leading edge El (Fig. 3(c)).
More formally, let f ( k , i ) denote the edge stren,gth of the ith node on the kth graph profile of the resampled edge subimage for laminae detection [Fig. 3(c)]. Let d ( k , i) be its edge direction. The cost c ~ ( k , i ) assigned to a node on a path corresponding to the external lamina depends on the edge triplet or pattern cost 2 ~ ( k , i ) and the direction by which the node is reached. The edge pattern cost is inversely related to edge pattern strength P (5, i) :
?~(k,i) = max {P(z,y)} - P ( k , i ) (1) X E X , Y E Y
X , Y are sets of integers ranging from 1 to the width of the region of interest and from 1 to the length of the outer boundary of the region of interest, respectively. They define the size of the rectangular two-dimensional laminae border detection graph. The edge pattern strength P(k,i) is related to the sum of the edge strengths associated with tlhe leading and trailing edges of the echo responses to the external lamina and the trailing edge of the internal lamina response
_ - - - _
externailamina echo responses
(a)
external lamina internal lamina
(b)
,A> straightened outer - boundary of ROI
external lamina media 0.1-0.3 mm (5-10 pixels) internal lamina
i $ preferred edge direchons
(C)
Fig. 3. External elastic lamina detection. (a) Ultrasound responses from internal and external elastic laminae form a double-echo pattern. (b) Idealized echo responses along a radial profile. (c) Leading and trailing edges of echo responses from internal and external elastic laminae in the resampled image.
P ( k , i) = Ez(k, 2) + Et(k , i ) + I t ( k , i ) (2) The elliptic model for the shape of the external elastic
lamina is incorporated in the cost function by modifying node costs when paths are formed. The model corresponds to a straight line in the laminae border detection graph. Therefore, paths in the graph that are not straight represent deviations from the model and are discriminated against by adding a model penalty mp to the node cost. Paths to a node are grouped in two classes according to the direction by which the node is reached from its predecessor. The modified node cost c ~ ( k , i )
with
for d(k,i) E [-7r/2,n/2] i, = { ;[:: ii - d p othe-wise (3)
(4)
( 5 )
Et(k,i) = , max {fEt(k,i + j ) } j=-4,--2
I t ( k i ) = max {f&, i + j ) ) j=3,6
and
The preferred edge directions for leading and trailing edge echo responses are 0 and 7r respectively [Fig. 3(c)l; d p is the penalty used to distinguish between edges with ‘appropriate’ and ‘inappropriate’ edge directions. In essence, the edge pattern strength associated with a possible location ( k , i) of the external lamina depends on the local edge strength together with nearby edge strengths that potentially correspond with the trailing edges of the echo responses to the internal and external laminae.
is given by E E ( k , 2)
if the predecessor’s coordinates are ( k - 1,i) (8)
? ~ ( k , i) + mp otherwise.
C E ( k , i ) =
The value of the model penalty mp determines the model’s strength. Similar to other model-based border detection strate- gies, an excessively strong model would force the border to follow the model even when the image data were inconsistent with the model. The appropriate model strength for intravas- cular ultrasound border detection was determined empirically.
After assigning an appropriate cost C E ( ~ , i) to each graph node, the optimal path forming a closed boundary in the
124 IEEE TRANSACTIONS ON MEDICAL IMAGING, VOL. 14, NO. 4, DECEMBER 1995
original image space is searched for in the two-dimensional graph. The optimal path is defined as the path with the minimum sum of costs of all nodes on the path.
c) Identijication of the intemal elastic lamina: Using the same laminae border detection graph but a different cost function, a search is conducted for the internal lamina border inside of and in proximity to the external lamina border. The cost assigned to a node depends upon its edge strength, its edge direction, and its position with respect to the extemal lamina border. Information about media thickness is used as a priori knowledge. When searching for the internal lamina border, the previously detected external lamina border is used as a model. The model in this case forms a narrow region of support in which the internal border is most likely to be located. The region of support is defined as a 0.2-mm-wide strip located 3-10 pixels (0.1-0.3 mm) inside the external lamina border. The cost of graph nodes outside the region of support is increased by penalty sp.
The cost c ~ ( k , i ) assigned to a node at position ( k , i) is given by:
where ( k , j ) are coordinates of the detected external lamina border and
with
The preferred edge direction is 0 [Fig. 3(c)] and dp is the directional penalty. The internal elastic lamina border is de- fined as the minimum cost path through the laminae border detection graph with costs c l (k , i).
d) Identijication of the plaque border: Detection of the plaque border is less difficult than detecting lamina borders since the blood-plaque interface represents the border with the highest contrast in the intravascular ultrasound image. The plaque border is identified using the plaque border detection graph with node costs c p ( k , i) calculated from edge strength and local edge direction
with
f ( k , i ) is the edge strength in the resampled edge subimage for plaque border detection. X’, Y’ represent the dimensions of the plaque border detection graph, d p is the directional penalty, and the preferred edge direction is 0.
Since the boundary between the catheter and the blood-filled lumen has high contrast, nodes corresponding to this boundary may interfere with plaque border detection. Therefore, they are automatically identified using the known size and position of the intravascular catheter in the original image and their
costs are increased by the penalty cp. Similarly, nodes located outside the previously identified internal elastic lamina are discriminated against by adding the same penalty to their costs. The plaque border is defined as the minimum cost path through the plaque border detection graph with costs c p ( k , 2 ) .
5) Quantitative Evaluation of Arterial Morphology: External and internal elastic laminae and plaque borders are smoothed using a moving average of 31 border points and mapped back into the original image space. Lumen area, total arterial area (area encompassed by the internal lamina), plaque area, percent area stenosis (fraction of total arterial area occupied by plaque), segmental media thickness, and segmental plaque thickness are then calculated.
111. EXPERIMENTAL METHODS
A. Intravascular Ultrasound Image Acquisition
The border detection algorithm was tested in a set of 38 intravascular ultrasound images acquired from 24 fresh cadaveric hearts in which post mortem angiography showed no discrete stenoses in the proximal left anterior descending coronary artery. The hearts were obtained from patients who died from causes other than heart disease (mean age 60 years, range 32-90 years). Cadaveric coronary arteries were imaged in vitro using a previously developed method [36]. Briefly, the heart was perfused with 0.9% saline solution at physiologic pressures and at 37°C using a roller pump. The pump speed was adjusted to maintain a constant mean pressure of approximately 100 mmHg at the left coronary ostium. Under fluoroscopic guidance, a 4.3 French (1.43 mm) intracoronary ultrasound 30-MHz imaging catheter (CVIS, Sunnyvale, CA) was introduced into the cannulated coronary ostium over an angioplasty guidewire. The catheter was moved down the coronary artery to identify an eccentric plaque which is typically seen just after the bifurcation of the left circumflex coronary artery. The catheter was then held stationary at that position, the ultrasound image was stored in video-memory of the intravascular ultrasound system, and the static ultrasound image was continuously recorded on S-VHS videotape. A sec- ond region of the left anterior descending artery approximately 1 cm distal to the first was also identified and imaged. The S- VHS videotape was played back at normal speed and single frames were digitized at an image resolution of 0.03 “/pixel.
B. Observer-Defined Intravascular Ultrasound Borders
To assess the performance of our border detection method, we compared automatically detected laminae and plaque bor- ders with manually identified borders which were used as an independent standard. Despite the complex character of intravascular ultrasound images, several studies have shown good agreement between operator-determined ultrasound mea- surements and histology [3], [13]. This agreement is achieved by optimizing imaging parameters, applying expert knowledge of arterial wall morphology, and utilizing a real-time video display to visually integrate structures as the catheter is moved along the artery. In the current study, an experienced intravas-
SONKA et al.: SEGMENTATION OF INTRAVASCULAR ULTRASOUND IMAGES 125
cular ultrasound technician traced the borders in the digitized images corresponding to the external elastic lamina, internal elastic lamina and plaque. Since visual border identification in single-frame images can be difficult, real-time display of intravascular images recorded on S-VHS tape was available to the operator for reference. If the border was riot clearly visible, real-time playback allowed for visual in1 erpolation of the border information between frames and minimized border positioning ambiguity. The operator was allowed to repeatedly edit borders until fully satisfied. The operator- traced borders were then inspected and edited as necessary by two cardiologists. Again, real-time playback was provided to the cardiologists. The final observer-defined borders were determined by consensus of the two cardiologists. The techni- cian and the cardiologists were unaware of the results of the computer analysis. Ten images were excluded from the study because the observers were not confident of the position of the borders due to extensive calcification or overall low image quality. A set of 38 test images resulted. No images were excluded because of the performance of the computer border detection method.
C. Study Protocol and Data Analysis
To objectively evaluate the accuracy of our border detection method, we compared five quantitative measures of arterial ge- ometry obtained from computer-detected borders to measures obtained from observer-defined borders. These measures were: lumen area, plaque area, segmental media thickness, segmental plaque thickness, and percent area stenosis. We arisessed the accuracy of computer-detected and observer-defined lumen and plaque area measurements by calculating the root-mean- square (rms) errors of these measurements. We also directly compared computer-detected and observer-defined borders by calculating maximum and rms border positioning errors.
Media thickness was defined as the distance bctween the internal and external elastic laminae and was measured at 10" intervals along angular projections from the vessel cen- troid, which was calculated from the observer-defined external elastic lamina border. Plaque thickness was defined as the distance between the plaque-blood border and the internal elastic lamina border and was measured at 10" intervals along angular projections from the lumen centroid calculated from observer-defined plaque borders. The same vessel and lumen centroids were used to make thickness measurements from both observer- and computer-defined borders. Linear regres- sion analysis was used to compare computer-determined lumen and plaque areas, segmental plaque thickness, and percent area stenosis with the corresponding observer-defined rneasures of vessel morphology. Regression equations were compared to the equation of the line of identity using t-statis tics for the slope and intercept. Media and plaque thickness, imd percent area stenosis errors were calculated in individual images, reported as mean signed error (bias) f standard deviation and mean unsigned error & standard deviation. Plaque and media thicknesses obtained from computer-detected and observer- defined borders were compared using paired t-tests. The Wilcoxon signed rank test was used to compiue percent
area stenosis values calculated from computer-detected and observer-defined borders [37].
To assess the positioning accuracy of computer-detected external and internal laminae and plaque borders, maximum and rms positioning errors were determined for each border by measuring the distance between corresponding points on computer- and observer-detected borders. For each point on the computer-detected border, the corresponding point on the observer-defined border was defined as that point which was closest (using the Euclidean metric). Maximum and rms positioning errors were determined in each image, expressed in millimeters, and reported as mean * standard deviation.
In the experiments reported here, empirically determined penalties of d p = 50, sp = 50, mp = 15, and cp = 50 were used. The penalty values d p , sp, and cp were chosen to favor the preferred border location. The selected model strength mp gives enough weight to both the edge information coming from the image data and to the border shape information from the model. The method is quite insensitive to the exact penalty values and penalties from a large interval result in virtually identical borders. Although our region of interest definition software permits manual modification of portions of the observer-defined elliptic region of interest, no such modifications were necessary in this study.
IV. RESULTS All 38 intravascular ultrasound images were successfully
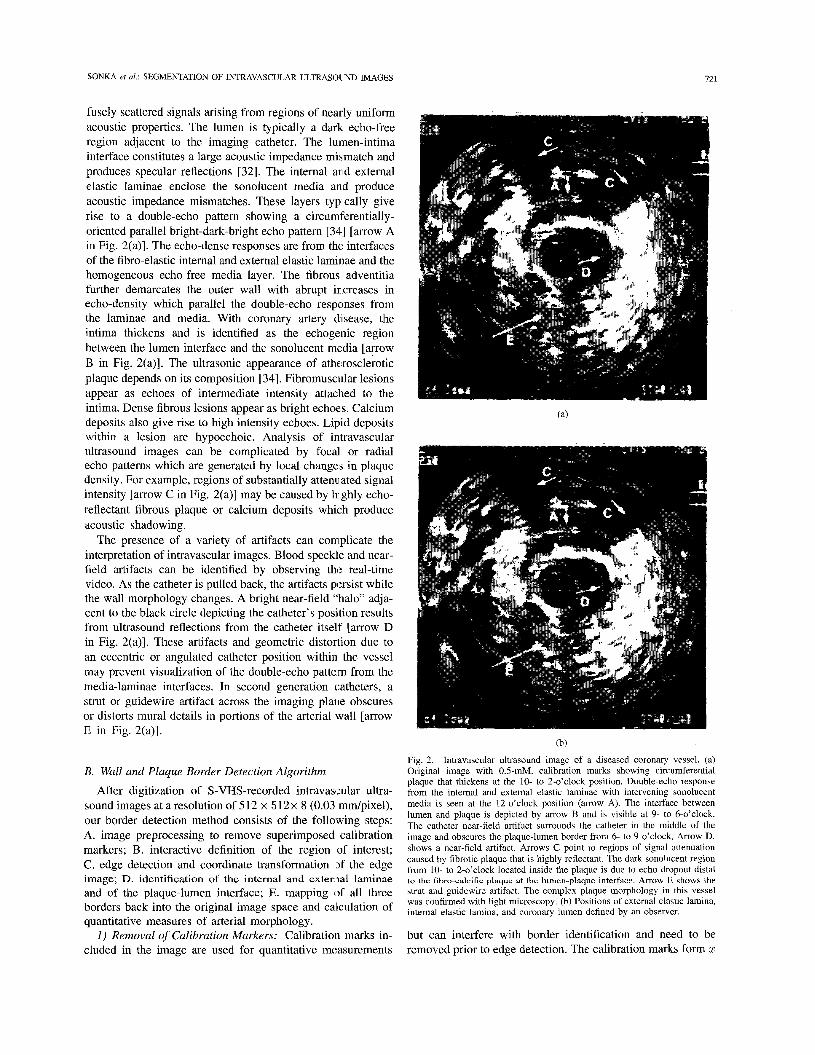
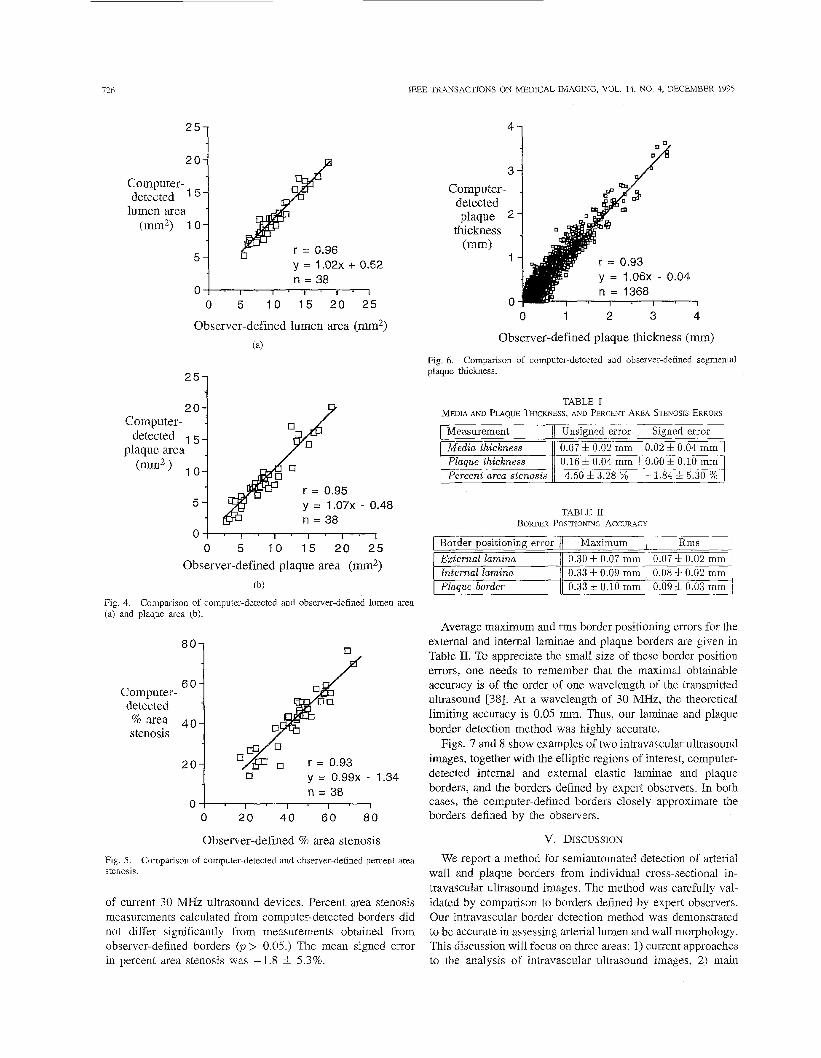
analyzed by our border detection method. Computer-identified lumen areas correlated very well with observer-defined lumen areas [T = 0.96, y = 1 . 0 2 ~ + 0.52, Fig. 4(a)]. Computer- identified plaque areas also correlated very well with observer- defined plaque areas [T = 0.95, y = 1.072- 0.48, Fig. 4(b)l. In our image set percent area stenosis ranged from 17-72%. A good correlation was obtained between the percent area stenosis calculated from computer-determined and observer- defined borders (T = 0.93, y = 0.992- 1.34, Fig. 5). The three regression equations for lumen and plaque area and percent area stenosis closely approximated the line of identity with neither the slope nor the intercept being significantly different from one and zero, respectively (p> 0.2 in all cases). The rms errors of lumen and plaque area measurements were 1.13 mm2 and 1.33 mm2, respectively.
Comparison of computer-determined and observer-defined segmental plaque thicknesses was based on 1368 measurement pairs and showed a good correlation (T = 0.93, y = 1.062- 0.04, Fig. 6). The regression line for segmental plaque thick- ness closely approximated the line of identity but because of the very large n, the slope and intercept differed significantly from one and zero, respectively. Table I shows the media thick- ness, plaque thickness, and percent area stenosis measurement errors. The average absolute (unsigned) and average signed errors are expressed as mean & standard deviation. Plaque thickness measurements derived from computer-detected bor- ders were highly accurate and did not differ significantly from observer-derived measurements (p > 0.5.) The signed and unsigned errors in media thickness were small but substantial compared to the media thickness. The accuracy of media thickness measurements is limited by the spatial resolution
726
25-
2 0 -
Computer- detected ' 5-
lumen area - ("2) 1 0 -
5 - y = 1 . 0 2 ~ -t 0.52 n = 38
0 1 ' I ' 1 . I ' I * I
0 5 1 0 1 5 20 25
Observer-defined lumen area ( m 2 ) (a)
Computer- - detected 5 -
plaque area @m2) 10-
5 -
'"3 20
Measurement Media thickness Plaque thickness Percent area stenosis
Unsigned error Signed error 0.07 f 0.02 mm 0.16 4 0.04 mm 4.50 4 3.28 %
0.02 * 0.04 mm 0.00 6 0.10 mm -1.84 4 5.30 %
y = 1.07X - 0.48
EzternaI hllinil Internal lamina Plaque border
0.30 f 0.07 mm 0.33 4 0.09 mm 0.33 f 0.10 mm
0' 0 5 1 0 15 20 25
Observer-defined plaque area (mm2) (b)
Fig. 4. (a) and plaque area (b).
Comparison of computer-detected and observer-defined lumen area
0.07 k 0.02 mm 0.08 f 0.02 mm 0.09 i 0.03 mm
IEEE TRANSACTIONS ON MEDICAL IMAGING, VOL. 14, NO. 4, DECEMBER 1995
41
3 1
8ol % area 4 0
Computer- detected
stenosis
2 0 y = 0.99x - 1.34
0 0 2 0 4 0 6 0 8 0
Observer-defined % area stenosis Fig. 5 . stenosis.
Comparison of computer-detected and observer-defined percent area
of current 30 MHz ultrasound devices. Percent area stenosis measurements calculated from computer-detected borders did not differ significantly from measurements obtained from observer-defined borders (p> 0.05.) The mean signed error in percent area stenosis was -1.8 & 5.3%.
Computer- detected plaque
thickness ("1
r = 0.93
n = 1368 ' y = 1 . 0 6 ~ - 0.04
0 1 2 3 4
Observer-defined plaque thickness (mm)
Fig. 6. plaque thickness.
Comparison of computer-detected and observer-defined segmental
TABLE I1 BOR~ER POSITIONING A c c m c v
1 Border PositioninE error I / Maximum I Rms 1
Average maximum and rms border positioning errors for the external and internal laminae and plaque borders are given in Table 11. To appreciate the small size of these border position errors, one needs to remember that the maximal obtainable accuracy is of the order of one wavelength of the transmitted ultrasound [38]. At a wavelength of 30 MHz, the theoretical limiting accuracy is 0.05 mm. Thus, our laminae and plaque border detection method was highly accurate.
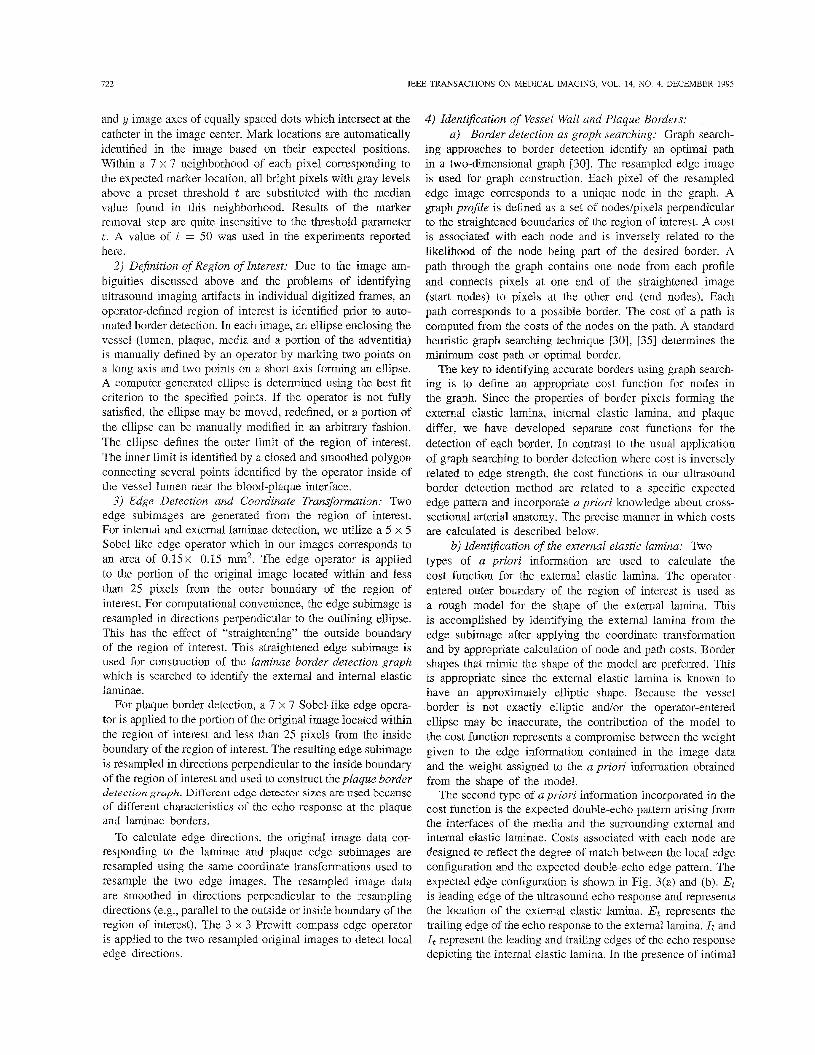
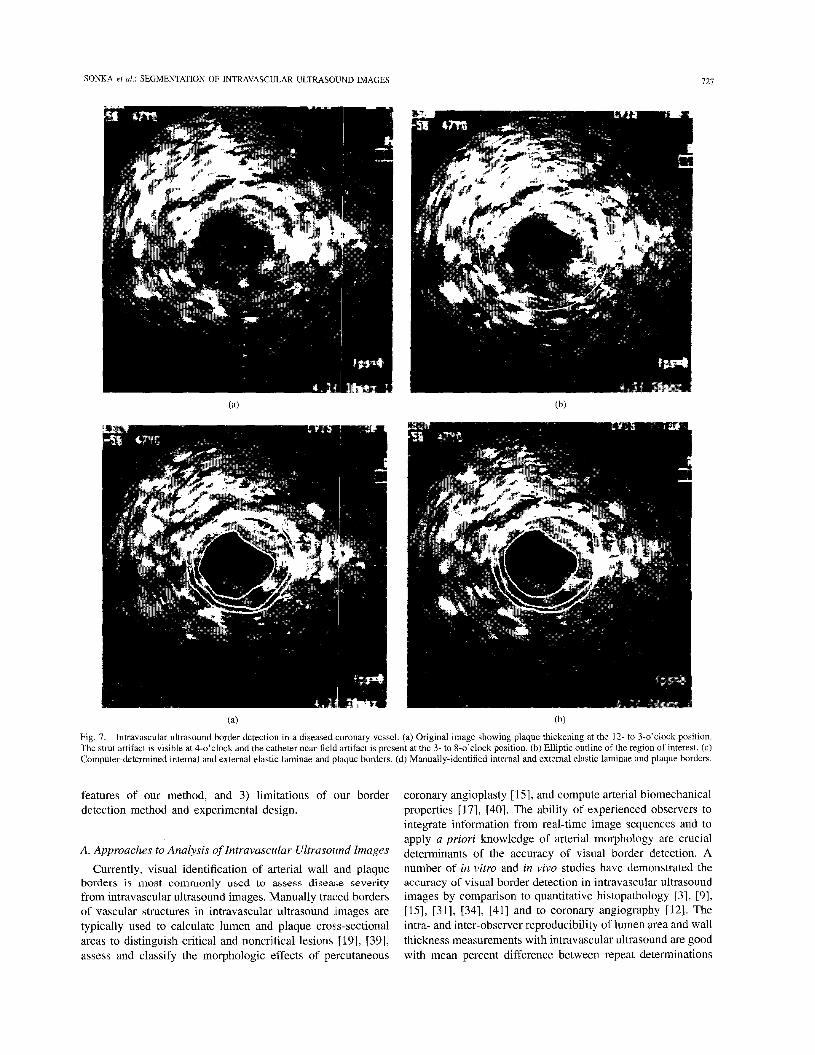
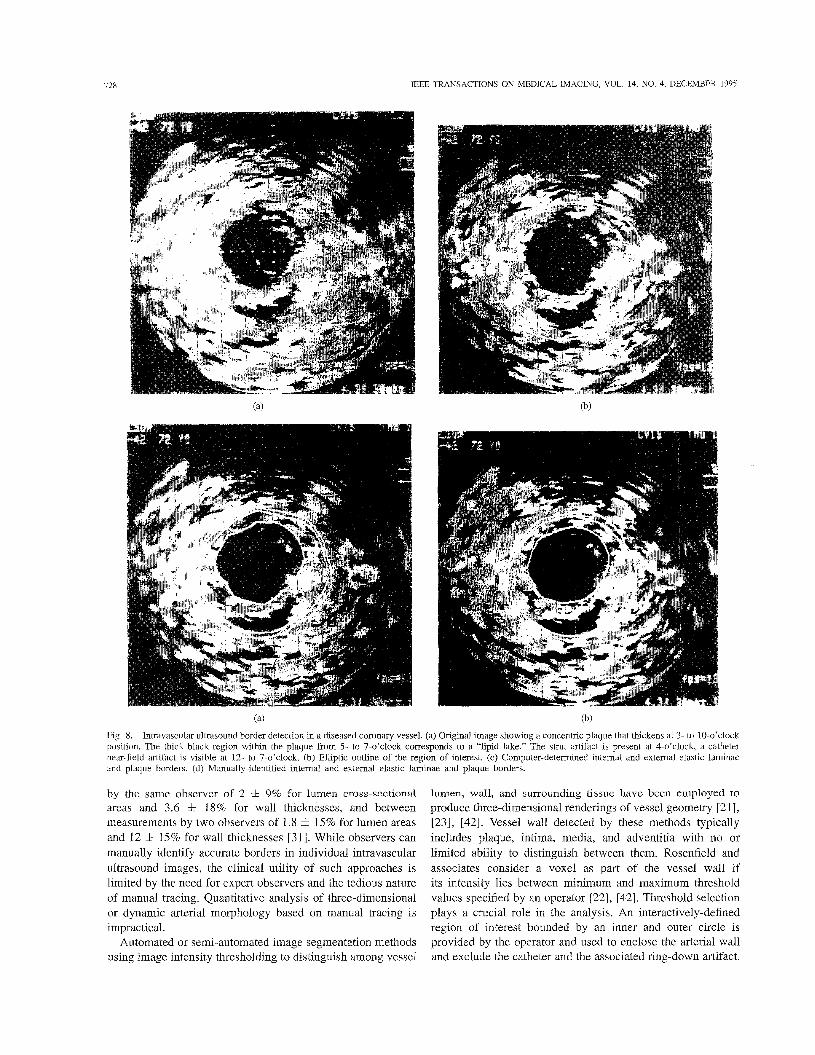
Figs. 7 and 8 show examples of two intravascular ultrasound images, together with the elliptic regions of interest, computer- detected internal and external elastic laminae and plaque borders, and the borders defined by expert observers. In both cases, the computer-defined borders closely approximate the borders defined by the observers.
V. DISCUSSION
We report a method for semiautomated detection of arterial wall and plaque borders from individual cross-sectional in- travascular ultrasound images. The method was carefully val- idated by comparison to borders defined by expert observers. Our intravascular border detection method was demonstrated to be accurate in assessing arterial lumen and wall morphology. This discussion will focus on three areas: 1) current approaches to the analysis of intravascular ultrasound images, 2) main
SONKA et al.: SEGMENTATION OF INTRAVASCULAR ULTRASOUND IMAGES I21
Fig. 7. Intravascular ultrasound border detection in a diseased coronary vessel. (a) Original image showing plaque thickening at the 12- to 3-o’clock position. The strut artifact is visible at 4-o’clock and the catheter near-field artifact is present at the 3- to 8-o’clock position. (b) Elliptic outline of the region of interest. (c) Computer-determined internal and external elastic laminae and plaque borders. (d) Manually-identified internal and external elastic laminae and plaque borders.
features of our method, and 3) limitations of our border detection method and experimental design.
A. Approaches to Analysis of Intravascular Ultrasound Images
Currently, visual identification of arterial wall iind plaque borders is most commonly used to assess disease severity from intravascular ultrasound images. Manually traced borders of vascular structures in intravascular ultrasound images are typically used to calculate lumen and plaque cross-sectional areas to distinguish critical and noncritical lesions [19], [39], assess and classify the morphologic effects of percutaneous
coronary angioplasty [ 151, and compute arterial biomechanical properties [17], [40]. The ability of experienced observers to integrate information from real-time image sequences and to apply a priori knowledge of arterial morphology are crucial determinants of the accuracy of visual border detection. A number of in vitro and in vivo studies have demonstrated the accuracy of visual border detection in intravascular ultrasound images by comparison to quantitative histopathology [3], [9], [15], [31], [34], [41] and to coronary angiography [12]. The intra- and inter-observer reproducibility of lumen area and wall thickness measurements with intravascular ultrasound are good with mean percent difference between repeat determinations
728 IEEE TRANSACTIONS ON MEDICAL IMAGING, VOL. 14, NO. 4, DECEMBER 1995
Fig. 8. Intravascular ultrasound border detection in a diseased coronary vessel. (a) Original image showing a concentric plaque that thickens at 3- to 10-o’clock position. The thick black region within the plaque from 5- to 7-o’clock corresponds to a “lipid lake.” The strut artifact is present at 4-o’clock, a catheter near-field artifact is visible at 12- to 7-o’clock. (b) Elliptic outline of the region of interest. (c) Computer-determined internal and external elastic laminae and plaque borders. (d) Manually-identified internal and external elastic laminae and plaque borders.
by the same observer of 2 ZIC 9% for lumen cross-sectional areas and 3.6 5 18% for wall thicknesses, and between measurements by two observers of 1.8 f 1.5% for lumen areas and 12 f 1.5% for wall thicknesses [31]. While observers can manually identify accurate borders in individual intravascular ultrasound images, the clinical utility of such approaches is limited by the need for expert observers and the tedious nature of manual tracing. Quantitative analysis of three-dimensional or dynamic arterial morphology based on manual tracing is impractical.
Automated or semi-automated image segmentation methods using image intensity thresholding to distinguish among vessel
lumen, wall, and surrounding tissue have been employed to produce three-dimensional renderings of vessel geometry [2 11, [23], 1421. Vessel wall detected by these methods typically includes plaque, intima, media, and adventitia with no or limited ability to distinguish between them. Rosenfield and associates consider a voxel as part of the vessel wall if its intensity lies between minimum and maximum threshold values specified by an operator [22], [42]. Threshold selection plays a crucial role in the analysis. An interactively-defined region of interest bounded by an inner and outer circle is provided by the operator and used to enclose the arterial wall and exclude the catheter and the associated ring-down artifact.
SONKA ef al.: SEGMENTATION OF INTRAVASCULAR ULTRASOIJND IMAGES
Measurements of lumen area obtained with this method have B. Main Features of Our Method
129
been validated in comparison to quantitative a1lgi0graphY Our method for intravascular ultrasound wall and plaque
was by and colleagues [23i. To image graph searching border detection approach that identifies a
inside the lumen and Outside the they advantageous in images where local edge gradients Second,
in an ~ t h I X " r o t i c fjwine model 1261. A similar approach border detection has two key First, it uses a
thresholding difficulties arising from the presence of artifacts border that is optimal in a global sense. This approach is
define regions Of interest to Only inclode are insufficient to reliably identify border our method incorporates a priori information of a variety of types into the border detection process. In particular, to identify the position of the external elastic lamina we search not for a connected series of pixels with large edge gradients but for an expected double-echo edge pattern. This pattern does not rely on the frequently reported trilayer appearance of intravascular ultrasound images of muscular arteries. The trilayer appearance of diseased coronary vessels is thought to correspond with sequential layers of intima and/or plaque, media, and surrounding tissue (adventitia) and may in fact not always be present [32]. We are instead exploiting the differences in acoustic impedance between the elastic laminae and the surrounding tissues [3213 [341.
Our method searches for edge trip1ets representing the leading and trailing edges of the external elastic lamina echo and the trailing edge of the internal elastic lamina echo. It has previously been suggested that the local gradients of trailing edges are less useful in locating borders because the trailing edge signal is highly gain-dependent 1241. Accordingly, we do not use the trailing edge location but rather use the existence of trailing edges inside two windows positioned With lamina as contextual edge information. Based on the presence of this double-echo pattern and discriminating against borders that depart too m ~ h from the model of the Preferred vessel shape7 the location of the external elastic lamina is determined. This boundary then Sfx~eS to define a search region, whose width is defined by a priori knowledge about the thickness of the media, within which the leading edge Of the internal elastic lamina echo is determined. Lastly, the border between lumen and plaque is identified based on the echo response from the blood-plaque interface. Thus, the identification of all three borders is based on searching for a boundary that is globally optimal. Consequently, it is possible to identify borders even in the presence of missing data due, for example, to focal interruptions of the internal elastic lamina caused by plaque.
In the processed intravascular ultrasound images, border detection results were insensitive to exact values of dp. In an effort to minimize the number Of this method's parameters, a single Penalty value dP was ~ e d . Nevertheless, the values of & may is fine-tuned to reflect POSSiblY d i f f ~ ~ e n t individual border properties if the method be modified for other aP- plications. Similarly, edge directions may be penalized in a more continuous fashion assigning higher penalty to directions that differ more from the preferred directions. However, only the general orientation of the border is known and there is no single preferred direction. Therefore, and considering the speckle characteristics of ultrasound images, we have chosen to penalize only those directions which we know to represent
structures between adventitia and intima. The limitations of thresholding using fixed thresholds as a segmentation method are widely recognized in the medical imaging community. Even very careful region of interest selection does not obviate these problems.
Texture properties of specular ultrasound signal are some- times utilized to improve image segmentation in a variety of ultrasound image data [43]-[47]. In intravascular ultrasound images, however, the possible role of texture information will more likely be in tissue classification and determination of plaque composition than in coronary wall border detection.
An intravascular ultrasound border detection approach which identifies wall and plaque borders that uses simulated annealing was reported by Herrington et al. [24]. In their approach, an operator interactively identifies an approximate border and a resampled image is formed using the border to define a region of interest. An edge was applied to the resampled image and the closed boundw that represented the best compromise between identifying a smooth boundary and minimizing the sum of the inverted edge strengths along the boundary was determined. using this procedure, borders between blood and plaque or between media and adventitia may be individually identified. Dhawale et al. use interactively-defined boundary points to guide a one-dimensional dynamic search for the border between media and adventitia and the border between blood and plaque [48].
We have previously reported an approach using a heuristic graph search for identifying external and internal 1,uninae and plaque borders [25]. This method used an adaptive model- based approach in which the strength of the ]nodel VX- ied around the vessel circumference as a function of local image quality. The method was validated in two disten- sible phantoms, each of which was imaged under several pressure conditions. Lumen cross-sectional areas correlated very well with distending pressure in both phantoms. Al- though this method yielded promising results and important insights in phantoms, it did not incorporate sufficient a pri- ori information to perform well in more realistic imaging situations.
No fully automated method for detection of cojronary wall and plaque borders in intravascular ultrasound images has been published to date. Intravascular ultrasound images are quite noisy and often contain catheter and other artifacts. Without contextual information from image frames adjacent in space and time, single-frame intravascular images are difficult to analyze even for the most experienced humans. To be successful, automated methods need to incorporate substantial a priori knowledge about ultrasound imaging physics and ar- terial anatomy. The ability to use information from temporally and spatially adjacent images could also prove advantageous.
to the leading edge Of the
730 IEEE TRANSACTIONS ON MEDICAL IMAGING, VOL. 14, NO. 4, DECEMBER 1995
undesired directions, we penalize all three “bad” directions by the same amount.
In designing our intravascular ultrasound border detection method, we have attempted to mimic the strategies employed by experienced ultrasonographers when attempting to visually identify arterial borders. When the local distribution of image intensities do not allow unambiguous border identification, expert observers will rely upon the a priori knowledge they have accumulated about intravascular ultrasound image char- acteristics. Their final decision about border locations will represent a balance between the clues provided by local image patterns and their expectations about overall image characteristics. It is of course possible that the two will at times conflict and it is thus necessary to make a trade-off between local border detection accuracy and overall analysis reliability. We have made the same sort of trade-off in designing the overall scheme and cost functions used in our border detection method. The resulting method successfully identifies wall and plaque borders in images of fresh cadaveric vessels with a wide variety of atherosclerotic plaques. The computational complexity of the method is modest; processing of an image requires about 7 seconds using an HP 715/100 workstation.
C. Limitations of Our Border Detection Method and Experimental Design
In its current form, our method for intravascular ultrasound border detection has some limitations. The quality of the images we analyze is diminished by a number of factors. We rely upon storage of intravascular images on S-VHS videotape and subsequent digitization during playback. It is well known that image quality deteriorates during th!s recording/playback process. The images used in this study contain calibration markers which are important for visual analysis and for calibration. Although our preprocessing step removes the markers quite reliably, the markers can potentially interfere with local border detection. The original ultrasound data are acquired in polar coordinates and scan-converted by the imaging instrument to form a rectangular image. Our graph searching algorithm requires the image data to be resampled again to form a straightened image. Since scan conversion is inevitably accompanied with information loss, it would be preferable to produce the straightened image directly from the raw polar ultrasound image data.
The knowledge that we have incorporated into our border detection method may not be applicable in all cases. The assumption of a media thickness between 0.1-0.3 mm may not be valid in vessels with advanced atherosclerosis. Histologic studies show that the media underlying the plaque may be attenuated or nonexistent 1491, [50]. In addition, the internal elastic lamina may be fragmented or completely missing. Although our experience in analysis of cadaveric vessels suggests that our model-guided approach is robust enough to overcome partially missing edge information, further studies using quantitative histologic comparisons are warranted.
Our current method is not fully automated in that it utilizes an operator-defined region of interest. The laminae and plaque borders are then automatically identified within this region.
In OUT method, the region of interest may be quickly and easily defined and need not closely approximate the external lamina [see Figs. 7 and 81. While a fully automated algorithm would be desirable, we have elected to focus our initial efforts on developing and validating a semi-automated approach that takes advantage of limited operator interaction. The need for an operator to define a region of interest is made necessary by the complex and variable nature of plaque morphology together with the relatively poor quality of state-of-the-art intravascular ultrasound images which until recently has made computerized analysis of individual intravascular ultrasound images very difficult. Intravascular ultrasound image quality is now rapidly improving due to the introduction of new catheters and ultrasound signal processing techniques. These advances should facilitate the development of fully automated analysis procedures. Our current efforts to develop a fully automated intravascular ultrasound border detection method will focus on utilizing the contextual information from sub- sequent image frames both in temporal and spatial image sequences. A preliminary implementation of a fully automated method for coronary wall and plaque border detection in short pressure sequences suggested the feasibility of such an approach [51].
Our experimental design has several limitations. The ul- trasound images were obtained from fresh cadaveric hearts that were perfused with saline under physiological temperature and pressure. Although these in vitro images were reasonably representative of images obtained in the clinical setting, their quality probably exceeds that of in vivo images. The quality of in vivo images may be degraded by a number of factors, including increased difficulty of optimal positioning of the ultrasound catheter within the vessel lumen, vessel motion during the cardiac cycle, and scattering from blood, especially at lower flow rates observed in stenotic vessels. These factors may sect the ability of our method to identify the internal elastic lamina or the plaque-lumen interface. We expect that identification of the internal elastic lamina with our algorithm gains some immunity to these degradations, since the borders are found ‘from the outside in.’ That is, information about the location of the external elastic lamina is incorporated in the cost function for detection of the internal elastic lamina. Further validation studies of our border detection approach using images obtained in vivo need to be performed.
A second limitation of our experimental design relates to the use of manually-traced wall and plaque borders as an independent standard. Perhaps the best alternative independent standard is quantitative histology. Unfortunately, the utility of this standard is limited by tissue processing and shrinkage artifacts which lead to systematic changes in lumen and vessel wall dimensions [3], [31]. We took a number of steps to limit the shortcomings of using manually-defined borders. The borders were traced by an experienced observer who was instructed to take great care in tracing the borders. The borders were then inspected by two cardiologists, edited as needed using convenient interactive software tools, and approved by consensus of the two cardiologists. All observers were able to refer to the real-time video recordings and were unaware of the results of the computer analysis. Despite the great care
SONJSA et al.: SEGMENTATION OF INTRAVASCULAR ULTRASOUND IMAGES 731
given to manual tracing in this study, manually-defined borders remain an imperfect independent standard.
VI. CONCLUSION Intravascular ultrasound is a promising new imaging method
for evaluating coronary artery anatomy. Because of its ability to directly image coronary lumen and wall cross-sectional dimensions and to assess the composition of atherosclerotic plaque, intracoronary ultrasound may ultimately replace an- giography as the gold standard in evaluating coronary artery disease [13], [19]. Although there is substantial and growing interest in quantitative analysis of intravascular ultrasound images, only very limited progress has been reported in the literature on the development of automated methods for identifying wall and lumedplaque borders. We report here a knowledge-based method for detection of external and internal elastic lamina and plaque borders in intravascular ultrasound images. The method was validated in 38 intravas- cular images acquired from fresh cadaveric hearts. Computer- detected borders showed very good agreement with manually- traced borders defined by experienced observers. The border detection method shows promise for the reliable imalysis of intravascular ultrasound images of coronary arteries in vivo.
REFERENCES
[1] S. M. Collins and D. J. Skorton, Eds, Cardiac Imaging and Image Processing. New York McGraw Hill, 1986.
[2] M. L. Marcus, H. R. Schelbert, D. J. Skorton, and G. L. Wolf. Cardiac Imaging. Philadelphia, PA W. B. Saunders, 1991.
[3] P. R. Liebson and L. W. Klein, “Intravascular ultrasound in coronary atherosclerosis: A new approach to clinical assessment,” Am. Heart J., vol. 123, pp. 1643-1660, 1991.
[4] D. J. Skorton and S. M. Collins, “New directions in cardiac imaging,” Ann. Intem. Med., vol. 102, pp. 795-799, 1985.
[5] M. L. Marcus, D. J. Skorton, M. R. Johnson, S. M. Collins, D. G. Harrison, and R. E. Kerber, “Visual estimates of percent diamater coronary stenosis: (A} battered gold standard,” J. Am. Coll. Cardiol.,
[6] G. B. J. Mancini, “Applications of digital angiography to the coronary vol. 11, pp. 882-885, 1988.
- - . circulation,” in Cardia; Imaging: Principles and Practice. M. L. Mar- cus and D. J. Skorton, Eds. Philadelphia: WB Saunders, 1991, pp. 310-347. J. H. C. Reiber, P. W. Sermys, and J. D. Barth, “Quantitative coronary angiography,” in Cardiac Imaging, M. L. Marcus, H. R. Schelbert, D. J. Skorton, and G. L. Wolf, Eds. Philadelphia: W. B. Saunders, 1991,
J. M. Hodgson, S. D. Graham, A. D. Savakus, S. G. Dame, D. N. Stephens, P. S. Dhillon, D. Brands, H. Sheehan, and M. J. Eberle. “Clinical percutaneous imaging of coronary anatomy using an over- the-wire ultrasound catheter system,” Inr. J. Card. Imag’., vol. 4, pp. 187-193, 1989. J. A Mallery, J. M. Tobis, J. Griffith, J. Gessert, M. McRae, 0. Moussabeck, M. Bessen, M. Moriuchi, and W. L. Henry, “.4ssessment of normal and atherosclerotic arterial wall thickness with an intravascular ultrasound catheter,” Am. Heart J., vol. 119, pp. 1392-1400, 1990. S. E. Nissen, J. C. Gurley, C. L. Grines, D. C. Booth, R. McClure, M. Berk, C. Ficher, and A. N. DeMaria, “Intravascular ultrasound assessment of lumen size and wall morphology in normal subjects and patients with coronary artery disease,” Circ., vol. 84, p p 1087-1099, 1991. C . J. Davidson, K. H. Sheikh, J. K. Harrison, S. I. Himielstein, M. E. Leithe, K. B. Kisslo, and T. M. Bashore, “Intravascular ultrasonography versus digital subtraction angiography: A human in vivo (comparison of vessel size and morphology,” J. Am. Coll. Cardiol., vol. 16, pp. 633-636, 1990. J. M. Hodgson, S. P. Graham, H. Sheenan, and A. D. Savakus, “Percutaneous intracoronary ultrasound imaging: Initial applications in patients,” Echocardiography, vol. 7, pp. 403413, 1990.
pp. 211-280.
[ 131 J. M. Tobis, “Intravascular ultrasound A fantastic voyage,” Cim., vol. 84, pp. 2190-2192, 1991.
[14] C. J. White, S. R. Ramee, T. J. Collins, A. Jain, and J. E. Mesa, “Ambiguous coronary angiography: Clinical utility of intravascular ultrasound,” Cath. Cardiovasc. Diagn., vol. 26, pp. 200-203, 1992.
[15] T. C. Gerber, R. Erbel, G. Goerge, J. Ge, H. Rupprecht, and J. Meyer, “Classification of morphologic effects of percutaneous transluminal coronary angioplasty assessed by intravascular ultrasound,” Am. J. Cardiol., vol. 70, pp. 1546-1554, 1992.
[16] H. Mudra, R. Blasini, V. Klauss, E. Regar, J. Rieber, A. Konig, M. Roth, R. von Essen, and K. Theisen, “Diameter measurements after balloon angioplasty by intravascular ultrasound and quantitative coronary angiography: Reasons for discrepancy (abstract),” Circ., vol. 88, pp. 1-411, 1992.
[17] R. T. Lee, H. M. Loree, G. C. Cheng, E. H. Liegerman, N. Jaramillo, and F. J. Schoen, “Computational structural analysis based on intravascular ultrasound imaging before in vitro angioplasty: Prediction of plaque fracture locations,” J. Am. Coll. Cardiol., vol. 21, pp. 777-782, 1993.
1181 N. G. Pandian, A. Kreis, and A. Weintraub, “Real-time intravascular imaging in humans,” Am. J. Cardiol., vol. 65, pp. 1392-1396, 1990.
[19] B. F. Waller, C. A. Pinkerton, and J. D. Slack, “Intravascular ultrasound A histological study of vessels during life. The new ‘gold standard’ for vascular imaging,” Circ., vol. 85, pp. 2305-2309, 1992.
[20] P. G. Yock, P. J. Fitzgerald, and D. T. Linker, “Intravascular ultra- sound guidance for catheter-based coronary interventions,” J. Am. Coll. Cardiol., vol. 17, pp. 39B-45B, 1991.
[21] D. M. Cavaye, M. R. Tabbara, G. E. Kopchok, T. E. Laas, and R. A. White, “Three dimensional vascular ultrasound imaging,” Amer. Surgeon, vol. 57, pp. 751-755, 1991.
[22] K. Rosenfield, J. Kaufman, A. M. Pieczek, R. E. Langevin, P. E. Palefski, S. A. Pazvi, and J. M. h e r , “Human coronary and peripheral arteries: On-line three-dimensional reconstruction from two-dimensional intravascular us scans,” Radiol., vol. 184, pp. 823-832, 1992.
[23] G. S. Mintz, B. N. Potkin, G. Keren, L. F. Satler, A. D. Pichard, K. M. Kent, J. J. Popma, and M. B. Leon, “Intravascular ultrasound evaluation of the effect of rotational atherectomy in obstructive atherosclerotic coronary artery disease,” Circ., vol. 86, pp. 1383-1393, 1992.
[24] D. M. Herrington, T. Johnson, P. Santago, and W. E. Snyder, “Semi- automated boundary detection for intravascular ultrasound” in Compur- ers in Cardiology 1992. Los Alamitos, C A IEEE, 1992, pp. 103-106.
[25] M. Sonka, X. Zhang, M. Siebes, R. R. Chada, C. R. McKay, and S. M. Collins, “Automated detection of wall and plaque borders in intravascular ultrasound images,” in Physiology and Function from Multidimensional Images, Proc. SPIE. Bellingham, WA: SPIE, vol. 2168, 1994, pp. 13-22.
[26] K. Rosenfield, D. W. Losordo, K. Ramaswamy, A. Pieczek, M. Keamey, J. Hogan, and B. D. Kosowsky, “Quantitative analysis of luminal cross- sectional area from 3-dimensional reconstructions of 2-dimensional intravascular ultrasound: Validation of a novel technique (abstract),” Circ., vol. 84, pp. II-542, 1991.
[27] S. R. Fleagle, M. R. Johnson, C. J. Wilbricht, D. J. Skorton, R. F. Wilson, C. W. White, M. L. Marcus, and S. M. Collins, “Automated analysis of coronary arterial morphology in cineangiograms: Geometric and physiologic validation in humans,” IEEE Trans. Med. Imag., vol. 8, pp. 387400, 1989.
[28] M. Sonka, C. J. Wilbricht, S. R. Fleagle, S. K. Tadikonda, M. D. Winniford, and S. M. Collins, “Simultaneous detection of both coronary borders,” IEEE Trans. Med. I m g . , vol. 12, pp. 588-599, 1993.
[29] M. Sonka, M. D. Winniford, and S. M. Collins, “Robust simultaneous detection of coronary borders in complex images,” IEEE Trans. Med. Imaging, vol. 14, no. 1, pp. 151-161, 1995.
[30] M. Sonka, V. Hlavac, and R. Boyle,” Image Processing, Analysis, and Machine Vision.
[31] B. N. Potkin, A. L. Bartorelli, J. M. Gessert, R. F. Neville, Y. Almagor, W. C. Robberts, and M. B. Leon, “Coronary artery imaging with intravascular high-frequency ultrasound,” Circ., vol. 81, pp. 1575-1585, 1990.
[32] P. J. Fitzgerald, F. G. St. Goar, A. J. Connolly, F. J. Pinto, M. E. Billingham, R. L. Popp, and P. G. Yock, “Intravascular ultrasound imaging of coronary arteries. Is three layers the norm?’ Circ., vol. 86, pp. 1541.58, 1992.
[33] C . R. McKay, B. F. Waller, I. Gessert, M. Catellier, S. R. Fleagle, and M. L. Marcus, “Quantitative analysis of coronary artery morphology using intracoronary high frequency ultrasound Validation by histology and quantitative coronary angiography (abstract),” J. Am. Coll. Cardiol., vol. 13, p. 228A, 1989.
[34] E. J. Gussenhoven, C . E. Essed, C. T. Lancee, F. Mastik, P. Frietman, F. C. van Egmond, J. Reiber, H. Bosch, H. van Urk, J. Roelandt,
London, New York Chapman and Hall, 1993.
132 IEEE TRANSACTIONS ON MEDICAL, IMAGING, VOL. 14, NO. 4, DECEMBER 1995
and N. Bom, “Artenal wall characteristics determined by intravascular ultrasound imaging: An in vitro study,” J. A m Coll. Cardiol., vol. 14,
[35] N. J. Nilsson,” Problem Solving Methods in ArtiJicial Intelligence. New York: McGraw Hill, 1971.
[36] C. R. McKay, S. Landas, P. Hanson, D. Robertson, B. F. Waller, and M. D. Winniford, “Histologic and angiographic effects of a pulsed holmium: YAG laser in normal and atherosclerotic human coronary arteries and aorta,” Cardiovasc. Res., vol. 26, pp. 994-1000, 1992.
[37] J. H. Zar,” Biostatistical Analysis, 2nd ed. Englewood Cliffs, F’rentice Hall, 1984.
[38] S. Li, W. N. McDicken, and P. R. Hoskins, “Blood vessel diameter measurement by ultrasound,” Physiol. Meas., vol. 14, pp. 291-297, 1993.
[39] L. Wengnang, W. J. Gussenhoven, Y. Zhong, S. H. K. The, C. Di Mario, S. Madretsma, F. V. Egmond, P. D. Feyter, H. Pieterman, H. V. Urk, H. Rijsterborgh, and N. Bom, “Validation of quantitative analysis of intravascular ultrasound images,” Int. J. Cardiac Imag., vol. 6, pp. 247-253, 1991.
[40] P. J. Dhawale, D. L. Wilson, and J. McB Hodgson,” In vivo estimation of elastic properties of arteries with intracoronary ultrasound,” in Proc. of the Annu. Inc. Con$ of the IEEE Engineering in Medicine and Biology Soci., IEEE, Piscataway, NJ, vol. 15, pp. 204-205, 1993.
[41] R. A. Nishimura, W. D. Edwards, C. A. Wames, G. S. Reeder, D. R. Holmes, A. J. Tajik, and P. G. Yock, “Intravascular ultrasound imaging: In vitro validation and pathologic correlation,” J. A m Coll. Cardiol., vol. 16, pp. 145-154, 1990.
[42] K. Rosenfield, D. W. Losordo, K. Ramaswamy, J. 0. Pastore, R. E. Langevin, S. Razvi, B. D. Kosowsky, and J. M. h e r , ‘Three- dimensional reconstruction of human coronary and peripheral arteries
pp. 947-952, 1989.
from images recorded during two-dimensional intravascular ultrasound examination,” Circ., vol. 84, pp. 1938-1956, 1991.
[43] M. F. Insana, R. F. Wagner, B. S. Garra, D. G. Brown, and T. H. Shawker, “Analysis of ultrasound image texture via generalized Rician statistics,” Opt. Eng., vol. 25, pp. 743-748, 1986.
[44] R. Momenan, R. F. Wagner, B. S. Garra, M. H. Loew, and M. F. Insana, “Image staining and differential diagnosis of ultrasound scans based on the Mahalanobis distance,” IEEE Trans. Med. Imag., vol. 13, pp. 3 7 4 7 , 1994.
[45] R. Muzzolini, Y. H. Yang, and R. Pierson, “Multiresolution texture segmentation with application to diagnostic ultrasound images,” IEEE Tram. Med. Img. , vol. 12, pp. 108-123, 1993.
[46] R. Muzzolini, Y. Yee-Hong, and R. Pierson, “Texture characterization using robust statistics,” Pattern Recognition, vol. 27, pp. 119-134, 1994.
[47] R. Durikovic, K. Kaneda, and H. Yamashita, “Texture approach to dynamic contour following,” Trans. Inform. Processing SocJapan, vol.
[48] P. J. Dhawale, Q. Rasheed, N. Griffin, D. L. Wilson, and J. McB Hodg- son, “Intracoronary ultrasound plaque volume quantification,” in Com- puters in Cardiology.
[49] J. M. Isner, R. F. Donaldson, A. H. Fortin, A. Tischler, and R. H. Clarke, “Attenuation of the media of coronary arteries in advanced atherosclerosis,” A m J. Cardiol., vol. 58, pp. 837-839, 1986.
[50] B. F. Waller, ‘The eccentric coronary atherosclerotic plaque: Morpho- logic observations and clinical relevance,” Clin. Cardiol., vol. 12, pp. 14-20, 1989.
[51] M. Sonka, X. Zhang, M. Siebes, S. DeJong, C. R. McKay, and S. M. Collins, “Automated segmentation of coronary wall and plaque from intravascular ultrasound image sequences,” in Computers in Cardiology 1994.
35, pp. 1732-1738, 1994.
Los Alamitos, CA: IEEE, 1993, pp. 121-124.
Los Alamitos, CA: IEEE, 1995, pp. 281-284.


