Embed Size (px)
Citation preview

Seismic Processing for Geohazards - Onshore Nigeria Case Study
A.ADEBAYO*, J.OBIEKWE, CGGVeritas
Summary
Geo-hazards in oil exploration principally
result from shallow gas (hydrates) found
both onshore and offshore, which may
adversely impact well placement and
drilling activities. They can result in loss
of well control and ‘blow-outs’ which can
lead to fatality. Seismic data, when
properly processed, provide a means with
which these gases could be identified.
Offshore, new generation broadband
marine and seabed techniques exist for
their identification. Onshore (and offshore)
geo-hazards identification using seismic
data is the best available tool and requires
accurate processing. The main processing
steps to achieve this goal are the main
focus of this paper.
In this paper we present an adapted
processing flow for geo-hazard
identification on a seismic survey onshore
Niger Delta. A focus on three main steps is
needed to reveal shallow gas on land
seismic data:
1. Attention to proper near surface
modelling for refraction statics
computation.
2. Use of robust suit of preserved
amplitude processing algorithms.
3. Accurate velocities.
Introduction
The near surface of land surveys where
shallow gases are located is often masked
with high-frequency noise, low-fold data
and low-velocity layer effect on refraction
statics computation. The low-fold is also a
draw-back for velocity analysis.
A point of advantage from field data is the
acquisition sampling rate which is
normally at 2ms; this is adequate for this
study.
We have therefore focused the adapted
processing flow on addressing these issues
that affect the ‘visibility’ of near surface
information on a 3D land survey from the
onshore Niger Delta.
The data used in this paper was acquired in
2009 using orthogonal geometry with the
following acquisition and recording
parameters:
Bin size: 25m x 25m
Source line spacing: 350m
Receiver line spacing: 300m
Shot-point interval: 50m
Receiver Station interval: 50m
Active receiver lines/shot: 8
Maximum active channels/shot: 1344
Maximum active receivers/line: 168
Nominal full fold: 48
Shots/salvo: 24
Max. Trace offset (m): 4480
Min. trace offset (m): 36.35
Sampling interval (ms): 2
Swaths: 8
Receiver lines: 36
Total Shots: 5565
Full fold area (km2): 52
Location
The survey area is located in the north
central part of onshore Niger Delta,
Nigeria, as shown in Figure 1.
Figure 1: survey location map

Initially, prospects in the area were
identified on the basis of 2D seismic lines
of very old vintage. The first well was
drilled, based on that dataset, in 1972
which resulted in a blow-out. Following
this, three relief wells were drilled from a
nearby location to control the blowout.
The blowout however continued for more
than two years before it subsided. A
significant amount of water, mud and
cement were injected into suspected
reservoirs which were understood to have
caused the blowout by the initial operator.
No appraisal activities took place in the
block until 2007. The acquisition in 2009
was therefore aimed at studying any
possible charged high pressure sand in the
shallow section as part of exploration
activity by the subsequent operator of this
lease area.
The geology, typical in Niger Delta, is
characterised with large scale growth
faults dipping to the south/southwest and
occurring as rollover anticlines generally
trending in northwest/southeast direction.
The target for this study is between 0ms -
1000ms.
Processing Strategy
In achieving the objectives in processing,
we focussed attention on three main areas
that enhance signal in the shallow,
discussed below.
1. Thoroughly quality-checked near-
surface model for refraction statics
computation and application.
Geostar, a CGGVeritas integrated solution
for near-surface modelling and 3D
refraction statics tools is used in this work.
It builds and refines a near-surface model
and creates weathering statics corrections
by using seismic first arrival information.
An accurate refraction solution begins with
precise first break picks which are the
input as depicted in Figure 2 below. The
picks are double-checked as overlay after
auto-picking.
Figure 2: refraction statics workflow
The initial model was built from field up-
hole data and refined manually to fit
reasonable geological expectations; for
example, regional trending are carefully
removed and smoothed where necessary.
The first breaks and the initial models are
validated by travel conformance displays
which are expected to be flattened with the
modelled velocities from the up-hole data.
The degrees of correctness of the updated
(or final) models are confirmed with how
flat the first arrivals have become in
subsequent travel conformance displays.
We updated the models using a cascade of
iterated linear model inversion (LMI)
technique.
We, more importantly, checked that the
final refraction solution indeed solves the
topographic and the low-velocity-layer
problems. Several sections through the
final model and the computed statics
solution showed surface consistency with
the surface elevation map, shown in Figure
3a and b. A sample section through the
model is shown in Figure 4 below.

Figure 3a: survey surface elevation map
Figure 3b: Final refraction statics map
Figure 4: Near surface model for
refraction statics computation showing the
travel conformance display from the initial
model and below after final updated
model.
Of course, the final check is the actual
application on seismic. The resulting
refraction statics are then applied on the
data volume, stacked and quality-checked.
The results are shown in Figures 5 and 6,
where near surface reflections have
become better aligned with consequent
higher stack response.
Figure 5: An inline stack before refraction
statics application
Figure 6: an inline stack after refraction
statics application
2. Use of Robust suit of preserved
amplitude processing algorithms.
Preserved amplitude algorithms assure
easy detection and preservation of changes
which are due to changes in geology. All
of the algorithms employed here are
normally used in seismic processing
prospecting for deep targets; two of these
stand out which aid near-surface imaging.
The two are:
a. Adaptive Ground-roll Attenuation
algorithm for both aliased and
dispersive ground-roll noise
attenuation.
b. REVIVE 5D Interpolation for data
regularisation.
a. Adaptive Ground-roll Attenuation is a
preserved amplitude processing algorithm
used to remove aliased and dispersive
ground-roll noise.
Where ground-roll characteristics vary
across a survey, standard methods such as
FK and radon techniques which use fixed
parameterisations and regular grids
become ineffective. CGGVeritas AGORA-
Adaptive Ground Roll Attenuation
provides accurate attenuation by adapting
to the ground-roll characteristics in 2D and
3D domains.
The ground-roll is elastically modelled and
adapted to the data in a least-squares sense
before subtraction. This provides robust
and effective attenuation to the ground-
roll, even on external cables and in
challenging conditions where noise is
aliased or dispersive, whilst ensuring
excellent preservation of primaries.
AGORA is also used to attenuate guided
waves allowing wider mutes, improved
velocity picking, increased signal-noise
ratio in the stack and providing more far-
offset data for full AVO studies. This is
appropriate in removing noise that masks
near-surface information.
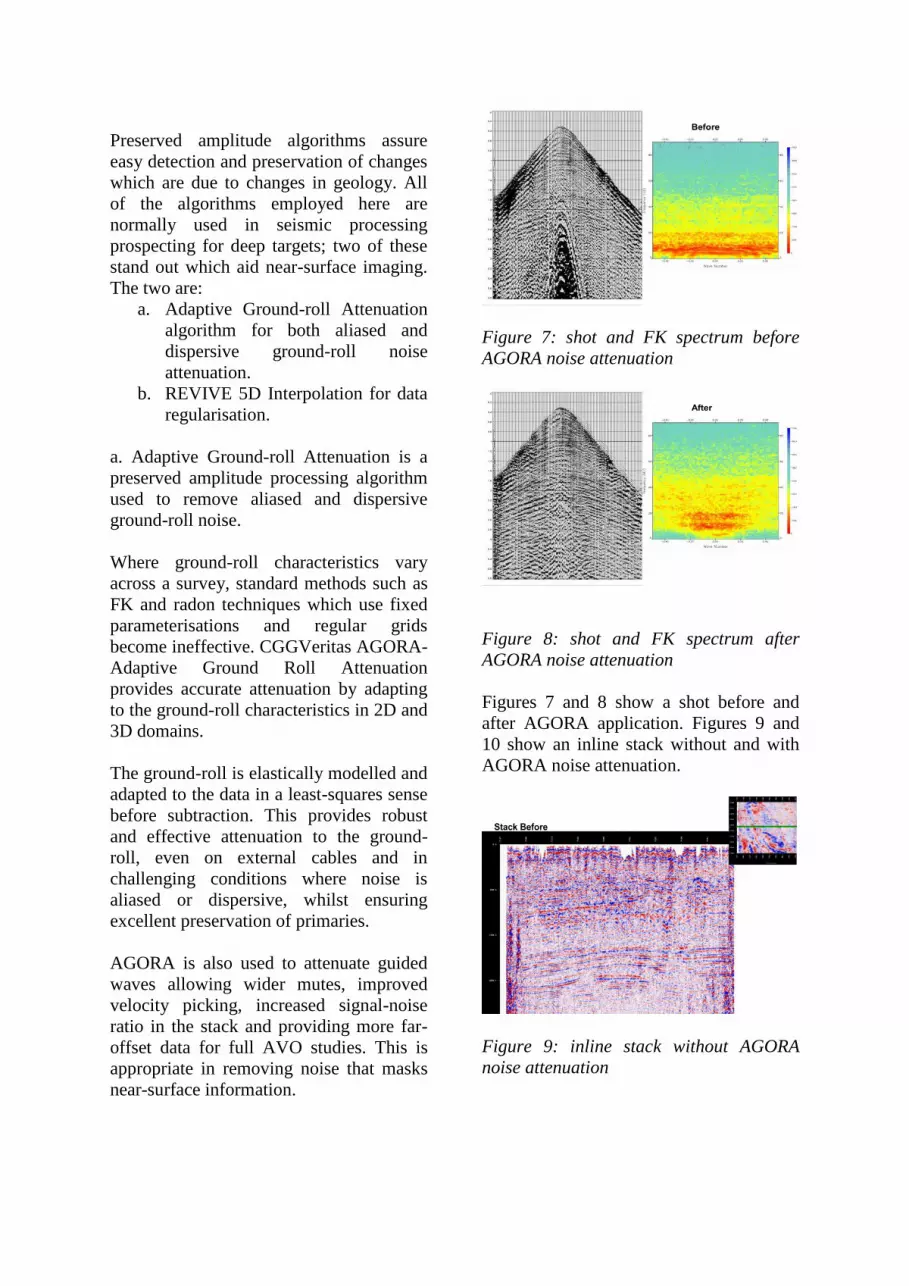
Figure 7: shot and FK spectrum before
AGORA noise attenuation
Figure 8: shot and FK spectrum after
AGORA noise attenuation
Figures 7 and 8 show a shot before and
after AGORA application. Figures 9 and
10 show an inline stack without and with
AGORA noise attenuation.
Figure 9: inline stack without AGORA
noise attenuation

Figure 10: inline stack with AGORA noise
attenuation
b. REVIVE 5D Interpolation for data
regularisation has been employed in this
work. In this algorithm, full interpolation
and regularisation to bin centre is achieved
in FK domain after data has been
transformed using multi-dimensional
Fourier transformation. The reverse
transform reconstructs the energy to bin
centre (or any specified coordinates)
resulting in reduced gaps and much higher
signal-to-noise in the stack. Figure 11
depicts these transforms.
Figures 12 and 13 show an inline stack
without and with REVIVE 5D
interpolation.
Figure 11: data interpolation and
regularisation with REVIVE 5D
Figure 12: inline stack without REVIVE
5D interpolation
Figure 13: inline stack with REVIVE 5D
interpolation
3. Accurate velocity analysis was
performed, which was aided greatly due to
increased data continuity provided by
REVIVE 5D, resulting in precise velocity
picking which was used for pre-stack time
migration. The precision in the velocity
field was also helped with the temporal
sampling of 2 ms recorded from the field.
Great care was taken to estimate the best
velocity possible at an early stage. The
brute velocity analysis was prepared with
scans of several CDP gathers of a sub-line.
These were used as references in

subsequent analyses. The final migration
velocity was performed at a grid of 250m x
250m. Residual move-out velocity was
done on a grid of 100m x 100m for final
stack.
Figure 14 compares stack images of the
raw data and final migration.
Figure 14: stack inline: raw vs. final
migrated image
Discussion of Results
Important feedback was received on the
interpretation of this processed dataset and
how it was used in delineating geo-hazards
and well placement, these are discussed
here.
Regarding the reported blowout of 1972,
its current extent was easily seen and
delineated at times 220ms and 850ms and
easily mapped spatially as shown in
Figures 15 and 16.
Comparison with the originally processed
section is shown in Figure 17, which was
also interpreted. This does not map
properly the spatial extent of the geo-
hazards at ~850ms.
Figure 15: spatial delineation of extent of
blowout at time 220ms
Figure 16: spatial delineation of extent of
blowout at time 850ms – mid Benin section
Figure 17: blowout effect on seismic:
original vs reprocessed
This interpretation consequently helped in
well placement as depicted in Figure 18.

Figure 18: well placement aided by easy
delineation of blowout effect
Conclusion
The adapted processing flow used in this
work has helped in identifying and
delineating the extent of the blowout
which happened in 1972 on this survey
area. It has therefore helped in properly
placing the well and avoiding risks to the
equipment and personnel. This is fully in
line with the set objectives.
Actual well drilling has been started
without any fatality.
Acknowledgments
The authors thank Sterling Energy and
Exploration Company for permission to
publish this paper. We also thank Debo
Adewusi, Philippe Lamant, Luke Twigger
and Roger Taylor of CGGveritas for their
contributions.
References
Oz Yilmaz, 2001, Seismic Data Analysis –
Volume 1 (SEG)
David Le Meur, et al, 2008, Adaptive
Ground-roll Filtering. 70th
EAGE,
expanded abstract.
Perkings, C. and Zwaan, M. Ground-roll
attenuation. 62nd
EAGE, Expanded
abstract, session L0021
Sheng Xu, Yu Zhang and Gilles Lambare.
2012. Antileakage Fourier transform for
Seismic data regularisation in higher
dimensions. Goephysics, Vol.75, No.6
(November-December 2012); P. WB113-
WB120.


