Embed Size (px)
Citation preview

Seismic risk perception in the aftermath of Wenchuanearthquakes in southwestern China
Alex Y. Lo
The Kadoorie Institute, University of Hong Kong, Hong Kong
Lewis T.O. Cheung
Department of Social Sciences, The Hong Kong Institute ofEducation, Tai Po, New Territories, Hong Kong
Citation:
Lo, A.Y. and L.T.O. Cheung (in press) Seismic risk perception in the aftermath ofWenchuan earthquakes in southwestern China, Natural Hazards. DOI:http://dx.doi.org/10.1007/s11069-015-1815-6
Publisher version available from authors: [email protected]
2

Abstract
Disruptive earthquakes hit Sichuan Province, China, in 2008. Thisarticle describes the earthquake risk perception of residents inthe most badly damaged area of Sichuan. Specifically, thisresearch explores the extent to which risk perception is relatedto a household’s socioeconomic characteristics and theirfinancial protection from natural hazards. A household survey wasconducted in a special administrative region of Wenchuan County.Residents strongly believe that major earthquakes are unlikely toreturn in the next decade, although potential impacts areexpected to be significant. The perceived likelihood and severityof future earthquake disasters increased with the intensity ofthe damage from past earthquakes, i.e., the most greatly affectedvictims tend to rate the risk higher. Income levels had anegative effect on the perceived earthquake likelihood. Moreover,many local residents did not appear to be financially preparedfor earthquakes. The degree of financial protection fromearthquakes had only modest impacts on risk perception. Theseresults provide mixed evidence for the hypothesis thatindividuals who are better prepared for hazards tend to perceiverelated risks lower than others. We call for further researchinto how rising incomes and the ability to secure disasterfinances affect community resilience to natural hazards.
Keywords: earthquake; risk perception; financial protection; income; community resilience; China
3

1.
2. Introduction
According to the International Disaster Database (2014), the top
ten most devastating earthquakes during 2005-2014 incurred an
economic damage of US$395 billion in total. Japan’s ‘3.11’
earthquake and tsunami in 2011 topped the list by causing
estimated damage of US$210 billion. The second and eighth most
damaging earthquake events, estimated at US$85 billion and US$6.8
billion, respectively, were recorded in China. Casualties and
property damage in these two catastrophic events were
concentrated in Sichuan Province, which is located in
southwestern China; the province had a Gross Domestic Product
(GDP) per capita of ¥29,608 Chinese RMB yuan, or US$4,775, in
2012 (National Bureau of Statistics, 2013).
Earthquakes occur within a very brief period of time.
Effective adaptive and coping efforts crucially rely upon the
extent to which necessary knowledge, resources, and competencies
are organized in advance and are used promptly and effectively
should the need arise (Paton et al., 2010). Arrangements for
post-disaster relief and catastrophe insurance are important for
accelerating economic recovery from major hazardous events
(Botzen, 2013; Lo, 2013). Not all countries or regions, however,
have set up effective mechanisms for providing timely financial
aid to earthquake victims (World Bank, 2010). Members of poor
agricultural communities, such as the remote counties and
4

villages in Sichuan, are particularly vulnerable (Sun et al.,
2010). Local governments and the public sector in these areas
struggle to increase their capital investments in seismic risk
mitigation due to budgetary constraints relative to other
priorities. Because of the shortage of governmental assistance,
households and communities exposed to seismic hazards must take
initiative in risk mitigation and preparation.
Hazard awareness is the most fundamental psychosocial
threshold that must be passed before members of a society can
adjust to impending shocks (Laska, 1990). Early research
suggested that residents of earthquake-prone areas had little
knowledge of the probability or potential damage from a future
disaster (Kunreuther and Slovic, 1978; Palm, 1990), and this
remains largely true in present-day communities (Armas, 2006;
Tian et al., 2014). The public might misperceive or ignore the
risk of earthquakes, which are low-probability events that are
not amenable to direct human control and that are difficult to
predict with high precision (Kung and Chen, 2012). Misperception
and myopic attitudes might result in delays or failures in taking
proper risk-mitigating actions ahead of time to reduce the
potential impacts of the hazard on households and communities.
Understanding how earthquake risks are perceived by the
public is an important first step for assessing a community’s
seismic vulnerability (Armas, 2006, 2008; Palm and Hodgson,
1992). However, few recent international research reports are
5

dedicated to the study of earthquake risk perception (Armas,
2006, 2008; Paton et al., 2010). Such knowledge is very limited
in China, despite the pressing need for public understanding of
seismic hazards to inform organizational practices. Only a
handful of scientific reports have been published in the
aftermath of the 2008 earthquake that devastated Sichuan (Tian et
al., 2014; Zhu et al., 2011). None of these studies were
conducted within the most badly damaged area, i.e., Wenchuan.
Closer investigation is needed to assess the ability of victims
and other residents to cope with future earthquakes and to
identify risk management options for protecting vulnerable groups
from the large-scale destruction of the economy.
This research explores how members of affected villages
perceive the risk of earthquakes in Sichuan’s Wenchuan County.
The general research objective is to determine the extent to
which earthquake risk perception is related to household
characteristics and financial preparedness for coping with
damaging natural catastrophes. We focus on socioeconomic factors
that influence responses, particularly those that may reduce the
perceived risk of hazards. The findings can help hazard managers
target population segments that are least predisposed to adopt
hazard adjustments and can help address perverse incentives for
deferring hazard adjustments.
Evidence was solicited from a household survey conducted in
Wenchuan, where the epicentre of the 2008 massive earthquake
6

measured 7.9 on the Richter scale. This article reports the
findings of this survey. The next section describes the study
area. The survey measures and sampling method are then
introduced. The collected data are analyzed and presented in the
following section. The conclusions section summarizes the
findings and the practical implications of the study.
2. Wenchuan and Recent Earthquakes
Wenchuan County is within the boundary of the Ngawa Tibetan and
Qiang Autonomous Prefecture, which is situated in the
northwestern part of Sichuan Province, People’s Republic of
China. With an area of 4,084 km2, the county was home to 98,780
people in 20111. Our study area is a special administrative
region located within Wenchuan County, i.e., the Wolong National
Nature Reserve. The reserve is 125 km from Chengdu, the
Province’s capital city, and is under the provincial government’s
direct control. The national protected area is best known for its
large giant panda population, conservation and research
facilities. The reserve has a resident population of 5,343, 85%
of whom engage in agriculture-related activities2.
Towns and villages in Wenchuan, including the Wolong
National Nature Reserve, were severely damaged by a catastrophic1 Wenchuan County Population and Family Planning Bureau’s official website. URL: http://www.wcxjsj.gov.cn. Accessed 13 September 2014.2 Wolong National Nature Reserve’s official website. URL: http://wl.forestry.gov.cn/business/htmlfiles/wl/bhqjj/index.html. Accessed 13 September 2014.
7

earthquake on 12 May 2008. Wenchuan County was the epicentre
(31.021°N 103.367°E) of the 7.9-magnitude earthquake. According
to a briefing released by the China Earthquake Administration
(2008), the earthquake occurred along the Longmenshan fault,
which is a thrust structure along the border of the Indo-
Australian Plate and Eurasian Plate; seismic activities were
concentrated near the mid-fracture. The rupture lasted nearly 2
minutes, while the majority of the energy was released within the
first 80 sec. The earthquake started in Wenchuan and propagated
at an average speed of 3.1 kilometres per second at 49° towards
the north-east. The fault was 300 km long. The maximum
displacement was estimated as 9 metres, and the focus was deeper
than 10 km.
According to the International Disaster Database (2014), the
‘5.12’ earthquake was the most destructive natural catastrophe in
China since 1976 and one of the largest earthquakes in human
history in terms of socio-economic losses. The economic damage
costs of this disaster event amounted to US$85 billion
(International Disaster Database, 2014). Swiss Re, a global
reinsurance company, reported a larger number: the total economic
losses were estimated at US$137 billion, whereas insured losses
were only US$0.4 billion (i.e., 0.3% insured) (Swiss Re, 2014).
Therefore, the economic damage created by the Wenchuan earthquake
accounted for 1.9% to 3.1% of China’s GDP in 2008: ¥30,067
billion Chinese yuan (National Bureau of Statistics, 2009) or
US$4,410 billion.
8

Massive casualties were the worst consequence. There were a
total of 87,449 deaths, 375,000 injured, 15 million people made
homeless, 5 million houses destroyed, and 18,500 collapsed
schools (Swiss Re, 2014). For comparison, Japan’s ‘3.11’
earthquake and tsunami in 2011 killed 18,520 individuals and
injured 5,893; 0.4 million people lost their homes. Although the
Japan earthquake was the world’s costliest seismic disaster
within ten years, approximately 16.7% of the total economic
damage was insured (Swiss Re, 2014). The Wenchuan earthquake was
relatively more destructive in terms of the number of casualties
and relative size of insured losses.
Within two years, Sichuan was hit by another major
earthquake (20 April 2013), known as the Lushan or Ya’an
earthquake. The Lushan earthquake was measured at a magnitude of
7.0, and the epicentre was located in Sichuan’s Lushan County,
which is approximately 156 km from Chengdu and only 85 km from
southwestern Wenchuan County. According to Swiss Re (2014), the
2013 earthquake resulted in less damage than the 2008 event: 214
deaths and 13,484 injuries. Nearly US$ 7 billion in economic
losses were recorded, but only 0.4% of these losses were insured.
Both the 2011 and 2013 earthquakes were considered economic
disasters. Enormous unrecoverable losses were incurred, and the
poor agricultural communities in Sichuan were further
impoverished. Sun et al. (2010) reported that the Wenchuan
earthquake more than doubled the poverty rate of 43 counties, and
9

farmers’ per capita net income in these areas decreased from
¥1,873 yuan (approx. US$305) at the end of 2007 to less than
¥1,000 yuan (approx. US$163) in the aftermath of the 2008
catastrophe. Both events suggest that China’s southwestern
population remains economically vulnerable to seismic hazards,
despite the rapid economic growth along the country’s eastern
coast. Enhancing the community’s economic resilience to
unavoidable natural hazards is imperative. More effective coping
strategies for the bulk of rural population are needed. This
endeavour could benefit from an assessment of public responses to
potential threats.
3. Research Hypotheses
This study sought to ascertain how earthquake risk perception is
related to the socio-demographic traits of individuals and to
their financial preparedness for coping with damaging natural
catastrophes. Three working hypotheses were developed to guide
the empirical study. The topics were 1) hazard experience, 2)
financial preparedness for hazards and 3) personal and household
characteristics. The rationale is explained below.
H1: Earthquake risk perception is a function of the personal and household
characteristics of individuals
10

Socio-demographic factors can explain variations in the
perceptions of natural hazards. Gender, for example, is a key
determinant; females generally tend to be more concerned about
environmental hazards, including earthquakes (Lindell and
Whitney, 2000; Kung and Chen, 2012; Armas, 2006). Older and less
educated individuals have greater concern of earthquakes than the
better educated and younger generations (Armas, 2006; Tian et
al., 2014). Personal or household income is negatively associated
with risk perception (Tian et al., 2014). Yet, review studies
show that the explanatory power of these variables changes for
hazard types and locations (Bubeck et al., 2012; Lindell and
Perry, 2000). There is mixed evidence for the ways in which
personal or household characteristics influence risk perception.
Further confirmatory research is needed (Lindell and Perry,
2000).
Apart from these standard socio-demographic variables, we
also explored the implications of several secondary factors for
risk perception. These factors pertain to occupation, source of
income, remittance, home ownership, and insurance, which are all
related to the economic capabilities of individuals and
households. Considering these attributes can help broaden our
understanding of the role of household economic resources in
reducing perceived environmental risks, which have clear
implications for (mal)adaptation to environmental change (Lo,
2014).
11

H2: Earthquake risk perception is positively associated with hazard experience (intensity
of damage)
Previous experience with related hazards is closely linked to
perceived earthquake risk, as supported by recent Chinese
studies, such as Zhu et al. (2011), Kung and Chen (2012) and Tian
et al. (2014). Victims severely impacted by past earthquakes may
strongly believe that the hazard is likely to return in future
and create significant losses. The usual assumption is therefore
a positive relationship between hazard experience and perceived
risk. However, Lindell and Perry (2000) have found mixed evidence
on the role of past experience with earthquakes. While the
frequency of encounters with natural hazards is logically related
to perceived risk, empirical evidence is far from conclusive (Lo,
2013; Tian et al., 2014). Bubeck et al. (2012) argue that an
important determinant of flood risk perception is the extent of
the experience with the negative consequences of flooding rather
than direct experience with flooding per se. Laska (1990) supports
this view. We therefore focused on the intensity of damage to
seek evidence on the effects of hazard experience.
H3: Earthquake risk perception is negatively associated with financial preparedness for
hazards
12
The second objective of this study is to assess the extent to
which Wolong residents are financially prepared for major
earthquakes and how the degree of preparedness varies with
perceived earthquake risk. Few studies are dedicated to exploring
the important linkage between financial preparation and risk
perception. Bubeck et al.’s report (2012) suggests that
households who have made effective financial arrangements for
coping with flooding tend to perceive flood risks as lower. A
person or household acquires flood insurance, for example,
because they believe that it can reduce the risks confronting
them by recovering insured losses of properties and assets.
Consequently, financially better prepared households tend to
perceive risks as lower, particularly in terms of consequences.
This finding may be explained in terms of ‘optimistic bias’,
which refers to the tendency of self-prepared individuals to
perceive the need for additional preparedness as lower than other
people (Helweg-Larsen, 1999; Paton and Johnston, 2001). A cross-
national study also notes that the sense of security and efficacy
has negative impacts on environmental risk perception (Lo, 2014).
We explored such a hypothesis by including a suite of questions
related to financial preparedness in a questionnaire, as
described in the next section.
4. Measures
13

A household survey was conducted in Wolong to address the three
hypotheses. We employed a structured questionnaire to record the
personal and household characteristics of Wolong residents, their
perception and experience with earthquakes, and their ability to
mitigate the resulting economic impacts. How these factors are
related to earthquake risk perception were statistically
analyzed. This section describes the relevant survey items and
questions included in the questionnaire.
The structure of the questionnaire followed a standard
design, beginning with items that are likely to be familiar to
the respondents. The first few questions probed hazard
experience. The questionnaire included a subjective assessment of
the intensity of damage by past earthquakes. The perceived
outcome severity was prompted by the question ‘How damaging was
the last major earthquake to you and your family?’ A five-point
scale, ranging from ‘No damage’ to ‘Extremely damaging’, was
presented to respondents.
This question was followed by two items about earthquake
risk perception, which was enlisted as the dependent variable in
a subsequent statistical analysis. In its simplest form, risk
perception denotes the perceived likelihood of an outcome that
affects what people value and the perceived severity of that
outcome (Renn, 2008). Kunreuther (1996) is convinced that if a
risk is perceived to be sufficiently high, then people would
behave in a way that can mitigate that risk. Advocates of the
14

psychometric paradigm, such as Slovic (1987, 2000), define risk
perception in terms of a range of attributes, including
dreadfulness, controllability, catastrophic potential, newness,
fatality, scientific certainty and distribution of consequences.
Critics argue that the psychometric scale does not fully
apply to perceptions of natural events, such as earthquakes,
because it is more fitting for studies of man-made hazards (Brun,
1992). Seminal work conducted by Lindell and Whitney (2000) also
defines risk perception primarily in terms of perceived
likelihood and impacts. Moreover, the focus of our study is
people’s expectation of the possible return of a disruptive
earthquake and its potential impacts on livelihoods, rather than
the various dimensions of risk perception per se. We therefore
adopted a basic two-dimensional structure for assessing seismic
risk perception, and we do not seek a broad representation of the
risk perception concept.
The questionnaire included two individual statements that
gauged the perceived likelihood and severity of earthquake risk.
The first question was “How likely is Wolong to experience a
magnitude 7 earthquake in the next ten years?” The responses were
recorded on a five-point Likert scale, with options ranging from
‘Very unlikely’ to ‘Very likely’. The second question was “How
much personal damage would another magnitude 7 earthquake cause?”
A different five-point scale was presented to respondents,
ranging from ‘No damage’ to ‘Extremely damaging’.
15

The financial preparedness variables appeared in the middle
of the questionnaire. These questions were generally presented in
terms of access to alternative sources of income or contingency
funds should earthquakes severely affect one’s livelihood. For
example, having multiple sources of income and forms of assets
could reduce the risk of losing the essential basis of livelihood
(Alinovi et al., 2009). Liquid assets require lower transaction
costs to sell; ownership of assets and the ability to liquidate
is particularly important for poor farmers when their income-
generating activities come to a halt during an extended drought
(Keil et al., 2008). Other related attributes include access to
credit (Le Dang et al., 2014), access to insurance (Bubeck et
al., 2012), and availability of remittances from family members
or friends (Adger et al., 2002). These capabilities or
opportunities can maintain the functioning of a household economy
in the aftermath of a disruptive disaster event and can prevent
the significant deterioration of people’s well-being. Finances
can strengthen the sense of security and efficacy but may weaken
the sense of caution towards natural hazards. The knowledge that
effective protection measures have been implemented might produce
perverse effects on the perceived severity of consequences
(Bubeck et al., 2012).
To examine this perspective, a nine-item scale was
constructed to measure the financial preparedness to disruptive
earthquakes. Based on the various studies cited above, notably
Alinovi et al. (2009) and Le Dang et al. (2014), the constructed
16

scale included various attributes, such as income diversity,
asset liquidity, access to loans, and remittance. Full
descriptions are listed in Section 5. Respondents were requested
to assess the statements on a five-point scale.
As a common practice, personal information, such gender,
age, and monthly income, was collected by the last batch of
survey questions to avoid non-response. Survey items for
secondary demographic variables, such as home ownership and
remittance, were distributed in different parts of the
questionnaire, mostly before or after relevant questions about
financial preparedness for hazards.
5. Data collection
The household survey was conducted in the main villages of Wolong
and Gengda in the Wolong National Nature Reserve between March
and May 2014 (Figure 1). These villages are located near (within
40 km) the epicentre of the 2008 Wenchuan earthquakes, and they
experienced significant losses during the event. Each of the
villages has approximately 80 – 100 households. Residents of six
villages within Wolong Town and Gengda Town were invited to
participate in face-to-face interviews based on the structured
questionnaire.
Six local undergraduate students were recruited as research
assistants. These student research assistants were fluent in the
17

local dialect and were trained in the procedure and etiquette of
face-to-face interviews. Each assistant was assigned to one
village and visited every household in that village while
accompanied by a local government officer from the Wolong Nature
Reserve Administration, which granted permission for the
interviews and offered logistical support. One member of each
household age 16 or older was invited to complete the
questionnaire in situ.
The survey was conducted on weekdays and weekends. Each
interview, on average, lasted 15 minutes. All interviewees
received a small gift as a token of appreciation after completing
the survey. A total of 425 local residents were approached and
invited to participate; 380 agreed to be interviewed. Only 371
individuals completed the interviews, yielding an effective
response rate of 89%.
The Wolong National Reserve Administration indicated that
the reserve currently has a population of nearly 5,500, of which
75% are ethnic minorities. We did not have access to accurate
household statistics that could help achieve demographic
representativeness of the sample due to the inherent difficulties
of obtaining socio-demographic census data in China. In contrast
to Western cities, detailed demographic data are not available
for Chinese counties; the data are aggregated to a broad scale,
challenging the generalization of survey findings (Byrne et al.,
forthcoming; Xie et al., 2014).
18
6. Results
The study is based on the 371 complete interviews. Data analysis
was performed by standard statistical software, e.g., SPSS. This
section describes the socio-economic characteristics and risk
perceptions of respondents and presents the results of our
analysis based on multiple regression.
6.1 Socioeconomic characteristics of respondents
As shown in Table 1, the average respondent was 41 years old and
had lived in Wolong for 36 years, suggesting that the majority of
respondents were native. Only 26 (7%) of the respondents did not
report their household income level (one outlier was excluded).
The average and median incomes were ¥1,578 (approx. US$255) and
¥1,000 (approx. US$161) Chinese yuan, respectively, which are
well below the provincial average of ¥2,467 (approx. US$398)
(National Bureau of Statistics, 2013).
More than half of the respondents were female (54.5%). Many
received elementary education only (43.1%), and some attended
middle school (32.5%), whereas less than 10% had a post-secondary
education. This suggests that opportunities for higher education
are limited in Wolong. The sample includes 252 (67.9%) ethnic
Tibetans and only 97 (26.1%) people of Han origin, which is the
19

dominant ethnic group in China. The study area is home to a
relatively large minority community.
Wolong is an agricultural community, and most of the local
residents are associated with the primary agriculture industry.
As many as 70.6% of our survey respondents identified themselves
as farmers, and only 38.8% received all or partial income from
non-agricultural sources. Few respondents (15.5%) received
remittance incomes from other family members. More than half
(60.6%) were homeowners, but only a handful (5.4%) had active
insurance policies on their residential properties.
6.2 Hazard experience and risk perception
A relatively large number of respondents recorded losses in
personal or household properties during major earthquakes in
Sichuan (Figure 2). The majority described the impacts as
extremely damaging (49.5%) and fairly damaging (31.5%). Few
reported no economic loss (3.8%) or minor damage (2.4%), while
the rest experienced mild impacts (12.8%). These results suggest
that most of the local residents interviewed were severely
affected by recent earthquakes, although the amount of the damage
varied.
Despite their personal experience with earthquakes, many
Wolong residents described the possibility of recurring magnitude
7 earthquakes as unlikely (Figure 3). More than half of the
20

respondents felt assured: 50.5% believed that a strong earthquake
was not likely to return, and 14.4% expressed an even stronger
view. Less than 5% acknowledged such a possibility, while 30.4%
admitted uncertainties in the repeat occurrence of a major
seismic disaster. The likelihood of another major earthquake in
the next ten years was generally perceived to be low.
However, if major earthquakes were to occur, most
respondents anticipated substantial impacts on their properties
and assets (Figure 4). The majority believed that it would be
extremely damaging (42.3%) or fairly damaging (36.9%). A small
proportion of respondents were very optimistic (0.8%), while
others anticipated minor damage (8.9%) or moderate damage
(11.1%). Overall, the severity of the next major earthquake was
perceived to be significant.
6.3 Financial preparedness for earthquakes
The self-assessment of the capacity for economically recovering
from disruptive earthquakes generated mixed results (Table 2).
Many Wolong residents (45.2%) were confident that they would be
able to return to work as usual immediately after a strong
earthquake. Notably, there was a modest degree of uncertainty in
their responses (15.6%).
While there was a fair degree of job continuity, diversity
of income and assets was rated low. Less than one-third of
21

respondents had alternative sources of income (29.3%) and assets
other than their current residential properties (25.1%), which
are typically primitive in structure and likely to suffer during
strong earthquakes. Fewer (13.2%) respondents claimed to be able
to easily liquidate their assets should a strong earthquake occur
and financial needs arise.
Commercial means for disaster recovery were limited to a few
respondents. One-third (33.1%) of the residents interviewed
suggested that they had access to insurance that would compensate
for part of their losses due to strong earthquakes. More than
half (54.2%) believed that they could secure finance from banks
or financial institutions for rebuilding their properties, assets
or businesses if these are severely affected by strong
earthquakes. Opportunities for disaster finance were just
emerging in these earthquake-prone communities.
There was greater confidence in the ability to solicit
contingency funds via social channels. More than half (55.8%)
trusted that the local community corporations or their work units
would offer finance for rebuilding properties, assets or
businesses in the aftermath of earthquakes. Most respondents
expected remittance incomes from out-of-town family members
(71.4%) or friends (61%) if their livelihood were to be severely
affected by earthquakes. Thus, local residents are more likely to
depend on socially organized financial assistance than commercial
solutions.
22

6.4 Regression analysis
To identify the determinants of risk perception, all of the
survey items discussed above were included in regression
modelling. The perceived likelihood and severity of earthquakes
were used as dependent variables. All other items were tested for
their predictive power against these perceptions. Dummy variables
were created for the categorical independent variables listed in
Table 1, namely, gender, education, ethnicity, occupation, off-
farm income, remittance, homeownership, and insurance. Ordinal
regression was performed using SPSS. The regression model
explained 13% of the variation in the perceived likelihood of
earthquakes (Table 3), while the other model accounted for 17% of
the variability in the perceived severity (Table 4). Tests of
parallel lines yielded a satisfactory Chi-square value in both
models (p > .05), suggesting that the proportional odds
assumption was not violated.
The perceived likelihood did not have strong relationship
with the socio-economic characteristics of the respondents (Table
3). Only the household income demonstrated significant negative
impacts, suggesting that wealthier households were less likely to
experience an impending disaster. A weak association was found
between the perceived severity and socio-economic variables
(Table 4). Males and those without off-farm income were less
likely to consider a future magnitude 7 earthquake as very
23

damaging. This result provides limited support for Hypothesis H1
listed in Section 3, i.e., Earthquake risk perception is a function of the
personal and household characteristics of individuals.
There was some supporting evidence for Hypothesis H2, i.e.,
Earthquake risk perception is positively associated with hazard experience (intensity of
damage). The reported intensity of damage from the last earthquake
increased with the perceived likelihood when other variables were
controlled for, although the magnitude of the effects was modest
(Table 3). The intensity of the damage, however, was strongly and
positively related to the perceived severity (Table 4).
Mixed evidence was found for Hypothesis H3, i.e., Earthquake risk
perception is negatively associated with financial preparedness for hazards. Three
financial preparedness variables indicated mixed effects on the
perceived likelihood (Table 3). Job continuity was negatively
associated with the perceived likelihood. Therefore, those
individuals who are able to return to work as usual after
earthquakes tended to perceive the likelihood of repeat major
earthquakes as low. Yet, asset liquidity and access to commercial
credit produced positive impacts. Those individuals who are able
to sell their assets for cash and secure finances were more aware
of a potential disruptive earthquake in the next 10 years. Access
to insurance and commercial credit had significant but opposite
impacts on the perceived disaster severity (Table 4). Holders of
insurance policies were less concerned about the catastrophic
consequences of a future magnitude 7 earthquake than non-policy
24
holders. In contrast, the ability to secure finance increased
with such concern.
7. Discussion
Results of the household survey indicate that most of the Wolong
residents interviewed reported some damage during the major
seismic events in 2008 and 2011. Although there was a strong
belief that magnitude 7 earthquakes were unlikely to return in
the next decade, the potential impacts of such large-scale
seismic hazards were expected to be disruptive. Similar to most
people, the local residents understood major earthquakes as low-
probability high-impact events.
Many Wolong residents did not appear to be financially well-
prepared for earthquakes or other natural hazards. Diversity of
income and assets and asset liquidity were reported to be low.
Some of the respondents might be able to secure disaster finance
from commercial sources, but many have greater access to
contingency funds via social channels. Consistent with the
literature on community resilience to environmental change
(Adger, 2000; Pelling, 2011), these results imply that social
capital is likely to be a main source of financial protection for
rural households, who typically do not have knowledge or
opportunities for arranging disaster finance, in contrast to
urban residents. This finding indicates the importance of
enhancing community resilience to natural hazards by
25

strengthening social ties and directing social dynamics towards
disaster preparation (Lo, 2013; Lo et al., 2012; Xie et al.,
2014).
This inquiry sought to identify factors that influence
earthquake risk perception. We found that the intensity of damage
from past earthquakes consistently predicted the perceived
likelihood and severity of future earthquake disasters, i.e., the
more greatly affected victims tended to rate the risk of
suffering from the same hazard as higher. This finding is logical
and is supported by numerous studies on hazards (Bubeck et al.,
2012; Jackson, 1981; Laska, 1990; Lo, 2013; Miceli et al., 2008;
Zhu et al., 2011). Contrary to Armas’s (2006, 2008) Romania
study, our results show that few socio-demographic variables had
significant impacts on risk perception, and these significant
observations were not consistently predictive across the two
constituent variables.
Nonetheless, the income effects are consistent across
scientific studies. In our research, the monthly income strongly
and negatively impacted the perception of the probability of
future earthquake disasters. Similar results have been reported
by other researchers, such as Lima et al. (2005), Le Dang et al.
(2014), Lo (2014) and Tian et al. (2014). To the extent in which
hazard adjustments are a function of perceived risk, these
results suggest that wealthier households are relatively more
likely to be less cautious of natural hazards because of a
26

(false) sense of security. This finding raises concerns regarding
economic development and adaptation to environmental change,
i.e., would wealth accumulation create perverse incentives for
deferring hazard adjustments? Further research should ascertain
how increasing incomes affect community resilience to natural
hazards.
A related hypothesis is the idea that potential financial
protection can reduce perceived risks (Bubeck et al., 2012; Lo,
2013). This claim has mixed support from our study, as most of
the model variables that represent financial preparedness did not
predict risk perception, and significant predictors did not have
the same signs. More research is needed to replicate such
‘optimistic bias’ in disaster preparation (Helweg-Larsen, 1999;
Paton and Johnston, 2001). We suggest introducing an
effectiveness dimension to construct survey statements. Dang et
al. (2014), for example, made a distinction between the ability
to gain access to credit and perceived usefulness of credit; the
authors showed that the latter had strong impacts on the
perception of adaptation efficacy. A similar approach that
recognizes subjective dimensions could provide more conclusive
evidence on the partially supported hypothesis. This step will be
important for understanding the implications of the increasing
abilities of households to secure disaster finance for community
resilience to natural hazards.
27

8. Conclusions
Major earthquakes hit Sichuan Province, China, in 2008 and 2011
and resulted in massive casualties and economic damage. The
objective of this article was to investigate how rural residents
of Sichuan Wolong perceive earthquake risk and how the perceived
risk is related to the household characteristics and financial
preparedness for coping with damaging natural catastrophes. We
found that many Wolong residents did not anticipate a premature
return of magnitude 7 earthquakes in the following decade but
were aware of the potential disruptive consequences of such
infrequent natural hazards. Personal and household
characteristics, except household income, were not significantly
related to earthquake risk perception. Moreover, hazard
experience influenced the perception of the likelihood and
severity of future earthquake disasters. Wolong residents
indicated a modest level of financial preparation for earthquakes
or other natural hazards. Financial preparedness had mixed
impacts on risk perceptions.
The results of the household survey have practical
implications for policy-making and disaster communication. More
information is needed to inform rural residents of the risks of
natural hazards, including but not limited to earthquakes. Risk
education requires a more complete understanding of how audiences
comprehend various dimensions of hazard risks. A limitation of
our study is the use of a primitive scale for risk perception,
28

which is defined in terms of perceived likelihood and severity.
Although the choice of the scale is supported by our research
objectives, the use of multi-attribute measures, such as the
psychometric approach adopted by Kung and Chen (2012) and Tian et
al. (2014), would have provided a conceptually more complete
analysis and a more solid basis for formulating risk education
strategies.
Additionally, social channels are important for enhancing
community resilience to natural hazards. Coordinating the
activities of rural community corporations or neighbourhood
associations is a way to strengthen social ties between community
members and promote community financing. Governments and aid
organizations should also help local communities set up micro-
finance schemes and inter-community insurance mechanisms (World
Bank, 2010). However, care should be taken when interpreting the
results because the measures of financial preparedness prompt
subjective opinions of respondents, which may not be completely
factual. There may be discrepancies between the actual
availability and respondents’ personal opinions of their access
to credit or their likelihood of receiving remittances. Including
objective measures in the questionnaire, such as estimated values
of liquid assets (Keil et al., 2008) or cash amounts (Alinovi et
al., 2009), may improve the validity of the results.
29

References:
Adger WN (2000) Social and ecological resilience: are they related?Progress in Human Geography 24:347-364.
Adger WN, Kelly PM, Winkels A, Huy LQ, Locke C (2002) Migration,Remittances, Livelihood Trajectories, and Social Resilience. AMBIO:A Journal of the Human Environment 31:358-366.
Alinovi L, Mane E, Romano D (2009) Measuring household resilience tofood insecurity: application to Palestinian households. EC-FAO FoodSecurity Programme: Linking Information and Decision Making toImprove Food.
Armas I (2006) Earthquake Risk Perception in Bucharest, Romania. RiskAnalysis 26:1223-1234.
Armas I (2008) Social vulnerability and seismic risk perception. Casestudy: the historic center of the Bucharest Municipality/Romania.Natural Hazards 47:397-410.
Botzen WJW (2013) Managing extreme climate change risks throughinsurance. Cambridge University Press, Cambridge, England.
Brun W (1992) Cognitive components in risk perception: Natural versusmanmade risks. Journal of Behavioral Decision Making 5:117–132.
Bubeck P, Botzen WJW, Aerts JCJH (2012) A Review of Risk Perceptionsand Other Factors that Influence Flood Mitigation Behavior. RiskAnalysis 32:1481-1495.
Byrne J, Lo AY, Yang J (forthcoming) Residents' understanding of therole of green infrastructure for climate change adaptation inHangzhou, China. Landscape and Urban Planning.
China Earthquake Administration (2008) An analysis of the causes ofthe Wenchuan magnitude 8.0 earthquake. Available fromhttp://www.cea.gov.cn/manage/html/8a8587881632fa5c0116674a018300cf/_content/08_05/30/1212119940937.html. Accessed 13 September 2014.(in Chinese).
Helweg-Larsen M (1999) (The Lack of) Optimistic Biases in Response tothe 1994 Northridge Earthquake: The Role of Personal Experience.Basic and Applied Social Psychology 21:119-129.
International Disaster Database (2014) EM-DAT: The OFDA/CREDInternational Disaster Database - Université Catholique de Louvain -Brussels – Belgium. Available from www.emdat.be/database. Accessed17 February 2015.
Jackson EL (1981) Response to Earthquake Hazard: The West Coast ofNorth America. Environment and Behavior 13:387-416.
Keil A, Zeller M, Wida A, Sanim B, Birner R (2008) What determinesfarmers’ resilience towards ENSO-related drought? An empirical
30

assessment in Central Sulawesi, Indonesia. Climatic Change 86:291-307.
Kung Y-W, Chen S-H (2012) Perception of Earthquake Risk in Taiwan:Effects of Gender and Past Earthquake Experience. Risk Analysis32:1535-1546.
Kunreuther H (1996) Mitigating disaster losses through insurance.Journal of Risk and Uncertainty 12:171-187.
Kunreuther H, Slovic P (1978) Economics, psychology, and protectivebehavior. American Economic Review 68:64-69.
Laska SB (1990) Homeowner Adaptation to Flooding: An Application ofthe General Hazards Coping Theory. Environment and Behavior 22:320-357.
Le Dang H, Li E, Nuberg I, Bruwer J (2014) Farmers’ assessments ofprivate adaptive measures to climate change and influential factors:a study in the Mekong Delta, Vietnam. Natural Hazards 71:385-401.
Lima ML, Barnett J, Vala J (2005) Risk Perception and TechnologicalDevelopment at a Societal Level. Risk Analysis 25:1229-1239.
Lindell MK, Whitney DJ (2000) Correlates of Household Seismic HazardAdjustment Adoption. Risk Analysis 20:13-25.
Lo AY (2013) The Role of Social Norms in Climate Adaptation: MediatingRisk Perception and Flood Insurance Purchase. Global EnvironmentalChange 23:1249–1257.
Lo AY (2014) Negative income effect on perception of long-termenvironmental risk. Ecological Economics 107:51-58.
Lo AY, Chow AT, Cheung SM (2012) Significance of Perceived SocialExpectation and Implications to Conservation Education: TurtleConservation as a Case Study. Environmental Management 50:900-913.
Miceli R, Sotgiu I, Settanni M (2008) Disaster preparedness andperception of flood risk: A study in an alpine valley in Italy.Journal of Environmental Psychology 28:164-173.
National Bureau of Statistics (2009) China Statistics Yearbook.National Bureau of Statistics, Beijing.
National Bureau of Statistics (2013) China Statistics Yearbook.National Bureau of Statistics, Beijing.
Palm R (1990) Natural Hazards: An Integrative Framework for Researchand Planning. Johns Hopkins University Press, Baltimore, MD.
Palm R, Hodgson M (1992) Earthquake Insurance: Mandated Disclosure andHomeowner Response in California. Annals of the Association ofAmerican Geographers 82:207-222.
Paton D, Bajek R, Okada N, McIvor D (2010) Predicting communityearthquake preparedness: a cross-cultural comparison of Japan andNew Zealand. Natural Hazards 54:765-781.
31

Paton D, Johnston D (2001) Disasters and communities: vulnerability,resilience and preparedness. Disaster Prevention and Management: AnInternational Journal 10:270-277.
Pelling M (2011) Adaptation to climate change : from resilience totransformation Routledge, Oxon, U.K.
Renn O (2008) Risk governance: coping with uncertainty in a complexworld. Earthscan, London.
Slovic P (1987) Perception of risk. Science 236:280-285.Slovic P (ed.): (2000) The perception of risk Earthscan, London.Sun M, Chen B, Ren J, Chang T (2010) Natural Disaster's Impact
Evaluation of Rural Households’ Vulnerability: The case of Wenchuanearthquake. Agriculture and Agricultural Science Procedia 1:52-61.
Swiss Re (2014) Sigma Explorer. Available at http://www.sigma-explorer.com/. Accessed 13 September 2014.
Tian L, Yao P, Jiang S-j (2014) Perception of earthquake risk: a studyof the earthquake insurance pilot area in China. Natural Hazards:1-17.
World Bank (2010) Natural Hazards, UnNatural Disasters: The Economicsof Effective Prevention. World Bank, Washington D.C.
Xie XL, Lo AY, Zheng Y, Pan J, Luo J (2014) Generic security concerninfluencing individual response to natural hazards: evidence fromShanghai, China. Area 46:194-202.
Zhu D, Xie X, Gan Y (2011) Information source and valence: Howinformation credibility influences earthquake risk perception.Journal of Environmental Psychology 31:129-136.
32

Table 1 Socioeconomic characteristics of respondents (N = 371)
Socioeconomic variable (continuous)
Measure ValueAge Average 41 yearsYears of residence Average 36 years
Monthly household income (ChineseRMB yuan)
Average ¥1,5781 U.S. dollar / Chinese Yuan = 6.2 (March 2014)
Median ¥1,000
Socioeconomic variable (categorical)
Category Frequency(%)Gender Male 45.5
Female 54.5Education attainment Primary or below 43.1
Junior middleschool
32.5Middle school 15.2Post-secondary
diploma7.3
Universitydegree
1.9
Ethnicity Han 26.1Tibetan 67.9
Other minorities 5.4Primary occupation Farmer 70.6
Otherwise 29.4
Off-farm income Yes 38.8Otherwise 61.2
Received remittance during last 12 months
Yes 15.5Otherwise 84.5
Homeowner Yes 60.6Otherwise 39.4
Home insurance cover Yes 5.4Otherwise 94.6
33

Figure 2 Percentage of respondents by intensity of damage fromthe last earthquake
No damage 3.8%Minor damage 2.4%
Some damage 12.8%
Fairly damaging 31.5%
Extremely damaging 49.5%
How damaging was the last major earthquake to you and
your family?
34

Figure 3 Percentage of respondents by perceived likelihood of magnitude 7 earthquake in Wolong
Very unlikely 14.4%
Not quite possible 50.5%
Maybe 30.4%
Possible 1.9%Very likely 2.7%
How likely is Wolong to experience a magnitude 7 earthquake in the
next ten years?
35

No damage 0.8% Minor damage 8.9%Some damage
11.1%
Fairly damaging 36.9%
Extremely damaging 42.3%
How much personal damage would another magnitude 7 earthquake
cause?
Figure 4 Percentage of respondents by perceived severity of damage from the next magnitude 7 earthquake in Wolong
36

Table 2 Self-assessed household financial preparedness forearthquakes
Variable Survey statement
No /Notmany(1/2)^
Neutral /fair(3)
Yes /
Many(4/5)#
Mean(1-5)
S.D.
(%)Job continuity
Are you able to quickly return to work as usual after a strong earthquake?
38.2 15.6 45.2 3.08 1.26
Income diversity
Do you or your family have alternative sources of income that are unlikely to be affected by strong earthquakes
61.2 8.9 29.3 2.31 1.32
Asset diversity
Do you or your family own any form of asset other than your house?
67.9 6.7 25.1 2.03 1.28
Asset liquidity
Are you able to easily liquidate your assets after a strong earthquake
77.3 8.1 13.2 2.01 1.02
Access toinsurance
Are you able to get commercial insurance that covers part of your potential losses due to strong earthquakes?
55.8 10.8 33.1 2.67 1.22
Access tocredit (commercial)
Are you able to get low-interest loans from banks or financial institutions for rebuilding your properties, assets or businesses ifthese are severely affected by consequences of strong earthquakes?
34.8 10.5 54.2 3.28 1.21
Access tocredit (social)
Would your community corporates or work units offer you loans upon your request, if your livelihood isseverely affected by the consequences of earthquakes?
28.3 15.1 55.8 3.29 1.15
Remittance (family)
Would your family members living outside the town send you money (remittance), if your livelihood isseverely affected by the consequences of earthquakes?
20.0 7.3 71.4 3.86 1.22
Remittanc Would your friends send you 29.1 9.2 61.0 3.48 1.2
37

e (friends)
(remittance), if your livelihood isseverely affected by the consequences of earthquakes?
3
^ negative options include ‘Definitely not / Not at all’ (1) and ‘Probablynot / Not many’ (2). #positive options include ‘Probably / Some’ (4)and ‘Definitely / Many’ (5). Percentages may not add to 100% becauseof missing values. The higher the scores, the greater the financialpreparedness of the households.
38

Table 3 Ordinal regression for the perceived likelihood of having a magnitude 7 earthquake in Wolong in the next ten years
Variable Coefficients
Std.Error
95% ConfidenceIntervalLower Upper
Socio-economic characteristicsMale -.132 .227 -.576 .313Age -.005 .014 -.032 .022Years of residence -.011 .011 -.032 .011Monthly income -.194 *** .074 -.338 -.049Education -.013 .135 -.278 .253Ethnic Tibetan -.298 .251 -.790 .194Farmer .225 .269 -.303 .753Off-farm income -.219 .234 -.679 .240Received remittance during last 12 months
-.361 .305 -.959 .238
Home owner .337 .242 -.137 .811Home insurance cover -.562 .478 -1.499 .374Intensity of damage from last earthquake
.190 * .112 -.030 .410
Financial preparedness
Job continuity -.208 ** .093 -.390 -.025Income diversity .111 .089 -.065 .286Asset diversity -.032 .091 -.209 .146Asset liquidity .268 ** .115 .041 .494Access to insurance -.019 .099 -.213 .175Access to credit (commercial)
.250 ** .105 .045 .456Access to credit (social) -.079 .107 -.288 .131Remittance (family) .079 .107 -.130 .288Remittance (friends) .007 .106 -.200 .215Pseudo R2 0.13-2 log likelihood 701.589Chi-square 39.151Sig. p < .05N 319
39
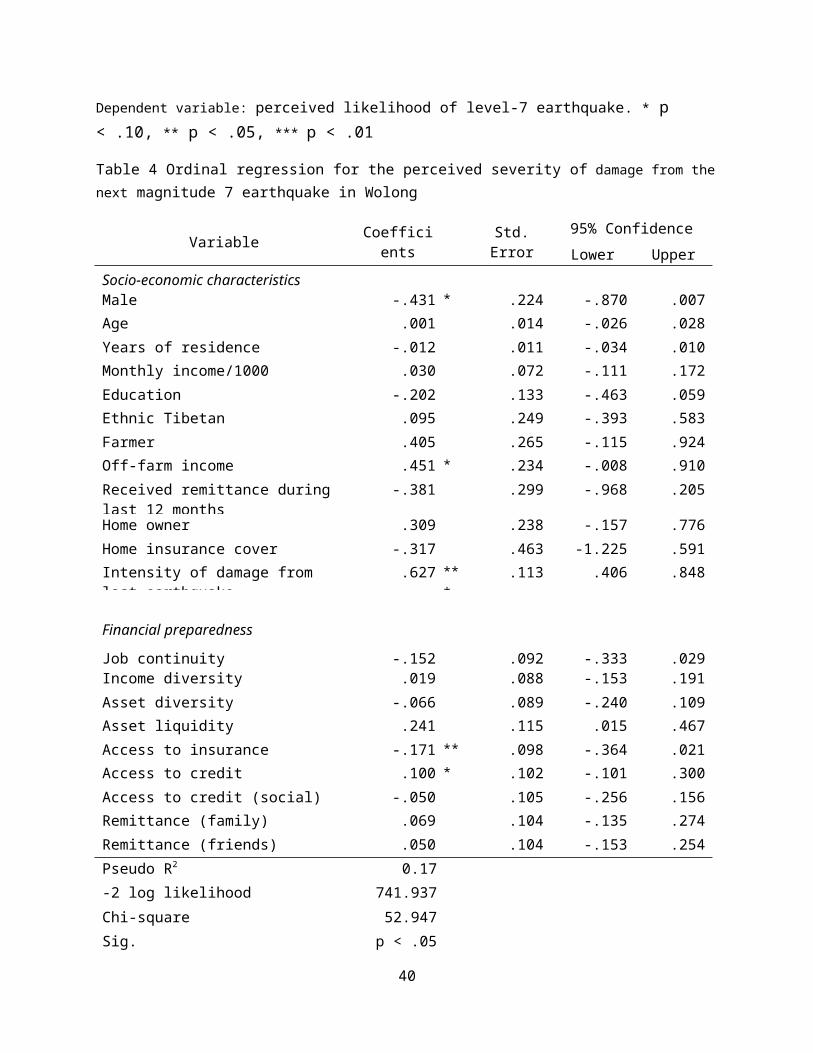
Dependent variable: perceived likelihood of level-7 earthquake. * p < .10, ** p < .05, *** p < .01
Table 4 Ordinal regression for the perceived severity of damage from thenext magnitude 7 earthquake in Wolong
Variable Coefficients
Std.Error
95% ConfidenceIntervalLower Upper
Socio-economic characteristicsMale -.431 * .224 -.870 .007Age .001 .014 -.026 .028Years of residence -.012 .011 -.034 .010Monthly income/1000 .030 .072 -.111 .172Education -.202 .133 -.463 .059Ethnic Tibetan .095 .249 -.393 .583Farmer .405 .265 -.115 .924Off-farm income .451 * .234 -.008 .910Received remittance during last 12 months
-.381 .299 -.968 .205
Home owner .309 .238 -.157 .776Home insurance cover -.317 .463 -1.225 .591Intensity of damage from last earthquake
.627 ***
.113 .406 .848
Financial preparedness
Job continuity -.152 .092 -.333 .029Income diversity .019 .088 -.153 .191Asset diversity -.066 .089 -.240 .109Asset liquidity .241 .115 .015 .467Access to insurance -.171 ** .098 -.364 .021Access to credit (commercial)
.100 * .102 -.101 .300Access to credit (social) -.050 .105 -.256 .156Remittance (family) .069 .104 -.135 .274Remittance (friends) .050 .104 -.153 .254Pseudo R2 0.17-2 log likelihood 741.937Chi-square 52.947Sig. p < .05
40

N 320Dependent variable: perceived severity of damage from the next level-7 earthquake. * p < .10, ** p < .05, *** p < .01
41


