Embed Size (px)
Citation preview
Selected Aspects of Biodegradation Testing
of Pharmaceuticals Including Development
of a New Biodegradation Test
Der Fakültat Nachhaltigkeit Kumulative Dissertationsschrift zur Erlangung des akademischen
Grades
Doktor der Naturwissenschaften
(Dr. rer. nat.)
Angefertigt am Institut für Nachhaltige Chemie und Umweltchemie
Leuphana Universität Lüneburg
Vorgelegte Dissertation von
Ewelina Baginska
Geb.16. November 1986 in Bielsk Podlaski, Polen
Eingereicht am: 12.06.2017
Betreuer und Erstgutachter: Prof. Dr. Klaus Kümmerer
Zweitgutachter: Dr. Michael Radke
Drittgutachter: Prof. Dr. Daniel Pleissner
Tag der Disputation: 23.01.2018
Die einzelnen Beiträge des kumulativen Dissertationsvorhabens sind oder werden wie folgt in
Zeitschriften veröffentlicht:
I. Haddad, T., Baginska, E., Kümmerer, K., Transformation products of antibiotic and
cytostatic drugs in the aquatic cycle that result from effluent treatment and abiotic/biotic
reactions in the environment: An increasing challenge calling for higher emphasis on
measures at the beginning of the pipe. Water Research 2015; 72:75–126.
doi: 10.1016/j.watres.2014.12.042
II. Lutterbeck, C. A., Baginska, E., Machado. Ê. L., Kümmerer, K., Removal of the anti-
cancer drug methotrexate from water by advanced oxidation processes: Aerobic
biodegradation and toxicity studies after treatment. Chemosphere 2015; 141:290–6.
doi: 10.1016/j.chemosphere.2015.07.069
III. Lutterbeck, C. A., Wilde M. L., Baginska, E., Leder C., Machado. Ê. L., Kümmerer, K.,
Degradation of cyclophosphamide and 5-fluorouracil by UV and simulated sunlight
treatments: Assessment of the enhancement of the biodegradability and toxicity.
Environmental Pollution 2016; 208:467–76. doi: 10.1016/j.envpol.2015.10.016
IV. Lutterbeck, C. A., Wilde M. L., Baginska, E., Leder C., Machado. Ê. L., Kümmerer, K.
Degradation of 5-FU by means of advanced (photo)oxidation processes: UV/H2O2,
UV/Fe2+/H2O2 and UV/TiO2 – Comparison of transformation products, ready
biodegradability and toxicity. Science of The Total Environment 2015; 527–528:232–45.
doi: 10.1016/j.scitotenv.2015.04.111
V. Baginska, E., Haiß, A., Kümmerer, K., Biodegradation screening of chemicals in an
artificial matrix simulating the water–sediment interface. Chemosphere 2015;119: 1240–
6. doi: 10.1016/j.chemosphere.2014.09.103
VI. Gutowski, L., Baginska, E., Olsson, O., Leder, C., Kümmerer, K., Assessing the
environmental fate of S-metolachlor, its commercial product Mercantor Gold® and their
photoproducts using a water–sediment test and in silico methods. Chemosphere 2015;
138:847–855. doi:10.1016/j.chemosphere.2015.08.013.
Nachdruck am Ende dieser Arbeit mit freundlicher Genehmigung der Elsevier B.V.
Selected Aspects of Biodegradation Testing
of Pharmaceuticals Including Development
of a New Biodegradation Test
This cumulative thesis and the publications listed on the following page are submitted to the
Faculty of Sustainability of Leuphana University Lüneburg to earn the academic degree of
Doctor of Natural Science (Dr. rer. nat.)
Carried out at the Institute of Sustainable and Environmental Chemistry
Leuphana University of Lüneburg
Dissertation submitted by
Ewelina Baginska
Born on November 16, 1986 in Bielsk Podlaski, Poland
Submitted on: 12.06.2017
Doctoral advisor and first reviewer: Prof. Dr. Klaus Kümmerer
Second reviewer: Dr. Michael Radke
Third reviewer: Prof. Dr. Daniel Pleissner
Date of disputation: 23.01.2018
The individual articles constituting this cumulative doctoral dissertation meet the formal
requirements for a cumulative dissertation. The PhD thesis consists of the following
publications:
I. Haddad, T., Baginska, E., Kümmerer, K., Transformation products of antibiotic and
cytostatic drugs in the aquatic cycle that result from effluent treatment and abiotic/biotic
reactions in the environment: An increasing challenge calling for higher emphasis on
measures at the beginning of the pipe. Water Research 2015; 72:75–126.
doi: 10.1016/j.watres.2014.12.042
II. Lutterbeck, C. A., Baginska, E., Machado. Ê. L., Kümmerer, K., Removal of the anti-
cancer drug methotrexate from water by advanced oxidation processes: Aerobic
biodegradation and toxicity studies after treatment. Chemosphere 2015; 141:290–6.
doi: 10.1016/j.chemosphere.2015.07.069
III. Lutterbeck, C. A., Wilde M. L., Baginska, E., Leder C., Machado. Ê. L., Kümmerer, K.,
Degradation of cyclophosphamide and 5-fluorouracil by UV and simulated sunlight
treatments: Assessment of the enhancement of the biodegradability and toxicity.
Environmental Pollution 2016; 208:467–76. doi: 10.1016/j.envpol.2015.10.016
IV. Lutterbeck, C. A., Wilde M. L., Baginska, E., Leder C., Machado. Ê. L., Kümmerer, K.
Degradation of 5-FU by means of advanced (photo)oxidation processes: UV/H2O2,
UV/Fe2+/H2O2 and UV/TiO2 – Comparison of transformation products, ready
biodegradability and toxicity. Science of The Total Environment 2015; 527-528:232–45.
doi: 10.1016/j.scitotenv.2015.04.111
V. Baginska, E., Haiß, A., Kümmerer, K., Biodegradation screening of chemicals in an
artificial matrix simulating the water–sediment interface. Chemosphere 2015; 119:1240–
6. doi: 10.1016/j.chemosphere.2014.09.103
VI. Gutowski, L., Baginska, E., Olsson, O., Leder, C., Kümmerer, K., Assessing the
environmental fate of S-metolachlor, its commercial product Mercantor Gold® and their
photoproducts using a water–sediment test and in silico methods. Chemosphere 2015;
138:847–855. doi:10.1016/j.chemosphere.2015.08.013.
Reprinted at the end of this thesis with the permission of Science of Elsevier B.V.
I
Acknowledgments
First and foremost I would like thank to Prof. Dr. rer. nat. Klaus Kümmerer for giving me the
opportunity to work in his great team and all the support, advice, motivation, sharing with his
knowledge and experience, and help during my whole PhD studies.
I owe my deepest gratitude to Annette Haiβ for supporting and guidance through scientific
problems, lively discussions and constructive feedback. Her positive thinking and life energy
could always put me on a right track and not to give up.
I submit my highest appreciation to all the co-authors who had contributed to this PhD project
as their contributions, guidance and support was vital for the success of this thesis.
I would also like to thank the whole working group of the Institute of Sustainable and
Environmental Chemistry at the Leuphana University for their support and being always
helpful. I would like to personally thank (in alphabetical order) Anju, Annette, Carlos,
Christoph, Evgenia, Franziska, Jakob, Janin, Kham Dieu, Karen, Lukasz, Mandy, Manuel,
Marco, Marcelo, Matthias, Nareman, Natalie, Oliver, Philipp, Richard, Samuel, Stefanie,
Tarek, Tushar, and Waleed. Furthermore, I would like to thank Dagmar Schuchardt for her
assistance during my adventure of having laboratory classes with students. I would also like to
express my thanks to the Institute of Ecology group at Leuphana University for assistance
with sediment sample analysis and permit to use some of their equipment.
Last but not least I would like to thank my family; my parents Ewa and Roman, and my
brothers Damian and Wojciech. Dziekuję wam Rodzice za to, że daliście mi życie. Damian
i Wojtek wiem, że mnie kochacie, i ja was kocham.

II
Dedication
I would like to dedicate this Thesis to my Brother
Wojtek
Mój Duduś, moje serce
III
Table of contents
Acknowledgments ................................................................................................................... I
Dedication .............................................................................................................................. II
Table of contents .................................................................................................................. III
List of figures ......................................................................................................................... V
List of symbols and abbreviations ........................................................................................ VI
Summary .............................................................................................................................. VII
Zussamenfassung ................................................................................................................... X
1. Introduction and motivation ............................................................................................ 1
1.1. Biodegradability Testing ............................................................................................. 1
1.2. Pharmaceuticals in the Environment ........................................................................... 2
2. Aims and objectives ........................................................................................................ 4
3. Research approach ........................................................................................................... 5
4. Results and discussion ..................................................................................................... 8
5. Concluding remarks and outlook .................................................................................. 16
References ............................................................................................................................ 19
Curriculum vitae ................................................................................................................... 25
Publication list and scientific conference contribution ......................................................... 29
Declaration ............................................................................................................................ 31
Appendices ........................................................................................................................... 33
Article I: Transformation products of antibiotic and cytostatic drugs in the aquatic
cycle that result from effluent treatment and abiotic/biotic reactions in the environment: An
increasing challenge calling for higher emphasis on measures at the beginning of the pipe.
Article II: Removal of the anti-cancer drug methotrexate from water by advanced
oxidation processes: Aerobic biodegradation and toxicity studies after treatment.
Article III: Degradation of cyclophosphamide and 5-fluorouracil by UV and
simulated sunlight treatments: Assessment of the enhancement of the biodegradability and
toxicity.
Article IV: Degradation of 5-FU by means of advanced (photo)oxidation processes:
UV/H2O2, UV/Fe2+/H2O2 and UV/TiO2 – Comparison of transformation products, ready
biodegradability and toxicity
IV
Article V: Biodegradation screening of chemicals in an artificial matrix simulating
the water–sediment interface.
Article VI: Assessing the environmental fate of S-metolachlor, its commercial
product Mercantor Gold® and their photoproducts using a water–sediment test and in silico
methods.

V
List of figures
Figure 1: Experimental design of TPs analysis (article II, III, IV). ........................................... 6
VI
List of symbols and abbreviations
5-FU 5-fluorouracil
ACN acetonitril
AOP Advanced oxidation process
BOD Biological oxygen demand
CAS-RN Chemical abstracts registry number
CBT Closed bottle test
CFU Colony forming unit
CIP Ciprofloxacin
CYC Cyclophosphamide
DEG Diethyleneglycol
FDA Fluorescence detector
HPLC High performance liquid chromatography
IR Infrared spectroscopy
ISO International Standard Organization
LC-MS Liquid chromatography mass spectrometry
MTX Methotrexate
NMR Nuclear Magnetic Resonance
NPOC Non-purchable organic carbon
OECD Organization of Economic Cooperation and Development
QSAR Quantitative Structure Activity Relationship
STP Sewage treatment plant
ThOD Theoretical oxygen demand
TP Transformation product
UV Ultraviolet
WST Water sediment test
WWTP Wastewater treatment plant
VII
Summary
Among all attenuation processes, biodegradation plays one of the most important role and is
one of the most desirable processes in the environment especially since products released
during this bio-reactions, can be once again reintroduced into the natural element cycles. To
assess biodegradation, a variety of biodegradation test procedures have been developed by
several international organizations. OECD guidelines for ready biodegradability testing
represent one of the most prominent group of internationally used screening biodegradation
tests (series 301A-F). These tests are usually very simple in their designs and allow for the
fast and cheap screening of biodegradability. However, because of their stringency, the test
conditions are not close to simulating environmental conditions and may lead to unrealistic
results. To overcome these limitations, OECD introduced simulation tests which are designed
to investigate the behavior of chemicals in specified environmentally relevant compartments.
Despite the fact that simulation tests give more insight into the fate of chemicals in the
environment, they are not applied frequently as they are often tedious, time consuming and
expensive. Consequently, there is a need to provide a new biodegradation testing method that
would combine complex testing environment as in simulation tests, easiness in handling and
good data repeatability as in screening biodegradation tests. Another challenge is an adaption
of the existing biodegradation testing methods to new types of samples, i.e. mixtures of
transformation products (TPs).
The research on the presence of pharmaceuticals in the environment gained momentum in the
1990s; since then, it has been growing. Their presence in the environment is a
well-established fact. A wide range of pharmaceuticals is continuously detected in many
environmental compartments such as surface waters, soils, sediments, or ground waters. After
pharmaceuticals reach the natural aquatic environment they may undergo a number of
processes such as: photolysis (under direct sunlight), hydrolysis, oxidation and reduction
reactions, sorption, biodegradation (by bacteria of fungi), and bioaccumulation. These
processes, may cause their elimination from aquatic environment, if reaction is complete, or
creation of new compounds i.e., transformation products (TPs). What is more, processes, like
chlorination and advanced oxidation processes (AOPs), such as H2O2/UV, O3/UV, TiO2/UV,
Fenton, and photo-Fenton, or UV treatment which might be applied in water or wastewater
treatment, may also lead to the TPs introduction into aquatic environment. The research on
the TPs brings many new challenges. From one side, there is a constant need for the
development of a sensitive and reliable analytical separation, detection, and structure
VIII
elucidation methods. Furthermore, there is a need for the preparation of appropriate assays for
the investigation of properties of new compounds, especially those answering the question if
TPs pose a higher risk to the aquatic ecosystems than their parent compounds. Among
numerous groups of pharmaceuticals, two are of great importance: antibiotics since they
might promote emergence and maintenance of antimicrobial resistance in the aquatic
environment; and cytostatic drugs. Cytostatic drugs can exert carcinogenic, mutagenic and/or
teratogenic effects in animals and humans.
The challenges of biodegradation testing presented in this thesis, encompasses these different
areas of interest and was divided into three objectives: 1) Identification of the knowledge gaps
and data distribution of the two groups of pharmaceuticals antibiotics and cytostatic drugs
(article I); 2) Increasing the knowledge on biodegradation of cytostatic drugs and their TPs
(articles II, III, and IV) and 3) Establishment of a biodegradation test with closer to simulation
tests conditions, that could be affordable and to support better understanding on processes in
water sediment interface construction – screening water-sediment test. Further validation of
the test with an insight into sorption and desorption processes (articles V and VI).
Article I focuses on the identification of the knowledge gaps and data distribution of the two
groups of pharmaceuticals antibiotics and cytostatic drugs. A literature research was
conducted on data about parent compounds and TPs that has been published. The 21 selected
antibiotics and cytostatic drugs were investigated. Information available on TPs demonstrates
that already a slight change in treatment conditions and processes results in the formation of
different TPs. This in turn makes it, on the one hand, difficult to select the right conditions for
effluent treatment, and on the other hand it presents a big challenge for the identification and
assessment of TPs. What is more, there is a severe risk of drowning in much unrelated and
non-assessable data, both from a scientific and from a technical treatment-related point of
view. Therefore, from a practical and sustainability point of view, limiting the input of
pharmaceuticals and their TPs as well as improving their (bio) degradability and elimination
behavior during the optimization stages of drug design, i.e. "benign by design", is urgently
needed. Solutions focusing on this "beginning of the pipe" approach should minimize the
adverse effects of parent compounds and their TPs by ultimately reducing their entrance into
the natural environment
Articles II, III and IV address the issue of increasing the knowledge on biodegradation of
cytostatic drugs and their TPs. Biodegradation testing was conducted according to OECD
301D guideline (Closed Bottle Test) and toxicity evaluation assays using the luminescent
IX
bacteria Vibrio fischeri. Samples with TPs were tested for biodegradation and toxicity when
during the photodegradation studies (UV-Lamp, Xenon Lamp, UV/H2O2, UV/Fe2+/H2O2, and
UV/TiO2), observed mineralization was <70%. The experimental data from the presented
study confirms that not all of photodegradation treatments are able to completely remove
cytostatic drugs. What is more, it is difficult to predict, what properties formed TPs would
have, and what would be the influence on environment once released.
Articles V and VI are about establishment of a biodegradation test with closer simulation
tests conditions, that could be affordable and to support better understanding on processes in
water-sediment interface construction – screening water-sediment test (WST). The WST
provides testing conditions (presence of water-sediment interface) that are more complex than
those in standardized screening tests, where only biodegradation performed by bacteria
suspended in the water phase is taken into account. An indirect method for the evaluation of
compound mineralization, adopted from biodegradation screening tests, makes WST less
laborious than standardized simulation OECD tests where analytical methods validated for
each compound and radiolabelling are required. The limitation for application of the WST test
is the toxicity against inoculum of the tested compound. However, the inclusion of a ‘toxicity
control’ allows excluding false negative results. The WST is also not suited for volatile and
low water soluble compounds. Further advantages of WST (article VI) were achieved by
integration of a ‘sterile control’ into the test system. This, together with screening the water
phase for the test substances e.g., by HPLC, gives a good indication of possible sorption and
other non-biotic processes of the tested compounds. Consequently, the WST can be a good
starting point for further investigations of sorption and desorption in different sediment
compartments. WST can be applied for the first screening of the substance behavior in water-
sediment interface and is a good starting point providing the information that allows planning
the direction of further research especially in combination with in silico tools.
X
Zussamenfassung
Der biologische Abbau von organischen Substanzen spielt eine bedeutende Rolle und ist einer
der erstrebenswertesten Prozesse in der Umwelt, vor allem, da die bei diesen Bio-Reaktionen
freigesetzten Produkte insbesondere bei vollständiger Mineralisierung wieder in die
natürlichen Elementzyklen reassimiliert werden können. Um die biologische Abbaubarkeit zu
prüfen, wurde eine Vielzahl von biologischen Testverfahren von mehreren internationalen
Organisationen entwickelt. OECD-Prüfrichtlinien für die biologische Abbaubarkeitsprüfung
stellen eine der bekanntesten Gruppe von international eingesetzten biologischen Abbautests
dar (301A-F). Diese Tests sind in der Regel sehr einfach in ihren Designs und ermöglichen
das schnelle und kostengünstige Screening der biologischen Abbaubarkeit. Aufgrund ihrer
Stringenz entsprechen die Testbedingungen nicht der Realität von Umgebungsbedingungen
und können zu unvollkommenen, fehlerhaften (unrealistischen) Ergebnissen führen. Um diese
Einschränkungen zu überwinden, führte die OECD Simulationstests ein, die das Verhalten
von Chemikalien in bestimmten umweltrelevanten Kompartimenten untersuchen sollen. Trotz
der Tatsache, dass Simulationstests mehr Einblicke in das Verhalten von Chemikalien in der
Umwelt geben, werden sie nicht häufig angewendet, da sie oft langwierig, zeitaufwändig und
teuer sind. Folglich besteht die Notwendigkeit, ein neues biologisches Testverfahren
bereitzustellen, das komplexe Testumgebungen, wie bei Simulationstests, mit der Einfachheit
in der Handhabung und der guten Datenwiederholbarkeit kombiniert, wie es bei
Screeningtests für biologische Abbauarbeit gegeben ist. Eine weitere Herausforderung istdie
Anpassung der bestehenden biologischen Abbauprüfmethoden an neue Probenarten, d.h.
Mischungen von Transformationsprodukten (TPs) und die Bereitstellung neuer effizienterer
Methoden.
Die Forschung über das Vorkommen von Arzneimitteln in der Umwelt hat seit den 1990er
Jahren eine zunehmende Dynamik. Ihre Präsenz in der Umwelt ist eine allgemein anerkannte
Tatsache. In vielen Umweltkompartimenten wie Oberflächengewässern, Böden, Sedimenten
oder Grundwässern wird kontinuierlich eine breite Palette von Arzneimitteln nachgewiesen.
Nachdem Arzneimittel die natürliche aquatische Umwelt erreichen, können sie eine Reihe
von Prozessen wie Photolyse (unter direktem Sonnenlicht), Hydrolyse, Oxidations- und
Reduktionsreaktionen, Sorption, biologischer Abbau (durch Mikroorganismen) und
Bioakkumulation durchlaufen. Diese Prozesse können die vollständige Eliminierung von
Chemikalien und Arzneimitteln aus der aquatischen Umgebung bewerkstelligen, aber auch zu
neuen Verbindungen wie TPsführen. Darüber hinaus können durch Chlorierung und
XI
fortgeschrittene Oxidationsprozesse wie Behandlung mit H2O2/UV, O3/UV, TiO2/UV, die
Fenton- und Photo-Fentonreaktion oder UV-Bestrahlung, die in der Wasser- oder
Abwasserbehandlung angewendet werden, TPs entstehen, die wiederrum in die aquatische
Umwelt gelangen. Die Herausforderungen in der Forschung bezüglich dieser TPs sind nicht
nur die Entwicklung empfindlicher und zuverlässiger analytischer Nachweis- und
Strukturaufklärungsmethoden, sondern auch die Etablierung geeigneter Assays für die
Untersuchung der Eigenschaften dieser neuen Verbindungen. Es stellt sichvor allem die
Frage, ob die TPs ein höheres Risiko darstellen als die Muttersubstanzen (Ausgangsprodukte).
Unter zahlreichen Gruppen von Arzneimitteln scheinen zwei von großer Bedeutung zu sein:
Antibiotika, da sie die Entstehung und Erhaltung der antimikrobiellen Resistenz in der
aquatischen Umwelt fördern können sowie Zytostatika, welche karzinogene, mutagene und /
oder teratogene Effekte bei Versuchstieren und Menschen haben.
Die Anforderungen der in dieser Arbeit vorgestellten biologischen Abbauprüfungen umfassen
verschiedene Bereiche. Dementsprechend hatte die vorgelegte Arbeit drei Ziele: 1)
Ermittlung der Wissenslücken zu Antibiotika und Zytostatika (Artikel I), 2) Erforschung des
biologischen Abbaus von Zytostatika und deren TPs (Artikel II, III und IV) und 3)
Etablierung eines biologischen Abbautestverfahrens mit Annäherung an reale Bedingungen,
das eine kostengünstige Alternative darstellt und ein besseres Verständnis für die
Wechselwirkungen von Substanzen zwischen Wasser- und Sedimentphasen erlaubt und
Einblicke in das Sorptions- und Desorptionsverhalten von Prüfsubstanzen bietet (Artikel V
und VI).
Der Artikel I konzentriert sich auf die Identifizierung von Wissenslücken und Daten von zwei
Gruppen von Arzneimitteln: Antibiotika und Zytostatika. Es wurde eine Literaturrecherche
über Muttersubstanzen und TPs durchgeführt. 21 ausgewählte Antibiotika und Zytostatika
wurden betrachtet. Informationen, die über TPs verfügbar sind, zeigen, dass eine bereits
geringfügige Änderung der Behandlungsbedingungen und Prozesse zur Bildung von
verschiedenen TPs führt. Dies wiederum macht es einerseits schwierig, die richtigen
Bedingungen für die Abwasserbehandlung auszuwählen und setzt gleichzeitig voraus, TPs vor
der Behandlung zu indentifizieren und zu bewerten, was Sowohl aus wissenschaftlicher als
auch aus technischer, behandlungsbezogener Sicht insbesondere bei schwer interpretierbaren
Daten und nicht beurteilbaren Stoffen ein nahezu unlösbares Unterfangen darstellt. Daher ist
aus praktischer und nachhaltiger Sicht die Begrenzung des Eintrags von Arzneimitteln und
deren TPs in die Umwelt genauso erstrebenswert, wie die Zielsetzung während des
XII
Arzneimitteldesigns, die Moleküle bezüglich ihrer (Bio-) Abbaubarkeit und ihres
Eliminierungsverhaltens zu optimieren. Dies entspricht dem Gedanken von "benign by
design".. Lösungen, die sich auf diesen "beginning of the pipe"-Ansatz konzentrieren, sollten
die nachteiligen Wirkungen der Muttersubstanzen und ihrer TPs minimieren, indem sie
letztendlich ihren Eintritt und Verbleib in die natürliche Umgebung reduzieren.
Die Artikel II, III und IV befassen sich mit der Erforschung des biologischen Abbaus von
Zytostatika und deren TPs. Die Bioabbautests wurden gemäß der OECD 301D-Richtlinie
(CBT) und die Toxizitätassays unter Verwendung des Lumineszenzbakteriums Vibrio fischeri
durchgeführt. TPs wurden getestet, wenn während der Photoabbaustudien (UV-Lampe,
Xenonlampe, UV/H2O2, UV/Fe2+/H2O2 und UV/TiO2) die beobachtete Mineralisierung
weniger als 70% betrug. Die experimentellen Daten aus der vorgestellten Studie bestätigen,
dass nicht alle Photodegradationsbehandlungen in der Lage sind, Zytostatika vollständig zu
entfernen. Darüber hinaus konnte gezeigt werden, dass es schwierig ist zu prognostizieren,
welche TPs entstehen und welche Eigenschaften und Wirkungen sie in in der Umwelt haben
werden.
Die Artikel V und VI beschreiben die Entwicklung und Anwendung eines neuen biologischen
Abbautestverfahrens, den Screening-Wasser-Sediment-Test (WST), der näher an
Umweltbedingungen angelehnt ist als einfache genormte Tests, aber eine preiswertere
Alternative mit geringerem Arbeitsaufwand im Vergleich zu herkömmlichen Simulationstests
darstellt und gleichzeitig ein besseres Verständnis für Prozesse an der Wasser-Sediment-
Schnittstelle ermöglicht. Der WST liefert Testbedingungen (Vorhandensein von Wasser-
Sediment-Grenzflächen), die komplexer sind als bei standardisierten Screening-Tests, bei
denen nur der biologische Abbau der gelösten Substanz durch die in der Wasserphase
suspendierten Bakterien berücksichtigt wird. Eine indirekte Methode zur Bewertung der
Mineralisierung, die aus Screening-Tests zur biologischen Abbaubarkeit übernommen wurde,
macht den WST weniger aufwendig als Simulations-OECD-Tests, bei denen analytische
Methoden und radioaktiv markierte Verbindungen benötigt werden. Über den Endpunkt
Sauerstoffverbrauch sind Aussagen zur Mineralisierung der Testsubstanzen mit Hilfe eines
Summenparameters möglich. Es kann aber auch eine stoffspezifische Analytik wie bei den
OECD Simulationstests durchgeführt werden. Wie bei allen Tests, die die biologische
Abbaubarkeit prüfen, ist es auch beim WST-Test nicht möglich, Substanzen zu prüfen, die
gegenüber dem Inokulum hemmend oder toxisch wirken. Die Einbeziehung einer
"Toxizitätskontrolle" erlaubt jedoch, falsch negative Ergebnisse auszuschließen. Der WST
XIII
eignet sich für flüchtige, wasserlösliche und schwer wasserlösliche Verbindungen. Ein
weiterer Vorteil ist die Einführung einer „Sterilkontrolle“ (Artikel VI). Diese ermöglicht in
Kombination mit dem Screening von Testsubstanzen bzw. deren TPs in der Wasserphase und
ggf. im Sediment, z. B. durch HPLC, Hinweise auf eine mögliche Sorption und andere nicht-
biotische Prozesse zur Elimination der getesteten Verbindungen. Folglich kann der WST ein
guter Ausgangspunkt für weitere Untersuchungen von Sorption und Desorption in
verschiedenen Sedimentkomponenten sein. Insgesamt kann der WST für das erste Screening
des Stoffverhaltens in der Wasser-Sediment-Grenzfläche gut angewendet werden und ist ein
guter Ausgangspunkt für die Planung in welche Richtung die weiteren Forschungen (auch in
Kombination mit in silico Methoden) gehen sollen.

XIV
1
1. Introduction and motivation
1.1. Biodegradability Testing
Among all of attenuation processes, biodegradation plays one of the most important role and
is one of the most desirable processes in the environment especially since products released
during this bio-reactions, can often be once again reintroduced into the natural element cycles
especially in the case of complete mineralization (Cowan et al., 1996). Chemicals that are
characterized as being biodegradable are broken down into smaller non-toxic compounds by
bacteria or fungi during their growth; in the best case they are fully mineralized
(i.e., transformed to inorganic compound and/or used for biomass production).
The biodegradability and rate of biodegradation of chemicals are important for the estimation
of parameters such as exposure to aquatic organisms, persistency, toxicity, bioaccumulation,
etc. (Blok and Booy, 1984; Raymond et al., 2001; OECD, 2006). The rate and to the what
extent a substance is biodegraded is also an important information used in Quantitative
Structure Activity Relationships (QSAR) models, for predicting the properties of chemical
compounds (Cowan et al., 1996; Rücker and Kümmerer, 2012).
To assess biodegradation, a variety of biodegradation test procedures have been developed by
several international organizations, for instance the Organization of Economic Co-operation
and Development (OECD), or International Organization for Standardizations (ISO)
standards. Among them, OECD guidelines for ready biodegradability testing represent the
most prominent group of internationally used screening biodegradation tests (301A-F)
(OECD, 2006; Guhl and Steber, 2006; Strotmann et al., 1995). All these ready
biodegradability screening tests are very simple in their designs and they use indirect
measurement of the elimination of test compounds e.g., decrease of oxygen, carbon dioxide
evolution or pressure change. That allows for the fast and cheap screening of biodegradability
(OECD, 2006). However, because of their stringency, the test conditions are not close to
simulating environmental conditions and may lead to unrealistic results. Therefore the results
of these tests should be considered as guiding only (i.e., they allow only for the classification
of the compound as ready/ not ready biodegradable, but not to fully predict its behavior in
natural environment) (Cowan et al., 1996; Alexander, 1985).
The simulation tests described in the OECD guidelines are designed to overcome these
limitations since they allow to investigate the behavior of chemicals in specified
environmentally relevant compartments e.g., soil (OECD 307), sediment (OECD 308),
2
aerobic sewage system (OECD 303A). Furthermore, the concentrations used in these tests
should be in the same range as found in the environment. Despite the fact that simulation tests
give more insight into fate of chemicals in the environment, they are not applied frequently as
they are often tedious, time consuming and expensive. One of the reasons for that might be
that it involves working with radiolabeled substances, which requires specific apparatus,
equipment, knowledge, and safety measures as well as the safe disposal of radioactive waste.
One of such a simulation tests, described in the OECD 308 guideline (OECD, 2002), is
designed to investigate aerobic and anaerobic transformation of chemicals in aquatic sediment
systems.
In most of the standard biodegradation tests, the source of inoculum is the bacterial mixture
taken usually directly from surface waters or STPs effluents. So complex biological
communities, in combination with the indirect measurement of biodegradation processes,
makes proper interpretation of biodegradation tests results challenging. Especially, when we
interpret negative results as compounds possible influence on metabolism, community
structure or reproduction of microorganisms, or even all the above. This interpretation is even
more complicated, when a sample consists not only of parent compound, but additionally
comprises a mixture of compounds’ transformation products (TPs).
1.2. Pharmaceuticals in the Environment
The research on the presence of pharmaceuticals in the environment gained momentum in the
1990s; since then, it has been growing. Their presence in the environment is a
well-established fact. A wide range of pharmaceuticals is continuously detected in many
environmental compartments such as surface waters (Ashton et al., 2004; Bendz et al., 2005;
Hilton and Thomas, 2003; Hirsch, 1999; Mompelat et al., 2009; Ternes, 1998), soils (Ho et
al., 2014; Aznar et al., 2014; Song et al., 2010), sediments (Kim and Carlson, 2007; Chen et
al., 2013; Lahti and Oikari, 2012), or ground waters (Barnes et al., 2008; Hirsch, 1999). They
may enter these environmental compartments via different pathways. Main sources of
pharmaceuticals in the aquatic environment are STPs’ effluent, manufacturing plants,
household waste (inappropriate disposal), landfill effluent, aquaculture, or the use of
contaminated sludge or manure in agriculture (Kümmerer, 2008).
Many pharmaceuticals related to the human medicine, may undergo only incomplete
resorption and metabolism within the body and therefore enter the raw sewage in their active
forms or as metabolites (Andreozzi et al., 2003). Additionally, the inappropriate disposal of
3
out-of-date or unwanted drugs is also source of pharmaceuticals in raw sewage (Kümmerer,
2008). After reaching the STP, some of the pharmaceuticals might be biodegraded by
activated sludge or eliminated by sorption. However, since STPs are not designed to eliminate
this class of contaminants, part of them remains unchanged and reaches aquatic environment
through effluent (Fatta-Kassinos et al., 2011a; Roberts and Thomas, 2006; Heberer, 2002; Yu
et al., 2006). Therefore, STPs are the main point sources of human pharmaceuticals in the
aquatic environment. Because of limited biodegradability and a constant release into the
environment, many pharmaceuticals can be regarded as persistent or at least pseudopersistent
(Kümmerer, 2008).
After pharmaceuticals reach the natural aquatic environment they may undergo number of
processes such as: photolysis (under direct sunlight), hydrolysis, oxidation and reduction
reactions, sorption, biodegradation (by bacteria of fungi), and bioaccumulation. These
processes may cause their elimination from aquatic environment, if reaction is complete, or
creation of new compounds i.e., TPs (Kümmerer, 2008).
Aforementioned reactions are not the only sources of pharmaceuticals’ TPs in the aquatic
environment. Technical processes, like chlorination and advanced oxidation processes
(AOPs), such as treatment with H2O2/UV, O3/UV, TiO2/UV, Fenton, and photo-Fenton, are
under discussion for the treatment of STP effluents in order to improve the removal rate of
micro-pollutants such as pharmaceuticals. Since all of these processes often do not completely
mineralize chemicals they can consequently produce TPs (Zwiener, 2007; Kosjek and Heath,
2008; Radjenović et al., 2009; Loos et al., 2013; Magdeburg et al., 2014; Richardson and
Ternes, 2014; Trautwein et al., 2014). Another treatment, which may lead to the TPs
introduction into aquatic environment, is UV treatment. It is applied in water treatment in
order to disinfect effluents or drinking water. Water treatment processes such as oxidation
processes are applied, especially for the removal of micro-pollutants from drinking water,
which cause odor or color, as well as for disinfection.
Numerous studies, that address the issue of pharmaceuticals’ TPs, have been published (e.g.
Dodd and Huang, 2004; Calza et al., 2008; DellaGreca et al., 2007; Dewitte et al., 2008;
Fernández et al., 2010; Khan et al., 2010; Prieto et al., 2011; Terzic et al., 2011; Vasconcelos
et al., 2009). The research on TPs brings many new challenges. From one side, there is a
constant need for the development of a sensitive and reliable analytical separation, detection,
and structure elucidation methods. Additionally, there is a need for the preparation of
appropriate assays for the investigation of properties of new compounds, especially those
4
answering the question if TPs pose a higher risk to the aquatic ecosystems than their parent
compounds (Kosjek and Heath, 2008; Pérez and Barceló, 2007; Fatta-Kassinos et al., 2011b).
Two groups of the pharmaceuticals are of special importance: antibiotics and cytostatic drugs.
Researchers are interested in antibiotics not only because of their extensive usage, but also
because of their direct influence on bacterial communities, which may impact geochemical
cycles and soil fertility, and might possibly contribute to resistance development of potential
human pathogens (Daughton and Ternes, 1999; Kümmerer, 2009a, 2009b). In addition to the
research on antibiotics, much recent attention has been given to cytostatic drugs. These drugs
have a specific mode of action (blocking the growth of cancer cells by influencing the cell
cycle), and can exert carcinogenic, mutagenic and/or teratogenic effects in experimental
animals and humans (Allwood et al., 2002; Eitel et al., 2000; Kümmerer et al., 2016).
Biodegradation testing of chemicals including pharmaceuticals and their TPs is a new
challenge. First of all, there is a need to provide a new biodegradation testing method that
would combine complex testing environment as in simulation tests, easiness in handling and
good data repeatability as in screening biodegradation tests. Another challenge is the need for
an adaption of the existing biodegradation testing methods to new types of samples and
compounds including mixtures of TPs and providing new, more efficient testing methods of
above mixtures.
2. Aims and objectives
The challenge of biodegradation testing presented in this thesis, encompasses different areas
and was divided into three objectives:
1) Identification of the knowledge gaps and data distribution of the two groups of
pharmaceuticals i.e., antibiotics and cytostatic drugs (article I).
2) Increasing the knowledge on biodegradation of cytostatic drugs and their TPs (articles
II, III, and IV).
3) Development, validation and establishment of a biodegradation test with closer to
simulation tests conditions that would be affordable and would allow a better understanding
of processes in water sediment interfaces – screening water-sediment test. Extended
validation of the test with an insight into sorption and desorption processes (article V and VI).
5
3. Research approach
Objective 1: Identification of the knowledge gaps and data distribution of the two
groups of pharmaceuticals antibiotics and cytostatic drugs (article I).
The scientific literature was researched via the following databases: Scopus
(www.scopus.com), Web of Knowledge (www.apps.webofknowledge.com), PubMed
(www.ncbi.nlm.nih.gov), and SciFinder (www.scifinder.cas.org). A literature research was
conducted on data about parent compounds and TPs. In total 21 pharmaceuticals from two
groups namely antibiotics and cytostatic drugs were selected based on available knowledge in
terms of potential effects, occurrence, persistence, and consumption. Treatment processes
(chlorination and AOPs, such as H2O2/UV, O3/UV, TiO2/UV, Fenton, and photo-Fenton) as
well as naturally occurring transformations (biodegradation, photolysis) were taken into
account when searching for TPs. Studies that investigated more complex treatment processes
(e.g. a combination of above processes) were also included. Studies were considered that are
related to lab-scale experiments (spiked synthetic/real water), and in which samples were
collected from the aquatic environment or from full-scale waste water treatment plants
(WWTPs). However, human and mammal metabolites that were formed by metabolization of
the compounds in target organisms were not considered in the data compilation.
Objective 2: Increasing the knowledge on biodegradation of cytostatic drugs and their
TPs (articles II, III, and IV).
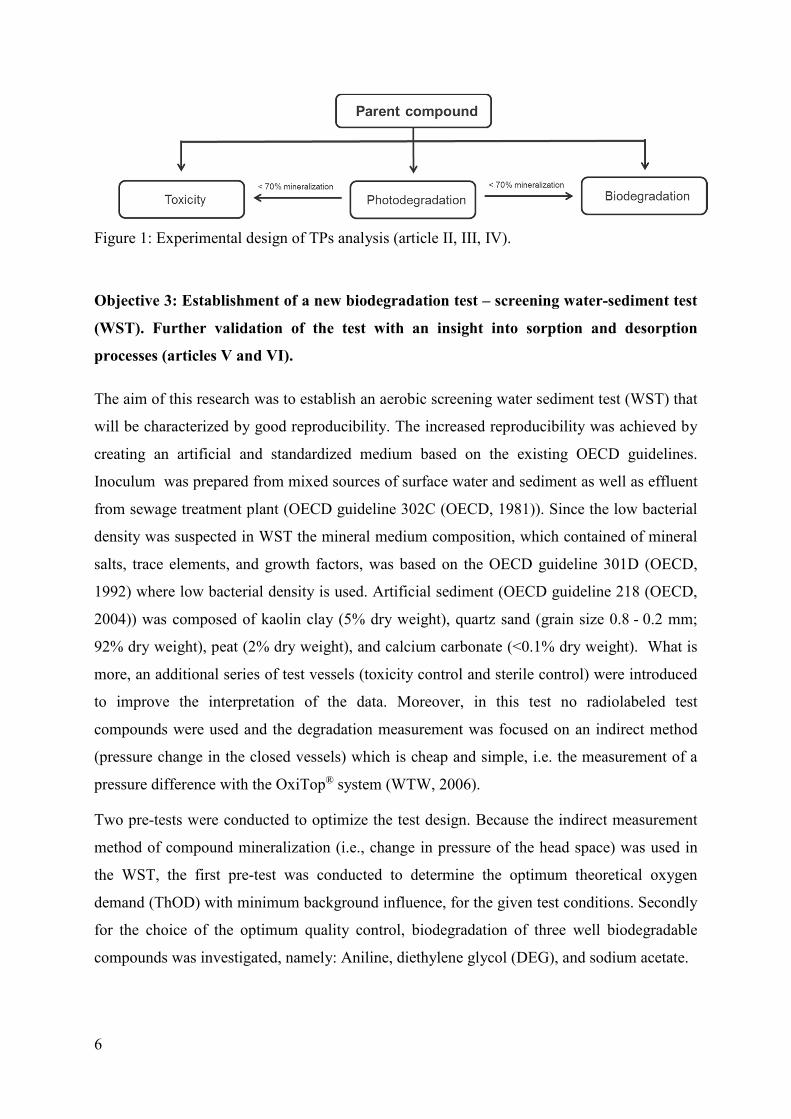
To fill the research gaps on cytostatic drugs and their TPs, the following testing design was
applied. First the photodegradation studies were conducted. The applied processes were: UV-
Lamp, Xenon Lamp, UV/H2O2, UV/Fe/H2O2, and UV/TiO2 photodegradations. Compounds
tested were: Cyclophosphamide (CYC), 5-Fluorouracil (5-FU), and Methotrexate (MTX).
Toxicity and biodegradation of the parent compound were tested. Additionally, if during the
photodegradation studies, observed mineralization was <70%, these samples were tested
further for their biodegradation and toxicity (Figure 1). Biodegradation testing was conducted
according to OECD 301D guideline (Closed Bottle Test (CBT)) and toxicity evaluation with
assays using the luminescent bacteria Vibrio fischeri. Additionally, in the samples the NPOC
(non-purchable organic carbon) was measured and analytical evaluation by HPLC or LC-MS
was performed.
6
Figure 1: Experimental design of TPs analysis (article II, III, IV).
Objective 3: Establishment of a new biodegradation test – screening water-sediment test
(WST). Further validation of the test with an insight into sorption and desorption
processes (articles V and VI).
The aim of this research was to establish an aerobic screening water sediment test (WST) that
will be characterized by good reproducibility. The increased reproducibility was achieved by
creating an artificial and standardized medium based on the existing OECD guidelines.
Inoculum was prepared from mixed sources of surface water and sediment as well as effluent
from sewage treatment plant (OECD guideline 302C (OECD, 1981)). Since the low bacterial
density was suspected in WST the mineral medium composition, which contained of mineral
salts, trace elements, and growth factors, was based on the OECD guideline 301D (OECD,
1992) where low bacterial density is used. Artificial sediment (OECD guideline 218 (OECD,
2004)) was composed of kaolin clay (5% dry weight), quartz sand (grain size 0.8 - 0.2 mm;
92% dry weight), peat (2% dry weight), and calcium carbonate (<0.1% dry weight). What is
more, an additional series of test vessels (toxicity control and sterile control) were introduced
to improve the interpretation of the data. Moreover, in this test no radiolabeled test
compounds were used and the degradation measurement was focused on an indirect method
(pressure change in the closed vessels) which is cheap and simple, i.e. the measurement of a
pressure difference with the OxiTop® system (WTW, 2006).
Two pre-tests were conducted to optimize the test design. Because the indirect measurement
method of compound mineralization (i.e., change in pressure of the head space) was used in
the WST, the first pre-test was conducted to determine the optimum theoretical oxygen
demand (ThOD) with minimum background influence, for the given test conditions. Secondly
for the choice of the optimum quality control, biodegradation of three well biodegradable
compounds was investigated, namely: Aniline, diethylene glycol (DEG), and sodium acetate.
7
To further validate the WST and its possible applications biodegradation of two
pharmaceuticals, namely acetaminophen and ciprofloxacin, in the WST was investigated.
Ciprofloxacin was expected to be not biodegradable but influenced by sorption, therefore
removal from water phase was investigated. For that, water samples were collected with a
syringe through sample port, at days 0, 1 and 28. The samples were stored at -20 °C until they
were measured by the HPLC-fluorescence detection (FDA) (Shimadzu Prominence HPLC
system; Duisburg, Germany).
Further evaluation of WST with an insight into sorption and desorption processes.
In order to gain more insight in processes that take place during WST and expand the possible
knowledge gain (beside biodegradation processes), an accompanying battery of tests was
applied to WST in order to investigate the sorption and desorption possibilities of
micro-pollutants. Because of the test design, processes such as biodegradation, sorption,
elimination from water phase, and abiotic degradation can be investigated in this test
simultaneously.
Furthermore, a pesticide S-metolachlor and its commercial product Mercantor Gold® (86.5%
w/w) was used in this test in order to extend the possible application of WST. Pesticides and
their TPs are next to the pharmaceuticals an important group of micro-pollutants that may
cause unwanted effects on non-target organisms such as humans, animals, other plants, and
the environment due to their toxicity and their bioaccumulation potential or just their
unwanted presence in the environment. The direct application on fields and possible entering
surface waters by wash-off from plants or during surface runoffs makes these compounds
suitable for WST.
This research focused on investigation of the impact of Mercantor Gold®’s adjuvants on the
active substance fate in the simulated water-sediment system. For this purpose such a test as
the WST is most suitable compared to simple biodegradation tests. Additionally, the
biodegradability of photo-TPs of both S-metolachlor and Mercantor Gold® in the water
sediment system using WST was investigated to evaluate the elimination of the parent
compound, its photo-TPs and the possible generation of bio-TPs resulting from photo-TPs.
Monitoring by HPLC-UV was applied to screen for accessible TPs and primary elimination of
parent compounds and TPs. The structure elucidation of generated bio-TPs was accomplished
using LC-UV-MS/MS.
8
In addition the dissipation of the S-metolachlor from water phase was monitored in each
vessel of the test series (test, toxicity control, and sterile control) at days 0, 1, and 28. Samples
were collected through sample port and analyzed by HPLC. Furthermore, extraction of
S-metolachlor from sediment was performed by the use of extraction solution containing a
mixture of acetonitrile (ACN) and water (9:1). In parallel, the extraction from sediment with
0.01 M CaCl2 aqueous solution was performed to evaluate the strength of sorption of S-
metolachlor onto sediment (OECD, 2000). Analysis of S-metolachlor and TPs was performed
by HPLC-UV and LC-MS/MS Bruker Daltonic Esquire 6000 plus ion-trap mass spectrometer
(IT-MS) equipped with the Bruker data analysis system (Bruker Daltonic GmbH, Bremen,
Germany).
4. Results and discussion
Objective 1: Identification of the knowledge gaps and data distribution of the two
groups of pharmaceuticals antibiotics and cytostatic drugs (article I).
In total, 294 TPs, identified with chemical structures in the literature published until 2012,
were found for 15 compounds out of the 21 selected as target compounds. 158 of these had an
assigned CAS-RN, but 136 were not yet registered in the CAS system. However, for some of
the selected pharmaceuticals, particularly cefuroxime, ceftriaxone, ifosfamide, imatinib,
hydroxycarbamide and capecitabine, no research was found that had reported on TPs until the
end of May 2012. In general, structures of TPs were by far more often reported for antibiotics
(275 TPs) than for anticancer drugs (19 TPs). The differences in the number of TPs between
different pharmaceuticals are not necessary correlated to the potential of possible
transformations of the parent compound, but are usually directly correlated to the number of
publications available on this topic i.e. how “fashionable” the parent compound is in research
and how easy to measure. Most of the investigations of TPs were done at lab-scale. The
formed transformation products within the reactors were often identified by means of
chromatographic and mass spectrometric instruments. However, the confirmation of
structures of TPs can only be done in comparison to a synthesized reference standard or, in
case no standard is available, by complementary techniques such as NMR and IR
spectroscopy after isolation and enrichment of the target compound. For an accurate study of
environmental samples where TPs are in trace as well as affected by the complexity of matrix,
advanced sensitivity and accuracy of analytical methods is required to remove uncertainty in
elucidation of structures. It is important to keep in mind that such a task is time-consuming
9
and very expensive. Moreover, not only one TP may be the result of different reactions (e.g.
photodegradation, biodegradation or AOP), but also numerous different TPs may be formed
within one type of treatment, applied under different conditions, sometimes even depending
on the duration or other specific conditions of the treatment. Only a minority of studies on the
assessment of the ecotoxicological potency of TPs included long-term toxicity on non-target
organisms. Furthermore, the question which endpoints are relevant for this kind of research is
still unanswered. Investigations aiming at answering questions, such as how pharmaceuticals
transform, what products result and what is the significance of these, are very costly and time-
consuming if not impossible. Therefore, instead of only relying on advanced effluent
treatments, solutions focusing on "beginning of the pipe" approach such as "benign by design"
(Kümmerer, 2007; Rastogi et al., 2014a; Rastogi et al., 2014b) should minimize the adverse
effects of parent compounds by reducing formation of TPs and their entrance into the natural
environment. The research also demonstrated that more data e.g. on biodegradation of the
selected pharmaceuticals and additional tests for pharmaceuticals and chemicals are needed.
Objective 2: Increasing the knowledge on biodegradation of cytostatic drugs and their
TPs (articles II, III, and IV).
Among all the applied treatment processes, UV/TiO2 and UV/Fe/H2O2 were most efficient
ones for the elimination of 5-FU and MTX. Since the threshold of <70% of mineralization
was adopted, the biodegradation screening was conducted only for the samples after
treatments: UV-Lamp and Xe-Lamp for CYC; UV-Lamp, Xe-Lamp, and UV/H2O2 for 5-FU
and UV/H2O2 for MTX.
None of the parent compounds (CYC, MTX and 5-FU) could be classified as ready
biodegradable. The classification of CYC as a non-readily biodegradable compound is in line
with the results of previous CBT experiments (Kümmerer et al., 1996). Moreover, even in
biodegradation experiments that simulate sewage treatments plants (which contain a much
higher density and diversity of bacteria) and at concentrations ranging from low ng L-1 to a
few hundred mg L-1, CYC was not eliminated (Steger-Hartmann et al., 1997; Kiffmeyer et al.,
1998; Buerge et al., 2006). MTX showed the highest level of biodegradation (44%) among
tested compounds. Kiffmeyer et al. (1998), reported a 95% of MTX removal in conditions
simulating sewage treatment plant. However MTX was classified as not readily biodegradable
in a study performed with the ‘manometric respiration test’ OECD 301 F (Henschel et al.,
10
1997). The biodegradation of MTX appears to be strongly dependent on the bacterial density
and elimination could also be due to sorption to sludge.
The classification of 5-FU as not ready biodegradable is in accordance with the results of
CBT by Kümmerer and Al-Ahmad (1997). On the other hand, in an OECD confirmatory test,
Kiffmeyer et al., 1998 verified a full elimination of 5-FU within a few days. According to the
authors, the biodegradation rate is dependent on the initial concentration, and the best results
were obtained at the lowest 5-FU concentrations (i.e., 5 mg L-1), which is still very high,
compared to its concentration in sewage or the environment. The outcome of research carried
out with activated sludge indicated a complete removal of 5-FU from the wastewater of an
oncological ward (Mahnik et al., 2007). More recently, Kosjek et al., 2013 investigated the
degradation of 5-FU in batch biodegradation experiments at a scale of 0.5 L (inoculum of
activated sludge with initial concentration of 5.4 g L-1). The authors found that 5-FU was
completely eliminated at lower concentrations (1 and 10 mg L-1), whereas a toxic effect
occurred at higher concentrations (20 and 100 mg L-1), retarding or even inhibiting the
elimination. Yu et al., 2006 observed incomplete removal of 5-FU (<60%), even at lower
concentrations (1 and 50 μg L-1). Despite the results of some studies presented above,
showing a fast elimination of 5-FU, it is noteworthy that all these tests were performed with
higher bacterial densities (2.5 g L-1 dry mass in the OECD 303A and 5.4 g L-1 in the study
performed by Kosjek et al. (2013)), whereas the CBT test is characterized by a low bacterial
density (500 CFU mL-1), which may explain the different outcomes. Moreover, the results of
the Zahn-Wellens Test (Kümmerer and Al-Ahmad, 1997), which is also performed with a
higher bacterial density (1 g L-1 dry mass), showed no biodegradation after 28 days. Although
performing this test with a high initial concentration of 5-FU (854 mg L-1), Kümmerer and Al-
Ahmad (1997) observed no toxicity in the toxicity control, which excludes the hypothesis of a
toxic effect that could occur at higher concentrations resulting in retarding or inhibiting, as
suggested by some authors (Kosjek et al., 2013; Kiffmeyer et al., 1998). Likewise, no toxic
effect was observed by the authors in the toxicity control of the CBT. Therefore, considering
the above information, the low biodegradability of 5-FU in the CBT is likely associated with
the low bacterial density.
Comparison between the biodegradation of parent compound and TPs mixture after the
treatment processes showed that UV/H2O2 increased the biodegradability of formed TPs
compared to the parent compound for 5-FU, however, slightly decreased biodegradation of
TPs of MTX. Also UV-photo treatment improved the biodegradation of TPs’ mixture from
11
5-FU, whereas treatment with Xe-Lamp had no influence on improving the biodegradability
of the above. This may be because of the different lamps (i.e. wavelengths/spectra and
radiation energy) Since there was no elimination observed for CYC under UV and Xe-Lamp
treatments, consequently, there was no difference in biodegradation level between samples
before and after these treatments.
The increase in biodegradation of TPs usually followed the reduction in toxicity for all of the
compounds. A significant reduction was observed for chronic luminescence inhibition and
growth inhibition endpoints in luminescent bacteria Vibrio fischeri assays.
The results demonstrated that more knowledge on fate of parent compounds and TPs is
desirable.
Objective 3: Establishment of a new biodegradation test – Screening water-sediment test
(WST). Further validation of the test with an insight into sorption and desorption
mechanisms (articles V and VI).
First of all, some of the important parameters were optimized for the best performance of the
test. In the WST, the concentration of tested substance was adjusted so that by the use of
indirect measurement it would be able to differentiate the mineralization of the compound
from the high background degradation of the organic fraction (peat) in the artificial sediment.
Aniline in all four concentrations achieved similar rates and levels of biodegradation;
64 ± 17%; 80 ± 4%; 62 ± 10%; 68 ± 84% for 40, 20, 10, and 4 mg L-1 respectively. Best
values in regards to standard deviation were obtained at a test concentration of 20 mg L-1
aniline which corresponds to a ThOD of 48.2 mg L-1. Optimum test substance concentration
was therefore decided to be 40 mg L-1 in terms of ThOD. The reference compound was
selected from the three proposed namely aniline, sodium acetate, and DEG. The ready
biodegradability of aniline along with the clearly separated and structured biodegradation
curve makes this compound the optimum choice for a reference compound in the WST.
Artificial sediment content had been adjusted to improve the oxygen penetration into
sediment. For that purpose the content of clay was reduced from 20 to 5%. This improved the
water exchange between water and sediment phases and therefore exchange of oxygen.
Moreover, to reduce the biological oxygen demand (BOD) of the sediment, and therefore high
background readings, the organic fraction was decreased to 1% (2% of peat consisting of 50%
of carbon). The cultivation time was decreased from one month to 10 days. The shortened
cultivation period of inoculum used in the test, was applied in order to limit the decrease in
12
bacterial diversity, reduce change of the inoculum, while still increasing the bacterial density
and its adaptation to WST conditions.
To investigate possible discrepancy of inoculum performance, two WSTs with aniline,
sodium acetate and DEG, were conducted one and half years apart and in two different
seasons (summer and winter). As expected, there was no significant difference of
biodegradation rate of sodium acetate since it is ready biodegradable compound. DEG and
aniline also reached similar levels of biodegradation in both tests, with only slight difference
in the adaptation time of inoculum expressed as lag phase. These results, gave a proof of a
good reproducibility of conditions (especially inoculum) in WST regardless the season when
experiments are performed.
Additionally, biodegradation of two pharmaceuticals, namely acetaminophen and
ciprofloxacin was investigated for the possible application of the test.
Acetaminophen
The inoculum in the WST was in an optimum condition, as could be seen from ‘quality
control’ which was biodegraded in 85 ± 14%. Acetaminophen was degraded to 60 ± 28%.
Acetaminophen in tested at a concentration that was not toxic to inoculum with
biodegradation level in ‘toxicity control’ of 67 ± 15%. Since the ‘Toxicity control calculated’
(sum of oxygen demand in the test and quality assay) and ‘toxicity control’ measured
corresponded well to each other, it was concluded that degradation of both compounds
occurred in parallel and was not impacted because bacterial toxicity. Therefore, the ‘Toxicity
control’ proved to be a good tool to investigate bacterial inhibition by the tested substances.
The potential of acetaminophen to be biodegraded is in agreement with literature data
(Gusseme et al., 2011; Lin et al., 2010; Wu et al., 2012b). Since the biodegradation achieved
in the WST was similar to those in simulation test systems it can be suggest that the WST is a
good indicator system for screening under simulating environment biodegradation conditions.
Ciprofloxacin (CIP)
Similarly in this test series, the inoculum was in good condition since ‘quality control’
reached 66 ± 18% of degradation. CIP showed no biodegradability with a negative
biodegradation curve that reached -46 ± 12% at day 28. The negative development of the
biodegradation curve for CIP is a result of normalization of the test results by the ‘blank’
series, therefore this result should be considered as 0% degradation. Furthermore, low
biodegradability in ‘toxicity control’ 5 ± 11% and correlation of toxicity controls between
13
calculated and tested indicated that the test substance has inhibited the bacterial activity
during the WST. These results are in agreement with literature data (Al-Ahmad et al., 1999;
Girardi et al., 2011).
The comparison of the substance removal from water phase between test and sterile controls
performed by analytical screening of compound concentration in water phase, gave more
information on the influence of the abiotic processes e.g., sorption or hydrolysis of CIP. CIP
concentration in the water phase during the test demonstrated that CIP was partially removed
from water phase in all three test series after 8 h and almost completely removed from the
water phase at the end of the test. That indicates that sorption will be the main removal
process of CIP from aquatic environment. A more rapid CIP elimination was obtained in the
sterile control which could be explained by the zwitterionic nature of CIP. Decreasing the pH
value by sodium azide promoted the share of cationic form of CIP and increased sorption
effects. Numerous studies showed CIP having a strong potential to be adsorbed on clay (Li et
al., 2011; Wu et al., 2012a; Wang et al., 2011) and peat (humic substances) (Aristilde and
Sposito, 2010).
Further evaluation of WST with an insight into sorption and desorption mechanisms was
investigated using a pesticide S-metolachlor and its commercial formulation Mercantor Gold®
that contains adjuvants which could impact biodegradation and sorption.
Behavior of pure S-metolachlor, Mercantor Gold®, and their photo-TPs in the WST.
The inoculum was in very good condition since the biodegradation of sodium acetate in the
quality control reached 75 ± 9%. The results demonstrate for S-metolachlor no
biodegradability (6 ± 14%) likewise the photolysis mixture of S-metolachlor after 8h of
irradiation (-10 ± 8%). The negative development of the S-metolachlor biodegradation was a
result of normalization of the test results by blank series and should therefore be considered as
0%. No toxic effects on bacteria (biodegradation in toxicity control > 25%) were observed by
any tested substance in the toxicity control (biodegradation level in ‘toxicity control’ of
37 ± 9% for S-metolachlor and 37 ± 7% for the photolysis mixture). Moreover, in both cases,
calculated toxicity controls (sum of oxygen demand in the test and quality assay) and toxicity
controls measured corresponded well to each other, concluding that degradation of sodium
acetate was not inhibited by the test compound.
For Mercantor Gold® in WST the inoculum was of very good activity (quality control was
biodegraded in 79 ± 9%, n = 2). No difference was observed between biodegradation of
14
Mercantor Gold® and its photolysis mixture. The biodegradability of Mercantor Gold®
reached 11 ± 16% and photolysis mixture 11 ± 6%. Both, Mercantor Gold® and its photo-TPs
were not toxic to the test bacteria as biodegradation in toxicity control reached 44 ± 7% and
48 ± 10%, respectively. Additionally, calculated toxicity control corresponded well to toxicity
control obtained, concluding that degradation of both (sodium acetate and Mercantor Gold®)
occurred in parallel and was not inhibited. The slightly higher degradation rates of Mercantor
Gold® compared with the pure S-metolachlor and their photolysis mixtures could be within
measurement error and therefore were not significant, especially when biodegradation was
evaluated based on indirect measurements such as monitoring pressure. Gutowski et al.
(2015) compared biodegradability of S-metolachlor and S-metolachlor in Mercantor Gold® in
Closed Bottle test and Manometric Respiratory test and neither biodegradability nor a
difference between commercial formulation and the pesticide alone was found. The difference
between above mentioned and current study was the presence of a sediment layer and
inoculum used. The inoculum in WST was a mixture of microbial communities from natural
water bodies and secondary effluent from sewage treatment plant whereas for the other tests
only inoculum from secondary effluent of sewage treatment plant was used. Both factors can
impact the result.
The photo-TPs were also resistant to the biodegradation in the WST. Although, both
substances and their photolysis mixtures were not degraded it is worthy to mention that there
was always a small difference in biodegradation on favor of the commercial product. This
finding might be interpreted as the influence of the adjuvants on the biodegradation process or
their biodegradability. These adjuvants, which were in fact a mixture of hydrocarbons and the
surfactant dodecylbenzenesulfonic acid calcium salt, could have contributed to biodegradation
in a low extent (Khleifat, 2006; Scott and Jones, 2000). Dodecylbenzenesulfonic acid is
known to be biodegradable in the environment by anaerobic and aerobic bacteria (Denger and
Cook, 1999; Manousaki et al., 2004). This is in agreement with the results of Katagi (2006,
2008). In another study by Mersie et al. (2004), metolachlor was found to be partially
degraded in a water-sediment test and formation of oxanilic acid and ethane sulfonic acid
transformation products was reported. Moreover, these authors reported a decline in
concentration of the above-mentioned TPs after 56 days of incubation, suggesting further
transformation to new products. However, these metabolites were not found in our WST. The
main reason might be due to different sediment used or another test design applied in our
study.
15
Dissipation of the S-metolachlor from water phase.
HPLC-UV measurements revealed that S-metolachlor was similarly removed from the water
phase in all three test series of the WST (test, toxicity and sterile controls). The compound
was gradually dissipating, starting from the 1st day to reach 33.6% removal on 28th day.
Likewise the pure compound, the S-metolachlor in Mercantor Gold® was continuously
dissipating to reach higher removal of 52.8% on the 28th in all three test series. This result
could be explained by one of the Mercantor Gold® adjuvants (dodecylbenzenesulfonic acid
calcium salt), which is an anionic surfactant that will directly interact with the sediment.
Katagi (2008) indicated that due to their structures, surfactants can determine the distribution
properties of pesticides in soil and sediment systems (i.e. mobility, leaching, sorption etc.).
Generally, this was confirmed by a study of Gonzalez et al. (2010), who reported increased
soil mobility of organochlorine pesticides due to the presence of anionic surfactants (sodium
dodecyl sulfate). Therefore S-metolachlor in Mercantor Gold® could easier permeate to
sediment than pure S-metolachlor.
The WST allowed for tracking the elimination of the parent substance from the water phase
which was probably due to its sorption onto sediment particles. The extraction of
S-metolachlor was conducted in order to investigate whether S-metolachlor could be
re-extracted from sediment taken from WST. This information is especially important, since
desorption processes also play an important role in the fate and distribution of chemicals in
the environment. For this purpose two different solvents were selected. One highly polar
consisting of ACN/water (9:1) and as a second one a solution of 0.01 M CaCl2 as suggested
by OECD Test Guideline 106 (OECD, 2000). Recovery rate for S-metolachlor as pure
compound and as constituent of and Mercantor Gold® with CaCl2 was 55.4% and 50.0%,
respectively. Extraction with ACN/water turned out to be more effective with recovery rates
of 96.9% (S-metolachlor) and 93.1% (Mercantor Gold®). This might suggest that a part of S-
metolachlor in both formulations was immobilized by the sediment under natural conditions.
The nature of S-metolachlor sorption onto artificial sediment might differ depending on the
individual fraction that it consists of: mineral, clay and organic. Thus, it might be assumed
that S-metolachlor was sorbed to one of the three sediment components under natural
conditions. Although the detailed sorption mechanisms of pesticides are not yet fully
understood some authors proved that sorption of metolachlor increases with increased soil
organic matter content (Gannon et al., 2013; Westra et al., 2015). Therefore only extraction
with highly polar ACN allowed obtaining high recovery compared with CaCl2 solution. One
16
can say that in natural aquatic environment S-metolachlor might display similar behavior and
could be partially immobilized in bottom sediments.
Determination of transformation products in WST.
The results from the WST after 28 days show that the photolysis product with the specific
mass m/z 266.2 was eliminated and it reveals that two products with the m/z 264.2 (Rt 9.7 and
12.0 min) were formed. The formation of bio-TPs from photolysis mixtures of S-metolachlor
in water was also demonstrated by Gutowski et al. (2015) using a Manometric Respiratory
test, OECD 301F. Since, this study shows an identical degradation of photo-TPs with the m/z
266.2 and the formation of two new products with the m/z 264.2 (Rt 9.7 and 12.0 min), it
confirms that WST delivers the similar conditions for biotic transformation as a Manometric
Respiratory test (Gutowski et al., 2015). These observed follow up bio-TPs were found only
in test and toxicity control series and not in the sterile control confirming their biological
generation. Abiotic processes like hydrolysis or other non-biotic chemical transformations can
be excluded to play a significant role in the parent compound and its photo-TPs fate in water.
The WST proved to be an appropriate tool for the first screening of a various substances
behavior (pesticides, pharmaceuticals) in water-sediment interface and a good starting point
providing the information that allows planning direction of further research. What is more,
obtained results on biodegradation and sorption were in agreement with literature data for all
of the tested compounds namely acetaminophen, ciprofloxacin and S-metolachlor.
Additionally, false negative results, that are a result of the toxicity against inoculum of the
tested compound, can be eliminated by the inclusion of a ‘toxicity control’. Integration of a
‘sterile control’ into the test system combined with screening the water phase for the test
substances, gives a good indication of possible sorption and other non-biotic processes of the
tested compounds. This all makes the WST a reliable tool for biodegradation and sorption
investigation.
5. Concluding remarks and outlook
Information available on TPs demonstrates that an already slight change in treatment
conditions and processes results in the formation of different TPs. This in turn makes it, on
the one hand, difficult to select the right conditions for effluent treatment, and on the other
hand it presents a big challenge for the identification and assessment of TPs. There is a severe
risk of drowning in much unrelated and non-assessable data, both from a scientific and from a
technical treatment-related point of view (article I).
17
Furthermore, the experimental data from the study on cytostatic drugs confirms that not all the
treatments are suitable for each compound. What is more, it is difficult to predict, what
properties TPs would have, and what would be the influence on environment once released
(articles II, III and IV).
Therefore, from a practical and sustainability point of view, limiting the input of
pharmaceuticals and their TPs as well as improving their (bio) degradability and elimination
behavior, during the optimization stages of drug design, i.e. "benign by design", is urgently
needed. Solutions focusing on this "beginning of the pipe" approach should minimize the
adverse effects of parent compounds and their TPs by ultimately reducing their entrance into
the natural environment.
The WST (article V) provides testing conditions (presence of water-sediment interface) that
are more complex than those in standardized screening tests, where only biodegradation
performed by bacteria suspended in water phase is taken into account. An indirect method for
the evaluation of compound mineralization, adopted from biodegradation screening tests,
makes WST less laborious than standardized simulation OECD tests where analytical
methods validated for each compound and radiolabelling are required. The limitation for
application of the WST test is the toxicity against inoculum of the tested compound.
However, the inclusion of a ‘toxicity control’ allows excluding false negative results. The
WST is also not suited for volatile and low water soluble compounds.
Further advantages of WST (article VI) were achieved by integration of a ‘sterile control’ into
the test system. This, together with screening the water phase for the test substances e.g., by
HPLC, gives a good indication of possible sorption and other non-biotic processes of the
tested compounds. Consequently, WST can be a good starting point for further investigations
of sorption and desorption in different sediment compartments. WST can be applied for the
first screening of the substance behavior in water-sediment interface and a good starting point
providing the information that allows planning the direction of further research especially in
combination with in silico tools.
Summarizing, the WST is more efficient than other screening tests, since it gives a better
understanding of the environmental fate of organic compounds, which is essential to estimate
its effects and risks for an environmental risk assessment, and at the same time affordable
workload level. Future development of biodegradation in water-sediment interface should
focus on investigation of chemicals behavior in anoxic conditions which are common to deep
18
water bodies. Another direction of further research would be adjustment of WST conditions in
order to test chemicals in lower, closer to those detected in the environment, concentrations.
Biodegradation and other tests are needed to get further insights in the fate of micro-pollutants
into the aquatic environment. The work and tests performed and developed in this thesis do
contribute to this. In the long run, however, even if we provide new and efficient testing
methods it is still impossible to test every single compound and its TPs. Therefore there is a
need to focus on the introduction of chemicals into the natural environment. Design of more
environment friendly chemicals, limitation of the introduction of chemicals into environment
e.g. by efficient elimination of these compounds via wastewater treatment plants; or peoples’
education on proper usage is also important.
19
References
Al-Ahmad, A., Daschner, F.D., Kümmerer, K., 1999. Biodegradability of cefotiam, ciprofloxacin, meropenem, penicillin G, and sulfamethoxazole and inhibition of waste water bacteria. Archives of Environmental Contamination and Toxicology 37 (2), 158–163.
Allwood, M.C., Stanley, A., Wright, P., 2002. The cytotoxics handbook, 4th ed. Radcliffe Medical Press, Abingdon, Oxon.
Andreozzi, R., Raffaele, M., Nicklas, P., 2003. Pharmaceuticals in STP effluents and their solar photodegradation in aquatic environment. Chemosphere 50 (10), 1319–1330.
Aristilde, L., Sposito, G., 2010. Binding of ciprofloxacin by humic substances: A molecular dynamics study. Environmental Toxicology and Chemistry 29 (1), 90–98.
Ashton, D., Hilton, M., Thomas, K., 2004. Investigating the environmental transport of human pharmaceuticals to streams in the United Kingdom. Science of The Total Environment 333 (1-3), 167–184.
Aznar, R., Sánchez-Brunete, C., Albero, B., Rodríguez, J.A., Tadeo, J.L., 2014. Occurrence and analysis of selected pharmaceutical compounds in soil from Spanish agricultural fields. Environmental Science and Pollution Research 21 (6), 4772–4782.
Barnes, K.K., Kolpin, D.W., Furlong, E.T., Zaugg, S.D., Meyer, M.T., Barber, L.B., 2008. A national reconnaissance of pharmaceuticals and other organic wastewater contaminants in the United States — I) Groundwater. Science of The Total Environment 402 (2-3), 192–200.
Bendz, D., Paxéus, N.A., Ginn, T.R., Loge, F.J., 2005. Occurrence and fate of pharmaceutically active compounds in the environment, a case study: Höje River in Sweden. Journal of Hazardous Materials 122 (3), 195–204.
Buerge, I.J., Buser, H.-R., Poiger, T., Müller, M.D., 2006. Occurrence and fate of the cytostatic drugs cyclophosphamide and ifosfamide in wastewater and surface waters †. Environmental Science and Technology 40 (23), 7242–7250.
Calza, P., Medana, C., Carbone, F., Giancotti, V., Baiocchi, C., 2008. Characterization of intermediate compounds formed upon photoinduced degradation of quinolones by high-performance liquid chromatography/high-resolution multiple-stage mass spectrometry. Rapid Communications in Mass Spectrometry 22 (10), 1533–1552.
Chen, Y.S., Yu, S., Hong, Y.W., Lin, Q.Y., Li, H.B., 2013. Pharmaceutical residues in tidal surface sediments of three rivers in southeastern China at detectable and measurable levels. Environmental Science and Pollution Research 20 (12), 8391–8403.
Daughton, C.G., Ternes, T., 1999. Pharmaceuticals and personal care products in the environment: Agents of subtle change? Environmental Health Perspectives 107 (6), 907–938.
DellaGreca, M., Iesce, M.R., Isidori, M., Nardelli, A., Previtera, L., Rubino, M., 2007. Phototransformation products of tamoxifen by sunlight in water. Toxicity of the drug and its derivatives on aquatic organisms. Chemosphere 67 (10), 1933–1939.
Denger, K., Cook, A.M., 1999. Linear alkylbenzenesulphonate (LAS) bioavailable to anaerobic bacteria as a source of sulphur. Journal of Applied Microbiology 86 (1), 165–168.
20
Dewitte, B., Dewulf, J., Demeestere, K., Van De Vyvere, V., De Wispelaere, P., Van Langenhove, H., 2008. Ozonation of ciprofloxacin in water: HRMS identification of reaction products and pathways. Environmental Science and Technology 42 (13), 4889–4895.
Dodd, M.C., Huang, C.-H., 2004. Transformation of the Antibacterial Agent Sulfamethoxazole in Reactions with Chlorine: Kinetics, Mechanisms, and Pathways. Environmental Science and Technology 38 (21), 5607–5615.
Eitel, A., Scherrer, M., Kümmerer, K., 2000. Handling cytostatic drugs: A practical guide. Bristol-Myers Squibb GmbH, München, Germany.
Fatta-Kassinos, D., Meric, S., Nikolaou, A., 2011a. Pharmaceutical residues in environmental waters and wastewater: Current state of knowledge and future research. Analytical and Bioanalytical Chemistry 399 (1), 251–275.
Fatta-Kassinos, D., Vasquez, M., Kümmerer, K., 2011b. Transformation products of pharmaceuticals in surface waters and wastewater formed during photolysis and advanced oxidation processes – Degradation, elucidation of byproducts and assessment of their biological potency. Chemosphere 85 (5), 693–709.
Fernández, L.A., Hernández, C., Bataller, M., Véliz, E., López, A., Ledea, O., Padrón, S., 2010. Cyclophosphamide degradation by advanced oxidation processes. Water and Environment Journal 24 (3), 174–180.
Gannon, T.W., Hixson, A.C., Weber, J.B., Shi, W., Yelverton, F.H., Rufty, T.W., 2013. sorption of simazine and s-metolachlor to soils from a chronosequence of turfgrass systems. Weed Science 61 (03), 508–514.
Girardi, C., Greve, J., Lamshoeft, M., Fetzer, I., Miltner, A., Schaeffer, A., Kaestner, M., 2011. Biodegradation of ciprofloxacin in water and soil and its effects on the microbial communities. Journal of Hazardous Materials 198, 22–30.
Gonzalez, M., Miglioranza, K.S.B., Aizpun, J.E., Isla, F.I., Pena, A., 2010. Assessing pesticide leaching and desorption in soils with different agricultural activities from Argentina (Pampa and Patagonia). Chemosphere 81 (3), 351–358.
Gusseme, B. de, Vanhaecke, L., Verstraete, W., Boon, N., 2011. Degradation of acetaminophen by Delftia tsuruhatensis and Pseudomonas aeruginosa in a membrane bioreactor. Water Research 45 (4), 1829–1837.
Gutowski, L., Olsson, O., Leder, C., Kummerer, K., 2015. A comparative assessment of the transformation products of S-metolachlor and its commercial product Mercantor Gold® and their fate in the aquatic environment by employing a combination of experimental and in silico methods. Science of the Total Environment 506-507, 369–379.
Heberer, T., 2002. Occurrence, fate, and removal of pharmaceutical residues in the aquatic environment: A review of recent research data. Toxicology Letters 131 (1-2), 5–17.
Henschel, K.-P., Wenzel, A., Diedrich, M., Fliedner, A., 1997. Environmental Hazard Assessment of Pharmaceuticals. Regulatory Toxicology and Pharmacology 25 (3), 220–225.
Hilton, M.J., Thomas, K., 2003. Determination of selected human pharmaceutical compounds in effluent and surface water samples by high-performance liquid chromatography–electrospray tandem mass spectrometry. Journal of Chromatography A 1015 (1-2), 129–141.
21
Hirsch, R., 1999. Occurrence of antibiotics in the aquatic environment. Science of The Total Environment 225 (1-2), 109–118.
Ho, Y.B., Zakaria, M.P., Latif, P.A., Saari, N., 2014. Occurrence of veterinary antibiotics and progesterone in broiler manure and agricultural soil in Malaysia. Science of The Total Environment 488-489, 261–267.
Katagi, T., 2006. Behavior of Pesticides in Water-Sediment Systems, in: Ware, G.W., Albert, L.A., Voogt, P. de, Gerba, C.P., Hutzinger, O., Knaak, J.B., Mayer, F.L., Morgan, D.P., Park, D.L., Tjeerdema, R.S., Whitacre, D.M., Yang, R.S.H., Gunther, F.A. (Eds.), Reviews of Environmental Contamination and Toxicology, vol. 187. Reviews of Environmental Contamination and Toxicology. Springer New York, New York, NY, pp. 133–251.
Katagi, T., 2008. Surfactant Effects on Environmental Behavior of Pesticides, in: Whitacre, D.M. (Ed.), Reviews of Environmental Contamination and Toxicology, vol. 194. Reviews of Environmental Contamination and Toxicology. Springer New York, New York, NY, pp. 71–177.
Khan, M.H., Bae, H., Jung, J.-Y., 2010. Tetracycline degradation by ozonation in the aqueous phase: Proposed degradation intermediates and pathway. Journal of Hazardous Materials 181 (1-3), 659–665.
Khleifat, K.M., 2006. Biodegradation of linear alkylbenzene sulfonate by a two-member facultative anaerobic bacterial consortium. Enzyme and Microbial Technology 39 (5), 1030–1035.
Kiffmeyer, T., Götze, H.-J., Jursch, M., Lüders, U., 1998. Trace enrichment, chromatographic separation and biodegradation of cytostatic compounds in surface water. Fresenius' Journal of Analytical Chemistry 361 (2), 185–191.
Kim, S.-C., Carlson, K., 2007. Quantification of human and veterinary antibiotics in water and sediment using SPE/LC/MS/MS. Analytical and Bioanalytical Chemistry 387 (4), 1301–1315.
Kosjek, T., Heath, E., 2008. Applications of mass spectrometry to identifying pharmaceutical transformation products in water treatment. TrAC Trends in Analytical Chemistry 27 (10), 807–820.
Kosjek, T., Perko, S., Zigon, D., Heath, E., 2013. Fluorouracil in the environment: Analysis, occurrence, degradation and transformation. Journal of Chromatography A 1290, 62–72.
Kümmerer, K., Haiss, A., Schuster, A., Hein, A., Ebert, I., 2016. Antineoplastic compounds in the environment-substances of special concern. Environmental science and pollution research international 23 (15), 14791–14804.
Kümmerer, K., 2007. Sustainable from the very beginning: rational design of molecules by life cycle engineering as an important approach for green pharmacy and green chemistry. Green Chemistry 9 (8), 899.
Kümmerer, K. (Ed.), 2008. Pharmaceuticals in the environment: sources, fate, effects and risks, 3rd ed. Springer, Berlin, Heidelberg.
Kümmerer, K., 2009a. Antibiotics in the aquatic environment – A review – Part I. Chemosphere 75 (4), 417–434.
Kümmerer, K., 2009b. Antibiotics in the aquatic environment – A review – Part II. Chemosphere 75 (4), 435–441.
22
Kümmerer, K., Al-Ahmad, A., 1997. Biodegradability of the anti-tumour agents 5-fluorouracil, cytarabine, and gemcitabine: Impact of the chemical structure and synergistic toxicity with hospital effluent. Acta Hydrochimica et Hydrobiologica 25 (4), 166–172.
Kümmerer, K., StegerHartmann, T., Baranyai, A., Burhaus, I., 1996. Examination of the biodegradation of the antineoplastics cyclophosphamide and ifosfamide with the closed bottle test (OECD 301 D). Zentralblatt fur Hygiene und Umweltmedizin 198 (3), 215–225.
Lahti, M., Oikari, A., 2012. Vertical distribution of pharmaceuticals in lake sediments-citalopram as potential chemomarker. Environmental Toxicology and Chemistry 31 (8), 1738–1744.
Li, Z., Hong, H., Liao, L., Ackley, C.J., Schulz, L.A., MacDonald, R.A., Mihelich, A.L., Emard, S.M., 2011. A mechanistic study of ciprofloxacin removal by kaolinite. Colloids and Surfaces B: Biointerfaces 88 (1), 339–344.
Lin, A.Y.-C., Lin, C.-A., Tung, H.-H., Chary, N.S., 2010. Potential for biodegradation and sorption of acetaminophen, caffeine, propranolol and acebutolol in lab-scale aqueous environments. Journal of Hazardous Materials 183 (1-3), 242–250.
Loos, R., Carvalho, R., António, D.C., Comero, S., Locoro, G., Tavazzi, S., Paracchini, B., Ghiani, M., Lettieri, T., Blaha, L., Jarosova, B., Voorspoels, S., Servaes, K., Haglund, P., Fick, J., Lindberg, R.H., Schwesig, D., Gawlik, B.M., 2013. EU-wide monitoring survey on emerging polar organic contaminants in wastewater treatment plant effluents. Water Research 47 (17), 6475–6487.
Magdeburg, A., Stalter, D., Schlüsener, M., Ternes, T., Oehlmann, J., 2014. Evaluating the efficiency of advanced wastewater treatment: target analysis of organic contaminants and (geno-)toxicity assessment tell a different story. Water Research 50, 35–47.
Mahnik, S.N., Lenz, K., Weissenbacher, N., Mader, R.M., Fürhacker, M., 2007. Fate of 5-fluorouracil, doxorubicin, epirubicin, and daunorubicin in hospital wastewater and their elimination by activated sludge and treatment in a membrane-bio-reactor system. Chemosphere 66 (1), 30–37.
Manousaki, E., Psillakis, E., Kalogerakis, N., Mantzavinos, D., 2004. Degradation of sodium dodecylbenzene sulfonate in water by ultrasonic irradiation. Water Research 38 (17), 3751–3759.
Mersie, W., McNamee, C., Seybold, C., Wu, J., Tierney, D., 2004. Degradation of Metolachlor in Bare and Vegetated Soils and in Simulated Water–Sediment Systems. Environmental Toxicology and Chemistry 23 (11), 2627.
Mompelat, S., Le Bot, B., Thomas, O., 2009. Occurrence and fate of pharmaceutical products and by-products, from resource to drinking water. Environment International 35 (5), 803–814.
OECD, 1981. Test No. 302C: Inherent Biodegradability: Modified MITI Test (II). OECD Publishing.
OECD, 1992. Test No. 301D: Ready biodegradability - closed bottle test. OECD Publishing. OECD, 2000. Test No. 106: Adsorption - Desorption Using a Batch Equilibrium Method.
OECD Publishing. OECD, 2004. Test No. 218: Sediment-Water Chironomid Toxicity Using Spiked Sediment.
OECD Publishing.
23
Pérez, S., Barceló, D., 2007. Application of advanced MS techniques to analysis and identification of human and microbial metabolites of pharmaceuticals in the aquatic environment. TrAC Trends in Analytical Chemistry 26 (6), 494–514.
Prieto, A., Moder, M., Rodil, R., Adrian, L., Marco-Urrea, E., 2011. Degradation of the antibiotics norfloxacin and ciprofloxacin by a white-rot fungus and identification of degradation products. Bioresource Technology 102 (23), 10987–10995.
Radjenović, J., Petrović, M., Barceló, D., 2009. Complementary mass spectrometry and bioassays for evaluating pharmaceutical-transformation products in treatment of drinking water and wastewater. TrAC Trends in Analytical Chemistry 28 (5), 562–580.
Rastogi, T., Leder, C., Kümmerer, K., 2014a. A sustainable chemistry solution to the presence of pharmaceuticals and chemicals in the aquatic environment – the example of re-designing β-blocker Atenolol. RSC Advances 5 (1), 27–32.
Rastogi, T., Leder, C., Kümmerer, K., 2014b. Designing green derivatives of β-blocker Metoprolol: A tiered approach for green and sustainable pharmacy and chemistry. Chemosphere 111, 493–499.
Raymond, J.W., Rogers, T.N., Shonnard, D.R., Kline, A.A., 2001. A review of structure-based biodegradation estimation methods. Journal of Hazardous Materials 84 (2-3), 189–215.
Richardson, S.D., Ternes, T.A., 2014. Water analysis: emerging contaminants and current issues. Analytical chemistry 86 (6), 2813–2848.
Roberts, P., Thomas, K., 2006. The occurrence of selected pharmaceuticals in wastewater effluent and surface waters of the lower Tyne catchment. Science of The Total Environment 356 (1-3), 143–153.
Scott, M.J., Jones, M.N., 2000. The biodegradation of surfactants in the environment. Biochimica et Biophysica Acta (BBA) - Biomembranes 1508 (1-2), 235–251.
Song, W., Ding, Y., Chiou, C.T., Li, H., 2010. Selected Veterinary Pharmaceuticals in Agricultural Water and Soil from Land Application of Animal Manure. Journal of Environment Quality 39 (4), 1211.
Steger-Hartmann, T., Kümmerer, K., Hartmann, A., 1997. Biological degradation of cyclophosphamide and its occurrence in sewage water. Ecotoxicology and Environmental Safety 36 (2), 174–179.
Ternes, T.A., 1998. Occurrence of drugs in German sewage treatment plants and rivers1Dedicated to Professor Dr. Klaus Haberer on the occasion of his 70th birthday.1. Water Research 32 (11), 3245–3260.
Terzic, S., Senta, I., Matosic, M., Ahel, M., 2011. Identification of biotransformation products of macrolide and fluoroquinolone antimicrobials in membrane bioreactor treatment by ultrahigh-performance liquid chromatography/quadrupole time-of-flight mass spectrometry. Analytical and Bioanalytical Chemistry 401 (1), 353–363.
Trautwein, C., Berset, J.-D., Wolschke, H., Kümmerer, K., 2014. Occurrence of the antidiabetic drug Metformin and its ultimate transformation product Guanylurea in several compartments of the aquatic cycle. Environment international 70, 203–212.
Vasconcelos, T.G., Henriques, D.M., König, A., Martins, A.F., Kümmerer, K., 2009. Photo-degradation of the antimicrobial ciprofloxacin at high pH: Identification and biodegradability assessment of the primary by-products. Chemosphere 76 (4), 487–493.
24
Wang, C.-J., Li, Z., Jiang, W.-T., 2011. Adsorption of ciprofloxacin on 2:1 dioctahedral clay minerals. Applied Clay Science 53 (4), 723–728.
Westra, E., Shaner, D., Barbarick, K., Khosla, R., 2015. Evaluation of sorption coefficients for Pyroxasulfone, s-Metolachlor, and Dimethenamid-p. Air, Soil and Water Research 8, 9–15.
WTW, 2006. System OxiTop Control: Operating Manual. Wu, Q., Li, Z., Hong, H., 2012a. Influence of types and charges of exchangeable cations on
ciprofloxacin sorption by montmorillonite. The Journal of Wuhan University of Technology-Materials Science Edition 27 (3), 516–522.
Wu, S., Zhang, L., Chen, J., 2012b. Paracetamol in the environment and its degradation by microorganisms. Applied Microbiology and Biotechnology 96 (4), 875–884.
Yu, J.T., Bouwer, E.J., Coelhan, M., 2006. Occurrence and biodegradability studies of selected pharmaceuticals and personal care products in sewage effluent. Agricultural Water Management 86 (1-2), 72–80.
Zwiener, C., 2007. Occurrence and analysis of pharmaceuticals and their transformation products in drinking water treatment. Analytical and Bioanalytical Chemistry 387 (4), 1159–1162.
25
Curriculum vitae
Ewelina Baginska born on 16.11.1986, in Bielsk Podlaski, Poland
Education
2011-present PhD student, Sustainable and Environmental Chemistry, Leuphana University
Lüneburg, Germany,
2009-2010 Master of Science, Master of Process Engineering, Biotechnology in
Environment Protection, University of Applied Sciences in Offenburg,
Germany / University of Warmia and Masuria in Olsztyn, Poland
2005-2009 Bachelor of Science, Environment protection, University of Warmia and
Masuria in Olsztyn, Poland,
Employment and professional experience
2011-2014 Scientist in EU funded Pharmas Research Project
2012 Supervisor of the practical experimental chemistry techniques sections for the
bachelor students in the Faculty of Sustainability in the summer semester 2012
List of publications
Peer reviewed research articles
Baginska, E., Haiss, A., Kummerer, K., 2015. Biodegradation screening of chemicals in an
artificial matrix simulating the water-sediment interface. Chemosphere 119, 1240–1246.
doi:10.1016/j.chemosphere.2014.09.103.
Gutowski, L., Baginska, E., Olsson, O., Leder, C., Kümmerer, K., 2015. Assessing the
environmental fate of S-metolachlor, its commercial product Mercantor Gold® and their
photoproducts using a water–sediment test and in silico methods. Chemosphere 138, 847–
855. doi:10.1016/j.chemosphere.2015.08.013.
Haddad, T., Baginska, E., Kummerer, K., 2015. Transformation products of antibiotic and
cytostatic drugs in the aquatic cycle that result from effluent treatment and abiotic/biotic
reactions in the environment: An increasing challenge calling for higher emphasis on
measures at the beginning of the pipe. Water Research 72, 75–126.
doi:10.1016/j.watres.2014.12.042.
26
Lutterbeck, C.A., Baginska, E., Machado, Ê.L., Kümmerer, K., 2015. Removal of the anti-
cancer drug methotrexate from water by advanced oxidation processes: Aerobic
biodegradation and toxicity studies after treatment. Chemosphere 141, 290–296.
doi:10.1016/j.chemosphere.2015.07.069.
Lutterbeck, C.A., Wilde, M.L., Baginska, E., Leder, C., Machado, Ê.L., Kümmerer, K., 2015.
Degradation of 5-FU by means of advanced (photo)oxidation processes: UV/H2O2,
UV/Fe2+/H2O2 and UV/TiO2 — Comparison of transformation products, ready
biodegradability and toxicity. Science of The Total Environment 527-528, 232–245.
doi:10.1016/j.scitotenv.2015.04.111.
Lutterbeck, C.A., Wilde, M.L., Baginska, E., Leder, C., Machado, Ê.L., Kümmerer, K., 2016.
Degradation of cyclophosphamide and 5-fluorouracil by UV and simulated sunlight
treatments: Assessment of the enhancement of the biodegradability and toxicity.
Environmental Pollution 208, 467–476. doi:10.1016/j.envpol.2015.10.016.
Menz, J., Baginska, E., Haiß, A., Arrhenius, Å., Backhaus, T., Kümmerer, K., 2017.
Antimicrobial activity of pharmaceutical cocktails in STP effluent – An experimental and
predictive approach to mixture risk assessment. Environmental Pollution 231, 1507–1517.
doi: 10.1016/j.envpol.2017.
Book chapters
Michael, I., Ines Vasquez, M., Hapeshi, E., Haddad, T., Baginska, E., Kümmerer, K., Fatta-
Kassinos, D., Metabolites and transformation products of pharmaceuticals in the environment
as contaminants of emerging concern. Book chapter in: Transformation products of emerging
contaminants in the environment: Analysis, processes, occurrence, effects and risks, Vol. 1
edited by Dimitra A. Lambropoulou, Leo M. L. Nollet, 01/2014: chapter 14: pages 413-457;
John Wiley & Sons Ltd., ISBN: 978-1-118-33959-6
27
Contributions to international conferences
Poster presentations
Lamoree, M., Weiss, J., Baginska, E., Haddad, T., Leder, C., Vasconcelos, T., Roche, P.,
Boireau, V., Hebert, A., Roig, B., Mompelat, S., Kümmerer, K., Formation and structure
elucidation of stable transformation products of pharmaceuticals in the water. Poster, SETAC
North America 32nd Annual Meeting, Boston 2011
Baginska, E., Haiß, A., Kümmerer, K., A screening biodegradation Water Sediment Test,
Poster, Conference: Pharmaceutical products in the Environment: Is there a problem?
PHARMAS Conference, Nimes, 2013, June 3rd-4th, France
Toolaram, A.P., Baginska, E., Lutterbeck, C.A., Huynh, K.D., Schneider, M., Kümmerer, K.,
Environmental fate of Methotrexate: photodegradation, biodegradability and mutagenicity
assessment. Pharmaceuticals in the environment: is there a problem? PHARMAS Conference,
Nimes, 2013, June 3rd-4th France
Baginska, E., Lutterbeck, C.A., Kümmerer, K., Biodegradability of cytostatic drugs:
Cyclophosphamide, 5-Fluorouracil and Methotrexate and their photo -transformation products
resulting from treatment with UV and simulated sunlight radiation in Closed Bottle Test,
Pharmaceuticals in the environment: is there a problem? PHARMAS Conference, Nimes,
2013, June 3rd-4th, France
Baginska, E., Gutowski, L., Haiss, A., Olsson, O., Kümmerer, K., Environmental fate of S-
metolachlor in its pure form and as a part of commercial product - Mercantor Gold®:
biodegradation and sorption onto sediment, SETAC North America 34th Annual Meeting,
Nashville 2013

28
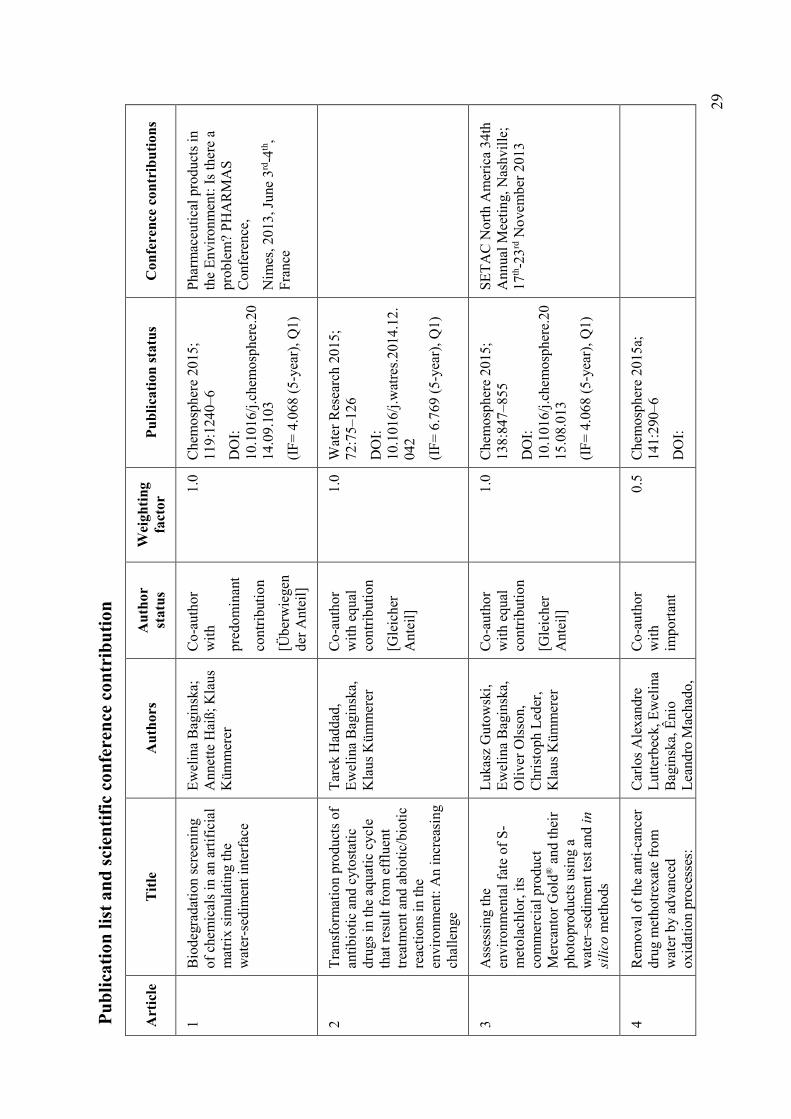
29
Pu
bli
cati
on
lis
t a
nd
sci
enti
fic
con
fere
nce
co
ntr
ibu
tio
n
Art
icle
T
itle
A
uth
ors
A
uth
or
statu
s
Wei
gh
tin
g
fact
or
Pu
bli
cati
on
sta
tus
Con
fere
nce
con
trib
uti
on
s
1 B
iode
grad
atio
n sc
reen
ing
of c
hem
ical
s in
an
arti
fici
al
mat
rix
sim
ulat
ing
the
wat
er-s
edim
ent i
nter
face
Ew
elin
a B
agin
ska;
A
nnet
te H
aiß;
Kla
us
Küm
mer
er
Co-
auth
or
wit
h
pred
omin
ant
cont
ribu
tion
[Übe
rwie
gen
der
Ant
eil]
1.0
Che
mos
pher
e 20
15;
119:
1240
–6
DO
I:
10.1
016/
j.che
mos
pher
e.20
14.0
9.10
3
(IF
= 4
.068
(5-
year
), Q
1)
Pha
rmac
euti
cal p
rodu
cts
in
the
Env
iron
men
t: I
s th
ere
a pr
oble
m?
PH
AR
MA
S
Con
fere
nce,
Nim
es, 2
013,
Jun
e 3rd
-4th,
Fra
nce
2 T
rans
form
atio
n pr
oduc
ts o
f an
tibi
otic
and
cyt
osta
tic
drug
s in
the
aqua
tic
cycl
e th
at r
esul
t fro
m e
fflu
ent
trea
tmen
t and
abi
otic
/bio
tic
reac
tion
s in
the
envi
ronm
ent:
An
incr
easi
ng
chal
leng
e
Tar
ek H
adda
d,
Ew
elin
a B
agin
ska,
K
laus
Küm
mer
er
Co-
auth
or
wit
h eq
ual
cont
ribu
tion
[Gle
iche
r A
ntei
l]
1.0
Wat
er R
esea
rch
2015
; 72
:75–
126
DO
I:
10.1
016/
j.wat
res.
2014
.12.
042
(IF
= 6
.769
(5-
year
), Q
1)
3 A
sses
sing
the
envi
ronm
enta
l fat
e of
S-
met
olac
hlor
, its
co
mm
erci
al p
rodu
ct
Mer
cant
or G
old®
and
thei
r ph
otop
rodu
cts
usin
g a
wat
er–s
edim
ent t
est a
nd in
sili
co m
etho
ds
Luk
asz
Gut
owsk
i, E
wel
ina
Bag
insk
a,
Oli
ver
Ols
son,
C
hris
toph
Led
er,
Kla
us K
ümm
erer
Co-
auth
or
wit
h eq
ual
cont
ribu
tion
[Gle
iche
r A
ntei
l]
1.0
Che
mos
pher
e 20
15;
138:
847–
855
DO
I:
10.1
016/
j.che
mos
pher
e.20
15.0
8.01
3
(IF
= 4
.068
(5-
year
), Q
1)
SE
TA
C N
orth
Am
eric
a 34
th
Ann
ual M
eeti
ng, N
ashv
ille
; 17
th-2
3rd N
ovem
ber
2013
4 R
emov
al o
f th
e an
ti-c
ance
r dr
ug m
etho
trex
ate
from
w
ater
by
adva
nced
ox
idat
ion
proc
esse
s:
Car
los
Ale
xand
re
Lut
terb
eck,
Ew
elin
a B
agin
ska,
Êni
o L
eand
ro M
acha
do,
Co-
auth
or
wit
h im
port
ant
0.5
Che
mos
pher
e 20
15a;
14
1:29
0–6
DO
I:
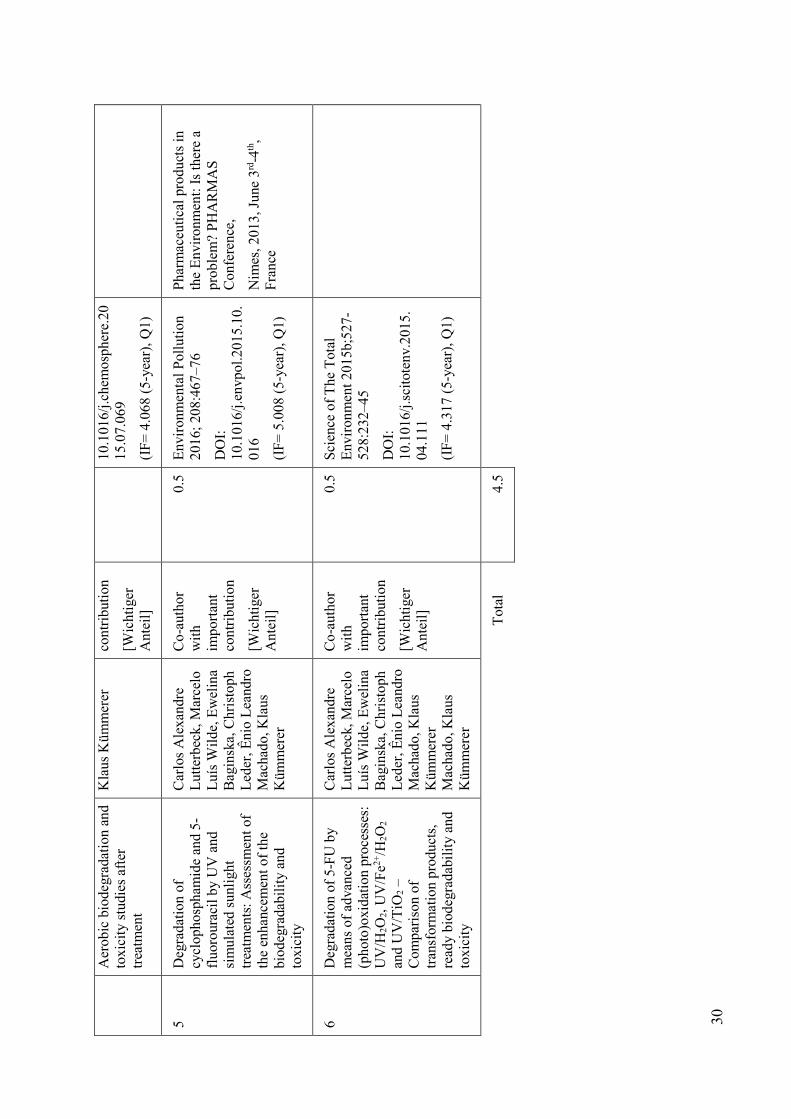
30
Aer
obic
bio
degr
adat
ion
and
toxi
city
stu
dies
aft
er
trea
tmen
t
Kla
us K
ümm
erer
co
ntri
buti
on
[Wic
htig
er
Ant
eil]
10.1
016/
j.che
mos
pher
e.20
15.0
7.06
9
(IF
= 4
.068
(5-
year
), Q
1)
5 D
egra
dati
on o
f cy
clop
hosp
ham
ide
and
5-fl
uoro
urac
il b
y U
V a
nd
sim
ulat
ed s
unli
ght
trea
tmen
ts: A
sses
smen
t of
the
enha
ncem
ent o
f th
e bi
odeg
rada
bili
ty a
nd
toxi
city
Car
los
Ale
xand
re
Lut
terb
eck,
Mar
celo
L
uís
Wil
de, E
wel
ina
Bag
insk
a, C
hris
toph
L
eder
, Êni
o L
eand
ro
Mac
hado
, Kla
us
Küm
mer
er
Co-
auth
or
wit
h im
port
ant
cont
ribu
tion
[Wic
htig
er
Ant
eil]
0.5
Env
iron
men
tal P
ollu
tion
20
16; 2
08:4
67–7
6
DO
I:
10.1
016/
j.env
pol.2
015.
10.
016
(IF
= 5
.008
(5-
year
), Q
1)
Pha
rmac
euti
cal p
rodu
cts
in
the
Env
iron
men
t: I
s th
ere
a pr
oble
m?
PH
AR
MA
S
Con
fere
nce,
Nim
es, 2
013,
Jun
e 3rd
-4th,
Fra
nce
6 D
egra
dati
on o
f 5-
FU
by
mea
ns o
f ad
vanc
ed
(pho
to)o
xida
tion
pro
cess
es:
UV
/H2O
2, U
V/F
e2+/H
2O2
and
UV
/TiO
2 –
Com
pari
son
of
tran
sfor
mat
ion
prod
ucts
, re
ady
biod
egra
dabi
lity
and
toxi
city
Car
los
Ale
xand
re
Lut
terb
eck,
Mar
celo
L
uís
Wil
de, E
wel
ina
Bag
insk
a, C
hris
toph
L
eder
, Êni
o L
eand
ro
Mac
hado
, Kla
us
Küm
mer
er
Mac
hado
, Kla
us
Küm
mer
er
Co-
auth
or
wit
h im
port
ant
cont
ribu
tion
[Wic
htig
er
Ant
eil]
0.5
Sci
ence
of
The
Tot
al
Env
iron
men
t 201
5b;5
27-
528:
232–
45
DO
I:
10.1
016/
j.sci
tote
nv.2
015.
04.1
11
(IF
= 4
.317
(5-
year
), Q
1)
T
otal
4.
5
31
Declaration
I avouch that all information given in this appendix is true in each instance and overall.
Ewelina Baginska
Lüneburg, 7th June 2017

32

Appendices

Article I
Transformation products of antibiotic and cytostatic drugs in the aquatic
cycle that result from effluent treatment and abiotic/biotic reactions in
the environment: An increasing challenge calling for higher emphasis
on measures at the beginning of the pipe.
Haddad, T., Baginska, E., Kümmerer, K., Water Research 2015;72:75–126.
doi: 10.1016/j.watres.2014.12.042

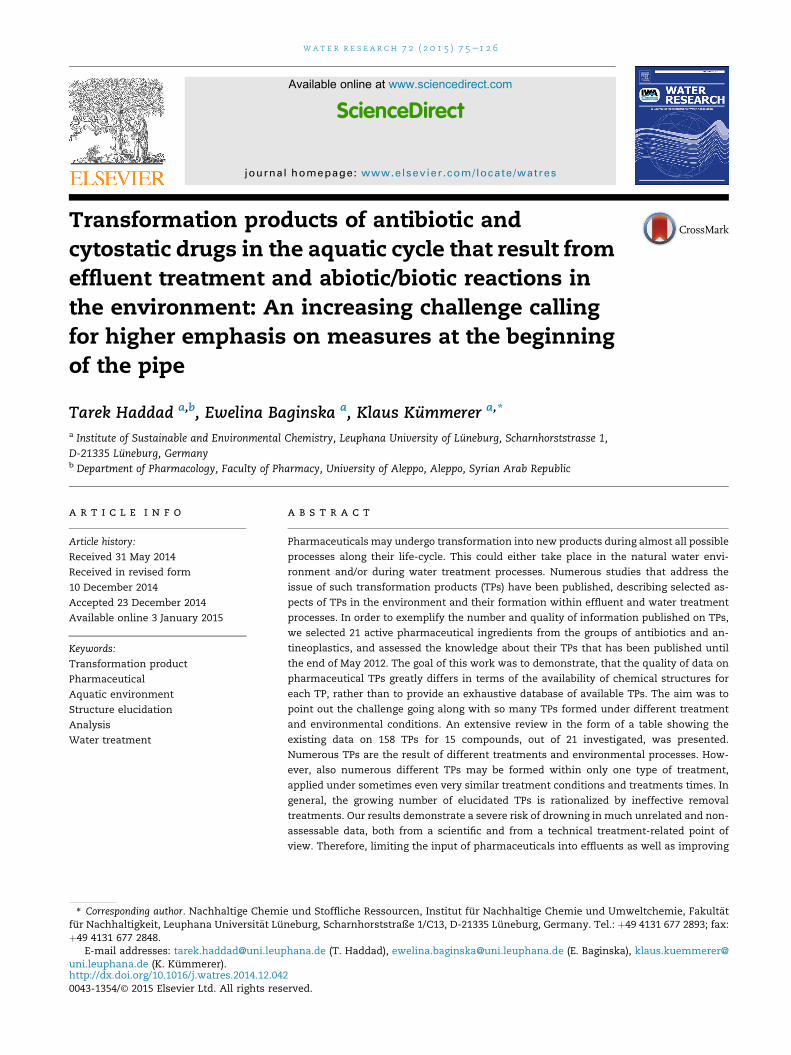
Transformation products of antibiotic and
cytostatic drugs in the aquatic cycle that result from
effluent treatment and abiotic/biotic reactions in
the environment: An increasing challenge calling
for higher emphasis on measures at the beginning
of the pipe
Tarek Haddad a,b, Ewelina Baginska a, Klaus Kummerer a,*
a Institute of Sustainable and Environmental Chemistry, Leuphana University of Luneburg, Scharnhorststrasse 1,
D-21335 Luneburg, Germanyb Department of Pharmacology, Faculty of Pharmacy, University of Aleppo, Aleppo, Syrian Arab Republic
a r t i c l e i n f o
Article history:
Received 31 May 2014
Received in revised form
10 December 2014
Accepted 23 December 2014
Available online 3 January 2015
Keywords:
Transformation product
Pharmaceutical
Aquatic environment
Structure elucidation
Analysis
Water treatment
a b s t r a c t
Pharmaceuticals may undergo transformation into new products during almost all possible
processes along their life-cycle. This could either take place in the natural water envi-
ronment and/or during water treatment processes. Numerous studies that address the
issue of such transformation products (TPs) have been published, describing selected as-
pects of TPs in the environment and their formation within effluent and water treatment
processes. In order to exemplify the number and quality of information published on TPs,
we selected 21 active pharmaceutical ingredients from the groups of antibiotics and an-
tineoplastics, and assessed the knowledge about their TPs that has been published until
the end of May 2012. The goal of this work was to demonstrate, that the quality of data on
pharmaceutical TPs greatly differs in terms of the availability of chemical structures for
each TP, rather than to provide an exhaustive database of available TPs. The aim was to
point out the challenge going along with so many TPs formed under different treatment
and environmental conditions. An extensive review in the form of a table showing the
existing data on 158 TPs for 15 compounds, out of 21 investigated, was presented.
Numerous TPs are the result of different treatments and environmental processes. How-
ever, also numerous different TPs may be formed within only one type of treatment,
applied under sometimes even very similar treatment conditions and treatments times. In
general, the growing number of elucidated TPs is rationalized by ineffective removal
treatments. Our results demonstrate a severe risk of drowning in much unrelated and non-
assessable data, both from a scientific and from a technical treatment-related point of
view. Therefore, limiting the input of pharmaceuticals into effluents as well as improving
* Corresponding author. Nachhaltige Chemie und Stoffliche Ressourcen, Institut fur Nachhaltige Chemie und Umweltchemie, Fakult€atfur Nachhaltigkeit, Leuphana Universit€at Luneburg, Scharnhorststraße 1/C13, D-21335 Luneburg, Germany. Tel.: þ49 4131 677 2893; fax:þ49 4131 677 2848.
E-mail addresses: [email protected] (T. Haddad), [email protected] (E. Baginska), [email protected] (K. Kummerer).
Available online at www.sciencedirect.com
ScienceDirect
journal homepage: www.elsevier .com/locate/watres
wa t e r r e s e a r c h 7 2 ( 2 0 1 5 ) 7 5e1 2 6
http://dx.doi.org/10.1016/j.watres.2014.12.0420043-1354/© 2015 Elsevier Ltd. All rights reserved.
their (bio) degradability and elimination behavior, instead of only relying on advanced
effluent treatments, is urgently needed. Solutions that focus on this “beginning of the pipe”
approach should minimize the adverse effects of parent compounds by reducing and
formation of TPs and their entrance into the natural environment.
© 2015 Elsevier Ltd. All rights reserved.
1. Introduction
The research on the presence of pharmaceuticals in the
environment gained momentum in the 1990s; since then, it
has been growing. Until today, a considerable number of re-
view articles and several thousand original research articles
on pharmaceuticals concerning their sources, their occur-
rence in different compartments of the environment, their
fate and elimination by natural or human-driven processes,
and possible effects on humans and organisms in the envi-
ronment have been published (Halling-Sørensen et al., 1998;
Ternes, 1998; Kummerer, 2001; Heberer, 2002; Boreen et al.,
2003; Bendz et al., 2005; Xia et al., 2005; Fent et al., 2006;
Kummerer, 2008; Onesios et al., 2009; Ding and He, 2010;
Fatta-Kassinos et al., 2011a). In addition, the evaluation of
analytical methods used for detection and quantification of
pharmaceuticals in the environment has also developed
further (Steger-Hartmann et al., 1996; Diaz-Cruz and Barcel�o,
2005; Kim and Carlson, 2005; Petrovi�c et al., 2005; Fatta et al.,
2007; Hao et al., 2007; Hern�andez et al., 2007; Hernando et al.,
2007; Rodil et al., 2012; Masi�a et al., 2014). As the knowledge on
pharmaceuticals and their fate in the aquatic environment,
together with more accurate and sensitive methods of their
detection and analysis, increased, new questions and issues
started to emerge. In the meantime, the focus in this area is
not only on the parent compounds themselves, but also on the
molecules resulting from incomplete mineralization in the
body of treated organisms (metabolites) or abiotic reactions
that can take place within advanced effluent treatment and
once the parent compound is released into the environment
(transformation products). However, research started to
improve the knowledge on this new kind of micro-pollutants,
i.e. transformation products (TPs), only recently. Knowledge
on sources, properties, fate, and effects of TPs on human
health and the natural environment is one such research
focus with a tremendously increasing number of publications.
The sources of TPs are directly connected to the fate of
parent compounds. Depending on their sources, TPs are
described in the literature by different terms (Table 1). TPs are
being formed in different processes in the environment as
well as in waste water and potable water treatment (Zwiener,
2007; Schmidt and Brauch, 2008). After being administrated to
humans or animals, pharmaceuticals may be metabolized by
a variety of mechanisms and pathways within the body. The
rate and extent of these processes are specific to each com-
pound andmay sometimes even be different between species.
In the case of human pharmaceuticals, once these com-
pounds and/or metabolites are excreted, they reach waste-
water treatment plants (WWTPs), if such plants are in place,
or directly reach surface water. In the case of veterinary
pharmaceuticals, they are directly disposed in fields or used in
biogas plants. In WWTPs, a further transformation of phar-
maceuticals and metabolites may take place, for instance, by
activated sludge during aerobic wastewater treatment or
anaerobic digestion of sludge, which results in bacterial me-
tabolites, also known as biotransformation products (bio-TPs)
(L€angin et al., 2009; Trautwein and Kummerer, 2011). Hydro-
lysis and non-biotic oxidation reactionsmay also play a role in
the transformation of pharmaceuticals in WWTPs
(Kummerer, 2009a). Additionally, so called advanced oxida-
tion methods are under discussion for the treatment of
wastewater and WWTP effluents in order to improve the
removal rate of micro-pollutants such as pharmaceuticals.
Processes used for these purposes are for example chlorina-
tion and advanced oxidation processes (AOPs), such as H2O2/
Table 1 e Examples of terms that have been used in the literature to describe transformation products according to theirsource.
Processes Transformation products Compartment
Biodegradation Bio-transformation products, bacterial
metabolites, biodegradation products, metabolites
Wastewater treatment plant, surface water bodies,
anaerobic digesters, soils as far as related to
bacteria or fungi
Photolysis, photocatalysis Photo-transformation products, photoproducts Surface water bodies, effluent treatment, drinking
water treatment/disinfection
Chlorination, ozonation and
advanced oxidation
processes
Chlorination products, oxidation products,
photo-oxidation products (if treatment by
UV light is included), by products
Wastewater treatment plant, water treatment
works, pre- and/or post- treatment of wastewater,
drinking water treatment and disinfection
Other Transformation products, intermediates,
degradation products, stable transformation
products
Used in general to all types of transformation products
wat e r r e s e a r c h 7 2 ( 2 0 1 5 ) 7 5e1 2 676
UV, O3/UV, TiO2/UV, Fenton, and photo-Fenton. All of these
processes do not often completely mineralize chemicals and
can therefore frequently produce TPs (Zwiener, 2007; Kosjek
and Heath, 2008; Radjenovi�c et al., 2009b; Loos et al., 2013;
Magdeburg et al., 2014; Richardson and Ternes, 2014;
Trautwein et al., 2014; www.saicm.org). Together with
WWTPs effluents; the mixture of pharmaceuticals, bio-TPs,
and human metabolites enters surface water bodies. Once
pharmaceuticals are introduced into the aquatic environ-
ment, they can undergo photolysis caused by exposure to the
direct sunlight, in addition to already mentioned biodegra-
dation and hydrolysis. As a result of this reaction, photo-
transformation products (photo-TPs) are formed. Further-
more, UV treatment, chlorination or treatment with ozone are
also very common for water treatment in order to disinfect
drinking water. Water treatment processes such as oxidation
processes are applied, especially for the removal of micro-
pollutants from drinking water, which cause odor or colour,
as well as for disinfection. The most effective species gener-
ated in these processes, which reacts with the target com-
pounds, is the hydroxyl radical (HO�). It is a very reactive
molecule with low region-selectivity, i.e. in contrast to bio-
logical reaction mediated by enzymes, it reacts in a very un-
specific way. This results in the formation of numerous TPs
related to the treatment of pharmaceuticals.
In addition to publications on pharmaceuticals,
numerous studies that address the issue of TPs have been
published (Dewitte et al., 2008; Sirtori et al., 2010; Wang
et al., 2010; Chen et al., 2012; Sturini et al., 2012;
Lambropoulou and Nollet, 2014). Most of these works
describe selected aspects of TPs in the environment and
their formation within effluent and water treatment pro-
cesses. Some reviews on TPs have been already published.
For example, Fatta-Kassinos et al. (2011b) have summarized
some general knowledge on how to identify TPs that are
formed during the application of natural photolytic and
AOPs as well as on potential biological effects that these
products may cause. Additionally, Kosjek and Heath (2008)
discussed the analytical challenges in the field of qualita-
tive analysis of TPs generated during the AOPs and disin-
fection processes such as chlorination. P�erez and Barcel�o
(2007) also provided an overview on strategies of analyzing
unknown human and bacterial metabolites, using the mass
spectrometry (MS) technique and focusing on the detection
of metabolites in wastewater treatment plants.
Among research on pharmaceuticals, studies of antibiotics
are very frequent (Kummerer, 2009a, 2009b). Besides the nat-
ural background (some antibiotics are produced by bacteria in
the environment), antibiotics are used in both human and
veterinary medicine and in aquaculture (Kummerer, 2009a).
Therefore, sewage treatment plants as well as run-offs, e.g.
from soils after the application of manure and heavy rain
events, are sources of antibiotics in the environment
(Daughton and Ternes, 1999; Kummerer, 2009a). Researchers
are interested in antibiotics not only because of their great
usage, but also because of their direct influence on bacterial
communities, which may impact geochemical cycles and soil
fertility, and might possibly contribute to resistance devel-
opment of potential human pathogens (Daughton and Ternes,
1999; Kummerer, 2009a, 2009b).
In addition to the research on antibiotics, much recent
attention has been given to cytostatic drugs and their mode of
action. Cytostatic drugs are used to block the growth of cancer
cells. They achieve this by influencing the cell cycle so that cell
division and reproduction is inhibited (Eitel et al., 1999).
Cytostatic drugs can exert carcinogenic, mutagenic, and/or
teratogenic effects in animals and humans (Allwood et al.,
2002). The measurement and significance of these properties
under environmental conditions and possible associated risks
are still unclear (Kummerer and Al-Ahmad, 2010; Toolaram
et al., 2014; Zhang et al., 2013; Kummerer et al., in press). The
use of such drugs in hospitals as well as increasingly in
outpatient treatment for cancer therapy has considerably
increased over the past decades due to the steady increase in
the number of cancer patients around the world (Van Der Aa
and Kommer, 2010; Yin et al., 2010; Stewart and Wild, 2014;
Toolaram et al., 2014). After administration, most of these
agents are incompletely metabolized in the body. Depending
on the specific pharmaceutical, the rate of the excreted and
unchanged pharmaceutical is different, ranging from a few
percent up to nearly 100% (Eitel et al., 1999; Kummerer and Al-
Ahmad, 2010). The same holds true for antibiotics (Kummerer
and Henninger, 2003). Pharmaceuticals can; therefore, enter
wastewater in their active forms via the urine and feces of
patients undergoing chemotherapy. Therefore, sewage treat-
ment plants are considered as the main source of introducing
these agents to surface waters (Kummerer and Al-Ahmad,
2010; Besse et al., 2012; Ferrando-Climent et al., 2013; Zhang
et al., 2013; Kummerer et al., in press).
Identification of products formed of incomplete degrada-
tion, e.g. in biodegradation experiments or photolysis studies,
has become the most challenging step in environmental
analysis (Krauss et al., 2010; Kosjek and Heath, 2011;
Richardson and Ternes, 2014). Oxidation processes render
molecules more polar. This often holds true for bio-TPs as
well; however, polarity can sometimes also be reduced by, e.g.
an alkylation step under anaerobic conditions. Due to the
water-solubility of most pharmaceuticals and TPs, MS is often
coupled with liquid chromatography (LC) and sometimes with
gas chromatography (GC), which needs most often a prior
derivatization step, thereby providing a more sensitive and
selective tool for the separation/detection of the analytes in
samples (Cardoza et al., 2005; An et al., 2010; Yuan et al., 2011).
To separate unknown TPs from other compounds in the same
sample, high performance liquid chromatography (HPLC) or
ultrahigh performance liquid chromatography (UPLC) tech-
niques are widely used (Jarman, 1973; Sanderson et al., 2005;
Kwon, 2011; Shelver and Varel, 2012). Among the possible
ionization techniques, atmospheric pressure ionization (API)
methods such as electrospray ionization (ESI) and atmo-
spheric pressure chemical ionization (APCI) are extensively
employed, however, ESI is the most used (Kugelmann et al.,
2011; Yuan et al., 2011; Luo et al., 2012).
In the absence of reference standards, which is most often
the case for newly formed TPs, the interpretation of frag-
mentation patterns of tandem mass spectrometry (MS/MS) or
ion trapmultistage tandemmass spectrometry (MSn) provides
structural suggestions of TPs (Hernandez et al., 2008;
Vasconcelos et al., 2009; Ge et al., 2010). In the past, low res-
olution mass spectrometry (LRMS) was used most often, but
wa t e r r e s e a r c h 7 2 ( 2 0 1 5 ) 7 5e1 2 6 77

provided only very limited information with respect to the
reliability of the suggested structural formula, namely detec-
ted as peaks in chromatography. Degradation studies have
often been performed at lab-scale, in which samples only
contained the parent compound and a few TPs in relatively
high concentration, but did not contain any additional water
constituents such as nitrate or humic substances that can act
as photo sensitizers. To assess the impact of environmental
matrices on the degradation of compounds of interest, many
studies were conducted by spiking a stock solution of a stud-
ied substance with raw water samples (Turiel et al., 2005). In
such studies, a step of sample preparation is needed. Extrac-
tion by solid phase extraction (SPE) showed a successful sep-
aration and enrichment for the analysis of TPs (Cardoza et al.,
2005). However, with unknown compounds, it is not fully clear
whether all of them have been extracted and to what degree.
Recently, the advances in high-resolution mass spec-
trometry (HRMS) have enabled structure elucidation with a
higher confidence because of high mass accuracy and reso-
lution (Dewitte et al., 2008; Sirtori et al., 2010). Furthermore,
HRMS can result in the detection and identification of TPs at
lower concentrations, e.g. in the ng L�1 ranges in real envi-
ronmental samples. More recently, hybrid instruments such
as triple quadrupole/time-of-flight (QqQ/QToF) or linear ion
trap/orbitrap (e.g. LTQ-Orbitrap) have been increasingly used
to provide complementary information in order to elucidate
and confirm unknown TPs (Calza et al., 2008; Radjenovi�c et al.,
2009a; Paul et al., 2010; L�opez et al., 2014). An unambiguous
confirmation can be typically obtained by the analysis of
reference standards. Since standards of TPs often are not
commercially available, a powerful structure elucidation
technique such as nuclear magnetic resonance (NMR) or
infrared (IR) spectroscopy can be used (Venta et al., 2005;
DellaGreca et al., 2007; Kugelmann et al., 2011). However,
because of the presence of several compounds in the sample,
the interpretation of spectra is challenging. Furthermore, such
expensive machines are not frequently available and low
concentration of TP presents additional challenge.
In sum, much research has been published on the fate of
parent compounds and related TPs thatmay be formed during
different processes and under different conditions in the
aquatic cycle. This paper uses the examples of selected
pharmaceuticals and their TPs over a limited period to provide
a critical review on what this knowledge might tell us. Two
groups, antibiotics and anticancer drugs, were considered.
Among the wide amount of such substances, a selection of 21
compoundswasmade, based on available knowledge in terms
of potential effect, occurrence, persistence, and consumption.
These compounds are representative of different families of
compounds within each therapeutic group respectively (Table
2). Available information on these compounds was collected
from various scientific publications. We assessed the knowl-
edge about TPs that has been published until the end of May
2012 in order to exemplify the number and quality of infor-
mation published on TPs. The aim of this study was to
demonstrate, that the quality of data on pharmaceutical TPs
greatly differs in terms of the availability of chemical struc-
tures for each TP, rather than to provide an exhaustive data-
base of available TPs. To the best of our knowledge, this is the
first work that addresses the challenge going along with so
many TPs formed under different treatments and environ-
mental conditions.
2. Materials and methods
Structures and availability of TPs' registry numbers in
chemical abstracts service (CAS-RNs) was reviewed for the
selected pharmaceuticals (Table 2) in the scientific literature
via the following databases: Scopus (www.scopus.com), Web
of Knowledge (www.apps.webofknowledge.com), PubMed
(www.ncbi.nlm.nih.gov), and SciFinder (www.scifinder.cas.
org). CAS-RNs are used worldwide to provide a nearly
unique and unmistakable identifier for chemical substances
that have been reported in the scientific literature (http://
www.cas.org/content/chemical-substances/faqs). A litera-
ture research was conducted on data about TPs that has been
published until the end of May 2012. Treatment processes
(chlorination and AOPs, such as H2O2/UV, O3/UV, TiO2/UV,
Fenton, and photo-Fenton) as well as naturally occurring
transformations (biodegradation, photolysis) were taken into
account when searching for TPs. Studies that investigated
more complex treatment processes (e.g. a combination of
above processes) were also included and short-written as
“other” in Tables 1 and 3. Studies were considered that are
related to lab-scale experiments (spiked synthetic/real water),
Table 2 e List of selected pharmaceuticals.
Antibiotic agents Cytostatic agents
Compound name Sub-class CAS-RNa Compound name Sub-class CAS-RNa
Cefuroxime Cephalosporin 55268-75-2 Cyclophosphamide Nitrogen mustard analogue 6055-19-2
Ceftriaxone Cephalosporin 73384-59-5 Ifosfamide Nitrogen mustard analogue 3778-73-2
Chlortetracycline Tetracycline 57-62-5 Carboplatin Platinium compound 41575-94-4
Doxycycline Tetracycline 564-25-0 Cisplatin Platinium compound 15663-27-1
Oxytetracycline Tetracycline 79-57-2 5-fluorouracil Pyrimidin analogue 51-21-8
Tetracycline Tetracycline 60-54-8 Capecitabine Pyrimidin analogue 154361-50-9
Ciprofloxacin Fluoroquinolone 85721-33-1 Methotrexate Folic acid analogue 59-05-2
Levofloxacin Fluoroquinolone 100986-85-4 Hydroxycarbamide Hydroxyurea 127-07-1
Ofloxacin Fluoroquinolone 82419-36-1 Tamoxifen Anti-estrogen 10540-29-1
Erythromycin Macrolide 114-07-8 Imatinib Protein Kinase Inhibitor 152459-95-5
Trimethoprim Folic acid antagonist 738-70-5
a Chemical abstracts service registry number.
wat e r r e s e a r c h 7 2 ( 2 0 1 5 ) 7 5e1 2 678
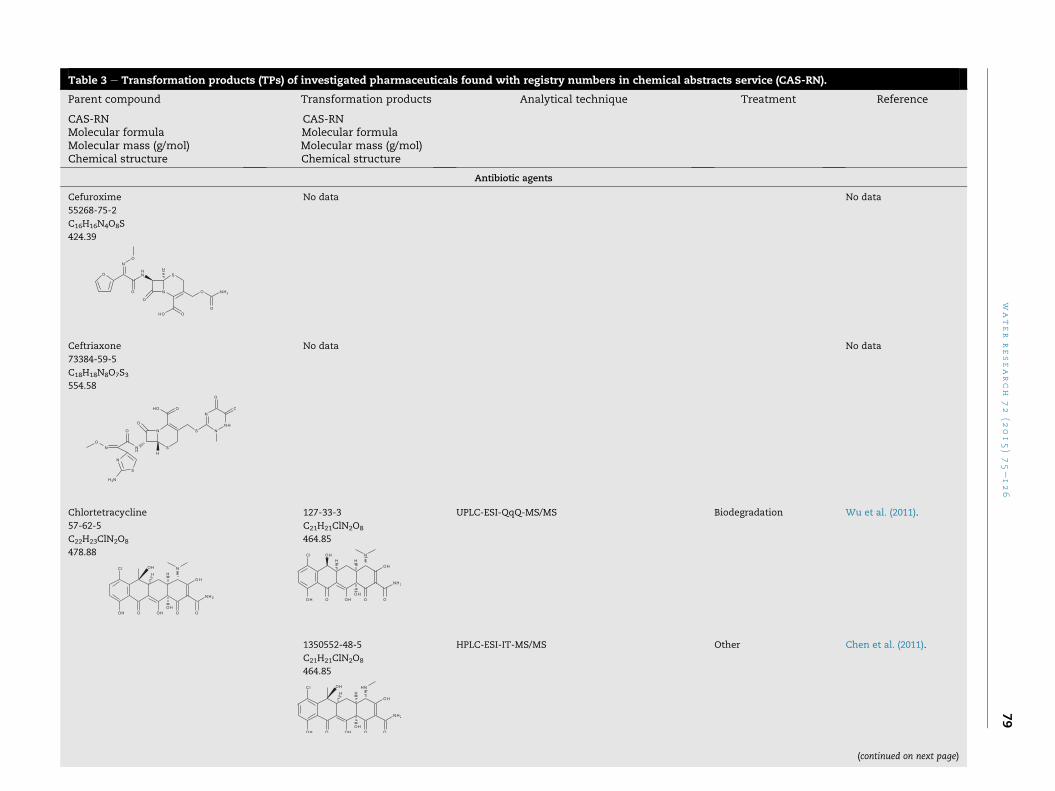
Table 3 e Transformation products (TPs) of investigated pharmaceuticals found with registry numbers in chemical abstracts service (CAS-RN).
Parent compound Transformation products Analytical technique Treatment Reference
CAS-RNMolecular formulaMolecular mass (g/mol)Chemical structure
CAS-RNMolecular formulaMolecular mass (g/mol)Chemical structure
Antibiotic agents
Cefuroxime
55268-75-2
C16H16N4O8S
424.39
No data No data
Ceftriaxone
73384-59-5
C18H18N8O7S3554.58
No data No data
Chlortetracycline
57-62-5
C22H23ClN2O8
478.88
127-33-3
C21H21ClN2O8
464.85
UPLC-ESI-QqQ-MS/MS Biodegradation Wu et al. (2011).
1350552-48-5
C21H21ClN2O8
464.85
HPLC-ESI-IT-MS/MS Other Chen et al. (2011).
(continued on next page)
water
research
72
(2015)75e126
79
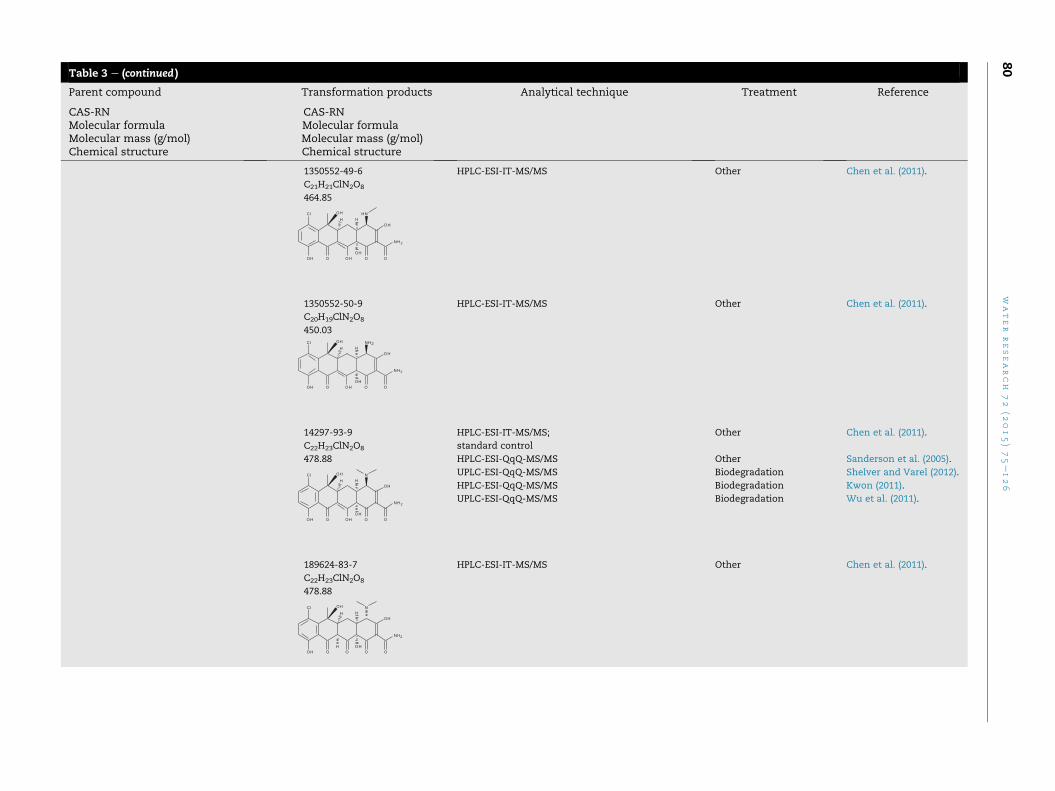
Table 3 e (continued )
Parent compound Transformation products Analytical technique Treatment Reference
CAS-RNMolecular formulaMolecular mass (g/mol)Chemical structure
CAS-RNMolecular formulaMolecular mass (g/mol)Chemical structure
1350552-49-6
C21H21ClN2O8
464.85
HPLC-ESI-IT-MS/MS Other Chen et al. (2011).
1350552-50-9
C20H19ClN2O8
450.03
HPLC-ESI-IT-MS/MS Other Chen et al. (2011).
14297-93-9
C22H23ClN2O8
478.88
HPLC-ESI-IT-MS/MS;
standard control
Other Chen et al. (2011).
HPLC-ESI-QqQ-MS/MS Other Sanderson et al. (2005).
UPLC-ESI-QqQ-MS/MS Biodegradation Shelver and Varel (2012).
HPLC-ESI-QqQ-MS/MS Biodegradation Kwon (2011).
UPLC-ESI-QqQ-MS/MS Biodegradation Wu et al. (2011).
189624-83-7
C22H23ClN2O8
478.88
HPLC-ESI-IT-MS/MS Other Chen et al. (2011).
water
research
72
(2015)75e126
80
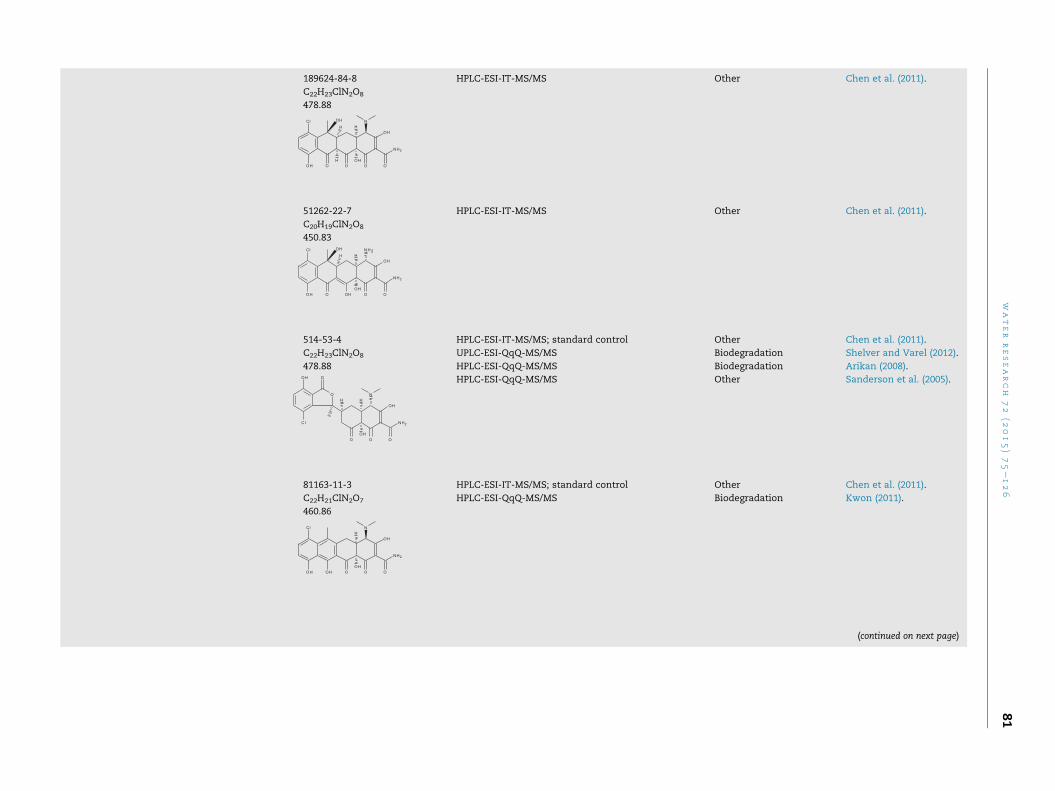
189624-84-8
C22H23ClN2O8
478.88
HPLC-ESI-IT-MS/MS Other Chen et al. (2011).
51262-22-7
C20H19ClN2O8
450.83
HPLC-ESI-IT-MS/MS Other Chen et al. (2011).
514-53-4
C22H23ClN2O8
478.88
HPLC-ESI-IT-MS/MS; standard control Other Chen et al. (2011).
UPLC-ESI-QqQ-MS/MS Biodegradation Shelver and Varel (2012).
HPLC-ESI-QqQ-MS/MS Biodegradation Arikan (2008).
HPLC-ESI-QqQ-MS/MS Other Sanderson et al. (2005).
81163-11-3
C22H21ClN2O7
460.86
HPLC-ESI-IT-MS/MS; standard control Other Chen et al. (2011).
HPLC-ESI-QqQ-MS/MS Biodegradation Kwon (2011).
(continued on next page)
water
research
72
(2015)75e126
81
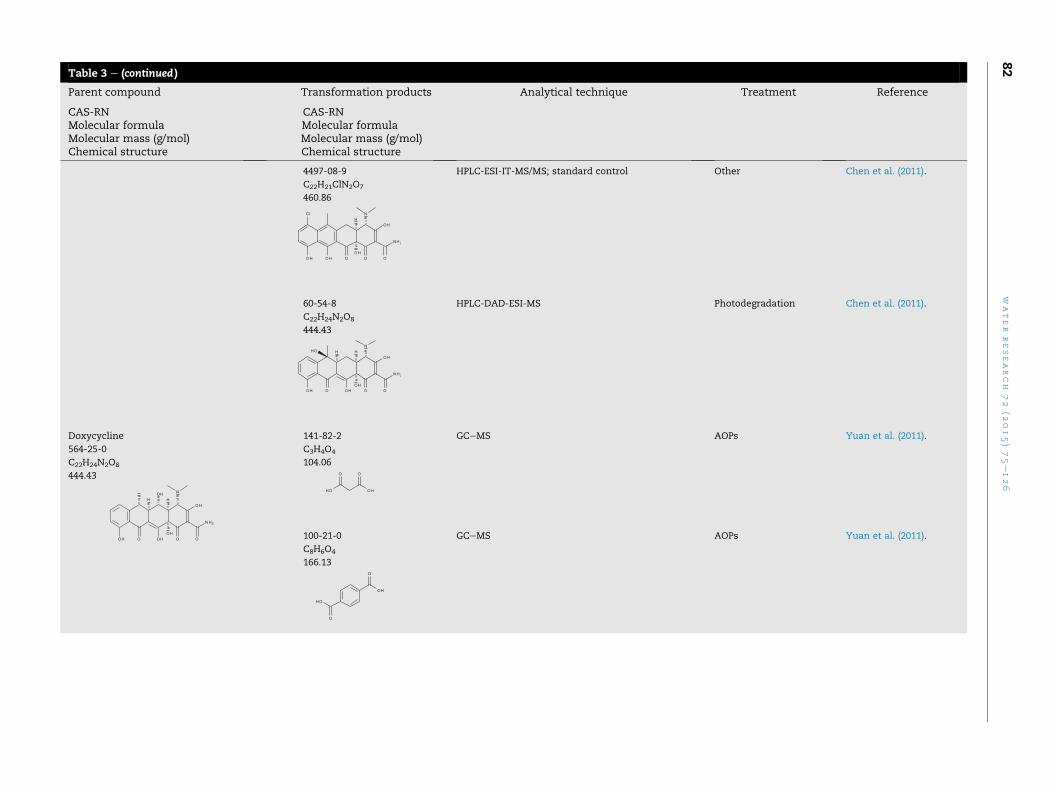
Table 3 e (continued )
Parent compound Transformation products Analytical technique Treatment Reference
CAS-RNMolecular formulaMolecular mass (g/mol)Chemical structure
CAS-RNMolecular formulaMolecular mass (g/mol)Chemical structure
4497-08-9
C22H21ClN2O7
460.86
HPLC-ESI-IT-MS/MS; standard control Other Chen et al. (2011).
60-54-8
C22H24N2O8
444.43
HPLC-DAD-ESI-MS Photodegradation Chen et al. (2011).
Doxycycline
564-25-0
C22H24N2O8
444.43
141-82-2
C3H4O4
104.06
GCeMS AOPs Yuan et al. (2011).
100-21-0
C8H6O4
166.13
GCeMS AOPs Yuan et al. (2011).
water
research
72
(2015)75e126
82
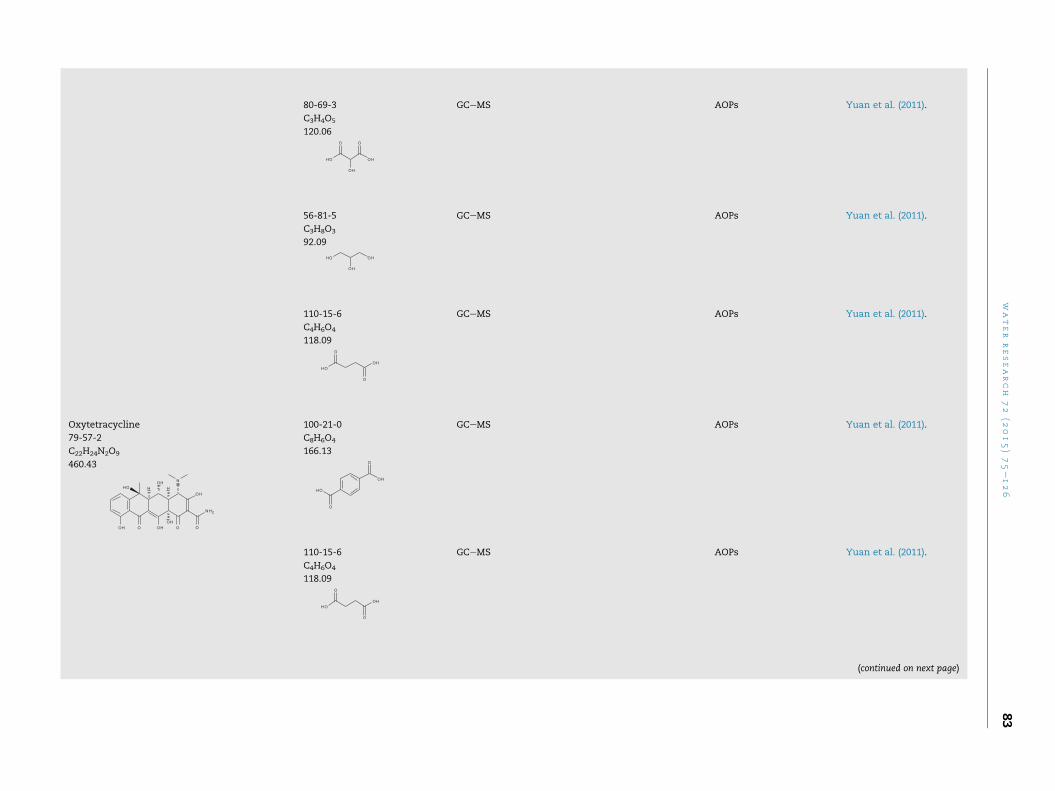
80-69-3
C3H4O5
120.06
GCeMS AOPs Yuan et al. (2011).
56-81-5
C3H8O3
92.09
GCeMS AOPs Yuan et al. (2011).
110-15-6
C4H6O4
118.09
GCeMS AOPs Yuan et al. (2011).
Oxytetracycline
79-57-2
C22H24N2O9
460.43
100-21-0
C8H6O4
166.13
GCeMS AOPs Yuan et al. (2011).
110-15-6
C4H6O4
118.09
GCeMS AOPs Yuan et al. (2011).
(continued on next page)
water
research
72
(2015)75e126
83
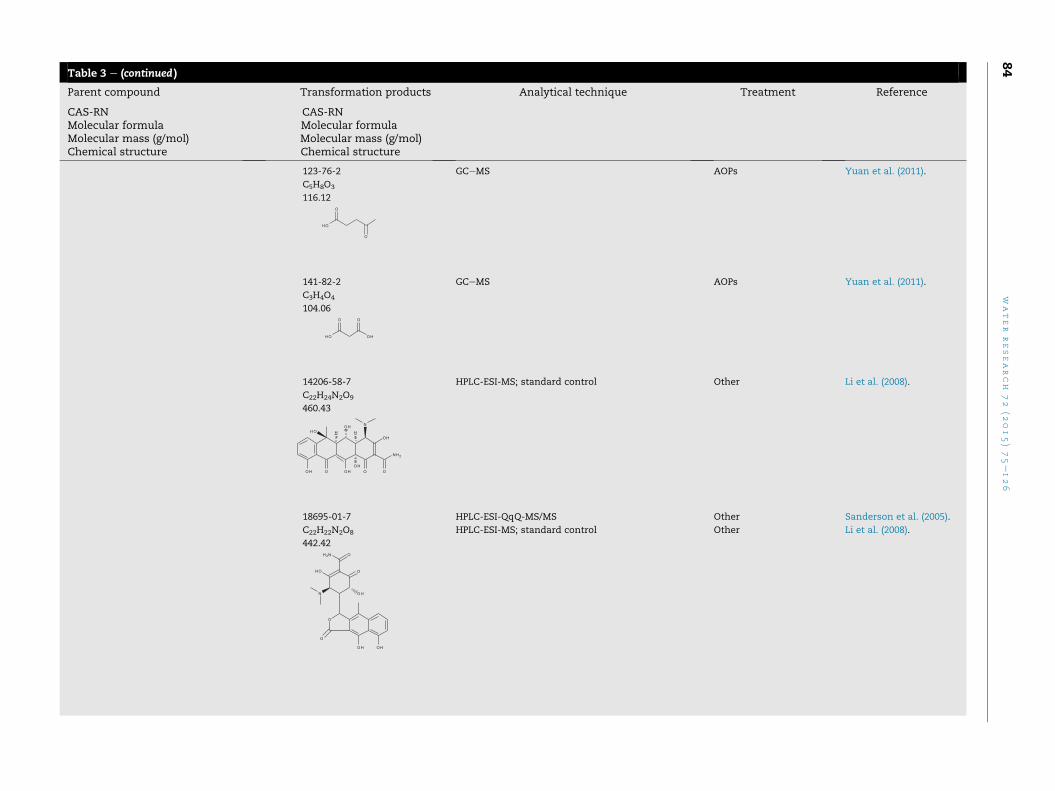
Table 3 e (continued )
Parent compound Transformation products Analytical technique Treatment Reference
CAS-RNMolecular formulaMolecular mass (g/mol)Chemical structure
CAS-RNMolecular formulaMolecular mass (g/mol)Chemical structure
123-76-2
C5H8O3
116.12
GCeMS AOPs Yuan et al. (2011).
141-82-2
C3H4O4
104.06
GCeMS AOPs Yuan et al. (2011).
14206-58-7
C22H24N2O9
460.43
HPLC-ESI-MS; standard control Other Li et al. (2008).
18695-01-7
C22H22N2O8
442.42
HPLC-ESI-QqQ-MS/MS Other Sanderson et al. (2005).
HPLC-ESI-MS; standard control Other Li et al. (2008).
water
research
72
(2015)75e126
84
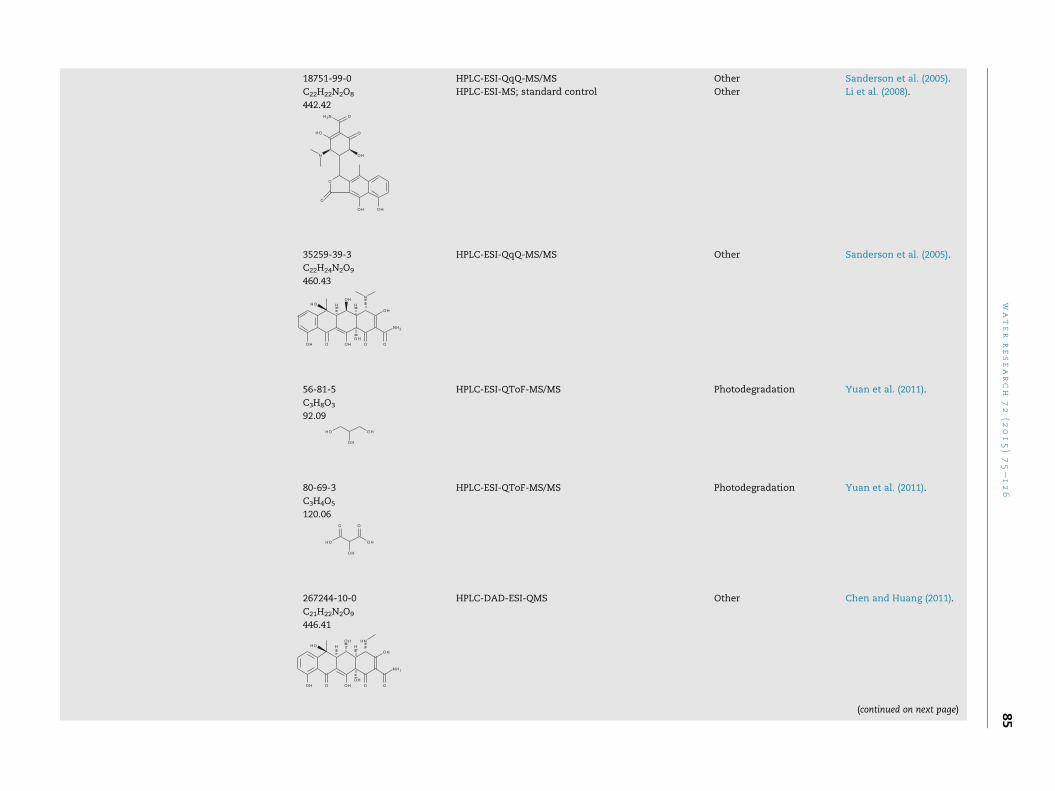
18751-99-0
C22H22N2O8
442.42
HPLC-ESI-QqQ-MS/MS Other Sanderson et al. (2005).
HPLC-ESI-MS; standard control Other Li et al. (2008).
35259-39-3
C22H24N2O9
460.43
HPLC-ESI-QqQ-MS/MS Other Sanderson et al. (2005).
56-81-5
C3H8O3
92.09
HPLC-ESI-QToF-MS/MS Photodegradation Yuan et al. (2011).
80-69-3
C3H4O5
120.06
HPLC-ESI-QToF-MS/MS Photodegradation Yuan et al. (2011).
267244-10-0
C21H22N2O9
446.41
HPLC-DAD-ESI-QMS Other Chen and Huang (2011).
(continued on next page)
water
research
72
(2015)75e126
85
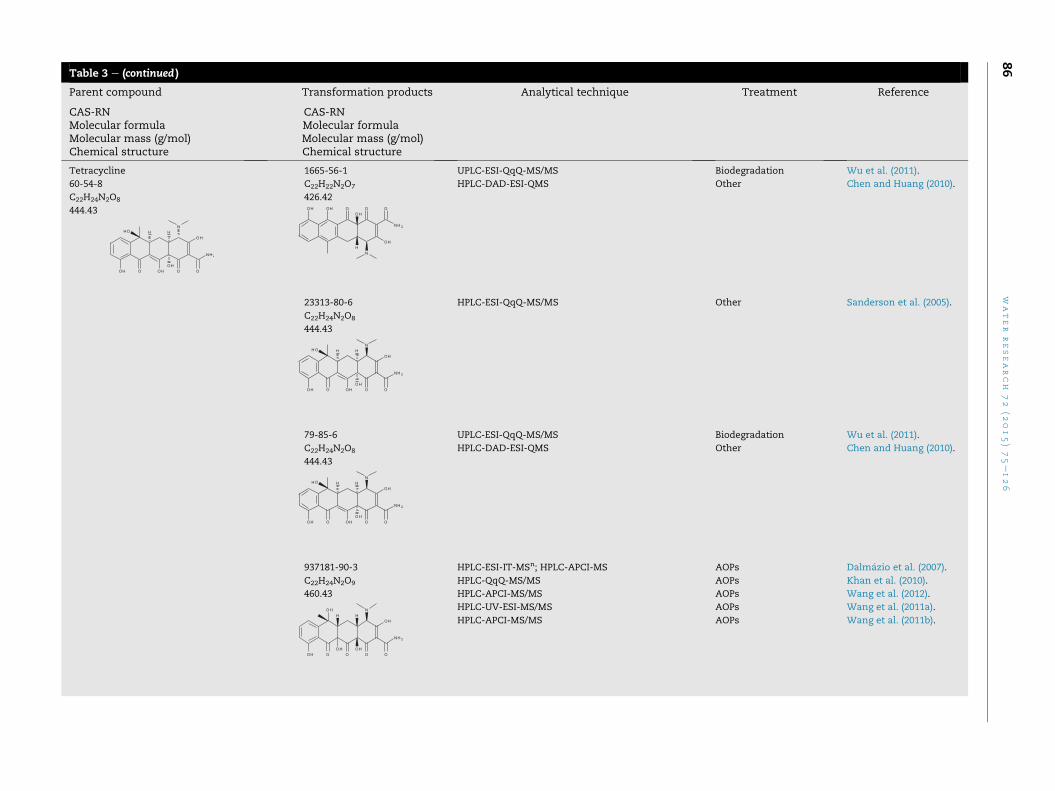
Table 3 e (continued )
Parent compound Transformation products Analytical technique Treatment Reference
CAS-RNMolecular formulaMolecular mass (g/mol)Chemical structure
CAS-RNMolecular formulaMolecular mass (g/mol)Chemical structure
Tetracycline
60-54-8
C22H24N2O8
444.43
1665-56-1
C22H22N2O7
426.42
UPLC-ESI-QqQ-MS/MS Biodegradation Wu et al. (2011).
HPLC-DAD-ESI-QMS Other Chen and Huang (2010).
23313-80-6
C22H24N2O8
444.43
HPLC-ESI-QqQ-MS/MS Other Sanderson et al. (2005).
79-85-6
C22H24N2O8
444.43
UPLC-ESI-QqQ-MS/MS Biodegradation Wu et al. (2011).
HPLC-DAD-ESI-QMS Other Chen and Huang (2010).
937181-90-3
C22H24N2O9
460.43
HPLC-ESI-IT-MSn; HPLC-APCI-MS AOPs Dalm�azio et al. (2007).
HPLC-QqQ-MS/MS AOPs Khan et al. (2010).
HPLC-APCI-MS/MS AOPs Wang et al. (2012).
HPLC-UV-ESI-MS/MS AOPs Wang et al. (2011a).
HPLC-APCI-MS/MS AOPs Wang et al. (2011b).
water
research
72
(2015)75e126
86
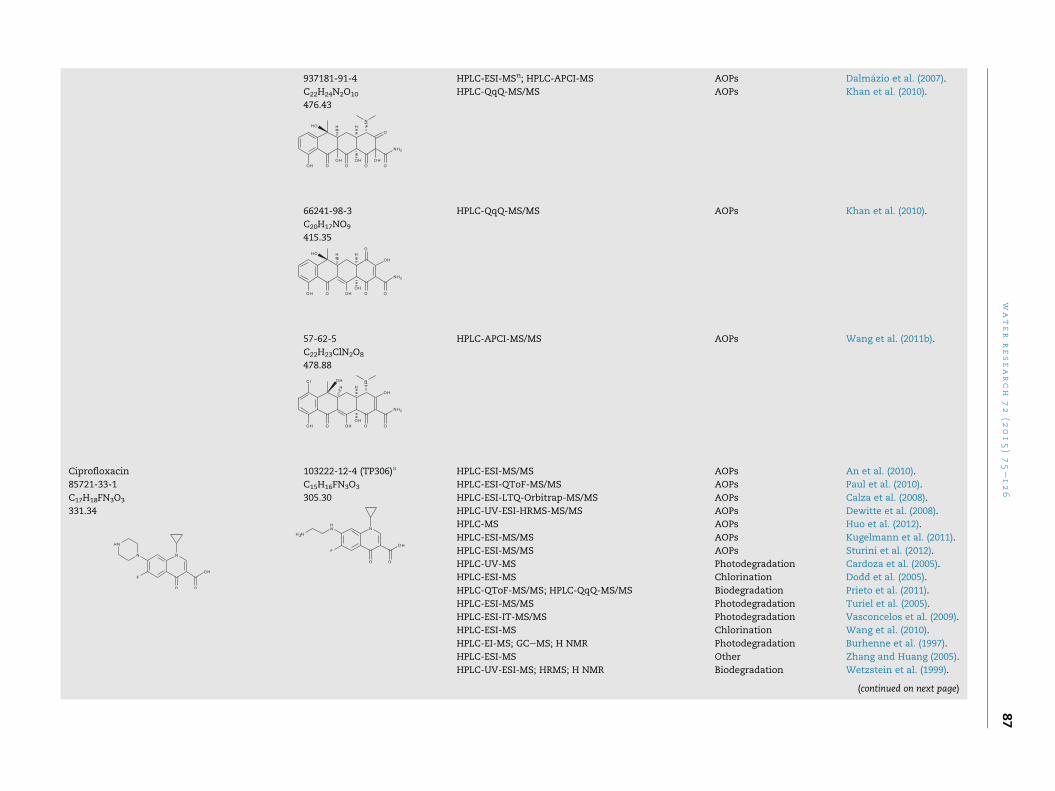
937181-91-4
C22H24N2O10
476.43
HPLC-ESI-MSn; HPLC-APCI-MS AOPs Dalm�azio et al. (2007).
HPLC-QqQ-MS/MS AOPs Khan et al. (2010).
66241-98-3
C20H17NO9
415.35
HPLC-QqQ-MS/MS AOPs Khan et al. (2010).
57-62-5
C22H23ClN2O8
478.88
HPLC-APCI-MS/MS AOPs Wang et al. (2011b).
Ciprofloxacin
85721-33-1
C17H18FN3O3
331.34
103222-12-4 (TP306)a
C15H16FN3O3
305.30
HPLC-ESI-MS/MS AOPs An et al. (2010).
HPLC-ESI-QToF-MS/MS AOPs Paul et al. (2010).
HPLC-ESI-LTQ-Orbitrap-MS/MS AOPs Calza et al. (2008).
HPLC-UV-ESI-HRMS-MS/MS AOPs Dewitte et al. (2008).
HPLC-MS AOPs Huo et al. (2012).
HPLC-ESI-MS/MS AOPs Kugelmann et al. (2011).
HPLC-ESI-MS/MS AOPs Sturini et al. (2012).
HPLC-UV-MS Photodegradation Cardoza et al. (2005).
HPLC-ESI-MS Chlorination Dodd et al. (2005).
HPLC-QToF-MS/MS; HPLC-QqQ-MS/MS Biodegradation Prieto et al. (2011).
HPLC-ESI-MS/MS Photodegradation Turiel et al. (2005).
HPLC-ESI-IT-MS/MS Photodegradation Vasconcelos et al. (2009).
HPLC-ESI-MS Chlorination Wang et al. (2010).
HPLC-EI-MS; GCeMS; H NMR Photodegradation Burhenne et al. (1997).
HPLC-ESI-MS Other Zhang and Huang (2005).
HPLC-UV-ESI-MS; HRMS; H NMR Biodegradation Wetzstein et al. (1999).
(continued on next page)
water
research
72
(2015)75e126
87
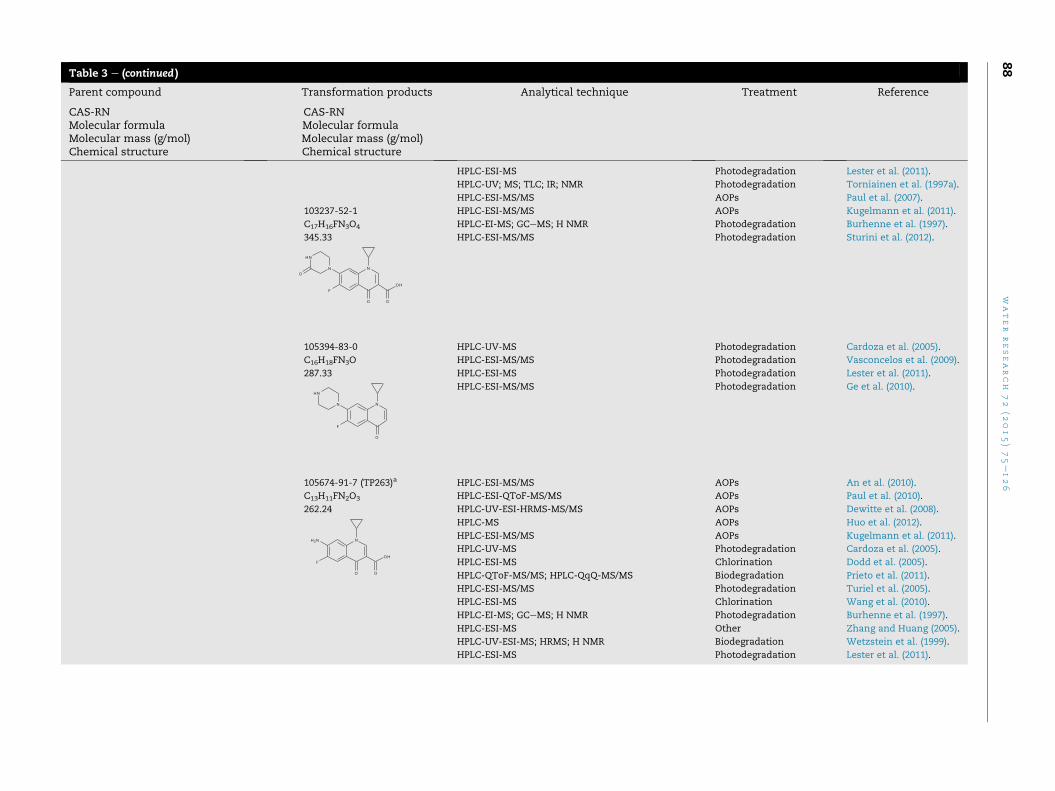
Table 3 e (continued )
Parent compound Transformation products Analytical technique Treatment Reference
CAS-RNMolecular formulaMolecular mass (g/mol)Chemical structure
CAS-RNMolecular formulaMolecular mass (g/mol)Chemical structure
HPLC-ESI-MS Photodegradation Lester et al. (2011).
HPLC-UV; MS; TLC; IR; NMR Photodegradation Torniainen et al. (1997a).
HPLC-ESI-MS/MS AOPs Paul et al. (2007).
103237-52-1
C17H16FN3O4
345.33
HPLC-ESI-MS/MS AOPs Kugelmann et al. (2011).
HPLC-EI-MS; GCeMS; H NMR Photodegradation Burhenne et al. (1997).
HPLC-ESI-MS/MS Photodegradation Sturini et al. (2012).
105394-83-0
C16H18FN3O
287.33
HPLC-UV-MS Photodegradation Cardoza et al. (2005).
HPLC-ESI-MS/MS Photodegradation Vasconcelos et al. (2009).
HPLC-ESI-MS Photodegradation Lester et al. (2011).
HPLC-ESI-MS/MS Photodegradation Ge et al. (2010).
105674-91-7 (TP263)a
C13H11FN2O3
262.24
HPLC-ESI-MS/MS AOPs An et al. (2010).
HPLC-ESI-QToF-MS/MS AOPs Paul et al. (2010).
HPLC-UV-ESI-HRMS-MS/MS AOPs Dewitte et al. (2008).
HPLC-MS AOPs Huo et al. (2012).
HPLC-ESI-MS/MS AOPs Kugelmann et al. (2011).
HPLC-UV-MS Photodegradation Cardoza et al. (2005).
HPLC-ESI-MS Chlorination Dodd et al. (2005).
HPLC-QToF-MS/MS; HPLC-QqQ-MS/MS Biodegradation Prieto et al. (2011).
HPLC-ESI-MS/MS Photodegradation Turiel et al. (2005).
HPLC-ESI-MS Chlorination Wang et al. (2010).
HPLC-EI-MS; GCeMS; H NMR Photodegradation Burhenne et al. (1997).
HPLC-ESI-MS Other Zhang and Huang (2005).
HPLC-UV-ESI-MS; HRMS; H NMR Biodegradation Wetzstein et al. (1999).
HPLC-ESI-MS Photodegradation Lester et al. (2011).
water
research
72
(2015)75e126
88
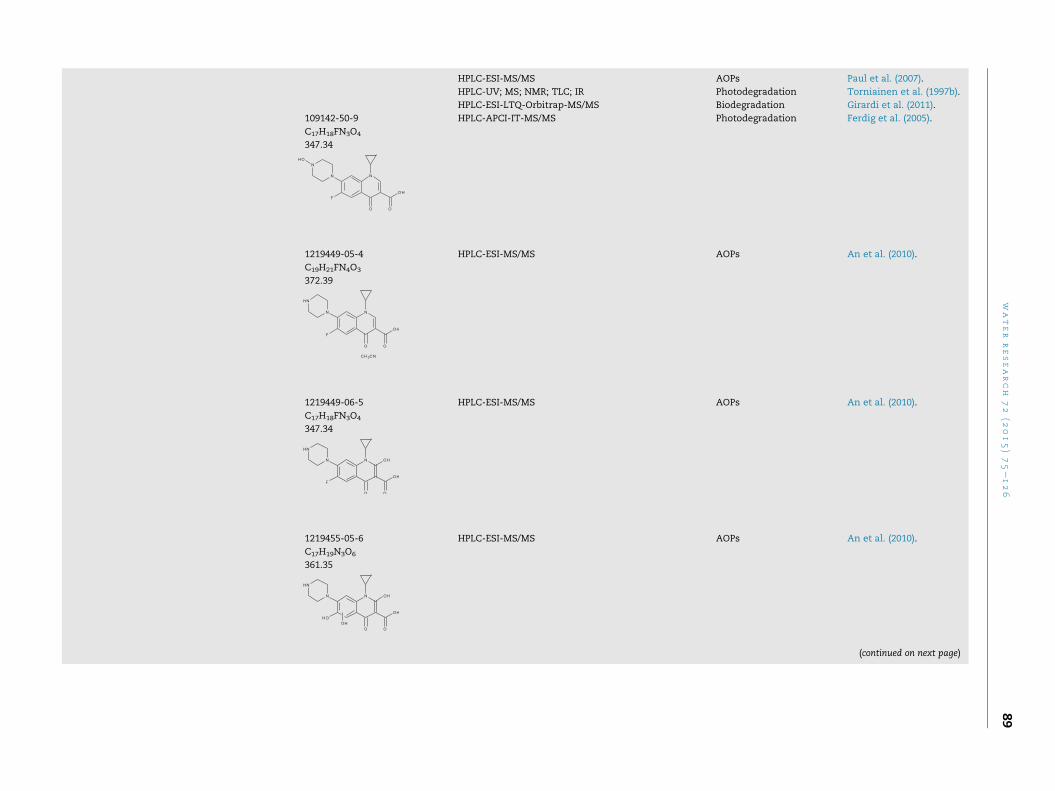
HPLC-ESI-MS/MS AOPs Paul et al. (2007).
HPLC-UV; MS; NMR; TLC; IR Photodegradation Torniainen et al. (1997b).
HPLC-ESI-LTQ-Orbitrap-MS/MS Biodegradation Girardi et al. (2011).
109142-50-9
C17H18FN3O4
347.34
HPLC-APCI-IT-MS/MS Photodegradation Ferdig et al. (2005).
1219449-05-4
C19H21FN4O3
372.39
HPLC-ESI-MS/MS AOPs An et al. (2010).
1219449-06-5
C17H18FN3O4
347.34
HPLC-ESI-MS/MS AOPs An et al. (2010).
1219455-05-6
C17H19N3O6
361.35
HPLC-ESI-MS/MS AOPs An et al. (2010).
(continued on next page)
water
research
72
(2015)75e126
89
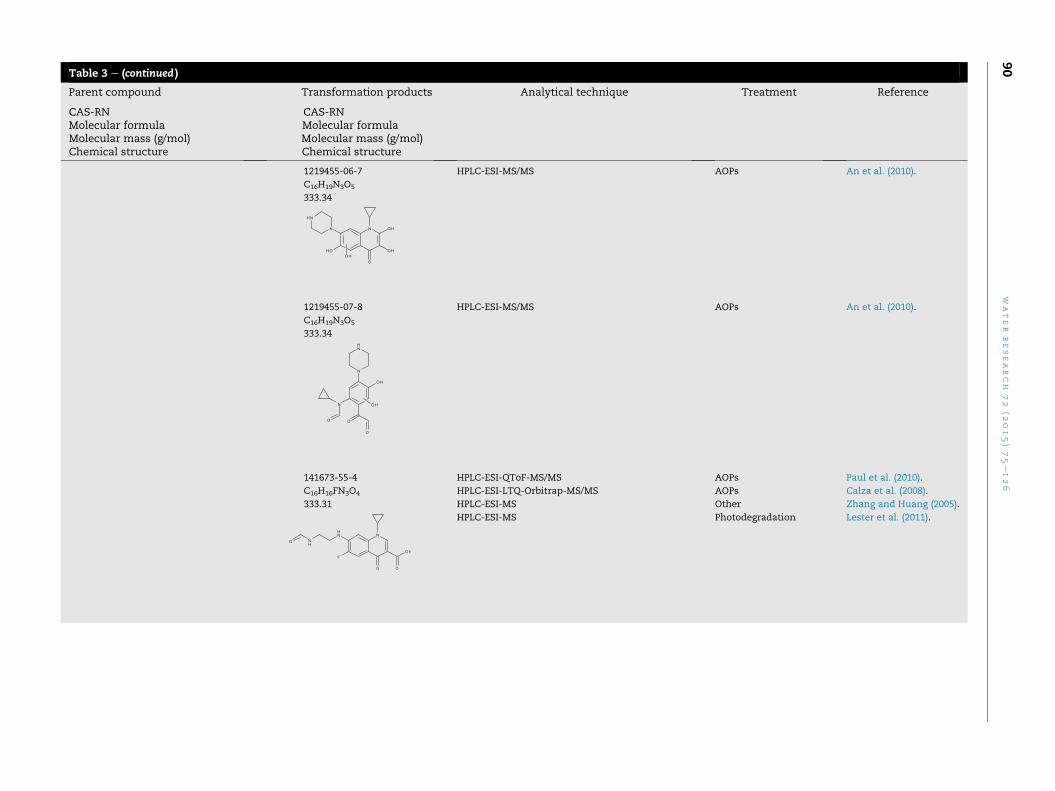
Table 3 e (continued )
Parent compound Transformation products Analytical technique Treatment Reference
CAS-RNMolecular formulaMolecular mass (g/mol)Chemical structure
CAS-RNMolecular formulaMolecular mass (g/mol)Chemical structure
1219455-06-7
C16H19N3O5
333.34
HPLC-ESI-MS/MS AOPs An et al. (2010).
1219455-07-8
C16H19N3O5
333.34
HPLC-ESI-MS/MS AOPs An et al. (2010).
141673-55-4
C16H16FN3O4
333.31
HPLC-ESI-QToF-MS/MS AOPs Paul et al. (2010).
HPLC-ESI-LTQ-Orbitrap-MS/MS AOPs Calza et al. (2008).
HPLC-ESI-MS Other Zhang and Huang (2005).
HPLC-ESI-MS Photodegradation Lester et al. (2011).
water
research
72
(2015)75e126
90
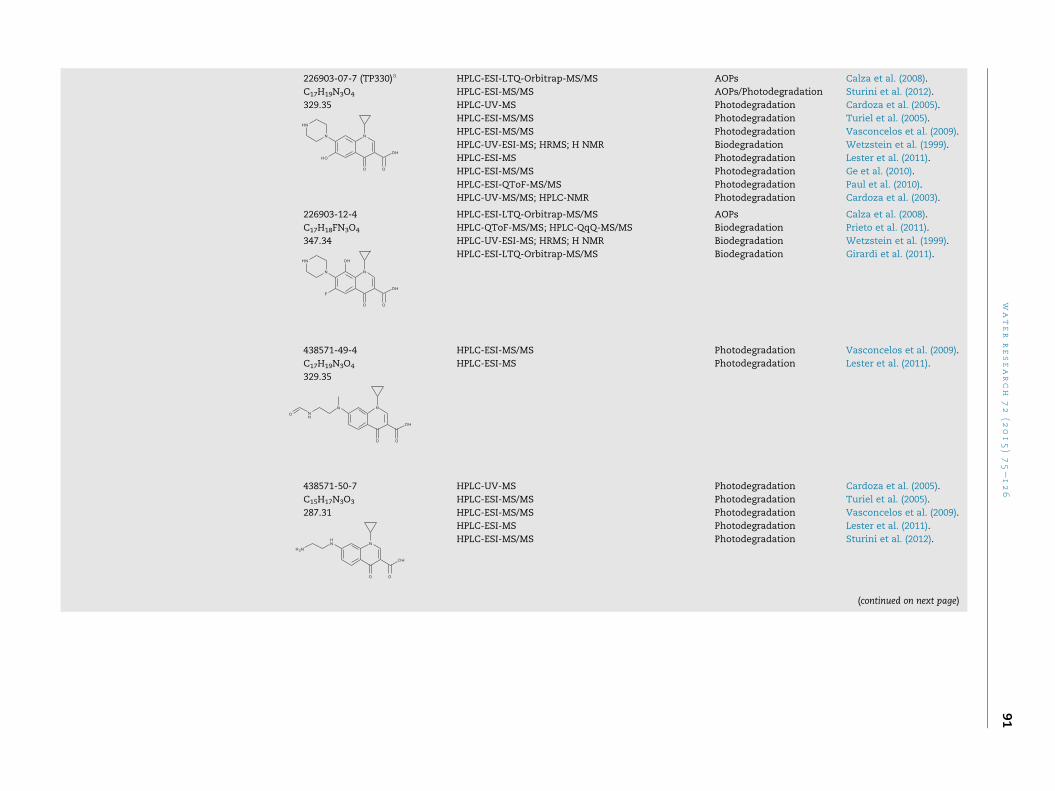
226903-07-7 (TP330)a
C17H19N3O4
329.35
HPLC-ESI-LTQ-Orbitrap-MS/MS AOPs Calza et al. (2008).
HPLC-ESI-MS/MS AOPs/Photodegradation Sturini et al. (2012).
HPLC-UV-MS Photodegradation Cardoza et al. (2005).
HPLC-ESI-MS/MS Photodegradation Turiel et al. (2005).
HPLC-ESI-MS/MS Photodegradation Vasconcelos et al. (2009).
HPLC-UV-ESI-MS; HRMS; H NMR Biodegradation Wetzstein et al. (1999).
HPLC-ESI-MS Photodegradation Lester et al. (2011).
HPLC-ESI-MS/MS Photodegradation Ge et al. (2010).
HPLC-ESI-QToF-MS/MS Photodegradation Paul et al. (2010).
HPLC-UV-MS/MS; HPLC-NMR Photodegradation Cardoza et al. (2003).
226903-12-4
C17H18FN3O4
347.34
HPLC-ESI-LTQ-Orbitrap-MS/MS AOPs Calza et al. (2008).
HPLC-QToF-MS/MS; HPLC-QqQ-MS/MS Biodegradation Prieto et al. (2011).
HPLC-UV-ESI-MS; HRMS; H NMR Biodegradation Wetzstein et al. (1999).
HPLC-ESI-LTQ-Orbitrap-MS/MS Biodegradation Girardi et al. (2011).
438571-49-4
C17H19N3O4
329.35
HPLC-ESI-MS/MS Photodegradation Vasconcelos et al. (2009).
HPLC-ESI-MS Photodegradation Lester et al. (2011).
438571-50-7
C15H17N3O3
287.31
HPLC-UV-MS Photodegradation Cardoza et al. (2005).
HPLC-ESI-MS/MS Photodegradation Turiel et al. (2005).
HPLC-ESI-MS/MS Photodegradation Vasconcelos et al. (2009).
HPLC-ESI-MS Photodegradation Lester et al. (2011).
HPLC-ESI-MS/MS Photodegradation Sturini et al. (2012).
(continued on next page)
water
research
72
(2015)75e126
91
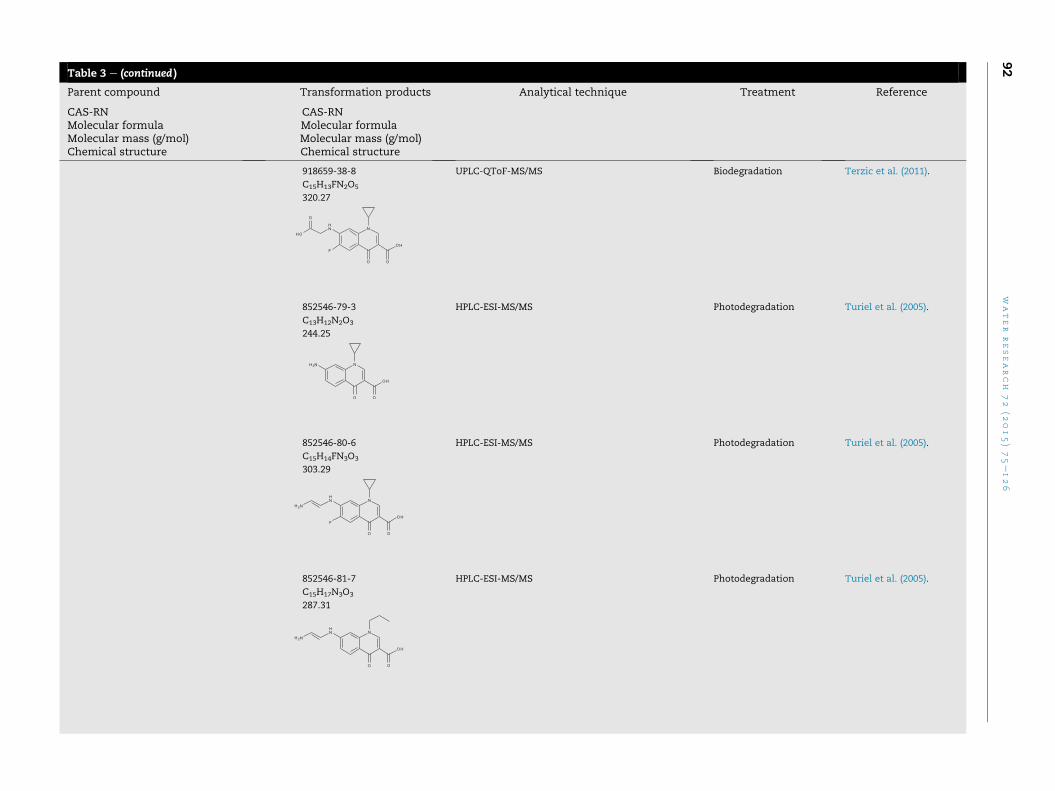
Table 3 e (continued )
Parent compound Transformation products Analytical technique Treatment Reference
CAS-RNMolecular formulaMolecular mass (g/mol)Chemical structure
CAS-RNMolecular formulaMolecular mass (g/mol)Chemical structure
918659-38-8
C15H13FN2O5
320.27
UPLC-QToF-MS/MS Biodegradation Terzic et al. (2011).
852546-79-3
C13H12N2O3
244.25
HPLC-ESI-MS/MS Photodegradation Turiel et al. (2005).
852546-80-6
C15H14FN3O3
303.29
HPLC-ESI-MS/MS Photodegradation Turiel et al. (2005).
852546-81-7
C15H17N3O3
287.31
HPLC-ESI-MS/MS Photodegradation Turiel et al. (2005).
water
research
72
(2015)75e126
92
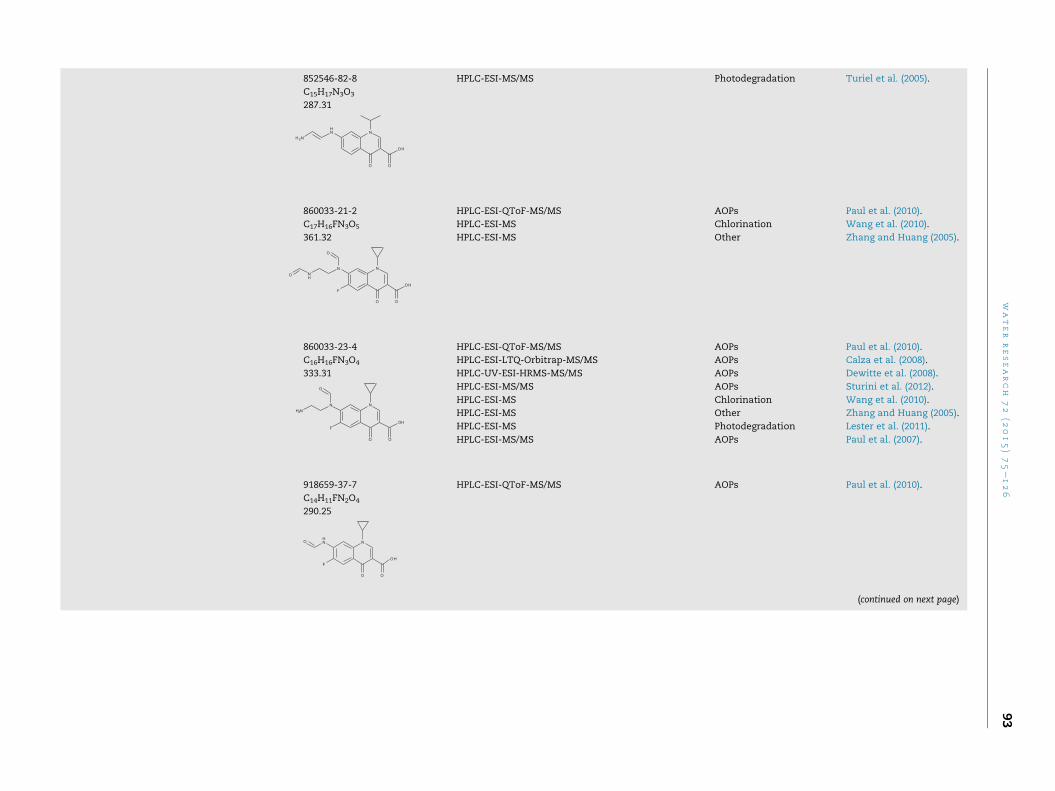
852546-82-8
C15H17N3O3
287.31
HPLC-ESI-MS/MS Photodegradation Turiel et al. (2005).
860033-21-2
C17H16FN3O5
361.32
HPLC-ESI-QToF-MS/MS AOPs Paul et al. (2010).
HPLC-ESI-MS Chlorination Wang et al. (2010).
HPLC-ESI-MS Other Zhang and Huang (2005).
860033-23-4
C16H16FN3O4
333.31
HPLC-ESI-QToF-MS/MS AOPs Paul et al. (2010).
HPLC-ESI-LTQ-Orbitrap-MS/MS AOPs Calza et al. (2008).
HPLC-UV-ESI-HRMS-MS/MS AOPs Dewitte et al. (2008).
HPLC-ESI-MS/MS AOPs Sturini et al. (2012).
HPLC-ESI-MS Chlorination Wang et al. (2010).
HPLC-ESI-MS Other Zhang and Huang (2005).
HPLC-ESI-MS Photodegradation Lester et al. (2011).
HPLC-ESI-MS/MS AOPs Paul et al. (2007).
918659-37-7
C14H11FN2O4
290.25
HPLC-ESI-QToF-MS/MS AOPs Paul et al. (2010).
(continued on next page)
water
research
72
(2015)75e126
93
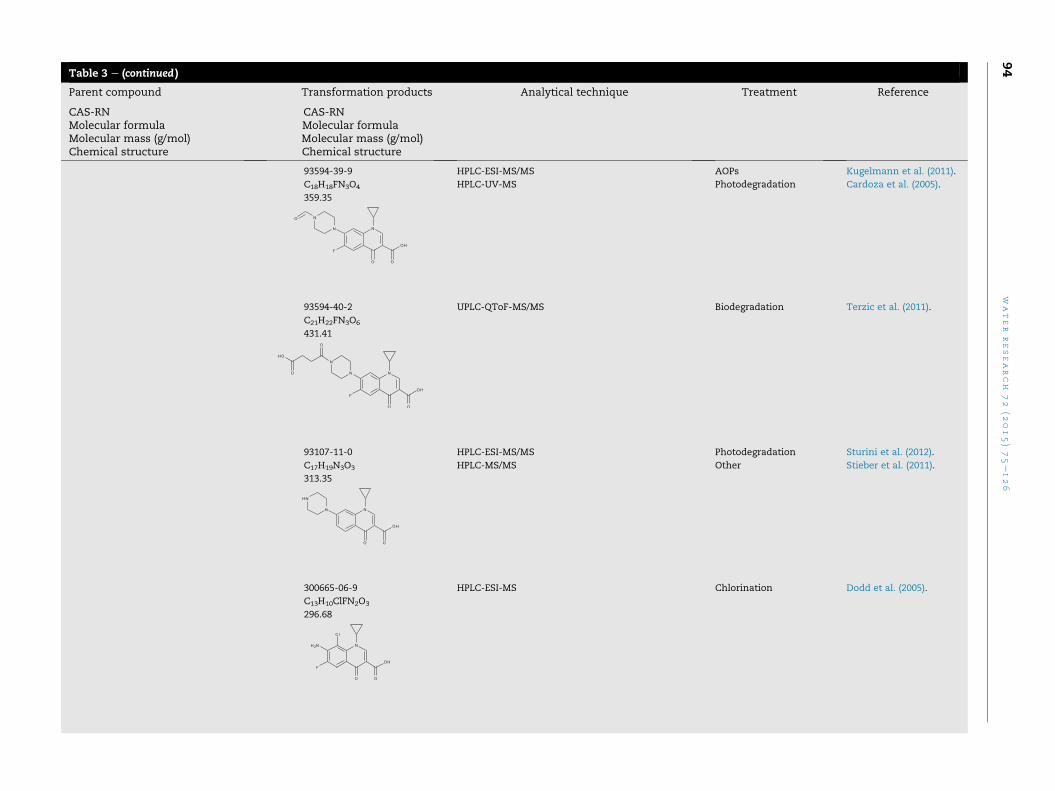
Table 3 e (continued )
Parent compound Transformation products Analytical technique Treatment Reference
CAS-RNMolecular formulaMolecular mass (g/mol)Chemical structure
CAS-RNMolecular formulaMolecular mass (g/mol)Chemical structure
93594-39-9
C18H18FN3O4
359.35
HPLC-ESI-MS/MS AOPs Kugelmann et al. (2011).
HPLC-UV-MS Photodegradation Cardoza et al. (2005).
93594-40-2
C21H22FN3O6
431.41
UPLC-QToF-MS/MS Biodegradation Terzic et al. (2011).
93107-11-0
C17H19N3O3
313.35
HPLC-ESI-MS/MS Photodegradation Sturini et al. (2012).
HPLC-MS/MS Other Stieber et al. (2011).
300665-06-9
C13H10ClFN2O3
296.68
HPLC-ESI-MS Chlorination Dodd et al. (2005).
water
research
72
(2015)75e126
94
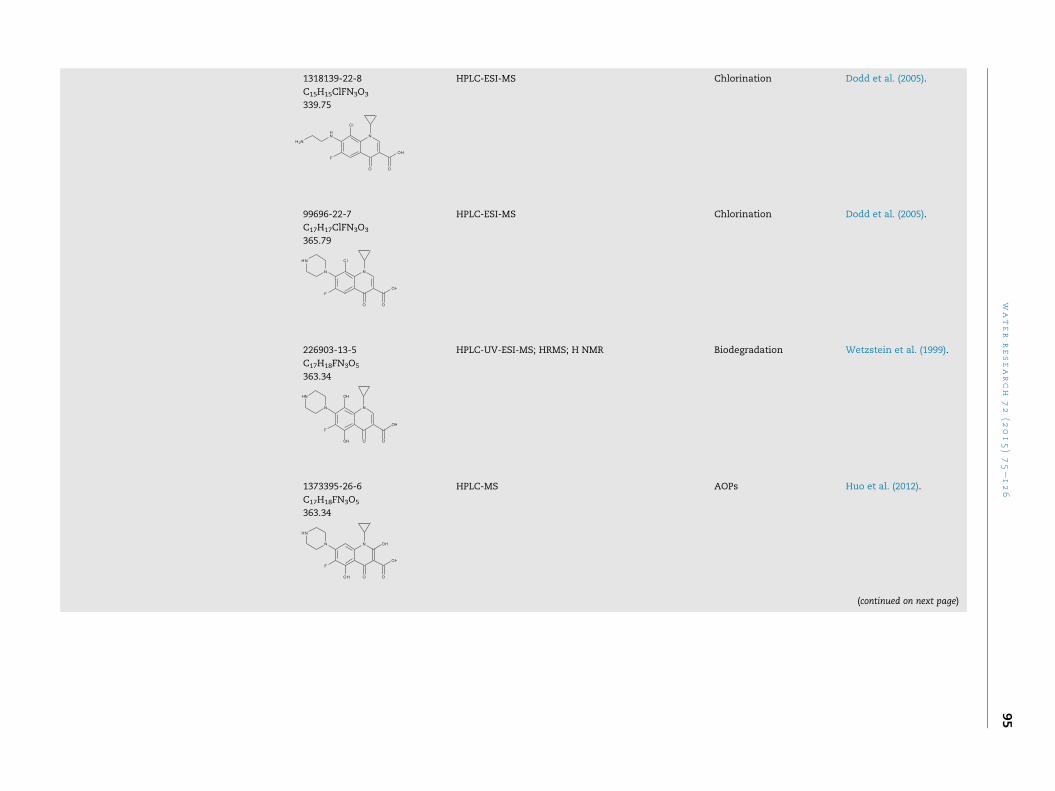
1318139-22-8
C15H15ClFN3O3
339.75
HPLC-ESI-MS Chlorination Dodd et al. (2005).
99696-22-7
C17H17ClFN3O3
365.79
HPLC-ESI-MS Chlorination Dodd et al. (2005).
226903-13-5
C17H18FN3O5
363.34
HPLC-UV-ESI-MS; HRMS; H NMR Biodegradation Wetzstein et al. (1999).
1373395-26-6
C17H18FN3O5
363.34
HPLC-MS AOPs Huo et al. (2012).
(continued on next page)
water
research
72
(2015)75e126
95
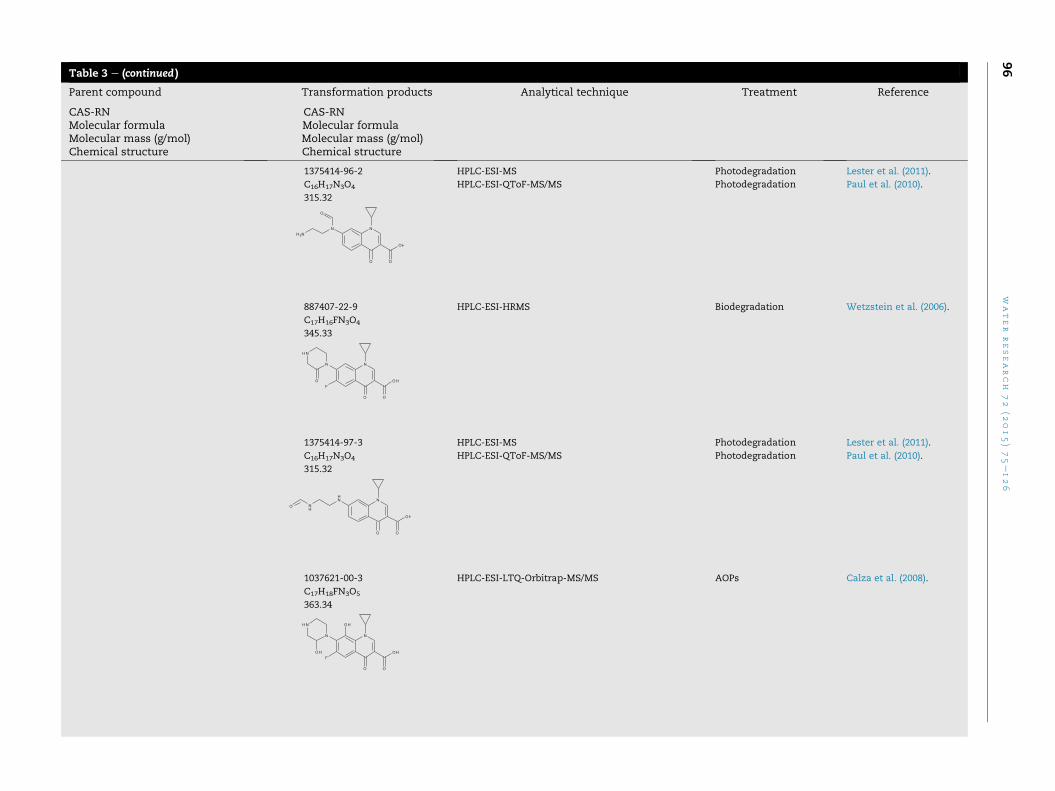
Table 3 e (continued )
Parent compound Transformation products Analytical technique Treatment Reference
CAS-RNMolecular formulaMolecular mass (g/mol)Chemical structure
CAS-RNMolecular formulaMolecular mass (g/mol)Chemical structure
1375414-96-2
C16H17N3O4
315.32
HPLC-ESI-MS Photodegradation Lester et al. (2011).
HPLC-ESI-QToF-MS/MS Photodegradation Paul et al. (2010).
887407-22-9
C17H16FN3O4
345.33
HPLC-ESI-HRMS Biodegradation Wetzstein et al. (2006).
1375414-97-3
C16H17N3O4
315.32
HPLC-ESI-MS Photodegradation Lester et al. (2011).
HPLC-ESI-QToF-MS/MS Photodegradation Paul et al. (2010).
1037621-00-3
C17H18FN3O5
363.34
HPLC-ESI-LTQ-Orbitrap-MS/MS AOPs Calza et al. (2008).
water
research
72
(2015)75e126
96
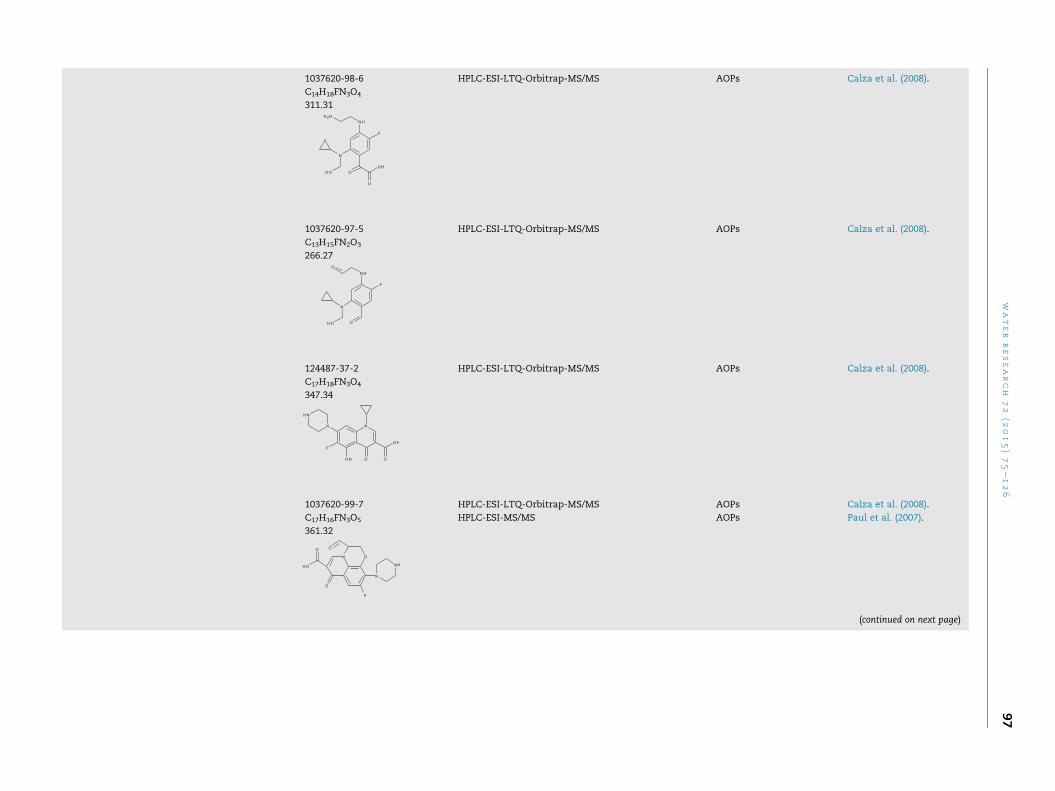
1037620-98-6
C14H18FN3O4
311.31
HPLC-ESI-LTQ-Orbitrap-MS/MS AOPs Calza et al. (2008).
1037620-97-5
C13H15FN2O3
266.27
HPLC-ESI-LTQ-Orbitrap-MS/MS AOPs Calza et al. (2008).
124487-37-2
C17H18FN3O4
347.34
HPLC-ESI-LTQ-Orbitrap-MS/MS AOPs Calza et al. (2008).
1037620-99-7
C17H16FN3O5
361.32
HPLC-ESI-LTQ-Orbitrap-MS/MS AOPs Calza et al. (2008).
HPLC-ESI-MS/MS AOPs Paul et al. (2007).
(continued on next page)
water
research
72
(2015)75e126
97

Table 3 e (continued )
Parent compound Transformation products Analytical technique Treatment Reference
CAS-RNMolecular formulaMolecular mass (g/mol)Chemical structure
CAS-RNMolecular formulaMolecular mass (g/mol)Chemical structure
226903-09-9
C15H16FN3O2
289.3
HPLC-UV-ESI-MS; HRMS; H NMR Biodegradation Wetzstein et al. (1999).
HPLC-UV-ESI-HRMS-MS/MS AOPs Dewitte et al. (2008).
1031898-44-8
C17H18FN3O4
347.35
HPLC-UV-ESI-HRMS-MS/MS AOPs Dewitte et al. (2008).
1031898-45-9
C17H16FN3O5
361.34
HPLC-UV-ESI-HRMS-MS/MS AOPs Dewitte et al. (2008).
1031767-21-1
C16H16FN3O5
349.31
HPLC-UV-ESI-HRMS-MS/MS AOPs Dewitte et al. (2008).
water
research
72
(2015)75e126
98
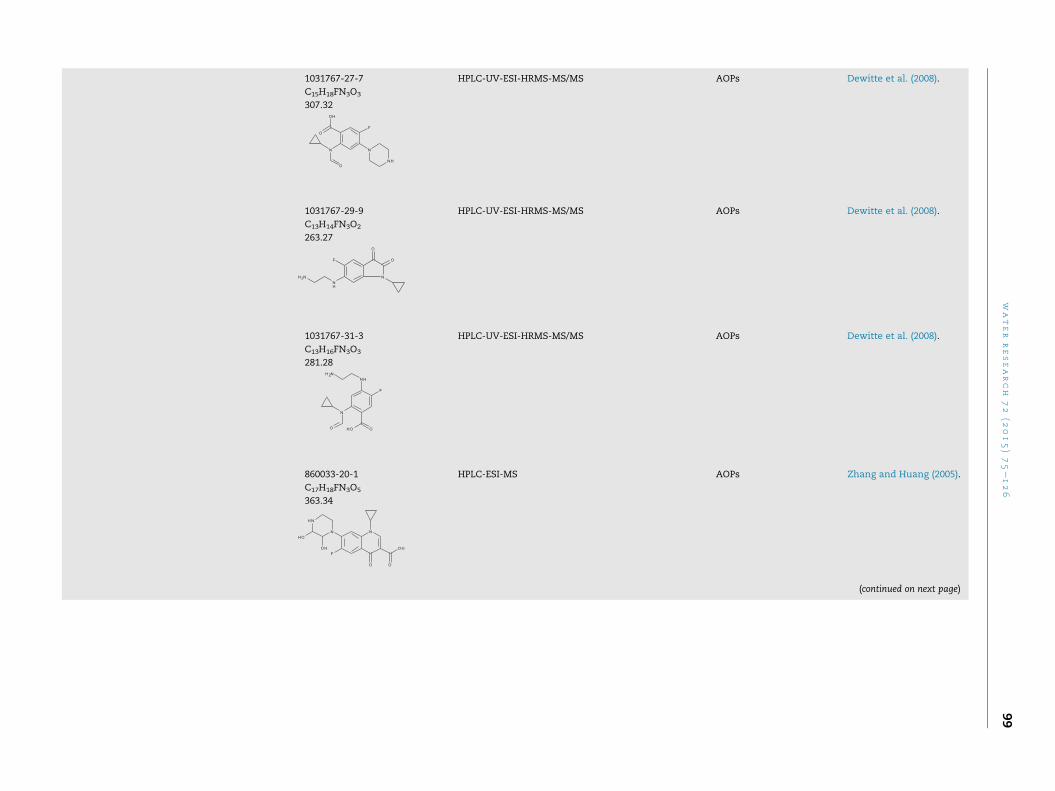
1031767-27-7
C15H18FN3O3
307.32
HPLC-UV-ESI-HRMS-MS/MS AOPs Dewitte et al. (2008).
1031767-29-9
C13H14FN3O2
263.27
HPLC-UV-ESI-HRMS-MS/MS AOPs Dewitte et al. (2008).
1031767-31-3
C13H16FN3O3
281.28
HPLC-UV-ESI-HRMS-MS/MS AOPs Dewitte et al. (2008).
860033-20-1
C17H18FN3O5
363.34
HPLC-ESI-MS AOPs Zhang and Huang (2005).
(continued on next page)
water
research
72
(2015)75e126
99
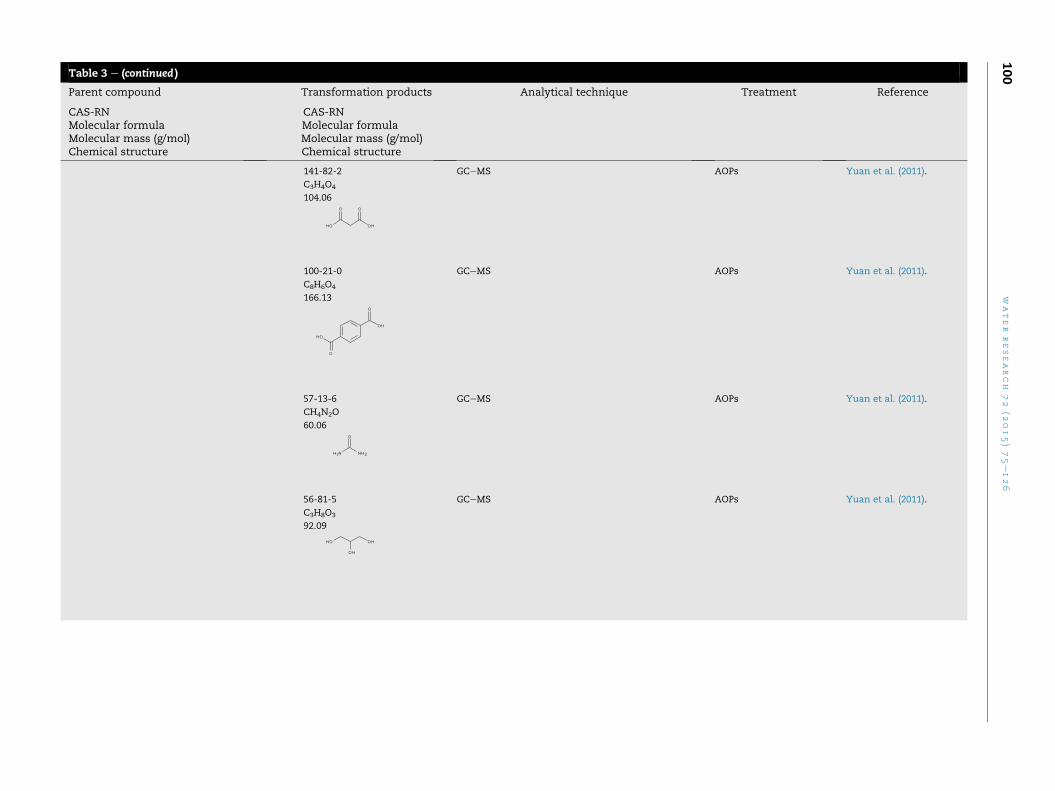
Table 3 e (continued )
Parent compound Transformation products Analytical technique Treatment Reference
CAS-RNMolecular formulaMolecular mass (g/mol)Chemical structure
CAS-RNMolecular formulaMolecular mass (g/mol)Chemical structure
141-82-2
C3H4O4
104.06
GCeMS AOPs Yuan et al. (2011).
100-21-0
C8H6O4
166.13
GCeMS AOPs Yuan et al. (2011).
57-13-6
CH4N2O
60.06
GCeMS AOPs Yuan et al. (2011).
56-81-5
C3H8O3
92.09
GCeMS AOPs Yuan et al. (2011).
water
research
72
(2015)75e126
100
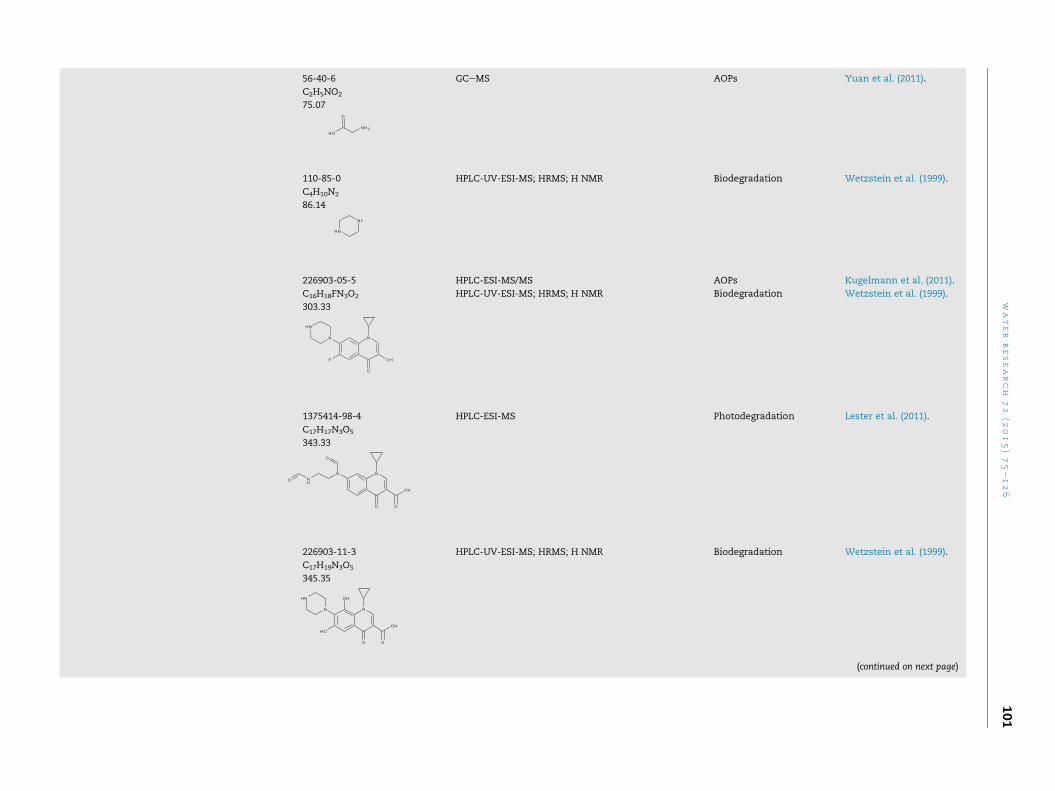
56-40-6
C2H5NO2
75.07
GCeMS AOPs Yuan et al. (2011).
110-85-0
C4H10N2
86.14
HPLC-UV-ESI-MS; HRMS; H NMR Biodegradation Wetzstein et al. (1999).
226903-05-5
C16H18FN3O2
303.33
HPLC-ESI-MS/MS AOPs Kugelmann et al. (2011).
HPLC-UV-ESI-MS; HRMS; H NMR Biodegradation Wetzstein et al. (1999).
1375414-98-4
C17H17N3O5
343.33
HPLC-ESI-MS Photodegradation Lester et al. (2011).
226903-11-3
C17H19N3O5
345.35
HPLC-UV-ESI-MS; HRMS; H NMR Biodegradation Wetzstein et al. (1999).
(continued on next page)
water
research
72
(2015)75e126
101
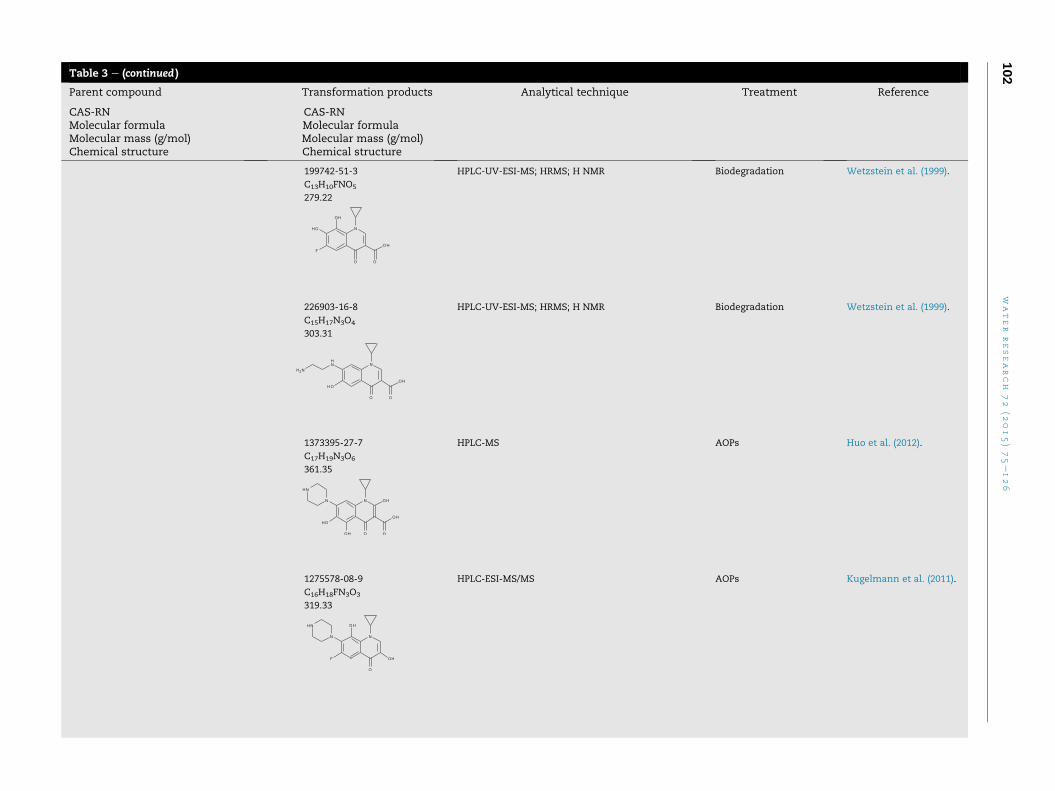
Table 3 e (continued )
Parent compound Transformation products Analytical technique Treatment Reference
CAS-RNMolecular formulaMolecular mass (g/mol)Chemical structure
CAS-RNMolecular formulaMolecular mass (g/mol)Chemical structure
199742-51-3
C13H10FNO5
279.22
HPLC-UV-ESI-MS; HRMS; H NMR Biodegradation Wetzstein et al. (1999).
226903-16-8
C15H17N3O4
303.31
HPLC-UV-ESI-MS; HRMS; H NMR Biodegradation Wetzstein et al. (1999).
1373395-27-7
C17H19N3O6
361.35
HPLC-MS AOPs Huo et al. (2012).
1275578-08-9
C16H18FN3O3
319.33
HPLC-ESI-MS/MS AOPs Kugelmann et al. (2011).
water
research
72
(2015)75e126
102
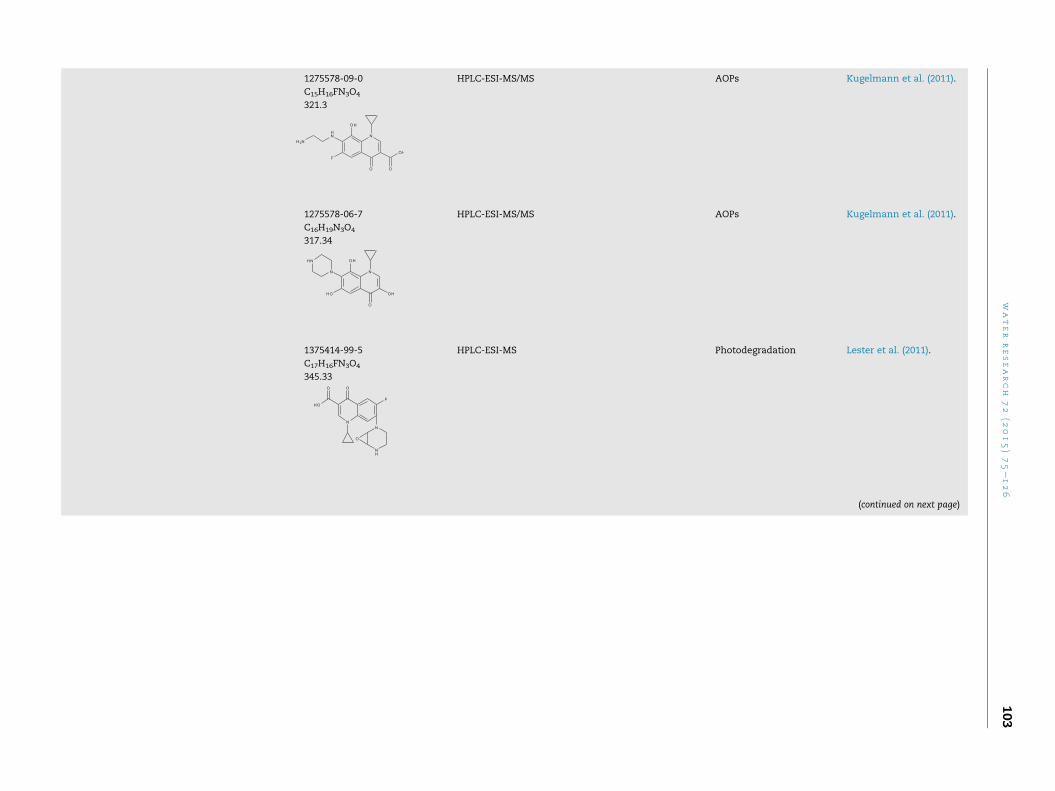
1275578-09-0
C15H16FN3O4
321.3
HPLC-ESI-MS/MS AOPs Kugelmann et al. (2011).
1275578-06-7
C16H19N3O4
317.34
HPLC-ESI-MS/MS AOPs Kugelmann et al. (2011).
1375414-99-5
C17H16FN3O4
345.33
HPLC-ESI-MS Photodegradation Lester et al. (2011).
(continued on next page)
water
research
72
(2015)75e126
103
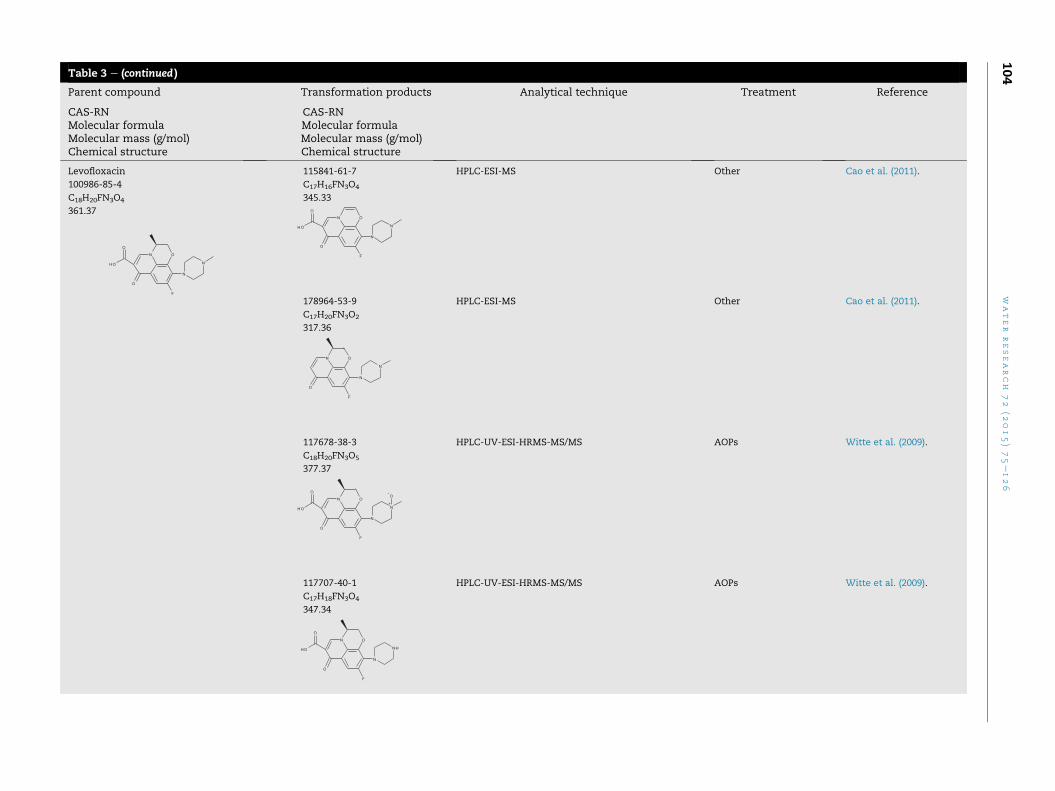
Table 3 e (continued )
Parent compound Transformation products Analytical technique Treatment Reference
CAS-RNMolecular formulaMolecular mass (g/mol)Chemical structure
CAS-RNMolecular formulaMolecular mass (g/mol)Chemical structure
Levofloxacin
100986-85-4
C18H20FN3O4
361.37
115841-61-7
C17H16FN3O4
345.33
HPLC-ESI-MS Other Cao et al. (2011).
178964-53-9
C17H20FN3O2
317.36
HPLC-ESI-MS Other Cao et al. (2011).
117678-38-3
C18H20FN3O5
377.37
HPLC-UV-ESI-HRMS-MS/MS AOPs Witte et al. (2009).
117707-40-1
C17H18FN3O4
347.34
HPLC-UV-ESI-HRMS-MS/MS AOPs Witte et al. (2009).
water
research
72
(2015)75e126
104
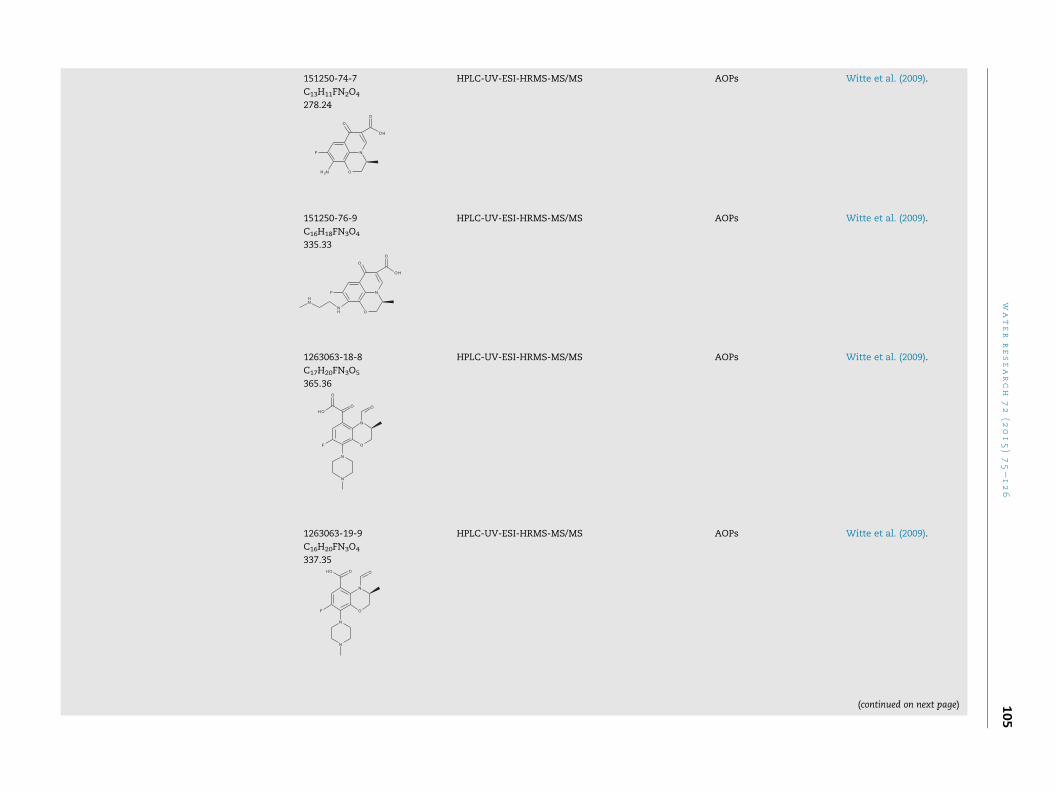
151250-74-7
C13H11FN2O4
278.24
HPLC-UV-ESI-HRMS-MS/MS AOPs Witte et al. (2009).
151250-76-9
C16H18FN3O4
335.33
HPLC-UV-ESI-HRMS-MS/MS AOPs Witte et al. (2009).
1263063-18-8
C17H20FN3O5
365.36
HPLC-UV-ESI-HRMS-MS/MS AOPs Witte et al. (2009).
1263063-19-9
C16H20FN3O4
337.35
HPLC-UV-ESI-HRMS-MS/MS AOPs Witte et al. (2009).
(continued on next page)
water
research
72
(2015)75e126
105
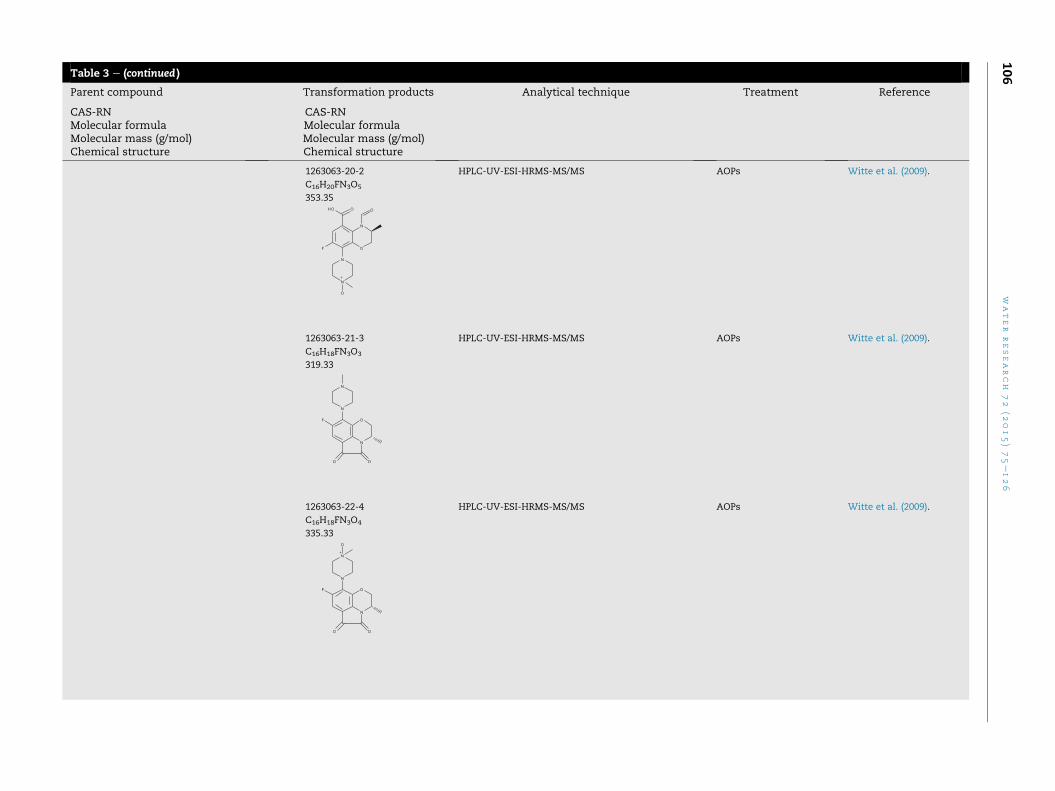
Table 3 e (continued )
Parent compound Transformation products Analytical technique Treatment Reference
CAS-RNMolecular formulaMolecular mass (g/mol)Chemical structure
CAS-RNMolecular formulaMolecular mass (g/mol)Chemical structure
1263063-20-2
C16H20FN3O5
353.35
HPLC-UV-ESI-HRMS-MS/MS AOPs Witte et al. (2009).
1263063-21-3
C16H18FN3O3
319.33
HPLC-UV-ESI-HRMS-MS/MS AOPs Witte et al. (2009).
1263063-22-4
C16H18FN3O4
335.33
HPLC-UV-ESI-HRMS-MS/MS AOPs Witte et al. (2009).
water
research
72
(2015)75e126
106
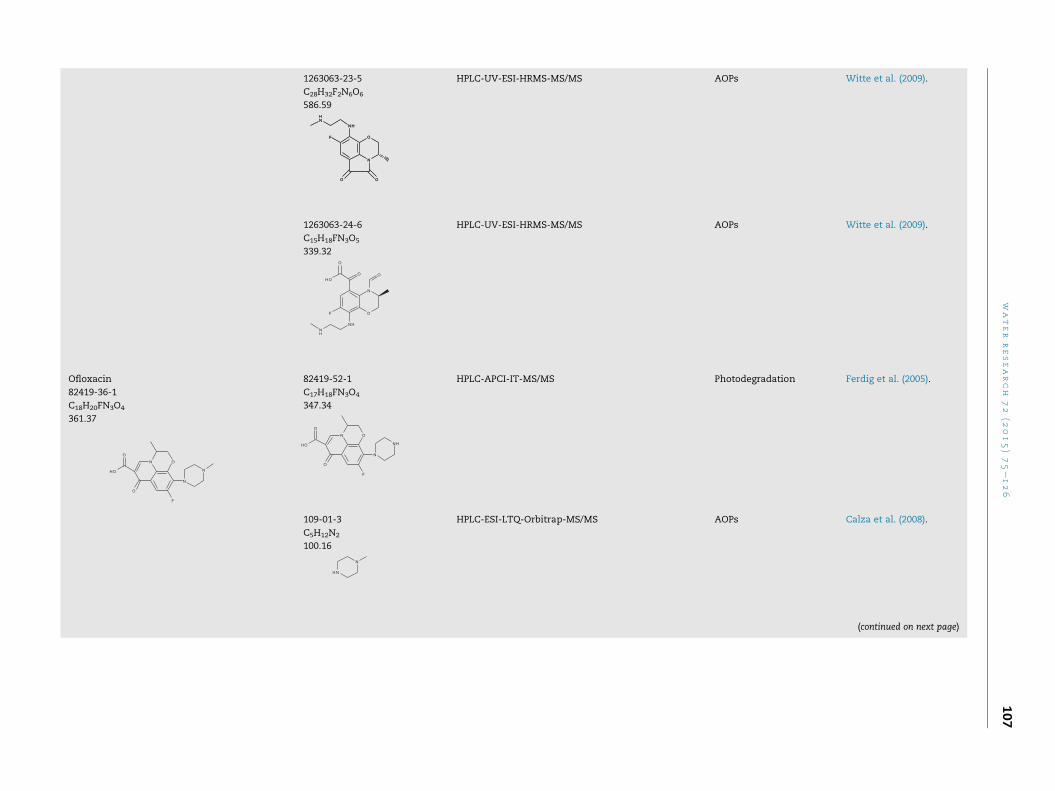
1263063-23-5
C28H32F2N6O6
586.59
HPLC-UV-ESI-HRMS-MS/MS AOPs Witte et al. (2009).
1263063-24-6
C15H18FN3O5
339.32
HPLC-UV-ESI-HRMS-MS/MS AOPs Witte et al. (2009).
Ofloxacin
82419-36-1
C18H20FN3O4
361.37
82419-52-1
C17H18FN3O4
347.34
HPLC-APCI-IT-MS/MS Photodegradation Ferdig et al. (2005).
109-01-3
C5H12N2
100.16
HPLC-ESI-LTQ-Orbitrap-MS/MS AOPs Calza et al. (2008).
(continued on next page)
water
research
72
(2015)75e126
107
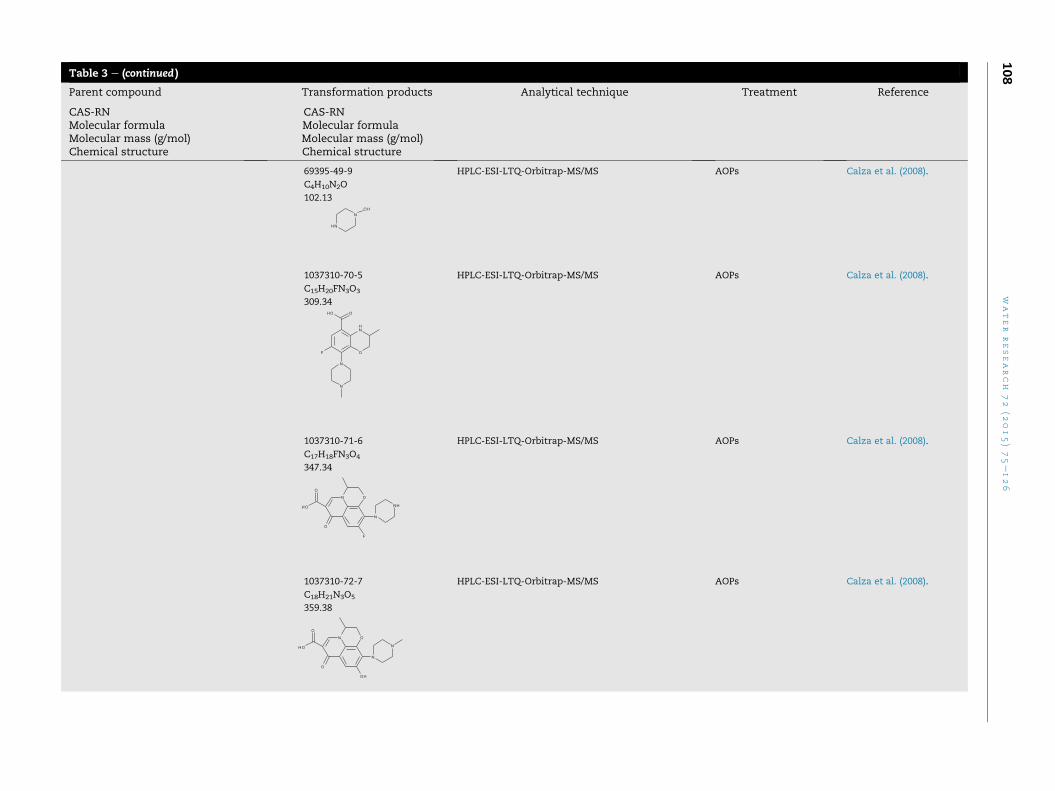
Table 3 e (continued )
Parent compound Transformation products Analytical technique Treatment Reference
CAS-RNMolecular formulaMolecular mass (g/mol)Chemical structure
CAS-RNMolecular formulaMolecular mass (g/mol)Chemical structure
69395-49-9
C4H10N2O
102.13
HPLC-ESI-LTQ-Orbitrap-MS/MS AOPs Calza et al. (2008).
1037310-70-5
C15H20FN3O3
309.34
HPLC-ESI-LTQ-Orbitrap-MS/MS AOPs Calza et al. (2008).
1037310-71-6
C17H18FN3O4
347.34
HPLC-ESI-LTQ-Orbitrap-MS/MS AOPs Calza et al. (2008).
1037310-72-7
C18H21N3O5
359.38
HPLC-ESI-LTQ-Orbitrap-MS/MS AOPs Calza et al. (2008).
water
research
72
(2015)75e126
108
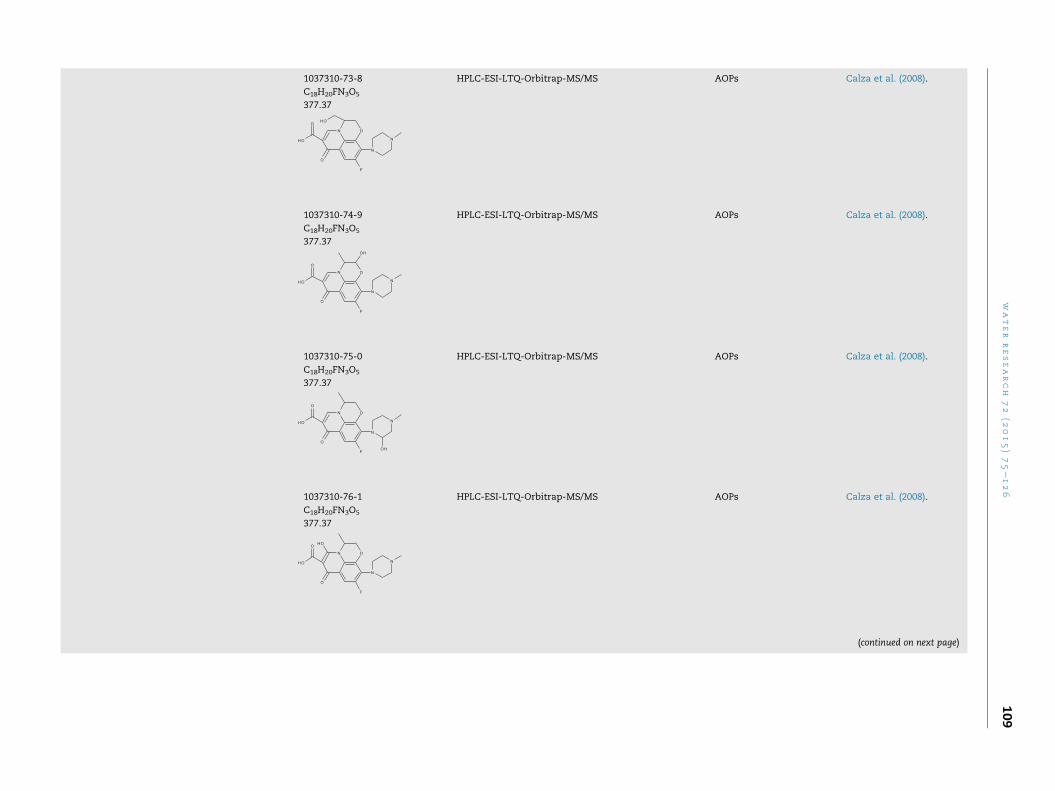
1037310-73-8
C18H20FN3O5
377.37
HPLC-ESI-LTQ-Orbitrap-MS/MS AOPs Calza et al. (2008).
1037310-74-9
C18H20FN3O5
377.37
HPLC-ESI-LTQ-Orbitrap-MS/MS AOPs Calza et al. (2008).
1037310-75-0
C18H20FN3O5
377.37
HPLC-ESI-LTQ-Orbitrap-MS/MS AOPs Calza et al. (2008).
1037310-76-1
C18H20FN3O5
377.37
HPLC-ESI-LTQ-Orbitrap-MS/MS AOPs Calza et al. (2008).
(continued on next page)
water
research
72
(2015)75e126
109
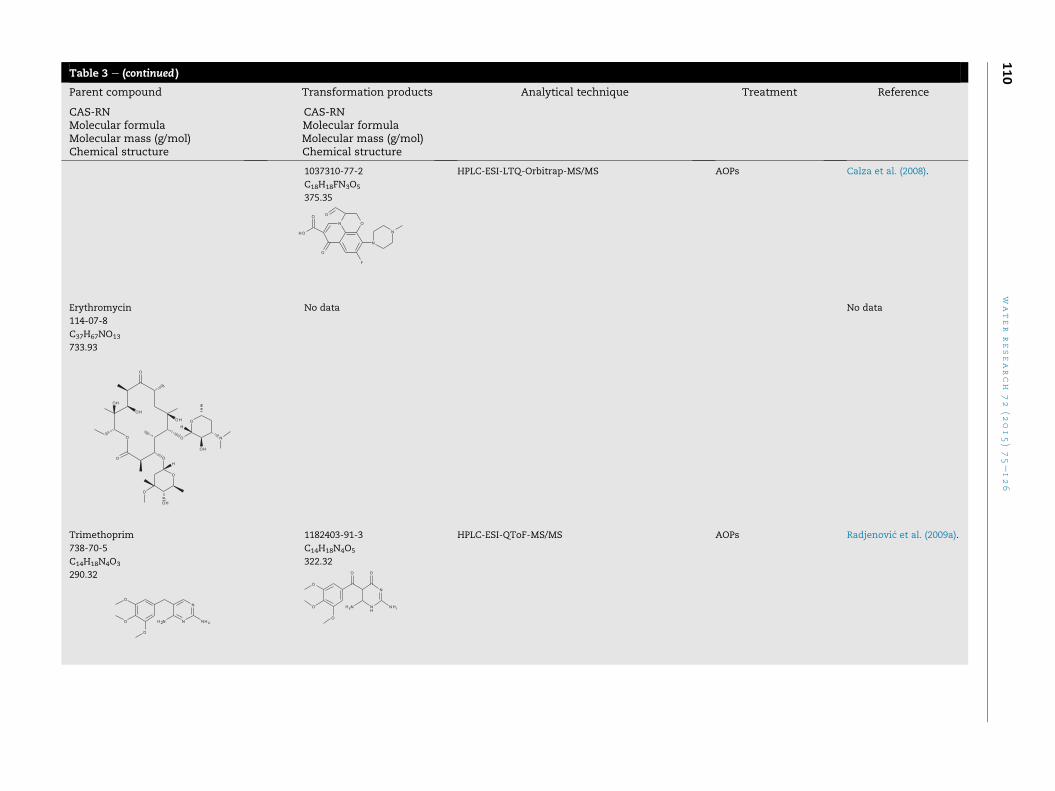
Table 3 e (continued )
Parent compound Transformation products Analytical technique Treatment Reference
CAS-RNMolecular formulaMolecular mass (g/mol)Chemical structure
CAS-RNMolecular formulaMolecular mass (g/mol)Chemical structure
1037310-77-2
C18H18FN3O5
375.35
HPLC-ESI-LTQ-Orbitrap-MS/MS AOPs Calza et al. (2008).
Erythromycin
114-07-8
C37H67NO13
733.93
No data No data
Trimethoprim
738-70-5
C14H18N4O3
290.32
1182403-91-3
C14H18N4O5
322.32
HPLC-ESI-QToF-MS/MS AOPs Radjenovi�c et al. (2009a).
water
research
72
(2015)75e126
110
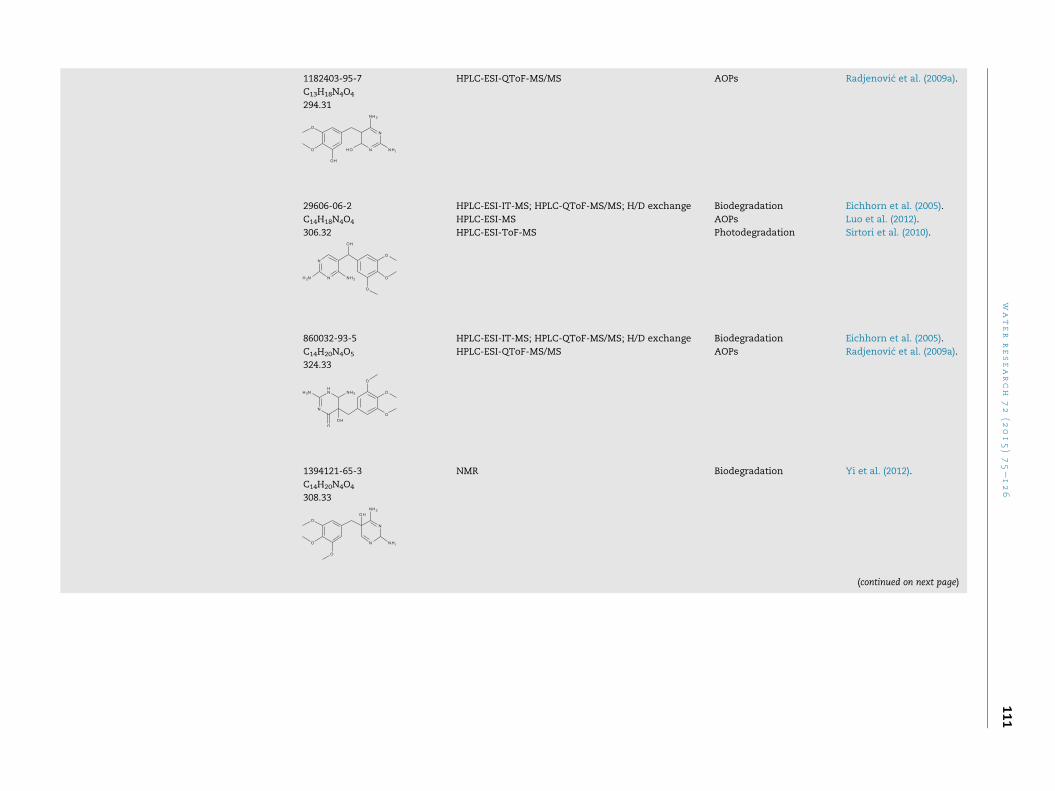
1182403-95-7
C13H18N4O4
294.31
HPLC-ESI-QToF-MS/MS AOPs Radjenovi�c et al. (2009a).
29606-06-2
C14H18N4O4
306.32
HPLC-ESI-IT-MS; HPLC-QToF-MS/MS; H/D exchange Biodegradation Eichhorn et al. (2005).
HPLC-ESI-MS AOPs Luo et al. (2012).
HPLC-ESI-ToF-MS Photodegradation Sirtori et al. (2010).
860032-93-5
C14H20N4O5
324.33
HPLC-ESI-IT-MS; HPLC-QToF-MS/MS; H/D exchange Biodegradation Eichhorn et al. (2005).
HPLC-ESI-QToF-MS/MS AOPs Radjenovi�c et al. (2009a).
1394121-65-3
C14H20N4O4
308.33
NMR Biodegradation Yi et al. (2012).
(continued on next page)
water
research
72
(2015)75e126
111
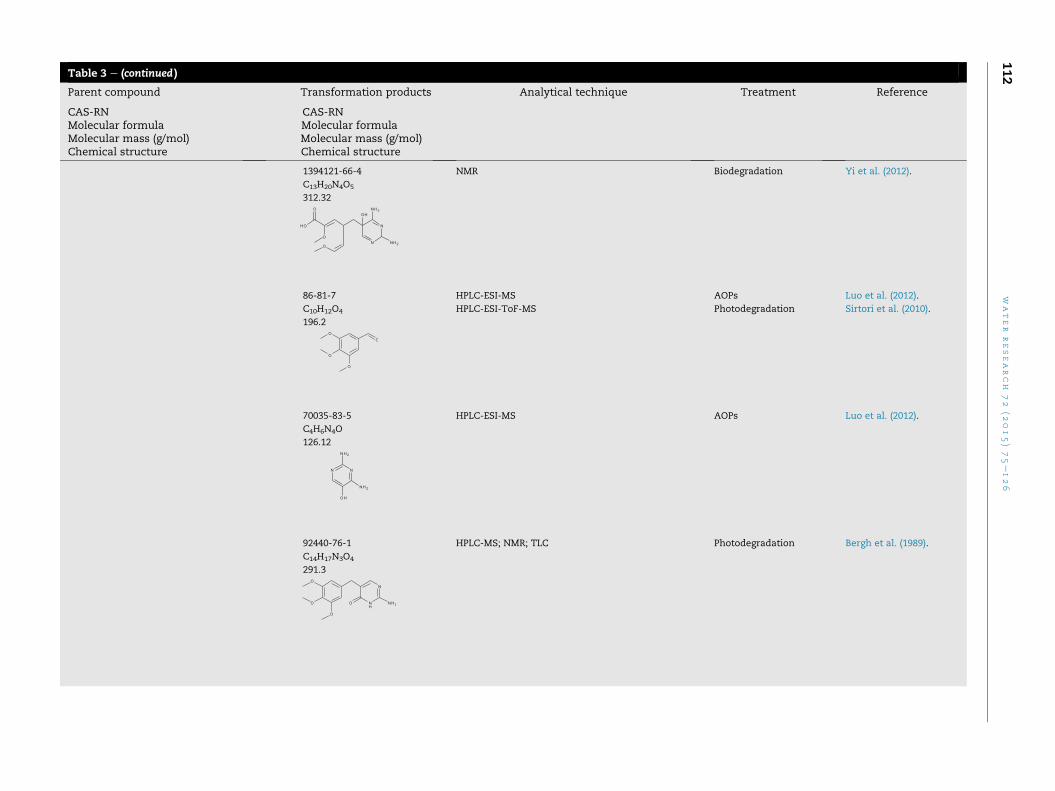
Table 3 e (continued )
Parent compound Transformation products Analytical technique Treatment Reference
CAS-RNMolecular formulaMolecular mass (g/mol)Chemical structure
CAS-RNMolecular formulaMolecular mass (g/mol)Chemical structure
1394121-66-4
C13H20N4O5
312.32
NMR Biodegradation Yi et al. (2012).
86-81-7
C10H12O4
196.2
HPLC-ESI-MS AOPs Luo et al. (2012).
HPLC-ESI-ToF-MS Photodegradation Sirtori et al. (2010).
70035-83-5
C4H6N4O
126.12
HPLC-ESI-MS AOPs Luo et al. (2012).
92440-76-1
C14H17N3O4
291.3
HPLC-MS; NMR; TLC Photodegradation Bergh et al. (1989).
water
research
72
(2015)75e126
112
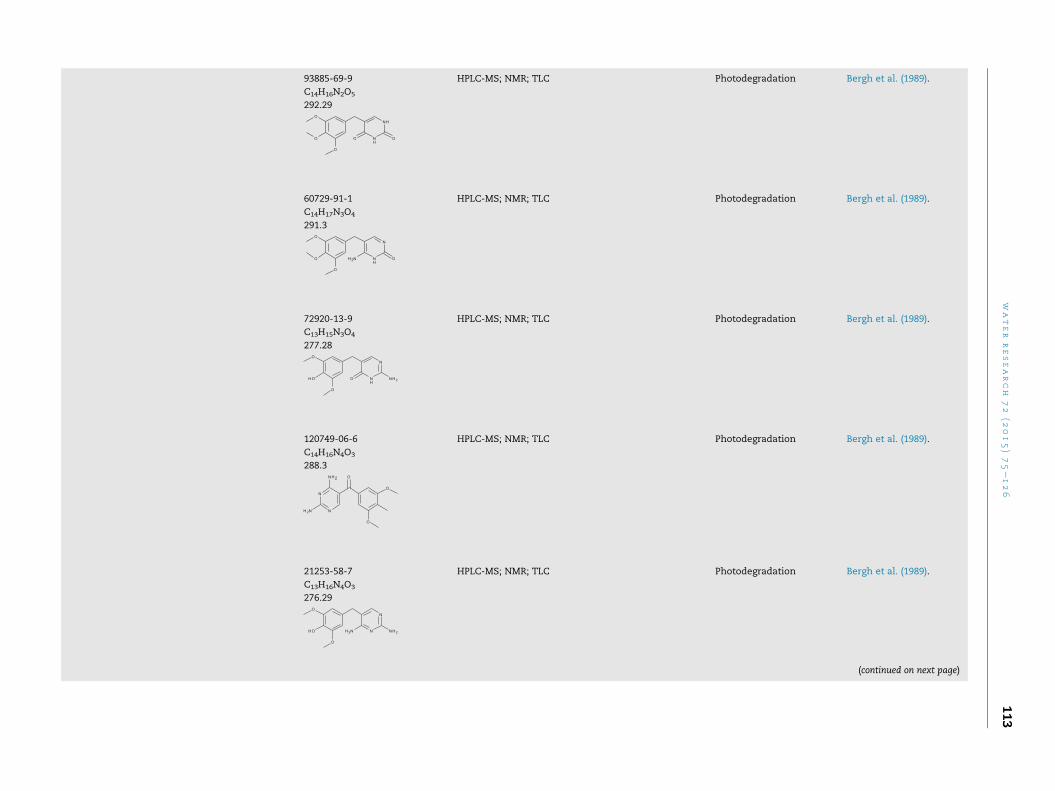
93885-69-9
C14H16N2O5
292.29
HPLC-MS; NMR; TLC Photodegradation Bergh et al. (1989).
60729-91-1
C14H17N3O4
291.3
HPLC-MS; NMR; TLC Photodegradation Bergh et al. (1989).
72920-13-9
C13H15N3O4
277.28
HPLC-MS; NMR; TLC Photodegradation Bergh et al. (1989).
120749-06-6
C14H16N4O3
288.3
HPLC-MS; NMR; TLC Photodegradation Bergh et al. (1989).
21253-58-7
C13H16N4O3
276.29
HPLC-MS; NMR; TLC Photodegradation Bergh et al. (1989).
(continued on next page)
water
research
72
(2015)75e126
113
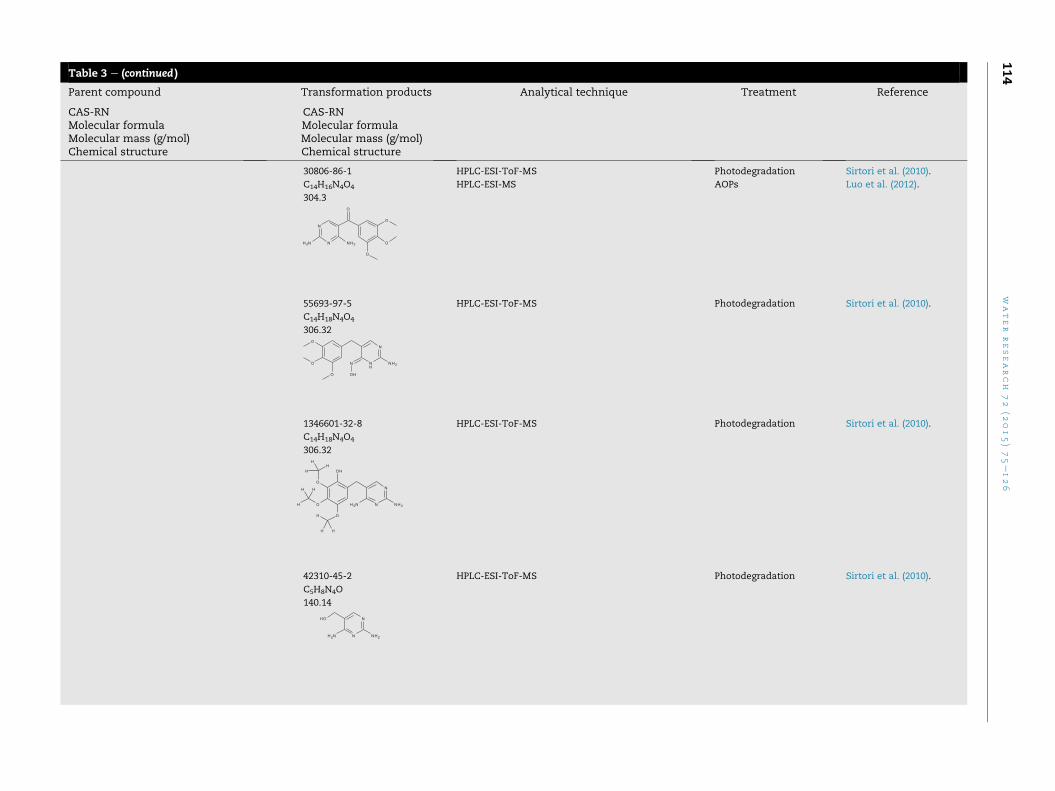
Table 3 e (continued )
Parent compound Transformation products Analytical technique Treatment Reference
CAS-RNMolecular formulaMolecular mass (g/mol)Chemical structure
CAS-RNMolecular formulaMolecular mass (g/mol)Chemical structure
30806-86-1
C14H16N4O4
304.3
HPLC-ESI-ToF-MS Photodegradation Sirtori et al. (2010).
HPLC-ESI-MS AOPs Luo et al. (2012).
55693-97-5
C14H18N4O4
306.32
HPLC-ESI-ToF-MS Photodegradation Sirtori et al. (2010).
1346601-32-8
C14H18N4O4
306.32
HPLC-ESI-ToF-MS Photodegradation Sirtori et al. (2010).
42310-45-2
C5H8N4O
140.14
HPLC-ESI-ToF-MS Photodegradation Sirtori et al. (2010).
water
research
72
(2015)75e126
114
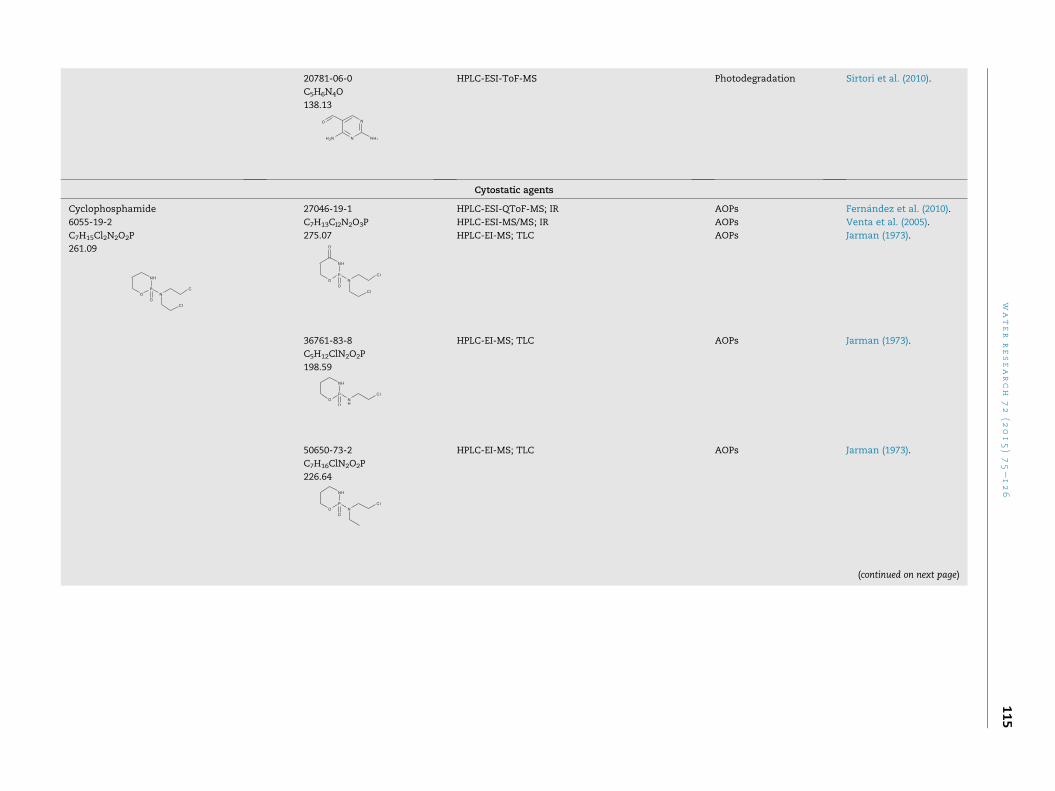
20781-06-0
C5H6N4O
138.13
HPLC-ESI-ToF-MS Photodegradation Sirtori et al. (2010).
Cytostatic agents
Cyclophosphamide
6055-19-2
C7H15Cl2N2O2P
261.09
27046-19-1
C7H13Cl2N2O3P
275.07
HPLC-ESI-QToF-MS; IR AOPs Fern�andez et al. (2010).
HPLC-ESI-MS/MS; IR AOPs Venta et al. (2005).
HPLC-EI-MS; TLC AOPs Jarman (1973).
36761-83-8
C5H12ClN2O2P
198.59
HPLC-EI-MS; TLC AOPs Jarman (1973).
50650-73-2
C7H16ClN2O2P
226.64
HPLC-EI-MS; TLC AOPs Jarman (1973).
(continued on next page)
water
research
72
(2015)75e126
115
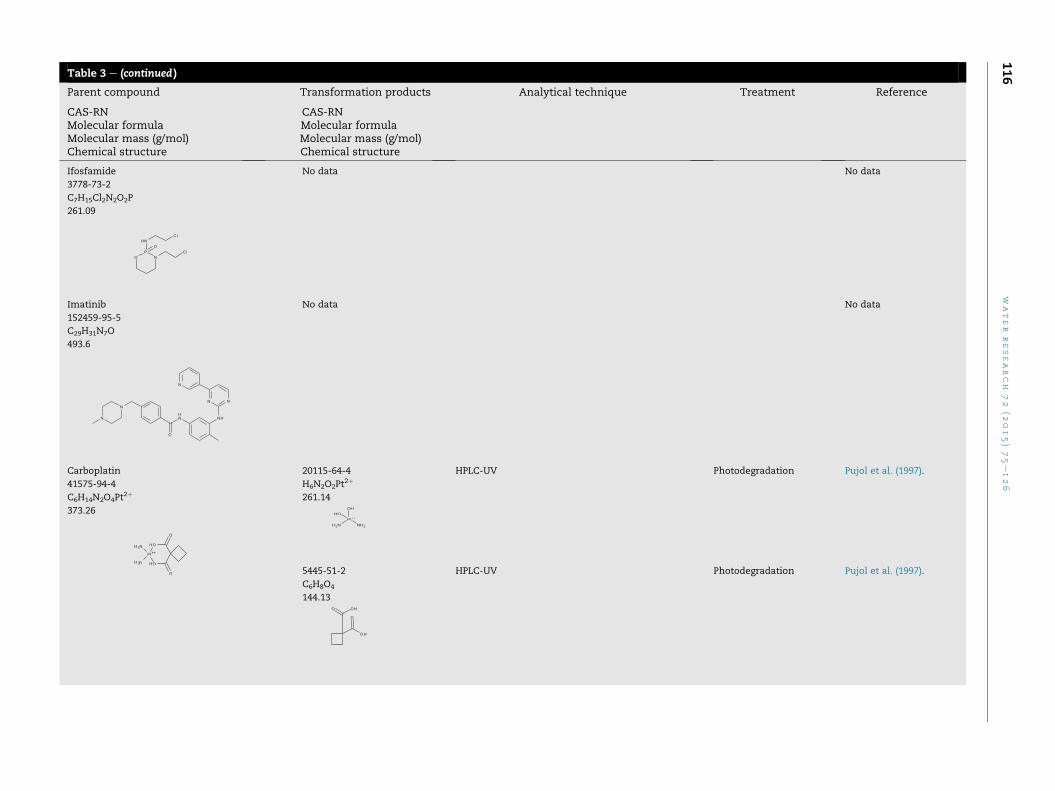
Table 3 e (continued )
Parent compound Transformation products Analytical technique Treatment Reference
CAS-RNMolecular formulaMolecular mass (g/mol)Chemical structure
CAS-RNMolecular formulaMolecular mass (g/mol)Chemical structure
Ifosfamide
3778-73-2
C7H15Cl2N2O2P
261.09
No data No data
Imatinib
152459-95-5
C29H31N7O
493.6
No data No data
Carboplatin
41575-94-4
C6H14N2O4Pt2þ
373.26
20115-64-4
H6N2O2Pt2þ
261.14
HPLC-UV Photodegradation Pujol et al. (1997).
5445-51-2
C6H8O4
144.13
HPLC-UV Photodegradation Pujol et al. (1997).
water
research
72
(2015)75e126
116
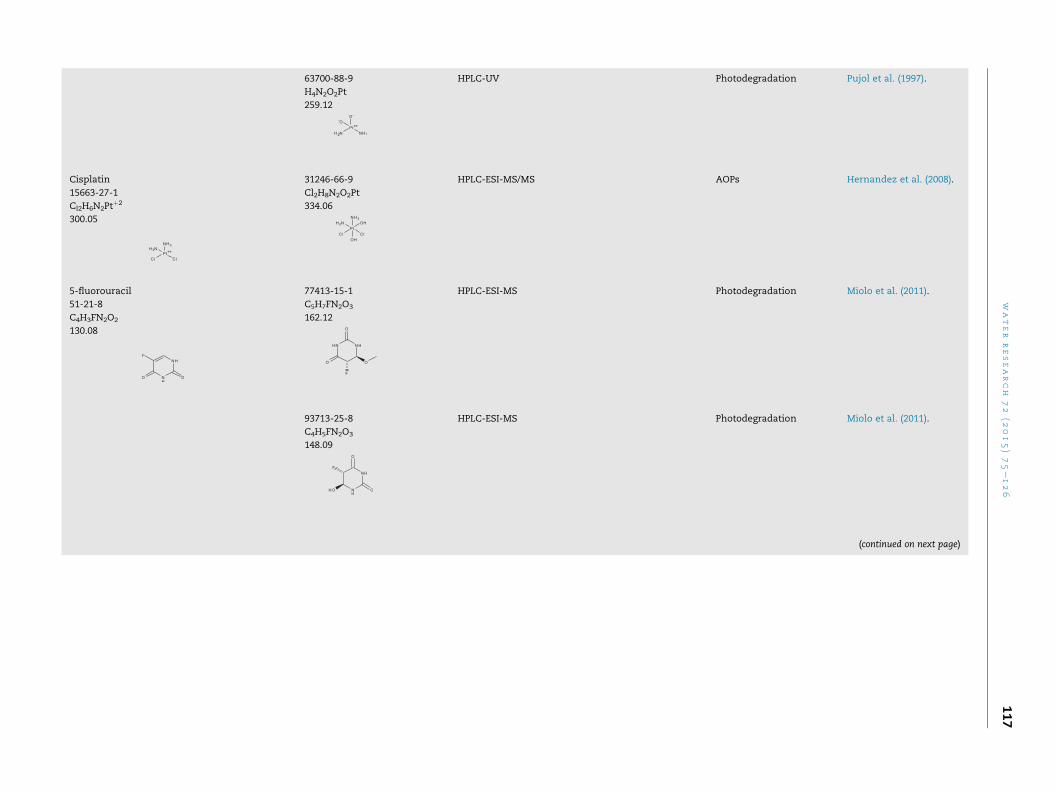
63700-88-9
H4N2O2Pt
259.12
HPLC-UV Photodegradation Pujol et al. (1997).
Cisplatin
15663-27-1
Cl2H6N2Ptþ2
300.05
31246-66-9
Cl2H8N2O2Pt
334.06
HPLC-ESI-MS/MS AOPs Hernandez et al. (2008).
5-fluorouracil
51-21-8
C4H3FN2O2
130.08
77413-15-1
C5H7FN2O3
162.12
HPLC-ESI-MS Photodegradation Miolo et al. (2011).
93713-25-8
C4H5FN2O3
148.09
HPLC-ESI-MS Photodegradation Miolo et al. (2011).
(continued on next page)
water
research
72
(2015)75e126
117
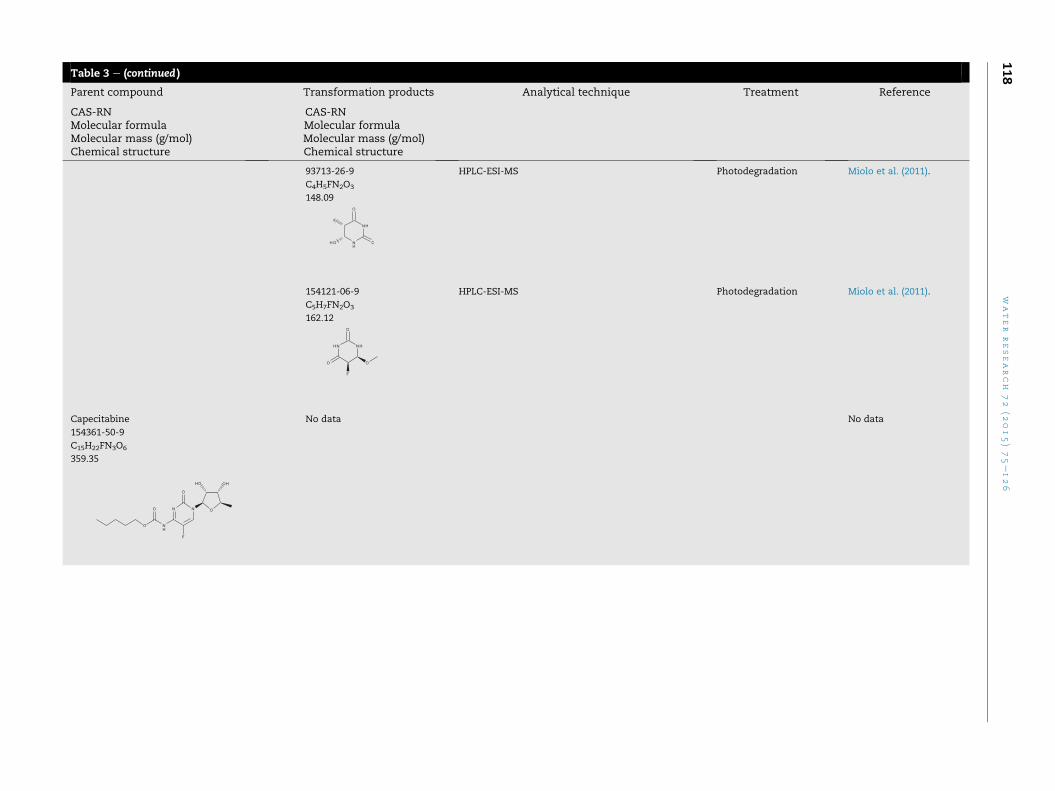
Table 3 e (continued )
Parent compound Transformation products Analytical technique Treatment Reference
CAS-RNMolecular formulaMolecular mass (g/mol)Chemical structure
CAS-RNMolecular formulaMolecular mass (g/mol)Chemical structure
93713-26-9
C4H5FN2O3
148.09
HPLC-ESI-MS Photodegradation Miolo et al. (2011).
154121-06-9
C5H7FN2O3
162.12
HPLC-ESI-MS Photodegradation Miolo et al. (2011).
Capecitabine
154361-50-9
C15H22FN3O6
359.35
No data No data
water
research
72
(2015)75e126
118
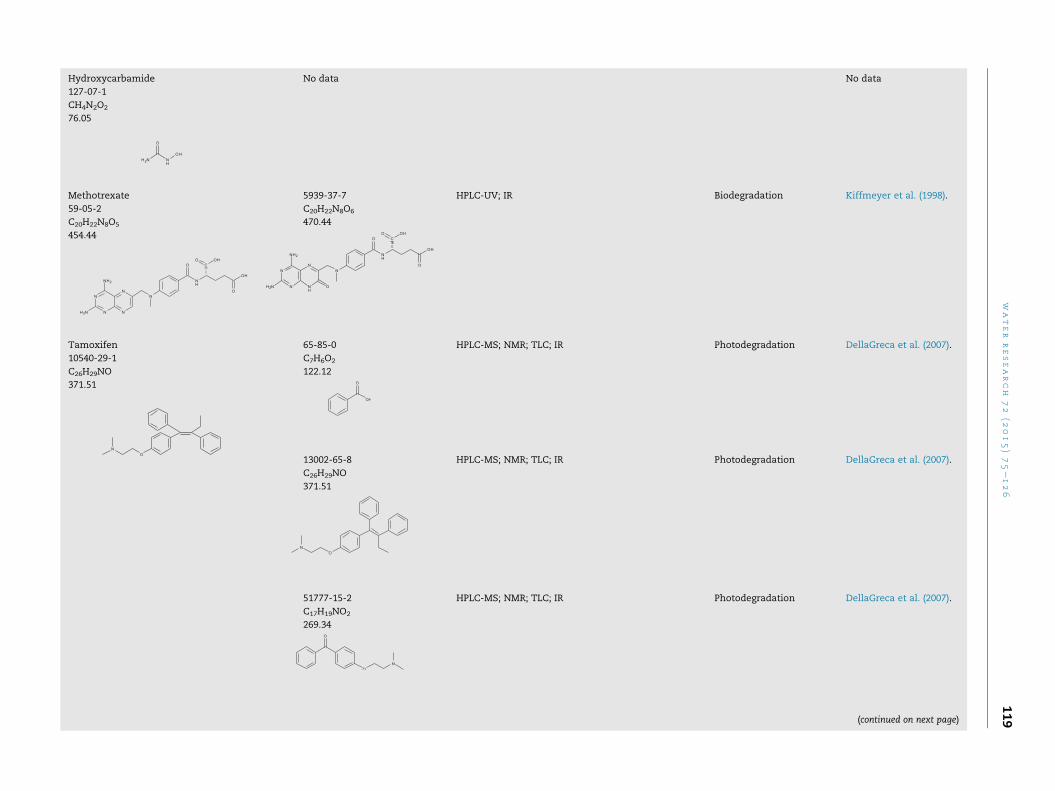
Hydroxycarbamide
127-07-1
CH4N2O2
76.05
No data No data
Methotrexate
59-05-2
C20H22N8O5
454.44
5939-37-7
C20H22N8O6
470.44
HPLC-UV; IR Biodegradation Kiffmeyer et al. (1998).
Tamoxifen
10540-29-1
C26H29NO
371.51
65-85-0
C7H6O2
122.12
HPLC-MS; NMR; TLC; IR Photodegradation DellaGreca et al. (2007).
13002-65-8
C26H29NO
371.51
HPLC-MS; NMR; TLC; IR Photodegradation DellaGreca et al. (2007).
51777-15-2
C17H19NO2
269.34
HPLC-MS; NMR; TLC; IR Photodegradation DellaGreca et al. (2007).
(continued on next page)
water
research
72
(2015)75e126
119
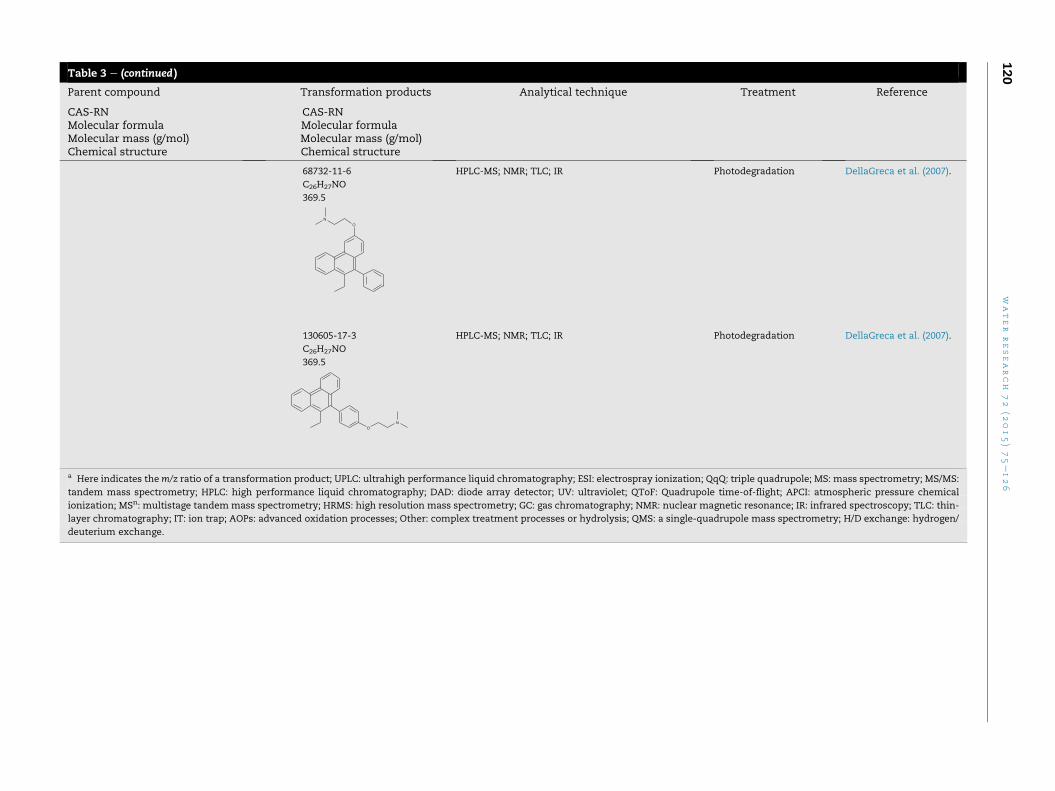
Table 3 e (continued )
Parent compound Transformation products Analytical technique Treatment Reference
CAS-RNMolecular formulaMolecular mass (g/mol)Chemical structure
CAS-RNMolecular formulaMolecular mass (g/mol)Chemical structure
68732-11-6
C26H27NO
369.5
HPLC-MS; NMR; TLC; IR Photodegradation DellaGreca et al. (2007).
130605-17-3
C26H27NO
369.5
HPLC-MS; NMR; TLC; IR Photodegradation DellaGreca et al. (2007).
a Here indicates them/z ratio of a transformation product; UPLC: ultrahigh performance liquid chromatography; ESI: electrospray ionization; QqQ: triple quadrupole; MS: mass spectrometry; MS/MS:
tandem mass spectrometry; HPLC: high performance liquid chromatography; DAD: diode array detector; UV: ultraviolet; QToF: Quadrupole time-of-flight; APCI: atmospheric pressure chemical
ionization; MSn: multistage tandem mass spectrometry; HRMS: high resolution mass spectrometry; GC: gas chromatography; NMR: nuclear magnetic resonance; IR: infrared spectroscopy; TLC: thin-
layer chromatography; IT: ion trap; AOPs: advanced oxidation processes; Other: complex treatment processes or hydrolysis; QMS: a single-quadrupole mass spectrometry; H/D exchange: hydrogen/
deuterium exchange.
water
research
72
(2015)75e126
120
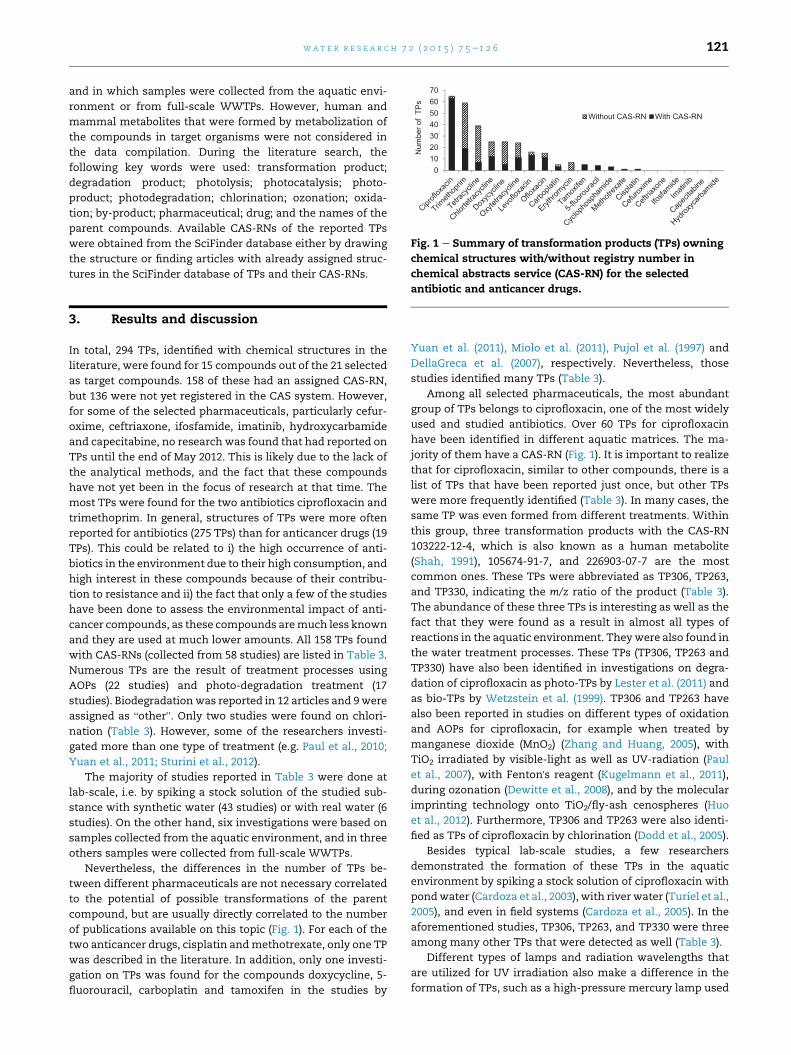
and in which samples were collected from the aquatic envi-
ronment or from full-scale WWTPs. However, human and
mammal metabolites that were formed by metabolization of
the compounds in target organisms were not considered in
the data compilation. During the literature search, the
following key words were used: transformation product;
degradation product; photolysis; photocatalysis; photo-
product; photodegradation; chlorination; ozonation; oxida-
tion; by-product; pharmaceutical; drug; and the names of the
parent compounds. Available CAS-RNs of the reported TPs
were obtained from the SciFinder database either by drawing
the structure or finding articles with already assigned struc-
tures in the SciFinder database of TPs and their CAS-RNs.
3. Results and discussion
In total, 294 TPs, identified with chemical structures in the
literature, were found for 15 compounds out of the 21 selected
as target compounds. 158 of these had an assigned CAS-RN,
but 136 were not yet registered in the CAS system. However,
for some of the selected pharmaceuticals, particularly cefur-
oxime, ceftriaxone, ifosfamide, imatinib, hydroxycarbamide
and capecitabine, no research was found that had reported on
TPs until the end of May 2012. This is likely due to the lack of
the analytical methods, and the fact that these compounds
have not yet been in the focus of research at that time. The
most TPs were found for the two antibiotics ciprofloxacin and
trimethoprim. In general, structures of TPs were more often
reported for antibiotics (275 TPs) than for anticancer drugs (19
TPs). This could be related to i) the high occurrence of anti-
biotics in the environment due to their high consumption, and
high interest in these compounds because of their contribu-
tion to resistance and ii) the fact that only a few of the studies
have been done to assess the environmental impact of anti-
cancer compounds, as these compounds aremuch less known
and they are used at much lower amounts. All 158 TPs found
with CAS-RNs (collected from 58 studies) are listed in Table 3.
Numerous TPs are the result of treatment processes using
AOPs (22 studies) and photo-degradation treatment (17
studies). Biodegradationwas reported in 12 articles and 9were
assigned as “other”. Only two studies were found on chlori-
nation (Table 3). However, some of the researchers investi-
gated more than one type of treatment (e.g. Paul et al., 2010;
Yuan et al., 2011; Sturini et al., 2012).
The majority of studies reported in Table 3 were done at
lab-scale, i.e. by spiking a stock solution of the studied sub-
stance with synthetic water (43 studies) or with real water (6
studies). On the other hand, six investigations were based on
samples collected from the aquatic environment, and in three
others samples were collected from full-scale WWTPs.
Nevertheless, the differences in the number of TPs be-
tween different pharmaceuticals are not necessary correlated
to the potential of possible transformations of the parent
compound, but are usually directly correlated to the number
of publications available on this topic (Fig. 1). For each of the
two anticancer drugs, cisplatin andmethotrexate, only one TP
was described in the literature. In addition, only one investi-
gation on TPs was found for the compounds doxycycline, 5-
fluorouracil, carboplatin and tamoxifen in the studies by
Yuan et al. (2011), Miolo et al. (2011), Pujol et al. (1997) and
DellaGreca et al. (2007), respectively. Nevertheless, those
studies identified many TPs (Table 3).
Among all selected pharmaceuticals, the most abundant
group of TPs belongs to ciprofloxacin, one of the most widely
used and studied antibiotics. Over 60 TPs for ciprofloxacin
have been identified in different aquatic matrices. The ma-
jority of them have a CAS-RN (Fig. 1). It is important to realize
that for ciprofloxacin, similar to other compounds, there is a
list of TPs that have been reported just once, but other TPs
were more frequently identified (Table 3). In many cases, the
same TP was even formed from different treatments. Within
this group, three transformation products with the CAS-RN
103222-12-4, which is also known as a human metabolite
(Shah, 1991), 105674-91-7, and 226903-07-7 are the most
common ones. These TPs were abbreviated as TP306, TP263,
and TP330, indicating the m/z ratio of the product (Table 3).
The abundance of these three TPs is interesting as well as the
fact that they were found as a result in almost all types of
reactions in the aquatic environment. Theywere also found in
the water treatment processes. These TPs (TP306, TP263 and
TP330) have also been identified in investigations on degra-
dation of ciprofloxacin as photo-TPs by Lester et al. (2011) and
as bio-TPs by Wetzstein et al. (1999). TP306 and TP263 have
also been reported in studies on different types of oxidation
and AOPs for ciprofloxacin, for example when treated by
manganese dioxide (MnO2) (Zhang and Huang, 2005), with
TiO2 irradiated by visible-light as well as UV-radiation (Paul
et al., 2007), with Fenton's reagent (Kugelmann et al., 2011),
during ozonation (Dewitte et al., 2008), and by the molecular
imprinting technology onto TiO2/fly-ash cenospheres (Huo
et al., 2012). Furthermore, TP306 and TP263 were also identi-
fied as TPs of ciprofloxacin by chlorination (Dodd et al., 2005).
Besides typical lab-scale studies, a few researchers
demonstrated the formation of these TPs in the aquatic
environment by spiking a stock solution of ciprofloxacin with
pondwater (Cardoza et al., 2003), with river water (Turiel et al.,
2005), and even in field systems (Cardoza et al., 2005). In the
aforementioned studies, TP306, TP263, and TP330 were three
among many other TPs that were detected as well (Table 3).
Different types of lamps and radiation wavelengths that
are utilized for UV irradiation also make a difference in the
formation of TPs, such as a high-pressure mercury lamp used
Fig. 1 e Summary of transformation products (TPs) owning
chemical structures with/without registry number in
chemical abstracts service (CAS-RN) for the selected
antibiotic and anticancer drugs.
wa t e r r e s e a r c h 7 2 ( 2 0 1 5 ) 7 5e1 2 6 121
by Torniainen et al. (1997a) and a medium-pressure mercury
lamp used by both Lester et al. (2011) and Vasconcelos et al.
(2009). The same variety of conditions is observed in studies
using a xenon lamp, resulting in different findings in relation
to structural elucidation. For instance, ciprofloxacin was
transformed to three TPs by the Suntest-CPS apparatus
(Messrs, Heraeus) in a study by Burhenne et al. (1997); how-
ever, two other TPs were found by the merry-go-round
photochemical reactor (Xujiang Electromechanical Plant) in
a study by Ge et al. (2010) (Table 3). Additionally, it is important
to note that in addition to different light sources, the entire
experimental system of various studies is often very different,
i.e. photoreactor and its geometry, initial concentration of
parent compound, matrix of samples, pH and temperature of
solution and many others. Fatta-Kassinos et al. (2011b) pre-
viously addressed this issue and gave an example of applying
standardized tests for photolysis and surface water (i.e. OECD
316).
Chlorination is often applied as a disinfection process prior
to the final discharge of WWTP effluent into streams, which
can also affect the formation of TPs. In the context of cipro-
floxacin, Dodd et al. (2005) investigated reactions between free
available chlorine (HOCl/OCl�) and ciprofloxacin, and
described a formation of five TPs. Another study byWang et al.
(2010) identified four TPs formed by the reaction of ciproflox-
acin with chlorine dioxide (ClO2). A comparison of the iden-
tified TPs shows that only TP306 and TP263 are documented in
both of these studies. Furthermore, monochlorinated ana-
logues of TP306, TP263 and ciprofloxacin were identified as
TPs by Dodd et al. (2005) while products with one and two
aldehyde groups on the piperazine moiety were found by
Wang et al. (2010) (Table 3). However, ClO2 generates fewer
chlorinated by-products and is less pH-dependent than free
chlorine (Wang et al., 2010).
Generally, the same processes for one compound are often
performed under different conditions by different research
groups. This fact makes comparison and any discussion of
treatment efficiencies difficult if not impossible.
Overall, many different approaches were applied in iden-
tifying unknown TPs. Identification is often performed by
means of chromatographic and mass spectrometric in-
struments. Table 3 reveals an increasing use of LRMS, in 33
studies, whereas HRMS was reported in 14 studies. Cardoza
et al. (2005) investigated photo-degradation of ciprofloxacin
under different light sources, and the qualitative identifica-
tion of TPs was only narrowed by using HPLC-UV-MS analysis
of the treated samples. The authors compared the observed
specific mass [MþH]þ to the ones already published and
confirmed in previous studies. However, an accurate confir-
mation of structures of TPs can only be done by comparison
with a synthesized reference standard. In a study by Chen
et al. (2011), HPLC-MS/MS was used to identify oxidation
products of chlortetracycline by MnO2. Among ten proposed
structures, four were confirmed via comparison with
authentic standards.
In case no standard is available, complementary tech-
niques such as NMR and IR spectroscopy would be the best
available tools in structural elucidation. A very early structure
elucidation for TPs of ciprofloxacin was performed by utilizing
mass spectrometry followed by final structure confirmation
with NMR and IR techniques (Burhenne et al., 1997;
Torniainen et al., 1997b). In a study by Cardoza et al. (2003),
TP330 was found during the degradation of ciprofloxacin
under fluorescent lights that were cycled diurnally at lab-
scale. Initially, TP330 was identified using the HPLC-UV-MS
technique. The relative molecular weight, MS/MS fragmenta-
tion patterns along with the spectral information obtained
from NMR experiments were used to elucidate TPs structures.
It is evident from Table 3 that NMR and IR spectroscopy have
been employed in ten and six studies, respectively, while in
two other studies, the identification of TPs was confirmed via
comparison with standards. One has to be aware that NMR
analysis needs enrichment or high testing concentrations
which in turn may affect type and concentration of formed
TPs, and in principle not all TPs that are formed within a
certain process are detectedwithin chromatographic analysis.
This means also that highly polar products would not be
retained on the chromatographic column, and less polar ones
might be retained for too long during analysis. Furthermore
they may possess a low ionization efficiency under the con-
ditions selected and will therefore be below the limit of
detection.
Studies that evaluated a specific treatment, in which the
detected TPs were identified, did not always include a toxicity
assessment which is not possible for unknown TPs or if TPs
are not commercially available. Of the 58 studies reported in
Table 3, only 14 studies included the evaluation of toxicity of
the formed TPs. Toxicity was investigated by different
methods, e.g. Vibrio fischeri luminescent bacterial assay (Calza
et al., 2008; Vasconcelos et al., 2009; Sirtori et al., 2010; Yuan
et al., 2011), residual antibacterial activity study (Wetzstein
et al., 1999; Paul et al., 2010; Cao et al., 2011), mutagenicity
test (Hernandez et al., 2008) or Daphnia magna toxicity assay
(DellaGreca et al., 2007; Wang et al., 2011b; Yang and Chen,
2011; Wang et al., 2012). Most of the studies indicated either
no difference between the parent compound and the TPs
mixture, or even a decrease in toxicity during a trans-
formation process. Only in two cases (Sirtori et al., 2010; Yuan
et al., 2011) was the TPs mixture more toxic than the parent
compound. However, in some studies there was evidence of a
relation between time of the study and the toxicity of the re-
action mixture, showing that toxicity increases at the begin-
ning but then continuously decreases over the course of the
treatment, e.g. ozonation, photodegradation (Calza et al.,
2008; Yang and Chen, 2011; Wang et al., 2011b, 2012).
To summarize: Most of the investigations of TPs were done
at lab-scale. The formed transformation products within the
reactors were often identified by means of chromatographic
and mass spectrometric instruments. However, the confir-
mation of structures of TPs can only be done in comparison to
a synthesized reference standard or, in case no standard is
available, by complementary techniques such as NMR and IR
spectroscopy. For an accurate study of environmental sam-
ples where TPs are in trace as well as affected by the
complexity of matrix, advanced sensitivity and accuracy of
analytical methods is required to remove uncertainty in
elucidation of structures. It is important to keep in mind that
such a task is time-consuming and very expensive.
Moreover, as we have observed, not only one TPmay be the
result of different reactions (e.g. photodegradation,
wat e r r e s e a r c h 7 2 ( 2 0 1 5 ) 7 5e1 2 6122
biodegradation or AOP), but also numerous different TPs may
be formed within one type of treatment, applied under
different conditions. Only a minority of studies on the
assessment of the ecotoxicological potency of TPs included
long-term toxicity on non-target organisms. Furthermore, the
question which endpoints are relevant for this kind of
research is still unanswered. Investigations aiming at
answering questions, such as how pharmaceuticals trans-
form, what products result and what is the significance of
these, are very costly and time-consuming if not impossible.
Therefore, instead of only relying on advanced effluent
treatments, solutions focusing on “beginning of the pipe”
approach such as “benign by design” (Kummerer, 2007;
Rastogi et al., 2014a, 2014b) should minimize the adverse ef-
fects of parent compounds by reducing formation of TPs and
their entrance into the natural environment.
4. Conclusions
Pharmaceuticals may undergo incomplete mineralization
that leads to their transformation into new molecules by
almost all possible processes, which could either take place in
the natural aquatic environment and/or during water treat-
ment processes. Today, the presence of TPs in the aquatic
environment and the issue that they can actually pose a
higher risk to environmental and human health than their
parent is a fact. The growing number of elucidated TPs is
rationalized by ineffective removal treatments.
Information available on TPs demonstrates that an
already slight change in treatment conditions and processes
results in the formation of different TPs. This in turn, on the
one hand, makes it difficult to select the right conditions for
effluent treatment, and on the other hand it presents a big
challenge for the identification and assessment of TPs. The
results presented in this paper demonstrate a severe risk of
drowning in much unrelated and non-assessable data, both
from a scientific and from a technical treatment-related point
of view.
Therefore, froma practical and sustainability point of view,
limiting the input of pharmaceuticals and their TPs as well as
improving their (bio) degradability and elimination behavior,
already during the optimization stages of drug design, i.e.
“benign by design”, is urgently needed. Solutions focusing on
this “beginning of the pipe” approach should minimize the
adverse effects of parent compounds and their TPs by ulti-
mately reducing their entrance into the natural environment.
Acknowledgements
This work was financially supported by the European Union
(European Commission, FP7 project PHARMAS, grant agree-
ment no. 265346). Tarek Haddad also received a scholarship
from Leuphana University of Luneburg. Special thanks go to
Isabell May and Eoin Ryan from the Writing Centre at Leu-
phana University of Luneburg for English language revision
of the manuscript. Structures and related chemical infor-
mation presented in Table 3 were prepared in ChemDraw Pro
version 8.0 (CambridgeSoft Corporation, Cambridge, MA,
USA).
r e f e r e n c e s
Allwood, M.C., Stanley, A., Wright, P., 2002. The CytotoxicsHandbook, fourth ed. Radcliffe Medical Press, Abingdon, Oxon.
An, T., Yang, H., Li, G., Song, W., Cooper, W.J., Nie, X., 2010.Kinetics and mechanism of advanced oxidation processes(AOPs) in degradation of ciprofloxacin in water. Appl. Catal. BEnviron. 94 (3e4), 288e294.
Arikan, O.A., 2008. Degradation and metabolization ofchlortetracycline during the anaerobic digestion of manurefrom medicated calves. J. Hazard. Mater. 158 (2e3), 485e490.
Bendz, D., Pax�eus, N.A., Ginn, T.R., Loge, F.J., 2005. Occurrenceand fate of pharmaceutically active compounds in theenvironment, a case study: H€oje river in Sweden. J. Hazard.Mater. 122 (3), 195e204.
Bergh, J.J., Breytenbach, J.C., Wessels, P.L., 1989. Degradation oftrimethoprim. J. Pharm. Sci. 78 (4), 348e350.
Besse, J.-P., Latour, J.-F., Garric, J., 2012. Anticancer drugs insurface waters. Environ. Int. 39 (1), 73e86.
Boreen, A.L., Arnold, W.A., McNeill, K., 2003. Photodegradation ofpharmaceuticals in the aquatic environment e a review.Aquat. Sci. 65 (4), 320e341.
Burhenne, J., Ludwig, M., Nikoloudis, P., Spiteller, M., 1997.Primary photoproducts and half-lives. Environ. Sci. Pollut. Res.4 (1), 10e15.
Calza, P., Medana, C., Carbone, F., Giancotti, V., Baiocchi, C., 2008.Characterization of intermediate compounds formed uponphotoinduced degradation of quinolones by high-performance liquid chromatography/high-resolutionmultiple-stage mass spectrometry. Rapid Commun. MassSpectrom. 22 (10), 1533e1552.
Cao, D., Zhang, X., Zhao, S., Guan, Y., Zhang, H., 2011. Appropriatedose for degradation of levofloxacin lactate: gamma radiolysisand assessment of degradation product activity andcytotoxicity. Environ. Eng. Sci. 28 (3), 183e189.
Cardoza, L.A., Almeida, V.K., Carr, A., Larive, C.K., Graham, D.W.,2003. Separations coupled with NMR detection. TrAC e TrendsAnal. Chem. 22 (10), 766e775.
Cardoza, L.A., Knapp, C.W., Larive, C.K., Belden, J.B., Lydy, M.,Graham, D.W., 2005. Factors affecting the fate of ciprofloxacinin aquatic field systems. Water Air Soil Pollut. 161 (1e4),383e398.
Chemical Abstracts Service. http://www.cas.org/content/chemical-substances/faqs (accessed 12.11.12.).
Chen, W.-R., Huang, C.-H., 2010. Adsorption and transformationof tetracycline antibiotics with aluminum oxide.Chemosphere 79 (8), 779e785.
Chen, W.-R., Huang, C.-H., 2011. Transformation kinetics andpathways of tetracycline antibiotics with manganese oxide.Environ. Pollut. 159 (5), 1092e1100.
Chen, G., Zhao, L., Dong, Y.-h, 2011. Oxidative degradationkinetics and products of chlortetracycline by manganesedioxide. J. Hazard. Mater. 193, 128e138.
Chen, Y., Li, H., Wang, Z., Tao, T., Wei, D., Hu, C., 2012. Photolysisof chlortetracycline in aqueous solution: kinetics, toxicity andproducts. J. Environ. Sci. 24 (2), 254e260.
Dalm�azio, I., Almeida, M.O., Augusti, R., Alves, T.M.A., 2007.Monitoring the degradation of tetracycline by ozone inaqueous medium via atmospheric pressure ionization massspectrometry. J. Am. Soc. Mass Spectrom. 18 (4), 679e687.
Daughton, C.G., Ternes, T., 1999. Pharmaceuticals and personalcare products in the environment: agents of subtle change?Environ. Health Perspect. 107 (6), 907e938.
wa t e r r e s e a r c h 7 2 ( 2 0 1 5 ) 7 5e1 2 6 123
DellaGreca, M., Iesce, M.R., Isidori, M., Nardelli, A., Previtera, L.,Rubino, M., 2007. Phototransformation products of tamoxifenby sunlight in water. Toxicity of the drug and its derivatives onaquatic organisms. Chemosphere 67 (10), 1933e1939.
Dewitte, B., Dewulf, J., Demeestere, K., Van De Vyvere, V., DeWispelaere, P., Van Langenhove, H., 2008. Ozonation ofciprofloxacin in water: HRMS identification of reactionproducts and pathways. Environ. Sci. Technol. 42 (13),4889e4895.
Diaz-Cruz, M.S., Barcel�o, D., 2005. LC-MS2 trace analysis ofantimicrobials in water, sediment and soil. TrAC e TrendsAnal. Chem. 24 (7), 645e657.
Ding, C., He, J., 2010. Effect of antibiotics in the environment onmicrobial populations. Appl. Microbiol. Biotechnol. 87 (3),925e941.
Dodd, M.C., Shah, A.D., Von Gunten, U., Huang, C.-H., 2005.Interactions of fluoroquinolone antibacterial agents withaqueous chlorine: reaction kinetics, mechanisms, andtransformation pathways. Environ. Sci. Technol. 39 (18),7065e7076.
Eichhorn, P., Ferguson, P.L., P�erez, S., Aga, D.S., 2005. Applicationof ion trap-MS with H/D exchange and QqTOF-MS in theidentification of microbial degradates of trimethoprim innitrifying activated sludge. Anal. Chem. 77 (13), 4176e4184.
Eitel, A., Scherrer, M., Kummerer, K., 1999. Handling CytostaticDrugs: a Practical Guide, first ed. Bristol-Myers-Squibb,Munchen.
Fatta, D., Achilleos, A., Nikolaou, A., Meric, S., 2007. Analyticalmethods for tracing pharmaceutical residues in water andwastewater. TrAC e Trends Anal. Chem. 26 (6), 515e533.
Fatta-Kassinos, D., Meric, S., Nikolaou, A., 2011a. Pharmaceuticalresidues in environmental waters and wastewater: currentstate of knowledge and future research. Anal. Bioanal. Chem.399 (1), 251e275.
Fatta-Kassinos, D., Vasquez, M., Kummerer, K., 2011b.Transformation products of pharmaceuticals in surfacewaters and wastewater formed during photolysis andadvanced oxidation processes e degradation, elucidation ofbyproducts and assessment of their biological potency.Chemosphere 85 (5), 693e709.
Fent, K., Weston, A.A., Caminada, D., 2006. Ecotoxicology ofhuman pharmaceuticals. Aquat. Toxicol. 76 (2), 122e159.
Ferdig, M., Kaleta, A., Buchberger, W., 2005. Improved liquidchromatographic determination of nine currently used(fluoro)quinolones with fluorescence and mass spectrometricdetection for environmental samples. J. Sep. Sci. 28 (13),1448e1456.
Fern�andez, L.A., Hern�andez, C., Bataller, M., V�eliz, E., L�opez, A.,Ledea, O., Padr�on, S., 2010. Cyclophosphamide degradation byadvancedoxidation processes.Water Environ. J. 24 (3), 174e180.
Ferrando-Climent, L., Rodriguez-Mozaz, S., Barcel�o, D., 2013.Development of a UPLC-MS/MS method for the determinationof ten anticancer drugs in hospital and urban wastewaters,and its application for the screening of human metabolitesassisted by information-dependent acquisition tool (IDA) insewage samples. Anal. Bioanal. Chem. 405 (18), 5937e5952.
Ge, L., Chen, J., Wei, X., Zhang, S., Qiao, X., Cai, X., Xie, Q., 2010.Aquatic photochemistry of fluoroquinolone antibiotics:kinetics, pathways, and multivariate effects of main waterconstituents. Environ. Sci. Technol. 44 (7), 2400e2405.
Girardi, C., Greve, J., Lamshoeft, M., Fetzer, I., Miltner, A.,Schaeffer, A., Kaestner, M., 2011. Biodegradation ofciprofloxacin in water and soil and its effects on the microbialcommunities. J. Hazard. Mater. 198, 22e30.
Halling-Sørensen, B., Nors Nielsen, S., Lanzky, P.F., Ingerslev, F.,Lutzhoft, H.C.H., Jørgensen, S.E., 1998. Occurrence, fate andeffects of pharmaceutical substances in the environment e areview. Chemosphere 36 (2), 357e393.
Hao, C., Zhao, X., Yang, P., 2007. GC-MS and HPLC-MS analysis ofbioactive pharmaceuticals and personal-care products inenvironmental matrices. TrAC e Trends Anal. Chem. 26 (6),569e580.
Heberer, T., 2002. Occurrence, fate, and removal ofpharmaceutical residues in the aquatic environment: a reviewof recent research data. Toxicol. Lett. 131 (1e2), 5e17.
Hern�andez, F., Sancho, J.V., Ibanez, M., Guerrero, C., 2007.Antibiotic residue determination in environmental waters byLC-MS. TrAC e Trends Anal. Chem. 26 (6), 466e485.
Hernandez, C., Ramos, Y., Fern�andez, L.A., Ledea, O., Bataller, M.,V�eliz, E., Besada, V., Rosado, A., 2008. Ozonation of cisplatin inaqueous solution at pH 9. Ozone Sci. Eng. 30 (3), 189e196.
Hernando, M.D., Gomez, M.J., Aguera, A., Fern�andez-Alba, A.R.,2007. LC-MS analysis of basic pharmaceuticals (beta-blockersand anti-ulcer agents) in wastewater and surface water. TrACe Trends Anal. Chem. 26 (6), 581e594.
Huo, P., Lu, Z., Liu, X., Wu, D., Liu, X., Pan, J., Gao, X., Guo, W.,Li, H., Yan, Y., 2012. Preparation photocatalyst of selectedphotodegradation antibiotics by molecular imprintingtechnology onto TiO2/fly-ash cenospheres. Chem. Eng. J.189e190, 75e83.
Jarman, M., 1973. Formation of 4-ketocyclophosphamide by theoxidation of cyclophosphamide with KMnO4. Experientia 29(7), 812e814.
Khan, M.H., Bae, H., Jung, J.-Y., 2010. Tetracycline degradation byozonation in the aqueous phase: proposed degradationintermediates and pathway. J. Hazard. Mater. 181 (1e3),659e665.
Kiffmeyer, T., G€otze, H.-J., Jursch, M., Luders, U., 1998. Traceenrichment, chromatographic separation and biodegradationof cytostatic compounds in surface water. Fresen. J. Anal.Chem. 361 (2), 185e191.
Kim, S.C., Carlson, K., 2005. LC-MS2 for quantifying trace amountsof pharmaceutical compounds in soil and sediment matrices.TrAC e Trends Anal. Chem. 24 (7), 635e644.
Kosjek, T., Heath, E., 2008. Applications of mass spectrometry toidentifying pharmaceutical transformation products in watertreatment. TrAC e Trends Anal. Chem. 27 (10), 807e820.
Kosjek, T., Heath, E., 2011. Occurrence, fate and determination ofcytostatic pharmaceuticals in the environment. TrAC e
Trends Anal. Chem. 30 (7), 1065e1087.Krauss, M., Singer, H., Hollender, J., 2010. LC-high resolution MS
in environmental analysis: from target screening to theidentification of unknowns. Anal. Bioanal. Chem. 397 (3),943e951.
Kugelmann, E., Albert, C.R., Bringmann, G., Holzgrabe, U., 2011.Fenton's oxidation: a tool for the investigation of potentialdrug metabolites. J. Pharm. Biomed. Anal. 54 (5), 1047e1058.
Kummerer, K., 2001. Drugs in the environment: emission ofdrugs, diagnostic aids and disinfectants into wastewater byhospitals in relation to other sources e a review.Chemosphere 45 (6e7), 957e969.
Kummerer, K., 2007. Sustainable from the very beginning:rational design of molecules by life cycle engineering as animportant approach for green pharmacy and green chemistry.Green. Chem. 9 (8), 899e907.
Kummerer, K. (Ed.), 2008. Pharmaceuticals in the Environment:Sources, Fate, Effects and Risks, third ed. Springer, Berlin,Heidelberg.
Kummerer, K., 2009a. Antibiotics in the aquatic environment e areview e part I. Chemosphere 75 (4), 417e434.
Kummerer, K., 2009b. Antibiotics in the aquatic environment e areview e part II. Chemosphere 75 (4), 435e441.
Kummerer, K., Al-Ahmad, A., 2010. Estimation of the cancer riskto humans resulting from the presence of cyclophosphamideand ifosfamide in surface water. Environ. Sci. Pollut. Res. 17(2), 486e496.
wat e r r e s e a r c h 7 2 ( 2 0 1 5 ) 7 5e1 2 6124
Kummerer, K., Henninger, A., 2003. Promoting resistance by theemission of antibiotics from hospitals and households intoeffluent. Clin. Microbiol. Infect. 9 (12), 1203e1214.
Kummerer, K., Haiß, A., Schuster, A., Hein, A., Ebert, I., 2015.Antineoplastic compounds in the environment e substancesof special concern. Environ. Sci. Pollut. Res. http://dx.doi.org/10.1007/s11356-014-3902-8 (in press).
Kwon, J.-W., 2011. Fate of chlortetracycline in Korean arable soil.Bull. Environ. Contam. Toxicol. 87 (1), 36e39.
Lambropoulou, D.A., Nollet, L.M.L., 2014. TransformationProducts of Emerging Contaminants in the Environment:Analysis, Processes, Occurrence, Effects and Risks. John Wiley& Sons Ltd, Chichester, West Sussex.
L€angin, A., Alexy, R., K€onig, A., Kummerer, K., 2009. Deactivationand transformation products in biodegradability testing ofbeta-lactams amoxicillin and piperacillin. Chemosphere 75 (3),347e354.
Lester, Y., Avisar, D., Gozlan, I., Mamane, H., 2011. Removal ofpharmaceuticals using combination of UV/H2O2/O3 advancedoxidation process. Water Sci. Technol. 64 (11), 2230e2238.
Li, D., Yang, M., Hu, J., Ren, L., Zhang, Y., Li, K., 2008.Determination and fate of oxytetracycline and relatedcompounds in oxytetracycline production wastewater and thereceiving river. Environ. Toxicol. Chem. 27 (1), 80e86.
Loos, R., Carvalho, R., Ant�onio, D.C., Comero, S., Locoro, G.,Tavazzi, S., Paracchini, B., Ghiani, M., Lettieri, T., Blaha, L.,Jarosova, B., Voorspoels, S., Servaes, K., Haglund, P., Fick, J.,Lindberg, R.H., Schwesig, D., Gawlik, B.M., 2013. EU-widemonitoring survey on emerging polar organic contaminants inwastewater treatment plant effluents. Water Res. 47 (17),6475e6487.
L�opez, S.H., Ulaszewska, M.M., Hernando, M.D., Martınez, B.M.J.,G�omez, M.J., Fern�andez-Alba, A.R., 2014. Post-acquisition dataprocessing for the screening of transformation products ofdifferent organic contaminants. Two-year monitoring of riverwater using LC-ESI-QTOF-MS and GCxGC-EI-TOF-MS. Environ.Sci. Pollut. Res. 21 (21), 12583e12604.
Luo, X., Zheng, Z., Greaves, J., Cooper, W.J., Song, W., 2012.Trimethoprim: kinetic and mechanistic considerations inphotochemical environmental fate and AOP treatment. WaterRes. 46 (4), 1327e1336.
Magdeburg, A., Stalter, D., Schlusener, M., Ternes, T.,Oehlmann, J., 2014. Evaluating the efficiency of advancedwastewater treatment: target analysis of organiccontaminants and (geno-)toxicity assessment tell a differentstory. Water Res. 50, 35e47.
Masi�a, A., Campo, J., Blasco, C., Pic�o, Y., 2014. Ultra-highperformance liquid chromatography-quadrupole time-of-flight mass spectrometry to identify contaminants in water:an insight on environmental forensics. J. Chromatogr. A 1345,86e97.
Miolo, G., Marzano, C., Gandin, V., Palozzo, A.C., Dalzoppo, D.,Salvador, A., Caffieri, S., 2011. Photoreactivity of 5-fluorouracilunder UVB light: photolysis and cytotoxicity studies. Chem.Res. Toxicol. 24 (8), 1319e1326.
Onesios, K.M., Yu, J.T., Bouwer, E.J., 2009. Biodegradation andremoval of pharmaceuticals and personal care products intreatment systems e a review. Biodegradation 20 (4),441e466.
Paul, T., Miller, P.L., Strathmann, T.J., 2007. Visible-light-mediatedTiO2 photocatalysis of fluoroquinolone antibacterial agents.Environ. Sci. Technol. 41 (13), 4720e4727.
Paul, T., Dodd, M.C., Strathmann, T.J., 2010. Photolytic andphotocatalytic decomposition of aqueous ciprofloxacin:transformation products and residual antibacterial activity.Water Res. 44 (10), 3121e3132.
P�erez, S., Barcel�o, D., 2007. Application of advanced MStechniques to analysis and identification of human and
microbial metabolites of pharmaceuticals in the aquaticenvironment. TrAC e Trends Anal. Chem. 26 (6), 494e514.
Petrovi�c, M., Hernando, M.D., Diaz-Cruz, M.S., Barcel�o, D., 2005.Liquid chromatography-tandem mass spectrometry for theanalysis of pharmaceutical residues in environmentalsamples e a review. J. Chromatogr. A 1067 (1e2), 1e14.
Prieto, A., Moder, M., Rodil, R., Adrian, L., Marco-Urrea, E., 2011.Degradation of the antibiotics norfloxacin and ciprofloxacinby a white-rot fungus and identification of degradationproducts. Bioresour. Technol. 102 (23), 10987e10995.
Pujol, M., Girona, V., Prat, J., Mu~noz, M., Bol�os, J. de, 1997.Degradation pathway of carboplatin in aqueous solution. Int.J. Pharm. 146 (2), 263e269.
Radjenovi�c, J., Godehardt, M., Petrovi�c, M., Hein, A., Farr�e, M.,Jekel, M., Barcel�o, D., 2009a. Evidencing generation ofpersistent ozonation products of antibiotics roxithromycinand trimethoprim. Environ. Sci. Technol. 43 (17), 6808e6815.
Radjenovi�c, J., Petrovi�c, M., Barcel�o, D., 2009b. Complementarymass spectrometry and bioassays for evaluatingpharmaceutical-transformation products in treatment ofdrinking water and wastewater. TrAC e Trends Anal. Chem.28 (5), 562e580.
Rastogi, T., Leder, C., Kummerer, K., 2014a. A sustainablechemistry solution to the presence of pharmaceuticals andchemicals in the aquatic environment e the example of re-designing b-blocker atenolol. R. Soc. Chem. Adv. 5 (1), 27e32.
Rastogi, T., Leder, C., Kummerer, K., 2014b. Designing greenderivatives of b-blocker Metoprolol: a tiered approach forgreen and sustainable pharmacy and chemistry.Chemosphere 111, 493e499.
Richardson, S.D., Ternes, T.A., 2014. Water analysis: emergingcontaminants and current issues. Anal. Chem. 86 (6),2813e2848.
Rodil, R., Quintana, J.B., Cela, R., 2012. Transformation ofphenazone-type drugs during chlorination. Water Res. 46 (7),2457e2468.
Sanderson, H., Ingerslev, F., Brain, R.A., Halling-Sørensen, B.,Bestari, J.K., Wilson, C.J., Johnson, D.J., Solomon, K.R., 2005.Dissipation of oxytetracycline, chlortetracycline, tetracyclineand doxycycline using HPLC-UV and LC/MS/MS under aquaticsemi-field microcosm conditions. Chemosphere 60 (5),619e629.
Schmidt, C.K., Brauch, H.-J., 2008. N,N-dimethylsulfamide asprecursor for N-nitrosodimethylamine (NDMA) formationupon ozonation and its fate during drinking water treatment.Environ. Sci. Technol. 42 (17), 6340e6346.
Shah, P.M., 1991. Ciprofloxacin. Int. J. Antimicrob. Agents 1 (2e3),75e96.
Shelver, W.L., Varel, V.H., 2012. Development of a UHPLC-MS/MSmethod for the measurement of chlortetracycline degradationin swine manure. Anal. Bioanal. Chem. 402 (5), 1931e1939.
Sirtori, C., Aguera, A., Gernjak, W., Malato, S., 2010. Effect ofwater-matrix composition on trimethoprim solarphotodegradation kinetics and pathways. Water Res. 44 (9),2735e2744.
Steger-Hartmann, T., Kummerer, K., Schecker, J., 1996. Traceanalysis of the antineoplastics ifosfamide andcyclophosphamide in sewage water by two step solid-phaseextraction and gas chromatography-mass spectrometry. J.Chromatogr. A 726 (1e2), 179e184.
Stewart, B.W., Wild, C., 2014. World Cancer Report 2014. WHOPress.
Stieber, M., Putschew, A., Jekel, M., 2011. Treatment ofpharmaceuticals and diagnostic agents using zero-valent irone kinetic studies and assessment of transformation productsassay. Environ. Sci. Technol. 45 (11), 4944e4950.
Strategic Approach to International Chemicals Management.http://www.saicm.org (accessed 06.06.14.).
wa t e r r e s e a r c h 7 2 ( 2 0 1 5 ) 7 5e1 2 6 125
Sturini, M., Speltini, A., Maraschi, F., Profumo, A., Pretali, L.,Irastorza, E.A., Fasani, E., Albini, A., 2012. Photolytic andphotocatalytic degradation of fluoroquinolones in untreatedriver water under natural sunlight. Appl. Catal. B Environ.119e120, 32e39.
Ternes, A.T., 1998. Occurence of drugs in German sewagetreatment plants and rivers. Water Res. 32 (11), 3245e3260.
Terzic, S., Senta, I., Matosic, M., Ahel, M., 2011. Identification ofbiotransformation products of macrolide and fluoroquinoloneantimicrobials in membrane bioreactor treatment byultrahigh-performance liquid chromatography/quadrupoletime-of-flight mass spectrometry. Anal. Bioanal. Chem. 401(1), 353e363.
Toolaram, A.P., Kummerer, K., Schneider, M., 2014.Environmental risk assessment of anti-cancer drugs and theirtransformation products: a focus on their genotoxicitycharacterization-state of knowledge and short comings.Mutat. Res./Rev. Mutat. Res. 760, 18e35.
Torniainen, K., Askolin, C.-P., Mattinen, J., 1997a. Isolation andstructure elucidation of an intermediate in thephotodegradation of ciprofloxacin. J. Pharm. Biomed. Anal. 16(3), 439e445.
Torniainen, K., Mattinen, J., Askolin, C.-P., Tammilehto, S., 1997b.Structure elucidation of a photodegradation product ofciprofloxacin. J. Pharm. Biomed. Anal. 15 (7), 887e894.
Trautwein, C., Kummerer, K., 2011. Incomplete aerobicdegradation of the antidiabetic drug metformin andidentification of the bacterial dead-end transformationproduct guanylurea. Chemosphere 85 (5), 765e773.
Trautwein, C., Berset, J.-D., Wolschke, H., Kummerer, K., 2014.Occurrence of the antidiabetic drug metformin and itsultimate transformation product guanylurea in severalcompartments of the aquatic cycle. Environ. Int. 70, 203e212.
Turiel, E., Bordin, G., Rodriguez, A.R., 2005. Study of the evolutionand degradation products of ciprofloxacin and oxolinic acid inriver water samples by HPLC-UV/MS/MS-MS. J. Environ. Monit.7 (3), 189e195.
Van Der Aa, M., Kommer, G., 2010. Forecast of pharmaceuticalconsumption in the Netherlands using demographicprojections. In: Kummerer, K., Hempel, M. (Eds.), Green andSustainable Pharmacy. Springer, Berlin, Heidelberg,pp. 201e208.
Vasconcelos, T.G., Henriques, D.M., K€onig, A., Martins, A.F.,Kummerer, K., 2009. Photo-degradation of the antimicrobialciprofloxacin at high pH: identification and biodegradabilityassessment of the primary by-products. Chemosphere 76 (4),487e493.
Venta, M.B., Castro, C.H., Garcia, L.A., Marzo, A.L., Lorenzo, E.V.,Alvarez, C.A., 2005. Effect of O3/H2O2 molar concentration ratioat different pH values on cyclophosphamide degradation. J.Water Supply: Res. Technol. e AQUA 54 (7), 403e410.
Wang, P., He, Y.-L., Huang, C.-H., 2010. Oxidation offluoroquinolone antibiotics and structurally related amines by
chlorine dioxide: reaction kinetics, product and pathwayevaluation. Water Res. 44 (20), 5989e5998.
Wang, Y., Zhang, H., Chen, L., 2011a. Ultrasound enhancedcatalytic ozonation of tetracycline in a rectangular air-liftreactor. Catal. Today 175 (1), 283e292.
Wang, Y., Zhang, H., Zhang, J., Lu, C., Huang, Q., Wu, J., Liu, F.,2011b. Degradation of tetracycline in aqueous media byozonation in an internal loop-lift reactor. J. Hazard. Mater. 192(1), 35e43.
Wang, Y., Zhang, H., Chen, L., Wang, S., Zhang, D., 2012.Ozonation combined with ultrasound for the degradation oftetracycline in a rectangular air-lift reactor. Sep. Purif.Technol. 84, 138e146.
Wetzstein, H.G., Stadler, M., Tichy, H.V., Dalhoff, A., Karl, W.,1999. Degradation of ciprofloxacin by basidiomycetes andidentification of metabolites generated by the brown rotfungus Gloeophyllum striatum. Appl. Environ. Microbiol. 65 (4),1556e1563.
Wetzstein, H.-G., Schneider, J., Karl, W., 2006. Patterns ofmetabolites produced from the fluoroquinolone enrofloxacinby basidiomycetes indigenous to agricultural sites. Appl.Microbiol. Biotechnol. 71 (1), 90e100.
Witte, B.D., Van Langenhove, H., Hemelsoet, K., Demeestere, K.,Wispelaere, P.D., Van Speybroeck, V., Dewulf, J., 2009.Levofloxacin ozonation in water: rate determining processparameters and reaction pathway elucidation. Chemosphere76 (5), 683e689.
Wu, X., Wei, Y., Zheng, J., Zhao, X., Zhong, W., 2011. Thebehavior of tetracyclines and their degradation productsduring swine manure composting. Bioresour. Technol. 102(10), 5924e5931.
Xia, K., Bhandari, A., Das, K., Pillar, G., 2005. Occurrence and fateof pharmaceuticals and personal care products (PPCPs) inbiosolids. J. Environ. Qual. 34 (1), 91e104.
Yi, T., Barr, W., Harper, W.F., 2012. Electron density-basedtransformation of trimethoprim during biological wastewatertreatment. Water Sci. Technol. 65 (4), 689e696.
Yin, J., Shao, B., Zhang, J., Li, K., 2010. A preliminary study on theoccurrence of cytostatic drugs in hospital effluents in Beijing,China. Bull. Environ. Contam. Toxicol. 84 (1), 39e45.
Yuan, F., Hu, C., Hu, X., Wei, D., Chen, Y., Qu, J., 2011.Photodegradation and toxicity changes of antibiotics in UVand UV/H2O2 process. J. Hazard. Mater. 185 (2e3), 1256e1263.
Zhang, H., Huang, C.-H., 2005. Oxidative transformation offluoroquinolone antibacterial agents and structurally relatedamines by manganese oxide. Environ. Sci. Technol. 39 (12),4474e4483.
Zhang, J., Chang, V.W.C., Giannis, A., Wang, J.Y., 2013. Removal ofcytostatic drugs from aquatic environment: a review. Sci.Total Environ. 45e446, 281e298.
Zwiener, C., 2007. Occurrence and analysis of pharmaceuticalsand their transformation products in drinking watertreatment. Anal. Bioanal. Chem. 387 (4), 1159e1162.
wat e r r e s e a r c h 7 2 ( 2 0 1 5 ) 7 5e1 2 6126
Article II
Removal of the anti-cancer drug methotrexate from water by advanced
oxidation processes: Aerobic biodegradation and toxicity studies after
treatment.
Lutterbeck, C. A., Baginska, E., Machado. Ê. L., Kümmerer, K., Chemosphere
2015a;141:290–6. doi: 10.1016/j.chemosphere.2015.07.069

Removal of the anti-cancer drug methotrexate from water by advancedoxidation processes: Aerobic biodegradation and toxicity studies aftertreatment
Carlos Alexandre Lutterbeck a,b, Ewelina Baginska a, Ênio Leandro Machado b, Klaus Kümmerer a,⇑
a Sustainable Chemistry and Material Resources, Institute of Sustainable and Environmental Chemistry, Faculty of Sustainability, Leuphana University of Lüneburg,
Scharnhorststraße 1/C13, DE-21335 Lüneburg, GermanybGraduate Program in Environmental Technology, Universidade de Santa Cruz do Sul — UNISC, Av. Independência, 2293, CEP 96815-900 Santa Cruz do Sul, Rio Grande do Sul, Brazil
h i g h l i g h t s
� AOP’s were compared with respect to degree and kinetics of elimination and mineralization of MTX.� The parent compound was easily eliminated in all the treatments.� None of the treatments fully mineralized MTX and formation of stable intermediates was observed.� MTX and its photolytic mixture were not biodegradable.� Photolytic mixture was less toxic than MTX itself.
a r t i c l e i n f o
Article history:
Received 9 March 2015Received in revised form 23 July 2015Accepted 29 July 2015Available online 27 August 2015
Keywords:
MethotrexateAdvanced oxidation processMineralizationBiodegradationToxicityTransformation product
a b s t r a c t
Anti-cancer drugs are discussed as high risk substances in regard to human health and considered asproblematic for the environment. They are of potential environmental relevance due to their poorbiodegradability and toxicological properties. Methotrexate (MTX) is an antimetabolite that was intro-duced in the pharmaceutical market in the 40’s and still today is one of the most consumed cytotoxiccompounds around the world. In the present study MTX was only partially biodegraded in the closed bot-tle test (CBT). Therefore, it was submitted to three different advanced oxidation processes (AOPs): UV/H2O2, UV/Fe
2+/H2O2 and UV/TiO2. The irradiation was carried out with a Hg medium-pressure lamp dur-ing 256 min whereas the analytical monitoring was done through LC-UV–MS/MS and DOC analysis. MTXwas easily removed in all the irradiation experiments, while the highest mineralization values and rateswere achieved by the UV/Fe2+/H2O2 treatment. The lowest resulted from the UV/H2O2 reactions. The UV/H2O2 treatment resulted in little biodegradable transformation products (TPs). However, the same treat-ment resulted in a reduction of the toxicity of MTX by forming less toxic TPs. Analysis by LC-UV–MS/MSrevealed the existence of nine TPs formed during the photo-catalytic treatments. The pH of the solutionsdecreased from 6.4 (t 0 min) to 5.15 in the UV/H2O2 and from 6.4 (t 0 min) to 5.9 in the UV/TiO2 at the endof the experiments. The initial pH of the UV/Fe2+/H2O2 experiments was adjusted to 5 and after the addi-tion of H2O2 the pH decreased to around 3 and remained in this range until the end of the treatments.
� 2015 Elsevier Ltd. All rights reserved.
1. Introduction
Pharmaceuticals are ubiquitous substances and several studieshave detected their presence in wastewaters (Kümmerer, 2001;Escher et al., 2011), surface waters (Buerge et al., 2006; Fatta-Kassinos et al., 2011), drinking waters (Heberer, 2002; Mompelatet al., 2009) and ground waters (Heberer, 2002). Among the variousclasses of pharmaceuticals, the anti-cancer drugs require a specialattention because of an increasing demand for the chemotherapytreatment (Hoppe-Tichy, 2010). Anti-cancer drugs are discussed
http://dx.doi.org/10.1016/j.chemosphere.2015.07.0690045-6535/� 2015 Elsevier Ltd. All rights reserved.
⇑ Corresponding author at: Nachhaltige Chemie und Stoffliche Ressourcen,Institut für Nachhaltige Chemie und Umweltchemie, Fakultät für Nachhaltigkeit,Leuphana Universität Lüneburg, Scharnhorststraße 1/C13, D-21335 Lüneburg,Germany.
E-mail addresses: [email protected] (C.A. Lutterbeck), [email protected] (E. Baginska), [email protected] (Ê.L Machado), [email protected](K. Kümmerer).
Chemosphere 141 (2015) 290–296
Contents lists available at ScienceDirect
Chemosphere
journal homepage: www.elsevier .com/locate /chemosphere
as high risk substances in regard of human health and consideredas problematic for the environment because of their special prop-erties in combination with poor biodegradability (Toolaram et al.,2014). Methotrexate (MTX) is a mutagen and a teratogen anti-cancer drug which belongs to the subgroup of the antimetabolitesand acts by blocking enzyme activity and disrupting the DNAsynthesis.
It is widely used at high dose for the chemotherapy of variousforms of cancer (bronchial, breast and ovarian cancer, lymphomas,leukemia) and has been sold since the 1940s (Rubino, 2001). MTXis a highly polar compound with negligible bioaccumulation andsorption to organic matter (Table S1). Up to 90% of the unchangeddrug can be excreted by urine and feces. Therefore, it can beexpected in the water cycle. Some studies reveal the presence ofMTX in hospital and sewage treatment plant (STP) effluents, andeven in surface waters at a concentration range of ng/L (Halling-Sørensen et al., 1998; Castiglioni et al., 2005; Yin et al., 2010;Besse et al., 2012).
These findings demonstrate that the traditional biological,physical and chemical water and wastewater treatments are inef-fective in removing or mineralizing MTX. In those cases, advancedoxidation processes (AOP’s) may be suitable methods, which mayyield good elimination. Besides, the AOP’s represent an interestingalternative, since they can be employed in association with biolog-ical treatments for wastewater remediation, as a pre-treatment,increasing the biodegradability by a partial oxidation, or as apost-treatment for the degradation of persistent compounds (Dela Cruz et al., 2012).
Over the last years many studies have reported the applicationof UV/H2O2, UV/Fe
2+/H2O2 and UV/TiO2 systems to degrade phar-maceutical compounds (Arslan-Alaton and Dogruel, 2004;Elmolla and Chaudhuri, 2010; De la Cruz et al., 2012; Slemanet al., 2012). However, often incomplete mineralization can resultin the formation of unwanted reaction products (so called transfor-mation products, TPs) of unknown properties.
The objectives of the present work were: (i) to evaluate thebiodegradability of MTX, (ii) to compare the efficiency of the elim-ination of MTX as well as its degree of mineralization by UV/H2O2,UV/Fe2+/H2O2 and UV/TiO2 (iii) to evaluate the biodegradability ofits photo-TPs, and (iv) to assess the toxicity of MTX and its photoTPs.
2. Materials and methods
As methotrexate exhibits mutagenic and teratogenic properties,the work with this compound requires strict safety precautions(Allwood et al., 2002).
2.1. Chemicals
All solvents used in our studies were of HPLC grade and allchemicals were of analytical reagent grade or higher (Text S1).
2.2. Advanced photo treatments
The assays were performed in an 800 mL batch photo-reactorcontaining 600 mL of MTX with an initial concentration of20 mg/L. The high concentration was used in order to allow for per-forming subsequent biodegradation testing. A medium-pressuremercury lamp (TQ150, UV Consulting Peschl, Mainz) with an ilma-sil quartz immersion tube was used to irradiate the samples. Ameasured lamp output of 2057 mJ/cm2 was obtained using anUVpad Spectral Radiometer (Opsytec Dr. Gröbel GmbH, Ettlingen,Germany). The emission of the used UV lamp was measured withUV-pad Spectral Radiometer (Opsytec Dr. Gröbel GmbH,
Ettlingen, Germany) at a distance of 4 cm from the emission sourcein an aluminum box in the range of 200–440 nm (Fig. S1).
The solutions were constantly stirred in order to ensure homo-geneity and a circulating cooling system (WKL230, LAUDA, Berlin)was used to keep the temperature between 20 ± 2 �C. The pH val-ues were also monitored during all the treatments. The experi-ments were performed during 256 min with samplings at regulartime points in a geometrical row (2, 4, 8, 16, 32, 64, 128 and256 min) to check the degradation and mineralization rates ofthe compounds.
Nonlinear regression analyses were performed using an expo-nential decay model with the statistical software Prism 5(Graphpad Inc., CA, USA). The functions ‘‘one phase decay” and‘‘two phase decay” were used to calculate the rate constants andthe half-lifes of the three processes. A more detailed descriptionof data analysis is available in the Supplementary Material (TextS2).
2.2.1. UV/H2O2
Three different concentrations of hydrogen peroxide (9.8 mM,14.7 mM and 19.6 mM) were tested in order to determine the opti-mum concentration range in our experiments. The mineralizationdegrees were used to evaluate the performance of the processes.Aiming to avoid any direct oxidation of MTX by hydrogen peroxide,the lamp was firstly turned on and afterwards the hydrogen perox-ide was added. The pH of the samples collected during the assayswas adjusted to 7 (±1) with NaOH, whereas the residual, unreactedH2O2 was destroyed by the addition of catalase made from bovineliver (1 unit will decompose 1.0 lmole of H2O2 per min at pH 7.0 at25 �C).
2.2.2. UV/Fe2+/H2O2
The experiments were performed based on the mineralizationresults of the UV/H2O2 experiments. The initial concentrations ofH2O2 and FeSO4�7H2O were 9.8 mM and 1.56 mM respectively.The pH was adjusted to 5 with H2SO4 (2 M, 98%) (although the lit-erature defines the optimal pH for the Fenton reactions at around3, preliminary experiments showed no better results than the onesperformed in pH 5). Furthermore two additional experiments vary-ing the concentrations of hydrogen peroxide (15.5 mM and19.6 mM) and of the catalyst (2.14 mM) were also performed. Inorder to precipitate the ferric ions after the irradiation was finishedthe pH of the aliquots was adjusted to 7 ± 1 with NaOH. Afterwardscatalase was used to destroy the residual, unreacted H2O2 and thesamples were then centrifuged at 4000 rpm for 5 min and subse-quently filtered through 0.2-lm filter membranes (CHROMAFIL�
Xtra.Typ: PES 20/25, Macherey–Nagel, Germany).A simple and practical spectrophotometric method based on the
reaction of H2O2 with ammonium metavanadate in acidic mediumwas used for monitoring the H2O2 consumption during the tests(Nogueira et al., 2005). The concentrations of ferric and ferrousions were determined using a colorimetric method with 1–10phenantroline (APHA/AWWA/WPCF, 2012).
2.2.3. UV/TiO2
Preliminary experiments with different concentrations (100,500 and 1000 mg/L) were performed in order set the best titaniumdioxide concentration. Before starting the photo-catalytic assays,solutions containing MTX and TiO2 were constantly stirred for30 min in the dark to reach adsorption equilibrium on the TiO2 sur-face. The samples collected during the treatments were centrifugedat 4000 rpm for 5 min and then filtered through 0.2-lmmembranefilters (CHROMAFIL� Xtra.Typ: PES 20/25, Macherey–Nagel,Germany).
C.A. Lutterbeck et al. / Chemosphere 141 (2015) 290–296 291
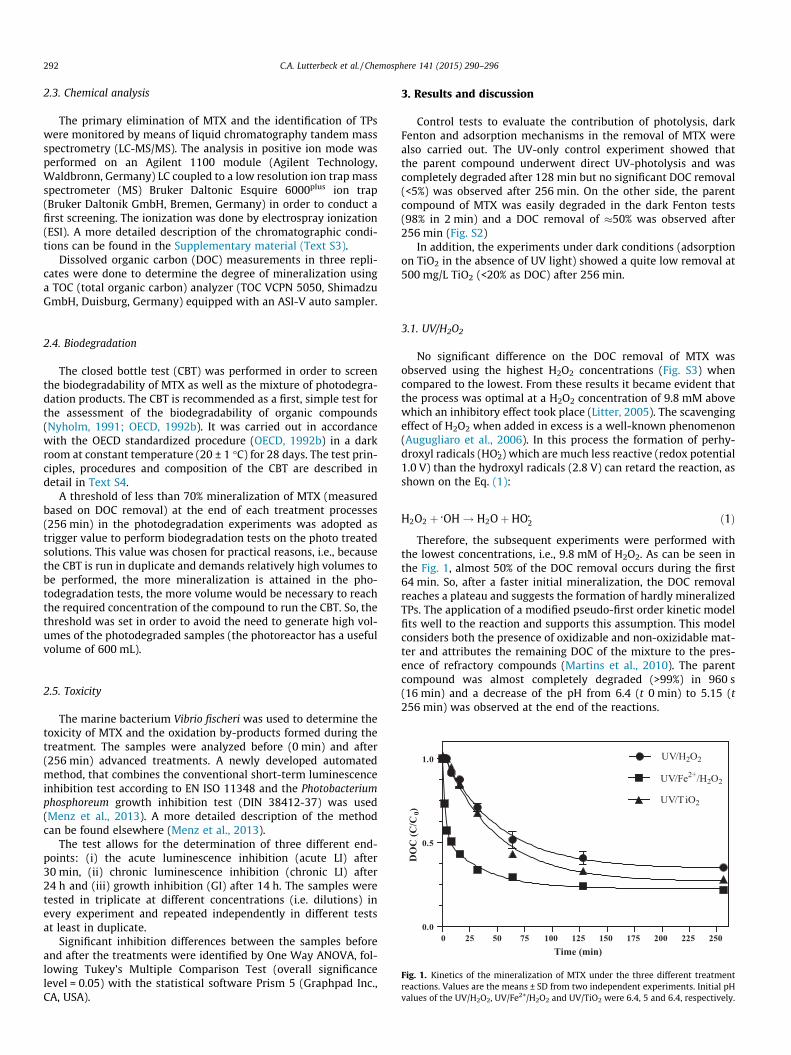
2.3. Chemical analysis
The primary elimination of MTX and the identification of TPswere monitored by means of liquid chromatography tandem massspectrometry (LC-MS/MS). The analysis in positive ion mode wasperformed on an Agilent 1100 module (Agilent Technology,Waldbronn, Germany) LC coupled to a low resolution ion trap massspectrometer (MS) Bruker Daltonic Esquire 6000plus ion trap(Bruker Daltonik GmbH, Bremen, Germany) in order to conduct afirst screening. The ionization was done by electrospray ionization(ESI). A more detailed description of the chromatographic condi-tions can be found in the Supplementary material (Text S3).
Dissolved organic carbon (DOC) measurements in three repli-cates were done to determine the degree of mineralization usinga TOC (total organic carbon) analyzer (TOC VCPN 5050, ShimadzuGmbH, Duisburg, Germany) equipped with an ASI-V auto sampler.
2.4. Biodegradation
The closed bottle test (CBT) was performed in order to screenthe biodegradability of MTX as well as the mixture of photodegra-dation products. The CBT is recommended as a first, simple test forthe assessment of the biodegradability of organic compounds(Nyholm, 1991; OECD, 1992b). It was carried out in accordancewith the OECD standardized procedure (OECD, 1992b) in a darkroom at constant temperature (20 ± 1 �C) for 28 days. The test prin-ciples, procedures and composition of the CBT are described indetail in Text S4.
A threshold of less than 70% mineralization of MTX (measuredbased on DOC removal) at the end of each treatment processes(256 min) in the photodegradation experiments was adopted astrigger value to perform biodegradation tests on the photo treatedsolutions. This value was chosen for practical reasons, i.e., becausethe CBT is run in duplicate and demands relatively high volumes tobe performed, the more mineralization is attained in the pho-todegradation tests, the more volume would be necessary to reachthe required concentration of the compound to run the CBT. So, thethreshold was set in order to avoid the need to generate high vol-umes of the photodegraded samples (the photoreactor has a usefulvolume of 600 mL).
2.5. Toxicity
The marine bacterium Vibrio fischeri was used to determine thetoxicity of MTX and the oxidation by-products formed during thetreatment. The samples were analyzed before (0 min) and after(256 min) advanced treatments. A newly developed automatedmethod, that combines the conventional short-term luminescenceinhibition test according to EN ISO 11348 and the Photobacterium
phosphoreum growth inhibition test (DIN 38412-37) was used(Menz et al., 2013). A more detailed description of the methodcan be found elsewhere (Menz et al., 2013).
The test allows for the determination of three different end-points: (i) the acute luminescence inhibition (acute LI) after30 min, (ii) chronic luminescence inhibition (chronic LI) after24 h and (iii) growth inhibition (GI) after 14 h. The samples weretested in triplicate at different concentrations (i.e. dilutions) inevery experiment and repeated independently in different testsat least in duplicate.
Significant inhibition differences between the samples beforeand after the treatments were identified by One Way ANOVA, fol-lowing Tukey’s Multiple Comparison Test (overall significancelevel = 0.05) with the statistical software Prism 5 (Graphpad Inc.,CA, USA).
3. Results and discussion
Control tests to evaluate the contribution of photolysis, darkFenton and adsorption mechanisms in the removal of MTX werealso carried out. The UV-only control experiment showed thatthe parent compound underwent direct UV-photolysis and wascompletely degraded after 128 min but no significant DOC removal(<5%) was observed after 256 min. On the other side, the parentcompound of MTX was easily degraded in the dark Fenton tests(98% in 2 min) and a DOC removal of �50% was observed after256 min (Fig. S2)
In addition, the experiments under dark conditions (adsorptionon TiO2 in the absence of UV light) showed a quite low removal at500 mg/L TiO2 (<20% as DOC) after 256 min.
3.1. UV/H2O2
No significant difference on the DOC removal of MTX wasobserved using the highest H2O2 concentrations (Fig. S3) whencompared to the lowest. From these results it became evident thatthe process was optimal at a H2O2 concentration of 9.8 mM abovewhich an inhibitory effect took place (Litter, 2005). The scavengingeffect of H2O2 when added in excess is a well-known phenomenon(Augugliaro et al., 2006). In this process the formation of perhy-droxyl radicals (HO2
� ) which are much less reactive (redox potential1.0 V) than the hydroxyl radicals (2.8 V) can retard the reaction, asshown on the Eq. (1):
H2O2 þ�OH ! H2OþHO�
2 ð1Þ
Therefore, the subsequent experiments were performed withthe lowest concentrations, i.e., 9.8 mM of H2O2. As can be seen inthe Fig. 1, almost 50% of the DOC removal occurs during the first64 min. So, after a faster initial mineralization, the DOC removalreaches a plateau and suggests the formation of hardly mineralizedTPs. The application of a modified pseudo-first order kinetic modelfits well to the reaction and supports this assumption. This modelconsiders both the presence of oxidizable and non-oxizidable mat-ter and attributes the remaining DOC of the mixture to the pres-ence of refractory compounds (Martins et al., 2010). The parentcompound was almost completely degraded (>99%) in 960 s(16 min) and a decrease of the pH from 6.4 (t 0 min) to 5.15 (t256 min) was observed at the end of the reactions.
0 25 50 75 100 125 150 175 200 225 250
0.0
0.5
1.0 UV/H2O2
UV/Fe2+/H2O2
UV/TiO2
Time (min)
DO
C (
C/C
0)
Fig. 1. Kinetics of the mineralization of MTX under the three different treatmentreactions. Values are the means ± SD from two independent experiments. Initial pHvalues of the UV/H2O2, UV/Fe
2+/H2O2 and UV/TiO2 were 6.4, 5 and 6.4, respectively.
292 C.A. Lutterbeck et al. / Chemosphere 141 (2015) 290–296
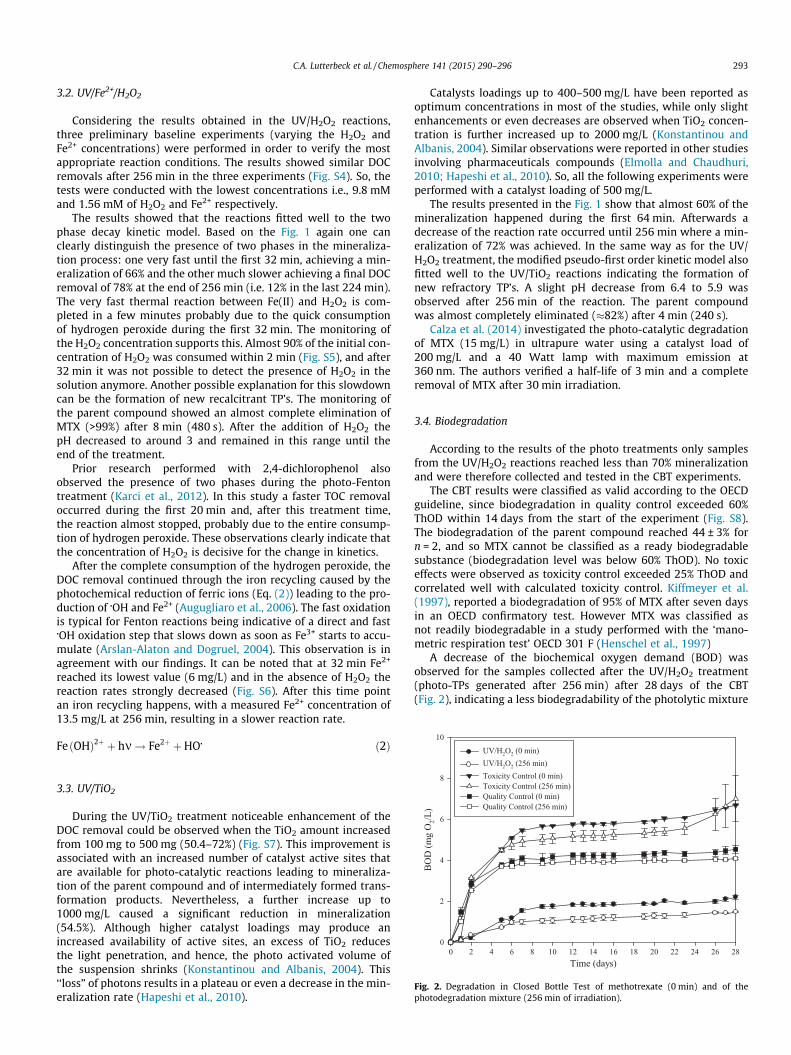
3.2. UV/Fe2+/H2O2
Considering the results obtained in the UV/H2O2 reactions,three preliminary baseline experiments (varying the H2O2 andFe2+ concentrations) were performed in order to verify the mostappropriate reaction conditions. The results showed similar DOCremovals after 256 min in the three experiments (Fig. S4). So, thetests were conducted with the lowest concentrations i.e., 9.8 mMand 1.56 mM of H2O2 and Fe2+ respectively.
The results showed that the reactions fitted well to the twophase decay kinetic model. Based on the Fig. 1 again one canclearly distinguish the presence of two phases in the mineraliza-tion process: one very fast until the first 32 min, achieving a min-eralization of 66% and the other much slower achieving a final DOCremoval of 78% at the end of 256 min (i.e. 12% in the last 224 min).The very fast thermal reaction between Fe(II) and H2O2 is com-pleted in a few minutes probably due to the quick consumptionof hydrogen peroxide during the first 32 min. The monitoring ofthe H2O2 concentration supports this. Almost 90% of the initial con-centration of H2O2 was consumed within 2 min (Fig. S5), and after32 min it was not possible to detect the presence of H2O2 in thesolution anymore. Another possible explanation for this slowdowncan be the formation of new recalcitrant TP’s. The monitoring ofthe parent compound showed an almost complete elimination ofMTX (>99%) after 8 min (480 s). After the addition of H2O2 thepH decreased to around 3 and remained in this range until theend of the treatment.
Prior research performed with 2,4-dichlorophenol alsoobserved the presence of two phases during the photo-Fentontreatment (Karci et al., 2012). In this study a faster TOC removaloccurred during the first 20 min and, after this treatment time,the reaction almost stopped, probably due to the entire consump-tion of hydrogen peroxide. These observations clearly indicate thatthe concentration of H2O2 is decisive for the change in kinetics.
After the complete consumption of the hydrogen peroxide, theDOC removal continued through the iron recycling caused by thephotochemical reduction of ferric ions (Eq. (2)) leading to the pro-duction of �OH and Fe2+ (Augugliaro et al., 2006). The fast oxidationis typical for Fenton reactions being indicative of a direct and fast�OH oxidation step that slows down as soon as Fe3+ starts to accu-mulate (Arslan-Alaton and Dogruel, 2004). This observation is inagreement with our findings. It can be noted that at 32 min Fe2+
reached its lowest value (6 mg/L) and in the absence of H2O2 thereaction rates strongly decreased (Fig. S6). After this time pointan iron recycling happens, with a measured Fe2+ concentration of13.5 mg/L at 256 min, resulting in a slower reaction rate.
Fe ðOHÞ2þ þ hm ! Fe2þ þHO� ð2Þ
3.3. UV/TiO2
During the UV/TiO2 treatment noticeable enhancement of theDOC removal could be observed when the TiO2 amount increasedfrom 100 mg to 500 mg (50.4–72%) (Fig. S7). This improvement isassociated with an increased number of catalyst active sites thatare available for photo-catalytic reactions leading to mineraliza-tion of the parent compound and of intermediately formed trans-formation products. Nevertheless, a further increase up to1000 mg/L caused a significant reduction in mineralization(54.5%). Although higher catalyst loadings may produce anincreased availability of active sites, an excess of TiO2 reducesthe light penetration, and hence, the photo activated volume ofthe suspension shrinks (Konstantinou and Albanis, 2004). This‘‘loss” of photons results in a plateau or even a decrease in the min-eralization rate (Hapeshi et al., 2010).
Catalysts loadings up to 400–500 mg/L have been reported asoptimum concentrations in most of the studies, while only slightenhancements or even decreases are observed when TiO2 concen-tration is further increased up to 2000 mg/L (Konstantinou andAlbanis, 2004). Similar observations were reported in other studiesinvolving pharmaceuticals compounds (Elmolla and Chaudhuri,2010; Hapeshi et al., 2010). So, all the following experiments wereperformed with a catalyst loading of 500 mg/L.
The results presented in the Fig. 1 show that almost 60% of themineralization happened during the first 64 min. Afterwards adecrease of the reaction rate occurred until 256 min where a min-eralization of 72% was achieved. In the same way as for the UV/H2O2 treatment, the modified pseudo-first order kinetic model alsofitted well to the UV/TiO2 reactions indicating the formation ofnew refractory TP’s. A slight pH decrease from 6.4 to 5.9 wasobserved after 256 min of the reaction. The parent compoundwas almost completely eliminated (�82%) after 4 min (240 s).
Calza et al. (2014) investigated the photo-catalytic degradationof MTX (15 mg/L) in ultrapure water using a catalyst load of200 mg/L and a 40 Watt lamp with maximum emission at360 nm. The authors verified a half-life of 3 min and a completeremoval of MTX after 30 min irradiation.
3.4. Biodegradation
According to the results of the photo treatments only samplesfrom the UV/H2O2 reactions reached less than 70% mineralizationand were therefore collected and tested in the CBT experiments.
The CBT results were classified as valid according to the OECDguideline, since biodegradation in quality control exceeded 60%ThOD within 14 days from the start of the experiment (Fig. S8).The biodegradation of the parent compound reached 44 ± 3% forn = 2, and so MTX cannot be classified as a ready biodegradablesubstance (biodegradation level was below 60% ThOD). No toxiceffects were observed as toxicity control exceeded 25% ThOD andcorrelated well with calculated toxicity control. Kiffmeyer et al.(1997), reported a biodegradation of 95% of MTX after seven daysin an OECD confirmatory test. However MTX was classified asnot readily biodegradable in a study performed with the ‘mano-metric respiration test’ OECD 301 F (Henschel et al., 1997)
A decrease of the biochemical oxygen demand (BOD) wasobserved for the samples collected after the UV/H2O2 treatment(photo-TPs generated after 256 min) after 28 days of the CBT(Fig. 2), indicating a less biodegradability of the photolytic mixture
Time (days)
0 2 4 6 8 10 12 14 16 18 20 22 24 26 28
BO
D (
mg O
2/L
)
0
2
4
6
8
10
UV/H2O
2 (0 min)
UV/H2O
2 (256 min)
Toxicity Control (0 min)
Toxicity Control (256 min)
Quality Control (0 min)
Quality Control (256 min)
Fig. 2. Degradation in Closed Bottle Test of methotrexate (0 min) and of thephotodegradation mixture (256 min of irradiation).
C.A. Lutterbeck et al. / Chemosphere 141 (2015) 290–296 293
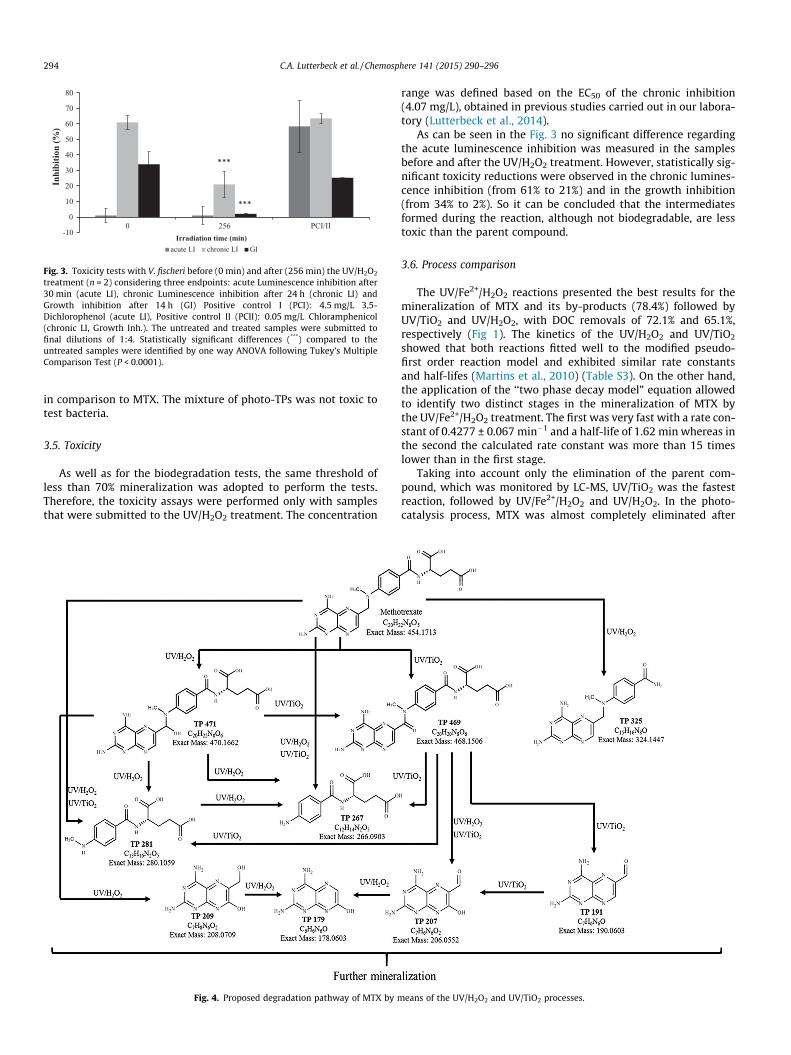
in comparison to MTX. The mixture of photo-TPs was not toxic totest bacteria.
3.5. Toxicity
As well as for the biodegradation tests, the same threshold ofless than 70% mineralization was adopted to perform the tests.Therefore, the toxicity assays were performed only with samplesthat were submitted to the UV/H2O2 treatment. The concentration
range was defined based on the EC50 of the chronic inhibition(4.07 mg/L), obtained in previous studies carried out in our labora-tory (Lutterbeck et al., 2014).
As can be seen in the Fig. 3 no significant difference regardingthe acute luminescence inhibition was measured in the samplesbefore and after the UV/H2O2 treatment. However, statistically sig-nificant toxicity reductions were observed in the chronic lumines-cence inhibition (from 61% to 21%) and in the growth inhibition(from 34% to 2%). So it can be concluded that the intermediatesformed during the reaction, although not biodegradable, are lesstoxic than the parent compound.
3.6. Process comparison
The UV/Fe2+/H2O2 reactions presented the best results for themineralization of MTX and its by-products (78.4%) followed byUV/TiO2 and UV/H2O2, with DOC removals of 72.1% and 65.1%,respectively (Fig 1). The kinetics of the UV/H2O2 and UV/TiO2
showed that both reactions fitted well to the modified pseudo-first order reaction model and exhibited similar rate constantsand half-lifes (Martins et al., 2010) (Table S3). On the other hand,the application of the ‘‘two phase decay model” equation allowedto identify two distinct stages in the mineralization of MTX bythe UV/Fe2+/H2O2 treatment. The first was very fast with a rate con-stant of 0.4277 ± 0.067 min�1 and a half-life of 1.62 min whereas inthe second the calculated rate constant was more than 15 timeslower than in the first stage.
Taking into account only the elimination of the parent com-pound, which was monitored by LC-MS, UV/TiO2 was the fastestreaction, followed by UV/Fe2+/H2O2 and UV/H2O2. In the photo-catalysis process, MTX was almost completely eliminated after
-10
0
10
20
30
40
50
60
70
80
PCI/II2560
Inh
ibit
ion
(%
)
Irradiation time (min)
acute LI chronic LI GI
***
***
Fig. 3. Toxicity tests with V. fischeri before (0 min) and after (256 min) the UV/H2O2
treatment (n = 2) considering three endpoints: acute Luminescence inhibition after30 min (acute LI), chronic Luminescence inhibition after 24 h (chronic LI) andGrowth inhibition after 14 h (GI) Positive control I (PCI): 4.5 mg/L 3,5-Dichlorophenol (acute LI), Positive control II (PCII): 0.05 mg/L Chloramphenicol(chronic LI, Growth Inh.). The untreated and treated samples were submitted tofinal dilutions of 1:4. Statistically significant differences (***) compared to theuntreated samples were identified by one way ANOVA following Tukey’s MultipleComparison Test (P < 0.0001).
Fig. 4. Proposed degradation pathway of MTX by means of the UV/H2O2 and UV/TiO2 processes.
294 C.A. Lutterbeck et al. / Chemosphere 141 (2015) 290–296
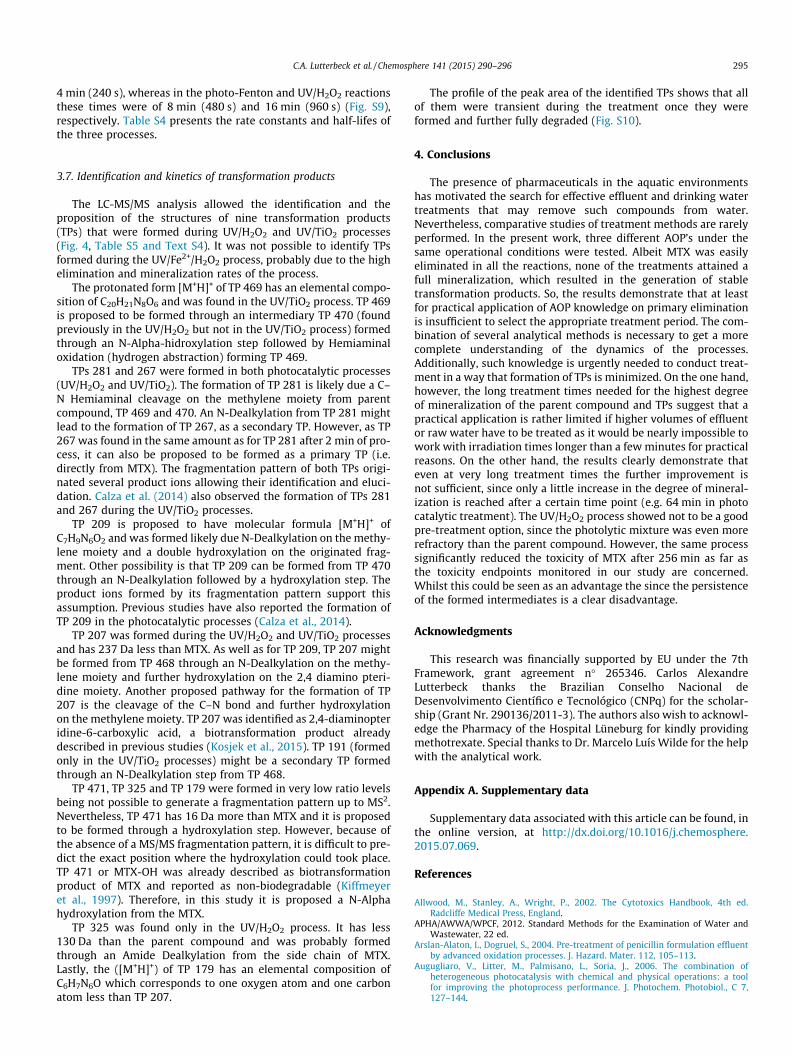
4 min (240 s), whereas in the photo-Fenton and UV/H2O2 reactionsthese times were of 8 min (480 s) and 16 min (960 s) (Fig. S9),respectively. Table S4 presents the rate constants and half-lifes ofthe three processes.
3.7. Identification and kinetics of transformation products
The LC-MS/MS analysis allowed the identification and theproposition of the structures of nine transformation products(TPs) that were formed during UV/H2O2 and UV/TiO2 processes(Fig. 4, Table S5 and Text S4). It was not possible to identify TPsformed during the UV/Fe2+/H2O2 process, probably due to the highelimination and mineralization rates of the process.
The protonated form [M+H]+ of TP 469 has an elemental compo-sition of C20H21N8O6 and was found in the UV/TiO2 process. TP 469is proposed to be formed through an intermediary TP 470 (foundpreviously in the UV/H2O2 but not in the UV/TiO2 process) formedthrough an N-Alpha-hidroxylation step followed by Hemiaminaloxidation (hydrogen abstraction) forming TP 469.
TPs 281 and 267 were formed in both photocatalytic processes(UV/H2O2 and UV/TiO2). The formation of TP 281 is likely due a C–N Hemiaminal cleavage on the methylene moiety from parentcompound, TP 469 and 470. An N-Dealkylation from TP 281 mightlead to the formation of TP 267, as a secondary TP. However, as TP267 was found in the same amount as for TP 281 after 2 min of pro-cess, it can also be proposed to be formed as a primary TP (i.e.directly from MTX). The fragmentation pattern of both TPs origi-nated several product ions allowing their identification and eluci-dation. Calza et al. (2014) also observed the formation of TPs 281and 267 during the UV/TiO2 processes.
TP 209 is proposed to have molecular formula [M+H]+ ofC7H9N6O2 and was formed likely due N-Dealkylation on the methy-lene moiety and a double hydroxylation on the originated frag-ment. Other possibility is that TP 209 can be formed from TP 470through an N-Dealkylation followed by a hydroxylation step. Theproduct ions formed by its fragmentation pattern support thisassumption. Previous studies have also reported the formation ofTP 209 in the photocatalytic processes (Calza et al., 2014).
TP 207 was formed during the UV/H2O2 and UV/TiO2 processesand has 237 Da less than MTX. As well as for TP 209, TP 207 mightbe formed from TP 468 through an N-Dealkylation on the methy-lene moiety and further hydroxylation on the 2,4 diamino pteri-dine moiety. Another proposed pathway for the formation of TP207 is the cleavage of the C–N bond and further hydroxylationon the methylene moiety. TP 207 was identified as 2,4-diaminopteridine-6-carboxylic acid, a biotransformation product alreadydescribed in previous studies (Kosjek et al., 2015). TP 191 (formedonly in the UV/TiO2 processes) might be a secondary TP formedthrough an N-Dealkylation step from TP 468.
TP 471, TP 325 and TP 179 were formed in very low ratio levelsbeing not possible to generate a fragmentation pattern up to MS2.Nevertheless, TP 471 has 16 Da more than MTX and it is proposedto be formed through a hydroxylation step. However, because ofthe absence of a MS/MS fragmentation pattern, it is difficult to pre-dict the exact position where the hydroxylation could took place.TP 471 or MTX-OH was already described as biotransformationproduct of MTX and reported as non-biodegradable (Kiffmeyeret al., 1997). Therefore, in this study it is proposed a N-Alphahydroxylation from the MTX.
TP 325 was found only in the UV/H2O2 process. It has less130 Da than the parent compound and was probably formedthrough an Amide Dealkylation from the side chain of MTX.Lastly, the ([M+H]+) of TP 179 has an elemental composition ofC6H7N6O which corresponds to one oxygen atom and one carbonatom less than TP 207.
The profile of the peak area of the identified TPs shows that allof them were transient during the treatment once they wereformed and further fully degraded (Fig. S10).
4. Conclusions
The presence of pharmaceuticals in the aquatic environmentshas motivated the search for effective effluent and drinking watertreatments that may remove such compounds from water.Nevertheless, comparative studies of treatment methods are rarelyperformed. In the present work, three different AOP’s under thesame operational conditions were tested. Albeit MTX was easilyeliminated in all the reactions, none of the treatments attained afull mineralization, which resulted in the generation of stabletransformation products. So, the results demonstrate that at leastfor practical application of AOP knowledge on primary eliminationis insufficient to select the appropriate treatment period. The com-bination of several analytical methods is necessary to get a morecomplete understanding of the dynamics of the processes.Additionally, such knowledge is urgently needed to conduct treat-ment in a way that formation of TPs is minimized. On the one hand,however, the long treatment times needed for the highest degreeof mineralization of the parent compound and TPs suggest that apractical application is rather limited if higher volumes of effluentor raw water have to be treated as it would be nearly impossible towork with irradiation times longer than a few minutes for practicalreasons. On the other hand, the results clearly demonstrate thateven at very long treatment times the further improvement isnot sufficient, since only a little increase in the degree of mineral-ization is reached after a certain time point (e.g. 64 min in photocatalytic treatment). The UV/H2O2 process showed not to be a goodpre-treatment option, since the photolytic mixture was even morerefractory than the parent compound. However, the same processsignificantly reduced the toxicity of MTX after 256 min as far asthe toxicity endpoints monitored in our study are concerned.Whilst this could be seen as an advantage the since the persistenceof the formed intermediates is a clear disadvantage.
Acknowledgments
This research was financially supported by EU under the 7thFramework, grant agreement n� 265346. Carlos AlexandreLutterbeck thanks the Brazilian Conselho Nacional deDesenvolvimento Científico e Tecnológico (CNPq) for the scholar-ship (Grant Nr. 290136/2011-3). The authors also wish to acknowl-edge the Pharmacy of the Hospital Lüneburg for kindly providingmethotrexate. Special thanks to Dr. Marcelo Luís Wilde for the helpwith the analytical work.
Appendix A. Supplementary data
Supplementary data associated with this article can be found, inthe online version, at http://dx.doi.org/10.1016/j.chemosphere.2015.07.069.
References
Allwood, M., Stanley, A., Wright, P., 2002. The Cytotoxics Handbook, 4th ed.Radcliffe Medical Press, England.
APHA/AWWA/WPCF, 2012. Standard Methods for the Examination of Water andWastewater, 22 ed.
Arslan-Alaton, I., Dogruel, S., 2004. Pre-treatment of penicillin formulation effluentby advanced oxidation processes. J. Hazard. Mater. 112, 105–113.
Augugliaro, V., Litter, M., Palmisano, L., Soria, J., 2006. The combination ofheterogeneous photocatalysis with chemical and physical operations: a toolfor improving the photoprocess performance. J. Photochem. Photobiol., C 7,127–144.
C.A. Lutterbeck et al. / Chemosphere 141 (2015) 290–296 295
Besse, J.-P., Latour, J.-F., Garric, J., 2012. Anticancer drugs in surface waters: whatcan we say about the occurrence and environmental significance of cytotoxic,cytostatic and endocrine therapy drugs? Environ. Int. 39, 73–86.
Buerge, I.J., Buser, H.R., Poiger, T., Muller, M.D., 2006. Occurrence and fate of thecytostatic drugs cyclophosphamide and ifosfamide in wastewater and surfacewaters. Environ. Sci. Technol. 40, 7242–7250.
Calza, P., Medana, C., Sarro, M., Rosato, V., Aigotti, R., Baiocchi, C., Minero, C., 2014.Photocatalytic degradation of selected anticancer drugs and identification oftheir transformation products in water by liquid chromatography–highresolution mass spectrometry. J. Chromatogr. A 1362, 135–144.
Castiglioni, S., Bagnati, R., Calamari, D., Fanelli, R., Zuccato, E., 2005. A multiresidueanalytical method using solid-phase extraction and high-pressure liquidchromatography tandem mass spectrometry to measure pharmaceuticals ofdifferent therapeutic classes in urban wastewaters. J. Chromatogr. A 1092, 206–215.
De la Cruz, N., Giménez, J., Esplugas, S., Grandjean, D., de Alencastro, L.F., Pulgarín,C., 2012. Degradation of 32 emergent contaminants by UV and neutral photo-fenton in domestic wastewater effluent previously treated by activated sludge.Water Res. 46, 1947–1957.
Elmolla, E.S., Chaudhuri, M., 2010. Photocatalytic degradation of amoxicillin,ampicillin and cloxacillin antibiotics in aqueous solution using UV/TiO2 andUV/H2O2/TiO2 photocatalysis. Desalination 252, 46–52.
Escher, B.I., Baumgartner, R., Koller, M., Treyer, K., Lienert, J., McArdell, C.S., 2011.Environmental toxicology and risk assessment of pharmaceuticals fromhospital wastewater. Water Res. 45, 75–92.
Fatta-Kassinos, D., Vasquez, M.I., Kümmerer, K., 2011. Transformation products ofpharmaceuticals in surface waters and wastewater formed during photolysisand advanced oxidation processes – Degradation, elucidation of byproducts andassessment of their biological potency. Chemosphere 85, 693–709.
Halling-Sørensen, B., Nors Nielsen, S., Lanzky, P.F., Ingerslev, F., Holten Lützhøft, H.C., Jørgensen, S.E., 1998. Occurrence, fate and effects of pharmaceuticalsubstances in the environment – a review. Chemosphere 36, 357–393.
Hapeshi, E., Achilleos, A., Vasquez, M.I., Michael, C., Xekoukoulotakis, N.P.,Mantzavinos, D., Kassinos, D., 2010. Drugs degrading photocatalytically:Kinetics and mechanisms of ofloxacin and atenolol removal on titaniasuspensions. Water Res. 44, 1737–1746.
Heberer, T., 2002. Occurrence, fate, and removal of pharmaceutical residues in theaquatic environment: a review of recent research data. Toxicol. Lett. 131, 5–17.
Henschel, K.P., Wenzel, A., Diedrich, M., Fliedner, A., 1997. Environmental hazardassessment of pharmaceuticals. Regul. Toxicol. Pharmacol. 25, 220–225.
Hoppe-Tichy, T., 2010. Current challenges in European oncology pharmacy practice.J. Oncol. Pharm. Pract. 16, 9–18.
Karci, A., Arslan-Alaton, I., Olmez-Hanci, T., Bekbölet, M., 2012. Transformation of2,4-dichlorophenol by H2O2/UV-C, Fenton and photo-Fenton processes:oxidation products and toxicity evolution. J. Photochem. Photobiol., A 230,65–73.
Kiffmeyer, T., Götze, H.-S., Jursch, M., Lüders, U., 1997. Trace enrichment,chromatographic separation and biodegradation of cytostatic compounds insurface water. Fresenius’ J. Anal. Chem. 361, 185–191.
Konstantinou, I.K., Albanis, T.A., 2004. TiO2-assisted photocatalytic degradation ofazo dyes in aqueous solution: kinetic and mechanistic investigations: a review.Appl. Catal. B 49, 1–14.
Kosjek, T., Negreira, N., de Alda, M.L., Barceló, D., 2015. Aerobic activated sludgetransformation of methotrexate: identification of biotransformation products.Chemosphere 119 (Supplement), S42–S50.
Kümmerer, K., 2001. Drugs in the environment: emission of drugs, diagnostic aidsand disinfectants into wastewater by hospitals in relation to other sources – areview. Chemosphere 45, 957–969.
Litter, M.I., 2005. Introduction to Photochemical Advanced Oxidation Processes forWater Treatment. Springer, Berlin Heidelberg. pp. 325–366.
Lutterbeck, C.A., Kern, D.I., Machado, Ê.L., Kümmerer, K., 2014. Ecotoxicologicalevaluation of selected anticancer drugs. Toxicol. Lett. 229 (Supplement), S71–S72.
Martins, R.C., Lopes, R.J.G., Quinta-Ferreira, R.M., 2010. Lumped kinetic models forsingle ozonation of phenolic effluents. Chem. Eng. J. 165, 678–685.
Menz, J., Schneider, M., Kümmerer, K., 2013. Toxicity testing with luminescentbacteria – characterization of an automated method for the combinedassessment of acute and chronic effects. Chemosphere 93, 990–996.
Mompelat, S., Le Bot, B., Thomas, O., 2009. Occurrence and fate of pharmaceuticalproducts and by-products, from resource to drinking water. Environ Int 35,803–814.
Nogueira, R.F.P., Oliveira, M.C., Paterlini, W.C., 2005. Simple and fastspectrophotometric determination of H2O2 in photo-Fenton reactions usingmetavanadate. Talanta 66, 86–91.
Nyholm, N., 1991. The european system of standardized legal tests for assessing thebiodegradability of chemicals. Environ. Toxicol. Chem. 10, 1237–1246.
OECD, 1992b. Organisation for Economic Co-operation and Development. OECDguideline for testing of chemicals 301D: ready biodegradability. Closed Bottletest.
Rubino, F.M., 2001. Separation methods for methotrexate, its structural analoguesand metabolites. J. Chromatogr. B. Biomed. Sci. Appl. 764, 217–254.
Sleman, F., Mahmoud, W.M.M., Schubert, R., Kümmerer, K., 2012. Photodegradation,photocatalytic, and aerobic biodegradation of sulfisomidine and identificationof transformation products by LC–UV-MS/MS. CLEAN – Soil Air, Water 40,1244–1249.
Toolaram, A.P., Kümmerer, K., Schneider, M., 2014. Environmental risk assessmentof anti-cancer drugs and their transformation products: a focus on theirgenotoxicity characterization-state of knowledge and short comings. Mutat.Res./Rev. Mutat. Res. 760, 18–35.
Yin, J., Shao, B., Zhang, J., Li, K., 2010. A preliminary study on the occurrence ofcytostatic drugs in hospital effluents in Beijing, China. Bull. Environ. Contam.Toxicol. 84, 39–45.
296 C.A. Lutterbeck et al. / Chemosphere 141 (2015) 290–296

Supplementary Material
Removal of the anti-cancer drug Methotrexate from
water by advanced oxidation processes: aerobic
biodegradation and toxicity studies after treatment
Carlos Alexandre Lutterbeck a,b, Ewelina Baginskaa, Ênio Leandro Machadob, Klaus
Kümmerer a
a Sustainable Chemistry and Material Resources, Institute of Sustainable and Environmental Chemistry, Faculty of
Sustainability, Leuphana University of Lüneburg, Scharnhorststraße 1/C13, DE-21335 Lüneburg, Germany
b Graduate Program in Environmental Technology, Universidade de Santa Cruz do Sul — UNISC, Av. Independência, 2293,
CEP 96815-900, Santa Cruz do Sul, Rio Grande do Sul, Brazil
Nachhaltige Chemie und Stoffliche Ressourcen, Institut für Nachhaltige Chemie und Umweltchemie, Fakultät für
Nachhaltigkeit, Leuphana Universität Lüneburg, Scharnhorststraße 1/C13, D-21335 Lüneburg, Germany. Tel.: +49 4131 677
2893.
E-Mail adresses: [email protected] (C. Lutterbeck), [email protected] (E. Baginska), [email protected] (E.
Machado), [email protected] (K. Kümmerer)
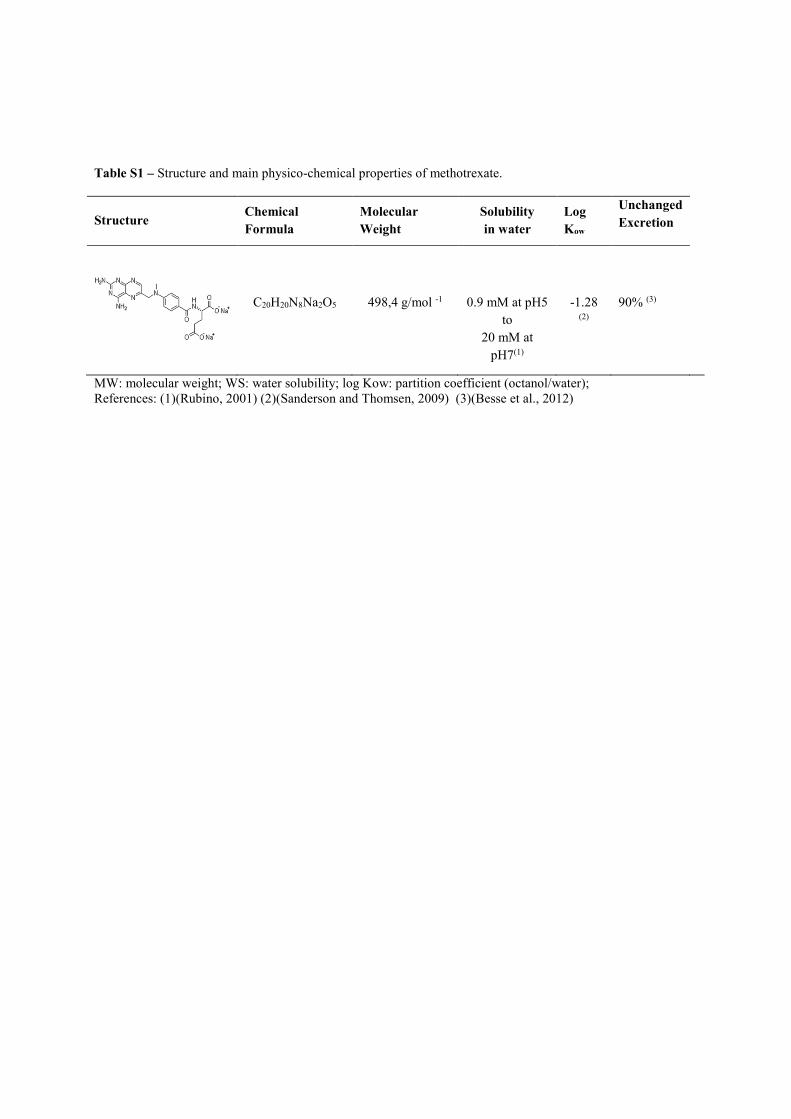
Table S1 – Structure and main physico-chemical properties of methotrexate.
Structure Chemical
Formula
Molecular
Weight
Solubility
in water
Log
Kow
Unchanged
Excretion
C20H20N8Na2O5
498,4 g/mol -1
0.9 mM at pH5
to 20 mM at
pH7(1)
-1.28
(2)
90% (3)
MW: molecular weight; WS: water solubility; log Kow: partition coefficient (octanol/water); References: (1)(Rubino, 2001) (2)(Sanderson and Thomsen, 2009) (3)(Besse et al., 2012)
Text Supplementary Material S1 - Chemicals:
Acetonitrile (HiPerSolv CHROMANORM, LC–MS grade, BDH Prolabo) and formic
acid (analytical grade) were purchased from VWR International GmbH (Darmstadt,
Germany). Sodium hydroxide (NaOH 1 M) and sulfuric acid (H2SO4 2 M, 98 %) were
obtained from Carl Roth GmbH & Co. KG (Karlsruhe, Germany) and titanium dioxide (TiO2
P25) was purchased from Evonik Degussa GmbH (Frankfurt, Germany). Hydrogen peroxide
(H2O2 30 % w/w) was acquired from Merck-Group (Darmstadt, Germany) whereas iron (II)
sulfate heptahydrate (FeSO4⋅7H2O), catalase from bovine liver (2,000-5,000 units/mg
protein), ammonium metavanadate (NH4VO3) and 1,10-phenantroline (C12H8N2) from Sigma-
Aldrich Biochemie GmbH (Hamburg, Germany). Methotrexate disodium (TEVA GmbH,
Ulm, Germany) was kindly provided and handled by the pharmacy of the Hospital Lüneburg,
Germany (therapeutic infusions bags were prepared on-demand). In order to avoid any
scavenging effect of other species and so evaluate only the degradation of MTX, all the
solutions were prepared using ultrapure water (Q1:16.6 mΩ and Q2: 18.2 mΩ).
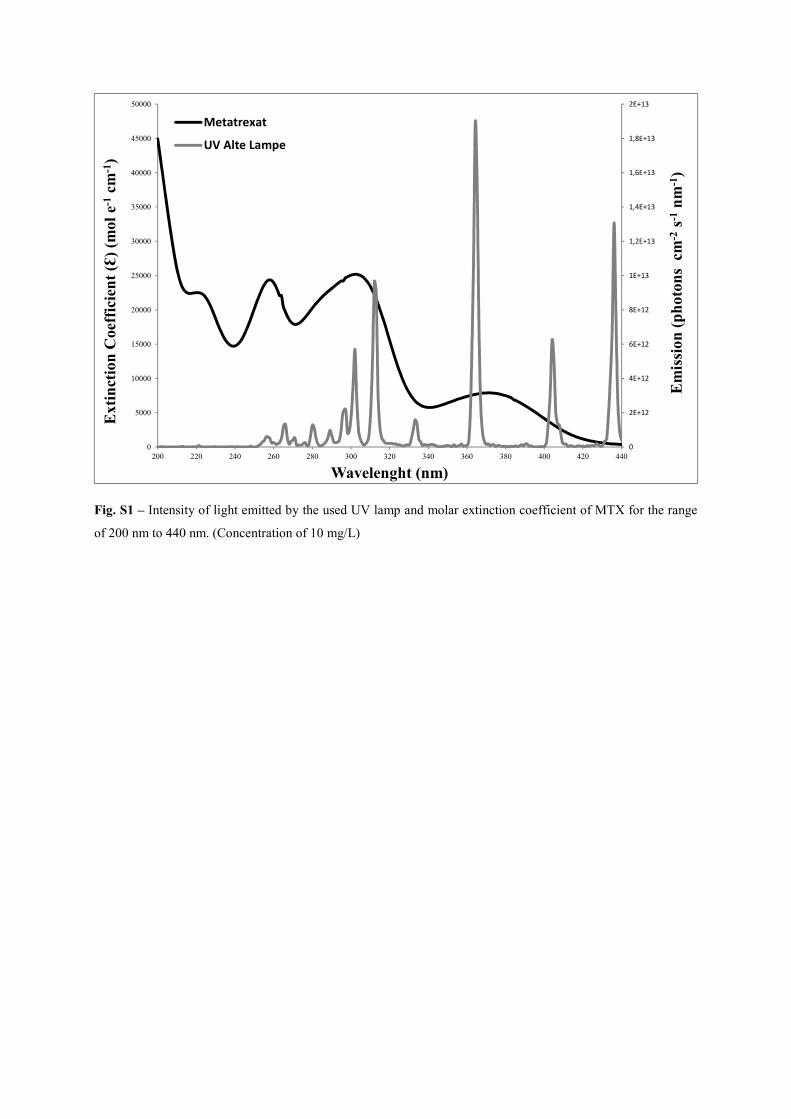
Fig. S1 – Intensity of light emitted by the used UV lamp and molar extinction coefficient of MTX for the range
of 200 nm to 440 nm. (Concentration of 10 mg/L)
0
2E+12
4E+12
6E+12
8E+12
1E+13
1,2E+13
1,4E+13
1,6E+13
1,8E+13
2E+13
0
5000
10000
15000
20000
25000
30000
35000
40000
45000
50000
200 220 240 260 280 300 320 340 360 380 400 420 440
Em
issi
on
(p
hoto
ns
cm
-2s-1
nm
-1)
Exti
nct
ion
Coef
fici
ent
(Ɛ)
(mol
e-1cm
-1)
Wavelenght (nm)
Metatrexat
UV Alte Lampe
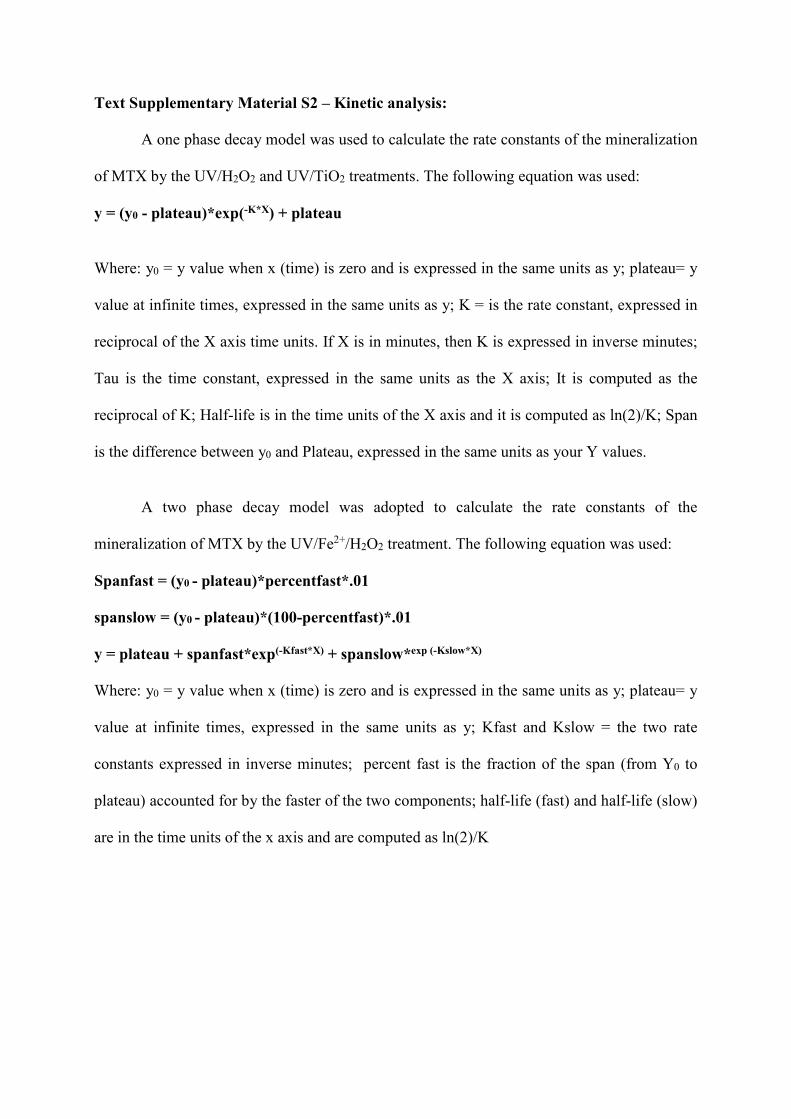
Text Supplementary Material S2 – Kinetic analysis:
A one phase decay model was used to calculate the rate constants of the mineralization
of MTX by the UV/H2O2 and UV/TiO2 treatments. The following equation was used:
y = (y0 - plateau)*exp(-K*X) + plateau
Where: y0 = y value when x (time) is zero and is expressed in the same units as y; plateau= y
value at infinite times, expressed in the same units as y; K = is the rate constant, expressed in
reciprocal of the X axis time units. If X is in minutes, then K is expressed in inverse minutes;
Tau is the time constant, expressed in the same units as the X axis; It is computed as the
reciprocal of K; Half-life is in the time units of the X axis and it is computed as ln(2)/K; Span
is the difference between y0 and Plateau, expressed in the same units as your Y values.
A two phase decay model was adopted to calculate the rate constants of the
mineralization of MTX by the UV/Fe2+/H2O2 treatment. The following equation was used:
Spanfast = (y0 - plateau)*percentfast*.01
spanslow = (y0 - plateau)*(100-percentfast)*.01
y = plateau + spanfast*exp(-Kfast*X) + spanslow*exp (-Kslow*X)
Where: y0 = y value when x (time) is zero and is expressed in the same units as y; plateau= y
value at infinite times, expressed in the same units as y; Kfast and Kslow = the two rate
constants expressed in inverse minutes; percent fast is the fraction of the span (from Y0 to
plateau) accounted for by the faster of the two components; half-life (fast) and half-life (slow)
are in the time units of the x axis and are computed as ln(2)/K
Text S3 LC-MS/MS analysis
The chromatographic separation of the sample was performed on a Nucleodur RP-18
endcapped 100-3 column, 2µm (Macherey-Nagel, Düren, Germany) coupled to a precolumn,
(Nucleodur C18 ec 4-2, 3µm; Macherey-Nagel, Düren, Germany). For elution, 0.1 % formic
acid in deionized water (solution A) and acetonitrile LC-MS grade (solution B) were used by
applying the following gradient: isocratic from 0 min. until 5 min 5 % B, linear gradient 20
min 70 % B, isocratic until 25 min 70 % B, 27 min 5 % B, 33 min 5 % B. The sample
injection volume was 10 µL and flow rate was 0.3 mL/min.
Mass spectra were obtained using a Bruker Daltonic Esquire 6000 ion trap mass
spectrometer (MS) equipped with a Bruker data analysis system (Bruker Daltonik GmbH,
Bremen, Germany). The MS was connected to the Agilent Technologies HPLC 1100
series. Ionization was done by an electrospray (ESI: electrospray ionization) module. The
positive mode was used. Setting of scan mode was full-MS without fragmentation of
molecular ions. The operation conditions of the source were: -500 V end plate and -3580 V
capillary voltages relative to the needle, 30 psi nebulizer pressure, and 12.0 mL min-1 nitrogen
dry gas flow at dry temperature of 350°C. For quantification, the molecule ion for MTX (m/z
455.1) at a retention time of 12.2 min was used.
Text Supplementary Material S4 – Aerobic Biodegradability:
The aerobic biodegradability of MTX and its TP’s was investigated in the Closed
Bottle Test (CBT) according to the OECD 301D guideline(OECD, 1992).
All the vessels used in the test contained the same mineral salt solution prepared in
accordance to the test guideline. The effluent collected from the municipal STP AGL GmbH,
Lüneburg, Nord, Germany (73 000 inhabitant equivalents) was used as inoculum source. Two
drops of inoculum were added to 1 L of the mineral medium solution, which resulted in
bacterial density of approx. 500 CFU/mL.
Each test consisted of four different series running in parallel and in duplicate,
respectively. The first series corresponded to the “blank” series, which contained only mineral
medium and inoculum. The vessels used in the “quality control” series were prepared using
readily biodegradable sodium acetate in a concentration corresponding to 5 mg/L theoretical
oxygen demand (ThODNH3, calculated without considering a possible nitrification) as the
only organic carbon source besides the inoculum. The “test” vessel series contained inoculum
and the test compound. The “toxicity control” was the fourth series and contained in addition
to the inoculum the test compound and sodium acetate in a concentration corresponding to 5
mg/L ThOD, respectively. A tested compound is considered to be inhibitory for the bacteria if
the biodegradation does not reach more than 25% of ThOD within 14 days. Additionally, to
determine the toxic effects, the oxygen consumption measured in the toxicity controls was
compared with the predicted level calculated from the oxygen consumption in the quality
control and in the test vessel, respectively.
During the whole test the consumption of oxygen in the bottles was measured daily
with an optical oxygen sensor system (Fibox 3 PreSens, Regensburg, Germany) using sensor
spots in the bottles. Besides, the temperature and the pH (day 0 and 28) were also controlled.
A more detailed description of the test can be found elsewhere (Kummerer et al., 1996;
Trautwein et al., 2008; Mahmoud and Kummerer, 2012; Friedrich et al., 2013).
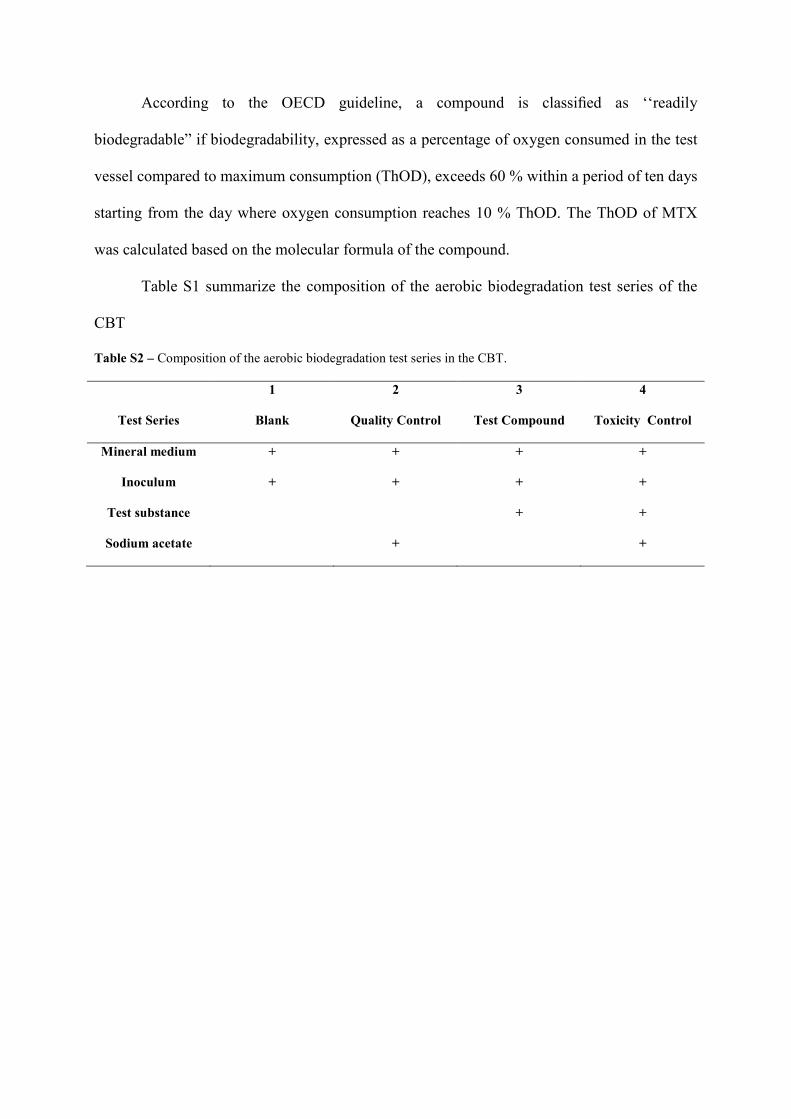
According to the OECD guideline, a compound is classified as ‘‘readily
biodegradable” if biodegradability, expressed as a percentage of oxygen consumed in the test
vessel compared to maximum consumption (ThOD), exceeds 60 % within a period of ten days
starting from the day where oxygen consumption reaches 10 % ThOD. The ThOD of MTX
was calculated based on the molecular formula of the compound.
Table S1 summarize the composition of the aerobic biodegradation test series of the
CBT
Table S2 – Composition of the aerobic biodegradation test series in the CBT.
Test Series
1
Blank
2
Quality Control
3
Test Compound
4
Toxicity Control
Mineral medium + + + +
Inoculum + + + +
Test substance + +
Sodium acetate + +
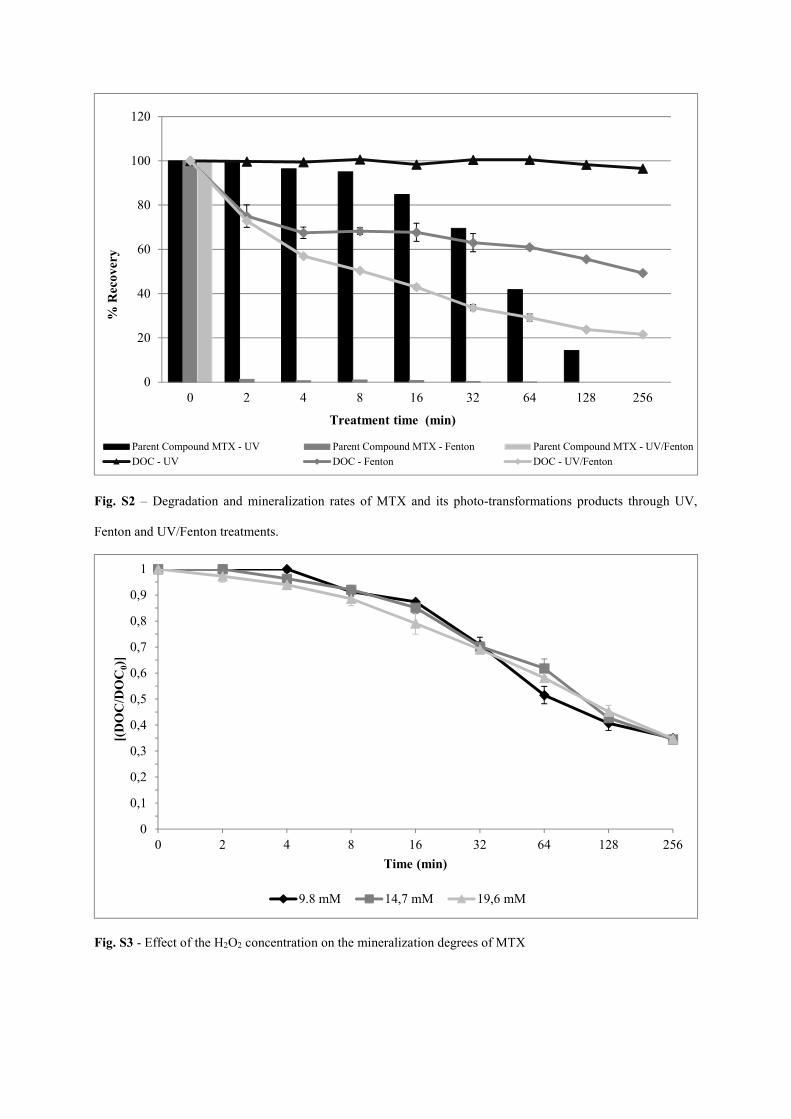
Fig. S2 – Degradation and mineralization rates of MTX and its photo-transformations products through UV,
Fenton and UV/Fenton treatments.
Fig. S3 - Effect of the H2O2 concentration on the mineralization degrees of MTX
0
20
40
60
80
100
120
0 2 4 8 16 32 64 128 256
% R
eco
ver
y
Treatment time (min)
Parent Compound MTX - UV Parent Compound MTX - Fenton Parent Compound MTX - UV/Fenton
DOC - UV DOC - Fenton DOC - UV/Fenton
0
0,1
0,2
0,3
0,4
0,5
0,6
0,7
0,8
0,9
1
0 2 4 8 16 32 64 128 256
[(D
OC
/DO
C0)]
Time (min)
9.8 mM 14,7 mM 19,6 mM
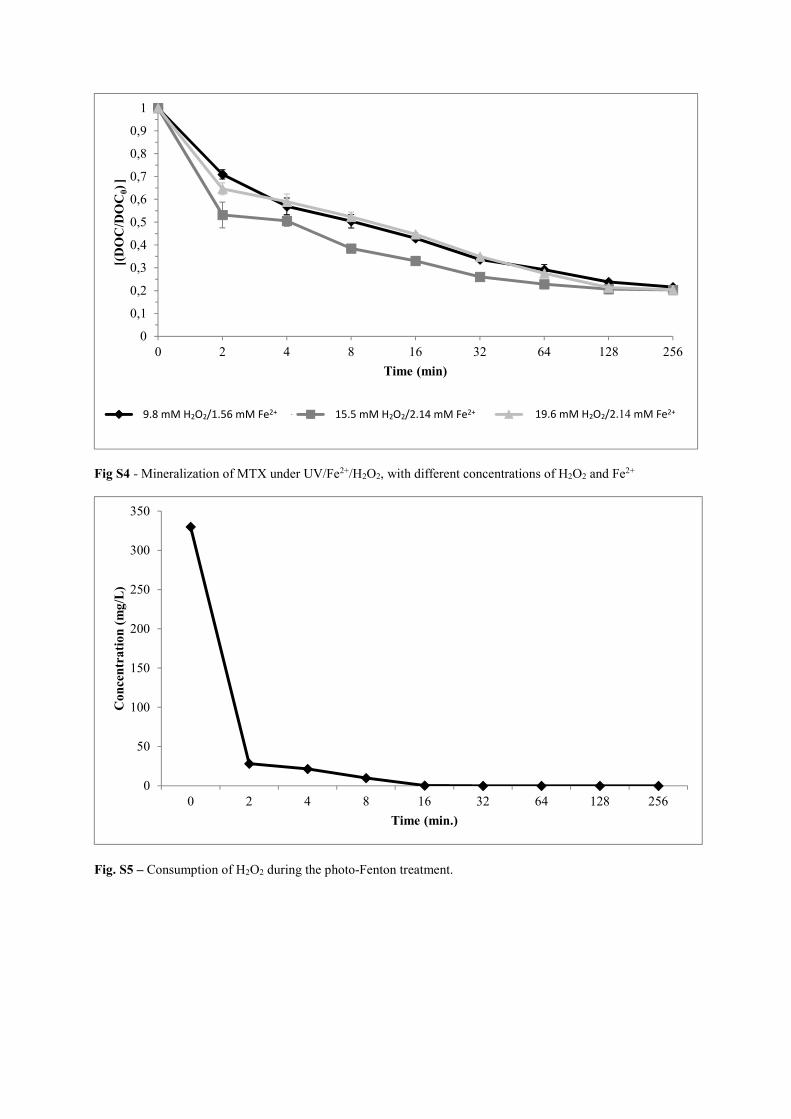
Fig S4 - Mineralization of MTX under UV/Fe2+/H2O2, with different concentrations of H2O2 and Fe2+
Fig. S5 – Consumption of H2O2 during the photo-Fenton treatment.
0
0,1
0,2
0,3
0,4
0,5
0,6
0,7
0,8
0,9
1
0 2 4 8 16 32 64 128 256
[(D
OC
/DO
C0)]
Time (min)
9.8 mM H2O2/1.55 mM Fe2+ 15.5 mM H2O2/2.14 mM Fe2+ 19.6 mM H2O2/2.14 mM Fe2+
0
50
100
150
200
250
300
350
0 2 4 8 16 32 64 128 256
Co
nce
ntr
ati
on
(m
g/L
)
Time (min.)
9.8 mM H2O2/1.56 mM Fe2+ 15.5 mM H2O2/2.14 mM Fe2+ 19.6 mM H2O2/2.14 mM Fe2+
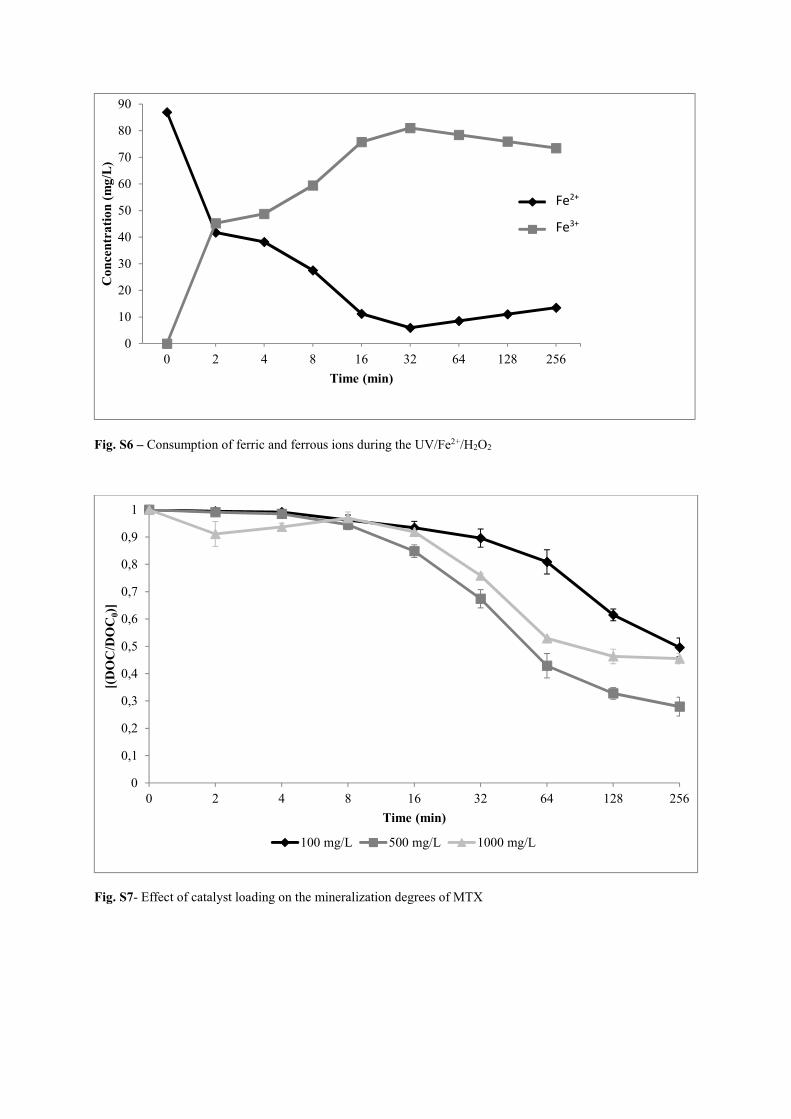
Fig. S6 – Consumption of ferric and ferrous ions during the UV/Fe2+/H2O2
Fig. S7- Effect of catalyst loading on the mineralization degrees of MTX
0
10
20
30
40
50
60
70
80
90
0 2 4 8 16 32 64 128 256
Co
nce
ntr
ati
on
(m
g/L
)
Time (min)
Fe2+
Fe3+
0
0,1
0,2
0,3
0,4
0,5
0,6
0,7
0,8
0,9
1
0 2 4 8 16 32 64 128 256
[(D
OC
/DO
C0)]
Time (min)
100 mg/L 500 mg/L 1000 mg/L
Fe2+
Fe3+
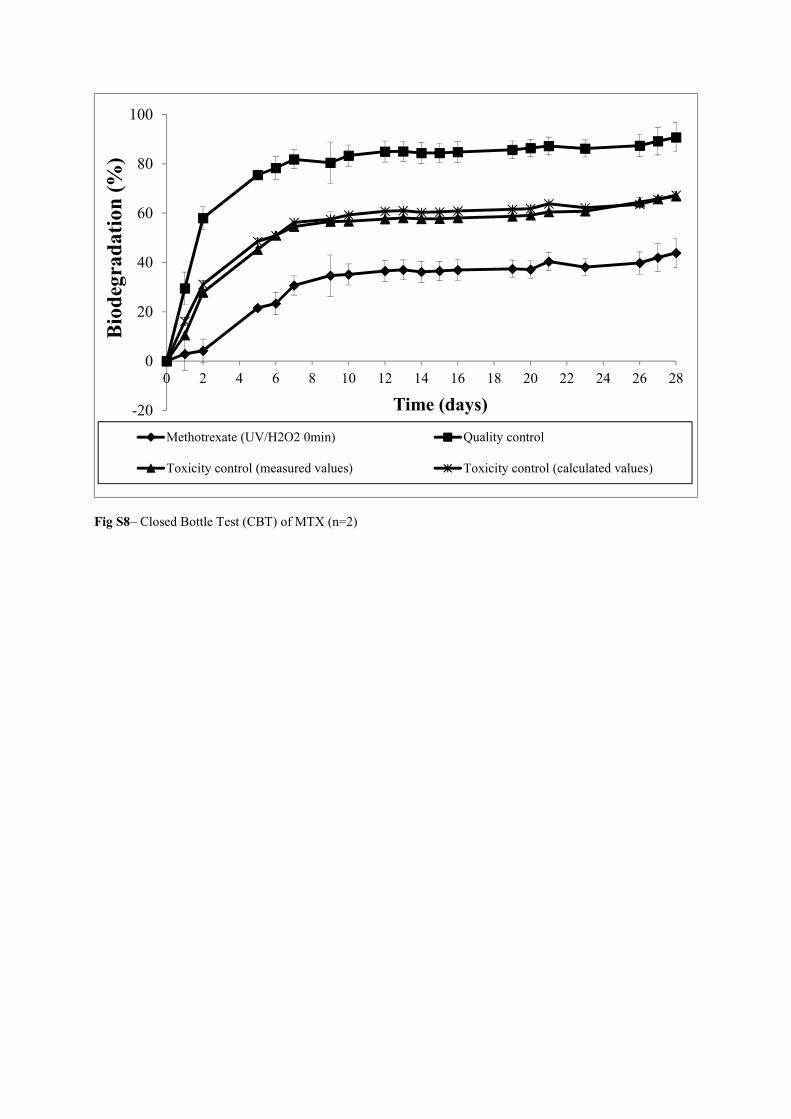
Fig S8– Closed Bottle Test (CBT) of MTX (n=2)
-20
0
20
40
60
80
100
0 2 4 6 8 10 12 14 16 18 20 22 24 26 28
Bio
deg
rad
ati
on
(%
)
Time (days)
Methotrexate (UV/H2O2 0min) Quality control
Toxicity control (measured values) Toxicity control (calculated values)
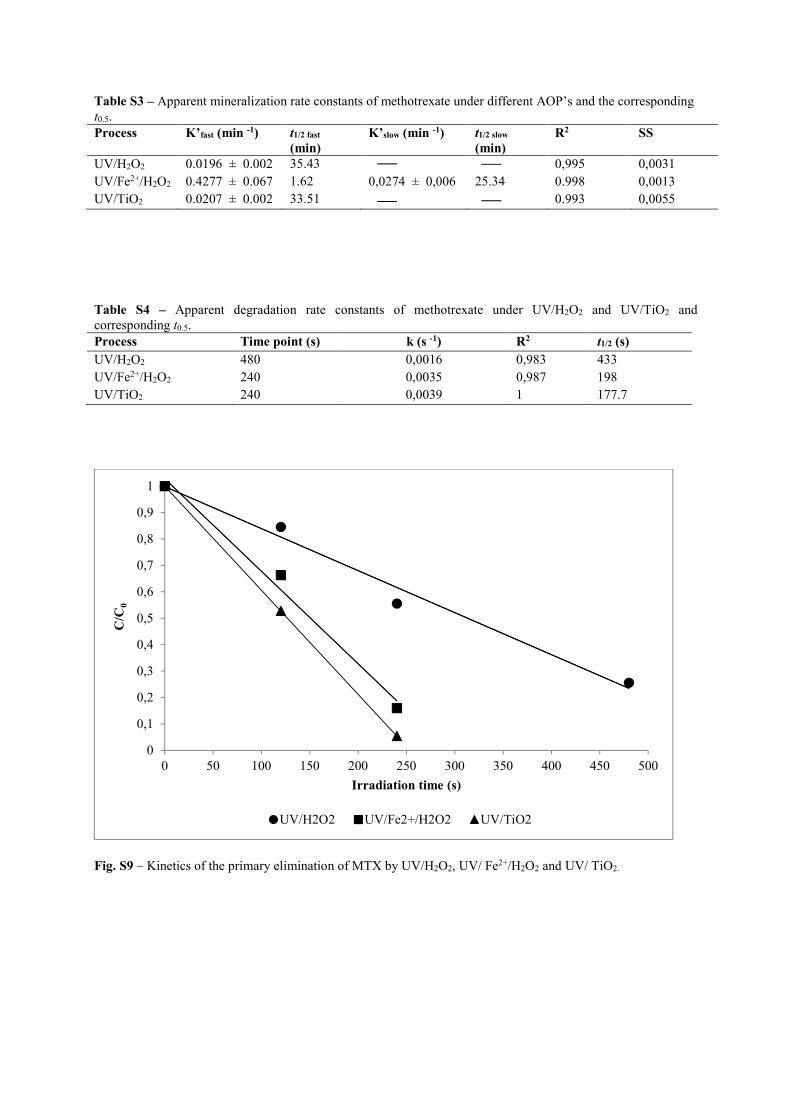
Table S3 – Apparent mineralization rate constants of methotrexate under different AOP’s and the corresponding t0.5. Process K’fast (min -1) t1/2 fast
(min)
K’slow (min -1) t1/2 slow
(min)
R2 SS
UV/H2O2 0.0196 ± 0.002 35.43 0,995 0,0031 UV/Fe2+/H2O2 0.4277 ± 0.067 1.62 0,0274 ± 0,006 25.34 0.998 0,0013 UV/TiO2 0.0207 ± 0.002 33.51 0.993 0,0055
Table S4 – Apparent degradation rate constants of methotrexate under UV/H2O2 and UV/TiO2 and corresponding t0.5. Process Time point (s) k (s -1) R2 t1/2 (s)
UV/H2O2 UV/Fe2+/H2O2
480 240
0,0016 0,0035
0,983 0,987
433 198
UV/TiO2 240 0,0039 1 177.7
Fig. S9 – Kinetics of the primary elimination of MTX by UV/H2O2, UV/ Fe2+/H2O2 and UV/ TiO2.
0
0,1
0,2
0,3
0,4
0,5
0,6
0,7
0,8
0,9
1
0 50 100 150 200 250 300 350 400 450 500
C/C
0
Irradiation time (s)
UV/H2O2 UV/Fe2+/H2O2 UV/TiO2
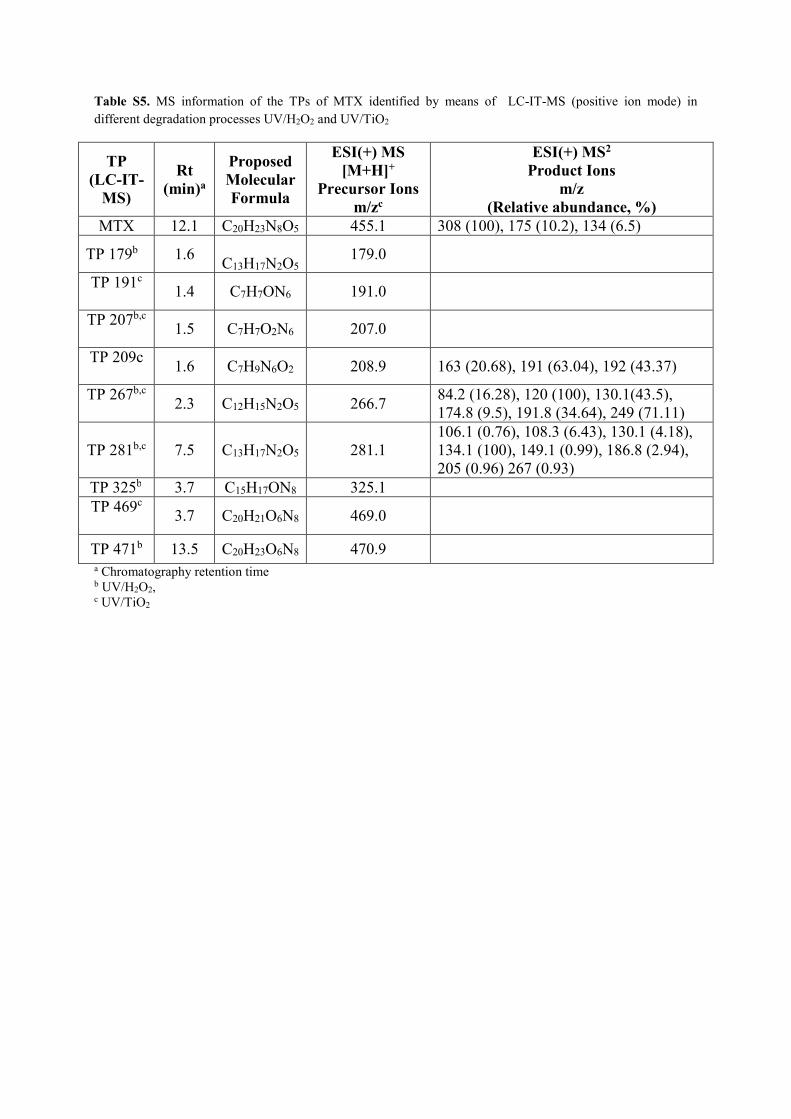
Table S5. MS information of the TPs of MTX identified by means of LC-IT-MS (positive ion mode) in different degradation processes UV/H2O2 and UV/TiO2
TP
(LC-IT-
MS)
Rt
(min)a
Proposed
Molecular
Formula
ESI(+) MS
[M+H]+
Precursor Ions
m/zc
ESI(+) MS2
Product Ions
m/z
(Relative abundance, %) MTX 12.1 C20H23N8O5 455.1 308 (100), 175 (10.2), 134 (6.5)
TP 179b 1.6
C13H17N2O5 179.0
TP 191c
1.4 C7H7ON6 191.0
TP 207b,c
1.5 C7H7O2N6 207.0
TP 209c
1.6 C7H9N6O2 208.9 163 (20.68), 191 (63.04), 192 (43.37)
TP 267b,c
2.3 C12H15N2O5 266.7 84.2 (16.28), 120 (100), 130.1(43.5), 174.8 (9.5), 191.8 (34.64), 249 (71.11)
TP 281b,c 7.5 C13H17N2O5 281.1 106.1 (0.76), 108.3 (6.43), 130.1 (4.18), 134.1 (100), 149.1 (0.99), 186.8 (2.94), 205 (0.96) 267 (0.93)
TP 325b 3.7 C15H17ON8 325.1 TP 469c
3.7 C20H21O6N8 469.0
TP 471b 13.5 C20H23O6N8 470.9 a Chromatography retention time b UV/H2O2, c UV/TiO2
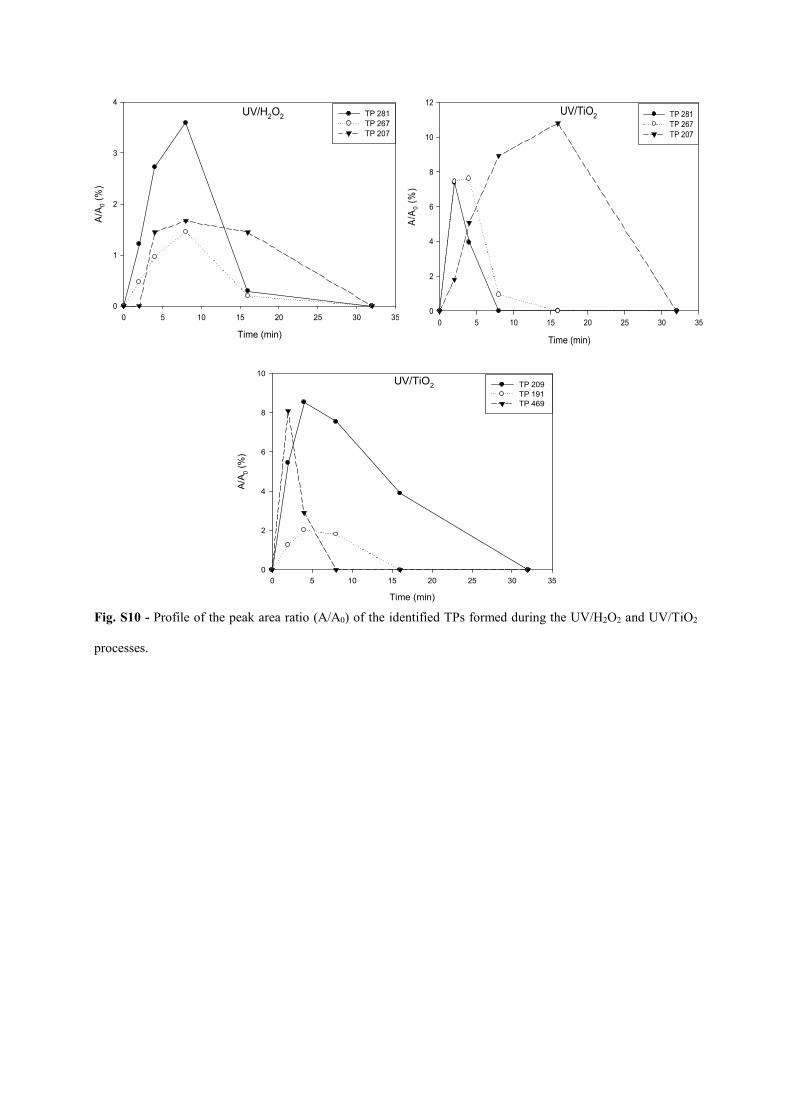
Fig. S10 - Profile of the peak area ratio (A/A0) of the identified TPs formed during the UV/H2O2 and UV/TiO2
processes.
UV/H2O
2
Time (min)
0 5 10 15 20 25 30 35
A/A
0 (
%)
0
1
2
3
4
TP 281
TP 267
TP 207
UV/TiO2
Time (min)
0 5 10 15 20 25 30 35
A/A
0 (
%)
0
2
4
6
8
10
12
TP 281
TP 267
TP 207
UV/TiO2
Time (min)
0 5 10 15 20 25 30 35
A/A
0 (
%)
0
2
4
6
8
10
TP 209
TP 191
TP 469
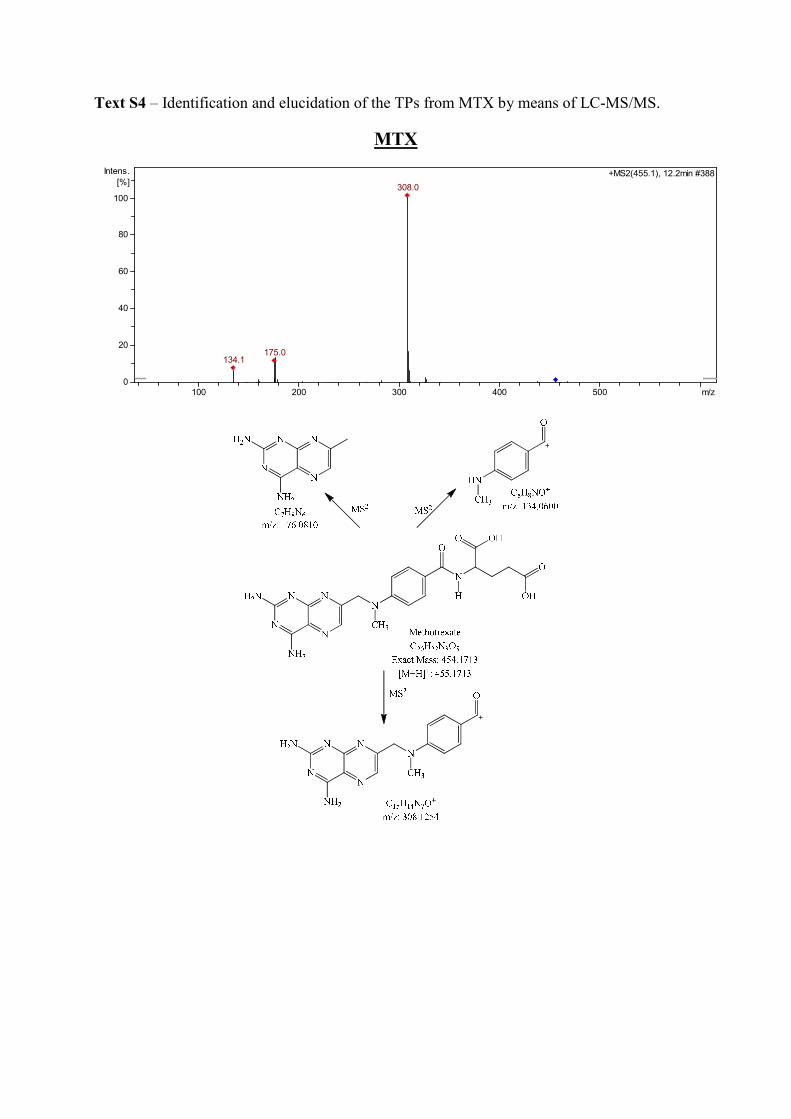
Text S4 – Identification and elucidation of the TPs from MTX by means of LC-MS/MS.
MTX
134.1175.0
308.0
+MS2(455.1), 12.2min #388
0
20
40
60
80
100
Intens.
[%]
100 200 300 400 500 m/z
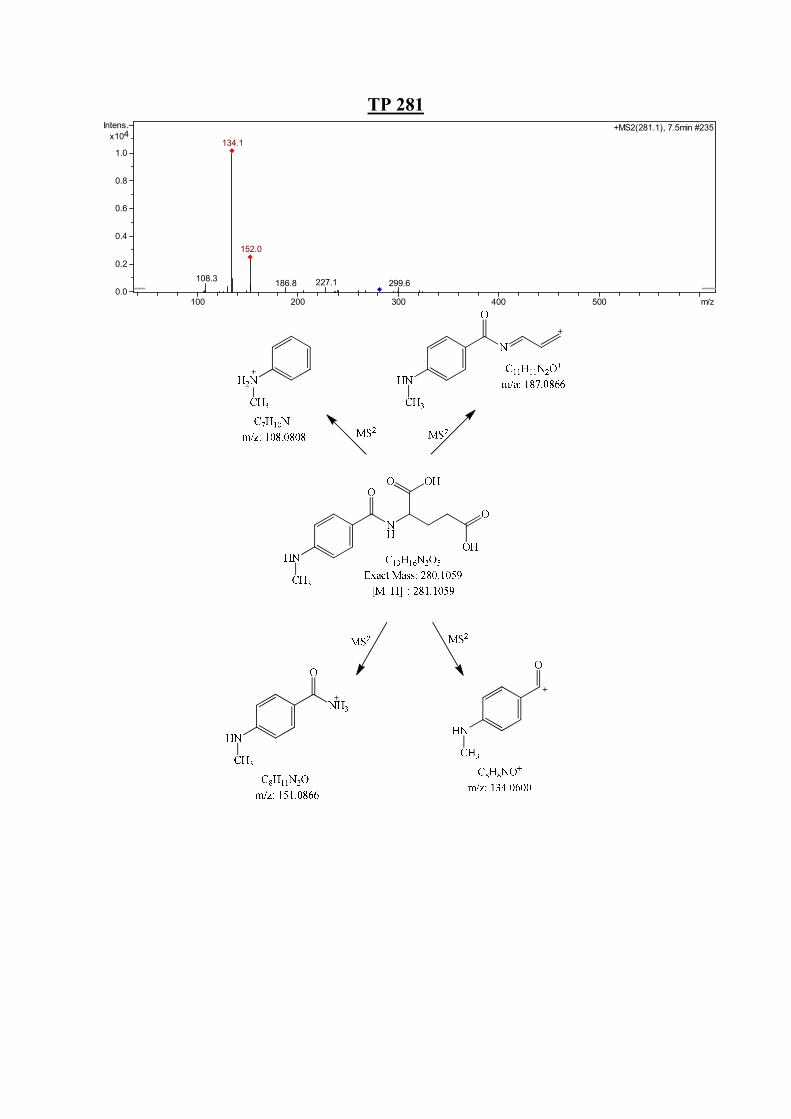
TP 281
108.3186.8 227.1 299.6
134.1
152.0
+MS2(281.1), 7.5min #235
0.0
0.2
0.4
0.6
0.8
1.0
4x10
Intens.
100 200 300 400 500 m/z
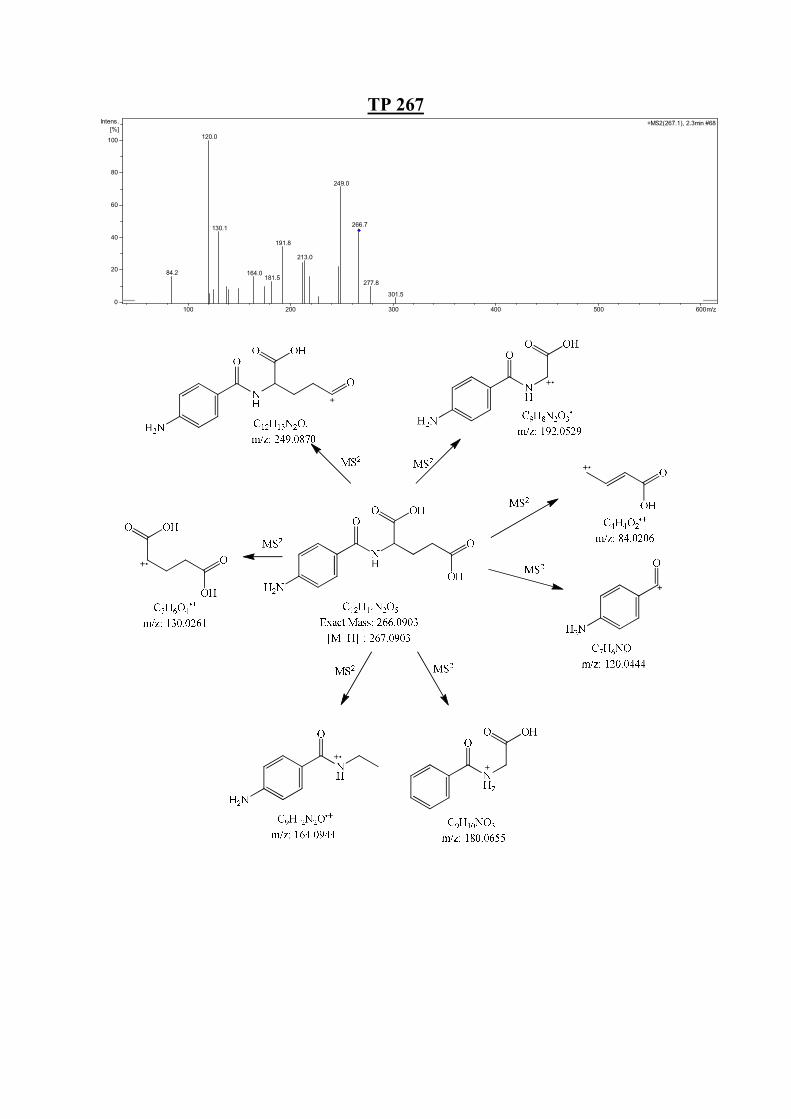
TP 267
84.2
120.0
130.1
164.0181.5
191.8
213.0
249.0
266.7
277.8
301.5
+MS2(267.1), 2.3min #68
0
20
40
60
80
100
Intens.
[%]
100 200 300 400 500 600m/z
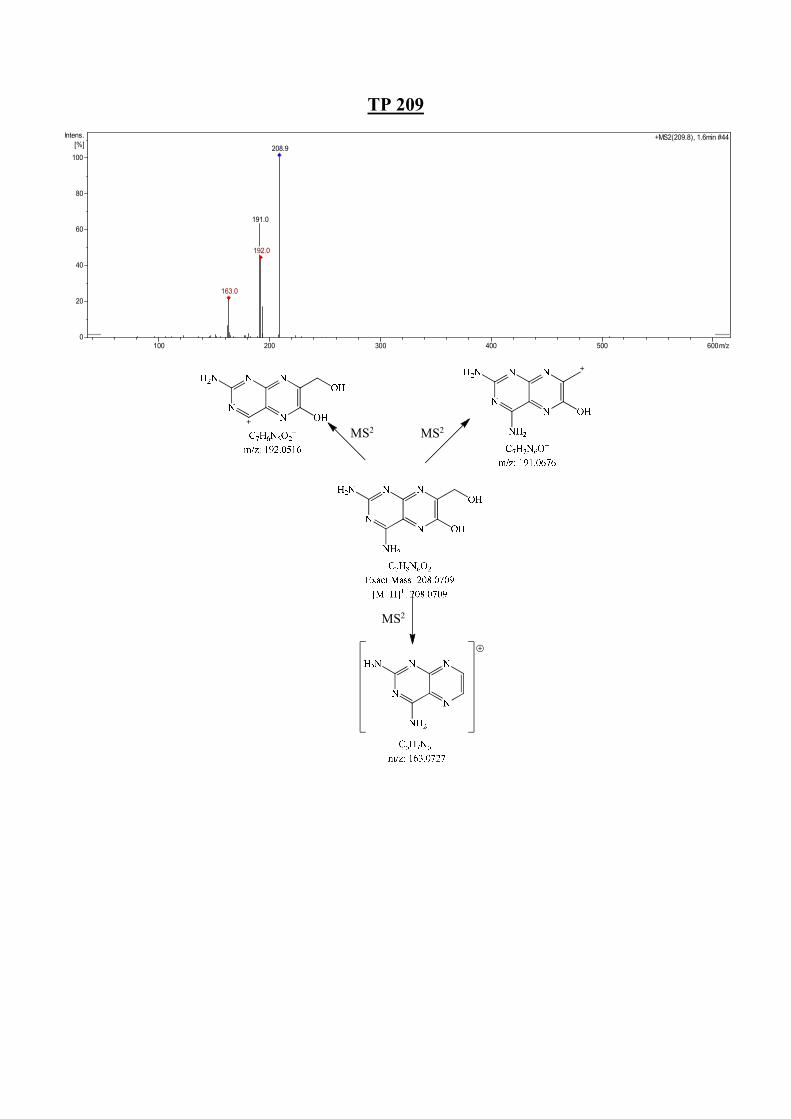
191.0
208.9
163.0
192.0
+MS2(209.8), 1.6min #44
0
20
40
60
80
100
Intens.
[%]
100 200 300 400 500 600m/z
TP 209
MS2
MS2 MS2
References
Besse, J.-P., Latour, J.-P., Garric, J., 2012. Anticancer drugs in surface waters: What can we
say about the occurrence and environmental significance of cytotoxic, cytostatic and
endocrine therapy drugs? 39, 73–86.
Friedrich, J., Längin, A., Kümmerer, K., 2013. Comparison of an Electrochemical and
Luminescence‐Based Oxygen Measuring System for Use in the Biodegradability Testing
According to Closed Bottle Test (OECD 301D). CLEAN – Soil, Air, Water 41, 251-257.
Kummerer, K., Steger-Hartmann, T., Baranyai, A., Burhaus, I., 1996. Tests of biodegradation
of cytostatics cyclophosphamide and ifosfamide using the Closed Bottle Test (OECD 301 D).
Zentralbl Hyg Umweltmed 198, 215-225.
Mahmoud, W.M., Kummerer, K., 2012. Captopril and its dimer captopril disulfide:
photodegradation, aerobic biodegradation and identification of transformation products by
HPLC-UV and LC-ion trap-MS(n). Chemosphere 88, 1170-1177.
OECD, 1992. Organisation for Economic Co-operation and Development. OECD guideline
for testing of chemicals 301D: ready biodegradability. Closed Bottle test. OECD Publishing.
Rubino, F.M., 2001. Separation methods for methotrexate, its structural analogues and
metabolites. J Chromatogr B Biomed Sci Appl 764, 217-254.
Sanderson, H., Thomsen, M., 2009. Comparative analysis of pharmaceuticals versus industrial
chemicals acute aquatic toxicity classification according to the United Nations classification
system for chemicals. Assessment of the (Q)SAR predictability of pharmaceuticals acute
aquatic toxicity and their predominant acute toxic mode-of-action. Toxicology Letters 187,
84-93.
Trautwein, C., Kümmerer, K., Metzger, J.W., 2008. Aerobic biodegradability of the calcium
channel antagonist verapamil and identification of a microbial dead-end transformation
product studied by LC–MS/MS. Chemosphere 72, 442-450.
Article III
Degradation of cyclophosphamide and 5-fluorouracil by UV and
simulated sunlight treatments: Assessment of the enhancement of the
biodegradability and toxicity.
Lutterbeck, C. A., Wilde M. L., Baginska, E., Leder C., Machado. Ê. L., Kümmerer, K.,
Environmental Pollution 2016;208:467–76. doi: 10.1016/j.envpol.2015.10.016.

Degradation of cyclophosphamide and 5-fluorouracil by UV andsimulated sunlight treatments: Assessment of the enhancement of thebiodegradability and toxicity
Carlos Alexandre Lutterbeck a, b, Marcelo Luís Wilde a, Ewelina Baginska a,Christoph Leder a, Enio Leandro Machado b, Klaus Kümmerer a, *
a Sustainable Chemistry and Material Resources, Institute of Sustainable and Environmental Chemistry, Faculty of Sustainability, Leuphana University of
Lüneburg, Scharnhorststraße 1/C13, DE-21335 Lüneburg, Germanyb Graduate Program in Environmental Technology, Universidade de Santa Cruz do Suld UNISC, Av. Independencia, 2293, CEP 96815-900, Santa Cruz do Sul,
Rio Grande do Sul, Brazil
a r t i c l e i n f o
Article history:
Received 4 August 2015
Received in revised form
13 October 2015
Accepted 14 October 2015
Available online 10 November 2015
Keywords:
Cyclophosphamide
5-Fluorouracil
Photodegradation
Biodegradation
Toxicity
a b s t r a c t
The presence of pharmaceuticals in the environment has triggered concern among the general popu-
lation and received considerable attention from the scientific community in recent years. However, only
a few publications have focused on anticancer drugs, a class of pharmaceuticals that can exhibit cyto-
toxic, genotoxic, mutagenic, carcinogenic and teratogenic effects. The present study investigated the
photodegradation, biodegradation, bacterial toxicity, mutagenicity and genotoxicity of cyclophospha-
mide (CP) and 5-fluorouracil (5-FU). The photodegradation experiments were performed at a neutral to
slight pH range (7e7.8) using two different lamps (medium-pressure mercury lamp and a xenon lamp).
The primary elimination of the parent compounds was monitored by means of liquid chromatography
tandem mass spectrometry (LC-IT-MS/MS). NPOC (non-purgeable organic carbon) analyses were carried
out in order to assess mineralization rates. The Closed Bottle Test (CBT) was used to assess ready
biodegradability. A new method using Vibrio fischeri was adopted to evaluate toxicity. CP was not
degraded by any lamp, whereas 5-FU was completely eliminated by irradiation with the mercury lamp
but only partially by the Xe lamp. No mineralization was observed for the experiments performed with
the Xe lamp, and a NPOC removal of only 18% was registered for 5-FU after 256 min using the UV lamp.
Not one of the parent compounds was readily biodegradable in the CBT. Photo transformation products
(PTPs) resulting from photolysis were neither better biodegradable nor less toxic than the parent
compound 5-FU. In contrast, the results of the tests carried out with the UV lamp indicated that more
biodegradable and non-toxic PTPs of 5-FU were generated. Three PTPs were formed during the photo-
degradation experiments and were identified. The results of the in silico QSAR predictions showed
positive mutagenic and genotoxic alerts for 5-FU, whereas only one of the formed PTPs presented
positive alerts for the genotoxicity endpoint.
© 2015 Elsevier Ltd. All rights reserved.
Abbreviations: 5-FU, 5-fluorouracil; AI, acute luminescence inhibition; CBT, closed bottle test; CFU, colony forming units; CI, chronic luminescence inhibition; CP,
cyclophosphamide; DNA, deoxyribonucleic acid; DOC, dissolved organic carbon; EC, effective concentration; GI, growth inhibition; HPLC, high performance liquid chro-
matography; LC, liquid chromatography; LOEC, lowest observed effect concentration; LSSTP, laboratory-scale sewage treatment plant; MS, mass spectrometry; NPOC, non
purgeable organic carbon; OECD, organization for economic co-operation and development; PTPs, photo-transformation products; QSAR, quantitative structureeactivity
relationship; TOC, total organic carbon; ThOD, theoretical oxygen demand; UV, ultraviolet.
* Corresponding author. Sustainable Chemistry and Material Resources, Institute of Sustainable and Environmental Chemistry, Faculty of Sustainability, Leuphana Uni-
versity of Lüneburg, Scharnhorststraße 1/C13, DE-21335 Lüneburg, Germany.
E-mail addresses: [email protected] (C.A. Lutterbeck), [email protected] (M.L. Wilde), [email protected] (E. Baginska), [email protected]
(C. Leder), [email protected] (E.L. Machado), [email protected] (K. Kümmerer).
Contents lists available at ScienceDirect
Environmental Pollution
journal homepage: www.elsevier .com/locate/envpol
http://dx.doi.org/10.1016/j.envpol.2015.10.016
0269-7491/© 2015 Elsevier Ltd. All rights reserved.
Environmental Pollution 208 (2016) 467e476
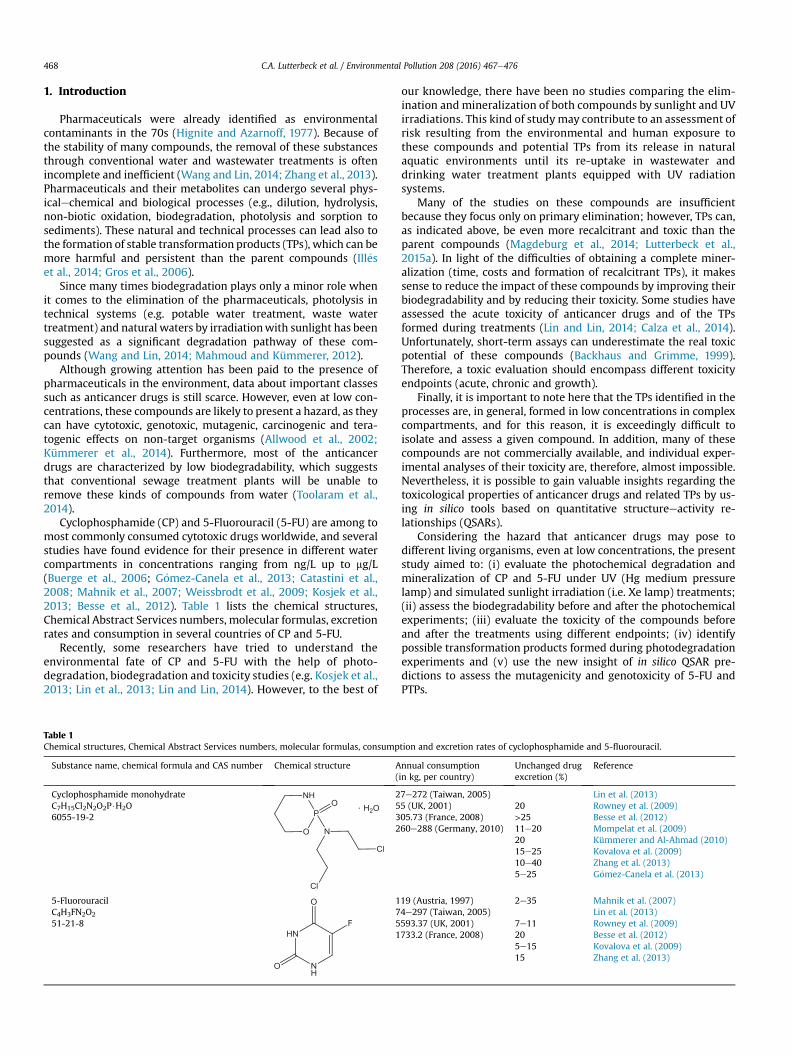
1. Introduction
Pharmaceuticals were already identified as environmental
contaminants in the 70s (Hignite and Azarnoff, 1977). Because of
the stability of many compounds, the removal of these substances
through conventional water and wastewater treatments is often
incomplete and inefficient (Wang and Lin, 2014; Zhang et al., 2013).
Pharmaceuticals and their metabolites can undergo several phys-
icalechemical and biological processes (e.g., dilution, hydrolysis,
non-biotic oxidation, biodegradation, photolysis and sorption to
sediments). These natural and technical processes can lead also to
the formation of stable transformation products (TPs), which can be
more harmful and persistent than the parent compounds (Ill�es
et al., 2014; Gros et al., 2006).
Since many times biodegradation plays only a minor role when
it comes to the elimination of the pharmaceuticals, photolysis in
technical systems (e.g. potable water treatment, waste water
treatment) and natural waters by irradiationwith sunlight has been
suggested as a significant degradation pathway of these com-
pounds (Wang and Lin, 2014; Mahmoud and Kümmerer, 2012).
Although growing attention has been paid to the presence of
pharmaceuticals in the environment, data about important classes
such as anticancer drugs is still scarce. However, even at low con-
centrations, these compounds are likely to present a hazard, as they
can have cytotoxic, genotoxic, mutagenic, carcinogenic and tera-
togenic effects on non-target organisms (Allwood et al., 2002;
Kümmerer et al., 2014). Furthermore, most of the anticancer
drugs are characterized by low biodegradability, which suggests
that conventional sewage treatment plants will be unable to
remove these kinds of compounds from water (Toolaram et al.,
2014).
Cyclophosphamide (CP) and 5-Fluorouracil (5-FU) are among to
most commonly consumed cytotoxic drugs worldwide, and several
studies have found evidence for their presence in different water
compartments in concentrations ranging from ng/L up to mg/L
(Buerge et al., 2006; G�omez-Canela et al., 2013; Catastini et al.,
2008; Mahnik et al., 2007; Weissbrodt et al., 2009; Kosjek et al.,
2013; Besse et al., 2012). Table 1 lists the chemical structures,
Chemical Abstract Services numbers, molecular formulas, excretion
rates and consumption in several countries of CP and 5-FU.
Recently, some researchers have tried to understand the
environmental fate of CP and 5-FU with the help of photo-
degradation, biodegradation and toxicity studies (e.g. Kosjek et al.,
2013; Lin et al., 2013; Lin and Lin, 2014). However, to the best of
our knowledge, there have been no studies comparing the elim-
ination and mineralization of both compounds by sunlight and UV
irradiations. This kind of studymay contribute to an assessment of
risk resulting from the environmental and human exposure to
these compounds and potential TPs from its release in natural
aquatic environments until its re-uptake in wastewater and
drinking water treatment plants equipped with UV radiation
systems.
Many of the studies on these compounds are insufficient
because they focus only on primary elimination; however, TPs can,
as indicated above, be even more recalcitrant and toxic than the
parent compounds (Magdeburg et al., 2014; Lutterbeck et al.,
2015a). In light of the difficulties of obtaining a complete miner-
alization (time, costs and formation of recalcitrant TPs), it makes
sense to reduce the impact of these compounds by improving their
biodegradability and by reducing their toxicity. Some studies have
assessed the acute toxicity of anticancer drugs and of the TPs
formed during treatments (Lin and Lin, 2014; Calza et al., 2014).
Unfortunately, short-term assays can underestimate the real toxic
potential of these compounds (Backhaus and Grimme, 1999).
Therefore, a toxic evaluation should encompass different toxicity
endpoints (acute, chronic and growth).
Finally, it is important to note here that the TPs identified in the
processes are, in general, formed in low concentrations in complex
compartments, and for this reason, it is exceedingly difficult to
isolate and assess a given compound. In addition, many of these
compounds are not commercially available, and individual exper-
imental analyses of their toxicity are, therefore, almost impossible.
Nevertheless, it is possible to gain valuable insights regarding the
toxicological properties of anticancer drugs and related TPs by us-
ing in silico tools based on quantitative structureeactivity re-
lationships (QSARs).
Considering the hazard that anticancer drugs may pose to
different living organisms, even at low concentrations, the present
study aimed to: (i) evaluate the photochemical degradation and
mineralization of CP and 5-FU under UV (Hg medium pressure
lamp) and simulated sunlight irradiation (i.e. Xe lamp) treatments;
(ii) assess the biodegradability before and after the photochemical
experiments; (iii) evaluate the toxicity of the compounds before
and after the treatments using different endpoints; (iv) identify
possible transformation products formed during photodegradation
experiments and (v) use the new insight of in silico QSAR pre-
dictions to assess the mutagenicity and genotoxicity of 5-FU and
PTPs.
Table 1
Chemical structures, Chemical Abstract Services numbers, molecular formulas, consumption and excretion rates of cyclophosphamide and 5-fluorouracil.
Substance name, chemical formula and CAS number Chemical structure Annual consumption
(in kg, per country)
Unchanged drug
excretion (%)
Reference
Cyclophosphamide monohydrate
C7H15Cl2N2O2P$H2O
6055-19-2
27e272 (Taiwan, 2005)
55 (UK, 2001)
305.73 (France, 2008)
260e288 (Germany, 2010)
20
>25
11e20
20
15e25
10e40
5e25
Lin et al. (2013)
Rowney et al. (2009)
Besse et al. (2012)
Mompelat et al. (2009)
Kümmerer and Al-Ahmad (2010)
Kovalova et al. (2009)
Zhang et al. (2013)
G�omez-Canela et al. (2013)
5-Fluorouracil
C4H3FN2O2
51-21-8
119 (Austria, 1997)
74e297 (Taiwan, 2005)
5593.37 (UK, 2001)
1733.2 (France, 2008)
2e35
7e11
20
5e15
15
Mahnik et al. (2007)
Lin et al. (2013)
Rowney et al. (2009)
Besse et al. (2012)
Kovalova et al. (2009)
Zhang et al. (2013)
C.A. Lutterbeck et al. / Environmental Pollution 208 (2016) 467e476468
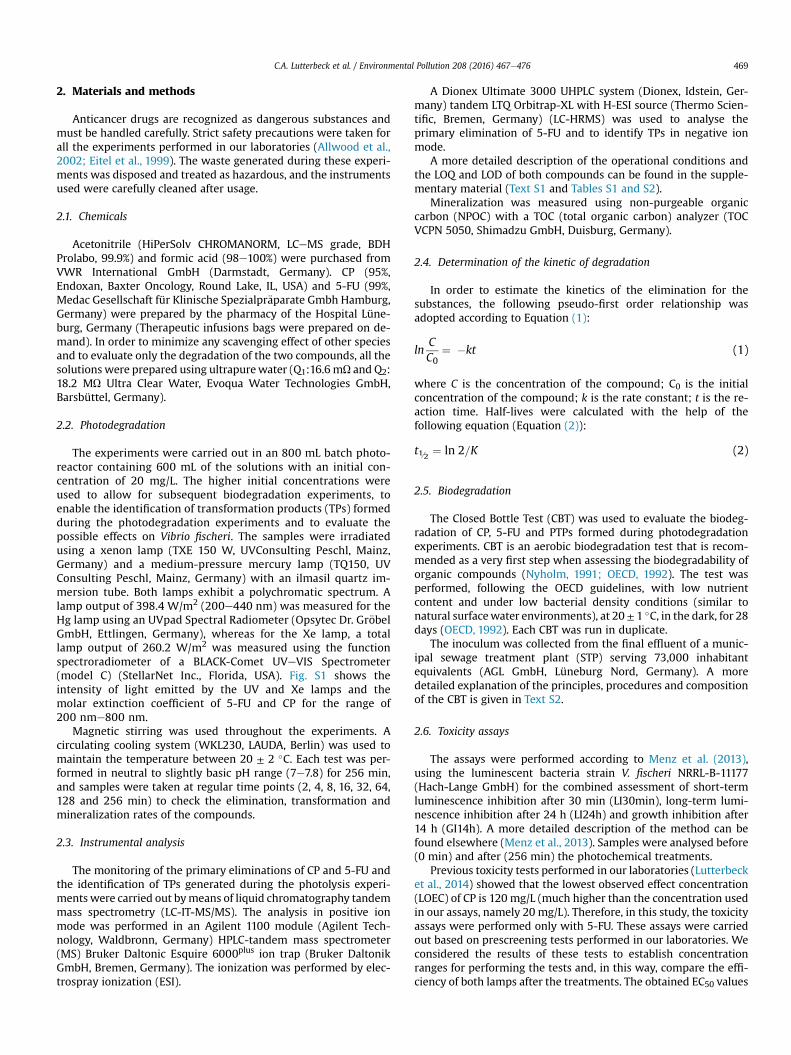
2. Materials and methods
Anticancer drugs are recognized as dangerous substances and
must be handled carefully. Strict safety precautions were taken for
all the experiments performed in our laboratories (Allwood et al.,
2002; Eitel et al., 1999). The waste generated during these experi-
ments was disposed and treated as hazardous, and the instruments
used were carefully cleaned after usage.
2.1. Chemicals
Acetonitrile (HiPerSolv CHROMANORM, LCeMS grade, BDH
Prolabo, 99.9%) and formic acid (98e100%) were purchased from
VWR International GmbH (Darmstadt, Germany). CP (95%,
Endoxan, Baxter Oncology, Round Lake, IL, USA) and 5-FU (99%,
Medac Gesellschaft für Klinische Spezialpr€aparate Gmbh Hamburg,
Germany) were prepared by the pharmacy of the Hospital Lüne-
burg, Germany (Therapeutic infusions bags were prepared on de-
mand). In order to minimize any scavenging effect of other species
and to evaluate only the degradation of the two compounds, all the
solutions were prepared using ultrapurewater (Q1:16.6mU and Q2:
18.2 MU Ultra Clear Water, Evoqua Water Technologies GmbH,
Barsbüttel, Germany).
2.2. Photodegradation
The experiments were carried out in an 800 mL batch photo-
reactor containing 600 mL of the solutions with an initial con-
centration of 20 mg/L. The higher initial concentrations were
used to allow for subsequent biodegradation experiments, to
enable the identification of transformation products (TPs) formed
during the photodegradation experiments and to evaluate the
possible effects on Vibrio fischeri. The samples were irradiated
using a xenon lamp (TXE 150 W, UVConsulting Peschl, Mainz,
Germany) and a medium-pressure mercury lamp (TQ150, UV
Consulting Peschl, Mainz, Germany) with an ilmasil quartz im-
mersion tube. Both lamps exhibit a polychromatic spectrum. A
lamp output of 398.4 W/m2 (200e440 nm) was measured for the
Hg lamp using an UVpad Spectral Radiometer (Opsytec Dr. Gr€obel
GmbH, Ettlingen, Germany), whereas for the Xe lamp, a total
lamp output of 260.2 W/m2 was measured using the function
spectroradiometer of a BLACK-Comet UVeVIS Spectrometer
(model C) (StellarNet Inc., Florida, USA). Fig. S1 shows the
intensity of light emitted by the UV and Xe lamps and the
molar extinction coefficient of 5-FU and CP for the range of
200 nme800 nm.
Magnetic stirring was used throughout the experiments. A
circulating cooling system (WKL230, LAUDA, Berlin) was used to
maintain the temperature between 20 ± 2 �C. Each test was per-
formed in neutral to slightly basic pH range (7e7.8) for 256 min,
and samples were taken at regular time points (2, 4, 8, 16, 32, 64,
128 and 256 min) to check the elimination, transformation and
mineralization rates of the compounds.
2.3. Instrumental analysis
The monitoring of the primary eliminations of CP and 5-FU and
the identification of TPs generated during the photolysis experi-
ments were carried out bymeans of liquid chromatography tandem
mass spectrometry (LC-IT-MS/MS). The analysis in positive ion
mode was performed in an Agilent 1100 module (Agilent Tech-
nology, Waldbronn, Germany) HPLC-tandem mass spectrometer
(MS) Bruker Daltonic Esquire 6000plus ion trap (Bruker Daltonik
GmbH, Bremen, Germany). The ionization was performed by elec-
trospray ionization (ESI).
A Dionex Ultimate 3000 UHPLC system (Dionex, Idstein, Ger-
many) tandem LTQ Orbitrap-XL with H-ESI source (Thermo Scien-
tific, Bremen, Germany) (LC-HRMS) was used to analyse the
primary elimination of 5-FU and to identify TPs in negative ion
mode.
A more detailed description of the operational conditions and
the LOQ and LOD of both compounds can be found in the supple-
mentary material (Text S1 and Tables S1 and S2).
Mineralization was measured using non-purgeable organic
carbon (NPOC) with a TOC (total organic carbon) analyzer (TOC
VCPN 5050, Shimadzu GmbH, Duisburg, Germany).
2.4. Determination of the kinetic of degradation
In order to estimate the kinetics of the elimination for the
substances, the following pseudo-first order relationship was
adopted according to Equation (1):
lnC
C0¼ �kt (1)
where C is the concentration of the compound; C0 is the initial
concentration of the compound; k is the rate constant; t is the re-
action time. Half-lives were calculated with the help of the
following equation (Equation (2)):
t1 =
2¼ ln 2=K (2)
2.5. Biodegradation
The Closed Bottle Test (CBT) was used to evaluate the biodeg-
radation of CP, 5-FU and PTPs formed during photodegradation
experiments. CBT is an aerobic biodegradation test that is recom-
mended as a very first step when assessing the biodegradability of
organic compounds (Nyholm, 1991; OECD, 1992). The test was
performed, following the OECD guidelines, with low nutrient
content and under low bacterial density conditions (similar to
natural surfacewater environments), at 20± 1 �C, in the dark, for 28
days (OECD, 1992). Each CBT was run in duplicate.
The inoculum was collected from the final effluent of a munic-
ipal sewage treatment plant (STP) serving 73,000 inhabitant
equivalents (AGL GmbH, Lüneburg Nord, Germany). A more
detailed explanation of the principles, procedures and composition
of the CBT is given in Text S2.
2.6. Toxicity assays
The assays were performed according to Menz et al. (2013),
using the luminescent bacteria strain V. fischeri NRRL-B-11177
(Hach-Lange GmbH) for the combined assessment of short-term
luminescence inhibition after 30 min (LI30min), long-term lumi-
nescence inhibition after 24 h (LI24h) and growth inhibition after
14 h (GI14h). A more detailed description of the method can be
found elsewhere (Menz et al., 2013). Samples were analysed before
(0 min) and after (256 min) the photochemical treatments.
Previous toxicity tests performed in our laboratories (Lutterbeck
et al., 2014) showed that the lowest observed effect concentration
(LOEC) of CP is 120 mg/L (much higher than the concentration used
in our assays, namely 20 mg/L). Therefore, in this study, the toxicity
assays were performed only with 5-FU. These assays were carried
out based on prescreening tests performed in our laboratories. We
considered the results of these tests to establish concentration
ranges for performing the tests and, in this way, compare the effi-
ciency of both lamps after the treatments. The obtained EC50 values
C.A. Lutterbeck et al. / Environmental Pollution 208 (2016) 467e476 469
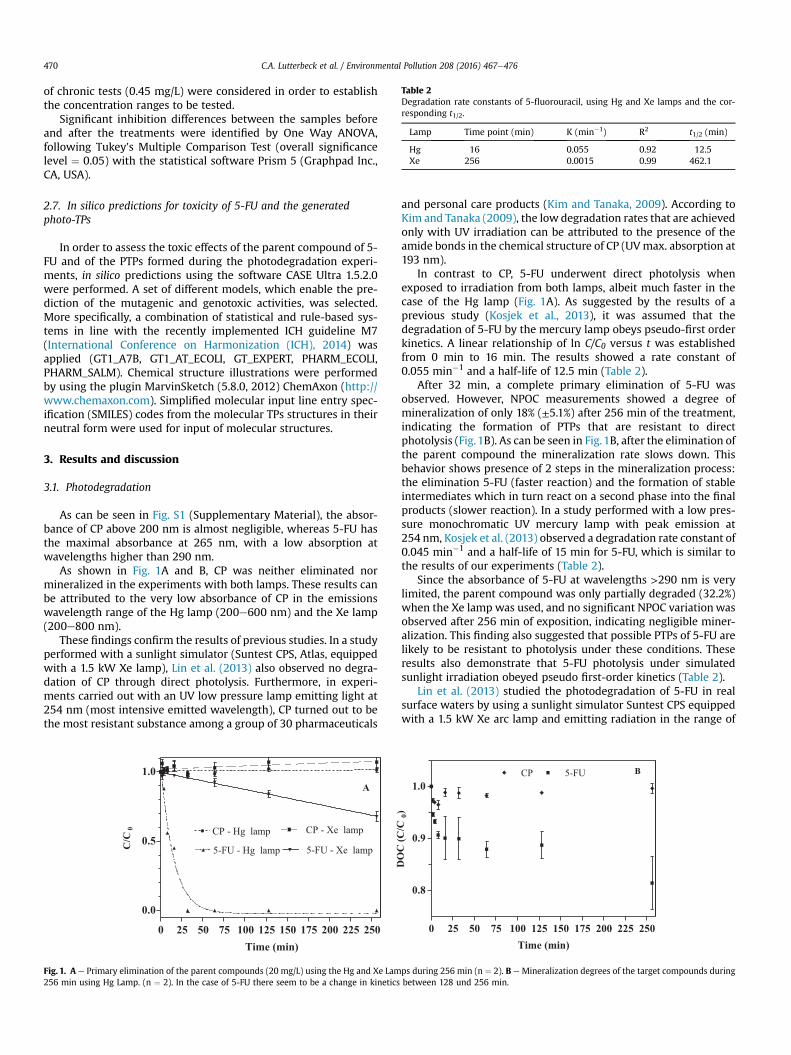
of chronic tests (0.45 mg/L) were considered in order to establish
the concentration ranges to be tested.
Significant inhibition differences between the samples before
and after the treatments were identified by One Way ANOVA,
following Tukey's Multiple Comparison Test (overall significance
level ¼ 0.05) with the statistical software Prism 5 (Graphpad Inc.,
CA, USA).
2.7. In silico predictions for toxicity of 5-FU and the generated
photo-TPs
In order to assess the toxic effects of the parent compound of 5-
FU and of the PTPs formed during the photodegradation experi-
ments, in silico predictions using the software CASE Ultra 1.5.2.0
were performed. A set of different models, which enable the pre-
diction of the mutagenic and genotoxic activities, was selected.
More specifically, a combination of statistical and rule-based sys-
tems in line with the recently implemented ICH guideline M7
(International Conference on Harmonization (ICH), 2014) was
applied (GT1_A7B, GT1_AT_ECOLI, GT_EXPERT, PHARM_ECOLI,
PHARM_SALM). Chemical structure illustrations were performed
by using the plugin MarvinSketch (5.8.0, 2012) ChemAxon (http://
www.chemaxon.com). Simplified molecular input line entry spec-
ification (SMILES) codes from the molecular TPs structures in their
neutral form were used for input of molecular structures.
3. Results and discussion
3.1. Photodegradation
As can be seen in Fig. S1 (Supplementary Material), the absor-
bance of CP above 200 nm is almost negligible, whereas 5-FU has
the maximal absorbance at 265 nm, with a low absorption at
wavelengths higher than 290 nm.
As shown in Fig. 1A and B, CP was neither eliminated nor
mineralized in the experiments with both lamps. These results can
be attributed to the very low absorbance of CP in the emissions
wavelength range of the Hg lamp (200e600 nm) and the Xe lamp
(200e800 nm).
These findings confirm the results of previous studies. In a study
performed with a sunlight simulator (Suntest CPS, Atlas, equipped
with a 1.5 kW Xe lamp), Lin et al. (2013) also observed no degra-
dation of CP through direct photolysis. Furthermore, in experi-
ments carried out with an UV low pressure lamp emitting light at
254 nm (most intensive emitted wavelength), CP turned out to be
the most resistant substance among a group of 30 pharmaceuticals
and personal care products (Kim and Tanaka, 2009). According to
Kim and Tanaka (2009), the low degradation rates that are achieved
only with UV irradiation can be attributed to the presence of the
amide bonds in the chemical structure of CP (UVmax. absorption at
193 nm).
In contrast to CP, 5-FU underwent direct photolysis when
exposed to irradiation from both lamps, albeit much faster in the
case of the Hg lamp (Fig. 1A). As suggested by the results of a
previous study (Kosjek et al., 2013), it was assumed that the
degradation of 5-FU by the mercury lamp obeys pseudo-first order
kinetics. A linear relationship of ln C/C0 versus t was established
from 0 min to 16 min. The results showed a rate constant of
0.055 min�1 and a half-life of 12.5 min (Table 2).
After 32 min, a complete primary elimination of 5-FU was
observed. However, NPOC measurements showed a degree of
mineralization of only 18% (±5.1%) after 256 min of the treatment,
indicating the formation of PTPs that are resistant to direct
photolysis (Fig.1B). As can be seen in Fig.1B, after the elimination of
the parent compound the mineralization rate slows down. This
behavior shows presence of 2 steps in the mineralization process:
the elimination 5-FU (faster reaction) and the formation of stable
intermediates which in turn react on a second phase into the final
products (slower reaction). In a study performed with a low pres-
sure monochromatic UV mercury lamp with peak emission at
254 nm, Kosjek et al. (2013) observed a degradation rate constant of
0.045 min�1 and a half-life of 15 min for 5-FU, which is similar to
the results of our experiments (Table 2).
Since the absorbance of 5-FU at wavelengths >290 nm is very
limited, the parent compound was only partially degraded (32.2%)
when the Xe lamp was used, and no significant NPOC variationwas
observed after 256 min of exposition, indicating negligible miner-
alization. This finding also suggested that possible PTPs of 5-FU are
likely to be resistant to photolysis under these conditions. These
results also demonstrate that 5-FU photolysis under simulated
sunlight irradiation obeyed pseudo first-order kinetics (Table 2).
Lin et al. (2013) studied the photodegradation of 5-FU in real
surface waters by using a sunlight simulator Suntest CPS equipped
with a 1.5 kW Xe arc lamp and emitting radiation in the range of
0 25 50 75 100 125 150 175 200 225 250
0.0
0.5
1.0
CP - Hg lamp CP - Xe lamp
5-FU - Hg lamp 5-FU - Xe lamp
Time (min)
C/C
0
0 25 50 75 100 125 150 175 200 225 250
0.8
0.9
1.0
CP 5-FU
Time (min)
DO
C (
C/C
0)
A
B
Fig. 1. A e Primary elimination of the parent compounds (20 mg/L) using the Hg and Xe Lamps during 256 min (n ¼ 2). B e Mineralization degrees of the target compounds during
256 min using Hg Lamp. (n ¼ 2). In the case of 5-FU there seem to be a change in kinetics between 128 und 256 min.
Table 2
Degradation rate constants of 5-fluorouracil, using Hg and Xe lamps and the cor-
responding t1/2.
Lamp Time point (min) K (min�1) R2 t1/2 (min)
Hg 16 0.055 0.92 12.5
Xe 256 0.0015 0.99 462.1
C.A. Lutterbeck et al. / Environmental Pollution 208 (2016) 467e476470
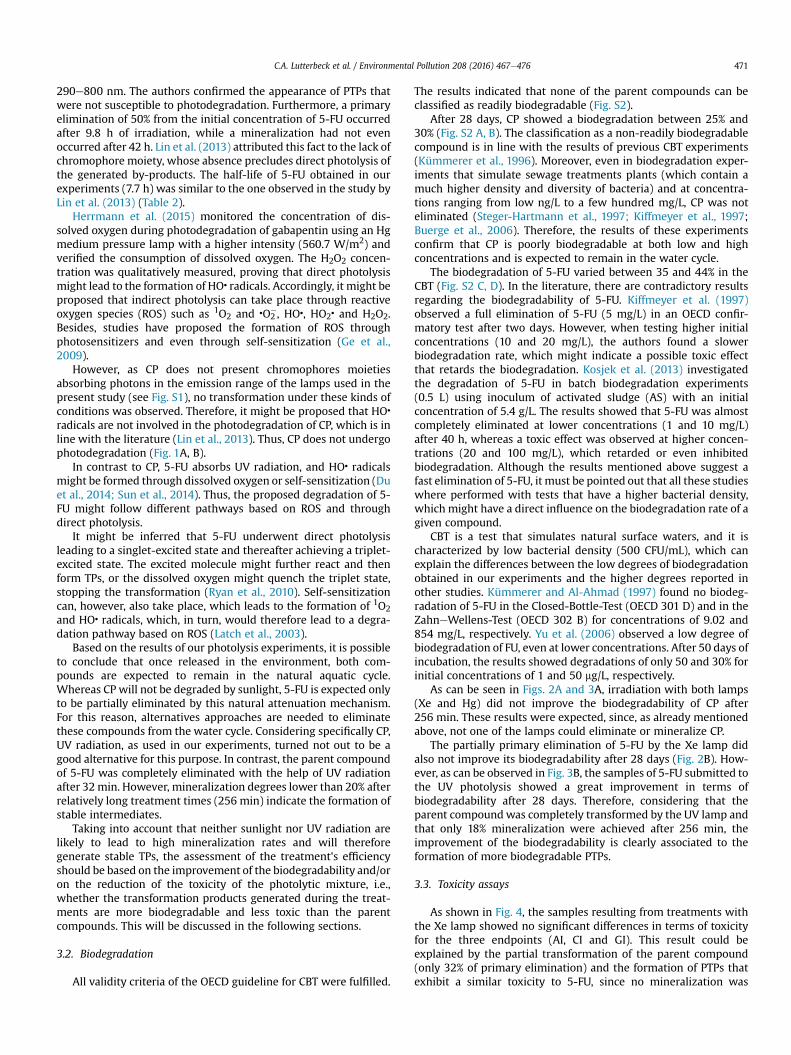
290e800 nm. The authors confirmed the appearance of PTPs that
were not susceptible to photodegradation. Furthermore, a primary
elimination of 50% from the initial concentration of 5-FU occurred
after 9.8 h of irradiation, while a mineralization had not even
occurred after 42 h. Lin et al. (2013) attributed this fact to the lack of
chromophore moiety, whose absence precludes direct photolysis of
the generated by-products. The half-life of 5-FU obtained in our
experiments (7.7 h) was similar to the one observed in the study by
Lin et al. (2013) (Table 2).
Herrmann et al. (2015) monitored the concentration of dis-
solved oxygen during photodegradation of gabapentin using an Hg
medium pressure lamp with a higher intensity (560.7 W/m2) and
verified the consumption of dissolved oxygen. The H2O2 concen-
tration was qualitatively measured, proving that direct photolysis
might lead to the formation of HO� radicals. Accordingly, it might be
proposed that indirect photolysis can take place through reactive
oxygen species (ROS) such as 1O2 and �O2�, HO�, HO2
� and H2O2.
Besides, studies have proposed the formation of ROS through
photosensitizers and even through self-sensitization (Ge et al.,
2009).
However, as CP does not present chromophores moieties
absorbing photons in the emission range of the lamps used in the
present study (see Fig. S1), no transformation under these kinds of
conditions was observed. Therefore, it might be proposed that HO�
radicals are not involved in the photodegradation of CP, which is in
line with the literature (Lin et al., 2013). Thus, CP does not undergo
photodegradation (Fig. 1A, B).
In contrast to CP, 5-FU absorbs UV radiation, and HO� radicals
might be formed through dissolved oxygen or self-sensitization (Du
et al., 2014; Sun et al., 2014). Thus, the proposed degradation of 5-
FU might follow different pathways based on ROS and through
direct photolysis.
It might be inferred that 5-FU underwent direct photolysis
leading to a singlet-excited state and thereafter achieving a triplet-
excited state. The excited molecule might further react and then
form TPs, or the dissolved oxygen might quench the triplet state,
stopping the transformation (Ryan et al., 2010). Self-sensitization
can, however, also take place, which leads to the formation of 1O2
and HO� radicals, which, in turn, would therefore lead to a degra-
dation pathway based on ROS (Latch et al., 2003).
Based on the results of our photolysis experiments, it is possible
to conclude that once released in the environment, both com-
pounds are expected to remain in the natural aquatic cycle.
Whereas CP will not be degraded by sunlight, 5-FU is expected only
to be partially eliminated by this natural attenuation mechanism.
For this reason, alternatives approaches are needed to eliminate
these compounds from the water cycle. Considering specifically CP,
UV radiation, as used in our experiments, turned not out to be a
good alternative for this purpose. In contrast, the parent compound
of 5-FU was completely eliminated with the help of UV radiation
after 32min. However, mineralization degrees lower than 20% after
relatively long treatment times (256 min) indicate the formation of
stable intermediates.
Taking into account that neither sunlight nor UV radiation are
likely to lead to high mineralization rates and will therefore
generate stable TPs, the assessment of the treatment's efficiency
should be based on the improvement of the biodegradability and/or
on the reduction of the toxicity of the photolytic mixture, i.e.,
whether the transformation products generated during the treat-
ments are more biodegradable and less toxic than the parent
compounds. This will be discussed in the following sections.
3.2. Biodegradation
All validity criteria of the OECD guideline for CBT were fulfilled.
The results indicated that none of the parent compounds can be
classified as readily biodegradable (Fig. S2).
After 28 days, CP showed a biodegradation between 25% and
30% (Fig. S2 A, B). The classification as a non-readily biodegradable
compound is in line with the results of previous CBT experiments
(Kümmerer et al., 1996). Moreover, even in biodegradation exper-
iments that simulate sewage treatments plants (which contain a
much higher density and diversity of bacteria) and at concentra-
tions ranging from low ng/L to a few hundred mg/L, CP was not
eliminated (Steger-Hartmann et al., 1997; Kiffmeyer et al., 1997;
Buerge et al., 2006). Therefore, the results of these experiments
confirm that CP is poorly biodegradable at both low and high
concentrations and is expected to remain in the water cycle.
The biodegradation of 5-FU varied between 35 and 44% in the
CBT (Fig. S2 C, D). In the literature, there are contradictory results
regarding the biodegradability of 5-FU. Kiffmeyer et al. (1997)
observed a full elimination of 5-FU (5 mg/L) in an OECD confir-
matory test after two days. However, when testing higher initial
concentrations (10 and 20 mg/L), the authors found a slower
biodegradation rate, which might indicate a possible toxic effect
that retards the biodegradation. Kosjek et al. (2013) investigated
the degradation of 5-FU in batch biodegradation experiments
(0.5 L) using inoculum of activated sludge (AS) with an initial
concentration of 5.4 g/L. The results showed that 5-FU was almost
completely eliminated at lower concentrations (1 and 10 mg/L)
after 40 h, whereas a toxic effect was observed at higher concen-
trations (20 and 100 mg/L), which retarded or even inhibited
biodegradation. Although the results mentioned above suggest a
fast elimination of 5-FU, it must be pointed out that all these studies
where performed with tests that have a higher bacterial density,
which might have a direct influence on the biodegradation rate of a
given compound.
CBT is a test that simulates natural surface waters, and it is
characterized by low bacterial density (500 CFU/mL), which can
explain the differences between the low degrees of biodegradation
obtained in our experiments and the higher degrees reported in
other studies. Kümmerer and Al-Ahmad (1997) found no biodeg-
radation of 5-FU in the Closed-Bottle-Test (OECD 301 D) and in the
ZahneWellens-Test (OECD 302 B) for concentrations of 9.02 and
854 mg/L, respectively. Yu et al. (2006) observed a low degree of
biodegradation of FU, even at lower concentrations. After 50 days of
incubation, the results showed degradations of only 50 and 30% for
initial concentrations of 1 and 50 mg/L, respectively.
As can be seen in Figs. 2A and 3A, irradiation with both lamps
(Xe and Hg) did not improve the biodegradability of CP after
256 min. These results were expected, since, as already mentioned
above, not one of the lamps could eliminate or mineralize CP.
The partially primary elimination of 5-FU by the Xe lamp did
also not improve its biodegradability after 28 days (Fig. 2B). How-
ever, as can be observed in Fig. 3B, the samples of 5-FU submitted to
the UV photolysis showed a great improvement in terms of
biodegradability after 28 days. Therefore, considering that the
parent compound was completely transformed by the UV lamp and
that only 18% mineralization were achieved after 256 min, the
improvement of the biodegradability is clearly associated to the
formation of more biodegradable PTPs.
3.3. Toxicity assays
As shown in Fig. 4, the samples resulting from treatments with
the Xe lamp showed no significant differences in terms of toxicity
for the three endpoints (AI, CI and GI). This result could be
explained by the partial transformation of the parent compound
(only 32% of primary elimination) and the formation of PTPs that
exhibit a similar toxicity to 5-FU, since no mineralization was
C.A. Lutterbeck et al. / Environmental Pollution 208 (2016) 467e476 471
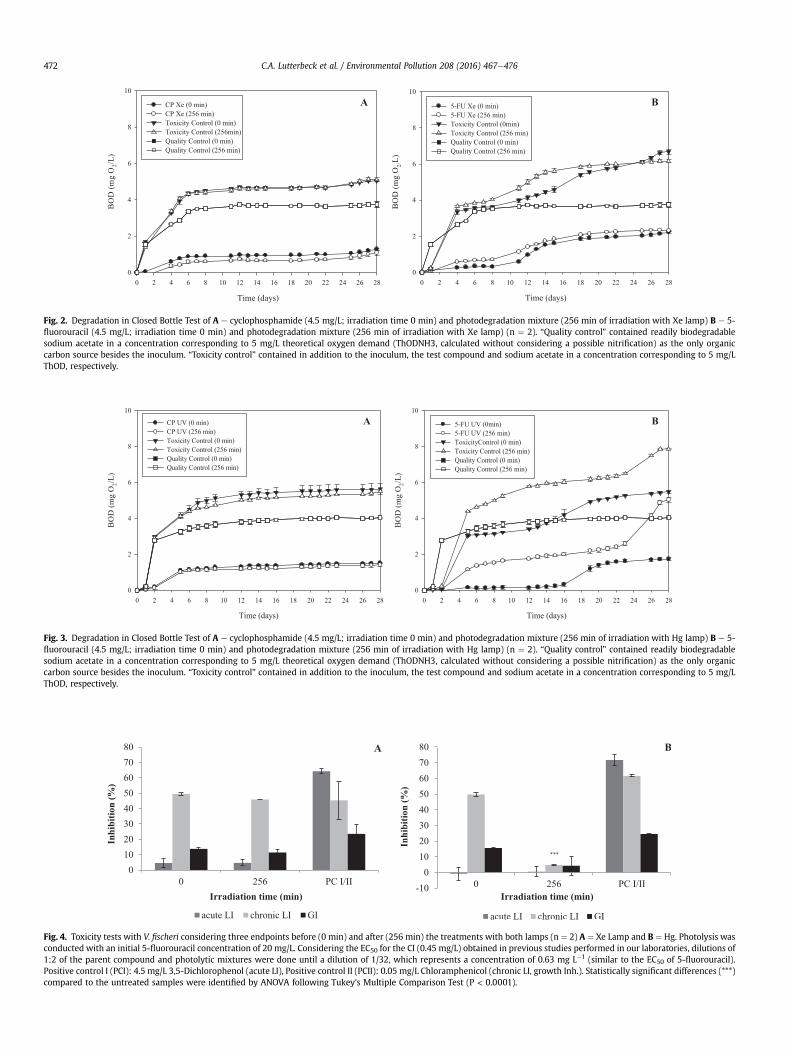
Time (days)
0 2 4 6 8 10 12 14 16 18 20 22 24 26 28
Og
m(D
OB
2/L
)
0
2
4
6
8
10
5-FU Xe (0 min)
5-FU Xe (256 min)
Toxicity Control (0min)
Toxicity Control (256 min)
Quality Control (0 min)
Quality Control (256 min)
Time (days)
0 2 4 6 8 10 12 14 16 18 20 22 24 26 28
Og
m(D
OB
2)
L/
0
2
4
6
8
10
CP Xe (0 min)
CP Xe (256 min)
Toxicity Control (0 min)
Toxicity Control (256min)
Quality Control (0 min)
Quality Control (256 min)
A B
Fig. 2. Degradation in Closed Bottle Test of A e cyclophosphamide (4.5 mg/L; irradiation time 0 min) and photodegradation mixture (256 min of irradiation with Xe lamp) B e 5-
fluorouracil (4.5 mg/L; irradiation time 0 min) and photodegradation mixture (256 min of irradiation with Xe lamp) (n ¼ 2). “Quality control” contained readily biodegradable
sodium acetate in a concentration corresponding to 5 mg/L theoretical oxygen demand (ThODNH3, calculated without considering a possible nitrification) as the only organic
carbon source besides the inoculum. “Toxicity control” contained in addition to the inoculum, the test compound and sodium acetate in a concentration corresponding to 5 mg/L
ThOD, respectively.
Time (days)
0 2 4 6 8 10 12 14 16 18 20 22 24 26 28
Og
m(D
OB
2)
L/
0
2
4
6
8
10
5-FU UV (0min)
5-FU UV (256 min)
ToxicityControl (0 min)
Toxicity Control (256 min)
Quality Control (0 min)
Quality Control (256 min)
Time (days)
0 2 4 6 8 10 12 14 16 18 20 22 24 26 28
Og
m(D
OB
2)
L/
0
2
4
6
8
10
CP UV (0 min)
CP UV (256 min)
Toxicity Control (0 min)
Toxicity Control (256 min)
Quality Control (0 min)
Quality Control (256 min)
A B
Fig. 3. Degradation in Closed Bottle Test of A e cyclophosphamide (4.5 mg/L; irradiation time 0 min) and photodegradation mixture (256 min of irradiation with Hg lamp) B e 5-
fluorouracil (4.5 mg/L; irradiation time 0 min) and photodegradation mixture (256 min of irradiation with Hg lamp) (n ¼ 2). “Quality control” contained readily biodegradable
sodium acetate in a concentration corresponding to 5 mg/L theoretical oxygen demand (ThODNH3, calculated without considering a possible nitrification) as the only organic
carbon source besides the inoculum. “Toxicity control” contained in addition to the inoculum, the test compound and sodium acetate in a concentration corresponding to 5 mg/L
ThOD, respectively.
Fig. 4. Toxicity tests with V. fischeri considering three endpoints before (0 min) and after (256 min) the treatments with both lamps (n ¼ 2) A ¼ Xe Lamp and B ¼ Hg. Photolysis was
conducted with an initial 5-fluorouracil concentration of 20 mg/L. Considering the EC50 for the CI (0.45 mg/L) obtained in previous studies performed in our laboratories, dilutions of
1:2 of the parent compound and photolytic mixtures were done until a dilution of 1/32, which represents a concentration of 0.63 mg L�1 (similar to the EC50 of 5-fluorouracil).
Positive control I (PCI): 4.5 mg/L 3,5-Dichlorophenol (acute LI), Positive control II (PCII): 0.05 mg/L Chloramphenicol (chronic LI, growth Inh.). Statistically significant differences (***)
compared to the untreated samples were identified by ANOVA following Tukey's Multiple Comparison Test (P < 0.0001).
C.A. Lutterbeck et al. / Environmental Pollution 208 (2016) 467e476472
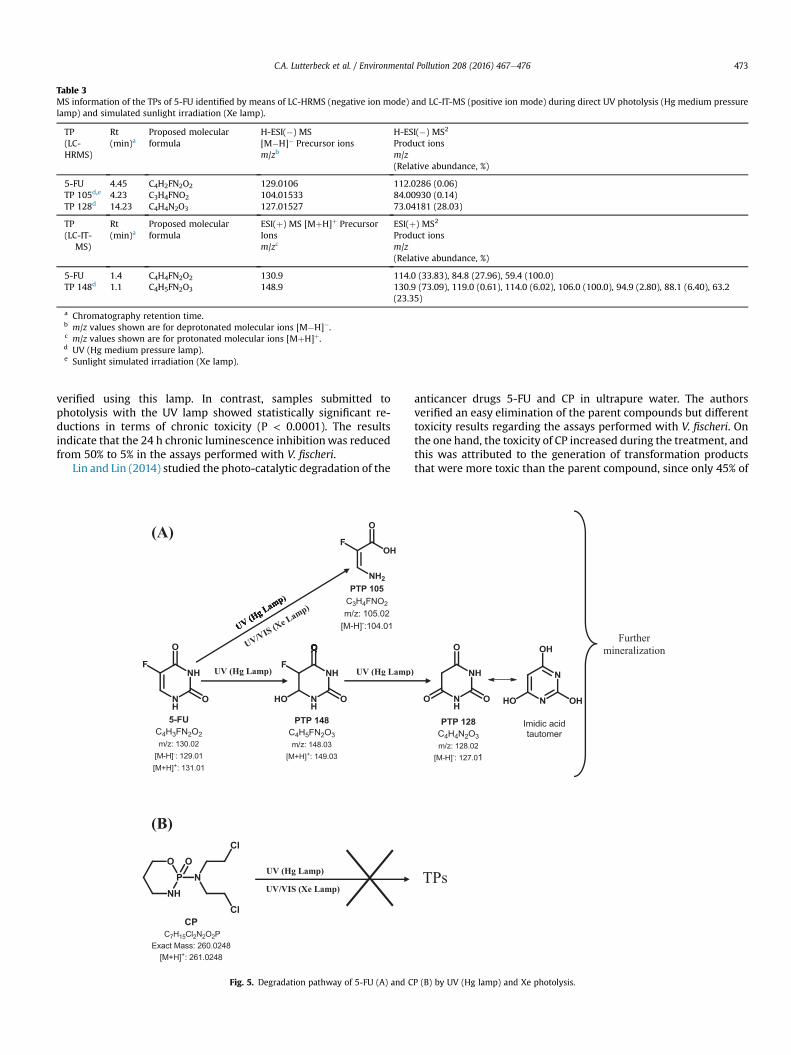
verified using this lamp. In contrast, samples submitted to
photolysis with the UV lamp showed statistically significant re-
ductions in terms of chronic toxicity (P < 0.0001). The results
indicate that the 24 h chronic luminescence inhibitionwas reduced
from 50% to 5% in the assays performed with V. fischeri.
Lin and Lin (2014) studied the photo-catalytic degradation of the
anticancer drugs 5-FU and CP in ultrapure water. The authors
verified an easy elimination of the parent compounds but different
toxicity results regarding the assays performed with V. fischeri. On
the one hand, the toxicity of CP increased during the treatment, and
this was attributed to the generation of transformation products
that were more toxic than the parent compound, since only 45% of
Table 3
MS information of the TPs of 5-FU identified by means of LC-HRMS (negative ion mode) and LC-IT-MS (positive ion mode) during direct UV photolysis (Hg medium pressure
lamp) and simulated sunlight irradiation (Xe lamp).
TP
(LC-
HRMS)
Rt
(min)aProposed molecular
formula
H-ESI(�) MS
[M�H]� Precursor ions
m/zb
H-ESI(�) MS2
Product ions
m/z
(Relative abundance, %)
5-FU 4.45 C4H2FN2O2 129.0106 112.0286 (0.06)
TP 105d,e 4.23 C3H4FNO2 104.01533 84.00930 (0.14)
TP 128d 14.23 C4H4N2O3 127.01527 73.04181 (28.03)
TP
(LC-IT-
MS)
Rt
(min)aProposed molecular
formula
ESI(þ) MS [MþH]þ Precursor
Ions
m/zc
ESI(þ) MS2
Product ions
m/z
(Relative abundance, %)
5-FU 1.4 C4H4FN2O2 130.9 114.0 (33.83), 84.8 (27.96), 59.4 (100.0)
TP 148d 1.1 C4H5FN2O3 148.9 130.9 (73.09), 119.0 (0.61), 114.0 (6.02), 106.0 (100.0), 94.9 (2.80), 88.1 (6.40), 63.2
(23.35)
a Chromatography retention time.b m/z values shown are for deprotonated molecular ions [M�H]�.c m/z values shown are for protonated molecular ions [MþH]þ.d UV (Hg medium pressure lamp).e Sunlight simulated irradiation (Xe lamp).
Further
mineralization
UV (Hg Lamp) UV (Hg Lamp)
UV (Hg Lamp)TPs
(A)
(B)
UV/VIS (Xe Lamp)
Fig. 5. Degradation pathway of 5-FU (A) and CP (B) by UV (Hg lamp) and Xe photolysis.
C.A. Lutterbeck et al. / Environmental Pollution 208 (2016) 467e476 473
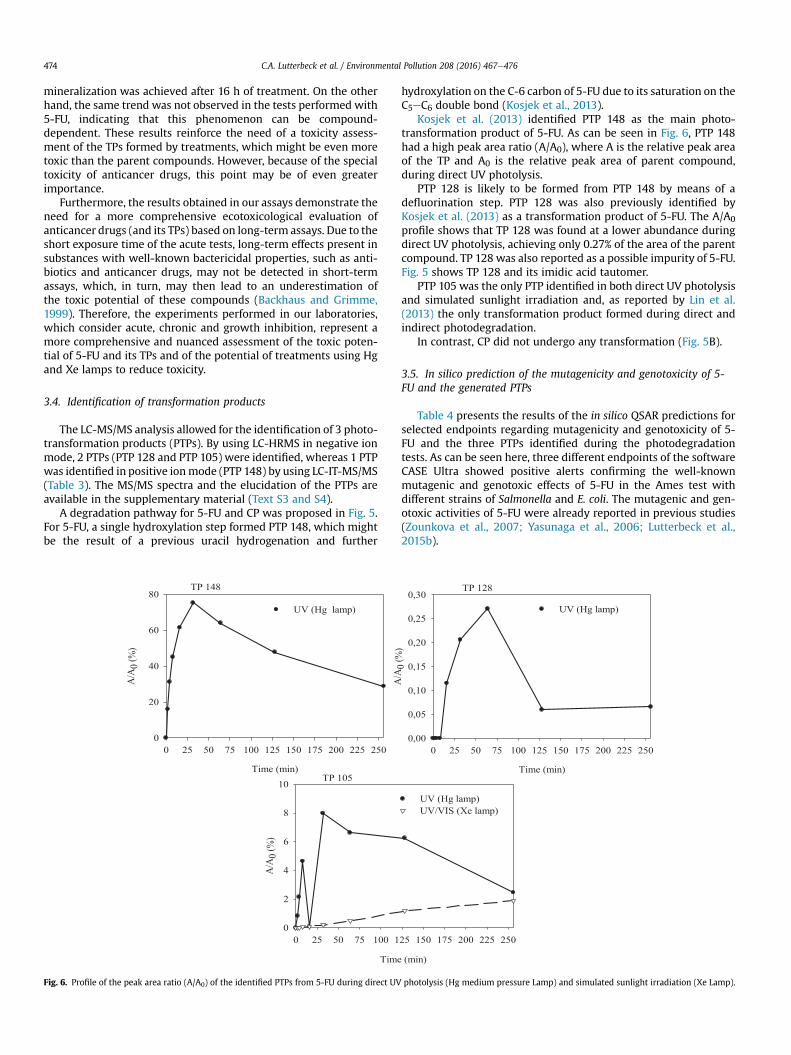
mineralization was achieved after 16 h of treatment. On the other
hand, the same trend was not observed in the tests performed with
5-FU, indicating that this phenomenon can be compound-
dependent. These results reinforce the need of a toxicity assess-
ment of the TPs formed by treatments, which might be even more
toxic than the parent compounds. However, because of the special
toxicity of anticancer drugs, this point may be of even greater
importance.
Furthermore, the results obtained in our assays demonstrate the
need for a more comprehensive ecotoxicological evaluation of
anticancer drugs (and its TPs) based on long-term assays. Due to the
short exposure time of the acute tests, long-term effects present in
substances with well-known bactericidal properties, such as anti-
biotics and anticancer drugs, may not be detected in short-term
assays, which, in turn, may then lead to an underestimation of
the toxic potential of these compounds (Backhaus and Grimme,
1999). Therefore, the experiments performed in our laboratories,
which consider acute, chronic and growth inhibition, represent a
more comprehensive and nuanced assessment of the toxic poten-
tial of 5-FU and its TPs and of the potential of treatments using Hg
and Xe lamps to reduce toxicity.
3.4. Identification of transformation products
The LC-MS/MS analysis allowed for the identification of 3 photo-
transformation products (PTPs). By using LC-HRMS in negative ion
mode, 2 PTPs (PTP 128 and PTP 105) were identified, whereas 1 PTP
was identified in positive ionmode (PTP 148) by using LC-IT-MS/MS
(Table 3). The MS/MS spectra and the elucidation of the PTPs are
available in the supplementary material (Text S3 and S4).
A degradation pathway for 5-FU and CP was proposed in Fig. 5.
For 5-FU, a single hydroxylation step formed PTP 148, which might
be the result of a previous uracil hydrogenation and further
hydroxylation on the C-6 carbon of 5-FU due to its saturation on the
C5eC6 double bond (Kosjek et al., 2013).
Kosjek et al. (2013) identified PTP 148 as the main photo-
transformation product of 5-FU. As can be seen in Fig. 6, PTP 148
had a high peak area ratio (A/A0), where A is the relative peak area
of the TP and A0 is the relative peak area of parent compound,
during direct UV photolysis.
PTP 128 is likely to be formed from PTP 148 by means of a
defluorination step. PTP 128 was also previously identified by
Kosjek et al. (2013) as a transformation product of 5-FU. The A/A0
profile shows that TP 128 was found at a lower abundance during
direct UV photolysis, achieving only 0.27% of the area of the parent
compound. TP 128 was also reported as a possible impurity of 5-FU.
Fig. 5 shows TP 128 and its imidic acid tautomer.
PTP 105 was the only PTP identified in both direct UV photolysis
and simulated sunlight irradiation and, as reported by Lin et al.
(2013) the only transformation product formed during direct and
indirect photodegradation.
In contrast, CP did not undergo any transformation (Fig. 5B).
3.5. In silico prediction of the mutagenicity and genotoxicity of 5-
FU and the generated PTPs
Table 4 presents the results of the in silico QSAR predictions for
selected endpoints regarding mutagenicity and genotoxicity of 5-
FU and the three PTPs identified during the photodegradation
tests. As can be seen here, three different endpoints of the software
CASE Ultra showed positive alerts confirming the well-known
mutagenic and genotoxic effects of 5-FU in the Ames test with
different strains of Salmonella and E. coli. The mutagenic and gen-
otoxic activities of 5-FU were already reported in previous studies
(Zounkova et al., 2007; Yasunaga et al., 2006; Lutterbeck et al.,
2015b).
TP 105
Time (min)
0 25 50 75 100 125 150 175 200 225 250
A/A
0 (
%)
0
2
4
6
8
10
UV (Hg lamp)
UV/VIS (Xe lamp)
TP 128
Time (min)
0 25 50 75 100 125 150 175 200 225 250
A/A
0 (
%)
0,00
0,05
0,10
0,15
0,20
0,25
0,30
UV (Hg lamp)
TP 148
Time (min)
0 25 50 75 100 125 150 175 200 225 250
A/A
0)
%(
0
20
40
60
80
UV (Hg lamp)
Fig. 6. Profile of the peak area ratio (A/A0) of the identified PTPs from 5-FU during direct UV photolysis (Hg medium pressure Lamp) and simulated sunlight irradiation (Xe Lamp).
C.A. Lutterbeck et al. / Environmental Pollution 208 (2016) 467e476474
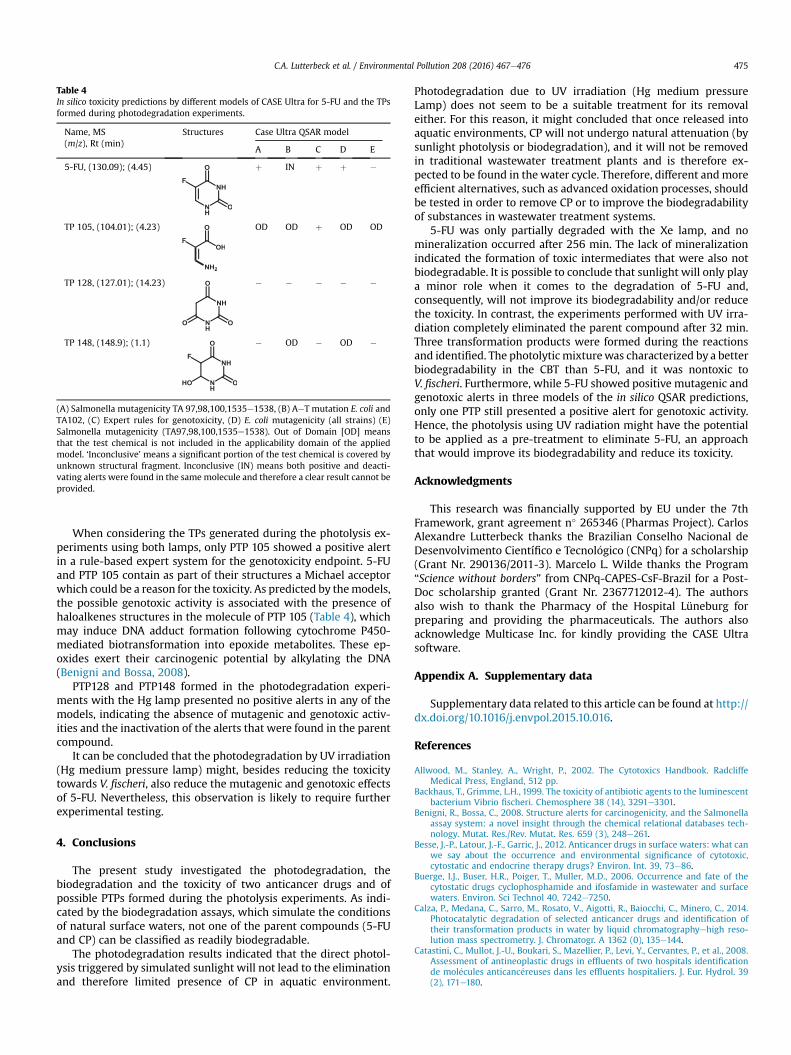
When considering the TPs generated during the photolysis ex-
periments using both lamps, only PTP 105 showed a positive alert
in a rule-based expert system for the genotoxicity endpoint. 5-FU
and PTP 105 contain as part of their structures a Michael acceptor
which could be a reason for the toxicity. As predicted by themodels,
the possible genotoxic activity is associated with the presence of
haloalkenes structures in the molecule of PTP 105 (Table 4), which
may induce DNA adduct formation following cytochrome P450-
mediated biotransformation into epoxide metabolites. These ep-
oxides exert their carcinogenic potential by alkylating the DNA
(Benigni and Bossa, 2008).
PTP128 and PTP148 formed in the photodegradation experi-
ments with the Hg lamp presented no positive alerts in any of the
models, indicating the absence of mutagenic and genotoxic activ-
ities and the inactivation of the alerts that were found in the parent
compound.
It can be concluded that the photodegradation by UV irradiation
(Hg medium pressure lamp) might, besides reducing the toxicity
towards V. fischeri, also reduce the mutagenic and genotoxic effects
of 5-FU. Nevertheless, this observation is likely to require further
experimental testing.
4. Conclusions
The present study investigated the photodegradation, the
biodegradation and the toxicity of two anticancer drugs and of
possible PTPs formed during the photolysis experiments. As indi-
cated by the biodegradation assays, which simulate the conditions
of natural surface waters, not one of the parent compounds (5-FU
and CP) can be classified as readily biodegradable.
The photodegradation results indicated that the direct photol-
ysis triggered by simulated sunlight will not lead to the elimination
and therefore limited presence of CP in aquatic environment.
Photodegradation due to UV irradiation (Hg medium pressure
Lamp) does not seem to be a suitable treatment for its removal
either. For this reason, it might concluded that once released into
aquatic environments, CP will not undergo natural attenuation (by
sunlight photolysis or biodegradation), and it will not be removed
in traditional wastewater treatment plants and is therefore ex-
pected to be found in the water cycle. Therefore, different andmore
efficient alternatives, such as advanced oxidation processes, should
be tested in order to remove CP or to improve the biodegradability
of substances in wastewater treatment systems.
5-FU was only partially degraded with the Xe lamp, and no
mineralization occurred after 256 min. The lack of mineralization
indicated the formation of toxic intermediates that were also not
biodegradable. It is possible to conclude that sunlight will only play
a minor role when it comes to the degradation of 5-FU and,
consequently, will not improve its biodegradability and/or reduce
the toxicity. In contrast, the experiments performed with UV irra-
diation completely eliminated the parent compound after 32 min.
Three transformation products were formed during the reactions
and identified. The photolytic mixturewas characterized by a better
biodegradability in the CBT than 5-FU, and it was nontoxic to
V. fischeri. Furthermore, while 5-FU showed positive mutagenic and
genotoxic alerts in three models of the in silico QSAR predictions,
only one PTP still presented a positive alert for genotoxic activity.
Hence, the photolysis using UV radiation might have the potential
to be applied as a pre-treatment to eliminate 5-FU, an approach
that would improve its biodegradability and reduce its toxicity.
Acknowledgments
This research was financially supported by EU under the 7th
Framework, grant agreement n� 265346 (Pharmas Project). Carlos
Alexandre Lutterbeck thanks the Brazilian Conselho Nacional de
Desenvolvimento Científico e Tecnol�ogico (CNPq) for a scholarship
(Grant Nr. 290136/2011-3). Marcelo L. Wilde thanks the Program
“Science without borders” from CNPq-CAPES-CsF-Brazil for a Post-
Doc scholarship granted (Grant Nr. 2367712012-4). The authors
also wish to thank the Pharmacy of the Hospital Lüneburg for
preparing and providing the pharmaceuticals. The authors also
acknowledge Multicase Inc. for kindly providing the CASE Ultra
software.
Appendix A. Supplementary data
Supplementary data related to this article can be found at http://
dx.doi.org/10.1016/j.envpol.2015.10.016.
References
Allwood, M., Stanley, A., Wright, P., 2002. The Cytotoxics Handbook. RadcliffeMedical Press, England, 512 pp.
Backhaus, T., Grimme, L.H., 1999. The toxicity of antibiotic agents to the luminescentbacterium Vibrio fischeri. Chemosphere 38 (14), 3291e3301.
Benigni, R., Bossa, C., 2008. Structure alerts for carcinogenicity, and the Salmonellaassay system: a novel insight through the chemical relational databases tech-nology. Mutat. Res./Rev. Mutat. Res. 659 (3), 248e261.
Besse, J.-P., Latour, J.-F., Garric, J., 2012. Anticancer drugs in surface waters: what canwe say about the occurrence and environmental significance of cytotoxic,cytostatic and endocrine therapy drugs? Environ. Int. 39, 73e86.
Buerge, I.J., Buser, H.R., Poiger, T., Muller, M.D., 2006. Occurrence and fate of thecytostatic drugs cyclophosphamide and ifosfamide in wastewater and surfacewaters. Environ. Sci Technol 40, 7242e7250.
Calza, P., Medana, C., Sarro, M., Rosato, V., Aigotti, R., Baiocchi, C., Minero, C., 2014.Photocatalytic degradation of selected anticancer drugs and identification oftheir transformation products in water by liquid chromatographyehigh reso-lution mass spectrometry. J. Chromatogr. A 1362 (0), 135e144.
Catastini, C., Mullot, J.-U., Boukari, S., Mazellier, P., Levi, Y., Cervantes, P., et al., 2008.Assessment of antineoplastic drugs in effluents of two hospitals identificationde mol�ecules anticanc�ereuses dans les effluents hospitaliers. J. Eur. Hydrol. 39(2), 171e180.
Table 4
In silico toxicity predictions by different models of CASE Ultra for 5-FU and the TPs
formed during photodegradation experiments.
Name, MS
(m/z), Rt (min)
Structures Case Ultra QSAR model
A B C D E
5-FU, (130.09); (4.45) þ IN þ þ �
TP 105, (104.01); (4.23) OD OD þ OD OD
TP 128, (127.01); (14.23) � � � � �
TP 148, (148.9); (1.1) � OD � OD �
(A) Salmonella mutagenicity TA 97,98,100,1535e1538, (B) AeT mutation E. coli and
TA102, (C) Expert rules for genotoxicity, (D) E. coli mutagenicity (all strains) (E)
Salmonella mutagenicity (TA97,98,100,1535e1538). Out of Domain [OD] means
that the test chemical is not included in the applicability domain of the applied
model. ‘Inconclusive’ means a significant portion of the test chemical is covered by
unknown structural fragment. Inconclusive (IN) means both positive and deacti-
vating alerts were found in the samemolecule and therefore a clear result cannot be
provided.
C.A. Lutterbeck et al. / Environmental Pollution 208 (2016) 467e476 475
Eitel, A., Scherrer, M., Kümmerer, K., 1999. Handling Cytostatic Drugs. Kehrer Digital& Print, Freiburg, Germany, 42 pp.
Du, Y., Chen, H., Zhang, Y., Chang, Y., 2014. Photodegradation of gallic acid under UVirradiation: insights regarding the pH effect on direct photolysis and the ROSoxidation-sensitized process of DOM. Chemosphere 99, 254e260.
Ge, L., Chen, J., Qiao, X., Lin, J., Cai, X., 2009. Light-source-dependent effects of mainwater constituents on photodegradation of phenicol antibiotics: mechanismand kinetics. Environ. Sci. Technol. 43, 3101e3107.
G�omez-Canela, C., Cort�es-Francisco, N., Ventura, F., Caixach, J., Lacorte, S., 2013.Liquid chromatography coupled to tandem mass spectrometry and high reso-lution mass spectrometry as analytical tools to characterize multi-class cyto-static compounds. J. Chromatogr. A 1276, 78e94.
Gros, M., Petrovi�c, M., Barcel�o, D., 2006. Multi-residue analytical methods usingLCetandem MS for the determination of pharmaceuticals in environmental andwastewater samples: a review. Anal. Bioanal. Chem. 386, 941e952.
Herrmann, M., Menz, J., Olsson, O., Kümmerer, K., 2015. Identification of photo-transformation products of the antiepileptic drug gabapentin: biodegradabilityand initial assessment of toxicity. Water Res. 85, 11e21.
Hignite, C., Azarnoff, D.L., 1977. Drugs and drug metabolites as environmentalcontaminants: chlorophenoxyisobutyrate and salicyclic acid in sewage watereffluent. Life Sci. 20, 337e341.
Ill�es, E., Szab�o, E., Tak�acs, E., Wojn�arovits, L., Dombi, A., Gajda-Schrantz, K., 2014.Ketoprofen removal by O3 and O3/UV processes: kinetics, transformationproducts and ecotoxicity. Sci. Total Environ. 472, 178e184.
International Conference on Harmonization (ICH), 2014. ICH Guideline M7. http://www.ich.org/fileadmin/Public_Web_Site/ICH_Products/Guidelines/Multidisciplinary/M7/M7_Step_4.pdf (accessed 18.05.15.).
Kiffmeyer, T., G€otze, H.-S., Jursch, M., Lüders, U., 1997. Trace enrichment, chro-matographic separation and biodegradation of cytostatic compounds in surfacewater. Fresen. J. Anal. Chem. 361, 185e191.
Kim, I., Tanaka, H., 2009. Photodegradation characteristics of PPCPs in water withUV treatment. Environ. Int. 35, 793e802.
Kosjek, T., Perko, S., �Zigon, D., Heath, E., 2013. Fluorouracil in the environment:analysis, occurrence, degradation and transformation. J. Chromatogr. A 1290,62e72.
Kovalova, L., McArdell, C.S., Hollender, J., 2009. Challenge of high polarity and lowconcentrations in analysis of cytostatics and metabolites in wastewater byhydrophilic interaction chromatography/tandem mass spectrometry.J. Chromatogr. A 1216, 1100e1108.
Kümmerer, K., Al-Ahmad, A., 1997. Biodegradability of the anti-tumour agents 5-fluorouracil, cytarabine, and gemcitabine: impact of the chemical structure andsynergistic toxicity with hospital effluent. Acta Hydroch. Hydrob. 25, 166e172.
Kümmerer, K., Al-Ahmad, A., 2010. Estimation of the cancer risk to humansresulting from the presence of cyclophosphamide and ifosfamide in surfacewater. Environ. Sci. Pollut. Res. Int. 17, 486e496.
Kümmerer, K., Steger-Hartmann, T., Baranyai, A., Burhaus, I., 1996. Tests ofbiodegradation of cytostatics cyclophosphamide and ifosfamide using theClosed Bottle Test (OECD 301 D). Zentralbl. Hyg. Umweltmed. 198, 215e225.
Kümmerer, K., Haiß, A., Schuster, A., Hein, A., Ebert, I., 2014. Antineoplastic com-pounds in the environmentdsubstances of special concern. Environ. Sci. Pollut.Res. http://dx.doi.org/10.1007/s11356-014-3902-8.
Latch, D.E., Stender, B.L., Packer, J.L., Arnold, W.A., McNeill, K., 2003. Photochemicalfate of pharmaceuticals in the environment: cimetidine and ranitidine. Environ.Sci. Technol. 37, 3342e3350.
Lin, H.H.-H., Lin, A.Y.-C., 2014. Photocatalytic oxidation of 5-fluorouracil andcyclophosphamide via UV/TiO2 in an aqueous environment. Water Res. 48,559e568.
Lin, A.Y.-C., Wang, X.-H., Lee, W.-N., 2013. Phototransformation determines the fateof 5-fluorouracil and cyclophosphamide in natural surface waters. Environ. Sci.Technol. 47, 4104e4112.
Lutterbeck, C.A., Kern, D.I., Machado, E.L., Kümmerer, K., 2014. Ecotoxicologicalevaluation of selected anticancer drugs. Toxicol. Lett. 229 (Suppl. l.), S71eS72.
Lutterbeck, C.A., Baginska, E., Machado, E.L., Kümmerer, K., 2015a. Removal of the
anti-cancer drug methotrexate from water by advanced oxidation processes:aerobic biodegradation and toxicity studies after treatment. Chemosphere 141,290e296.
Lutterbeck, C.A., Kern, D.I., Machado, E.L., Kümmerer, K., 2015b. Evaluation of thetoxic effects of four anti-cancer drugs in plant bioassays and its potency forscreening in the context of waste water reuse for irrigation. Chemosphere 135,403e410.
Magdeburg, A., Stalter, D., Schlüsener, M., Ternes, T., Oehlmann, J., 2014. Evaluatingthe efficiency of advanced wastewater treatment: target analysis of organiccontaminants and (geno-)toxicity assessment tell a different story. Water. Res.50 (0), 35e47.
Mahmoud, W.M., Kummerer, K., 2012. Captopril and its dimer captopril disulfide:photodegradation, aerobic biodegradation and identification of transformationproducts by HPLC-UV and LC-ion trap-MS(n). Chemosphere 88 (10), 1170e1177.
Mahnik, S.N., Lenz, K., Weissenbacher, N., Mader, R.M., Fuerhacker, M., 2007. Fate of5-fluorouracil, doxorubicin, epirubicin, and daunorubicin in hospital waste-water and their elimination by activated sludge and treatment in a membrane-bio-reactor system. Chemosphere 66, 30e37.
Menz, J., Schneider, M., Kümmerer, K., 2013. Toxicity testing with luminescentbacteria e characterization of an automated method for the combined assess-ment of acute and chronic effects. Chemosphere 93, 990e996.
Mompelat, S., Le Bot, B., Thomas, O., 2009. Occurrence and fate of pharmaceuticalproducts and by-products, from resource to drinking water. Environ. Int. 35,803e814.
Nyholm, N., 1991. The European system of standardized legal tests for assessing thebiodegradability of chemicals. Environ. Toxicol. Chem. 10, 1237e1246.
OECD (Organisation for Economic Co-operation and Development), 1992. OECDGuideline for Testing of Chemicals 301D. Ready Biodegradability. Closed BottleTest. OECD Publishing.
Rowney, N.C., Johnson, A.C., Williams, R.J., 2009. Cytotoxic drugs in drinking water:a prediction and risk assessment exercise for the Thames catchment in theUnited Kingdom. Environ. Toxicol. Chem. 28, 2733e2743.
Ryan, C.C., Tan, D.T., Arnold, W.A., 2010. Direct and indirect photolysis of sulfa-methoxazole and trimethoprim in wastewater treatment plant effluent. WaterRes. 45, 1280e1286.
Steger-Hartmann, T., Kümmerer, K., Hartmann, A., 1997. Biological degradation ofcyclophosphamide and its occurrence in sewage water. Ecotox. Environ. Safe.36, 174e179.
Sun, P., Pavlostathis, S.G., Huang, C., 2014. Photodegradation of veterinary iono-phore antibiotics under UV and solar irradiation. Environ. Sci. Technol. 48,13188e13196.
Toolaram, A.P., Kümmerer, K., Schneider, M., 2014. Environmental risk assessmentof anti-cancer drugs and their transformation products: a focus on their gen-otoxicity characterization-state of knowledge and short comings. Mutat. Res./Rev. Mutat. Res. 760, 18e35.
Wang, X.-H., Lin, A.Y.-C., 2014. Is the phototransformation of pharmaceuticals anatural purification process that decreases ecological and human health risks?Environ. Pollut. 186, 203e215.
Weissbrodt, D., Kovalova, L., Ort, C., Pazhepurackel, V., Moser, R., Hollender, J.,Siegrist, H., McArdell, C.S., 2009. Mass flows of X-ray contrast media and cy-tostatics in hospital wastewater. Environ. Sci. Technol. 43, 4810e4817.
Yasunaga, K., Kiyonari, A., Nakagawa, M., Yoshikawa, K., 2006. Investigation into theability of the Salmonella umu test to detect DNA damage using antitumordrugs. Toxicol. in Vitro 20, 712e728.
Yu, J.T., Bouwer, E.J., Coelhan, M., 2006. Occurrence and biodegradability studies ofselected pharmaceuticals and personal care products in sewage effluent. Agric.Water Manage. 86, 72e80.
Zhang, J., Chang, V.W.C., Giannis, A., Wang, J.-Y., 2013. Removal of cytostatic drugsfrom aquatic environment: a review. Sci. Total Environ. 445e446, 281e298.
Zounkova, R., Odraska, P., Dolezalova, L., Hilscherova, K., Marsalek, B., Blaha, L., 2007.Ecotoxicity and genotoxicity assessment of cytostatic pharmaceuticals. Environ.Toxicol. Chem. 26, 2208e2214.
C.A. Lutterbeck et al. / Environmental Pollution 208 (2016) 467e476476
Supplementary Material
Degradation of Cyclophosphamide and 5-
Fluorouracil under UV and Xe irradiations and
assessment of the enhancement of the
biodegradability and toxicty
Carlos Alexandre Lutterbecka,b, Marcelo Luís Wildea, Ewelina Baginskaa, Christoph
Ledera, Ênio Leandro Machadob, Klaus Kümmerer a
a Sustainable Chemistry and Material Resources, Institute of Sustainable and Environmental Chemistry, Faculty of
Sustainability, Leuphana University of Lüneburg, Scharnhorststraße 1/C13, DE-21335 Lüneburg, Germany
b Graduate Program in Environmental Technology, Universidade de Santa Cruz do Sul — UNISC, Av.
Independência, 2293, CEP 96815-900, Santa Cruz do Sul, Rio Grande do Sul, Brazil
Nachhaltige Chemie und Stoffliche Ressourcen, Institut für Nachhaltige Chemie und Umweltchemie, Fakultät für
Nachhaltigkeit, Leuphana Universität Lüneburg, Scharnhorststraße 1/C13, D-21335 Lüneburg, Germany. Tel.: +49
4131 677 2893.
E-Mail adresses: [email protected] (C. A. Lutterbeck), [email protected] (M. L. Wilde)
[email protected] (E. Baginska), [email protected] (C. Leder) [email protected] (E. Machado),
[email protected] (K. Kümmerer)
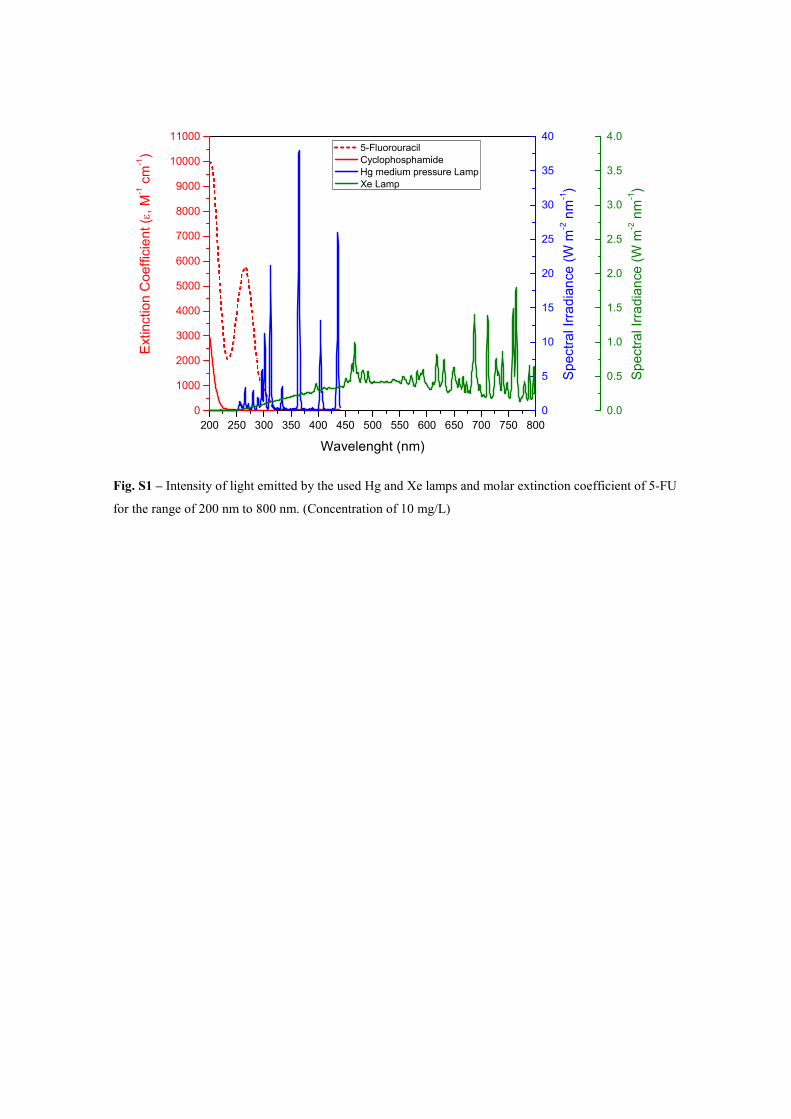
200 250 300 350 400 450 500 550 600 650 700 750 800
0
1000
2000
3000
4000
5000
6000
7000
8000
9000
10000
11000
0
5
10
15
20
25
30
35
40
0.0
0.5
1.0
1.5
2.0
2.5
3.0
3.5
4.0E
xtinction
Coeffic
ient (
, M
-1 c
m-1)
Wavelenght (nm)
5-Fluorouracil
Cyclophosphamide
Hg medium pressure Lamp
Xe Lamp
Sp
ectr
al Ir
radia
nce
(W
m-2 n
m-1)
Sp
ectr
al Ir
radia
nce
(W
m-2 n
m-1)
Fig. S1 – Intensity of light emitted by the used Hg and Xe lamps and molar extinction coefficient of 5-FU
for the range of 200 nm to 800 nm. (Concentration of 10 mg/L)
Text S1 – Analytical Methods
The chromatographic separation of the CP was performed on a Nucleodur RP-18
endcapped 100-3, 2µm (Macherey-Nagel, Düren, Germany) coupled to a precolumn,
Nucleodur C18 ec 4-2, 3µm (Macherey-Nagel, Düren, Germany). For elution, 0.1
% formic acid in deionized water (solution A) and 100% acetonitrile LC-MS grade
(solution B) were used by applying the following gradient: isocratic from 0 min until 5
min. 5 % B, linear gradient 20 min 70 % B, isocratic until 25 min 70 % B, 27 min 5 %
B, 33 min 5 % B. The sample injection volume was 10 µL and flow rate was 0.3 mL m-
1. Standards of CP (0.1, 1, 2.5, 5, 10 and 20 mg/L) were used to establish a linear
calibration curve. For LOD we used a signal to noise ratio (S:N) of 3:1 from the
extracted ion chromatograms (EICs) peak area and for LOQ a S:N ratio of 10:1 was set.
The linearity for CP was r2 0.997 while the LOD and LOQ were about 100µg/L and 350
µg/L, respectively
The chromatographic separation of 5-FU in the LC-IT-MS was carried out on a
Nucleodur RP-18 endcapped 100-3, 2 µm (Macherey-Nagel, Düren, Germany) coupled
to a guard column, (Nucleodur C18 ec 4-2, 3 µm; Macherey-Nagel, Düren, Germany).
The mobile phase consisted of (A) 0.1 % formic acid in deionized water and (B) 100%
acetonitrile. The following gradient was applied: 0-5 min isocratic 5% of B, 5-20 min
linear gradient 5-70% of B, 20-25 min isocratic 70% of B, 25-27 min linear gradient 70-
5% of B, 27-33 min isocratic 5% of B. Injection volume was 10 µL and the flow rate
was settled to 0.3 mL/min.
Elution was performed on a MN Nucleodur® HILIC column (EC 100/3 mm, 3
μm) (Macherey-Nagel, Düren, Germany) by a binary mobile phase consisting of (A)
0.1% of formic acid in ultrapure water and (B) MeOH at a isocratic flow rate of 0.3 mL
min-1, oven temperature 30 °C, using a isocratic flow of 30% B during 15 min.
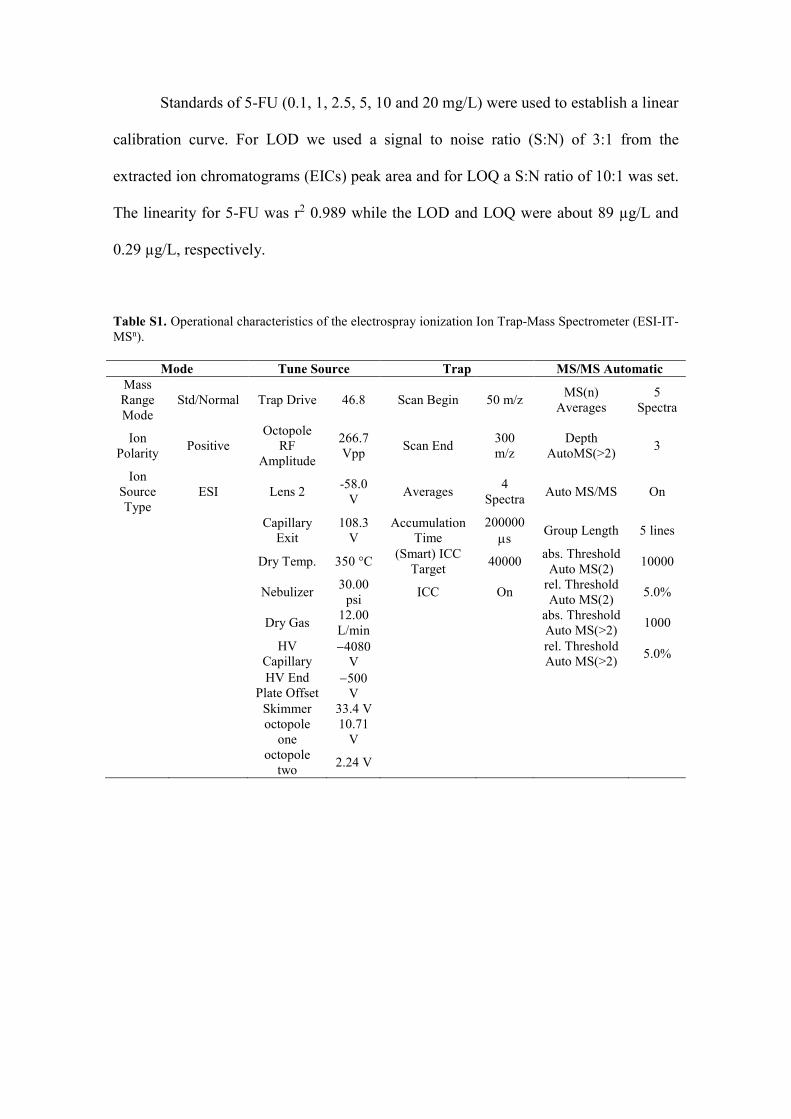
Standards of 5-FU (0.1, 1, 2.5, 5, 10 and 20 mg/L) were used to establish a linear
calibration curve. For LOD we used a signal to noise ratio (S:N) of 3:1 from the
extracted ion chromatograms (EICs) peak area and for LOQ a S:N ratio of 10:1 was set.
The linearity for 5-FU was r2 0.989 while the LOD and LOQ were about 89 µg/L and
0.29 µg/L, respectively.
Table S1. Operational characteristics of the electrospray ionization Ion Trap-Mass Spectrometer (ESI-IT-MSn).
Mode Tune Source Trap MS/MS Automatic
Mass Range Mode
Std/Normal Trap Drive 46.8 Scan Begin 50 m/z MS(n)
Averages 5
Spectra
Ion Polarity
Positive Octopole
RF Amplitude
266.7 Vpp
Scan End 300 m/z
Depth AutoMS(>2)
3
Ion Source Type
ESI Lens 2 -58.0
V Averages
4 Spectra
Auto MS/MS On
Capillary
Exit 108.3
V Accumulation
Time 200000 s
Group Length 5 lines
Dry Temp. 350 °C (Smart) ICC
Target 40000
abs. Threshold Auto MS(2)
10000
Nebulizer 30.00
psi ICC On
rel. Threshold Auto MS(2)
5.0%
Dry Gas 12.00 L/min
abs. Threshold Auto MS(>2)
1000
HV
Capillary 4080
V
rel. Threshold Auto MS(>2)
5.0%
HV End
Plate Offset 500
V
Skimmer 33.4 V
octopole
one 10.71
V
octopole
two 2.24 V
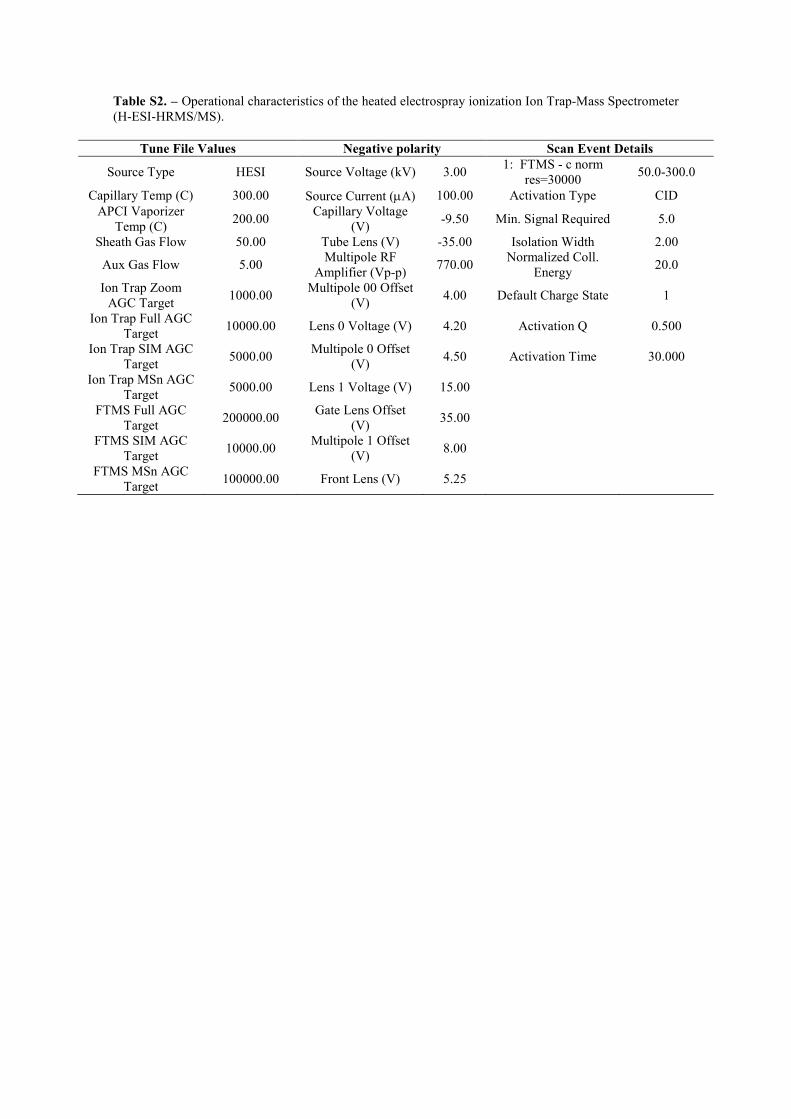
Table S2. – Operational characteristics of the heated electrospray ionization Ion Trap-Mass Spectrometer (H-ESI-HRMS/MS).
Tune File Values Negative polarity Scan Event Details
Source Type HESI Source Voltage (kV) 3.00 1: FTMS - c norm
res=30000 50.0-300.0
Capillary Temp (C) 300.00 Source Current (A) 100.00 Activation Type CID APCI Vaporizer
Temp (C) 200.00
Capillary Voltage (V)
-9.50 Min. Signal Required 5.0
Sheath Gas Flow 50.00 Tube Lens (V) -35.00 Isolation Width 2.00
Aux Gas Flow 5.00 Multipole RF
Amplifier (Vp-p) 770.00
Normalized Coll. Energy
20.0
Ion Trap Zoom AGC Target
1000.00 Multipole 00 Offset
(V) 4.00 Default Charge State 1
Ion Trap Full AGC Target
10000.00 Lens 0 Voltage (V) 4.20 Activation Q 0.500
Ion Trap SIM AGC Target
5000.00 Multipole 0 Offset
(V) 4.50 Activation Time 30.000
Ion Trap MSn AGC Target
5000.00 Lens 1 Voltage (V) 15.00
FTMS Full AGC Target
200000.00 Gate Lens Offset
(V) 35.00
FTMS SIM AGC Target
10000.00 Multipole 1 Offset
(V) 8.00
FTMS MSn AGC Target
100000.00 Front Lens (V) 5.25
Text S2. Ready biodegradability by means of Closed Bottle Test (OECD 301D)
The aerobic biodegradability of 5-FU and CP and of possible TP’s formed
during the photodegradation experiments was investigated in the Closed Bottle Test
(CBT) according to the OECD 301D guidelines (OECD, 1992). The CBT consisted of
four series running in parallel and in duplicate (i.e., “blank”, “quality control”, “test”,
and “toxicity control”). The composition of the CBT series is summarized in Table S1.
The concentrations of sodium acetate and test substances, in any of the corresponding
test series, were 5 mg/L of theoretical oxygen demand (ThODNH3, calculated without
considering a possible nitrification. The inoculum source was the effluent collected
from the municipal STP AGL GmbH, Lüneburg, Nord, Germany (73 000 inhabitant
equivalents). Two drops of inoculum were added to 1 L of the mineral medium solution.
During the whole test the consumption of oxygen in the bottles was measured
daily with an optical oxygen sensor system (Fibox 3 PreSens, Regensburg, Germany)
using sensor spots in the bottles. Besides, the temperature and the pH (day 0 and 28)
were also controlled. A more detailed description of the test can be found elsewhere
(Friedrich et al., 2013; Kümmerer et al., 1996; Mahmoud and Kümmerer, 2012;
Trautwein et al., 2008).
According to the OECD guideline, a compound is classified as ‘‘readily
biodegradable” if biodegradability, expressed as a percentage of oxygen consumed in
the test vessel compared to maximum consumption (ThOD), exceeds 60 % within a
period of ten days starting from the day where oxygen consumption reaches 10 %
ThOD. A tested compound is considered to be inhibitory for the bacteria if the
biodegradation does not reach more than 25% of ThOD within 14 days. Additionally, to
determine the toxic effects, the oxygen consumption measured in the toxicity controls
was compared with the predicted level calculated from the oxygen consumption in the
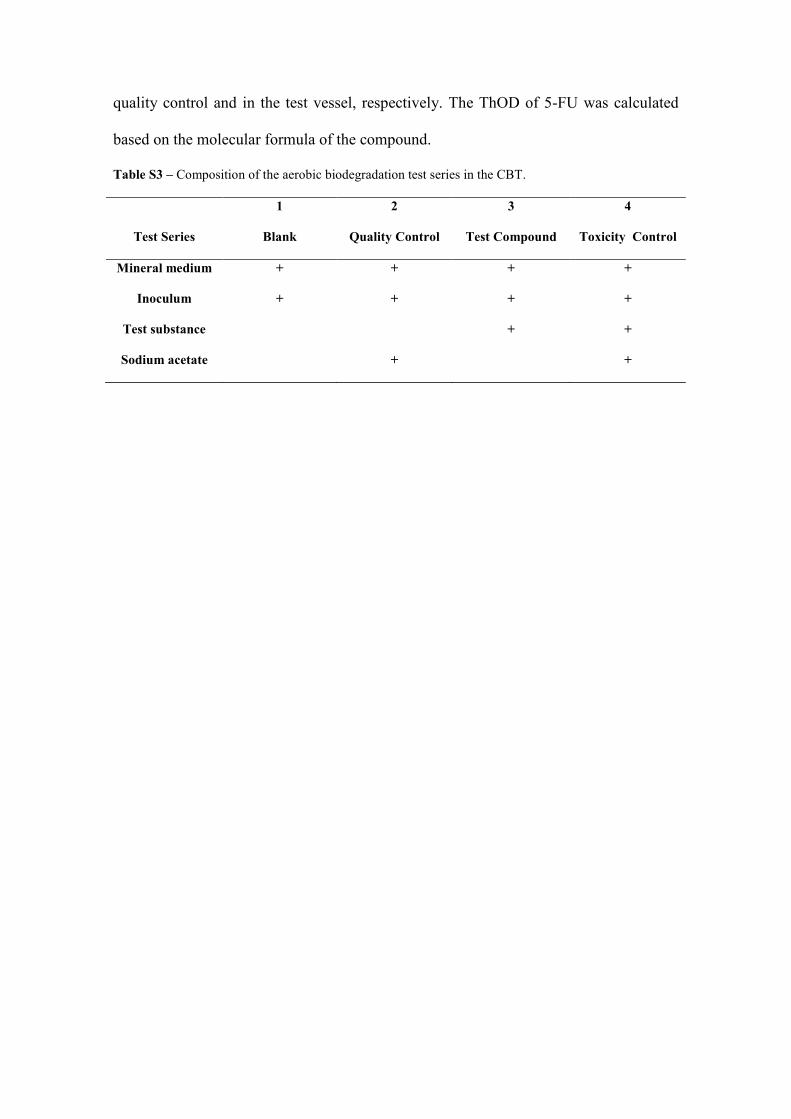
quality control and in the test vessel, respectively. The ThOD of 5-FU was calculated
based on the molecular formula of the compound.
Table S3 – Composition of the aerobic biodegradation test series in the CBT.
Test Series
1
Blank
2
Quality Control
3
Test Compound
4
Toxicity Control
Mineral medium + + + +
Inoculum + + + +
Test substance + +
Sodium acetate + +
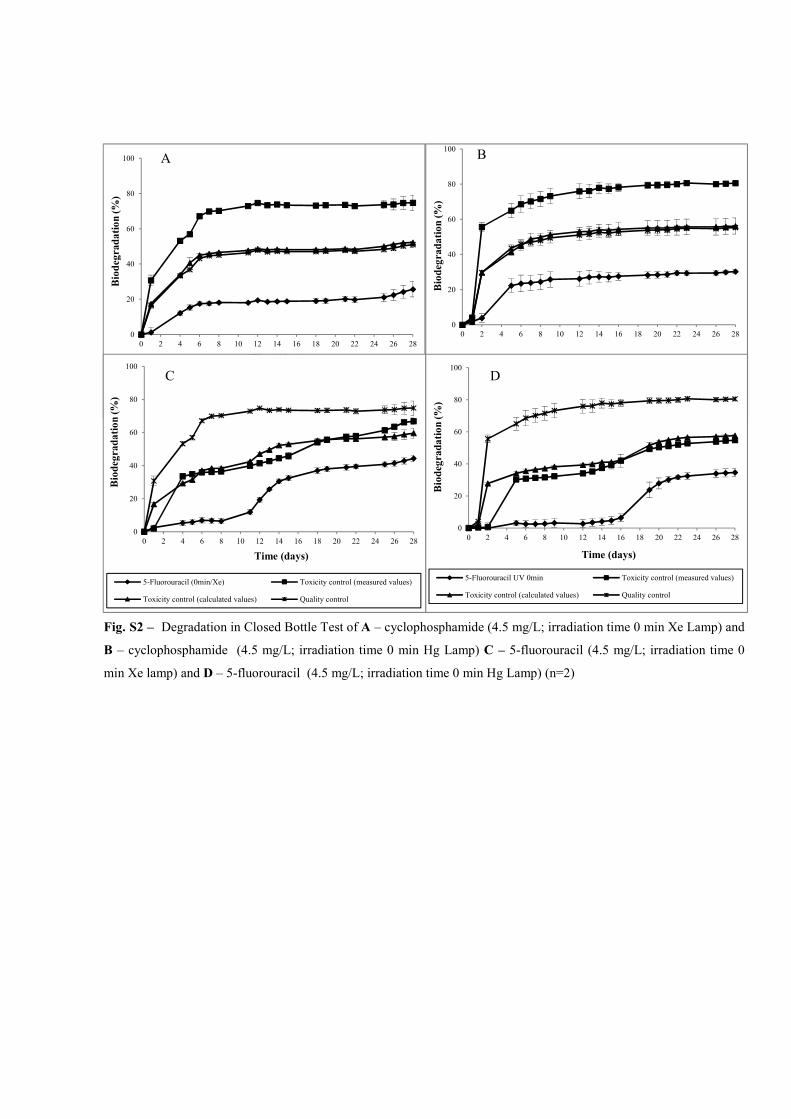
0
20
40
60
80
100
0 2 4 6 8 10 12 14 16 18 20 22 24 26 28
Bio
deg
rad
ati
on
(%
)
Time (days)
Cyclophosphamide (0min/Xe) Quality control
Toxicity control (measured values) Toxicity control (calculated values)
0
20
40
60
80
100
0 2 4 6 8 10 12 14 16 18 20 22 24 26 28
Bio
deg
rad
ati
on
(%
)
Time (days)
Cyclophosphamide UV 0min Quality control
Toxicity control (measured values) Toxicity control (calculated values)
0
20
40
60
80
100
0 2 4 6 8 10 12 14 16 18 20 22 24 26 28
Bio
deg
rad
ati
on
(%
)
Time (days)
5-Fluorouracil (0min/Xe) Toxicity control (measured values)
Toxicity control (calculated values) Quality control
0
20
40
60
80
100
0 2 4 6 8 10 12 14 16 18 20 22 24 26 28
Bio
deg
rad
ati
on
(%
)
Time (days)
5-Fluorouracil UV 0min Toxicity control (measured values)
Toxicity control (calculated values) Quality control
Fig. S2 – Degradation in Closed Bottle Test of A – cyclophosphamide (4.5 mg/L; irradiation time 0 min Xe Lamp) and
B – cyclophosphamide (4.5 mg/L; irradiation time 0 min Hg Lamp) C – 5-fluorouracil (4.5 mg/L; irradiation time 0
min Xe lamp) and D – 5-fluorouracil (4.5 mg/L; irradiation time 0 min Hg Lamp) (n=2)
C D
A B
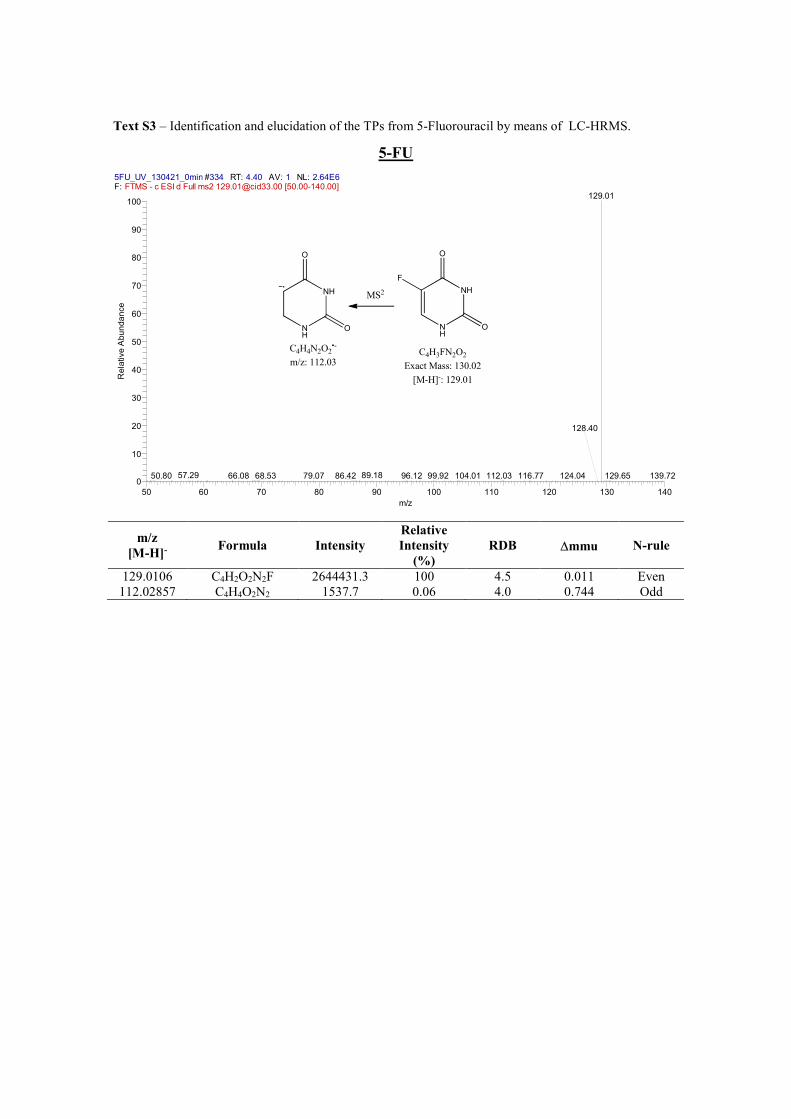
Text S3 – Identification and elucidation of the TPs from 5-Fluorouracil by means of LC-HRMS.
5-FU
m/z
[M-H]- Formula Intensity
Relative
Intensity
(%)
RDB mmu N-rule
129.0106 C4H2O2N2F 2644431.3 100 4.5 0.011 Even 112.02857 C4H4O2N2 1537.7 0.06 4.0 0.744 Odd
5FU_UV_130421_0min #334 RT: 4.40 AV: 1 NL: 2.64E6F: FTMS - c ESI d Full ms2 [email protected] [50.00-140.00]
50 60 70 80 90 100 110 120 130 140
m/z
0
10
20
30
40
50
60
70
80
90
100
Re
lative
Abu
nd
an
ce
129.01
89.1857.29 66.08 96.12 129.6568.53 99.9279.07 124.0450.80 139.7286.42 116.77
128.40
104.01 112.03
NH
O
NH
O
C4H4N2O2•-
m/z: 112.03
NH
O
NH
O
F
C4H3FN2O2
Exact Mass: 130.02
[M-H]-: 129.01
MS2
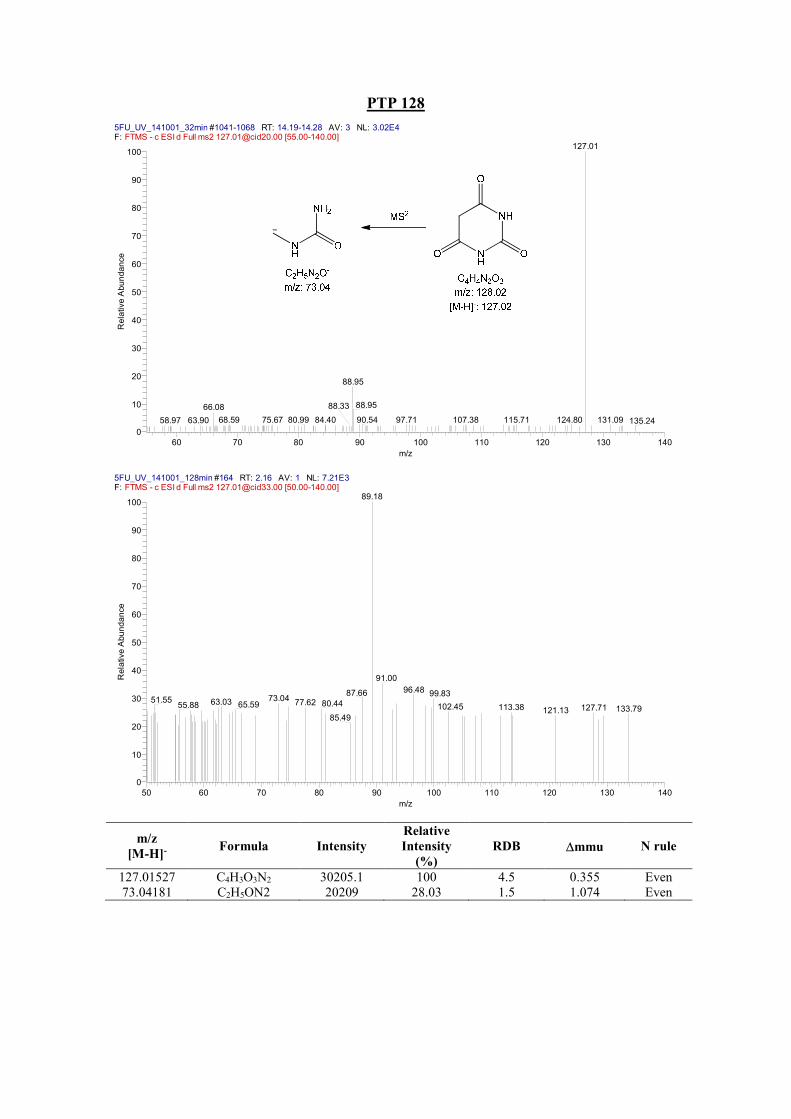
PTP 128
m/z
[M-H]- Formula Intensity
Relative
Intensity
(%)
RDB mmu N rule
127.01527 C4H3O3N2 30205.1 100 4.5 0.355 Even 73.04181 C2H5ON2 20209 28.03 1.5 1.074 Even
5FU_UV_141001_32min #1041-1068 RT: 14.19-14.28 AV: 3 NL: 3.02E4F: FTMS - c ESI d Full ms2 [email protected] [55.00-140.00]
60 70 80 90 100 110 120 130 140
m/z
0
10
20
30
40
50
60
70
80
90
100
Re
lative
Abu
nd
an
ce
127.01
88.95
88.9566.08
84.4075.67 131.0980.99 107.3868.59 124.8090.54 115.7197.7163.90
88.33
58.97 135.24
5FU_UV_141001_128min #164 RT: 2.16 AV: 1 NL: 7.21E3F: FTMS - c ESI d Full ms2 [email protected] [50.00-140.00]
50 60 70 80 90 100 110 120 130 140
m/z
0
10
20
30
40
50
60
70
80
90
100
Re
lative
Abu
nd
an
ce
89.18
91.00
96.4887.66 99.8373.0451.55 63.03 77.62 80.4465.5955.88 102.45 113.38 127.71 133.79121.13
85.49
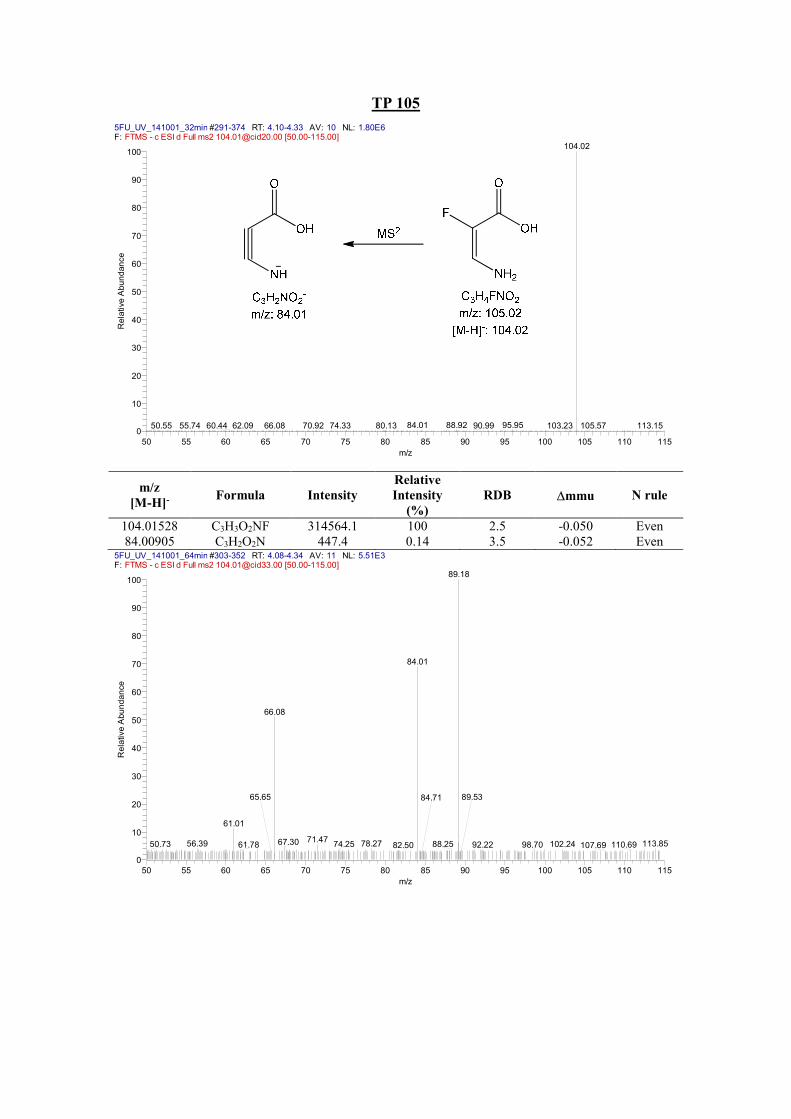
TP 105
m/z
[M-H]- Formula Intensity
Relative
Intensity
(%)
RDB mmu N rule
104.01528 C3H3O2NF 314564.1 100 2.5 -0.050 Even 84.00905 C3H2O2N 447.4 0.14 3.5 -0.052 Even
5FU_UV_141001_32min #291-374 RT: 4.10-4.33 AV: 10 NL: 1.80E6F: FTMS - c ESI d Full ms2 [email protected] [50.00-115.00]
50 55 60 65 70 75 80 85 90 95 100 105 110 115
m/z
0
10
20
30
40
50
60
70
80
90
100
Re
lative
Abu
nd
an
ce
104.02
88.92 95.9584.0166.08 113.1550.55 62.09 74.33 80.1370.9260.44 90.99 103.23 105.5755.74
5FU_UV_141001_64min #303-352 RT: 4.08-4.34 AV: 11 NL: 5.51E3F: FTMS - c ESI d Full ms2 [email protected] [50.00-115.00]
50 55 60 65 70 75 80 85 90 95 100 105 110 115
m/z
0
10
20
30
40
50
60
70
80
90
100
Re
lative
Abu
nd
an
ce
89.18
84.01
66.08
61.01
71.4767.30 113.8578.2756.39 74.2550.73 88.25 102.2461.78 92.22 98.70
65.65
110.69
89.53
82.50
84.71
107.69
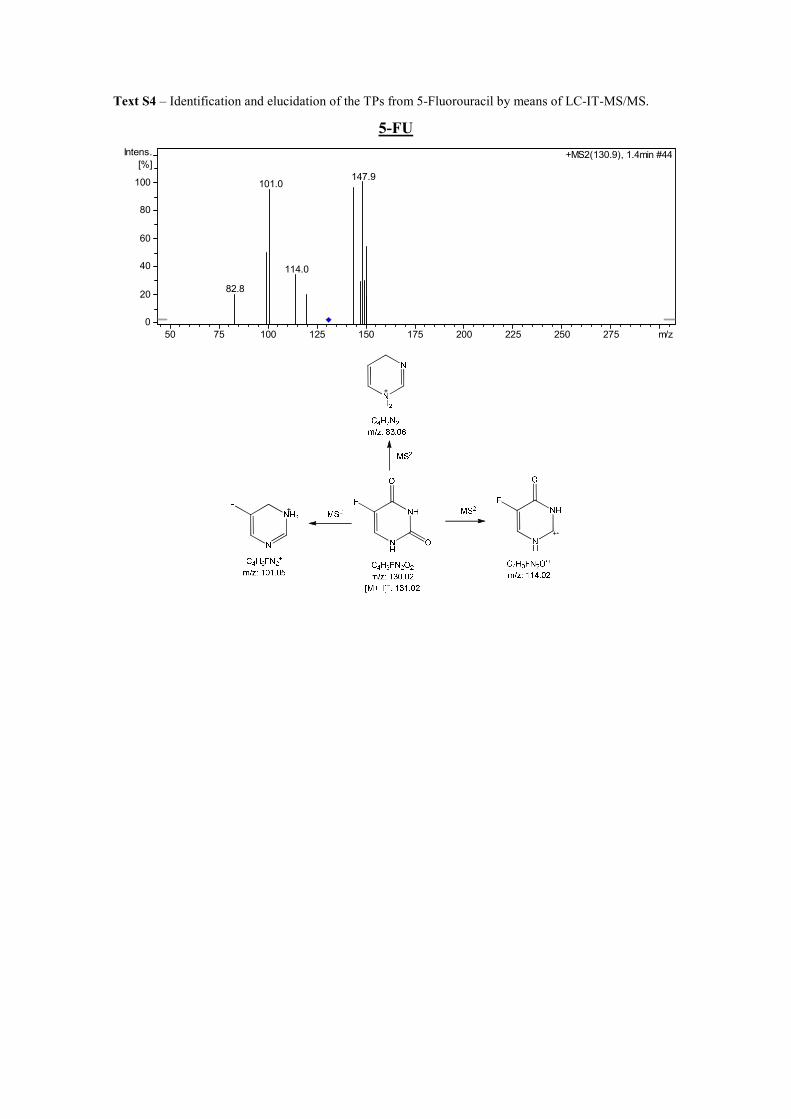
Text S4 – Identification and elucidation of the TPs from 5-Fluorouracil by means of LC-IT-MS/MS.
5-FU
82.8
101.0
114.0
147.9
+MS2(130.9), 1.4min #44
0
20
40
60
80
100
Intens.
[%]
50 75 100 125 150 175 200 225 250 275 m/z
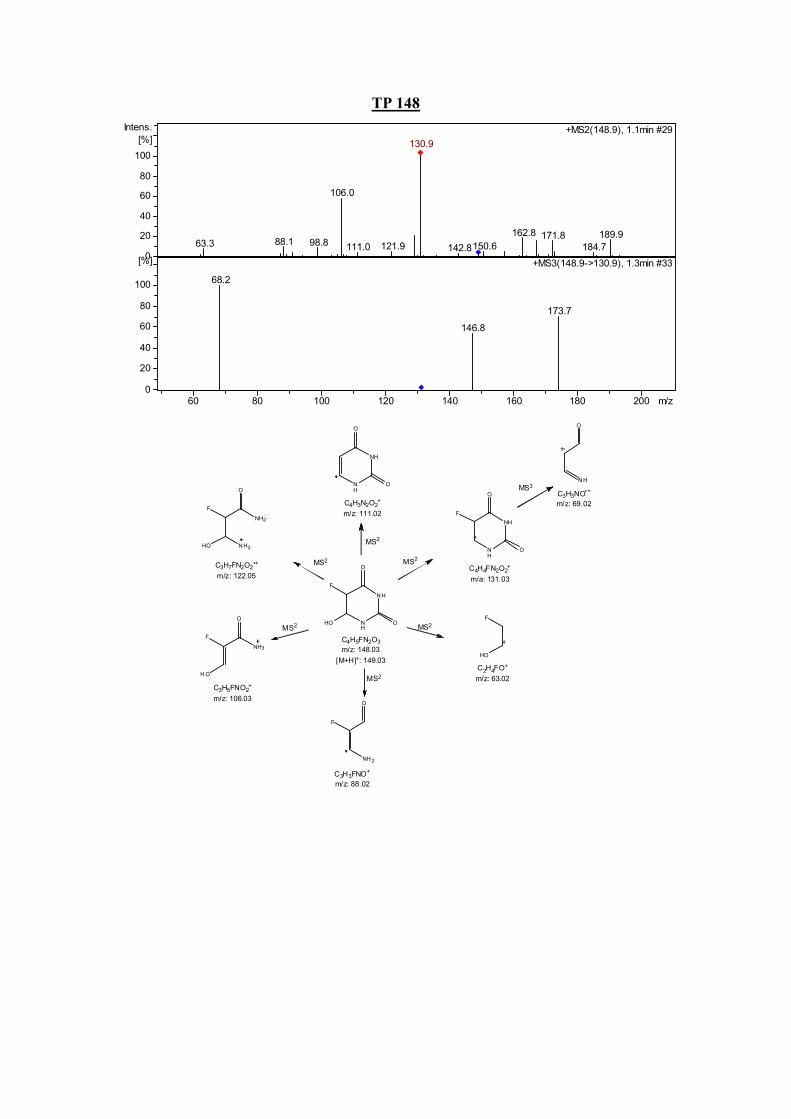
TP 148
NH
O
NH
O
F
HO
C4H5FN2O3
m/z: 148.03
[M+H]+: 149.03
NH
O
NH
O
NH2
NH2
O
F
HO
NH
O
NH
O
C4H3N2O2+
m/z: 111.02
O
F
H O
C3H5FNO2+
m/z: 106.03
NH 2
O
F
C3H7FN2O2•+
m/z: 122.05
NH3
C3H3NO•+
m/z: 69.02
F
HO
C2H4FO+
m/z: 63.02
NH
O
C3H3FNO+
m/z: 88.02
C4H4FN2O2+
m/a: 131.03
F
MS2
MS2
MS2
MS2
MS2
MS2
MS3
63.3 88.1 98.8
106.0
111.0 121.9 142.8150.6
162.8 171.8
184.7
189.9
130.9
+MS2(148.9), 1.1min #29
68.2
146.8
173.7
+MS3(148.9->130.9), 1.3min #330
20
40
60
80
100
Intens.
[%]
0
20
40
60
80
100
[%]
60 80 100 120 140 160 180 200 m/z
References
Friedrich, J., Längin, A., Kümmerer, K., 2013. Comparison of an Electrochemical and
Luminescence‐Based Oxygen Measuring System for Use in the Biodegradability
Testing According to Closed Bottle Test (OECD 301D). CLEAN – Soil, Air,
Water, 41, 251-257.
Mahmoud, W.M., Kümmerer, K., 2012. Captopril and its dimer captopril disulfide:
photodegradation, aerobic biodegradation and identification of transformation
products by HPLC-UV and LC-ion trap-MS(n). Chemosphere, 88, 1170-7.
OECD, 1992. Organisation for Economic Co-operation and Development. OECD
guideline for testing of chemicals 301D: ready biodegradability. Closed Bottle
test. OECD Publishing.
Trautwein, C., Kümmerer, K., Metzger, J.W., 2008. Aerobic biodegradability of the
calcium channel antagonist verapamil and identification of a microbial dead-end
transformation product studied by LC–MS/MS. Chemosphere, 72, 442-450.
Article IV
Degradation of 5-FU by means of advanced (photo)oxidation
processes: UV/H2O2, UV/Fe2+/H2O2 and UV/TiO2 – Comparison of
transformation products, ready biodegradability and toxicity.
Lutterbeck, C. A., Wilde M. L., Baginska, E., Leder C., Machado. Ê. L., Kümmerer, K. Science
of The Total Environment 2015b;527-528:232–45. doi: 10.1016/j.scitotenv.2015.04.111.

Degradation of 5-FU by means of advanced (photo)oxidation processes:UV/H2O2, UV/Fe
2+/H2O2 and UV/TiO2 — Comparison of transformationproducts, ready biodegradability and toxicity
Carlos Alexandre Lutterbeck a,b, Marcelo Luís Wilde a, Ewelina Baginska a, Christoph Leder a,Ênio Leandro Machado b, Klaus Kümmerer a,⁎
a Sustainable Chemistry and Material Resources, Institute of Sustainable and Environmental Chemistry, Faculty of Sustainability, Leuphana University of Lüneburg, Scharnhorststraße 1/C13,
DE-21335 Lüneburg, Germanyb Graduate Program in Environmental Technology, Universidade de Santa Cruz do Sul — UNISC, Av. Independência, 2293, CEP 96815-900 Santa Cruz do Sul, Rio Grande do Sul, Brazil
H I G H L I G H T S
• Full primary elimination of 5-FU was achieved in all the treatments.• None of the processes were able to fully mineralize 5-FU.• Six transformation products (TPs) were identified during the treatments.• Photolytic mixture was more biodegradable and non-toxic against V. fisheri.• Several of the formed TPs showed less mutagenic and genotoxic activities.
a b s t r a c ta r t i c l e i n f o
Article history:
Received 17 March 2015Received in revised form 28 April 2015Accepted 28 April 2015Available online 14 May 2015
Editor: D. Barcelo
Keywords:
5-FluorouracilAdvanced oxidation processBiodegradationToxicityTransformation product
The present study investigates the degradation of the antimetabolite 5-fluorouracil (5-FU) by three differentadvanced photo oxidation processes: UV/H2O2, UV/Fe
2+/H2O2 and UV/TiO2. Prescreening experiments varyingthe H2O2 and TiO2 concentrations were performed in order to set the best catalyst concentrations in the UV/H2O2 and UV/TiO2 experiments, whereas the UV/Fe2+/H2O2 process was optimized varying the pH, Fe2+ andH2O2 concentrations bymeans of the Box–Behnkendesign (BBD). 5-FUwas quickly removed in all the irradiationexperiments. The UV/Fe2+/H2O2 and UV/TiO2 processes achieved the highest degree of mineralization, whereasthe lowest one resulted from the UV/H2O2 treatment. Six transformation products were formed during the ad-vanced (photo)oxidation processes and identified using low and high resolution mass spectrometry. Most ofthem were formed and further eliminated during the reactions. The parent compound of 5-FU was notbiodegraded, whereas the photolytic mixture formed in the UV/H2O2 treatment after 256 min showed a notice-able improvement of the biodegradability in the closed bottle test (CBT) andwas nontoxic towards Vibrio fischeri.In silico predictions showed positive alerts for mutagenic and genotoxic effects of 5-FU. In contrast, several of thetransformation products (TPs) generated along the processes did not provide indications for mutagenic orgenotoxic activity. One exception was TP with m/z 146 with positive alerts in several models of bacterial muta-genicity which could demand further experimental testing. Results demonstrate that advanced treatment caneliminate parent compounds and its toxicity. However, transformation products formed can still be toxic. There-fore toxicity screening after advanced treatment is recommendable.
© 2015 Elsevier B.V. All rights reserved.
Science of the Total Environment 527–528 (2015) 232–245
Abbreviations:5-FU,5-fluorouracil;AI,acuteinhibition;ANOVA,analysisofvariance;AOP,advancedoxidationprocess;BBD,BoxBehnkendesign;BOD,biochemicaloxygendemand;CAP,capecitabine; CBT, closed bottle test; CI, chronic inhibition; COD, chemical oxygen demand; DOC, dissolved organic carbon;DOM, dissolved organicmatter; ESI, electrospray ionization; GI,growth inhibition; H2O2, hydrogen peroxide; HPLC, high performance liquid chromatography; LC–IT-MS/MS, liquid chromatography tandemmass spectrometry; LBT, luminescentbacteriatest;LC, liquidchromatography;mM,milli-molar;MS,massspectrometry;nm,nanometers;OECD,organizationforeconomicco-operationanddevelopment;HO•,hydroxylradicals;QSAR, quantitative structure activity relationship;ThOD, theoretical oxygendemand; TOC, total organic carbon;UV, ultraviolet; IT, ion trap;HRMS,high resolutionmass spectrometry; TiO2,titaniumdioxide; TOC, total organic carbon; TPs, transformation products; UHPLC, ultra high performance liquid chromatography.⁎ Corresponding author at: Nachhaltige Chemie und Stoffliche Ressourcen, Institut für Nachhaltige Chemie und Umweltchemie, Fakultät für Nachhaltigkeit, Leuphana Universität
Lüneburg, Scharnhorststraße 1/C13, D-21335 Lüneburg, Germany.E-mail addresses: [email protected] (C.A. Lutterbeck), [email protected] (M.L. Wilde), [email protected] (E. Baginska), [email protected] (C. Leder),
[email protected] (Ê.L. Machado), [email protected] (K. Kümmerer).
http://dx.doi.org/10.1016/j.scitotenv.2015.04.1110048-9697/© 2015 Elsevier B.V. All rights reserved.
Contents lists available at ScienceDirect
Science of the Total Environment
j ourna l homepage: www.e lsev ie r .com/ locate /sc i totenv
1. Introduction
Anticancer drugs are substances specially designed to act byinhibiting cell growth or directly killing cells (Besse et al., 2012;Mahnik et al., 2004; Kümmerer et al., 2014). Because of the non-selective mode of action, affecting both cancerous and healthy cells,anticancer drugs are reported as potentially carcinogenic, genotoxic,mu-tagenic and teratogenic compounds (Allwood et al., 2002; Kümmereret al., 2014). Although, in comparison to other groups of pharmaceu-ticals, the relatively low consumption rates and thus, relatively lowenvironmental concentrations, it is not possible to establish thresh-old values for lowest effective concentrations for some of these com-pounds (Kosjek and Heath, 2011; Kümmerer et al., 2014). Due totheir toxicological properties, some authors believe that anticancerdrugsmight inflict adverse effects on any growing eukaryotic organism,even at very low concentrations (Allwood et al., 2002; Besse et al., 2012;Johnson et al., 2008).
The antimetabolite 5-fluorouracil (5-FU) was introduced into thepharmaceutical market in the late 1950s and, globally, is the most com-monly consumed anticancer drug (Kosjek and Heath, 2011; Straub,2010). 5-FU is also the active substance in the prodrug capecitabine(CAP), which is rapidly metabolized and converted to the active com-pound (5-FU) in the human body (Deboever et al., 2013). It acts byblocking enzyme activity and disrupting DNA synthesis, and has beenwidely used in the treatment of solid tumors, such as colorectal andbreast cancers. Approximately 15% of the parent compound of 5-FU isexcreted unchanged (Zhang et al., 2013). 5-FU may therefore reach dif-ferent water compartments. Furthermore, it is a very polar compound,which is unlikely to be eliminated by sorption into sewage sludge andis not expected to bioaccumulate in aquatic organisms (Table S1)(Wang and Lin, 2014; Zhang et al., 2013). Contradictory results havebeen published regarding the biodegradation of 5-FU (Kümmerer andAl‐Ahmad, 1997; Straub, 2010). Thus, a general conclusion about its bio-degradability cannot be made.
Due to its low absorption at wavelengths above 290 nm, 5-FU(maximum of absorption is 265 nm in ultrapure water) is unlikely toundergo direct solar photolysis. Therefore, it is likely that 5-FU will befound in the water cycle. Accordingly, 5-FU has been detected in theaquatic environment at concentrations ranging from ng/L up to μg/L(Kovalova et al., 2009; Mahnik et al., 2007; Mahnik et al., 2004; Mullotet al., 2009; Weissbrodt et al., 2009).
Since the removal of 5-FU and other pharmaceuticals by convention-al wastewater treatment is often incomplete and inefficient (Wang andLin, 2014; Zhang et al., 2013), other alternatives need to be investigated.The so-called advanced oxidation processes (AOPs) may be suitablemethods, which may result in satisfactory elimination. Moreover, theyrepresent an interesting alternative, since they can be employed inassociation with biological treatments for wastewater remediation,as a pre-treatment, increasing the biodegradability through partialoxidation, or as a post-treatment for the degradation of persistent com-pounds (De la Cruz et al., 2012). However, a possible incompleteminer-alization can generate unwanted, and often unknown, transformationproducts (TPs) of unknown properties which can be recalcitrant andeven more toxic than the parent compound itself (Lutterbeck et al.,2015; Mahmoud et al., 2013; Rastogi et al., 2014). Therefore, the identi-fication of the main TPs generated in the processes is an importantissue. Furthermore, the degree of mineralization, the kinetics of forma-tion of TPs and their chemical structure may depend on the type oftreatment.
In thisway, the present study aims to (i) compare the efficiency of theelimination of 5-FU, as well as its degree of mineralization by meansof three different AOPs (UV/H2O2, UV/Fe
2+/H2O2 and UV/TiO2);(ii) identify and elucidate the structure of TPs formed during degrada-tion processes; (iii) evaluate the biodegradability of 5-FU and the mix-ture of its post-process TPs by standard OECD tests; (iv) assess thebacterial toxicity of 5-FU and its photo-TPs and (v) assess themutagenic
and genotoxic activities of 5-FU and the TPs formed in the advanced(photo)oxidation processes.
2. Materials and methods
Based on its mode of action 5-FU is a potentially mutagenic andteratogenic agent and thus, should be handled with care by taking theappropriate safety measures (Allwood et al., 2002; Eitel et al., 1999).All the waste generated during the experiments was treated and thendisposed as hazardous waste, and the instruments and glassware usedwere carefully cleaned before and after usage.
2.1. Chemicals
Stock solutions of 5-FU (5-fluoro-1H, 3H-pyrimidine-2,4-dione, CASNr: 51-21-8) were kindly provided and handled by the pharmacy of theHospital Lüneburg, Germany (therapeutic infusions bagswere preparedon demand). In order to avoid any scavenging effect of other chemicalspecies, and also to evaluate only the photo degradation of 5-FU, allthe solutions were prepared using ultrapure water (Q1:16.6 MΩ andQ2:18.2 MΩ Ultra Clear Water, Evoqua Water Technologies GmbH,Barsbüttel, Germany).
All solvents used were of HPLC grade, and all chemicals were of ana-lytical reagent grade or higher. Acetonitrile (HiPerSolv CHROMANORM,LC–MS grade, BDH Prolabo) and formic acid (analytical grade) were ac-quired from VWR International GmbH (Darmstadt, Germany). Sodiumhydroxide (NaOH 1 mol/L), sulfuric acid (H2SO4 2 mol/L, 98%) was pur-chased from Carl Roth GmbH & Co. KG (Karlsruhe, Germany). Titaniumdioxide (TiO2 P25) was purchased from Evonik Degussa GmbH (Frank-furt, Germany). Hydrogen peroxide (H2O2 30% w/w) was obtained fromMerck-Group (Darmstadt, Germany). Iron (II) sulfate heptahydrate(FeSO4⋅7H2O), catalase from bovine liver (2000–5000 units/mg protein),ammoniummetavanadate (NH4VO3), and 1,10-phenantroline (C12H8N2)were all acquired from Sigma-Aldrich Biochemie GmbH (Hamburg,Germany).
2.2. Setup of the advanced photo degradation experiments
The advanced (photo)oxidation experiments were carried out in an800 mL reactor, containing 600 mL of a 5-FU solution with an initialconcentration of 20 mg/L. The higher initial concentrations were usedto allow subsequent biodegradation experiments and enable the identi-fication of transformation products (TPs) that could be formed duringthe photo treatment, and finally to evaluate the possible effects onVibrio fischeri.
The irradiation source used was a mercury medium pressure lamp(TQ150, UV Consulting Peschl, Mainz) with an ilmasil quartz immer-sion tube (Fig. S1). An UV-pad Spectral Radiometer (Opsytec Dr.Gröbel GmbH, Ettlingen, Germany) was used to estimate the totalphoton flow rate of the polychromatic lamp (200–440 nm). The radi-ometer was positioned at a distance of 4 cm from the emission sourcein an aluminum box and the integration of the total photon flow rate ofthe lamp for each wavelength (200–440 nm) was estimated to be5.71 × 106 mol·photons/cm2·s1 (Fig. S2).
The reactor was placed on a magnetic stirrer to maintain the ho-mogeneity of the solution, and the temperature was kept constantat 20 ± 1 °C by using a cooling system (WKL230, LAUDA, Berlin).The experiments were carried out for 256 min and samples (approx.20 mL) were withdrawn according to a determinate time schedule(2, 4, 8, 16, 32, 64, 128 and 256 min) for further analysis.
The kinetic rates of the three advanced photo treatments wereassessed through nonlinear regression models using the softwarePrism 5 (Graphpad Inc., CA, USA). Exponential decay models with thefunctions “one phase decay” and “two phase decay”were used to calcu-late the rate constants and half-lives of the reactions, and to take into ac-count possible first order or second order kinetics. A more detailed
233C.A. Lutterbeck et al. / Science of the Total Environment 527–528 (2015) 232–245
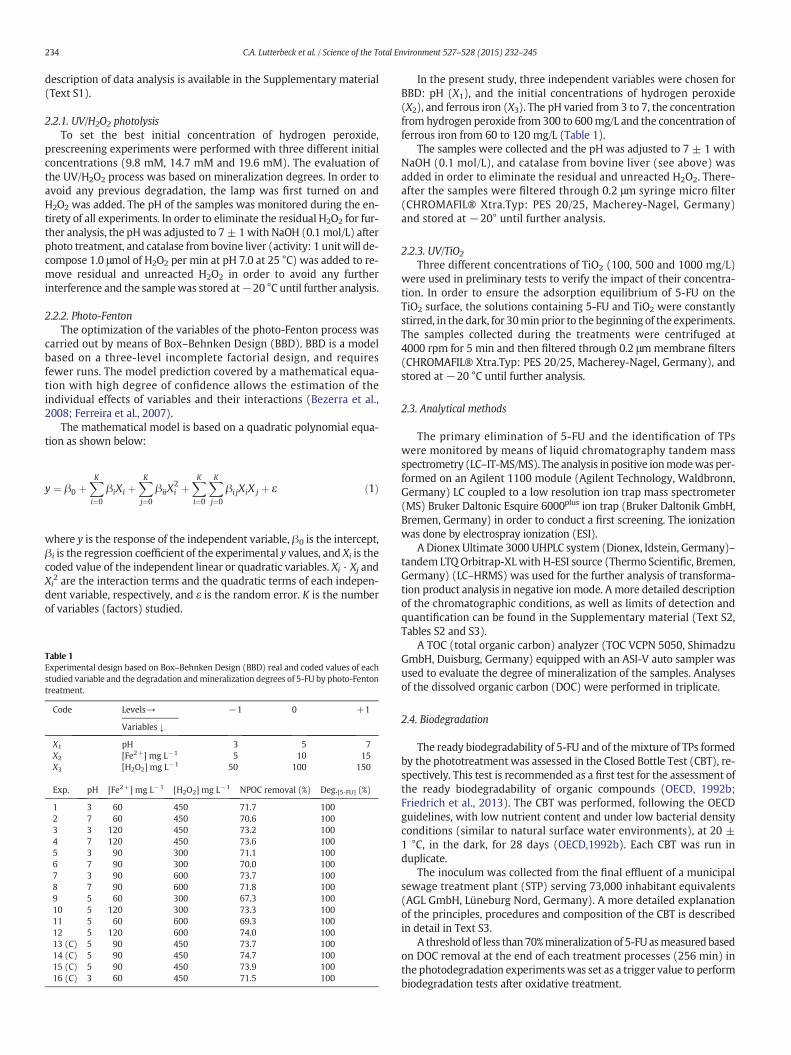
description of data analysis is available in the Supplementary material(Text S1).
2.2.1. UV/H2O2 photolysis
To set the best initial concentration of hydrogen peroxide,prescreening experiments were performed with three different initialconcentrations (9.8 mM, 14.7 mM and 19.6 mM). The evaluation ofthe UV/H2O2 process was based on mineralization degrees. In order toavoid any previous degradation, the lamp was first turned on andH2O2 was added. The pH of the samples was monitored during the en-tirety of all experiments. In order to eliminate the residual H2O2 for fur-ther analysis, the pHwas adjusted to 7± 1with NaOH (0.1 mol/L) afterphoto treatment, and catalase from bovine liver (activity: 1 unit will de-compose 1.0 μmol of H2O2 per min at pH 7.0 at 25 °C) was added to re-move residual and unreacted H2O2 in order to avoid any furtherinterference and the samplewas stored at−20 °C until further analysis.
2.2.2. Photo-Fenton
The optimization of the variables of the photo-Fenton process wascarried out by means of Box–Behnken Design (BBD). BBD is a modelbased on a three-level incomplete factorial design, and requiresfewer runs. The model prediction covered by a mathematical equa-tion with high degree of confidence allows the estimation of theindividual effects of variables and their interactions (Bezerra et al.,2008; Ferreira et al., 2007).
The mathematical model is based on a quadratic polynomial equa-tion as shown below:
y ¼ β0 þXK
i¼0
βiXi þXK
j¼0
βiiX2i þ
XK
i¼0
XK
j¼0
βi jXiX j þ ε ð1Þ
where y is the response of the independent variable, β0 is the intercept,βi is the regression coefficient of the experimental y values, and Xi is thecoded value of the independent linear or quadratic variables. Xi · Xj andXi
2 are the interaction terms and the quadratic terms of each indepen-dent variable, respectively, and ε is the random error. K is the numberof variables (factors) studied.
In the present study, three independent variables were chosen forBBD: pH (X1), and the initial concentrations of hydrogen peroxide(X2), and ferrous iron (X3). The pH varied from 3 to 7, the concentrationfrom hydrogen peroxide from 300 to 600mg/L and the concentration offerrous iron from 60 to 120 mg/L (Table 1).
The samples were collected and the pH was adjusted to 7 ± 1 withNaOH (0.1 mol/L), and catalase from bovine liver (see above) wasadded in order to eliminate the residual and unreacted H2O2. There-after the samples were filtered through 0.2 μm syringe micro filter(CHROMAFIL® Xtra.Typ: PES 20/25, Macherey-Nagel, Germany)and stored at −20° until further analysis.
2.2.3. UV/TiO2
Three different concentrations of TiO2 (100, 500 and 1000 mg/L)were used in preliminary tests to verify the impact of their concentra-tion. In order to ensure the adsorption equilibrium of 5-FU on theTiO2 surface, the solutions containing 5-FU and TiO2 were constantlystirred, in the dark, for 30min prior to the beginning of the experiments.The samples collected during the treatments were centrifuged at4000 rpm for 5 min and then filtered through 0.2 μm membrane filters(CHROMAFIL® Xtra.Typ: PES 20/25, Macherey-Nagel, Germany), andstored at−20 °C until further analysis.
2.3. Analytical methods
The primary elimination of 5-FU and the identification of TPswere monitored by means of liquid chromatography tandem massspectrometry (LC–IT-MS/MS). The analysis in positive ionmodewas per-formed on an Agilent 1100 module (Agilent Technology, Waldbronn,Germany) LC coupled to a low resolution ion trap mass spectrometer(MS) Bruker Daltonic Esquire 6000plus ion trap (Bruker Daltonik GmbH,Bremen, Germany) in order to conduct a first screening. The ionizationwas done by electrospray ionization (ESI).
A Dionex Ultimate 3000 UHPLC system (Dionex, Idstein, Germany)–tandem LTQ Orbitrap-XLwith H-ESI source (Thermo Scientific, Bremen,Germany) (LC–HRMS) was used for the further analysis of transforma-tion product analysis in negative ion mode. A more detailed descriptionof the chromatographic conditions, as well as limits of detection andquantification can be found in the Supplementary material (Text S2,Tables S2 and S3).
A TOC (total organic carbon) analyzer (TOC VCPN 5050, ShimadzuGmbH, Duisburg, Germany) equipped with an ASI-V auto sampler wasused to evaluate the degree of mineralization of the samples. Analysesof the dissolved organic carbon (DOC) were performed in triplicate.
2.4. Biodegradation
The ready biodegradability of 5-FU and of the mixture of TPs formedby the phototreatment was assessed in the Closed Bottle Test (CBT), re-spectively. This test is recommended as a first test for the assessment ofthe ready biodegradability of organic compounds (OECD, 1992b;Friedrich et al., 2013). The CBT was performed, following the OECDguidelines, with low nutrient content and under low bacterial densityconditions (similar to natural surface water environments), at 20 ±1 °C, in the dark, for 28 days (OECD,1992b). Each CBT was run induplicate.
The inoculum was collected from the final effluent of a municipalsewage treatment plant (STP) serving 73,000 inhabitant equivalents(AGL GmbH, Lüneburg Nord, Germany). A more detailed explanationof the principles, procedures and composition of the CBT is describedin detail in Text S3.
A threshold of less than 70%mineralization of 5-FU asmeasured basedon DOC removal at the end of each treatment processes (256 min) inthe photodegradation experimentswas set as a trigger value to performbiodegradation tests after oxidative treatment.
Table 1
Experimental design based on Box–Behnken Design (BBD) real and coded values of eachstudied variable and the degradation andmineralization degrees of 5-FU by photo-Fentontreatment.
Code Levels→ −1 0 +1
Variables ↓
X1 pH 3 5 7X2 [Fe2+] mg L−1 5 10 15X3 [H2O2] mg L−1 50 100 150
Exp. pH [Fe2+] mg L−1 [H2O2] mg L−1 NPOC removal (%) Deg.[5-FU] (%)
1 3 60 450 71.7 1002 7 60 450 70.6 1003 3 120 450 73.2 1004 7 120 450 73.6 1005 3 90 300 71.1 1006 7 90 300 70.0 1007 3 90 600 73.7 1008 7 90 600 71.8 1009 5 60 300 67.3 10010 5 120 300 73.3 10011 5 60 600 69.3 10012 5 120 600 74.0 10013 (C) 5 90 450 73.7 10014 (C) 5 90 450 74.7 10015 (C) 5 90 450 73.9 10016 (C) 3 60 450 71.5 100
234 C.A. Lutterbeck et al. / Science of the Total Environment 527–528 (2015) 232–245
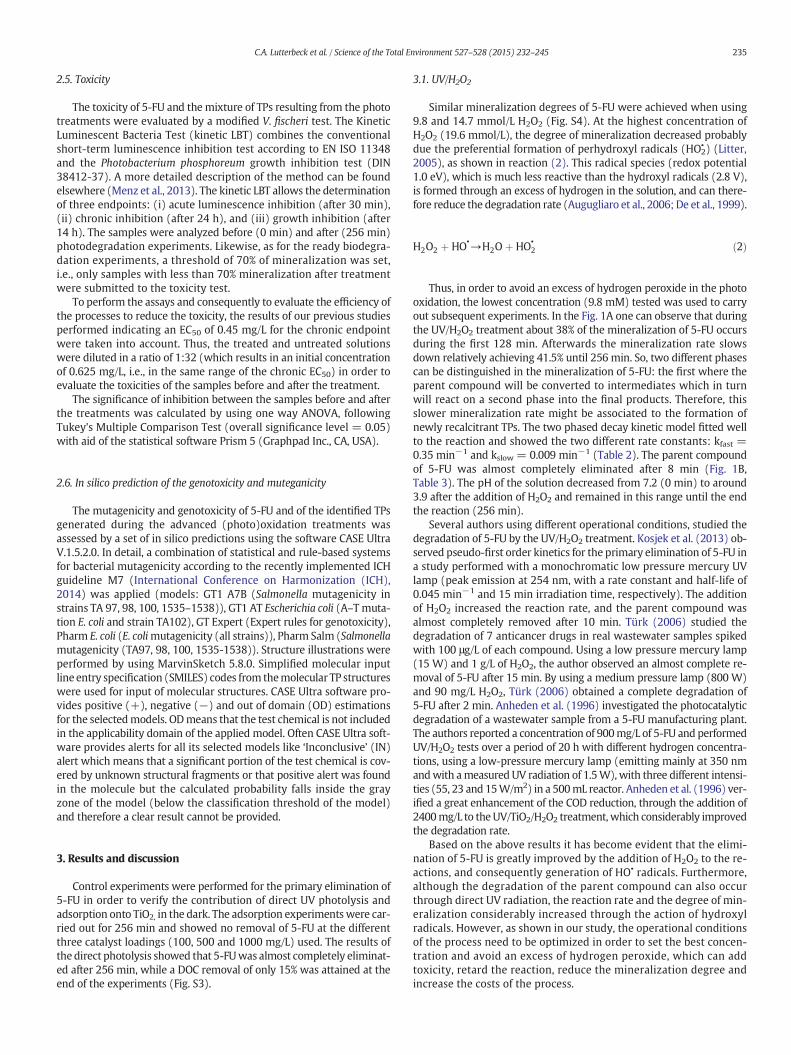
2.5. Toxicity
The toxicity of 5-FU and the mixture of TPs resulting from the phototreatments were evaluated by a modified V. fischeri test. The KineticLuminescent Bacteria Test (kinetic LBT) combines the conventionalshort-term luminescence inhibition test according to EN ISO 11348and the Photobacterium phosphoreum growth inhibition test (DIN38412-37). A more detailed description of the method can be foundelsewhere (Menz et al., 2013). The kinetic LBT allows the determinationof three endpoints: (i) acute luminescence inhibition (after 30 min),(ii) chronic inhibition (after 24 h), and (iii) growth inhibition (after14 h). The samples were analyzed before (0 min) and after (256 min)photodegradation experiments. Likewise, as for the ready biodegra-dation experiments, a threshold of 70% of mineralization was set,i.e., only samples with less than 70% mineralization after treatmentwere submitted to the toxicity test.
To perform the assays and consequently to evaluate the efficiency ofthe processes to reduce the toxicity, the results of our previous studiesperformed indicating an EC50 of 0.45 mg/L for the chronic endpointwere taken into account. Thus, the treated and untreated solutionswere diluted in a ratio of 1:32 (which results in an initial concentrationof 0.625 mg/L, i.e., in the same range of the chronic EC50) in order toevaluate the toxicities of the samples before and after the treatment.
The significance of inhibition between the samples before and afterthe treatments was calculated by using one way ANOVA, followingTukey's Multiple Comparison Test (overall significance level = 0.05)with aid of the statistical software Prism 5 (Graphpad Inc., CA, USA).
2.6. In silico prediction of the genotoxicity and muteganicity
The mutagenicity and genotoxicity of 5-FU and of the identified TPsgenerated during the advanced (photo)oxidation treatments wasassessed by a set of in silico predictions using the software CASE UltraV.1.5.2.0. In detail, a combination of statistical and rule-based systemsfor bacterial mutagenicity according to the recently implemented ICHguideline M7 (International Conference on Harmonization (ICH),2014) was applied (models: GT1 A7B (Salmonella mutagenicity instrains TA 97, 98, 100, 1535–1538)), GT1 AT Escherichia coli (A–T muta-tion E. coli and strain TA102), GT Expert (Expert rules for genotoxicity),Pharm E. coli (E. colimutagenicity (all strains)), Pharm Salm (Salmonella
mutagenicity (TA97, 98, 100, 1535-1538)). Structure illustrations wereperformed by using MarvinSketch 5.8.0. Simplified molecular inputline entry specification (SMILES) codes from themolecular TP structureswere used for input of molecular structures. CASE Ultra software pro-vides positive (+), negative (−) and out of domain (OD) estimationsfor the selectedmodels. ODmeans that the test chemical is not includedin the applicability domain of the applied model. Often CASE Ultra soft-ware provides alerts for all its selected models like ‘Inconclusive’ (IN)alert which means that a significant portion of the test chemical is cov-ered by unknown structural fragments or that positive alert was foundin the molecule but the calculated probability falls inside the grayzone of the model (below the classification threshold of the model)and therefore a clear result cannot be provided.
3. Results and discussion
Control experiments were performed for the primary elimination of5-FU in order to verify the contribution of direct UV photolysis andadsorption onto TiO2, in the dark. The adsorption experimentswere car-ried out for 256 min and showed no removal of 5-FU at the differentthree catalyst loadings (100, 500 and 1000 mg/L) used. The results ofthe direct photolysis showed that 5-FUwas almost completely eliminat-ed after 256 min, while a DOC removal of only 15% was attained at theend of the experiments (Fig. S3).
3.1. UV/H2O2
Similar mineralization degrees of 5-FU were achieved when using9.8 and 14.7 mmol/L H2O2 (Fig. S4). At the highest concentration ofH2O2 (19.6 mmol/L), the degree of mineralization decreased probablydue the preferential formation of perhydroxyl radicals (HO2
• ) (Litter,2005), as shown in reaction (2). This radical species (redox potential1.0 eV), which is much less reactive than the hydroxyl radicals (2.8 V),is formed through an excess of hydrogen in the solution, and can there-fore reduce the degradation rate (Augugliaro et al., 2006; De et al., 1999).
H2O2 þ HO•→H2O þ HO•
2 ð2Þ
Thus, in order to avoid an excess of hydrogen peroxide in the photooxidation, the lowest concentration (9.8 mM) tested was used to carryout subsequent experiments. In the Fig. 1A one can observe that duringthe UV/H2O2 treatment about 38% of the mineralization of 5-FU occursduring the first 128 min. Afterwards the mineralization rate slowsdown relatively achieving 41.5% until 256 min. So, two different phasescan be distinguished in the mineralization of 5-FU: the first where theparent compound will be converted to intermediates which in turnwill react on a second phase into the final products. Therefore, thisslower mineralization rate might be associated to the formation ofnewly recalcitrant TPs. The two phased decay kinetic model fitted wellto the reaction and showed the two different rate constants: kfast =0.35 min−1 and kslow = 0.009 min−1 (Table 2). The parent compoundof 5-FU was almost completely eliminated after 8 min (Fig. 1B,Table 3). The pH of the solution decreased from 7.2 (0 min) to around3.9 after the addition of H2O2 and remained in this range until the endthe reaction (256 min).
Several authors using different operational conditions, studied thedegradation of 5-FU by the UV/H2O2 treatment. Kosjek et al. (2013) ob-served pseudo-first order kinetics for the primary elimination of 5-FU ina study performed with a monochromatic low pressure mercury UVlamp (peak emission at 254 nm, with a rate constant and half-life of0.045 min−1 and 15 min irradiation time, respectively). The additionof H2O2 increased the reaction rate, and the parent compound wasalmost completely removed after 10 min. Türk (2006) studied thedegradation of 7 anticancer drugs in real wastewater samples spikedwith 100 μg/L of each compound. Using a low pressure mercury lamp(15 W) and 1 g/L of H2O2, the author observed an almost complete re-moval of 5-FU after 15 min. By using a medium pressure lamp (800 W)and 90 mg/L H2O2, Türk (2006) obtained a complete degradation of5-FU after 2 min. Anheden et al. (1996) investigated the photocatalyticdegradation of a wastewater sample from a 5-FU manufacturing plant.The authors reported a concentration of 900mg/L of 5-FU and performedUV/H2O2 tests over a period of 20 h with different hydrogen concentra-tions, using a low-pressure mercury lamp (emitting mainly at 350 nmandwith ameasured UV radiation of 1.5W), with three different intensi-ties (55, 23 and 15W/m2) in a 500mL reactor. Anheden et al. (1996) ver-ified a great enhancement of the COD reduction, through the addition of2400mg/L to the UV/TiO2/H2O2 treatment, which considerably improvedthe degradation rate.
Based on the above results it has become evident that the elimi-nation of 5-FU is greatly improved by the addition of H2O2 to the re-actions, and consequently generation of HO• radicals. Furthermore,although the degradation of the parent compound can also occurthrough direct UV radiation, the reaction rate and the degree of min-eralization considerably increased through the action of hydroxylradicals. However, as shown in our study, the operational conditionsof the process need to be optimized in order to set the best concen-tration and avoid an excess of hydrogen peroxide, which can addtoxicity, retard the reaction, reduce the mineralization degree andincrease the costs of the process.
235C.A. Lutterbeck et al. / Science of the Total Environment 527–528 (2015) 232–245
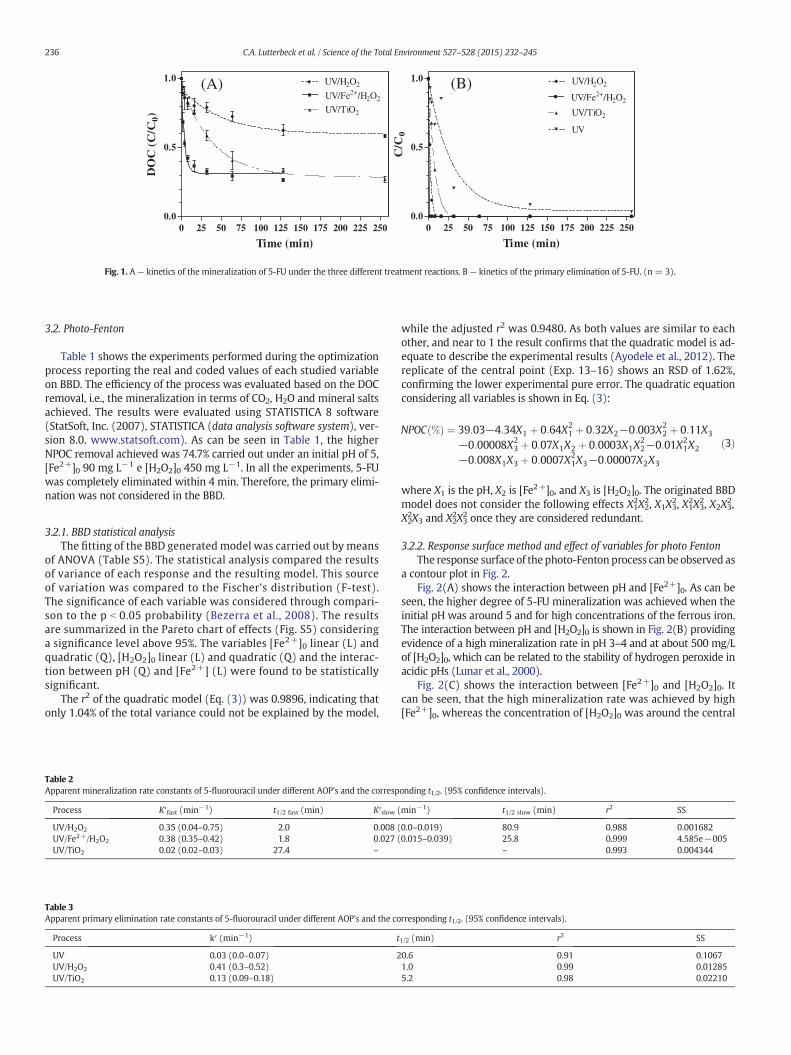
3.2. Photo-Fenton
Table 1 shows the experiments performed during the optimizationprocess reporting the real and coded values of each studied variableon BBD. The efficiency of the process was evaluated based on the DOCremoval, i.e., the mineralization in terms of CO2, H2O and mineral saltsachieved. The results were evaluated using STATISTICA 8 software(StatSoft, Inc. (2007), STATISTICA (data analysis software system), ver-sion 8.0. www.statsoft.com). As can be seen in Table 1, the higherNPOC removal achieved was 74.7% carried out under an initial pH of 5,[Fe2+]0 90 mg L−1 e [H2O2]0 450 mg L−1. In all the experiments, 5-FUwas completely eliminated within 4 min. Therefore, the primary elimi-nation was not considered in the BBD.
3.2.1. BBD statistical analysis
The fitting of the BBD generated model was carried out by meansof ANOVA (Table S5). The statistical analysis compared the resultsof variance of each response and the resulting model. This sourceof variation was compared to the Fischer's distribution (F-test).The significance of each variable was considered through compari-son to the p b 0.05 probability (Bezerra et al., 2008). The resultsare summarized in the Pareto chart of effects (Fig. S5) consideringa significance level above 95%. The variables [Fe2+]0 linear (L) andquadratic (Q), [H2O2]0 linear (L) and quadratic (Q) and the interac-tion between pH (Q) and [Fe2+] (L) were found to be statisticallysignificant.
The r2 of the quadratic model (Eq. (3)) was 0.9896, indicating thatonly 1.04% of the total variance could not be explained by the model,
while the adjusted r2 was 0.9480. As both values are similar to eachother, and near to 1 the result confirms that the quadratic model is ad-equate to describe the experimental results (Ayodele et al., 2012). Thereplicate of the central point (Exp. 13–16) shows an RSD of 1.62%,confirming the lower experimental pure error. The quadratic equationconsidering all variables is shown in Eq. (3):
NPOC %ð Þ ¼ 39:03−4:34X1 þ 0:64X21 þ 0:32X2−0:003X2
2 þ 0:11X3
−0:00008X23 þ 0:07X1X2 þ 0:0003X1X
22−0:01X2
1X2
−0:008X1X3 þ 0:0007X21X3−0:00007X2X3
ð3Þ
where X1 is the pH, X2 is [Fe2+]0, and X3 is [H2O2]0. The originated BBD
model does not consider the following effects X12X2
2, X1X32, X1
2X32, X2X3
2,X22X3 and X2
2X32 once they are considered redundant.
3.2.2. Response surface method and effect of variables for photo Fenton
The response surface of thephoto-Fenton process can be observed asa contour plot in Fig. 2.
Fig. 2(A) shows the interaction between pH and [Fe2+]0. As can beseen, the higher degree of 5-FU mineralization was achieved when theinitial pH was around 5 and for high concentrations of the ferrous iron.The interaction between pH and [H2O2]0 is shown in Fig. 2(B) providingevidence of a high mineralization rate in pH 3–4 and at about 500 mg/Lof [H2O2]0, which can be related to the stability of hydrogen peroxide inacidic pHs (Lunar et al., 2000).
Fig. 2(C) shows the interaction between [Fe2+]0 and [H2O2]0. Itcan be seen, that the high mineralization rate was achieved by high[Fe2+]0, whereas the concentration of [H2O2]0 was around the central
0 25 50 75 100 125 150 175 200 225 250
0.0
0.5
1.0 UV/H2O2
UV/Fe2+/H2O2
UV/TiO2
Time (min)
DO
C (
C/C
0)
0 25 50 75 100 125 150 175 200 225 250
0.0
0.5
1.0 UV/H2O2
UV/Fe2+/H2O2
UV/TiO2
UV
Time (min)
C/C
0
(A) (B)
Fig. 1. A — kinetics of the mineralization of 5-FU under the three different treatment reactions. B — kinetics of the primary elimination of 5-FU. (n = 3).
Table 2
Apparent mineralization rate constants of 5-fluorouracil under different AOP's and the corresponding t1/2. (95% confidence intervals).
Process K′fast (min−1) t1/2 fast (min) K′slow (min−1) t1/2 slow (min) r2 SS
UV/H2O2 0.35 (0.04–0.75) 2.0 0.008 (0.0–0.019) 80.9 0.988 0.001682UV/Fe2+/H2O2 0.38 (0.35–0.42) 1.8 0.027 (0.015–0.039) 25.8 0.999 4.585e−005UV/TiO2 0.02 (0.02–0.03) 27.4 – – 0.993 0.004344
Table 3
Apparent primary elimination rate constants of 5-fluorouracil under different AOP's and the corresponding t1/2. (95% confidence intervals).
Process k′ (min−1) t1/2 (min) r2 SS
UV 0.03 (0.0–0.07) 20.6 0.91 0.1067UV/H2O2 0.41 (0.3–0.52) 1.0 0.99 0.01285UV/TiO2 0.13 (0.09–0.18) 5.2 0.98 0.02210
236 C.A. Lutterbeck et al. / Science of the Total Environment 527–528 (2015) 232–245
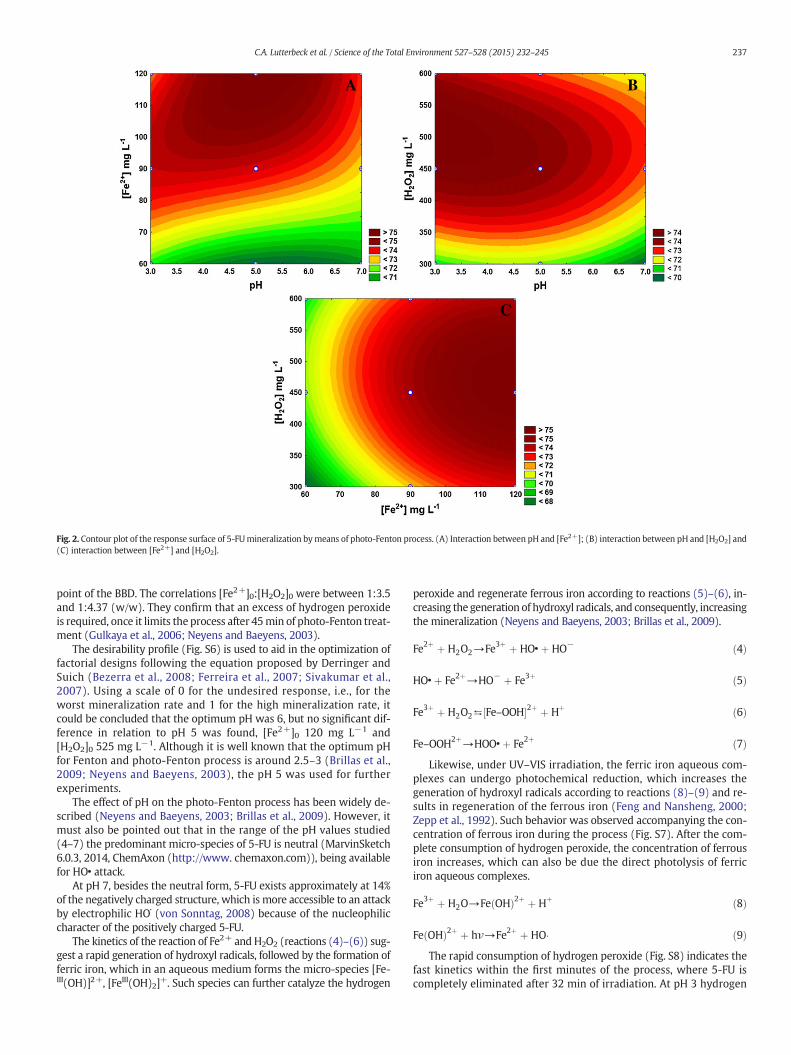
point of the BBD. The correlations [Fe2+]0:[H2O2]0 were between 1:3.5and 1:4.37 (w/w). They confirm that an excess of hydrogen peroxideis required, once it limits the process after 45min of photo-Fenton treat-ment (Gulkaya et al., 2006; Neyens and Baeyens, 2003).
The desirability profile (Fig. S6) is used to aid in the optimization offactorial designs following the equation proposed by Derringer andSuich (Bezerra et al., 2008; Ferreira et al., 2007; Sivakumar et al.,2007). Using a scale of 0 for the undesired response, i.e., for theworst mineralization rate and 1 for the high mineralization rate, itcould be concluded that the optimum pH was 6, but no significant dif-ference in relation to pH 5 was found, [Fe2+]0 120 mg L−1 and[H2O2]0 525 mg L−1. Although it is well known that the optimum pHfor Fenton and photo-Fenton process is around 2.5–3 (Brillas et al.,2009; Neyens and Baeyens, 2003), the pH 5 was used for furtherexperiments.
The effect of pH on the photo-Fenton process has been widely de-scribed (Neyens and Baeyens, 2003; Brillas et al., 2009). However, itmust also be pointed out that in the range of the pH values studied(4–7) the predominant micro-species of 5-FU is neutral (MarvinSketch6.0.3, 2014, ChemAxon (http://www. chemaxon.com)), being availablefor HO• attack.
At pH 7, besides the neutral form, 5-FU exists approximately at 14%of the negatively charged structure, which is more accessible to an attackby electrophilic HO˙ (von Sonntag, 2008) because of the nucleophiliccharacter of the positively charged 5-FU.
The kinetics of the reaction of Fe2+ and H2O2 (reactions (4)–(6)) sug-gest a rapid generation of hydroxyl radicals, followed by the formation offerric iron, which in an aqueous medium forms the micro-species [Fe-III(OH)]2+, [FeIII(OH)2]
+. Such species can further catalyze the hydrogen
peroxide and regenerate ferrous iron according to reactions (5)–(6), in-creasing the generation of hydroxyl radicals, and consequently, increasingthe mineralization (Neyens and Baeyens, 2003; Brillas et al., 2009).
Fe2þ þ H2O2→Fe3þ þ HO• þ HO−ð4Þ
HO• þ Fe2þ→HO−þ Fe3þ ð5Þ
Fe3þ þ H2O2⇆½Fe–OOH�2þ þ Hþð6Þ
Fe–OOH2þ→HOO• þ Fe2þ ð7Þ
Likewise, under UV–VIS irradiation, the ferric iron aqueous com-plexes can undergo photochemical reduction, which increases thegeneration of hydroxyl radicals according to reactions (8)–(9) and re-sults in regeneration of the ferrous iron (Feng and Nansheng, 2000;Zepp et al., 1992). Such behavior was observed accompanying the con-centration of ferrous iron during the process (Fig. S7). After the com-plete consumption of hydrogen peroxide, the concentration of ferrousiron increases, which can also be due the direct photolysis of ferriciron aqueous complexes.
Fe3þ þ H2O→FeðOHÞ2þ þ Hþð8Þ
FeðOHÞ2þ þ hν→Fe2þ þ HO� ð9Þ
The rapid consumption of hydrogen peroxide (Fig. S8) indicates thefast kinetics within the first minutes of the process, where 5-FU iscompletely eliminated after 32 min of irradiation. At pH 3 hydrogen
A B
C
Fig. 2. Contour plot of the response surface of 5-FUmineralization bymeans of photo-Fenton process. (A) Interaction between pH and [Fe2+]; (B) interaction between pH and [H2O2] and(C) interaction between [Fe2+] and [H2O2].
237C.A. Lutterbeck et al. / Science of the Total Environment 527–528 (2015) 232–245
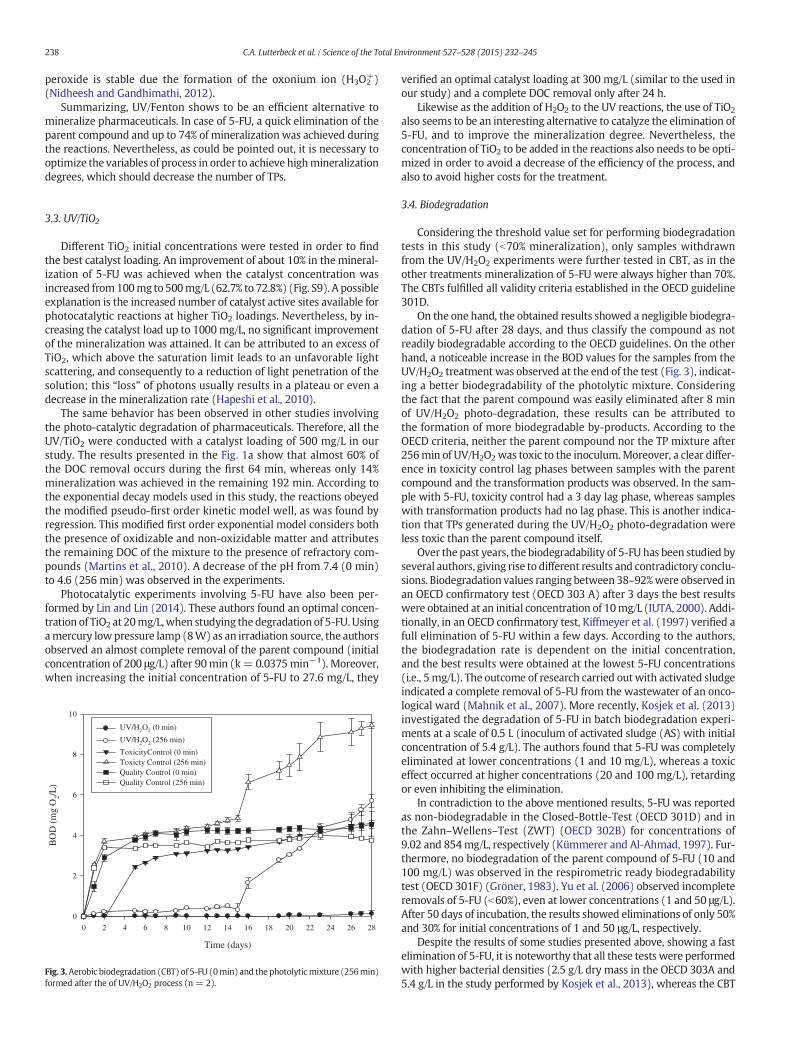
peroxide is stable due the formation of the oxonium ion (H3O2+)
(Nidheesh and Gandhimathi, 2012).Summarizing, UV/Fenton shows to be an efficient alternative to
mineralize pharmaceuticals. In case of 5-FU, a quick elimination of theparent compound and up to 74% of mineralization was achieved duringthe reactions. Nevertheless, as could be pointed out, it is necessary tooptimize the variables of process in order to achieve highmineralizationdegrees, which should decrease the number of TPs.
3.3. UV/TiO2
Different TiO2 initial concentrations were tested in order to findthe best catalyst loading. An improvement of about 10% in the mineral-ization of 5-FU was achieved when the catalyst concentration wasincreased from100mg to 500mg/L (62.7% to 72.8%) (Fig. S9). A possibleexplanation is the increased number of catalyst active sites available forphotocatalytic reactions at higher TiO2 loadings. Nevertheless, by in-creasing the catalyst load up to 1000mg/L, no significant improvementof the mineralization was attained. It can be attributed to an excess ofTiO2, which above the saturation limit leads to an unfavorable lightscattering, and consequently to a reduction of light penetration of thesolution; this “loss” of photons usually results in a plateau or even adecrease in the mineralization rate (Hapeshi et al., 2010).
The same behavior has been observed in other studies involvingthe photo-catalytic degradation of pharmaceuticals. Therefore, all theUV/TiO2 were conducted with a catalyst loading of 500 mg/L in ourstudy. The results presented in the Fig. 1a show that almost 60% ofthe DOC removal occurs during the first 64 min, whereas only 14%mineralization was achieved in the remaining 192 min. According tothe exponential decay models used in this study, the reactions obeyedthe modified pseudo-first order kinetic model well, as was found byregression. This modified first order exponential model considers boththe presence of oxidizable and non-oxizidable matter and attributesthe remaining DOC of the mixture to the presence of refractory com-pounds (Martins et al., 2010). A decrease of the pH from 7.4 (0 min)to 4.6 (256 min) was observed in the experiments.
Photocatalytic experiments involving 5-FU have also been per-formed by Lin and Lin (2014). These authors found an optimal concen-tration of TiO2 at 20mg/L,when studying the degradation of 5-FU. Usingamercury lowpressure lamp (8W) as an irradiation source, the authorsobserved an almost complete removal of the parent compound (initialconcentration of 200 μg/L) after 90min (k= 0.0375min−1). Moreover,when increasing the initial concentration of 5-FU to 27.6 mg/L, they
verified an optimal catalyst loading at 300 mg/L (similar to the used inour study) and a complete DOC removal only after 24 h.
Likewise as the addition of H2O2 to the UV reactions, the use of TiO2
also seems to be an interesting alternative to catalyze the elimination of5-FU, and to improve the mineralization degree. Nevertheless, theconcentration of TiO2 to be added in the reactions also needs to be opti-mized in order to avoid a decrease of the efficiency of the process, andalso to avoid higher costs for the treatment.
3.4. Biodegradation
Considering the threshold value set for performing biodegradationtests in this study (b70% mineralization), only samples withdrawnfrom the UV/H2O2 experiments were further tested in CBT, as in theother treatments mineralization of 5-FU were always higher than 70%.The CBTs fulfilled all validity criteria established in the OECD guideline301D.
On the one hand, the obtained results showed a negligible biodegra-dation of 5-FU after 28 days, and thus classify the compound as notreadily biodegradable according to the OECD guidelines. On the otherhand, a noticeable increase in the BOD values for the samples from theUV/H2O2 treatment was observed at the end of the test (Fig. 3), indicat-ing a better biodegradability of the photolytic mixture. Consideringthe fact that the parent compound was easily eliminated after 8 minof UV/H2O2 photo-degradation, these results can be attributed tothe formation of more biodegradable by-products. According to theOECD criteria, neither the parent compound nor the TP mixture after256min of UV/H2O2was toxic to the inoculum.Moreover, a clear differ-ence in toxicity control lag phases between samples with the parentcompound and the transformation products was observed. In the sam-ple with 5-FU, toxicity control had a 3 day lag phase, whereas sampleswith transformation products had no lag phase. This is another indica-tion that TPs generated during the UV/H2O2 photo-degradation wereless toxic than the parent compound itself.
Over the past years, the biodegradability of 5-FU has been studied byseveral authors, giving rise to different results and contradictory conclu-sions. Biodegradation values ranging between 38–92%were observed inan OECD confirmatory test (OECD 303 A) after 3 days the best resultswere obtained at an initial concentration of 10mg/L (IUTA, 2000). Addi-tionally, in an OECD confirmatory test, Kiffmeyer et al. (1997) verified afull elimination of 5-FU within a few days. According to the authors,the biodegradation rate is dependent on the initial concentration,and the best results were obtained at the lowest 5-FU concentrations(i.e., 5 mg/L). The outcome of research carried outwith activated sludgeindicated a complete removal of 5-FU from the wastewater of an onco-logical ward (Mahnik et al., 2007). More recently, Kosjek et al. (2013)investigated the degradation of 5-FU in batch biodegradation experi-ments at a scale of 0.5 L (inoculum of activated sludge (AS) with initialconcentration of 5.4 g/L). The authors found that 5-FU was completelyeliminated at lower concentrations (1 and 10 mg/L), whereas a toxiceffect occurred at higher concentrations (20 and 100 mg/L), retardingor even inhibiting the elimination.
In contradiction to the above mentioned results, 5-FU was reportedas non-biodegradable in the Closed-Bottle-Test (OECD 301D) and inthe Zahn–Wellens–Test (ZWT) (OECD 302B) for concentrations of9.02 and 854mg/L, respectively (Kümmerer and Al‐Ahmad, 1997). Fur-thermore, no biodegradation of the parent compound of 5-FU (10 and100 mg/L) was observed in the respirometric ready biodegradabilitytest (OECD 301F) (Gröner, 1983). Yu et al. (2006) observed incompleteremovals of 5-FU (b60%), even at lower concentrations (1 and 50 μg/L).After 50 days of incubation, the results showed eliminations of only 50%and 30% for initial concentrations of 1 and 50 μg/L, respectively.
Despite the results of some studies presented above, showing a fastelimination of 5-FU, it is noteworthy that all these tests were performedwith higher bacterial densities (2.5 g/L dry mass in the OECD 303A and5.4 g/L in the study performed by Kosjek et al., 2013), whereas the CBT
Time (days)
0 2 4 6 8 10 12 14 16 18 20 22 24 26 28
BO
D (
mg O
2/L
)
0
2
4
6
8
10
UV/H2O
2 (0 min)
UV/H2O
2 (256 min)
ToxicityControl (0 min)
Toxicty Control (256 min)
Quality Control (0 min)
Quality Control (256 min)
Fig. 3.Aerobic biodegradation (CBT) of 5-FU (0min) and the photolyticmixture (256min)formed after the of UV/H2O2 process (n = 2).
238 C.A. Lutterbeck et al. / Science of the Total Environment 527–528 (2015) 232–245
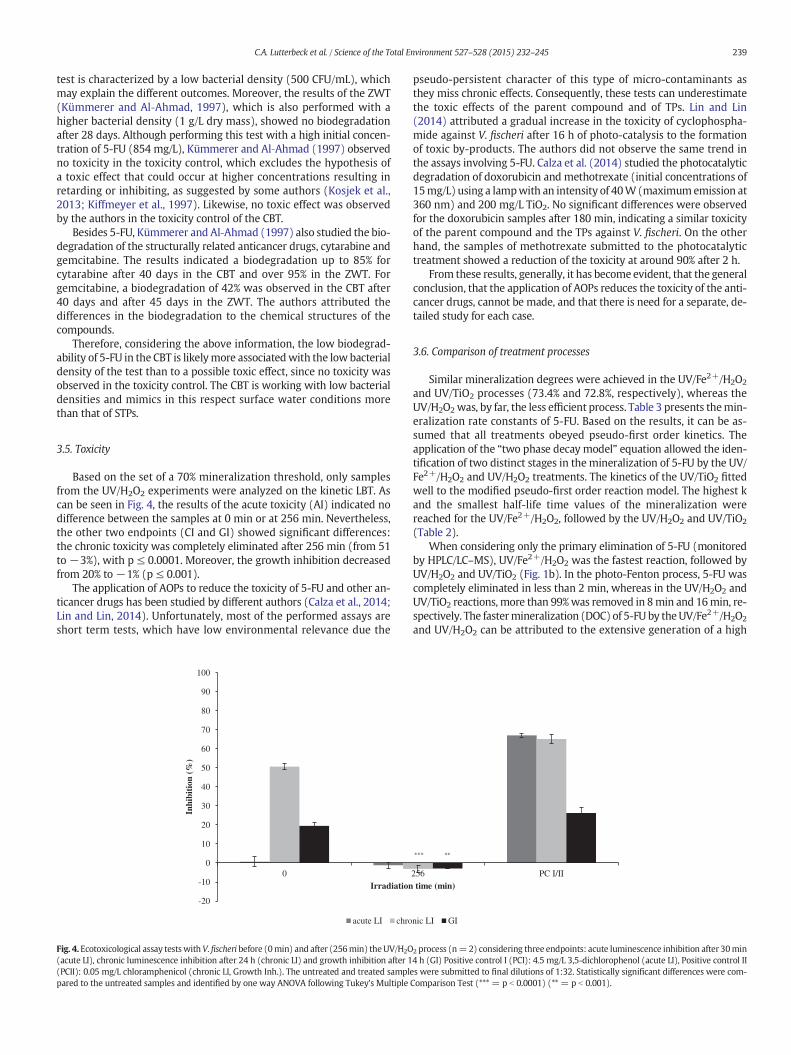
test is characterized by a low bacterial density (500 CFU/mL), whichmay explain the different outcomes. Moreover, the results of the ZWT(Kümmerer and Al‐Ahmad, 1997), which is also performed with ahigher bacterial density (1 g/L dry mass), showed no biodegradationafter 28 days. Although performing this test with a high initial concen-tration of 5-FU (854 mg/L), Kümmerer and Al‐Ahmad (1997) observedno toxicity in the toxicity control, which excludes the hypothesis ofa toxic effect that could occur at higher concentrations resulting inretarding or inhibiting, as suggested by some authors (Kosjek et al.,2013; Kiffmeyer et al., 1997). Likewise, no toxic effect was observedby the authors in the toxicity control of the CBT.
Besides 5-FU, Kümmerer and Al‐Ahmad (1997) also studied the bio-degradation of the structurally related anticancer drugs, cytarabine andgemcitabine. The results indicated a biodegradation up to 85% forcytarabine after 40 days in the CBT and over 95% in the ZWT. Forgemcitabine, a biodegradation of 42% was observed in the CBT after40 days and after 45 days in the ZWT. The authors attributed thedifferences in the biodegradation to the chemical structures of thecompounds.
Therefore, considering the above information, the low biodegrad-ability of 5-FU in the CBT is likelymore associatedwith the low bacterialdensity of the test than to a possible toxic effect, since no toxicity wasobserved in the toxicity control. The CBT is working with low bacterialdensities and mimics in this respect surface water conditions morethan that of STPs.
3.5. Toxicity
Based on the set of a 70% mineralization threshold, only samplesfrom the UV/H2O2 experiments were analyzed on the kinetic LBT. Ascan be seen in Fig. 4, the results of the acute toxicity (AI) indicated nodifference between the samples at 0 min or at 256 min. Nevertheless,the other two endpoints (CI and GI) showed significant differences:the chronic toxicity was completely eliminated after 256 min (from 51to −3%), with p ≤ 0.0001. Moreover, the growth inhibition decreasedfrom 20% to −1% (p ≤ 0.001).
The application of AOPs to reduce the toxicity of 5-FU and other an-ticancer drugs has been studied by different authors (Calza et al., 2014;Lin and Lin, 2014). Unfortunately, most of the performed assays areshort term tests, which have low environmental relevance due the
pseudo-persistent character of this type of micro-contaminants asthey miss chronic effects. Consequently, these tests can underestimatethe toxic effects of the parent compound and of TPs. Lin and Lin(2014) attributed a gradual increase in the toxicity of cyclophospha-mide against V. fischeri after 16 h of photo-catalysis to the formationof toxic by-products. The authors did not observe the same trend inthe assays involving 5-FU. Calza et al. (2014) studied the photocatalyticdegradation of doxorubicin and methotrexate (initial concentrations of15mg/L) using a lampwith an intensity of 40W(maximumemission at360 nm) and 200 mg/L TiO2. No significant differences were observedfor the doxorubicin samples after 180 min, indicating a similar toxicityof the parent compound and the TPs against V. fischeri. On the otherhand, the samples of methotrexate submitted to the photocatalytictreatment showed a reduction of the toxicity at around 90% after 2 h.
From these results, generally, it has become evident, that the generalconclusion, that the application of AOPs reduces the toxicity of the anti-cancer drugs, cannot be made, and that there is need for a separate, de-tailed study for each case.
3.6. Comparison of treatment processes
Similar mineralization degrees were achieved in the UV/Fe2+/H2O2
and UV/TiO2 processes (73.4% and 72.8%, respectively), whereas theUV/H2O2was, by far, the less efficient process. Table 3 presents themin-eralization rate constants of 5-FU. Based on the results, it can be as-sumed that all treatments obeyed pseudo-first order kinetics. Theapplication of the “two phase decay model” equation allowed the iden-tification of two distinct stages in themineralization of 5-FU by the UV/Fe2+/H2O2 and UV/H2O2 treatments. The kinetics of the UV/TiO2 fittedwell to the modified pseudo-first order reaction model. The highest kand the smallest half-life time values of the mineralization werereached for the UV/Fe2+/H2O2, followed by the UV/H2O2 and UV/TiO2
(Table 2).When considering only the primary elimination of 5-FU (monitored
by HPLC/LC–MS), UV/Fe2+/H2O2 was the fastest reaction, followed byUV/H2O2 and UV/TiO2 (Fig. 1b). In the photo-Fenton process, 5-FU wascompletely eliminated in less than 2 min, whereas in the UV/H2O2 andUV/TiO2 reactions, more than 99%was removed in 8min and 16min, re-spectively. The fastermineralization (DOC) of 5-FU by theUV/Fe2+/H2O2
and UV/H2O2 can be attributed to the extensive generation of a high
-20
-10
0
10
20
30
40
50
60
70
80
90
100
0 256 PC I/II
Inh
ibit
ion
(%
)
Irradiation time (min)
acute LI chronic LI GI
*****
Fig. 4. Ecotoxicological assay tests with V. fischeri before (0min) and after (256min) theUV/H2O2 process (n=2) considering three endpoints: acute luminescence inhibition after 30min(acute LI), chronic luminescence inhibition after 24 h (chronic LI) and growth inhibition after 14 h (GI) Positive control I (PCI): 4.5 mg/L 3,5-dichlorophenol (acute LI), Positive control II(PCII): 0.05 mg/L chloramphenicol (chronic LI, Growth Inh.). The untreated and treated samples were submitted to final dilutions of 1:32. Statistically significant differences were com-pared to the untreated samples and identified by one way ANOVA following Tukey's Multiple Comparison Test (*** = p b 0.0001) (** = p b 0.001).
239C.A. Lutterbeck et al. / Science of the Total Environment 527–528 (2015) 232–245
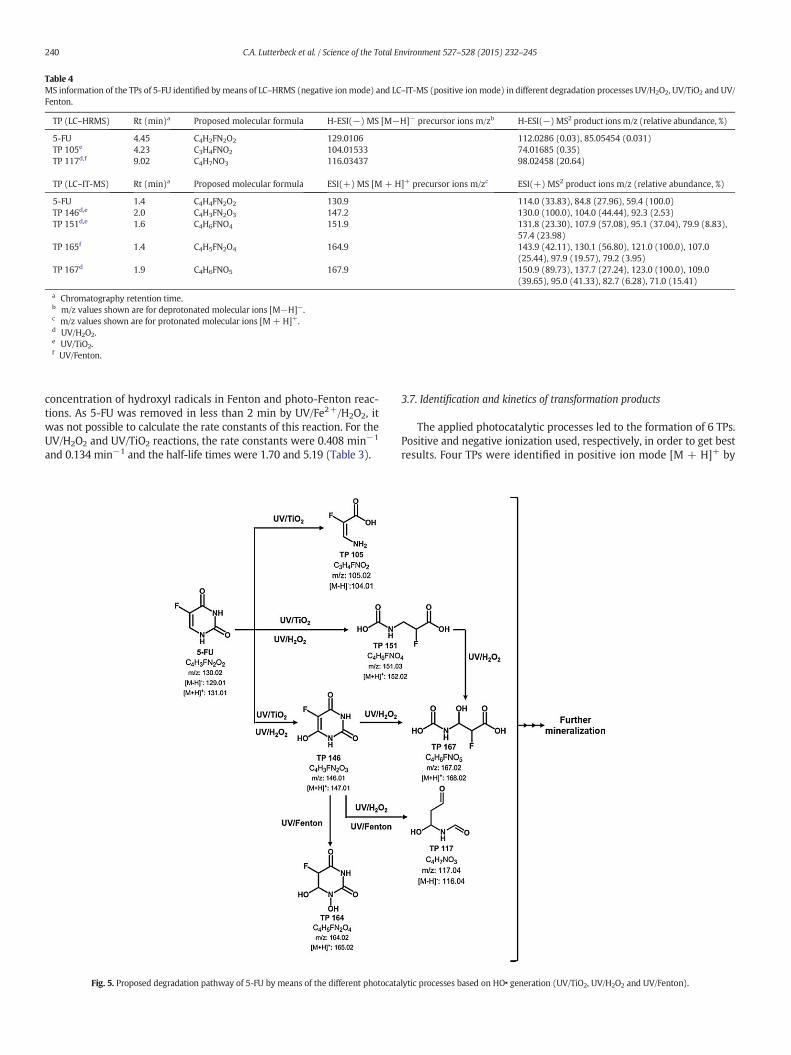
concentration of hydroxyl radicals in Fenton and photo-Fenton reac-tions. As 5-FU was removed in less than 2 min by UV/Fe2+/H2O2, itwas not possible to calculate the rate constants of this reaction. For theUV/H2O2 and UV/TiO2 reactions, the rate constants were 0.408 min−1
and 0.134 min−1 and the half-life times were 1.70 and 5.19 (Table 3).
3.7. Identification and kinetics of transformation products
The applied photocatalytic processes led to the formation of 6 TPs.Positive and negative ionization used, respectively, in order to get bestresults. Four TPs were identified in positive ion mode [M + H]+ by
Table 4
MS information of the TPs of 5-FU identified by means of LC–HRMS (negative ionmode) and LC–IT-MS (positive ion mode) in different degradation processes UV/H2O2, UV/TiO2 and UV/Fenton.
TP (LC–HRMS) Rt (min)a Proposed molecular formula H-ESI(−) MS [M−H]− precursor ions m/zb H-ESI(−) MS2 product ionsm/z (relative abundance, %)
5-FU 4.45 C4H2FN2O2 129.0106 112.0286 (0.03), 85.05454 (0.031)TP 105e 4.23 C3H4FNO2 104.01533 74.01685 (0.35)TP 117d,f 9.02 C4H7NO3 116.03437 98.02458 (20.64)
TP (LC–IT-MS) Rt (min)a Proposed molecular formula ESI(+) MS [M + H]+ precursor ions m/zc ESI(+) MS2 product ions m/z (relative abundance, %)
5-FU 1.4 C4H4FN2O2 130.9 114.0 (33.83), 84.8 (27.96), 59.4 (100.0)TP 146d,e 2.0 C4H3FN2O3 147.2 130.0 (100.0), 104.0 (44.44), 92.3 (2.53)TP 151d,e 1.6 C4H6FNO4 151.9 131.8 (23.30), 107.9 (57.08), 95.1 (37.04), 79.9 (8.83),
57.4 (23.98)TP 165f 1.4 C4H5FN2O4 164.9 143.9 (42.11), 130.1 (56.80), 121.0 (100.0), 107.0
(25.44), 97.9 (19.57), 79.2 (3.95)TP 167d 1.9 C4H6FNO5 167.9 150.9 (89.73), 137.7 (27.24), 123.0 (100.0), 109.0
(39.65), 95.0 (41.33), 82.7 (6.28), 71.0 (15.41)
a Chromatography retention time.b m/z values shown are for deprotonated molecular ions [M−H]−.c m/z values shown are for protonated molecular ions [M+ H]+.d UV/H2O2.e UV/TiO2.f UV/Fenton.
Fig. 5. Proposed degradation pathway of 5-FU by means of the different photocatalytic processes based on HO• generation (UV/TiO2, UV/H2O2 and UV/Fenton).
240 C.A. Lutterbeck et al. / Science of the Total Environment 527–528 (2015) 232–245
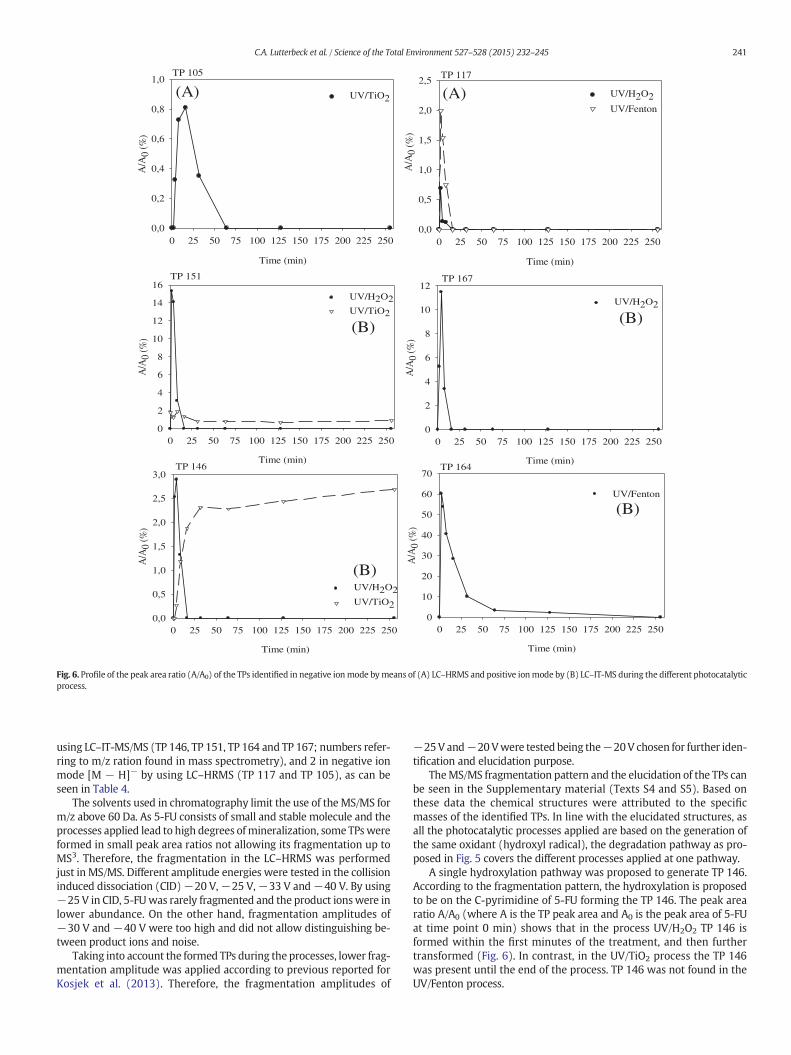
using LC–IT-MS/MS (TP 146, TP 151, TP 164 and TP 167; numbers refer-ring to m/z ration found in mass spectrometry), and 2 in negative ionmode [M − H]− by using LC–HRMS (TP 117 and TP 105), as can beseen in Table 4.
The solvents used in chromatography limit the use of the MS/MS form/z above 60 Da. As 5-FU consists of small and stable molecule and theprocesses applied lead to high degrees ofmineralization, some TPswereformed in small peak area ratios not allowing its fragmentation up toMS3. Therefore, the fragmentation in the LC–HRMS was performedjust in MS/MS. Different amplitude energies were tested in the collisioninduced dissociation (CID)−20 V,−25 V,−33 V and−40 V. By using−25 V in CID, 5-FUwas rarely fragmented and the product ionswere inlower abundance. On the other hand, fragmentation amplitudes of−30 V and −40 V were too high and did not allow distinguishing be-tween product ions and noise.
Taking into account the formed TPs during the processes, lower frag-mentation amplitude was applied according to previous reported forKosjek et al. (2013). Therefore, the fragmentation amplitudes of
−25V and−20Vwere tested being the−20V chosen for further iden-tification and elucidation purpose.
TheMS/MS fragmentation pattern and the elucidation of the TPs canbe seen in the Supplementary material (Texts S4 and S5). Based onthese data the chemical structures were attributed to the specificmasses of the identified TPs. In line with the elucidated structures, asall the photocatalytic processes applied are based on the generation ofthe same oxidant (hydroxyl radical), the degradation pathway as pro-posed in Fig. 5 covers the different processes applied at one pathway.
A single hydroxylation pathway was proposed to generate TP 146.According to the fragmentation pattern, the hydroxylation is proposedto be on the C-pyrimidine of 5-FU forming the TP 146. The peak arearatio A/A0 (where A is the TP peak area and A0 is the peak area of 5-FUat time point 0 min) shows that in the process UV/H2O2 TP 146 isformed within the first minutes of the treatment, and then furthertransformed (Fig. 6). In contrast, in the UV/TiO2 process the TP 146was present until the end of the process. TP 146 was not found in theUV/Fenton process.
TP 105
Time (min)
0 25 50 75 100 125 150 175 200 225 250
A/A
0 (
%)
0,0
0,2
0,4
0,6
0,8
1,0
UV/TiO2
TP 117
Time (min)
0 25 50 75 100 125 150 175 200 225 250
0,0
0,5
1,0
1,5
2,0
2,5
UV/H2O2
UV/Fenton
(A) (A)
A/A
0 (
%)
TP 151
Time (min)
0 25 50 75 100 125 150 175 200 225 250
A/A
0 (%
)
0
2
4
6
8
10
12
14
16
UV/H2O2
UV/TiO2
TP 167
Time (min)
0 25 50 75 100 125 150 175 200 225 250
A/A
0 (%
)
0
2
4
6
8
10
12
UV/H2O2
TP 146
Time (min)
0 25 50 75 100 125 150 175 200 225 250
A/A
0 (%
)
0,0
0,5
1,0
1,5
2,0
2,5
3,0
UV/H2O2
UV/TiO2
TP 164
Time (min)
0 25 50 75 100 125 150 175 200 225 250
A/A
0 (%
)
0
10
20
30
40
50
60
70
UV/Fenton
(B)(B)
(B)
(B)
Fig. 6. Profile of the peak area ratio (A/A0) of the TPs identified in negative ionmode bymeans of (A) LC–HRMS and positive ionmode by (B) LC–IT-MS during the different photocatalyticprocess.
241C.A. Lutterbeck et al. / Science of the Total Environment 527–528 (2015) 232–245
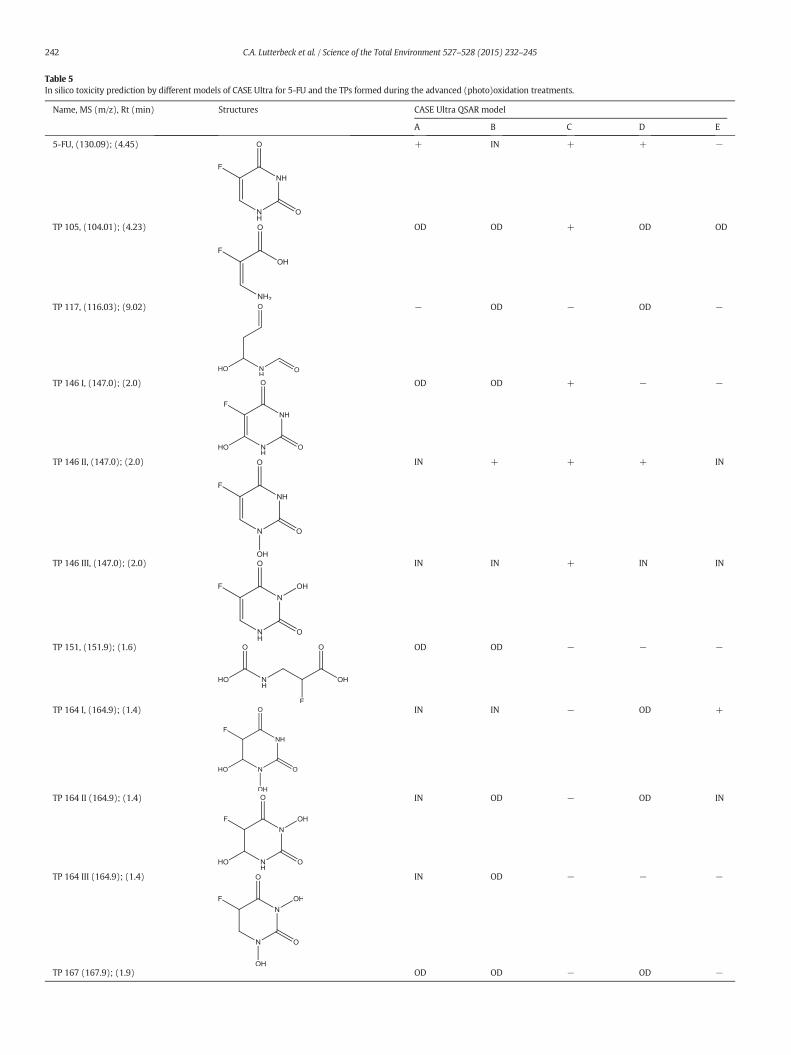
Table 5
In silico toxicity prediction by different models of CASE Ultra for 5-FU and the TPs formed during the advanced (photo)oxidation treatments.
Name, MS (m/z), Rt (min) Structures CASE Ultra QSAR model
A B C D E
5-FU, (130.09); (4.45) + IN + + −
TP 105, (104.01); (4.23) OD OD + OD OD
TP 117, (116.03); (9.02) − OD − OD −
TP 146 I, (147.0); (2.0) OD OD + − −
TP 146 II, (147.0); (2.0) IN + + + IN
TP 146 III, (147.0); (2.0) IN IN + IN IN
TP 151, (151.9); (1.6) OD OD − − −
TP 164 I, (164.9); (1.4) IN IN − OD +
TP 164 II (164.9); (1.4) IN OD − OD IN
TP 164 III (164.9); (1.4) IN OD − − −
TP 167 (167.9); (1.9) OD OD − OD −
242 C.A. Lutterbeck et al. / Science of the Total Environment 527–528 (2015) 232–245
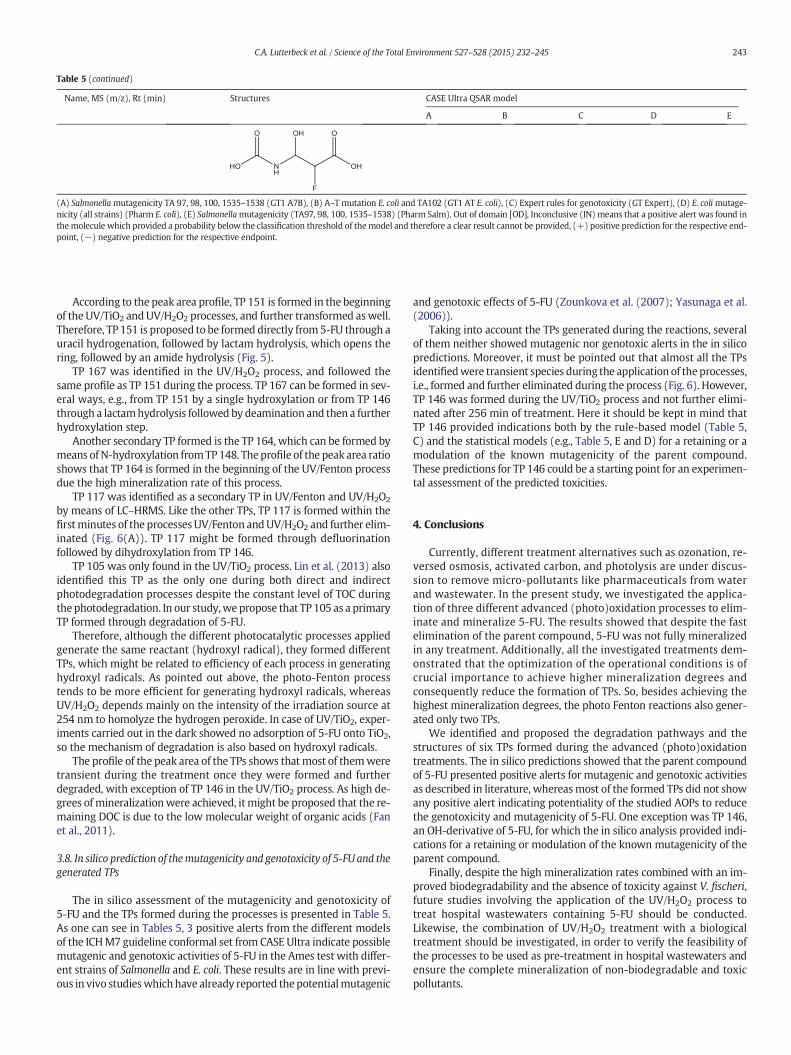
According to the peak area profile, TP 151 is formed in the beginningof the UV/TiO2 andUV/H2O2 processes, and further transformed aswell.Therefore, TP 151 is proposed to be formed directly from5-FU through auracil hydrogenation, followed by lactam hydrolysis, which opens thering, followed by an amide hydrolysis (Fig. 5).
TP 167 was identified in the UV/H2O2 process, and followed thesame profile as TP 151 during the process. TP 167 can be formed in sev-eral ways, e.g., from TP 151 by a single hydroxylation or from TP 146through a lactamhydrolysis followed by deamination and then a furtherhydroxylation step.
Another secondary TP formed is the TP 164, which can be formed bymeans of N-hydroxylation fromTP148. Theprofile of the peak area ratioshows that TP 164 is formed in the beginning of the UV/Fenton processdue the high mineralization rate of this process.
TP 117 was identified as a secondary TP in UV/Fenton and UV/H2O2
by means of LC–HRMS. Like the other TPs, TP 117 is formed within thefirstminutes of the processesUV/Fenton andUV/H2O2 and further elim-inated (Fig. 6(A)). TP 117 might be formed through defluorinationfollowed by dihydroxylation from TP 146.
TP 105 was only found in the UV/TiO2 process. Lin et al. (2013) alsoidentified this TP as the only one during both direct and indirectphotodegradation processes despite the constant level of TOC duringthe photodegradation. In our study,we propose that TP 105 as a primaryTP formed through degradation of 5-FU.
Therefore, although the different photocatalytic processes appliedgenerate the same reactant (hydroxyl radical), they formed differentTPs, which might be related to efficiency of each process in generatinghydroxyl radicals. As pointed out above, the photo-Fenton processtends to be more efficient for generating hydroxyl radicals, whereasUV/H2O2 depends mainly on the intensity of the irradiation source at254 nm to homolyze the hydrogen peroxide. In case of UV/TiO2, exper-iments carried out in the dark showed no adsorption of 5-FU onto TiO2,so the mechanism of degradation is also based on hydroxyl radicals.
The profile of the peak area of the TPs shows that most of themweretransient during the treatment once they were formed and furtherdegraded, with exception of TP 146 in the UV/TiO2 process. As high de-grees of mineralizationwere achieved, it might be proposed that the re-maining DOC is due to the low molecular weight of organic acids (Fanet al., 2011).
3.8. In silico prediction of themutagenicity and genotoxicity of 5-FU and the
generated TPs
The in silico assessment of the mutagenicity and genotoxicity of5-FU and the TPs formed during the processes is presented in Table 5.As one can see in Tables 5, 3 positive alerts from the different modelsof the ICHM7 guideline conformal set from CASE Ultra indicate possiblemutagenic and genotoxic activities of 5-FU in the Ames test with differ-ent strains of Salmonella and E. coli. These results are in line with previ-ous in vivo studieswhichhave already reported thepotentialmutagenic
and genotoxic effects of 5-FU (Zounkova et al. (2007); Yasunaga et al.(2006)).
Taking into account the TPs generated during the reactions, severalof them neither showed mutagenic nor genotoxic alerts in the in silicopredictions. Moreover, it must be pointed out that almost all the TPsidentifiedwere transient species during the application of theprocesses,i.e., formed and further eliminated during the process (Fig. 6). However,TP 146 was formed during the UV/TiO2 process and not further elimi-nated after 256 min of treatment. Here it should be kept in mind thatTP 146 provided indications both by the rule-based model (Table 5,C) and the statistical models (e.g., Table 5, E and D) for a retaining or amodulation of the known mutagenicity of the parent compound.These predictions for TP 146 could be a starting point for an experimen-tal assessment of the predicted toxicities.
4. Conclusions
Currently, different treatment alternatives such as ozonation, re-versed osmosis, activated carbon, and photolysis are under discus-sion to remove micro-pollutants like pharmaceuticals from waterand wastewater. In the present study, we investigated the applica-tion of three different advanced (photo)oxidation processes to elim-inate and mineralize 5-FU. The results showed that despite the fastelimination of the parent compound, 5-FU was not fully mineralizedin any treatment. Additionally, all the investigated treatments dem-onstrated that the optimization of the operational conditions is ofcrucial importance to achieve higher mineralization degrees andconsequently reduce the formation of TPs. So, besides achieving thehighest mineralization degrees, the photo Fenton reactions also gener-ated only two TPs.
We identified and proposed the degradation pathways and thestructures of six TPs formed during the advanced (photo)oxidationtreatments. The in silico predictions showed that the parent compoundof 5-FU presented positive alerts for mutagenic and genotoxic activitiesas described in literature, whereasmost of the formed TPs did not showany positive alert indicating potentiality of the studied AOPs to reducethe genotoxicity and mutagenicity of 5-FU. One exception was TP 146,an OH-derivative of 5-FU, for which the in silico analysis provided indi-cations for a retaining or modulation of the known mutagenicity of theparent compound.
Finally, despite the high mineralization rates combined with an im-proved biodegradability and the absence of toxicity against V. fischeri,future studies involving the application of the UV/H2O2 process totreat hospital wastewaters containing 5-FU should be conducted.Likewise, the combination of UV/H2O2 treatment with a biologicaltreatment should be investigated, in order to verify the feasibility ofthe processes to be used as pre-treatment in hospital wastewaters andensure the complete mineralization of non-biodegradable and toxicpollutants.
Table 5 (continued)
Name, MS (m/z), Rt (min) Structures CASE Ultra QSAR model
A B C D E
(A) Salmonellamutagenicity TA 97, 98, 100, 1535–1538 (GT1 A7B), (B) A–T mutation E. coli and TA102 (GT1 AT E. coli), (C) Expert rules for genotoxicity (GT Expert), (D) E. colimutage-nicity (all strains) (Pharm E. coli), (E) Salmonellamutagenicity (TA97, 98, 100, 1535–1538) (Pharm Salm). Out of domain [OD], Inconclusive (IN) means that a positive alert was found inthemolecule which provided a probability below the classification threshold of themodel and therefore a clear result cannot be provided, (+) positive prediction for the respective end-point, (−) negative prediction for the respective endpoint.
243C.A. Lutterbeck et al. / Science of the Total Environment 527–528 (2015) 232–245
Acknowledgments
This project was funded by the EU under the 7th Framework, grantagreement n° 265346 (“Pharmas Project”). C. A. Lutterbeck thanksthe Brazilian “Conselho Nacional de Desenvolvimento Científico eTecnológico” (CNPq) for their financial support (Grant Nr. 290136/2011-3). M. L. Wilde thanks the program “Ciências sem Fronteiras”from CNPq-CAPES-CsF-Brazil for the scholarship granted (Grant Nr.2367712012-4). The authors also gratefully acknowledge the Pharmacyof the Hospital Lüneburg for kindly providing 5-fluorouracil and itspreparations. The authors also acknowledge Multicase Inc. for kindlyproviding the CASE Ultra software.
Appendix A. Supplementary data
Supplementary data to this article can be found online at http://dx.doi.org/10.1016/j.scitotenv.2015.04.111.
References
Allwood, M., Stanley, A., Wright, P., 2002. The Cytotoxics Handbook. Radcliffe MedicalPress, England (512 pp.).
Anheden, M., Goswami, D.Y., Svedberg, G., 1996. Photocatalytic treatment of wastewaterfrom 5-fluorouracil manufacturing. J. Sol. Energy Eng. 118, 2–8.
Augugliaro, V., Litter, M., Palmisano, L., Soria, J., 2006. The combination of heterogeneousphotocatalysis with chemical and physical operations: a tool for improving thephotoprocess performance. J. Photochem. Photobiol. C 7, 127–144.
Ayodele, O.B., Lim, J.K., Hameed, B.H., 2012. Degradation of phenol in photo-Fenton pro-cess by phosphoric acid modified kaolin supported ferric-oxalate catalyst: optimiza-tion and kinetic modeling. Chem. Eng. J. 197, 181–192.
Besse, J.-P., Latour, J.-F., Garric, J., 2012. Anticancer drugs in surface waters: what can wesay about the occurrence and environmental significance of cytotoxic, cytostatic andendocrine therapy drugs? Environ. Int. 39, 73–86.
Bezerra, M.A., Santelli, R.E., Oliveira, E.P., Villar, L.S., Escaleira, L.A., 2008. Response surfacemethodology (RSM) as a tool for optimization in analytical chemistry. Talanta 76,965–977.
Brillas, E., Sires, I., Oturan, M.A., 2009. Electro-Fenton process and related electrochemicaltechnologies based on Fenton's reaction chemistry. Chem. Rev. 109, 6570–6631.
Calza, P., Medana, C., Sarro, M., Rosato, V., Aigotti, R., Baiocchi, C., Minero, C., 2014. Photo-catalytic degradation of selected anticancer drugs and identification of their transfor-mation products in water by liquid chromatography–high resolution massspectrometry. J. Chromatogr. A 1362, 135–144.
De la Cruz, N., Giménez, J., Esplugas, S., Grandjean, D., de Alencastro, L.F., Pulgarín, C.,2012. Degradation of 32 emergent contaminants by UV and neutral photo-fentonin domestic wastewater effluent previously treated by activated sludge. 46,1947–1957.
De, A.K., Chaudhuri, B., Bhattacharjee, S., Dutta, B.K., 1999. Estimation of •OH radicalreaction rate constants for phenol and chlorinated phenols using UV/H2O2 photo-oxidation. J. Hazard. Mater. 64, 91–104.
Deboever, G., Hiltrop, N., Cool, M., Lambrecht, G., 2013. Alternative treatment options incolorectal cancer patientswith 5-fluorouracil- or capecitabine-induced cardiotoxicity.Clin. Colorectal Cancer 12, 8–14.
Eitel, A., Scherrer, M., Kümmerer, K., 1999. Handling Cytostatic Drugs. Kehrer Digital &Print, Freiburg, Germany (42 pp.).
Fan, X., Hao, H., Shen, X., Chen, F., Zhang, J., 2011. Removal and degradation pathwaystudy of sulfasalazine with Fenton-like reaction. J. Hazard. Mater. 190, 493–500.
Feng, W., Nansheng, D., 2000. Photochemistry of hydrolytic iron (III) species and photo-induced degradation of organic compounds. A minireview. Chemosphere 41,1137–1147.
Ferreira, S.L.C., Bruns, R.E., da Silva, E.G.P., dos Santos, W.N.L., Quintella, C.M., David, J.M.,de Andrade, J.B., Breitkreitz, M.C., Jardim, I.C.S.F., Neto, B.B., 2007. Statistical designsand response surface techniques for the optimization of chromatographic systems.J. Chromatogr. A 1158, 2–14.
Friedrich, J., Längin, A., Kümmerer, K., 2013. Comparison of an electrochemical andluminescence‐based oxygen measuring system for use in the biodegradabilitytesting according to closed bottle test (OECD 301D). CLEAN — Soil, Air, Water41, 251–257.
Gröner, J., 1983. Biologische Abbaubarkeit und Toxizität von Fluorouracil und Natulan (fürRoche Welwyn). Basle (CH), Roche, Interne Mitteilung TSU/Nr. 52, 02/03/83.
Gulkaya, İ., Surucu, G.A., Dilek, F.B., 2006. Importance of H2O2/Fe2+ ratio in Fenton's treat-
ment of a carpet dyeing wastewater. J. Hazard. Mater. 136, 763–769.Hapeshi, E., Achilleos, A., Vasquez, M.I., Michael, C., Xekoukoulotakis, N.P.,
Mantzavinos, D., Kassinos, D., 2010. Drugs degrading photocatalytically: kineticsand mechanisms of ofloxacin and atenolol removal on titania suspensions. WaterRes. 44, 1737–1746.
International Conference on Harmonization (ICH), 2014. ICH Guideline M7. http://www.ich.org/fileadmin/Public_Web_Site/ICH_Products/Guidelines/Multidisciplinary/M7/M7_Step_4.pdf (Accessed on 18.02.2014).
IUTA, 2000. Opiolka S: Verhalten von Cytostatika in der Umwelt, insbesondere inAbwässern, Gewässern und Kläranlagen. IUTA report MURL: LUA 112-1781W/V8/
98, A.-Nr. 16141, 30.04.98. IUTA, Institut für Energie- und Umwelttechnik e.V.,D-47229 Duisburg (DE).
Johnson, A.C., Jürgens, M.D., Williams, R.J., Kümmerer, K., Kortenkamp, A., Sumpter, J.P.,2008. Do cytotoxic chemotherapy drugs discharged into rivers pose a risk to the en-vironment and human health? An overview and UK case study. J. Hydrol. 348,167–175.
Kiffmeyer, T., Götze, H.-S., Jursch, M., Lüders, U., 1997. Trace enrichment, chromatographicseparation and biodegradation of cytostatic compounds in surface water. FreseniusJ. Anal. Chem. 361, 185–191.
Kosjek, T., Heath, E., 2011. Occurrence, fate and determination of cytostatic pharmaceuti-cals in the environment. TrAC Trends Anal. Chem. 30, 1065–1087.
Kosjek, T., Perko, S., Žigon, D., Heath, E., 2013. Fluorouracil in the environment: analysis,occurrence, degradation and transformation. J. Chromatogr. A 1290, 62–72.
Kovalova, L., McArdell, C.S., Hollender, J., 2009. Challenge of high polarity and low concen-trations in analysis of cytostatics and metabolites in wastewater by hydrophilic inter-action chromatography/tandem mass spectrometry. J. Chromatogr. A 1216,1100–1108.
Kümmerer, K., Al‐Ahmad, A., 1997. Biodegradability of the anti-tumour agents 5-fluoro-uracil, cytarabine, and gemcitabine: impact of the chemical structure and synergistictoxicity with hospital effluent. Acta Hydrochim. Hydrobiol. 25, 166–172.
Kümmerer, K., Haiß, A., Schuster, A., Hein, A., Ebert, I., 2014. Antineoplastic compounds inthe environment — substances of special concern. Environ. Sci. Pollut. Res. 22, 1–14.http://dx.doi.org/10.1007/s11356-014-3902-8.
Lin, A.Y.-C., Wang, X.-H., Lee, W.-N., 2013. Phototransformation Determines the Fate of 5-Fluorouracil and Cyclophosphamide in Natural Surface Waters. Environmental Sci-ence & Technology 47, 4104–4112.
Lin, H.H.-H., Lin, A.Y.-C., 2014. Photocatalytic oxidation of 5-fluorouracil and cyclophos-phamide via UV/TiO2 in an aqueous environment. Water Res. 48, 559–568.
Litter, M.I., 2005. Introduction to Photochemical Advanced Oxidation Processes for WaterTreatment. Springer, Berlin Heidelberg, pp. 325–366.
Lunar, L., Sicilia, D., Rubio, S., Pérez-Bendito, D., Nickel, U., 2000. Degradation of photo-graphic developers by Fenton's reagent: condition optimization and kinetics formetol oxidation. Water Res. 34, 1791–1802.
Lutterbeck, C.A., Machado, Ê.L., Kümmerer, K., 2015. Photodegradation of the antineoplas-tic cyclophosphamide: a comparative study of the efficiencies of UV/H2O2, UV/Fe
2+/H2O2 and UV/TiO2 processes. Chemosphere 120, 538–546.
Mahnik, S.N., Rizovski, B., Fuerhacker, M., Mader, R.M., 2004. Determination of5-fluorouracil in hospital effluents. Anal. Bioanal. Chem. 380, 31–35.
Mahnik, S.N., Lenz, K., Weissenbacher, N., Mader, R.M., Fuerhacker, M., 2007. Fate of5-fluorouracil, doxorubicin, epirubicin, and daunorubicin in hospital wastewaterand their elimination by activated sludge and treatment in a membrane-bio-reactorsystem. 66, 30–37.
Mahmoud,W.M.M., Trautwein, C., Leder, C., Kümmerer, K., 2013. Aquatic photochemistry,abiotic and aerobic biodegradability of thalidomide: Identification of stable transfor-mation products by LC–UV–MSn. Science of The Total Environment 463–464,140–150.
Martins, R.C., Lopes, R.J.G., Quinta-Ferreira, R.M., 2010. Lumped kinetic models for singleozonation of phenolic effluents. Chem. Eng. J. 165, 678–685.
Menz, J., Schneider, M., Kümmerer, K., 2013. Toxicity testing with luminescent bacteria—
characterization of an automated method for the combined assessment of acute andchronic effects. Chemosphere 93, 990–996.
Mullot, J.U., Karolak, S., Fontova, A., Huart, B., Levi, Y., 2009. Development and validation ofa sensitive and selective method using GC/MS–MS for quantification of 5-fluorouracilin hospital wastewater. Anal. Bioanal. Chem. 394, 2203–2212.
Neyens, E., Baeyens, J., 2003. A review of classic Fenton's peroxidation as an advanced ox-idation technique. J. Hazard. Mater. 98, 33–50.
Nidheesh, P.V., Gandhimathi, R., 2012. Trends in electro-Fenton process for water andwastewater treatment: an overview. Desalination 299, 1–15.
OECD, 1992a. Test No. 302B: Guideline for Testing Chemicals of Chemicals — InherentBiodegradability: Zahn–Wellens/EVPA Test. OECD Publishing.
OECD, 1992b. Organisation for Economic Co-operation and Development. OECDGuideline for Testing of Chemicals 301D: Ready Biodegradability. Closed Bottletest.
Rastogi, T., Leder, C., Kümmerer, K., 2014. Qualitative environmental risk assessment ofphotolytic transformation products of iodinated X-ray contrast agent diatrizoic acid.Sci. Total Environ. 482–483, 378–388.
Sivakumar, T., Manavalan, R., Muralidharan, C., Valliappan, K., 2007. Multi-criteria deci-sion making approach and experimental design as chemometric tools to optimizeHPLC separation of domperidone and pantoprazole. J. Pharm. Biomed. Anal. 43,1842–1848.
Straub, J.O., 2010. Combined environmental risk assessment for 5-fluorouracil and cape-citabine in Europe. Integr. Environ. Assess. Manag. 6, 540–566 (Suppl.).
Türk, J., 2006. Abbau von Pharmazeutika in Krankenhausabwasser — Teilströmenmittels. AOP IUTA, Institut für Energie- und Umwelttechnik e.V., D-47229Duisburg (DE).
von Sonntag, C., 2008. Advanced oxidation processes: mechanistic aspects. Water Sci.Technol. 58, 1015–1021.
Wang, X.-H., Lin, A.Y.-C., 2014. Is the phototransformation of pharmaceuticals a naturalpurification process that decreases ecological and human health risks? Environ.Pollut. 186, 203–215.
Weissbrodt, D., Kovalova, L., Ort, C., Pazhepurackel, V., Moser, R., Hollender, J., Siegrist, H.,McArdell, C.S., 2009. Mass flows of X-ray contrast media and cytostatics in hospitalwastewater. Environ. Sci. Technol. 43, 4810–4817.
Yasunaga, K., Kiyonari, A., Nakagawa, M., Yoshikawa, K., 2006. Investigation into the abil-ity of the Salmonella umu test to detect DNA damage using antitumor drugs. Toxicol.in Vitro 20, 712–728.
244 C.A. Lutterbeck et al. / Science of the Total Environment 527–528 (2015) 232–245

Yu, J.T., Bouwer, E.J., Coelhan, M., 2006. Occurrence and biodegradability studies ofselected pharmaceuticals and personal care products in sewage effluent. 86,72–80.
Zepp, R.G., Faust, B.C., Hoigne, J., 1992. Hydroxyl radical formation in aqueous reactions(pH 3–8) of iron(II) with hydrogen peroxide: the photo-Fenton reaction. Environ.Sci. Technol. 26, 313–319.
Zhang, J., Chang, V.W.C., Giannis, A., Wang, J.-Y., 2013. Removal of cytostatic drugs fromaquatic environment: a review. Sci. Total Environ. 445–446, 281–298.
Zounkova, R., Odraska, P., Dolezalova, L., Hilscherova, K., Marsalek, B., Blaha, L., 2007.Ecotoxicity and genotoxicity assessment of cytostatic pharmaceuticals. Environ.Toxicol. Chem. 26, 2208–2214.
245C.A. Lutterbeck et al. / Science of the Total Environment 527–528 (2015) 232–245
Supplementary Material
Degradation of 5-FU by means of advanced
(photo)oxidation processes: UV/H2O2, UV/Fe2+/H2O2
and UV/TiO2 – Comparison of transformation
products, ready biodegradability and toxicity
Carlos Alexandre Lutterbecka,b, Marcelo Luís Wildea, Ewelina Baginskaa, Christoph Ledera, Ênio
Leandro Machadob, Klaus Kümmerera
a Sustainable Chemistry and Material Resources, Institute of Sustainable and Environmental Chemistry, Faculty of Sustainability,
Leuphana University of Lüneburg, Scharnhorststraße 1/C13, DE-21335 Lüneburg, Germany
b Graduate Program in Environmental Technology, Universidade de Santa Cruz do Sul — UNISC, Av. Independência, 2293, CEP
96815-900, Santa Cruz do Sul, Rio Grande do Sul, Brazil
Corresponding author at: Nachhaltige Chemie und Stoffliche Ressourcen, Institut für Nachhaltige Chemie und Umweltchemie,
Fakultät für Nachhaltigkeit, Leuphana Universität Lüneburg, Scharnhorststraße 1/C13, D-21335 Lüneburg, Germany. Tel.: +49
4131 677 2893.
E-Mail addresses: [email protected] (C. A. Lutterbeck), [email protected] (M. L.
Wilde), [email protected] (E. Baginska), [email protected] (C. Leder),
[email protected] (E. L. Machado) [email protected] (K. Kümmerer)
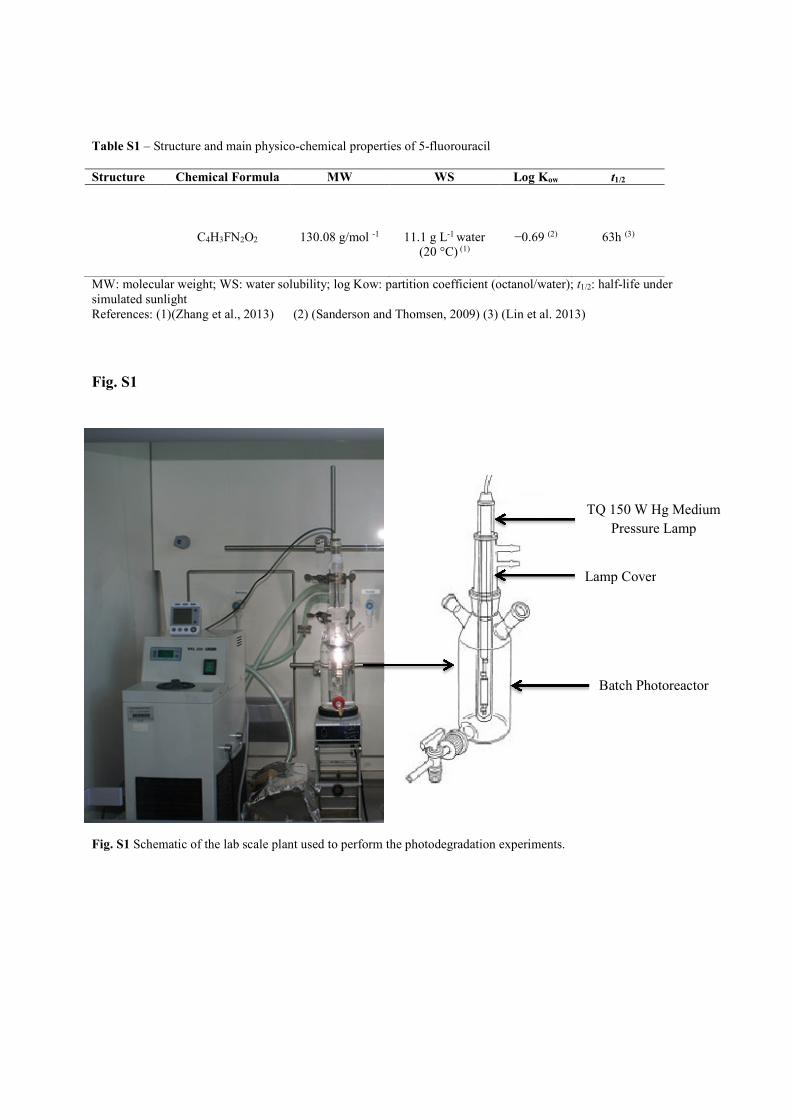
Table S1 – Structure and main physico-chemical properties of 5-fluorouracil
Structure Chemical Formula MW WS Log Kow t1/2
C4H3FN2O2
130.08 g/mol -1
11.1 g L-1 water (20 °C) (1)
−0.69 (2)
63h (3)
MW: molecular weight; WS: water solubility; log Kow: partition coefficient (octanol/water); t1/2: half-life under simulated sunlight References: (1)(Zhang et al., 2013) (2) (Sanderson and Thomsen, 2009) (3) (Lin et al. 2013)
Fig. S1
Fig. S1 Schematic of the lab scale plant used to perform the photodegradation experiments.
TQ 150 W Hg Medium Pressure Lamp
Lamp Cover
Batch Photoreactor
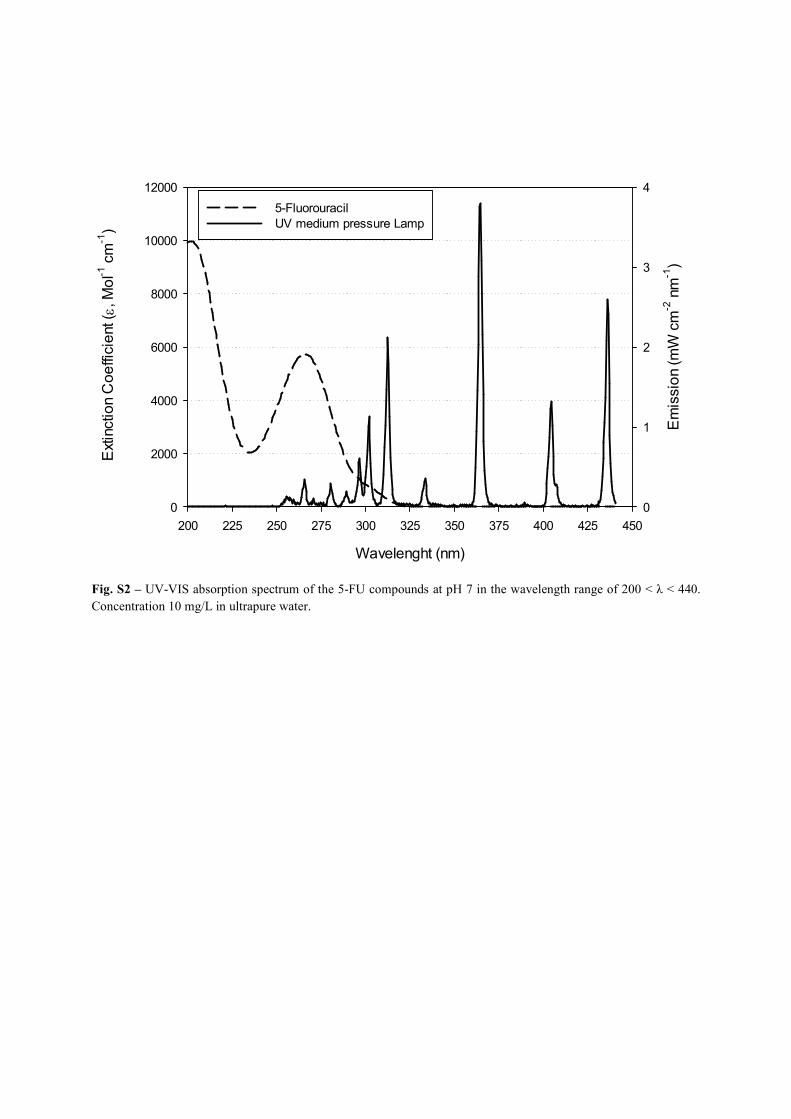
Wavelenght (nm)
200 225 250 275 300 325 350 375 400 425 450
Ext
inctio
n C
oe
ffic
ient (
, M
ol-1
cm
-1)
0
2000
4000
6000
8000
10000
12000
Em
issio
n (
mW
cm
-2 n
m-1
)
0
1
2
3
4
5-Fluorouracil
UV medium pressure Lamp
Fig. S2 – UV-VIS absorption spectrum of the 5-FU compounds at pH 7 in the wavelength range of 200 < λ < 440. Concentration 10 mg/L in ultrapure water.
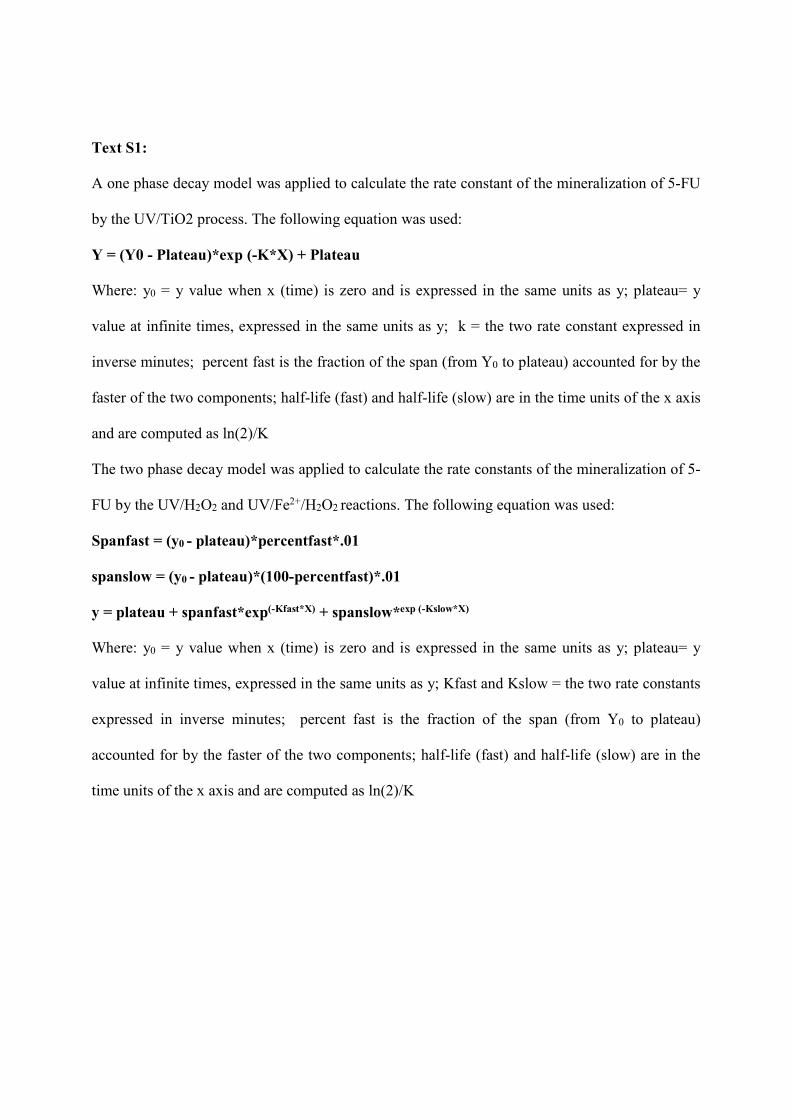
Text S1:
A one phase decay model was applied to calculate the rate constant of the mineralization of 5-FU
by the UV/TiO2 process. The following equation was used:
Y = (Y0 - Plateau)*exp (-K*X) + Plateau
Where: y0 = y value when x (time) is zero and is expressed in the same units as y; plateau= y
value at infinite times, expressed in the same units as y; k = the two rate constant expressed in
inverse minutes; percent fast is the fraction of the span (from Y0 to plateau) accounted for by the
faster of the two components; half-life (fast) and half-life (slow) are in the time units of the x axis
and are computed as ln(2)/K
The two phase decay model was applied to calculate the rate constants of the mineralization of 5-
FU by the UV/H2O2 and UV/Fe2+/H2O2 reactions. The following equation was used:
Spanfast = (y0 - plateau)*percentfast*.01
spanslow = (y0 - plateau)*(100-percentfast)*.01
y = plateau + spanfast*exp(-Kfast*X) + spanslow*exp (-Kslow*X)
Where: y0 = y value when x (time) is zero and is expressed in the same units as y; plateau= y
value at infinite times, expressed in the same units as y; Kfast and Kslow = the two rate constants
expressed in inverse minutes; percent fast is the fraction of the span (from Y0 to plateau)
accounted for by the faster of the two components; half-life (fast) and half-life (slow) are in the
time units of the x axis and are computed as ln(2)/K
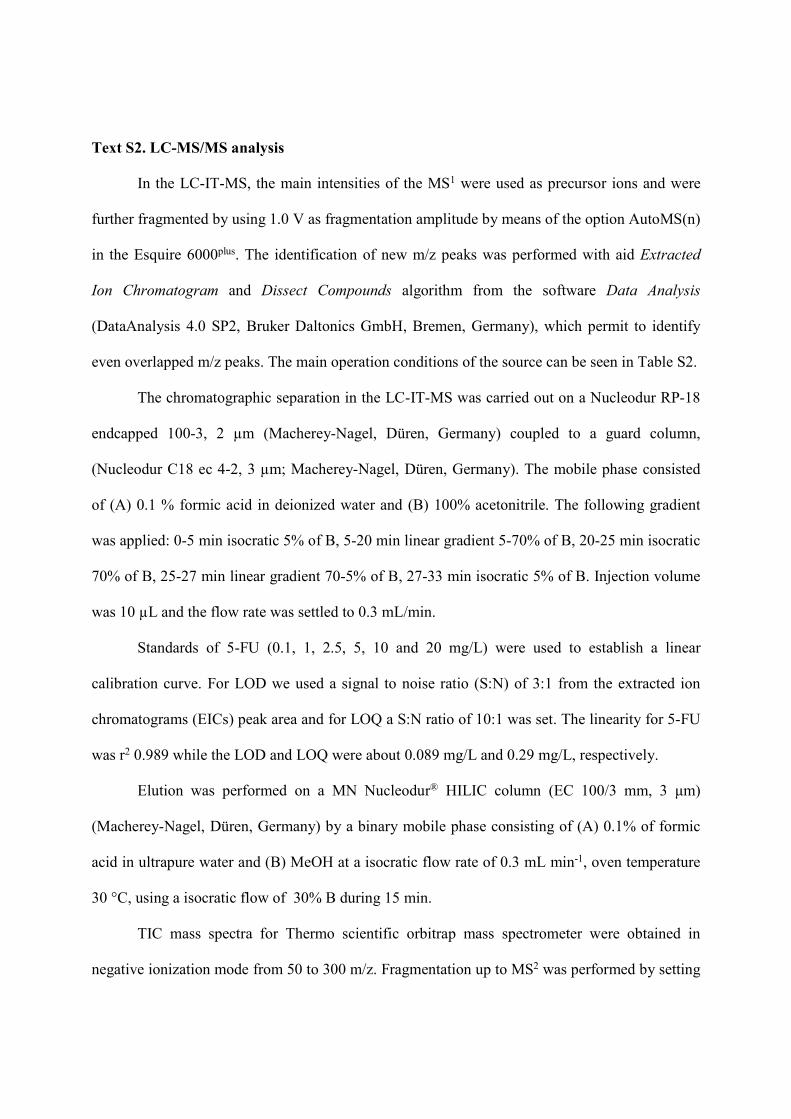
Text S2. LC-MS/MS analysis
In the LC-IT-MS, the main intensities of the MS1 were used as precursor ions and were
further fragmented by using 1.0 V as fragmentation amplitude by means of the option AutoMS(n)
in the Esquire 6000plus. The identification of new m/z peaks was performed with aid Extracted
Ion Chromatogram and Dissect Compounds algorithm from the software Data Analysis
(DataAnalysis 4.0 SP2, Bruker Daltonics GmbH, Bremen, Germany), which permit to identify
even overlapped m/z peaks. The main operation conditions of the source can be seen in Table S2.
The chromatographic separation in the LC-IT-MS was carried out on a Nucleodur RP-18
endcapped 100-3, 2 µm (Macherey-Nagel, Düren, Germany) coupled to a guard column,
(Nucleodur C18 ec 4-2, 3 µm; Macherey-Nagel, Düren, Germany). The mobile phase consisted
of (A) 0.1 % formic acid in deionized water and (B) 100% acetonitrile. The following gradient
was applied: 0-5 min isocratic 5% of B, 5-20 min linear gradient 5-70% of B, 20-25 min isocratic
70% of B, 25-27 min linear gradient 70-5% of B, 27-33 min isocratic 5% of B. Injection volume
was 10 µL and the flow rate was settled to 0.3 mL/min.
Standards of 5-FU (0.1, 1, 2.5, 5, 10 and 20 mg/L) were used to establish a linear
calibration curve. For LOD we used a signal to noise ratio (S:N) of 3:1 from the extracted ion
chromatograms (EICs) peak area and for LOQ a S:N ratio of 10:1 was set. The linearity for 5-FU
was r2 0.989 while the LOD and LOQ were about 0.089 mg/L and 0.29 mg/L, respectively.
Elution was performed on a MN Nucleodur® HILIC column (EC 100/3 mm, 3 μm)
(Macherey-Nagel, Düren, Germany) by a binary mobile phase consisting of (A) 0.1% of formic
acid in ultrapure water and (B) MeOH at a isocratic flow rate of 0.3 mL min-1, oven temperature
30 °C, using a isocratic flow of 30% B during 15 min.
TIC mass spectra for Thermo scientific orbitrap mass spectrometer were obtained in
negative ionization mode from 50 to 300 m/z. Fragmentation up to MS2 was performed by setting

collision-induced dissociation (CID) 25 eV for the sample of 0 min and 20 eV for the different
sampling times during the treatments. More about the source and tune method can be found in
Table S3. The linearity in LC-HRMS for 5-FU was r2 0.98 whereas the LOD and LOQ were 0.06
mg/L and 0.20 mg/L, respectively.
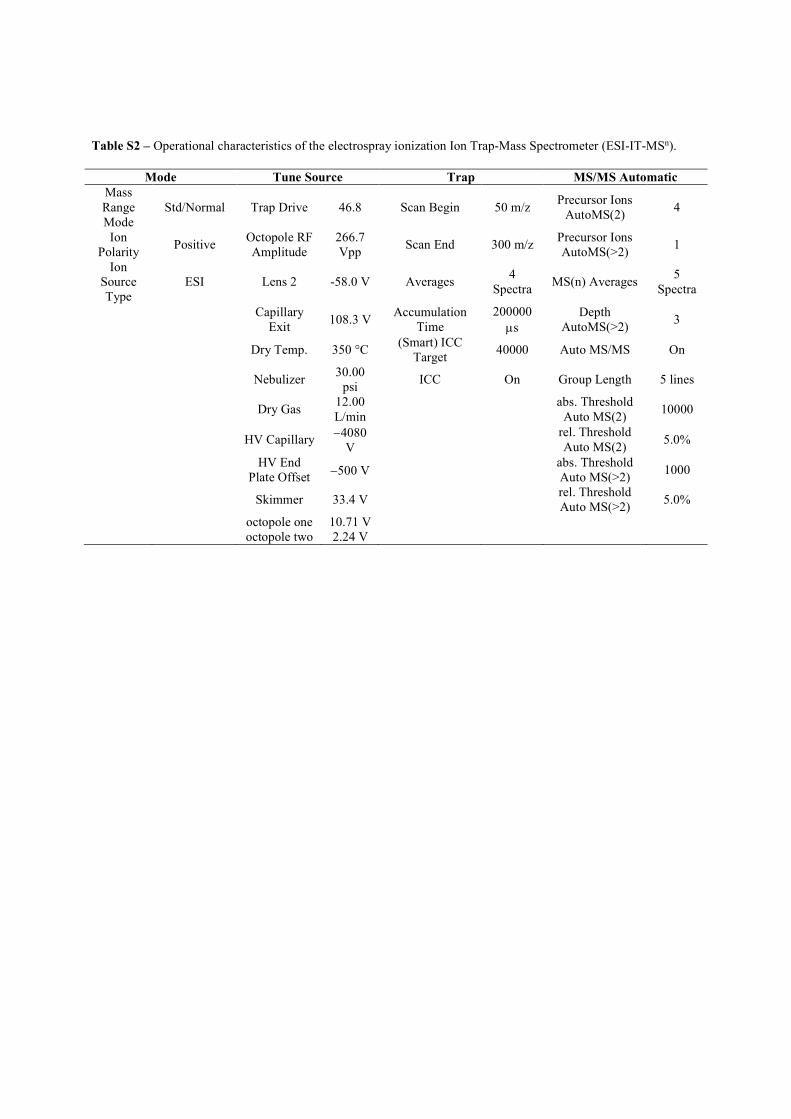
Table S2 – Operational characteristics of the electrospray ionization Ion Trap-Mass Spectrometer (ESI-IT-MSn).
Mode Tune Source Trap MS/MS Automatic
Mass Range Mode
Std/Normal Trap Drive 46.8 Scan Begin 50 m/z Precursor Ions
AutoMS(2) 4
Ion Polarity
Positive Octopole RF Amplitude
266.7 Vpp
Scan End 300 m/z Precursor Ions AutoMS(>2)
1
Ion Source Type
ESI Lens 2 -58.0 V Averages 4
Spectra MS(n) Averages
5 Spectra
Capillary
Exit 108.3 V
Accumulation Time
200000 s
Depth AutoMS(>2)
3
Dry Temp. 350 °C (Smart) ICC
Target 40000 Auto MS/MS On
Nebulizer 30.00
psi ICC On Group Length 5 lines
Dry Gas 12.00 L/min
abs. Threshold
Auto MS(2) 10000
HV Capillary 4080 V
rel. Threshold Auto MS(2)
5.0%
HV End
Plate Offset 500 V abs. Threshold Auto MS(>2)
1000
Skimmer 33.4 V rel. Threshold Auto MS(>2)
5.0%
octopole one 10.71 V octopole two 2.24 V
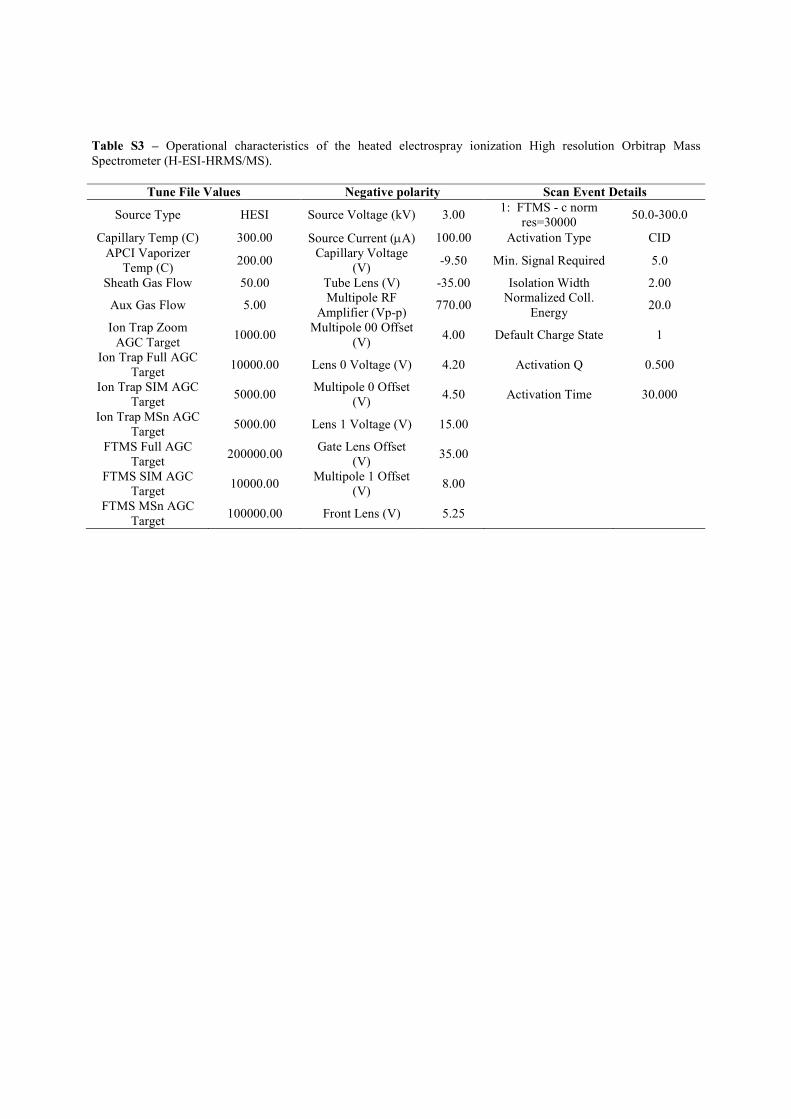
Table S3 – Operational characteristics of the heated electrospray ionization High resolution Orbitrap Mass Spectrometer (H-ESI-HRMS/MS).
Tune File Values Negative polarity Scan Event Details
Source Type HESI Source Voltage (kV) 3.00 1: FTMS - c norm
res=30000 50.0-300.0
Capillary Temp (C) 300.00 Source Current (A) 100.00 Activation Type CID APCI Vaporizer
Temp (C) 200.00
Capillary Voltage (V)
-9.50 Min. Signal Required 5.0
Sheath Gas Flow 50.00 Tube Lens (V) -35.00 Isolation Width 2.00
Aux Gas Flow 5.00 Multipole RF
Amplifier (Vp-p) 770.00
Normalized Coll. Energy
20.0
Ion Trap Zoom AGC Target
1000.00 Multipole 00 Offset
(V) 4.00 Default Charge State 1
Ion Trap Full AGC Target
10000.00 Lens 0 Voltage (V) 4.20 Activation Q 0.500
Ion Trap SIM AGC Target
5000.00 Multipole 0 Offset
(V) 4.50 Activation Time 30.000
Ion Trap MSn AGC Target
5000.00 Lens 1 Voltage (V) 15.00
FTMS Full AGC Target
200000.00 Gate Lens Offset
(V) 35.00
FTMS SIM AGC Target
10000.00 Multipole 1 Offset
(V) 8.00
FTMS MSn AGC Target
100000.00 Front Lens (V) 5.25
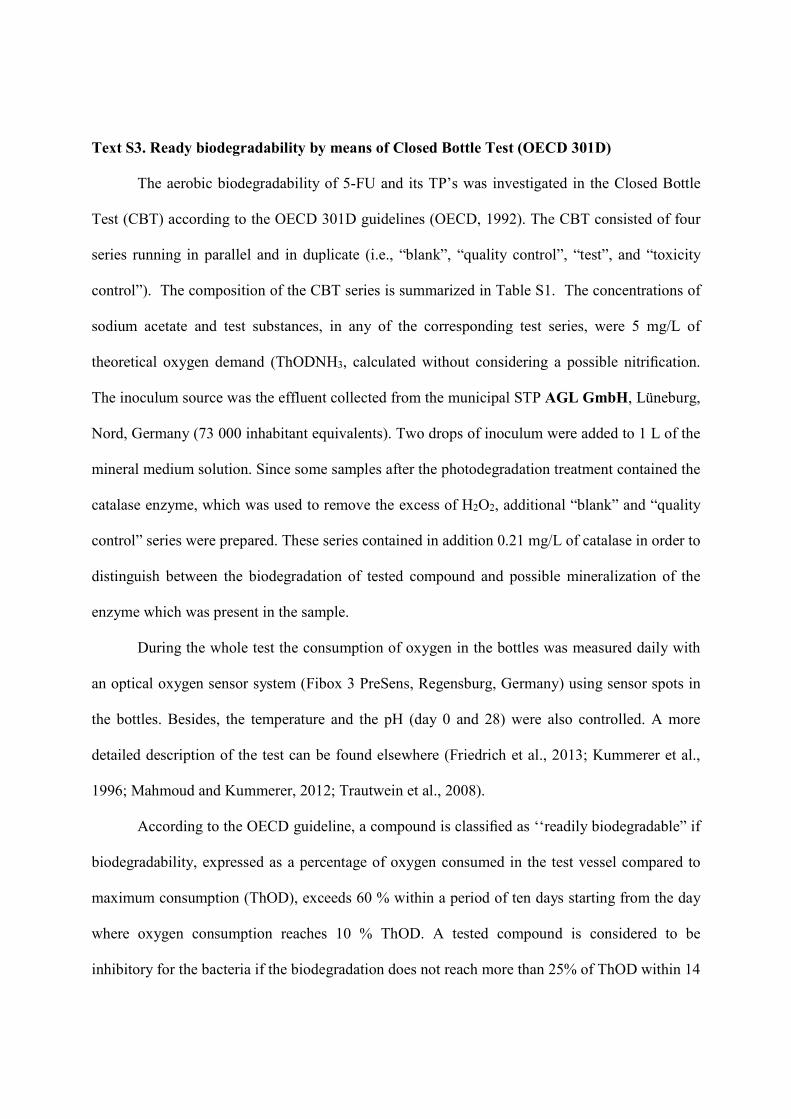
Text S3. Ready biodegradability by means of Closed Bottle Test (OECD 301D)
The aerobic biodegradability of 5-FU and its TP’s was investigated in the Closed Bottle
Test (CBT) according to the OECD 301D guidelines (OECD, 1992). The CBT consisted of four
series running in parallel and in duplicate (i.e., “blank”, “quality control”, “test”, and “toxicity
control”). The composition of the CBT series is summarized in Table S1. The concentrations of
sodium acetate and test substances, in any of the corresponding test series, were 5 mg/L of
theoretical oxygen demand (ThODNH3, calculated without considering a possible nitrification.
The inoculum source was the effluent collected from the municipal STP AGL GmbH, Lüneburg,
Nord, Germany (73 000 inhabitant equivalents). Two drops of inoculum were added to 1 L of the
mineral medium solution. Since some samples after the photodegradation treatment contained the
catalase enzyme, which was used to remove the excess of H2O2, additional “blank” and “quality
control” series were prepared. These series contained in addition 0.21 mg/L of catalase in order to
distinguish between the biodegradation of tested compound and possible mineralization of the
enzyme which was present in the sample.
During the whole test the consumption of oxygen in the bottles was measured daily with
an optical oxygen sensor system (Fibox 3 PreSens, Regensburg, Germany) using sensor spots in
the bottles. Besides, the temperature and the pH (day 0 and 28) were also controlled. A more
detailed description of the test can be found elsewhere (Friedrich et al., 2013; Kummerer et al.,
1996; Mahmoud and Kummerer, 2012; Trautwein et al., 2008).
According to the OECD guideline, a compound is classified as ‘‘readily biodegradable” if
biodegradability, expressed as a percentage of oxygen consumed in the test vessel compared to
maximum consumption (ThOD), exceeds 60 % within a period of ten days starting from the day
where oxygen consumption reaches 10 % ThOD. A tested compound is considered to be
inhibitory for the bacteria if the biodegradation does not reach more than 25% of ThOD within 14
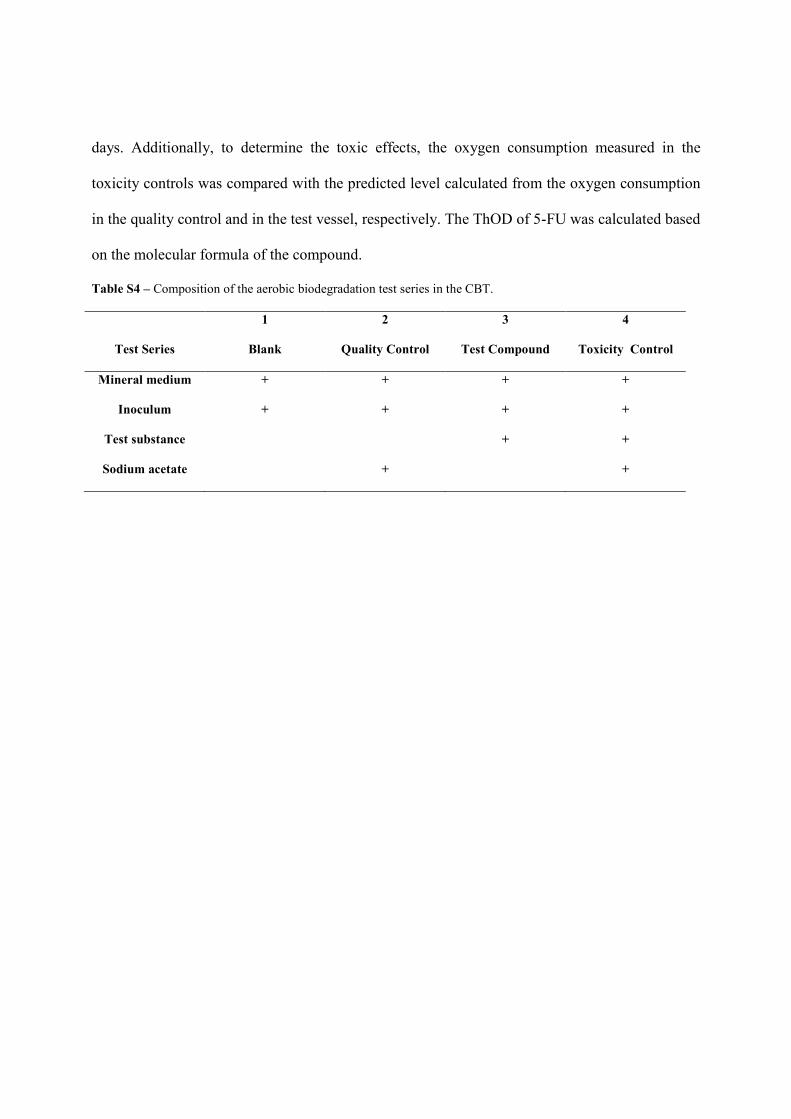
days. Additionally, to determine the toxic effects, the oxygen consumption measured in the
toxicity controls was compared with the predicted level calculated from the oxygen consumption
in the quality control and in the test vessel, respectively. The ThOD of 5-FU was calculated based
on the molecular formula of the compound.
Table S4 – Composition of the aerobic biodegradation test series in the CBT.
Test Series
1
Blank
2
Quality Control
3
Test Compound
4
Toxicity Control
Mineral medium + + + +
Inoculum + + + +
Test substance + +
Sodium acetate + +
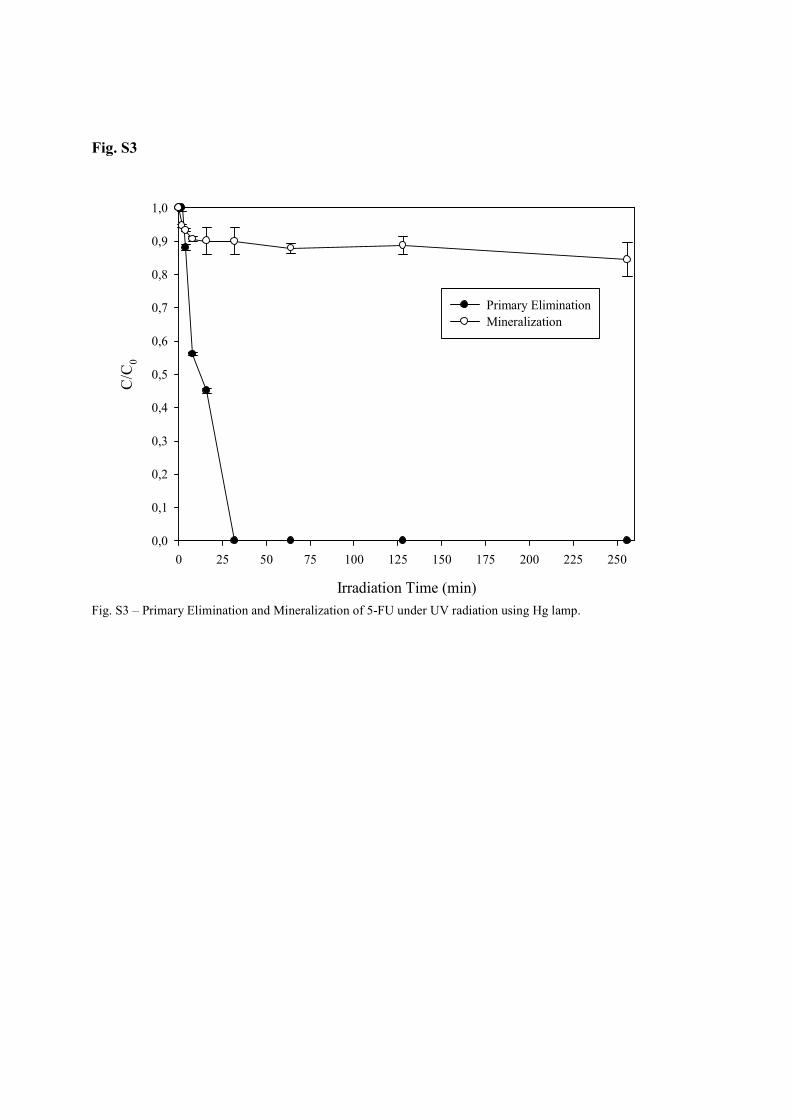
Fig. S3
Fig. S3 – Primary Elimination and Mineralization of 5-FU under UV radiation using Hg lamp.
Irradiation Time (min)
0 25 50 75 100 125 150 175 200 225 250
C/C
0
0,0
0,1
0,2
0,3
0,4
0,5
0,6
0,7
0,8
0,9
1,0
Primary EliminationMineralization
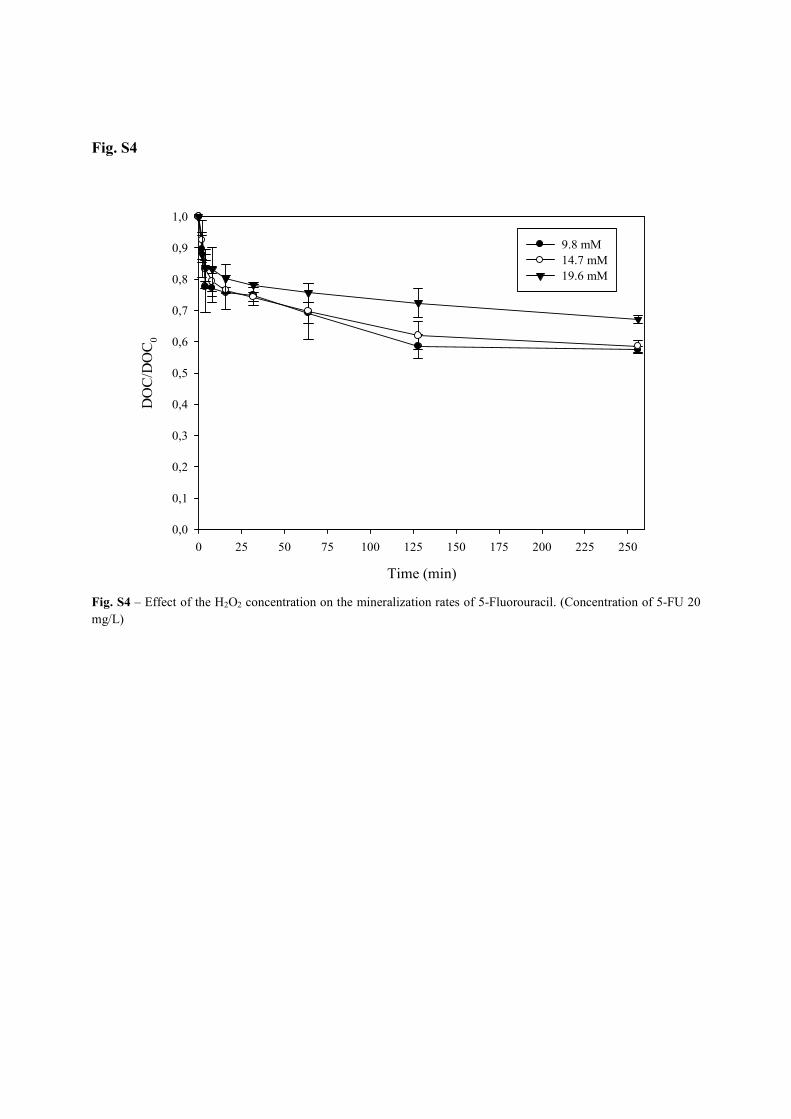
Fig. S4
Fig. S4 – Effect of the H2O2 concentration on the mineralization rates of 5-Fluorouracil. (Concentration of 5-FU 20 mg/L)
Time (min)
0 25 50 75 100 125 150 175 200 225 250
DO
C/D
OC
0
0,0
0,1
0,2
0,3
0,4
0,5
0,6
0,7
0,8
0,9
1,0
9.8 mM14.7 mM19.6 mM
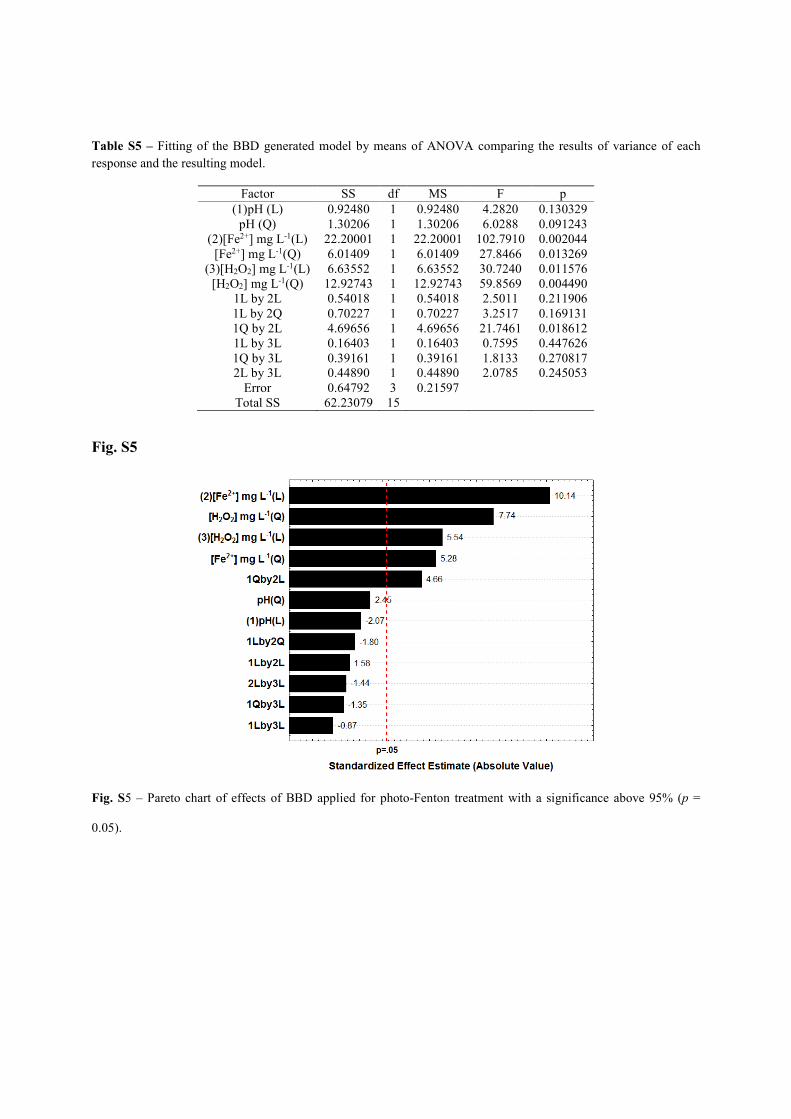
Table S5 – Fitting of the BBD generated model by means of ANOVA comparing the results of variance of each response and the resulting model.
Factor SS df MS F p (1)pH (L) 0.92480 1 0.92480 4.2820 0.130329
pH (Q) 1.30206 1 1.30206 6.0288 0.091243 (2)[Fe2+] mg L-1(L) 22.20001 1 22.20001 102.7910 0.002044
[Fe2+] mg L-1(Q) 6.01409 1 6.01409 27.8466 0.013269 (3)[H2O2] mg L-1(L) 6.63552 1 6.63552 30.7240 0.011576
[H2O2] mg L-1(Q) 12.92743 1 12.92743 59.8569 0.004490 1L by 2L 0.54018 1 0.54018 2.5011 0.211906 1L by 2Q 0.70227 1 0.70227 3.2517 0.169131 1Q by 2L 4.69656 1 4.69656 21.7461 0.018612 1L by 3L 0.16403 1 0.16403 0.7595 0.447626 1Q by 3L 0.39161 1 0.39161 1.8133 0.270817 2L by 3L 0.44890 1 0.44890 2.0785 0.245053
Error 0.64792 3 0.21597 Total SS 62.23079 15
Fig. S5
Fig. S5 – Pareto chart of effects of BBD applied for photo-Fenton treatment with a significance above 95% (p =
0.05).
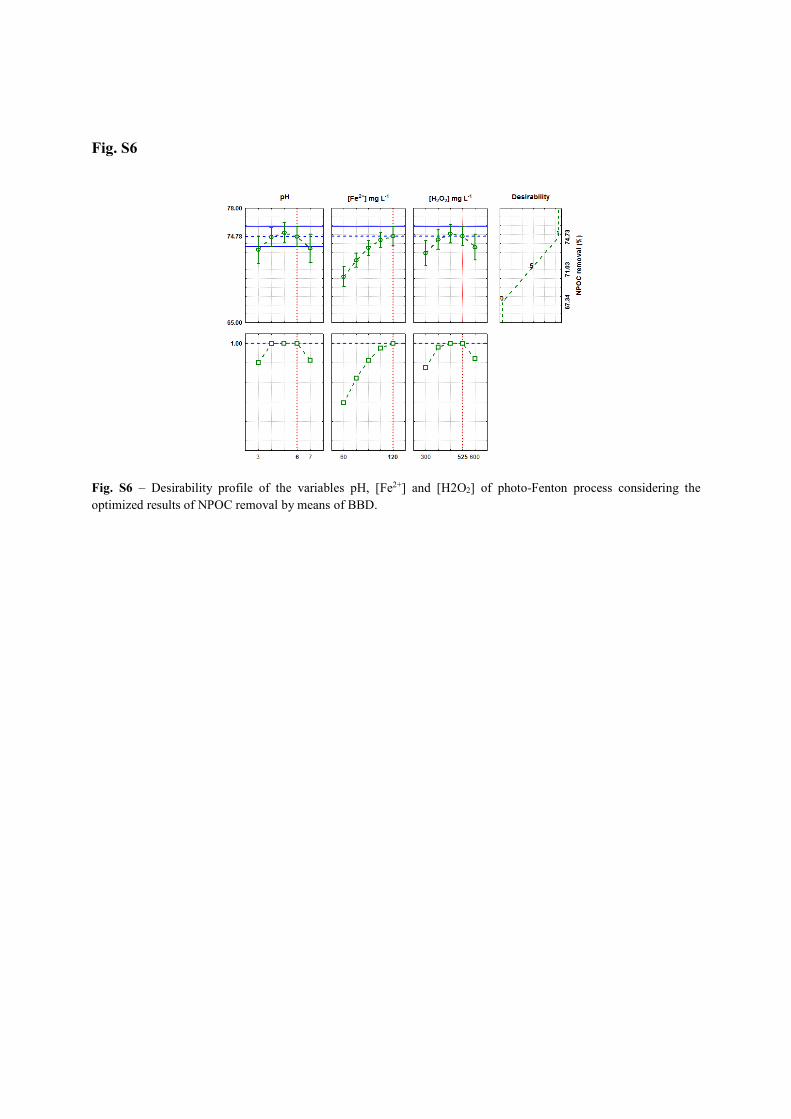
Fig. S6
Fig. S6 – Desirability profile of the variables pH, [Fe2+] and [H2O2] of photo-Fenton process considering the optimized results of NPOC removal by means of BBD.
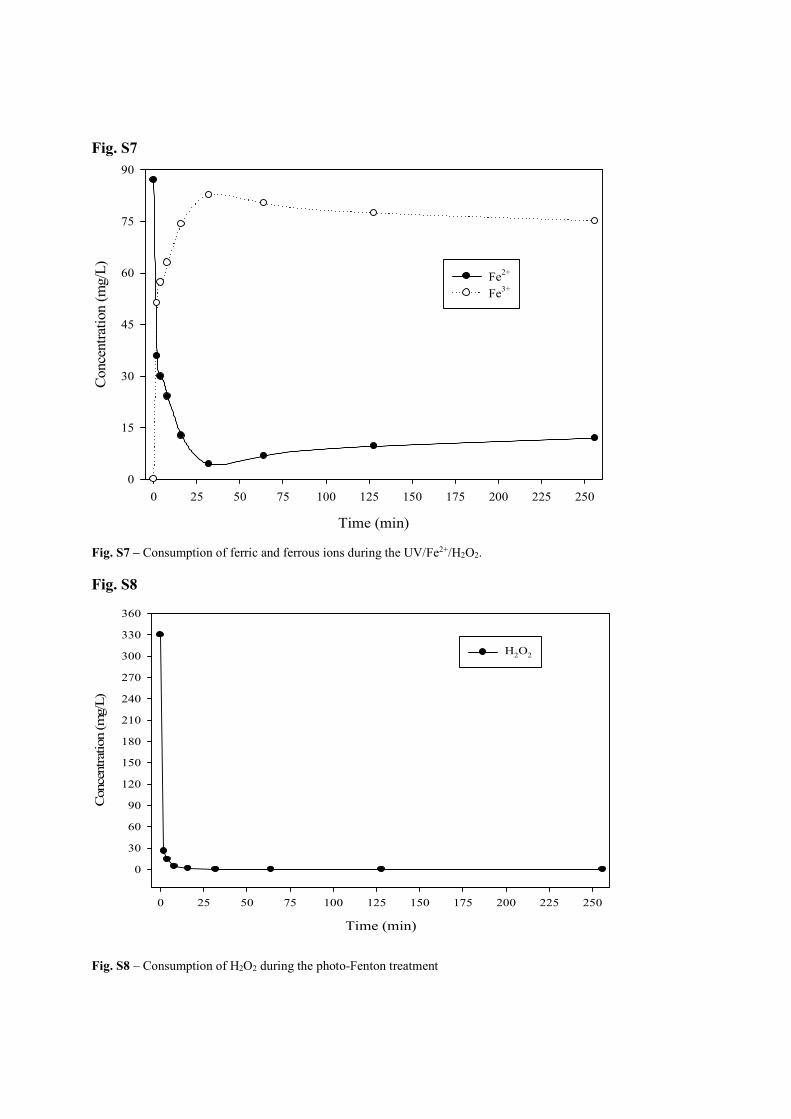
Fig. S7
Fig. S7 – Consumption of ferric and ferrous ions during the UV/Fe2+/H2O2.
Fig. S8
Fig. S8 – Consumption of H2O2 during the photo-Fenton treatment
Time (min)
0 25 50 75 100 125 150 175 200 225 250
Con
cent
rati
on (
mg/
L)
0
15
30
45
60
75
90
Fe2+
Fe3+
Time (min)
0 25 50 75 100 125 150 175 200 225 250
Con
cent
ration
(m
g/L)
0
30
60
90
120
150
180
210
240
270
300
330
360
H2O2
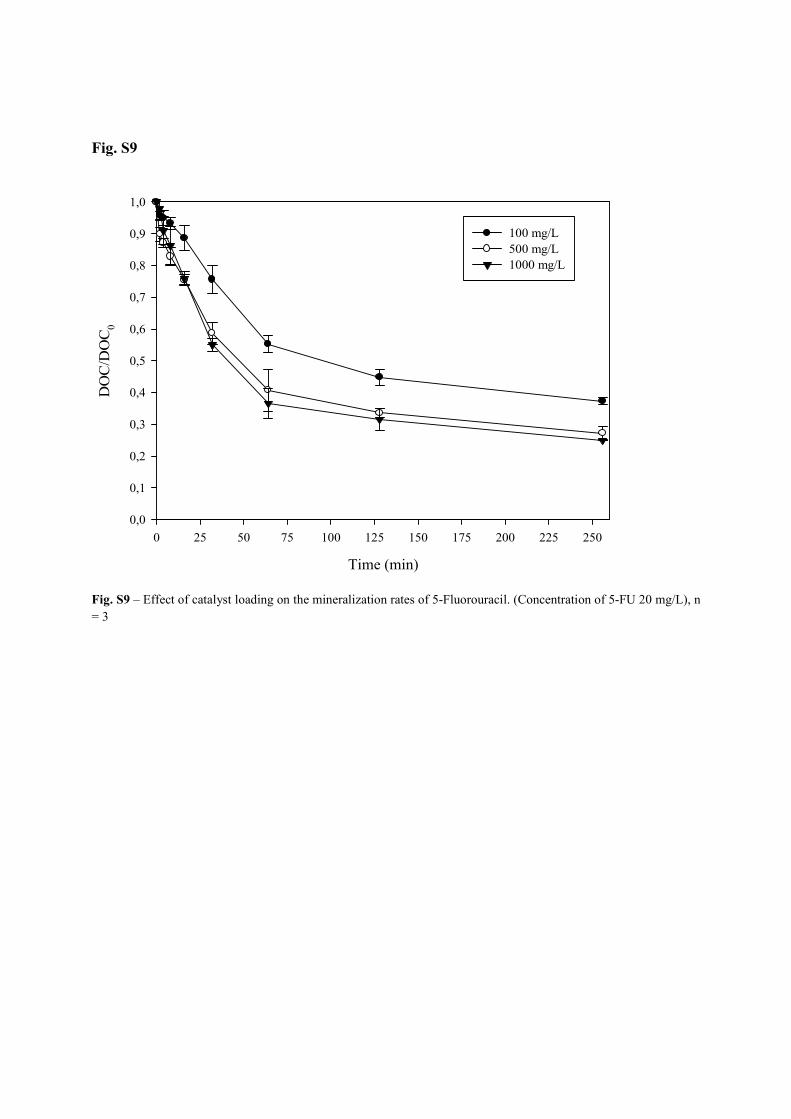
Fig. S9
Time (min)
0 25 50 75 100 125 150 175 200 225 250
DO
C/D
OC
0
0,0
0,1
0,2
0,3
0,4
0,5
0,6
0,7
0,8
0,9
1,0
100 mg/L500 mg/L1000 mg/L
Fig. S9 – Effect of catalyst loading on the mineralization rates of 5-Fluorouracil. (Concentration of 5-FU 20 mg/L), n = 3
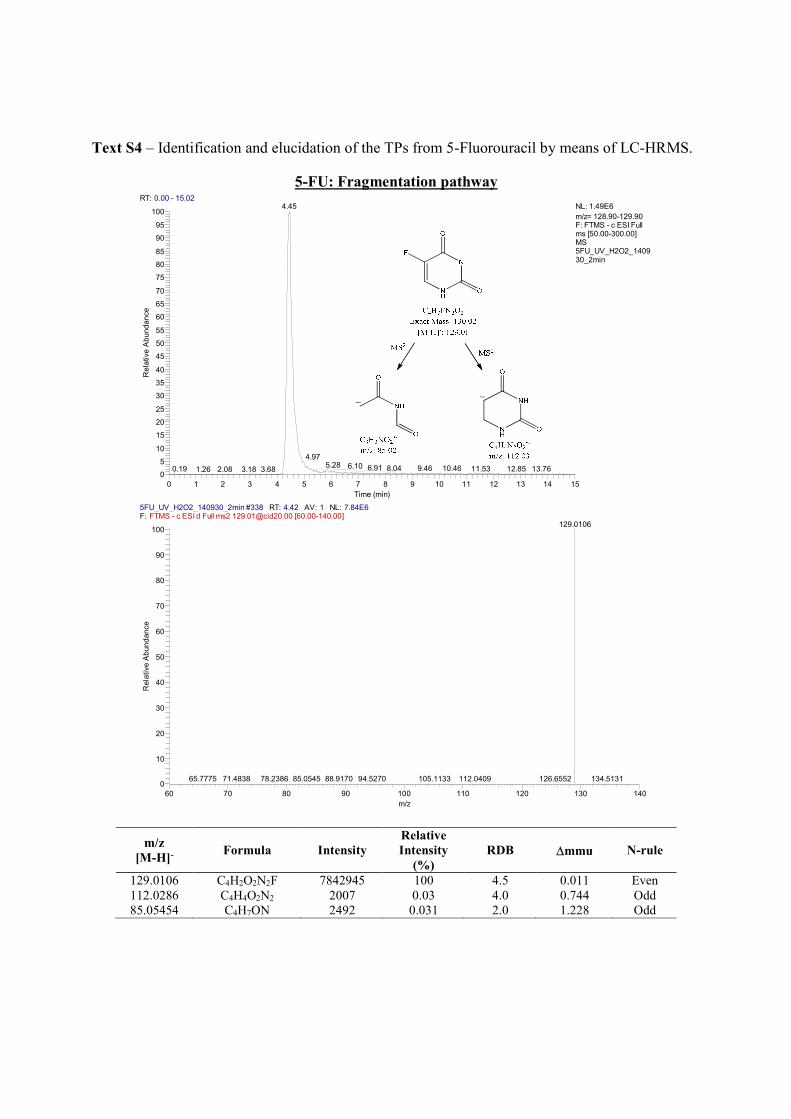
Text S4 – Identification and elucidation of the TPs from 5-Fluorouracil by means of LC-HRMS.
5-FU: Fragmentation pathway
m/z
[M-H]- Formula Intensity
Relative
Intensity
(%)
RDB mmu N-rule
129.0106 C4H2O2N2F 7842945 100 4.5 0.011 Even 112.0286 C4H4O2N2 2007 0.03 4.0 0.744 Odd 85.05454 C4H7ON 2492 0.031 2.0 1.228 Odd
RT: 0.00 - 15.02
0 1 2 3 4 5 6 7 8 9 10 11 12 13 14 15
Time (min)
0
5
10
15
20
25
30
35
40
45
50
55
60
65
70
75
80
85
90
95
100
Re
lative
Ab
un
da
nce
4.45
4.975.28 6.10 6.91 8.04 9.46 10.46 11.53 12.85 13.760.19 1.26 3.683.182.08
NL: 1.49E6
m/z= 128.90-129.90 F: FTMS - c ESI Full ms [50.00-300.00] MS 5FU_UV_H2O2_140930_2min
5FU_UV_H2O2_140930_2min #338 RT: 4.42 AV: 1 NL: 7.84E6F: FTMS - c ESI d Full ms2 [email protected] [60.00-140.00]
60 70 80 90 100 110 120 130 140
m/z
0
10
20
30
40
50
60
70
80
90
100
Re
lative
Ab
un
da
nce
129.0106
88.917085.054571.483865.7775 78.2386 105.113394.5270 112.0409 134.5131126.6552
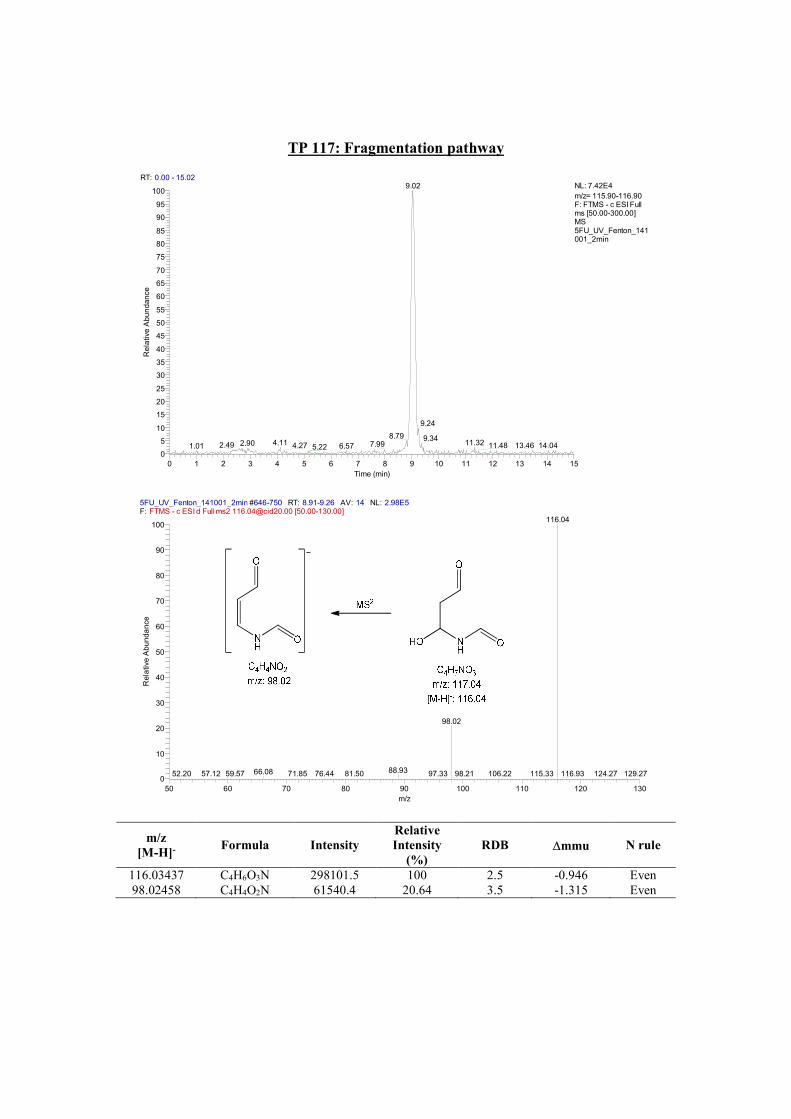
TP 117: Fragmentation pathway
m/z
[M-H]- Formula Intensity
Relative
Intensity
(%)
RDB mmu N rule
116.03437 C4H6O3N 298101.5 100 2.5 -0.946 Even 98.02458 C4H4O2N 61540.4 20.64 3.5 -1.315 Even
RT: 0.00 - 15.02
0 1 2 3 4 5 6 7 8 9 10 11 12 13 14 15
Time (min)
0
5
10
15
20
25
30
35
40
45
50
55
60
65
70
75
80
85
90
95
100
Re
lative
Ab
un
da
nce
9.02
9.24
8.79 9.3411.324.112.90 7.992.49 14.044.27 13.4611.481.01 6.575.22
NL: 7.42E4
m/z= 115.90-116.90 F: FTMS - c ESI Full ms [50.00-300.00] MS 5FU_UV_Fenton_141001_2min
5FU_UV_Fenton_141001_2min #646-750 RT: 8.91-9.26 AV: 14 NL: 2.98E5F: FTMS - c ESI d Full ms2 [email protected] [50.00-130.00]
50 60 70 80 90 100 110 120 130
m/z
0
10
20
30
40
50
60
70
80
90
100
Re
lative
Ab
un
da
nce
116.04
98.02
88.9366.08 116.9352.20 76.44 124.2757.12 115.3359.57 81.5071.85 97.33 129.2798.21 106.22
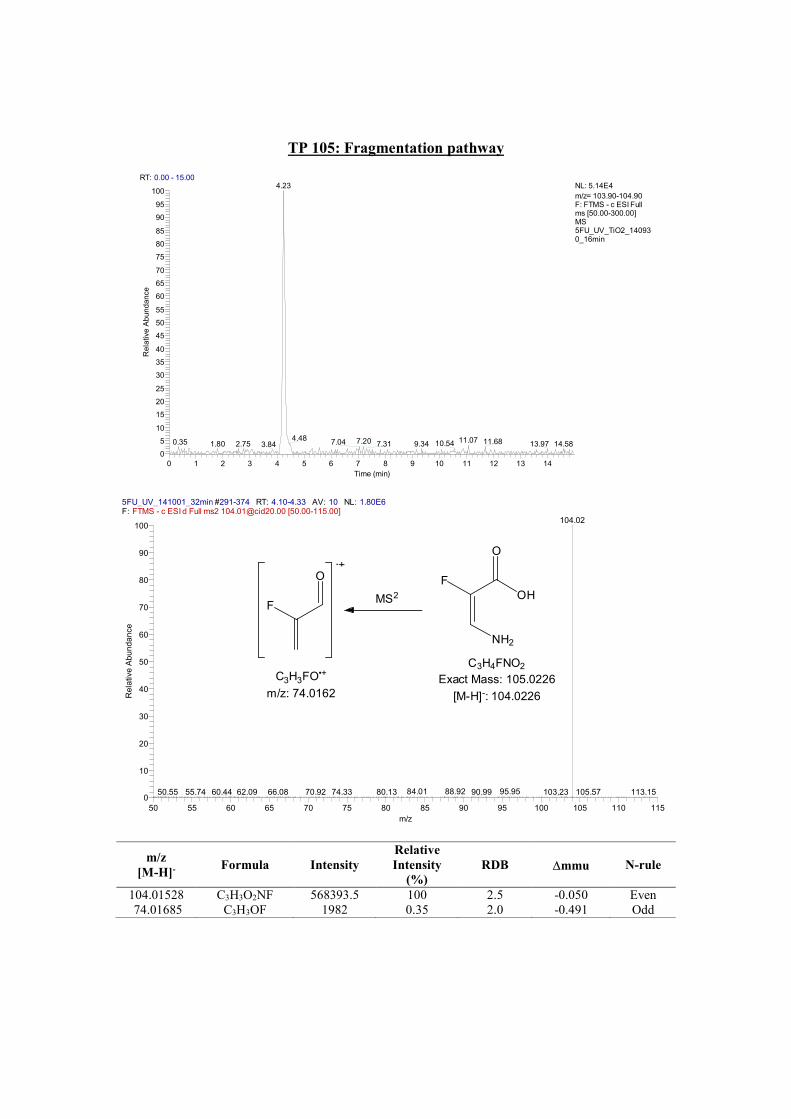
TP 105: Fragmentation pathway
m/z
[M-H]- Formula Intensity
Relative
Intensity
(%)
RDB mmu N-rule
104.01528 C3H3O2NF 568393.5 100 2.5 -0.050 Even 74.01685 C3H3OF 1982 0.35 2.0 -0.491 Odd
RT: 0.00 - 15.00
0 1 2 3 4 5 6 7 8 9 10 11 12 13 14
Time (min)
0
5
10
15
20
25
30
35
40
45
50
55
60
65
70
75
80
85
90
95
100
Re
lative
Ab
un
da
nce
4.23
4.48 11.077.20 11.687.040.35 10.541.80 9.342.75 14.587.31 13.973.84
NL: 5.14E4
m/z= 103.90-104.90 F: FTMS - c ESI Full ms [50.00-300.00] MS 5FU_UV_TiO2_140930_16min
5FU_UV_141001_32min #291-374 RT: 4.10-4.33 AV: 10 NL: 1.80E6F: FTMS - c ESI d Full ms2 [email protected] [50.00-115.00]
50 55 60 65 70 75 80 85 90 95 100 105 110 115
m/z
0
10
20
30
40
50
60
70
80
90
100
Re
lative
Ab
un
da
nce
104.02
88.92 95.9584.0166.08 113.1550.55 62.09 74.33 80.1370.9260.44 90.99 103.23 105.5755.74
NH2
O
F
OH
O
MS2
F
C3H3FO•+
m/z: 74.0162
C3H4FNO2
Exact Mass: 105.0226
[M-H]-: 104.0226
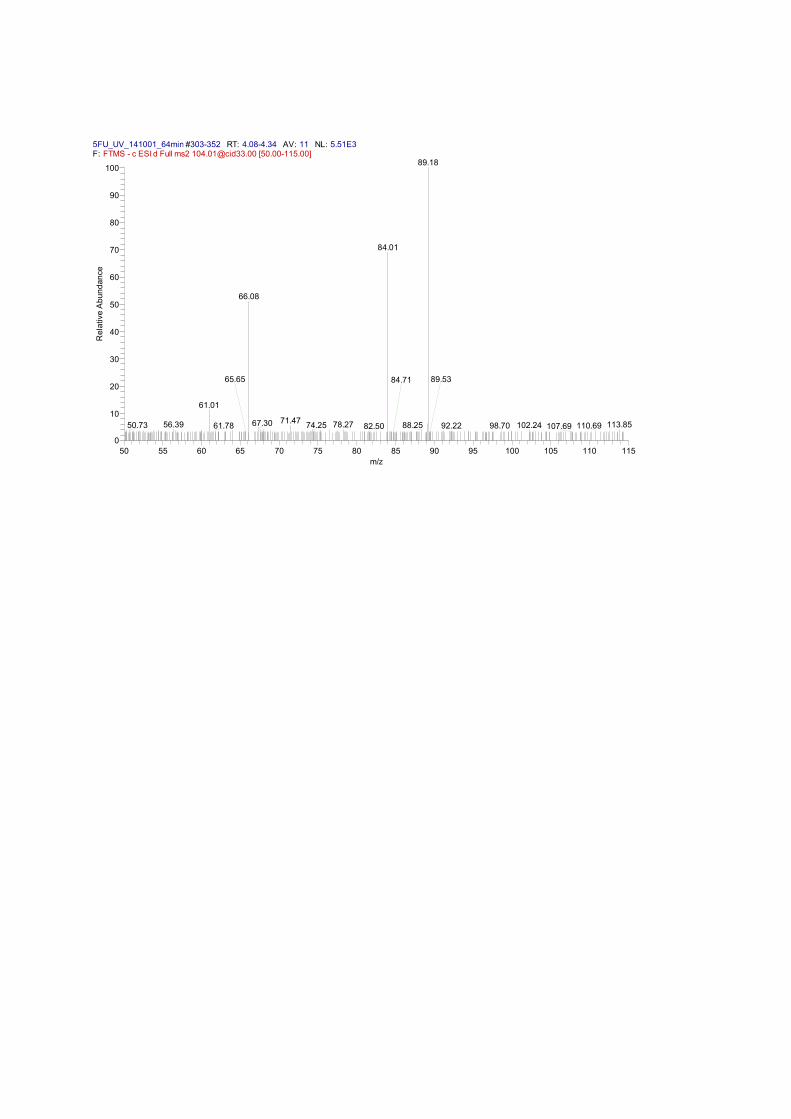
5FU_UV_141001_64min #303-352 RT: 4.08-4.34 AV: 11 NL: 5.51E3F: FTMS - c ESI d Full ms2 [email protected] [50.00-115.00]
50 55 60 65 70 75 80 85 90 95 100 105 110 115
m/z
0
10
20
30
40
50
60
70
80
90
100
Re
lative
Ab
un
da
nce
89.18
84.01
66.08
61.01
71.4767.30 113.8578.2756.39 74.2550.73 88.25 102.2461.78 92.22 98.70
65.65
110.69
89.53
82.50
84.71
107.69
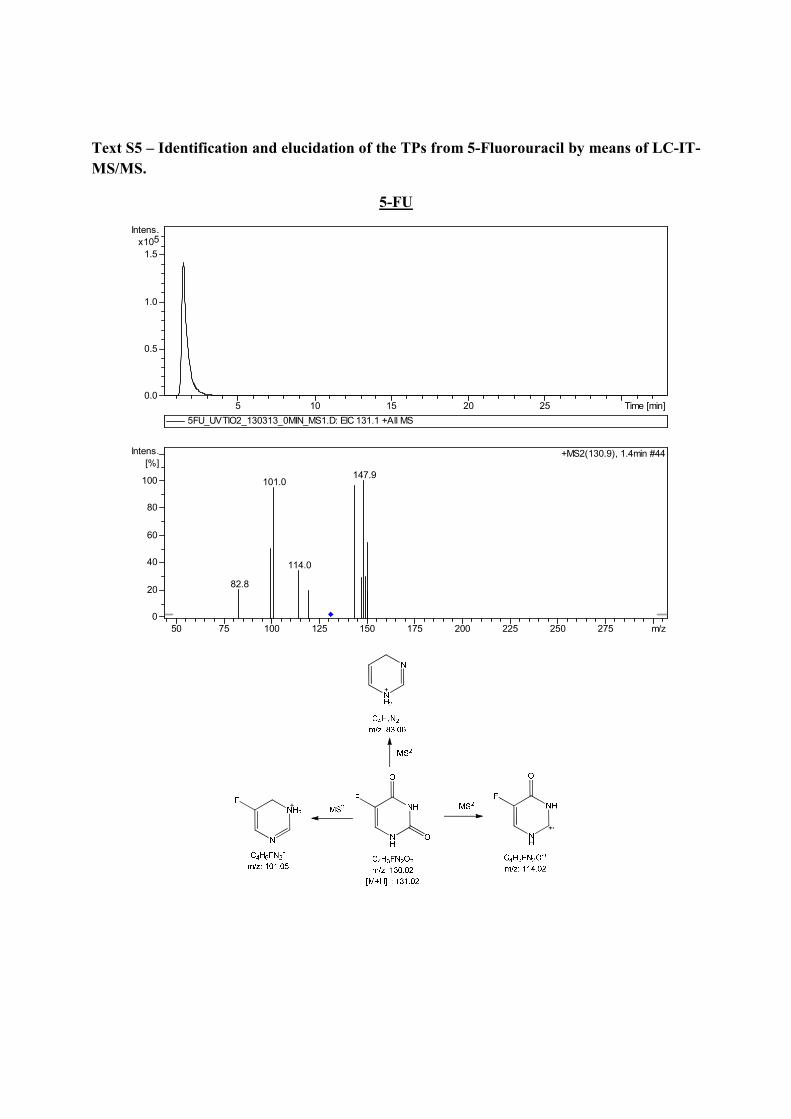
Text S5 – Identification and elucidation of the TPs from 5-Fluorouracil by means of LC-IT-
MS/MS.
5-FU
5 10 15 20 25 Time [min]0.0
0.5
1.0
1.5
5x10
Intens.
5FU_UVTIO2_130313_0MIN_MS1.D: EIC 131.1 +All MS
82.8
101.0
114.0
147.9
+MS2(130.9), 1.4min #44
0
20
40
60
80
100
Intens.
[%]
50 75 100 125 150 175 200 225 250 275 m/z
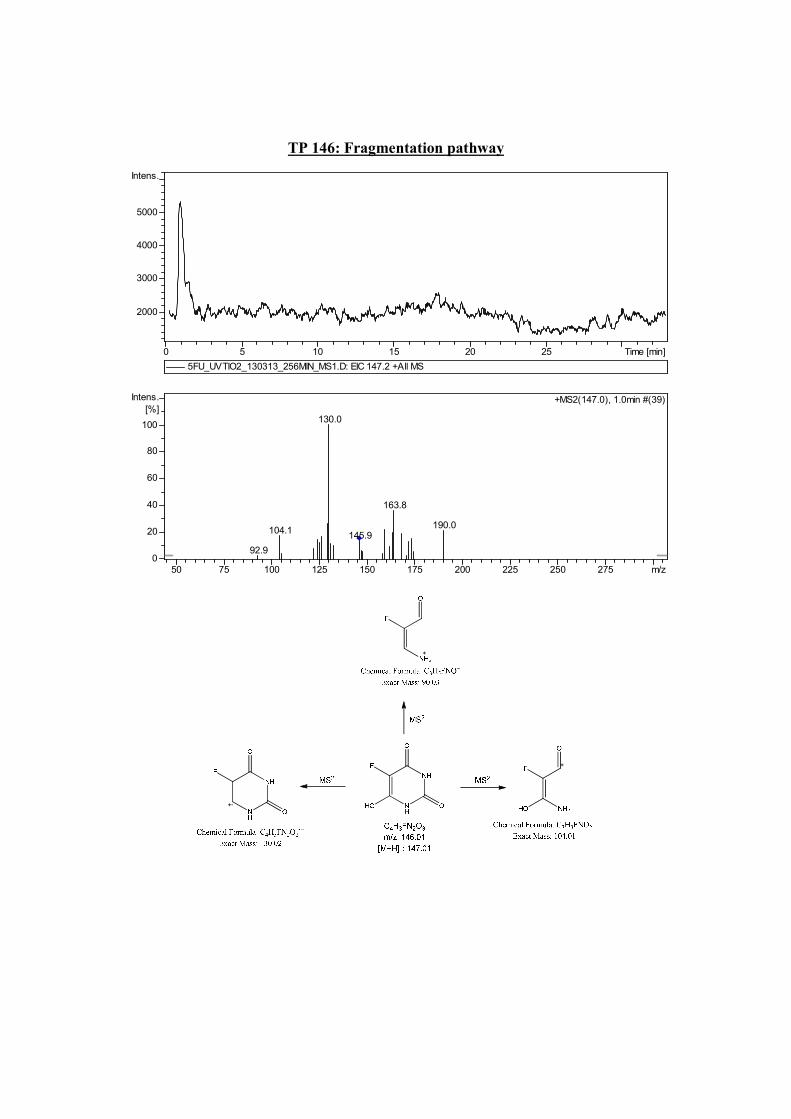
TP 146: Fragmentation pathway
0 5 10 15 20 25 Time [min]
2000
3000
4000
5000
Intens.
5FU_UVTIO2_130313_256MIN_MS1.D: EIC 147.2 +All MS
92.9
104.1
130.0
145.9
163.8
190.0
+MS2(147.0), 1.0min #(39)
0
20
40
60
80
100
Intens.
[%]
50 75 100 125 150 175 200 225 250 275 m/z
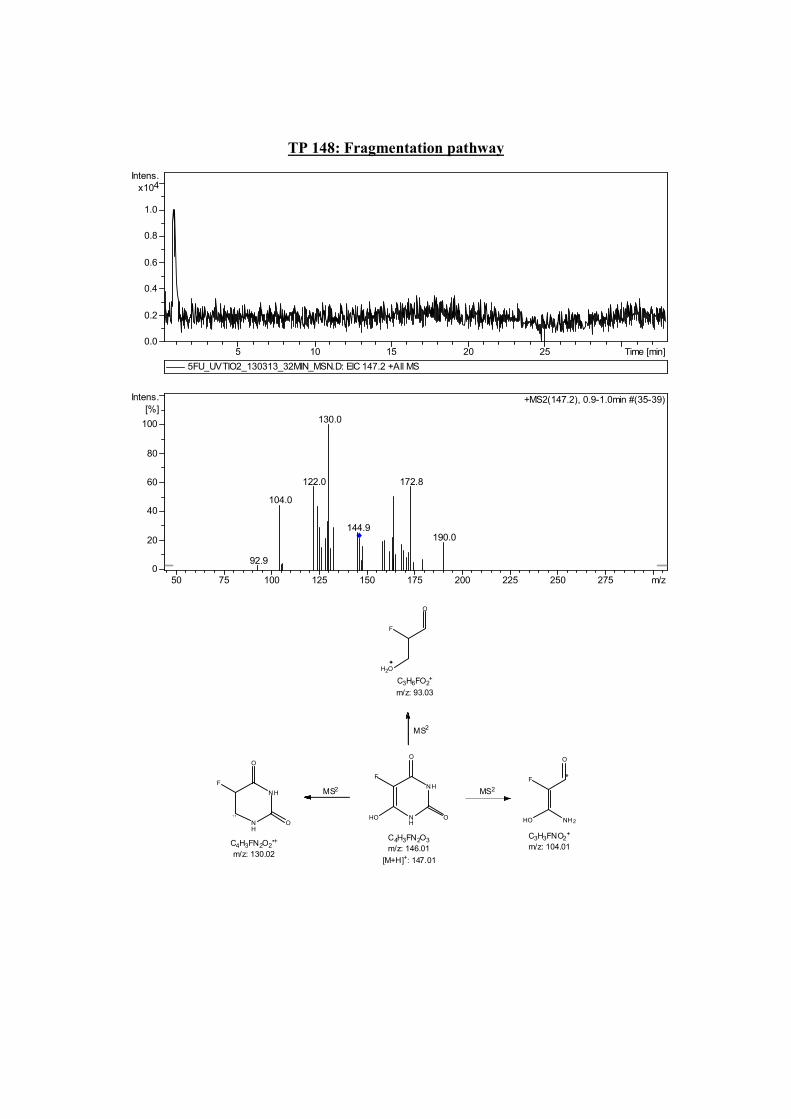
TP 148: Fragmentation pathway
NH
NH
O
O
F
HO
C4H3FN2O3
m/z: 146.01
[M+H]+: 147.01
NH
NH
O
O
NH 2
O
O
F
MS2MS2
MS2
F
C3H3FNO2+
m/z: 104.01
HO
C4H3FN2O2•+
m/z: 130.02
F
C3H6FO2+
m/z: 93.03
H2O
5 10 15 20 25 Time [min]0.0
0.2
0.4
0.6
0.8
1.0
4x10
Intens.
5FU_UVTIO2_130313_32MIN_MSN.D: EIC 147.2 +All MS
92.9
104.0
122.0
130.0
144.9
172.8
190.0
+MS2(147.2), 0.9-1.0min #(35-39)
0
20
40
60
80
100
Intens.
[%]
50 75 100 125 150 175 200 225 250 275 m/z
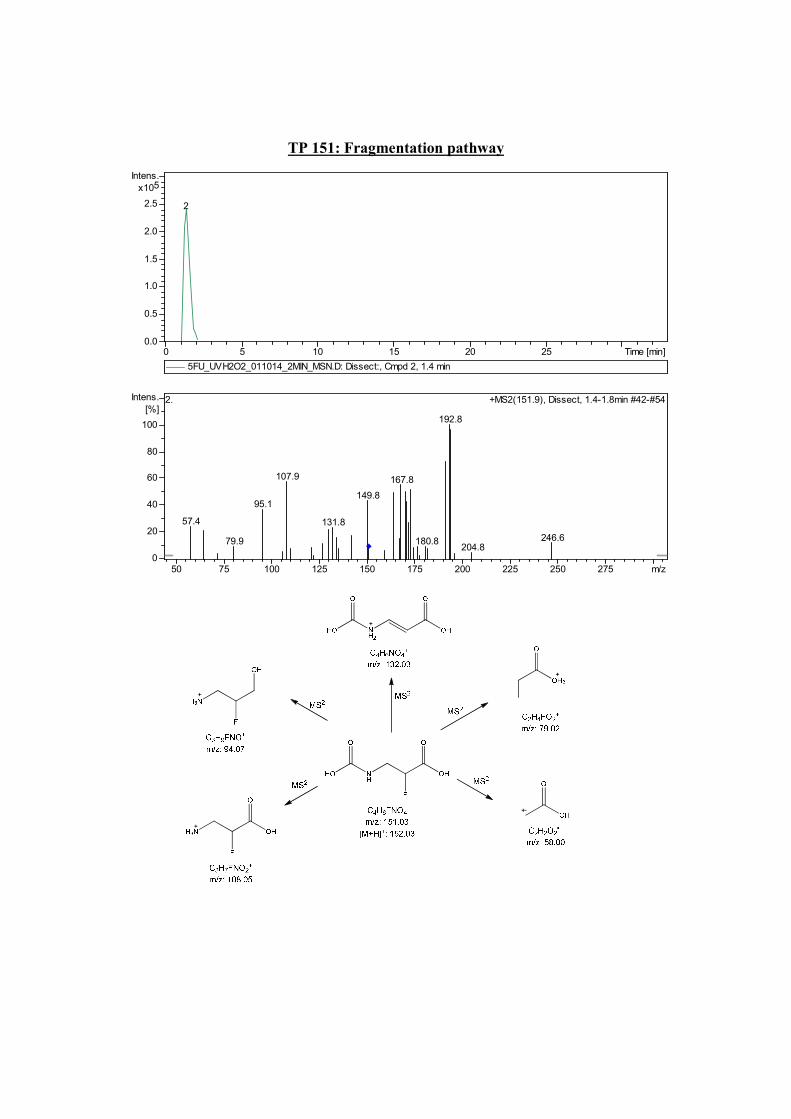
TP 151: Fragmentation pathway
2
0 5 10 15 20 25 Time [min]0.0
0.5
1.0
1.5
2.0
2.5
5x10
Intens.
5FU_UVH2O2_011014_2MIN_MSN.D: Dissect:, Cmpd 2, 1.4 min
57.4
79.9
95.1
107.9
131.8
149.8
167.8
180.8
192.8
204.8246.6
2. +MS2(151.9), Dissect, 1.4-1.8min #42-#54
0
20
40
60
80
100
Intens.
[%]
50 75 100 125 150 175 200 225 250 275 m/z
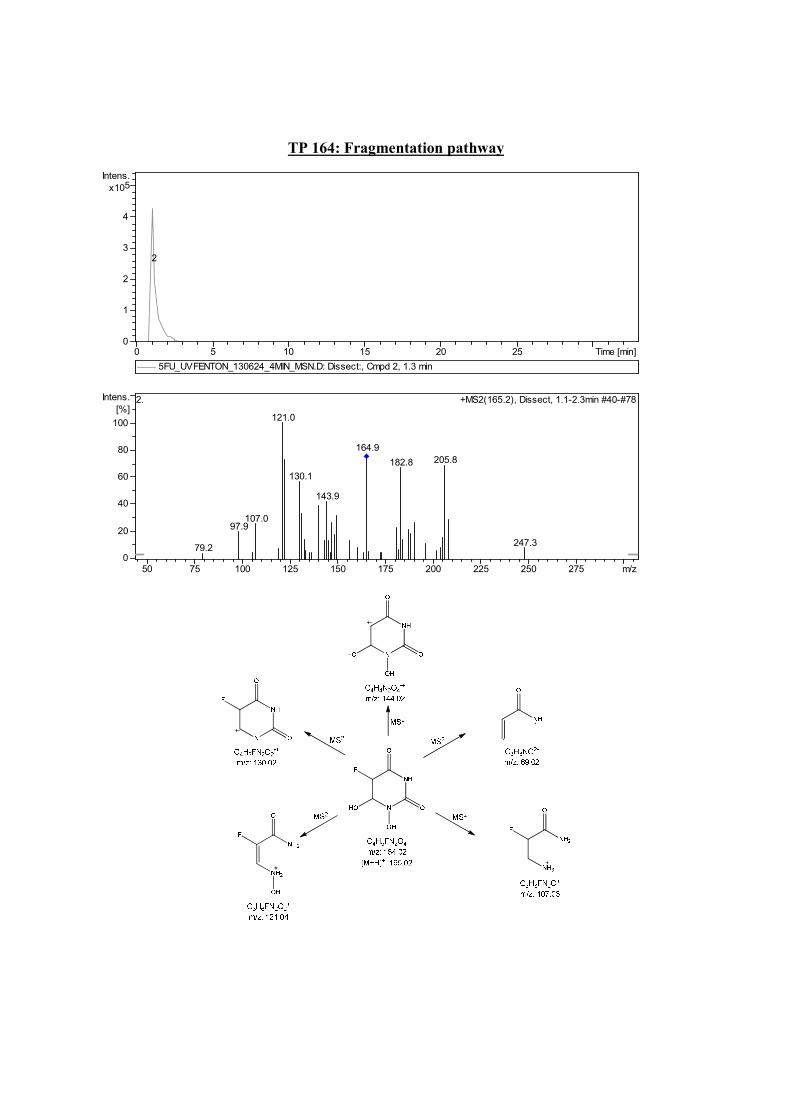
TP 164: Fragmentation pathway
2
0 5 10 15 20 25 Time [min]0
1
2
3
4
5x10
Intens.
5FU_UVFENTON_130624_4MIN_MSN.D: Dissect:, Cmpd 2, 1.3 min
79.2
97.9107.0
121.0
130.1
143.9
164.9
182.8 205.8
247.3
2. +MS2(165.2), Dissect, 1.1-2.3min #40-#78
0
20
40
60
80
100
Intens.
[%]
50 75 100 125 150 175 200 225 250 275 m/z
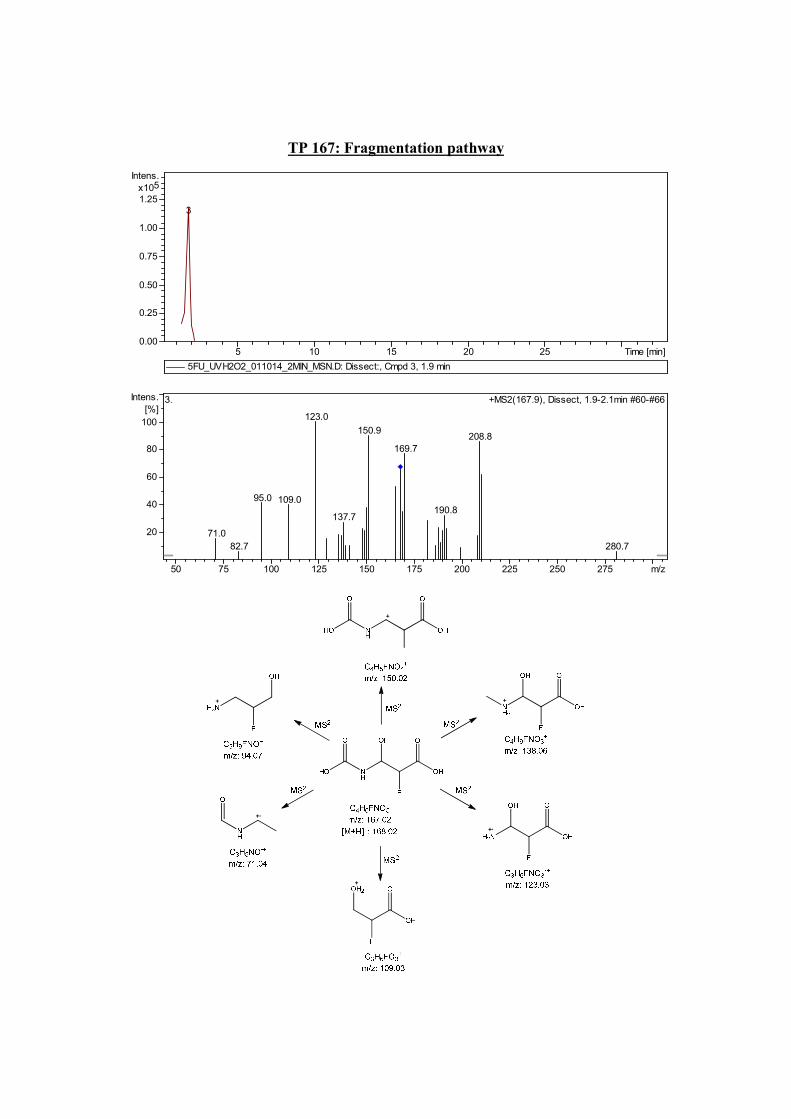
TP 167: Fragmentation pathway
3
5 10 15 20 25 Time [min]0.00
0.25
0.50
0.75
1.00
1.25
5x10
Intens.
5FU_UVH2O2_011014_2MIN_MSN.D: Dissect:, Cmpd 3, 1.9 min
71.0
82.7
95.0 109.0
123.0
137.7
150.9
169.7
190.8
208.8
280.7
3. +MS2(167.9), Dissect, 1.9-2.1min #60-#66
20
40
60
80
100
Intens.
[%]
50 75 100 125 150 175 200 225 250 275 m/z
References
Friedrich, J., Längin, A., Kümmerer, K., 2013. Comparison of an Electrochemical and
Luminescence‐Based Oxygen Measuring System for Use in the Biodegradability Testing
According to Closed Bottle Test (OECD 301D). CLEAN – Soil, Air, Water, 41, 251-257.
Kümmerer, K., Steger-Hartmann, T., Baranyai, A., Burhaus, I., 1996. Tests of biodegradation of
cytostatics cyclophosphamide and ifosfamide using the Closed Bottle Test (OECD 301
D). Zentralbl Hyg Umweltmed, 198, 215-25.
Lin AY-C, Wang X-H, Lee W-N. Phototransformation Determines the Fate of 5-Fluorouracil and
Cyclophosphamide in Natural Surface Waters. Environmental Science & Technology
2013; 47: 4104-4112.
Mahmoud, W.M., Kummerer, K., 2012. Captopril and its dimer captopril disulfide:
photodegradation, aerobic biodegradation and identification of transformation products by
HPLC-UV and LC-ion trap-MS(n). Chemosphere, 88, 1170-7.
OECD, 1992. Organisation for Economic Co-operation and Development. OECD guideline for
testing of chemicals 301D: ready biodegradability. Closed Bottle test. OECD Publishing.
Sanderson, H., Thomsen, M., 2009. Comparative analysis of pharmaceuticals versus industrial
chemicals acute aquatic toxicity classification according to the United Nations
classification system for chemicals. Assessment of the (Q)SAR predictability of
pharmaceuticals acute aquatic toxicity and their predominant acute toxic mode-of-action.
Toxicology Letters, 187, 84-93.
Trautwein, C., Kümmerer, K., Metzger, J.W., 2008. Aerobic biodegradability of the calcium
channel antagonist verapamil and identification of a microbial dead-end transformation
product studied by LC–MS/MS. Chemosphere, 72, 442-450.
Zhang, J., Chang, V.W.C., Giannis, A., Wang, J.-Y., 2013. Removal of cytostatic drugs from
aquatic environment: A review. Science of The Total Environment, 445–446, 281-298.
Article V
Biodegradation screening of chemicals in an artificial matrix simulating
the water–sediment interface.
Baginska, E., Haiß, A., Kümmerer, K., Chemosphere 2015;119:1240–6.
doi: 10.1016/j.chemosphere.2014.09.103

Biodegradation screening of chemicals in an artificial matrix simulatingthe water–sediment interface
Ewelina Baginska, Annette Haiß, Klaus Kümmerer ⇑
Sustainable Chemistry and Material Resources, Institute of Sustainable and Environmental Chemistry, Leuphana University Lüneburg, Scharnhorststrasse 1,
DE-21335 Lüneburg, Germany
h i g h l i g h t s
� New approach for screening biodegradation testing of chemicals was developed.
� Water–sediment interface was incorporated into screening test conditions.
� Artificial medium was applied to increase reproducibility of the data.
� Acetaminophen was eliminated by biodegradation.
� Ciprofloxacin was removed from water phase by sorption onto sediment.
a r t i c l e i n f o
Article history:
Received 10 June 2014
Received in revised form 16 September
2014
Accepted 22 September 2014
Available online 1 November 2014
Handling Editor: Caroline Gaus
Keywords:
Biodegradation
Elimination
Screening test
Respirometry
Water–sediment interface
Pharmaceuticals
a b s t r a c t
Biodegradation is the most important attenuation process for most of organic chemicals in the environ-
ment. This process decides whether the organic substance itself or its degradation products rests in the
environment and should be considered for a further risk assessment. This work presents the development
of a water sediment screening test, based on OECD guideline 308, with a high significance to environmen-
tal conditions and with a good reproducibility and consistency of results. The increased reproducibility
was achieved by creating an artificial and standardized medium, based on the existing OECD guidelines
OECD 302C, 301D and 218. Each test consisted of five different series: blank, quality control, test, toxicity
control and abiotic control. Biodegradation was assessed by measurement of pressure difference in closed
vessels using the OxiTop� system. Aniline, diethylene glycol and sodium acetate were used to optimize
and validate test conditions. Additionally, two pharmaceuticals: Acetaminophen and ciprofloxacin (CIP)
were tested as an example of possible test application. Acetaminophen was mainly removed from the
system by biodegradation whereas CIP was removed from water phase by sorption onto sediment. Water
sediment test proved to be a promising tool for the biodegradation investigation of chemicals in the
water–sediment interface.
� 2014 Elsevier Ltd. All rights reserved.
1. Introduction
Biodegradation is one of the main natural attenuation processes
for most of organic chemicals in the aquatic environment. Chemi-
cals that are characterized as being biodegradable are broken down
into smaller compounds by bacteria or fungi during their growth;
in the best case they are fully mineralized (i.e., transformed to inor-
ganic compounds and/or used for biomass production). The biode-
gradability and rate of biodegradation of chemicals are important
for the estimation of parameters such as exposure to aquatic
organisms, persistency, toxicity and bioaccumulation (Blok and
Booy, 1984; Raymond et al., 2001; OECD, 2006). Biodegradation
is one of the most desirable processes in the environment, espe-
cially since products released during this bio-reactions, can be once
again assimilated into the natural element cycles (Cowan et al.,
1996).
Among different biodegradation tests developed, OECD guide-
lines for ready biodegradability testing represent the most promi-
nent group of internationally used screening biodegradation tests
(301A-F) (Strotmann et al., 1995; OECD, 2006; Guhl and Steber,
2006). All these ready biodegradability screening tests are very
simple in their designs and use indirect measurement of elimina-
tion e.g., oxygen decrease, carbon dioxide evolution or pressure
http://dx.doi.org/10.1016/j.chemosphere.2014.09.103
0045-6535/� 2014 Elsevier Ltd. All rights reserved.
⇑ Corresponding author at: Leuphana Universität Lüneburg, Institut für Nachhal-
tige Chemie und Umweltchemie, Scharnhorststraße 1/C13, D-21335 Lüneburg,
Germany. Tel.: +49 4131 677 2893.
E-mail address: [email protected] (K. Kümmerer).
Chemosphere 119 (2015) 1240–1246
Contents lists available at ScienceDirect
Chemosphere
journal homepage: www.elsevier .com/locate /chemosphere
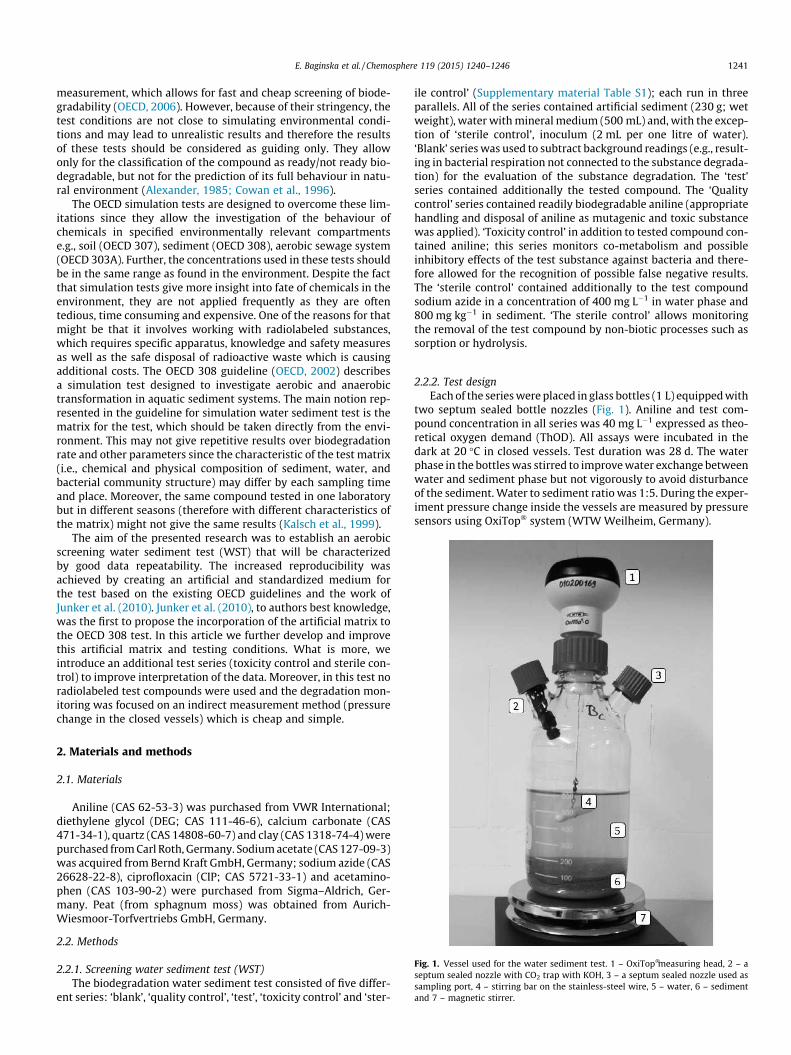
measurement, which allows for fast and cheap screening of biode-
gradability (OECD, 2006). However, because of their stringency, the
test conditions are not close to simulating environmental condi-
tions and may lead to unrealistic results and therefore the results
of these tests should be considered as guiding only. They allow
only for the classification of the compound as ready/not ready bio-
degradable, but not for the prediction of its full behaviour in natu-
ral environment (Alexander, 1985; Cowan et al., 1996).
The OECD simulation tests are designed to overcome these lim-
itations since they allow the investigation of the behaviour of
chemicals in specified environmentally relevant compartments
e.g., soil (OECD 307), sediment (OECD 308), aerobic sewage system
(OECD 303A). Further, the concentrations used in these tests should
be in the same range as found in the environment. Despite the fact
that simulation tests give more insight into fate of chemicals in the
environment, they are not applied frequently as they are often
tedious, time consuming and expensive. One of the reasons for that
might be that it involves working with radiolabeled substances,
which requires specific apparatus, knowledge and safety measures
as well as the safe disposal of radioactive waste which is causing
additional costs. The OECD 308 guideline (OECD, 2002) describes
a simulation test designed to investigate aerobic and anaerobic
transformation in aquatic sediment systems. The main notion rep-
resented in the guideline for simulation water sediment test is the
matrix for the test, which should be taken directly from the envi-
ronment. This may not give repetitive results over biodegradation
rate and other parameters since the characteristic of the test matrix
(i.e., chemical and physical composition of sediment, water, and
bacterial community structure) may differ by each sampling time
and place. Moreover, the same compound tested in one laboratory
but in different seasons (therefore with different characteristics of
the matrix) might not give the same results (Kalsch et al., 1999).
The aim of the presented research was to establish an aerobic
screening water sediment test (WST) that will be characterized
by good data repeatability. The increased reproducibility was
achieved by creating an artificial and standardized medium for
the test based on the existing OECD guidelines and the work of
Junker et al. (2010). Junker et al. (2010), to authors best knowledge,
was the first to propose the incorporation of the artificial matrix to
the OECD 308 test. In this article we further develop and improve
this artificial matrix and testing conditions. What is more, we
introduce an additional test series (toxicity control and sterile con-
trol) to improve interpretation of the data. Moreover, in this test no
radiolabeled test compounds were used and the degradation mon-
itoring was focused on an indirect measurement method (pressure
change in the closed vessels) which is cheap and simple.
2. Materials and methods
2.1. Materials
Aniline (CAS 62-53-3) was purchased from VWR International;
diethylene glycol (DEG; CAS 111-46-6), calcium carbonate (CAS
471-34-1), quartz (CAS 14808-60-7) and clay (CAS 1318-74-4)were
purchased fromCarl Roth, Germany. Sodiumacetate (CAS 127-09-3)
was acquired from Bernd Kraft GmbH, Germany; sodium azide (CAS
26628-22-8), ciprofloxacin (CIP; CAS 5721-33-1) and acetamino-
phen (CAS 103-90-2) were purchased from Sigma–Aldrich, Ger-
many. Peat (from sphagnum moss) was obtained from Aurich-
Wiesmoor-Torfvertriebs GmbH, Germany.
2.2. Methods
2.2.1. Screening water sediment test (WST)
The biodegradation water sediment test consisted of five differ-
ent series: ‘blank’, ‘quality control’, ‘test’, ‘toxicity control’ and ‘ster-
ile control’ (Supplementary material Table S1); each run in three
parallels. All of the series contained artificial sediment (230 g; wet
weight), water withmineral medium (500 mL) and, with the excep-
tion of ‘sterile control’, inoculum (2 mL per one litre of water).
‘Blank’ serieswas used to subtract background readings (e.g., result-
ing in bacterial respiration not connected to the substance degrada-
tion) for the evaluation of the substance degradation. The ‘test’
series contained additionally the tested compound. The ‘Quality
control’ series contained readily biodegradable aniline (appropriate
handling and disposal of aniline as mutagenic and toxic substance
was applied). ‘Toxicity control’ in addition to tested compound con-
tained aniline; this series monitors co-metabolism and possible
inhibitory effects of the test substance against bacteria and there-
fore allowed for the recognition of possible false negative results.
The ‘sterile control’ contained additionally to the test compound
sodium azide in a concentration of 400 mg L�1 in water phase and
800 mg kg�1 in sediment. ‘The sterile control’ allows monitoring
the removal of the test compound by non-biotic processes such as
sorption or hydrolysis.
2.2.2. Test design
Each of the serieswere placed in glass bottles (1 L) equippedwith
two septum sealed bottle nozzles (Fig. 1). Aniline and test com-
pound concentration in all series was 40 mg L�1 expressed as theo-
retical oxygen demand (ThOD). All assays were incubated in the
dark at 20 �C in closed vessels. Test duration was 28 d. The water
phase in the bottleswas stirred to improvewater exchange between
water and sediment phase but not vigorously to avoid disturbance
of the sediment.Water to sediment ratio was 1:5. During the exper-
iment pressure change inside the vessels are measured by pressure
sensors using OxiTop� system (WTW Weilheim, Germany).
Fig. 1. Vessel used for the water sediment test. 1 – OxiTop�measuring head, 2 – a
septum sealed nozzle with CO2 trap with KOH, 3 – a septum sealed nozzle used as
sampling port, 4 – stirring bar on the stainless-steel wire, 5 – water, 6 – sediment
and 7 – magnetic stirrer.
E. Baginska et al. / Chemosphere 119 (2015) 1240–1246 1241
2.2.2.1. Composition of the artificial matrix.
All components of artificial medium were standardized and
based on OECD guidelines for testing of chemicals. Inoculum
(OECD guideline 302C (OECD, 1981)) prepared from mixed sources
of surface water and sediment as well as effluent from sewage
treatment plant. Since the low bacterial density was suspected in
WST the mineral medium composition, which contained of mineral
salts, trace elements, and growth factors, was based on the OECD
guideline 301D (OECD, 1992)) where low bacterial density is used.
Artificial sediment (OECD guideline 218 (OECD, 2004)) was
composed of kaolin clay (5% dry weight), quartz sand (grain size
0.8–0.2 mm; 92% dry weight), sphagnum moss peat (2% dry
weight), and calcium carbonate (<0.1% dry weight). Details of the
preparation of the above matrix are included in Supplementary
material.
2.2.3. Endpoints
The assessment of biodegradation is based on the measurement
of a pressure difference with the OxiTop� system (WTW, 2006).
During the biodegradation, the oxygen is used by the microorgan-
isms, and carbon dioxide is released. CO2 is then captured by the
KOH pellets, placed in the rubber hood in the bottle above the
water phase. Eq. (1) had been used for calculations of the biological
oxygen demand (BOD) values.
BOD ¼MðO2Þ
RTm
V t � V l
V l
þ aTm
To
� �
DpðO2Þ ð1Þ
where BOD – biological oxygen demand (mg L�1); M(O2) – molecu-
lar weight (32,000 mg mol�1); R – gas constant (83.144 L
mbar mol�1 K�1); T0 – reference temperature (273.15 K); Tm – mea-
suring temperature (K); Vt – bottle volume (mL); Vl – sample
volume (mL); a – Bunsen adsorption coefficient (0.03103); Dp
(O2) – difference of the oxygen partial pressure (mbar).
Additionally, to monitor the bacterial toxicity of inoculum the
oxygen consumption was measured in the toxicity control and
compared with the predicted level computed from the oxygen con-
sumption in the ‘quality control’ and in the ‘test’. Substance is con-
sidered to be toxic if measured toxicity control is lower than 25%
which corresponds to less than 50% degradation of aniline. If the
measured ‘toxicity control’ is lower than calculated one substance
is assumed to have negative influence on inoculum
2.2.4. Optimization and validation
Two pre-tests were conducted to optimize the test based on the
design. Because the indirect measurement method of compound
mineralization (i.e., change in pressure of the head space) used in
the WST, the first pre-test was conducted to determine the opti-
mum ThODwithminimum background influence, for the given test
conditions. The concentrations of test compounds where optimized
to the best fitting in terms of ThOD. In this pre-test, where aniline
was tested at four different concentrations: 4, 10, 20, and 40 mg L�1
which in terms of ThOD correspond to 9.6, 24.1, 48.2, and
96.4 mg L�1 of ThOD, respectively. Secondly, for the choice of the
optimum quality control, biodegradation of three compounds were
investigated, namely: Aniline (99.96 mg L�1); diethylene glycol
(DEG; 80.28 mg L�1), and sodium acetate (20.16 mg L�1).
Additionally, to determine the change in bacterial density during
the inoculum cultivation, colony forming units (CFUs) were deter-
mined according to ISO EN 6222:1999 standard. Three time points
were considered for CFUs: (1) directly after sample collection mix-
ing and filtration, (2) at the third day of cultivation, when inoculum
was used for sediment conditioning and (3) at the tenth daywhen it
was used for the test. Also, for the comparison, the CFUs of effluent
from sewage treatment plant (STP) were determined. Agar plates
were inoculated with tenfold dilution of inoculum samples in 1%
peptone water solution. All dilutions were inoculated in triplicates
and incubated at 20 �C for 68 ± 4 h. After that time CFUs were
counted.
2.2.5. Biodegradation of acetaminophen and ciprofloxacin
Biodegradation of two pharmaceuticals, namely acetaminophen
and ciprofloxacin, in the WST was investigated. The concentrations
used in the test were 22.4 mg L�1 for acetaminophen and
24.0 mg L�1 for ciprofloxacin which corresponds each to a ThOD
concentration of 40 mg L�1. Ciprofloxacin was expected to be influ-
enced by sorption, therefore removal fromwater phasewas investi-
gated. For that,water sampleswere collectedwith a syringe through
sample port, at days 0, 1 and 28. The samples were stored at�20 �C
until theyweremeasured by theHPLC-fluorescence detection (FDA)
(Shimadzu Prominence HPLC system; Duisburg, Germany) at exci-
tationwavelength as set at 278 nmand the emissionwasmonitored
at 445 nm. The analytical method is described elsewhere in detail
(Haddad and Kümmerer, 2014). Briefly, the chromatographic sepa-
rations was carried out on a RP18 EC 125 mm � 4 mm, 5 lmNucle-
odur reverse phase column (Macherey–Nagel, Düren, Germany). A
gradient program was used for the mobile phase, combining sol-
vents A (formic acid 0.1%) and B (acetonitrile) as follows: 5–15% B
(up to 4 min), 15% B (up to 7 min), 15–40% B (up to 10 min), 40% B
(up to 11 min), 40– 5% B (up to 13 min), 5% B (up to 17 min). Flow
rate was 0.7 mL min�1, the injection volume was 5 lL and the col-
umn oven temperature was maintained at 40 �C. Prior to analysis,
samples were filtered through 0.2 lm PES filters (Macherey–Nagel
GmbH & Co. KG).
3. Results and discussion
3.1. WST design
3.1.1. Substance concentration
Following the OECD guideline 308 (OECD, 2006), test substance
concentration in simulation tests should reflect the expected or
measured environmental concentrations. On the other hand, higher
concentrations are used in screening tests, which are constructed to
investigate only biodegradation potential through the use of indi-
rect measurement methods that are less sensitive than analytical
methods. In the WST, the concentration of tested substance was
depended on obtaining an indirectmeasurement thatwould be able
to distinguish the mineralization of the compound, from the high
background degradation of the organic fraction (peat) in the artifi-
cial sediment. Aniline in all four concentrations achieved similar
rates and levels of biodegradation; 64 ± 17%; 80 ± 4%; 62 ± 10%;
68 ± 84% for 40, 20, 10, and 4 mg L�1 respectively (Supplementary
material Fig. S1). With increasing concentration, the measurement
was more stable and clear biodegradation curves were observed.
With the exception of the highest concentration, the lower the con-
centration the higher the standard deviationwas observed. Best val-
ues in regards to standard deviation were obtained at a test
concentration of 20 mg L�1 aniline which corresponds to a ThOD
of 48.2 mg L�1. Optimum test substance concentration was there-
fore decided to be 40 mg L�1 in terms of ThOD.
3.1.2. Quality control
In the OECD guideline 308 (OECD, 2002), compounds that could
be used as reference for inoculum quality, are not specified. How-
ever, this guideline recommends reference compounds that are
radiolabeled for the identification and quantification of removal
and transformation products by different analytical methods. Con-
sequently, the results strongly depend on the part of the molecule
where the radio-label is present. In the WST presented here, inves-
tigation of the biodegradation level is conducted by the indirect
measurement of pressure development inside the test system;
1242 E. Baginska et al. / Chemosphere 119 (2015) 1240–1246
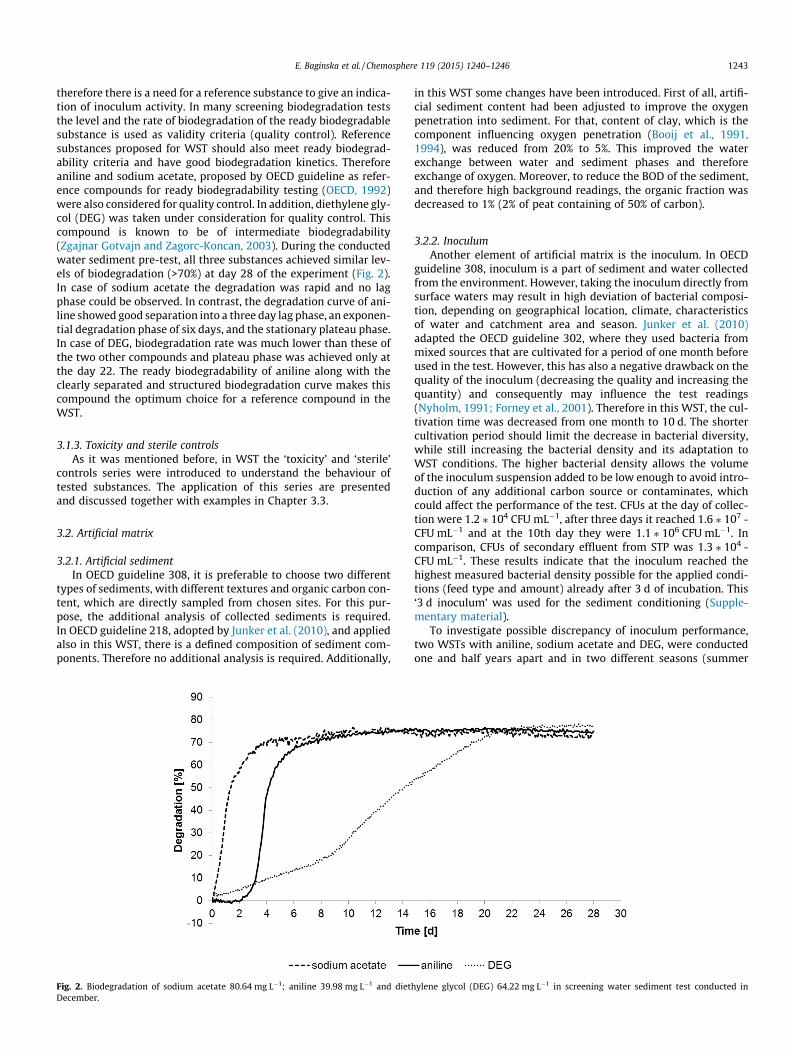
therefore there is a need for a reference substance to give an indica-
tion of inoculum activity. In many screening biodegradation tests
the level and the rate of biodegradation of the ready biodegradable
substance is used as validity criteria (quality control). Reference
substances proposed for WST should also meet ready biodegrad-
ability criteria and have good biodegradation kinetics. Therefore
aniline and sodium acetate, proposed by OECD guideline as refer-
ence compounds for ready biodegradability testing (OECD, 1992)
were also considered for quality control. In addition, diethylene gly-
col (DEG) was taken under consideration for quality control. This
compound is known to be of intermediate biodegradability
(Zgajnar Gotvajn and Zagorc-Koncan, 2003). During the conducted
water sediment pre-test, all three substances achieved similar lev-
els of biodegradation (>70%) at day 28 of the experiment (Fig. 2).
In case of sodium acetate the degradation was rapid and no lag
phase could be observed. In contrast, the degradation curve of ani-
line showed good separation into a three day lag phase, an exponen-
tial degradation phase of six days, and the stationary plateau phase.
In case of DEG, biodegradation rate was much lower than these of
the two other compounds and plateau phase was achieved only at
the day 22. The ready biodegradability of aniline along with the
clearly separated and structured biodegradation curve makes this
compound the optimum choice for a reference compound in the
WST.
3.1.3. Toxicity and sterile controls
As it was mentioned before, in WST the ‘toxicity’ and ‘sterile’
controls series were introduced to understand the behaviour of
tested substances. The application of this series are presented
and discussed together with examples in Chapter 3.3.
3.2. Artificial matrix
3.2.1. Artificial sediment
In OECD guideline 308, it is preferable to choose two different
types of sediments, with different textures and organic carbon con-
tent, which are directly sampled from chosen sites. For this pur-
pose, the additional analysis of collected sediments is required.
In OECD guideline 218, adopted by Junker et al. (2010), and applied
also in this WST, there is a defined composition of sediment com-
ponents. Therefore no additional analysis is required. Additionally,
in this WST some changes have been introduced. First of all, artifi-
cial sediment content had been adjusted to improve the oxygen
penetration into sediment. For that, content of clay, which is the
component influencing oxygen penetration (Booij et al., 1991,
1994), was reduced from 20% to 5%. This improved the water
exchange between water and sediment phases and therefore
exchange of oxygen. Moreover, to reduce the BOD of the sediment,
and therefore high background readings, the organic fraction was
decreased to 1% (2% of peat containing of 50% of carbon).
3.2.2. Inoculum
Another element of artificial matrix is the inoculum. In OECD
guideline 308, inoculum is a part of sediment and water collected
from the environment. However, taking the inoculum directly from
surface waters may result in high deviation of bacterial composi-
tion, depending on geographical location, climate, characteristics
of water and catchment area and season. Junker et al. (2010)
adapted the OECD guideline 302, where they used bacteria from
mixed sources that are cultivated for a period of one month before
used in the test. However, this has also a negative drawback on the
quality of the inoculum (decreasing the quality and increasing the
quantity) and consequently may influence the test readings
(Nyholm, 1991; Forney et al., 2001). Therefore in this WST, the cul-
tivation time was decreased from one month to 10 d. The shorter
cultivation period should limit the decrease in bacterial diversity,
while still increasing the bacterial density and its adaptation to
WST conditions. The higher bacterial density allows the volume
of the inoculum suspension added to be low enough to avoid intro-
duction of any additional carbon source or contaminates, which
could affect the performance of the test. CFUs at the day of collec-
tion were 1.2 ⁄ 104 CFU mL�1, after three days it reached 1.6 ⁄ 107 -
CFU mL�1 and at the 10th day they were 1.1 ⁄ 106 CFU mL�1. In
comparison, CFUs of secondary effluent from STP was 1.3 ⁄ 104 -
CFU mL�1. These results indicate that the inoculum reached the
highest measured bacterial density possible for the applied condi-
tions (feed type and amount) already after 3 d of incubation. This
‘3 d inoculum’ was used for the sediment conditioning (Supple-
mentary material).
To investigate possible discrepancy of inoculum performance,
two WSTs with aniline, sodium acetate and DEG, were conducted
one and half years apart and in two different seasons (summer
Fig. 2. Biodegradation of sodium acetate 80.64 mg L�1; aniline 39.98 mg L�1 and diethylene glycol (DEG) 64.22 mg L�1 in screening water sediment test conducted in
December.
E. Baginska et al. / Chemosphere 119 (2015) 1240–1246 1243
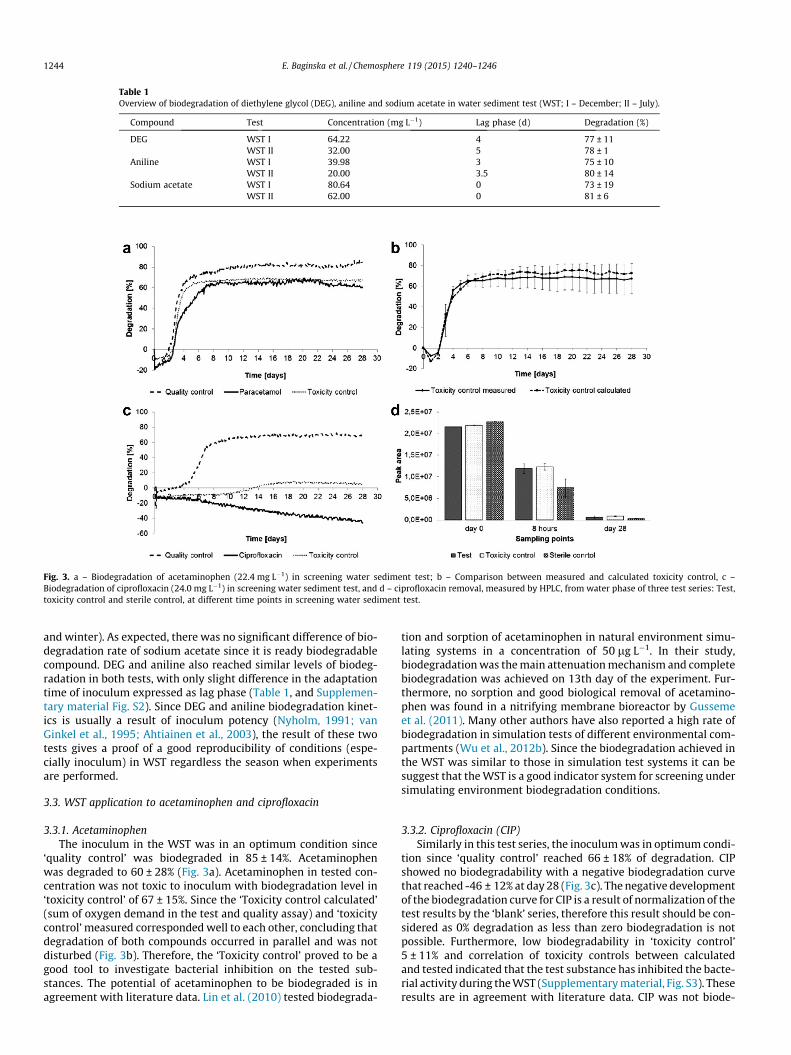
and winter). As expected, there was no significant difference of bio-
degradation rate of sodium acetate since it is ready biodegradable
compound. DEG and aniline also reached similar levels of biodeg-
radation in both tests, with only slight difference in the adaptation
time of inoculum expressed as lag phase (Table 1, and Supplemen-
tary material Fig. S2). Since DEG and aniline biodegradation kinet-
ics is usually a result of inoculum potency (Nyholm, 1991; van
Ginkel et al., 1995; Ahtiainen et al., 2003), the result of these two
tests gives a proof of a good reproducibility of conditions (espe-
cially inoculum) in WST regardless the season when experiments
are performed.
3.3. WST application to acetaminophen and ciprofloxacin
3.3.1. Acetaminophen
The inoculum in the WST was in an optimum condition since
‘quality control’ was biodegraded in 85 ± 14%. Acetaminophen
was degraded to 60 ± 28% (Fig. 3a). Acetaminophen in tested con-
centration was not toxic to inoculum with biodegradation level in
‘toxicity control’ of 67 ± 15%. Since the ‘Toxicity control calculated’
(sum of oxygen demand in the test and quality assay) and ‘toxicity
control’ measured corresponded well to each other, concluding that
degradation of both compounds occurred in parallel and was not
disturbed (Fig. 3b). Therefore, the ‘Toxicity control’ proved to be a
good tool to investigate bacterial inhibition on the tested sub-
stances. The potential of acetaminophen to be biodegraded is in
agreement with literature data. Lin et al. (2010) tested biodegrada-
tion and sorption of acetaminophen in natural environment simu-
lating systems in a concentration of 50 lg L�1. In their study,
biodegradationwas themain attenuationmechanism and complete
biodegradation was achieved on 13th day of the experiment. Fur-
thermore, no sorption and good biological removal of acetamino-
phen was found in a nitrifying membrane bioreactor by Gusseme
et al. (2011). Many other authors have also reported a high rate of
biodegradation in simulation tests of different environmental com-
partments (Wu et al., 2012b). Since the biodegradation achieved in
the WST was similar to those in simulation test systems it can be
suggest that theWST is a good indicator system for screening under
simulating environment biodegradation conditions.
3.3.2. Ciprofloxacin (CIP)
Similarly in this test series, the inoculumwas in optimum condi-
tion since ‘quality control’ reached 66 ± 18% of degradation. CIP
showed no biodegradability with a negative biodegradation curve
that reached -46 ± 12% at day 28 (Fig. 3c). The negative development
of the biodegradation curve for CIP is a result of normalization of the
test results by the ‘blank’ series, therefore this result should be con-
sidered as 0% degradation as less than zero biodegradation is not
possible. Furthermore, low biodegradability in ‘toxicity control’
5 ± 11% and correlation of toxicity controls between calculated
and tested indicated that the test substance has inhibited the bacte-
rial activity during theWST (Supplementarymaterial, Fig. S3). These
results are in agreement with literature data. CIP was not biode-
Table 1
Overview of biodegradation of diethylene glycol (DEG), aniline and sodium acetate in water sediment test (WST; I – December; II – July).
Compound Test Concentration (mg L�1) Lag phase (d) Degradation (%)
DEG WST I 64.22 4 77 ± 11
WST II 32.00 5 78 ± 1
Aniline WST I 39.98 3 75 ± 10
WST II 20.00 3.5 80 ± 14
Sodium acetate WST I 80.64 0 73 ± 19
WST II 62.00 0 81 ± 6
Fig. 3. a – Biodegradation of acetaminophen (22.4 mg L�1) in screening water sediment test; b – Comparison between measured and calculated toxicity control, c –
Biodegradation of ciprofloxacin (24.0 mg L�1) in screening water sediment test, and d – ciprofloxacin removal, measured by HPLC, from water phase of three test series: Test,
toxicity control and sterile control, at different time points in screening water sediment test.
1244 E. Baginska et al. / Chemosphere 119 (2015) 1240–1246
graded in screening biodegradation closed bottle test (Al-Ahmad
et al., 1999) and no toxic effect against bacteria was observed. How-
ever, the concentration of CIP was lower than that applied in WST.
Inhibition of bacterial activity was observed by Girardi et al.
(2011) in soil and aqueous systems with only minor mineralization
in soil. It was also found that sorption of CIP does not completely
eliminate toxic effects of the compound; however it can potentially
reduce bioavailability and its antibiotic potency (Córdova-Kreylos
and Scow, 2007). The CIPs’ EC50 for activated sludge bacteria was
estimated as 0.31–1.22 mg L�1 (Halling-Sorensen, 2000) and the
MIC50 (minimum inhibition concentration) for pathogenic bacteria
were reported to be 2–8000 lg L�1 (Al-Ahmad et al., 1999). CIP con-
centration in WST was from 20 to 77 times higher than EC50, which
could explain bacterial inhibition observed in this test.
The comparison, of substance removal from water phase,
between test and sterile controls, performed by analytical screening
of compound concentration in water phase, gave more information
on the influence of the abiotic processes e.g., sorption or hydrolysis
to CIP. CIP concentration in water phase during the test, demon-
strated that CIP was partially removed fromwater phase in all three
test series after 8 h and almost completely removed from water
phase at the end of the test (Fig. 3d), which indicates that sorption
will be the main removal process of CIP from aquatic environment.
The more rapid CIP elimination was obtained in the sterile control
which could be explained by the zwitterionic nature of CIP. Decreas-
ing the pH value by sodiumazide promote the share of cationic form
of CIP and increase sorption effects. Numerous studies showed CIP
having a strong potential to be adsorbed on clay (Li et al., 2011;
Wu et al., 2012a; Wang et al., 2011) and peat (humic substances)
(Aristilde and Sposito, 2010).
4. Summary and outlook
The WST provides testing conditions (presence of water–sedi-
ment interface) that are more complex than those in standardized
screening tests, where only biodegradation performed by bacteria
suspended in water phase is taken into account. The additional sed-
iment compartment is especially of interest for testing those chem-
icals which are known to be persistent in the environment and the
ones that may sorb to suspended solids and sediments. These com-
pounds are more likely to have contact with sediments and there-
fore eliminated by sorption or by biodegradation through
sediment bacteria, which are different to those present in the water
phase. An indirect method for the evaluation of compoundmineral-
ization, adopted from biodegradation screening tests, makes WST
less laborious than standardized simulation OECD tests where ana-
lytical methods validated for each compound and radiolabelling are
required. The limitation for application of the WST test is the toxic-
ity against inoculum of the tested compound. However, the inclu-
sion of a ‘toxicity control’ allows to exclude false negative results.
The applied indirect measurement system (OxiTop�) makes the
WST not suited for volatile compounds. Furthermore, compounds,
which have lowwater solubility, are also not suited for this method.
Further advantages of WST can be achieved by integration of a
‘sterile control’ into the test system. This, together with screening
the water phase for the test substances e.g., by HPLC, gives a good
indication of possible sorption and other non-biotic processes of
the tested compounds. Consequently, WST can be a good starting
point for further investigations of sorption and desorption in differ-
ent sediment compartments. Summarizing, the WST is more effi-
cient than other screening tests, since it gives a better
understanding of the environmental fate of organic compounds,
which is essential to estimate its effects and risks for an environ-
mental risk assessment, and at the same time affordable workload
level.
Appendix A. Supplementary material
Supplementary data associated with this article can be found, in
the online version, at http://dx.doi.org/10.1016/j.chemosphere.
2014.09.103.
References
Ahtiainen, J., Aalto, M., Pessala, P., 2003. Biodegradation of chemicals in astandardized test and in environmental conditions. Chemosphere 51 (6), 529–537.
Al-Ahmad, A., Daschner, F.D., Kümmerer, K., 1999. Biodegradability of cefotiam,ciprofloxacin, meropenem, penicillin G, and sulfamethoxazole and inhibition ofwaste water bacteria. Arch. Environ. Contam. Toxicol. 37 (2), 158–163.
Alexander, M., 1985. Biodegradation of organic chemicals. Environ. Sci. Technol. 19(2), 106–111.
Aristilde, L., Sposito, G., 2010. Binding of ciprofloxacin by humic substances: amolecular dynamics study. Environ. Toxicol. Chem. 29 (1), 90–98.
Blok, J., Booy, M., 1984. Biodegradability test results related to quality and quantityof the inoculum. Ecotox. Environ. Safe. 8 (5), 410–422.
Booij, K., Helder, W., Sundby, B., 1991. Rapid redistribution of oxygen in a sandysediment induced by changes in the flow velocity of the overlying water. Neth.J. Sea Res. 28 (3), 149–165.
Booij, K., Sundby, B., Helder, W., 1994. Measuring the flux of oxygen to a muddysediment with a cylindrical microcosm. Neth. J. Sea Res. 32 (1), 1–11.
Córdova-Kreylos, A.L., Scow, K.M., 2007. Effects of ciprofloxacin on salt marshsediment microbial communities. ISME J. 1 (7), 585–595.
Cowan, C.E., Federle, T.W., Larson, R.J., Feijtel, T.C.J., 1996. Impact of biodegradationtest methods on the development and applicability of biodegradation Qsars.SAR QSAR Environ. Res. 5 (1), 37–49.
EN ISO, 1999. EN ISO 6222:1999 – Water Quality – Enumeration of CulturableMicro-organisms – Colony Count by Inoculation in a Nutrient Agar CultureMedium.
Forney, L., Liu, W.-T., Guckert, J., Kumagai, Y., Namkung, E., Nishihara, T., Larson, R.,2001. Structure of microbial communities in activated sludge: potentialimplications for assessing the biodegradability of chemicals. Ecotox. Environ.Safe. 49 (1), 40–53.
Girardi, C., Greve, J., Lamshöft, M., Fetzer, I., Miltner, A., Schäffer, A., Kästner, M.,2011. Biodegradation of ciprofloxacin in water and soil and its effects on themicrobial communities. J. Hazard. Mater. 198, 22–30.
Guhl, W., Steber, J., 2006. The value of biodegradation screening test results forpredicting the elimination of chemicals’ organic carbon in waste watertreatment plants. Chemosphere 63 (1), 9–16.
de Gusseme, B., Vanhaecke, L., Verstraete, W., Boon, N., 2011. Degradation ofacetaminophen by Delftia tsuruhatensis and Pseudomonas aeruginosa in amembrane bioreactor. Water Res. 45 (4), 1829–1837.
Haddad, T., Kümmerer, K., 2014. Characterization of photo-transformation productsof the antibiotic drug Ciprofloxacin with liquid chromatography–tandem massspectrometry in combination with accurate mass determination using an LTQ-Orbitrap. Chemosphere 115, 40–46.
Halling-Sorensen, B., 2000. Environmental risk assessment of antibiotics:comparison of mecillinam, trimethoprim and ciprofloxacin. J. Antimicrob.Chemoth. 46 (90001), 53–58.
Junker, T., Paatzsch, C., Knacker, T., 2010. A water–sediment screening tool formeasuring biodegradation of organic chemicals. Sci. Total Environ. 408 (18),3803–3810.
Kalsch, W., Knacker, T., Danneberg, G., Studinger, G., Franke, C., 1999.Biodegradation of [14C]-4-nitrophenol in a sediment–water simulation test.Int. Biodeter. Biodegr. 44 (1), 65–74.
Li, Z., Hong, H., Liao, L., Ackley, C.J., Schulz, L.A., MacDonald, R.A., Mihelich, A.L.,Emard, S.M., 2011. A mechanistic study of ciprofloxacin removal by kaolinite.Colloid. Surf. B 88 (1), 339–344.
Lin, A.Y.-C., Lin, C.-A., Tung, H.-H., Chary, N.S., 2010. Potential for biodegradation andsorption of acetaminophen, caffeine, propranolol and acebutolol in lab-scaleaqueous environments. J. Hazard. Mater. 183 (1–3), 242–250.
Nyholm, N., 1991. The European system of standardized legal tests for assessing thebiodegradability of chemicals. Environ. Toxicol. Chem. 10 (10), 1237–1246.
OECD, 1981. Test No. 302C: Inherent Biodegradability: Modified MITI Test (II). OECDPublishing.
OECD, 1992. Test No. 301: Ready Biodegradability. OECD Publishing.OECD, 2002. Test No. 308: Aerobic and Anaerobic Transformation in Aquatic
Sediment Systems. OECD Publishing.OECD, 2004. Test No. 218: Sediment-water Chironomid Toxicity using Spiked
Sediment. OECD Publishing.OECD, 2006. Revised Introduction to the OECD Guidelines for Testing of Chemicals,
Section 3. OECD Publishing.Raymond, J.W., Rogers, T.N., Shonnard, D.R., Kline, A.A., 2001. A review of structure-
based biodegradation estimation methods. J. Hazard. Mater. 84 (2–3), 189–215.Strotmann, U.J., Schwarz, H., Pagga, U., 1995. The combined CO2/DOC test – a new
method to determine the biodegradability of organic compounds. Chemosphere30 (3), 525–538.
van Ginkel, C., Haan, A., Luuten, M., Stroo, C., 1995. Influence of the size and sourceof the inoculum on biodegradation curves in closed-bottle tests. Ecotox.Environ. Safe. 31 (3), 218–223.
E. Baginska et al. / Chemosphere 119 (2015) 1240–1246 1245

Wang, C.-J., Li, Z., Jiang, W.-T., 2011. Adsorption of ciprofloxacin on 2:1 dioctahedralclay minerals. Appl. Clay Sci. 53 (4), 723–728.
WTW, 2006. System OxiTop Control: Operating Manual, ger, 113pp.Wu, Q., Li, Z., Hong, H., 2012a. Influence of types and charges of exchangeable
cations on ciprofloxacin sorption by montmorillonite. J. Wuhan Univ. Technol.-Mat. Sci. Edit. 27 (3), 516–522.
Wu, S., Zhang, L., Chen, J., 2012b. Paracetamol in the environment and itsdegradation by microorganisms. Appl. Microbiol. Biot. 96 (4), 875–884.
Zgajnar Gotvajn, A., Zagorc-Koncan, J., 2003. Comparison of diethylene glycol andphenol biodegradability by different test methods. Arh. Hig. Rada. Toksikol. 54(3), 189–195.
1246 E. Baginska et al. / Chemosphere 119 (2015) 1240–1246

1
Supplementary material
Biodegradation screening of chemicals in artificial matrix simulating
water-sediment interface
Ewelina Baginska1; Annette Haiß1; Klaus Kümmerer1*
1Sustainable Chemistry and Material Resources, Institute of Sustainable and Environmental
Chemistry, Leuphana University Lüneburg, Scharnhorststrasse 1, DE-21335 Lüneburg,
Germany
*Corresponding author
Address: Leuphana Universität Lüneburg, Institut für Nachhaltige Chemie und
Umweltchemie, Scharnhorststraße 1/C13, D-21335 Lüneburg
Tel.: +49 4131 677-2893
E-mail address: [email protected]
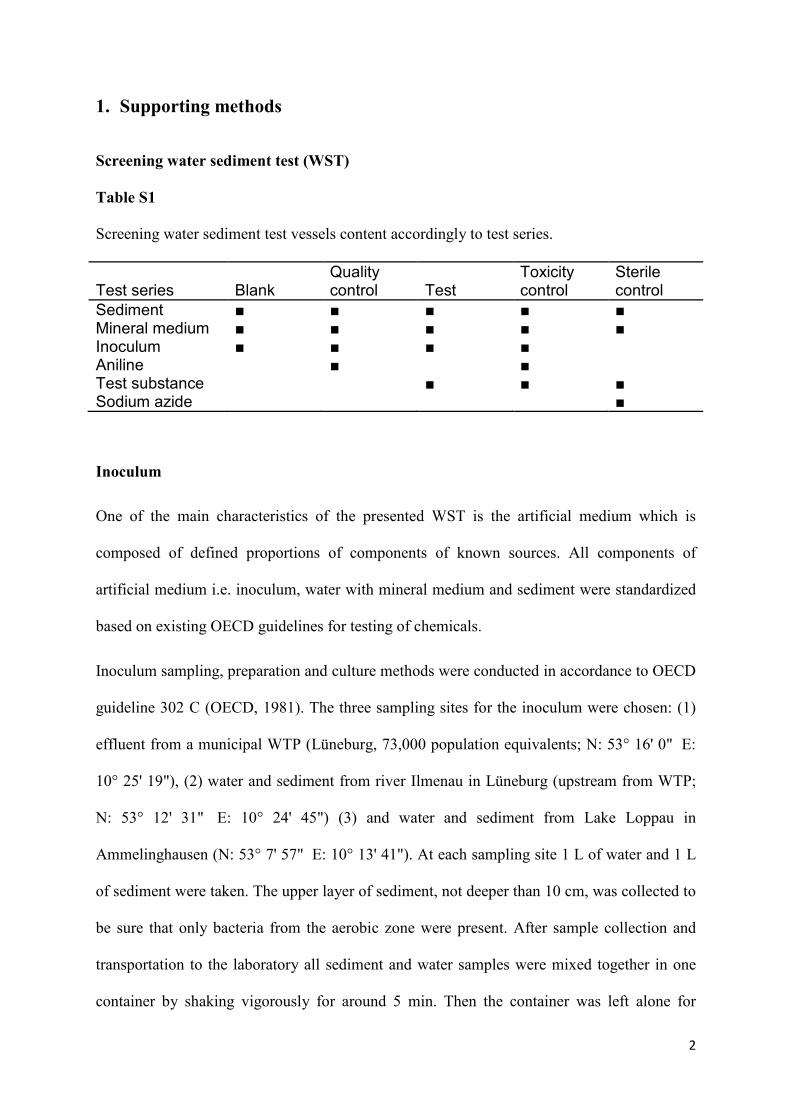
2
1. Supporting methods
Screening water sediment test (WST)
Table S1
Screening water sediment test vessels content accordingly to test series.
Test series Blank Quality control Test
Toxicity control
Sterile control
Sediment ■ ■ ■ ■ ■ Mineral medium ■ ■ ■ ■ ■ Inoculum ■ ■ ■ ■ Aniline ■ ■ Test substance ■ ■ ■ Sodium azide ■
Inoculum
One of the main characteristics of the presented WST is the artificial medium which is
composed of defined proportions of components of known sources. All components of
artificial medium i.e. inoculum, water with mineral medium and sediment were standardized
based on existing OECD guidelines for testing of chemicals.
Inoculum sampling, preparation and culture methods were conducted in accordance to OECD
guideline 302 C (OECD, 1981). The three sampling sites for the inoculum were chosen: (1)
effluent from a municipal WTP (Lüneburg, 73,000 population equivalents; N: 53° 16' 0" E:
10° 25' 19"), (2) water and sediment from river Ilmenau in Lüneburg (upstream from WTP;
N: 53° 12' 31" E: 10° 24' 45") (3) and water and sediment from Lake Loppau in
Ammelinghausen (N: 53° 7' 57" E: 10° 13' 41"). At each sampling site 1 L of water and 1 L
of sediment were taken. The upper layer of sediment, not deeper than 10 cm, was collected to
be sure that only bacteria from the aerobic zone were present. After sample collection and
transportation to the laboratory all sediment and water samples were mixed together in one
container by shaking vigorously for around 5 min. Then the container was left alone for
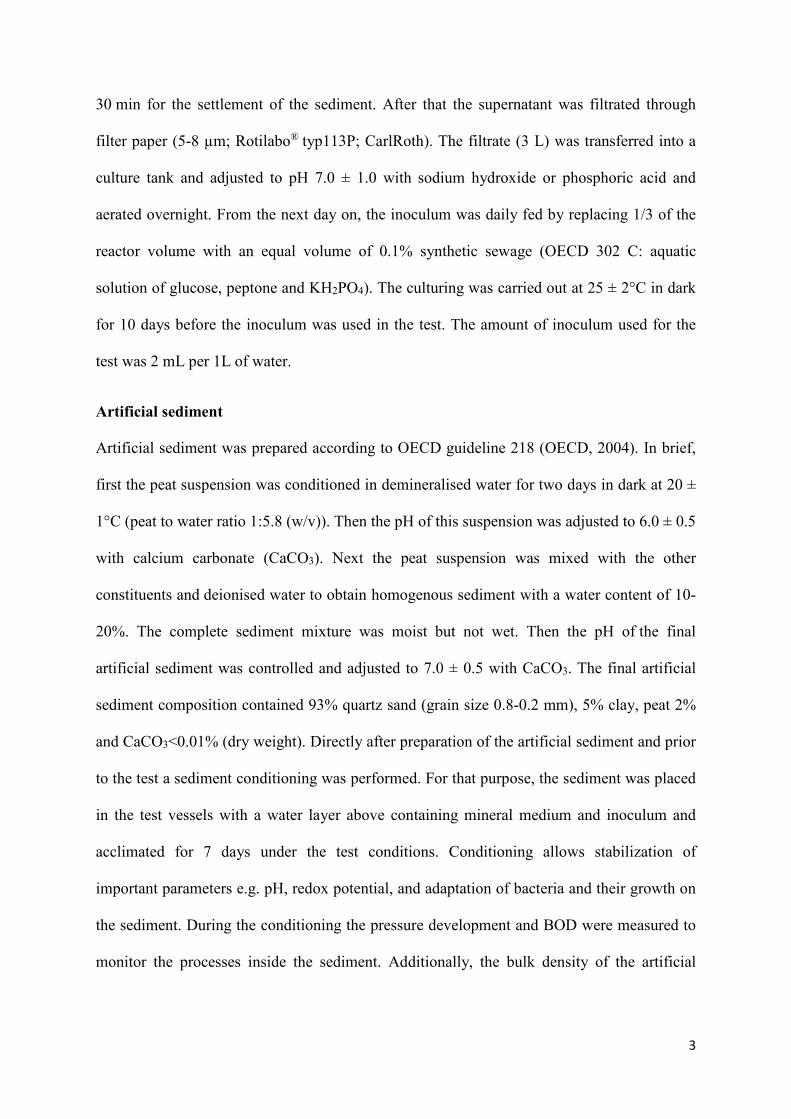
3
30 min for the settlement of the sediment. After that the supernatant was filtrated through
filter paper (5-8 µm; Rotilabo® typ113P; CarlRoth). The filtrate (3 L) was transferred into a
culture tank and adjusted to pH 7.0 ± 1.0 with sodium hydroxide or phosphoric acid and
aerated overnight. From the next day on, the inoculum was daily fed by replacing 1/3 of the
reactor volume with an equal volume of 0.1% synthetic sewage (OECD 302 C: aquatic
solution of glucose, peptone and KH2PO4). The culturing was carried out at 25 ± 2°C in dark
for 10 days before the inoculum was used in the test. The amount of inoculum used for the
test was 2 mL per 1L of water.
Artificial sediment
Artificial sediment was prepared according to OECD guideline 218 (OECD, 2004). In brief,
first the peat suspension was conditioned in demineralised water for two days in dark at 20 ±
1°C (peat to water ratio 1:5.8 (w/v)). Then the pH of this suspension was adjusted to 6.0 ± 0.5
with calcium carbonate (CaCO3). Next the peat suspension was mixed with the other
constituents and deionised water to obtain homogenous sediment with a water content of 10-
20%. The complete sediment mixture was moist but not wet. Then the pH of the final
artificial sediment was controlled and adjusted to 7.0 ± 0.5 with CaCO3. The final artificial
sediment composition contained 93% quartz sand (grain size 0.8-0.2 mm), 5% clay, peat 2%
and CaCO3<0.01% (dry weight). Directly after preparation of the artificial sediment and prior
to the test a sediment conditioning was performed. For that purpose, the sediment was placed
in the test vessels with a water layer above containing mineral medium and inoculum and
acclimated for 7 days under the test conditions. Conditioning allows stabilization of
important parameters e.g. pH, redox potential, and adaptation of bacteria and their growth on
the sediment. During the conditioning the pressure development and BOD were measured to
monitor the processes inside the sediment. Additionally, the bulk density of the artificial
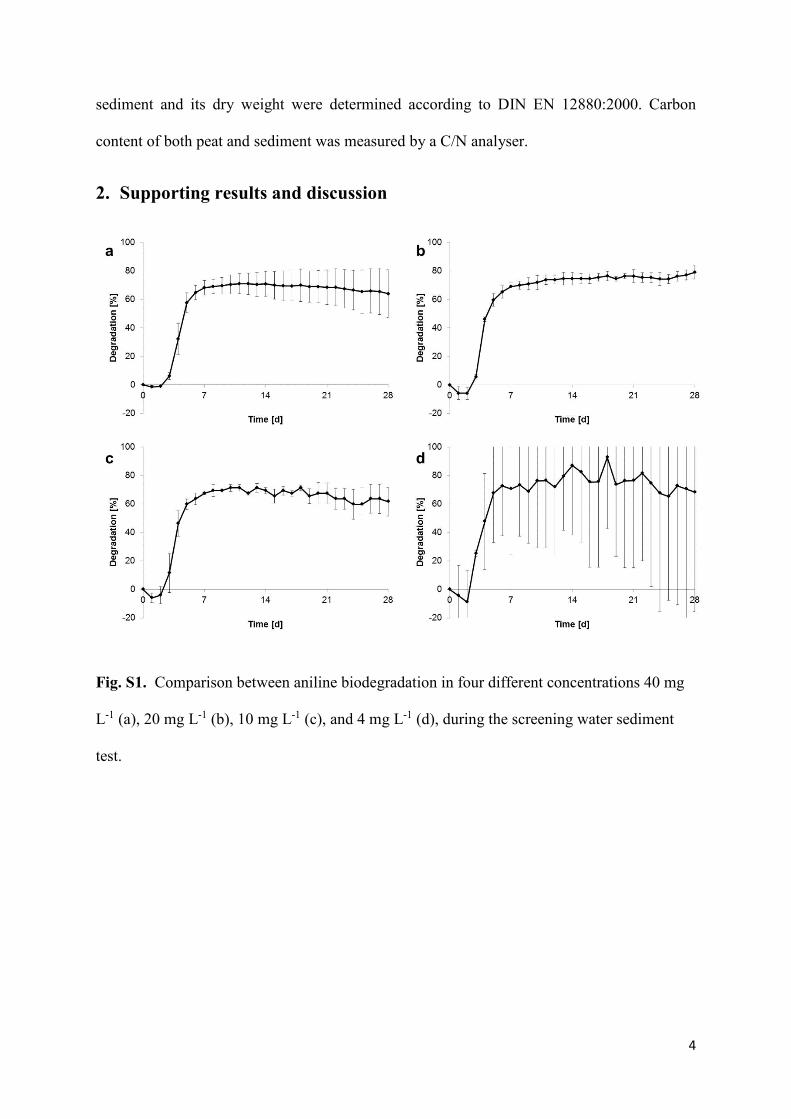
4
sediment and its dry weight were determined according to DIN EN 12880:2000. Carbon
content of both peat and sediment was measured by a C/N analyser.
2. Supporting results and discussion
Fig. S1. Comparison between aniline biodegradation in four different concentrations 40 mg
L-1 (a), 20 mg L-1 (b), 10 mg L-1 (c), and 4 mg L-1 (d), during the screening water sediment
test.
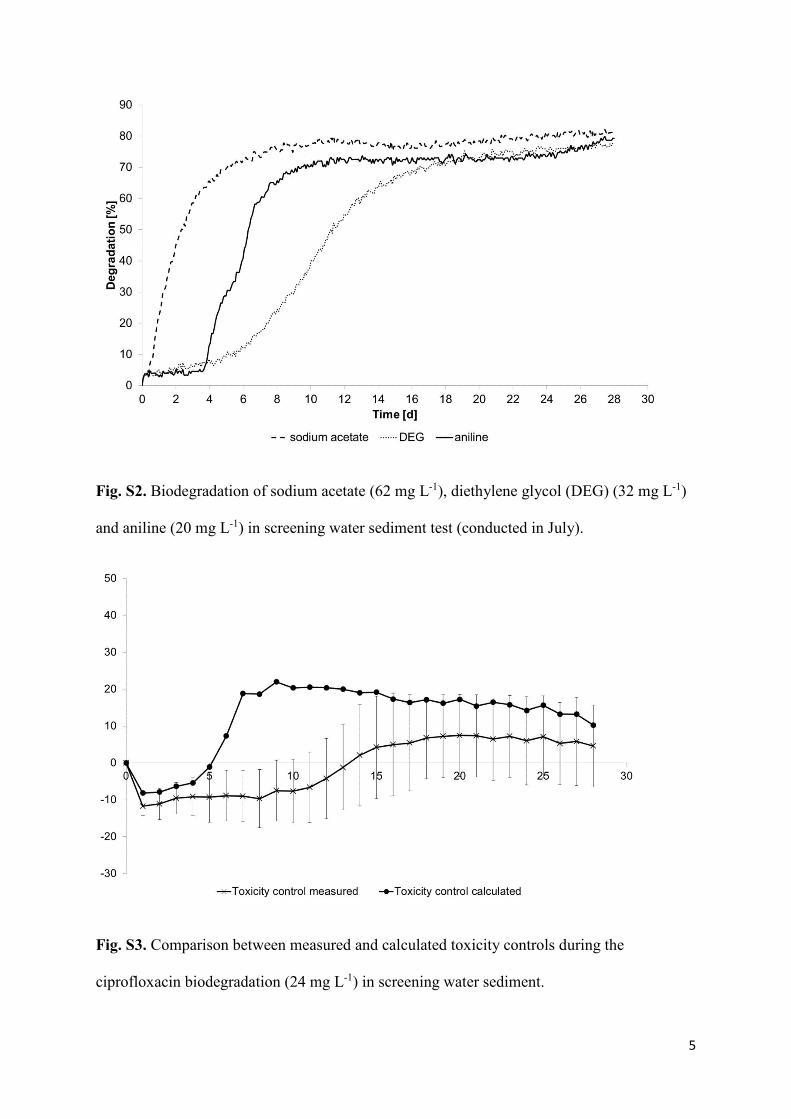
5
Fig. S2. Biodegradation of sodium acetate (62 mg L-1), diethylene glycol (DEG) (32 mg L-1)
and aniline (20 mg L-1) in screening water sediment test (conducted in July).
Fig. S3. Comparison between measured and calculated toxicity controls during the
ciprofloxacin biodegradation (24 mg L-1) in screening water sediment.
6
References
DIN EN 12880:2000 Characterization of sludges - Determination of dry residue and water
content.
EN ISO 6222:1999: Water quality - Enumeration of culturable micro-organisms – Colony
count by inoculation in a nutrient agar culture medium
OECD, 1981. Test No. 302C: Inherent Biodegradability: Modified MITI Test (II). OECD
Publishing.
OECD, 1992. Test No. 301: Ready Biodegradability. OECD Publishing, [Paris].
OECD, 2004. Test No. 218: Sediment-Water Chironomid Toxicity Using Spiked Sediment.
OECD Publishing.
WTW, 2006. System OxiTop Control: Operating Manual, ger, 113 pp.
Article VI
Assessing the environmental fate of S-metolachlor, its commercial
product Mercantor Gold® and their photoproducts using a water–
sediment test and in silico methods.
Gutowski, L., Baginska, E., Olsson, O., Leder, C., Kümmerer, K., Chemosphere 2015;
138:847–855. doi:10.1016/j.chemosphere.2015.08.013

Assessing the environmental fate of S-metolachlor, its commercialproduct Mercantor Gold� and their photoproducts using a water–
sediment test and in silico methods
Lukasz Gutowski, Ewelina Baginska, Oliver Olsson, Christoph Leder, Klaus Kümmerer ⇑
Sustainable Chemistry and Material Resources, Institute of Sustainable and Environmental Chemistry, Leuphana University Lüneburg, C13, DE – 21335 Lüneburg, Germany
h i g h l i g h t s
� SM and MG were not biodegraded in the water–sediment system.
� New bio-TPs were generated by aquatic micro-organisms from SM and MG photo-TPs.
� Adjuvants in MG had no significant influence on biodegradation but on sorption of SM.
� 50% of SM was irreversibly adsorbed onto sediment.
� In silico assessment of the new bio-TPs indicates toxicity to water organisms.
a r t i c l e i n f o
Article history:
Received 1 April 2015
Received in revised form 23 July 2015
Accepted 6 August 2015
Available online 24 August 2015
Keywords:
Water–sediment
Biodegradation
Adjuvants
Transformation
QSAR
In silico
a b s t r a c t
Pesticides enter surface and groundwater by several routes in which partition to sediment contributes to
their fate by abiotic (e.g. photolysis, hydrolysis) and biotic processes. Yet, little is known about
S-metolachlor (SM) transformation in water–sediment systems. Therefore, a newly developed screening
water–sediment test (WST) was applied to compare biodegradation and sorption processes between pure
SM and Mercantor Gold� (MG), a commercial formulation of SM. Photolysis in water was performed by
Xe lamp irradiation. Subsequently, the biodegradability of SM and MG photolysis mixtures was examined
in WST. The primary elimination of SM from water phase was monitored and structures of its TPs result-
ing from biotransformation (bio-TPs) were elucidated by LC-MS/MS. SM was extracted from sediment in
order to estimate the role of sorption in WST for its elimination. A set of in silico prediction software tools
was applied for toxicity assessment of SM and its bio-TPs. Obtained results suggest that the MG adjuvants
do not significantly affect biodegradation, but do influence diffusion of SM into sediment. 50% of SM could
not be re-extracted from sediment with 0.01 M CaCl2 aqueous solution recommended in OECD test guide-
line for adsorption. Neither the parent compound nor the photo-TPs were biodegraded. However, new
bio-TPs have been generated from SM and MG photo-TPs due to bacterial activity in the water–sediment
interphase. Moreover, according to in silico assessment of the bio-TPs the biotransformation might lead to
an increased toxicity to the water organisms compared with the SM. This might raise concerns of bio-TPs
presence in the environment.
� 2015 Elsevier Ltd. All rights reserved.
1. Introduction
The estimated annual worldwide usage of pesticides is about
2.5 million tons. Herbicides account for the largest portion of total
use, oscillating about 1 million tons (EPA, 2011). S-metolachlor
(2-chloro-N-(2-ethyl-6-methylphenyl)-N-[(1S)-2-methoxy-1-meth-
ylethyl] acetamide) is a selective chloroacetanilide herbicide
intensively applied for annual grassy weeds, corn, soybeans,
peanuts, and other crops. From the chloroacetamides class,
S-metolachlor (SM) is in the top three most used worldwide corre-
sponding to 4.2% of the global pesticide use (Fenner et al., 2013;
Martins et al., 2007). Mercantor Gold� (MG) as commercial product
consists of SM (86.5% w/w) mixed with different formulation
additives (adjuvants).
http://dx.doi.org/10.1016/j.chemosphere.2015.08.013
0045-6535/� 2015 Elsevier Ltd. All rights reserved.
⇑ Corresponding author at: Sustainable Chemistry and Material Resources,
Institute of Sustainable and Environmental Chemistry, Leuphana University
Lüneburg, C13, Scharnhorststrasse 1, DE – 21335 Lüneburg, Germany.
E-mail addresses: [email protected] (L. Gutowski), baginska@
leuphana.de (E. Baginska), [email protected] (O. Olsson), cleder@leuphana.
de (C. Leder), [email protected] (K. Kümmerer).
Chemosphere 138 (2015) 847–855
Contents lists available at ScienceDirect
Chemosphere
journal homepage: www.elsevier .com/locate /chemosphere
Research on the transport of pesticides from their source (i.e.
agricultural application) to surface bodies of water and groundwa-
ter by processes such as spray drift, wash-off from plants, surface
runoff, infiltration, lateral subsurface flow, leaching or via indus-
trial waste water discharge has been conducted by numerous
authors and the dominating processes are largely known
(Gassmann et al., 2013; Reichenberger et al., 2007; Remucal,
2014; Shibata et al., 2011). Approximately 1 to 5% of field applied
herbicides are removed by surface runoff and reach the aquatic
compartment (Scott et al., 1999; Wauchope, 1978). The application
of pesticides introduces to the environment not only the active
compound itself, but also other chemicals that make up the com-
mercial product that is applied. In commercial products such as
Mercantor Gold�, adjuvants have been developed not only to max-
imize pesticide efficacy but also to prevent any unfavorable envi-
ronmental contamination from the active compound and its
transformation products (TPs) (Katagi, 2008). Surfactants are some
of the most important components among many other adjuvants
such as stabilizers, thickeners or disperse and antifreeze agents
(Katagi, 2008). Surfactants modify spray droplet size thus improv-
ing biological activity together with the retention, spreading on the
leaf, or even the enhancing of pesticide uptake by crops (Knowles,
2001). Adjuvants can affect the solubility, biodegradation, and
sorption properties (Katagi, 2006, 2008) and may act as a photo-
sensitizer (Malouki et al., 2009).
Once in the water environment, pesticides in commercial prod-
ucts or as pure compounds are subject to biotic and abiotic trans-
formation. Resulting TPs can be more toxic and present at higher
concentrations than their parent compounds (Mañas et al., 2009;
Olsson et al., 2013). Gómez et al. (2012) stated that the majority
of the TPs have most likely not even been identified yet and much
less is known about their environmental relevance.
To assess the ecological impact of pesticides and their TPs on
water organisms and distribution between water and sediment
phase, the investigation of pesticide behavior in laboratory
water–sediment system would deliver valuable information
(Katagi, 2008). Some authors have addressed chloroacetanilide
herbicides’ degradation and dissipation in simulated water–sedi-
ment systems (Mersie et al., 2004; Rice et al., 2004). Few studies
focused on pesticides and their commercial formulations’
biodegradation in the water–sediment systems (García-Ortega
et al., 2006; Krieger et al., 1989). Only Gutowski et al. (2015) stud-
ied the environmental fate of SM and MG in a combined consecu-
tive photolysis – biodegradation test. However, no sediment phase
was included in this study. It should be noted that information and
data regarding the SM, MG, and their photolysis products’ behavior
in the water–sediment environment is still plainly lacking in the
international scientific literature. Knowledge regarding a possible
transformation of photo-TPs and the products’ fate and effects in
the water–sediment system is especially limited. Furthermore,
the influence and effects of the adjuvants on the pesticide and its
TP’s behavior in the water–sediment system is largely unknown.
TPs are usually formed in low concentrations, within complex
matrices so that isolation and purification is very challenging.
Also many of these TPs are not available commercially, which
makes the individual experimental analysis of their toxicity impos-
sible. In silico predictions are versatile tools used to fill this gap.
Hence, the generation of data based on quantitative structure
activity relationships (QSARs) are gaining importance especially
for analysis and assessment of environmental TPs (Mahmoud
et al., 2014; Rastogi et al., 2014a, 2014b). This paper will address
this lacuna by an in depth analysis of the fate of parent compound
and photo-TPs in water–sediment test and the potential eco-
toxicity against aquatic organisms of bio-TPs found in the study
presented here. This publication addresses specifically:
(i) The indirect impact of MG’s adjuvants on the active sub-
stance fate in the simulated water–sediment system (WST).
(ii) The biodegradability of photo-TPs in the water sediment
system using WST to evaluate the elimination of the parent
compound, its photo-TPs and their fate.
(iii) The structure elucidation of the generated bio-TPs, using LC-
MS/MS. (iv) The initial eco-toxicity assessment of the found
bio-TPs supported by in silico data generation using QSAR for
the endpoints microtoxicity in environmental bacteria, bio-
concentration factor and toxicity in rainbow trouts.
2. Materials and methods
2.1. Chemicals
The analytical standard of S-metolachlor (98.4% chemical pur-
ity, CAS Nr. 87392-12-9) was obtained from Fluka (Sigma–
Aldrich, Steinheim, Germany) and the commercial product
Mercantor Gold� from Syngenta Crop Protection, France. This pro-
duct consists of S-metolachlor (86.5% w/w), a mixture of not fur-
ther specified aromatic hydrocarbons (2–12% w/w),
dodecylbenzenesulfonic acid calcium salt (a surfactant), 1–5% w/
w), poly(oxy-1,2-ethanediyl),alpha-2,4,6-tris(1-phenylethyl)phe
nyl-omega-hydroxy (1–5% w/w, CAS Nr. 70559-25-0), and
2-methyl-1-propanol (1–2% w/w). Sodium azide (CAS Nr. 26628-
22-8) was purchased from Sigma–Aldrich, Germany. HPLC grade
acetonitrile (ACN, CAS Nr. 75-05-8) was purchased from VWR
(VWR International, GmbH, Darmstadt, Germany). Aniline (CAS
Nr. 62-53-3) was purchased from the same supplier; calcium car-
bonate (CAS Nr. 471-34-1), quartz (CAS Nr. 14808-60-7) and clay
(CAS Nr. 1318-74-4) were purchased from Carl Roth, Germany.
All aqueous solutions were prepared using ultrapure water
18.2 MO cm (Ultra Clear UV TM, Barsbüttel, Germany).
A flow chart of the experimental procedures applied in this
study can be found in Supplementary Information (SI), Fig. S1.
2.2. Simulated solar photolysis experiments in aqueous solution
Photolysis in water was performed in an ilmasil quartz immer-
sion tube using a xenon lamp (TXE 150, UV consulting Peschl,
Mainz, Germany) as the source of radiation. The lamp emits spectra
similar to natural sun light (200–800 nm) with the highest inten-
sity in the visible range (200–280 nm: 1.61 e�2 W/m2,
280–315 nm: 1.16 e�2 W/m2, 315–380 nm: 3.75 e�2 W/m2,
380–780 nm: 5.58 e�1 W/m2) (data provided by the manufacturer).
Photo-transformation products were generated by irradiation of
the pesticides solution (SM and SM in MG, respectively) for 8 h
time in ultrapure water. Samples before (0.0 h) and after (8.0) h
of photolysis were collected and subsequently submitted to the
WST. The final concentration of SM and MG was adjusted by mea-
suring NPOC (non-purgeable organic carbon) of the tested sub-
stance (i.e. before photolysis) and photolysis treated samples, to
provide required carbon content, and to reach adequate theoretical
oxygen demand (ThOD), (described further in Section 2.3) Details
on the experimental methods and the structural elucidation of
the photo-TPs can be found in Gutowski et al. (2015).
2.3. Water sediment test (WST)
Because of the test design, processes such as biodegradation,
sorption, elimination from water phase, and abiotic degradation
could be investigated in this test simultaneously. All components
of the artificial medium (sediment, inoculum, mineral medium)
were standardized and based on OECD guidelines for testing of
chemicals (218, 301 D and 302 C) (OECD, 1981, 1992, 2004).
848 L. Gutowski et al. / Chemosphere 138 (2015) 847–855
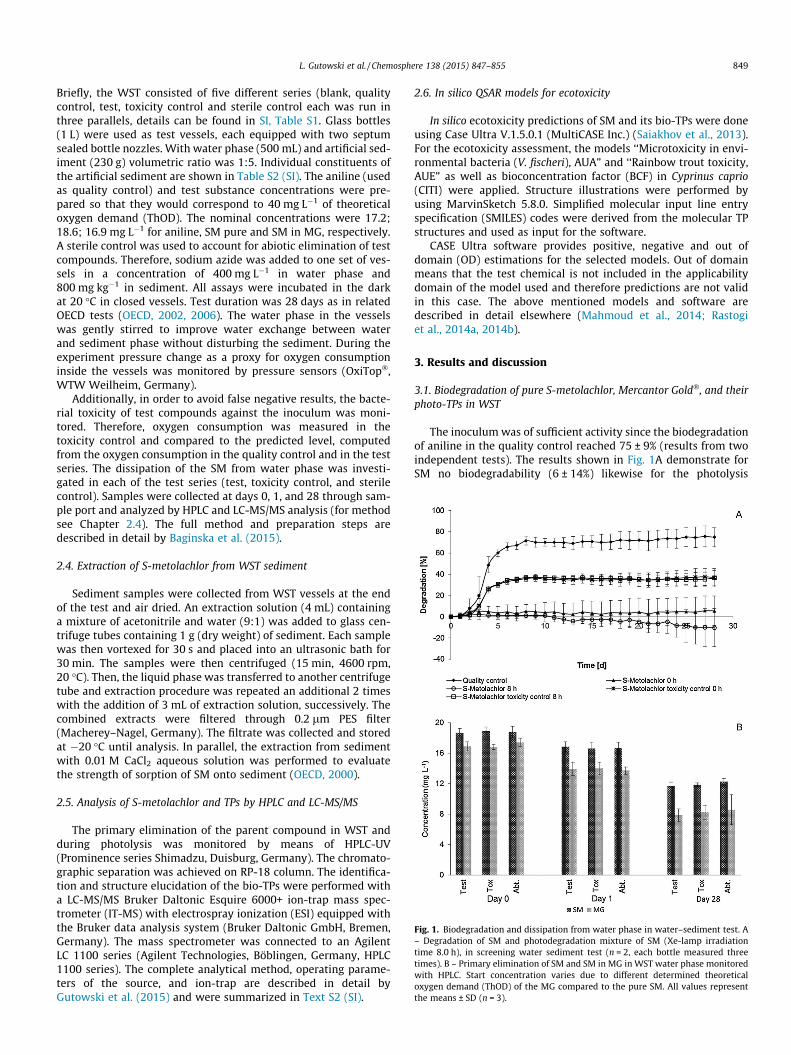
Briefly, the WST consisted of five different series (blank, quality
control, test, toxicity control and sterile control each was run in
three parallels, details can be found in SI, Table S1. Glass bottles
(1 L) were used as test vessels, each equipped with two septum
sealed bottle nozzles. With water phase (500 mL) and artificial sed-
iment (230 g) volumetric ratio was 1:5. Individual constituents of
the artificial sediment are shown in Table S2 (SI). The aniline (used
as quality control) and test substance concentrations were pre-
pared so that they would correspond to 40 mg L�1 of theoretical
oxygen demand (ThOD). The nominal concentrations were 17.2;
18.6; 16.9 mg L�1 for aniline, SM pure and SM in MG, respectively.
A sterile control was used to account for abiotic elimination of test
compounds. Therefore, sodium azide was added to one set of ves-
sels in a concentration of 400 mg L�1 in water phase and
800 mg kg�1 in sediment. All assays were incubated in the dark
at 20 �C in closed vessels. Test duration was 28 days as in related
OECD tests (OECD, 2002, 2006). The water phase in the vessels
was gently stirred to improve water exchange between water
and sediment phase without disturbing the sediment. During the
experiment pressure change as a proxy for oxygen consumption
inside the vessels was monitored by pressure sensors (OxiTop�,
WTW Weilheim, Germany).
Additionally, in order to avoid false negative results, the bacte-
rial toxicity of test compounds against the inoculum was moni-
tored. Therefore, oxygen consumption was measured in the
toxicity control and compared to the predicted level, computed
from the oxygen consumption in the quality control and in the test
series. The dissipation of the SM from water phase was investi-
gated in each of the test series (test, toxicity control, and sterile
control). Samples were collected at days 0, 1, and 28 through sam-
ple port and analyzed by HPLC and LC-MS/MS analysis (for method
see Chapter 2.4). The full method and preparation steps are
described in detail by Baginska et al. (2015).
2.4. Extraction of S-metolachlor from WST sediment
Sediment samples were collected from WST vessels at the end
of the test and air dried. An extraction solution (4 mL) containing
a mixture of acetonitrile and water (9:1) was added to glass cen-
trifuge tubes containing 1 g (dry weight) of sediment. Each sample
was then vortexed for 30 s and placed into an ultrasonic bath for
30 min. The samples were then centrifuged (15 min, 4600 rpm,
20 �C). Then, the liquid phase was transferred to another centrifuge
tube and extraction procedure was repeated an additional 2 times
with the addition of 3 mL of extraction solution, successively. The
combined extracts were filtered through 0.2 lm PES filter
(Macherey–Nagel, Germany). The filtrate was collected and stored
at �20 �C until analysis. In parallel, the extraction from sediment
with 0.01 M CaCl2 aqueous solution was performed to evaluate
the strength of sorption of SM onto sediment (OECD, 2000).
2.5. Analysis of S-metolachlor and TPs by HPLC and LC-MS/MS
The primary elimination of the parent compound in WST and
during photolysis was monitored by means of HPLC-UV
(Prominence series Shimadzu, Duisburg, Germany). The chromato-
graphic separation was achieved on RP-18 column. The identifica-
tion and structure elucidation of the bio-TPs were performed with
a LC-MS/MS Bruker Daltonic Esquire 6000+ ion-trap mass spec-
trometer (IT-MS) with electrospray ionization (ESI) equipped with
the Bruker data analysis system (Bruker Daltonic GmbH, Bremen,
Germany). The mass spectrometer was connected to an Agilent
LC 1100 series (Agilent Technologies, Böblingen, Germany, HPLC
1100 series). The complete analytical method, operating parame-
ters of the source, and ion-trap are described in detail by
Gutowski et al. (2015) and were summarized in Text S2 (SI).
2.6. In silico QSAR models for ecotoxicity
In silico ecotoxicity predictions of SM and its bio-TPs were done
using Case Ultra V.1.5.0.1 (MultiCASE Inc.) (Saiakhov et al., 2013).
For the ecotoxicity assessment, the models ‘‘Microtoxicity in envi-
ronmental bacteria (V. fischeri), AUA” and ‘‘Rainbow trout toxicity,
AUE” as well as bioconcentration factor (BCF) in Cyprinus caprio
(CITI) were applied. Structure illustrations were performed by
using MarvinSketch 5.8.0. Simplified molecular input line entry
specification (SMILES) codes were derived from the molecular TP
structures and used as input for the software.
CASE Ultra software provides positive, negative and out of
domain (OD) estimations for the selected models. Out of domain
means that the test chemical is not included in the applicability
domain of the model used and therefore predictions are not valid
in this case. The above mentioned models and software are
described in detail elsewhere (Mahmoud et al., 2014; Rastogi
et al., 2014a, 2014b).
3. Results and discussion
3.1. Biodegradation of pure S-metolachlor, Mercantor Gold�, and their
photo-TPs in WST
The inoculumwas of sufficient activity since the biodegradation
of aniline in the quality control reached 75 ± 9% (results from two
independent tests). The results shown in Fig. 1A demonstrate for
SM no biodegradability (6 ± 14%) likewise for the photolysis
Fig. 1. Biodegradation and dissipation from water phase in water–sediment test. A
– Degradation of SM and photodegradation mixture of SM (Xe-lamp irradiation
time 8.0 h), in screening water sediment test (n = 2, each bottle measured three
times). B – Primary elimination of SM and SM in MG in WST water phase monitored
with HPLC. Start concentration varies due to different determined theoretical
oxygen demand (ThOD) of the MG compared to the pure SM. All values represent
the means ± SD (n = 3).
L. Gutowski et al. / Chemosphere 138 (2015) 847–855 849
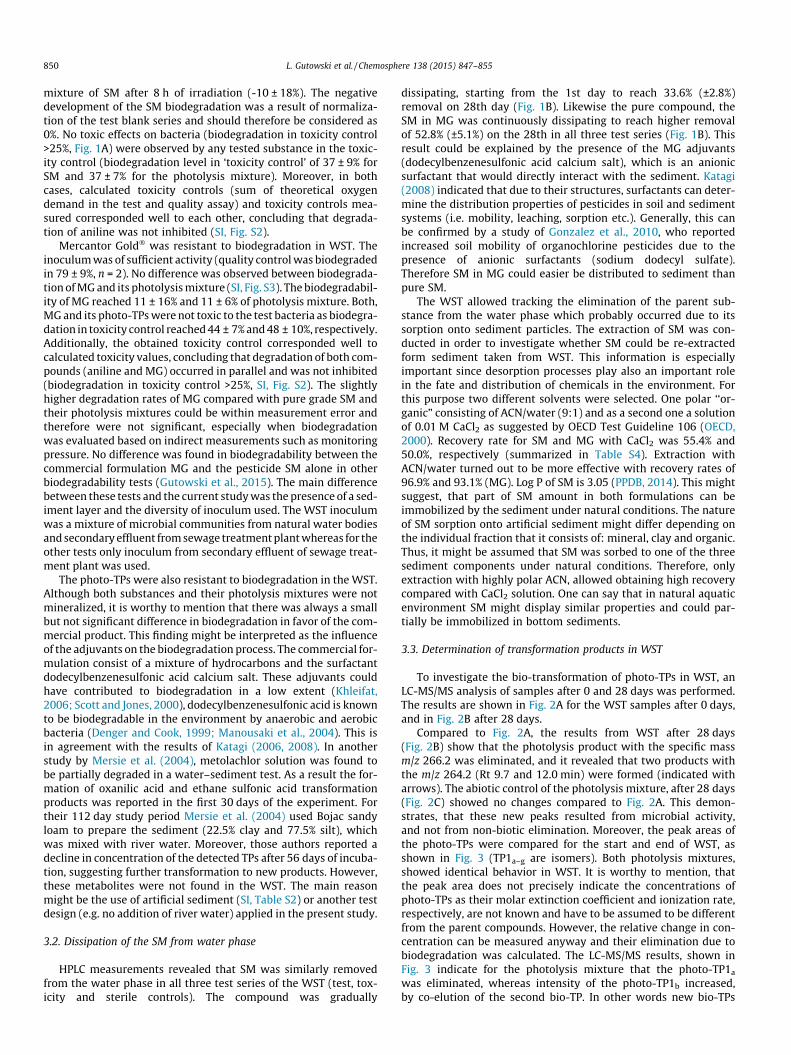
mixture of SM after 8 h of irradiation (-10 ± 18%). The negative
development of the SM biodegradation was a result of normaliza-
tion of the test blank series and should therefore be considered as
0%. No toxic effects on bacteria (biodegradation in toxicity control
>25%, Fig. 1A) were observed by any tested substance in the toxic-
ity control (biodegradation level in ‘toxicity control’ of 37 ± 9% for
SM and 37 ± 7% for the photolysis mixture). Moreover, in both
cases, calculated toxicity controls (sum of theoretical oxygen
demand in the test and quality assay) and toxicity controls mea-
sured corresponded well to each other, concluding that degrada-
tion of aniline was not inhibited (SI, Fig. S2).
Mercantor Gold� was resistant to biodegradation in WST. The
inoculumwas of sufficient activity (quality controlwas biodegraded
in 79 ± 9%, n = 2). No difference was observed between biodegrada-
tion ofMGand its photolysismixture (SI, Fig. S3). The biodegradabil-
ity of MG reached 11 ± 16% and 11 ± 6% of photolysis mixture. Both,
MGand its photo-TPswere not toxic to the test bacteria as biodegra-
dation in toxicity control reached44 ± 7%and48 ± 10%, respectively.
Additionally, the obtained toxicity control corresponded well to
calculated toxicity values, concluding that degradation of both com-
pounds (aniline and MG) occurred in parallel and was not inhibited
(biodegradation in toxicity control >25%, SI, Fig. S2). The slightly
higher degradation rates of MG compared with pure grade SM and
their photolysis mixtures could be within measurement error and
therefore were not significant, especially when biodegradation
was evaluated based on indirect measurements such as monitoring
pressure. No difference was found in biodegradability between the
commercial formulation MG and the pesticide SM alone in other
biodegradability tests (Gutowski et al., 2015). The main difference
between these tests and the current studywas the presence of a sed-
iment layer and the diversity of inoculum used. The WST inoculum
was a mixture of microbial communities from natural water bodies
and secondaryeffluent fromsewage treatmentplantwhereas for the
other tests only inoculum from secondary effluent of sewage treat-
ment plant was used.
The photo-TPs were also resistant to biodegradation in theWST.
Although both substances and their photolysis mixtures were not
mineralized, it is worthy to mention that there was always a small
but not significant difference in biodegradation in favor of the com-
mercial product. This finding might be interpreted as the influence
of the adjuvants on the biodegradation process. The commercial for-
mulation consist of a mixture of hydrocarbons and the surfactant
dodecylbenzenesulfonic acid calcium salt. These adjuvants could
have contributed to biodegradation in a low extent (Khleifat,
2006; Scott and Jones, 2000), dodecylbenzenesulfonic acid is known
to be biodegradable in the environment by anaerobic and aerobic
bacteria (Denger and Cook, 1999; Manousaki et al., 2004). This is
in agreement with the results of Katagi (2006, 2008). In another
study by Mersie et al. (2004), metolachlor solution was found to
be partially degraded in a water–sediment test. As a result the for-
mation of oxanilic acid and ethane sulfonic acid transformation
products was reported in the first 30 days of the experiment. For
their 112 day study period Mersie et al. (2004) used Bojac sandy
loam to prepare the sediment (22.5% clay and 77.5% silt), which
was mixed with river water. Moreover, those authors reported a
decline in concentration of the detected TPs after 56 days of incuba-
tion, suggesting further transformation to new products. However,
these metabolites were not found in the WST. The main reason
might be the use of artificial sediment (SI, Table S2) or another test
design (e.g. no addition of river water) applied in the present study.
3.2. Dissipation of the SM from water phase
HPLC measurements revealed that SM was similarly removed
from the water phase in all three test series of the WST (test, tox-
icity and sterile controls). The compound was gradually
dissipating, starting from the 1st day to reach 33.6% (±2.8%)
removal on 28th day (Fig. 1B). Likewise the pure compound, the
SM in MG was continuously dissipating to reach higher removal
of 52.8% (±5.1%) on the 28th in all three test series (Fig. 1B). This
result could be explained by the presence of the MG adjuvants
(dodecylbenzenesulfonic acid calcium salt), which is an anionic
surfactant that would directly interact with the sediment. Katagi
(2008) indicated that due to their structures, surfactants can deter-
mine the distribution properties of pesticides in soil and sediment
systems (i.e. mobility, leaching, sorption etc.). Generally, this can
be confirmed by a study of Gonzalez et al., 2010, who reported
increased soil mobility of organochlorine pesticides due to the
presence of anionic surfactants (sodium dodecyl sulfate).
Therefore SM in MG could easier be distributed to sediment than
pure SM.
The WST allowed tracking the elimination of the parent sub-
stance from the water phase which probably occurred due to its
sorption onto sediment particles. The extraction of SM was con-
ducted in order to investigate whether SM could be re-extracted
form sediment taken from WST. This information is especially
important since desorption processes play also an important role
in the fate and distribution of chemicals in the environment. For
this purpose two different solvents were selected. One polar ‘‘or-
ganic” consisting of ACN/water (9:1) and as a second one a solution
of 0.01 M CaCl2 as suggested by OECD Test Guideline 106 (OECD,
2000). Recovery rate for SM and MG with CaCl2 was 55.4% and
50.0%, respectively (summarized in Table S4). Extraction with
ACN/water turned out to be more effective with recovery rates of
96.9% and 93.1% (MG). Log P of SM is 3.05 (PPDB, 2014). This might
suggest, that part of SM amount in both formulations can be
immobilized by the sediment under natural conditions. The nature
of SM sorption onto artificial sediment might differ depending on
the individual fraction that it consists of: mineral, clay and organic.
Thus, it might be assumed that SM was sorbed to one of the three
sediment components under natural conditions. Therefore, only
extraction with highly polar ACN, allowed obtaining high recovery
compared with CaCl2 solution. One can say that in natural aquatic
environment SM might display similar properties and could par-
tially be immobilized in bottom sediments.
3.3. Determination of transformation products in WST
To investigate the bio-transformation of photo-TPs in WST, an
LC-MS/MS analysis of samples after 0 and 28 days was performed.
The results are shown in Fig. 2A for the WST samples after 0 days,
and in Fig. 2B after 28 days.
Compared to Fig. 2A, the results from WST after 28 days
(Fig. 2B) show that the photolysis product with the specific mass
m/z 266.2 was eliminated, and it revealed that two products with
the m/z 264.2 (Rt 9.7 and 12.0 min) were formed (indicated with
arrows). The abiotic control of the photolysis mixture, after 28 days
(Fig. 2C) showed no changes compared to Fig. 2A. This demon-
strates, that these new peaks resulted from microbial activity,
and not from non-biotic elimination. Moreover, the peak areas of
the photo-TPs were compared for the start and end of WST, as
shown in Fig. 3 (TP1a–g are isomers). Both photolysis mixtures,
showed identical behavior in WST. It is worthy to mention, that
the peak area does not precisely indicate the concentrations of
photo-TPs as their molar extinction coefficient and ionization rate,
respectively, are not known and have to be assumed to be different
from the parent compounds. However, the relative change in con-
centration can be measured anyway and their elimination due to
biodegradation was calculated. The LC-MS/MS results, shown in
Fig. 3 indicate for the photolysis mixture that the photo-TP1awas eliminated, whereas intensity of the photo-TP1b increased,
by co-elution of the second bio-TP. In other words new bio-TPs
850 L. Gutowski et al. / Chemosphere 138 (2015) 847–855
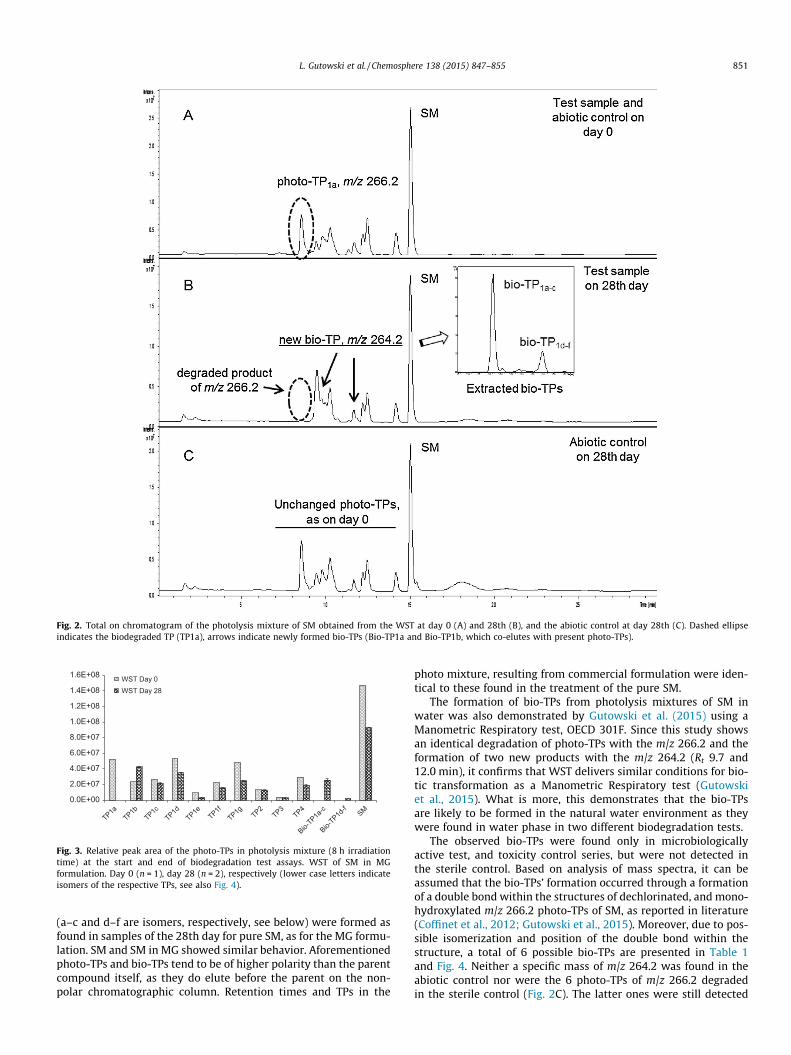
(a–c and d–f are isomers, respectively, see below) were formed as
found in samples of the 28th day for pure SM, as for the MG formu-
lation. SM and SM in MG showed similar behavior. Aforementioned
photo-TPs and bio-TPs tend to be of higher polarity than the parent
compound itself, as they do elute before the parent on the non-
polar chromatographic column. Retention times and TPs in the
photo mixture, resulting from commercial formulation were iden-
tical to these found in the treatment of the pure SM.
The formation of bio-TPs from photolysis mixtures of SM in
water was also demonstrated by Gutowski et al. (2015) using a
Manometric Respiratory test, OECD 301F. Since this study shows
an identical degradation of photo-TPs with the m/z 266.2 and the
formation of two new products with the m/z 264.2 (Rt 9.7 and
12.0 min), it confirms that WST delivers similar conditions for bio-
tic transformation as a Manometric Respiratory test (Gutowski
et al., 2015). What is more, this demonstrates that the bio-TPs
are likely to be formed in the natural water environment as they
were found in water phase in two different biodegradation tests.
The observed bio-TPs were found only in microbiologically
active test, and toxicity control series, but were not detected in
the sterile control. Based on analysis of mass spectra, it can be
assumed that the bio-TPs’ formation occurred through a formation
of a double bond within the structures of dechlorinated, and mono-
hydroxylated m/z 266.2 photo-TPs of SM, as reported in literature
(Coffinet et al., 2012; Gutowski et al., 2015). Moreover, due to pos-
sible isomerization and position of the double bond within the
structure, a total of 6 possible bio-TPs are presented in Table 1
and Fig. 4. Neither a specific mass of m/z 264.2 was found in the
abiotic control nor were the 6 photo-TPs of m/z 266.2 degraded
in the sterile control (Fig. 2C). The latter ones were still detected
Fig. 2. Total on chromatogram of the photolysis mixture of SM obtained from the WST at day 0 (A) and 28th (B), and the abiotic control at day 28th (C). Dashed ellipse
indicates the biodegraded TP (TP1a), arrows indicate newly formed bio-TPs (Bio-TP1a and Bio-TP1b, which co-elutes with present photo-TPs).
0.0E+00
2.0E+07
4.0E+07
6.0E+07
8.0E+07
1.0E+08
1.2E+08
1.4E+08
1.6E+08WST Day 0
WST Day 28
Fig. 3. Relative peak area of the photo-TPs in photolysis mixture (8 h irradiation
time) at the start and end of biodegradation test assays. WST of SM in MG
formulation. Day 0 (n = 1), day 28 (n = 2), respectively (lower case letters indicate
isomers of the respective TPs, see also Fig. 4).
L. Gutowski et al. / Chemosphere 138 (2015) 847–855 851
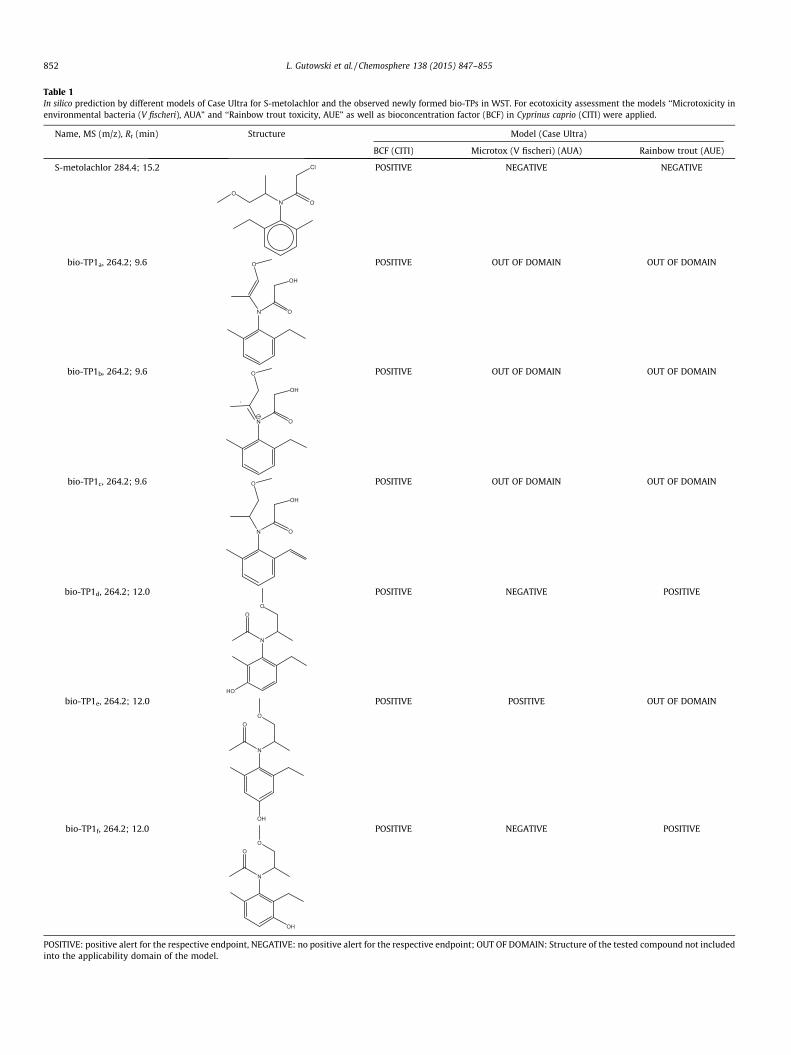
Table 1
In silico prediction by different models of Case Ultra for S-metolachlor and the observed newly formed bio-TPs in WST. For ecotoxicity assessment the models ‘‘Microtoxicity in
environmental bacteria (V fischeri), AUA” and ‘‘Rainbow trout toxicity, AUE” as well as bioconcentration factor (BCF) in Cyprinus caprio (CITI) were applied.
Name, MS (m/z), Rt (min) Structure Model (Case Ultra)
BCF (CITI) Microtox (V fischeri) (AUA) Rainbow trout (AUE)
S-metolachlor 284.4; 15.2 Cl
ON
O
POSITIVE NEGATIVE NEGATIVE
bio-TP1a, 264.2; 9.6
N O
OH
O POSITIVE OUT OF DOMAIN OUT OF DOMAIN
bio-TP1b, 264.2; 9.6
N O
OH
O POSITIVE OUT OF DOMAIN OUT OF DOMAIN
bio-TP1c, 264.2; 9.6
N O
OH
O POSITIVE OUT OF DOMAIN OUT OF DOMAIN
bio-TP1d, 264.2; 12.0
N
O
O
HO
POSITIVE NEGATIVE POSITIVE
bio-TP1e, 264.2; 12.0
N
O
O
OH
POSITIVE POSITIVE OUT OF DOMAIN
bio-TP1f, 264.2; 12.0
N
O
O
OH
POSITIVE NEGATIVE POSITIVE
POSITIVE: positive alert for the respective endpoint, NEGATIVE: no positive alert for the respective endpoint; OUT OF DOMAIN: Structure of the tested compound not included
into the applicability domain of the model.
852 L. Gutowski et al. / Chemosphere 138 (2015) 847–855
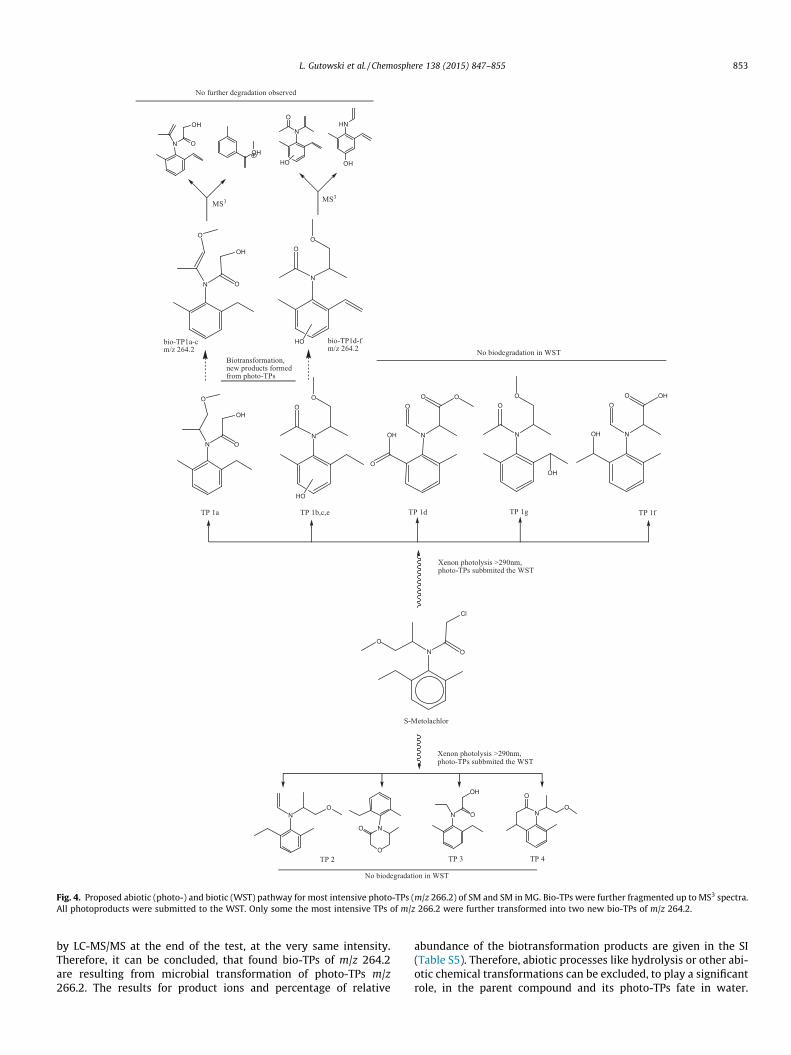
by LC-MS/MS at the end of the test, at the very same intensity.
Therefore, it can be concluded, that found bio-TPs of m/z 264.2
are resulting from microbial transformation of photo-TPs m/z
266.2. The results for product ions and percentage of relative
abundance of the biotransformation products are given in the SI
(Table S5). Therefore, abiotic processes like hydrolysis or other abi-
otic chemical transformations can be excluded, to play a significant
role, in the parent compound and its photo-TPs fate in water.
Cl
ON
O
N O
OH
O
N
O
O
HO
N
OO
OH
O
O
N
O
O
OH
N
OHO
OH
O
S-Metolachlor
TP 1a TP 1b,c,e TP 1d TP 1g TP 1f
N O
OH
O
N
O
O
HO
No biodegradation in WST
N O
OH
OH
HN
OH
N
O
HO
Xenon photolysis >290nm,photo-TPs subbmited the WST
Biotransformation,new products formedfrom photo-TPs
MS3MS3
No further degradation observed
NO
O
N O
OH
N
O
TP 2 TP 3 TP 4
bio-TP1a-cm/z 264.2
bio-TP1d-fm/z 264.2
No biodegradation in WST
Xenon photolysis >290nm,photo-TPs subbmited the WST
O
NO
Fig. 4. Proposed abiotic (photo-) and biotic (WST) pathway for most intensive photo-TPs (m/z 266.2) of SM and SM in MG. Bio-TPs were further fragmented up to MS3 spectra.
All photoproducts were submitted to the WST. Only some the most intensive TPs of m/z 266.2 were further transformed into two new bio-TPs of m/z 264.2.
L. Gutowski et al. / Chemosphere 138 (2015) 847–855 853
Suggested abiotic and biotic degradation pathway for SM and SM
in MG is shown in Fig. 4. Liu et al. (1995) had reported the forma-
tion of numerous biotransformation products of metolachlor, by a
rot fungus (P. chrysosporum) and its inability to fully mineralize the
parent compound. Thus, it appears that found bio-TPs can result in
the environment from direct transformation of the parent com-
pound, or by further transformation of the photo-TPs, not leading
to the direct mineralization as yet.
3.4. In silico eco-toxicity assessment for S-metolachlor and its bio-TPs
The BCF is predicted to be positive for both parent compound
and transformation products (Table 1), but an additional refined
analysis with several available models revealed indications, that
the BCF might be mitigated after biotransformation (SI, Table S7).
Moreover, in silico prediction provided initial indications that some
of the bio-TPs might have an increased ecotoxicity compared with
the parent compound SM. Of note are results of the bio-TPs
(Table 1), which showed alerts for toxicity towards environmental
bacteria (bio-TP1e) and towards rainbow trouts (bio-TP1d and bio-
TP1f), respectively. Thus, the biotransformation may have
increased the ecotoxicological potential of SM and its photo-TPs,
which would deserve further experimental attention. Besides, for
some transformation products, such as bio-TP1a or bio-TP1b, the
selected QSAR models cannot provide a prediction, since the mole-
cules are out of the applicability domain. Therefore, it would be
worth to study these compounds in the corresponding in vivo or
in vitro assays, once they are available in suitable amounts in order
to corroborate the prediction and/or to fill the data gaps.
4. Conclusions
This study shows that WST proved to be an appropriate tool for
the first screening of a substance’s behavior in water–sediment
interface and a good starting point providing the information that
allows to plan direction of further research especially in combina-
tion with in silico tools.
Experiments carried out in the laboratory showed that pure SM
and in Mercantor Gold� formulation were resistant to biodegrada-
tion in the WST. However, some of their most abundant photolysis
products were transformed into new bio-TPs due to bacterial activ-
ity, as found in our previous research. Adjuvants did not signifi-
cantly influence the biodegradation process, but due to the
present surfactants in MG’s formula they might increase the mobil-
ity of the active substance compared to the pure grade of SM. In
fact, this could result in increased diffusion to the sediment layers.
This study demonstrates that SM, MG, and especially their photo-
TPs should be considered as persistent. Moreover, some of the
photo-TPs could undergo biotransformations and result in new
bio-products in the aquatic environment. Applied QSAR models
provided preliminary information that the observed bio-TPs might
be of higher eco-toxicity than the parent compound. Therefore it is
highly recommended that their ecological impact should be further
investigated and should be taken into account for a detailed risk
assessment of the chemical. This calls for a more detailed investi-
gation and inclusion of follow up transformations into risk assess-
ment in general.
Acknowledgments
The authors would like to acknowledge funding of this study by
the PhytoRET Project (C.21) of the European INTERREG IV program
Upper Rhine. The authors also acknowledge Multicase for kindly
providing the CASE Ultra software, respectively.
Appendix A. Supplementary material
Supplementary data associated with this article can be found, in
the online version, at http://dx.doi.org/10.1016/j.chemosphere.
2015.08.013.
References
Baginska, E., Haiß, A., Kümmerer, K., 2015. Biodegradation screening of chemicals inan artificial matrix simulating the water–sediment interface. Chemosphere 119,1240–1246.
Coffinet, S., Rifai, A., Genty, C., Souissi, Y., Bourcier, S., Sablier, M., et al., 2012.Characterization of the photodegradation products of metolachlor: structuralelucidation, potential toxicity and persistence. J. Mass Spectrom. 47, 1582–1593.
Denger, K., Cook, A.M., 1999. Linear alkylbenzene sulphonate (LAS) bioavailable toanaerobic bacteria as a source of sulphur. J. Appl. Microbiol. 86, 165–168.
EPA, Office of Pesticide Programs, 2011. Pesticide Industry Sales and Usage Report:2006 and 2007 Market Estimates. Washington, DC. <http://www.epa.gov/opp00001/pestsales/07pestsales/market_estimates2007.pdf>.
Fenner, K., Canonica, S., Wackett, L.P., Elsner, M., 2013. Evaluating pesticidedegradation in the environment: blind spots and emerging opportunities.Science 341, 752–758.
García-Ortega, S., Holliman, P.J., Jones, D.L., 2006. Toxicology and fate of Pestanaland commercial propetamphos formulations in river and estuarine sediment.Sci. Total Environ. 366, 826–836.
Gassmann, M., Stamm, C., Olsson, O., Lange, J., Kümmerer, K., Weiler, M., 2013.Model-based estimation of pesticides and transformation products and theirexport pathways in a headwater catchment. Hydrol. Earth Syst. Sci. Discuss. 10,9847–9888.
Gómez, M.J., Herrera, S., Solé, D., García-Calvo, E., Fernández-Alba, A.R., 2012.Spatio-temporal evaluation of organic contaminants and their transformationproducts along a river basin affected by urban, agricultural and industrialpollution. Sci. Total Environ. 420, 134–145.
Gonzalez, M., Miglioranza, K.S., Aizpún, J.E., Isla, F.I., Peña, A., 2010. Assessingpesticide leaching and desorption in soils with different agricultural activitiesfrom Argentina (Pampa and Patagonia). Chemosphere 81, 351–358.
Gutowski, L., Olsson, O., Leder, C., Kümmerer, K., 2015. A comparative assessment ofthe transformation products of S-metolachlor and its commercial productMercantor Gold� and their fate in the aquatic environment by employing acombination of experimental and in silico methods. Sci. Total Environ. 506–507,369–379.
Katagi, T., 2006. Behavior of pesticides in water–sediment systems. Rev. Environ.Contam. Toxicol. 187, 133–251.
Katagi, T., 2008. Surfactant effects on environmental behavior of pesticides. Rev.Environ. Contam. Toxicol. 194, 71–177.
Khleifat, K.M., 2006. Biodegradation of linear alkylbenzene sulfonate by a two-member facultative anaerobic bacterial consortium. Enzyme Microb. Technol.39, 1030–1035.
Knowles, D.A., 2001. Trends in Pesticide Formulations: Agrow Reports.Krieger, A., Weinberger, P., Greenhalgh, R., 1989. A mathematical model used to
predict the modifying effects of adjuvants on fenitrothion insecticide in lakeand estuarine water systems. In: Chow, P.N.P. (Ed.), Adjuvants andAgrochemicals, vol. 2. CRC Press, Boca Raton, pp. 157–167.
Liu, D., Maguire, R.J., Pacepavicius, G.J., Aoyama, I., Okamura, H., 1995. Microbialtransformation of metolachlor. Environ. Toxicol. Water Qual. 10, 249–258.
Mahmoud, W.M.M., Toolaram, A.P., Menz, J., Leder, C., Schneider, M., Kümmerer, K.,2014. Identification of phototransformation products of thalidomide andmixture toxicity assessment: an experimental and quantitative structuralactivity relationships (QSAR) approach. Water Res. 49, 11–22.
Malouki, M.A., Cavani, L., Halle ter, A., Ciavatta, C., Richard, C., 2009.Photosensitizing properties of formulation adjuvants. J. Photochem. Photobiol.203, 186–191.
Mañas, F., Peralta, L., Raviolo, J., García Ovando, H., Weyers, A., Ugnia, L., et al.,2009. Genotoxicity of AMPA, the environmental metabolite of glyphosate,assessed by the Comet assay and cytogenetic tests. Ecotox. Environ. Safe. 72,834–837.
Martins, P.F., Martinez, C.O., de Carvalho, G., Carneiro, P.I.B., Azevedo, R.A., Pileggi, S.A.V., et al., 2007. Selection of microorganisms degrading S-Metolachlorherbicide. Braz. Arch. Biol. Technol. 50, 153–159.
Mersie, W., McNamee, C., Seybold, C., Wu, J., Tierney, D., 2004. Degradation ofmetolachlor in bare and vegetated soils and in simulated water–sedimentsystems. Environ. Toxicol. Chem. 23, 2627.
Manousaki, E., Psillakis, E., Kalogerakis, N., Mantzavinos, D., 2004. Degradation ofsodium dodecylbenzene sulfonate in water by ultrasonic irradiation. Water Res.38, 3751–3759.
OECD, 1981. Test No. 302C: Inherent Biodegradability: Modified MITI Test (II). OECDPublishing.
OECD, 1992. Test No. 301: Ready Biodegradability. OECD Publishing.OECD, 2000. Test No. 106: Adsorption – Desorption Using a Batch Equilibrium
Method. OECD Publishing.OECD, 2002. Test No. 308: Aerobic and Anaerobic Transformation in Aquatic
Sediment Systems. OECD Publishing.
854 L. Gutowski et al. / Chemosphere 138 (2015) 847–855
OECD, 2004. Test No. 218: Sediment–water Chironomid Toxicity using SpikedSediment. OECD Publishing.
OECD, 2006. Revised Introduction to the OECD Guidelines for Testing of Chemicals,Section 3. OECD Publishing.
Olsson, O., Khodorkovsky, M., Gassmann, M., Friedler, E., Schneider, M., Dubowski,Y., 2013. Fate of pesticides and their transformation products: first flush effectsin a semi-arid catchment. Clean: Soil, Air, Water 41, 134–142.
PPDB, 2014. Pesticide Properties DataBase, 2014. <http://sitem.herts.ac.uk/aeru/ppdb/en/Reports/1027.htm>.
Rastogi, T., Leder, C., Kümmerer, K., 2014a. Designing green derivatives of b-blockerMetoprolol: a tiered approach for green and sustainable pharmacy andchemistry. Chemosphere 111, 493–499.
Rastogi, T., Leder, C., Kümmerer, K., 2014b. Qualitative environmental riskassessment of photolytic transformation products of iodinated X-ray contrastagent diatrizoic acid. Sci. Total Environ. 482–483, 378–388.
Reichenberger, S., Bach, M., Skitschak, A., Frede, H., 2007. Mitigation strategies toreduce pesticide inputs into ground- and surface water and their effectiveness;a review. Sci. Total Environ. 384, 1–35.
Remucal, C.K., 2014. The role of indirect photochemical degradation in theenvironmental fate of pesticides: a review. Environ. Sci. Process. Impact 16,628–653.
Rice, P.J., Anderson, T.A., Coats, J.R., 2004. Effect of sediment on the fate ofmetolachlor and atrazine in surface water. Environ. Toxicol. Chem. 23, 1145.
Saiakhov, R., Chakravarti, S., Klopman, G., 2013. Effectiveness of CASE Ultra expertsystem in evaluating adverse effects of drugs. Mol. Inf. 32, 87–97.
Scott, G.I., Fulton, M.H., Moore, D.W., Wirth, E.F., Chandler, G.T., Key, P.B., et al.,1999. Assessment of risk reduction strategies for the management ofagricultural nonpoint source pesticide runoff in estuarine ecosystems. Toxicol.Ind. Health 15, 200–213.
Scott, M.J., Jones, M.N., 2000. The biodegradation of surfactants in the environment.BBA – Biomembranes 2000 (1508), 235–251.
Shibata, A., Kodaka, R., Fujisawa, T., Katagi, T., 2011. Degradation of flumioxazin inilluminated water–sediment systems. J. Agric. Food Chem. 59, 11186–11195.
Wauchope, R.D., 1978. The pesticide content of surface water draining fromagricultural fields—a review1. J. Environ. Qual. 7, 459.
L. Gutowski et al. / Chemosphere 138 (2015) 847–855 855

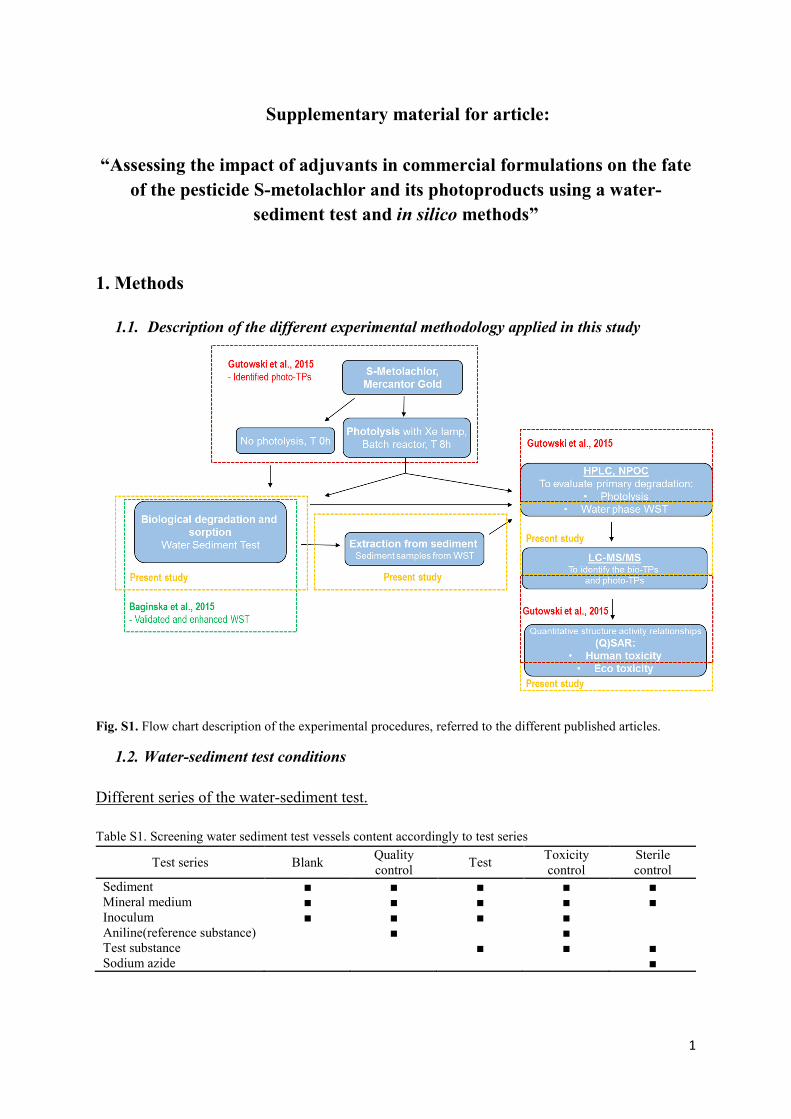
1
Supplementary material for article:
“Assessing the impact of adjuvants in commercial formulations on the fate
of the pesticide S-metolachlor and its photoproducts using a water-
sediment test and in silico methods”
1. Methods
1.1. Description of the different experimental methodology applied in this study
Fig. S1. Flow chart description of the experimental procedures, referred to the different published articles.
1.2. Water-sediment test conditions
Different series of the water-sediment test.
Table S1. Screening water sediment test vessels content accordingly to test series
Test series Blank Quality
control Test
Toxicity
control
Sterile
control
Sediment ■ ■ ■ ■ ■
Mineral medium ■ ■ ■ ■ ■
Inoculum ■ ■ ■ ■
Aniline(reference substance) ■ ■
Test substance ■ ■ ■
Sodium azide ■
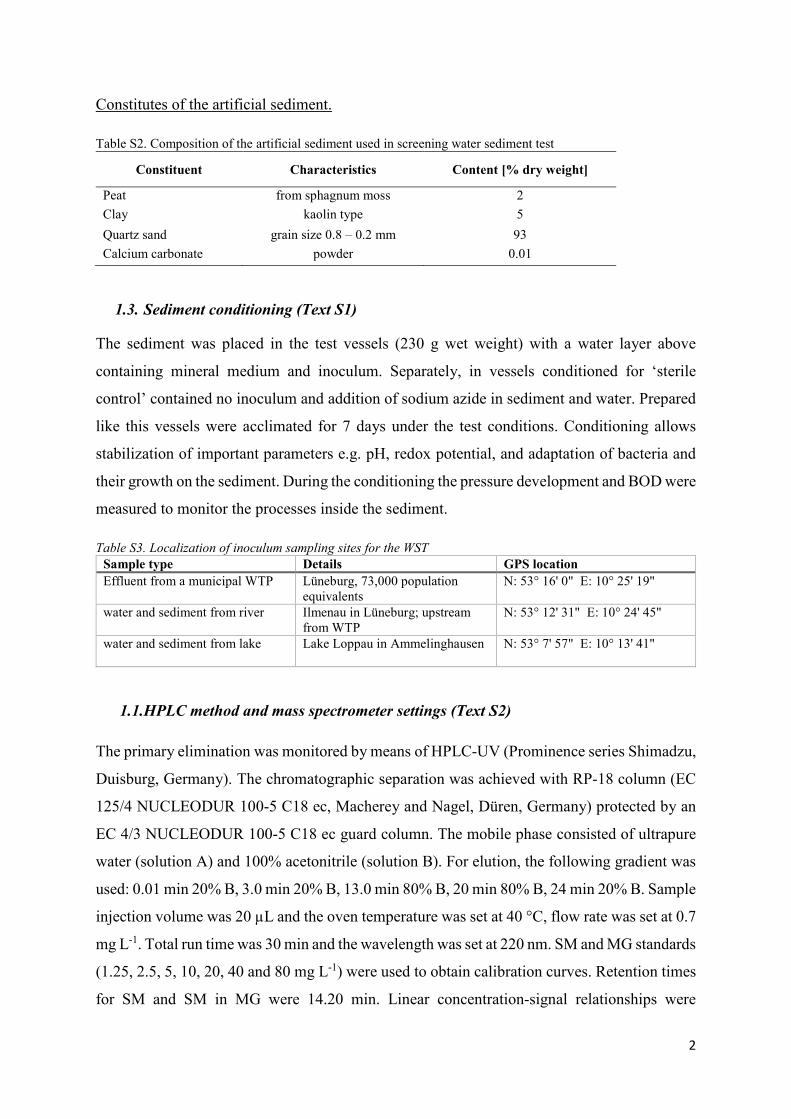
2
Constitutes of the artificial sediment.
Table S2. Composition of the artificial sediment used in screening water sediment test
Constituent Characteristics Content [% dry weight]
Peat from sphagnum moss 2
Clay kaolin type 5
Quartz sand grain size 0.8 – 0.2 mm 93
Calcium carbonate powder 0.01
1.3. Sediment conditioning (Text S1)
The sediment was placed in the test vessels (230 g wet weight) with a water layer above
containing mineral medium and inoculum. Separately, in vessels conditioned for ‘sterile
control’ contained no inoculum and addition of sodium azide in sediment and water. Prepared
like this vessels were acclimated for 7 days under the test conditions. Conditioning allows
stabilization of important parameters e.g. pH, redox potential, and adaptation of bacteria and
their growth on the sediment. During the conditioning the pressure development and BOD were
measured to monitor the processes inside the sediment.
Table S3. Localization of inoculum sampling sites for the WST
Sample type Details GPS location
Effluent from a municipal WTP Lüneburg, 73,000 population
equivalents
N: 53° 16' 0" E: 10° 25' 19"
water and sediment from river Ilmenau in Lüneburg; upstream
from WTP
N: 53° 12' 31" E: 10° 24' 45"
water and sediment from lake Lake Loppau in Ammelinghausen N: 53° 7' 57" E: 10° 13' 41"
1.1.HPLC method and mass spectrometer settings (Text S2)
The primary elimination was monitored by means of HPLC-UV (Prominence series Shimadzu,
Duisburg, Germany). The chromatographic separation was achieved with RP-18 column (EC
125/4 NUCLEODUR 100-5 C18 ec, Macherey and Nagel, Düren, Germany) protected by an
EC 4/3 NUCLEODUR 100-5 C18 ec guard column. The mobile phase consisted of ultrapure
water (solution A) and 100% acetonitrile (solution B). For elution, the following gradient was
used: 0.01 min 20% B, 3.0 min 20% B, 13.0 min 80% B, 20 min 80% B, 24 min 20% B. Sample
injection volume was 20 µL and the oven temperature was set at 40 °C, flow rate was set at 0.7
mg L-1. Total run time was 30 min and the wavelength was set at 220 nm. SM and MG standards
(1.25, 2.5, 5, 10, 20, 40 and 80 mg L-1) were used to obtain calibration curves. Retention times
for SM and SM in MG were 14.20 min. Linear concentration-signal relationships were
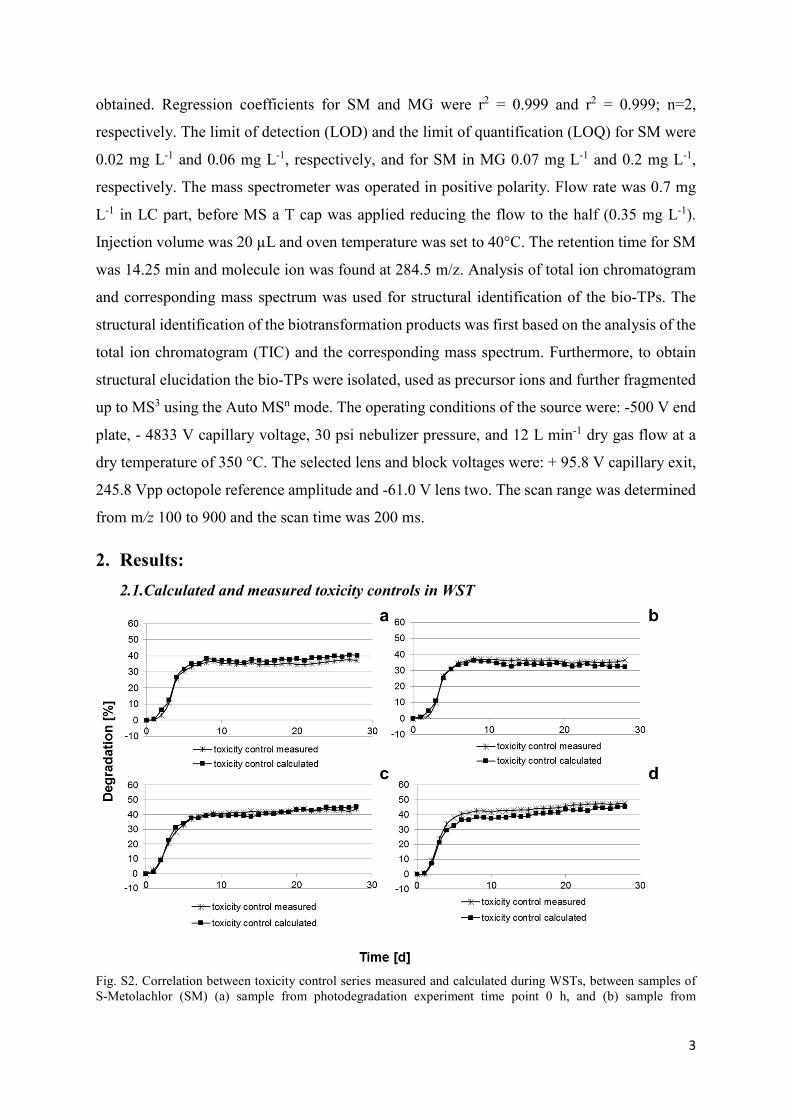
3
obtained. Regression coefficients for SM and MG were r2 = 0.999 and r2 = 0.999; n=2,
respectively. The limit of detection (LOD) and the limit of quantification (LOQ) for SM were
0.02 mg L-1 and 0.06 mg L-1, respectively, and for SM in MG 0.07 mg L-1 and 0.2 mg L-1,
respectively. The mass spectrometer was operated in positive polarity. Flow rate was 0.7 mg
L-1 in LC part, before MS a T cap was applied reducing the flow to the half (0.35 mg L-1).
Injection volume was 20 µL and oven temperature was set to 40°C. The retention time for SM
was 14.25 min and molecule ion was found at 284.5 m/z. Analysis of total ion chromatogram
and corresponding mass spectrum was used for structural identification of the bio-TPs. The
structural identification of the biotransformation products was first based on the analysis of the
total ion chromatogram (TIC) and the corresponding mass spectrum. Furthermore, to obtain
structural elucidation the bio-TPs were isolated, used as precursor ions and further fragmented
up to MS3 using the Auto MSn mode. The operating conditions of the source were: -500 V end
plate, - 4833 V capillary voltage, 30 psi nebulizer pressure, and 12 L min-1 dry gas flow at a
dry temperature of 350 °C. The selected lens and block voltages were: + 95.8 V capillary exit,
245.8 Vpp octopole reference amplitude and -61.0 V lens two. The scan range was determined
from m/z 100 to 900 and the scan time was 200 ms.
2. Results:
2.1.Calculated and measured toxicity controls in WST
Fig. S2. Correlation between toxicity control series measured and calculated during WSTs, between samples of
S-Metolachlor (SM) (a) sample from photodegradation experiment time point 0 h, and (b) sample from
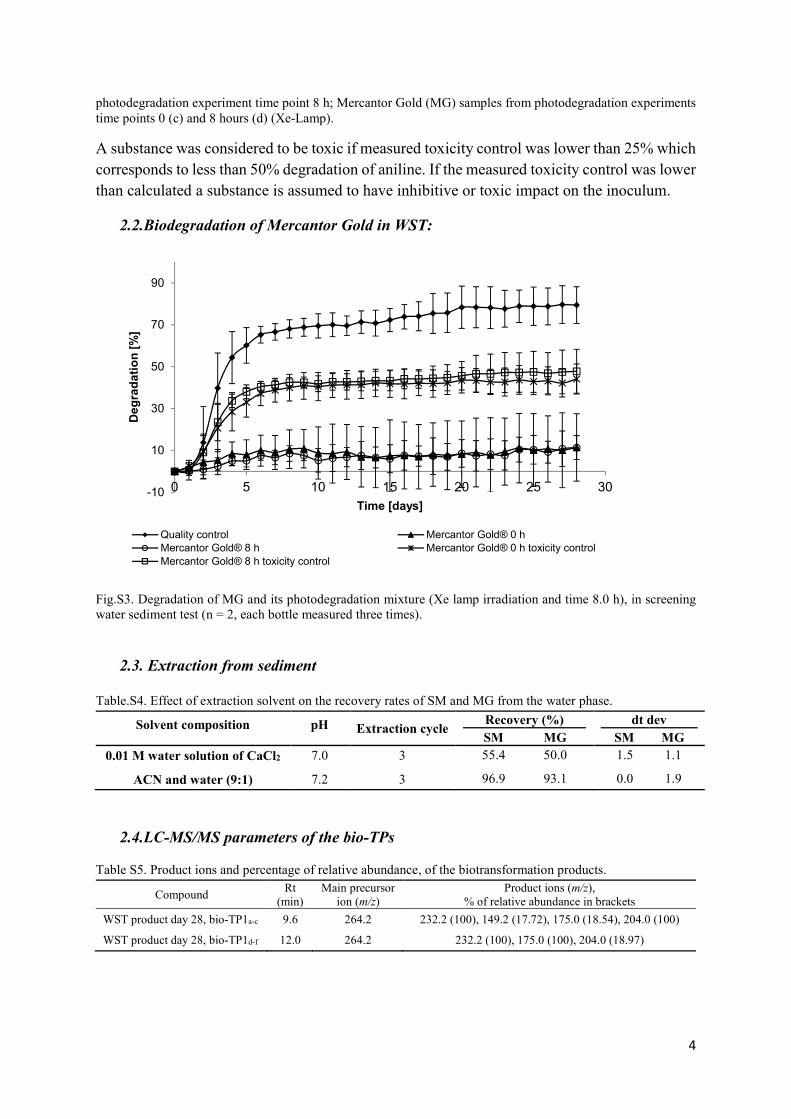
4
photodegradation experiment time point 8 h; Mercantor Gold (MG) samples from photodegradation experiments
time points 0 (c) and 8 hours (d) (Xe-Lamp).
A substance was considered to be toxic if measured toxicity control was lower than 25% which
corresponds to less than 50% degradation of aniline. If the measured toxicity control was lower
than calculated a substance is assumed to have inhibitive or toxic impact on the inoculum.
2.2.Biodegradation of Mercantor Gold in WST:
Fig.S3. Degradation of MG and its photodegradation mixture (Xe lamp irradiation and time 8.0 h), in screening
water sediment test (n = 2, each bottle measured three times).
2.3. Extraction from sediment
Table.S4. Effect of extraction solvent on the recovery rates of SM and MG from the water phase.
Solvent composition pH Extraction cycle Recovery (%)
SM MG
dt dev
SM MG
0.01 M water solution of CaCl2 7.0 3 55.4 50.0
1.5 1.1
ACN and water (9:1) 7.2 3 96.9 93.1
0.0 1.9
2.4.LC-MS/MS parameters of the bio-TPs
Table S5. Product ions and percentage of relative abundance, of the biotransformation products.
-10
10
30
50
70
90
0 5 10 15 20 25 30
De
gra
da
tio
n [
%]
Time [days]
Quality control Mercantor Gold® 0 h
Mercantor Gold® 8 h Mercantor Gold® 0 h toxicity control
Mercantor Gold® 8 h toxicity control
Compound Rt
(min)
Main precursor
ion (m/z)
Product ions (m/z),
% of relative abundance in brackets
WST product day 28, bio-TP1a-c 9.6 264.2 232.2 (100), 149.2 (17.72), 175.0 (18.54), 204.0 (100)
WST product day 28, bio-TP1d-f 12.0 264.2 232.2 (100), 175.0 (100), 204.0 (18.97)
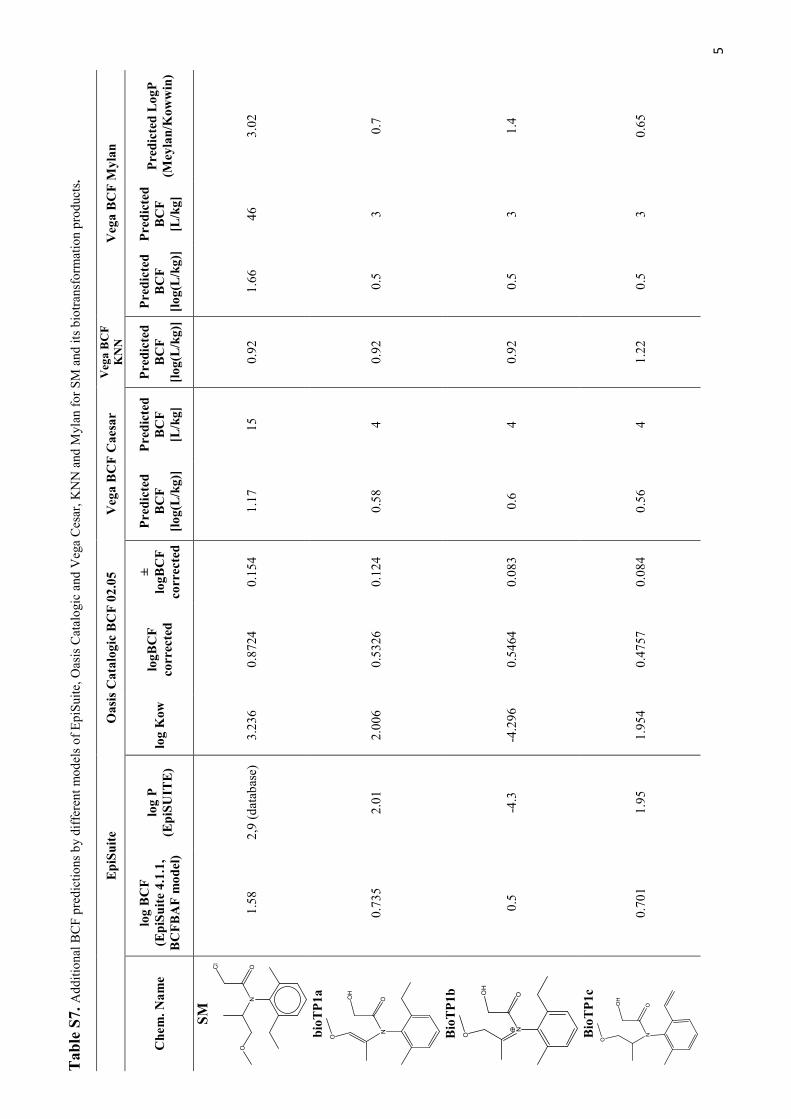
5
Tab
le S
7.
Ad
dit
ional
BC
F p
red
icti
ons
by d
iffe
ren
t m
od
els
of
Ep
iSuit
e, O
asi
s C
atal
ogic
and
Veg
a C
esa
r, K
NN
and
Myla
n f
or
SM
and
its
bio
tran
sfo
rmat
ion p
rod
uct
s.
E
piS
uit
e
Oa
sis
Ca
talo
gic
BC
F 0
2.0
5
Veg
a B
CF
Ca
esa
r V
ega B
CF
KN
N
Veg
a B
CF
My
lan
Ch
em
. N
am
e
log
BC
F
(Ep
iSu
ite
4.1
.1,
BC
FB
AF
mo
del
)
log
P
(Ep
iSU
ITE
) lo
g K
ow
lo
gB
CF
corr
ecte
d
±
log
BC
F
corr
ecte
d
Pre
dic
ted
BC
F
[lo
g(L
/kg
)]
Pre
dic
ted
BC
F
[L/k
g]
Pre
dic
ted
BC
F
[lo
g(L
/kg
)]
Pre
dic
ted
BC
F
[lo
g(L
/kg
)]
Pre
dic
ted
BC
F
[L/k
g]
Pre
dic
ted
Lo
gP
(Mey
lan
/Kow
win
)
SM
C
l
ON
O
1.5
8
2,9
(d
atab
ase)
3
.23
6
0.8
724
0.1
54
1.1
7
15
0.9
2
1.6
6
46
3.0
2
bio
TP
1a
NOO
H
O
0.7
35
2.0
1
2.0
06
0.5
326
0.1
24
0.5
8
4
0.9
2
0.5
3
0
.7
Bio
TP
1b
NOO
H
O
0.5
-4
.3
-4.2
96
0.5
464
0.0
83
0.6
4
0
.92
0.5
3
1
.4
Bio
TP
1c
NOO
H
O
0.7
01
1.9
5
1.9
54
0.4
757
0.0
84
0.5
6
4
1.2
2
0.5
3
0
.65
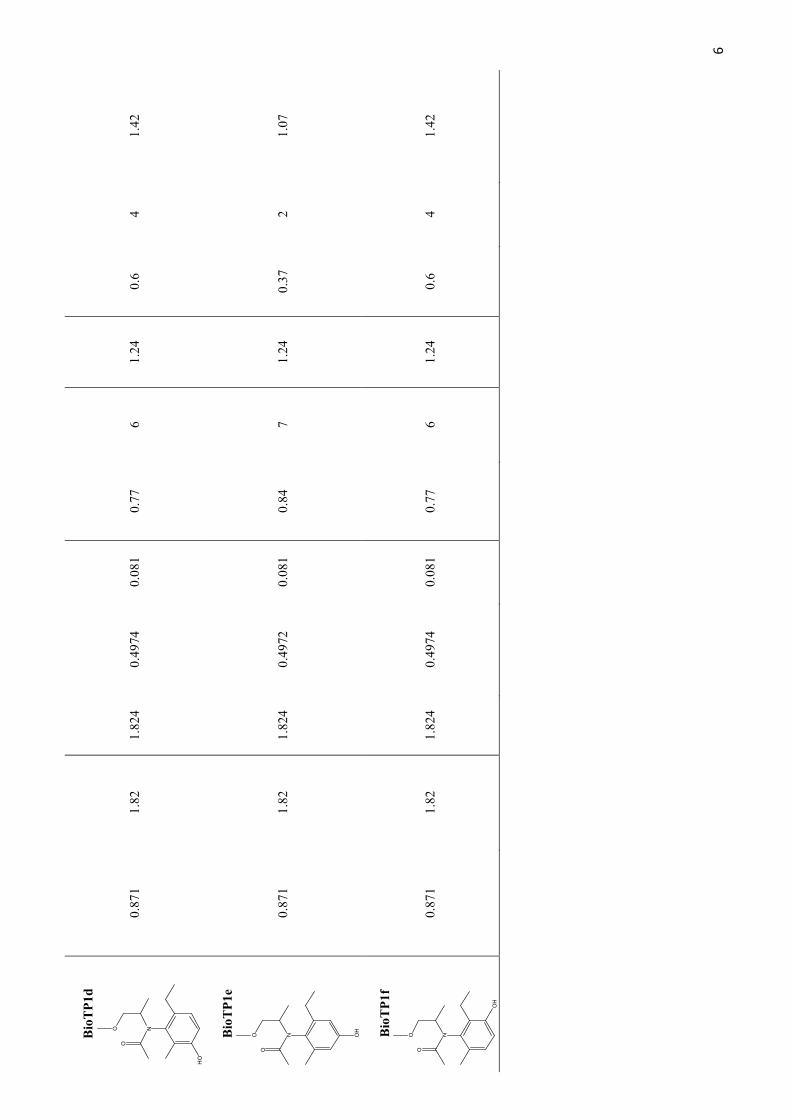
6
Bio
TP
1d
NO
O
HO
0.8
71
1.8
2
1.8
24
0.4
974
0.0
81
0.7
7
6
1.2
4
0.6
4
1
.42
Bio
TP
1e
NO
O
OH
0.8
71
1.8
2
1.8
24
0.4
972
0.0
81
0.8
4
7
1.2
4
0.3
7
2
1.0
7
Bio
TP
1f
NO
O
OH
0.8
71
1.8
2
1.8
24
0.4
974
0.0
81
0.7
7
6
1.2
4
0.6
4
1
.42