Embed Size (px)
Citation preview
Selective role of calcineurin in haematopoiesisand lymphopoiesisElena M. Gallo1, Lena Ho1, Monte M. Winslow1w, Tracy L. Staton1z & Gerald R. Crabtree1–4+
1Multidisciplinary Program in Immunology, and 2Howard Hughes Medical Institute, 3Department of Pathology
and 4Department of Developmental Biology, Stanford University, Stanford, California, USA
The calcineurin/NFAT (nuclear factor of activated T-cells)signalling pathway is essential for many aspects of vertebratedevelopment and is the target of the widely used immuno-suppressive drugs FK506 and cyclosporine A. The basis for thetherapeutic specificity of these drugs has remained unclear, ascalcineurin is expressed ubiquitously. By inactivating calcineurinduring haematopoietic development, we found that although thissignalling pathway has an important, non-redundant role in theregulation of lymphocyte developmental checkpoints, it is notessential for the development of blood myeloid lineages. Thesestudies have shown that the specificity of calcineurin inhibitorsarises from the selective use of calcineurin at distinct develop-mental stages. The requirement for calcineurin/NFAT in thedevelopment of the adaptive but not of the innate immune systemis consistent with the idea that the evolutionary appearance ofthis pathway was involved in the emergence of vertebrates.Keywords: haematopoiesis; calcineurin; NFAT; signallingEMBO reports (2008) 9, 1141–1148. doi:10.1038/embor.2008.174
INTRODUCTIONThe calcineurin/NFAT (nuclear factor of activated T-cells) signal-ling pathway, originally discovered in lymphocytes, is importantin many aspects of vertebrate development, including axonalguidance, vasculogenesis and cardiac morphogenesis. Ligation ofmany receptors leads to a rise in intracellular calcium concentra-tion and to the activation of calcineurin phosphatase by Ca2þ -bound calmodulin. Dephosphorylation of the cytoplasmic sub-units (NFATc) of NFAT transcription complexes by calcineurin
reveals the nuclear localization sequence and results in theirimport into the nucleus, where they bind to DNA and regulatetranscription cooperatively with other transcription factors(Crabtree & Olson, 2002). The important role of calcineurin/NFAT signalling in the regulation of immune function is shown bythe fact that this pathway is the common target of two of the mosteffective immunosuppressive drugs, FK506 and cyclosporine A(Flanagan et al, 1991). The molecular basis of specificity of thesedrugs in blocking immune responses is not clear; however, twotheories have been advanced. Specificity might arise from theselective use of the ubiquitous pathway for specific developmentalsteps. Alternatively, the main gain-of-function mechanism ofaction of both cyclosporine A and FK506 would render cells withlower concentrations of calcineurin paradoxically more sensitiveto the drugs. We investigated the role of this pathway in thedevelopment of the haematopoietic system by deletingthe regulatory subunit calcineurin B1 (Cnb1) specifically in bonemarrow-derived stem cells. In adult mice all blood cells derivefrom haematopoietic stem cells (Iwasaki & Akashi, 2007); there-fore, deletion of a genomic locus in these cells results in deletionin all haematopoietic lineages, thereby allowing identification ofthe steps requiring a specific gene.
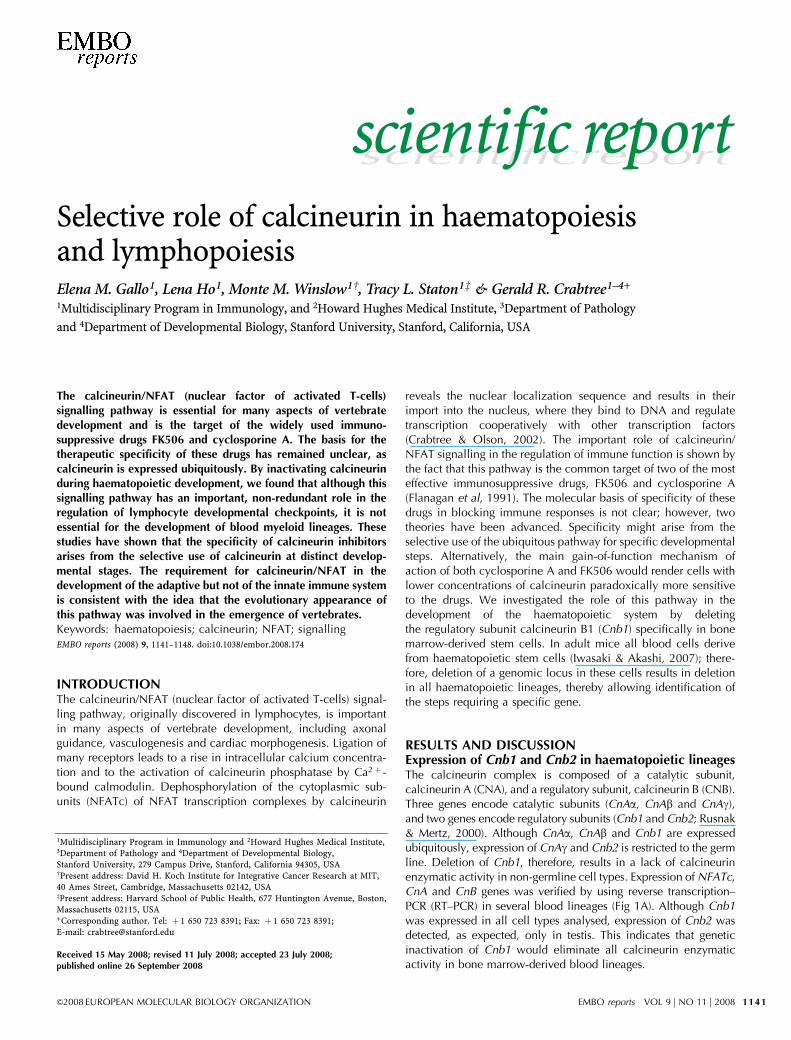
RESULTS AND DISCUSSIONExpression of Cnb1 and Cnb2 in haematopoietic lineagesThe calcineurin complex is composed of a catalytic subunit,calcineurin A (CNA), and a regulatory subunit, calcineurin B (CNB).Three genes encode catalytic subunits (CnAa, CnAb and CnAg),and two genes encode regulatory subunits (Cnb1 and Cnb2; Rusnak& Mertz, 2000). Although CnAa, CnAb and Cnb1 are expressedubiquitously, expression of CnAg and Cnb2 is restricted to the germline. Deletion of Cnb1, therefore, results in a lack of calcineurinenzymatic activity in non-germline cell types. Expression of NFATc,CnA and CnB genes was verified by using reverse transcription–PCR (RT–PCR) in several blood lineages (Fig 1A). Although Cnb1was expressed in all cell types analysed, expression of Cnb2 wasdetected, as expected, only in testis. This indicates that geneticinactivation of Cnb1 would eliminate all calcineurin enzymaticactivity in bone marrow-derived blood lineages.
Received 15 May 2008; revised 11 July 2008; accepted 23 July 2008;published online 26 September 2008
+Corresponding author. Tel: þ 1 650 723 8391; Fax: þ 1 650 723 8391;E-mail: [email protected]
1Multidisciplinary Program in Immunology and 2Howard Hughes Medical Institute,3Department of Pathology and 4Department of Developmental Biology,Stanford University, 279 Campus Drive, Stanford, California 94305, USAwPresent address: David H. Koch Institute for Integrative Cancer Research at MIT,40 Ames Street, Cambridge, Massachusetts 02142, USAzPresent address: Harvard School of Public Health, 677 Huntington Avenue, Boston,Massachusetts 02115, USA
&2008 EUROPEAN MOLECULAR BIOLOGY ORGANIZATION EMBO reports VOL 9 | NO 11 | 2008
scientificreportscientific report
1141
Inducible deletion of Cnb1 in bone marrow cellsCnb1 conditional knockout mice (Cnb1flox/flox; Neilson et al,2004) were crossed with mice expressing the Cre recombinasegene under the control of the interferon-inducible Mx-1 promoter(Kuhn et al, 1995). This promoter drives deletion in allhaematopoietic cells and is induced by the administration of viralmimics such as poly inosilic acid (poly I:C). After treatment, whole
or sorted bone marrow fractions from CD45.2þ control or CNB1-deficient donors were isolated and transplanted into congenicCD45.1þ recipients (B6.SJL; Fig 1B). The mismatched surfacemarkers CD45.1 and CD45.2 were used to monitor the efficiencyof reconstitution.
Whole bone marrow from mice treated with poly I:C wasanalysed to assess deletion of the Cnb1 genomic locus. The Cnb1locus was completely deleted in CNB1-deficient bone marrow(Fig 1C). Control and experimental mice treated with poly I:Cshowed no sign of toxicity and survived for more than 6 monthsafter treatment (data not shown).
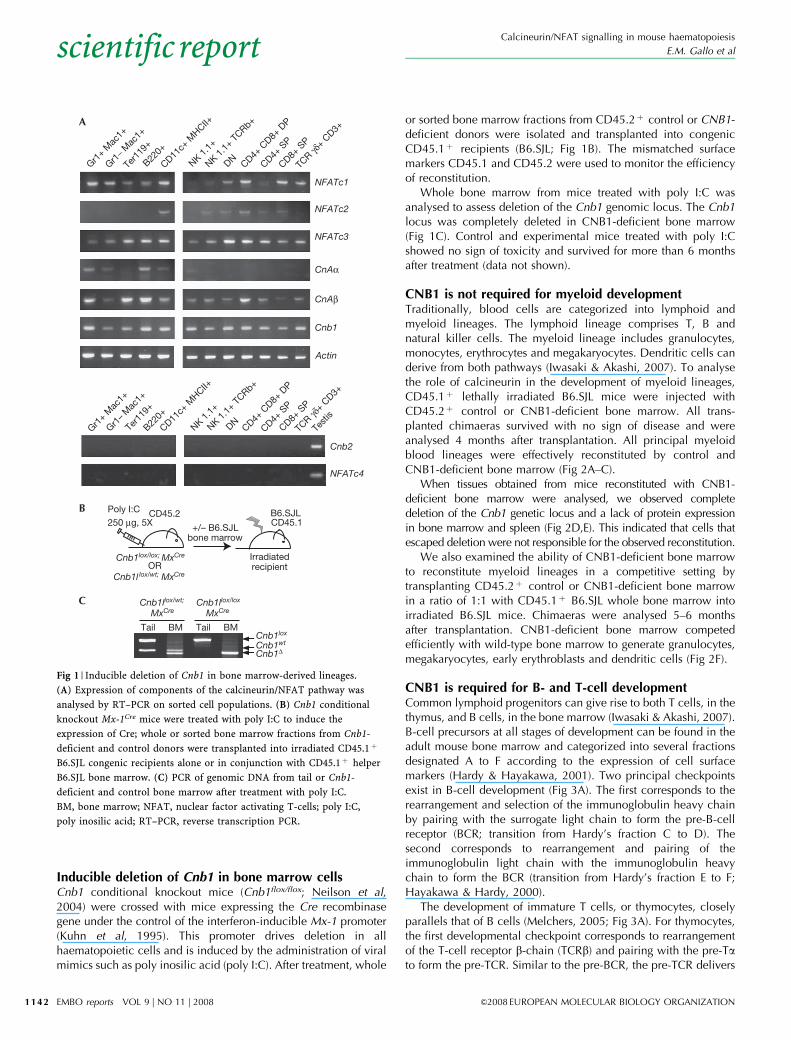
CNB1 is not required for myeloid developmentTraditionally, blood cells are categorized into lymphoid andmyeloid lineages. The lymphoid lineage comprises T, B andnatural killer cells. The myeloid lineage includes granulocytes,monocytes, erythrocytes and megakaryocytes. Dendritic cells canderive from both pathways (Iwasaki & Akashi, 2007). To analysethe role of calcineurin in the development of myeloid lineages,CD45.1þ lethally irradiated B6.SJL mice were injected withCD45.2þ control or CNB1-deficient bone marrow. All trans-planted chimaeras survived with no sign of disease and wereanalysed 4 months after transplantation. All principal myeloidblood lineages were effectively reconstituted by control andCNB1-deficient bone marrow (Fig 2A–C).
When tissues obtained from mice reconstituted with CNB1-deficient bone marrow were analysed, we observed completedeletion of the Cnb1 genetic locus and a lack of protein expressionin bone marrow and spleen (Fig 2D,E). This indicated that cells thatescaped deletion were not responsible for the observed reconstitution.
We also examined the ability of CNB1-deficient bone marrowto reconstitute myeloid lineages in a competitive setting bytransplanting CD45.2þ control or CNB1-deficient bone marrowin a ratio of 1:1 with CD45.1þ B6.SJL whole bone marrow intoirradiated B6.SJL mice. Chimaeras were analysed 5–6 monthsafter transplantation. CNB1-deficient bone marrow competedefficiently with wild-type bone marrow to generate granulocytes,megakaryocytes, early erythroblasts and dendritic cells (Fig 2F).
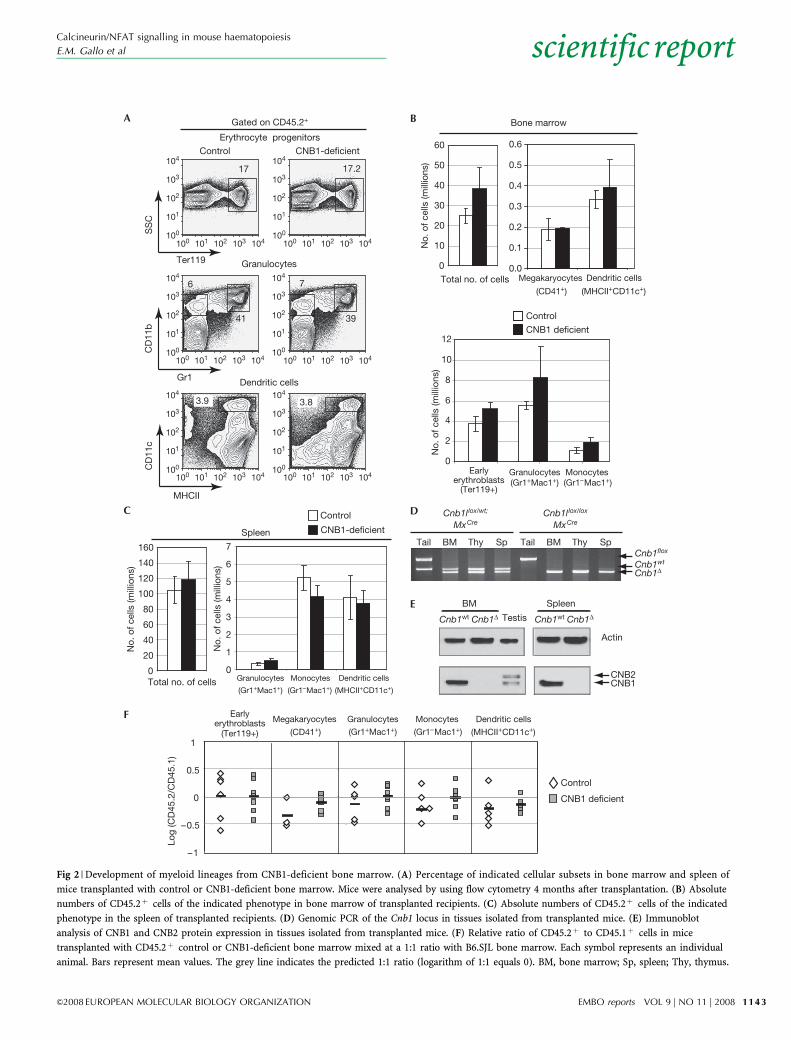
CNB1 is required for B- and T-cell developmentCommon lymphoid progenitors can give rise to both T cells, in thethymus, and B cells, in the bone marrow (Iwasaki & Akashi, 2007).B-cell precursors at all stages of development can be found in theadult mouse bone marrow and categorized into several fractionsdesignated A to F according to the expression of cell surfacemarkers (Hardy & Hayakawa, 2001). Two principal checkpointsexist in B-cell development (Fig 3A). The first corresponds to therearrangement and selection of the immunoglobulin heavy chainby pairing with the surrogate light chain to form the pre-B-cellreceptor (BCR; transition from Hardy’s fraction C to D). Thesecond corresponds to rearrangement and pairing of theimmunoglobulin light chain with the immunoglobulin heavychain to form the BCR (transition from Hardy’s fraction E to F;Hayakawa & Hardy, 2000).
The development of immature T cells, or thymocytes, closelyparallels that of B cells (Melchers, 2005; Fig 3A). For thymocytes,the first developmental checkpoint corresponds to rearrangementof the T-cell receptor b-chain (TCRb) and pairing with the pre-Tato form the pre-TCR. Similar to the pre-BCR, the pre-TCR delivers
Tail
CD45.2CD45.1B6.SJL
Cnb1lox/lox; MxCre
Cnb1l lox/wt; MxCre
+/– B6.SJLbone marrow
ORIrradiatedrecipient
Poly I:C250 μg, 5X
Gr1+ M
ac1+
NK 1.1
+ TCRb+
DN CD4+ C
D8+ D
P
CD4+ S
P
CD8+ S
P
TCR γδ
+ CD3+
Gr1− M
ac1+
Ter1
19+
CD11c+
MHCII+
B220+
NK 1.1
+
NFATc1
CnAβ
NFATc3
Actin
CnAα
Cnb1
NFATc2
DNTer1
19+
B220+
NK 1.1
+
Gr1+ M
ac1+
NK 1.1
+ TCRb+
CD4+ C
D8+ D
P
CD4+ S
P
CD8+ S
P
TCR γδ
+ CD3+
Gr1– M
ac1+
CD11c+
MHCII+
Testi
s
Cnb2
NFATc4
Cnb1lox
Cnb1wt
Cnb1Δ
Cnb1llox/wt;
MxCreCnb1llox/lox
MxCre
BM Tail BM
Fig 1 | Inducible deletion of Cnb1 in bone marrow-derived lineages.
(A) Expression of components of the calcineurin/NFAT pathway was
analysed by RT–PCR on sorted cell populations. (B) Cnb1 conditional
knockout Mx-1Cre mice were treated with poly I:C to induce the
expression of Cre; whole or sorted bone marrow fractions from Cnb1-
deficient and control donors were transplanted into irradiated CD45.1þ
B6.SJL congenic recipients alone or in conjunction with CD45.1þ helper
B6.SJL bone marrow. (C) PCR of genomic DNA from tail or Cnb1-
deficient and control bone marrow after treatment with poly I:C.
BM, bone marrow; NFAT, nuclear factor activating T-cells; poly I:C,
poly inosilic acid; RT–PCR, reverse transcription PCR.
Calcineurin/NFAT signalling in mouse haematopoiesis
E.M. Gallo et al
EMBO reports VOL 9 | NO 11 | 2008 &2008 EUROPEAN MOLECULAR BIOLOGY ORGANIZATION
scientificreport
1142
Control
CNB1-deficient
0
1
2
3
4
5
6
7
No.
of c
ells
(mill
ions
)
Spleen
0
20
40
60
80
100
120
140
160
Total no. of cells
No.
of c
ells
(mill
ions
)
0
2
4
6
8
10
12
(Ter119+)
0.0
0.1
0.2
0.3
0.4
0.5
0.6
(CD41+) (MHCII+CD11c+)
No.
of c
ells
(mill
ions
)
0
10
20
30
40
50
60
Total no. of cells
No.
of c
ells
(mill
ions
)
Control
CNB1 deficient
6
41
7
39
100
100
101
101 102 103 104
100 101 102 103 104
100 101 102 103 104 100 101 102 103 104
100 101 102 103 104
102
103
104
100
101
102
103
104
100
101
102
103
104
100
101
102
103
104
100
101
102
103
104
100
100
101
101 102 103 104
102
103
104
17 17.2
3.9 3.8
CD
11b
Gr1
SS
C
Ter119
CD
11c
MHCII
Gated on CD45.2+
CNB1-deficientControl
Bone marrow
Tail TailCnb1flox
Cnb1wt
Cnb1Δ
BM
TestisCnb1wt
Spleen
Log
(CD
45.2
/CD
45.1
)
CNB2CNB1
Actin
Control
CNB1 deficient
Cnb1Δ Cnb1wt Cnb1Δ
0
0.5
1
–0.5
–1
Cnb1llox/wt;
MxCre MxCreCnb1llox/lox
Erythrocyte progenitors
Megakaryocytes
Granulocytes
Dendritic cells
Dendritic cells
(CD41+) (MHCII+CD11c+)
Megakaryocytes Dendritic cells
(Gr1–Mac1+)
Monocytes
(Gr1+Mac1+)
Granulocytes
(Gr1–Mac1+)Monocytes
(Gr1+Mac1+)Granulocytes
(Gr1–Mac1+)
Monocytes
(Gr1+Mac1+)
Granulocytes
(MHCII+CD11c+)
Dendritic cells
Earlyerythroblasts
(Ter119+)
Earlyerythroblasts
BM Thy Sp BM Thy Sp
Fig 2 | Development of myeloid lineages from CNB1-deficient bone marrow. (A) Percentage of indicated cellular subsets in bone marrow and spleen of
mice transplanted with control or CNB1-deficient bone marrow. Mice were analysed by using flow cytometry 4 months after transplantation. (B) Absolute
numbers of CD45.2þ cells of the indicated phenotype in bone marrow of transplanted recipients. (C) Absolute numbers of CD45.2þ cells of the indicated
phenotype in the spleen of transplanted recipients. (D) Genomic PCR of the Cnb1 locus in tissues isolated from transplanted mice. (E) Immunoblot
analysis of CNB1 and CNB2 protein expression in tissues isolated from transplanted mice. (F) Relative ratio of CD45.2þ to CD45.1þ cells in mice
transplanted with CD45.2þ control or CNB1-deficient bone marrow mixed at a 1:1 ratio with B6.SJL bone marrow. Each symbol represents an individual
animal. Bars represent mean values. The grey line indicates the predicted 1:1 ratio (logarithm of 1:1 equals 0). BM, bone marrow; Sp, spleen; Thy, thymus.
Calcineurin/NFAT signalling in mouse haematopoiesis
E.M. Gallo et al
&2008 EUROPEAN MOLECULAR BIOLOGY ORGANIZATION EMBO reports VOL 9 | NO 11 | 2008
scientificreport
1143
survival/differentiation signals that allow the transition to the nextdevelopmental stage (transition from the double negative 3/4 stageto the double positive stage; Bhandoola et al, 2007). The secondcheckpoint corresponds to rearrangement and expression of theTCRa chain to form the abTCR. At this stage, thymocytes arepositively and negatively selected by peptide-major histocompati-bility complex molecules, a process unique to developingT cells (Starr et al, 2003).
First, we examined the role of calcineurin/NFAT signallingin the development of B and T cells in a non-competitivetransplantation experiment, by transplanting whole CD45.2þ
control or CNB1-deficient bone marrow in CD45.1þ lethallyirradiated B6.SJL mice. As reported previously (Neilson et al,2004), the deletion of Cnb1 resulted in a block of positiveselection, and impaired transition between the double-negativeand double-positive stages of development of thymocytes,
0.9
68.421
1.7
7020
57.4
8.3
33
26
38
50.4
25.5
20.4
53.4
8.47 90
21
104
103
102
101
101100
104
103
102
101
100
100 103 104102101100 103 104102
104
103
102
101
100
104
103
102
101
100
101100 103 104102101100 103 104102
104
103
102
101
100
101100 103 104102
104
103
102
101
100
101100 103 104102
104
103
102
101
100
101100 103 104102
104
103
102
101
100
101100 103 104102
0.3
1.34
Gated on CD45.2+
CNB1 deficientControl
B22
0
CD43 B220+ CD43+
B220+ CD43–
BP
1
CD24
B22
0
IgM
Gated on CD45.2+
CNB1 deficientControl
Thymus
0
2
4
6
CD4SP0
20
40
60
70
DP B220 + cells
Bone marrow
No.
of c
ells
(mill
ions
)
No.
of c
ells
(mill
ions
)
Control CNB1 deficient
0
5
10
15
20
25
Prepro-B Pro-B Pro-B Immature B cell
Mature B cell
Fr. A
B220+
CD43+
CD24–
BP-1–
DN1 DN2/3 DN3 DN4 DP CD4SPOR
CD8SP
CD4–
CD8–
CD44+
CD25–
CD4–
CD8–
CD44+/-
CD25+
TCRβ–
CD4–
CD8–
CD44+
CD25+
TCRβ+
CD4–
CD8–
CD44–
CD25–
TCRβ+
CD4+
CD8+
TCRβ+
TCRα–
CD4+
OR CD8+
TCRβ+
TCRα+
T-ce
ll d
evel
opm
ent
Thy
mus
B-c
ell d
evel
opm
ent
Bon
e m
arro
w
B220+
CD43+
CD24+
BP-1–
B220+
CD43+
CD24+
BP-1+
B220+
CD43–
IgM–
IgD–
B220+
CD43–
IgM+
IgD–
B220+
CD43–
IgM+
IgD+
Fr. B Fr. C Fr. D Fr. E Fr. F
Pre-B
94.4
CD8SP
9.78.3
Fig 3 | CNB1-deficient B- and T-cell development in a non-competitive setting. (A) Diagram illustrating stages and surface marker in B- and T-cell
development. Bars indicate principal developmental checkpoints. (B) CD45.1þ B6.SJL lethally irradiated mice were injected with CD45.2þ control
or CNB1-deficient bone marrow and then analysed 4 months after transplantation by flow cytometry. Figure shows the percentage of developing
B-cell subsets in the bone marrow of transplanted recipients. (C) Percentage of developing T-cell subsets in the thymus of transplanted recipients.
(D) Absolute numbers of CD45.2þ developing T and B cells in transplanted mice. DN, double negative; DP, double positive.
Calcineurin/NFAT signalling in mouse haematopoiesis
E.M. Gallo et al
EMBO reports VOL 9 | NO 11 | 2008 &2008 EUROPEAN MOLECULAR BIOLOGY ORGANIZATION
scientificreport
1144
but it had no major effect on B-cell development in the bonemarrow (Fig 3B–D).
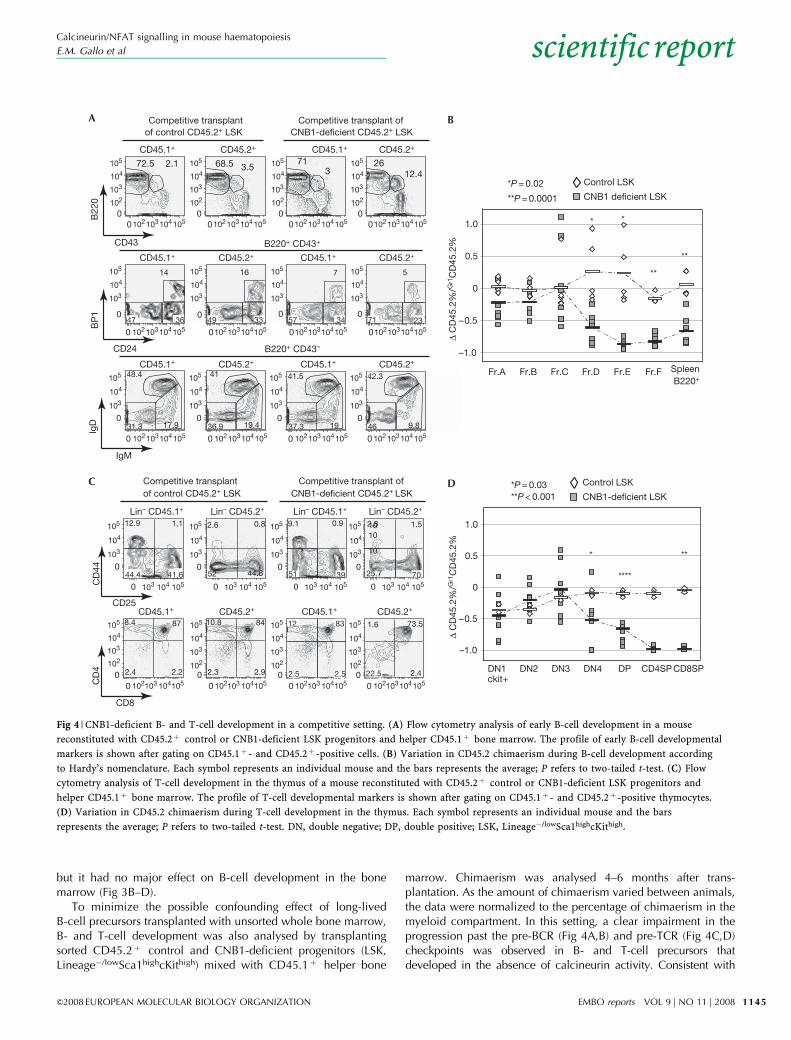
To minimize the possible confounding effect of long-livedB-cell precursors transplanted with unsorted whole bone marrow,B- and T-cell development was also analysed by transplantingsorted CD45.2þ control and CNB1-deficient progenitors (LSK,Lineage�/lowSca1highcKithigh) mixed with CD45.1þ helper bone
marrow. Chimaerism was analysed 4–6 months after trans-plantation. As the amount of chimaerism varied between animals,the data were normalized to the percentage of chimaerism in themyeloid compartment. In this setting, a clear impairment in theprogression past the pre-BCR (Fig 4A,B) and pre-TCR (Fig 4C,D)checkpoints was observed in B- and T-cell precursors thatdeveloped in the absence of calcineurin activity. Consistent with
371
12.426
57 34
7
71 23
5
37.3 19
41.5
46 9.8
42.3
CD45.1+
B22
0
CD43
BP
1
CD24
IgD
IgM
CD45.2+
CD45.1+ CD45.2+
CD45.1+ CD45.2+
Fr.A Fr.B Fr.C Fr.D Fr.E Fr.F SpleenB220+
–1.0
–0.5
0
0.5
1.0
–1.0
–0.5
0
0.5
1.0
Δ C
D45
.2%
/Gr1
CD
45.2
%
12 83
2.52.5
1.6
2.422.5
9.1 0.9
3951
10
10102.8
7025.7
CD
4
CD8
Lin– CD45.1+ Lin– CD45.2+
CD
44
CD25
CD8SP
Control LSK
CNB1 deficient LSK
DN1ckit+
DN2 DN3 DN4
Δ C
D45
.2%
/Gr1
CD
45.2
%
*P = 0.03**P < 0.001
*P = 0.02
**P = 0.0001
* *
**
**
*
****
**
Control LSK
CNB1-deficient LSK
CD45.1+ CD45.2+
0102
102
103
103
104
104
105
105
0
102103104105
0102
103
104
105
0102
103
104
105
0102
103
104
105
0
0 102103104105
0 102103104105
0 103 104 105 0 103 104 105 0 103 104 105 0 103 104 105
0 102103104105 0 102103104105 0 102103104105
0 1021031041050 102103 1041050 102103 1041050 102103 104105
0102103104105 0102103104105 0102103104105
0 0 0
103
104
105
103
104
105
103
104
105
103
104
105
0103
104
105
0103
104
105
0103
104
105
0103
104
105
0103
104
105
0103
104
105
0103
104
105
0103
104
105
0
0102
102
103
103
104
104
105
105
00102
102
103
103
104
104
105
105
00102
102
103
103
104
104
105
105
0
2.172.5 3.568.5
47 36
14
49 33.
16
31.3 17.9
48.4
36.9 19.4
41
CD45.1+ CD45.2+
B220+ CD43–
CD45.1+ CD45.2+
B220+ CD43+
CD45.1+ CD45.2+
Competitive transplantof control CD45.2+ LSK
Competitive transplant ofCNB1-deficient CD45.2+ LSK
12.9
41.644.4
2.6
52 44.6
8.4
2.22.4
10.8
2.92.3
Lin– CD45.1+ Lin– CD45.2+
CD45.1+ CD45.2+
Competitive transplantof control CD45.2+ LSK
Competitive transplant ofCNB1-deficient CD45.2+ LSK
CD4SPDP
87 84 73.5
1.50.81.1
Fig 4 | CNB1-deficient B- and T-cell development in a competitive setting. (A) Flow cytometry analysis of early B-cell development in a mouse
reconstituted with CD45.2þ control or CNB1-deficient LSK progenitors and helper CD45.1þ bone marrow. The profile of early B-cell developmental
markers is shown after gating on CD45.1þ - and CD45.2þ -positive cells. (B) Variation in CD45.2 chimaerism during B-cell development according
to Hardy’s nomenclature. Each symbol represents an individual mouse and the bars represents the average; P refers to two-tailed t-test. (C) Flow
cytometry analysis of T-cell development in the thymus of a mouse reconstituted with CD45.2þ control or CNB1-deficient LSK progenitors and
helper CD45.1þ bone marrow. The profile of T-cell developmental markers is shown after gating on CD45.1þ - and CD45.2þ -positive thymocytes.
(D) Variation in CD45.2 chimaerism during T-cell development in the thymus. Each symbol represents an individual mouse and the bars
represents the average; P refers to two-tailed t-test. DN, double negative; DP, double positive; LSK, Lineage�/lowSca1highcKithigh.
Calcineurin/NFAT signalling in mouse haematopoiesis
E.M. Gallo et al
&2008 EUROPEAN MOLECULAR BIOLOGY ORGANIZATION EMBO reports VOL 9 | NO 11 | 2008
scientificreport
1145
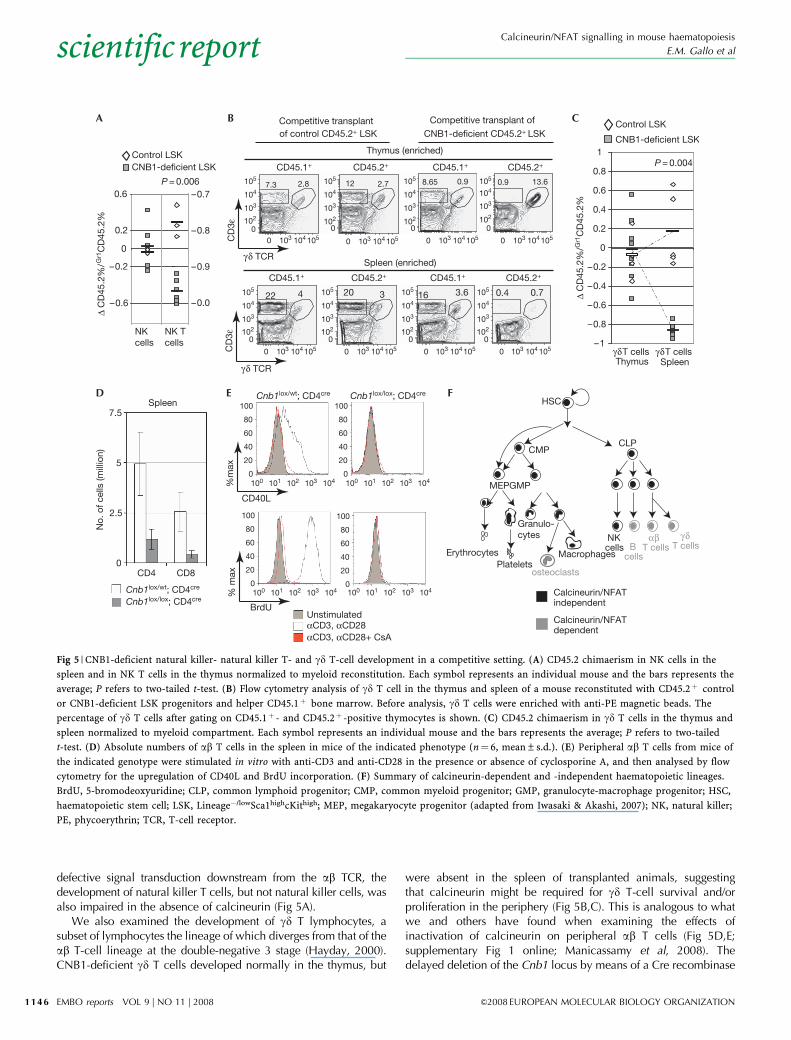
defective signal transduction downstream from the ab TCR, thedevelopment of natural killer T cells, but not natural killer cells, wasalso impaired in the absence of calcineurin (Fig 5A).
We also examined the development of gd T lymphocytes, asubset of lymphocytes the lineage of which diverges from that of theab T-cell lineage at the double-negative 3 stage (Hayday, 2000).CNB1-deficient gd T cells developed normally in the thymus, but
were absent in the spleen of transplanted animals, suggestingthat calcineurin might be required for gd T-cell survival and/orproliferation in the periphery (Fig 5B,C). This is analogous to whatwe and others have found when examining the effects ofinactivation of calcineurin on peripheral ab T cells (Fig 5D,E;supplementary Fig 1 online; Manicassamy et al, 2008). Thedelayed deletion of the Cnb1 locus by means of a Cre recombinase
CD
3ε
γδ TCR
13.60.9
0.70.43.616
0.98.65
Spleen (enriched)
Thymus (enriched)
CD45.1+ CD45.2+
ThymusγδT cells γδT cells Spleen
Control LSK
CNB1-deficient LSK
Δ C
D45
.2%
/Gr1
CD
45.2
%
–1
–0.8
–0.6
–0.4
–0.2
0
0.2
0.4
0.6
0.8
1P = 0.004
CD45.1+ CD45.2+
CD
3ε
γδ TCR
HSC
CLPCMP
MEPGMP
ErythrocytesPlatelets
Granulo-cytes
Macrophages
osteoclasts
Bcells
NKcells
αβ T cells
γδT cells
Calcineurin/NFAT dependent
Calcineurin/NFAT independent
Δ C
D45
.2%
/Gr1
CD
45.2
%
–0.6
–0.2
0.2
0.6
–0.0
–0.9
–0.8
–0.7
0
NKcells
P = 0.006
Control LSKCNB1-deficient LSK
2.712
00
105
105
104
104
103
103 0 105104103
0 105104103 0 105104103 0 105104103 0 105104103
0 105104103 0 105104103
102
0
105
104
103
102
0
105
104
103
102
0
105
104
103
102
0
105
104
103
102
0
105
104
103
102
0
105
104
103
102
0
105
104
103
102
2.87.3
422 320
CD45.1+ CD45.2+
CD45.1+ CD45.2+
Competitive transplantof control CD45.2+ LSK
Competitive transplant of
CNB1-deficient CD45.2+ LSK
NK Tcells
5
0
7.5
2.5
No.
of c
ells
(mill
ion)
CD4 CD8
CD40L
UnstimulatedBrdU
Cnb1lox/wt; CD4cre
Cnb1lox/lox; CD4cre
Cnb1lox/wt; CD4cre Cnb1lox/lox; CD4cre
Spleen
% m
ax%
max
100
80
60
40
20
0
100
80
60
40
20
0
100
80
60
40
20
0
100 101 102 103 104
100
80
60
40
20
0100 101 102 103 104
100 101 102 103 104
100 101 102 103 104
αCD3, αCD28αCD3, αCD28+ CsA
Fig 5 | CNB1-deficient natural killer- natural killer T- and gd T-cell development in a competitive setting. (A) CD45.2 chimaerism in NK cells in the
spleen and in NK T cells in the thymus normalized to myeloid reconstitution. Each symbol represents an individual mouse and the bars represents the
average; P refers to two-tailed t-test. (B) Flow cytometry analysis of gd T cell in the thymus and spleen of a mouse reconstituted with CD45.2þ control
or CNB1-deficient LSK progenitors and helper CD45.1þ bone marrow. Before analysis, gd T cells were enriched with anti-PE magnetic beads. The
percentage of gd T cells after gating on CD45.1þ - and CD45.2þ -positive thymocytes is shown. (C) CD45.2 chimaerism in gd T cells in the thymus and
spleen normalized to myeloid compartment. Each symbol represents an individual mouse and the bars represents the average; P refers to two-tailed
t-test. (D) Absolute numbers of ab T cells in the spleen in mice of the indicated phenotype (n¼ 6, mean±s.d.). (E) Peripheral ab T cells from mice of
the indicated genotype were stimulated in vitro with anti-CD3 and anti-CD28 in the presence or absence of cyclosporine A, and then analysed by flow
cytometry for the upregulation of CD40L and BrdU incorporation. (F) Summary of calcineurin-dependent and -independent haematopoietic lineages.
BrdU, 5-bromodeoxyuridine; CLP, common lymphoid progenitor; CMP, common myeloid progenitor; GMP, granulocyte-macrophage progenitor; HSC,
haematopoietic stem cell; LSK, Lineage�/lowSca1highcKithigh; MEP, megakaryocyte progenitor (adapted from Iwasaki & Akashi, 2007); NK, natural killer;
PE, phycoerythrin; TCR, T-cell receptor.
Calcineurin/NFAT signalling in mouse haematopoiesis
E.M. Gallo et al
EMBO reports VOL 9 | NO 11 | 2008 &2008 EUROPEAN MOLECULAR BIOLOGY ORGANIZATION
scientificreport
1146
driven by the CD4 promoter (Cnb1lox/lox;CD4cre) only mildlyaffects thymic selection (supplementary Fig 1 online). However,Cnb1lox/lox;CD4cre animals show severely reduced numbers ofperipheral ab T cells. Notably, the effects of calcineurin deletion inperipheral ab T-cell activation and proliferation phenocopy theeffects of calcineurin inhibition by treatment with cyclosporine A(Fig 5E; supplementary Fig 1 online).
Taken together, these data show that calcineurin is not essentialfor the development of myeloid lineages, whereas it is selectivelyrequired for the development of B and T cells. The development ofboth B and T cells is impaired at the checkpoint that is regulatedby functionally related ‘pre-receptors’ (Melchers, 2005), thepre-BCR and pre-TCR, respectively. In addition, the deletion ofcalcineurin blocks positive selection of thymocytes. It has beenproposed that positive selection provides the same ‘proofreading’function that is performed by the surrogate light chain duringB-cell development (Melchers, 2005). It is interesting to observethat both processes depend on calcineurin/NFAT signalling(Fig 3A, solid bars indicate developmental steps that requirecalcineurin). The observation that calcineurin is not requiredfor the generation of gd T cells in the thymus is consistentwith the recent finding that ligand-dependent signalling bythe gd TCR is dispensable for the development of these cells( Jensen et al, 2008).
The calcineurin inhibitors FK506 and cyclosporine A areamong the most effective of immunosuppressants and theirintroduction in the 1980s revolutionized transplant therapy.Although these drugs are relatively selective for the immunesystem, they show mechanism-based toxicity in the kidney andcardiovascular systems (Dumont, 2000); the basis of theirselective action on lymphocytes remains unknown. Onetheory is that, as both drugs bind to intracellular receptorsproducing a composite surface that blocks activity of calcineurin,high levels of calcineurin might make cells paradoxically lesssensitive to the drugs; indeed this seems to be the case withneurons (Graef et al, 2003). By contrast, the biologic andtherapeutic selectively might simply be a matter of use of theubiquitous pathway only by specific receptors. Our studiesshow that the latter is the case for the haematopoietic system, aswe find only minor variations in the levels of calcineurin inhaematopoietic lineages (Fig 1A).
In summary, calcineurin/NFAT signalling seems to have animportant non-redundant role in the regulation of developmentalcheckpoints of the lymphocyte, but it is not required for thedevelopment of blood myeloid lineages. It is possible, however,that the function of these cells might be compromised when thecalcineurin/NFAT pathway is inhibited.
Interestingly, the calcineurin/NFAT pathway is required for thedevelopment of osteoclasts, which represent a vertebrate-specificmyeloid-derived lineage (reviewed in Takayanagi, 2007). Thesefindings are consistent with the idea that the emergence ofthe calcineurin/NFAT pathway might have provided a newsignalling pathway for the development of vertebrate-specificorgans such as the combinatorial immune system and skeletalsystem (Wu et al, 2007).
METHODSMice. Cnb1 conditional knockout mice (Neilson et al, 2004) andMx-cre mice (Kuhn et al, 1995) have been characterized. For the
induction of the Mx-cre recombinase in vivo, mice were treatedwith five i.p. injections of 250 mg of poly-inosilic acid (poly I:C;Invivogen, San Diego, CA, USA) every other day for 10 days.Two days after the last injection, the mice were killed andbone marrow cells were prepared using standard protocols. Noconsistent differences were observed among mice transplantedwith bone marrow obtained from mice of the following genotypes:Cnb1þ /þ -MxCre; Cnb1flox/þ -MxCre; Cnb1D/þ -MxCre; Cnb1flox/flox
or Cnb1flox/D; therefore, they are collectively referred to as ‘controlmice’. In addition, no differences were observed between micetransplanted with bone marrow from Cnb1flox/flox-MxCre andCnb1flox/D-MxCre, and these mice were used interchangeably forthe experiments described in this study. Bone marrow derivedfrom these mice is referred to as ‘CNB1-deficient’ bone marrow.Mice that express the cre recombinase under the CD4 promoter(CD4cre; Lee et al, 2001) were purchased from Taconic (Hudson,NY, USA) and crossed with Cnb1 conditional knockout mice.Genomic PCR. Genomic PCR was performed on DNA extracted fromvarious tissues using standard protocols. The primers used for Cnb1genomic PCR have been described previously (Neilson et al, 2004).Bone marrow transplantation. CD45.1þ B6.SJL mice werepurchased from The Jackson Laboratory (Bar Harbor, ME, USA).Bone marrow chimaeras were prepared using standard protocols.Lethally irradiated (1250 rad) CD45.1þ B6.SJL mice werereconstituted with 5–10 million bone marrow cells from sex-matched CNB1-deficient and littermate control mice, alone or in a1:1 mixture with CD45.1þ bone marrow from B6.SJL mice, asindicated. For the analysis of lymphoid development, the Lineage(Gr1, CD11b, CD3, B220, Ter119)� Sca1highcKithigh (LSK) fractionof CNB1-deficient and control bone marrow was sorted onBD FACSArias and transplanted together with helper CD45.1þ
bone marrow from B6.SJL mice (B10,000 LSKs per mouse;2:1 LSK equivalents).Immunoblotting of total cell lysate. CNB1-deficient and controlbone marrow cells and splenocytes were obtained by standardprocedures. Cells were lysed in lysis buffer (50 mM Tris, pH 8,150 mM NaCl, 1% Triton X-100 and 1 mM dithiothreitol contain-ing a mixture of protease inhibitors). SDS–polyacrylamide gelelectrophoresis and immunoblotting were carried out by standardprocedures. The following antibodies were used for immunoblo-tting: anti-CNB1 (Upstate, Billerica, MA, USA), anti-Actin (Sigma,St Louis, MO, USA).Flow cytometry and peripheral T-cell activation. Single cellsuspensions from bone marrow, thymus and spleen were preparedand stained using standard protocols for flow cytometry. Antibodyconjugates were purchased from eBioscience. Cellular subsetswere identified as follows: granulocytes, Gr1þCD11bþ ; mono-cytes, Gr1�CD11bþ ; dendritic cells, MHC-IIþ CD11cþ ; erythro-cyte progenitors, Ter119þ ; megakaryocytes, CD41þ ; bone marrowB-cell subsets: fraction A, B220þCD43þ CD24�BP-1�; fraction B,B220þCD43þ CD24þBP-1�; fraction C, B220þCD43þ CD24þ
BP-1þ ; fraction D, B220þCD43� IgM�IgD�; fraction E, B220þ
CD43� IgMþ IgD�; fraction F, B220þCD43� IgMþ IgDþ ; T-cellsubsets: double negative 1, Lineage�CD8�CD117þCD44þCD25�;double negative 2, Lineage�CD8�CD44þCD25þ ; double negative 3,Lineage�CD8�CD44�CD25þ ; double negative 4, Lineage�CD8�
CD44�CD25�; double positive, CD4þCD8þ ; CD4SP, CD4þ
CD8�TCRbhigh; CD8SP, CD4�CD8þTCRbhigh; natural killerT cells, NK1.1þ TCRbþ ; natural killer cells, NK1.1þ TCRb�; gd
Calcineurin/NFAT signalling in mouse haematopoiesis
E.M. Gallo et al
&2008 EUROPEAN MOLECULAR BIOLOGY ORGANIZATION EMBO reports VOL 9 | NO 11 | 2008
scientificreport
1147
T cells; gd TCRþ CD3eþ . Samples were acquired on BD LRSs,and/or BD FACSArias, and analysed using FlowJos software.
CNB1-deficient and control thymocytes and splenocyteswere enriched for analysis of gd T cells with phycoerythrin (PE)-conjugated gd TCR antibody (eBioscience, San Diego, CA, USA)followed by anti-PE magnetic beads (Miltenyi Biotech, Auburn,CA, USA) according to the manufacturer’s instructions.
For analysis of peripheral T-cell activation, cells werestimulated with plate-bound anti-CD3 (10 mg ml�1) and anti-CD28 (50 mg ml�1) for 48 h in the presence or absence ofcyclosporine A (100 nM). Cells were pulsed with 5-bromodeoxy-uridine (BrdU; 10 mM) for the last 24 h of stimulation. BrdUstaining was performed with a BrdU BD Pharmingen kit accordingto the manufacturer’s instructions.Analysis of chimaerism in mice transplanted with LSKprogenitors. CD45.1þ B6.SJL lethally irradiated mice wereinjected with CD45.2þ control or CNB1-deficient sorted LSKprogenitors together with helper CD45.1þ bone marrow fromB6.SJL mice. Mice were analysed 4–6 months after trans-plantation. The following formula was used to indicate CD45.2chimaerism normalized to chimaerism in the myeloid compart-ment: (%CD45.2 in indicated population�%CD45.2 in Gr1þ
granulocytes)/%CD45.2 in Gr1þ granulocytes.RNA isolation and RT–PCR. Total RNA was collected from sortedpopulations with Trizols, followed by purification and on-columnDNase digestion with RNeasy mini kit (Qiagen, Valencia,CA, USA) according to the manufacturer’s recommendations.Complementary DNA was generated with SuperScripts II RT(Invitrogen, Carlsbad, CA, USA) according to the manufacturer’srecommendations. Primers used for amplification of cDNA aredescribed in supplementary Table 1 online.Supplementary information is available at EMBO reports online(http://www.emboreports.org).
ACKNOWLEDGEMENTSWe thank Tom Serwold and the Weisman laboratory, and Kirk Jensenand the Yueh-hsiu Chen laboratory for providing help and reagents.E.M.G. and M.M.W. were supported by Stanford Graduate Fellowships.M.M.W. was additionally supported by a Howard Hughes MedicalInstitute pre-doctoral fellowship. L.H. was supported by an A*STARScholarship. This study was supported by grants from the NationalInstitute of Health (to G.R.C.).
CONFLICT OF INTERESTThe authors declare that they have no conflict of interest.
REFERENCESBhandoola A, von Boehmer H, Petrie HT, Zuniga-Pflucker JC (2007)
Commitment and developmental potential of extrathymic andintrathymic T cell precursors: plenty to choose from. Immunity 26:678–689
Crabtree GR, Olson EN (2002) NFAT signaling: choreographing the sociallives of cells. Cell 109(Suppl): S67–S79
Dumont FJ (2000) FK506, an immunosuppressant targeting calcineurinfunction. Curr Med Chem 7: 731–748
Flanagan WM, Corthesy B, Bram RJ, Crabtree GR (1991) Nuclear associationof a T-cell transcription factor blocked by FK-506 and cyclosporin A.Nature 352: 803–807
Graef IA, Wang F, Charron F, Chen L, Neilson J, Tessier-Lavigne M,Crabtree GR (2003) Neurotrophins and netrins require calcineurin/NFATsignaling to stimulate outgrowth of embryonic axons. Cell 113: 657–670
Hardy RR, Hayakawa K (2001) B cell development pathways. Annu RevImmunol 19: 595–621
Hayakawa K, Hardy RR (2000) Development and function of B-1 cells.Curr Opin Immunol 12: 346–353
Hayday AC (2000) gd cells: a right time and a right place for a conserved thirdway of protection. Annu Rev Immunol 18: 975–1026
Iwasaki H, Akashi K (2007) Hematopoietic developmental pathways: oncellular basis. Oncogene 26: 6687–6696
Jensen KD et al (2008) Thymic selection determines gd T cell effector fate:antigen-naive cells make interleukin-17 and antigen-experienced cellsmake interferon g. Immunity 29: 90–100
Kuhn R, Schwenk F, Aguet M, Rajewsky K (1995) Inducible gene targeting inmice. Science 269: 1427–1429
Lee PP et al (2001) A critical role for Dnmt1 and DNA methylation in T celldevelopment, function, and survival. Immunity 15: 763–774
Manicassamy S, Gupta S, Huang Z, Molkentin JD, Shang W, Sun Z (2008)Requirement of calcineurin A b for the survival of naive T cells.J Immunol 180: 106–112
Melchers F (2005) The pre-B-cell receptor: selector of fitting immunoglobulinheavy chains for the B-cell repertoire. Nat Rev Immunol 5: 578–584
Neilson JR, Winslow MM, Hur EM, Crabtree GR (2004) Calcineurin B1 isessential for positive but not negative selection during thymocytedevelopment. Immunity 20: 255–266
Rusnak F, Mertz P (2000) Calcineurin: form and function. Physiol Rev 80:1483–1521
Starr TK, Jameson SC, Hogquist KA (2003) Positive and negative selectionof T cells. Annu Rev Immunol 21: 139–176
Takayanagi H (2007) The role of NFAT in osteoclast formation. Ann NYAcad Sci 1116: 227–237
Wu H, Peisley A, Graef IA, Crabtree GR (2007) NFAT signaling and theinvention of vertebrates. Trends Cell Biol 17: 251–260
Calcineurin/NFAT signalling in mouse haematopoiesis
E.M. Gallo et al
EMBO reports VOL 9 | NO 11 | 2008 &2008 EUROPEAN MOLECULAR BIOLOGY ORGANIZATION
scientificreport
1148


