Embed Size (px)
Citation preview
SELF-ASSEMBLED NANO-PATTERNS BY GAS CLUSTER
ION BEAM BOMBARDMENT
______________
A Dissertation
Presented to
the Faculty of the Department of Physics
University of Houston
______________
In Partial Fulfillment
of the Requirements for the Degree
Doctor of Philosophy
______________
By
Buddhi Prasanga Tilakaratne
December, 2012
ii
SELF-ASSEMBLED NANO-PATTERNS BY GAS CLUSTER
ION BEAM BOMBARDMENT
__________________________________________
Buddhi Prasanga Tilakaratne
APPROVED:
__________________________________________
Dr. Wei-Kan Chu, Chairman
__________________________________________
Dr. Gemunu H. Gunaratne
__________________________________________
Dr. James K. Meen
__________________________________________
Dr. John H. Miller
__________________________________________
Dr. Haibing Peng
__________________________________________
Dr. Mark A. Smith, Dean
Dean, College of Natural Sciences and Mathematics
iii
Acknowledgments
I would like to express my deep gratitude to my advisor; Dr. Wei-Kan Chu for his patient
guidance, enthusiastic encouragement, valuable support and critiques of this research
work. I am also grateful to my dissertation commit members, Dr. Gemunu Gunaratne, Dr.
James Meen, Dr. John Miller, and Dr. Haibing Peng for their guidance. Additionally, I
would like to thank my group members; Dr. Quark Chen, Dr. Dharshana Wijesundera,
Dr. Ananta Adhikari, Babu Bhandari, and Huy Dinh for their experimental suggestions
and support. I thank Xuemei Wang for technical support and excellent training sessions
during my dissertation work.
I am grateful to late Dr. Ki Ma for his unconventional research questions and guidance
during my early days at the ion beam laboratory.
I wish to thank Dr. John Baglin, Dr. Jiming Bao, Dr. Stephan Garoff, and Dr. Fernanda
Laezza for sharing their expertise and for their collaboration. I would also like to extend
my thanks to Dr. Robert Bradley and Dr. Shivakumar Bhaskaran of the Nano Fabrication
Facility at University of Houston for his help in offering me technical support in the
scanning electron microscope and profilometer measurements. I am grateful to Dr. Gila
Stein for permitting me to use her contact angle goniometer instrument.
I would like to extend my sincere gratitude to Dr. Riznia Jasim, Dr. Thiloshana
Ranawaka, Dr. Upali Karunasiri, Dr. Indika Wallimuni, Dr. Milinda Abeykoon, Manori
Gunasekera, and Deepal Weerasinghe. They helped me considerably.

iv
Last but not least, I wish to extend my deepest gratitude to my parents, my brother Kamal
and sister-in-law Sushama, and my sisters Thusharika and Udeshika for their love,
encouragement, and unconditional support to overcome many challenges put before me. I
dedicate this dissertation to my parents. Thank you for believing in me and guiding me
through every step since the day I was born.
v
SELF-ASSEMBLED NANO-PATTERNS BY GAS CLUSTER
ION BEAM BOMBARDMENT
______________
An Abstract of a Dissertation
Presented to
the Faculty of the Department of Physics
University of Houston
______________
In Partial Fulfillment
of the Requirements for the Degree
Doctor of Philosophy
______________
By
Buddhi Prasanga Tilakaratne
December, 2012
vi
Abstract
Morphological evolution of surfaces during the course of off-normal cluster ion beam
bombardment is investigated. The objective is to realize the Ar cluster ion-induced self-
assembled ripple shaped nano-pattern formation process on Si and Au surfaces. During
cluster ion beam bombardment, surface atoms undergo three processes: (1) continuous
sputtering into the vacuum due to high energy collisions, (2) initial re-deposition of
atoms, and (3) surface diffusion of atoms.
The first process is an independent of applied dosage, thus carries a minimum impact on
nano-ripple pattern formation. In the second process, atoms deposit close to the collision
site, which acts as a barrier for the next set of sputtering atoms. Even though this starts to
develop ripples, ripples become well-ordered and grow due to surface diffusion and
upstream sputtering of atoms.
This investigation reveals that cluster ion-induced nano-ripple formation saturates
comparatively sooner than that induced by monomer ions. Continuous bombardment
creates sand dune-like nano-structures on the Si surfaces at 60o angle of incidence
measured from the surface normal. However, at a grazing incidence, surface becomes
smooth. Further investigation on Au surfaces conform the above mentioned three-step
process of nano-ripple formation. Additionally, it was found that these nano-rippled
surfaces show anisotropic properties, which are useful in directional surface wetting and
surface plasmonic applications.
vii
Contents
1. Introduction 1
2. Background 8
2.1 Pattern Formation in Nature …………………………………............. 8
2.2 Ion-Solid Interaction …………………………………………………. 11
2.3 Brief Description of Surface Patterns Induced by Monomer Ion
Bombardment ………………………………………………………...
12
2.4 Gas Cluster Ions vs. Monomer Ions …………………………............. 13
3 Gas Cluster Ion Beam (GCIB) System 16
3.1 Cluster ion Sources …………………………………………………... 16
3.2 Cluster Ion Formation in GCIB System ……………………………... 19
3.2.1 Supersonic Jet Nozzle ……………………………………….. 19
3.2.2 Cluster Formation …………………………………………… 23
3.2.3 Metal Skimmer ……………………………………………… 25
3.2.4 Cluster Ionization and Acceleration ………………………… 25
4 Material and Surface Characterization Techniques 27
4.1 Rutherford Backscattering Spectrometry ……………………............. 27
4.1.1 Thin Film Microscopy ……………………………………….. 28
4.1.2 Ion Beam Channeling ………………………………………... 29
4.2 Atomic Force Microscopy …………………………………………… 31
4.3 Profilometer Analysis ………………………………………………... 33
viii
4.4 Scanning Electron Spectroscopy …………………………………….. 33
4.5 X-ray Photoelectron Spectroscopy …………………………………... 34
4.6 Static Contact Angle Goniometer Measurements ……………………. 35
4.7 Surface Plasmon Resonance Measurements …………………………. 38
5 Self-assembled Nano-patterns on Si Surfaces by Ar Cluster Ion Beam
Bombardment
40
5.1 Introduction …………………………………………………………... 40
5.2 Experimental Details ………………………………………………… 42
5.3 Experimental Results and Discussion ……………………………….. 43
5.3.1 Si Surface Roughening and Linear Regime …………………. 43
5.3.2 Saturation of Ripples and Sand Dune-like Structures on Si
Surfaces ……………………………………………………….
57
6 Morphological Evolution of Au Surfaces during Ar Cluster Ion Beam
Bombardment
62
6.1 Experimental Details ………………………………………………… 63
6.2 Experimental Results and Discussion ……………………………….. 64
6.2.1 Lateral Sputtering and Surface Smoothing Phenomena …....... 64
6.2.2 Ar Cluster Ion Beam Incident Angle Dependence …………... 70
6.2.3 Evolution of Nano-ripples with Applied Ar Cluster Ion Beam
Dose …………………………………......................................
78
6.2.4 Ar Cluster Ion Beam Energy Dependence …………………… 89
6.2.5 Cluster Ion Beam Induced Effective Surface Diffusion ........... 92
ix
6.2.6 Temperature Effect on Nano-ripple Formation on Au
Surfaces ……………………………………………………….
100
7 Applications of Au Nano-ripple Surfaces 105
7.1 Anisotropic Surface Wetting of Au Nano-ripple Surfaces …………... 105
7.2 Surface Plasmon Resonance of Metallic Nano-ripples ……………… 111
8 Summary and Future Directions 116
8.1 Overview ……………………………………………………………... 116
8.2 Proposed Future Directions ……………………………...…………... 119
Bibliography 121
Appendices
Appendix A Brief Description of Models Associated with Monomer Ion
Beam Induced Surface Patterns
136
x
List of Figures
1.1 The atomic force microscope (AFM) image of a 900 nm thick YBCO
sample. The scan area is 10µm with a height scale of 400 nm. (a) Non-
bombarded surface with standard deviation of roughness of 13 nm, and
(b) Ar cluster ion beam bombarded at 2 × 10¹⁶
clusters/cm2 dosage normal
to the surface the final surface standard deviation roughness was 0.8 nm ... 4
2.1 Patterns in nature resembling ripples (a) Lines on a palm of a hand, (b)
Strips on a zebra skin, and (c) Aeolian sand ripples in a desert ………….. 8
2.2 Sand grains elevate into suspension due to wind, and when the wind loses
its grip on these grains, it dumps them back onto the surface. These sand
grains known as saltation grains act as projectiles and upon colliding with
the surface (sand bed) eject secondary grains. Some of these secondary
grains go back into suspension and other; ejected with low energy, hop
into a new location. These are called reptation sand grains and also grains
creep along the surface. Alignment ripples depend on the wind direction .. 10
2.3 Angular distributions of sputtered Cu atoms due to monomer Ar+ ions at
20 keV energy and Ar2000
cluster ions at 10 keV and 20 keV energies
bombarded normal to the surface …………………………………………. 15
2.4 Angular distribution of atoms sputtered by Ar cluster ions at several
incident angles. The average cluster size and acceleration energy are 2000
atoms/cluster and 20 keV, respectively …………………………………… 15
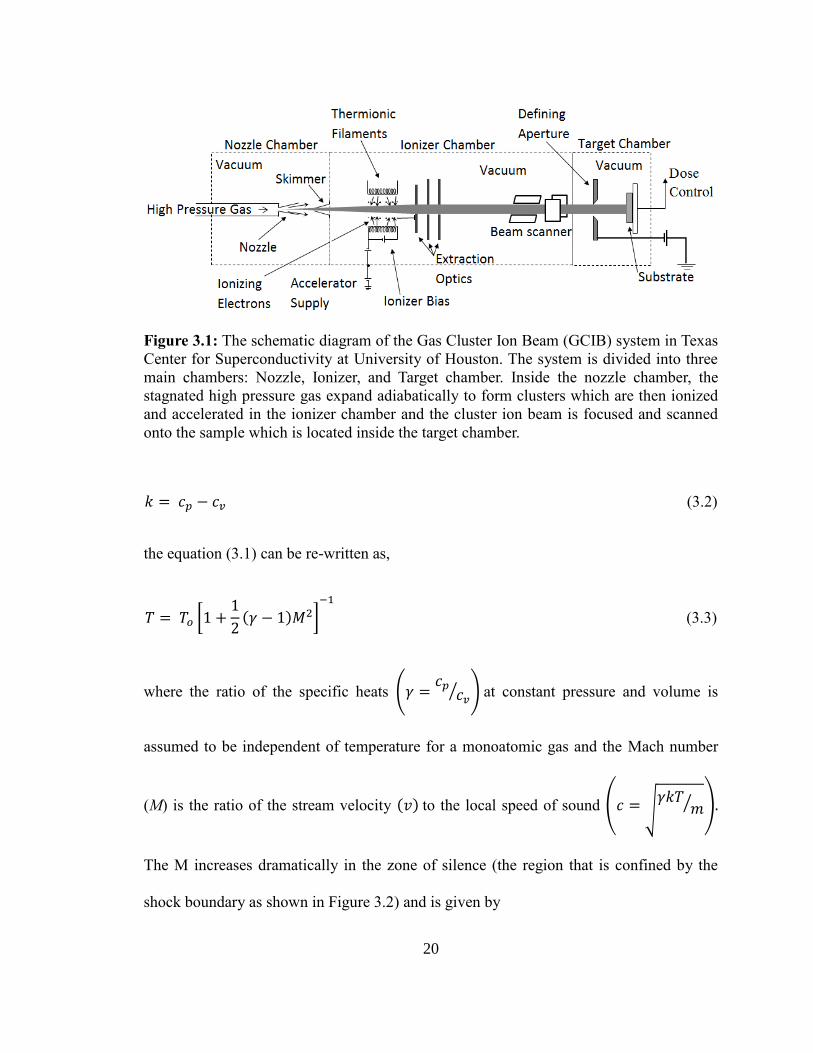
3.1 The schematic diagram of the Gas Cluster Ion Beam (GCIB) system in
Texas Center for Superconductivity at University of Houston. The system
is divided into three main chambers: Nozzle, Ionizer, and Target chamber.
Inside the nozzle chamber, the stagnated high pressure gas expand
adiabatically to form clusters which are then ionized and accelerated in
the ionizer chamber and the cluster ion beam is focused and scanned onto
the sample which is located inside the target chamber …………………… 20
3.2 The cross section of a nozzle and a skimmer, and apparent expansion of
an inert gas transitioning from monoatomic state to a molecular flow (The
dash line indicates the transition boundary). Mach number (M) is very
high just after expanding through the nozzle …………………………....... 22
3.3 Mach number variation with distance between nozzle throat and skimmer
orifice divided by nozzle throat diameter (0.075 mm) for monoatomic gas
with three degree of freedom and for diatomic gas with 5 degree of
xi
freedom ……………………………………………………………………. 22
3.4 Phase diagram of the gas flow in supersonic expansion. Point A represents
high pressure stagnated condition, and during adiabatic expansion, the gas
at point B crosses Pv(T) vapor pressure curve, and gas expands further
leading to an unstable state or super-saturation causing the gas to divert
from the adiabatic process at point C and re-attain the vapor pressure
curve. The curve is in a double-log coordinate system …………………… 24
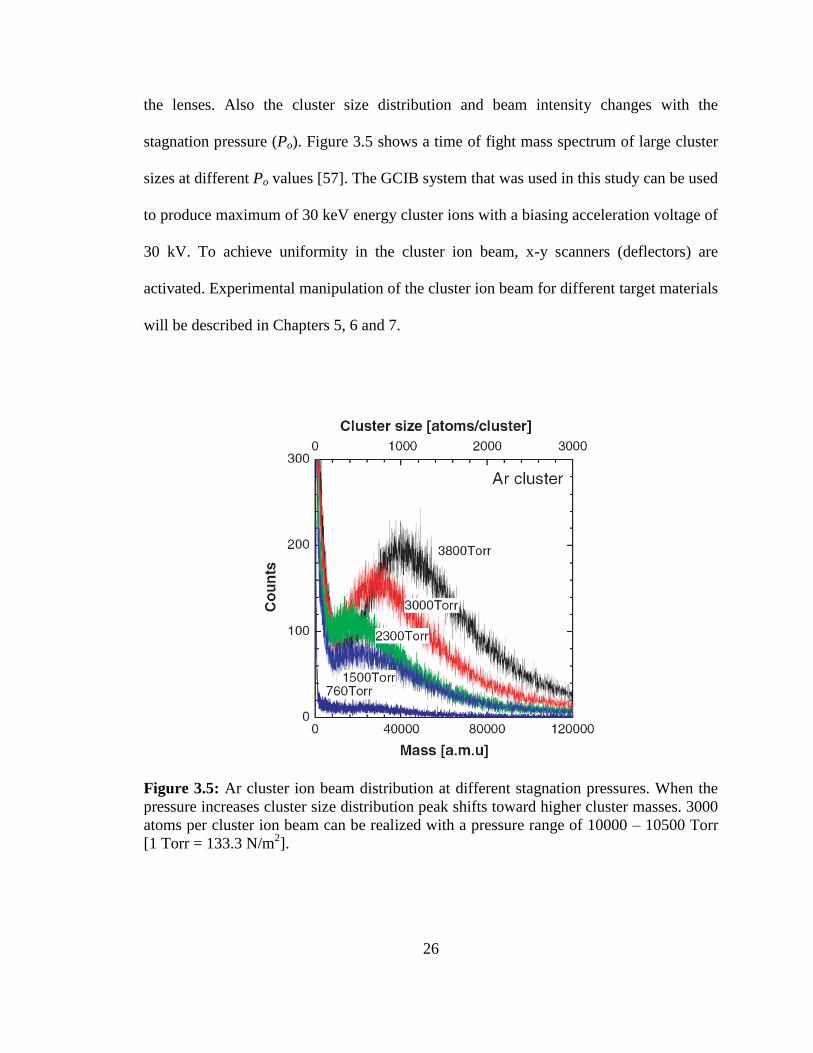
3.5 Ar cluster ion beam distribution at different stagnation pressures. When
the pressure increases cluster size distribution peak shifts toward higher
cluster masses. 3000 atoms per cluster ion beam can be realized with a
pressure range of 10000 – 10500 Torr [1 Torr = 133.3 N/m2] ……………. 26
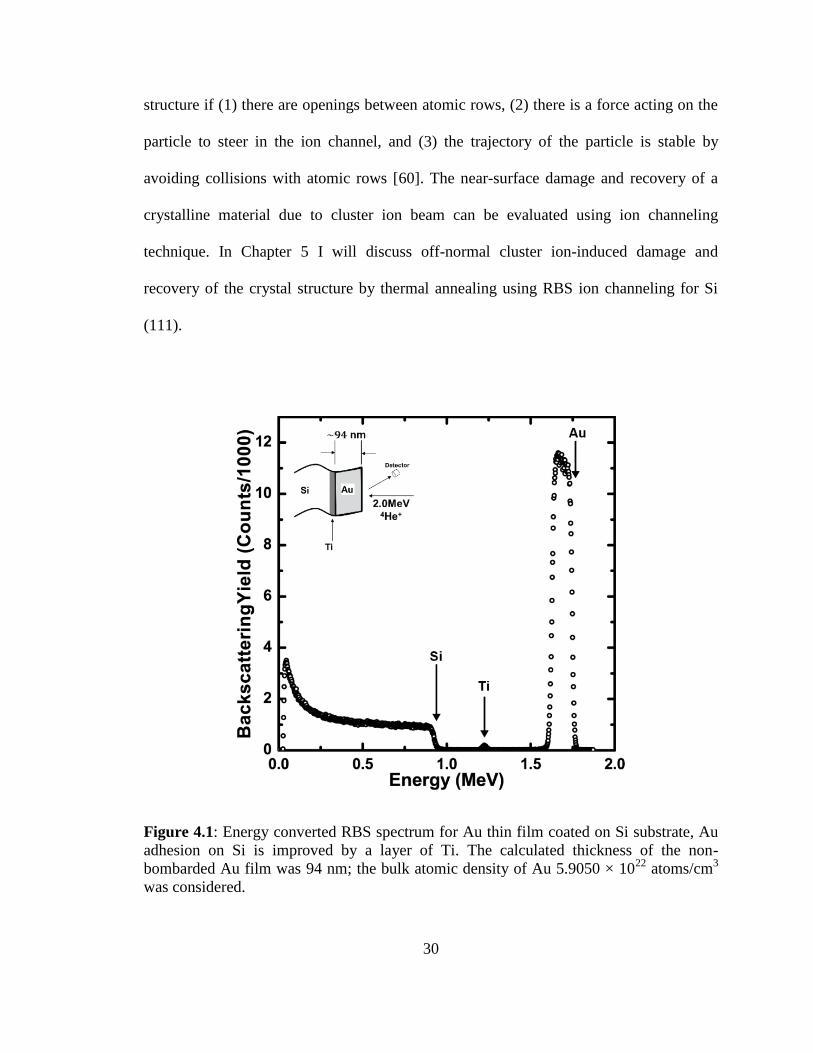
4.1 Energy converted RBS spectrum for Au thin film coated on Si substrate,
Au adhesion on Si is improved by a layer of Ti. The calculated thickness
of the non-bombarded Au film was 94 nm; the bulk atomic density of Au
5.9050 × 10²²
atoms/cm3 was considered …………………………………. 30
4.2 The contact angle between a solid-liquid interface and a liquid-vapor
interface is determined by using the static sessile drop method. (a) The
water droplet with 1μL volume just before the transfer onto the surface.
(b) A water droplet on a surface bombarded with large gas cluster ions at
an off-normal angle. θA > 90o means that the surface had become
hydrophobic and liquid-solid interactions are limited due to low surface
energy. (c) A surface bombarded with gas cluster ion beam at surface
normal direction and θB < 90o indicates that surface is hydrophilic and the
surface energy is higher …………………………………………………… 37
4.3 Experimental setup used for optical scattering measurements of gold
nano-ripples ……………………………………………………………….. 37
4.4 (a) Scattering spectrum from white source, (b) Raw data obtained from a
nano structure, (c) The raw spectrum of surface nano structure is
compared with the reference white light spectrum to produce a normalized
surface plasmon resonance spectrum …………………………………....... 39
5.1 RMS roughness of the Si (111) surface with the cluster ion incident angle.
After 70o the surface roughness reduces considerably and at grazing
incident angles the surface is smooth ……………………………………... 44
5.2 Atomic force microscope scans of Si (111) bombarded with 1 × 10¹⁶
clusters/cm2 dose Ar cluster ions at (a) 0
o, (b) 50
o, (c) 60
o and (d) 70
o. The
scan area for all images is 5 × 5μm2. White arrows indicate the direction
of the cluster ion incidence, and for image (a) the cluster ion direction
points inward ……………………………………………………………… 45
xii
5.3 RBS random and channeling analysis of the surface damage in Si (111)
substrates induced by Ar cluster ion beam bombardment, (a) before and
(b) after bombardment (1 × 10¹⁶
clusters/cm2, 60
o). After bombardment an
amorphous layer of 58 nm is formed on the substrate ……………………. 47
5.4 RBS channeling analysis of the surface damage recovery (15% recovered
from the original substrate) due to thermal annealing at 550 oC for an hour 48
5.5 Atomic force microscope scans of Si (111) substrates (a) Ar cluster ion
beam bombarded at a dose of 1 × 10¹⁶
clusters/cm2 and at an angle of
incidence of 60o, (b) Thermal annealed Si substrate. The scan area for all
images was 5 × 5μm2. White arrows indicate the direction of the cluster
ion incidence and the white circle shows ripple dislocations ……………... 48
5.6 Atomic force microscope scans of nano-ripple structures on Si (111) for
angles of incidence of 50°, 60°, and 70°. The dose evolution is shown for
each angle are from 2.5 × 10¹⁵
clusters/cm2, 7.5 × 10
15 clusters/cm
2 and 1
× 1016
clusters/cm2. The scan area for all images is 5 × 5μm
2. The arrow
indicates the direction of the cluster ion incidence ……………………….. 50
5.7 Root mean square roughness as a function of the dose for Si (111)
substrates when the cluster ion bombarded at incident angles 50°, 60°, and
70° ………………………………………………………………………… 52
5.8 Characteristic ripple wavelength as a function of dose for Si (111)
substrates when the cluster bombarded at incident angles 50°, 60°, and
70° ………………………………………………………………………… 53
5.9 Average sputtering depth of Si (111) as a function of dose for 50°, 60°,
and 70° incident angles …………………………………………………… 54
5.10 Correlation length as a function of the dose for Si (111) substrates, when
the cluster bombarded at 50°, 60°, and 70° incident angles ……………… 55
5.11 Aspect ratio of surface structures on Si (111) as a function of dose for 50°,
60°, and 70° incident angles. Assuming a sinusoidal surface [36], Table
5.2 lists the limiting conditions to avoid saturation. The squared data point
indicates aspect ratio increase due to atomic accumulation ………………. 56
5.12 Atomic force microscope scans of nano-ripple structures on Si (111) for
angles of incidence of (a) 60° and (b) 70° cluster ion bombarded at 1 ×
1017
clusters/cm2 dose. In (a) the black arrow indicates wall boundaries (or
ripple dislocations). (c) The sand dune like structures formed on Si (111)
after cluster ion bombardment at 1 × 10¹⁸
clusters/cm2 dose and at an
incident angle of 60o, the black arrows show secondary structure
formations on primary surface pattern. The scan area for all images is 5 ×
xiii
5 μm2. The arrow indicates the direction of the cluster ion incidence ……. 59
5.13 Square root of the height-height correlation function of the cluster ion
beam bombarded Si (111) at doses (a) 1 × 10¹⁶
clusters/cm2, (b) 1 × 10
17
clusters/cm2 and (c) 1 x 10
18 clusters/cm
2 for cluster ion incident angle of
60o. (i) The first local minimum of
⁄ ( ) gives a rough measurement of
the surface wavelength and (ii) The first maximum is the
characteristic surface average roughness ⁄ ( ⁄ ) for a given
ripple pattern ……………………………………………………………… 60
5.14 Square root of the height-height correlation function of the cluster ion
beam bombarded Si (111) at dose 1 × 10¹⁷
clusters/cm2 for cluster ion
incident angles (a) 60o and (b) 70
o ………………………………………... 61
6.1 AFM scans of (a) non-bombarded polycrystalline Au surface and (b) Ar
cluster ion beam smooth Au surface. The non-bombarded Au surface rms
roughness is around 1.28 nm and when the surface is smooth with a
normal incidence cluster ion with 30 keV energy for 2 × 10¹⁶
clusters/cm2
dosage, the surface rms roughness reduces to 0.7nm. The hillock
structures that exist in the smooth surface [as shown in (b)] are due to
isolated accumulation of surface atoms. The scan area for all images is 1.6
× 1.6 μm2 …………………………………………………………………..
66
6.2 Schematic diagram of cluster ion surface interaction at normal incidence .. 67
6.3 Random RBS spectra for 2.0 MeV 4He ions incident on non-bombarded
and six Ar cluster ion beam bombarded, at surface normal, Au thin film
deposited on Si substrate. The Si signal and the signal for the Ti adhesion
layer are not shown in the composite figure. The thickness of the non-
bombarded sample is 93.8 ± 1.4 nm and after sputtering with 2 × 10¹⁶
clusters/cm2 dosage the thickness of the film is 26.6 ± 1.4 nm. The atomic
density of the Au thin film is considered as the bulk density of Au 5.9050
× 1022
atoms/cm3 ………………………………………………………….. 68
6.4 Amount of layers sputtered with applied dosage for normal incidence Ar
cluster ion beam bombardment. The sputtered layer is calculated from the
RBS spectra shown in Figure 5.3 by deducting thicknesses of bombarded
Au thin films from non-bombarded thin film at each dosage. The linear
curve fit calculation gives the average amount of target atoms removed
from the surface during cluster ion bombardment, which are 21 atoms per
cluster ……………………………………………………………………...
69
6.5 Atomic force microscope images of Ar cluster ion beam modified Au
surfaces at different cluster ion incident angles (θ) with 1 × 10¹⁶
clusters/cm2 dosage and energy of 30keV per cluster ion: (a) 10
o, (b) 20
o,
(c) 30o, (d) 40
o, (e) 50
o, (f) 60
o, (g) 65
o, (h) 70
o, and (i) 80
o from surface
xiv
normal. Beyond 60o surface structures are disoriented. Inserted FFT
images show the ordering and disordering of surface structures with the
cluster ion incident angle. The arrow denotes the direction of incident
cluster ions. The scan area for all images is 1.6 × 1.6 μm2 ………………..
73
6.6 Square root of the height-height correlation function of the cluster ion
beam bombarded Au surfaces at doses 1 × 10¹⁶
clusters/cm2 for cluster ion
incident angles of (a) 0o, (b) 30
o, (c) 40
o, (d) 50
o, (e) 60
o, (f) 70
o, and (g)
80o. (1) The first local minimum of
⁄ ( ) gives a rough measurement
of the surface pattern wavelength . (2) The first maximum is the
characteristic surface average roughness ⁄ ( ⁄ ) for a given
ripple pattern …………………………………………………………….... 74
6.7 RMS roughness of the Au surface with the cluster ion incident angle.
After 60o the surface roughness reduces considerably and this threshold
angle depends on the target material ……………………………………... 75
6.8 Surface wavelength in the x-direction, which is perpendicular to the ripple
structures. The wavelength exponentially increases with incident cluster
ion beam angle ……………………………………………………………. 76
6.9 Random RBS spectra for 2.0 MeV 4He ions incident on non-bombarded
and 10 Ar cluster ion beam bombarded at different incident angles 0o to
80o. The Si signal and the signal for the Ti adhesion layer are not shown
in the composite figure ……………………………………………………. 77
6.10 Angular dependence of sputtering of Au thin film by Ar cluster ion beam
at 1 × 10¹⁶
clusters/cm2 dosage. Amount of Au atoms removed is
calculated with comparison to a non-bombarded Au thin film by RBS
analysis. The sputtering variation with the cluster ion angle is classified
into three regions. Region II (20o – 60
o) is the ripple formation region ….. 78
6.11 Atomic force microscope images of Au surfaces (a) non-bombarded
polycrystalline surface, and Ar cluster ion beam modified Au surfaces at
different dosages with 60o incident angle and energy of 30keV per cluster
ion (b) 0.1, (c) 0.2, (d) 0.4, (e) 0.6, (f) 0.8, (g) 1, (h) 2, and (i) 3, × 1016
clusters/cm2. The inserted FFT images show thinning of radial width of
the Fourier peak, which indicate the ordering of ripples structures with
applied cluster ion dose. The arrows denote the direction of cluster ions.
The scan area for all images is 1.6 × 1.6μm2 ……………………………... 81
xv
6.12 Square root of the height-height correlation function of the cluster ion
beam bombarded Au surfaces at doses (a) 1 × 10¹⁵
clusters/cm2, (b) 2 ×
1015
clusters/cm2, (c) 4 × 10
15 clusters/cm
2, (d) 1 × 10
16 clusters/cm
2, (e) 2
× 1016
clusters/cm2, and (f) 3 × 10
16 clusters/cm
2 for cluster ion incident
angles of 60o. (i) The first local minimum of
⁄ ( ) gives a rough
measurement of the surface pattern wavelength , and (ii) The first
maximum is the characteristic surface average roughness ⁄ ( ⁄ )
for a given ripple pattern ………………………………………………….
82
6.13 RMS roughness at the threshold angle of 60o remains higher than 50
o and
70o with dose. Compared to 60
o, surface roughness saturates prematurely
for 50o and 70
o ……………………………………………………………. 83
6.14 Surface wavelength in the x direction, which is perpendicular to the ripple
structures. Initially the wavelength exponentially increases with applied
dosage and saturates at higher dosages. According to the curves
wavelengths increases with the Ar cluster ion beam incident angle …….... 84
6.15 Aspect ratio of surface structures on Au thin film as a function of dose for
50°, 60°, and 70° incident angles. Here the aspect ratio is defined as the
ratio between roughness amplitude and wavelength, assuming a sinusoidal
surface pattern …………………………………………………………….. 85
6.16 Schematic diagram of cluster ion surface interaction at off-normal
incidence …………………………………………………………………... 86
6.17 Composite AFM image cross section of a ripple on Au surfaces formed
due to Ar cluster ion beam bombardment at 1, 2, and 3 × 10¹⁶
clusters/cm2
dosages for 60o incident angle …………………………………………….. 87
6.18 Composite AFM image cross section of a ripple on Au surfaces formed
due to Ar cluster ion beam bombardment at 3 × 10¹⁶
clusters/cm2 dosage
for 50o, 60
o and 70
o incident angles ………………………………………. 87
6.19 Dose dependence of sputtering Ar cluster ion beam incident angles θ =
50o, 60
o and 70
o …………………………………………………………… 88
6.20 Sputtering of the surface Au atoms with the applied dosage at 20 keV and
30 keV cluster ion energies at 50o
cluster ion angle of incidence, here
energy per atom in a cluster ion is 6.7 eV and 10.0 eV respectively ……... 90
6.21 RMS roughness as a function of cluster ion dose at 20 keV and 30 keV
energy ……………………………………………………………………... 91
6.22 SEM image of nano-ripple formation on Au surface with Ar cluster ion
beam bombarded at 60o incident angle and 2 × 10
16 clusters/cm
2 dosage ... 94
xvi
6.23 (a) a micro size particle is placed to generate a shadowing effect on the
surface, (b) the front end or downstream of the micro size particle show
an undamaged polycrystalline region and rippled region on Au surface.
(c) The back end or upstream of the micro particle show damaged ripple
structures due to backscattering of cluster ions ……………………………
95
6.24 Random RBS spectra for 2.0MeV 4He ions incident on non-bombarded
and Ar cluster ion beam bombarded at 50o incident angle from the surface
normal with 3 × 10¹⁶
clusters/cm2 dosage. Bombarded surface was
scanned across the sample in the direction of cluster ion incidence (1→4)
and the thin film surface thicknesses were measured at four locations. The
Si signal and the signal for the Ti adhesion layer are not shown in the
composite figure ………………………………………………………….. 96
6.25 Thickness of Au thin film after bombarded with (a) 1, (b) 2, and (c) 3 ×
1016
clusters/cm2 at 50
o cluster ion angle of incidence. Thickness was
measured 2mm apart in the direction A to B (cluster ions arrive onto the
surface in this direction) ………………………………………………….. 97
6.26 A survey x-ray photoelectron spectrum for Cluster ion beam bombarded
at 50o from the surface normal with 3 × 10
16 clusters/cm
2. Au binding
energy signals are Au 4p3, 4d
3, 4d
5, and 4f
7 (a) Location 4 and (b)
Location 1 corresponds to the RBS spectrum 4 and spectrum 1 in Figure
6.24. At Location 1 surface was discolored due to exposure of interface Ti
layer and Si substrate. O 1s and C 1s signal are due to contaminates when
Au surface exposed to the ambient environment …………………………. 98
6.27 Thickness of Au thin film after bombarded with 3 × 10¹⁶
clusters/cm2
dosage at 50o, 60
o and 70
o cluster ion beam incident angles. Thickness
was measured 2mm apart in the direction A to B (cluster ions arrive onto
the surface in this direction) ………………………………………………. 99
6.28 Atomic force microscope images of Ar cluster ion beam modified Au
surfaces as a function of surface temperature with 60o incident angle,
energy of 30 keV per cluster ion and applied dosage of 3 × 10¹⁶
cluster/cm2. The surface temperature: (a) 220.3 K, (b) 297.3 K (room
temperature), (c) 373.2 K, (d) 398.2 K, (e) 423.2 K, and (f) 473.2 K. The
arrows denote the direction of cluster ions. The scan area for all images is
1.6 × 1.6 μm2
……………………………………………………………… 102
6.29 RMS roughness and average wavelength as a function of surface
temperature at 60o cluster ion incident angle and 3 × 10
16 clusters/cm
2
dosage ……………………………………………………………………...
103
xvii
6.30 Square root of the height-height correlation function of surface
temperature at 3 × 10¹⁶
clusters/cm2 dosage with incident angle of 60
o. (i)
The first local minimum of ⁄ ( ) gives a rough measurement of the
surface wavelength and (ii) The first maximum is the characteristic
surface average roughness ⁄ ( ⁄ ) for a given ripple pattern ……
104
7.1 Water droplet behavior on a rough surface. (a) Wenzel state: water droplet
penetrates completely into the pattern, (b) Cassie-Baxter state: water
droplet suspends on the pattern …………………………………………… 107
7.2 (a) The percentage of surface area increase compared to a flat surface
measured as a function of Ar cluster ion beam incident angles for 1 × 10¹⁶
clusters/cm2 dosage, (b) Contact angle of a water droplet on Au surface as
a function of the cluster ion incident angle measured from the surface
normal. The size of the water droplet was 1 μL, (c) The percentage of
surface area increase compared to a flat surface measured as a function of
Ar cluster ion beam dosage at 50o incident angle, and (d) corresponding
contact angle measurement of a water droplet ……………………………. 108
7.3 (a) and (b) are water droplets placed on a ripple surface and contact angles
are measured in x and y directions respectively using static sessile water
droplet method. x-direction corresponds to the direction perpendicular to
ripples and y-direction is considered parallel to ripples. (c) Contact angle
measurements were carried out on a surface bombarded with Ar cluster
ion beam 3 × 10¹⁶
clusters/cm2 and the incident angle of the beam was
60o. The contact angle measured in x-direction was 101
o and in y-
direction it was 92o. (d) A schematic diagram of anisotropic water droplet
formed on a one dimensional ripple pattern. The 1 μL water droplet
spread 2.7 mm in the x-direction and spread 3.3 mm parallel to ripples …. 110
7.4 The dispersion curve diagram. ky the component of the wave vector in the
plane of the ripples ………………………………………………………... 112
7.5 A plane wave is incident onto a nano-rippled surface at a polar angle and
an azimuthal angle with respect to the coordinate system. Ripples are
perpendicular to the x direction …………………………………………… 112
7.6 (a) Normalized intensity curve for the scattering of light from a non-
bombard Au surface. Surface plasmon resonances of Au nano-ripple
surface bombarded with Ar cluster ion beam; (b) – (d) Incident white light
was perpendicular to ripples and (e) Incident white light was parallel to
ripples. (f) Surface plasmon resonance for Ag nano-ripple surface ………. 115
xviii
A.1 Coordinate system as described by Bradley and Harper model for ion
bombardment on a surface. The ellipses denote the energy deposited due
to a single collision event. (The energy distribution is Gaussian)
According to Sigmund’s theory, the probability for an atom to be
sputtered from the target material is proportional to the total energy
received from the neighboring atom due to ion bombardment. The
laboratory coordinate system is (x, y, z) and the local surface area
coordinates are denoted by (x/, y
/, z
/) ……………………………………...
138
A.2 Sketch of the geometrical shadowing effect on a sinusoidal surface
profile. Since the sine wave is described by ( ⁄ ): (a)
complete surface is exposed by ion beam, (b) Critical surface slope
( ⁄ ) at angle , where shadowing occurs, (c) grazing incidence of ions
shadowed by surface peaks and surface starts to develop saw tooth like
structures, and (d) completely formed saw tooth structures with and
upstream and downstream surface inclination angles ……………………. 141
A.3 Schematic diagram of Ehrlich-Schwoebel barrier instability on a
crystalline metallic surface. Notation JES
is the mass current due to
Ehrlich-Schwoebel barrier ………………………………………………… 143
xix
List of Tables
5.1 The growth exponent ( ) and the reciprocal of dynamic exponent ( ) for
Si (111) ………………………………………………………………….... 53
5.2 The aspect ratio limiting condition and the dose at which ripple saturation
begins for Ar cluster ion-induced nano-ripples on Si (111) substrates …… 58
6.1 The gradient of the Au surface as a function of dose at 50o cluster ion
beam incident angle ……………………………………………………...... 99
6.2 The gradient of the Au surface as a function of incident angle of the
cluster ion beam with a dosage of 3 × 10¹⁶
clusters/cm2………………....... 100
1
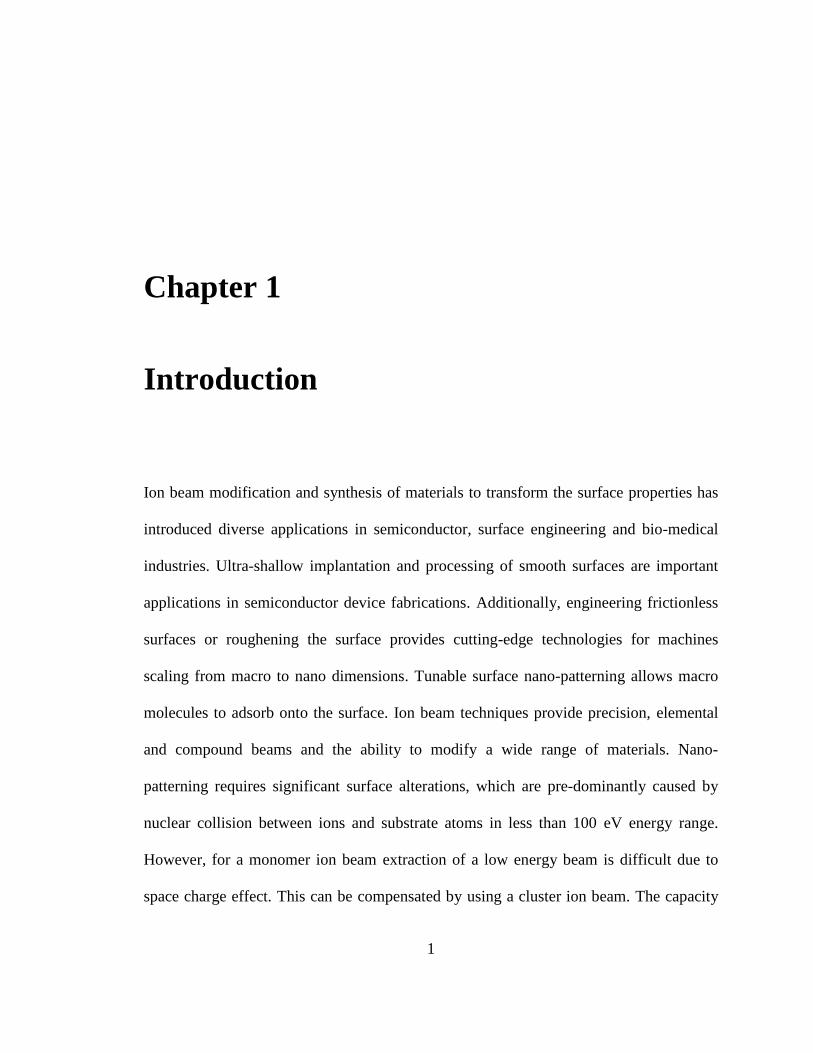
Chapter 1
Introduction
Ion beam modification and synthesis of materials to transform the surface properties has
introduced diverse applications in semiconductor, surface engineering and bio-medical
industries. Ultra-shallow implantation and processing of smooth surfaces are important
applications in semiconductor device fabrications. Additionally, engineering frictionless
surfaces or roughening the surface provides cutting-edge technologies for machines
scaling from macro to nano dimensions. Tunable surface nano-patterning allows macro
molecules to adsorb onto the surface. Ion beam techniques provide precision, elemental
and compound beams and the ability to modify a wide range of materials. Nano-
patterning requires significant surface alterations, which are pre-dominantly caused by
nuclear collision between ions and substrate atoms in less than 100 eV energy range.
However, for a monomer ion beam extraction of a low energy beam is difficult due to
space charge effect. This can be compensated by using a cluster ion beam. The capacity
2
to control current density, energy and size of clusters is important in creating micro-nano
scale patterns. However, a considerable amount of research work must be done before
commercialization of cluster ion patterned surfaces. In this dissertation I put forward a
substantial amount of experimental results on semiconductor and metallic surfaces to
build a fundamental understanding of cluster ion-induced surface patterns.
Cluster ions can be classified according to common ion beam terminologies by
considering the energy per atom before the impact with the target substrate [1, 2]. Cluster
ions having energies < 1 eV/atom, in thermal range, do not penetrate the surface and
atoms in the cluster adsorb on the surface [3, 4]. In the 1-100 eV/atom energy range
(Hyper thermal range) cluster ions interact with surface and sub-surface atoms [5, 6], and
in the 100 eV-500 keV/atom medium energy range clusters penetrate the surface and
large surface craters are formed and the dominant stopping mechanism is the nuclear
stopping power [7]. Cluster ions with energies beyond 500 keV/atom are called swift
cluster ions which penetrate deep into the target and electronic stopping power becomes
dominant [8].
Emergence of gas cluster ion beam systems was an essence of surface modification
research because of their capability to deliver low energy atoms with high beam current
density and low charge per cluster. Designs and development of a Gas Cluster Ion Beam
(GCIB) system was first done by Yamada and co-workers [9] in early 1990s. GCIB
research and development has flourished in the past two decades as an industrial tool for
surface smoothing, etching of semiconductor [5, 10], ultra-shallow chemical modification
of materials for device fabrication [11], processing of surfaces for bio-medical implants
3
[12], and high sputtering yield applications in Secondary Ion Mass Spectroscopy analysis
[13]. Cluster ion interactions with surface generate unique structural modifications
compared to monomer ion beams, where cluster ions simultaneously arrive at the same
location and disassociations close to the surface create synergetic reactions. This
dissertation mainly focuses on clusters having energies in the hyper thermal range with
few thousands of gaseous atoms and their effects on surfaces while bombarded at an off-
normal angle at room temperature and also will include a brief description of temperature
dependence of surface patterns. Gaseous large clusters with atoms carrying 10 eV/atom
energies generate massive amounts of energy density proximate to the surface creating
excessive modifications. Impact of a cluster ion produces a 104
K instantaneous
temperature pulse [14], but the overall surface temperature remains stable at room
temperature. In addition, a cluster ion with surface normal trajectory sputters target
surface atoms parallel to the measured surface (lateral sputtering). Clusters initially
sputter target surface peaks and fills in trenches, which smooth the surface and with
persistent bombardment, surface atomic layers start to peel out already smoothed surface
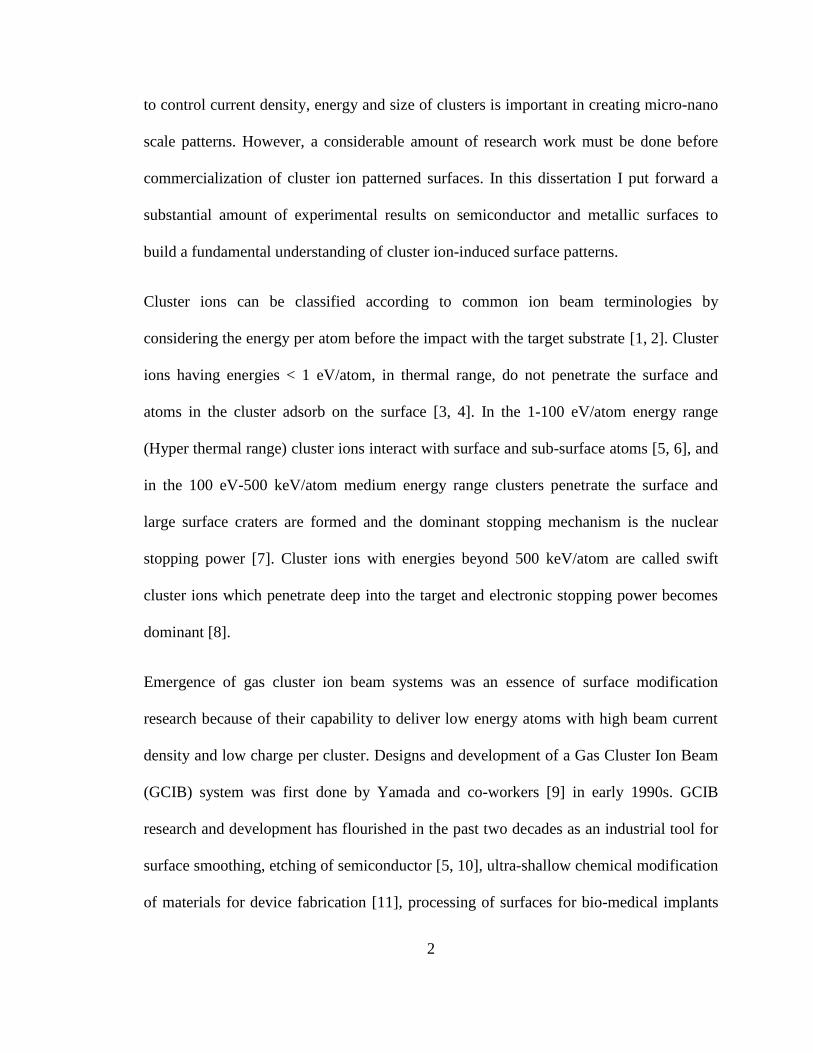
continuously. For examples, Chu, et al. [5] have tested gas cluster ion beam on
YBa2Cu3O7-δ (YBCO) high temperature superconducting thin film surfaces to smooth the
uneven surface formed due to nucleation and growth during the deposition process
[Figure 1(a)]. The YBCO surface smoothed from 13 nm to 0.8 nm with a 2 × 10¹⁶
clusters/cm2 dose at 6.7 eV per atom energy and about Ar 3000 atoms in a cluster [Figure
1(b)]. However, cluster ions amorphize the surface of YBCO, but the crystalline structure
can be recovered by thermal annealing or removed by chemical etching treatment [5].
4
Figure 1.1: The atomic force microscope (AFM) image of a 900 nm thick YBCO sample.
The scan area is 10µm with a height scale of 400 nm. (a) Non-bombarded surface with
standard deviation of roughness of 13 nm, and (b) Ar cluster ion beam bombarded at 2 ×
1016
clusters/cm2 dosage normal to the surface the final surface standard deviation
roughness was 0.8 nm.
Also most recent research activities that involved gas cluster ions conducted at University
of Houston include smoothing of strain relaxed Si0.7Ge0.3 surface, which had cross-
hatched patterns due to growth. These substrates were considered prospects for
fabrication of high performance strained Metal Oxide Semiconductor Field Effect
Transistors (MOSFET). Cluster ions with 10 eV/atom energy and 3000 Ar atoms smooth
the Si0.7Ge0.3 surface to 0.7 nm [15]. Other interesting research involving cluster ions was
to deposit C60 while continuously bombarding the deposited film at normal incidence to
transform C60 film into diamond-like thin films [16].
In contrast, off-normal cluster ion beam surface interactions generate anisotropic surface
patterns beyond a critical incident angle from the surface normal. Surface atoms attain
forward momentum caused by synergetic reactions of cluster ions [17]. In the course of
this surface atomic mass flow, patterns are generated depending on the angle of
5
incidence, energy and dose of the cluster ion, and on the surface material.
Despite extensive examinations carried out on GCIB surface smoothing processes, a good
understanding of surface pattern formation is lacking. The purpose of this research study
is to investigate pattern formation on surfaces experimentally using Ar cluster ion beam,
and to investigate possible applications of these nano-structured surfaces. In Chapter 2 I
will describe patterns found in nature and explain similarities of these patterns to nano
scale structures seen on material surfaces. Also I will cover monomer ion sputtering and
ripple formation models with an experimental briefing of monomer ion surface patterns.
In Chapter 3, I will briefly review different cluster ion beam forming technologies and
explicitly I will describe the GCIB technology that was used in this dissertation study:
Large argon clusters via gas cluster ion beam system, stagnated high pressure
monoatomic gas adiabatically convert into clusters and transported through a small
skimmer, which are then ionized by a cloud of electrons and accelerated toward a target
with maximum energy of 30 keV per cluster.
Chapter 4 covers the experimental analysis techniques used to characterize cluster ion
beam modified surfaces and thin films. Rutherford Backscattering Spectroscopy (RBS)
provides a unique non-destructive technique to acquire information from a material;
composition, thin film thickness, crystallinity and deformations are some examples. The
surface alteration created by clusters can be mapped via Atomic Force Microscopy
(AFM). AFM data provide information regarding surface roughness, and wavelength of
surface patterns. I will also explain a second technique used to profile surface,
specifically for bulk materials. Other techniques that I have been using include Scanning
6
Electron Microscopy (SEM), X-ray Photoelectron Spectroscopy (XPS), and also to
determine applications of cluster modified materials contact angle goniometer, surface
resonance plasmon were used. Results obtained from these techniques are discussed in
Chapters 5 and 6.
Chapter 5 will include a discussion on pattern formation on silicon during large cluster
ion beam bombardment, and compare these results to monomer ion-induced ripples on
silicon. The cluster ion beam formed ripples ignores surface crystallinity since the cluster
ion impact amorphizes the surface and ripples are formed on top of this amorphous layer.
Intriguingly, prolonged bombardment on the silicon surface produces sand dune like
structures on the surface. I will also discuss the recovery process of amorphized silicon
surface by annealing and its impact on ripples pattern.
Chapter 6 covers the large gas cluster beam bombardment of gold (Au). I observed Au
surfaces have a unique cluster ion incident angle for generating high surface nano-ripples.
Surface sputtering and roughness variations with cluster ion incident angle, dose and
energy show three processes that occur during ripple formation. GCIB produces high
aspect ratio structures with applied dose. Nano-ripple structure formation provides an
inexpensive technique that can be applied in many surface engineering industries.
Furthermore, I will discuss the complexity associated with high dose bombardment and
importance of surface element atomic mass and surface binding energy in ripple
formation. Also I will discuss the maximum surface instability with cluster ion beam
angle of incidence and surface geometrical shadowing process with bombardment time.
In chapter 7 I will discuss two exemplary applications of nano-ripples. Au nano-ripple
7
height, width, length, and well-orderedness produce unique surface wetting properties.
Wetting is expressed in terms of contact angle, which is the angle between solid-liquid
and liquid-vapor interfaces. I will discuss hydrophobic-hydrophilic interactions of nano-
ripple surfaces and dependence of contact angle on surface roughness. I will also discuss
anisotropic effects of these one-dimensional nano-ripples. Furthermore, I will discuss
surface plasmon resonance effects of Au nano-ripples for different Ar-cluster ion beam
bombardment conditions.
In Chapter 8 I will conclude the results of this research study and discuss future
directions that are needed to be taken to produce unique surface patterns and to study
multi element substrates.
8
Chapter 2
Background
2.1 Pattern Formation in Nature
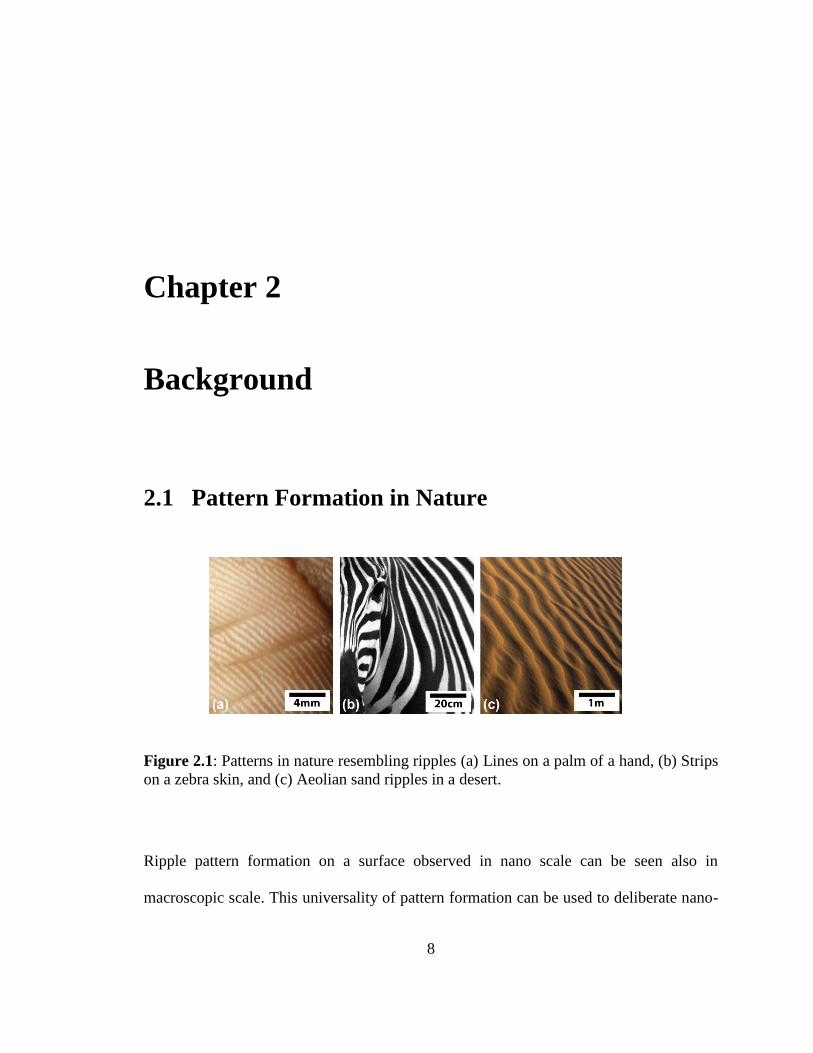
Figure 2.1: Patterns in nature resembling ripples (a) Lines on a palm of a hand, (b) Strips
on a zebra skin, and (c) Aeolian sand ripples in a desert.
Ripple pattern formation on a surface observed in nano scale can be seen also in
macroscopic scale. This universality of pattern formation can be used to deliberate nano-
9
ripple formations on material surfaces. For many years pattern formation in nature has
brought amazement not only to the public eye but also to the scientific. Figures 2.1 (a)
and (b) show a surface pattern of a human palm and (c) strips on a zebra respectively,
both exhibit biological processes formed in entirely different chemical and biological
methods, but in a more general point of view, we can observe similarities in these
patterns, order, pattern dislocations and discontinuities to name a few. Figure 2.1 (c)
shows an aeolian sand ripple pattern formed due to wind, these types of patterns is
usually formed on deserts and sandy beaches. The universality occurs in pattern
formation due to dynamical properties of a system, independent of whether the system is
physical, chemical or biological. One example that is beneficial in understanding nano-
pattern formation is the sand ripple formation. The behavior of sand under wind erosion
conditions have been studied for over eighty years. Sand ripple and dune formation was
first experimentally studied and modeled by R. A. Bagnold in 1931 [18]. In his early
model, ripple-forming sand were dubbed “singing sand”. That is ripples are formed by
sound waves generated by rapid vibration of top dry sand layers due to an external force,
but later this model was dropped due to lack of clarification in merger and coarsening of
ripples [19].
The most available explanation on aeolian sand ripple formation is that individual loose
sand grains elevate with the wind and go into suspension before becoming heavy for the
wind to hold up, and it deposits on the surface. Since these grains obtain potential energy
as well as kinetic energy from wind during suspension, and they eject more sand grains
when colliding with the surface [20]. The sand grains that initially eject due to wind are
10
called saltation grains and grains that eject with less energy due to saltation grain
collisions are known as the reptation grains. Furthermore, some sand grains go through a
creeping (rolling) process due to very low energy collisions. Saltation is maintained by
the amount of grains that the wind carries per given time, and the energy gained while
lifting from the sand bed [21]. Mitha et al. showed that sand grains’ collision process can
be illustrated by impacts of high speed steel spheres at an angle. Sphere impacts and
secondary projection of spheres from the surface covered with similar spheres showed
there were about eight projectiles formed during a single collision. The number of
secondary projectiles depended on the speeds and angles of impacting spheres [22]. In
1987, R. S. Anderson introduced a model based on sand ripple experimental observations
and Mitha’s work, where he explained that saltation grains gain momentum and direction
from wind and act as projectiles that collide with the surface and eject secondary grains,
which hop into a different location. These hopping grains accumulate and become
sources of aeolian sand ripples on sand beds [23].
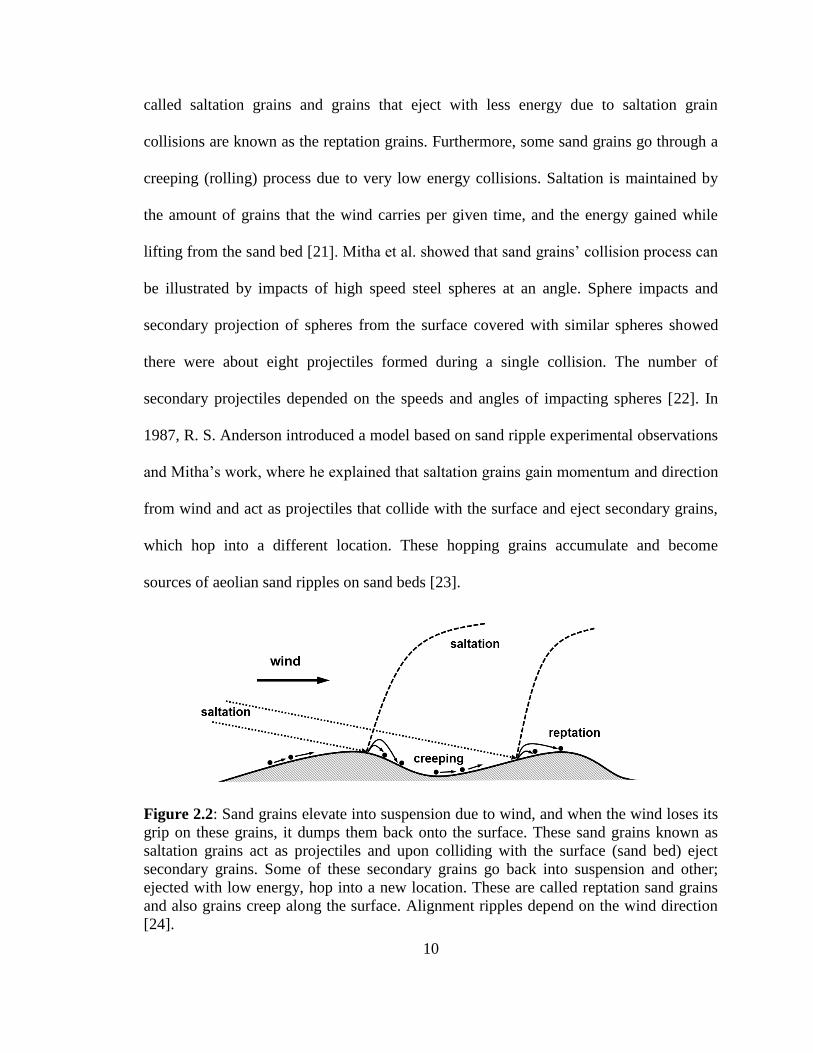
Figure 2.2: Sand grains elevate into suspension due to wind, and when the wind loses its
grip on these grains, it dumps them back onto the surface. These sand grains known as
saltation grains act as projectiles and upon colliding with the surface (sand bed) eject
secondary grains. Some of these secondary grains go back into suspension and other;
ejected with low energy, hop into a new location. These are called reptation sand grains
and also grains creep along the surface. Alignment ripples depend on the wind direction
[24].
11
Saltation, reptation, and creeping of sand grains can be related to cluster ion-induced
ripple formation processes as described above and Anderson’s aeolian sand ripple
formation formulism and a hydrodynamic approach can be adapted to describe nano-
ripple formation on material surfaces.
2.2 Ion – Solid Interaction
An ion bombarding a target material undergoes various processes depending on the ion
energy, mass, and angle of incidence, which include penetration into the material,
displacement of target material, backscattering, and adsorption on the surface. Ion target
collision and subsequent stopping of the ion in the material is classified according to two
types of energy loss: (1) electronic and (2) nuclear energy loss [25, 26]. Ions with
medium energy and higher (>10 keV) interact inelastically with the target and lose
energy by electronic excitation. Nuclear energy loss occurs due to ion surface atom
elastic collisions and kinetic energy transfer into the material from the colliding ion. For
metal and semiconductor materials, when atoms displace due to elastic collision, an
interstitial atom and a vacancy is produced; these are called Frenkel pairs. If an ion has
hyper-thermal energy (1 – 100 eV) the main energy loss mechanism is nuclear energy
loss.
12
2.3 Brief Description of Surface Patterns Induced by
Monomer Ion Bombardment
Surface self-assembled patterns due to monomer ion bombardment have been studied for
nearly five decades. The first self-assembled pattern formation study was done by Navez
et al. in 1962 [27]; the main observed patterns were ripples. They modified a glass
surface by a charged beam of air with 4 keV energy and found that when the angle of
incidence of the beam shifts from surface normal to grazing angles, the ripple orientation
changed from perpendicular to parallel to the direction of the beam. The ripple formation
and mechanism behind the process was not speculated on until decades later when
Bradley and Harper first derived a model for ripple formation on solid materials [28].
In recent years the researches on ripples and other self-assembled surface have increased
due to nano-scale applications. Experimental observations of monomer ion-induced nano
structures are discussed extensively [29-34] and this dissertation will be limited to
available theoretical model descriptions on ripple formation. In Chapter 5 I will cover a
discussion of experimental comparisons between monomer and gas cluster ion-induced
ripples. The Appendix A of this dissertation includes the Bradley and Harper model [28],
the Makeev, Cuerno, and Barabási extended, Bradley and Harper Model [30], the
Ehrlich-Schwoebel instability and the diffusional roughening model for temporal
variations of ripples on crystalline metals [32, 35], the geometrical shadowing effect
based model, which considers shadowing of ions by surface ripple geometries [36], and
finally discuss the Muñoz-Garcia, Castro, and Cuerno hydrodynamic model [37].
13
2.4 Gas Cluster Ions vs. Monomer Ions
The sputtering phenomenon was first observed in a laboratory experiment by Grove [38]
in 1853. The sputtering-induced surface instability depends on the ion beam angle of
incidence, energy and mass of ion, applied dose, and material. Directional ion
bombardment generates ripple patterns on a surface. The amplitude of these surface
features shows an initial linear variation with applied dose, but after a critical dose,
amplitude to wavelength ratio maximizes which causes saturation of ripple amplitudes.
Monomer ion-induced self-assembled nano-pattern formation experimental investigations
have been conducted in medium energy (100 eV < E < 10 keV’s) and high dose ranges
from ~1018
to 1022
ions/cm2 and in general the maximum surface instabilities for
monomer ions appear between 50o to 70
o from the surface normal for metal and
semiconductor materials [29-34], but there are some contradictory observations reported
by Ziberi et al. [39,40], where ripples form at an incidence angle of 20o and then again
surface roughening at 60o to 80
o. Medium energy monomer ions penetrate the solid
surface and undergo collision cascade events and surface sputtering occurs when an atom
gains sufficient energy from an energetic nearest neighbor atom to overcome the surface
binding energy barrier of the material [28, 30].
However, gas cluster ions consisting of hundreds to thousands of atoms with very low
energies, a few eV’s, generate high energy density collisions at the surface and sputter
large amount of atoms. Gas cluster ions formed due to condensation are held together by
van der Waal forces. Formation and instrumentation of large gas cluster ions are
discussed in detail in Chapter 3. Moreover, the cluster ion sputtering rate shows linear
14
variation with applied cluster ion energy [17], whereas monomer ion momentum
conservation creates a square root of energy deviation. Time-evolution Monte Carlo
simulation calculations done by Yamamura [41] suggest three interior processes within a
gas cluster ion at the moment of impact normal to the surface. (1) Highly packed first in
row atoms backscatter after the impact; (2) These backscattering atoms interact with
interior cluster atoms and produce parallel velocity components; and (3) Atoms move
laterally and interact with peaks and smoothed the surface. Since the total energy of a
cluster ion is conserved, Toyoda et al. from experimental observations interpreted that
atoms within a cluster ion undergo inelastic collisions resulting in atom-atom bond
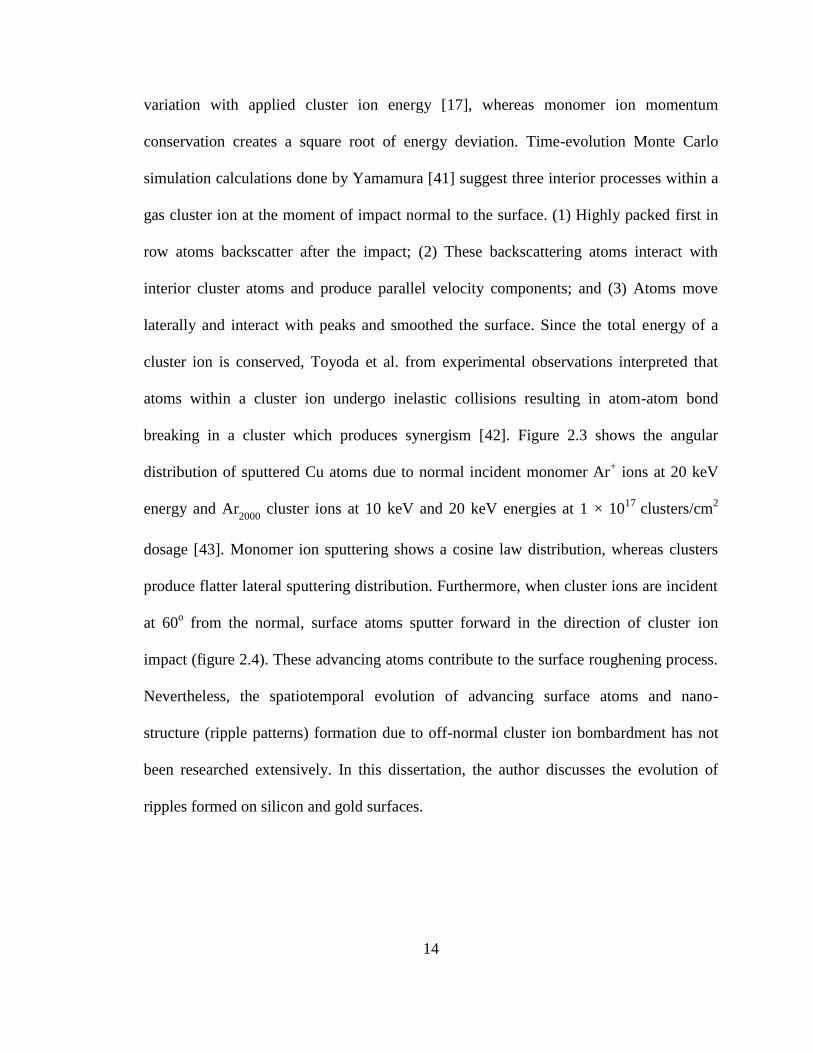
breaking in a cluster which produces synergism [42]. Figure 2.3 shows the angular
distribution of sputtered Cu atoms due to normal incident monomer Ar+ ions at 20 keV
energy and Ar2000
cluster ions at 10 keV and 20 keV energies at 1 × 10¹⁷
clusters/cm2
dosage [43]. Monomer ion sputtering shows a cosine law distribution, whereas clusters
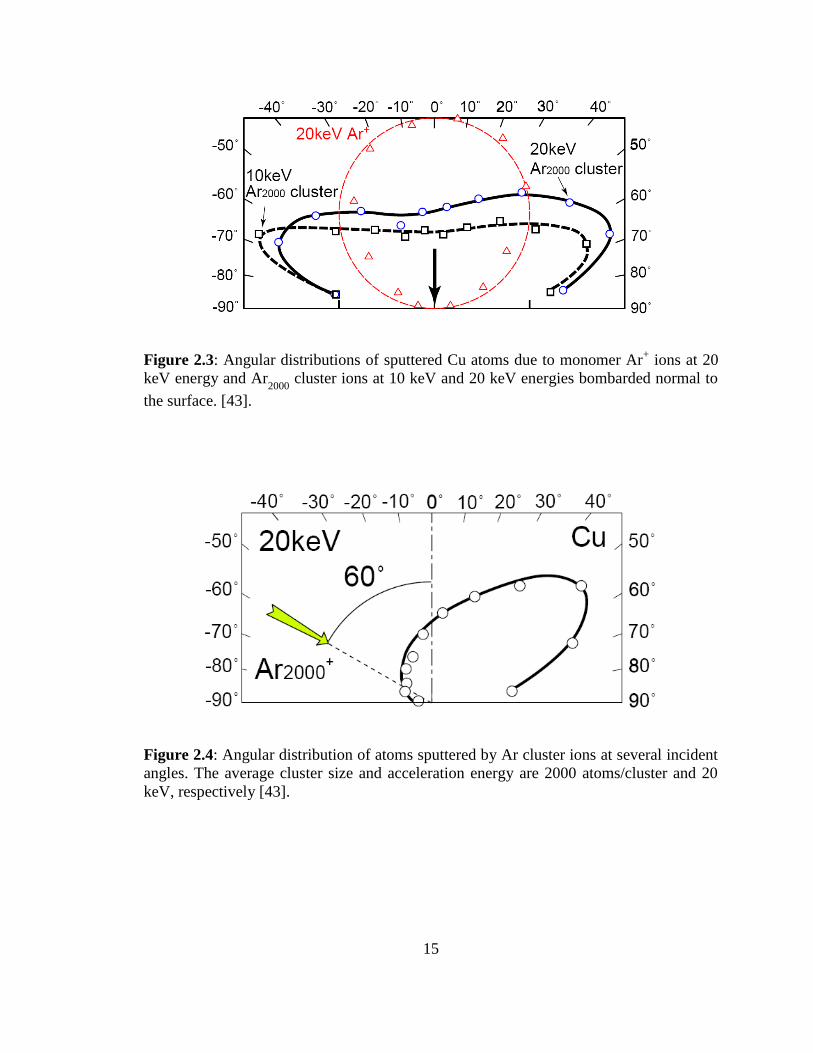
produce flatter lateral sputtering distribution. Furthermore, when cluster ions are incident
at 60o from the normal, surface atoms sputter forward in the direction of cluster ion
impact (figure 2.4). These advancing atoms contribute to the surface roughening process.
Nevertheless, the spatiotemporal evolution of advancing surface atoms and nano-
structure (ripple patterns) formation due to off-normal cluster ion bombardment has not
been researched extensively. In this dissertation, the author discusses the evolution of
ripples formed on silicon and gold surfaces.
15
Figure 2.3: Angular distributions of sputtered Cu atoms due to monomer Ar+ ions at 20
keV energy and Ar2000
cluster ions at 10 keV and 20 keV energies bombarded normal to
the surface. [43].
Figure 2.4: Angular distribution of atoms sputtered by Ar cluster ions at several incident
angles. The average cluster size and acceleration energy are 2000 atoms/cluster and 20
keV, respectively [43].
16
Chapter 3
Gas Cluster Ion Beam (GCIB) System
This chapter is an introduction to types of cluster ion-forming techniques and a detailed
description of GCIB System.
3.1 Cluster Ion Sources
Clusters of gaseous and metal atoms can be acquired through an expanding nozzle flow
with necessary conditions. The first such discovery of clusters was conducted by Becker
et al. in 1956 by studying condensation of individual vapor expanding out of a small
nozzle into a vacuum and the cluster ion beam was detected via a modified ion gauge
[44]. Cluster ions may take the form of dimers, molecules or large cluster up to about 10
nm in diameter with thousands of atoms. The characteristic properties of cluster ion
include segregation of atoms more closely to the surface and they are loosely bonded
17
compared to inner atoms and give rise to different interactions with materials compared
to monomer ions. One important aspect of cluster ion beams is their beam intensities and
the specific charge effect. Low specific charge is desired to obtain a high beam current
for energies ranging up to 10 keV/atom [45], with comparison of current and charge
density. The use of cluster ions with specific size N/Z increases mass current and density
by a factor of N/Z, where N is the number of atoms in the cluster, and Z is the atomic
number of the cluster ion element. Also heavy clusters have limited space charge effects.
There are various types of cluster ion forming sources that vary depending on the need of
the research on hand.
(a) Supersonic Expansion
A high pressure gas expands into a vacuum through a de Laval nozzle (an asymmetric
hour glass-shape tube that is squeezed in the middle) creating an adiabatic expansion
of the gas by limiting the velocity of the gaseous atoms which condense and form
clusters. The temperature of the clusters is less than 10 K and large gaseous clusters
are bonded with weaker van der Waals forces [17]. Then these clusters which pass
through a metal skimmer are ionized by speeding electrons generated from a heated
tungsten filament. When clusters are charged, they are mass selected and accelerated
into a target chamber. A detailed description of the instrumentation of this cluster ion
source will be discussed in section 3.2.
(b) Source of Negative Ion Cesium Sputtering (SNICS)
A negatively biased target material is sputtered by positive cesium ion and negative
target ions are extracted and focused onto the sample chamber [46]. During the target
18
sputtering process polyatomic clusters are also formed due to the high reactivity of
cesium ions, with an adjustable extraction voltage these clusters can be acquired and
accelerated.
(c) Laser Ablation
A metal is vaporized by a laser beam and the vapor is carried out by high density
helium gas through a nozzle where the gas undergoes supersonic expansion, and
cools and condenses to form metal clusters [47]. All metal clusters produced are
accelerated to the same speed by the helium carrier gas when exiting the nozzle. Early
experiments done by Dietz et al. show that for a Al vaporization clustering process,
the production of Al2 dimer and Al3 trimer signals possess 10% and 5% of the
monomer signal.
(d) Discharge Source
A pulsed high current arc is placed between two electrodes in a pulse of carrier gas,
which output the budding plasma through a channel and a conical nozzle into the high
vacuum [48]. Ionized particles act as condensation sites for metal cluster ion growth.
(e) Gas Aggregation
Clusters are formed by nucleation from a metal vapor in a helium gas atmosphere
covered by liquid nitrogen cooling chamber [49]. The neutral cluster beam is
extracted through a small orifice. Cluster size ranges from 2 to 500 atoms per cluster
depending on the metallic element.
(f) Liquid Clusters
A liquid is vaporized by resistive heating of the source. For ethanol room temperature
19
pressure is about 5.9 N/m2, but pressure increases with source temperature [50].
Similar to the process described in 3.1 (a), vaporized liquid expands when passed
through a nozzle whereby an adiabatic process vapor condenses and produces neutral
clusters; helium gas is used as the cooling agent of the vapor during the clustering
process. These clusters are ionized by electron bombardment.
3.2 Cluster Ion Formation in GCIB System
3.2.1 Supersonic Jet Nozzle
Figure 3.1 is a Gas Cluster Ion Beam (GCIB) system schematic diagram. In the nozzle
chamber stagnated high pressure (Po) gas at To temperature expands through a small hole
of diameter D. Due to adiabatic expansion, highly randomized gas passes into the
vacuum with similar speeds and at very low temperatures. The nozzle is a vital part of the
GCIB since its structure controls the gas flow, cluster size, beam divergence and
temperature. For the expansion, the energy conservation law can be applied by
considering the enthalpy in the stagnation region (Ho) and in the vacuum region energy
transfers into rest enthalpy and kinetic energy of the flow of gas which gives [51]
𝐻 = 𝐻 +1
2𝑚𝑣 = 𝑐 𝑇 +
1
2𝑚𝑣 = 𝑐 𝑇 (3.1)
here cp is the specific heat at constant pressure with a value of
𝑘 for a monoatomic
beam, and the flow region temperature is T. Also the Boltzmann constant is given by
equation,
20
Figure 3.1: The schematic diagram of the Gas Cluster Ion Beam (GCIB) system in Texas
Center for Superconductivity at University of Houston. The system is divided into three
main chambers: Nozzle, Ionizer, and Target chamber. Inside the nozzle chamber, the
stagnated high pressure gas expand adiabatically to form clusters which are then ionized
and accelerated in the ionizer chamber and the cluster ion beam is focused and scanned
onto the sample which is located inside the target chamber.
𝑘 = 𝑐 − 𝑐 (3.2)
the equation (3.1) can be re-written as,
𝑇 = 𝑇 [1 +1
2(𝛾 − 1)𝑀 ]
(3.3)
where the ratio of the specific heats (𝛾 =𝑐
𝑐 ⁄ ) at constant pressure and volume is
assumed to be independent of temperature for a monoatomic gas and the Mach number
(M) is the ratio of the stream velocity (𝑣) to the local speed of sound (𝑐 = √𝛾𝑘𝑇
𝑚⁄ ).
The M increases dramatically in the zone of silence (the region that is confined by the
shock boundary as shown in Figure 3.2) and is given by
21
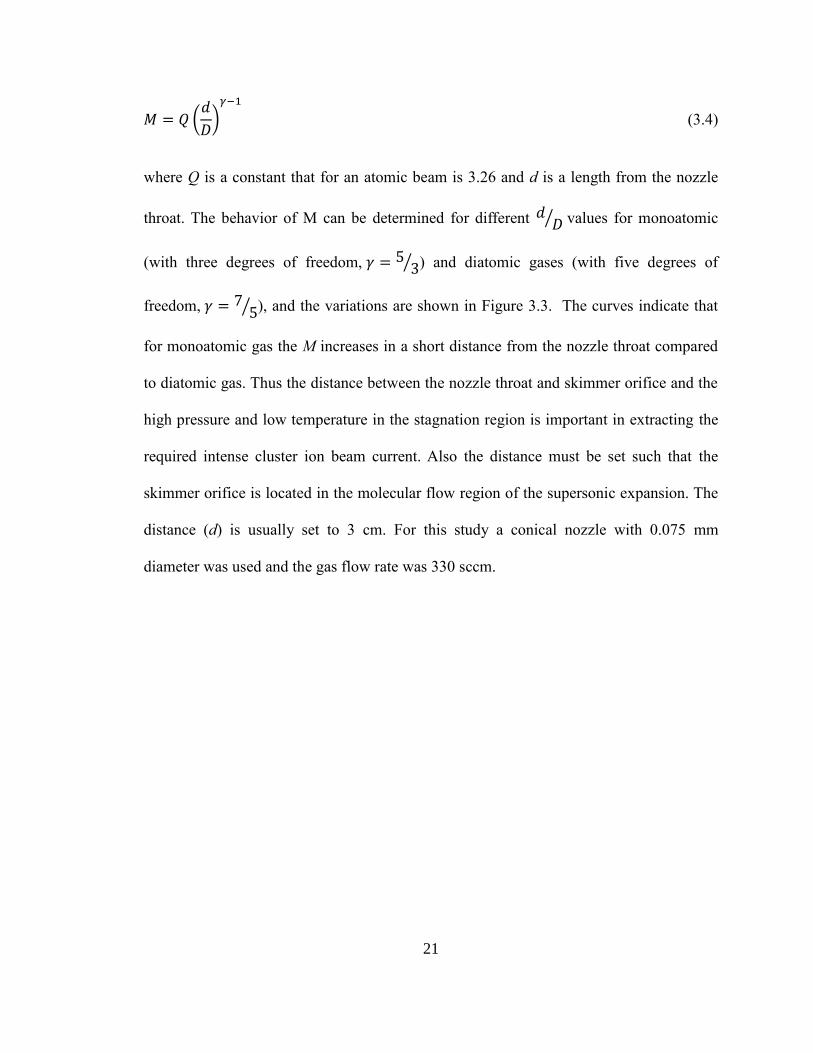
𝑀 = 𝑄 (𝑑
𝐷)
(3.4)
where Q is a constant that for an atomic beam is 3.26 and d is a length from the nozzle
throat. The behavior of M can be determined for different 𝑑 𝐷⁄ values for monoatomic
(with three degrees of freedom, 𝛾 = 53⁄ ) and diatomic gases (with five degrees of
freedom, 𝛾 = 75⁄ ), and the variations are shown in Figure 3.3. The curves indicate that
for monoatomic gas the M increases in a short distance from the nozzle throat compared
to diatomic gas. Thus the distance between the nozzle throat and skimmer orifice and the
high pressure and low temperature in the stagnation region is important in extracting the
required intense cluster ion beam current. Also the distance must be set such that the
skimmer orifice is located in the molecular flow region of the supersonic expansion. The
distance (d) is usually set to 3 cm. For this study a conical nozzle with 0.075 mm
diameter was used and the gas flow rate was 330 sccm.
22
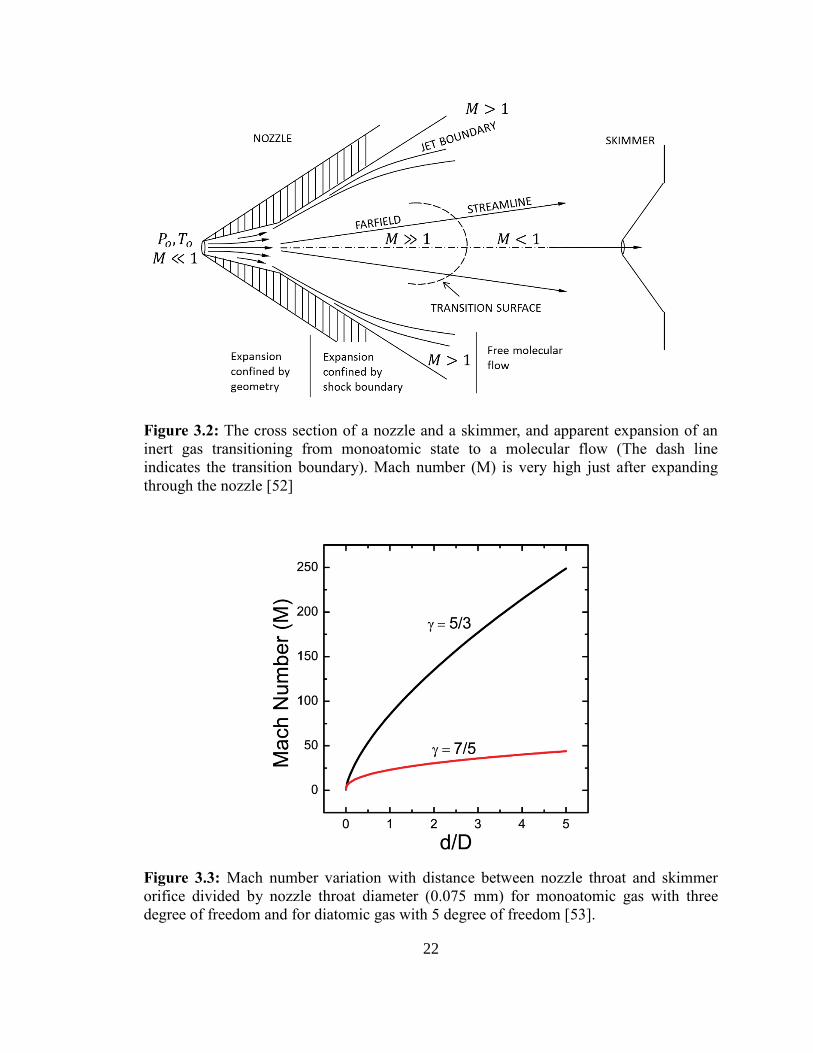
Figure 3.2: The cross section of a nozzle and a skimmer, and apparent expansion of an
inert gas transitioning from monoatomic state to a molecular flow (The dash line
indicates the transition boundary). Mach number (M) is very high just after expanding
through the nozzle [52]
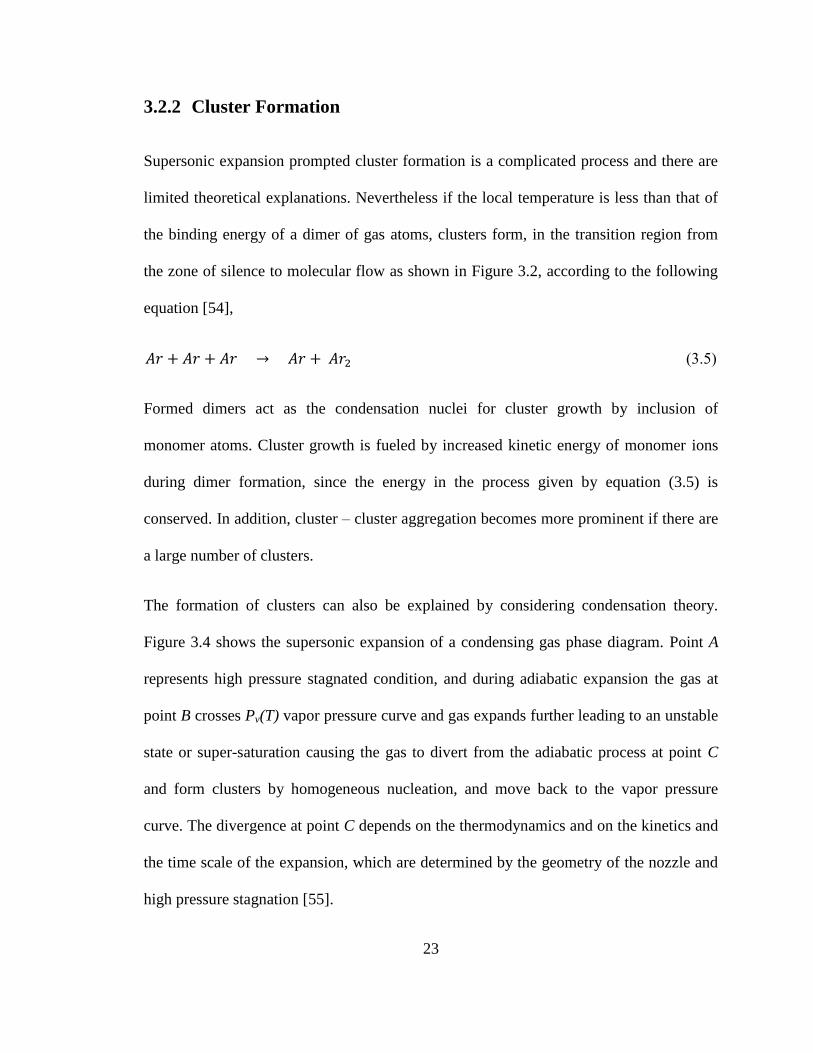
Figure 3.3: Mach number variation with distance between nozzle throat and skimmer
orifice divided by nozzle throat diameter (0.075 mm) for monoatomic gas with three
degree of freedom and for diatomic gas with 5 degree of freedom [53].
23
3.2.2 Cluster Formation
Supersonic expansion prompted cluster formation is a complicated process and there are
limited theoretical explanations. Nevertheless if the local temperature is less than that of
the binding energy of a dimer of gas atoms, clusters form, in the transition region from
the zone of silence to molecular flow as shown in Figure 3.2, according to the following
equation [54],
+ + + (3.5)
Formed dimers act as the condensation nuclei for cluster growth by inclusion of
monomer atoms. Cluster growth is fueled by increased kinetic energy of monomer ions
during dimer formation, since the energy in the process given by equation (3.5) is
conserved. In addition, cluster – cluster aggregation becomes more prominent if there are
a large number of clusters.
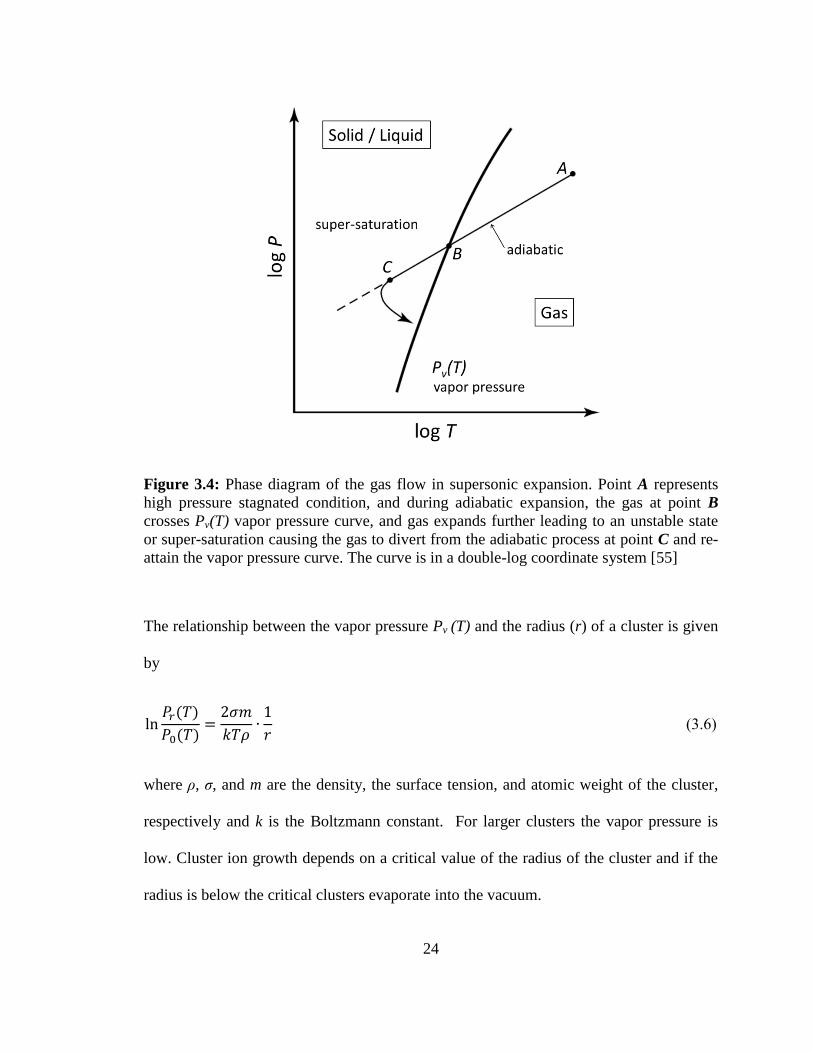
The formation of clusters can also be explained by considering condensation theory.
Figure 3.4 shows the supersonic expansion of a condensing gas phase diagram. Point A
represents high pressure stagnated condition, and during adiabatic expansion the gas at
point B crosses Pv(T) vapor pressure curve and gas expands further leading to an unstable
state or super-saturation causing the gas to divert from the adiabatic process at point C
and form clusters by homogeneous nucleation, and move back to the vapor pressure
curve. The divergence at point C depends on the thermodynamics and on the kinetics and
the time scale of the expansion, which are determined by the geometry of the nozzle and
high pressure stagnation [55].
24
Figure 3.4: Phase diagram of the gas flow in supersonic expansion. Point A represents
high pressure stagnated condition, and during adiabatic expansion, the gas at point B
crosses Pv(T) vapor pressure curve, and gas expands further leading to an unstable state
or super-saturation causing the gas to divert from the adiabatic process at point C and re-
attain the vapor pressure curve. The curve is in a double-log coordinate system [55]
The relationship between the vapor pressure Pv (T) and the radius (r) of a cluster is given
by
(𝑇)
(𝑇)=
2 𝑚
𝑘𝑇 1
(3.6)
where ρ, σ, and m are the density, the surface tension, and atomic weight of the cluster,
respectively and k is the Boltzmann constant. For larger clusters the vapor pressure is
low. Cluster ion growth depends on a critical value of the radius of the cluster and if the
radius is below the critical clusters evaporate into the vacuum.
25
3.2.3 Metal Skimmer
The cores of the neutral clusters pass through a small orifice of the skimmer and the
intensity of the cluster beam depends on the distance (d) between the nozzle and the
skimmer orifice. The skimmer that is used is made out of nickel (Ni) and has a shape of a
cone and also the diameter of the orifice used in this study was 0.075 mm. If d is larger
than an optimal value a shock wave called Mach disk is formed in front of the skimmer
which causes a decrease in the beam intensity [56]. Another issue that arises is that
cluster beam interference due to evaporating gas collisions with clusters. Thus, including
a high pumping rate turbo pump reduces the distortion by evaporating gas.
3.2.4 Cluster Ionization and Acceleration
Neutral clusters entering the ionizer chamber through the skimmer are ionized by
electrons, which is convenient in extracting an intense current cluster ion beam. Photons
are also a possible candidate for ionization and they produce a clear energy balance, but
the beam current is lower than that of electron ionized cluster ion beam current [17]. The
initial acceleration of cluster ions is provided by two-stage extraction voltages. The
ionization beam includes clusters as well as monomer ions, and to suppress monomer
ions via the space charge effect, a low extraction voltage is applied initially, and only
large cluster ions with higher initial kinetic energies are extracted. Extracted cluster ions
are focused by three electrostatic lenses. The cluster ion size distribution can be selected
through applying a voltage across a retarding electrode located beam downstream from
26
the lenses. Also the cluster size distribution and beam intensity changes with the
stagnation pressure (Po). Figure 3.5 shows a time of fight mass spectrum of large cluster
sizes at different Po values [57]. The GCIB system that was used in this study can be used
to produce maximum of 30 keV energy cluster ions with a biasing acceleration voltage of
30 kV. To achieve uniformity in the cluster ion beam, x-y scanners (deflectors) are
activated. Experimental manipulation of the cluster ion beam for different target materials
will be described in Chapters 5, 6 and 7.
Figure 3.5: Ar cluster ion beam distribution at different stagnation pressures. When the
pressure increases cluster size distribution peak shifts toward higher cluster masses. 3000
atoms per cluster ion beam can be realized with a pressure range of 10000 – 10500 Torr
[1 Torr = 133.3 N/m2].
27
Chapter 4
Material and Surface Characterization
Techniques
Investigation of the cluster ion-induced modifications of surface, and crystal structure, as
well as chemical composition of materials, requires various techniques that provide detail
characterization on materials. This chapter will cover the techniques that were used in the
research, and results will be given in following chapters.
4.1 Rutherford Backscattering Spectrometry
Ion beam analysis techniques introduce a non-destructive method for understanding
properties of materials. Since the discovery of backscattering of alpha particles from a
gold thin film target in 1909 by Sir Ernest Rutherford and colleagues From the results
28
obtained from Geiger-Marsden experiment Rutherford Model of the atom was formulated
in 1911. Rutherford Backscattering (RBS) has been employed to extract information
about target material composition and if the material is a thin film, details regarding film
thickness and layered compositional variations can be determined. Furthermore, if the ion
beam is aligned with sample crystal axes, RBS ion channeling can verify the crystallinity
of the sample.
4.1.1 Thin Film Analysis
If a multilayered elemental thin film sample is exposed to alpha particles, the
backscattering particle energy varies depending on the number of films, the elements
present and the thickness of films. The spectrum that is generated provides information
on the sample in terms of backscattering energies, which can be converted into film
thickness. Au coated Si substrates that were used in this research study were subjected to
Ar cluster ion beam sputtering, and samples had thickness greater than 10 nm. The
energy of the beam that was used for the RBS analysis was 2.0 MeV 4He ions. Figure
(4.1) shows the energy converted RBS spectrum for a non-bombarded Au thin film
coated on Si substrate; a layer of Ti was used to improve adhesion of Au onto Si
substrate. The energy difference created by the surface and the interface between film and
the substrate ΔE is related to the film thickness by
= [ ] (4.1)
where [ ] is the stopping cross section factor and N, Δtf are the atomic density and the
29
thickness of the film per channel respectively. [ ] is calculated according to the
following equation,
[ ] =
( )+
( ) (4.2)
where Kf is the kinematic factor of elemental thin film, and are inward and
outward stopping cross section factors respectively [58]. The scattering angle for the RBS
experiment used with respect to the laboratory frame was 165o and also the incident beam
was normal to the target surface, thus the incident angle of the alpha beam was θ1 = 0o
and the direction of the scattered particle was at θ2 = 15o. According to the mean energy
approximation, is evaluated with respect to the incident beam energy (Eo) and
with respect to KfEo. These values were calculated using SRIM 2012 software [59].
From equations (4.1) and (4.2), Δtf was evaluated for Au thin film. Also the total amount
of target atoms sputtered from the surface due to cluster ion beam was estimated with
comparison to a non-bombarded Au thin film. Calculated values of amount of Au atoms
sputtered are discussed in Chapter 6.
4.1.2 Ion Beam Channeling
Ion channeling describes an energetic ion beam incident onto a crystalline material, and
the ion beam is aligned with the crystal orientation. Energetic ions travel further into the
material than at a random crystal orientation. Thus, backscattering yield decreases
dramatically compared to a random RBS spectra. A particle channels through a crystal
30
structure if (1) there are openings between atomic rows, (2) there is a force acting on the
particle to steer in the ion channel, and (3) the trajectory of the particle is stable by
avoiding collisions with atomic rows [60]. The near-surface damage and recovery of a
crystalline material due to cluster ion beam can be evaluated using ion channeling
technique. In Chapter 5 I will discuss off-normal cluster ion-induced damage and
recovery of the crystal structure by thermal annealing using RBS ion channeling for Si
(111).
Figure 4.1: Energy converted RBS spectrum for Au thin film coated on Si substrate, Au
adhesion on Si is improved by a layer of Ti. The calculated thickness of the non-
bombarded Au film was 94 nm; the bulk atomic density of Au 5.9050 × 10²²
atoms/cm3
was considered.
31
4.2 Atomic Force Microscopy (AFM)
The surface topographies of non-bombarded and bombarded samples were investigated
using Park Scientific Auto Probe CP AFM. This provides a 3D profile of the surface on a
nanoscale by measuring forces between a sharp probe and the surface at a very short
distance. For a contact mode AFM, if the spring constant of the cantilever is less than the
surface the cantilever bends. The tip carries a repulsive force and by maintaining a
constant cantilever deflection, the force between the probe and the sample can be held
constant, and a surface image can be obtained. The AFM images were analyzed by
Gwyddion 2.24 AFM imaging software [61]. Surfaces of different bombardment
conditions were evaluated by root mean square roughness ( ),
= {1
∑[ − ⟨ ⟩]
}
⁄
(4.3)
The wavelength of surface ripple patterns in x-direction was calculated as the maximum
value of the power spectrum of the image. Fast Fourier Transform (FFT) decomposes
AFM data signal into harmonic components and thus useful for studying spectral
frequencies present in AFM data. Fourier transform of the AFM images was performed
using Hann's function as the discrete window function,
( ) = .5 [1 − 𝑐 (2 )] (4.4)
The 2D FFT image of the AFM scanned image shows the dominating spatial frequencies
present on the surface. RMS roughness provides surface behavior at an individual point,
32
height correlation of two arbitrary points is quantified by the autocorrelation function
(𝑑) or the height-height correlation function (𝑑) of the surface.
(𝑚 ) = 1
( − )(𝑀 − 𝑚)∑ ∑ [
]
( .5)
where 𝑚 = − ⁄ and = − ⁄ , with ( ) ( ) coordinates for
and arbitrary height values, and and are measurement intervals. For AFM
measurements, evaluation of surfaces is done only along the fast scanning axis.
Therefore, equation (4.5) can be rewritten as,
(𝑚) = 1
(𝑀 − 𝑚)∑ ∑ [ ]
( . )
The one-dimensional autocorrelation function in Gaussian form is given by,
( − ) = [−( − )
𝑇 ] ( .7)
here and 𝑇 are the root mean square deviation of the heights and the autocorrelation
length, respectively. The difference between the autocorrelation function and height-
height correlation function is negligible. For the latter function the power of difference
between arbitrary points are considered. One-dimensional height-height correlation
function can be written as,
( − ) = 1
(𝑀 − 𝑚)∑ ∑ [ − ]
( . )
33
The Gaussian form of the height-height correlation function is given by,
( − ) = 2 [1 − {−( − )
𝑇 }] ( . )
AFM evaluations of surfaces are presented in Chapters 5 and 6.
4.3 Profilometer Analysis (PA)
The Tencor Alpha step 200 profilometer was used to determine the amount of material
removed from the surface of bulk and polymeric materials. Half of each sample was
covered before bombardment of cluster ions to create a step on the surface. The height
difference that occurs on the surface due to bombardment is called an alpha-step. Then
samples were mounted on a manually operated x-y stage of the profiler, and they were
scanned across in one direction to measure the difference in step height. The step height
represents the amount of material sputtered from the surface for a given dosage. Alpha
steps were created for Si samples, which is discussed in detail in Chapter 5.
4.4 Scanning Electron Spectroscopy (SEM)
FEI XL-30FEG SEM provides the flexibility of scanning through a sample surface. It
uses a focused electron beam with 15 keV energy to excite electrons in the material,
which generate an image depending on the amount of these secondary electrons
34
collected. Intensity of each pixel is determined by collected electrons. SEM was used
because of its flexibility of scanning through a sample surface to identify cluster ion
beam shadowed regions, which assist in determining the formation of ripple patterns.
Analysis of SEM images will be described in Chapter 5 and Chapter 6.
4.5 X-ray Photoelectron Spectroscopy (XPS)
Cluster ion beam bombardment induced surface chemical modification was studied using
XPS. XPS spectra are acquired by bombarding the material surface with a beam of x-rays
and simultaneously measuring the kinetic energy and the number of electrons escaping
from the surface. The instrument that was used in this experiment was a Physical
Electronics PHI S-700 ESCA system with Al filament x-ray source. The energy of the
incident photon and kinetic energy of electrons is related by,
𝑣 = + + (4.5)
where 𝑣 is the x-ray photon energy, is the work function induced by the analyzer,
which is about 4-5 eV, and is the binding energy. The work function is artificially
given by the instrument. Therefore, the binding energy can be estimated by the energy
difference between the incident x-ray photon energy and the kinetic energy of escaping
electrons from the surface. XPS spectra are plots of measured numbers of electron versus
binding energy. Each element on the surface represents a characteristic binding energy.
An XPS spectrum produces binding energy signals for almost all elements in the periodic
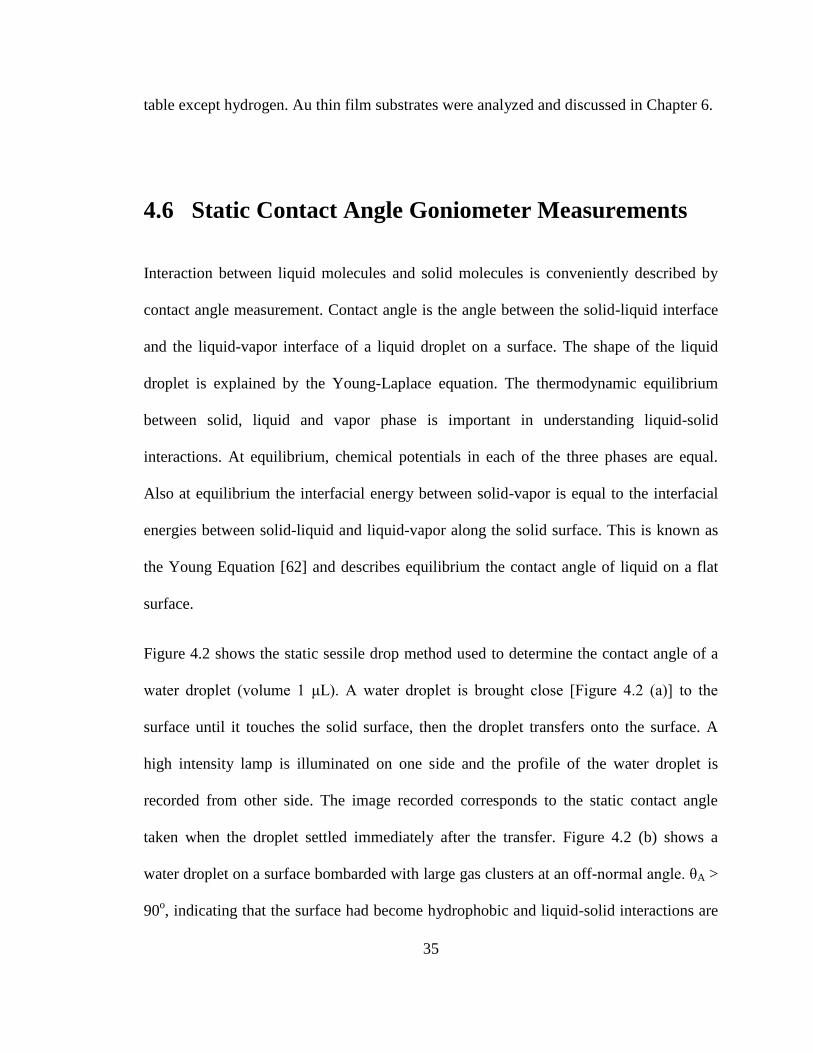
35
table except hydrogen. Au thin film substrates were analyzed and discussed in Chapter 6.
4.6 Static Contact Angle Goniometer Measurements
Interaction between liquid molecules and solid molecules is conveniently described by
contact angle measurement. Contact angle is the angle between the solid-liquid interface
and the liquid-vapor interface of a liquid droplet on a surface. The shape of the liquid
droplet is explained by the Young-Laplace equation. The thermodynamic equilibrium
between solid, liquid and vapor phase is important in understanding liquid-solid
interactions. At equilibrium, chemical potentials in each of the three phases are equal.
Also at equilibrium the interfacial energy between solid-vapor is equal to the interfacial
energies between solid-liquid and liquid-vapor along the solid surface. This is known as
the Young Equation [62] and describes equilibrium the contact angle of liquid on a flat
surface.
Figure 4.2 shows the static sessile drop method used to determine the contact angle of a
water droplet (volume 1 μL). A water droplet is brought close [Figure 4.2 (a)] to the
surface until it touches the solid surface, then the droplet transfers onto the surface. A
high intensity lamp is illuminated on one side and the profile of the water droplet is
recorded from other side. The image recorded corresponds to the static contact angle
taken when the droplet settled immediately after the transfer. Figure 4.2 (b) shows a
water droplet on a surface bombarded with large gas clusters at an off-normal angle. θA >
90o, indicating that the surface had become hydrophobic and liquid-solid interactions are
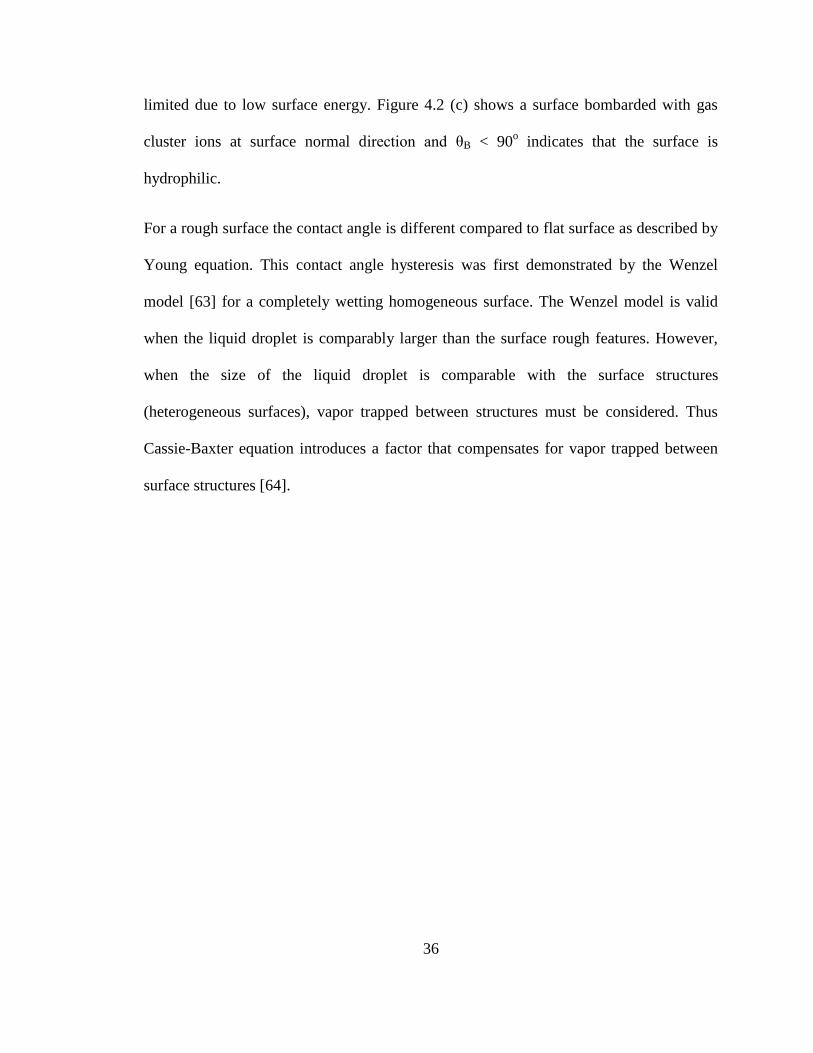
36
limited due to low surface energy. Figure 4.2 (c) shows a surface bombarded with gas
cluster ions at surface normal direction and θB < 90o indicates that the surface is
hydrophilic.
For a rough surface the contact angle is different compared to flat surface as described by
Young equation. This contact angle hysteresis was first demonstrated by the Wenzel
model [63] for a completely wetting homogeneous surface. The Wenzel model is valid
when the liquid droplet is comparably larger than the surface rough features. However,
when the size of the liquid droplet is comparable with the surface structures
(heterogeneous surfaces), vapor trapped between structures must be considered. Thus
Cassie-Baxter equation introduces a factor that compensates for vapor trapped between
surface structures [64].
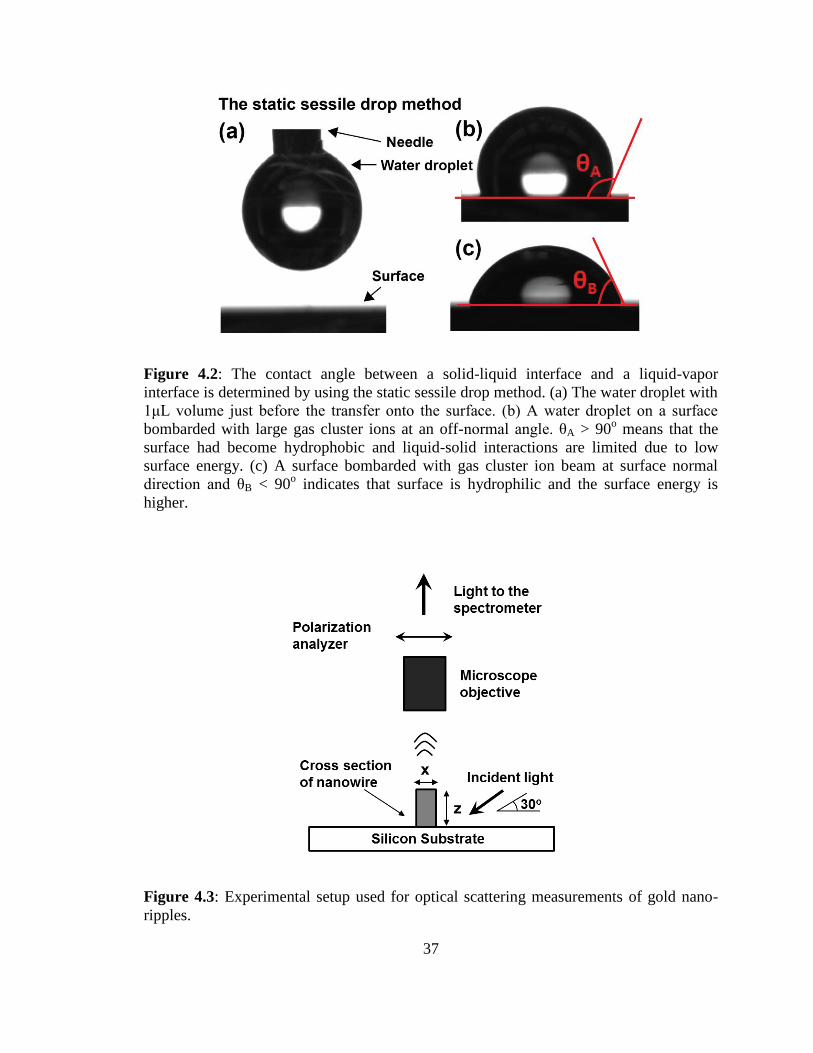
37
Figure 4.2: The contact angle between a solid-liquid interface and a liquid-vapor
interface is determined by using the static sessile drop method. (a) The water droplet with
1μL volume just before the transfer onto the surface. (b) A water droplet on a surface
bombarded with large gas cluster ions at an off-normal angle. θA > 90o means that the
surface had become hydrophobic and liquid-solid interactions are limited due to low
surface energy. (c) A surface bombarded with gas cluster ion beam at surface normal
direction and θB < 90o indicates that surface is hydrophilic and the surface energy is
higher.
Figure 4.3: Experimental setup used for optical scattering measurements of gold nano-
ripples.
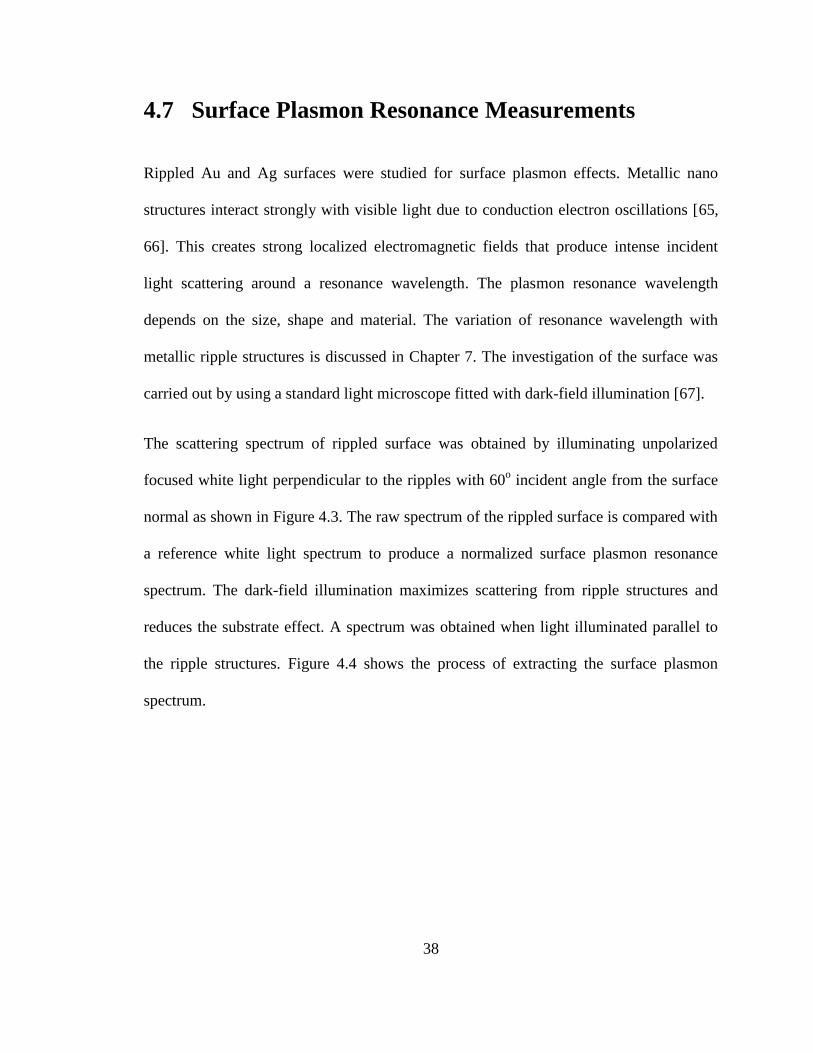
38
4.7 Surface Plasmon Resonance Measurements
Rippled Au and Ag surfaces were studied for surface plasmon effects. Metallic nano
structures interact strongly with visible light due to conduction electron oscillations [65,
66]. This creates strong localized electromagnetic fields that produce intense incident
light scattering around a resonance wavelength. The plasmon resonance wavelength
depends on the size, shape and material. The variation of resonance wavelength with
metallic ripple structures is discussed in Chapter 7. The investigation of the surface was
carried out by using a standard light microscope fitted with dark-field illumination [67].
The scattering spectrum of rippled surface was obtained by illuminating unpolarized
focused white light perpendicular to the ripples with 60o incident angle from the surface
normal as shown in Figure 4.3. The raw spectrum of the rippled surface is compared with
a reference white light spectrum to produce a normalized surface plasmon resonance
spectrum. The dark-field illumination maximizes scattering from ripple structures and
reduces the substrate effect. A spectrum was obtained when light illuminated parallel to
the ripple structures. Figure 4.4 shows the process of extracting the surface plasmon
spectrum.
39
Figure 4.4: (a) Scattering spectrum from white source, (b) Raw data obtained from a
nano structure, (c) The raw spectrum of surface nano structure is compared with the
reference white light spectrum to produce a normalized surface plasmon resonance
spectrum.
40
Chapter 5
Self-assembled Nano-patterns on Si
Surfaces by Ar Cluster Ion Beam
Bombardment
Nano-pattern formation on Si surfaces by Ar3000 cluster ion bombardment is investigated
as a function of cluster ion angle of incidence and applied dosage. This chapter covers a
comparison of cluster ion beam and monomer ion-induced nano-patterns on Si substrates.
5.1 Introduction
Self-assembled pattern formation due to ion beam bombardment has created significant
interest in recent years owing to their ease in processing with known conditions, and
41
fewer processing stages compared to a template based or lithography techniques. Si
substrates are the most extensively researched material in nano-pattern formation because
of their notable monatomic crystallography [68-75]. Although the process is well known,
the ripple formation phenomenon to date is investigated to establish a universal theory in
micro-nano scale surface evolution models [30,31,36,76-79]. So far nano-pattern
formation models and experiments based on monomer ion bombardment have suggested
ion beam dependence on the angle of incidence, dose, energy, type of ion, and current
density.
However, cluster ion-induced nano-pattern formation follows a different mechanism. The
synergistic interactions between an off-normal cluster ion and a surface generate forward
moving atoms due to momentum transfer [17]. These mobile atoms re-deposit close to
the collision site. One interpretation of nano structure formation is the shock wave
formation due to cluster ion collision [14]. Nevertheless, shock wave formation is a
single collision event process and does not explain the spatio-temporal growth of nano
structures. Inelastic collisions within the cluster ion [42] when colliding with a surface
provide additional energy due to van der Waal bond separations and lead to generation of
large amounts of surface mobile atoms. Because of these cascading events within the
cluster ion, surface penetration minimizes [17]. Surface curvature is not required for a
cluster ion beam to initiate a surface morphological variation [80], although the cluster
ion-induced surface roughness dependence increases on existing surface structures with
the applied dose. The Bradley and Harper model suggests the curvature and isotropic
thermal diffusion dependence for the formation of surface ripple structures on amorphous
42
materials [28] and these structures vary in orientation from perpendicular to parallel
depending on the incident angle of the monomer ion beam. Nonetheless, cluster ion-
induced surface ripples are always perpendicular to the incident beam, and ripples
disappear at a grazing incident angle for silicon amorphous surfaces.
5.2 Experimental Details
Silicon substrates with orientations of (111), (110), and (100) were cleaned before
loading in the main chamber of the Gas Cluster Ion Beam (GCIB) system. A detailed
schematic diagram of the GCIB system is given and described in Chapter 3. A high
pressure Ar gas undergoes supersonic expansion to produce neutral clusters, which are
ionized and accelerated to produce a beam of cluster ions with each cluster ion consisting
of about 3000 Ar atoms. Samples were bombarded with 30 keV Ar cluster ion beam at
different incident angles from 0o to 80
o in steps of 10
o and at a dose of 1 × 10
16
cluster/cm2; the incident angle was measured from the target surface normal. Also, the
bombardment dose was selected up to 1 × 10¹⁸
clusters/cm2 for the incident angle 60
o and
the cluster ion beam current density was set to 1 μA/cm2 with homogeneous beam
scanning. The low beam current avoids target sample heating, and the target chamber was
maintained at 24.5 oC with chamber pressure lower than 3 × 10
-4 N/m
2. Each sample was
characterized by Atomic Force Microscopy (AFM). The AFM image area was 5 × 5 μm2,
which included in all cases sufficient ripples to make substantial measurements. A clear
statistical understanding can be achieved by determining the surface root mean square
43
roughness, dominant wavelength, and correlation length, and by calculating the
roughness and the growth exponent.
The surface sputtered depth was estimated by producing an alpha step during cluster ion
beam bombardment and step height was measured by profilometer. Nano-ripple Si
sample bombarded at 60o at a dose of 1 × 10
16 clusters/cm
2 was annealed at 550
oC for 1
hour to determine the surface roughness and the degree of crystal structure recovery.
Rutherford Backscattering Spectroscopy (RBS) ion channeling measurements were
conducted on a non-bombarded sample, on Ar cluster ion beam bombarded sample and
on the annealed rippled sample.
5.3 Experimental Results and Discussion
5.3.1 Si Surface Roughening and Linear Regime
In the course of the Ar cluster ion beam bombardment study, we found that Si surface
roughness has a maximum transition incident angle as shown in Figure 5.1. We measured
surface root mean square roughness as a function of Ar cluster ion beam incident angle
measured from the surface normal, for each sample the dose was kept at 1 × 10¹⁶
clusters/cm2. Surface instability increases significantly up to 70
o incident angle and then
drastically decreases to a smooth surface at a grazing incidence angle of 80o. Ripple
patterns are formed in the range of 50o to 70
o, and below 50
o angle surface features are
random; these results are in agreement with previous work [17, 81, 57]. Monomer ion
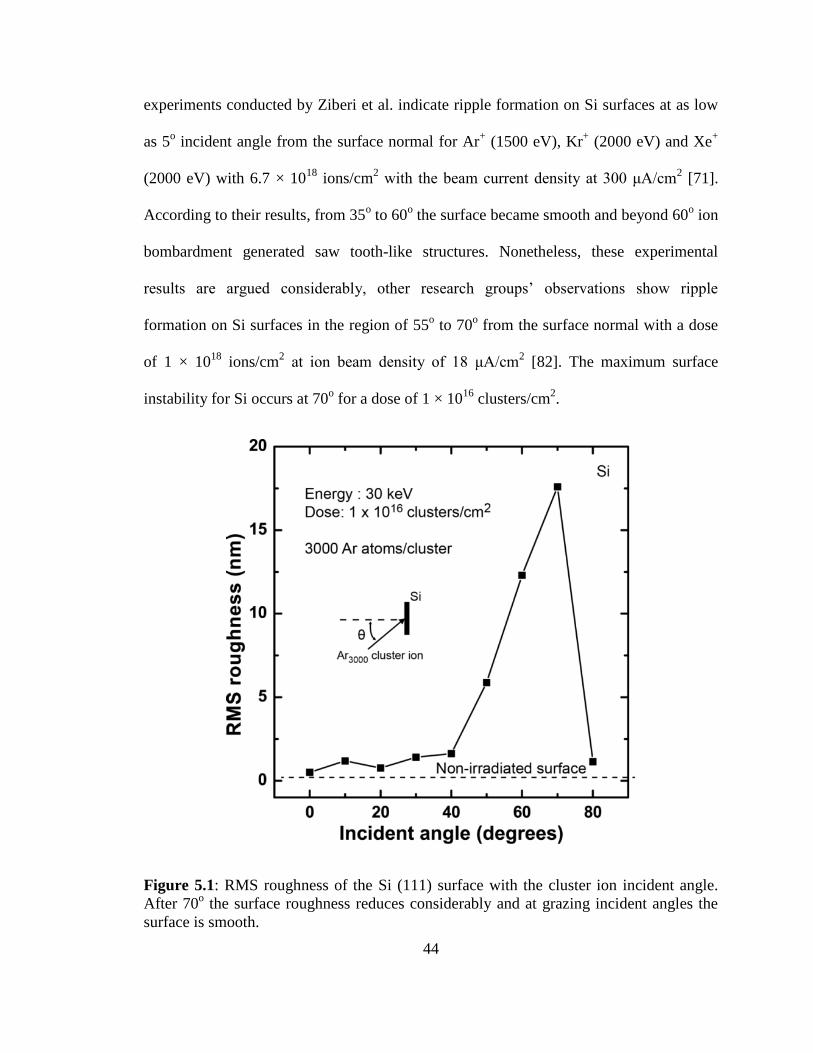
44
experiments conducted by Ziberi et al. indicate ripple formation on Si surfaces at as low
as 5o incident angle from the surface normal for Ar
+ (1500 eV), Kr
+ (2000 eV) and Xe
+
(2000 eV) with 6.7 × 10¹⁸
ions/cm2 with the beam current density at 300 μA/cm
2 [71].
According to their results, from 35o to 60
o the surface became smooth and beyond 60
o ion
bombardment generated saw tooth-like structures. Nonetheless, these experimental
results are argued considerably, other research groups’ observations show ripple
formation on Si surfaces in the region of 55o to 70
o from the surface normal with a dose
of 1 × 10¹⁸
ions/cm2 at ion beam density of 18 μA/cm
2 [82]. The maximum surface
instability for Si occurs at 70o for a dose of 1 × 10
16 clusters/cm
2.
Figure 5.1: RMS roughness of the Si (111) surface with the cluster ion incident angle.
After 70o the surface roughness reduces considerably and at grazing incident angles the
surface is smooth.
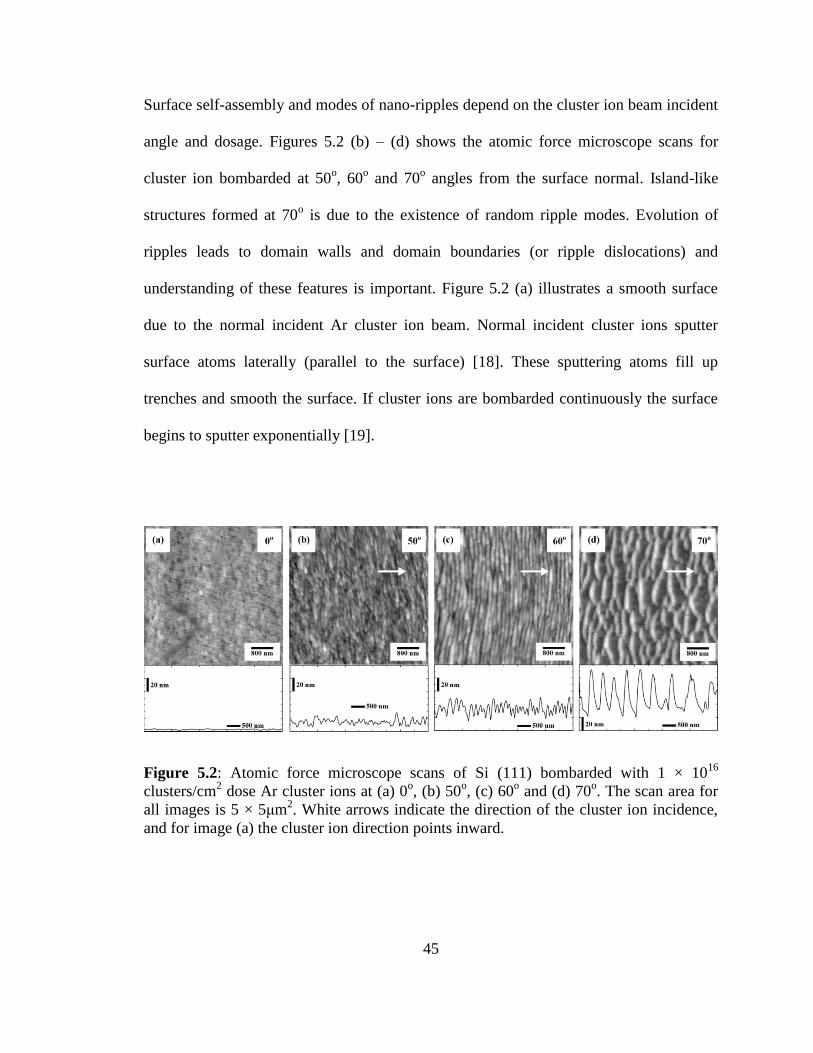
45
Surface self-assembly and modes of nano-ripples depend on the cluster ion beam incident
angle and dosage. Figures 5.2 (b) – (d) shows the atomic force microscope scans for
cluster ion bombarded at 50o, 60
o and 70
o angles from the surface normal. Island-like
structures formed at 70o is due to the existence of random ripple modes. Evolution of
ripples leads to domain walls and domain boundaries (or ripple dislocations) and
understanding of these features is important. Figure 5.2 (a) illustrates a smooth surface
due to the normal incident Ar cluster ion beam. Normal incident cluster ions sputter
surface atoms laterally (parallel to the surface) [18]. These sputtering atoms fill up
trenches and smooth the surface. If cluster ions are bombarded continuously the surface
begins to sputter exponentially [19].
Figure 5.2: Atomic force microscope scans of Si (111) bombarded with 1 × 10¹⁶
clusters/cm2 dose Ar cluster ions at (a) 0
o, (b) 50
o, (c) 60
o and (d) 70
o. The scan area for
all images is 5 × 5μm2. White arrows indicate the direction of the cluster ion incidence,
and for image (a) the cluster ion direction points inward.
46
During our experiment, we found that nano-ripple formation did not depend on the Si
crystal orientation. This is caused by amorphization of the surface layer due to high
energy transfer between cluster ions and the surface. As an example, Figures 5.3 (a) and
(b) show both RBS channeling spectra for a non-bombarded Si (111) substrate and for a
cluster ion beam bombarded Si (111) substrate, respectively. For the bombarded sample,
an amorphous surface layer of 58 nm is formed. Therefore, in the following sections we
will discuss only cluster ion-induced ripple formation on Si (111) substrates. When the
bombarded sample was annealed at 550 oC for an hour, the substrate crystallinity
recovered about 15% as demonstrated in Figure 5.4. During this re-crystallization process
the surface root mean square roughness increased from 12.3 nm to 15.4 nm, and also the
average wavelength increased from 200 nm to 230 nm. However, ripple dislocations
increased with thermal annealing as shown in Figure 5.5.
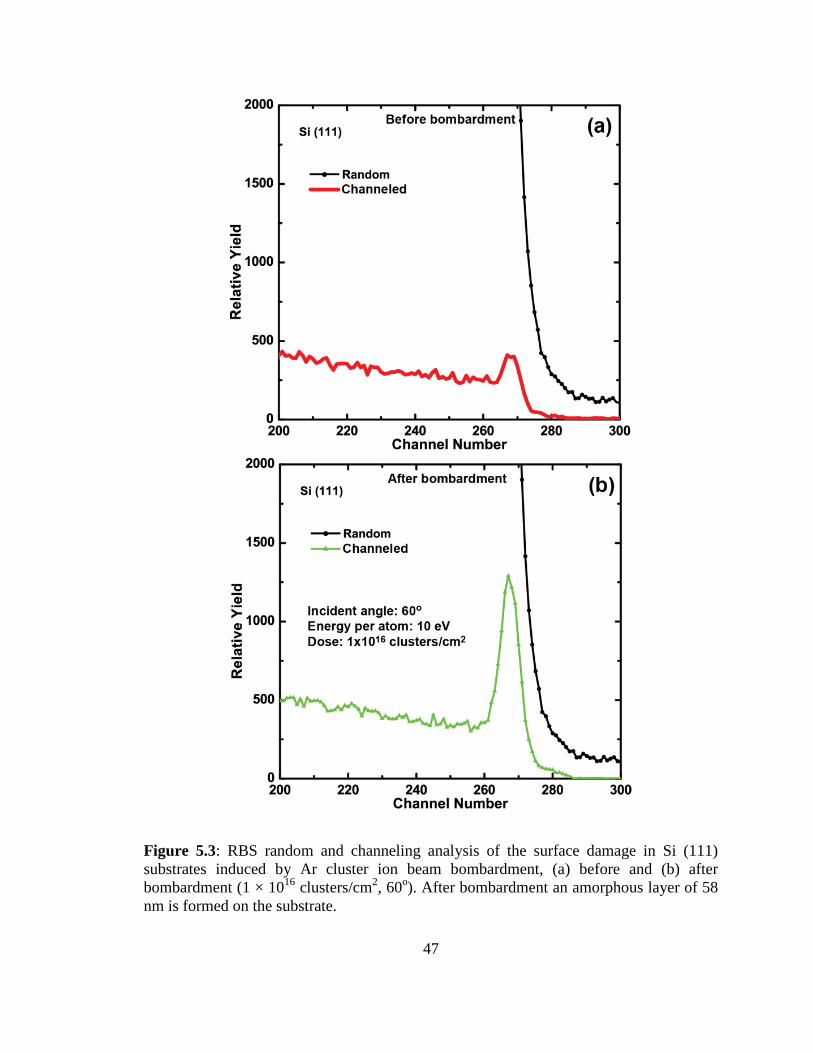
47
Figure 5.3: RBS random and channeling analysis of the surface damage in Si (111)
substrates induced by Ar cluster ion beam bombardment, (a) before and (b) after
bombardment (1 × 10¹⁶
clusters/cm2, 60
o). After bombardment an amorphous layer of 58
nm is formed on the substrate.
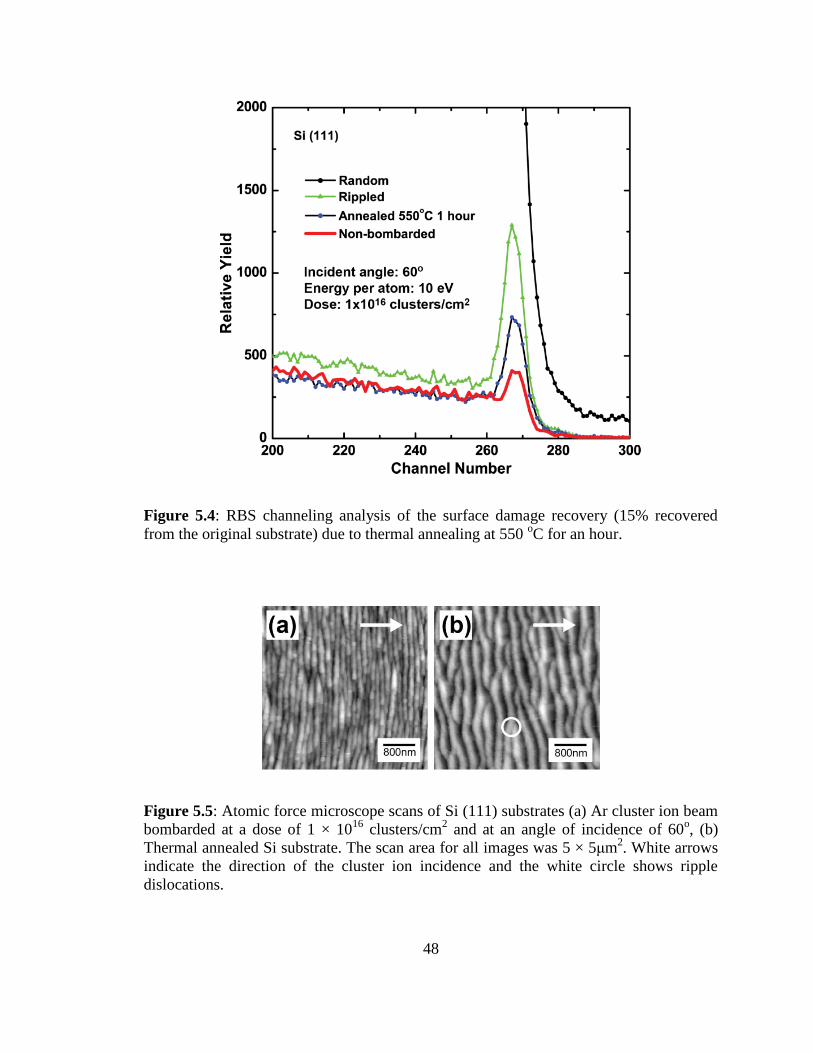
48
Figure 5.4: RBS channeling analysis of the surface damage recovery (15% recovered
from the original substrate) due to thermal annealing at 550 oC for an hour.
Figure 5.5: Atomic force microscope scans of Si (111) substrates (a) Ar cluster ion beam
bombarded at a dose of 1 × 10¹⁶
clusters/cm2 and at an angle of incidence of 60
o, (b)
Thermal annealed Si substrate. The scan area for all images was 5 × 5μm2. White arrows
indicate the direction of the cluster ion incidence and the white circle shows ripple
dislocations.
49
In our experiments, the target temperature did not deviate from the room temperature.
However, experiments have shown that the temperature of the target can rise up to about
150 oC during monomer ion beam bombardment [83]. Significance between our Ar
cluster ion experiments and monomer ion beam experiments are the energy per atom, the
beam current density, and the target temperature due to beam heating. Beam heating
activates isotropic thermal diffusion of surface atoms for monomer ion processing [28].
Since cluster ion beam processing of surfaces is at room temperature, main diffusion
activation is effective ion surface diffusion.
The randomness of initial impact of cluster ions creates surface defects that produce
arbitrary ripple modes at the surface, which depends on the basic parameters of a cluster
ion (angle of incidence, energy and dose). Continuous bombardment of clusters, coalesce
into ripples and this process is a time dependent. Figure 5.6 (a) – (c) shows atomic force
microscope scans for off-normal incident angles 50o, 60
o, and 70
o at 2.5 × 10
15
clusters/cm2, 7.5 × 10
15 clusters/cm
2 and 1 × 10
16 clusters/cm
2 dosages. However,
according to figures, angle of incidence also plays an important role in the self-assembly
of nano-ripples. For example, at 70o surface nano-ripples have a large amount of
dislocations, even though the roughness is higher as shown in Figure 5.7.
Qualitatively, our results point out that both amplitude and wavelength of surface nano-
structures at all incident angles show initial linear growth in their physical parameters,
which eventually saturates at higher dosages. Figure 5.7 shows the root mean square
roughness variation of ripples formed on Si (111) for cluster ion beam incident angles
50o, 60
o, and 70
o as a function of dose. Immediate saturation of surface roughness and
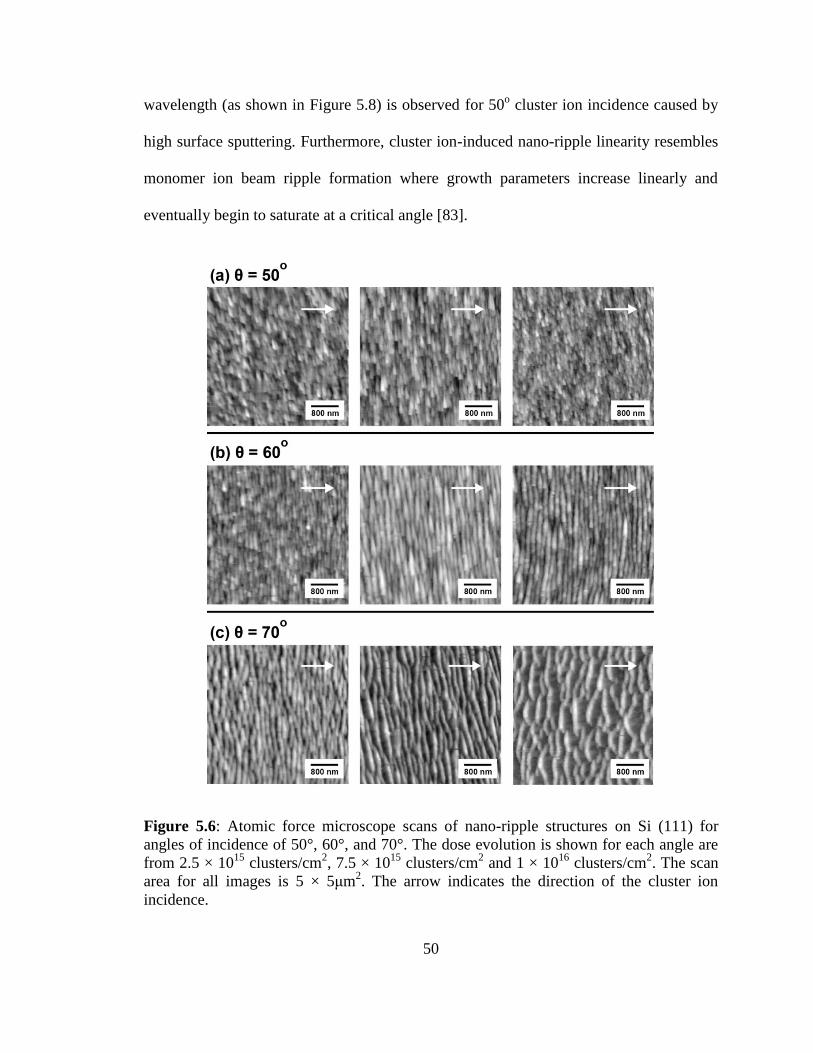
50
wavelength (as shown in Figure 5.8) is observed for 50o cluster ion incidence caused by
high surface sputtering. Furthermore, cluster ion-induced nano-ripple linearity resembles
monomer ion beam ripple formation where growth parameters increase linearly and
eventually begin to saturate at a critical angle [83].
Figure 5.6: Atomic force microscope scans of nano-ripple structures on Si (111) for
angles of incidence of 50°, 60°, and 70°. The dose evolution is shown for each angle are
from 2.5 × 10¹⁵
clusters/cm2, 7.5 × 10
15 clusters/cm
2 and 1 × 10
16 clusters/cm
2. The scan
area for all images is 5 × 5μm2. The arrow indicates the direction of the cluster ion
incidence.
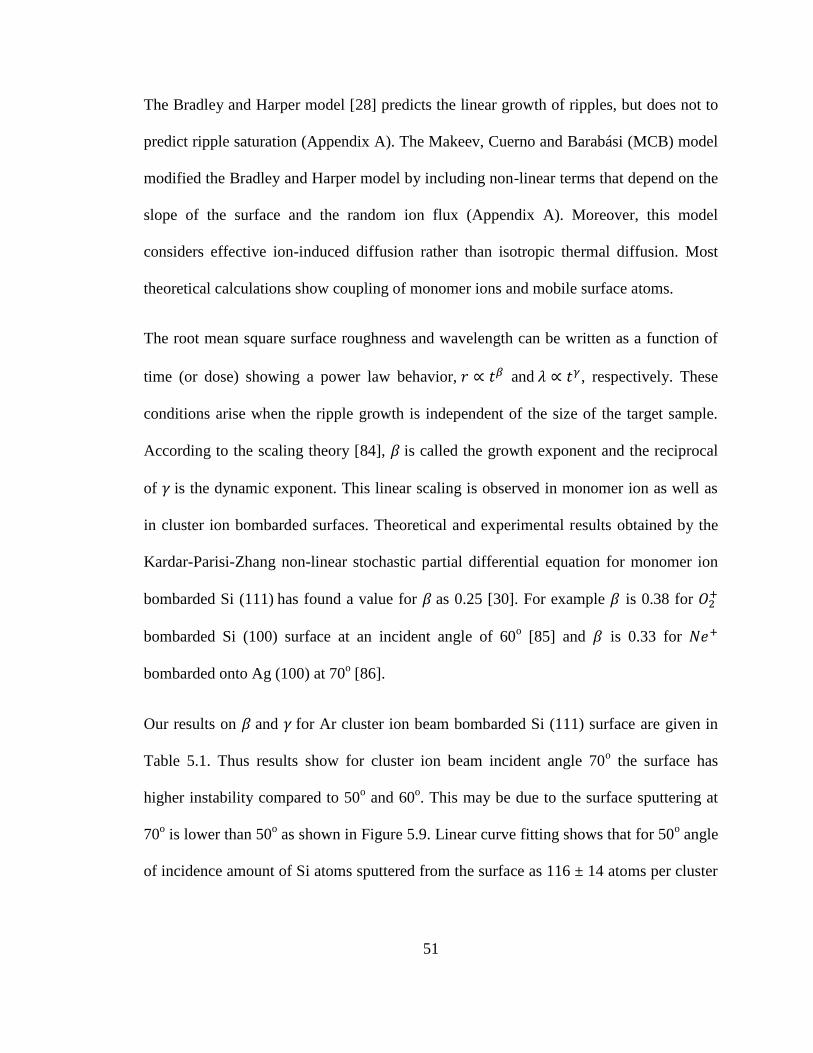
51
The Bradley and Harper model [28] predicts the linear growth of ripples, but does not to
predict ripple saturation (Appendix A). The Makeev, Cuerno and Barabási (MCB) model
modified the Bradley and Harper model by including non-linear terms that depend on the
slope of the surface and the random ion flux (Appendix A). Moreover, this model
considers effective ion-induced diffusion rather than isotropic thermal diffusion. Most
theoretical calculations show coupling of monomer ions and mobile surface atoms.
The root mean square surface roughness and wavelength can be written as a function of
time (or dose) showing a power law behavior, and , respectively. These
conditions arise when the ripple growth is independent of the size of the target sample.
According to the scaling theory [84], is called the growth exponent and the reciprocal
of 𝛾 is the dynamic exponent. This linear scaling is observed in monomer ion as well as
in cluster ion bombarded surfaces. Theoretical and experimental results obtained by the
Kardar-Parisi-Zhang non-linear stochastic partial differential equation for monomer ion
bombarded Si (111) has found a value for as 0.25 [30]. For example is 0.38 for
bombarded Si (100) surface at an incident angle of 60o [85] and is 0.33 for
bombarded onto Ag (100) at 70o [86].
Our results on and 𝛾 for Ar cluster ion beam bombarded Si (111) surface are given in
Table 5.1. Thus results show for cluster ion beam incident angle 70o the surface has
higher instability compared to 50o and 60
o. This may be due to the surface sputtering at
70o is lower than 50
o as shown in Figure 5.9. Linear curve fitting shows that for 50
o angle
of incidence amount of Si atoms sputtered from the surface as 116 ± 14 atoms per cluster
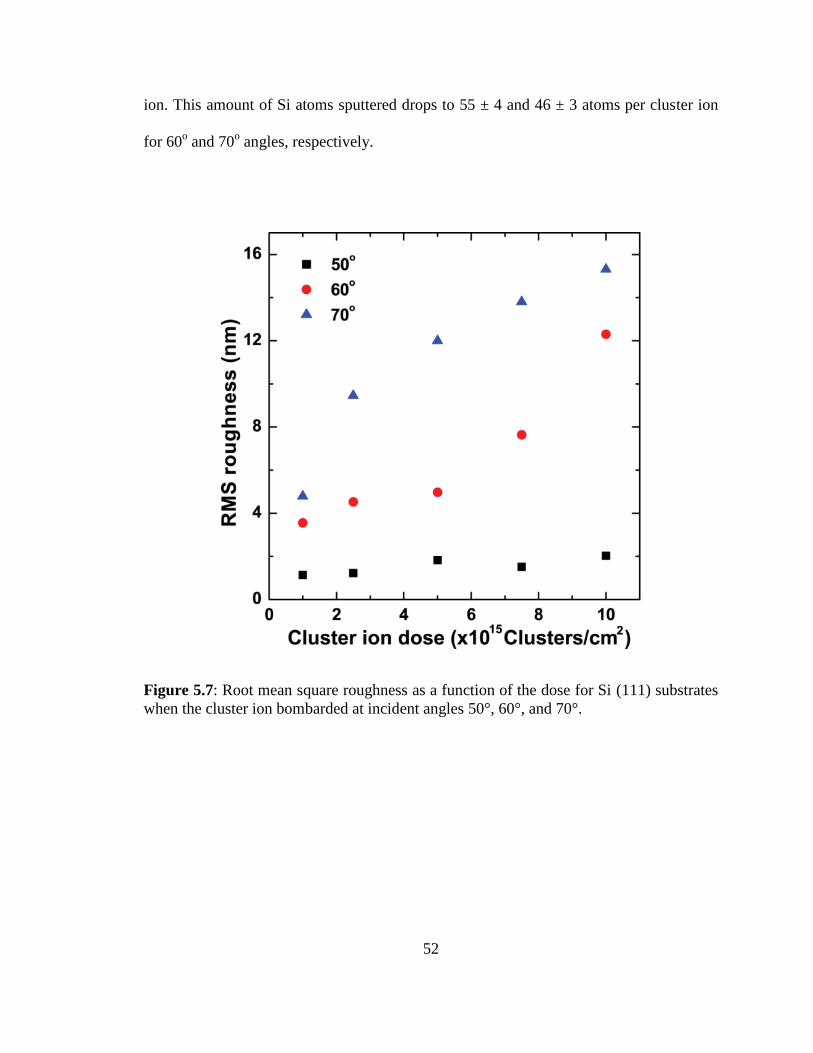
52
ion. This amount of Si atoms sputtered drops to 55 ± 4 and 46 ± 3 atoms per cluster ion
for 60o and 70
o angles, respectively.
Figure 5.7: Root mean square roughness as a function of the dose for Si (111) substrates
when the cluster ion bombarded at incident angles 50°, 60°, and 70°.
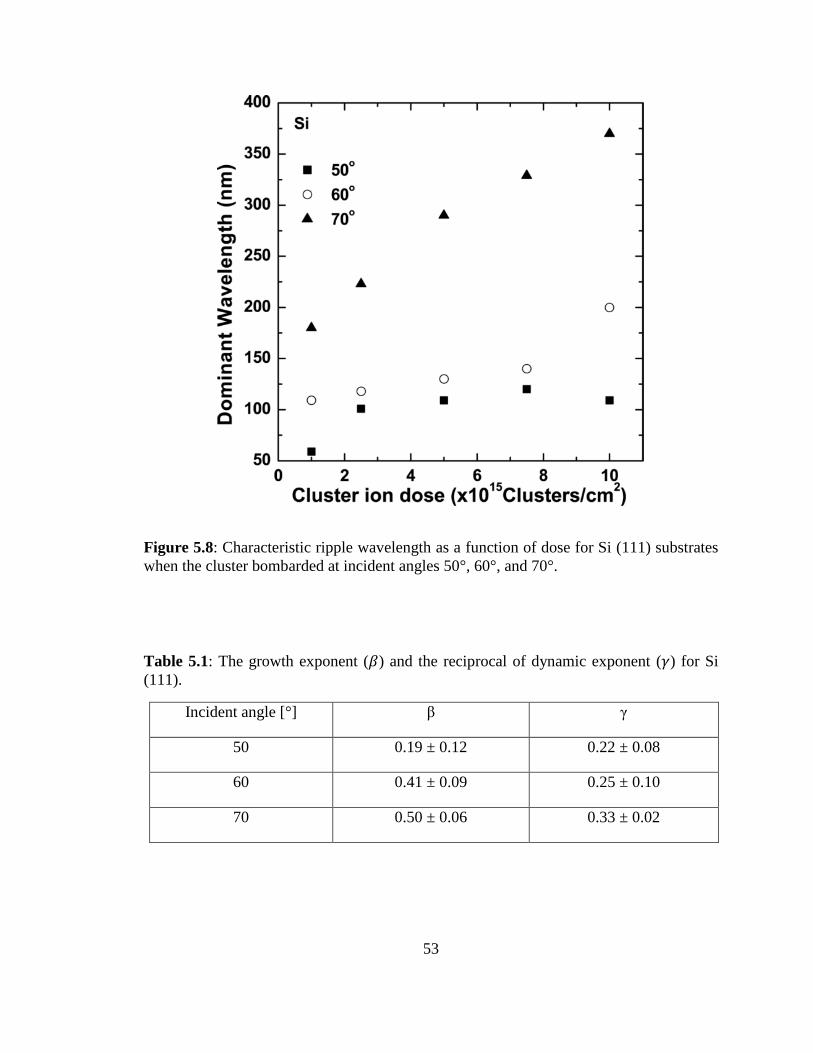
53
Figure 5.8: Characteristic ripple wavelength as a function of dose for Si (111) substrates
when the cluster bombarded at incident angles 50°, 60°, and 70°.
Table 5.1: The growth exponent ( ) and the reciprocal of dynamic exponent (𝛾) for Si
(111).
Incident angle [°] β γ
50 0.19 ± 0.12 0.22 ± 0.08
60 0.41 ± 0.09 0.25 ± 0.10
70 0.50 ± 0.06 0.33 ± 0.02
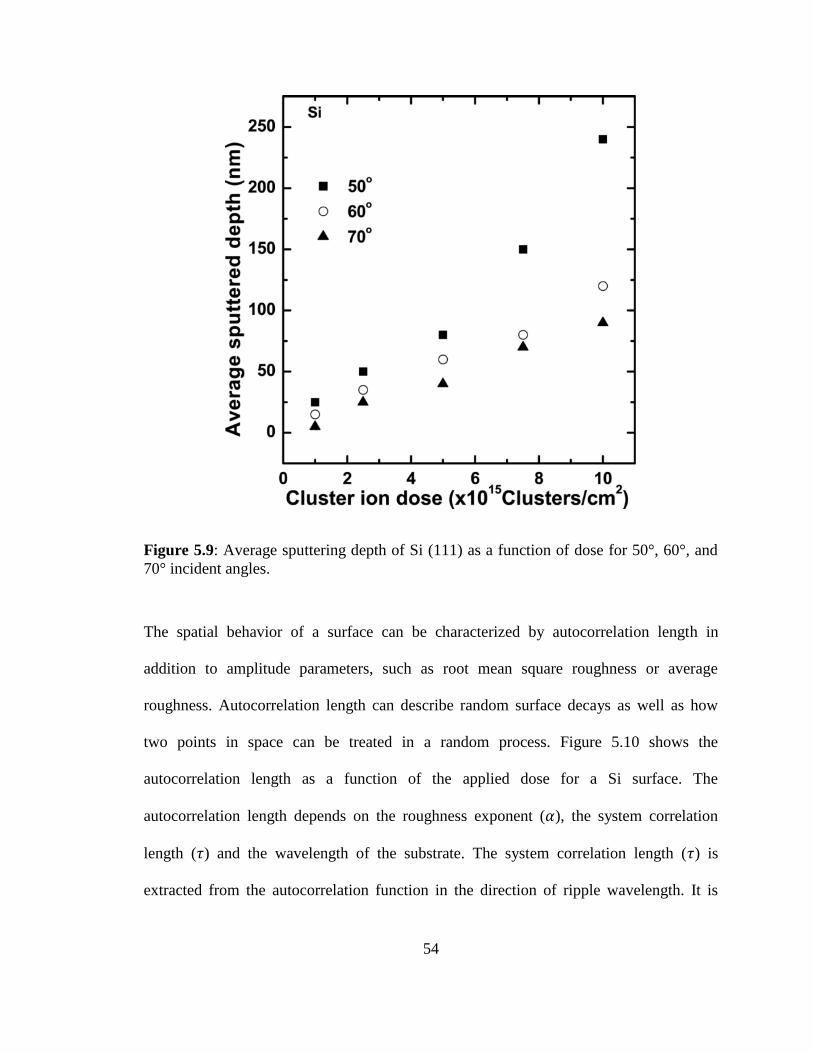
54
Figure 5.9: Average sputtering depth of Si (111) as a function of dose for 50°, 60°, and
70° incident angles.
The spatial behavior of a surface can be characterized by autocorrelation length in
addition to amplitude parameters, such as root mean square roughness or average
roughness. Autocorrelation length can describe random surface decays as well as how
two points in space can be treated in a random process. Figure 5.10 shows the
autocorrelation length as a function of the applied dose for a Si surface. The
autocorrelation length depends on the roughness exponent ( ), the system correlation
length ( ) and the wavelength of the substrate. The system correlation length ( ) is
extracted from the autocorrelation function in the direction of ripple wavelength. It is
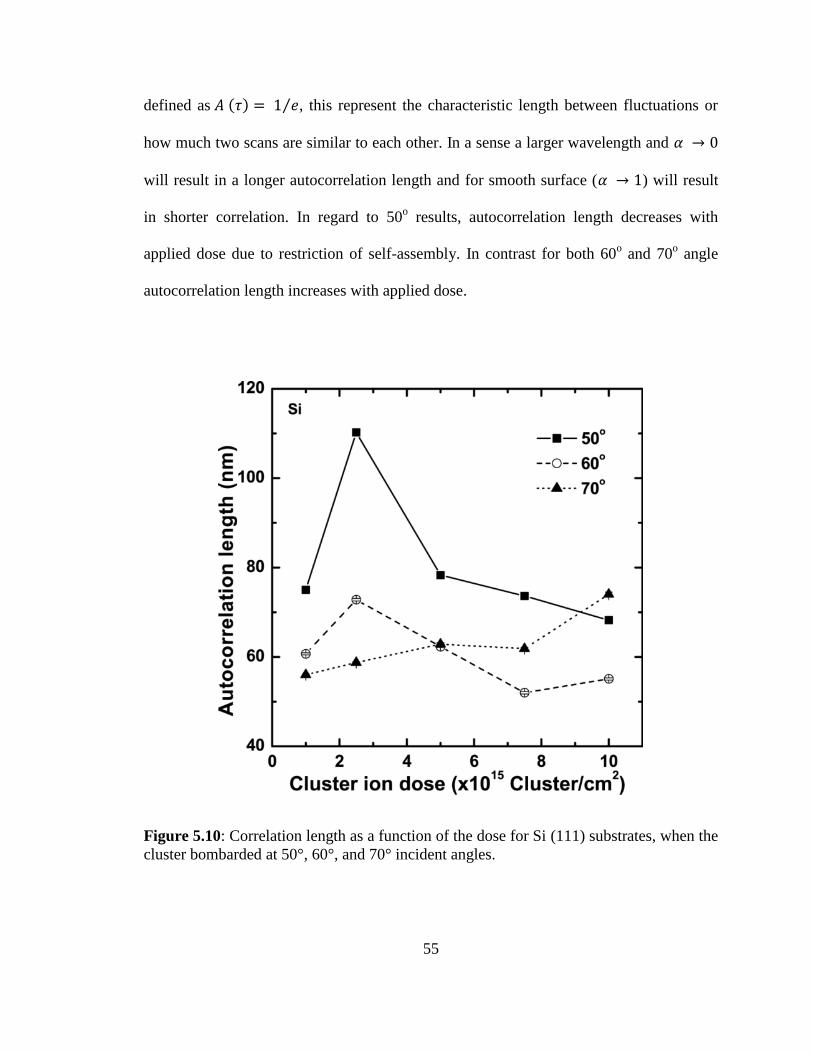
55
defined as ( ) = 1 ⁄ , this represent the characteristic length between fluctuations or
how much two scans are similar to each other. In a sense a larger wavelength and
will result in a longer autocorrelation length and for smooth surface ( 1) will result
in shorter correlation. In regard to 50o results, autocorrelation length decreases with
applied dose due to restriction of self-assembly. In contrast for both 60o and 70
o angle
autocorrelation length increases with applied dose.
Figure 5.10: Correlation length as a function of the dose for Si (111) substrates, when the
cluster bombarded at 50°, 60°, and 70° incident angles.
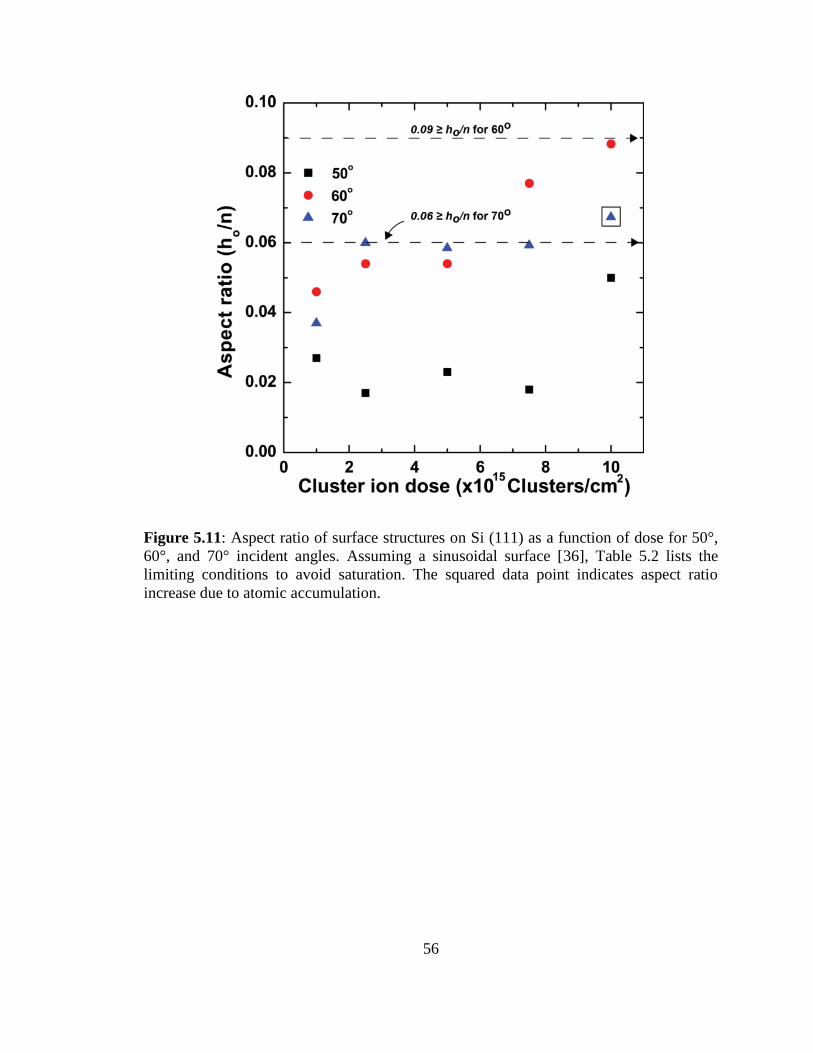
56
Figure 5.11: Aspect ratio of surface structures on Si (111) as a function of dose for 50°,
60°, and 70° incident angles. Assuming a sinusoidal surface [36], Table 5.2 lists the
limiting conditions to avoid saturation. The squared data point indicates aspect ratio
increase due to atomic accumulation.
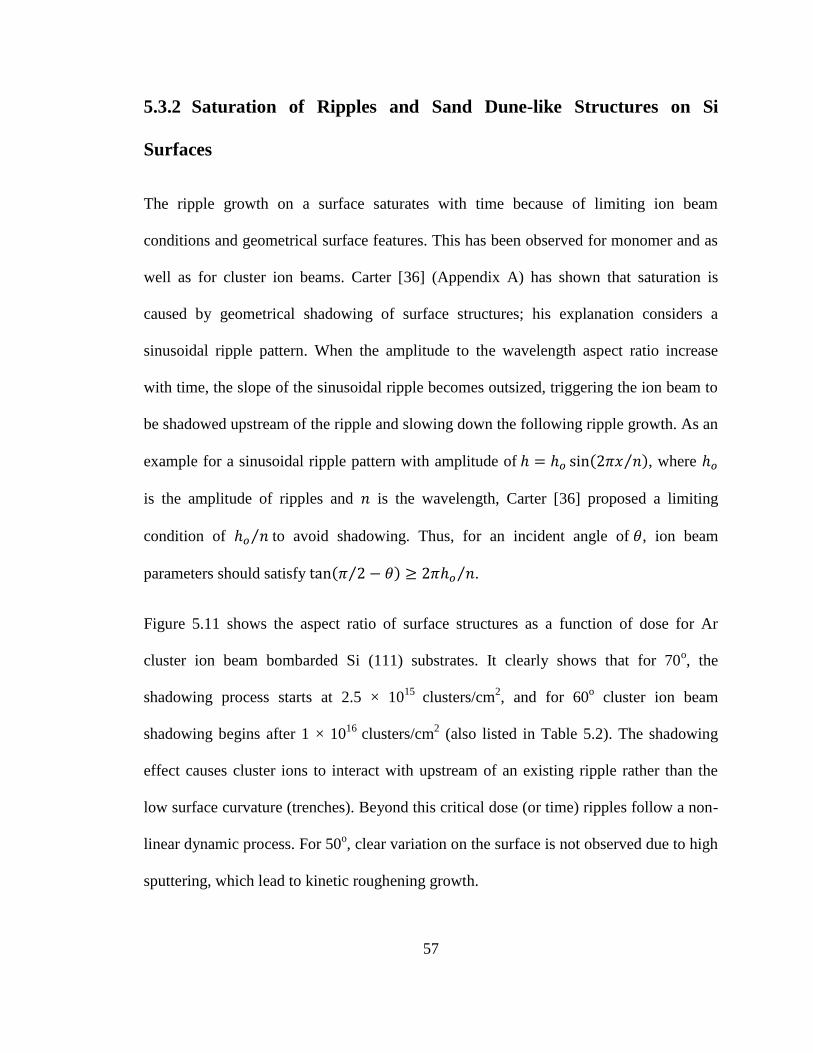
57
5.3.2 Saturation of Ripples and Sand Dune-like Structures on Si
Surfaces
The ripple growth on a surface saturates with time because of limiting ion beam
conditions and geometrical surface features. This has been observed for monomer and as
well as for cluster ion beams. Carter [36] (Appendix A) has shown that saturation is
caused by geometrical shadowing of surface structures; his explanation considers a
sinusoidal ripple pattern. When the amplitude to the wavelength aspect ratio increase
with time, the slope of the sinusoidal ripple becomes outsized, triggering the ion beam to
be shadowed upstream of the ripple and slowing down the following ripple growth. As an
example for a sinusoidal ripple pattern with amplitude of = (2 ⁄ ), where
is the amplitude of ripples and is the wavelength, Carter [36] proposed a limiting
condition of ⁄ to avoid shadowing. Thus, for an incident angle of , ion beam
parameters should satisfy ( 2⁄ − ) 2 ⁄ .
Figure 5.11 shows the aspect ratio of surface structures as a function of dose for Ar
cluster ion beam bombarded Si (111) substrates. It clearly shows that for 70o, the
shadowing process starts at 2.5 × 10¹⁵
clusters/cm2, and for 60
o cluster ion beam
shadowing begins after 1 × 10¹⁶
clusters/cm2 (also listed in Table 5.2). The shadowing
effect causes cluster ions to interact with upstream of an existing ripple rather than the
low surface curvature (trenches). Beyond this critical dose (or time) ripples follow a non-
linear dynamic process. For 50o, clear variation on the surface is not observed due to high
sputtering, which lead to kinetic roughening growth.
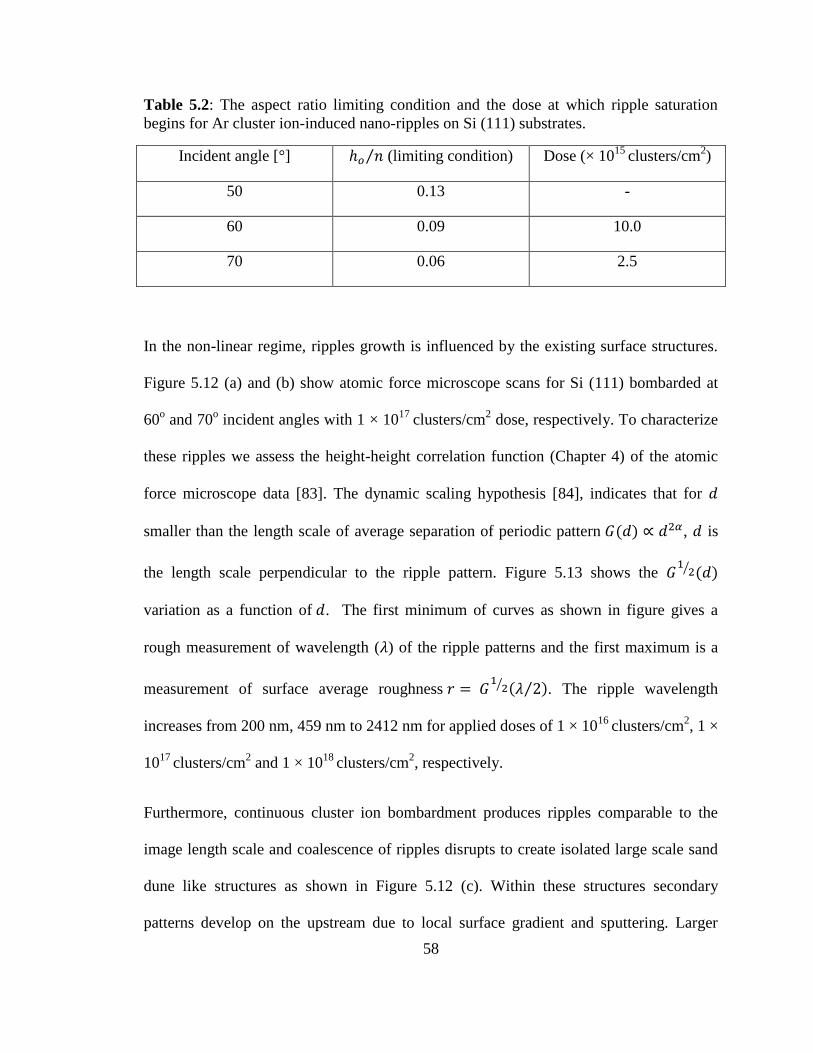
58
Table 5.2: The aspect ratio limiting condition and the dose at which ripple saturation
begins for Ar cluster ion-induced nano-ripples on Si (111) substrates.
Incident angle [°] ⁄ (limiting condition) Dose (× 1015
clusters/cm2)
50 0.13 -
60 0.09 10.0
70 0.06 2.5
In the non-linear regime, ripples growth is influenced by the existing surface structures.
Figure 5.12 (a) and (b) show atomic force microscope scans for Si (111) bombarded at
60o and 70
o incident angles with 1 × 10
17 clusters/cm
2 dose, respectively. To characterize
these ripples we assess the height-height correlation function (Chapter 4) of the atomic
force microscope data [83]. The dynamic scaling hypothesis [84], indicates that for 𝑑
smaller than the length scale of average separation of periodic pattern (𝑑) 𝑑 , 𝑑 is
the length scale perpendicular to the ripple pattern. Figure 5.13 shows the
⁄ (𝑑)
variation as a function of 𝑑. The first minimum of curves as shown in figure gives a
rough measurement of wavelength ( ) of the ripple patterns and the first maximum is a
measurement of surface average roughness =
⁄ ( 2⁄ ). The ripple wavelength
increases from 200 nm, 459 nm to 2412 nm for applied doses of 1 × 10¹⁶
clusters/cm2, 1 ×
1017
clusters/cm2 and 1 × 10
18 clusters/cm
2, respectively.
Furthermore, continuous cluster ion bombardment produces ripples comparable to the
image length scale and coalescence of ripples disrupts to create isolated large scale sand
dune like structures as shown in Figure 5.12 (c). Within these structures secondary
patterns develop on the upstream due to local surface gradient and sputtering. Larger
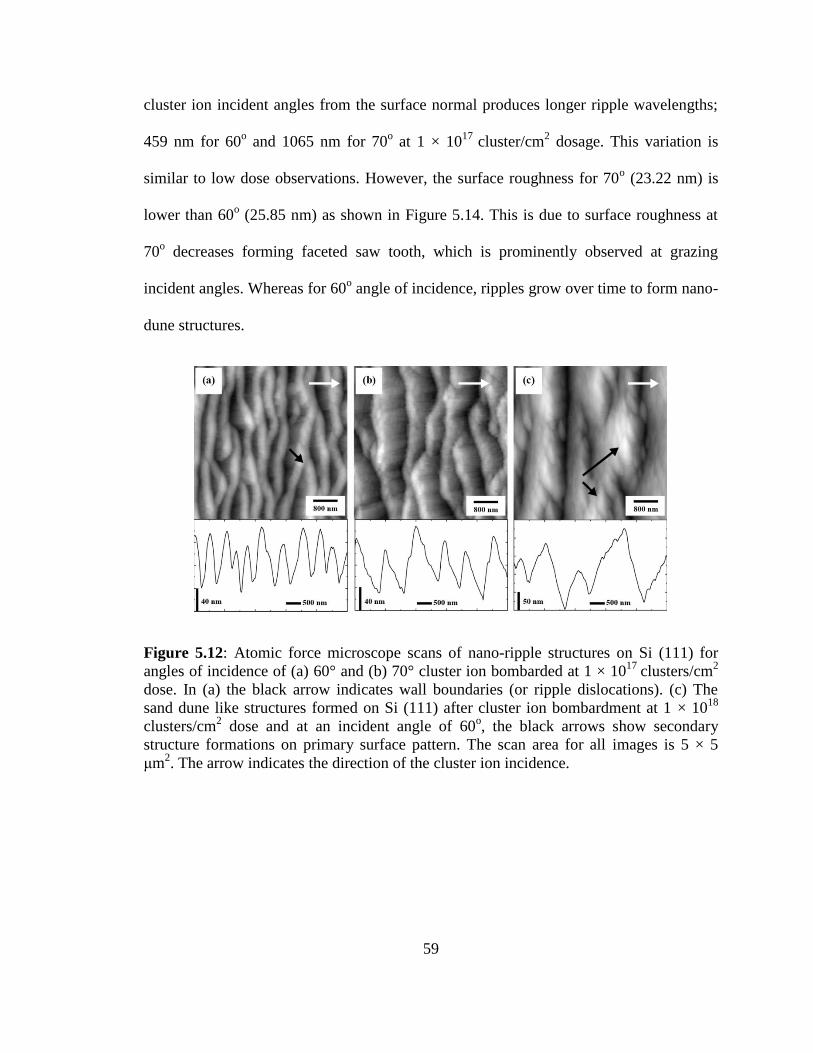
59
cluster ion incident angles from the surface normal produces longer ripple wavelengths;
459 nm for 60o and 1065 nm for 70
o at 1 × 10
17 cluster/cm
2 dosage. This variation is
similar to low dose observations. However, the surface roughness for 70o (23.22 nm) is
lower than 60o (25.85 nm) as shown in Figure 5.14. This is due to surface roughness at
70o decreases forming faceted saw tooth, which is prominently observed at grazing
incident angles. Whereas for 60o angle of incidence, ripples grow over time to form nano-
dune structures.
Figure 5.12: Atomic force microscope scans of nano-ripple structures on Si (111) for
angles of incidence of (a) 60° and (b) 70° cluster ion bombarded at 1 × 10¹⁷
clusters/cm2
dose. In (a) the black arrow indicates wall boundaries (or ripple dislocations). (c) The
sand dune like structures formed on Si (111) after cluster ion bombardment at 1 × 10¹⁸
clusters/cm2 dose and at an incident angle of 60
o, the black arrows show secondary
structure formations on primary surface pattern. The scan area for all images is 5 × 5
μm2. The arrow indicates the direction of the cluster ion incidence.
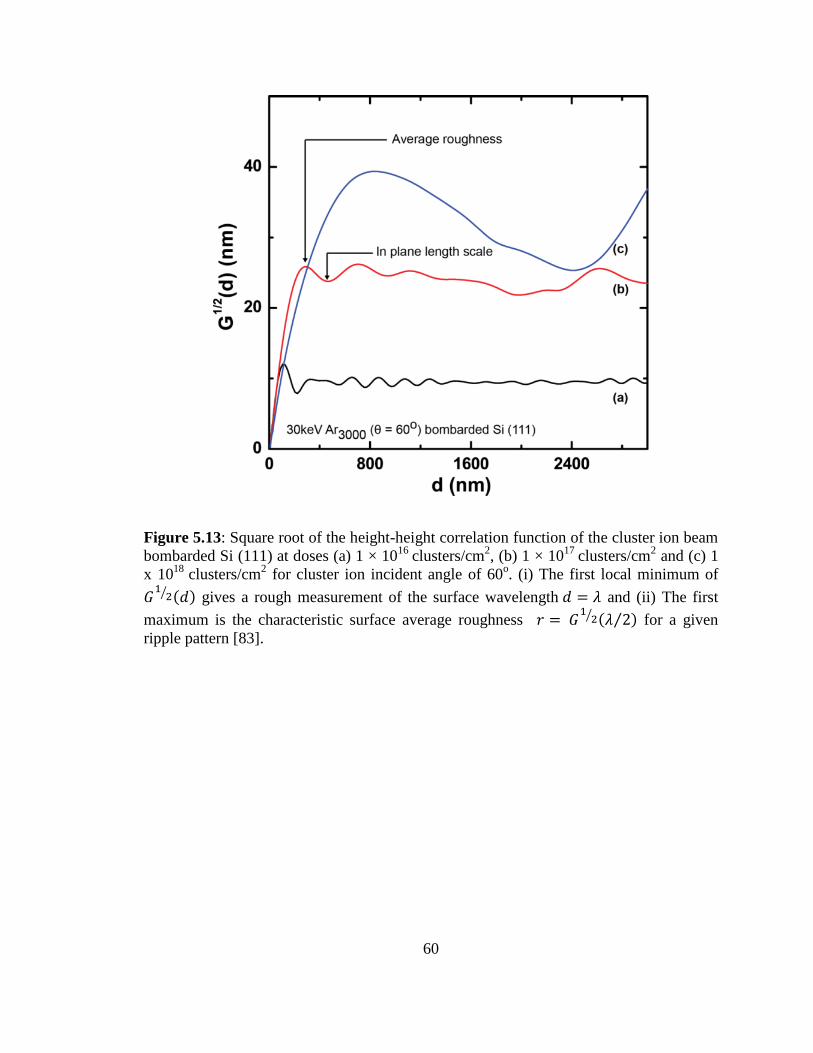
60
Figure 5.13: Square root of the height-height correlation function of the cluster ion beam
bombarded Si (111) at doses (a) 1 × 10¹⁶
clusters/cm2, (b) 1 × 10
17 clusters/cm
2 and (c) 1
x 1018
clusters/cm2 for cluster ion incident angle of 60
o. (i) The first local minimum of
⁄ (𝑑) gives a rough measurement of the surface wavelength 𝑑 = and (ii) The first
maximum is the characteristic surface average roughness =
⁄ ( 2⁄ ) for a given
ripple pattern [83].
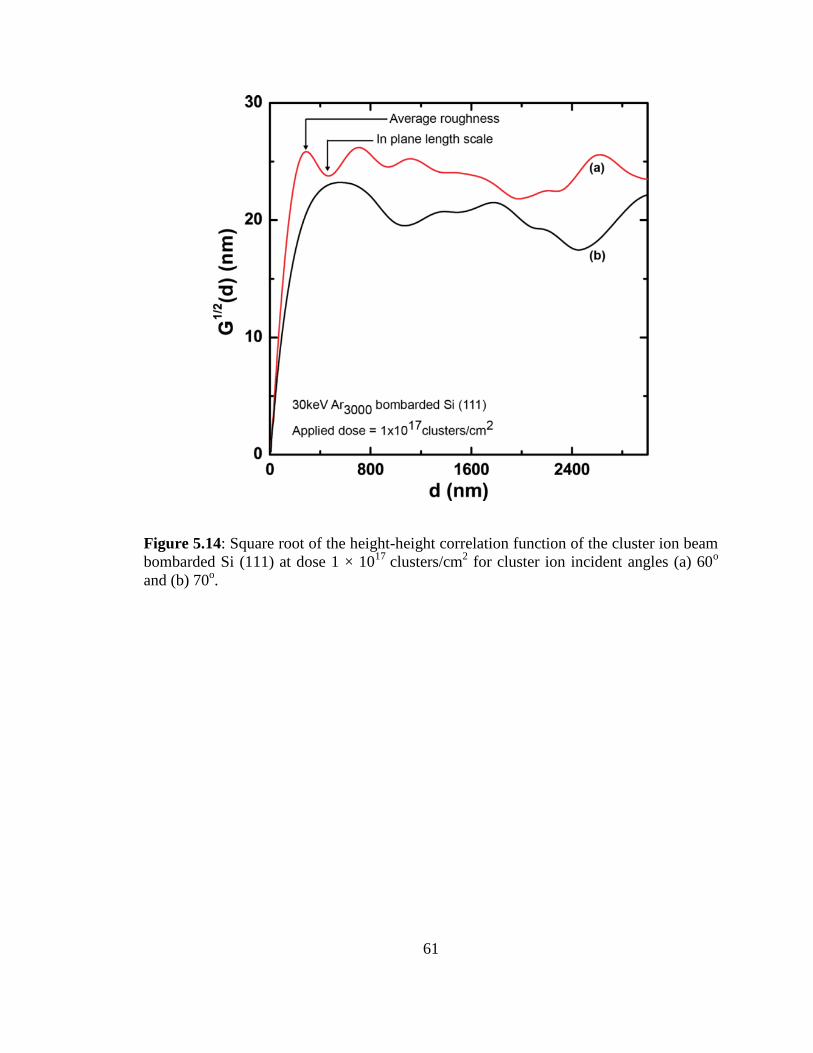
61
Figure 5.14: Square root of the height-height correlation function of the cluster ion beam
bombarded Si (111) at dose 1 × 10¹⁷
clusters/cm2 for cluster ion incident angles (a) 60
o
and (b) 70o.
62
Chapter 6
Morphological Evolution of Au Surfaces
during Ar Cluster Ion Beam
Bombardment
Evolution of Au surfaces during off-normal Ar3000
cluster ion beam bombardment is
investigated. Nano-pattern formation depends on cluster ion angle of incidence, energy,
and applied dosage. Cluster ion bombardment generates three surface processes: (1)
Continuous sputtering of atoms, (2) Re-deposition of sputtered atoms, and (3) Surface
diffusion. These processes provide a comprehensive explanation of cluster ion-induced
nano-ripples on Au surfaces. In this chapter, we will present our experimental results on
nano-ripple formation on Au surfaces and discuss a theoretical model on ripple
formation.
63
6.1 Experimental Details
Au thin films deposited on Si (100) substrates (purchased from Sigma-Aldrich) were used
in this experiment. Au orientation is technically polycrystalline with a preference to (111)
orientation. Au thin film is bonded onto the Si substrate by an interfacial Ti adhesive
layer. 0.5 × 0.5 cm2 samples were cleaned and mounted in to the Gas Cluster Ion Beam
(GCIB) system target chamber. Formation of Ar cluster ions by supersonic expansion is
described in Chapter 3. Samples were bombarded with Ar cluster ions, each cluster ion
carries about 3000 Ar atoms and the energy per atom was set to 10eV. Before the
experiment the GCIB target chamber, nozzle chamber, and ionization chamber were
vacuumed to 1 × 10⁻⁶
Torr, 4 × 10⁻⁸
Torr, and 1 × 10⁻⁸
Torr, respectively [1 Torr = 133.3
N/m2]. Usually, the required target chamber pressure can be achieved in about 16 hours
with the current experimental configuration.
Samples were mounted at tilt angles of 0o to 80
o in steps of 10
o; here the tilt angle is the
measured angle between the cluster ion beam direction and the sample holder. This angle
corresponds to the cluster ion beam incident angle measured from the target surface
normal. Each tilt sample was bombarded with 1 × 10¹⁶
clusters/cm2 cluster ion dose to
determine the maximum instability angle ( ). For Au we found that = 60o.
During the experiment the beam current density was kept at 1 μA/cm2 to prevent beam
heating. The applied dose was varied from 1 × 10¹⁵
to 3 × 10¹⁶
clusters/cm2 for incident
angles 50o, 60
o, and 70
o to determine the temporal evolution of nano-ripples on Au
surfaces. The cluster ion energy dependence of nano-ripple structures was determined by
comparing a 20 keV and 30 keV energy cluster ion beam at 50o incident angle for
64
variable cluster ion beam dose.
The thermal effect on nano-ripples formed on Au surface was investigated by a modified
sample stage and a target chamber, where temperature was varied from 220.3 K to 473.2
K for a constant angle (60o) and dose (3 × 10
16 clusters/cm
2).
Each sample was characterized by Atomic Force Microscopy (AFM) and Rutherford
Backscattering Spectroscopy (RBS) to determine the root mean square roughness,
wavelength, and Au thin film thicknesses after cluster ion bombardment. The Scanning
Electron Microscope (SEM) was used to scan large surface areas to observe defects
generated by contaminate particles.
6.2 Experimental Results and Discussion
6.2.1 Lateral Sputtering and Surface Smoothing Phenomena
Figure 6.1 (a) shows the AFM scan of the Au surface before Ar cluster ion beam
bombardment; this non-bombarded polycrystalline Au surface has a Root Mean Square
(RMS) roughness of 1.28 nm. Figure 6.1 (b) shows the AFM scan for the Au surface
bombarded with Ar cluster ion beam normal to the surface. The applied dose was 2 ×
1016
clusters/cm2 dose and the energy of the beam was 30 keV. When cluster ions deposit
normal to the surface, metallic, and semiconductor surfaces undergo smoothing processes
[17], i.e. cluster ions interact with mounds on the surface and sputtering atoms fills up
trenches [5]. The bombarded surface RMS roughness drops to 0.7 nm. Figure 5.1 (b) also
65
shows hillocks formed due to random accumulations and generation of spikes. Normal
incident cluster ion collisions generate spike regions [87] that experience high pressure
and high temperature transitions. In these regions the pressure can be in the order of 100
N/m2 and temperature can rise up to 10
4 or 10
5 K [14] and produce large amounts of
mobile target atoms. Figure 6.2 shows a schematic diagram of cluster ion beam
bombardment at normal incidence. Mobile atoms sputter parallel to the surface “Lateral
Sputtering” due to Ar atoms gaining lateral velocity components created by internal
cascade collisions within a cluster [41]. To produce significant surface damage, the
energy per atom should be greater than 2 eV [88]. These energies shock waves form and
surface atoms sputter outward from a collision site.
Figure 6.3 shows random composite RBS spectra for random composite RBS spectra for
the non-bombarded and Ar cluster ion beam bombarded at normal incidence for Au
surfaces. The primary estimation of the Au film thickness for the non-bombarded sample
is 93.8 ± 1.4 nm. Surface thickness reduces to 26.6 ± 1.4 nm when bombarded with 2 ×
1016
clusters/cm2 dose cluster ions normal to the surface. This large difference is
attributed to lateral sputtering of the surface. Figure 6.4 illustrates amounts of layers
removed due to sputtering, which is calculated by the difference between non-bombarded
and bombarded surfaces. The sputtering is linear with applied dose and the amount of Au
atoms sputtered per cluster ion is 21 atoms per cluster. The calculation was done
assuming bulk density of Au as 5.9040 × 10²²
atoms/cm3. In comparison, a monomer ion
beam of Ar+ at 30 keV energy sputters 11 Au atoms per ion (calculated by SRIM 2012
software [89]).
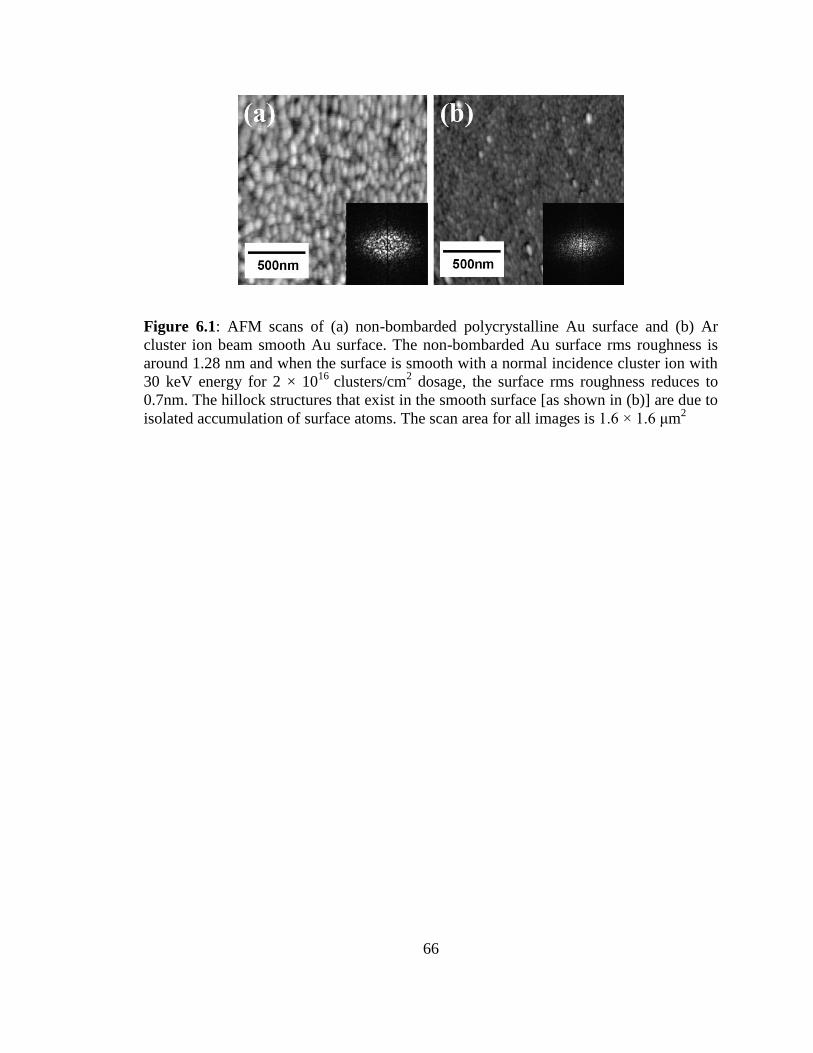
66
Figure 6.1: AFM scans of (a) non-bombarded polycrystalline Au surface and (b) Ar
cluster ion beam smooth Au surface. The non-bombarded Au surface rms roughness is
around 1.28 nm and when the surface is smooth with a normal incidence cluster ion with
30 keV energy for 2 × 10¹⁶
clusters/cm2 dosage, the surface rms roughness reduces to
0.7nm. The hillock structures that exist in the smooth surface [as shown in (b)] are due to
isolated accumulation of surface atoms. The scan area for all images is 1.6 × 1.6 μm2
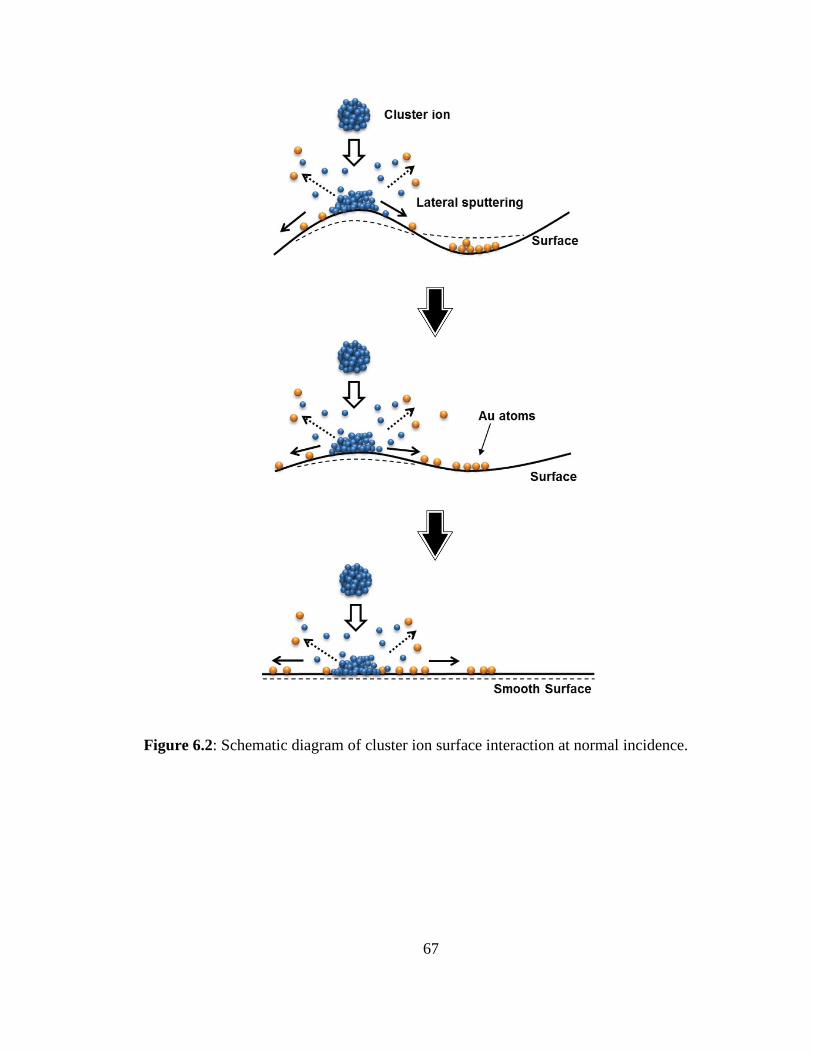
67
Figure 6.2: Schematic diagram of cluster ion surface interaction at normal incidence.
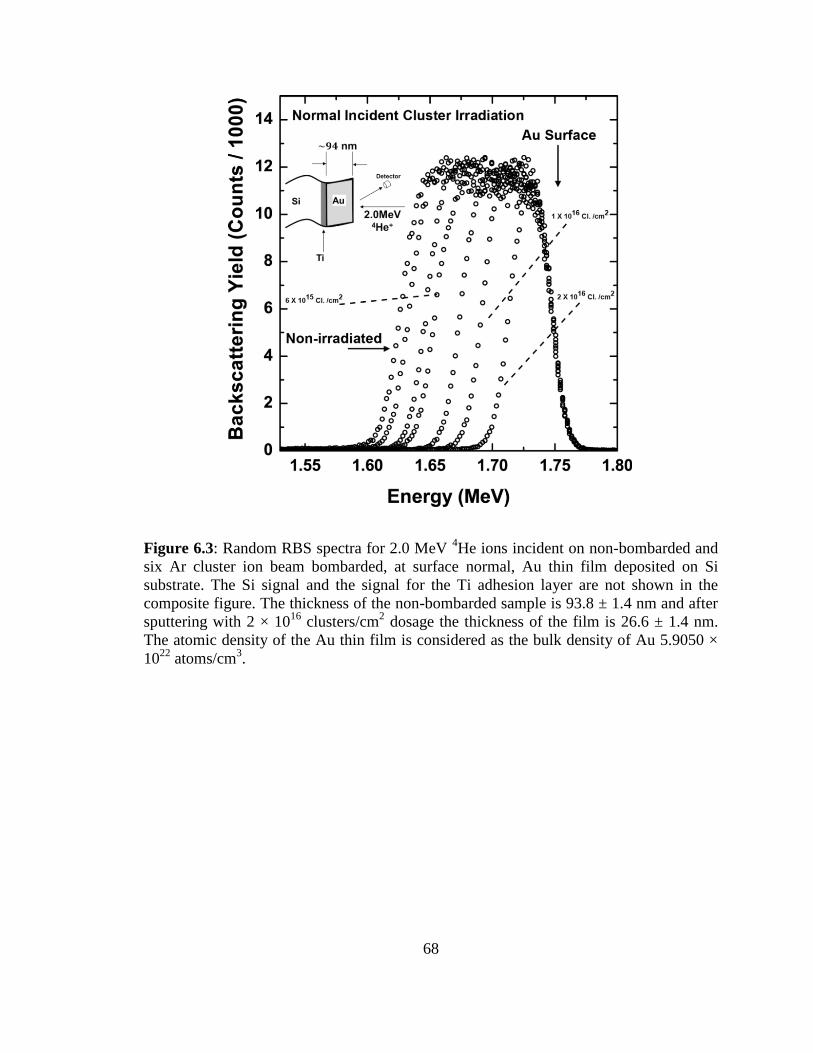
68
Figure 6.3: Random RBS spectra for 2.0 MeV 4He ions incident on non-bombarded and
six Ar cluster ion beam bombarded, at surface normal, Au thin film deposited on Si
substrate. The Si signal and the signal for the Ti adhesion layer are not shown in the
composite figure. The thickness of the non-bombarded sample is 93.8 ± 1.4 nm and after
sputtering with 2 × 10¹⁶
clusters/cm2 dosage the thickness of the film is 26.6 ± 1.4 nm.
The atomic density of the Au thin film is considered as the bulk density of Au 5.9050 ×
1022
atoms/cm3.
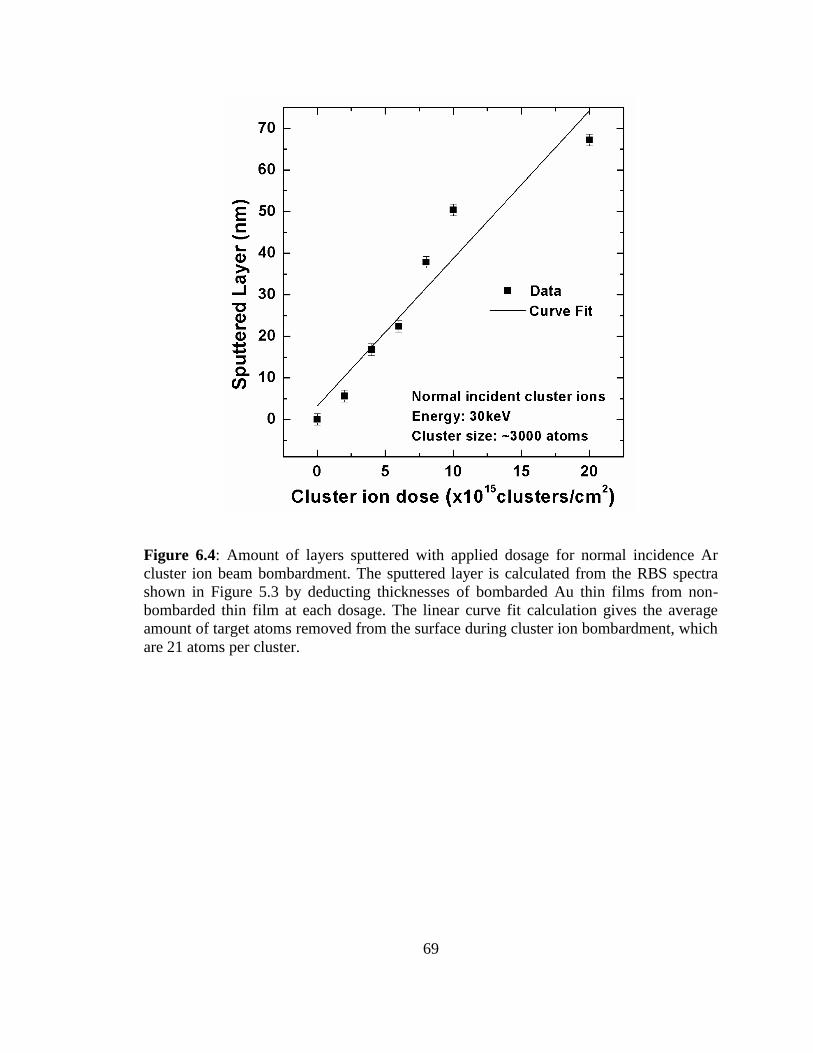
69
Figure 6.4: Amount of layers sputtered with applied dosage for normal incidence Ar
cluster ion beam bombardment. The sputtered layer is calculated from the RBS spectra
shown in Figure 5.3 by deducting thicknesses of bombarded Au thin films from non-
bombarded thin film at each dosage. The linear curve fit calculation gives the average
amount of target atoms removed from the surface during cluster ion bombardment, which
are 21 atoms per cluster.
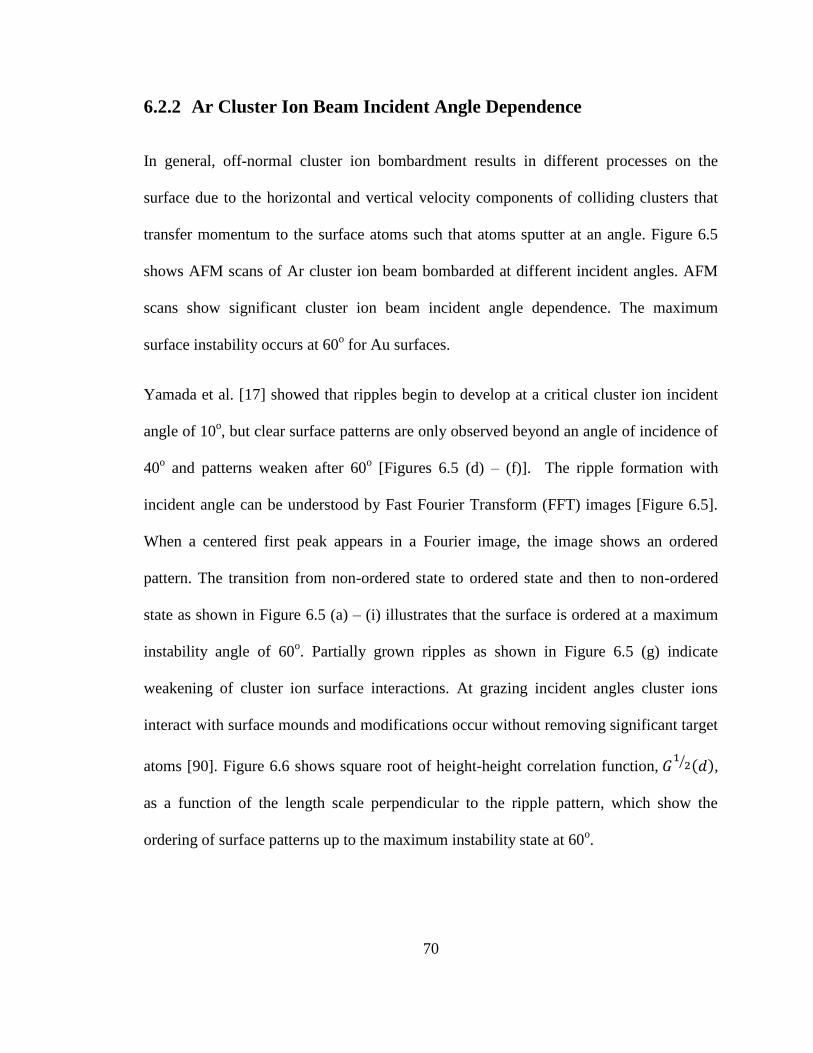
70
6.2.2 Ar Cluster Ion Beam Incident Angle Dependence
In general, off-normal cluster ion bombardment results in different processes on the
surface due to the horizontal and vertical velocity components of colliding clusters that
transfer momentum to the surface atoms such that atoms sputter at an angle. Figure 6.5
shows AFM scans of Ar cluster ion beam bombarded at different incident angles. AFM
scans show significant cluster ion beam incident angle dependence. The maximum
surface instability occurs at 60o for Au surfaces.
Yamada et al. [17] showed that ripples begin to develop at a critical cluster ion incident
angle of 10o, but clear surface patterns are only observed beyond an angle of incidence of
40o and patterns weaken after 60
o [Figures 6.5 (d) – (f)]. The ripple formation with
incident angle can be understood by Fast Fourier Transform (FFT) images [Figure 6.5].
When a centered first peak appears in a Fourier image, the image shows an ordered
pattern. The transition from non-ordered state to ordered state and then to non-ordered
state as shown in Figure 6.5 (a) – (i) illustrates that the surface is ordered at a maximum
instability angle of 60o. Partially grown ripples as shown in Figure 6.5 (g) indicate
weakening of cluster ion surface interactions. At grazing incident angles cluster ions
interact with surface mounds and modifications occur without removing significant target
atoms [90]. Figure 6.6 shows square root of height-height correlation function,
⁄ (𝑑),
as a function of the length scale perpendicular to the ripple pattern, which show the
ordering of surface patterns up to the maximum instability state at 60o.
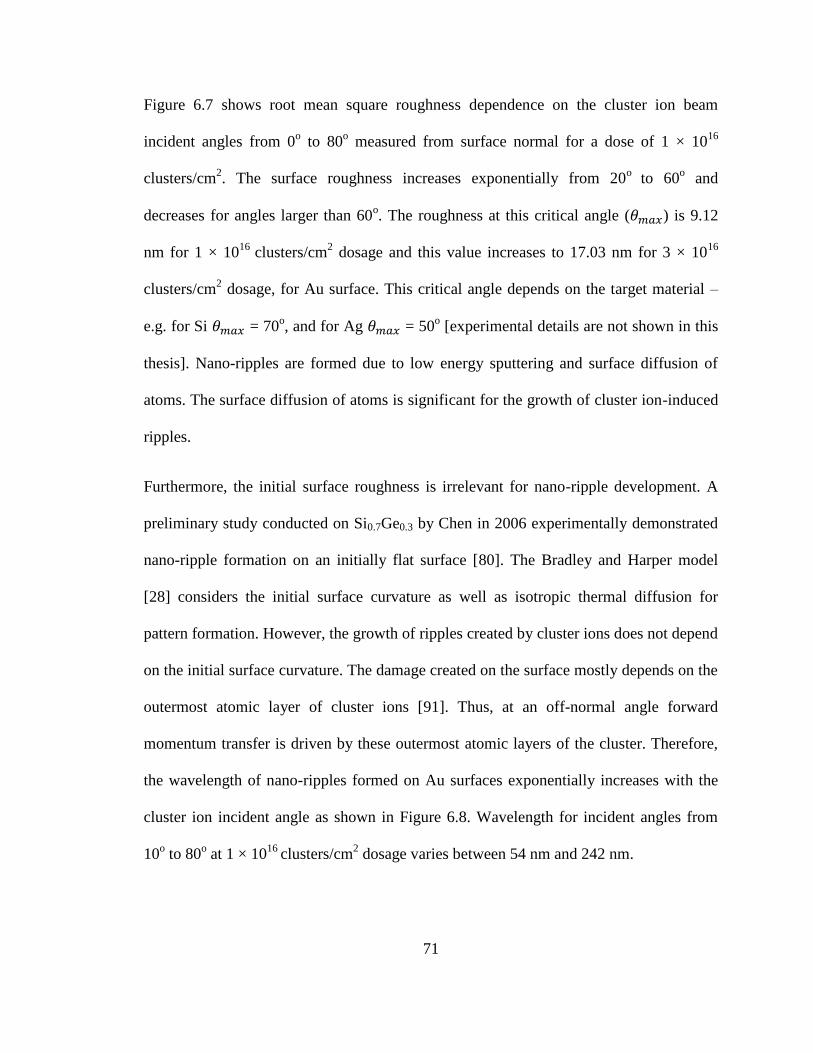
71
Figure 6.7 shows root mean square roughness dependence on the cluster ion beam
incident angles from 0o to 80
o measured from surface normal for a dose of 1 × 10
16
clusters/cm2. The surface roughness increases exponentially from 20
o to 60
o and
decreases for angles larger than 60o. The roughness at this critical angle ( ) is 9.12
nm for 1 × 10¹⁶
clusters/cm2 dosage and this value increases to 17.03 nm for 3 × 10
16
clusters/cm2 dosage, for Au surface. This critical angle depends on the target material –
e.g. for Si = 70o, and for Ag = 50
o [experimental details are not shown in this
thesis]. Nano-ripples are formed due to low energy sputtering and surface diffusion of
atoms. The surface diffusion of atoms is significant for the growth of cluster ion-induced
ripples.
Furthermore, the initial surface roughness is irrelevant for nano-ripple development. A
preliminary study conducted on Si0.7Ge0.3 by Chen in 2006 experimentally demonstrated
nano-ripple formation on an initially flat surface [80]. The Bradley and Harper model
[28] considers the initial surface curvature as well as isotropic thermal diffusion for
pattern formation. However, the growth of ripples created by cluster ions does not depend
on the initial surface curvature. The damage created on the surface mostly depends on the
outermost atomic layer of cluster ions [91]. Thus, at an off-normal angle forward
momentum transfer is driven by these outermost atomic layers of the cluster. Therefore,
the wavelength of nano-ripples formed on Au surfaces exponentially increases with the
cluster ion incident angle as shown in Figure 6.8. Wavelength for incident angles from
10o to 80
o at 1 × 10
16 clusters/cm
2 dosage varies between 54 nm and 242 nm.
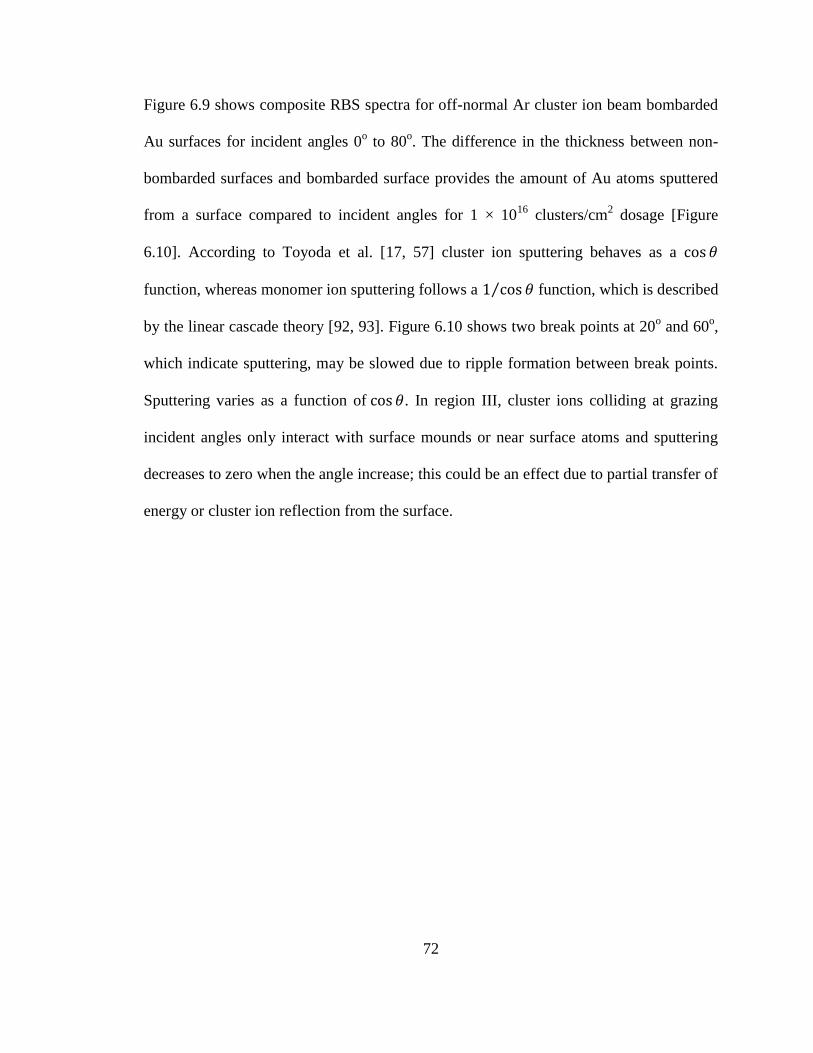
72
Figure 6.9 shows composite RBS spectra for off-normal Ar cluster ion beam bombarded
Au surfaces for incident angles 0o to 80
o. The difference in the thickness between non-
bombarded surfaces and bombarded surface provides the amount of Au atoms sputtered
from a surface compared to incident angles for 1 × 10¹⁶
clusters/cm2 dosage [Figure
6.10]. According to Toyoda et al. [17, 57] cluster ion sputtering behaves as a
function, whereas monomer ion sputtering follows a 1 ⁄ function, which is described
by the linear cascade theory [92, 93]. Figure 6.10 shows two break points at 20o and 60
o,
which indicate sputtering, may be slowed due to ripple formation between break points.
Sputtering varies as a function of . In region III, cluster ions colliding at grazing
incident angles only interact with surface mounds or near surface atoms and sputtering
decreases to zero when the angle increase; this could be an effect due to partial transfer of
energy or cluster ion reflection from the surface.
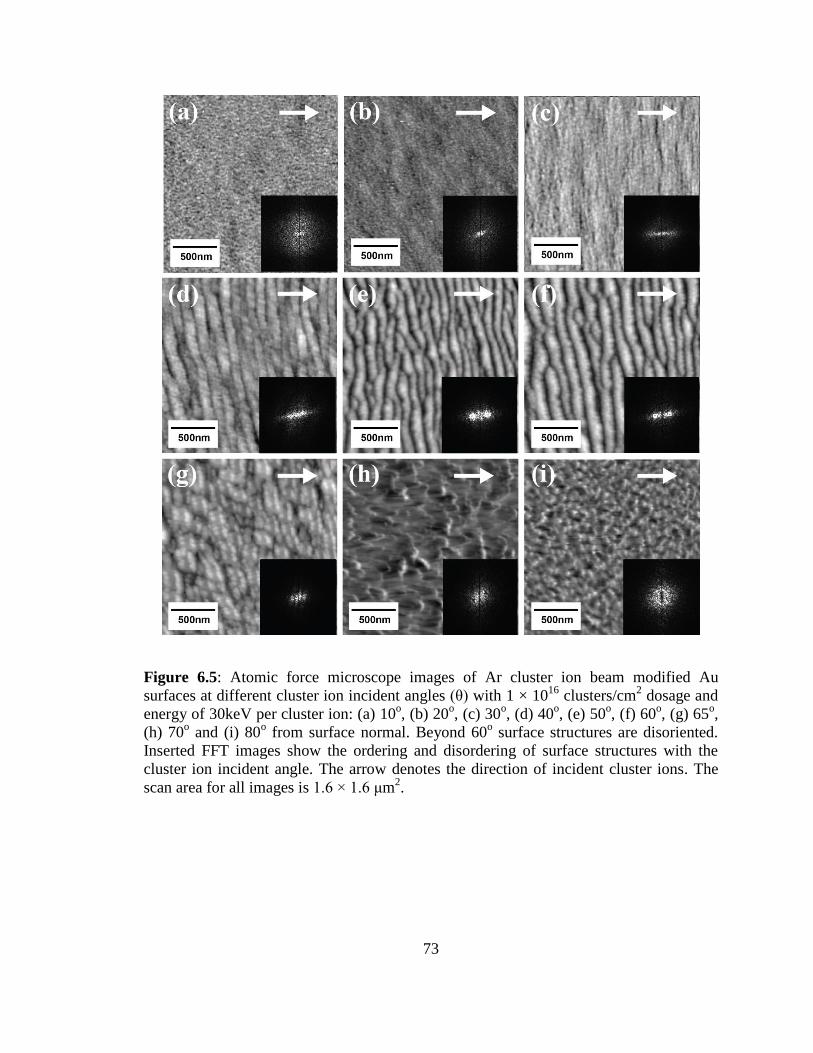
73
Figure 6.5: Atomic force microscope images of Ar cluster ion beam modified Au
surfaces at different cluster ion incident angles (θ) with 1 × 10¹⁶
clusters/cm2 dosage and
energy of 30keV per cluster ion: (a) 10o, (b) 20
o, (c) 30
o, (d) 40
o, (e) 50
o, (f) 60
o, (g) 65
o,
(h) 70o and (i) 80
o from surface normal. Beyond 60
o surface structures are disoriented.
Inserted FFT images show the ordering and disordering of surface structures with the
cluster ion incident angle. The arrow denotes the direction of incident cluster ions. The
scan area for all images is 1.6 × 1.6 μm2.
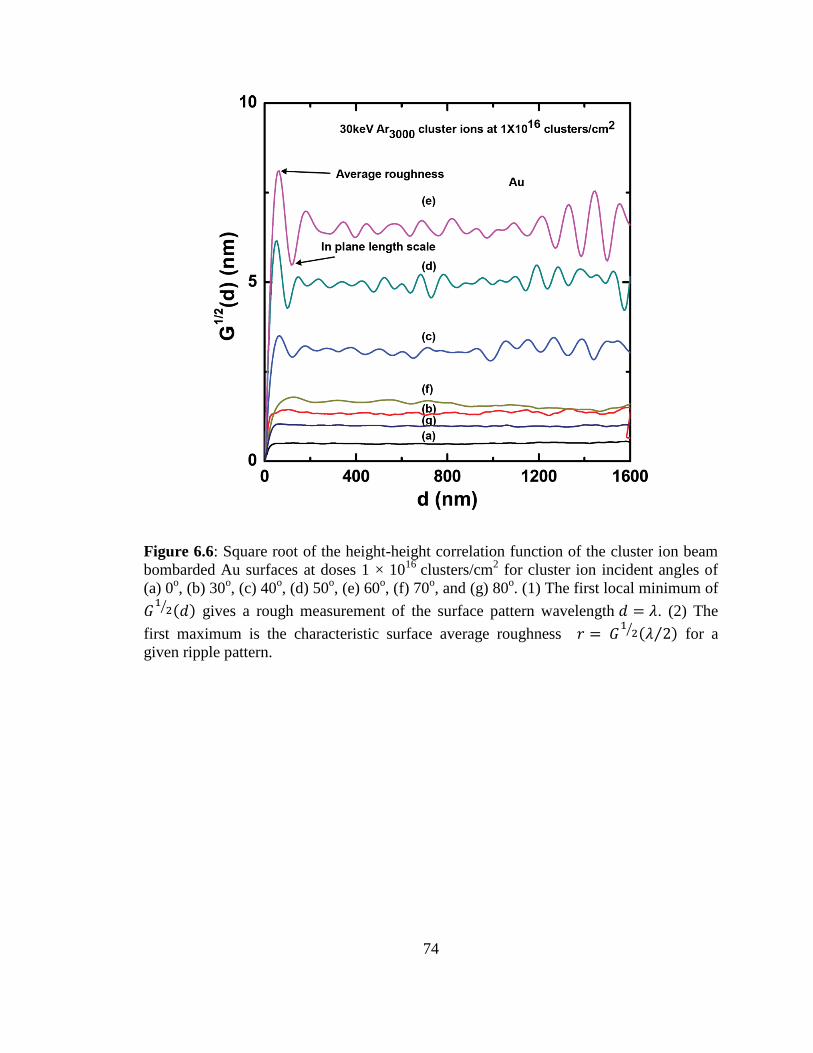
74
Figure 6.6: Square root of the height-height correlation function of the cluster ion beam
bombarded Au surfaces at doses 1 × 10¹⁶
clusters/cm2 for cluster ion incident angles of
(a) 0o, (b) 30
o, (c) 40
o, (d) 50
o, (e) 60
o, (f) 70
o, and (g) 80
o. (1) The first local minimum of
⁄ (𝑑) gives a rough measurement of the surface pattern wavelength 𝑑 = . (2) The
first maximum is the characteristic surface average roughness =
⁄ ( 2⁄ ) for a
given ripple pattern.
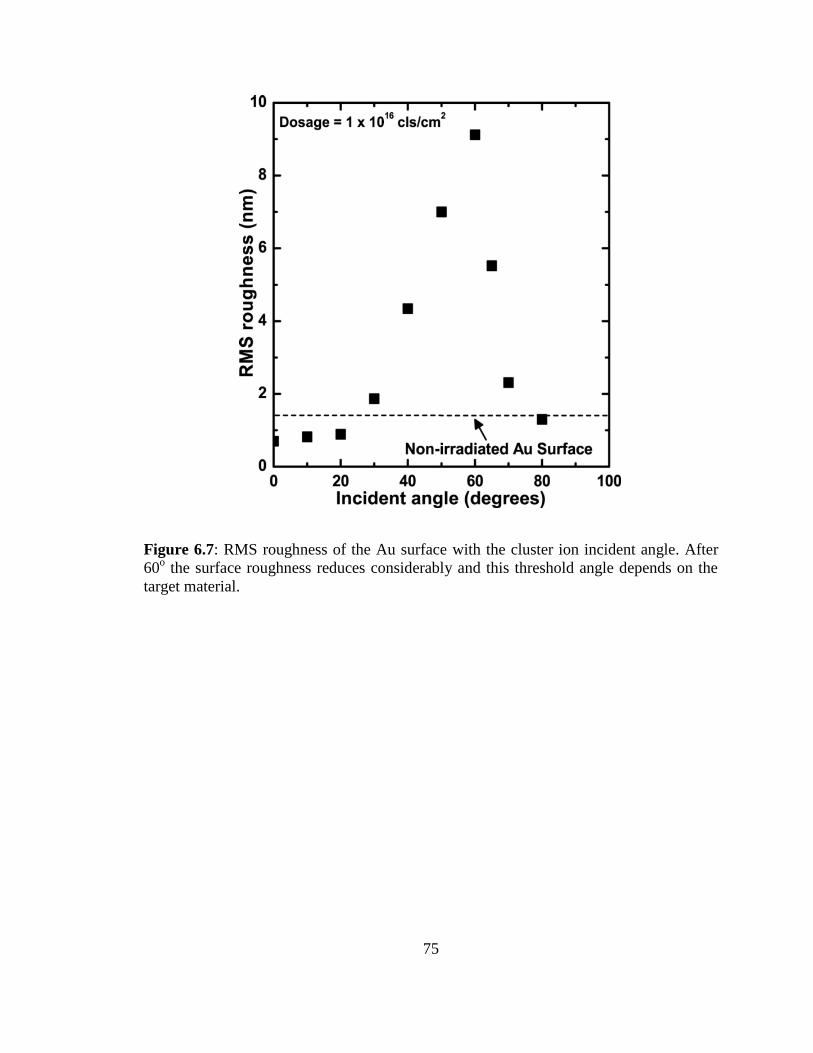
75
Figure 6.7: RMS roughness of the Au surface with the cluster ion incident angle. After
60o the surface roughness reduces considerably and this threshold angle depends on the
target material.
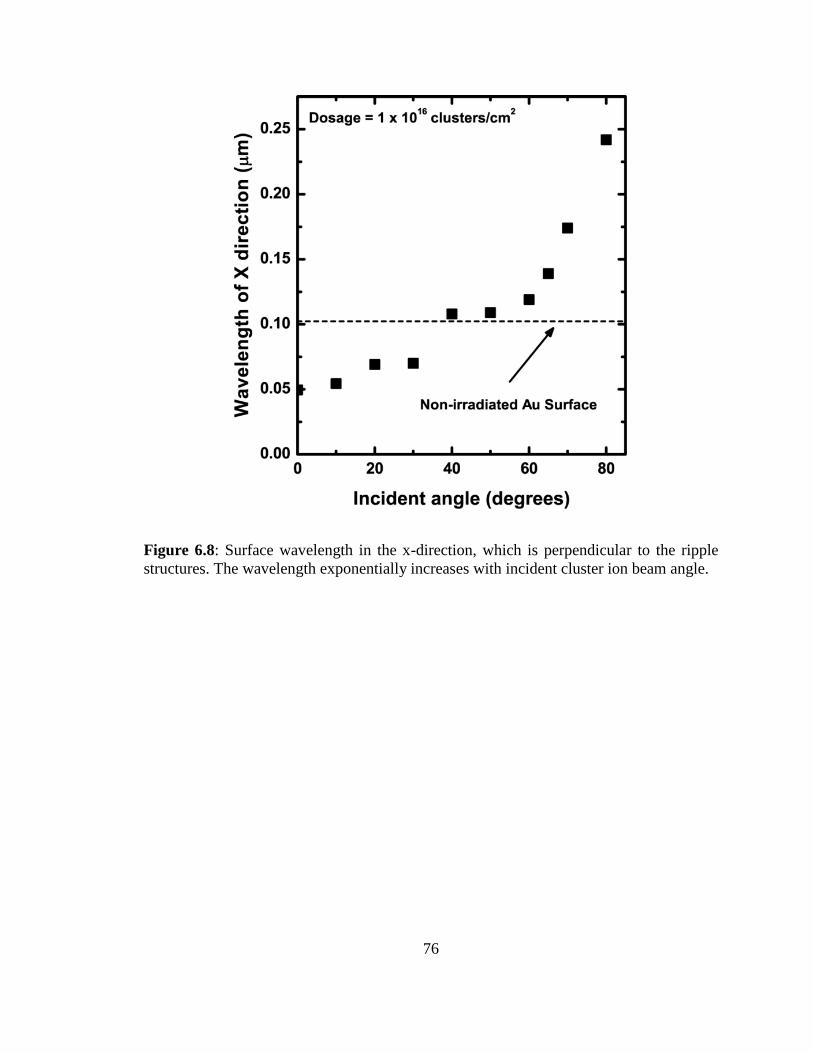
76
Figure 6.8: Surface wavelength in the x-direction, which is perpendicular to the ripple
structures. The wavelength exponentially increases with incident cluster ion beam angle.
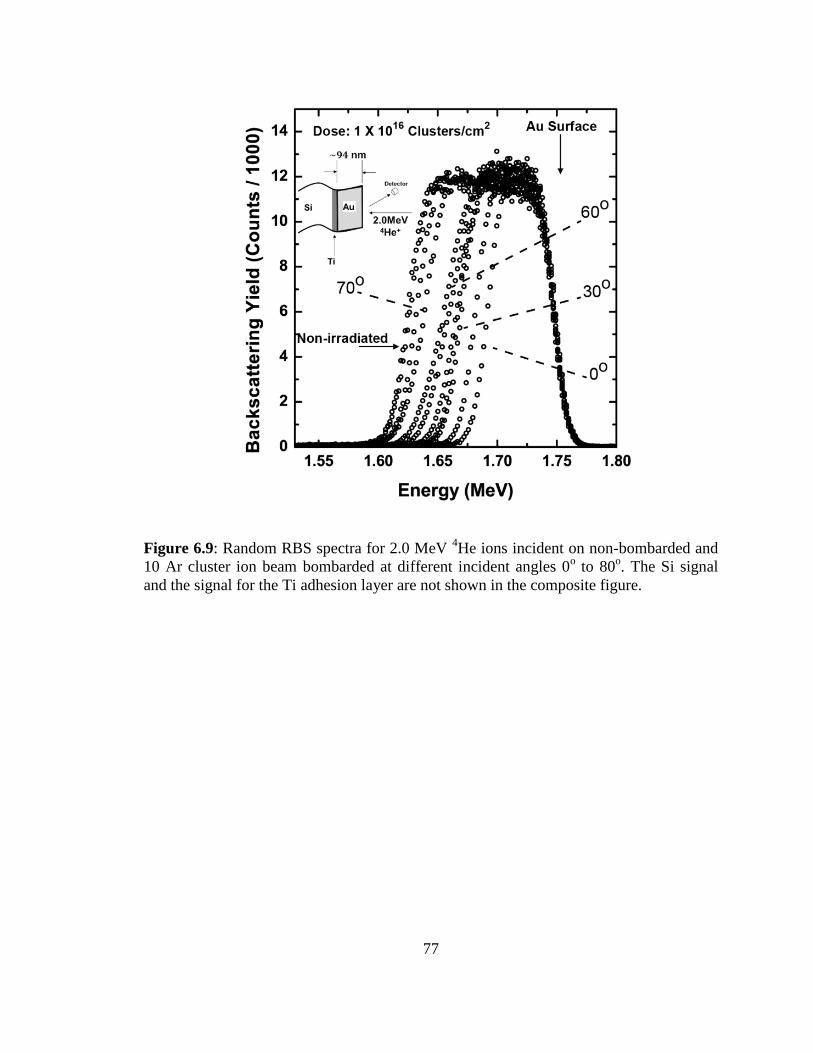
77
Figure 6.9: Random RBS spectra for 2.0 MeV 4He ions incident on non-bombarded and
10 Ar cluster ion beam bombarded at different incident angles 0o to 80
o. The Si signal
and the signal for the Ti adhesion layer are not shown in the composite figure.
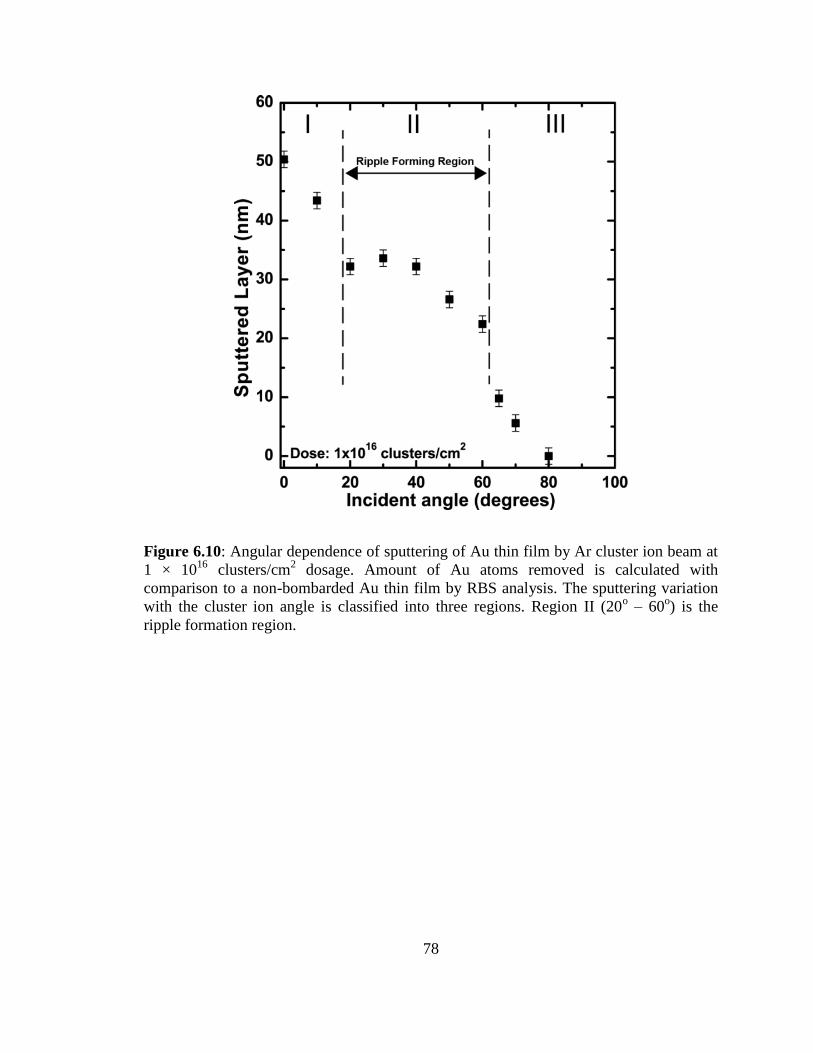
78
Figure 6.10: Angular dependence of sputtering of Au thin film by Ar cluster ion beam at
1 × 10¹⁶
clusters/cm2 dosage. Amount of Au atoms removed is calculated with
comparison to a non-bombarded Au thin film by RBS analysis. The sputtering variation
with the cluster ion angle is classified into three regions. Region II (20o – 60
o) is the
ripple formation region.
79
6.2.3 Evolution of Nano-ripples with Applied Ar Cluster Ion Dose
The evolution of nano-ripples with applied dosage is shown in Figures 6.11 (b) – (i).
Ripple structures initially as shown in Figure 6.11 (b) are highly dislocated due to
random cluster ion collisions – i.e. each collision sputters atoms at an angle and creates
a ripple with certain amplitude due to initial randomness structures that carry different
amplitude modes (domains). The boundary between these amplitudes is known as a
domain wall.
An important question that arises is how these ripples coalesce to form long ordered
structures with continuous bombardment. A possible solution for ordering draws on the
superposition of amplitude mode dislocations due to surface instability and growth of
ripples with the expense of neighboring domains [94]. Figure 6.11 (i) shows a significant
improvement in ripple ordering at 3 × 10¹⁶
clusters/cm2 dosage bombarded at 60
o Ar
cluster ion beam incident angle. Corresponding Fourier transform images [Figure 6.11]
show the ordering of ripples with bombardment dose. For sharper and uniform ripple
patterns, the radial width of the Fourier peak becomes smaller [39]. Figure 6.12 shows
the square root of height-height correlation function,
⁄ (𝑑) that indicates with dosage
ripples become more ordered. Figure 6.13 shows the RMS roughness of ripple patterns as
a function of applied Ar cluster ion beam dosage for incident angles of 50o, 60
o, and 70
o.
For a sinusoidal surface pattern according to Carter’s shadowing effect model [36], to
satisfy the ( 2⁄ − ) 2 ⁄ term aspect ratio of ripples should be 0.13, 0.09,
and 0.06 for 50o, 60
o, and 70
o, respectively. However, cluster ion-induced nano-ripples on
Au surfaces saturate at very low dosages as shown in Figure 6.15. For example, for
80
cluster ions incident at 60o, the limiting condition to avoid saturation occurs at 2 × 10
14
clusters/cm2. Therefore, the experimental parameters were varied in the saturated or non-
linear regime. Figure 6.14 shows the wavelengths in the x-direction (the direction of
cluster ion incidence) of surface ripple patterns. During the ripening process ripples
merge by superposition of neighboring ripple domains, which create more domain
boundaries before the production of coalescence ripples. This transition is shown in
Figures 6.11 (d) – (f). Figure 6.16 illustrates a schematic diagram of ripple formation
during cluster ion beam off-normal bombardment.
Preliminarily target Au surface atoms undergo three sputtering processes and the
formation of ripples are due to atoms that sputter with low energies and ripples grow due
to surface diffusion of target atoms. Beyond the limiting condition, cluster ion
bombardment and surface atom sputtering depends on the local surface slope. Cluster
ions colliding with surface mounds or in this case ripple structure peaks, sputter atoms
and the ripple growth slows down. However, cluster ions colliding the upstream of
ripples (upstream is defined as the ripple slope facing the cluster ions beam) produce
mobile atoms that accumulate upstream. This ripening process depends upon the cluster
ion applied dosage (Figure 6.17) and incident angle (Figure 6.18). The ripple maximum
height to width ratio (𝐻 ⁄ ) increases from 0.27 to 0.41 when the applied dose changes
from 1 × 10¹⁶
clusters/cm2 to 3 × 10
16 clusters/cm
2. Nevertheless, 𝐻 ⁄ ratio decreases to
0.19 for cluster ion incident angles of 50o. This is caused by the high sputtering rate at
50o (12 atoms/cluster) compared to 60
o (7 atoms/cluster), calculated from the slopes of
Figure 6.19. For 70o grazing incident angle, cluster ion beam sputtering rate decreases to
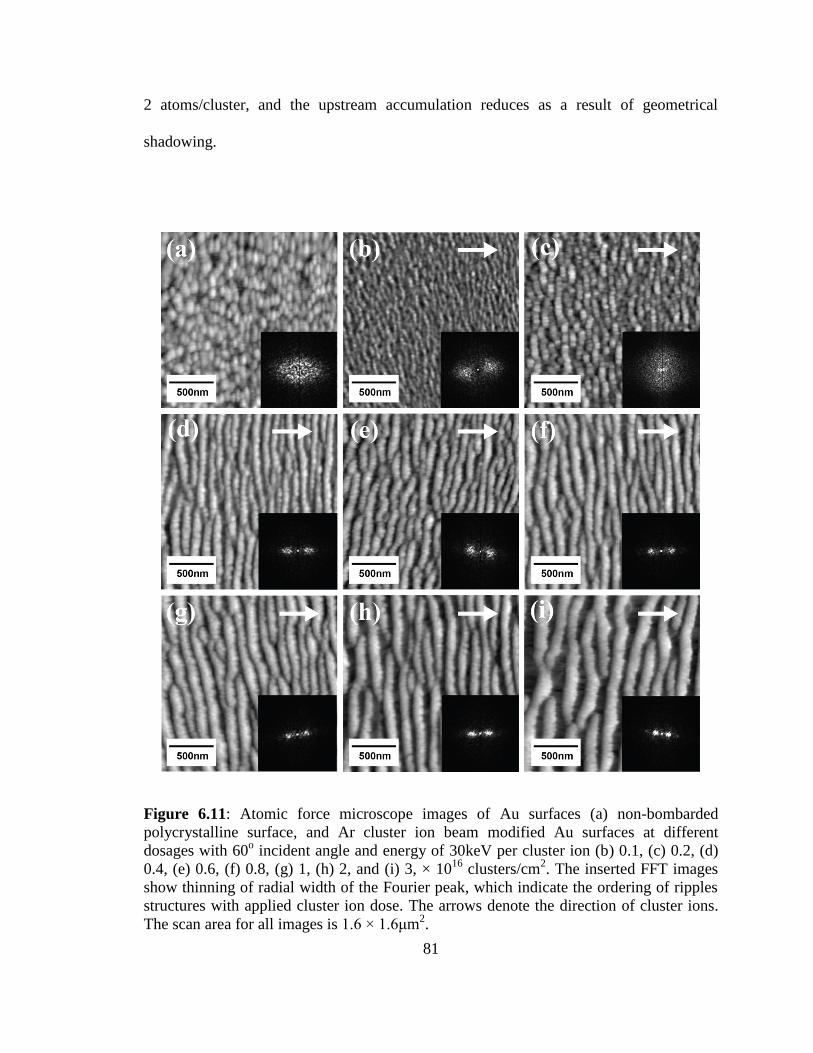
81
2 atoms/cluster, and the upstream accumulation reduces as a result of geometrical
shadowing.
Figure 6.11: Atomic force microscope images of Au surfaces (a) non-bombarded
polycrystalline surface, and Ar cluster ion beam modified Au surfaces at different
dosages with 60o incident angle and energy of 30keV per cluster ion (b) 0.1, (c) 0.2, (d)
0.4, (e) 0.6, (f) 0.8, (g) 1, (h) 2, and (i) 3, × 1016
clusters/cm2. The inserted FFT images
show thinning of radial width of the Fourier peak, which indicate the ordering of ripples
structures with applied cluster ion dose. The arrows denote the direction of cluster ions.
The scan area for all images is 1.6 × 1.6μm2.
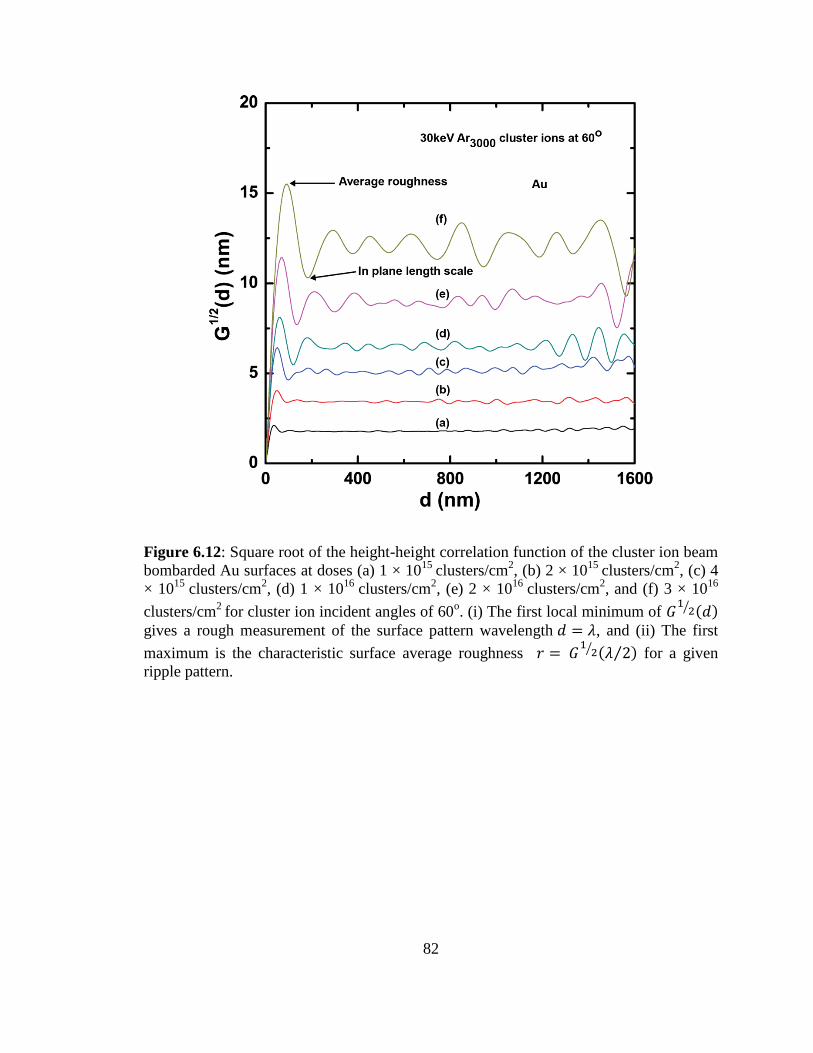
82
Figure 6.12: Square root of the height-height correlation function of the cluster ion beam
bombarded Au surfaces at doses (a) 1 × 10¹⁵
clusters/cm2, (b) 2 × 10
15 clusters/cm
2, (c) 4
× 1015
clusters/cm2, (d) 1 × 10
16 clusters/cm
2, (e) 2 × 10
16 clusters/cm
2, and (f) 3 × 10
16
clusters/cm2
for cluster ion incident angles of 60o. (i) The first local minimum of
⁄ (𝑑)
gives a rough measurement of the surface pattern wavelength 𝑑 = , and (ii) The first
maximum is the characteristic surface average roughness =
⁄ ( 2⁄ ) for a given
ripple pattern.
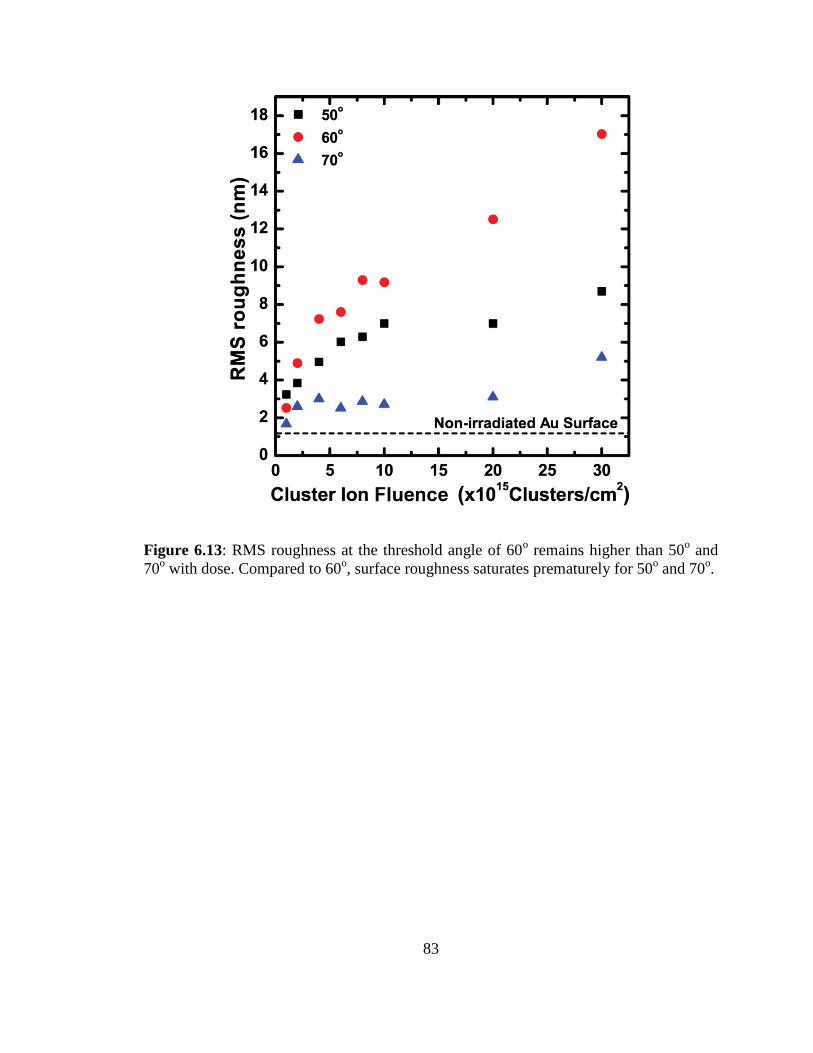
83
Figure 6.13: RMS roughness at the threshold angle of 60o remains higher than 50
o and
70o with dose. Compared to 60
o, surface roughness saturates prematurely for 50
o and 70
o.
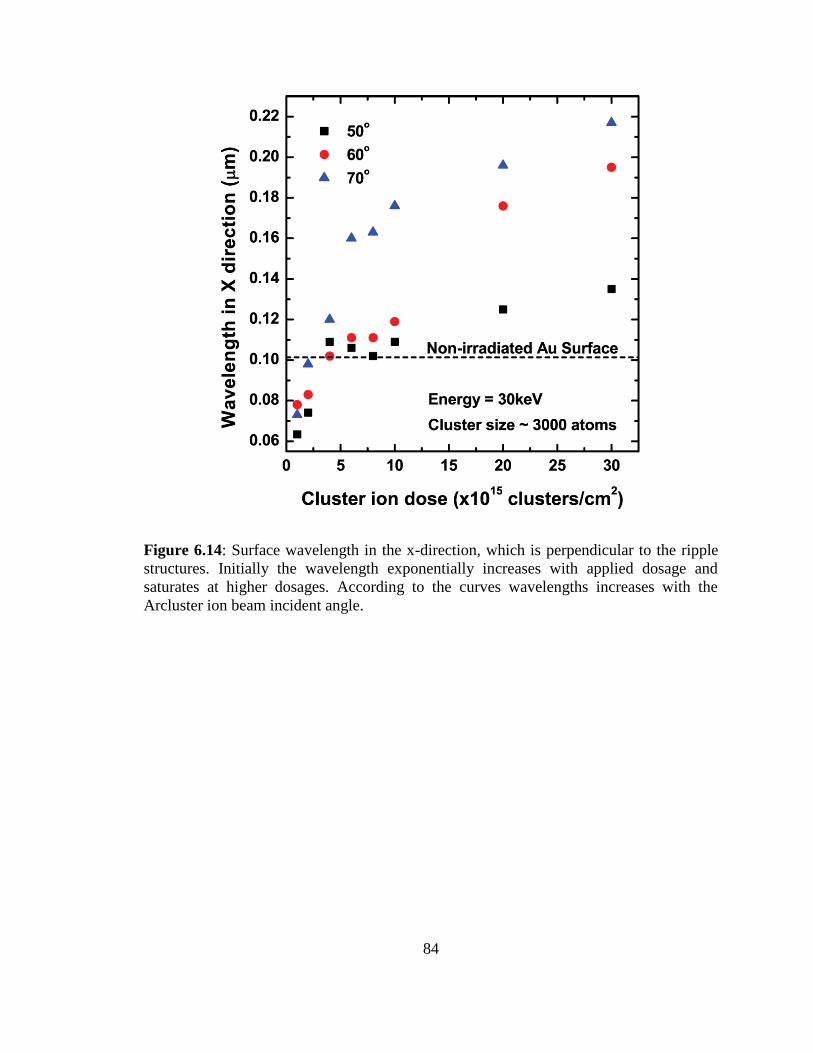
84
Figure 6.14: Surface wavelength in the x-direction, which is perpendicular to the ripple
structures. Initially the wavelength exponentially increases with applied dosage and
saturates at higher dosages. According to the curves wavelengths increases with the
Arcluster ion beam incident angle.
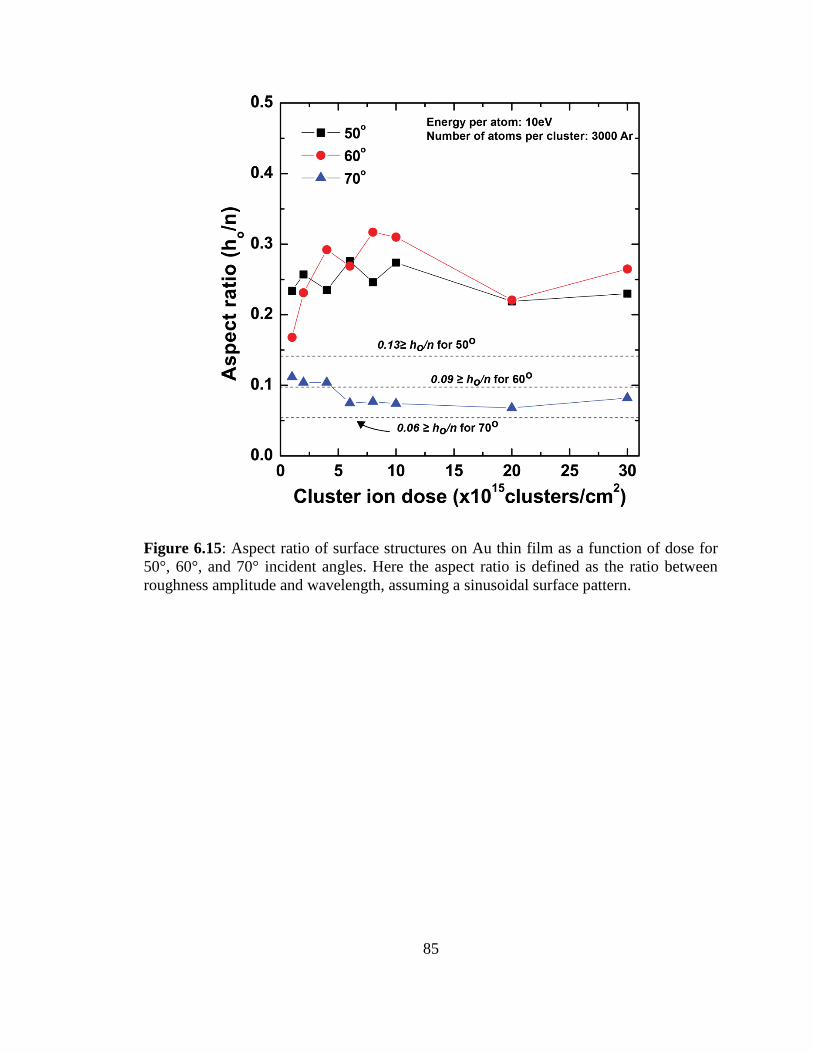
85
Figure 6.15: Aspect ratio of surface structures on Au thin film as a function of dose for
50°, 60°, and 70° incident angles. Here the aspect ratio is defined as the ratio between
roughness amplitude and wavelength, assuming a sinusoidal surface pattern.
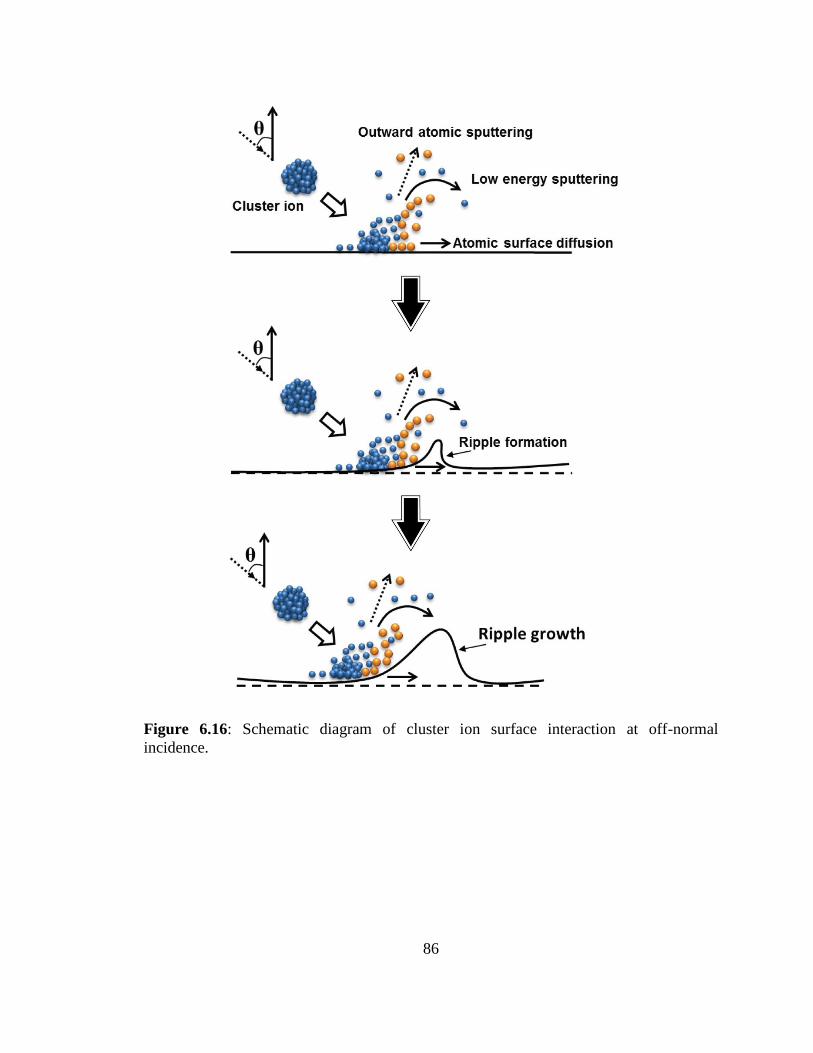
86
Figure 6.16: Schematic diagram of cluster ion surface interaction at off-normal
incidence.
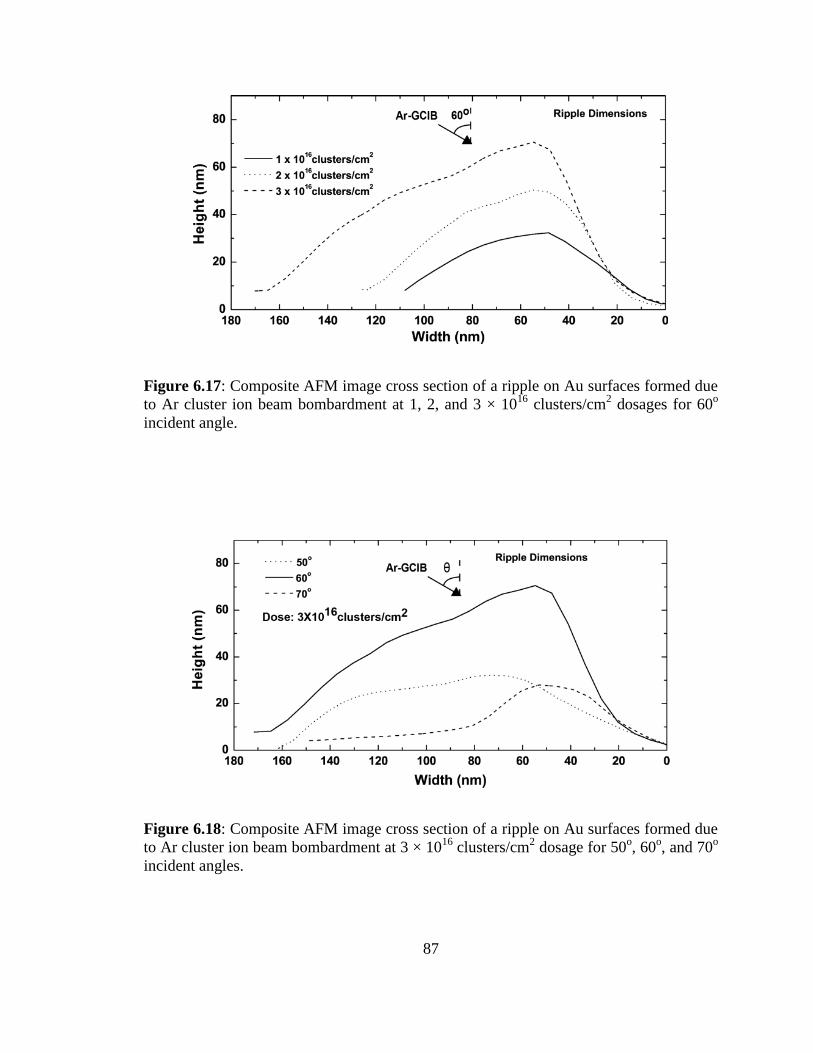
87
Figure 6.17: Composite AFM image cross section of a ripple on Au surfaces formed due
to Ar cluster ion beam bombardment at 1, 2, and 3 × 10¹⁶
clusters/cm2 dosages for 60
o
incident angle.
Figure 6.18: Composite AFM image cross section of a ripple on Au surfaces formed due
to Ar cluster ion beam bombardment at 3 × 10¹⁶
clusters/cm2 dosage for 50
o, 60
o, and 70
o
incident angles.
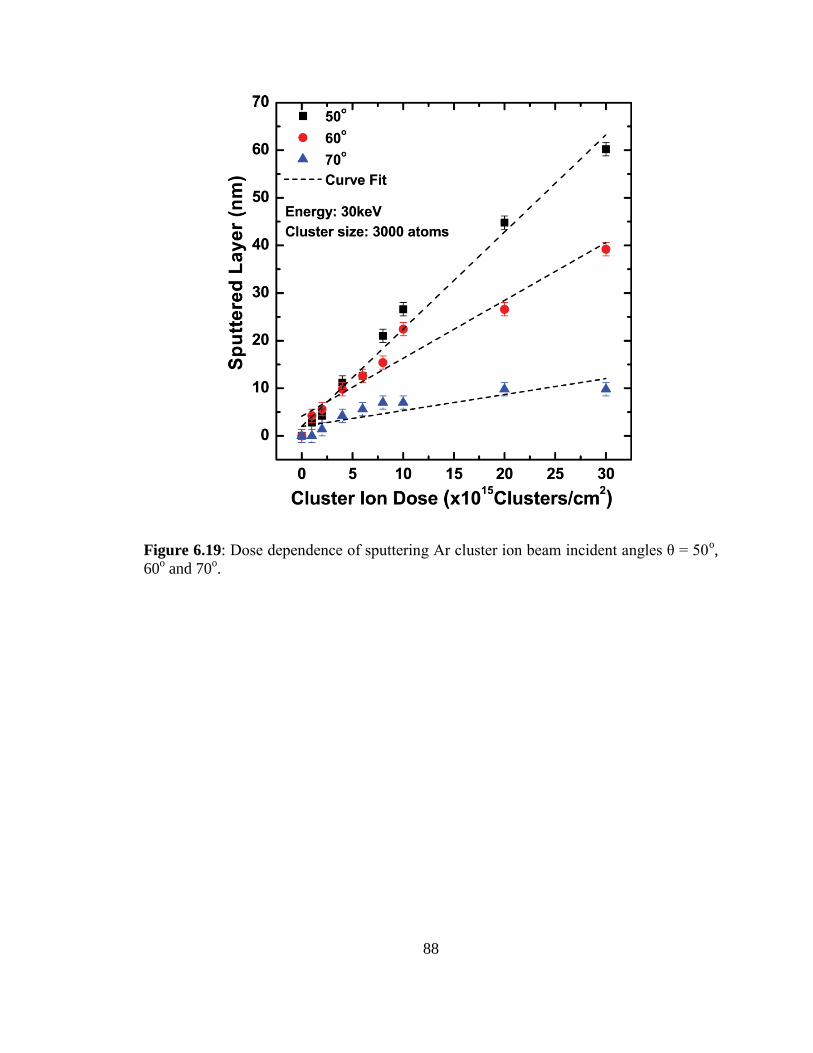
88
Figure 6.19: Dose dependence of sputtering Ar cluster ion beam incident angles θ = 50o,
60o and 70
o.
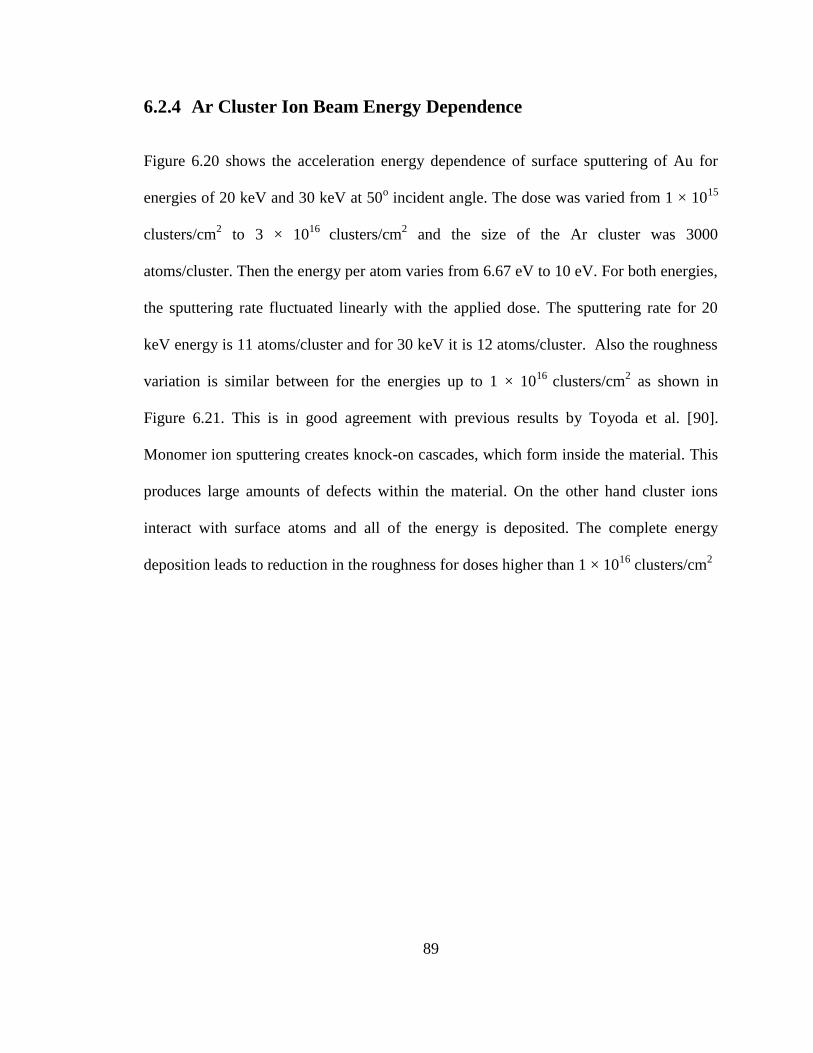
89
6.2.4 Ar Cluster Ion Beam Energy Dependence
Figure 6.20 shows the acceleration energy dependence of surface sputtering of Au for
energies of 20 keV and 30 keV at 50o incident angle. The dose was varied from 1 × 10
15
clusters/cm2 to 3 × 10
16 clusters/cm
2 and the size of the Ar cluster was 3000
atoms/cluster. Then the energy per atom varies from 6.67 eV to 10 eV. For both energies,
the sputtering rate fluctuated linearly with the applied dose. The sputtering rate for 20
keV energy is 11 atoms/cluster and for 30 keV it is 12 atoms/cluster. Also the roughness
variation is similar between for the energies up to 1 × 10¹⁶
clusters/cm2 as shown in
Figure 6.21. This is in good agreement with previous results by Toyoda et al. [90].
Monomer ion sputtering creates knock-on cascades, which form inside the material. This
produces large amounts of defects within the material. On the other hand cluster ions
interact with surface atoms and all of the energy is deposited. The complete energy
deposition leads to reduction in the roughness for doses higher than 1 × 10¹⁶
clusters/cm2
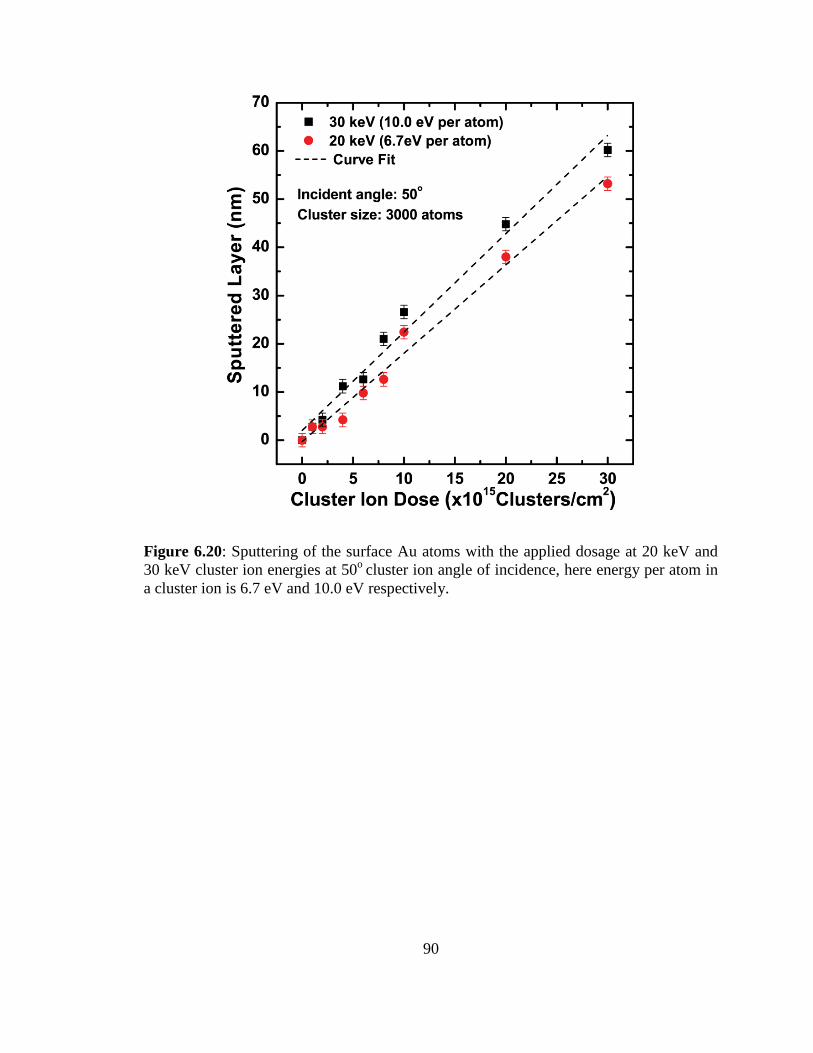
90
Figure 6.20: Sputtering of the surface Au atoms with the applied dosage at 20 keV and
30 keV cluster ion energies at 50o
cluster ion angle of incidence, here energy per atom in
a cluster ion is 6.7 eV and 10.0 eV respectively.
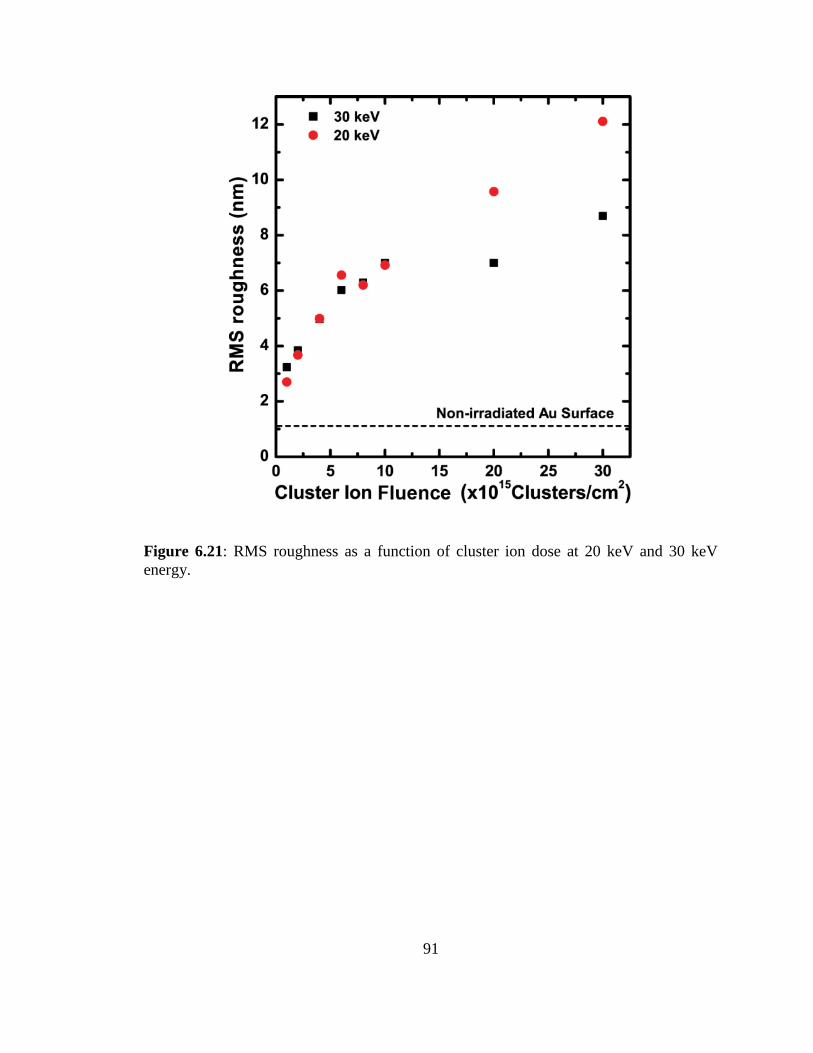
91
Figure 6.21: RMS roughness as a function of cluster ion dose at 20 keV and 30 keV
energy.
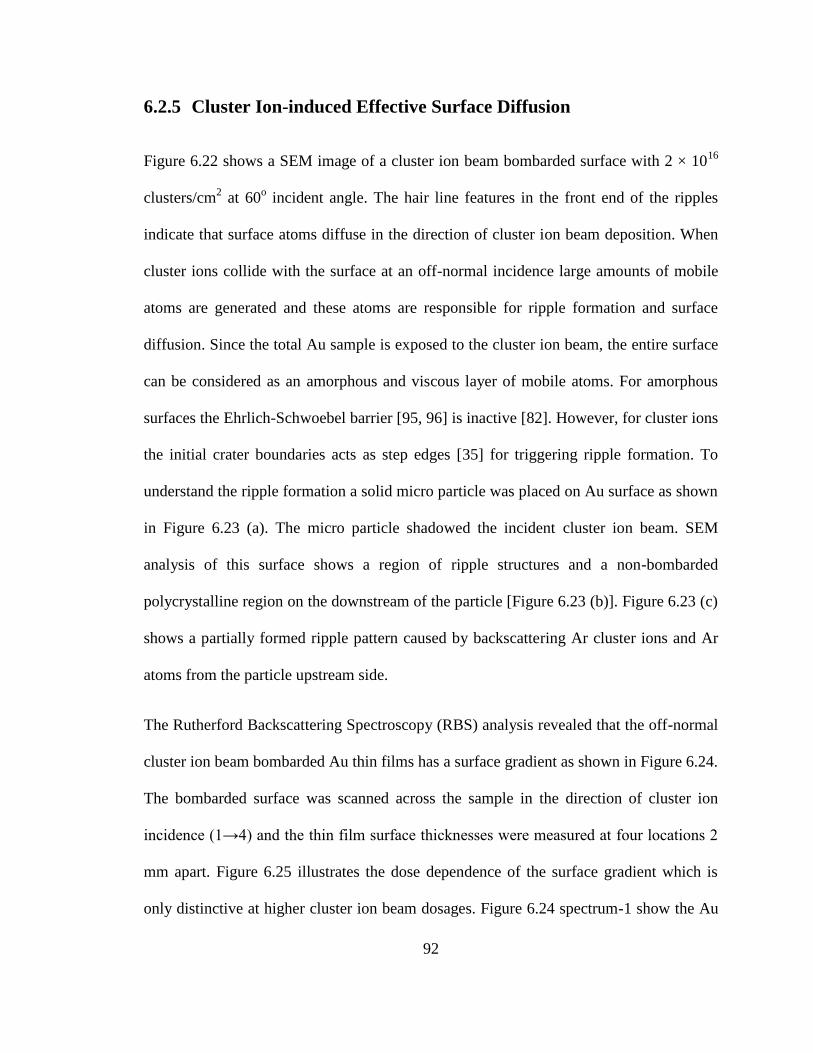
92
6.2.5 Cluster Ion-induced Effective Surface Diffusion
Figure 6.22 shows a SEM image of a cluster ion beam bombarded surface with 2 × 10¹⁶
clusters/cm2 at 60
o incident angle. The hair line features in the front end of the ripples
indicate that surface atoms diffuse in the direction of cluster ion beam deposition. When
cluster ions collide with the surface at an off-normal incidence large amounts of mobile
atoms are generated and these atoms are responsible for ripple formation and surface
diffusion. Since the total Au sample is exposed to the cluster ion beam, the entire surface
can be considered as an amorphous and viscous layer of mobile atoms. For amorphous
surfaces the Ehrlich-Schwoebel barrier [95, 96] is inactive [82]. However, for cluster ions
the initial crater boundaries acts as step edges [35] for triggering ripple formation. To
understand the ripple formation a solid micro particle was placed on Au surface as shown
in Figure 6.23 (a). The micro particle shadowed the incident cluster ion beam. SEM
analysis of this surface shows a region of ripple structures and a non-bombarded
polycrystalline region on the downstream of the particle [Figure 6.23 (b)]. Figure 6.23 (c)
shows a partially formed ripple pattern caused by backscattering Ar cluster ions and Ar
atoms from the particle upstream side.
The Rutherford Backscattering Spectroscopy (RBS) analysis revealed that the off-normal
cluster ion beam bombarded Au thin films has a surface gradient as shown in Figure 6.24.
The bombarded surface was scanned across the sample in the direction of cluster ion
incidence (1→4) and the thin film surface thicknesses were measured at four locations 2
mm apart. Figure 6.25 illustrates the dose dependence of the surface gradient which is
only distinctive at higher cluster ion beam dosages. Figure 6.24 spectrum-1 show the Au
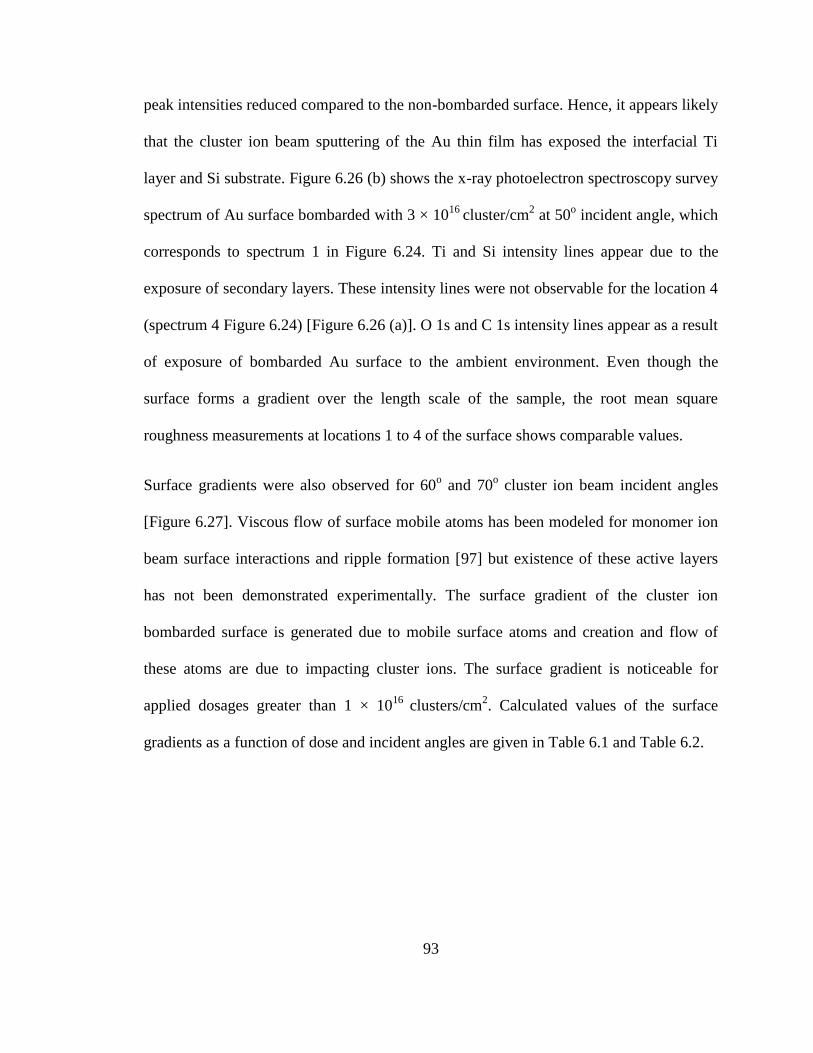
93
peak intensities reduced compared to the non-bombarded surface. Hence, it appears likely
that the cluster ion beam sputtering of the Au thin film has exposed the interfacial Ti
layer and Si substrate. Figure 6.26 (b) shows the x-ray photoelectron spectroscopy survey
spectrum of Au surface bombarded with 3 × 10¹⁶
cluster/cm2 at 50
o incident angle, which
corresponds to spectrum 1 in Figure 6.24. Ti and Si intensity lines appear due to the
exposure of secondary layers. These intensity lines were not observable for the location 4
(spectrum 4 Figure 6.24) [Figure 6.26 (a)]. O 1s and C 1s intensity lines appear as a result
of exposure of bombarded Au surface to the ambient environment. Even though the
surface forms a gradient over the length scale of the sample, the root mean square
roughness measurements at locations 1 to 4 of the surface shows comparable values.
Surface gradients were also observed for 60o and 70
o cluster ion beam incident angles
[Figure 6.27]. Viscous flow of surface mobile atoms has been modeled for monomer ion
beam surface interactions and ripple formation [97] but existence of these active layers
has not been demonstrated experimentally. The surface gradient of the cluster ion
bombarded surface is generated due to mobile surface atoms and creation and flow of
these atoms are due to impacting cluster ions. The surface gradient is noticeable for
applied dosages greater than 1 × 10¹⁶
clusters/cm2. Calculated values of the surface
gradients as a function of dose and incident angles are given in Table 6.1 and Table 6.2.
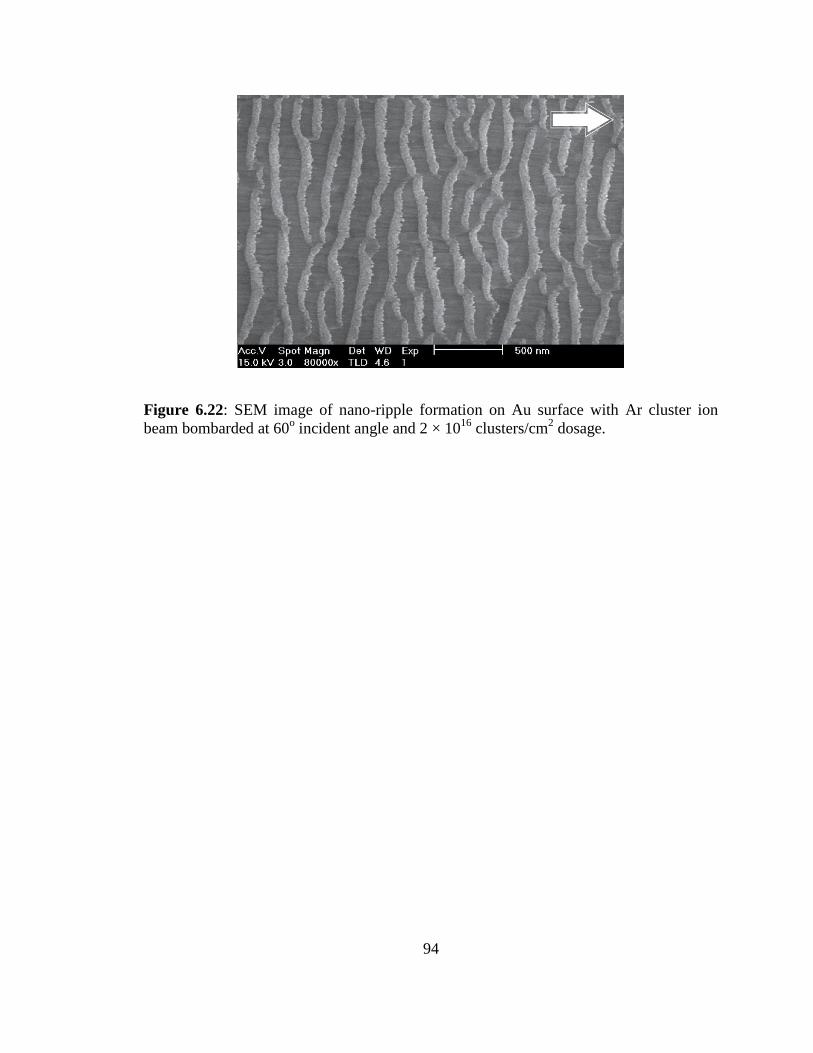
94
Figure 6.22: SEM image of nano-ripple formation on Au surface with Ar cluster ion
beam bombarded at 60o incident angle and 2 × 10
16 clusters/cm
2 dosage.
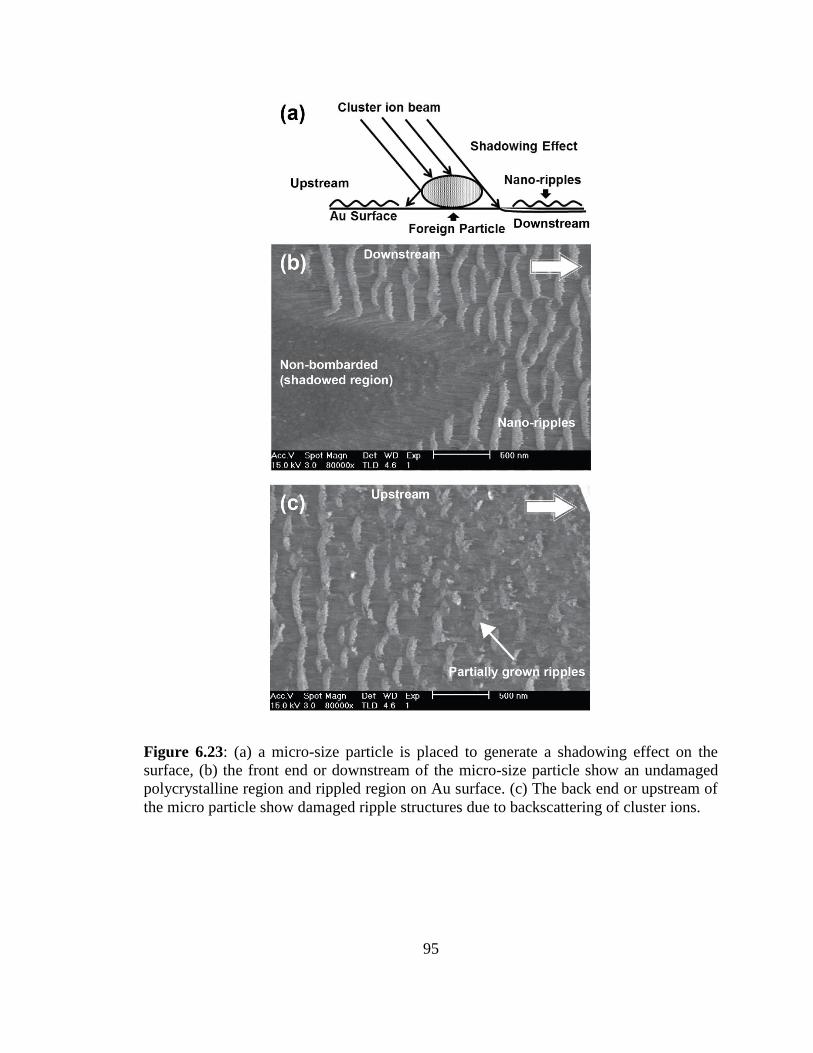
95
Figure 6.23: (a) a micro-size particle is placed to generate a shadowing effect on the
surface, (b) the front end or downstream of the micro-size particle show an undamaged
polycrystalline region and rippled region on Au surface. (c) The back end or upstream of
the micro particle show damaged ripple structures due to backscattering of cluster ions.
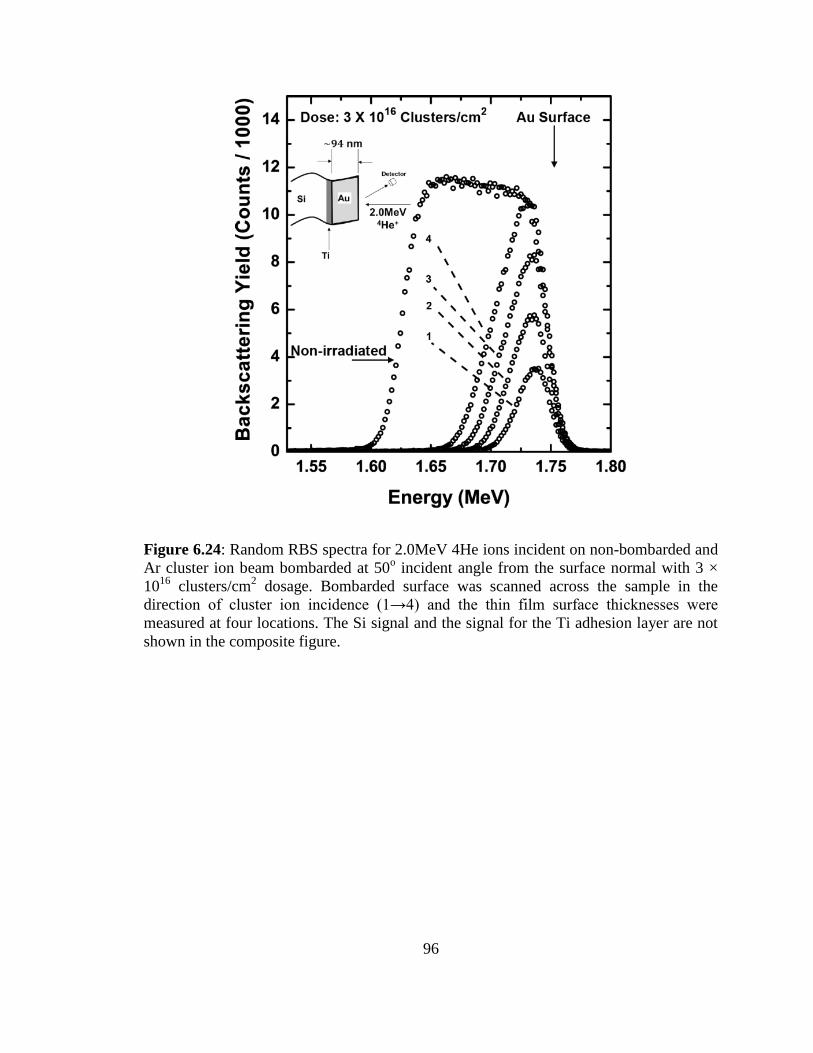
96
Figure 6.24: Random RBS spectra for 2.0MeV 4He ions incident on non-bombarded and
Ar cluster ion beam bombarded at 50o incident angle from the surface normal with 3 ×
1016
clusters/cm2 dosage. Bombarded surface was scanned across the sample in the
direction of cluster ion incidence (1→4) and the thin film surface thicknesses were
measured at four locations. The Si signal and the signal for the Ti adhesion layer are not
shown in the composite figure.
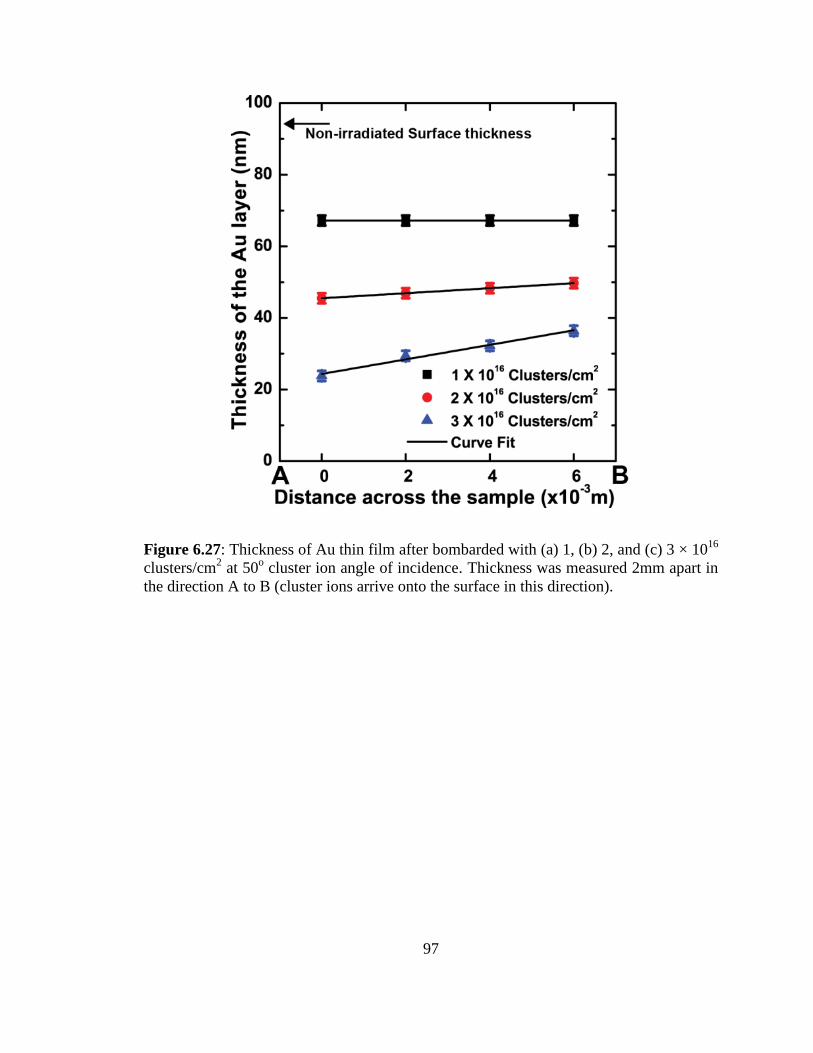
97
Figure 6.27: Thickness of Au thin film after bombarded with (a) 1, (b) 2, and (c) 3 × 10¹⁶
clusters/cm2 at 50
o cluster ion angle of incidence. Thickness was measured 2mm apart in
the direction A to B (cluster ions arrive onto the surface in this direction).
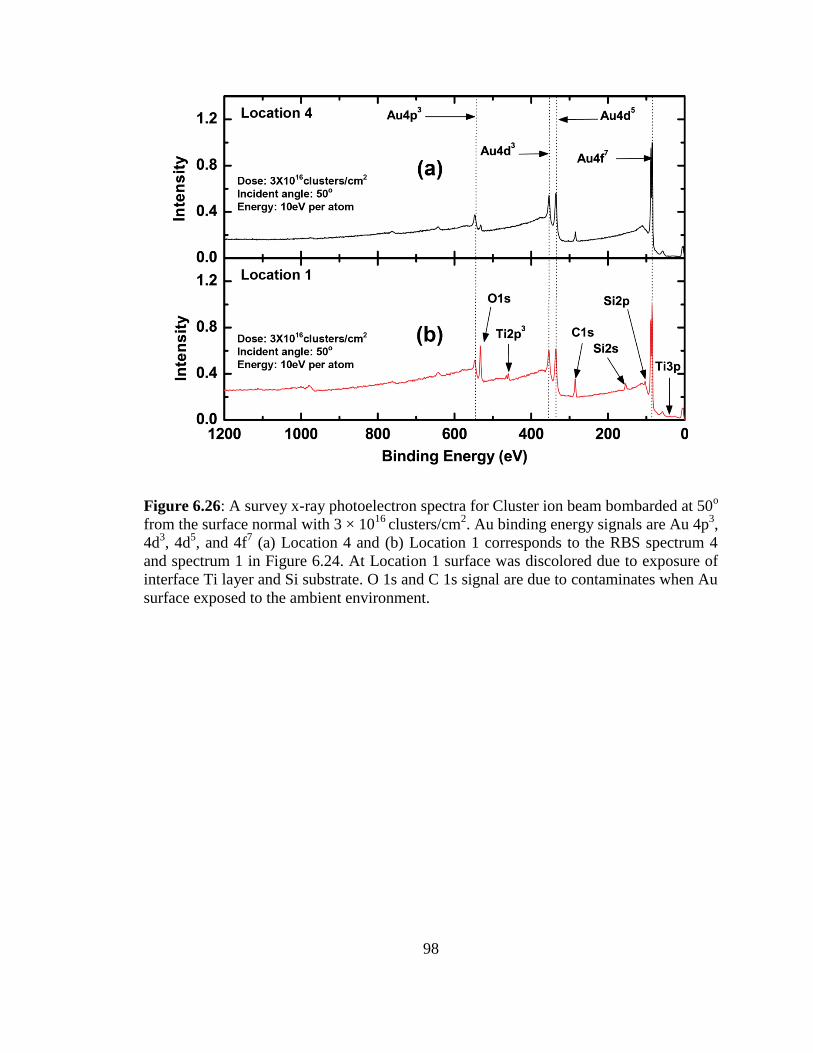
98
Figure 6.26: A survey x-ray photoelectron spectra for Cluster ion beam bombarded at 50o
from the surface normal with 3 × 10¹⁶
clusters/cm2. Au binding energy signals are Au 4p
3,
4d3, 4d
5, and 4f
7 (a) Location 4 and (b) Location 1 corresponds to the RBS spectrum 4
and spectrum 1 in Figure 6.24. At Location 1 surface was discolored due to exposure of
interface Ti layer and Si substrate. O 1s and C 1s signal are due to contaminates when Au
surface exposed to the ambient environment.
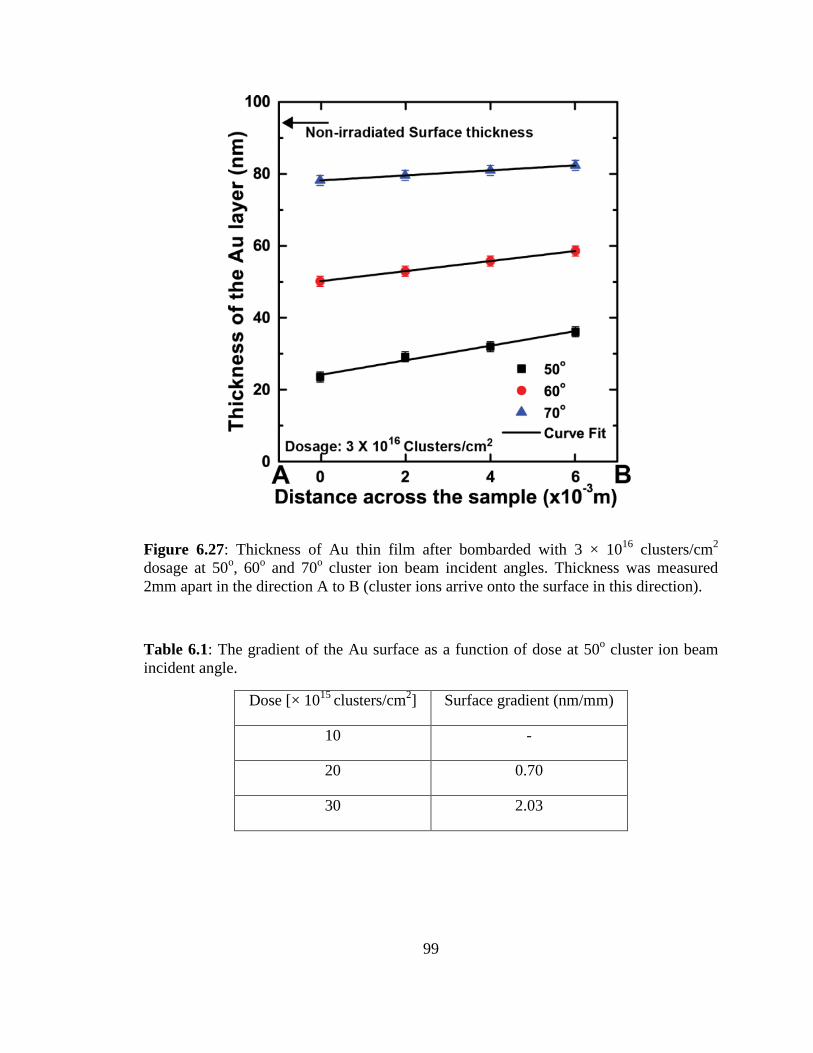
99
Figure 6.27: Thickness of Au thin film after bombarded with 3 × 10¹⁶
clusters/cm2
dosage at 50o, 60
o and 70
o cluster ion beam incident angles. Thickness was measured
2mm apart in the direction A to B (cluster ions arrive onto the surface in this direction).
Table 6.1: The gradient of the Au surface as a function of dose at 50o cluster ion beam
incident angle.
Dose [× 1015
clusters/cm2] Surface gradient (nm/mm)
10 -
20 0.70
30 2.03
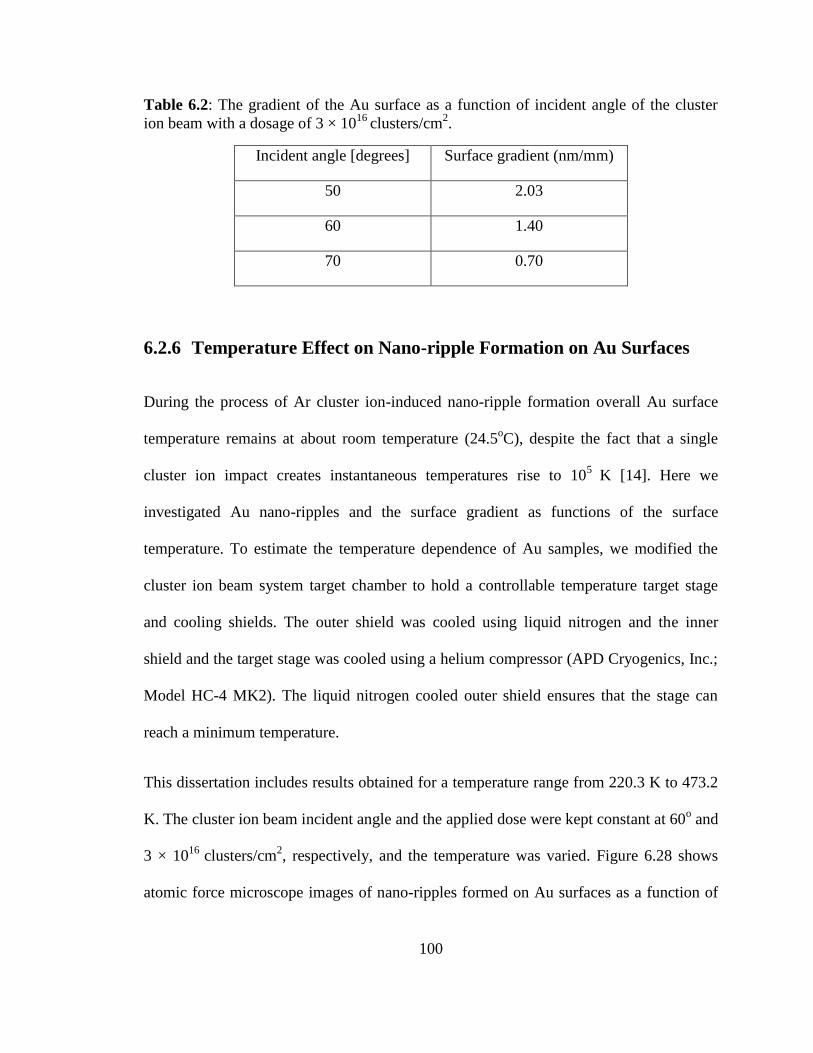
100
Table 6.2: The gradient of the Au surface as a function of incident angle of the cluster
ion beam with a dosage of 3 × 10¹⁶
clusters/cm2.
Incident angle [degrees] Surface gradient (nm/mm)
50 2.03
60 1.40
70 0.70
6.2.6 Temperature Effect on Nano-ripple Formation on Au Surfaces
During the process of Ar cluster ion-induced nano-ripple formation overall Au surface
temperature remains at about room temperature (24.5oC), despite the fact that a single
cluster ion impact creates instantaneous temperatures rise to 105
K [14]. Here we
investigated Au nano-ripples and the surface gradient as functions of the surface
temperature. To estimate the temperature dependence of Au samples, we modified the
cluster ion beam system target chamber to hold a controllable temperature target stage
and cooling shields. The outer shield was cooled using liquid nitrogen and the inner
shield and the target stage was cooled using a helium compressor (APD Cryogenics, Inc.;
Model HC-4 MK2). The liquid nitrogen cooled outer shield ensures that the stage can
reach a minimum temperature.
This dissertation includes results obtained for a temperature range from 220.3 K to 473.2
K. The cluster ion beam incident angle and the applied dose were kept constant at 60o and
3 × 10¹⁶
clusters/cm2, respectively, and the temperature was varied. Figure 6.28 shows
atomic force microscope images of nano-ripples formed on Au surfaces as a function of
101
temperature. Cluster ion-induced nano-ripples disrupts as the surface temperature
increases. However, the root mean square surface roughness is highest at room
temperature (RT) [Figure 6.29]. Hence the surface instability effects are mainly confined
to a temperature range close to RT. Figure 6.30 shows the square root of the height-
height correlation function as a variable of the surface temperature. The in-plane length
scale corresponds to a first local minimum of
⁄ (𝑑). The
⁄ (𝑑) value increase
relates to the disruption of ripples. At 473.2 K surface patterning is triggered by thermal
diffusion and the main surface features are holes.
The surface gradient decreases with the applied dose. Therefore, ripple formation and
mobile atom migration are mainly due to the effective cluster ion-induced diffusion. The
surface gradient at RT and 373.2 K are 1.40 nm/mm and 0.70 nm/mm, respectively.
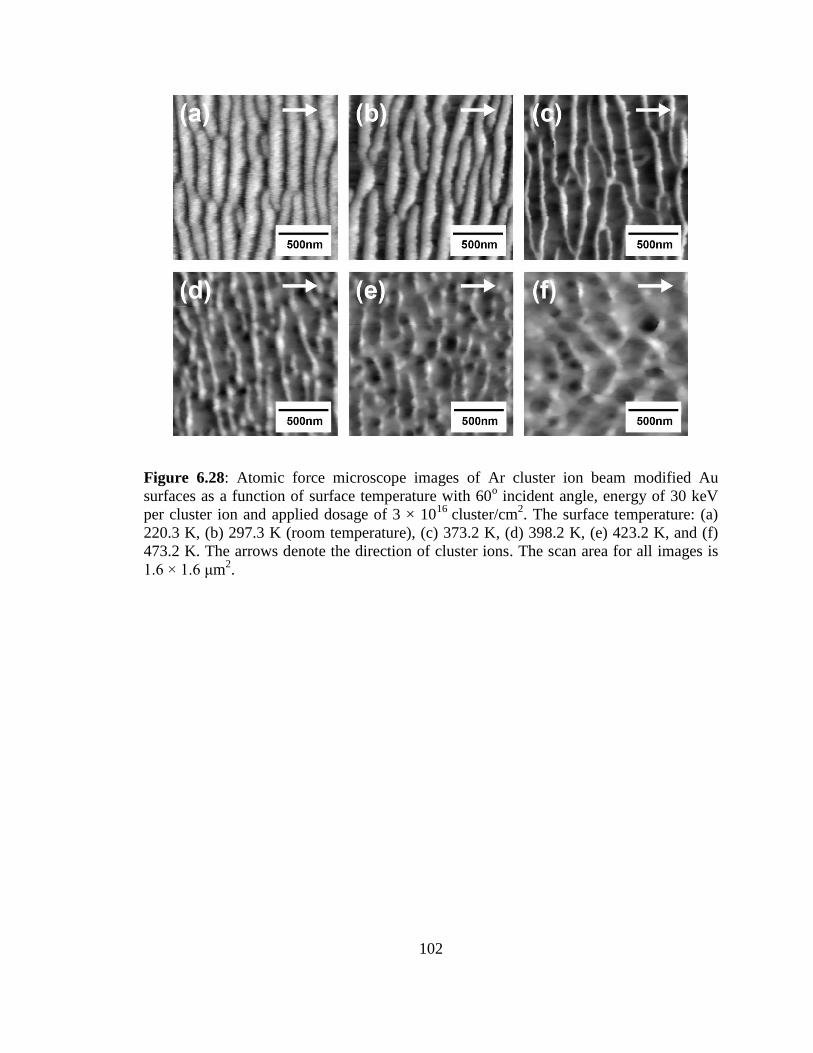
102
Figure 6.28: Atomic force microscope images of Ar cluster ion beam modified Au
surfaces as a function of surface temperature with 60o incident angle, energy of 30 keV
per cluster ion and applied dosage of 3 × 10¹⁶
cluster/cm2. The surface temperature: (a)
220.3 K, (b) 297.3 K (room temperature), (c) 373.2 K, (d) 398.2 K, (e) 423.2 K, and (f)
473.2 K. The arrows denote the direction of cluster ions. The scan area for all images is
1.6 × 1.6 μm2.
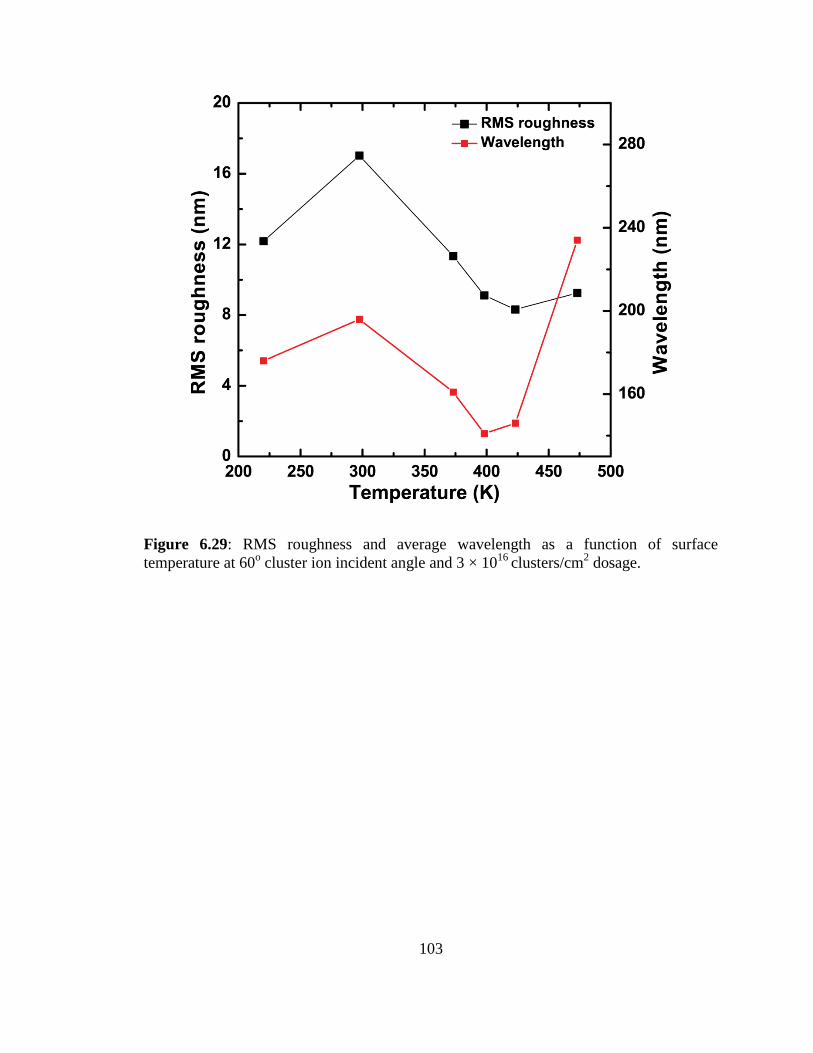
103
Figure 6.29: RMS roughness and average wavelength as a function of surface
temperature at 60o cluster ion incident angle and 3 × 10
16 clusters/cm
2 dosage.
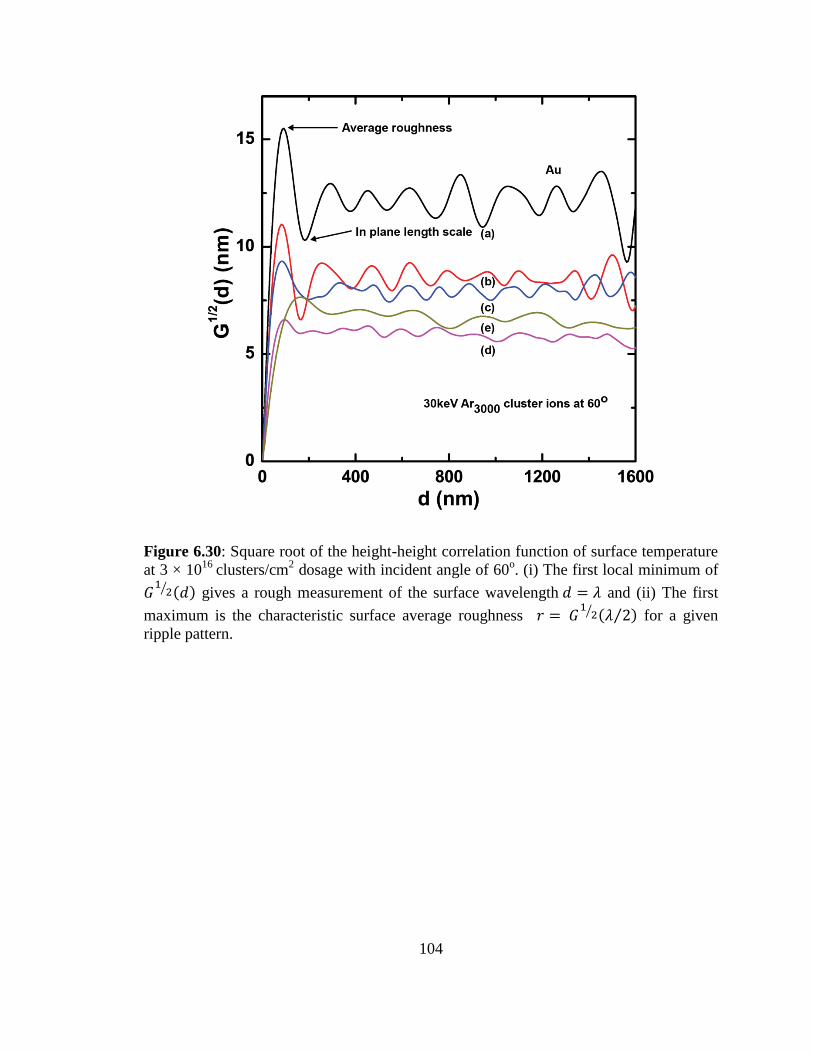
104
Figure 6.30: Square root of the height-height correlation function of surface temperature
at 3 × 10¹⁶
clusters/cm2 dosage with incident angle of 60
o. (i) The first local minimum of
⁄ (𝑑) gives a rough measurement of the surface wavelength 𝑑 = and (ii) The first
maximum is the characteristic surface average roughness =
⁄ ( 2⁄ ) for a given
ripple pattern.
105
Chapter 7
Applications of Au Nano-ripple Surfaces
Gas cluster ion beam fabricated self-assembled nano-patterns have introduced promising
applications in the fields of surface, optical, and bio-medical engineering. A Cluster ion
consists about thousands of atoms, which provides more than thousand fold throughput
advantage over monomer ions. In this Chapter we discuss two applications of Au nano-
ripple surfaces.
7.1 Anisotropic Surface Wetting of Au Nano-ripple
Surfaces
Wettability of a solid surface describes the interaction between a water droplet and the
surface [98]. It is commonly expressed as the Contact Angle (CA) of the water droplet.
CA is defined as the angle between solid-liquid and liquid-vapor interfaces. Depending
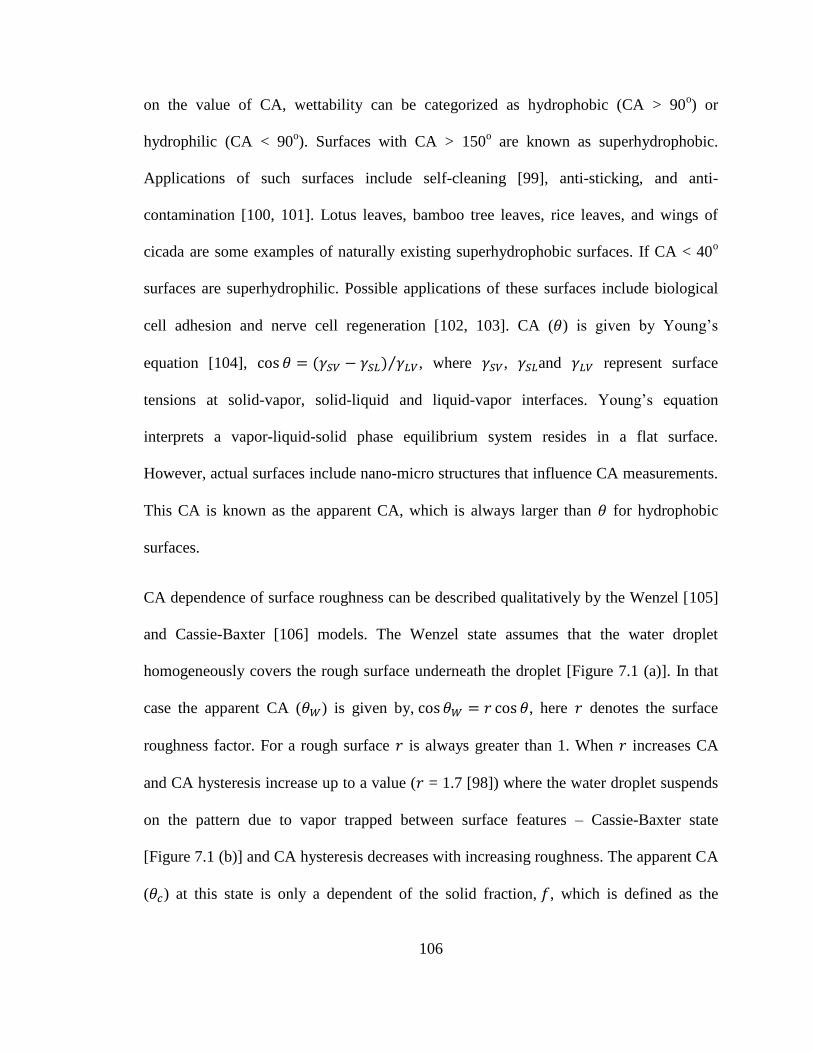
106
on the value of CA, wettability can be categorized as hydrophobic (CA > 90o) or
hydrophilic (CA < 90o). Surfaces with CA > 150
o are known as superhydrophobic.
Applications of such surfaces include self-cleaning [99], anti-sticking, and anti-
contamination [100, 101]. Lotus leaves, bamboo tree leaves, rice leaves, and wings of
cicada are some examples of naturally existing superhydrophobic surfaces. If CA < 40o
surfaces are superhydrophilic. Possible applications of these surfaces include biological
cell adhesion and nerve cell regeneration [102, 103]. CA ( ) is given by Young’s
equation [104], = (𝛾 − 𝛾 ) 𝛾 ⁄ , where 𝛾 , 𝛾 and 𝛾 represent surface
tensions at solid-vapor, solid-liquid and liquid-vapor interfaces. Young’s equation
interprets a vapor-liquid-solid phase equilibrium system resides in a flat surface.
However, actual surfaces include nano-micro structures that influence CA measurements.
This CA is known as the apparent CA, which is always larger than for hydrophobic
surfaces.
CA dependence of surface roughness can be described qualitatively by the Wenzel [105]
and Cassie-Baxter [106] models. The Wenzel state assumes that the water droplet
homogeneously covers the rough surface underneath the droplet [Figure 7.1 (a)]. In that
case the apparent CA ( ) is given by, = , here denotes the surface
roughness factor. For a rough surface is always greater than 1. When increases CA
and CA hysteresis increase up to a value ( = 1.7 [98]) where the water droplet suspends
on the pattern due to vapor trapped between surface features – Cassie-Baxter state
[Figure 7.1 (b)] and CA hysteresis decreases with increasing roughness. The apparent CA
( ) at this state is only a dependent of the solid fraction, , which is defined as the
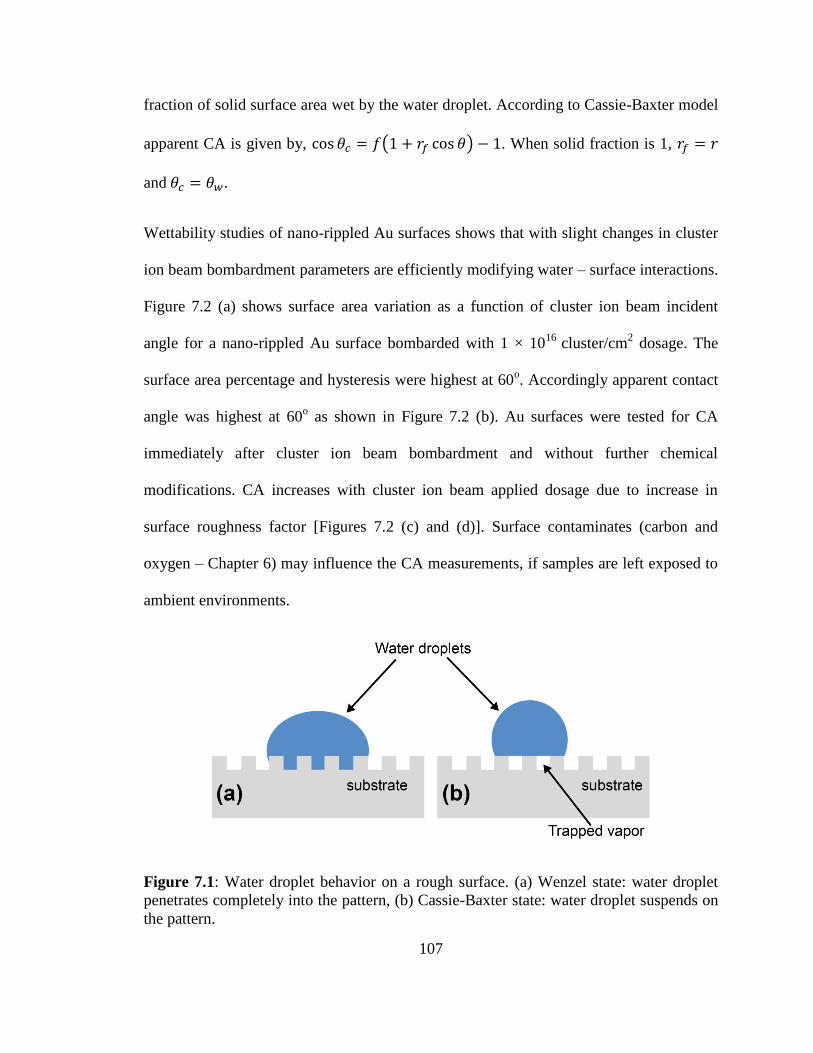
107
fraction of solid surface area wet by the water droplet. According to Cassie-Baxter model
apparent CA is given by, = (1 + ) − 1. When solid fraction is 1, =
and = .
Wettability studies of nano-rippled Au surfaces shows that with slight changes in cluster
ion beam bombardment parameters are efficiently modifying water – surface interactions.
Figure 7.2 (a) shows surface area variation as a function of cluster ion beam incident
angle for a nano-rippled Au surface bombarded with 1 × 10¹⁶
cluster/cm2 dosage. The
surface area percentage and hysteresis were highest at 60o. Accordingly apparent contact
angle was highest at 60o as shown in Figure 7.2 (b). Au surfaces were tested for CA
immediately after cluster ion beam bombardment and without further chemical
modifications. CA increases with cluster ion beam applied dosage due to increase in
surface roughness factor [Figures 7.2 (c) and (d)]. Surface contaminates (carbon and
oxygen – Chapter 6) may influence the CA measurements, if samples are left exposed to
ambient environments.
Figure 7.1: Water droplet behavior on a rough surface. (a) Wenzel state: water droplet
penetrates completely into the pattern, (b) Cassie-Baxter state: water droplet suspends on
the pattern.
108
Figure 7.2: (a) The percentage of surface area increase compared to a flat surface
measured as a function of Ar cluster ion beam incident angles for 1 × 10¹⁶
clusters/cm2
dosage, (b) Contact angle of a water droplet on Au surface as a function of the cluster ion
incident angle measured from the surface normal. The size of the water droplet was 1 μL,
(c) The percentage of surface area increase compared to a flat surface measured as a
function of Ar cluster ion beam dosage at 50o incident angle, and (d) corresponding
contact angle measurement of a water droplet.
109
Surface nano-ripple patterns become highly oriented with applied cluster ion beam
dosages (as discussed in Chapter 6). When a water droplet is placed on these one-
dimensional (1D) nano-ripple structures, it involves in an inhomogeneous wetting [107,
108]. This inhomogeneity is entirely due to liquid – solid surface contact line facing
physical discontinuities on the surface. Figure 7.3 (a) and (b) shows water droplets
placed on a rippled surface and contact angles were measured in x and y directions
respectively. x corresponds to the direction perpendicular to the ripples and y-direction is
parallel to ripples. Figure 7.3 (c) shows the surface tested for CA measurements, which
was prepared by bombarding with Ar cluster ion dose of 3 × 10¹⁶
clusters/cm2 and the
incident angle of the beam was 60o from the surface normal. The apparent CA in the x-
direction showed =101o and in the y-direction it was only = 92
o. Then the angle
difference − = 9o, is called the angle of wetting. Figure 7.3 (d) shows the water
droplet formed on the 1D ripple pattern. When the liquid spreading was measured for the
1 μL droplet, top view showed an elliptical shape of the drop. In x direction contact line
was measured 2.7 mm and in y-direction line it was 3.3 mm. The physical anisotropy
phenomenon introduces a unique directional flow of water on surface, which can be
applied as directional self-cleaning surfaces.
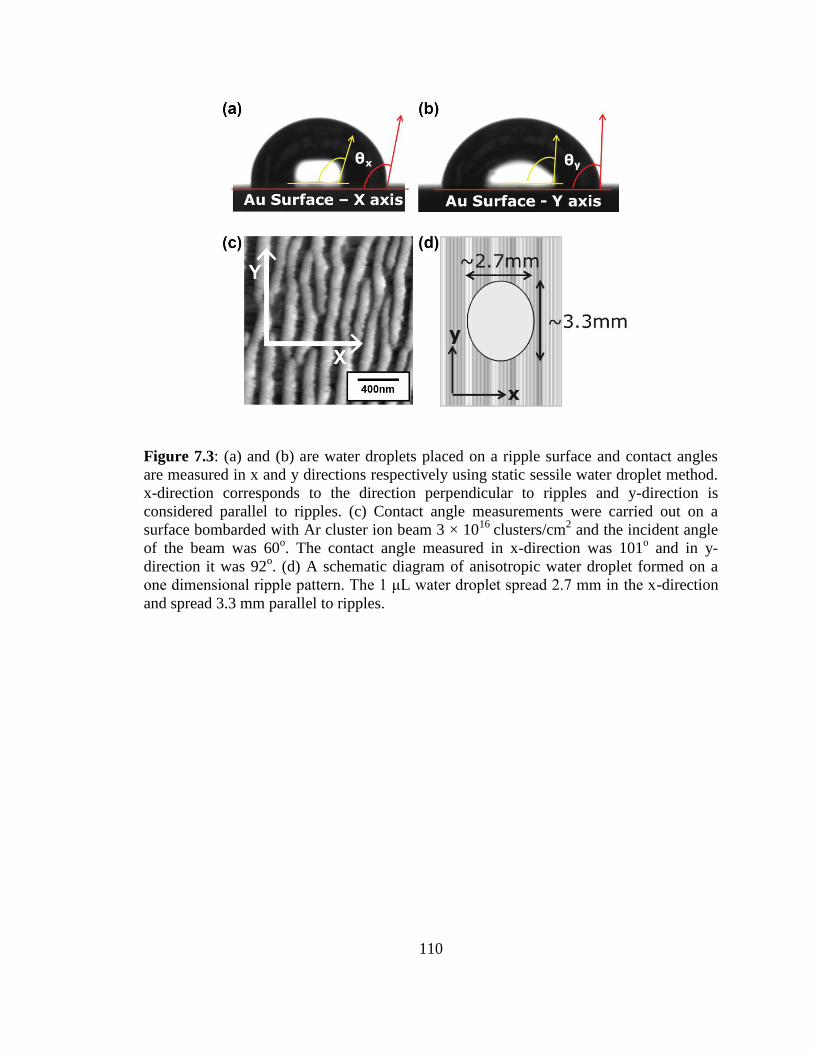
110
Figure 7.3: (a) and (b) are water droplets placed on a ripple surface and contact angles
are measured in x and y directions respectively using static sessile water droplet method.
x-direction corresponds to the direction perpendicular to ripples and y-direction is
considered parallel to ripples. (c) Contact angle measurements were carried out on a
surface bombarded with Ar cluster ion beam 3 × 10¹⁶
clusters/cm2 and the incident angle
of the beam was 60o. The contact angle measured in x-direction was 101
o and in y-
direction it was 92o. (d) A schematic diagram of anisotropic water droplet formed on a
one dimensional ripple pattern. The 1 μL water droplet spread 2.7 mm in the x-direction
and spread 3.3 mm parallel to ripples.
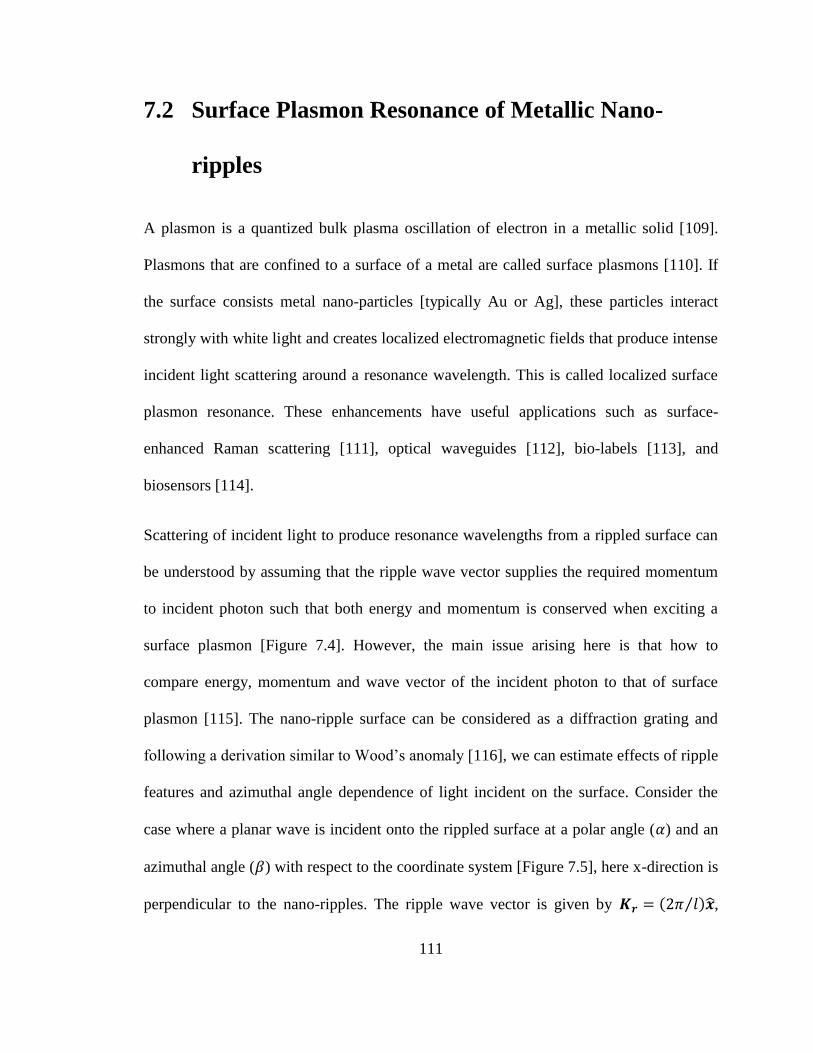
111
7.2 Surface Plasmon Resonance of Metallic Nano-
ripples
A plasmon is a quantized bulk plasma oscillation of electron in a metallic solid [109].
Plasmons that are confined to a surface of a metal are called surface plasmons [110]. If
the surface consists metal nano-particles [typically Au or Ag], these particles interact
strongly with white light and creates localized electromagnetic fields that produce intense
incident light scattering around a resonance wavelength. This is called localized surface
plasmon resonance. These enhancements have useful applications such as surface-
enhanced Raman scattering [111], optical waveguides [112], bio-labels [113], and
biosensors [114].
Scattering of incident light to produce resonance wavelengths from a rippled surface can
be understood by assuming that the ripple wave vector supplies the required momentum
to incident photon such that both energy and momentum is conserved when exciting a
surface plasmon [Figure 7.4]. However, the main issue arising here is that how to
compare energy, momentum and wave vector of the incident photon to that of surface
plasmon [115]. The nano-ripple surface can be considered as a diffraction grating and
following a derivation similar to Wood’s anomaly [116], we can estimate effects of ripple
features and azimuthal angle dependence of light incident on the surface. Consider the
case where a planar wave is incident onto the rippled surface at a polar angle ( ) and an
azimuthal angle ( ) with respect to the coordinate system [Figure 7.5], here x-direction is
perpendicular to the nano-ripples. The ripple wave vector is given by = (2 ⁄ ) ,
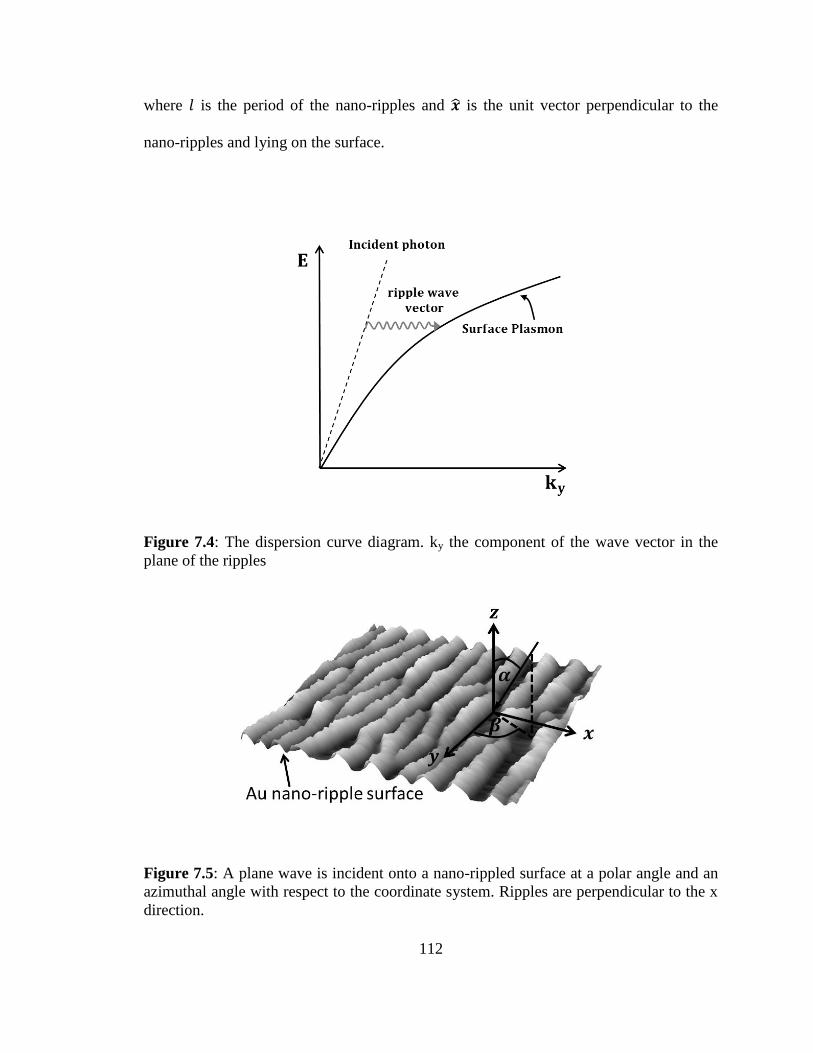
112
where is the period of the nano-ripples and is the unit vector perpendicular to the
nano-ripples and lying on the surface.
Figure 7.4: The dispersion curve diagram. ky the component of the wave vector in the
plane of the ripples
Figure 7.5: A plane wave is incident onto a nano-rippled surface at a polar angle and an
azimuthal angle with respect to the coordinate system. Ripples are perpendicular to the x
direction.
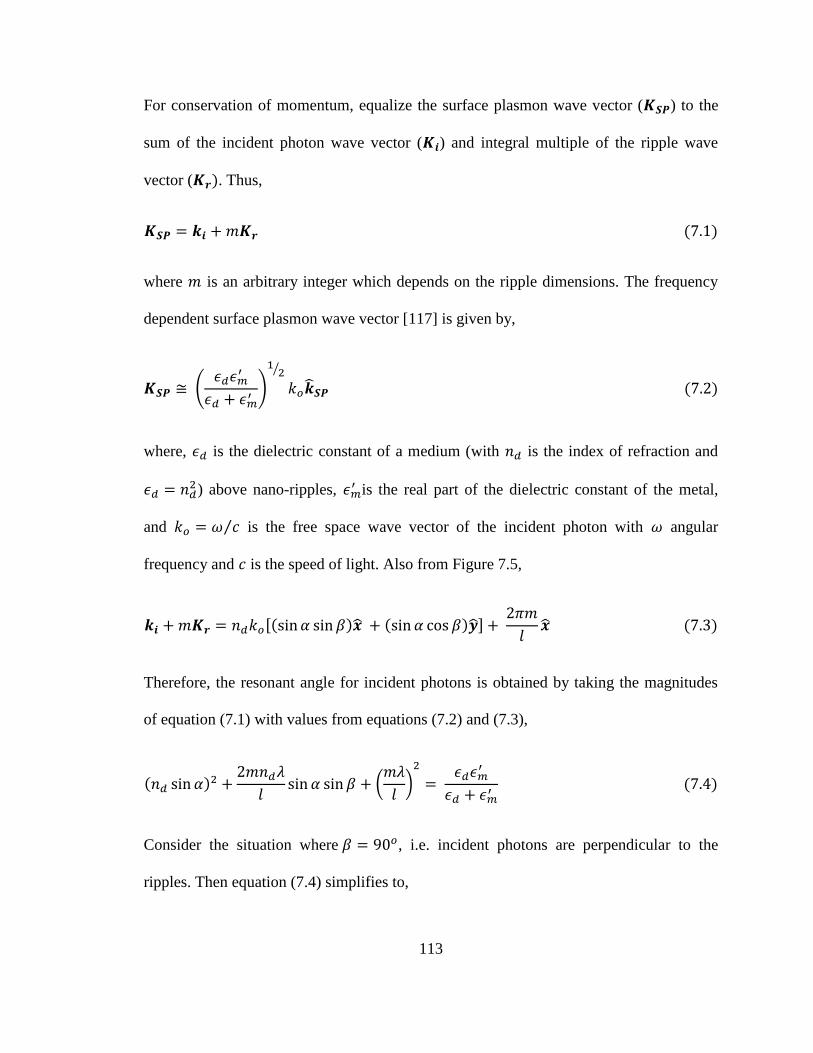
113
For conservation of momentum, equalize the surface plasmon wave vector ( ) to the
sum of the incident photon wave vector ( ) and integral multiple of the ripple wave
vector ( ). Thus,
= + 𝑚 (7.1)
where 𝑚 is an arbitrary integer which depends on the ripple dimensions. The frequency
dependent surface plasmon wave vector [117] is given by,
(
+ )
⁄
𝑘 (7.2)
where, is the dielectric constant of a medium (with is the index of refraction and
= ) above nano-ripples,
is the real part of the dielectric constant of the metal,
and 𝑘 = 𝑐⁄ is the free space wave vector of the incident photon with angular
frequency and 𝑐 is the speed of light. Also from Figure 7.5,
+ 𝑚 = 𝑘 [( ) + ( ) ] + 2 𝑚
(7.3)
Therefore, the resonant angle for incident photons is obtained by taking the magnitudes
of equation (7.1) with values from equations (7.2) and (7.3),
( ) +2𝑚
+ (
𝑚
)
=
+
(7. )
Consider the situation where = , i.e. incident photons are perpendicular to the
ripples. Then equation (7.4) simplifies to,
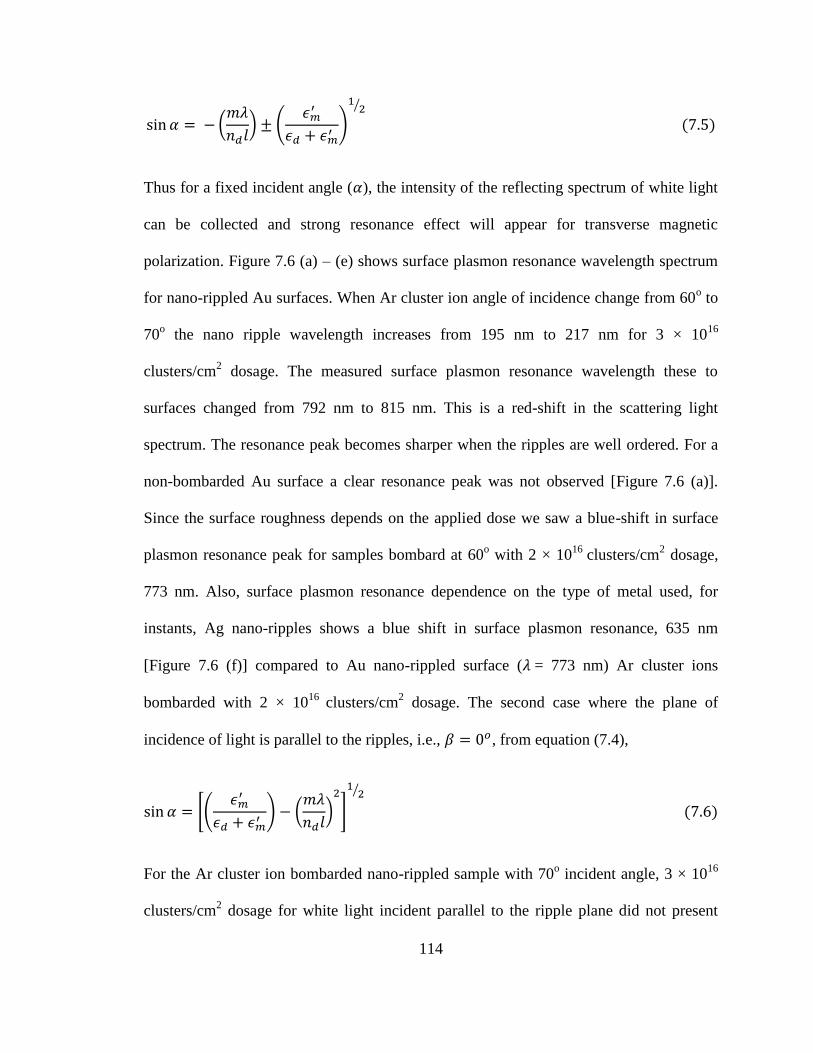
114
= − (𝑚
) (
+ )
⁄
(7.5)
Thus for a fixed incident angle ( ), the intensity of the reflecting spectrum of white light
can be collected and strong resonance effect will appear for transverse magnetic
polarization. Figure 7.6 (a) – (e) shows surface plasmon resonance wavelength spectrum
for nano-rippled Au surfaces. When Ar cluster ion angle of incidence change from 60o to
70o the nano ripple wavelength increases from 195 nm to 217 nm for 3 × 10
16
clusters/cm2 dosage. The measured surface plasmon resonance wavelength these to
surfaces changed from 792 nm to 815 nm. This is a red-shift in the scattering light
spectrum. The resonance peak becomes sharper when the ripples are well ordered. For a
non-bombarded Au surface a clear resonance peak was not observed [Figure 7.6 (a)].
Since the surface roughness depends on the applied dose we saw a blue-shift in surface
plasmon resonance peak for samples bombard at 60o with 2 × 10
16 clusters/cm
2 dosage,
773 nm. Also, surface plasmon resonance dependence on the type of metal used, for
instants, Ag nano-ripples shows a blue shift in surface plasmon resonance, 635 nm
[Figure 7.6 (f)] compared to Au nano-rippled surface ( = 773 nm) Ar cluster ions
bombarded with 2 × 10¹⁶
clusters/cm2 dosage. The second case where the plane of
incidence of light is parallel to the ripples, i.e., = , from equation (7.4),
= [(
+ ) − (
𝑚
)
]
⁄
(7. )
For the Ar cluster ion bombarded nano-rippled sample with 70o incident angle, 3 × 10
16
clusters/cm2 dosage for white light incident parallel to the ripple plane did not present
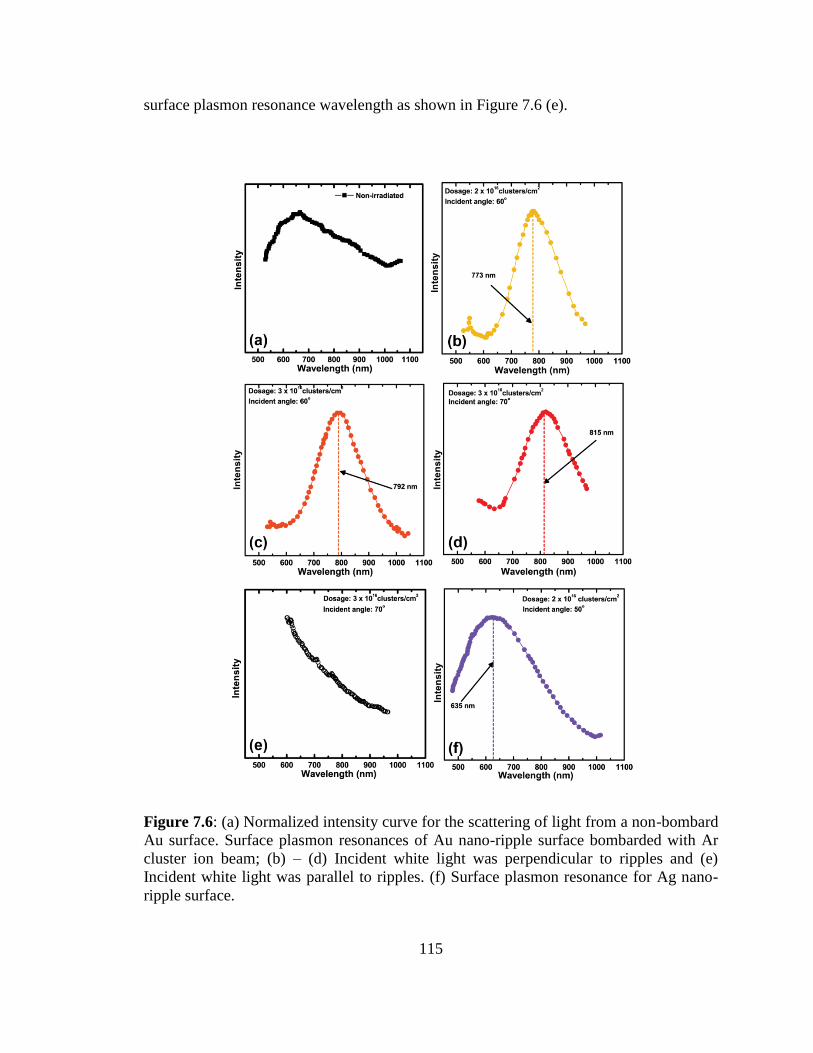
115
surface plasmon resonance wavelength as shown in Figure 7.6 (e).
Figure 7.6: (a) Normalized intensity curve for the scattering of light from a non-bombard
Au surface. Surface plasmon resonances of Au nano-ripple surface bombarded with Ar
cluster ion beam; (b) – (d) Incident white light was perpendicular to ripples and (e)
Incident white light was parallel to ripples. (f) Surface plasmon resonance for Ag nano-
ripple surface.
116
Chapter 8
Summary and Future Directions
8.1 Overview
In summary, the focus of this dissertation was to determine the gas cluster ion-induced
surface nano-rippling behavior under variable cluster ion beam parameters; (1) angle of
incidence, (2) energy per cluster ion, and (3) dosage. Ar cluster ion consists about 3000
atoms that provide more than thousand fold throughput advantage over a monomer ion.
In Chapter 5 I compared cluster and monomer ion-induced surface patterns on Si
surfaces. Monomer ion-induced nano-patterning highly rely on the energy, dose, ion
current density. The temperature of the target substrate rises up to about 150 oC and the
surface thermal activation plays an important role in monomer ion-induced nano-pattern
formation. Cluster ion beam bombardment increases the temperature instantaneously, but
overall substrate temperature did not change from the room temperature value of 24.5 oC.
During the cluster ion impact near-surface layer becomes amorphized and main structural
117
features that forms are nano-ripple patterns perpendicular to the cluster ion beam incident
direction.
The surface instability depends on the incident angle of the cluster ion beam. The
maximum instability was observed at an incident angle of 70o for a dose of 1 × 10
16
clusters/cm2 for Si substrate. However, geometrical shadowing limits the surface
roughness due to saturation with prolonged cluster ion beam bombardment. Saturation of
nano-ripples also depends on the angle of incidence of cluster ions. 60o angle of
incidence has a higher saturation dose compared at 70o. It was also observed that at a
dose of 1 × 10¹⁷
clusters/cm2, nano-ripples have a saw tooth structure at the incident
angle of 70o. For 60
o angle of incidence, the surface atomic accumulation on the upstream
of nano-ripple was high, which led to nano-dune formation at a dose of 1 × 10¹⁸
clusters/cm2.
Furthermore, in Chapter 6 I have investigated Au surface atom evolution with time
during off-normal bombardment of Ar cluster ion beam. Atoms undergo several
sputtering and diffusional processes on the surface depending on the applied cluster ion
beam energy and dose. These processes are (1) continuous sputtering into the vacuum
due to high energy collisions, (2) initial re-deposition of atoms, and (3) surface diffusion
of atoms. The first process is an independent of applied dosage, thus carries minimum
impact on the ripple formation. In the second process, atoms deposit close to the collision
site, which acts as a barrier for the next set of sputtering atoms. Even though this starts to
develop nan-ripples, ripples become well-ordered and grow due to surface diffusion and
upstream sputtering.
118
The amount of atoms sputtered from the surface depends on the angle of incidence of
cluster ions. The ripple height grows exponentially with the incident angle up to a
transition angle of 60o and then drops to a smooth surface at grazing incidence.
Additionally, in Chapter 7, I discussed two applications of Au nano-ripples, where we
tested nano-ripple surface wettability for different samples prepared by varying the
applied Ar cluster ion beam parameters, such as dose and angle of incidence. The contact
angle that is the angle between solid-liquid and liquid-vapor interfaces expresses the
degree of wetting of a surface. If CA > 90o the surface is hydrophobic and CA < 90
o the
surface is said to be hydrophilic. Understanding of CA variation with the surface
roughness is important for fundamental studies as well as for practical applications. We
discovered that for Au surface, CA increases with roughness up to a cluster ion beam
bombardment incident angle of 60o. At grazing incident angles, surface roughness is
similar to that of a smooth surface bombarded at 0o incident angle. Also the surface
roughness increases with Ar cluster ion beam dosage. However, this is shown for well-
ordered nano-ripple patterns at higher applied doses. The initial uneven variation of the
surface roughness and CA are due to ripening process of nano-ripples. The most
interesting CA observation of well-ordered nano-ripples was the anisotropic wetting
behavior. Results indicated that when CA was measured perpendicular to nano-ripples a
higher value of CA is accepted, compared to when measured parallel to nano-ripples.
These kinds of surfaces are useful for applications in directional self-cleaning surface,
and in biological cell guidance.
We have similarly presented that Au nano-ripple surfaces show a significant surface
119
plasmon resonance when the incident white light illuminates perpendicular to the nano-
ripples. This is due to formation of net charge difference at nano-ripple shorter width.
The imbalance in charge is created due to the displacement of conduction electrons in the
direction of light incidence and generates a strong localized electromagnetic field that
produces intense scattering of light around a resonance wavelength, which is similar to
the response shown by a diffraction grating. Off-normal Ar cluster ions produce nano-
ripples with variable dimensions, which create red or blue shift depending on the size of
nano-ripples and the wavelength of the nano-ripples. When the incident white light is
parallel to nano-ripples we do not observe surface plasmon resonance due to the length of
nano-ripples receding nano-particle behavior, which weakens localized electromagnetic
field. Surface plasmon resonance depends on the dielectric constant of the metal, size and
shape of nano-ripples.
8.2 Proposed Future Directions
Majority of this study was spent on cluster ion beam parameter optimization. Thus, in
future I suggest following activities for further characterization and development of a
theoretical model on cluster ion-induced nano-ripple formation:
Study cross-sectional transmission electron microscope of nano-ripples to determine
amorphization of surfaces and to determine accumulation of atoms on the upstream of
ripples.
120
Theoretical modeling and simulation of cluster ion-induced nano-ripples for different
substrates (metallic, semiconductor, alloy and polymer).
Characterization of nano-dot formation on metallic surfaces by target rotation and
ripple migration investigation by applying obstacles on ripple paths.
Research chemical and physical effects of cluster ion beam modified surfaces on
biological cell adhesion.
Investigation of anisotropy of nano-ripple parameters on surface wetting and its
applications of monolayer coating of surfactants and proteins.
Study surfaces plasmonic resonance for Ag substrates and evaluate a correlation
between nano-ripple wavelength and plasmonic resonance wavelength.
Optimization of parameters for thermal annealing effects on nano-rippled compound
materials and study structural evolution during recrystallization.
Since nano-ripples become well-ordered at high dosage these surfaces can be used as
templates for nano-rod size selection, which is useful for producing nano-sized
devices. Studies on this area will lead to efficient method for nano-rod selection.
Compare macroscopic ripple patterns to nano-ripple patterns by using pattern
recognition software to determine the universality of ripple pattern formation.
121
Bibliography
[1] D. C. Jacobs, "The role of internal energy and approach geometry in
molecule/surface reactive scattering", Journal of Physics-Condensed Matter 7 (6),
1023-1045 (1995).
[2] L. Hanley and S. B. Sinnott, "The growth and modification of materials via ion-
surface processing", Surface Science 500 (1-3), 500-522 (2002).
[3] P. Jensen, "Growth of nanostructures by cluster deposition: Experiments and
simple models", Reviews of Modern Physics 71 (5), 1695-1735 (1999).
[4] C. Xirouchaki, "Surface nanostructures created by cluster-surface impact",
Vacuum 73 (1), 123-129 (2004).
[5] W. K. Chu, Y. P. Li, J. R. Liu, J. Z. Wu, S. C. Tidrow, N. Toyoda, J. Matsuo, and
I. Yamada, "Smoothing of YBa2Cu3O7-δ films by ion cluster beam bombardment",
Applied Physics Letters 72 (2), 246-248 (1998).
[6] H. Chen, S. W. Liu, X. M. Wang, M. N. Iliev, C. L. Chen, X. K. Yu, J. R. Liu, K.
Ma, and W. K. Chu, "Smoothing of ZnO films by gas cluster ion beam", Nuclear
Instruments & Methods in Physics Research Section B-Beam Interactions with
Materials and Atoms 241 (1-4), 630-635 (2005).
[7] X. M. Wang, X. M. Lu, L. Shao, J. R. Liu, and W. K. Chu, "Small cluster ions
from source of negative ions by cesium sputtering", Nuclear Instruments &
Methods in Physics Research Section B-Beam Interactions with Materials and
Atoms 196 (1-2), 198-204 (2002).
122
[8] J. Krauser, A. K. Nix, H. G. Gehrke, H. Hofsass, C. Trautmann, and A.
Weidinger, "Highly conductive ion tracks in tetrahedral amorphous carbon by
irradiation with 30 mev c-60 projectiles", New Journal of Physics 13, 1-13 (2011).
[9] I. Yamada, "New horizons in material processing with ICB", Proceedings of 14th
Symposium on Ion Sources Ion-Assisted Technology, Tokyo, Japan, 227-235
(1991).
[10] J. A. Greer, D. B. Fenner, J. Hautala, L. P. Allen, V. DiFilippo, N. Toyoda, I.
Yamada, J. Matsuo, E. Minami, and H. Katsumata, "Etching, smoothing, and
deposition with gas-cluster ion beam technology", Surface & Coatings
Technology 133, 273-282 (2000).
[11] R. MacCrimmon, J. Hautala, M. Gwinn, and S. Sherman, "Gas cluster ion beam
infusion processing of semiconductors", Nuclear Instruments & Methods in
Physics Research Section B-Beam Interactions with Materials and Atoms 242 (1-
2), 427-430 (2006).
[12] A. R. Kirkpatrick and V. DiFilippo, "Method and system for improving the
effectiveness of artificial hip joints by the application of gas cluster ion beam
technology", US Patent No. 6,491,800 B2 (2002).
[13] S. Ninomiya, K. Ichiki, H. Yamada, Y. Nakata, T. Seki, T. Aoki, and J. Matsuo,
"Precise and fast secondary ion mass spectrometry depth profiling of polymer
materials with large ar cluster ion beams", Rapid Communications in Mass
Spectrometry 23 (11), 1601-1606 (2009).
[14] Z. Insepov and I. Yamada, "Molecular dynamics study of shock wave generation
by cluster impact on solid targets", Nuclear Instruments & Methods in Physics
123
Research Section B-Beam Interactions with Materials and Atoms 112 (1-4), 16-22
(1996).
[15] H. Chen, F. Chen, X. M. Wang, X. K. Yu, J. R. Liu, K. B. Ma, W. K. Chu, H. H.
Cheng, I. S. Yu, Y. T. Ho, and K. Y. Horng, "Smoothing of Si0.7Ge0.3 virtual
substrates by gas-cluster-ion beam", Applied Physics Letters 87, 103,504 (2005).
[16] H. Chen, M. N. Iliev, J. R. Liu, K. B. Ma, W. K. Chu, N. Badi, A. Bensaoula, and
E. B. Svedberg, "Room-temperature deposition of diamond-like carbon field
emitter on flexible substrates", Nuclear Instruments & Methods in Physics
Research Section B-Beam Interactions with Materials and Atoms 243 (1), 75-78
(2006).
[17] I. Yamada, J. Matsuo, N. Toyoda, and A. Kirkpatrick, "Materials processing by
gas cluster ion beams", Materials Science & Engineering R-Reports 34 (6), 231-
295 (2001).
[18] R. A. Bagnold, "The physics of blown sand and desert dunes", Chapman and Hall
(1941).
[19] H. Yizhaq, N. J. Balmforth, and A. Provenzale, "Blown by wind: Nonlinear
dynamics of aeolian sand ripples", Physica D-Nonlinear Phenomena 195 (3-4),
207-228 (2004).
[20] R. S. Anderson, "Eolian ripples as examples of self-organization in
geomorphological systems", Earth-Science Reviews 29 (1-4), 77-96 (1990).
[21] D. A. Rumpel, "Successive aeolian saltation - studies of idealized collisions",
Sedimentology 32 (2), 267-280 (1985).
124
[22] S. Mitha, M. Q. Tran, B. T. Werner, and P. K. Haff, "The grain-bed impact
process in aeolian saltation", Acta Mechanica 63 (1-4), 267-278 (1986).
[23] R. S. Anderson, "A theoretical-model for aeolian impact ripples", Sedimentology
34 (5), 943-956 (1987).
[24] L. Prigozhin, "Nonlinear dynamics of aeolian sand ripples", Physical Review E 60
(1), 729-733 (1999).
[25] J. Lindhard and M. Scharff, "Energy loss in matter by fast particles of low
charge", Det Kongelige Danske Videnskabernes selskab: Matematisk-fysiske
meddeleser 27 (15), 1-31 (1953).
[26] J. F. Ziegler, J. P. Biersack, and U. Littmark, "The stopping and range of ions in
solids", Pergamon Press, Inc. (1985).
[27] M. Navez, D. Chaperot, and C. Sella, "Microscopie electronique - etude de
lattaque du verre par bombardement ionique", Comptes Rendus Hebdomadaires
Des Seances De L Academie Des Sciences 254 (2), 240-248 (1962).
[28] R. M. Bradley and J. M. E. Harper, "Theory of ripple topography induced by ion-
bombardment", Journal of Vacuum Science & Technology a-Vacuum Surfaces
and Films 6 (4), 2390-2395 (1988).
[29] G. Carter, "The physics and applications of ion beam erosion", Journal of Physics
D-Applied Physics 34 (3), R1-R22 (2001).
[30] M. A. Makeev, R. Cuerno, and A. L. Barabasi, "Morphology of ion-sputtered
surfaces", Nuclear Instruments & Methods in Physics Research Section B-Beam
Interactions with Materials and Atoms 197 (3-4), 185-227 (2002).
125
[31] D. G. Cahill, "Morphological instabilities in thin-film growth and etching",
Journal of Vacuum Science & Technology A 21 (5), S110-S116 (2003).
[32] T. Aste and U. Valbusa, "Ripples and ripples: From sandy deserts to ion-sputtered
surfaces", New Journal of Physics 7 (122), 1-23 (2005).
[33] T. K. Chini, D. P. Datta, and S. R. Bhattacharyya, "Ripple formation on silicon by
medium energy ion bombardment", Journal of Physics-Condensed Matter 21,
224,004 (2009).
[34] E. Chason and W. L. Chan, "Spontaneous patterning of surfaces by low-energy
ion beams", Materials Science with Ion Beams 116, 53-71 (2010).
[35] W. L. Chan and E. Chason, "Making waves: Kinetic processes controlling surface
evolution during low energy ion sputtering", Journal of Applied Physics 101,
121,301 (2007).
[36] G. Carter, "The effects of surface ripples on sputtering erosion rates and
secondary ion emission yields", Journal of Applied Physics 85 (1), 455-459
(1999).
[37] J. Munoz-Garcia, M. Castro, and R. Cuerno, "Nonlinear ripple dynamics on
amorphous surfaces patterned by ion beam sputtering", Physical Review Letters
96, 086,101 (2006).
[38] W. R. Grove, "VII. On the electro-chemical polarity of gases", Philosophical
Transactions of the Royal Society of London 142, 87-101 (1853).
[39] B. Ziberi, F. Frost, T. Hoche, and B. Rauschenbach, "Ripple pattern formation on
silicon surfaces by low-energy ion-beam erosion: Experiment and theory",
Physical Review B 72, 235,310 (2005).
126
[40] M. Cornejo, B. Ziberi, C. Meinecke, D. Hirsch, J. W. Gerlach, T. Hoche, F. Frost,
and B. Rauschenbach, "Self-organized patterning on si(001) by ion sputtering
with simultaneous metal incorporation", Applied Physics a-Materials Science &
Processing 102 (3), 593-599 (2011).
[41] Y. Yamamura, "Computer-simulation of ionized cluster beam bombardment on a
carbon substrate", Nuclear Instruments & Methods in Physics Research Section
B-Beam Interactions with Materials and Atoms 45 (1-4), 707-713 (1990).
[42] N. Toyoda, J. Matsuo, and I. Yamada, "The sputtering effects of cluster ion
beams", Application of Accelerators in Research and Industry - Proceedings of
the Fourteenth International Conference, Pts 1 and 2 (392), 483-486 (1997).
[43] N. Toyoda, H. Kitani, N. Hagiwara, T. Aoki, J. Matsuo, and I. Yamada, "Angular
distributions of the particles sputtered with ar cluster ions", Materials Chemistry
and Physics 54 (1-3), 262-265 (1998).
[44] E. W. Becker, K. Bier, and W. Henkes, "Strahlen aus kondensierten atomen und
molekeln im hochvakuum", Zeitschrift Fur Physik 146 (3), 333-338 (1956).
[45] W. Henkes, "Production of plasma by injection of charged hydrogen clusters",
Physics Letters 12 (4), 322-323 (1964).
[46] R. Middleton, "Survey of negative-ions from a cesium sputter source", Nuclear
Instruments & Methods 144 (3), 373-399 (1977).
[47] T. G. Dietz, M. A. Duncan, D. E. Powers, and R. E. Smalley, "Laser production
of supersonic metal cluster beams", Journal of Chemical Physics 74 (11), 6511-
6512 (1981).
127
[48] G. Gantefor, H. R. Siekmann, H. O. Lutz, and K. H. Meiwesbroer, "Pure metal
and metal-doped rare-gas clusters grown in a pulsed-arc cluster ion-source",
Chemical Physics Letters 165 (4), 293-296 (1990).
[49] K. Sattler, J. Muhlbach, and E. Recknagel, "Generation of metal-clusters
containing from 2 to 500 atoms", Physical Review Letters 45 (10), 821-824
(1980).
[50] G. H. Takaoka, H. Noguchi, and Y. Hironaka, "Production of liquid cluster ions
and their application to surface etching", Nuclear Instruments & Methods in
Physics Research Section B-Beam Interactions with Materials and Atoms 242 (1-
2), 100-103 (2006).
[51] L. D. Landau and E. M. Lifshitz, "Fluid mechanics", Pergamon Press (1959).
[52] H. Dun, B. L. Mattes, and D. A. Stevenson, "Gas-dynamics of a conical nozzle
molecular-beam sampling system", Chemical Physics 38 (2), 161-172 (1979).
[53] D. R. Miller, in "Atomic and molecular beam methods, vol. 1", edited by G.
Scoles, Oxford University Press (1988).
[54] J. M. Soler, N. Garcia, O. Echt, K. Sattler, and E. Recknagel, "Microcluster
growth - transition from successive monomer addition to coagulation", Physical
Review Letters 49 (25), 1857-1860 (1982).
[55] O. F. Hagena, "Nucleation and growth of clusters in expanding nozzle flows",
Surface Science 106 (1-3), 101-116 (1981).
[56] H. Ashkenas and F. S. Sherman, in "Rarefied gas dynamics, vol. 2", edited by J.
H. DeLeeuw, Academic Press (1966).
128
[57] N. Toyoda, T. Mashita, and I. Yamada, "Nano structure formation by gas cluster
ion beam irradiations at oblique incidence", Nuclear Instruments & Methods in
Physics Research Section B-Beam Interactions with Materials and Atoms 232,
212-216 (2005).
[58] W. K. Chu, J. W. Mayer, and M. A. Nicolet, "Backscattering spectrometry",
Academic Press (1978).
[59] J. F. Ziegler, J. P. Biersack, and M. D. Ziegler, "Srim: The stopping range of ions
in matter", SRIM Co. (2008).
[60] D. V. Morgan, "Channeling: Theory, observation and applications", John Wiley
and Sons (1973).
[61] P. Klapetek, D. Necas, and C. Anderson, "Gwyddion 2.24", The Free Software
Foundation (2011).
[62] T. Young, "An essay on the cohesion of fluids", Philosophical Transactions of
Royal Society of London 95, 65-87 (1805).
[63] R. N. Wenzel, "Resistance of solid surfaces to wetting by water", Industrial and
Engineering Chemistry 28 (8), 988-994 (1936).
[64] A. B. D. Cassie and S. Baxter, "Wettability of porous surfaces", Transactions of
the Faraday Society 40, 546-551 (1944).
[65] C. F. Bohren and D. R. Huffman, "Absorption and scattering of light by small
particles", Wiley (1983).
[66] U. Kreibig and M. Vollmer, "Optical properties of metal clusters, vol. 25",
Springer (1995).
129
[67] Q. B. Xu, J. M. Bao, F. Capasso, and G. M. Whitesides, "Surface plasmon
resonances of free-standing gold nanowires fabricated by nanoskiving",
Angewandte Chemie-International Edition 45 (22), 3631-3635 (2006).
[68] R. Gago, L. Vazquez, R. Cuerno, M. Varela, C. Ballesteros, and J. M. Albella,
"Production of ordered silicon nanocrystals by low-energy ion sputtering",
Applied Physics Letters 78 (21), 3316-3318 (2001).
[69] S. Habenicht, K. P. Lieb, J. Koch, and A. D. Wieck, "Ripple propagation and
velocity dispersion on ion-beam-eroded silicon surfaces", Physical Review B 65,
115,327 (2002).
[70] A. D. Brown, J. Erlebacher, W. L. Chan, and E. Chason, "Transient topographies
of ion patterned si(111)", Physical Review Letters 95, 056,101 (2005).
[71] B. Ziberi, F. Frost, T. Hoche, and B. Rauschenbach, "Ripple pattern formation on
silicon surfaces by low-energy ion-beam erosion: Experiment and theory",
Physical Review B 72, 235,310 (2005).
[72] T. K. Chini, D. P. Datta, and S. R. Bhattacharyya, "Ripple formation on silicon by
medium energy ion bombardment", Journal of Physics-Condensed Matter 21,
224,004 (2009).
[73] A. Keller, R. Cuerno, S. Facsko, and W. Moller, "Anisotropic scaling of ripple
morphologies on high-fluence sputtered silicon", Physical Review B 79, 115,437
(2009).
[74] C. S. Madi, H. B. George, and M. J. Aziz, "Linear stability and instability patterns
in ion-sputtered silicon", Journal of Physics-Condensed Matter 21, 224,010
(2009).
130
[75] S. K. Garg, V. Venugopal, T. Basu, O. P. Sinha, S. Rath, D. Kanjilal, and T. Som,
"Evolution of ripple morphology on Si(100) by 60-keV argon ions", Applied
Surface Science 258 (9), 4135-4138 (2012).
[76] S. Park, B. Kahng, H. Jeong, and A. L. Barabasi, "Dynamics of ripple formation
in sputter erosion: Nonlinear phenomena", Physical Review Letters 83 (17), 3486-
3489 (1999).
[77] T. Aste and U. Valbusa, "Ripples and ripples: From sandy deserts to ion-sputtered
surfaces", New Journal of Physics 7 (2005).
[78] J. Munoz-Garcia, M. Castro, and R. Cuerno, "Nonlinear ripple dynamics on
amorphous surfaces patterned by ion beam sputtering", Physical Review Letters
96 (8) (2006).
[79] W. L. Chan and E. Chason, "Making waves: Kinetic processes controlling surface
evolution during low energy ion sputtering", Journal of Applied Physics 101 (12)
(2007).
[80] H. Chen, "Cluster ion beam modification of material surfaces", Ph.D.
Dissertation, University of Houston (2006).
[81] H. Kitani, N. Toyoda, J. Matsuo, and I. Yamada, "Incident angle dependence of
the sputtering effect of ar-cluster-ion bombardment", Nuclear Instruments &
Methods in Physics Research Section B-Beam Interactions with Materials and
Atoms 121 (1-4), 489-492 (1997).
[82] D. P. Datta and T. K. Chini, "Coarsening of ion-beam-induced surface ripple in si:
Nonlinear effect vs. Geometrical shadowing", Physical Review B 76, 075,323
(2007).
131
[83] D. P. Datta and T. K. Chini, "Atomic force microscopy study of 60-keV Ar-ion-
induced ripple patterns on Si(100)", Physical Review B 69, 235,313 (2004).
[84] J. Lapujoulade, "The roughening of metal surfaces", Surface Science Reports 20
(4), 191-249 (1994).
[85] P. Karmakar and D. Ghose, "Nanoscale periodic and faceted structures formation
on si(100) by oblique angle oxygen ion sputtering", Nuclear Instruments &
Methods in Physics Research Section B-Beam Interactions with Materials and
Atoms 230, 539-544 (2005).
[86] U. Valbusa, C. Boragno, and F. B. de Mongeot, "Nanostructuring surfaces by ion
sputtering", Journal of Physics-Condensed Matter 14 (35), 8153-8175 (2002).
[87] H. H. Andersen, "Nonlinear effects in collisional sputtering under cluster impact",
Fundamental Processes in Sputtering of Atoms and Molecules (Sput92), 127-153
(1993).
[88] I. Yamada, J. Matsuo, Z. Insepov, T. Aoki, T. Seki, and N. Toyoda, "Nano-
processing with gas cluster ion beams", Nuclear Instruments & Methods in
Physics Research Section B-Beam Interactions with Materials and Atoms 164,
944-959 (2000).
[89] J. F. Ziegler, J. P. Biersack, and M. D. Ziegler, "Srim: The stopping and range of
ions in matter", SRIM Co. (2008).
[90] N. Toyoda and I. Yamada, "Cluster size dependence of surface morphology after
gas cluster ion bombardments", Nuclear Instruments & Methods in Physics
Research Section B-Beam Interactions with Materials and Atoms 266 (10), 2529-
2532 (2008).
132
[91] T. Aoki, T. Seki, and J. Matsuo, "Molecular dynamics study of crater formation
by core-shell structured cluster impact", Nuclear Instruments & Methods in
Physics Research Section B-Beam Interactions with Materials and Atoms 282,
29-32 (2012).
[92] P. Sigmund, "Theory of sputtering. I. Sputtering yield of amorphous and
polycrystalline targets", Physical Review 184 (2), 383-416 (1969).
[93] G. K. Wehner and D. Rosenberg, "Angular distribution of sputtered material",
Journal of Applied Physics 31 (1), 177-179 (1960).
[94] M. I. Rabinovich, A. B. Ezersky, and P. D. Weidman, "The dynamics of
patterns", World Scientific (2000).
[95] G. Ehrlich and F. G. Hudda, "Atomic view of surface self-diffusion - tungsten on
tungsten", Journal of Chemical Physics 44 (3), 1039-1049 (1966).
[96] Schwoebe.Rl, "Step motion on crystal surfaces .2.", Journal of Applied Physics 40
(2), 614-618 (1969).
[97] J. Munoz-Garcia, R. Cuerno, and M. Castro, "Coupling of morphology to surface
transport in ion-beam irradiated surfaces: Oblique incidence", Physical Review B
78, 205,408 (2008).
[98] X. M. Li, D. Reinhoudt, and M. Crego-Calama, "What do we need for a
superhydrophobic surface? A review on the recent progress in the preparation of
superhydrophobic surfaces", Chemical Society Reviews 36 (8), 1350-1368
(2007).
[99] R. Blossey, "Self-cleaning surfaces - virtual realities", Nature Materials 2 (5),
301-306 (2003).
133
[100] W. Barthlott and C. Neinhuis, "Purity of the sacred lotus, or escape from
contamination in biological surfaces", Planta 202 (1), 1-8 (1997).
[101] A. Lafuma and D. Quere, "Superhydrophobic states", Nature Materials 2 (7), 457-
460 (2003).
[102] H. Tsuji, P. Sommani, T. Kitamura, M. Hattori, H. Sato, Y. Gotoh, and J.
Ishikawa, "Nerve-cell attachment properties of polystyrene and silicone rubber
modified by carbon negative-ion implantation", Surface & Coatings Technology
201 (19-20), 8123-8126 (2007).
[103] T. Limongi, F. Cesca, F. Gentile, R. Marotta, R. Ruffilli, A. Barberis, M. Dal
Maschio, E. M. Petrini, S. Santoriello, F. Benfenati, and E. Di Fabrizio,
"Nanostructured superhydrophobic substrates trigger the development of 3d
neuronal networks", Small, 201,201,377 (2012).
[104] T. Young, "An essay on the cohesion of fluids", Philosophical Transactions of the
Royal Society of London 95, 65-87 (1805).
[105] R. N. Wenzel, "Resistance of solid surfaces to wetting by water", Industrial &
Engineering Chemistry 28 (8), 988-994 (1936).
[106] A. B. D. Cassie and S. Baxter, "Wettability of porous surfaces", Transactions of
the Faraday Society 40 (0), 546-551 (1944).
[107] H. Kusumaatmaja, R. J. Vrancken, C. W. M. Bastiaansen, and J. M. Yeomans,
"Anisotropic drop morphologies on corrugated surfaces", Langmuir 24 (14),
7299-7308 (2008).
134
[108] D. Xia, L. M. Johnson, and G. P. López, "Anisotropic wetting surfaces with one-
dimesional and directional structures: Fabrication approaches, wetting properties
and potential applications", Advanced Materials 24 (10), 1287-1302 (2012).
[109] D. Pines and D. Bohm, "A collective description of electron interactions: Ii.
Collective vs individual particle aspects of the interactions", Physical Review 85
(2), 338-353 (1952).
[110] R. H. Ritchie, "Plasma losses by fast electrons in thin films", Physical Review
106 (5), 874-881 (1957).
[111] S. Nie and S. R. Emory, "Probing single molecules and single nanoparticles by
surface-enhanced raman scattering", Science 275 (5303), 1102-1106 (1997).
[112] W. L. Barnes, A. Dereux, and T. W. Ebbesen, "Surface plasmon subwavelength
optics", Nature 424 (6950), 824-830 (2003).
[113] S. Schultz, D. R. Smith, J. J. Mock, and D. A. Schultz, "Single-target molecule
detection with nonbleaching multicolor optical immunolabels", Proceedings of the
National Academy of Sciences of the United States of America 97 (3), 996-1001
(2000).
[114] Y. W. C. Cao, R. Jin, and C. A. Mirkin, "Nanoparticles with raman spectroscopic
fingerprints for DNA and rna detection", Science 297 (5586), 1536-1540 (2002).
[115] D. Sarid and W. Challener, "Modern introduction to surface plasmons: Theory,
mathematica modeling, and applications", Cambridge University Press (2010).
[116] R. W. Wood, "Anomalous diffraction gratings", Physical Review 48 (12), 928-
936 (1935).
135
[117] J. R. Sambles, G. W. Bradbery, and F. Z. Yang, "Optical-excitation of surface-
plasmons - an introduction", Contemporary Physics 32 (3), 173-183 (1991).
[118] P. Sigmund, "Mechanism of surface micro-roughening by ion-bombardment",
Journal of Materials Science 8 (11), 1545-1553 (1973).
[119] R. Cuerno, H. A. Makse, S. Tomassone, S. T. Harrington, and H. E. Stanley,
"Stochastic-model for surface erosion via ion sputtering - dynamical evolution
from ripple morphology to rough morphology", Physical Review Letters 75 (24),
4464-4467 (1995).
[120] R. Cuerno and A. L. Barabasi, "Dynamic scaling of ion-sputtered surfaces",
Physical Review Letters 74 (23), 4746-4749 (1995).
[121] R. I. Schwoebel, "Step motion on crystal surfaces .2.", Journal of Applied Physics
40 (2), 614-618 (1969).
[122] G. Costantini, S. Rusponi, F. B. de Mongeot, C. Boragno, and U. Valbusa,
"Periodic structures induced by normal-incidence sputtering on ag(110) and
ag(001): Flux and temperature dependence", Journal of Physics-Condensed
Matter 13 (26), 5875-5891 (2001).
[123] J. Villain, "Continuum models of crystal-growth from atomic-beams with and
without desorption", Journal De Physique I 1 (1), 19-42 (1991).
136
Appendix A
Brief Description of Models Associated
with Monomer Ion-induced Surface
Patterns
A.1 The Bradley and Harper Model for Surface
Sputtering-based Pattern Formation
The Bradley and Harper model [28] on ripple formation on amorphous materials takes
Sigmund’s theory of sputtering [118] as a starting point. According to Sigmund’s theory,
atom sputtering is caused by a physical process. This is only applicable for amorphous
materials. The probability for an atom to be sputtered from the surface is proportional to
the interstitial energy transfer from the neighboring atom which was bombarded with an
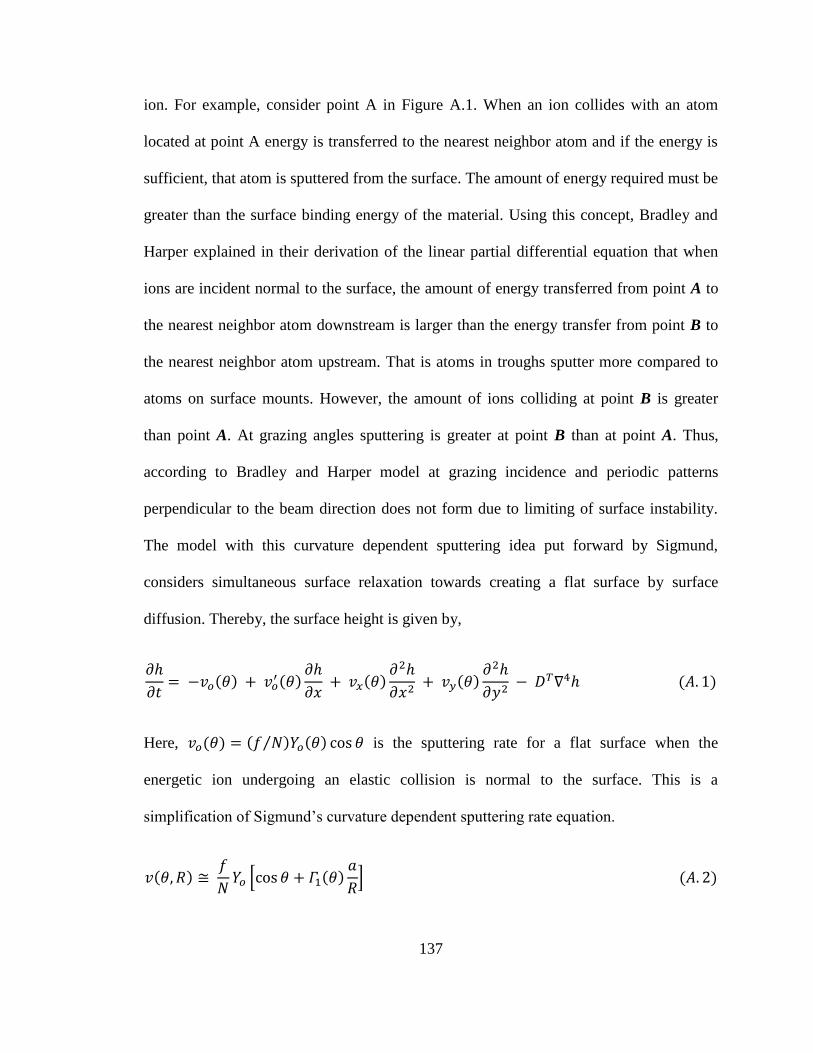
137
ion. For example, consider point A in Figure A.1. When an ion collides with an atom
located at point A energy is transferred to the nearest neighbor atom and if the energy is
sufficient, that atom is sputtered from the surface. The amount of energy required must be
greater than the surface binding energy of the material. Using this concept, Bradley and
Harper explained in their derivation of the linear partial differential equation that when
ions are incident normal to the surface, the amount of energy transferred from point A to
the nearest neighbor atom downstream is larger than the energy transfer from point B to
the nearest neighbor atom upstream. That is atoms in troughs sputter more compared to
atoms on surface mounts. However, the amount of ions colliding at point B is greater
than point A. At grazing angles sputtering is greater at point B than at point A. Thus,
according to Bradley and Harper model at grazing incidence and periodic patterns
perpendicular to the beam direction does not form due to limiting of surface instability.
The model with this curvature dependent sputtering idea put forward by Sigmund,
considers simultaneous surface relaxation towards creating a flat surface by surface
diffusion. Thereby, the surface height is given by,
= −𝑣 ( ) + 𝑣
( )
+ 𝑣 ( )
+ 𝑣 ( )
− 𝐷 ( . 1)
Here, 𝑣 ( ) = ( ⁄ ) ( ) is the sputtering rate for a flat surface when the
energetic ion undergoing an elastic collision is normal to the surface. This is a
simplification of Sigmund’s curvature dependent sputtering rate equation.
𝑣( )
[ + ( )
] ( . 2)
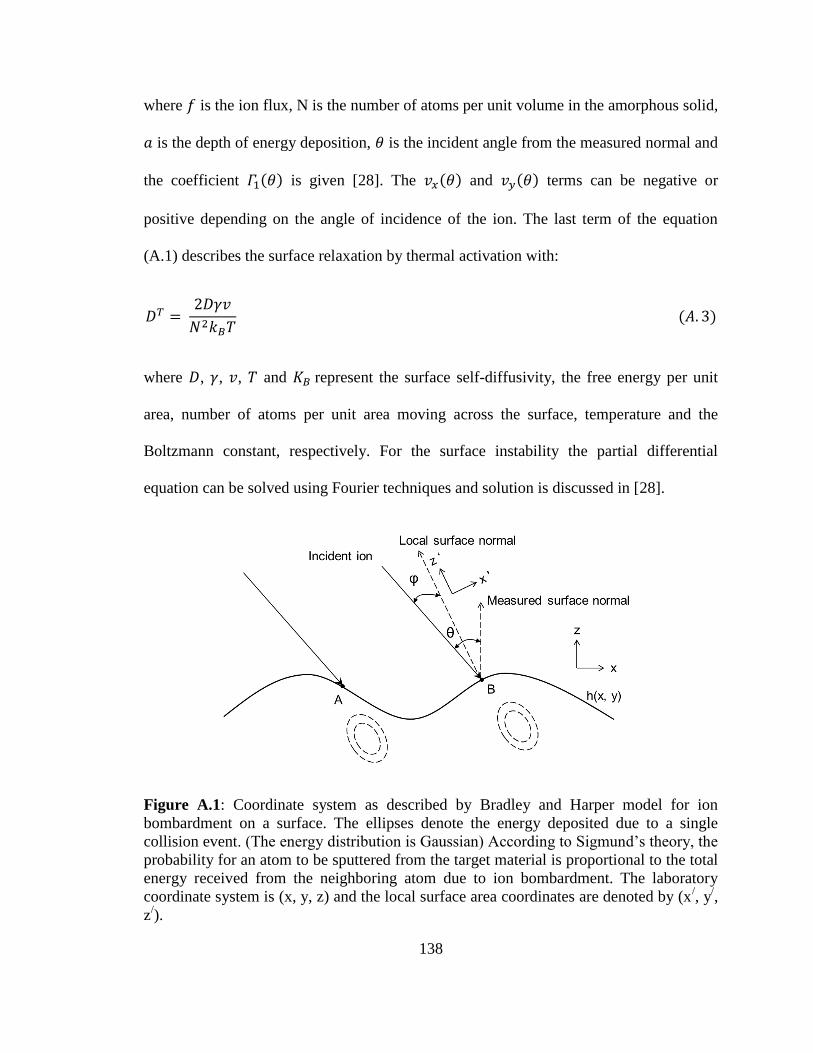
138
where is the ion flux, N is the number of atoms per unit volume in the amorphous solid,
is the depth of energy deposition, is the incident angle from the measured normal and
the coefficient ( ) is given [28]. The 𝑣 ( ) and 𝑣 ( ) terms can be negative or
positive depending on the angle of incidence of the ion. The last term of the equation
(A.1) describes the surface relaxation by thermal activation with:
𝐷 = 2𝐷𝛾𝑣
𝑘 𝑇 ( . 3)
where 𝐷, 𝛾, 𝑣, 𝑇 and represent the surface self-diffusivity, the free energy per unit
area, number of atoms per unit area moving across the surface, temperature and the
Boltzmann constant, respectively. For the surface instability the partial differential
equation can be solved using Fourier techniques and solution is discussed in [28].
Figure A.1: Coordinate system as described by Bradley and Harper model for ion
bombardment on a surface. The ellipses denote the energy deposited due to a single
collision event. (The energy distribution is Gaussian) According to Sigmund’s theory, the
probability for an atom to be sputtered from the target material is proportional to the total
energy received from the neighboring atom due to ion bombardment. The laboratory
coordinate system is (x, y, z) and the local surface area coordinates are denoted by (x/, y
/,
z/).
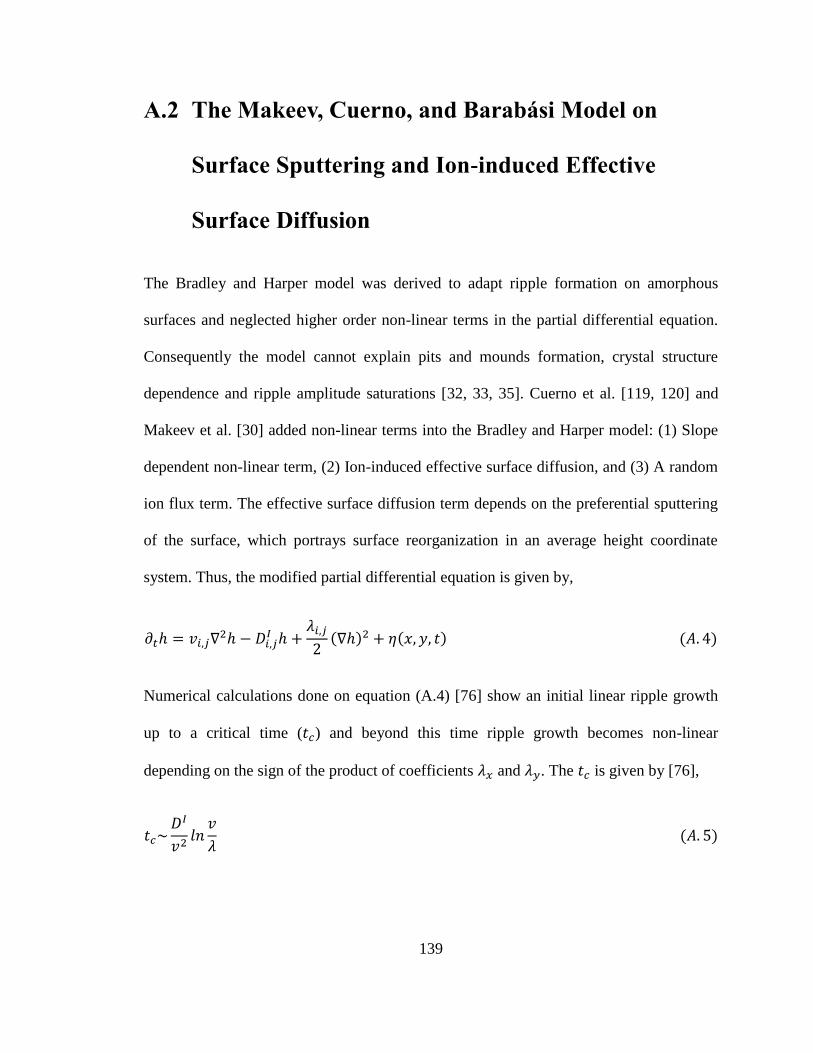
139
A.2 The Makeev, Cuerno, and Barabási Model on
Surface Sputtering and Ion-induced Effective
Surface Diffusion
The Bradley and Harper model was derived to adapt ripple formation on amorphous
surfaces and neglected higher order non-linear terms in the partial differential equation.
Consequently the model cannot explain pits and mounds formation, crystal structure
dependence and ripple amplitude saturations [32, 33, 35]. Cuerno et al. [119, 120] and
Makeev et al. [30] added non-linear terms into the Bradley and Harper model: (1) Slope
dependent non-linear term, (2) Ion-induced effective surface diffusion, and (3) A random
ion flux term. The effective surface diffusion term depends on the preferential sputtering
of the surface, which portrays surface reorganization in an average height coordinate
system. Thus, the modified partial differential equation is given by,
= 𝑣 − 𝐷
+
2( ) + ( ) ( . )
Numerical calculations done on equation (A.4) [76] show an initial linear ripple growth
up to a critical time ( ) and beyond this time ripple growth becomes non-linear
depending on the sign of the product of coefficients and . The is given by [76],
𝐷
𝑣
𝑣
( . 5)
140
where, 𝑣, 𝐷 and are perpendicular to the direction of ripples. The main differences
between equations (A.1) and (A.4) are absence of the zeroth order term in equation (A.4)
and instead of the thermally activated diffusion term (𝐷 ), equation (A.4) includes ion-
induced effective diffusion term (𝐷 ). This model neglects the high beam current density
heating of substrates.
A.3 The Shadowing Effect Model
The linear growth of ripples with time due to monomer ion beam bombardment is
predicted by the Bradley and Harper model and the linear Makeev, Cuerno and Barabási
model. According to the Makeev, Cuerno and Barabási model the non-linear regime
surface structures depend on the sign of the term in equation (A.4) and this is yet to
be proven experimentally. The ripple height saturation with time for monomer ion
bombardment is also explained using geometrical shadowing of ion beam by Carter [36].
The argument put forward by this model is once an ion beam incident onto the surface at
an angle, existing surface features may block or shadow the ion beam on the upstream of
surface features depending on the slope of the ripples. Figure A.2 (b) shows the limiting
slope angle of surface ripples; beyond this beam becomes shadowed. The Shadowing
effect is significant at grazing incident angles [Figure A.2 (c)]. The result of prolonged
bombardment at grazing angles leads to saw tooth like structures and saturation as shown
in Figure A.2 (d).
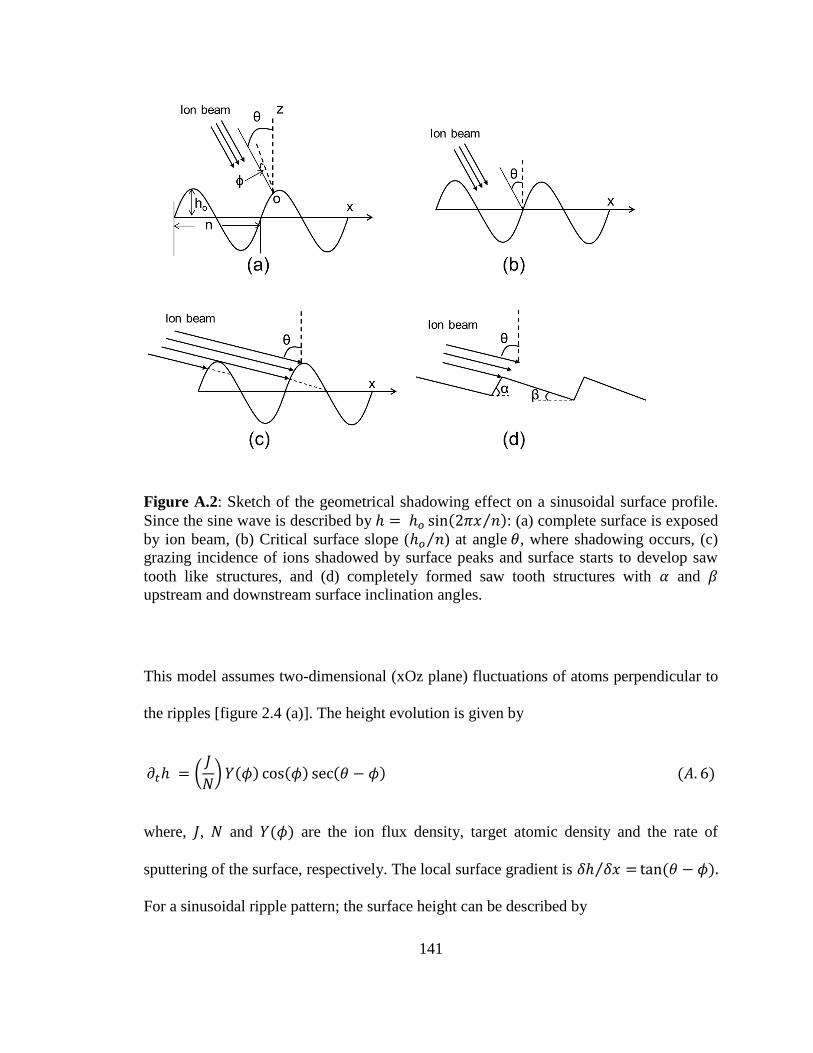
141
Figure A.2: Sketch of the geometrical shadowing effect on a sinusoidal surface profile.
Since the sine wave is described by = (2 ⁄ ): (a) complete surface is exposed
by ion beam, (b) Critical surface slope ( ⁄ ) at angle , where shadowing occurs, (c)
grazing incidence of ions shadowed by surface peaks and surface starts to develop saw
tooth like structures, and (d) completely formed saw tooth structures with and
upstream and downstream surface inclination angles.
This model assumes two-dimensional (xOz plane) fluctuations of atoms perpendicular to
the ripples [figure 2.4 (a)]. The height evolution is given by
= (
) ( ) ( ) ( − ) ( . )
where, , and ( ) are the ion flux density, target atomic density and the rate of
sputtering of the surface, respectively. The local surface gradient is =⁄ ( − ).
For a sinusoidal ripple pattern; the surface height can be described by
142
= (2
) ( . 7)
where is the amplitude of ripples and is the wavelength. When the amplitude to
wavelength ratio increases the maximum pattern slope increases and as a consequence the
local surface angle ( ) decreases and eventually beam shadowing processes become
dominant creating saturation of ripples. To avoid ion beam shadowing, beam conditions
should satisfy the following relation
(
2− )
2
( . )
A.4 The Diffusion Barrier Model (Ehrlich-Schwoebel
Barrier)
Ehrlich-Schwoebel barrier [95, 121] triggered mass flow is used to study patterns formed
due to sputtering on metallic surfaces such as pits, mounds, and ripples oriented with the
crystal structure [122, 86]. The Bradley and Harper model is unable to predict these
structures [35]. Originally the Ehrlich-Schwoebel barrier model was proposed for
roughening process of epitaxial growth by Villain [123]. According to the model the
Ehrlich-Schwoebel barrier induces adatom and vacancies which diffuse across step edges
(Figure A.3) and cause nucleation to produce surface roughness. The model demonstrates
ripple formation in crystalline directions [35]. Evidently, for amorphous surfaces this
method is not applicable [83].
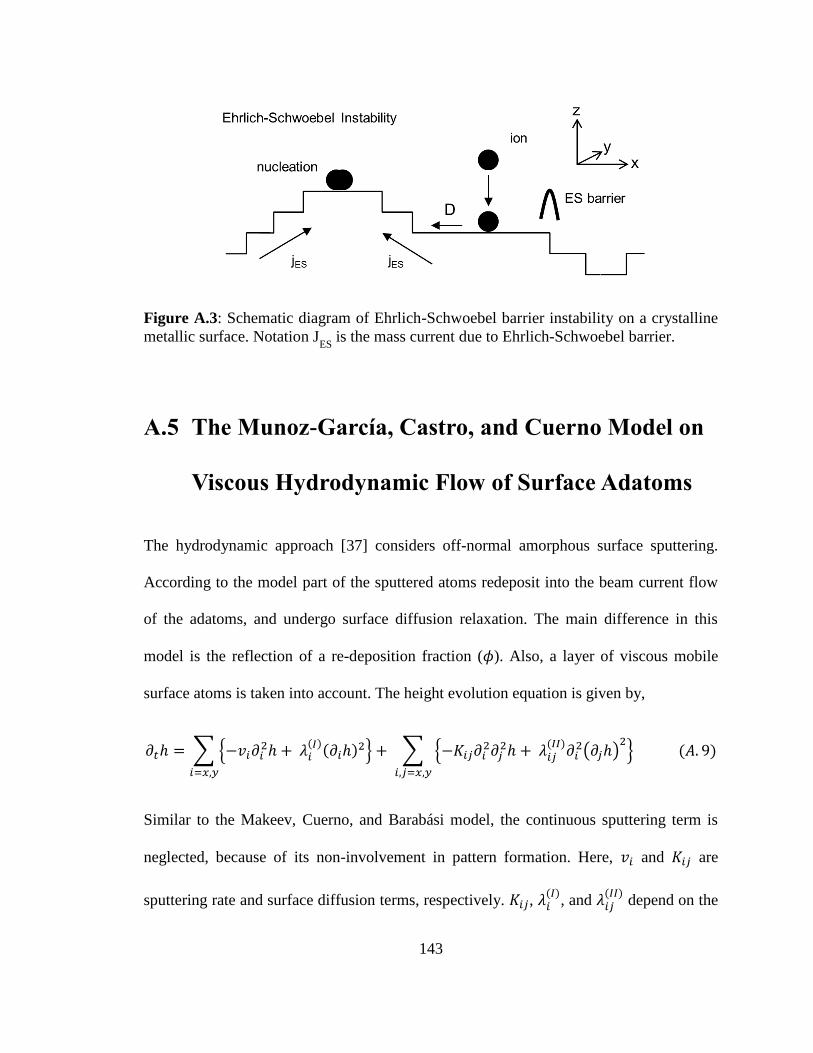
143
Figure A.3: Schematic diagram of Ehrlich-Schwoebel barrier instability on a crystalline
metallic surface. Notation JES
is the mass current due to Ehrlich-Schwoebel barrier.
A.5 The Munoz-García, Castro, and Cuerno Model on
Viscous Hydrodynamic Flow of Surface Adatoms
The hydrodynamic approach [37] considers off-normal amorphous surface sputtering.
According to the model part of the sputtered atoms redeposit into the beam current flow
of the adatoms, and undergo surface diffusion relaxation. The main difference in this
model is the reflection of a re-deposition fraction ( ). Also, a layer of viscous mobile
surface atoms is taken into account. The height evolution equation is given by,
= ∑ {−𝑣 +
( )( ) }
+ ∑ {−
+ ( )
( )
}
( . )
Similar to the Makeev, Cuerno, and Barabási model, the continuous sputtering term is
neglected, because of its non-involvement in pattern formation. Here, 𝑣 and are
sputtering rate and surface diffusion terms, respectively. , ( )
, and ( )
depend on the
144
redeposition fraction ( ), ion beam angle of incidence ( ) and on the average fraction of
mobile atoms that contribute to surface smoothing. Introduction of non-linear terms ( )
,
and ( )
prompts ripple dynamic features such as saturation, wavelength increase, ripple
rotation, and kinetic roughening.