Embed Size (px)
Citation preview
Graduate Theses and Dissertations Iowa State University Capstones, Theses andDissertations
2009
Self-centering bridge pier columns with structuralfusesMark Christopher CurrieIowa State University
Follow this and additional works at: https://lib.dr.iastate.edu/etd
Part of the Civil and Environmental Engineering Commons
This Thesis is brought to you for free and open access by the Iowa State University Capstones, Theses and Dissertations at Iowa State University DigitalRepository. It has been accepted for inclusion in Graduate Theses and Dissertations by an authorized administrator of Iowa State University DigitalRepository. For more information, please contact [email protected].
Recommended CitationCurrie, Mark Christopher, "Self-centering bridge pier columns with structural fuses" (2009). Graduate Theses and Dissertations. 11230.https://lib.dr.iastate.edu/etd/11230
Self-centering bridge pier columns with structural fuses
by
Mark Christopher Currie
A thesis submitted to the graduate faculty
in partial fulfillment of the requirements for the degree of
MASTER OF SCIENCE
Major: Civil Engineering (Structural Engineering)
Program of Study Committee: Jon M. Rouse, Major Professor
F. Wayne Klaiber Kelly Strong
Iowa State University
Ames, Iowa
2009
Copyright © Mark Christopher Currie, 2009. All rights reserved.
ii TABLE OF CONTENTS LIST OF FIGURES ....................................................................................................................... iv LIST OF TABLES......................................................................................................................... ix ABSTRACT.................................................................................................................................... x 1. INTRODUCTION ...................................................................................................................... 1
1.1 Background........................................................................................................................... 1 1.2 Objectives ............................................................................................................................. 3 1.3 Proposed Structural System .................................................................................................. 4 1.4 Research Methodology ......................................................................................................... 7
2. TEST SETUP AND PROCEDURE ......................................................................................... 11 2.1 Laboratory Constraints........................................................................................................ 11 2.2 Column Erection ................................................................................................................. 14 2.3 Instrumentation ................................................................................................................... 15 2.4 Testing Procedure ............................................................................................................... 18
3. DESIGN OF SPECIMENS....................................................................................................... 20 3.1 Design Approach ................................................................................................................ 20 3.2 Specimen Details ................................................................................................................ 22
4. SPECIMEN CONSTRUCTION............................................................................................... 31 4.1 Foundation Blocks .............................................................................................................. 31 4.2 Column Specimens ............................................................................................................. 33 4.3 System Impacts on Labor, Construction, and Materials ..................................................... 48
5. COLUMN MATERIAL PROPERTIES................................................................................... 50 5.1 Bearing Plates ..................................................................................................................... 50 5.2 Fuse Plates .......................................................................................................................... 54 5.3 Concrete .............................................................................................................................. 57
6. QUALITATIVE TEST RESULTS AND DESCRIPTION OF DAMAGE ............................. 59 6.1 Loading Conditions and Terminology ................................................................................ 59 6.2 Column 1 Results................................................................................................................ 60 6.3 Column 2 Results................................................................................................................ 69 6.4 Column 3 Results................................................................................................................ 77 6.5 Column 4 Results................................................................................................................ 85 6.6 Column 5 Results................................................................................................................ 93 6.7 Column 6 Results.............................................................................................................. 111
7. QUANTITATIVE TEST RESULTS AND ANALYSES ...................................................... 125 7.1 Notes from the tests of Columns 2, 3, and 4..................................................................... 125 7.2 Performance Indicators ..................................................................................................... 125 7.3 Lateral Load Displacement ............................................................................................... 126 7.4 Lateral Load Capacity and Displacement at Peak Lateral Load....................................... 133 7.5 Initial Lateral Stiffness and Residual Lateral Stiffness..................................................... 134 7.6 Energy Dissipation............................................................................................................ 138 7.7 Residual Displacement...................................................................................................... 142 7.8 Longitudinal Reinforcement Strain................................................................................... 145 7.9 Foundation Connection Results ........................................................................................ 150 7.10 Analytical Predictions of Behavior................................................................................. 151
iii
7.11 Analytical Predictions..................................................................................................... 167 8. CONCLUSIONS..................................................................................................................... 169
8.1 Summary ........................................................................................................................... 169 8.2 Construction Aspects ........................................................................................................ 169 8.3 Structural Detailing........................................................................................................... 170 8.4 Structural Behavior Aspects ............................................................................................. 171 8.5 Repair Aspects .................................................................................................................. 171
9. RECOMMENDED RESEARCH ........................................................................................... 173 10. REFERNCES........................................................................................................................ 175 ACKNOWLEDGEMENTS........................................................................................................ 176 BIOGRAPHICAL SKETCH ...................................................................................................... 177
iv
LIST OF FIGURES Figure 1. Basic pier assembly (isometric view)...............................................................................5 Figure 2. Steel collars at segment ends............................................................................................5 Figure 3. Single column segment with external connectors. ...........................................................6 Figure 4. Close-up of typical joints..................................................................................................6 Figure 5. Test columns.....................................................................................................................8 Figure 6. Test schematic. ...............................................................................................................11 Figure 7. Test setup........................................................................................................................12 Figure 8. Photograph of load beam from above. ...........................................................................13 Figure 9. Photographs of Column 1 socket and column placement. .............................................14 Figure 10. Photograph of actuator connection to column..............................................................15 Figure 11. Photograph of strain gages on 2-ft. segment of Column 5. ..........................................16 Figure 12. Instrumentation schematic............................................................................................17 Figure 13. Photograph of instrumentation. ....................................................................................17 Figure 14. Displacement regimen. .................................................................................................19 Figure 15. Base end of control column reinforcement cage. .........................................................23 Figure 16. Photographs of column 2-4 reinforcement. ..................................................................24 Figure 17. Collar for Columns 2–4. ...............................................................................................24 Figure 18. Reinforcement in Columns 1-4. ...................................................................................25 Figure 19. Column 5 details...........................................................................................................27 Figure 20. Column 5 mild steel reinforcement in the 2 ft. segment. .............................................28 Figure 21. Column 6 details...........................................................................................................29 Figure 22. Column 6 mild steel reinforcement in the 2 ft. segment. .............................................30 Figure 23. Column 6 collar. ...........................................................................................................30 Figure 24. Foundation details. .......................................................................................................31 Figure 25. Photograph of center socket reinforcement. .................................................................31 Figure 26. Photograph of foundation reinforcement cage. ............................................................32 Figure 27. Photographs of center socket boxout............................................................................32 Figure 28. Photograph of foundation reinforcement and tie-down ducts in forms........................33 Figure 29. Photograph of boxout in forms.....................................................................................33 Figure 30. Photograph of Column 1 reinforcement. ......................................................................34 Figure 31. Photograph of chairs and reinforcement in Column 1..................................................34 Figure 32. Photograph of base end of Column 1. ..........................................................................34 Figure 33. Photographs of lifting inserts........................................................................................35 Figure 34. Photograph of Column 2 bulkhead...............................................................................36 Figure 35. Photograph of Column 2 collar end..............................................................................36 Figure 36. Photograph of top of Column 2. ...................................................................................36 Figure 37. Photograph of Column 2 Strain gages..........................................................................37 Figure 38. Photograph of reinforcement of Column 2 (2 ft. column segment). ............................37 Figure 39. Photograph of Column 2 reinforcement in forms.........................................................37 Figure 40. Photograph of Column 2 steel collar with bolt through-ducts. ....................................38 Figure 41. Photograph of Column 3 collar and end plate. .............................................................39 Figure 42. Photograph of Column 3, 2 ft. segment reinforcement. ...............................................39 Figure 43. Photograph of Column 3, 2 ft. segment reinforcement in forms..................................39
v Figure 44. Photograph of Column 3 strain gages. .........................................................................40 Figure 45. Photograph of Column 3 reinforcement and inserts.....................................................40 Figure 46. Photograph of Column 4, 2 ft. segment........................................................................40 Figure 47. Photograph of Column 4 collar region congestion.......................................................41 Figure 48. Photograph of Column 4, 12 ft. segment reinforcement. .............................................41 Figure 49. Photograph of Column 3 foundation reinforcement in forms. .....................................41 Figure 50. Photograph of Column 4 foundation reinforcement in forms. .....................................42 Figure 51. Photographs of Column 4 alterations. ..........................................................................43 Figure 52. Photograph of Column 5, 2 ft. segment reinforcement. ...............................................44 Figure 53. Photograph Column 5 collar reinforcement anchorages. .............................................44 Figure 54. Photograph of Column 5 collar end plate.....................................................................45 Figure 55. Photograph of Column 5, 12 ft. segment collared end. ................................................45 Figure 56. Photograph of Column 6 collar and end anchorage details. .........................................46 Figure 57 Photograph of Column 6, 2 ft. segment reinforcement and collar. ...............................46 Figure 58 Photograph of Column 6 collar and end plate. ..............................................................47 Figure 59. Photograph of Column 6 in forms. ..............................................................................47 Figure 60. Photograph of Column 6 boxouts and lifting inserts....................................................47 Figure 61. Photograph of edge compression test. ..........................................................................51 Figure 62. Bearing plate compression test results. ........................................................................51 Figure 63. Photograph of epoxy grout plate. .................................................................................52 Figure 64. Polymer concrete bearing plate. ...................................................................................53 Figure 65. GFRP plate. ..................................................................................................................53 Figure 66. Typical stress vs. strain relationship for A36 steel used in fuse plates. .......................55 Figure 67. Typical stress vs. strain for 1018 carbon steel used in fuse plates. ..............................55 Figure 68. Typical stress vs. strain for SMA used in fuse plates...................................................56 Figure 69. Concrete strength gain..................................................................................................58 Figure 70. Top view of test setup showing column orientation in test frame................................59 Figure 71. Photographs of Column 1 - Cycle 8. ............................................................................61 Figure 72. Photographs of Column 1 - Cycle 11 base cracking. ...................................................61 Figure 73. Photographs of Column 1 - Cycle 11 progressive cracking. ........................................62 Figure 74. Photographs of Column 1 - Cycle 14. ..........................................................................62 Figure 75. Photographs of Column 1 - Cycle 20. ..........................................................................63 Figure 76. Photographs of Column 1 - Cycle 22. ..........................................................................63 Figure 77. Photographs of Column 1 - Cycle 23. ..........................................................................64 Figure 78. Photograph of Column 1 – Cycle 24 damage to southwest corner ..............................64 Figure 79. Photographs of Column 1 - Cycle 24. ..........................................................................65 Figure 80. Photographs of Column 1 - Cycle 25. ..........................................................................65 Figure 81. Photographs of Column 1 - Cycle 26. ..........................................................................66 Figure 82. Photographs of Column 1 - Cycle 27 damage/frame impingement. ............................67 Figure 83. Photographs of Column 1 - Cycle 27 damage and deformation. .................................68 Figure 84. Photographs of Column 1 – After testing.....................................................................68 Figure 85. Photographs of Column 2 – Cycle 11a initial cracking................................................71 Figure 86. Photographs of Column 2 – Cycle 11a upper column crack progression. ...................72 Figure 87. Photographs of Column 2 – Cycle 14a.........................................................................72 Figure 88. Photographs of Column 2 – Cycle 15a.........................................................................73 Figure 89. Photographs of Column 2 – Cycle 16b.........................................................................74
vi Figure 90. Photographs of Column 2 – Cycle 21b.........................................................................75 Figure 91. Photographs of Column 2 – Cycle 23b east face..........................................................75 Figure 92. Photographs of Column 2 – Cycle 23b.........................................................................76 Figure 93. Photographs of Column 3 – Prior to testing. ................................................................78 Figure 94. Photographs of Column 3 – Cycle 10a east face..........................................................79 Figure 95. Photographs of Column 3 – Cycle 10a west face.........................................................79 Figure 96. Photographs of Column 3 – Cycle 14a fuse plates.......................................................80 Figure 97. Photographs of Column 3 – Cycle 14a.........................................................................80 Figure 98. Photographs of Column 3 – Replacement fuse plates. .................................................81 Figure 99. Photographs of Column 3 – Cycle 16b.........................................................................81 Figure 100. Photograph of Column 3 – Cycle 18b west face damage...........................................82 Figure 101. Photograph of Column 3 – Cycle 19b east fuse plate buckling. ................................82 Figure 102. Photograph of Column 3 – Cycle 21b joint opening during push half-cycle. ............83 Figure 103. Photograph of Column 3 – Cycle 21b West fuse plate buckling. ..............................83 Figure 104. Photographs of Column 3 – Cycle 21b pull half-cycle. .............................................84 Figure 105. Photographs of Column 3 – Cycle 22b.......................................................................85 Figure 106. Photographs of Column 4 – Column prior to testing. ................................................86 Figure 107. Photographs of Column 4 – Cycle 7a.........................................................................87 Figure 108. Photograph of Column 4 – Cycle 7a east face. ..........................................................87 Figure 109. Photographs of Column 4 – Cycle 11a.......................................................................88 Figure 110. Photographs of Column 4 – Cycle 15a.......................................................................88 Figure 111. Photographs of Column 4 – Cycle 15a joint. .............................................................89 Figure 112. Photograph of Column 4 – Cycle 16a southeast retrofit angle damage. ....................89 Figure 113. Photographs of Column 4 – Start of test 4b. ..............................................................90 Figure 114. Photograph of Column 4 – Cycle 19b west face of upper column segment. .............90 Figure 115. Photographs of Column 4 – Cycle 21b north and east faces......................................91 Figure 116. Photographs of Column 4 – Cycle 21b south and west faces.....................................91 Figure 117. Photographs of Column 4 – Cycle 22b.......................................................................92 Figure 118. Photograph of Column 5 – Prior to testing.................................................................95 Figure 119. Photograph of Column 5 – Cycle 10a east face initial cracking. ...............................96 Figure 120. Photograph of Column 5 – Cycle 10a southeast corner view of cracking. ................96 Figure 121. Photographs of Column 5 – Cycle 13a east face........................................................97 Figure 122. Photographs of Column 5 – Cycle 13a west face.......................................................97 Figure 123. Photographs of Column 5 – Cycle 14a west face.......................................................98 Figure 124. Photographs of Column 5 – Cycle 15a.......................................................................98 Figure 125. Photographs of Column 5 – Cycle 16a.......................................................................99 Figure 126. Photographs of Column 5 – Cycle 18b west fuse plate buckling.............................100 Figure 127. Photographs of Column 5 – Cycle 21b.....................................................................100 Figure 128. Photographs of Column 5 – Cycle 23b.....................................................................101 Figure 129. Photographs of Column 5 – Cycle 24b joint opening. .............................................101 Figure 130. Photographs of Column 5 – Cycle 24b.....................................................................102 Figure 131. Photographs of Column 5 – Cycle 26b.....................................................................103 Figure 132. Photographs of Column 5 – Cycle 27b push half-cycle. ..........................................104 Figure 133. Photographs of Column 5 – Cycle 27b pull half-cycle. ...........................................105 Figure 134. Photographs of Column 5 – Cycle 28b.....................................................................106 Figure 135. Photographs of Column 5 – Cycle 29b.....................................................................107
vii Figure 136. Photographs of Column 5 – Cycle 30b push half-cycle. ..........................................108 Figure 137. Photographs of Column 5 – Cycle 30b pull half-cycle. ...........................................109 Figure 138. Photographs of Column 5 – After test. .....................................................................109 Figure 139. Photographs of Column 5 – Final damage after test. ...............................................110 Figure 140. Photographs of Column 6 – Segment joint prior to testing. .....................................113 Figure 141. Photograph of Column 6 prior to testing..................................................................114 Figure 142. Photographs of Column 6 – Cycle 11a.....................................................................114 Figure 143. Photographs of Column 6 – Cycle 13a.....................................................................115 Figure 144. Column 6 – Cycle 16a. .............................................................................................115 Figure 145. Photographs of Column 6 – Start of “b” portion of test. ..........................................116 Figure 146. Photographs of Column 6 – Cycle 17b.....................................................................116 Figure 147. Photographs of Column 6 – Cycle 18b.....................................................................117 Figure 148. Photographs of Column 6 – Cycle 19b.....................................................................117 Figure 149. Photographs of Column 6 – Cycle 20b.....................................................................118 Figure 150. Photographs of Column 6 – Cycle 21b, joint opening. ............................................118 Figure 151. Photographs of Column 6 – Cycle 23b, push half-cycle. .........................................119 Figure 152. Column 6 – Cycle 23b, pull half-cycle.....................................................................120 Figure 153. Photographs of Column 6 – Cycle 26b.....................................................................120 Figure 154. Photograph of Column 6 – Cycle 26b, east joint opening........................................121 Figure 155. Photograph of Column 6 – Cycle 26b, column damage...........................................121 Figure 156. Photographs of Column 6 – Cycle 28b.....................................................................122 Figure 157. Photographs of Column 6 – Cycle 29b fuse plate crack. .........................................123 Figure 158. Photographs of Column 6 – Cycle 29b.....................................................................123 Figure 159. Test 1 load vs. displacement hysteresis through Cycle 16. ......................................127 Figure 160. Test 1 load vs. displacement hysteresis....................................................................127 Figure 161. Test 2a load vs. displacement hysteresis. .................................................................128 Figure 162. Test 2b load vs. displacement hysteresis..................................................................128 Figure 163. Test 3a load vs. displacement hysteresis. .................................................................129 Figure 164. Test 3b load vs. displacement hysteresis..................................................................129 Figure 165. Test 4a load vs. displacement hysteresis. .................................................................130 Figure 166. Test 4b load vs. displacement hysteresis..................................................................130 Figure 167. Test 5a load vs. displacement hysteresis. .................................................................131 Figure 168. Test 5b load vs. displacement hysteresis..................................................................131 Figure 169. Test 6a load vs. displacement hysteresis. .................................................................132 Figure 170. Test 6b load vs. displacement hysteresis..................................................................132 Figure 171. Test “a” lateral stiffness comparisons between Columns 1, 5, and 6.......................137 Figure 172. Test “b” lateral stiffness comparisons between Columns 1, 5, and 6.......................137 Figure 173. Test “b” energy dissipation comparisons between Columns 1, 5, and 6..................140 Figure 174. Test "b" residual displacements................................................................................143 Figure 175. Column 1 longitudinal reinforcement strain through 2.5 in. displacement cycle. ...146 Figure 176. Column 1 longitudinal reinforcement strain for the entire test. ...............................146 Figure 177. Column 5a lower segment longitudinal reinforcement strain. .................................147 Figure 178. Column 5b lower segment longitudinal reinforcement strain. .................................147 Figure 179. Column 5a upper segment longitudinal reinforcement strain. .................................148 Figure 180. Column 5b upper longitudinal reinforcement strain. ...............................................148 Figure 181. Column 6a lower segment longitudinal reinforcement strain. .................................149
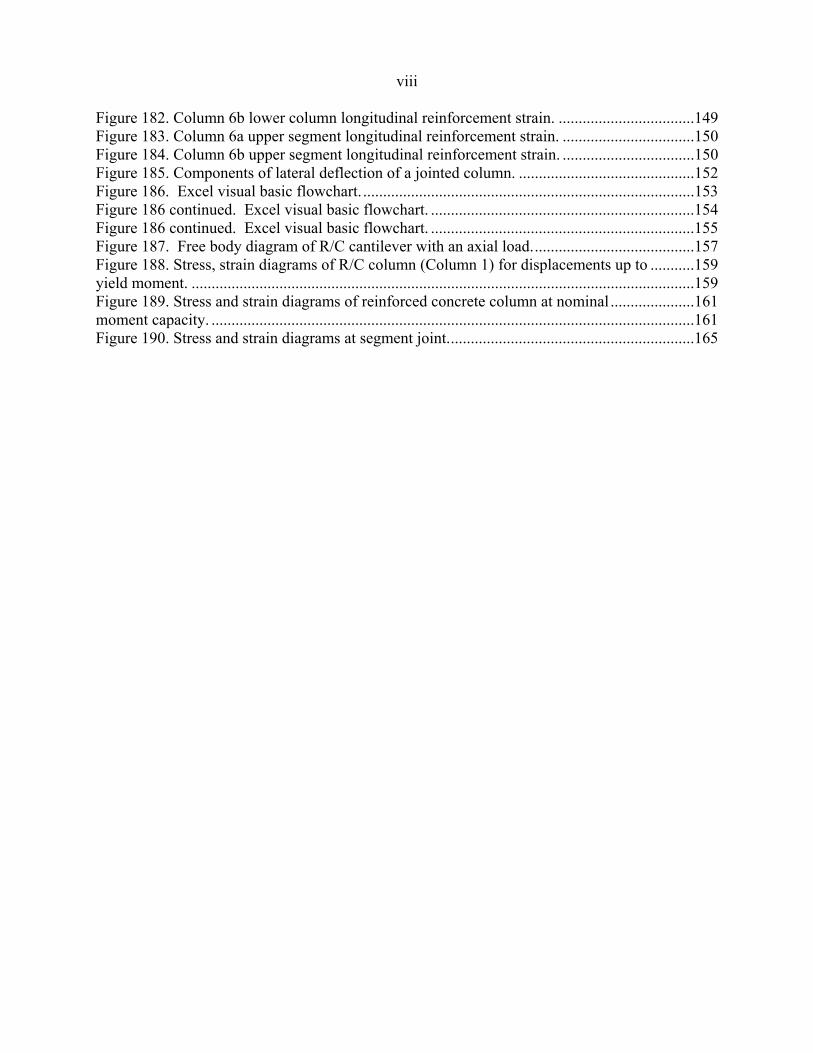
viii Figure 182. Column 6b lower column longitudinal reinforcement strain. ..................................149 Figure 183. Column 6a upper segment longitudinal reinforcement strain. .................................150 Figure 184. Column 6b upper segment longitudinal reinforcement strain. .................................150 Figure 185. Components of lateral deflection of a jointed column. ............................................152 Figure 186. Excel visual basic flowchart. ...................................................................................153 Figure 186 continued. Excel visual basic flowchart. ..................................................................154 Figure 186 continued. Excel visual basic flowchart. ..................................................................155 Figure 187. Free body diagram of R/C cantilever with an axial load.........................................157 Figure 188. Stress, strain diagrams of R/C column (Column 1) for displacements up to ...........159 yield moment. ..............................................................................................................................159 Figure 189. Stress and strain diagrams of reinforced concrete column at nominal .....................161 moment capacity. .........................................................................................................................161 Figure 190. Stress and strain diagrams at segment joint..............................................................165
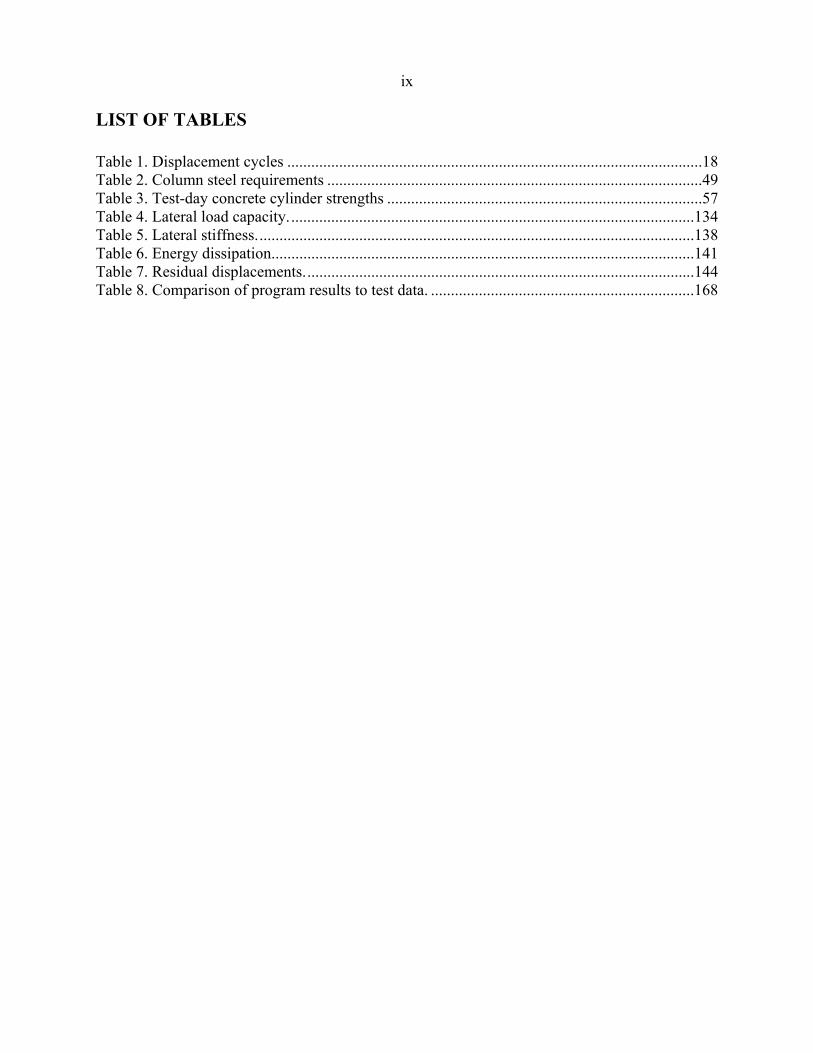
ix LIST OF TABLES Table 1. Displacement cycles ........................................................................................................18 Table 2. Column steel requirements ..............................................................................................49 Table 3. Test-day concrete cylinder strengths ...............................................................................57 Table 4. Lateral load capacity......................................................................................................134 Table 5. Lateral stiffness..............................................................................................................138 Table 6. Energy dissipation..........................................................................................................141 Table 7. Residual displacements..................................................................................................144 Table 8. Comparison of program results to test data. ..................................................................168
x
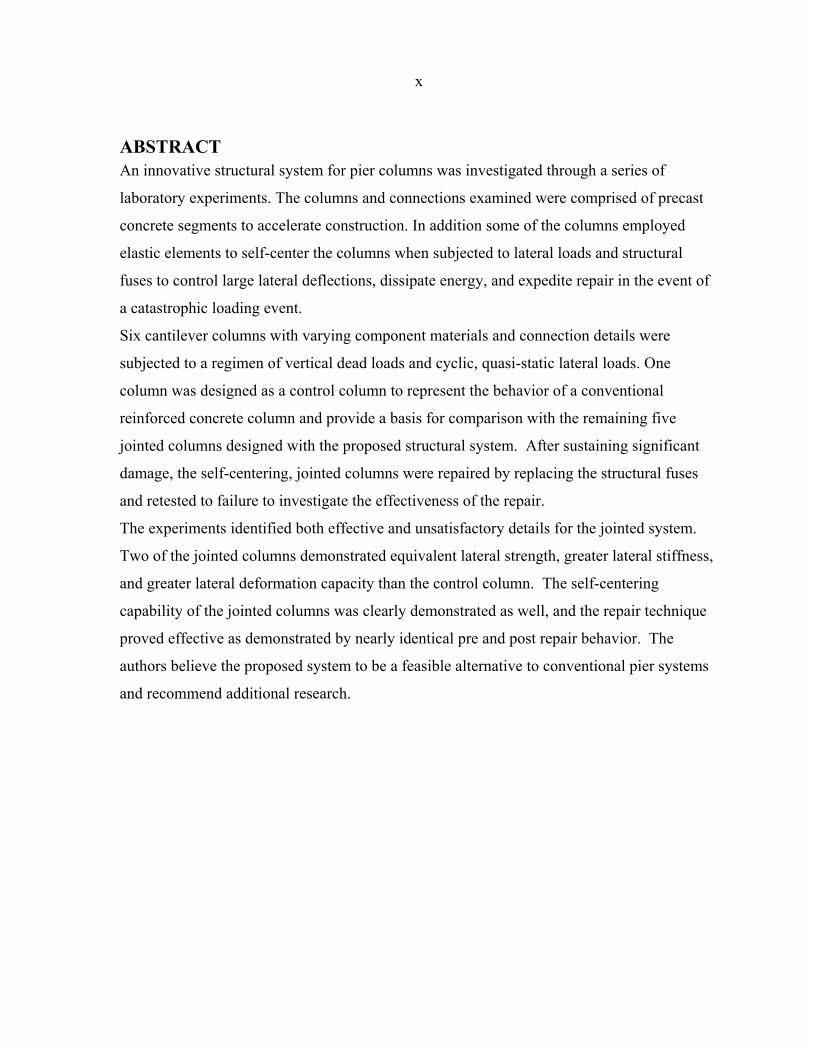
ABSTRACT An innovative structural system for pier columns was investigated through a series of
laboratory experiments. The columns and connections examined were comprised of precast
concrete segments to accelerate construction. In addition some of the columns employed
elastic elements to self-center the columns when subjected to lateral loads and structural
fuses to control large lateral deflections, dissipate energy, and expedite repair in the event of
a catastrophic loading event.
Six cantilever columns with varying component materials and connection details were
subjected to a regimen of vertical dead loads and cyclic, quasi-static lateral loads. One
column was designed as a control column to represent the behavior of a conventional
reinforced concrete column and provide a basis for comparison with the remaining five
jointed columns designed with the proposed structural system. After sustaining significant
damage, the self-centering, jointed columns were repaired by replacing the structural fuses
and retested to failure to investigate the effectiveness of the repair.
The experiments identified both effective and unsatisfactory details for the jointed system.
Two of the jointed columns demonstrated equivalent lateral strength, greater lateral stiffness,
and greater lateral deformation capacity than the control column. The self-centering
capability of the jointed columns was clearly demonstrated as well, and the repair technique
proved effective as demonstrated by nearly identical pre and post repair behavior. The
authors believe the proposed system to be a feasible alternative to conventional pier systems
and recommend additional research.
1
1. INTRODUCTION
1.1 Background
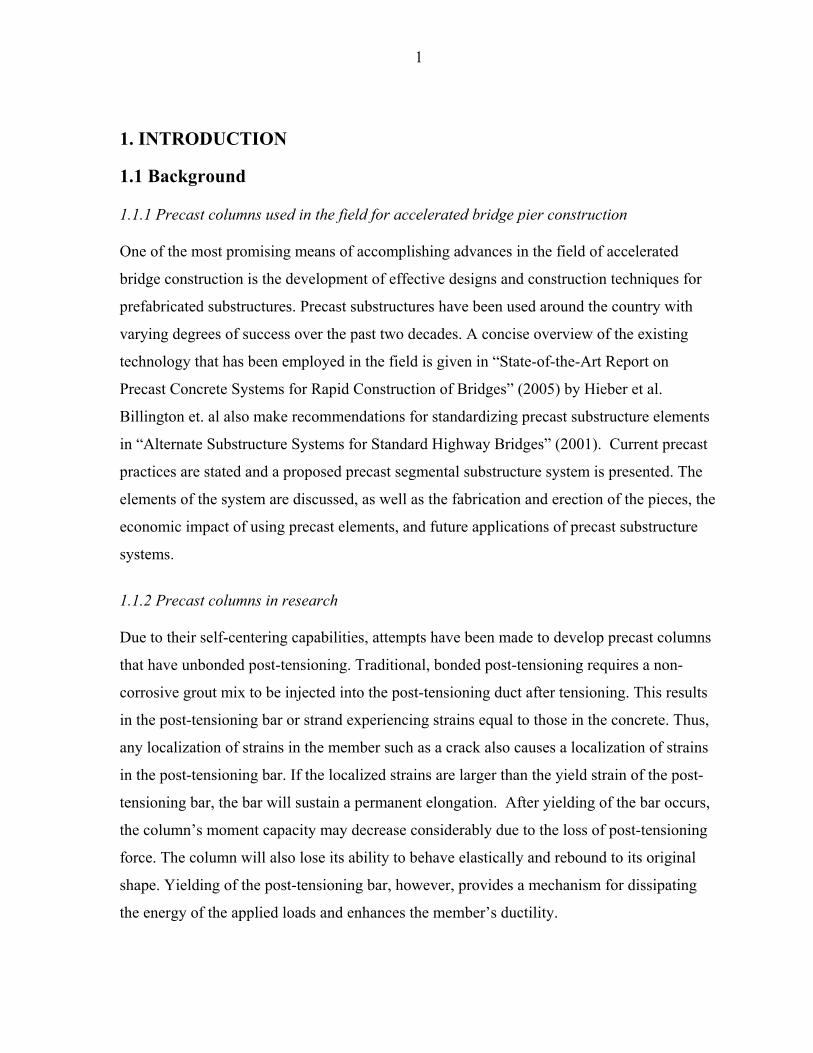
1.1.1 Precast columns used in the field for accelerated bridge pier construction
One of the most promising means of accomplishing advances in the field of accelerated
bridge construction is the development of effective designs and construction techniques for
prefabricated substructures. Precast substructures have been used around the country with
varying degrees of success over the past two decades. A concise overview of the existing
technology that has been employed in the field is given in “State-of-the-Art Report on
Precast Concrete Systems for Rapid Construction of Bridges” (2005) by Hieber et al.
Billington et. al also make recommendations for standardizing precast substructure elements
in “Alternate Substructure Systems for Standard Highway Bridges” (2001). Current precast
practices are stated and a proposed precast segmental substructure system is presented. The
elements of the system are discussed, as well as the fabrication and erection of the pieces, the
economic impact of using precast elements, and future applications of precast substructure
systems.
1.1.2 Precast columns in research
Due to their self-centering capabilities, attempts have been made to develop precast columns
that have unbonded post-tensioning. Traditional, bonded post-tensioning requires a non-
corrosive grout mix to be injected into the post-tensioning duct after tensioning. This results
in the post-tensioning bar or strand experiencing strains equal to those in the concrete. Thus,
any localization of strains in the member such as a crack also causes a localization of strains
in the post-tensioning bar. If the localized strains are larger than the yield strain of the post-
tensioning bar, the bar will sustain a permanent elongation. After yielding of the bar occurs,
the column’s moment capacity may decrease considerably due to the loss of post-tensioning
force. The column will also lose its ability to behave elastically and rebound to its original
shape. Yielding of the post-tensioning bar, however, provides a mechanism for dissipating
the energy of the applied loads and enhances the member’s ductility.
2
While a grouted post-tensioning bar is bonded to the member along its entire length,
unbonded post-tensioning is only connected to the member at its ends. This distributes strain
uniformly along the bar’s entire length, allowing the bar to remain in its elastic range for
much larger deformations. Since the bar is not bonded to the concrete, little or no localization
of strain is developed.
One significant structural concern with unbonded post-tensioning is the lack of a mechanism
for damping the hysteretic energy of the applied load, which can lead to large deflections and
a brittle failure. Damping of hysteretic energy in unbonded structural systems has been the
focus of many research topics.
Billington and Yoon discuss one such system in “Cyclic Response of Unbonded Post-
tensioned Precast Columns with Ductile Fiber-Reinforced Concrete” (2004), in which
unbonded post-tensioning is used to reduce residual displacements, epoxy-grout and match-
cast joints are used to connect all segments, and ductile fiber-reinforced cement-based
composite (DRFCC) in the precast segments at potential plastic hinging regions is used to
dissipate hysteretic energy. The two main variables in the investigation were the material
used in the plastic hinging region segment and the depth at which that segment was
embedded in the column foundation.
In “Unbonded Post-tensioned Concrete Bridge Piers. I: Monotonic and Cyclic Analysis”
(2003), Kwan and Billington present functional- and survival-performance limits to guide the
design of a proposed unbonded, post-tensioned concrete bridge pier system. The system used
unbonded post-tensioning to reduce residual displacements and bonded internal
reinforcement to provide energy dissipation. Adjustments could be made to the ratio of
bonded reinforcement to unbonded post-tensioning according to the emphasis placed on the
control of the maximum displacement versus the control of residual displacement. This
system adopted similar concepts of reinforcement combinations as presented by Ikeda (1998)
and Ito et al. (1997).
Stephan, Restrepo, and Seible presented “Seismic Behavior of Bridge Columns Built
Incorporating MMFX Steel” (2003). They compared the results of columns using
conventional reinforcement with columns containing MMFX steel. This corrosion resistant,
high strength steel was used in an attempt to increase the capacity of the column and reduce
3
residual displacements. Results revealed that these columns, which were representative of
the Oakland Touchdown Substructure of the San Francisco Oakland Bay Bridge, could be
designed to form ductile, flexural plastic hinges at their bases. A maximum lateral drift of
approximately 4% could be obtained by the columns before failure.
While some research has explored damping of hysteretic energy, no system to date has been
developed that can simultaneously reduce residual displacements to negligible levels, sustain
large (~10% drift) deformation, and be repaired cost-effectively.
1.2 Objectives
1.2.1 Accelerated bridge pier construction
The primary objective of this research was to accelerate bridge pier construction through the
use of precast columns in order to reduce construction costs, decrease traffic delays, improve
work zone safety, and minimize environmental impacts. By prefabricating all elements of the
system offsite and early in the project schedule, column erection can take place with more
speed and efficiency. Connections aimed at minimizing cure time for grouting, temporary
shoring requirements, and restrictive construction/fabrication tolerances were investigated.
Ultimately, contractors’ savings gained through enhanced constructability can be passed on
to transportation agencies and the traveling public. Future standardized details for the precast
substructures will also help the streamline construction for the proposed structural system
investigated in this project.
1.2.2 Improved structural performance
This research also aimed to develop a pier system that could endure an extreme loading event
such as a vehicle or ship impact, severe wind storm, flood, blast, or earthquake, better than a
conventional pier. Structural benefits associated with the system include improved durability
associated with precast concrete, improved stability and reduced repair costs should a
structure ever be subjected to an extreme load, and improved public safety gained through
small residual deformations that would allow bridges to remain in service after an extreme
load event. The system also allows a wide range of architectural options to improve bridge
aesthetics and highlight attractive structural features.
4
1.2.3 Repairability
An additional objective of this research was to develop a bridge pier system that can be
repaired cost-effectively after an extreme loading event. This system incorporates a design
that minimizes damage to precast column segments by localizing damage to sacrificial
structural fuse plates that joint the segments. These external plates required minimal labor to
replace, and this repair technique was shown through testing to effectively restore the
column’s initial structural integrity.
1.3 Proposed Structural System
1.3.1. System elements
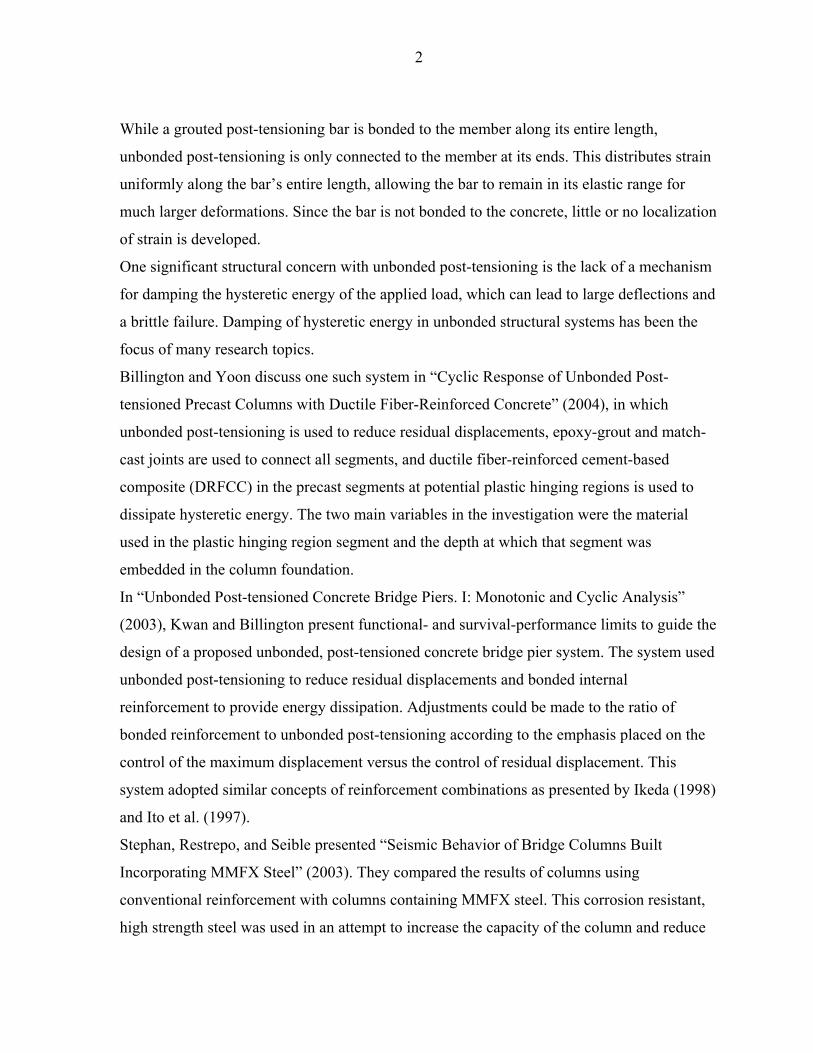
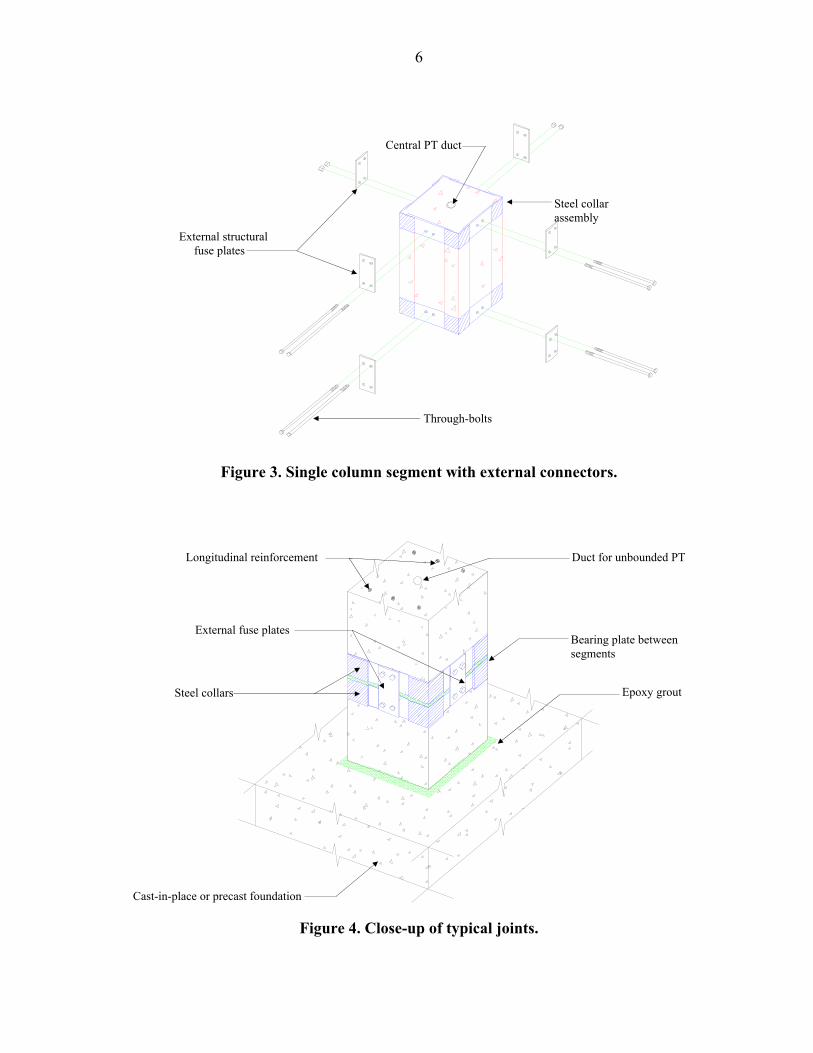
The system that was investigated in this research is illustrated in Figures 1-4. Key features of
the system included steel collars at the ends of segments (Figure 2), external reinforcement of
segment joints (i.e. structural fuse plates) with bolted connections (Figure 3), elastic elements
(e.g. unbonded post-tensioning) to self-center the columns, and bearing plates between
segments to avoid labor-intensive grouting procedures (Figure 4).
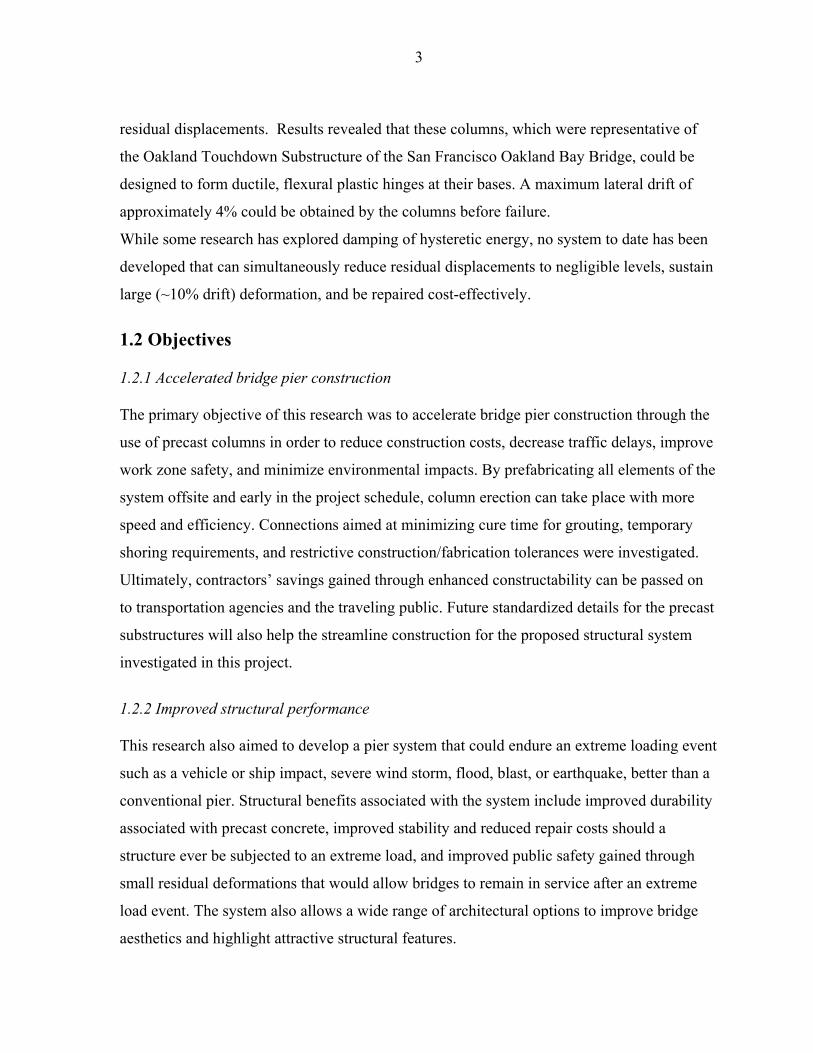
The steel collar assembly at the ends of each column segment, as illustrated in Figure 2,
served three purposes: (1) reinforcement of the segment ends to prevent damage during
shipping and erection, (2) confinement of the concrete at the ends of the segments to provide
additional concrete strength and ductility, and (3) a convenient means for attaching exterior
structural fuse plates. A single column segment is illustrated in Figure 3 with steel collars at
each end. Shown in Figure 4 is the foundation connection, as well as the first joint
connection. The first (lowest) column segment fits into a socket formed in a cast-in-place pile
cap, precast pile cap, or spread footing. A flowable epoxy grout fills the annular space in the
socket surrounding the first column segment.
This system, when subjected to lateral loads, is designed to concentrate deformation at the
segment joints. Such behavior is achieved by designing the replaceable external plates as
structural fuse plates which are intended to yield preferentially while leaving the remainder
of the structure relatively undamaged and elastic. When a sufficient lateral load is applied,
the fuse plates yield in tension and buckle in compression to accommodate the rotation at the
joint. A continuous elastic element, such as the post-tensioning rod used in this study, is
5
incorporated in the members to provide a self-centering force and minimize residual
deformations. By achieving minimal residual deformations in the columns, the bridge may
remain in service immediately after an extreme loading event. Full repair of the structure, if
required, may then be accomplished by replacing the structural fuse elements.
Figure 1. Basic pier assembly (isometric view).
Figure 2. Steel collars at segment ends.
Standard steel angles Steel plates
Ducts for through-bolts
typ.
typ.
typ.
Foundation
See Figure 4 for close-up view
Segmentally precast pier cap
Precast column segments
6
Figure 3. Single column segment with external connectors.
Figure 4. Close-up of typical joints.
Steel collar assembly
Through-bolts
Central PT duct
External structural fuse plates
Cast-in-place or precast foundation
Steel collars
External fuse plates
Epoxy grout
Bearing plate between segments
Duct for unbounded PT Longitudinal reinforcement
7
1.3.2. Construction sequence
A possible construction sequence is as follows: Once piles are driven, a precast pile cap is
placed with sockets to receive precast column segments. A vertical post-tensioning rod is
threaded into an anchor cast into the bottom of the socket, and the first column segment is
lowered into place. Once shimmed and leveled, flowable epoxy grout is poured into the
annular socket space. A bearing plate is placed at the top of the first segment, and the next
segment is subsequently lowered over the post-tensioning rod to rest on the bearing plate.
External fuse plates are then bolted into position ensuring alignment and stabilizing the
newly placed segment. This procedure continues until all but the uppermost column
segments are in place. The uppermost column segment is epoxied into a pier cap socket and
the unit is lowered onto the columns. Once all pieces are in place, cap segments are
connected, external plates are secured by fully tensioning the through-bolts, and post-
tensioning force is applied to the rod used for alignment. Then the pier is then ready to
receive the superstructure.
This research places special emphasis on the connection designs to simplify construction.
Although Figures 1–4 schematically illustrate square columns, connection details could be
developed for rectangular or circular columns as well.
1.4 Research Methodology
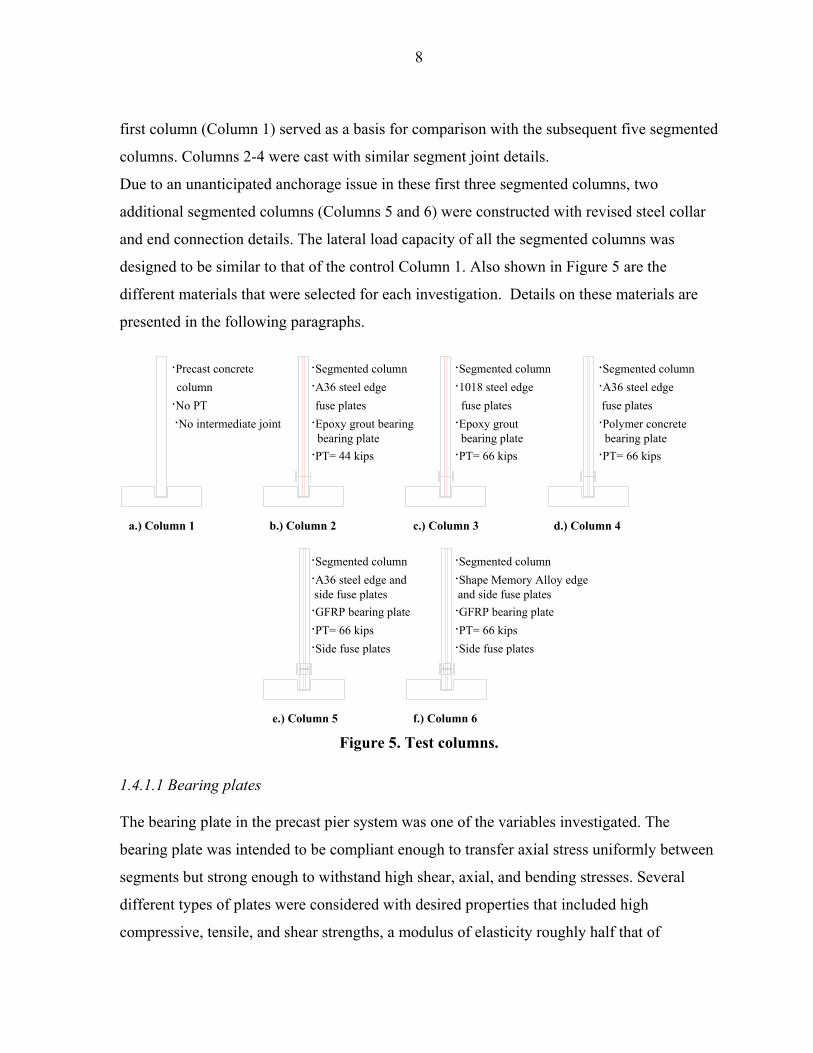
1.4.1 Key experimental variables
Because the greatest uncertainties in this proposed system are associated with the behavior of
the segment joints, cantilever column specimens for this investigation were designed to focus
on the behavior of a single segment joint. Test variables investigated included the types of
bearing plates, fuse plates, and amount of post-tensioning force applied. Various anchorage
details and fuse plate configurations were also examined. Variables used in each test are
shown in Figure 5.
One column was cast as a continuous, reinforced cantilever column to examine the behavior
of the socket-type foundation connection and represent the behavior of a conventional cast-
in-place column with a reinforcement ratio similar to those in the segmented columns. This
8
first column (Column 1) served as a basis for comparison with the subsequent five segmented
columns. Columns 2-4 were cast with similar segment joint details.
Due to an unanticipated anchorage issue in these first three segmented columns, two
additional segmented columns (Columns 5 and 6) were constructed with revised steel collar
and end connection details. The lateral load capacity of all the segmented columns was
designed to be similar to that of the control Column 1. Also shown in Figure 5 are the
different materials that were selected for each investigation. Details on these materials are
presented in the following paragraphs.
·Precast concrete ·Segmented column ·Segmented column ·Segmented column column ·A36 steel edge ·1018 steel edge ·A36 steel edge ·No PT fuse plates fuse plates fuse plates ·No intermediate joint ·Epoxy grout bearing ·Epoxy grout ·Polymer concrete bearing plate bearing plate bearing plate
·PT= 44 kips ·PT= 66 kips ·PT= 66 kips a.) Column 1 b.) Column 2 c.) Column 3 d.) Column 4 ·Segmented column ·Segmented column ·A36 steel edge and ·Shape Memory Alloy edge side fuse plates and side fuse plates ·GFRP bearing plate ·GFRP bearing plate
·PT= 66 kips ·PT= 66 kips ·Side fuse plates ·Side fuse plates e.) Column 5 f.) Column 6
Figure 5. Test columns.
1.4.1.1 Bearing plates
The bearing plate in the precast pier system was one of the variables investigated. The
bearing plate was intended to be compliant enough to transfer axial stress uniformly between
segments but strong enough to withstand high shear, axial, and bending stresses. Several
different types of plates were considered with desired properties that included high
compressive, tensile, and shear strengths, a modulus of elasticity roughly half that of
9
concrete, high resistance to corrosion, low creep, and relatively low cost. Materials
considered were epoxy grout, polymer concrete with steel reinforcement, glass fiber
reinforced polymer (GFRP), lead, neoprene, and cotton duck.
Sikadur 32, a high modulus, flowable epoxy was mixed with Grade 37 silica sand in a 1:1
ratio for Columns 2 and 3. The modulus of elasticity was approximately 1,500 ksi, while the
compressive strength of the epoxy-grout was close to 11.5 ksi. When tested in compression,
this material exhibited large plastic strains without cracking.
A steel-reinforced polymer concrete plate was used in the Column 4 test. In polymer
concrete, a high strength, corrosion resistant, thermosetting resin acts as the binding agent.
Three-eighths inch aggregate was used in the plate, and a 2 in. by 2 in. welded wire grid was
placed in the plate to reinforce against splitting. The modulus of elasticity of polymer
concrete was approximately 2,400 ksi, while its compressive strength is approximately 10
ksi.
A glass fiber-reinforced polymer (GFRP) plate was used for Column 5 and 6 tests. An epoxy
resin acts as the binding agent for the GFRP, with a 90-90 glass fiber orientation. The elastic
modulus for the GFRP bearing plate perpendicular to the fibers was measured to be 2,000
ksi.
1.4.1.2 Fuse plates
Fuse plates in the precast pier system were another variable investigated. Desired properties
include low yield stress, high plastic strain capacity, high resistance to corrosion, large
ultimate elongation (~20-25%), high toughness, and low cost. Materials considered included
A36 steel, 1018 carbon steel specifically manufactured to yield between 30 and 36 ksi, shape
memory alloy, A242 steel, and A588 steel. The following materials were selected to be used
for fuse plates.
A36 steel plates were used in Columns 2, 4, and 5 (see Figure 5). From laboratory tests, the
plates were determined to have a yield stress of 42 ksi with an ultimate elongation greater
than 20%. A36 plate stock is readily available in a large range of thicknesses, is easily
machined and relatively low cost.
10
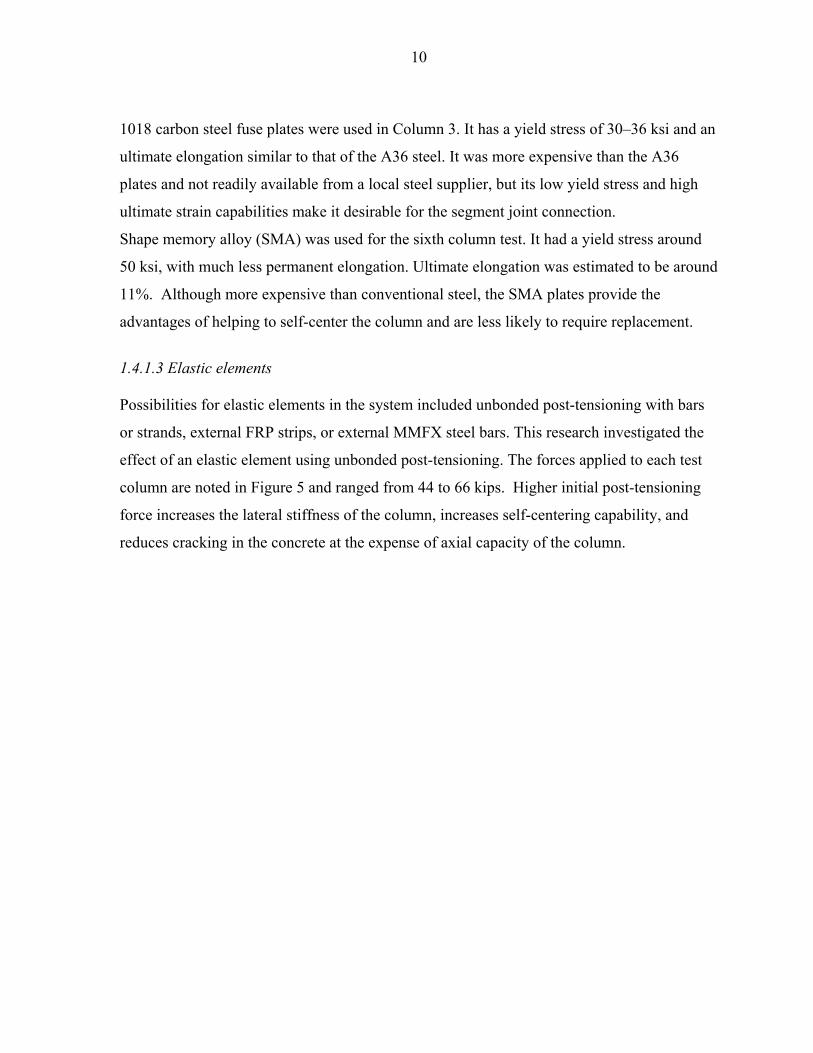
1018 carbon steel fuse plates were used in Column 3. It has a yield stress of 30–36 ksi and an
ultimate elongation similar to that of the A36 steel. It was more expensive than the A36
plates and not readily available from a local steel supplier, but its low yield stress and high
ultimate strain capabilities make it desirable for the segment joint connection.
Shape memory alloy (SMA) was used for the sixth column test. It had a yield stress around
50 ksi, with much less permanent elongation. Ultimate elongation was estimated to be around
11%. Although more expensive than conventional steel, the SMA plates provide the
advantages of helping to self-center the column and are less likely to require replacement.
1.4.1.3 Elastic elements
Possibilities for elastic elements in the system included unbonded post-tensioning with bars
or strands, external FRP strips, or external MMFX steel bars. This research investigated the
effect of an elastic element using unbonded post-tensioning. The forces applied to each test
column are noted in Figure 5 and ranged from 44 to 66 kips. Higher initial post-tensioning
force increases the lateral stiffness of the column, increases self-centering capability, and
reduces cracking in the concrete at the expense of axial capacity of the column.
11
Constant vertical dead load
Lab strong floor
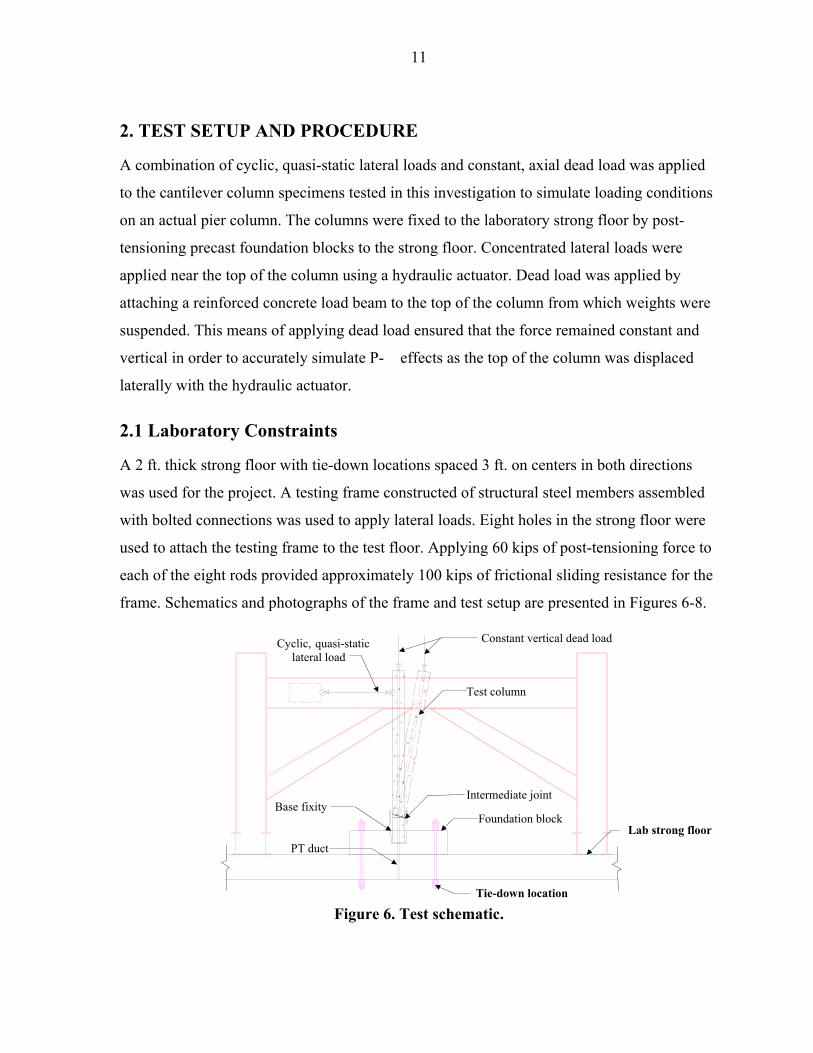
2. TEST SETUP AND PROCEDURE
A combination of cyclic, quasi-static lateral loads and constant, axial dead load was applied
to the cantilever column specimens tested in this investigation to simulate loading conditions
on an actual pier column. The columns were fixed to the laboratory strong floor by post-
tensioning precast foundation blocks to the strong floor. Concentrated lateral loads were
applied near the top of the column using a hydraulic actuator. Dead load was applied by
attaching a reinforced concrete load beam to the top of the column from which weights were
suspended. This means of applying dead load ensured that the force remained constant and
vertical in order to accurately simulate P-� effects as the top of the column was displaced
laterally with the hydraulic actuator.
2.1 Laboratory Constraints
A 2 ft. thick strong floor with tie-down locations spaced 3 ft. on centers in both directions
was used for the project. A testing frame constructed of structural steel members assembled
with bolted connections was used to apply lateral loads. Eight holes in the strong floor were
used to attach the testing frame to the test floor. Applying 60 kips of post-tensioning force to
each of the eight rods provided approximately 100 kips of frictional sliding resistance for the
frame. Schematics and photographs of the frame and test setup are presented in Figures 6-8.
Figure 6. Test schematic.
Test column
Base fixityIntermediate joint
Foundation block
PT duct
Cyclic, quasi-static lateral load
Tie-down location
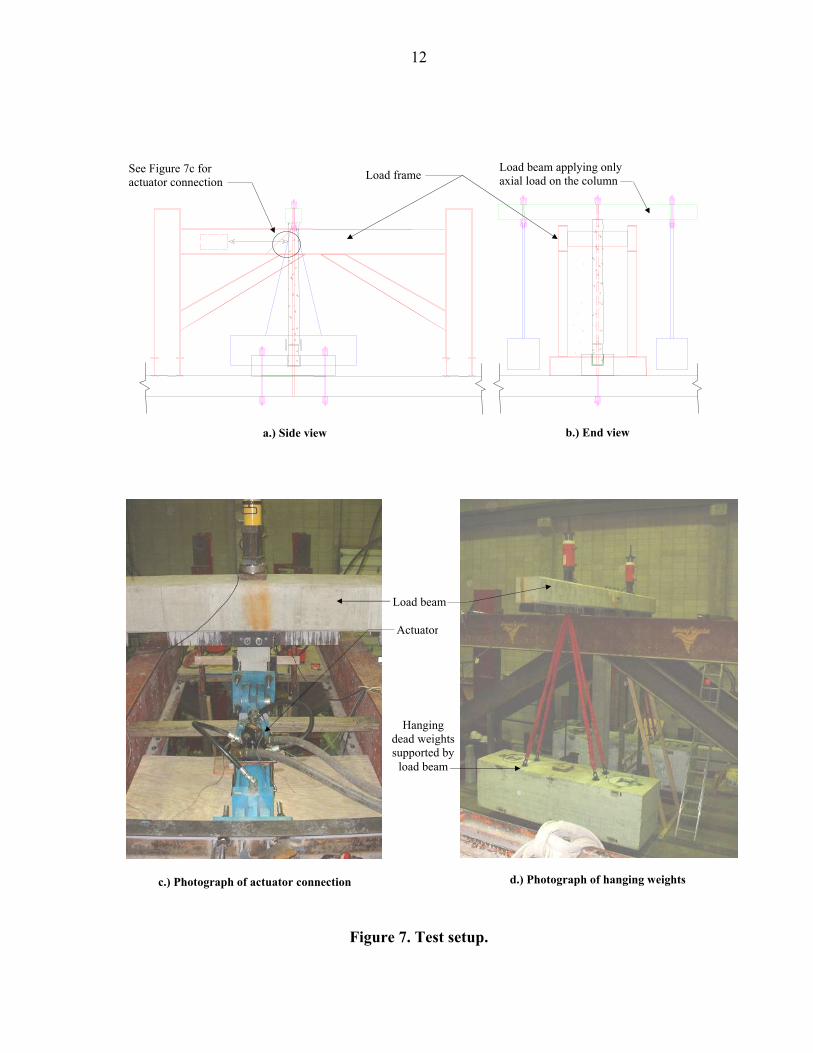
12
Hanging dead weightssupported by
load beam
Load beam applying only axial load on the column Load frame
a.) Side view b.) End view
d.) Photograph of hanging weightsc.) Photograph of actuator connection
Figure 7. Test setup.
See Figure 7c for actuator connection
Load beam
Actuator
13
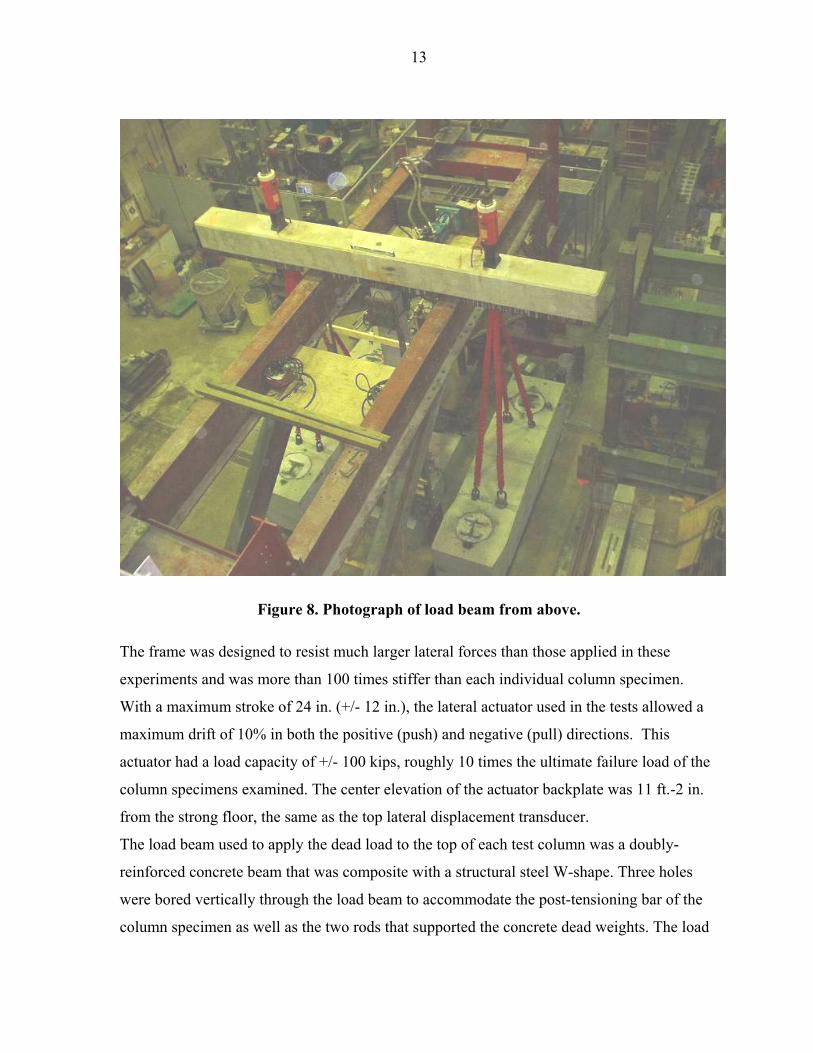
Figure 8. Photograph of load beam from above.
The frame was designed to resist much larger lateral forces than those applied in these
experiments and was more than 100 times stiffer than each individual column specimen.
With a maximum stroke of 24 in. (+/- 12 in.), the lateral actuator used in the tests allowed a
maximum drift of 10% in both the positive (push) and negative (pull) directions. This
actuator had a load capacity of +/- 100 kips, roughly 10 times the ultimate failure load of the
column specimens examined. The center elevation of the actuator backplate was 11 ft.-2 in.
from the strong floor, the same as the top lateral displacement transducer.
The load beam used to apply the dead load to the top of each test column was a doubly-
reinforced concrete beam that was composite with a structural steel W-shape. Three holes
were bored vertically through the load beam to accommodate the post-tensioning bar of the
column specimen as well as the two rods that supported the concrete dead weights. The load
14
beam was oriented perpendicular to the direction of lateral loading and applied its own
weight of 7 kips as well as the weight two large concrete blocks weighing 18.5 kips each to
the top of the column. This arrangement provided 44 kips of total dead load at the top of each
column.
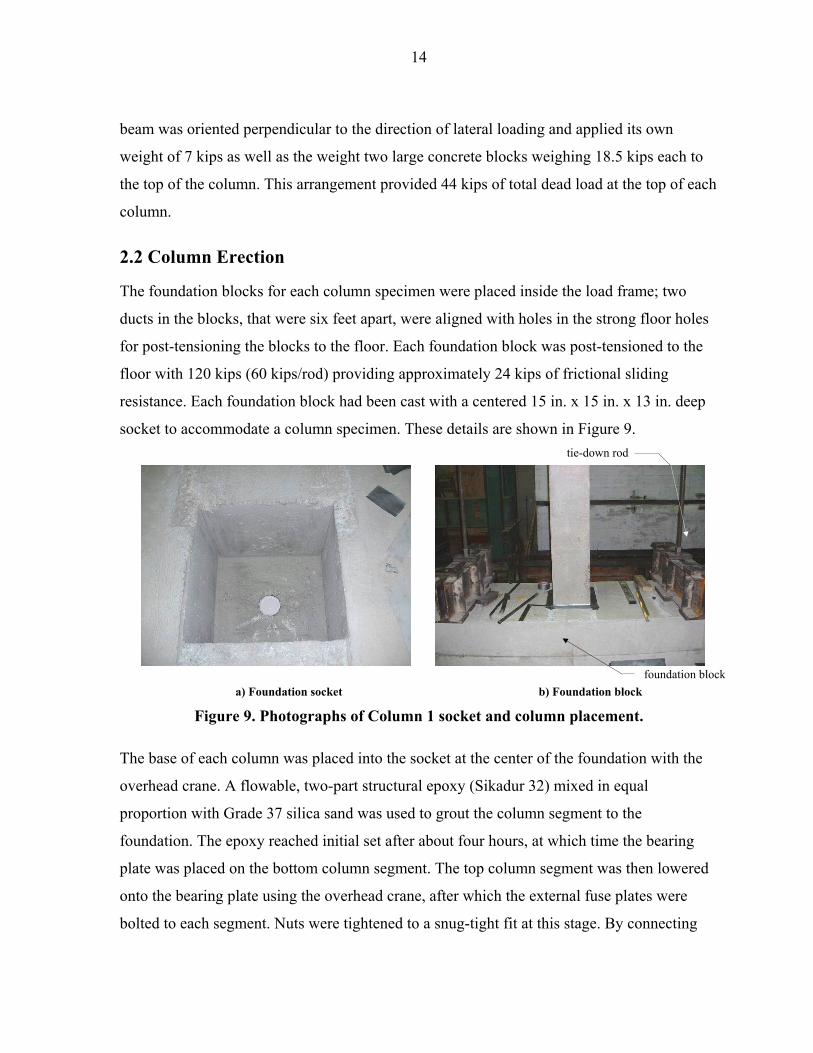
2.2 Column Erection
The foundation blocks for each column specimen were placed inside the load frame; two
ducts in the blocks, that were six feet apart, were aligned with holes in the strong floor holes
for post-tensioning the blocks to the floor. Each foundation block was post-tensioned to the
floor with 120 kips (60 kips/rod) providing approximately 24 kips of frictional sliding
resistance. Each foundation block had been cast with a centered 15 in. x 15 in. x 13 in. deep
socket to accommodate a column specimen. These details are shown in Figure 9.
a) Foundation socket b) Foundation block
Figure 9. Photographs of Column 1 socket and column placement.
The base of each column was placed into the socket at the center of the foundation with the
overhead crane. A flowable, two-part structural epoxy (Sikadur 32) mixed in equal
proportion with Grade 37 silica sand was used to grout the column segment to the
foundation. The epoxy reached initial set after about four hours, at which time the bearing
plate was placed on the bottom column segment. The top column segment was then lowered
onto the bearing plate using the overhead crane, after which the external fuse plates were
bolted to each segment. Nuts were tightened to a snug-tight fit at this stage. By connecting
tie-down rod
foundation block
15
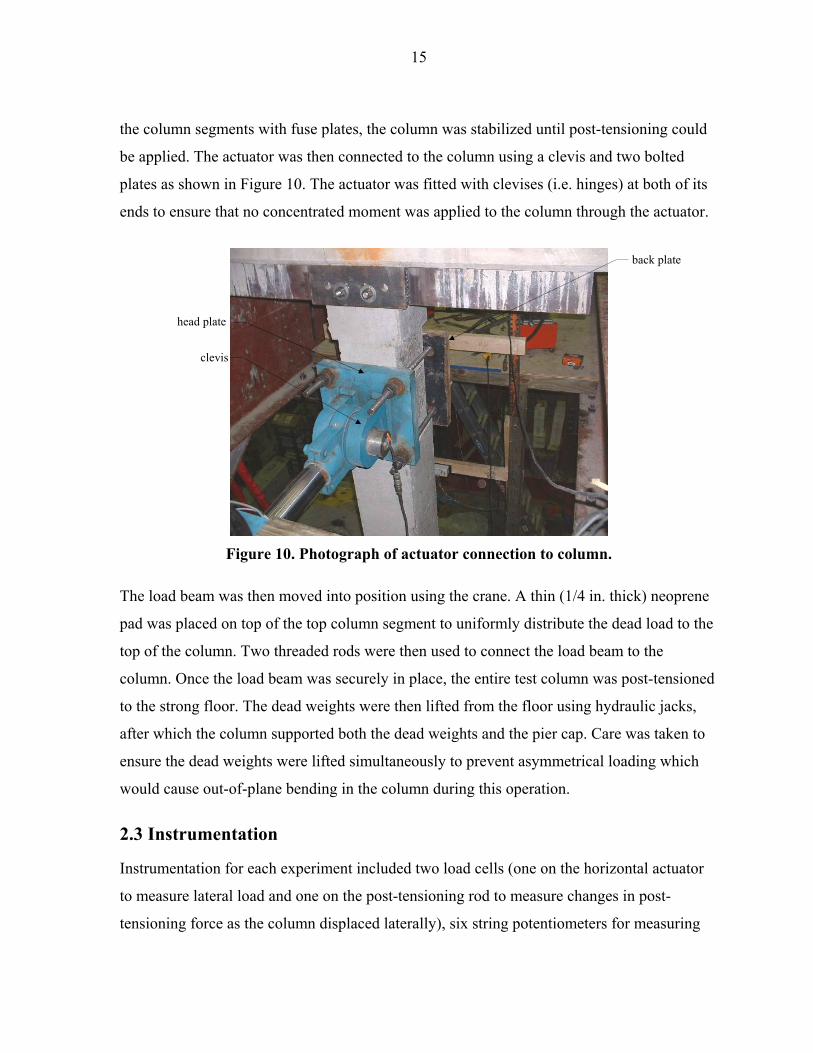
the column segments with fuse plates, the column was stabilized until post-tensioning could
be applied. The actuator was then connected to the column using a clevis and two bolted
plates as shown in Figure 10. The actuator was fitted with clevises (i.e. hinges) at both of its
ends to ensure that no concentrated moment was applied to the column through the actuator.
Figure 10. Photograph of actuator connection to column.
The load beam was then moved into position using the crane. A thin (1/4 in. thick) neoprene
pad was placed on top of the top column segment to uniformly distribute the dead load to the
top of the column. Two threaded rods were then used to connect the load beam to the
column. Once the load beam was securely in place, the entire test column was post-tensioned
to the strong floor. The dead weights were then lifted from the floor using hydraulic jacks,
after which the column supported both the dead weights and the pier cap. Care was taken to
ensure the dead weights were lifted simultaneously to prevent asymmetrical loading which
would cause out-of-plane bending in the column during this operation.
2.3 Instrumentation
Instrumentation for each experiment included two load cells (one on the horizontal actuator
to measure lateral load and one on the post-tensioning rod to measure changes in post-
tensioning force as the column displaced laterally), six string potentiometers for measuring
head plate
clevis
back plate
16
displacement along the length of the column, eight linearly variable displacement transducers
(LVDT’s) for measuring vertical movement between the segments at the joints, four
inclinometers for determining the rotations of the column shaft and horizontal actuator, 8–12
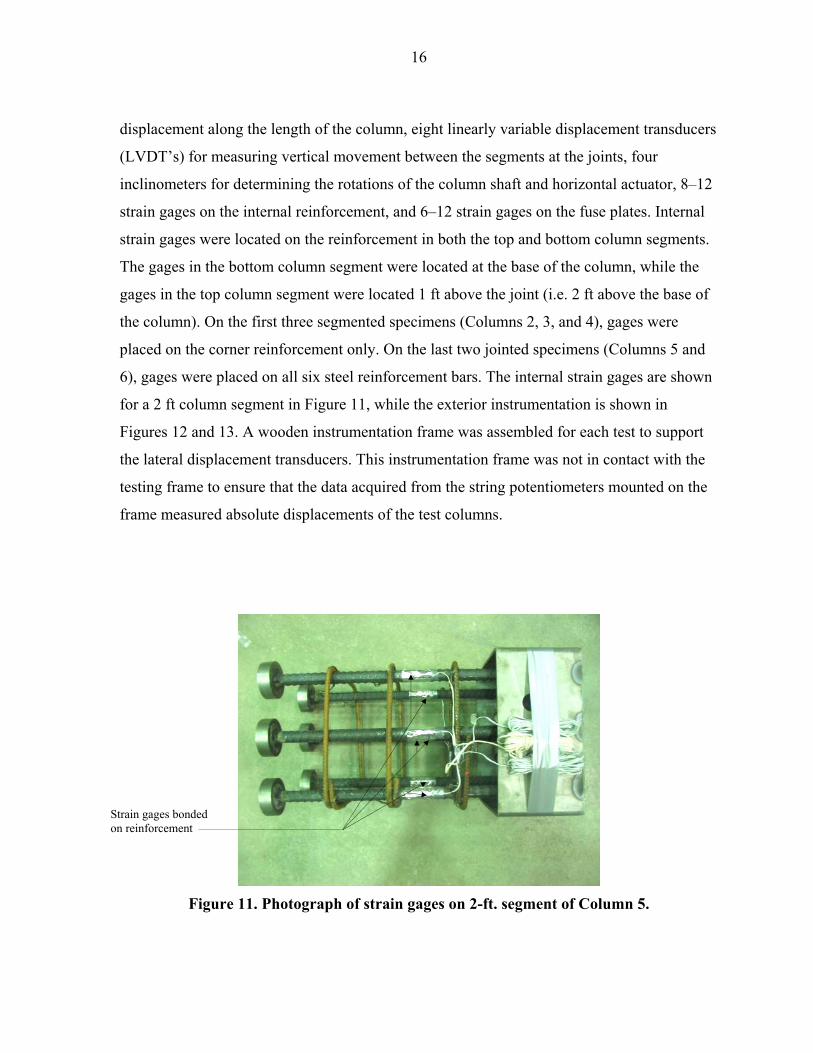
strain gages on the internal reinforcement, and 6–12 strain gages on the fuse plates. Internal
strain gages were located on the reinforcement in both the top and bottom column segments.
The gages in the bottom column segment were located at the base of the column, while the
gages in the top column segment were located 1 ft above the joint (i.e. 2 ft above the base of
the column). On the first three segmented specimens (Columns 2, 3, and 4), gages were
placed on the corner reinforcement only. On the last two jointed specimens (Columns 5 and
6), gages were placed on all six steel reinforcement bars. The internal strain gages are shown
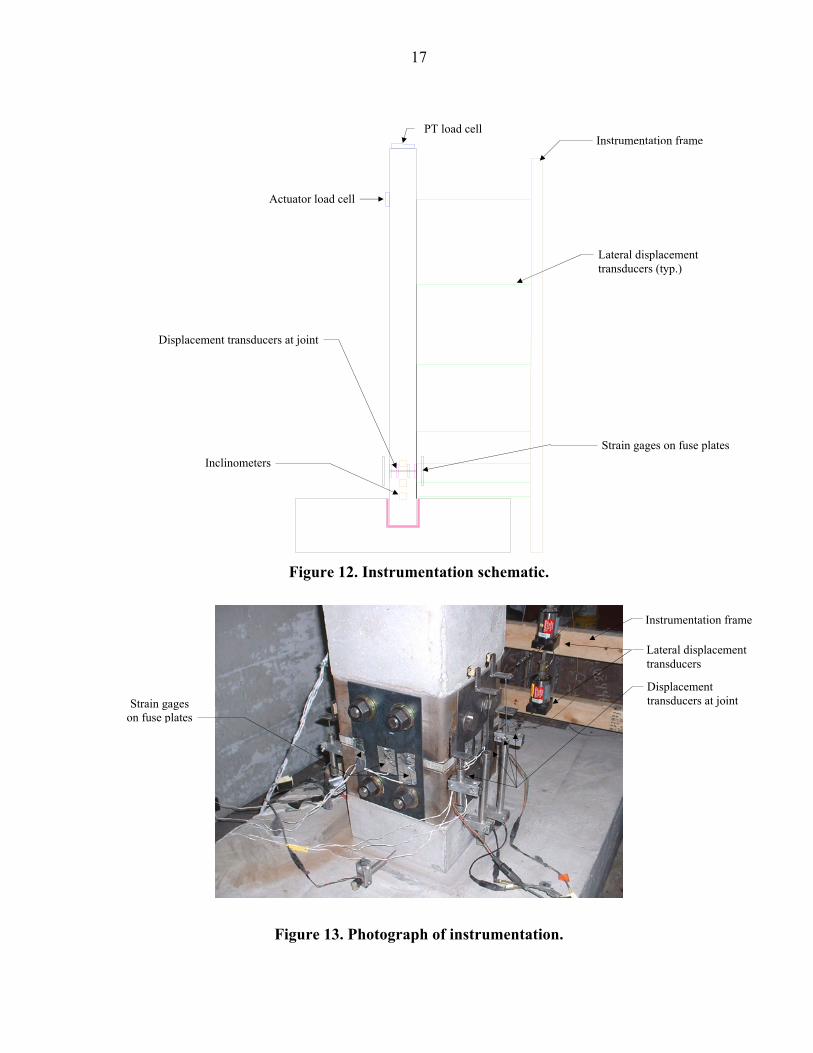
for a 2 ft column segment in Figure 11, while the exterior instrumentation is shown in
Figures 12 and 13. A wooden instrumentation frame was assembled for each test to support
the lateral displacement transducers. This instrumentation frame was not in contact with the
testing frame to ensure that the data acquired from the string potentiometers mounted on the
frame measured absolute displacements of the test columns.
Figure 11. Photograph of strain gages on 2-ft. segment of Column 5.
Strain gages bonded on reinforcement
17
Figure 12. Instrumentation schematic.
Figure 13. Photograph of instrumentation.
Actuator load cell
Instrumentation frame
Lateral displacement transducers (typ.)
Displacement transducers at joint
Strain gages on fuse plates
PT load cell
Inclinometers
Displacement transducers at joint
Lateral displacement transducers
Strain gages on fuse plates
Instrumentation frame
18
2.4 Testing Procedure
An MTS TestStar IIm controller was used for moving the actuator. By programming the
controller with a sinusoidal wave input equal in amplitude to the maximum displacement of
each cycle, the actuator was signaled to move to the peak target displacement of each loading
cycle and back in a uniform period of time. A data acquisition system (DAS) was used to log
data from all instrumentation employed in the experiments. The DAS recorded data once
every second during the tests due to the slow, quasi-static application of lateral loads.
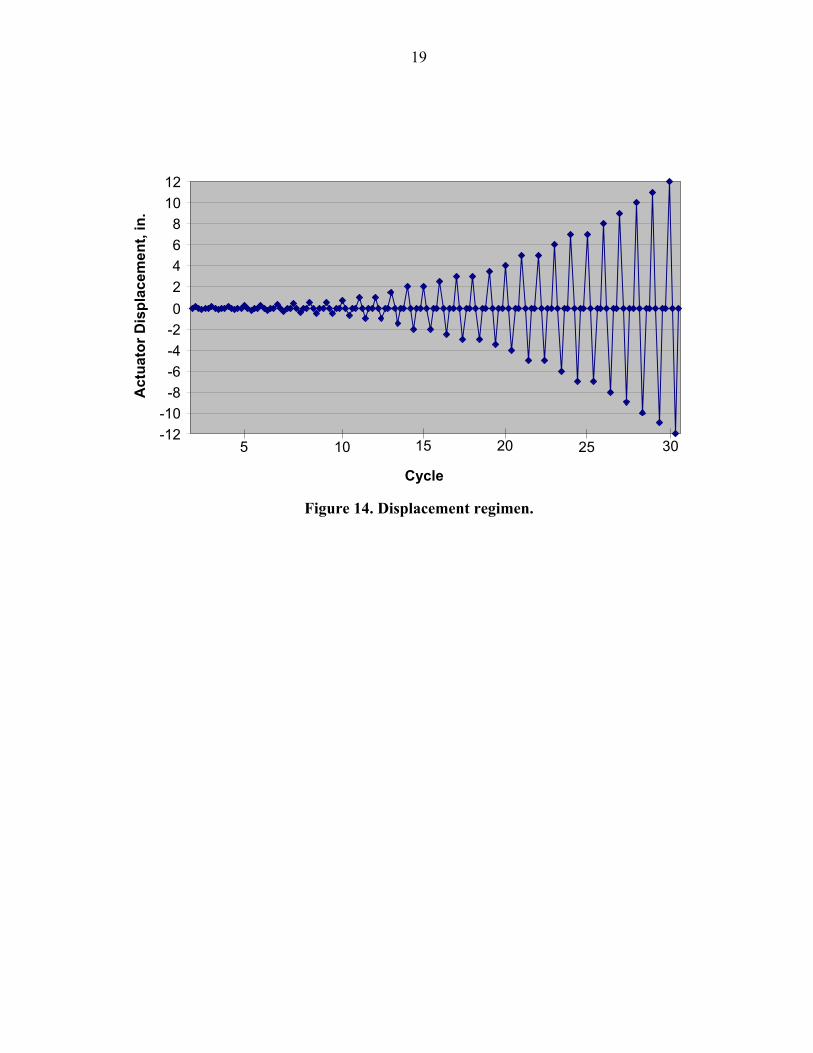
Cyclic, quasi-static lateral loads were applied to the column specimens using displacement
control. Displacement cycles increased incrementally until the column failed. Each cycle
began by inducing the desired positive displacement that was desired and returning to zero
displacement. The cycle was completed by inducing the same displacement in the opposite
direction, and returning to zero displacement (e.g., 0 in., +1 in., -1 in., 0 in.). The specimen
was examined for damage at peak displacements of each cycle, and photographs were taken
every few cycles. The displacement regimen used in the tests is shown in Table 1 and Figure
14.
All segmented columns followed a similar testing procedure with one major modification.
Once the column had been displaced 2.5 in. (Cycle 16), yielding and buckling of the fuse
plates was apparent. To investigate effectiveness of repair, the fuse plates were replaced with
new plates and the loading regimen was started over, this time continuing until the column
failed.
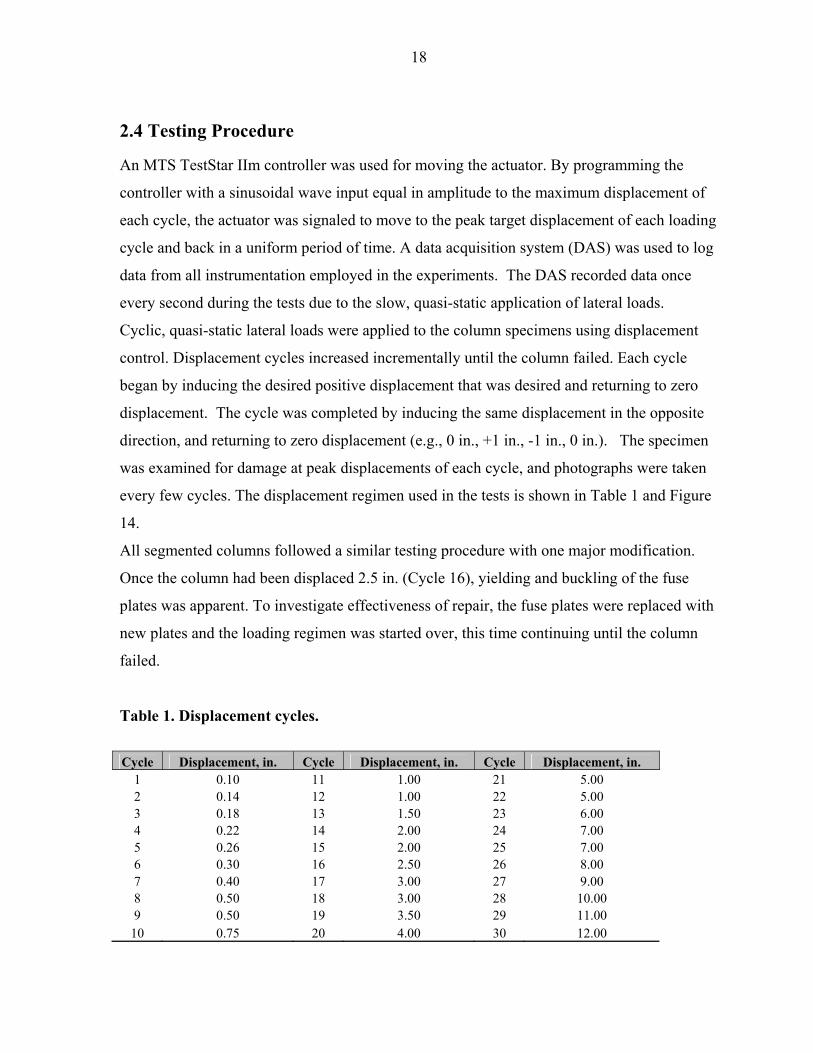
Table 1. Displacement cycles. Cycle Displacement, in. Cycle Displacement, in. Cycle Displacement, in.
1 0.10 11 1.00 21 5.00 2 0.14 12 1.00 22 5.00 3 0.18 13 1.50 23 6.00 4 0.22 14 2.00 24 7.00 5 0.26 15 2.00 25 7.00 6 0.30 16 2.50 26 8.00 7 0.40 17 3.00 27 9.00 8 0.50 18 3.00 28 10.00 9 0.50 19 3.50 29 11.00
10 0.75 20 4.00 30 12.00
19
Figure 14. Displacement regimen.
-12 -10 -8 -6 -4 -2 0 2 4 6 8
10 12
Act
uato
r Dis
plac
emen
t, in
.
5 10 15 20 25 30
Cycle
20
3. DESIGN OF SPECIMENS
3.1 Design Approach
Specimen design began by developing a systematic approach to assessing the behavior of the
proposed structure. Performance objectives associated with specific hazard levels were
determined for the structure; functional-level and survival-level performance objectives were
used in the design and analysis. During functional-level loading events, which are associated
with a higher probability of occurrence, the performance objective is to keep the structure
operational without the need for immediate repair. During survival-level loading events,
which have a lower probability of occurring, the performance objective is to prevent the
structure from collapsing.
As previously noted, one of the objectives of this research was to increase the event
magnitude required to cause permanent, irreparable damage to the structure. By limiting most
damage to the fuse plates at segment connections, the system was easily repaired and
remained in its functional-level state. In this research, a desired sequence of responses to
increasing lateral load which would lead to failure of the columns was developed. Due to the
repairable aspect of the system, damage criteria were established for functional-level
operations that would not permanently damage the structure. This preferred sequence of
responses was used to size the column reinforcement, as well as determine the joint and fuse
plate details.
The following response sequence was developed for the columns in terms of increasing the
magnitude of applied lateral load. When a lateral load is created from an event, cracking at
the base of the column is the first damage to occur in the column. The cracking will be found
at or near the base, because the moment there is the largest. Due to the relatively small load
required to cause cracking, this event is unavoidable from an economical design standpoint.
However, with the tensile strength of concrete being neglected during design, cracking of the
concrete will not diminish the overall performance of the column. Additionally, while this
event is not repairable, the crack will not prevent the column from acting in an elastic
manner. A decrease in initial lateral stiffness will occur due to this cracking. However, it
will not affect the strength of the column when larger displacements occur. Furthermore, the
21
addition of unbonded post-tensioning will reduce the potential for corrosion by decreasing
the widths of cracks that form.
With an increase in lateral load, the next damage to occur to the column should occur at the
fuse plates connecting the column segments. To remain structurally undamaged, the
longitudinal reinforcement in each precast column segment must not yield. To accomplish
this, the replaceable fuse plates were designed to yield before the bonded internal
reinforcement. By selecting a fuse plate material with appropriate yield strength, elastic
modulus, and cross-section dimensions, the plates can be designed to yield just prior to the
longitudinal reinforcement in the precast elements. By ensuring yielding of the fuse plates at
a load near that required for yielding the longitudinal reinforcement, the column strength will
be close to that of a non-segmented column. Furthermore, the unbonded post-tensioning in
the segmented column provides additional lateral load capacity so that the lateral strength of
the segmented columns may exceed that of a non-segmented column.
Once the fuse plates have yielded, they should continue to strain at nearly constant stress
levels as lateral loads increase until their ultimate elongation is reached. Selecting a fuse
plate material with large ultimate elongation will allow the column to experience large
deflections while resisting high loads. It will also prevent the precast column segments from
experiencing major damage due to yielding of internal reinforcement.
The column may continue to resist higher loads beyond yielding of the fuse plates for several
reasons. If fuse plates are used on all four sides of the construction joint, the plates parallel to
loading (i.e. side plates) nearer the neutral axis will not be fully yielded. Because a linear
strain profile is assumed at the construction joint, the center of these plates will experience
smaller strains than the fuse plates on the extreme tension and compression faces of the
column. These portions of the side plates will continue to sustain increasing stresses until
they too have fully yielded. Additionally, strain hardening of steel fuse plates may increase
the moment capacity of the segment joints incrementally as lateral deflections increase.
With a further increase in lateral load, the construction joint may continue to sustain higher
moments for the reasons previously noted. If the moment at the segment joint increases
sufficiently, the longitudinal reinforcement in the column segments will begin to yield, and
the column segments could no longer be considered elastic. The bonded reinforcement will
22
experience plastic deformation and will not return to its original state when unloading occurs.
Even so, the column would still be operating at the functional-level and residual
deformations will be small. The bridge could remain in service for use by emergency
vehicles and effective repair could be achieved by replacing the fuse plates.
As lateral deflections are increased further, the column should continue to deflect at a nearly
constant lateral load until the ultimate elongation of the fuse plates is reached. Once the
tension fuse plate fractures, the force resisted by the plate will be transferred to the unbonded
post-tensioning bar and the fuse plates parallel to the applied load. At this time, the post-
tensioning will likely begin to yield, marking the transition from a functional-level event to a
survival-level event. Until the ultimate tensile strength of the post-tensioning is exceeded, the
column will remain stable; however, it will lose both its self-centering capability and its
ability to be easily repaired.
3.2 Specimen Details
The 14 ft. vertical height of the column was limited by the dimensions of the load frame
available for testing. A 12 in. square cross-section was selected to examine bending-
dominated behavior and represent a half-scale model of a typical pier column used in Iowa
with a 2.5% reinforcement ratio.
The construction joint for the segmented columns was located 12 in. above the foundation
block to allow for convenient connections. This also placed the joint at a high moment region
in the column. All columns had 12 in. embedment into the foundation socket to avoid pull-
out and damage to the foundation block. Thus, the jointed columns were cast in 2 ft. and 12
ft. long segments.
Fuse plates and post-tensioning bars were selected and sized to ensure that yielding occurred
first in the fuse plates, as well as to accommodate the bolted friction connections. Bolt sizes
and types (1 in. diameter A490 bolts) were selected using AISC guidelines assuming constant
clamping forces typical in steel connections. This assumption proved suspect as slippage was
observed in testing. The 2.5 in. diameter central duct for the post-tensioning bar was selected
to avoid small-radius bending as curvature concentrated at the joint in the specimen at high
displacement levels.
23
All column segments were fabricated with six #7 Grade 60 steel longitudinal reinforcing
bars. Three bars were placed on both the tension and compression faces of the column.
Anchorage details varied in some of the columns, but the primary reinforcement remained
constant in all specimens to achieve columns with similar ultimate moment capacity. Steel
collars at the segment joint ends of each column segment were used to provide confinement
and prevent spalling at construction joints. As previously discussed in Section 1.3 these
collars also served to protect the relatively fragile concrete corners during shipping and
erection as well as to provide a convenient means for connecting fuse plates with through-
bolts.
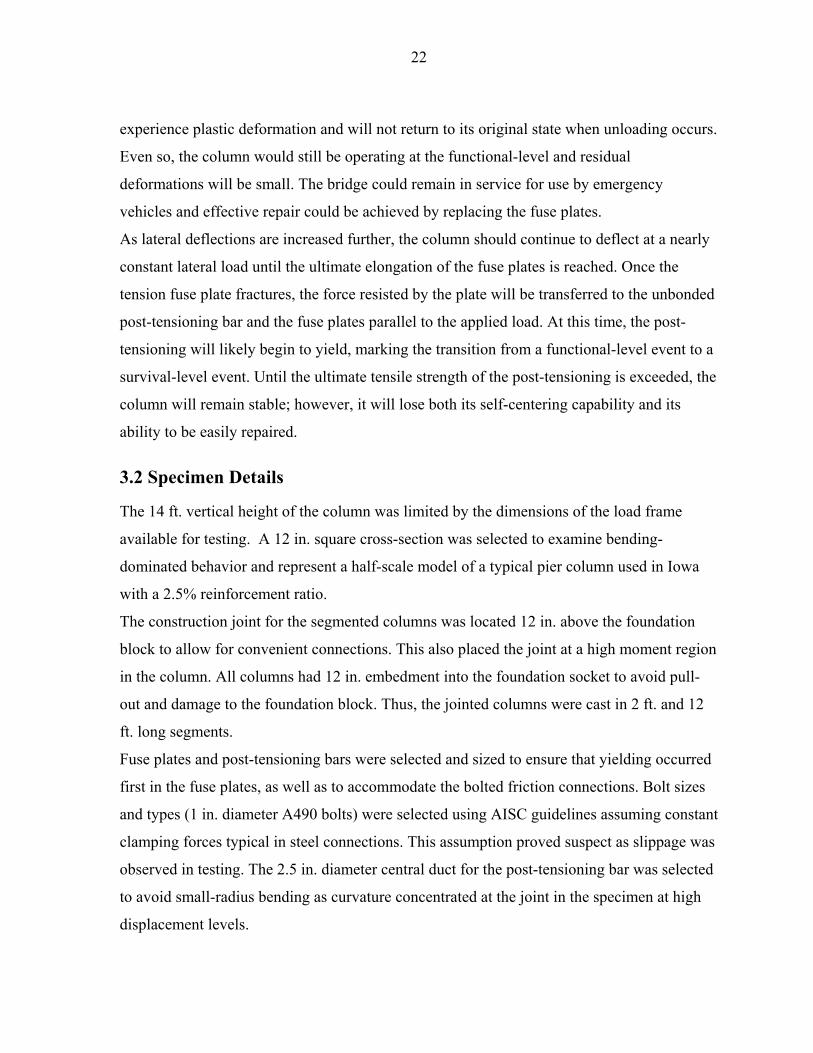
3.2.1 Column 1: Control Column with no segment joint
For the longitudinal reinforcement in the control column (Column 1), the corner bars on the
bottom end of the column embedded into the foundation socket consisted of two U-shaped
bars. One-hundred-eighty degree hooks were used on this end for the interior two bars to
achieve anchorage.
Transverse ties were spaced every foot along the height of the two column segments. On the
bottom end of the column, the first stirrup was placed 5 in. from the end of the column to
help confine the hooks and hoops; column reinforcement is shown in Figure 15.
Figure 15. Base end of control column reinforcement cage.
24
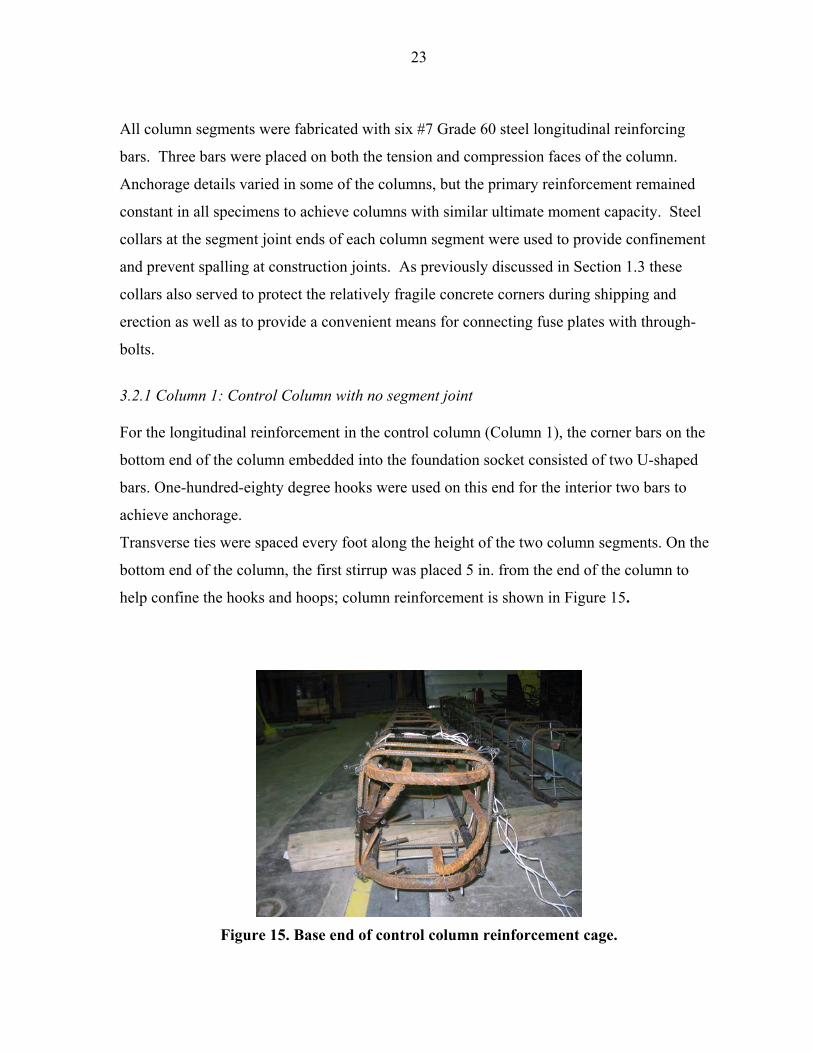
3.2.2 Columns 2–4: Segmented Columns
The first three segmented columns (Columns 2-4) had reinforcement details similar to those
used in the unjointed control column (Column 1). U-bars were used on the construction-joint
ends of the column segments for the corner bars as they were for the control column (Column
1). Similarly, the interior bars in each segment had one-hundred-eighty hooks on the
construction-joint end. These U-bars and hooks were wrapped around the ducts in the steel
collars in an attempt to prevent the through-bolts from pulling out of the ends of the column
segments when the columns were loaded. For the 2 ft. column segment, hooks were used at
the base of the reinforcement to provide anchorage. Similar transverse ties were used in these
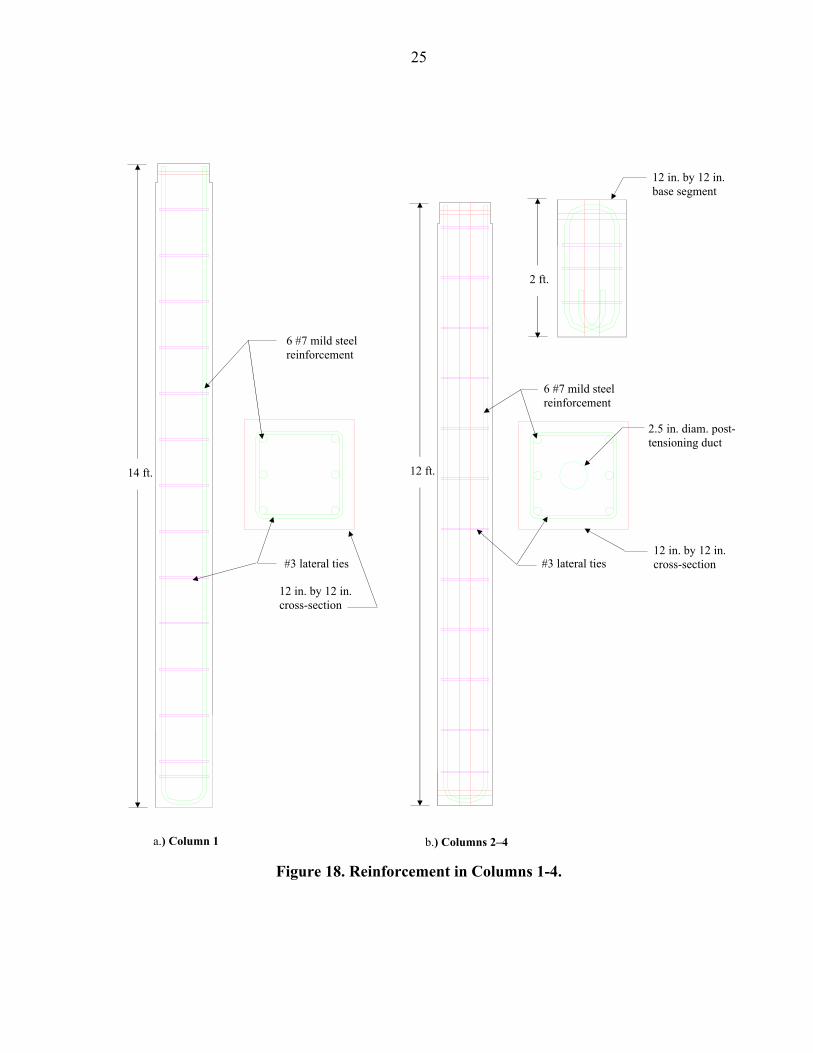
columns as in the first column. Additional column details for Columns 1-4 are shown in
Figures 16-18.
a.) Columns 2-4, 2 ft. segment reinforcement b.) Columns 2-4, 12 ft. segment reinforcement
Figure 16. Photographs of column 2-4 reinforcement.
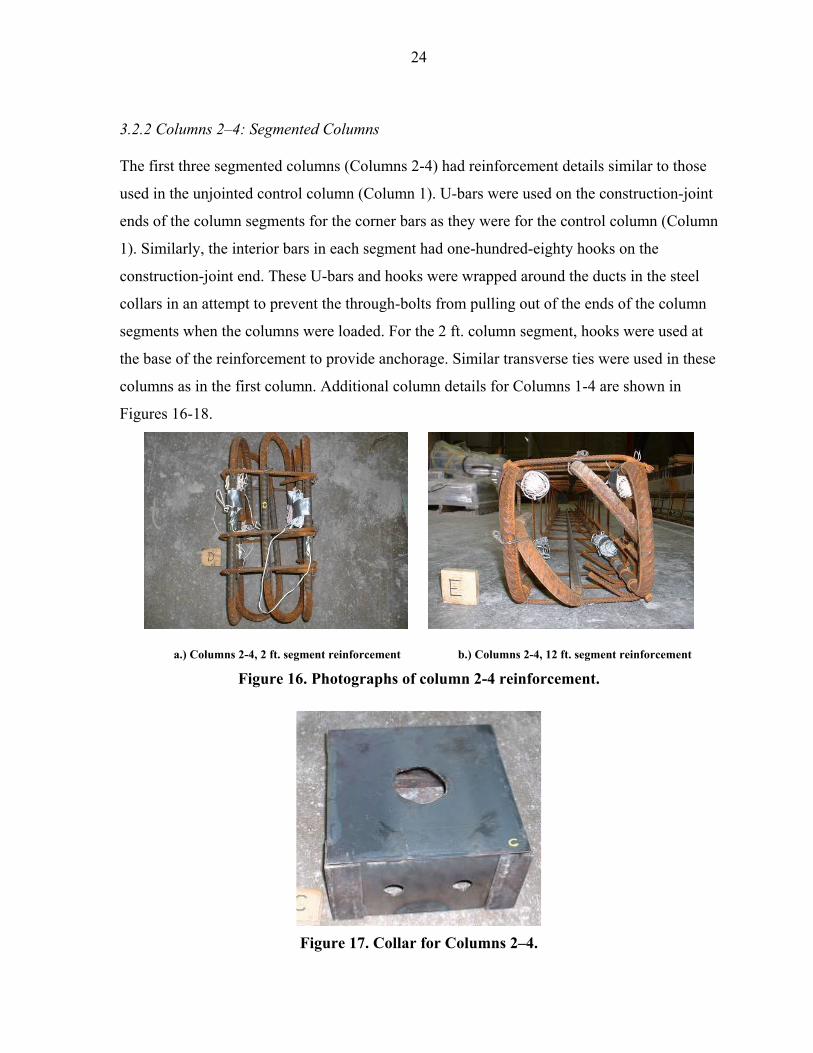
Figure 17. Collar for Columns 2–4.
25
Figure 18. Reinforcement in Columns 1-4.
a.) Column 1 b.) Columns 2–4
2.5 in. diam. post-tensioning duct
12 in. by 12 in. cross-section
6 #7 mild steel reinforcement
#3 lateral ties #3 lateral ties 12 in. by 12 in. cross-section
6 #7 mild steel reinforcement
14 ft.
12 in. by 12 in. base segment
12 ft.
2 ft.
26
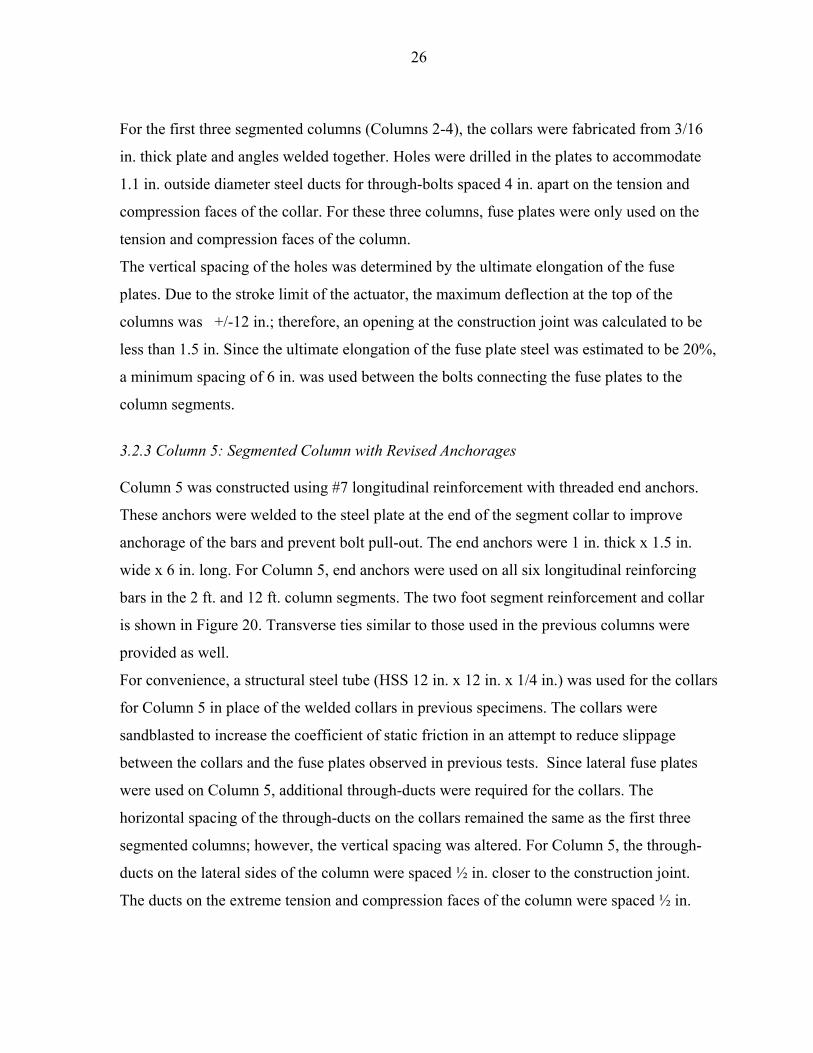
For the first three segmented columns (Columns 2-4), the collars were fabricated from 3/16
in. thick plate and angles welded together. Holes were drilled in the plates to accommodate
1.1 in. outside diameter steel ducts for through-bolts spaced 4 in. apart on the tension and
compression faces of the collar. For these three columns, fuse plates were only used on the
tension and compression faces of the column.
The vertical spacing of the holes was determined by the ultimate elongation of the fuse
plates. Due to the stroke limit of the actuator, the maximum deflection at the top of the
columns was +/-12 in.; therefore, an opening at the construction joint was calculated to be
less than 1.5 in. Since the ultimate elongation of the fuse plate steel was estimated to be 20%,
a minimum spacing of 6 in. was used between the bolts connecting the fuse plates to the
column segments.
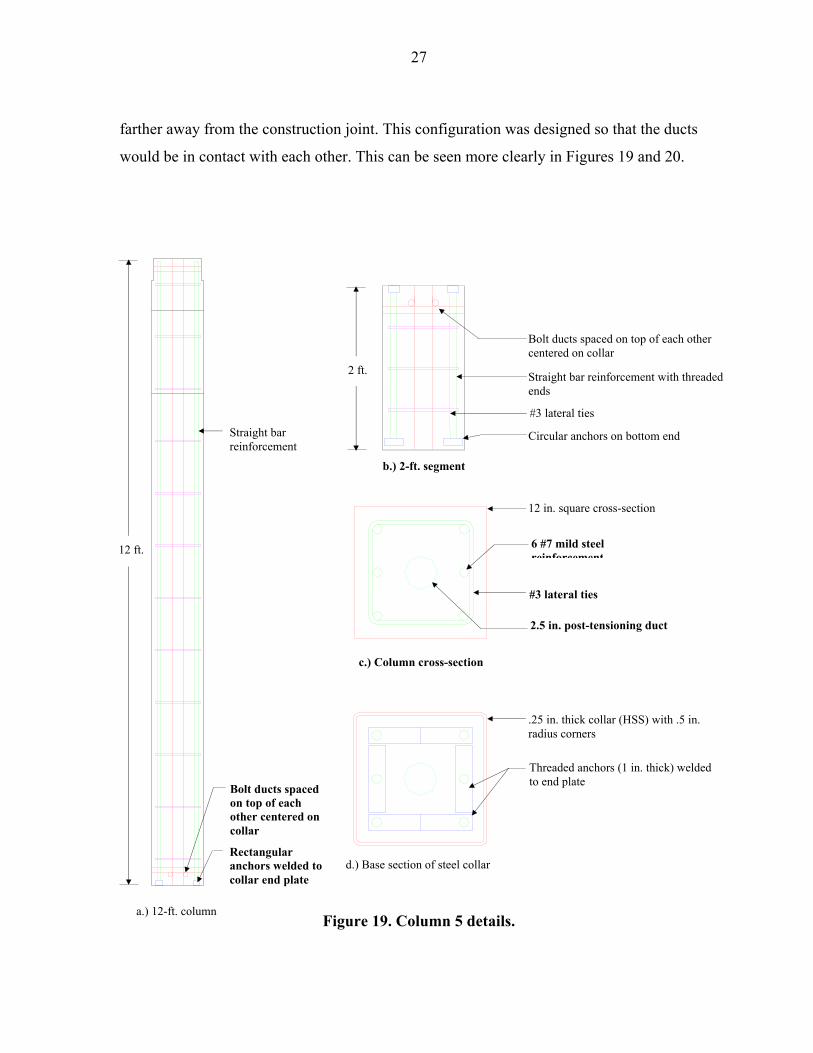
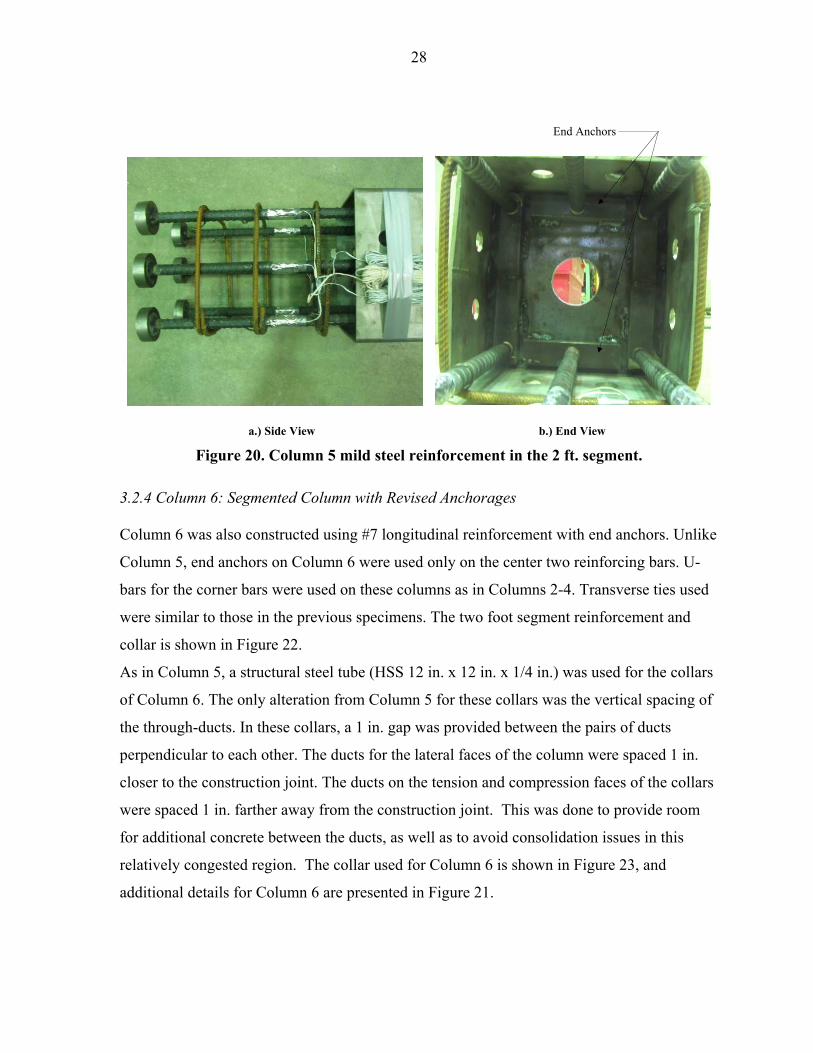
3.2.3 Column 5: Segmented Column with Revised Anchorages
Column 5 was constructed using #7 longitudinal reinforcement with threaded end anchors.
These anchors were welded to the steel plate at the end of the segment collar to improve
anchorage of the bars and prevent bolt pull-out. The end anchors were 1 in. thick x 1.5 in.
wide x 6 in. long. For Column 5, end anchors were used on all six longitudinal reinforcing
bars in the 2 ft. and 12 ft. column segments. The two foot segment reinforcement and collar
is shown in Figure 20. Transverse ties similar to those used in the previous columns were
provided as well.
For convenience, a structural steel tube (HSS 12 in. x 12 in. x 1/4 in.) was used for the collars
for Column 5 in place of the welded collars in previous specimens. The collars were
sandblasted to increase the coefficient of static friction in an attempt to reduce slippage
between the collars and the fuse plates observed in previous tests. Since lateral fuse plates
were used on Column 5, additional through-ducts were required for the collars. The
horizontal spacing of the through-ducts on the collars remained the same as the first three
segmented columns; however, the vertical spacing was altered. For Column 5, the through-
ducts on the lateral sides of the column were spaced ½ in. closer to the construction joint.
The ducts on the extreme tension and compression faces of the column were spaced ½ in.
27
farther away from the construction joint. This configuration was designed so that the ducts
would be in contact with each other. This can be seen more clearly in Figures 19 and 20.
Figure 19. Column 5 details.
Rectangular anchors welded to collar end plate
Straight bar reinforcement
Bolt ducts spaced on top of each other centered on collar
.25 in. thick collar (HSS) with .5 in. radius corners
12 in. square cross-section
Threaded anchors (1 in. thick) welded to end plate
2.5 in. post-tensioning duct
#3 lateral ties
6 #7 mild steel reinforcement
Circular anchors on bottom end
Straight bar reinforcement with threaded ends
Bolt ducts spaced on top of each other centered on collar
a.) 12-ft. column
d.) Base section of steel collar
c.) Column cross-section
b.) 2-ft. segment
12 ft.
2 ft.
#3 lateral ties
28
a.) Side View b.) End View
Figure 20. Column 5 mild steel reinforcement in the 2 ft. segment.
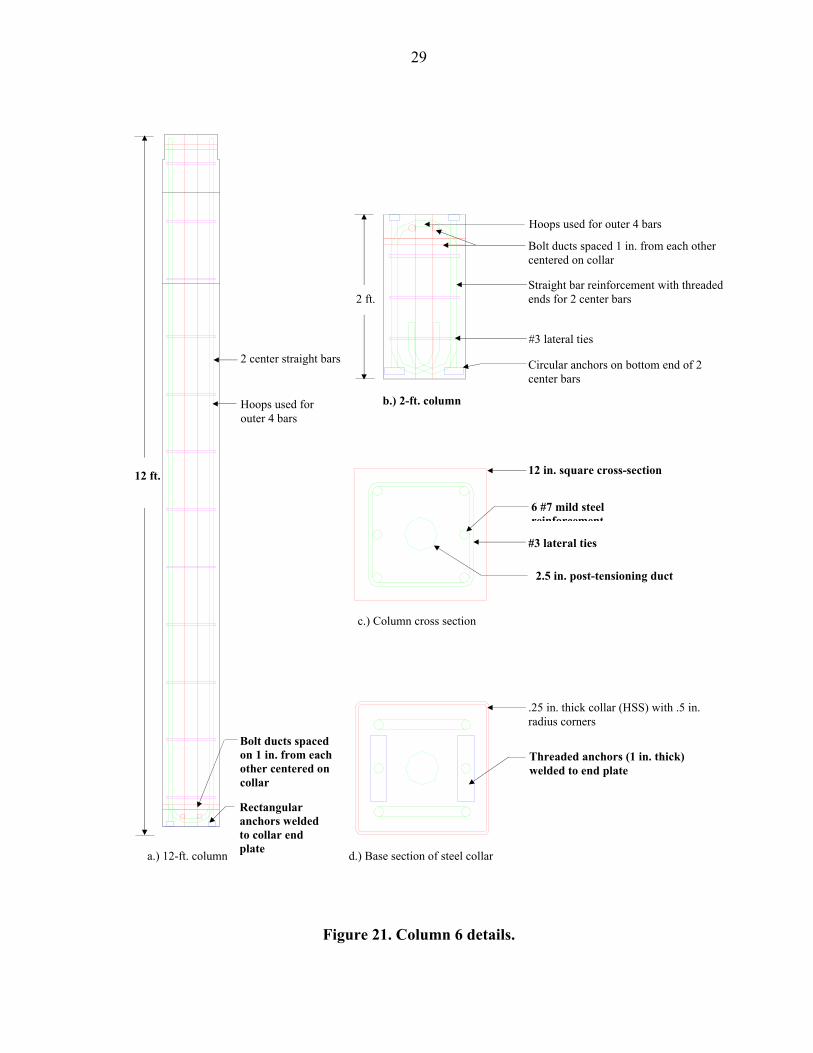
3.2.4 Column 6: Segmented Column with Revised Anchorages
Column 6 was also constructed using #7 longitudinal reinforcement with end anchors. Unlike
Column 5, end anchors on Column 6 were used only on the center two reinforcing bars. U-
bars for the corner bars were used on these columns as in Columns 2-4. Transverse ties used
were similar to those in the previous specimens. The two foot segment reinforcement and
collar is shown in Figure 22.
As in Column 5, a structural steel tube (HSS 12 in. x 12 in. x 1/4 in.) was used for the collars
of Column 6. The only alteration from Column 5 for these collars was the vertical spacing of
the through-ducts. In these collars, a 1 in. gap was provided between the pairs of ducts
perpendicular to each other. The ducts for the lateral faces of the column were spaced 1 in.
closer to the construction joint. The ducts on the tension and compression faces of the collars
were spaced 1 in. farther away from the construction joint. This was done to provide room
for additional concrete between the ducts, as well as to avoid consolidation issues in this
relatively congested region. The collar used for Column 6 is shown in Figure 23, and
additional details for Column 6 are presented in Figure 21.
End Anchors
29
Figure 21. Column 6 details.
Rectangular anchors welded to collar end plate
2 center straight bars
Bolt ducts spaced 1 in. from each other centered on collar
.25 in. thick collar (HSS) with .5 in. radius corners
12 in. square cross-section
Threaded anchors (1 in. thick) welded to end plate
2.5 in. post-tensioning duct
#3 lateral ties
6 #7 mild steel reinforcement
Circular anchors on bottom end of 2 center bars
Straight bar reinforcement with threaded ends for 2 center bars
Bolt ducts spaced on 1 in. from each other centered on collar
Hoops used for outer 4 bars
Hoops used for outer 4 bars
a.) 12-ft. column
c.) Column cross section
d.) Base section of steel collar
b.) 2-ft. column
12 ft.
2 ft.
#3 lateral ties
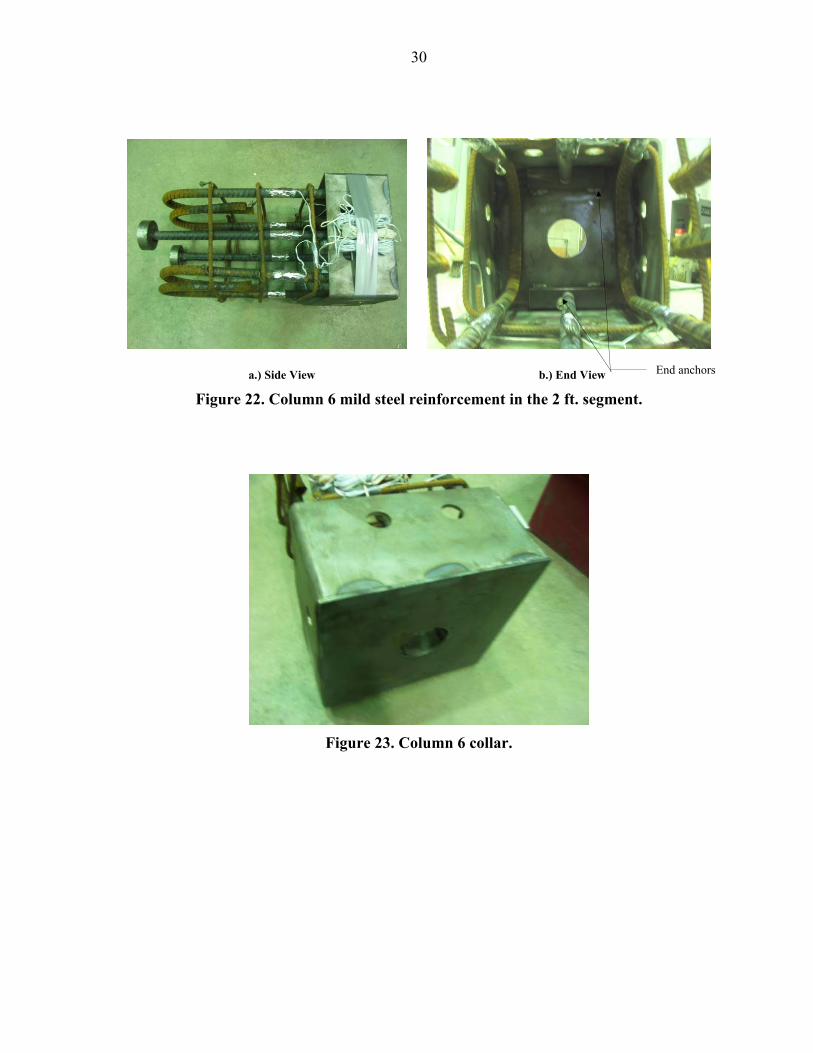
30
a.) Side View b.) End View
Figure 22. Column 6 mild steel reinforcement in the 2 ft. segment.
Figure 23. Column 6 collar.
End anchors
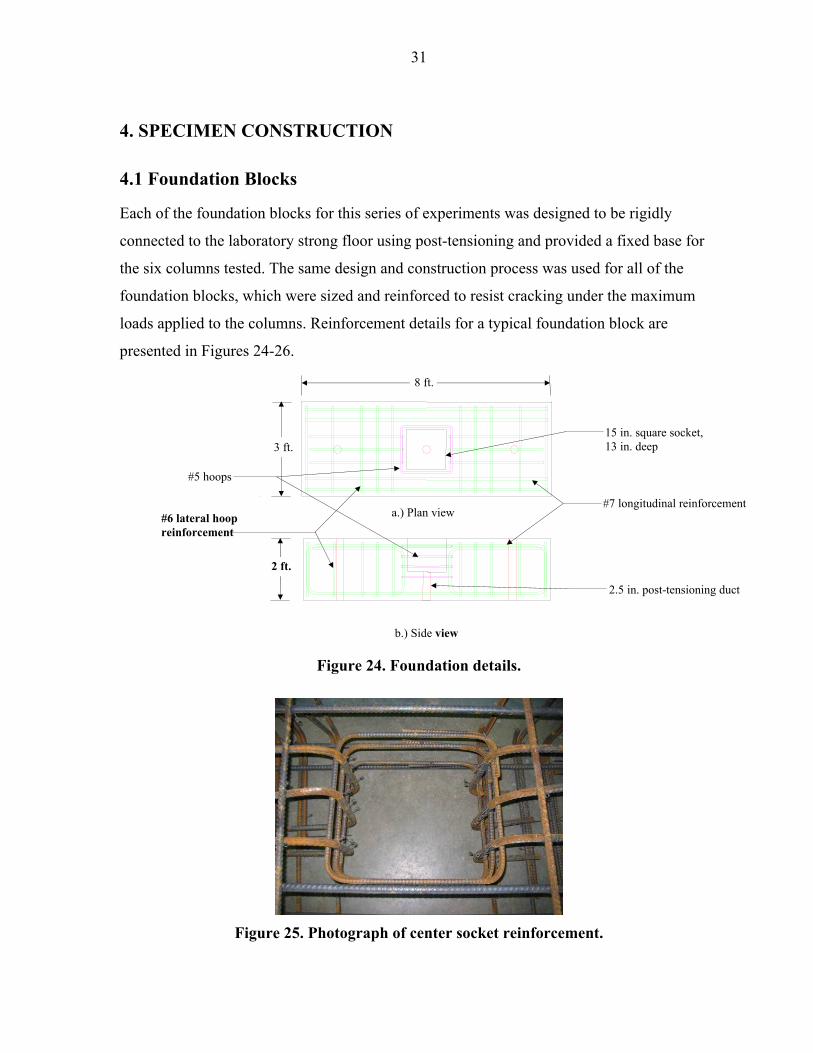
31
4. SPECIMEN CONSTRUCTION
4.1 Foundation Blocks
Each of the foundation blocks for this series of experiments was designed to be rigidly
connected to the laboratory strong floor using post-tensioning and provided a fixed base for
the six columns tested. The same design and construction process was used for all of the
foundation blocks, which were sized and reinforced to resist cracking under the maximum
loads applied to the columns. Reinforcement details for a typical foundation block are
presented in Figures 24-26.
Figure 24. Foundation details.
Figure 25. Photograph of center socket reinforcement.
#5 hoops
15 in. square socket, 13 in. deep
2.5 in. post-tensioning duct
#7 longitudinal reinforcement #6 lateral hoop reinforcement
a.) Plan view
b.) Side view
2 ft.
3 ft.
8 ft.
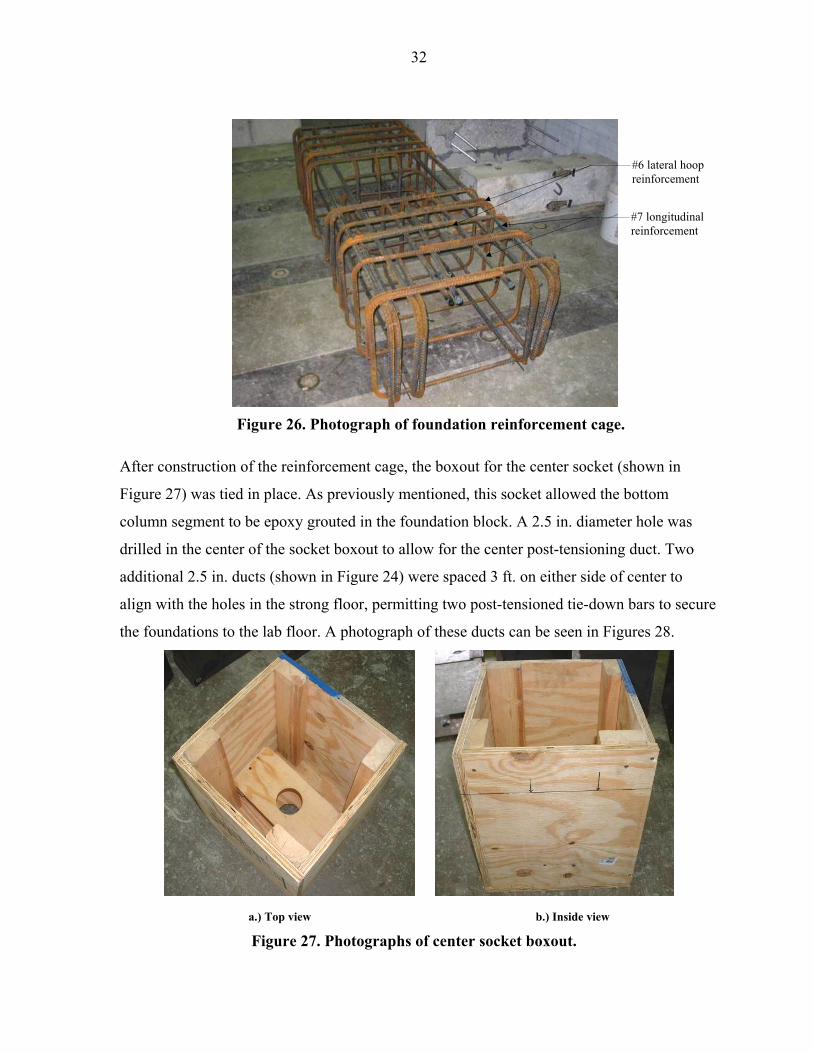
32
Figure 26. Photograph of foundation reinforcement cage.
After construction of the reinforcement cage, the boxout for the center socket (shown in
Figure 27) was tied in place. As previously mentioned, this socket allowed the bottom
column segment to be epoxy grouted in the foundation block. A 2.5 in. diameter hole was
drilled in the center of the socket boxout to allow for the center post-tensioning duct. Two
additional 2.5 in. ducts (shown in Figure 24) were spaced 3 ft. on either side of center to
align with the holes in the strong floor, permitting two post-tensioned tie-down bars to secure
the foundations to the lab floor. A photograph of these ducts can be seen in Figures 28.
a.) Top view b.) Inside view Figure 27. Photographs of center socket boxout.
#7 longitudinal reinforcement
#6 lateral hoop reinforcement
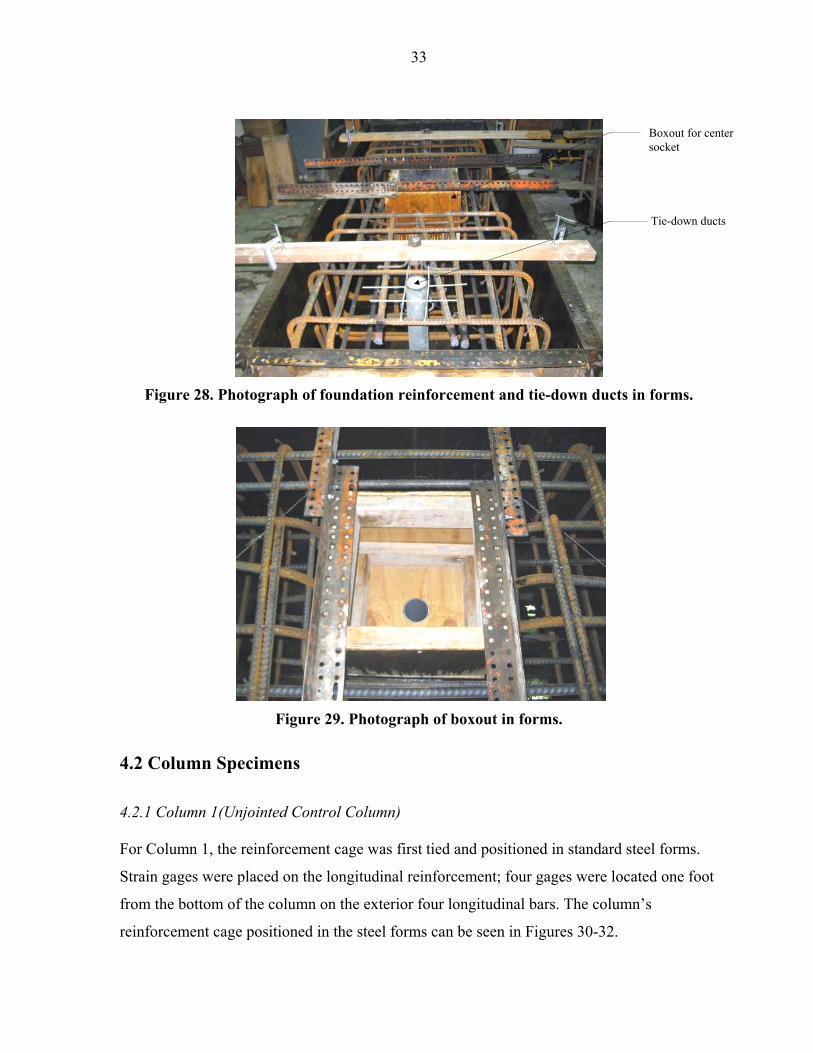
33
Figure 28. Photograph of foundation reinforcement and tie-down ducts in forms.
Figure 29. Photograph of boxout in forms.
4.2 Column Specimens
4.2.1 Column 1(Unjointed Control Column)
For Column 1, the reinforcement cage was first tied and positioned in standard steel forms.
Strain gages were placed on the longitudinal reinforcement; four gages were located one foot
from the bottom of the column on the exterior four longitudinal bars. The column’s
reinforcement cage positioned in the steel forms can be seen in Figures 30-32.
Tie-down ducts
Boxout for center socket
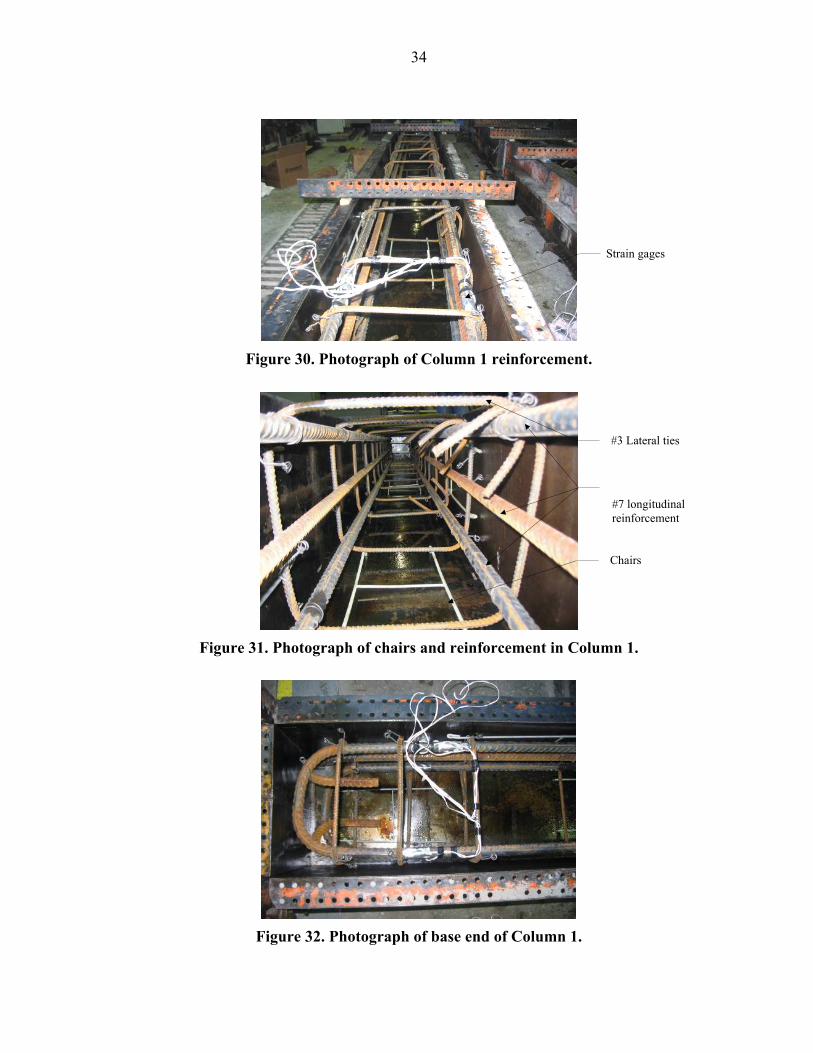
34
Figure 30. Photograph of Column 1 reinforcement.
Figure 31. Photograph of chairs and reinforcement in Column 1.
Figure 32. Photograph of base end of Column 1.
Strain gages
#3 Lateral ties
Chairs
#7 longitudinal reinforcement
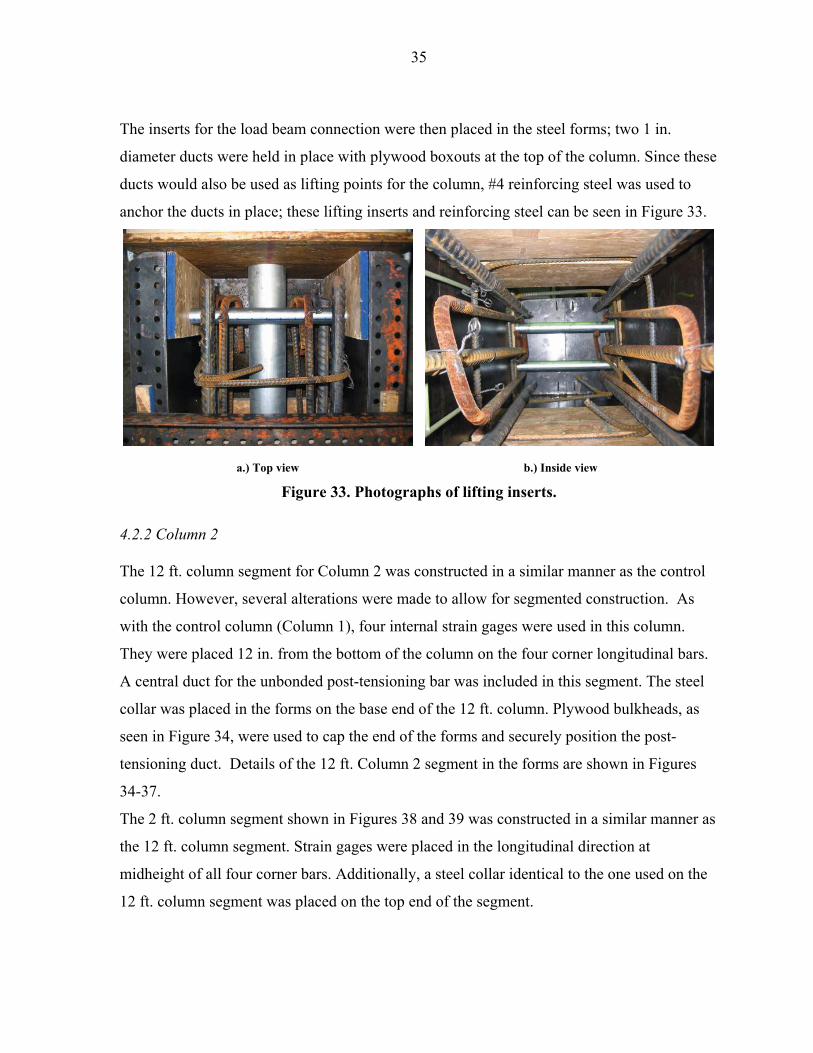
35
The inserts for the load beam connection were then placed in the steel forms; two 1 in.
diameter ducts were held in place with plywood boxouts at the top of the column. Since these
ducts would also be used as lifting points for the column, #4 reinforcing steel was used to
anchor the ducts in place; these lifting inserts and reinforcing steel can be seen in Figure 33.
a.) Top view b.) Inside view
Figure 33. Photographs of lifting inserts.
4.2.2 Column 2
The 12 ft. column segment for Column 2 was constructed in a similar manner as the control
column. However, several alterations were made to allow for segmented construction. As
with the control column (Column 1), four internal strain gages were used in this column.
They were placed 12 in. from the bottom of the column on the four corner longitudinal bars.
A central duct for the unbonded post-tensioning bar was included in this segment. The steel
collar was placed in the forms on the base end of the 12 ft. column. Plywood bulkheads, as
seen in Figure 34, were used to cap the end of the forms and securely position the post-
tensioning duct. Details of the 12 ft. Column 2 segment in the forms are shown in Figures
34-37.
The 2 ft. column segment shown in Figures 38 and 39 was constructed in a similar manner as
the 12 ft. column segment. Strain gages were placed in the longitudinal direction at
midheight of all four corner bars. Additionally, a steel collar identical to the one used on the
12 ft. column segment was placed on the top end of the segment.
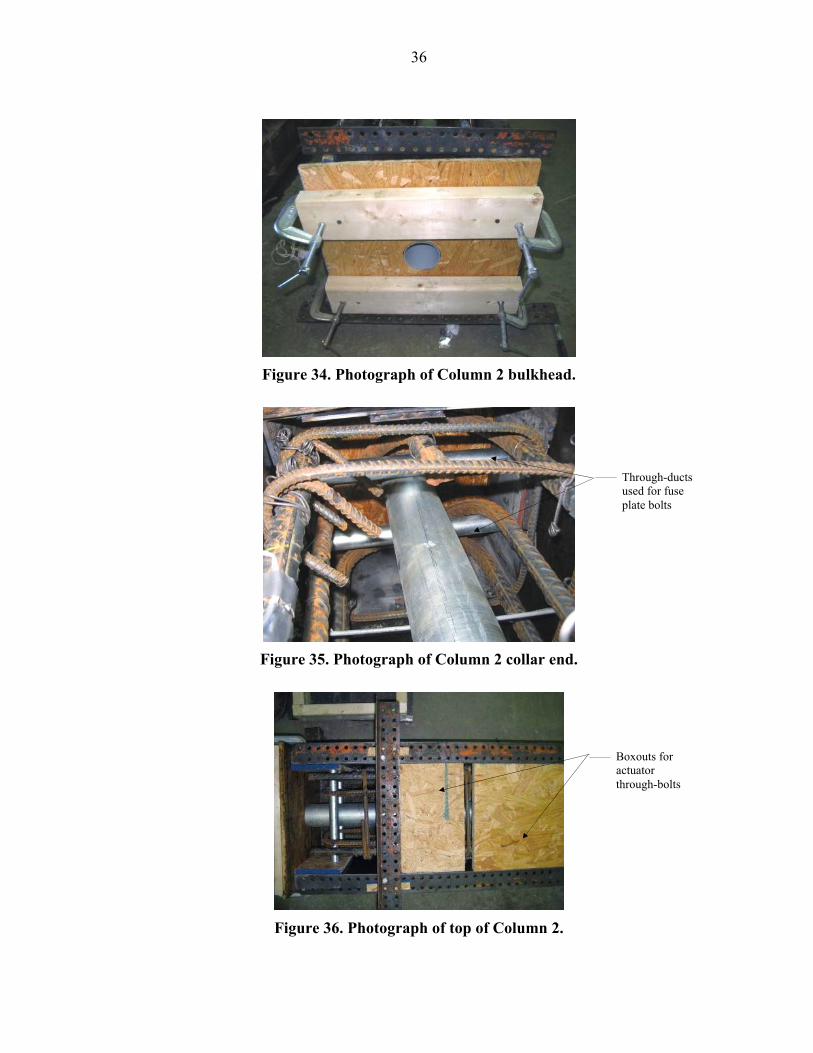
36
Figure 34. Photograph of Column 2 bulkhead.
Figure 35. Photograph of Column 2 collar end.
Figure 36. Photograph of top of Column 2.
Through-ducts used for fuse plate bolts
Boxouts for actuator through-bolts
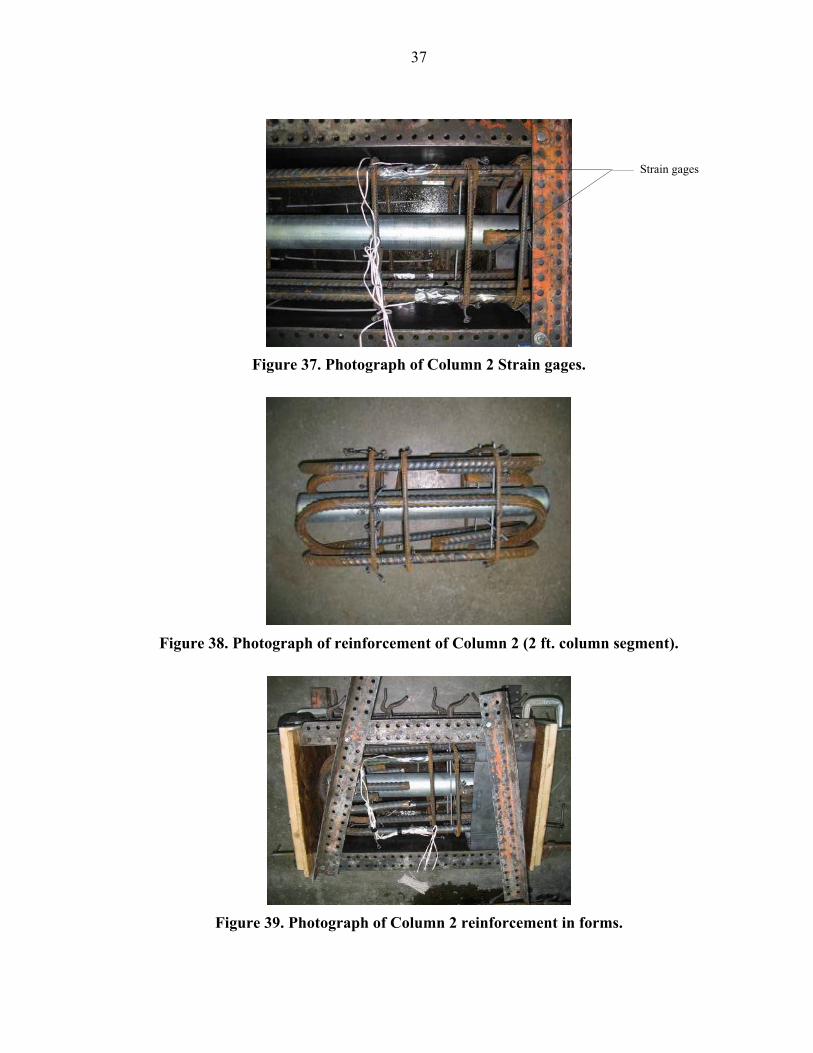
37
Figure 37. Photograph of Column 2 Strain gages.
Figure 38. Photograph of reinforcement of Column 2 (2 ft. column segment).
Figure 39. Photograph of Column 2 reinforcement in forms.
Strain gages
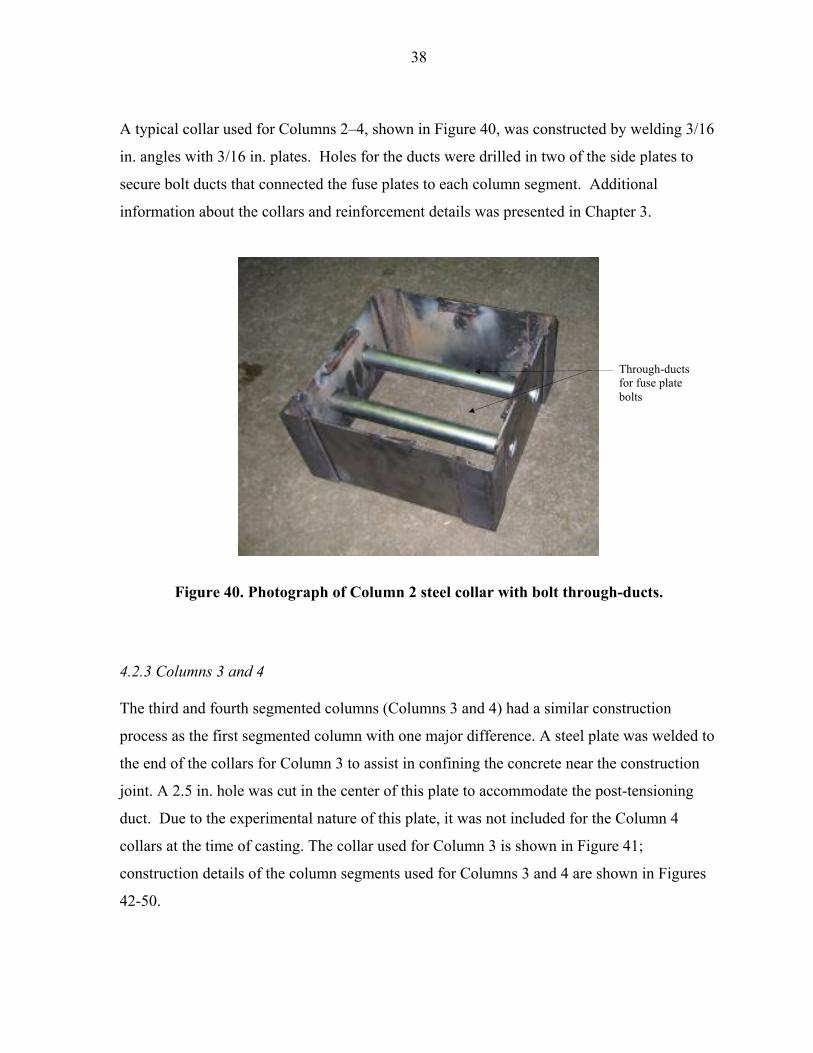
38
A typical collar used for Columns 2–4, shown in Figure 40, was constructed by welding 3/16
in. angles with 3/16 in. plates. Holes for the ducts were drilled in two of the side plates to
secure bolt ducts that connected the fuse plates to each column segment. Additional
information about the collars and reinforcement details was presented in Chapter 3.
Figure 40. Photograph of Column 2 steel collar with bolt through-ducts.
4.2.3 Columns 3 and 4
The third and fourth segmented columns (Columns 3 and 4) had a similar construction
process as the first segmented column with one major difference. A steel plate was welded to
the end of the collars for Column 3 to assist in confining the concrete near the construction
joint. A 2.5 in. hole was cut in the center of this plate to accommodate the post-tensioning
duct. Due to the experimental nature of this plate, it was not included for the Column 4
collars at the time of casting. The collar used for Column 3 is shown in Figure 41;
construction details of the column segments used for Columns 3 and 4 are shown in Figures
42-50.
Through-ducts for fuse plate bolts
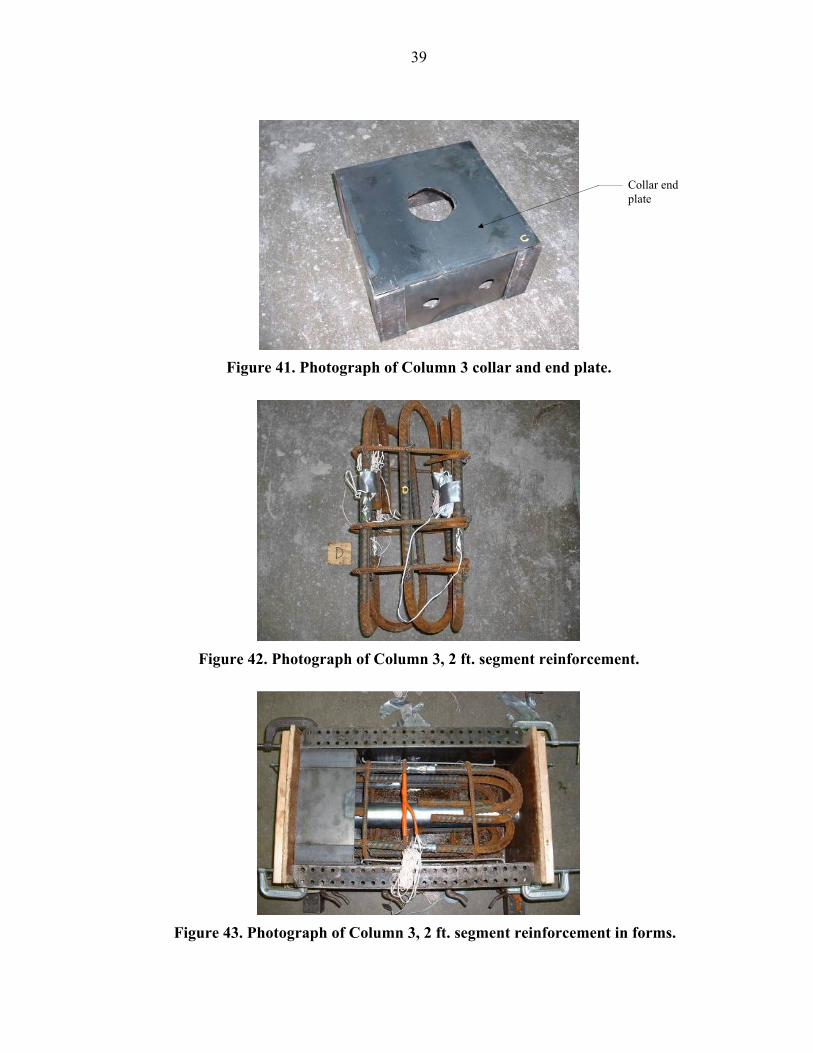
39
Figure 41. Photograph of Column 3 collar and end plate.
Figure 42. Photograph of Column 3, 2 ft. segment reinforcement.
Figure 43. Photograph of Column 3, 2 ft. segment reinforcement in forms.
Collar end plate
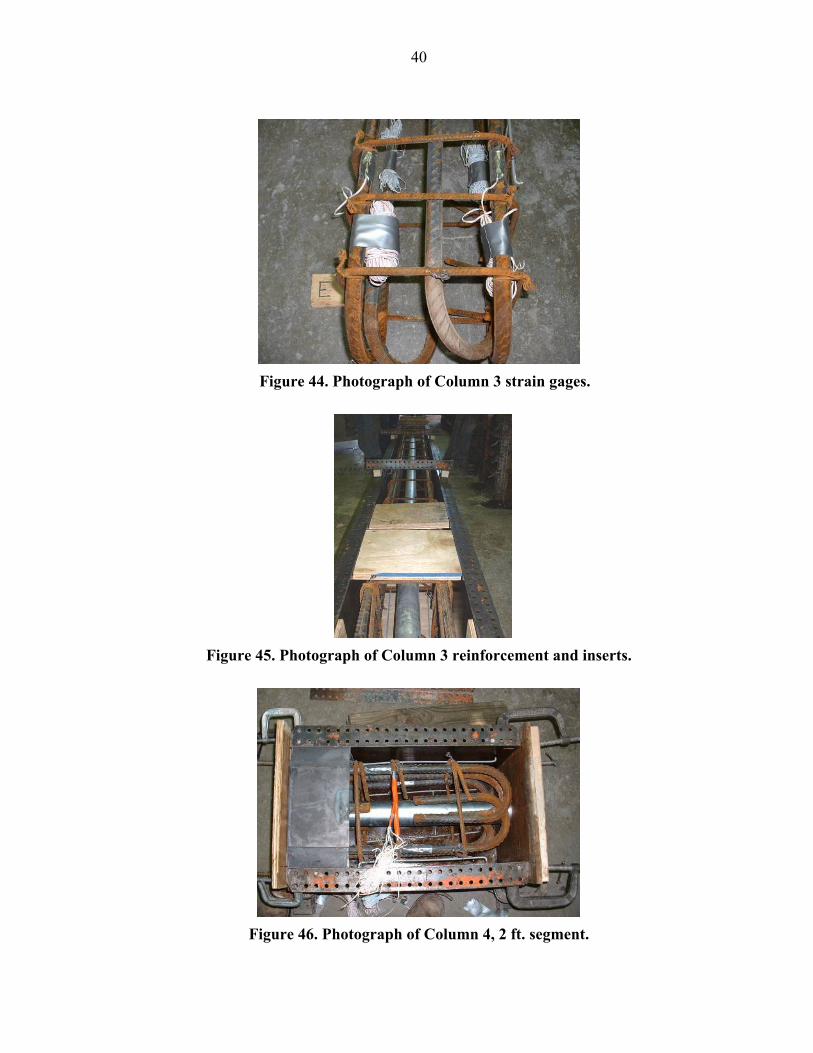
40
Figure 44. Photograph of Column 3 strain gages.
Figure 45. Photograph of Column 3 reinforcement and inserts.
Figure 46. Photograph of Column 4, 2 ft. segment.
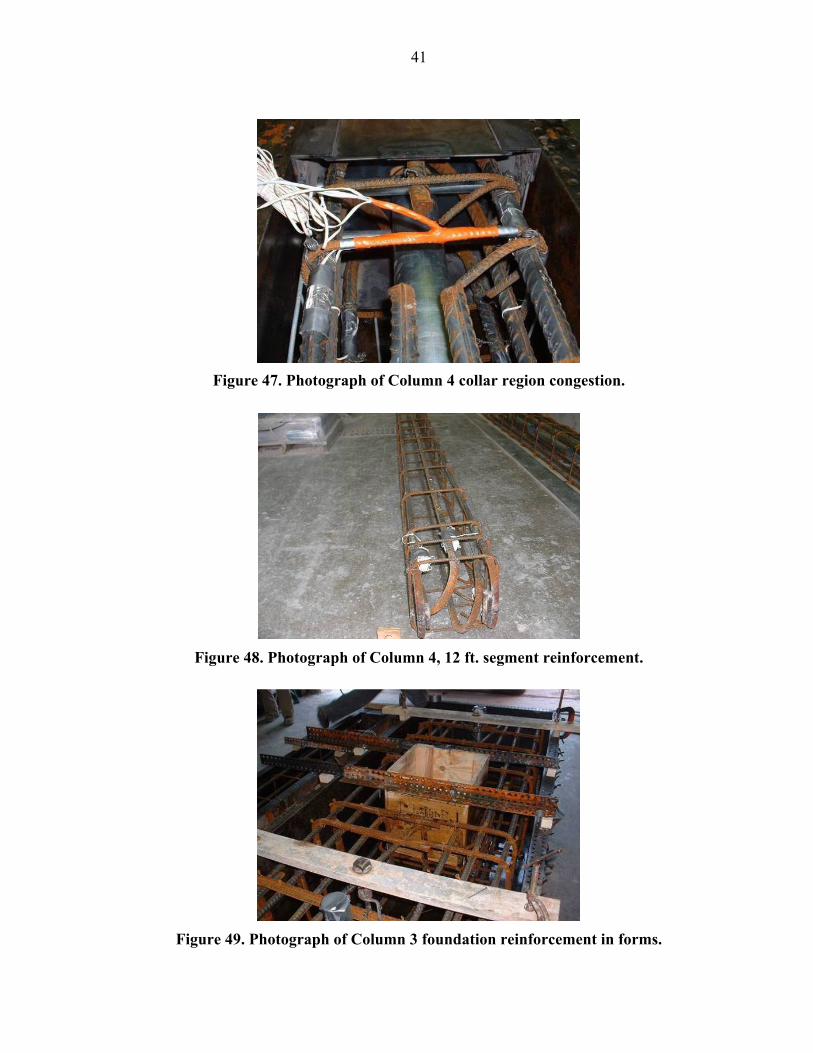
41
Figure 47. Photograph of Column 4 collar region congestion.
Figure 48. Photograph of Column 4, 12 ft. segment reinforcement.
Figure 49. Photograph of Column 3 foundation reinforcement in forms.
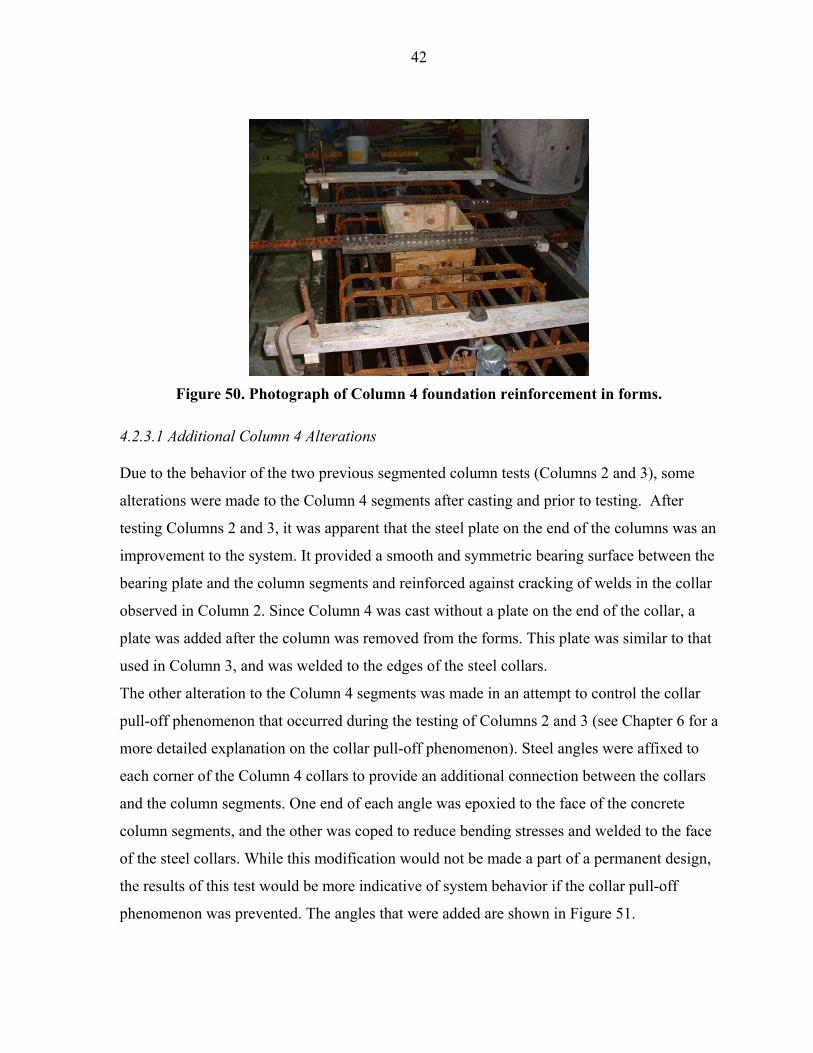
42
Figure 50. Photograph of Column 4 foundation reinforcement in forms.
4.2.3.1 Additional Column 4 Alterations
Due to the behavior of the two previous segmented column tests (Columns 2 and 3), some
alterations were made to the Column 4 segments after casting and prior to testing. After
testing Columns 2 and 3, it was apparent that the steel plate on the end of the columns was an
improvement to the system. It provided a smooth and symmetric bearing surface between the
bearing plate and the column segments and reinforced against cracking of welds in the collar
observed in Column 2. Since Column 4 was cast without a plate on the end of the collar, a
plate was added after the column was removed from the forms. This plate was similar to that
used in Column 3, and was welded to the edges of the steel collars.
The other alteration to the Column 4 segments was made in an attempt to control the collar
pull-off phenomenon that occurred during the testing of Columns 2 and 3 (see Chapter 6 for a
more detailed explanation on the collar pull-off phenomenon). Steel angles were affixed to
each corner of the Column 4 collars to provide an additional connection between the collars
and the column segments. One end of each angle was epoxied to the face of the concrete
column segments, and the other was coped to reduce bending stresses and welded to the face
of the steel collars. While this modification would not be made a part of a permanent design,
the results of this test would be more indicative of system behavior if the collar pull-off
phenomenon was prevented. The angles that were added are shown in Figure 51.
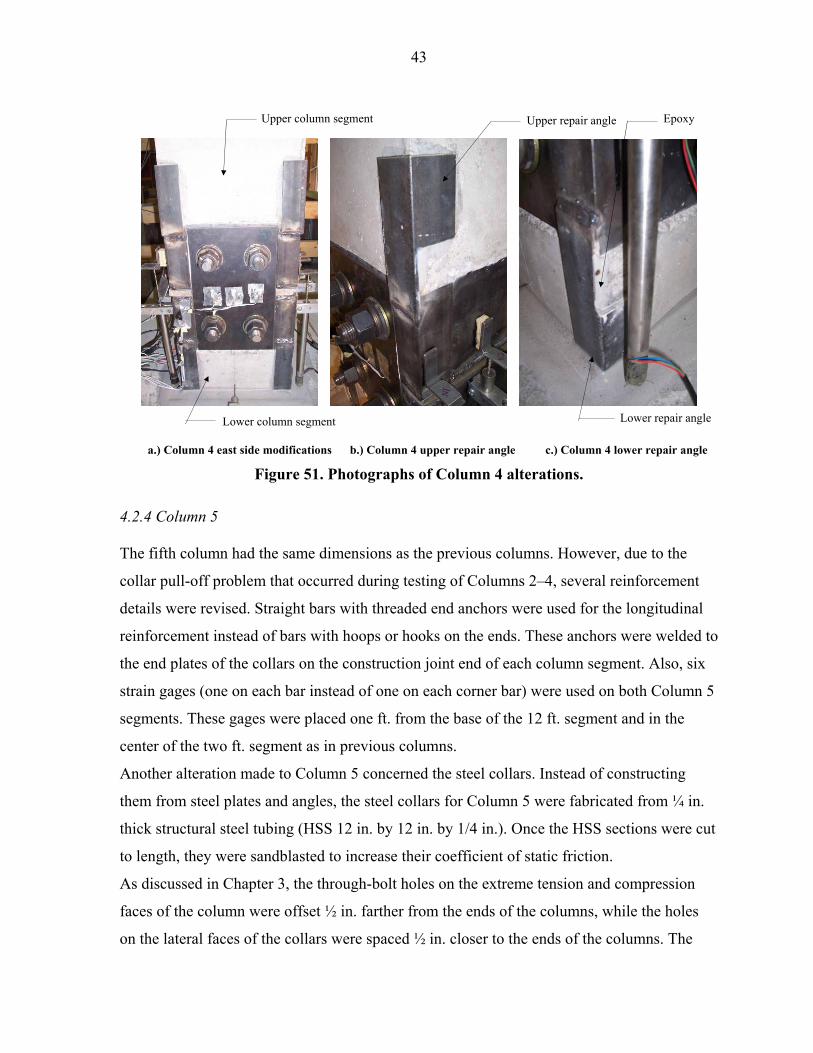
43
a.) Column 4 east side modifications b.) Column 4 upper repair angle c.) Column 4 lower repair angle
Figure 51. Photographs of Column 4 alterations.
4.2.4 Column 5
The fifth column had the same dimensions as the previous columns. However, due to the
collar pull-off problem that occurred during testing of Columns 2–4, several reinforcement
details were revised. Straight bars with threaded end anchors were used for the longitudinal
reinforcement instead of bars with hoops or hooks on the ends. These anchors were welded to
the end plates of the collars on the construction joint end of each column segment. Also, six
strain gages (one on each bar instead of one on each corner bar) were used on both Column 5
segments. These gages were placed one ft. from the base of the 12 ft. segment and in the
center of the two ft. segment as in previous columns.
Another alteration made to Column 5 concerned the steel collars. Instead of constructing
them from steel plates and angles, the steel collars for Column 5 were fabricated from ¼ in.
thick structural steel tubing (HSS 12 in. by 12 in. by 1/4 in.). Once the HSS sections were cut
to length, they were sandblasted to increase their coefficient of static friction.
As discussed in Chapter 3, the through-bolt holes on the extreme tension and compression
faces of the column were offset ½ in. farther from the ends of the columns, while the holes
on the lateral faces of the collars were spaced ½ in. closer to the ends of the columns. The
Upper repair angle
Lower repair angle
Upper column segment Epoxy
Lower column segment
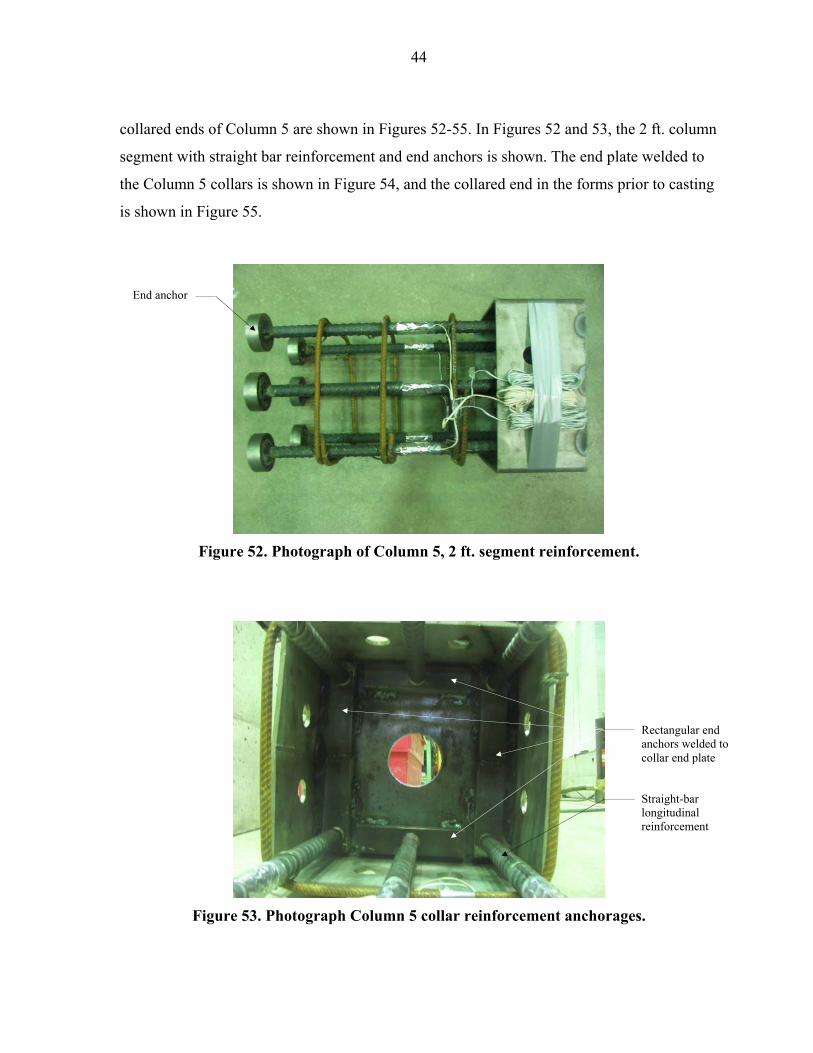
44
collared ends of Column 5 are shown in Figures 52-55. In Figures 52 and 53, the 2 ft. column
segment with straight bar reinforcement and end anchors is shown. The end plate welded to
the Column 5 collars is shown in Figure 54, and the collared end in the forms prior to casting
is shown in Figure 55.
Figure 52. Photograph of Column 5, 2 ft. segment reinforcement.
Figure 53. Photograph Column 5 collar reinforcement anchorages.
End anchor
Straight-bar longitudinal reinforcement
Rectangular end anchors welded to collar end plate
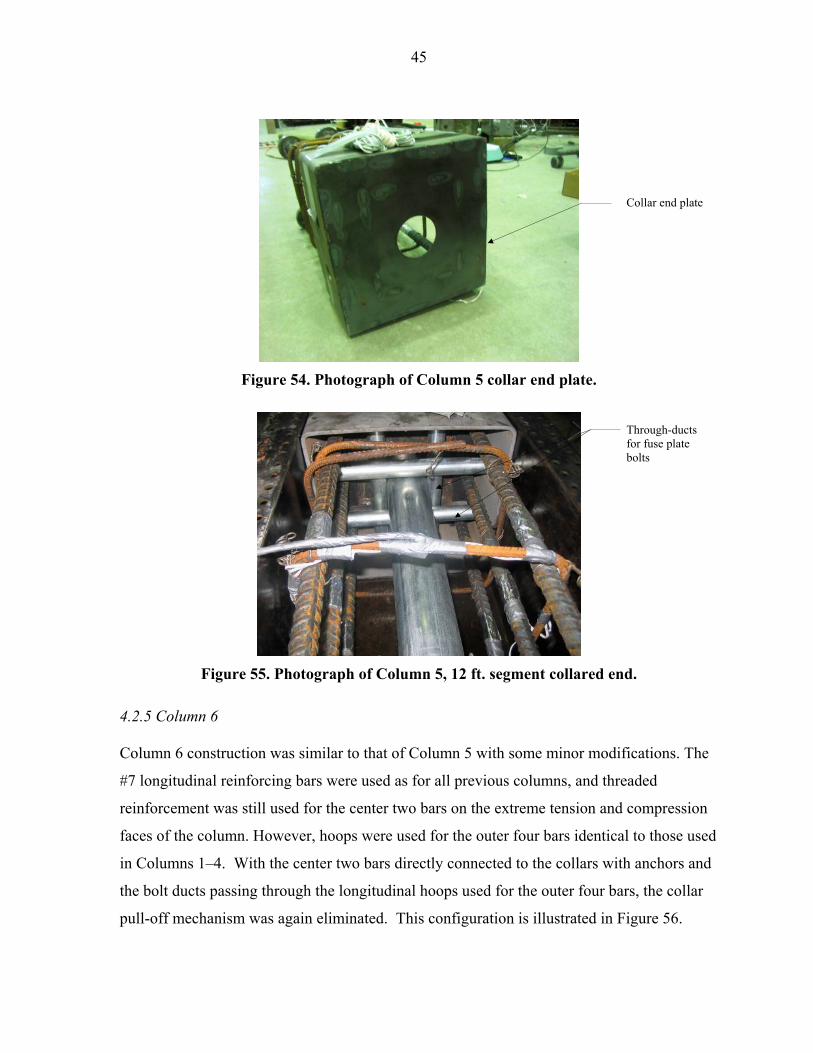
45
Figure 54. Photograph of Column 5 collar end plate.
Figure 55. Photograph of Column 5, 12 ft. segment collared end.
4.2.5 Column 6
Column 6 construction was similar to that of Column 5 with some minor modifications. The
#7 longitudinal reinforcing bars were used as for all previous columns, and threaded
reinforcement was still used for the center two bars on the extreme tension and compression
faces of the column. However, hoops were used for the outer four bars identical to those used
in Columns 1–4. With the center two bars directly connected to the collars with anchors and
the bolt ducts passing through the longitudinal hoops used for the outer four bars, the collar
pull-off mechanism was again eliminated. This configuration is illustrated in Figure 56.
Collar end plate
Through-ducts for fuse plate bolts
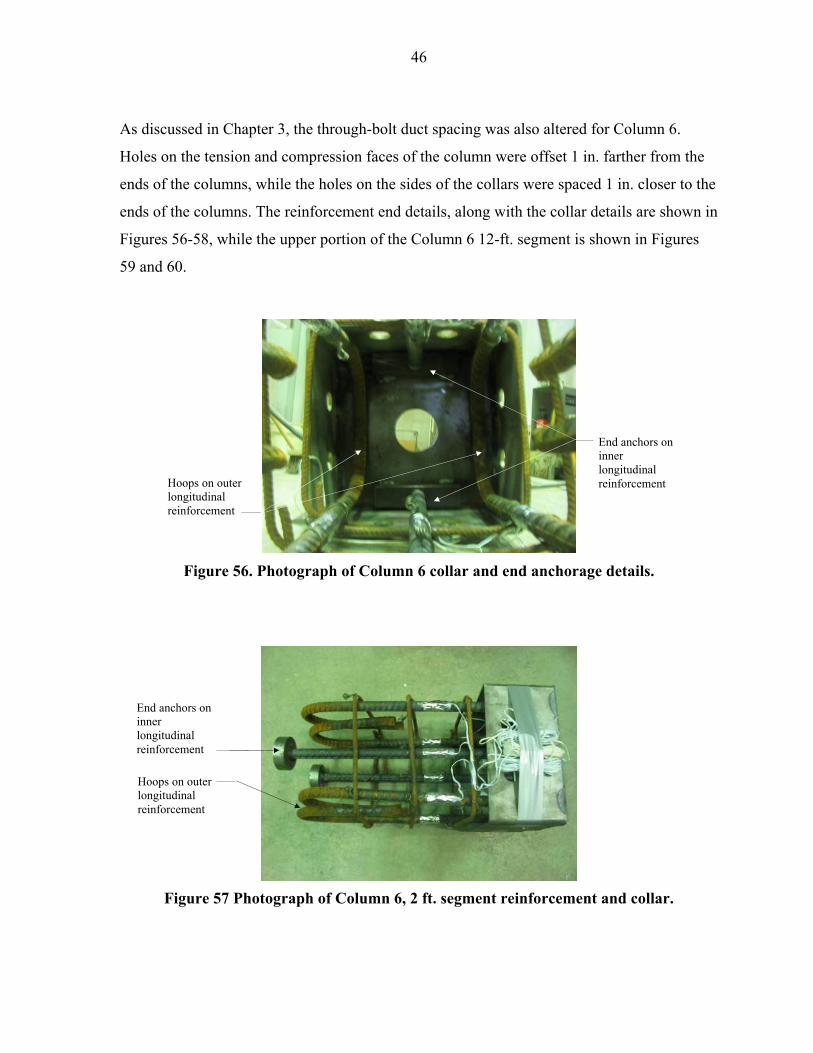
46
As discussed in Chapter 3, the through-bolt duct spacing was also altered for Column 6.
Holes on the tension and compression faces of the column were offset 1 in. farther from the
ends of the columns, while the holes on the sides of the collars were spaced 1 in. closer to the
ends of the columns. The reinforcement end details, along with the collar details are shown in
Figures 56-58, while the upper portion of the Column 6 12-ft. segment is shown in Figures
59 and 60.
Figure 56. Photograph of Column 6 collar and end anchorage details.
Figure 57 Photograph of Column 6, 2 ft. segment reinforcement and collar.
End anchors on inner longitudinal reinforcement
Hoops on outer longitudinal reinforcement
End anchors on inner longitudinal reinforcement Hoops on outer
longitudinal reinforcement
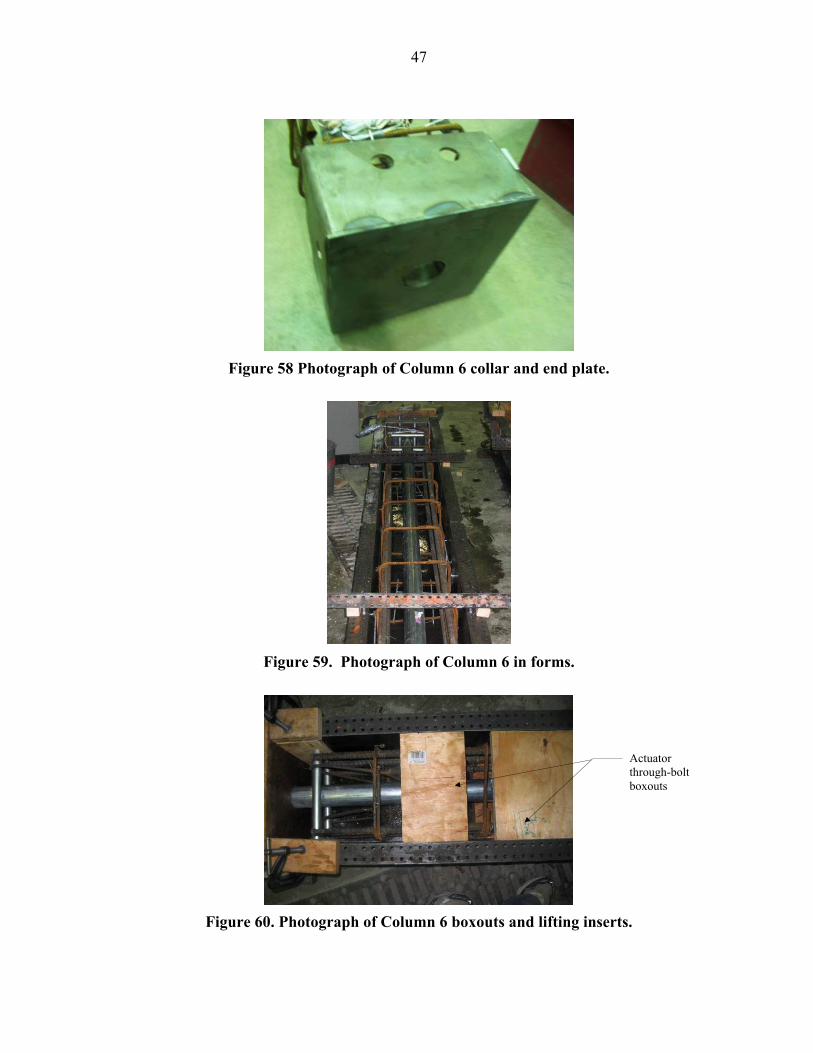
47
Figure 58 Photograph of Column 6 collar and end plate.
Figure 59. Photograph of Column 6 in forms.
Figure 60. Photograph of Column 6 boxouts and lifting inserts.
Actuator through-bolt boxouts
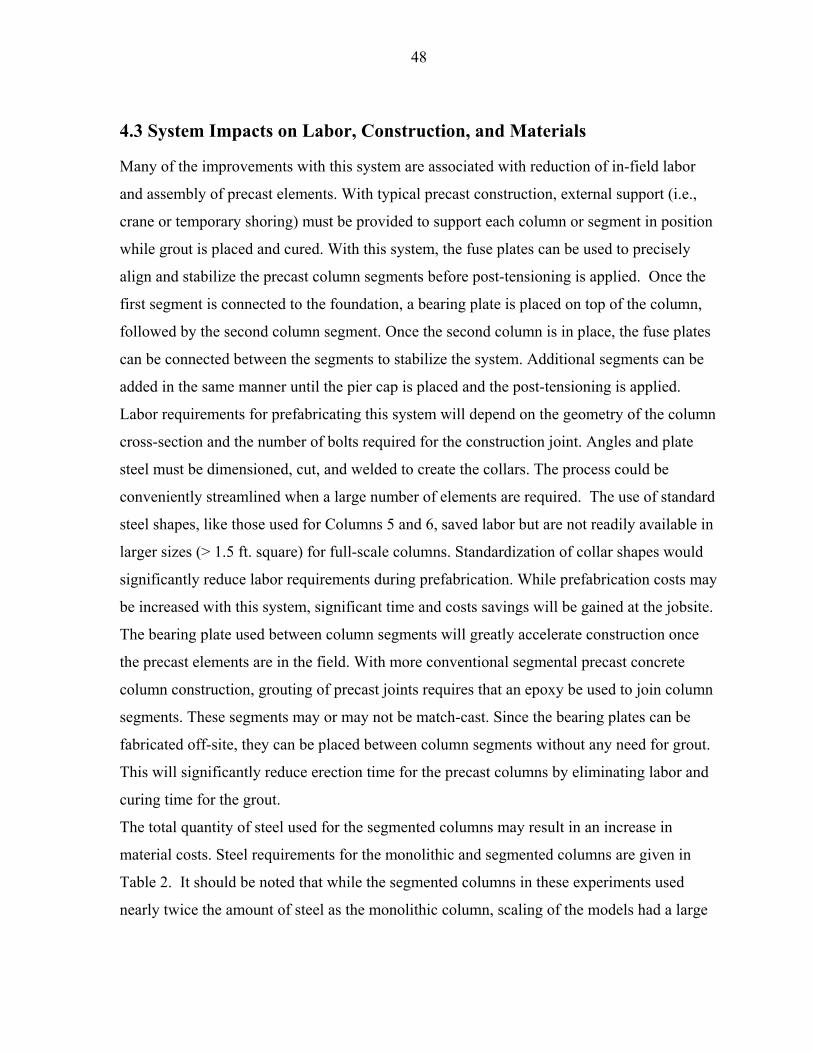
48
4.3 System Impacts on Labor, Construction, and Materials
Many of the improvements with this system are associated with reduction of in-field labor
and assembly of precast elements. With typical precast construction, external support (i.e.,
crane or temporary shoring) must be provided to support each column or segment in position
while grout is placed and cured. With this system, the fuse plates can be used to precisely
align and stabilize the precast column segments before post-tensioning is applied. Once the
first segment is connected to the foundation, a bearing plate is placed on top of the column,
followed by the second column segment. Once the second column is in place, the fuse plates
can be connected between the segments to stabilize the system. Additional segments can be
added in the same manner until the pier cap is placed and the post-tensioning is applied.
Labor requirements for prefabricating this system will depend on the geometry of the column
cross-section and the number of bolts required for the construction joint. Angles and plate
steel must be dimensioned, cut, and welded to create the collars. The process could be
conveniently streamlined when a large number of elements are required. The use of standard
steel shapes, like those used for Columns 5 and 6, saved labor but are not readily available in
larger sizes (> 1.5 ft. square) for full-scale columns. Standardization of collar shapes would
significantly reduce labor requirements during prefabrication. While prefabrication costs may
be increased with this system, significant time and costs savings will be gained at the jobsite.
The bearing plate used between column segments will greatly accelerate construction once
the precast elements are in the field. With more conventional segmental precast concrete
column construction, grouting of precast joints requires that an epoxy be used to join column
segments. These segments may or may not be match-cast. Since the bearing plates can be
fabricated off-site, they can be placed between column segments without any need for grout.
This will significantly reduce erection time for the precast columns by eliminating labor and
curing time for the grout.
The total quantity of steel used for the segmented columns may result in an increase in
material costs. Steel requirements for the monolithic and segmented columns are given in
Table 2. It should be noted that while the segmented columns in these experiments used
nearly twice the amount of steel as the monolithic column, scaling of the models had a large
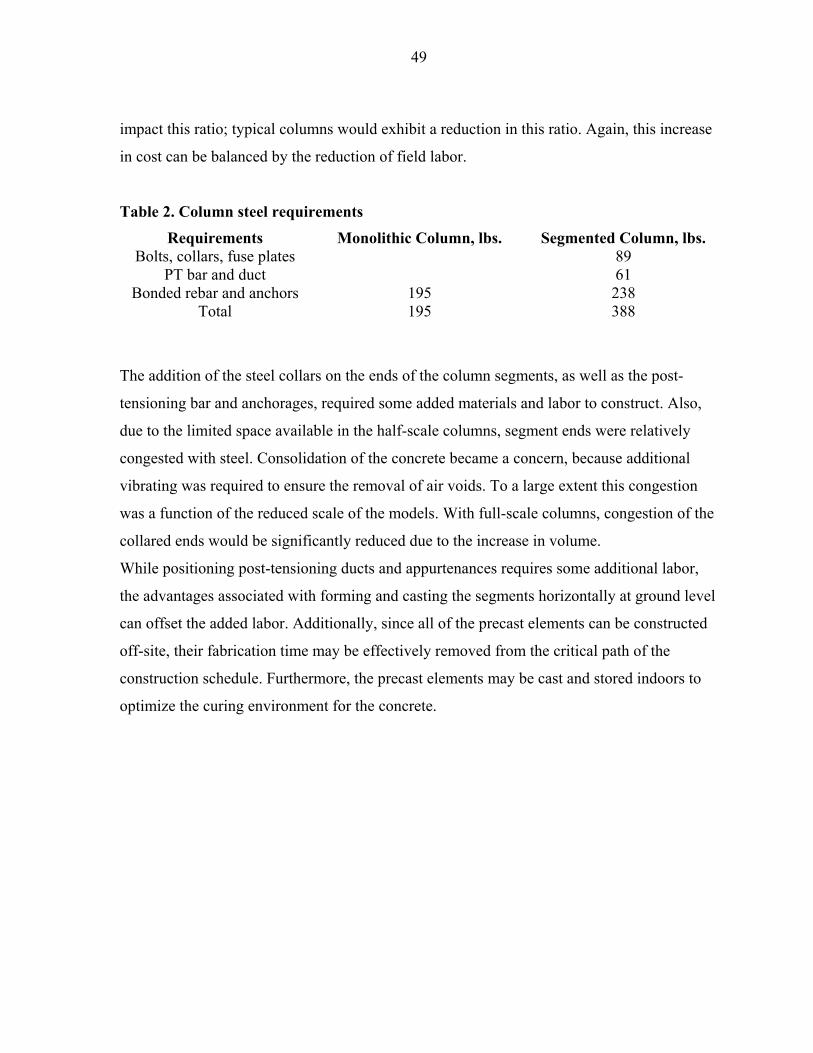
49
impact this ratio; typical columns would exhibit a reduction in this ratio. Again, this increase
in cost can be balanced by the reduction of field labor.
Table 2. Column steel requirements
Requirements Monolithic Column, lbs. Segmented Column, lbs. Bolts, collars, fuse plates 89
PT bar and duct 61 Bonded rebar and anchors 195 238
Total 195 388
The addition of the steel collars on the ends of the column segments, as well as the post-
tensioning bar and anchorages, required some added materials and labor to construct. Also,
due to the limited space available in the half-scale columns, segment ends were relatively
congested with steel. Consolidation of the concrete became a concern, because additional
vibrating was required to ensure the removal of air voids. To a large extent this congestion
was a function of the reduced scale of the models. With full-scale columns, congestion of the
collared ends would be significantly reduced due to the increase in volume.
While positioning post-tensioning ducts and appurtenances requires some additional labor,
the advantages associated with forming and casting the segments horizontally at ground level
can offset the added labor. Additionally, since all of the precast elements can be constructed
off-site, their fabrication time may be effectively removed from the critical path of the
construction schedule. Furthermore, the precast elements may be cast and stored indoors to
optimize the curing environment for the concrete.
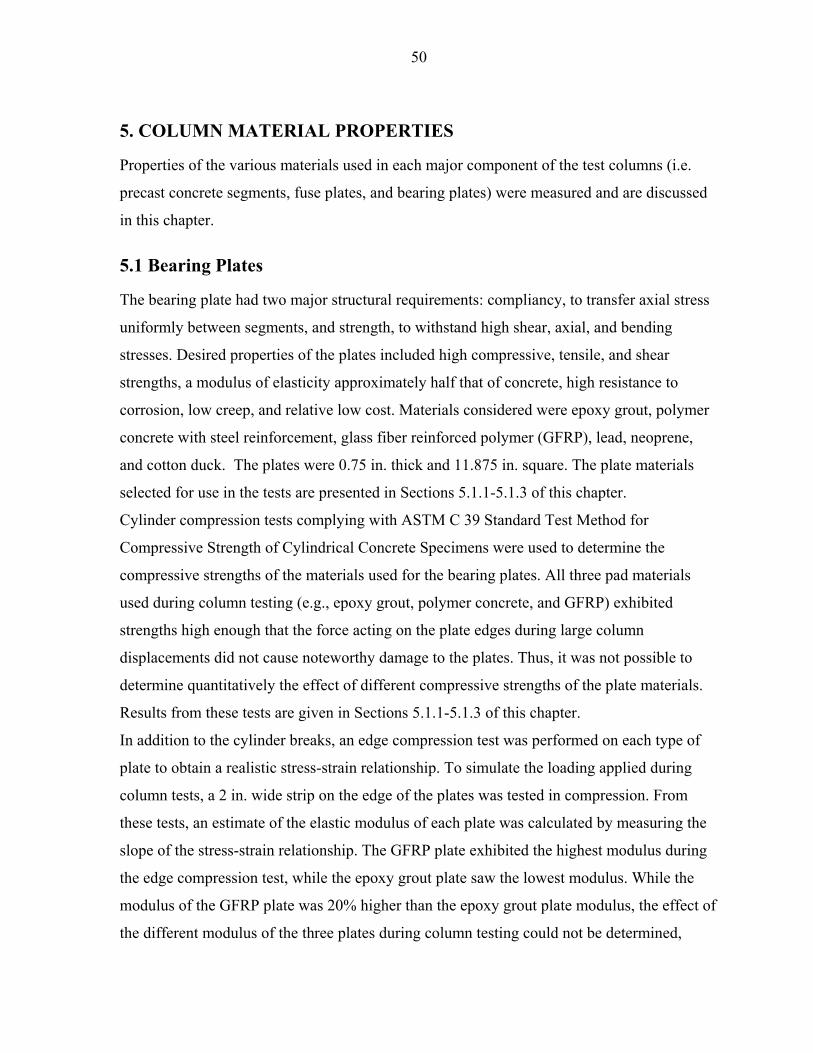
50
5. COLUMN MATERIAL PROPERTIES
Properties of the various materials used in each major component of the test columns (i.e.
precast concrete segments, fuse plates, and bearing plates) were measured and are discussed
in this chapter.
5.1 Bearing Plates
The bearing plate had two major structural requirements: compliancy, to transfer axial stress
uniformly between segments, and strength, to withstand high shear, axial, and bending
stresses. Desired properties of the plates included high compressive, tensile, and shear
strengths, a modulus of elasticity approximately half that of concrete, high resistance to
corrosion, low creep, and relative low cost. Materials considered were epoxy grout, polymer
concrete with steel reinforcement, glass fiber reinforced polymer (GFRP), lead, neoprene,
and cotton duck. The plates were 0.75 in. thick and 11.875 in. square. The plate materials
selected for use in the tests are presented in Sections 5.1.1-5.1.3 of this chapter.
Cylinder compression tests complying with ASTM C 39 Standard Test Method for
Compressive Strength of Cylindrical Concrete Specimens were used to determine the
compressive strengths of the materials used for the bearing plates. All three pad materials
used during column testing (e.g., epoxy grout, polymer concrete, and GFRP) exhibited
strengths high enough that the force acting on the plate edges during large column
displacements did not cause noteworthy damage to the plates. Thus, it was not possible to
determine quantitatively the effect of different compressive strengths of the plate materials.
Results from these tests are given in Sections 5.1.1-5.1.3 of this chapter.
In addition to the cylinder breaks, an edge compression test was performed on each type of
plate to obtain a realistic stress-strain relationship. To simulate the loading applied during
column tests, a 2 in. wide strip on the edge of the plates was tested in compression. From
these tests, an estimate of the elastic modulus of each plate was calculated by measuring the
slope of the stress-strain relationship. The GFRP plate exhibited the highest modulus during
the edge compression test, while the epoxy grout plate saw the lowest modulus. While the
modulus of the GFRP plate was 20% higher than the epoxy grout plate modulus, the effect of
the different modulus of the three plates during column testing could not be determined,
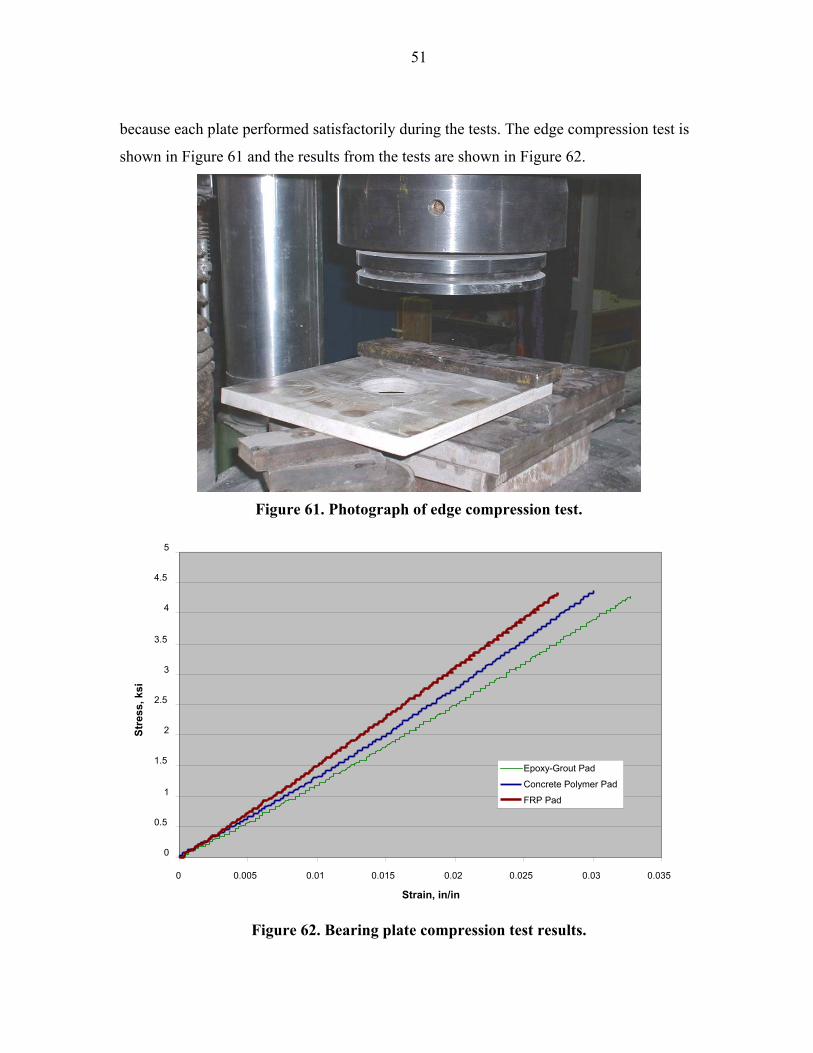
51
because each plate performed satisfactorily during the tests. The edge compression test is
shown in Figure 61 and the results from the tests are shown in Figure 62.
Figure 61. Photograph of edge compression test.
Figure 62. Bearing plate compression test results.
0
0.5
1
1.5
2
2.5
3
3.5
4
4.5
5
0 0.005 0.01 0.015 0.02 0.025 0.03 0.035
Strain, in/in
Stre
ss, k
si
Epoxy-Grout Pad Concrete Polymer Pad FRP Pad
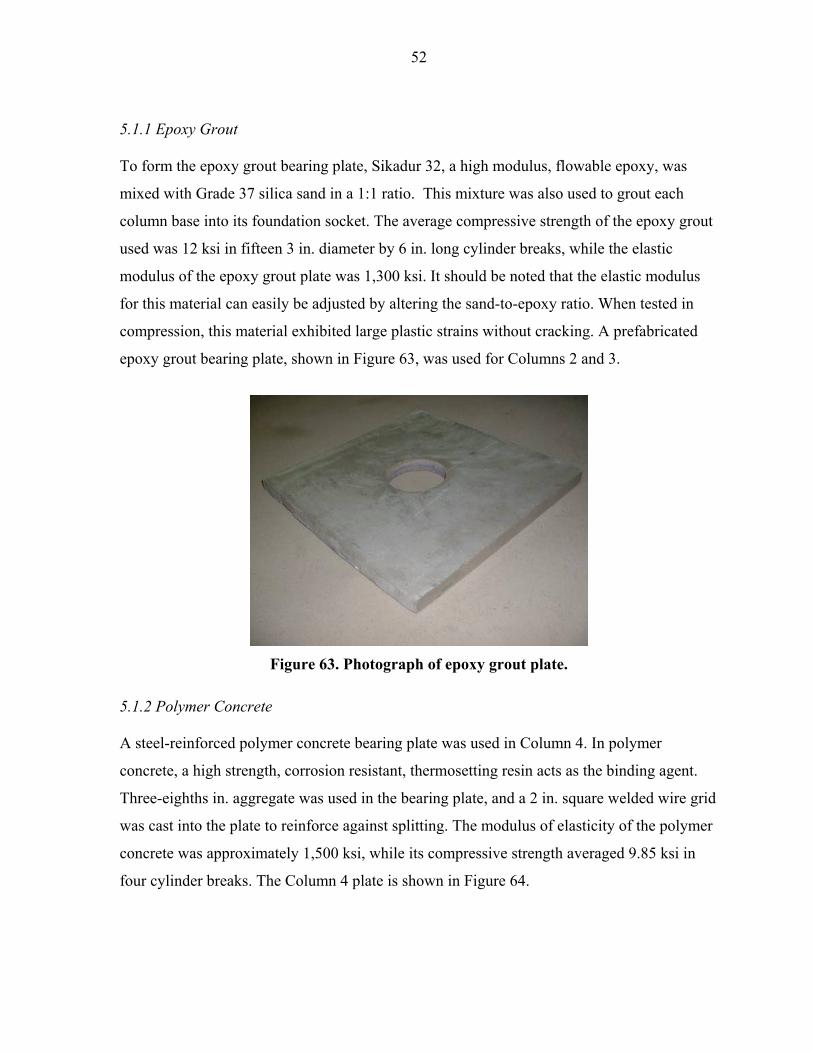
52
5.1.1 Epoxy Grout
To form the epoxy grout bearing plate, Sikadur 32, a high modulus, flowable epoxy, was
mixed with Grade 37 silica sand in a 1:1 ratio. This mixture was also used to grout each
column base into its foundation socket. The average compressive strength of the epoxy grout
used was 12 ksi in fifteen 3 in. diameter by 6 in. long cylinder breaks, while the elastic
modulus of the epoxy grout plate was 1,300 ksi. It should be noted that the elastic modulus
for this material can easily be adjusted by altering the sand-to-epoxy ratio. When tested in
compression, this material exhibited large plastic strains without cracking. A prefabricated
epoxy grout bearing plate, shown in Figure 63, was used for Columns 2 and 3.
Figure 63. Photograph of epoxy grout plate.
5.1.2 Polymer Concrete A steel-reinforced polymer concrete bearing plate was used in Column 4. In polymer
concrete, a high strength, corrosion resistant, thermosetting resin acts as the binding agent.
Three-eighths in. aggregate was used in the bearing plate, and a 2 in. square welded wire grid
was cast into the plate to reinforce against splitting. The modulus of elasticity of the polymer
concrete was approximately 1,500 ksi, while its compressive strength averaged 9.85 ksi in
four cylinder breaks. The Column 4 plate is shown in Figure 64.
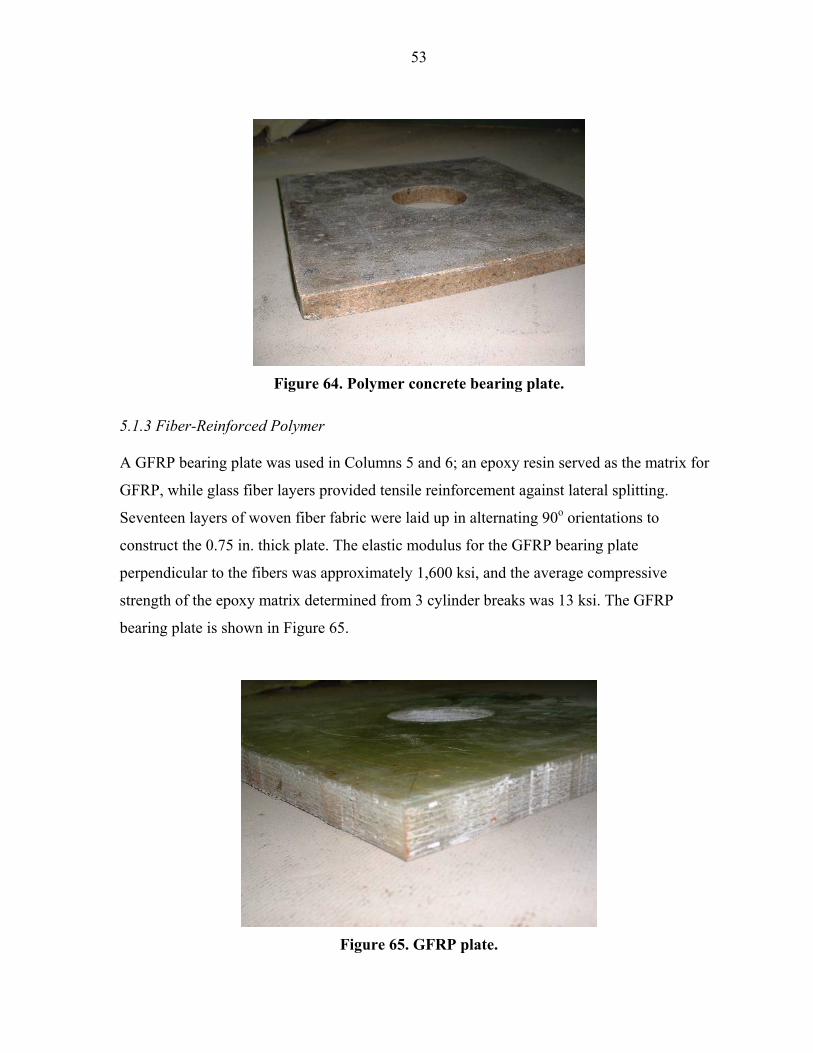
53
Figure 64. Polymer concrete bearing plate.
5.1.3 Fiber-Reinforced Polymer
A GFRP bearing plate was used in Columns 5 and 6; an epoxy resin served as the matrix for
GFRP, while glass fiber layers provided tensile reinforcement against lateral splitting.
Seventeen layers of woven fiber fabric were laid up in alternating 90o orientations to
construct the 0.75 in. thick plate. The elastic modulus for the GFRP bearing plate
perpendicular to the fibers was approximately 1,600 ksi, and the average compressive
strength of the epoxy matrix determined from 3 cylinder breaks was 13 ksi. The GFRP
bearing plate is shown in Figure 65.
Figure 65. GFRP plate.
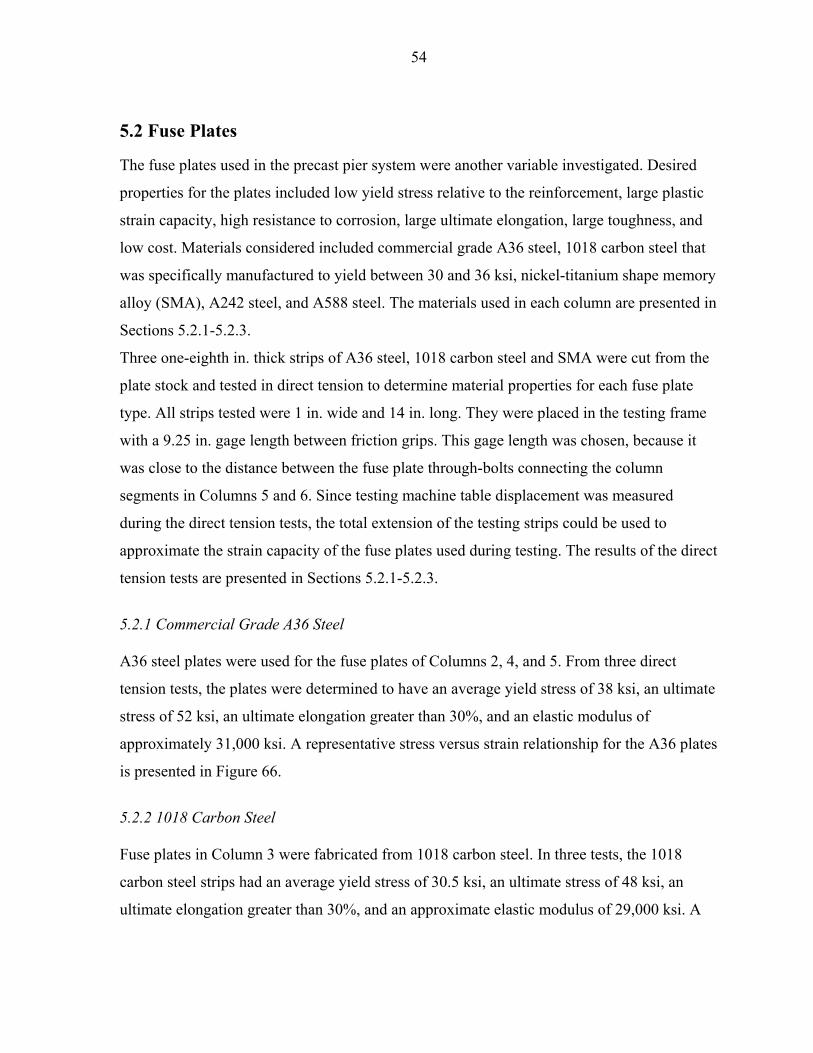
54
5.2 Fuse Plates
The fuse plates used in the precast pier system were another variable investigated. Desired
properties for the plates included low yield stress relative to the reinforcement, large plastic
strain capacity, high resistance to corrosion, large ultimate elongation, large toughness, and
low cost. Materials considered included commercial grade A36 steel, 1018 carbon steel that
was specifically manufactured to yield between 30 and 36 ksi, nickel-titanium shape memory
alloy (SMA), A242 steel, and A588 steel. The materials used in each column are presented in
Sections 5.2.1-5.2.3.
Three one-eighth in. thick strips of A36 steel, 1018 carbon steel and SMA were cut from the
plate stock and tested in direct tension to determine material properties for each fuse plate
type. All strips tested were 1 in. wide and 14 in. long. They were placed in the testing frame
with a 9.25 in. gage length between friction grips. This gage length was chosen, because it
was close to the distance between the fuse plate through-bolts connecting the column
segments in Columns 5 and 6. Since testing machine table displacement was measured
during the direct tension tests, the total extension of the testing strips could be used to
approximate the strain capacity of the fuse plates used during testing. The results of the direct
tension tests are presented in Sections 5.2.1-5.2.3.
5.2.1 Commercial Grade A36 Steel
A36 steel plates were used for the fuse plates of Columns 2, 4, and 5. From three direct
tension tests, the plates were determined to have an average yield stress of 38 ksi, an ultimate
stress of 52 ksi, an ultimate elongation greater than 30%, and an elastic modulus of
approximately 31,000 ksi. A representative stress versus strain relationship for the A36 plates
is presented in Figure 66.
5.2.2 1018 Carbon Steel
Fuse plates in Column 3 were fabricated from 1018 carbon steel. In three tests, the 1018
carbon steel strips had an average yield stress of 30.5 ksi, an ultimate stress of 48 ksi, an
ultimate elongation greater than 30%, and an approximate elastic modulus of 29,000 ksi. A
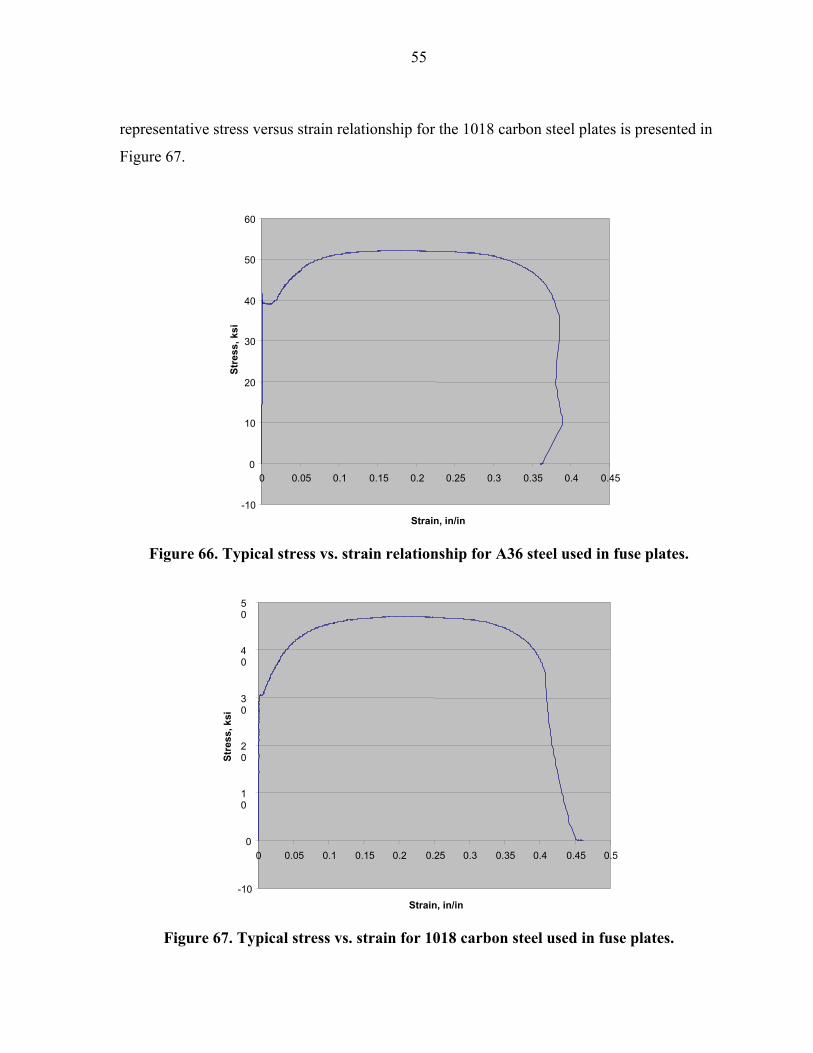
55
representative stress versus strain relationship for the 1018 carbon steel plates is presented in
Figure 67.
Figure 66. Typical stress vs. strain relationship for A36 steel used in fuse plates.
Figure 67. Typical stress vs. strain for 1018 carbon steel used in fuse plates.
-10
0
10
20
30
40
50
0 0.05 0.1 0.15 0.2 0.25 0.3 0.35 0.4 0.45 0.5
Strain, in/in
Stre
ss, k
si
-10
0
10
20
30
40
50
60
0 0.05 0.1 0.15 0.2 0.25 0.3 0.35 0.4 0.45
Strain, in/in
Stre
ss, k
si
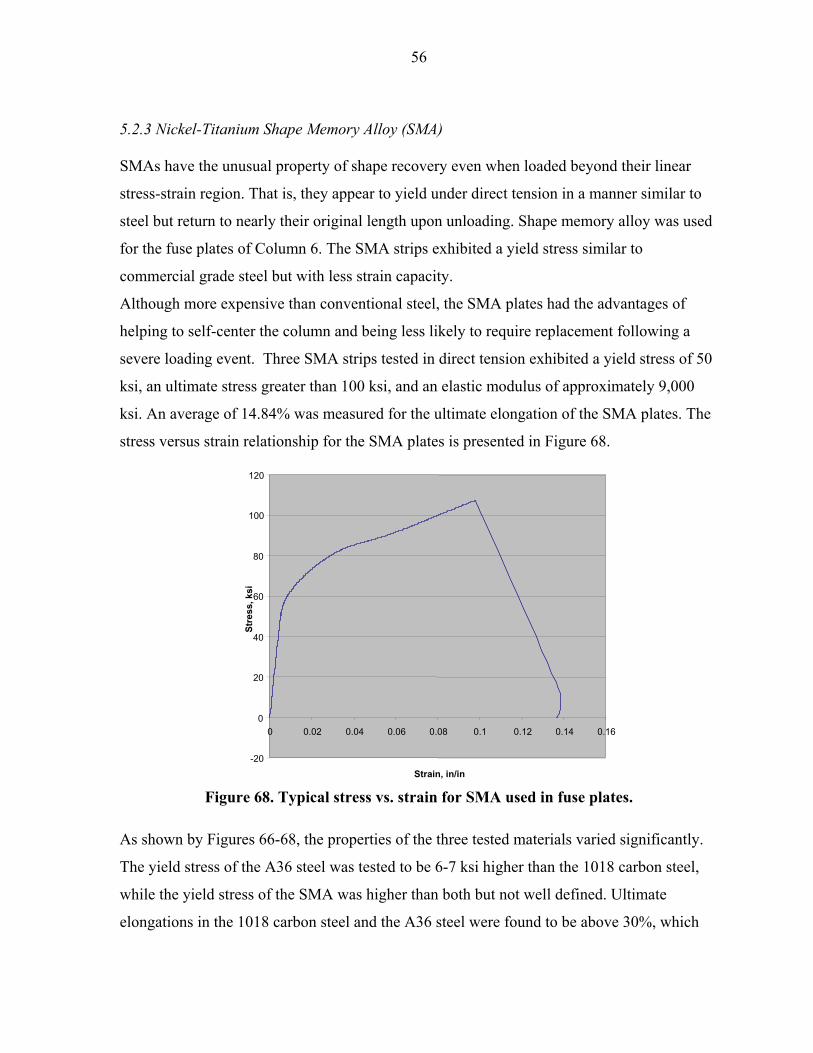
56
5.2.3 Nickel-Titanium Shape Memory Alloy (SMA)
SMAs have the unusual property of shape recovery even when loaded beyond their linear
stress-strain region. That is, they appear to yield under direct tension in a manner similar to
steel but return to nearly their original length upon unloading. Shape memory alloy was used
for the fuse plates of Column 6. The SMA strips exhibited a yield stress similar to
commercial grade steel but with less strain capacity.
Although more expensive than conventional steel, the SMA plates had the advantages of
helping to self-center the column and being less likely to require replacement following a
severe loading event. Three SMA strips tested in direct tension exhibited a yield stress of 50
ksi, an ultimate stress greater than 100 ksi, and an elastic modulus of approximately 9,000
ksi. An average of 14.84% was measured for the ultimate elongation of the SMA plates. The
stress versus strain relationship for the SMA plates is presented in Figure 68.
Figure 68. Typical stress vs. strain for SMA used in fuse plates.
As shown by Figures 66-68, the properties of the three tested materials varied significantly.
The yield stress of the A36 steel was tested to be 6-7 ksi higher than the 1018 carbon steel,
while the yield stress of the SMA was higher than both but not well defined. Ultimate
elongations in the 1018 carbon steel and the A36 steel were found to be above 30%, which
-20
0
20
40
60
80
100
120
0 0.02 0.04 0.06 0.08 0.1 0.12 0.14 0.16
Strain, in/in
Stre
ss, k
si
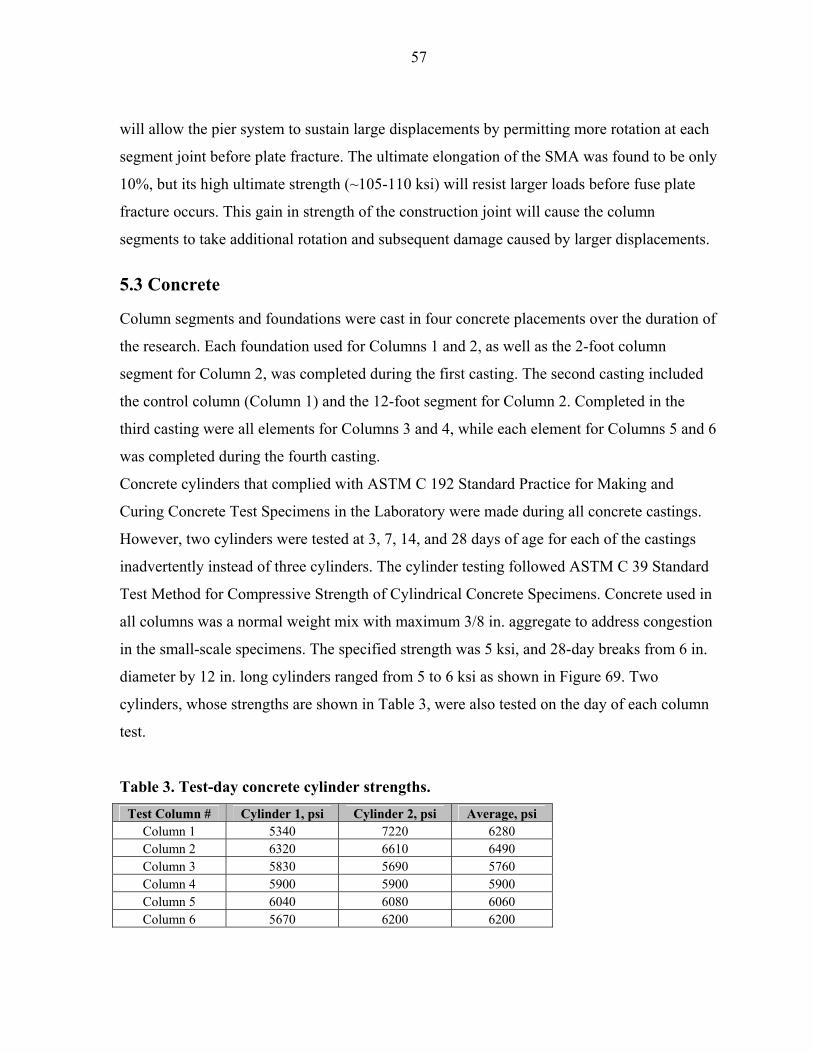
57
will allow the pier system to sustain large displacements by permitting more rotation at each
segment joint before plate fracture. The ultimate elongation of the SMA was found to be only
10%, but its high ultimate strength (~105-110 ksi) will resist larger loads before fuse plate
fracture occurs. This gain in strength of the construction joint will cause the column
segments to take additional rotation and subsequent damage caused by larger displacements.
5.3 Concrete
Column segments and foundations were cast in four concrete placements over the duration of
the research. Each foundation used for Columns 1 and 2, as well as the 2-foot column
segment for Column 2, was completed during the first casting. The second casting included
the control column (Column 1) and the 12-foot segment for Column 2. Completed in the
third casting were all elements for Columns 3 and 4, while each element for Columns 5 and 6
was completed during the fourth casting.
Concrete cylinders that complied with ASTM C 192 Standard Practice for Making and
Curing Concrete Test Specimens in the Laboratory were made during all concrete castings.
However, two cylinders were tested at 3, 7, 14, and 28 days of age for each of the castings
inadvertently instead of three cylinders. The cylinder testing followed ASTM C 39 Standard
Test Method for Compressive Strength of Cylindrical Concrete Specimens. Concrete used in
all columns was a normal weight mix with maximum 3/8 in. aggregate to address congestion
in the small-scale specimens. The specified strength was 5 ksi, and 28-day breaks from 6 in.
diameter by 12 in. long cylinders ranged from 5 to 6 ksi as shown in Figure 69. Two
cylinders, whose strengths are shown in Table 3, were also tested on the day of each column
test.
Table 3. Test-day concrete cylinder strengths. Test Column # Cylinder 1, psi Cylinder 2, psi Average, psi
Column 1 5340 7220 6280 Column 2 6320 6610 6490 Column 3 5830 5690 5760 Column 4 5900 5900 5900 Column 5 6040 6080 6060 Column 6 5670 6200 6200
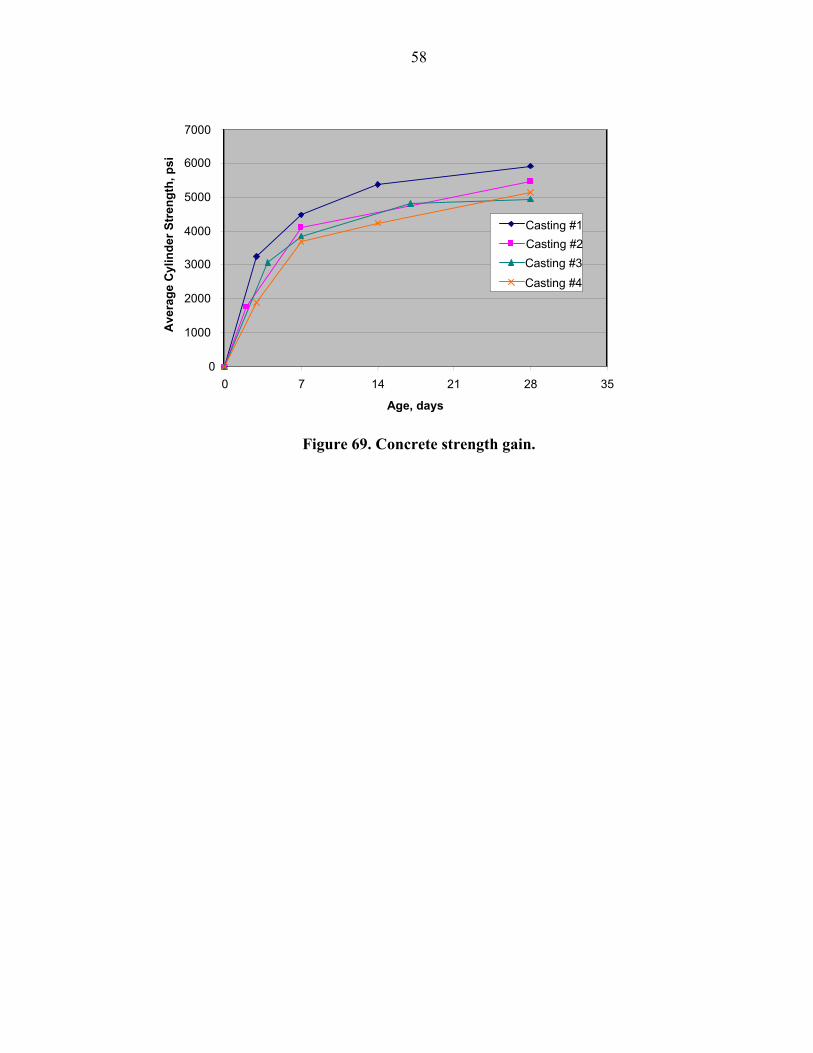
58
Figure 69. Concrete strength gain.
Ave
rage
Cyl
inde
r Str
engt
h, p
si
7000
6000
5000
4000
3000
2000
1000
Casting #1 Casting #2 Casting #3 Casting #4
0 0 7 14 21 28 35
Age, days
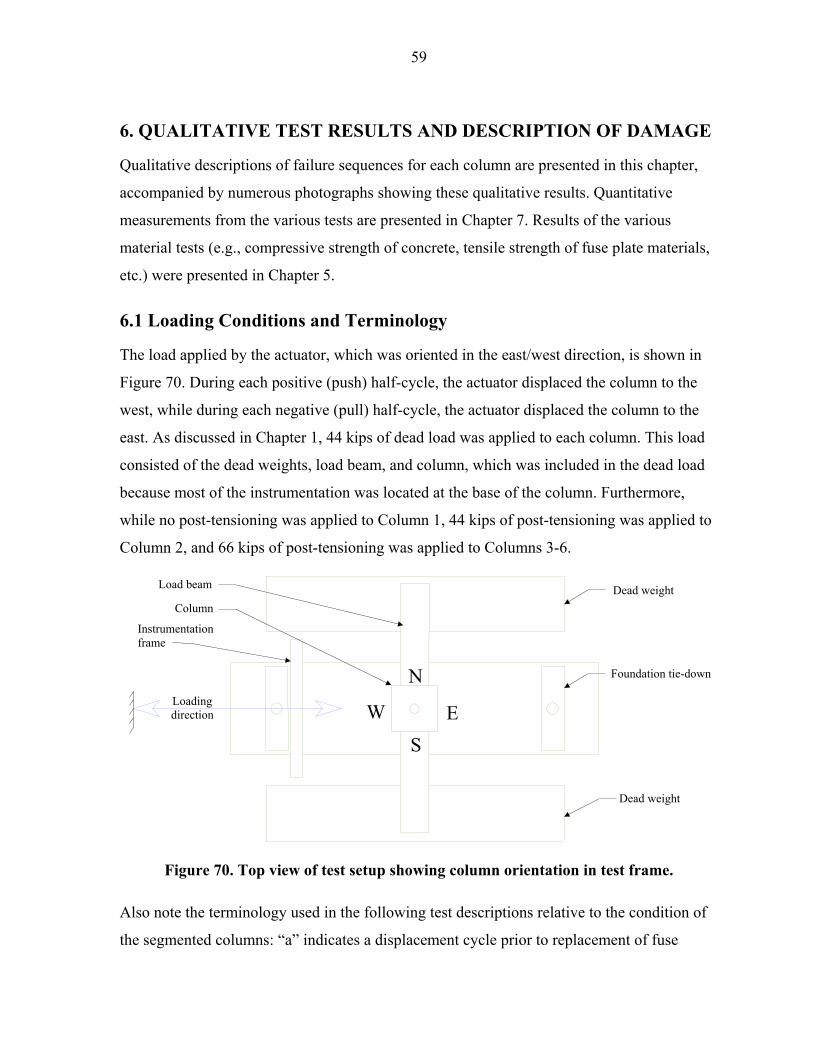
59
6. QUALITATIVE TEST RESULTS AND DESCRIPTION OF DAMAGE
Qualitative descriptions of failure sequences for each column are presented in this chapter,
accompanied by numerous photographs showing these qualitative results. Quantitative
measurements from the various tests are presented in Chapter 7. Results of the various
material tests (e.g., compressive strength of concrete, tensile strength of fuse plate materials,
etc.) were presented in Chapter 5.
6.1 Loading Conditions and Terminology
The load applied by the actuator, which was oriented in the east/west direction, is shown in
Figure 70. During each positive (push) half-cycle, the actuator displaced the column to the
west, while during each negative (pull) half-cycle, the actuator displaced the column to the
east. As discussed in Chapter 1, 44 kips of dead load was applied to each column. This load
consisted of the dead weights, load beam, and column, which was included in the dead load
because most of the instrumentation was located at the base of the column. Furthermore,
while no post-tensioning was applied to Column 1, 44 kips of post-tensioning was applied to
Column 2, and 66 kips of post-tensioning was applied to Columns 3-6.
Figure 70. Top view of test setup showing column orientation in test frame.
Also note the terminology used in the following test descriptions relative to the condition of
the segmented columns: “a” indicates a displacement cycle prior to replacement of fuse
N
W
SE
Dead weight
Dead weight
Loading direction
Load beam Column
Instrumentation frame
Foundation tie-down
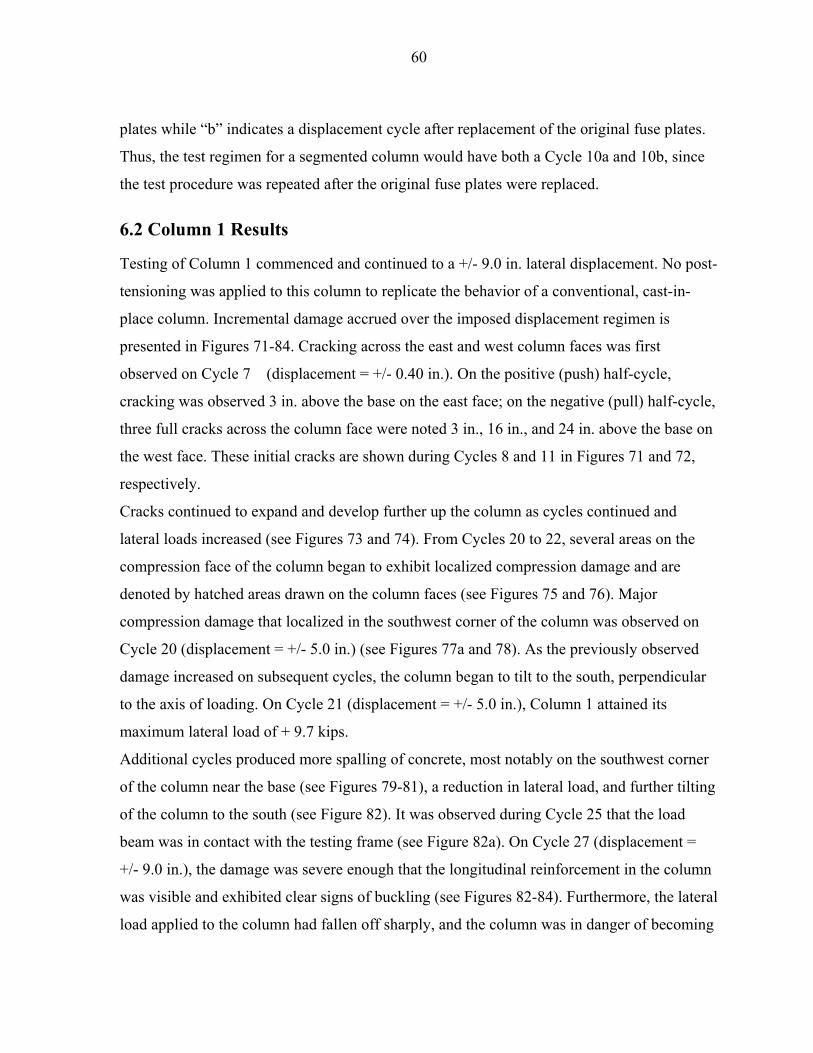
60
plates while “b” indicates a displacement cycle after replacement of the original fuse plates.
Thus, the test regimen for a segmented column would have both a Cycle 10a and 10b, since
the test procedure was repeated after the original fuse plates were replaced.
6.2 Column 1 Results
Testing of Column 1 commenced and continued to a +/- 9.0 in. lateral displacement. No post-
tensioning was applied to this column to replicate the behavior of a conventional, cast-in-
place column. Incremental damage accrued over the imposed displacement regimen is
presented in Figures 71-84. Cracking across the east and west column faces was first
observed on Cycle 7 (displacement = +/- 0.40 in.). On the positive (push) half-cycle,
cracking was observed 3 in. above the base on the east face; on the negative (pull) half-cycle,
three full cracks across the column face were noted 3 in., 16 in., and 24 in. above the base on
the west face. These initial cracks are shown during Cycles 8 and 11 in Figures 71 and 72,
respectively.
Cracks continued to expand and develop further up the column as cycles continued and
lateral loads increased (see Figures 73 and 74). From Cycles 20 to 22, several areas on the
compression face of the column began to exhibit localized compression damage and are
denoted by hatched areas drawn on the column faces (see Figures 75 and 76). Major
compression damage that localized in the southwest corner of the column was observed on
Cycle 20 (displacement = +/- 5.0 in.) (see Figures 77a and 78). As the previously observed
damage increased on subsequent cycles, the column began to tilt to the south, perpendicular
to the axis of loading. On Cycle 21 (displacement = +/- 5.0 in.), Column 1 attained its
maximum lateral load of + 9.7 kips.
Additional cycles produced more spalling of concrete, most notably on the southwest corner
of the column near the base (see Figures 79-81), a reduction in lateral load, and further tilting
of the column to the south (see Figure 82). It was observed during Cycle 25 that the load
beam was in contact with the testing frame (see Figure 82a). On Cycle 27 (displacement =
+/- 9.0 in.), the damage was severe enough that the longitudinal reinforcement in the column
was visible and exhibited clear signs of buckling (see Figures 82-84). Furthermore, the lateral
load applied to the column had fallen off sharply, and the column was in danger of becoming
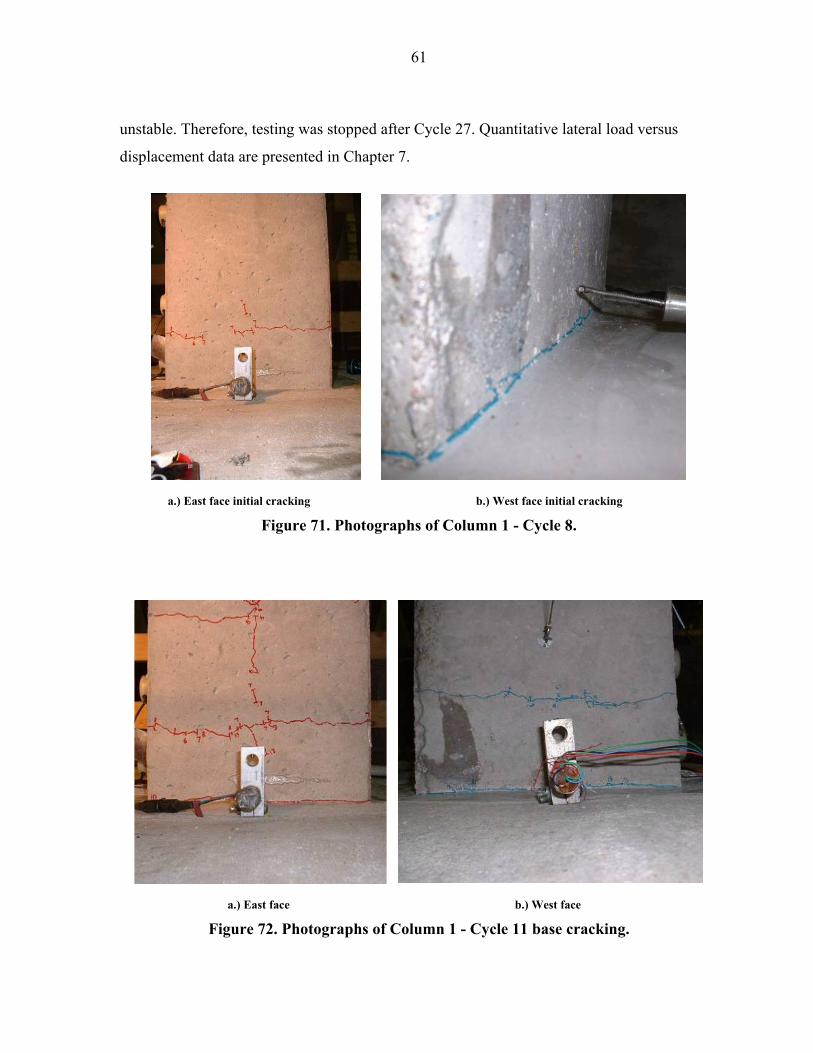
61
unstable. Therefore, testing was stopped after Cycle 27. Quantitative lateral load versus
displacement data are presented in Chapter 7.
a.) East face initial cracking b.) West face initial cracking
Figure 71. Photographs of Column 1 - Cycle 8.
a.) East face b.) West face
Figure 72. Photographs of Column 1 - Cycle 11 base cracking.
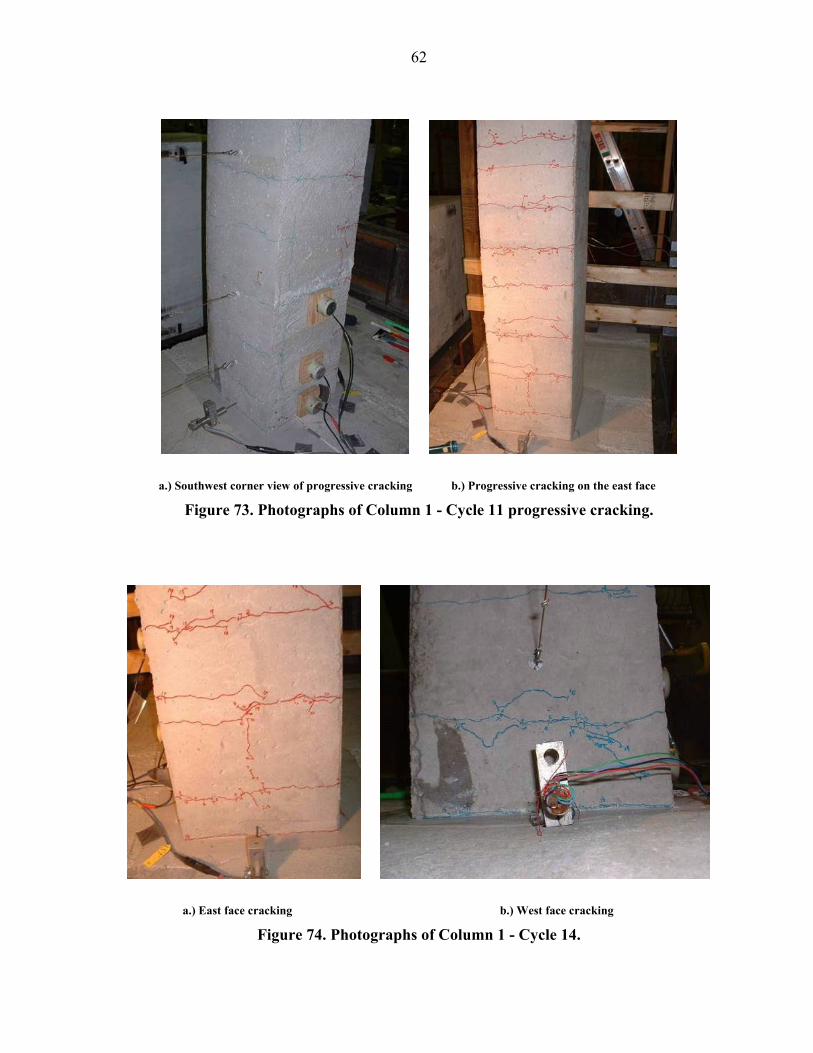
62
a.) Southwest corner view of progressive cracking b.) Progressive cracking on the east face
Figure 73. Photographs of Column 1 - Cycle 11 progressive cracking.
a.) East face cracking b.) West face cracking
Figure 74. Photographs of Column 1 - Cycle 14.
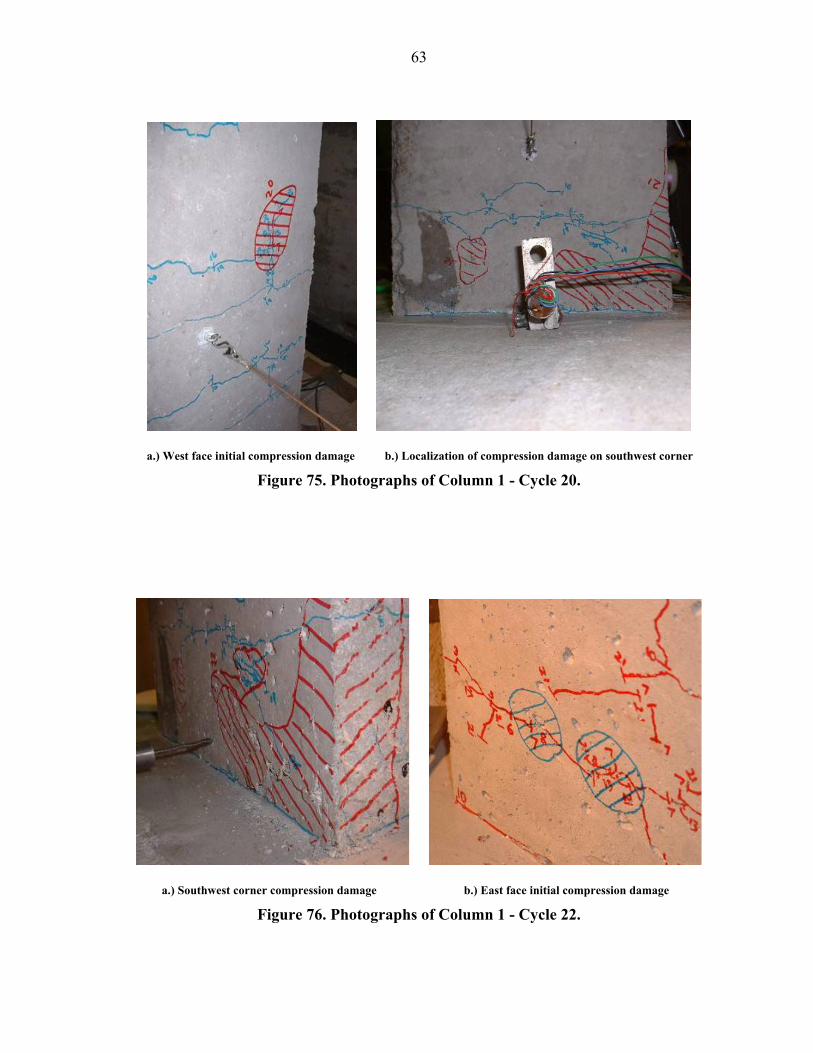
63
a.) West face initial compression damage b.) Localization of compression damage on southwest corner
Figure 75. Photographs of Column 1 - Cycle 20.
a.) Southwest corner compression damage b.) East face initial compression damage
Figure 76. Photographs of Column 1 - Cycle 22.
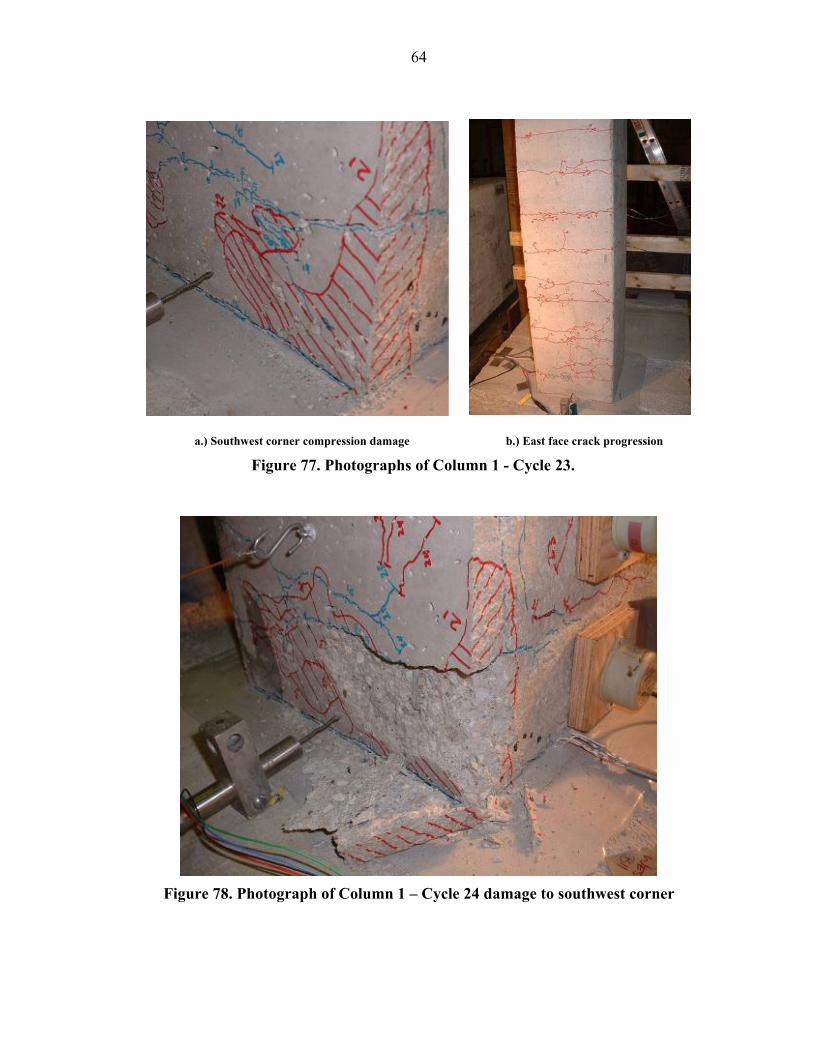
64
a.) Southwest corner compression damage b.) East face crack progression
Figure 77. Photographs of Column 1 - Cycle 23.
Figure 78. Photograph of Column 1 – Cycle 24 damage to southwest corner
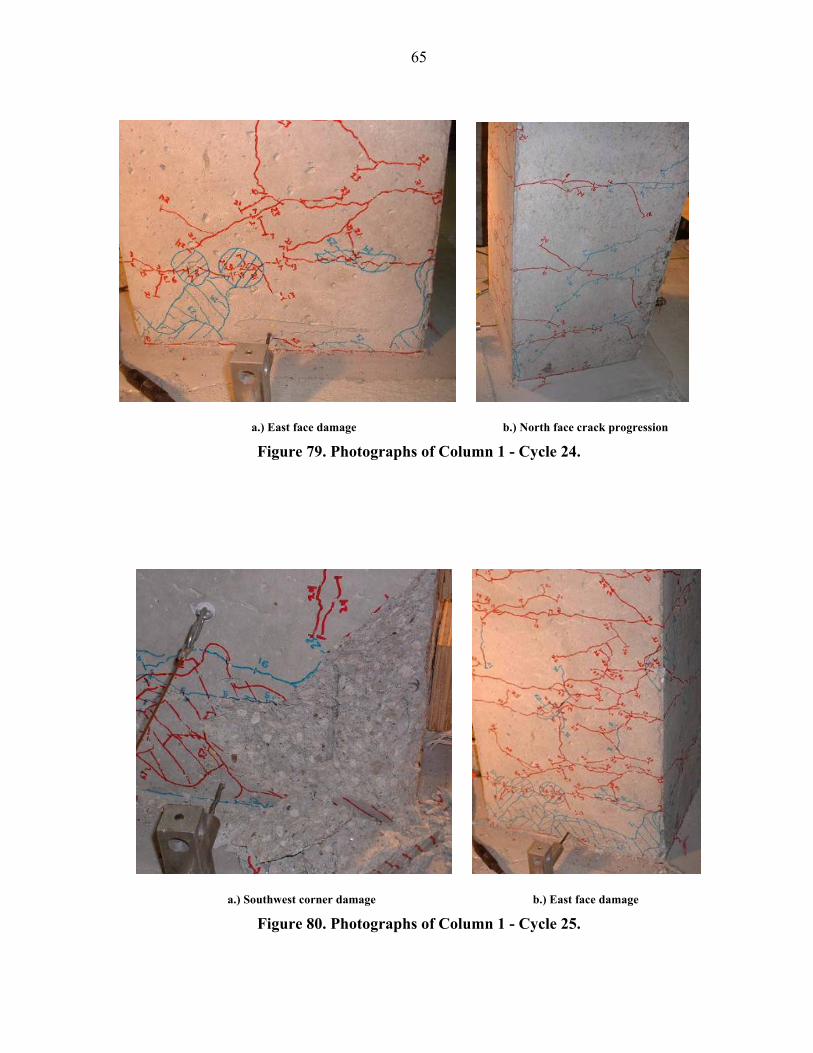
65
a.) East face damage b.) North face crack progression
Figure 79. Photographs of Column 1 - Cycle 24.
a.) Southwest corner damage b.) East face damage
Figure 80. Photographs of Column 1 - Cycle 25.
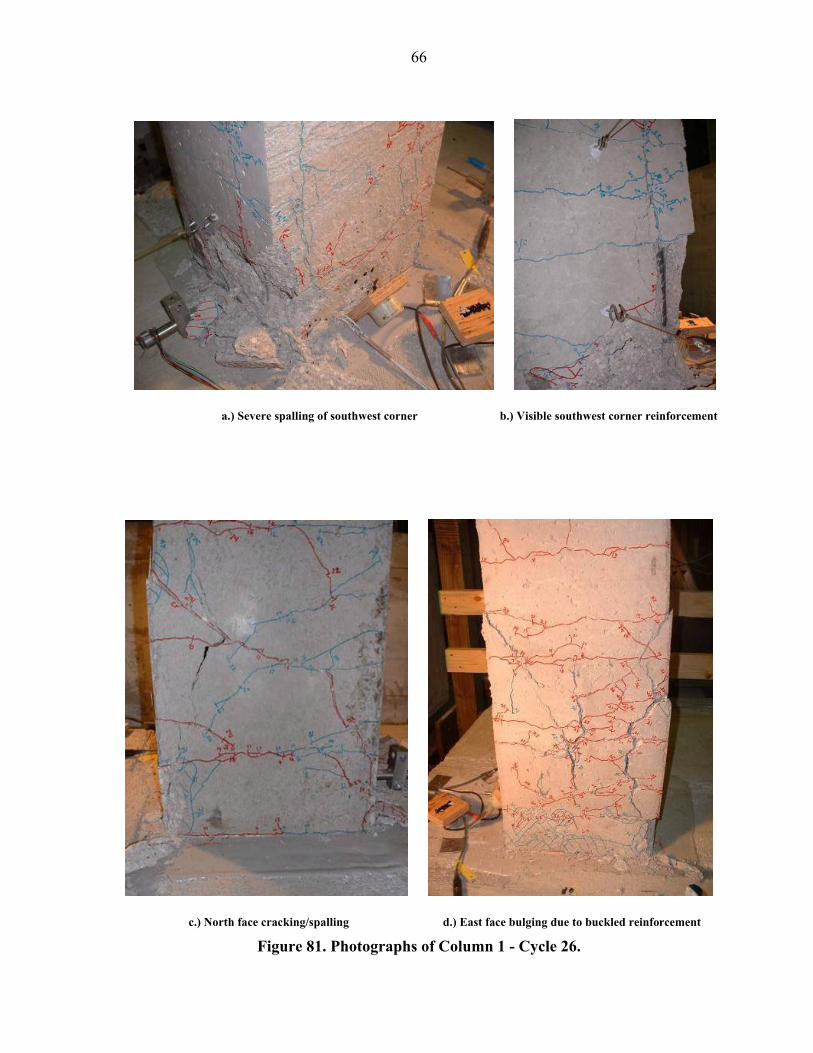
66
a.) Severe spalling of southwest corner b.) Visible southwest corner reinforcement
c.) North face cracking/spalling d.) East face bulging due to buckled reinforcement
Figure 81. Photographs of Column 1 - Cycle 26.
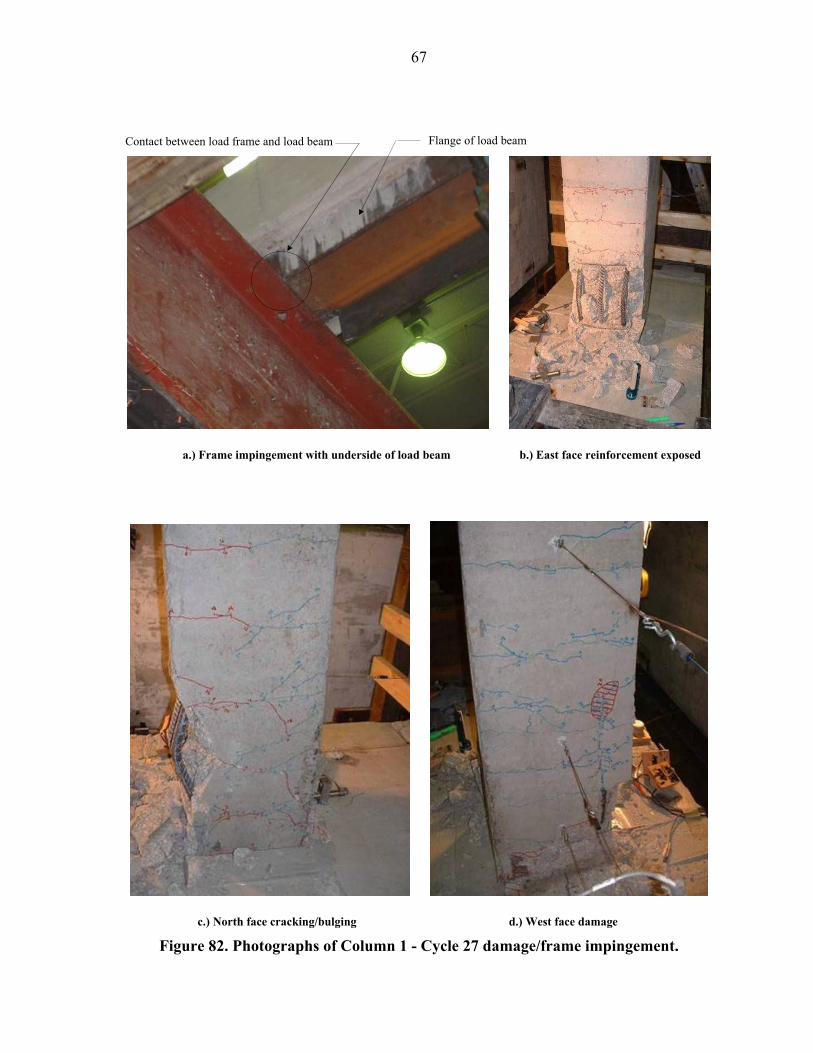
67
a.) Frame impingement with underside of load beam b.) East face reinforcement exposed
c.) North face cracking/bulging d.) West face damage
Figure 82. Photographs of Column 1 - Cycle 27 damage/frame impingement.
Contact between load frame and load beam Flange of load beam
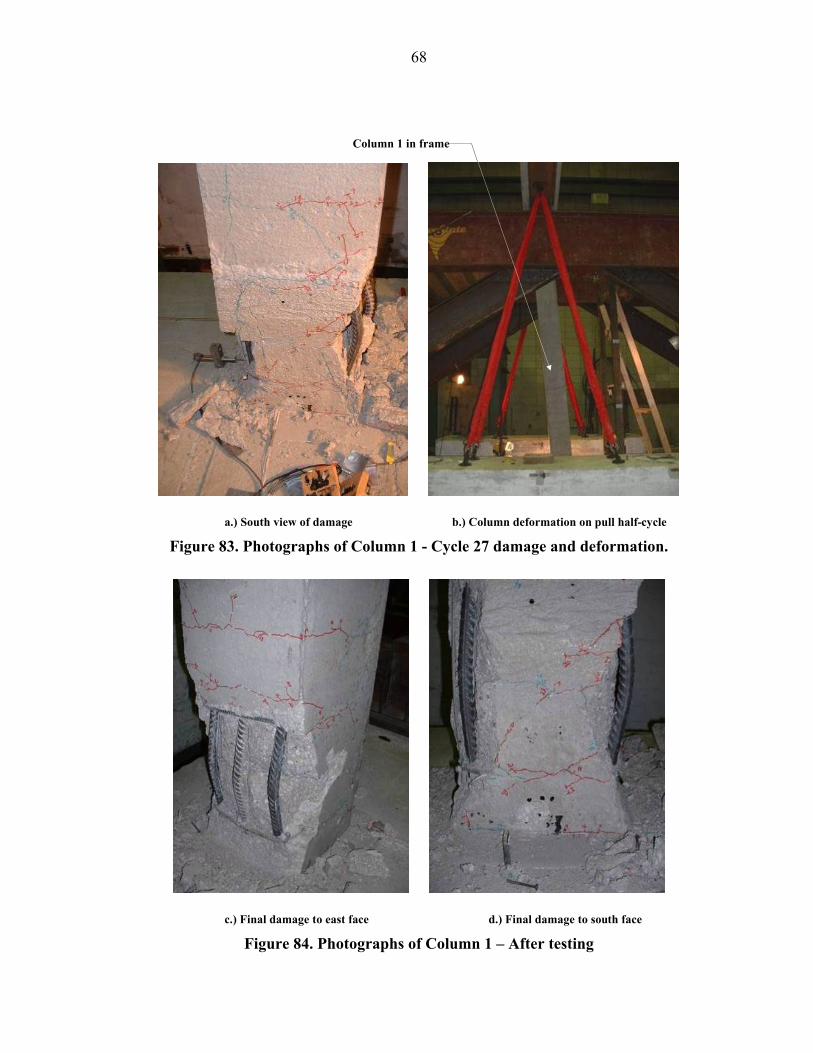
68
a.) South view of damage b.) Column deformation on pull half-cycle
Figure 83. Photographs of Column 1 - Cycle 27 damage and deformation.
c.) Final damage to east face d.) Final damage to south face
Figure 84. Photographs of Column 1 – After testing
Column 1 in frame
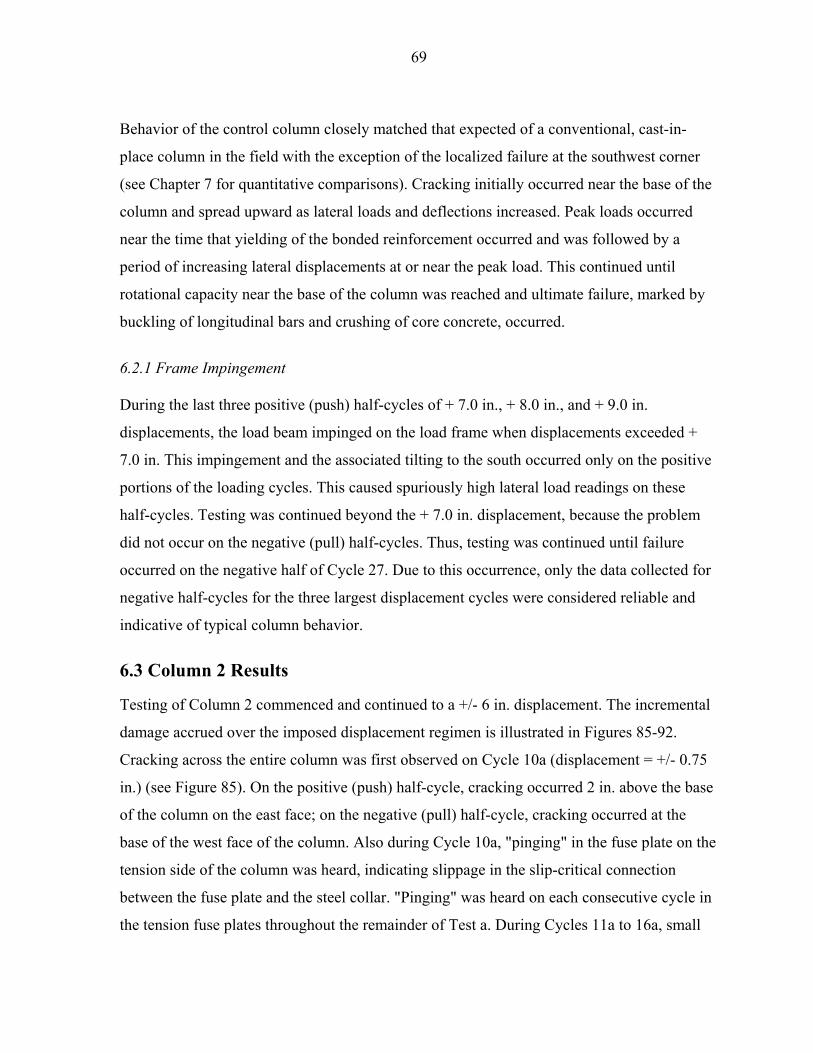
69
Behavior of the control column closely matched that expected of a conventional, cast-in-
place column in the field with the exception of the localized failure at the southwest corner
(see Chapter 7 for quantitative comparisons). Cracking initially occurred near the base of the
column and spread upward as lateral loads and deflections increased. Peak loads occurred
near the time that yielding of the bonded reinforcement occurred and was followed by a
period of increasing lateral displacements at or near the peak load. This continued until
rotational capacity near the base of the column was reached and ultimate failure, marked by
buckling of longitudinal bars and crushing of core concrete, occurred.
6.2.1 Frame Impingement
During the last three positive (push) half-cycles of + 7.0 in., + 8.0 in., and + 9.0 in.
displacements, the load beam impinged on the load frame when displacements exceeded +
7.0 in. This impingement and the associated tilting to the south occurred only on the positive
portions of the loading cycles. This caused spuriously high lateral load readings on these
half-cycles. Testing was continued beyond the + 7.0 in. displacement, because the problem
did not occur on the negative (pull) half-cycles. Thus, testing was continued until failure
occurred on the negative half of Cycle 27. Due to this occurrence, only the data collected for
negative half-cycles for the three largest displacement cycles were considered reliable and
indicative of typical column behavior.
6.3 Column 2 Results
Testing of Column 2 commenced and continued to a +/- 6 in. displacement. The incremental
damage accrued over the imposed displacement regimen is illustrated in Figures 85-92.
Cracking across the entire column was first observed on Cycle 10a (displacement = +/- 0.75
in.) (see Figure 85). On the positive (push) half-cycle, cracking occurred 2 in. above the base
of the column on the east face; on the negative (pull) half-cycle, cracking occurred at the
base of the west face of the column. Also during Cycle 10a, "pinging" in the fuse plate on the
tension side of the column was heard, indicating slippage in the slip-critical connection
between the fuse plate and the steel collar. "Pinging" was heard on each consecutive cycle in
the tension fuse plates throughout the remainder of Test a. During Cycles 11a to 16a, small
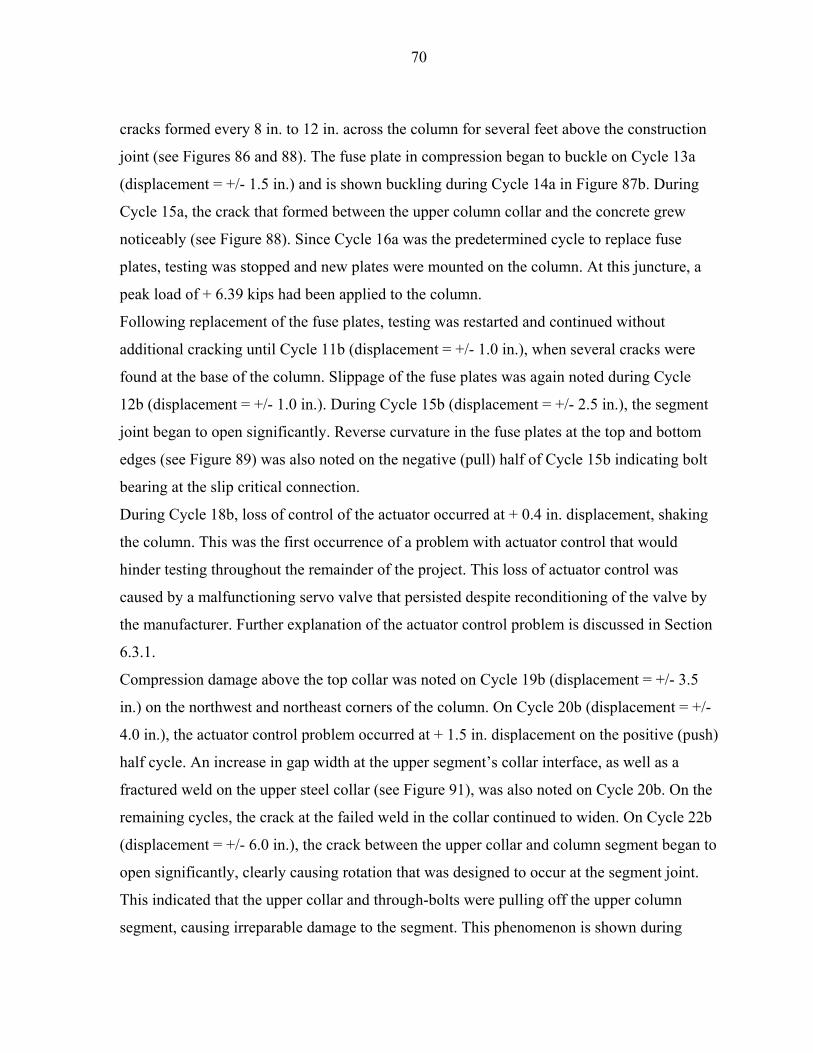
70
cracks formed every 8 in. to 12 in. across the column for several feet above the construction
joint (see Figures 86 and 88). The fuse plate in compression began to buckle on Cycle 13a
(displacement = +/- 1.5 in.) and is shown buckling during Cycle 14a in Figure 87b. During
Cycle 15a, the crack that formed between the upper column collar and the concrete grew
noticeably (see Figure 88). Since Cycle 16a was the predetermined cycle to replace fuse
plates, testing was stopped and new plates were mounted on the column. At this juncture, a
peak load of + 6.39 kips had been applied to the column.
Following replacement of the fuse plates, testing was restarted and continued without
additional cracking until Cycle 11b (displacement = +/- 1.0 in.), when several cracks were
found at the base of the column. Slippage of the fuse plates was again noted during Cycle
12b (displacement = +/- 1.0 in.). During Cycle 15b (displacement = +/- 2.5 in.), the segment
joint began to open significantly. Reverse curvature in the fuse plates at the top and bottom
edges (see Figure 89) was also noted on the negative (pull) half of Cycle 15b indicating bolt
bearing at the slip critical connection.
During Cycle 18b, loss of control of the actuator occurred at + 0.4 in. displacement, shaking
the column. This was the first occurrence of a problem with actuator control that would
hinder testing throughout the remainder of the project. This loss of actuator control was
caused by a malfunctioning servo valve that persisted despite reconditioning of the valve by
the manufacturer. Further explanation of the actuator control problem is discussed in Section
6.3.1.
Compression damage above the top collar was noted on Cycle 19b (displacement = +/- 3.5
in.) on the northwest and northeast corners of the column. On Cycle 20b (displacement = +/-
4.0 in.), the actuator control problem occurred at + 1.5 in. displacement on the positive (push)
half cycle. An increase in gap width at the upper segment’s collar interface, as well as a
fractured weld on the upper steel collar (see Figure 91), was also noted on Cycle 20b. On the
remaining cycles, the crack at the failed weld in the collar continued to widen. On Cycle 22b
(displacement = +/- 6.0 in.), the crack between the upper collar and column segment began to
open significantly, clearly causing rotation that was designed to occur at the segment joint.
This indicated that the upper collar and through-bolts were pulling off the upper column
segment, causing irreparable damage to the segment. This phenomenon is shown during
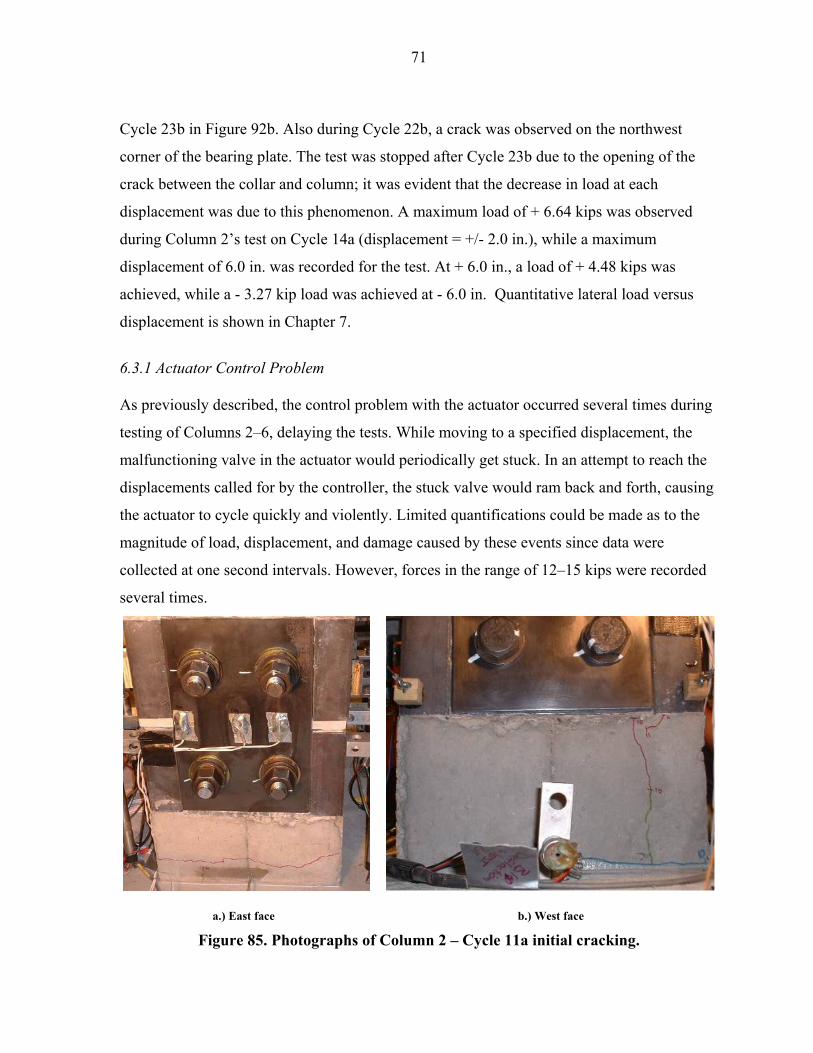
71
Cycle 23b in Figure 92b. Also during Cycle 22b, a crack was observed on the northwest
corner of the bearing plate. The test was stopped after Cycle 23b due to the opening of the
crack between the collar and column; it was evident that the decrease in load at each
displacement was due to this phenomenon. A maximum load of + 6.64 kips was observed
during Column 2’s test on Cycle 14a (displacement = +/- 2.0 in.), while a maximum
displacement of 6.0 in. was recorded for the test. At + 6.0 in., a load of + 4.48 kips was
achieved, while a - 3.27 kip load was achieved at - 6.0 in. Quantitative lateral load versus
displacement is shown in Chapter 7.
6.3.1 Actuator Control Problem
As previously described, the control problem with the actuator occurred several times during
testing of Columns 2–6, delaying the tests. While moving to a specified displacement, the
malfunctioning valve in the actuator would periodically get stuck. In an attempt to reach the
displacements called for by the controller, the stuck valve would ram back and forth, causing
the actuator to cycle quickly and violently. Limited quantifications could be made as to the
magnitude of load, displacement, and damage caused by these events since data were
collected at one second intervals. However, forces in the range of 12–15 kips were recorded
several times.
a.) East face b.) West face
Figure 85. Photographs of Column 2 – Cycle 11a initial cracking.
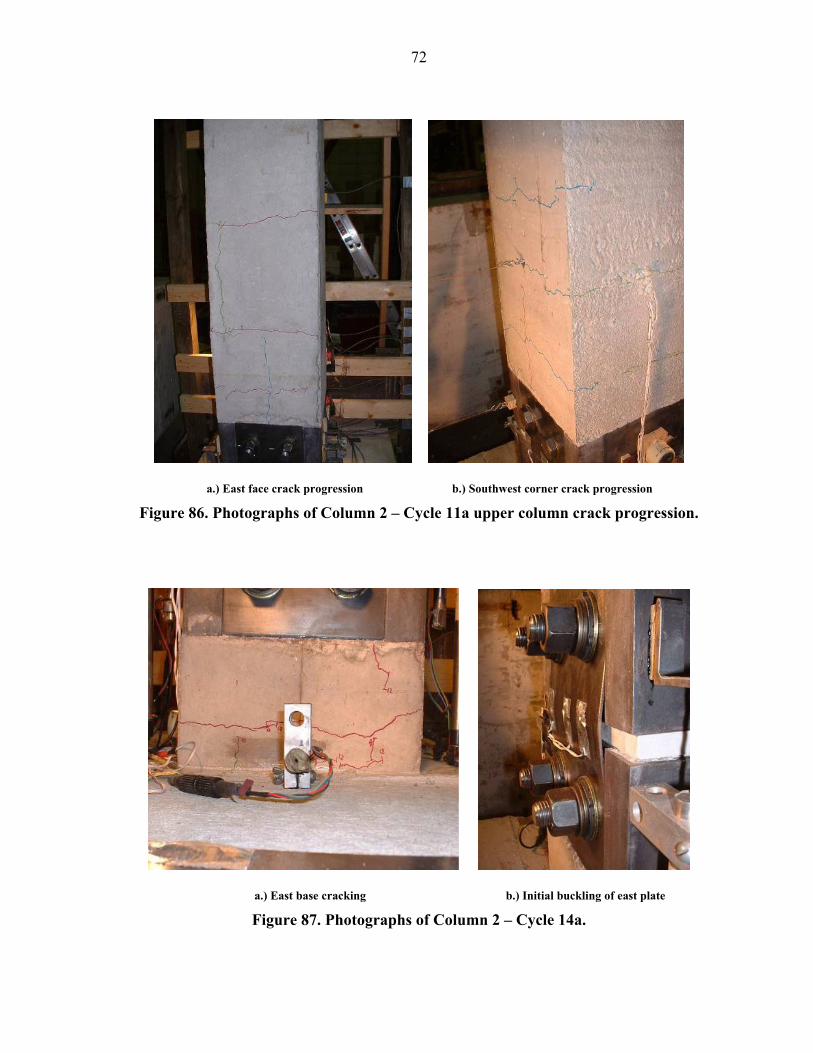
72
a.) East face crack progression b.) Southwest corner crack progression
Figure 86. Photographs of Column 2 – Cycle 11a upper column crack progression.
a.) East base cracking b.) Initial buckling of east plate
Figure 87. Photographs of Column 2 – Cycle 14a.
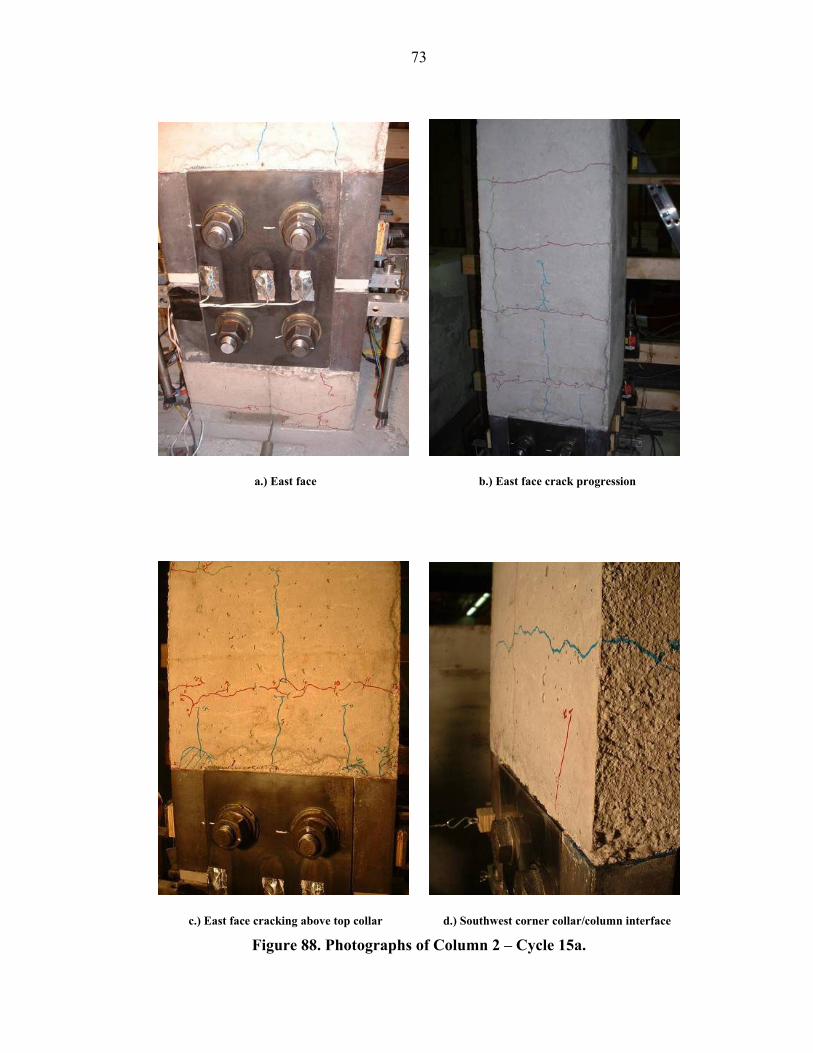
73
a.) East face b.) East face crack progression
c.) East face cracking above top collar d.) Southwest corner collar/column interface
Figure 88. Photographs of Column 2 – Cycle 15a.
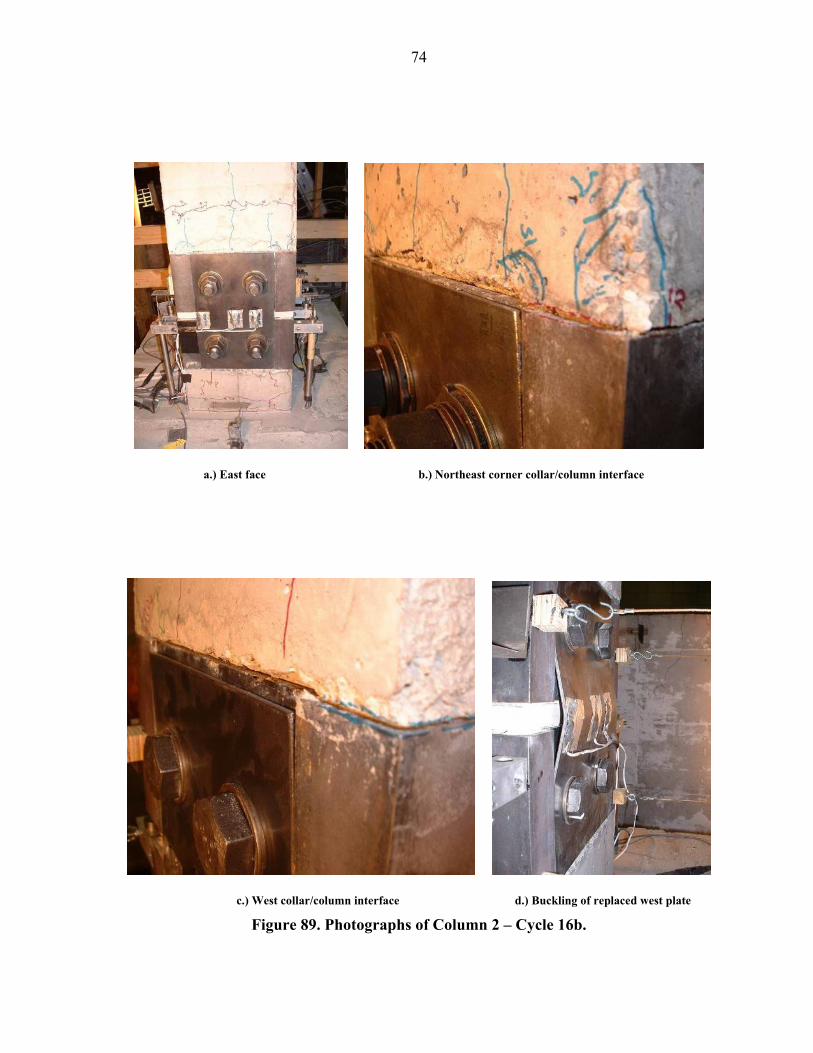
74
a.) East face b.) Northeast corner collar/column interface
c.) West collar/column interface d.) Buckling of replaced west plate
Figure 89. Photographs of Column 2 – Cycle 16b.
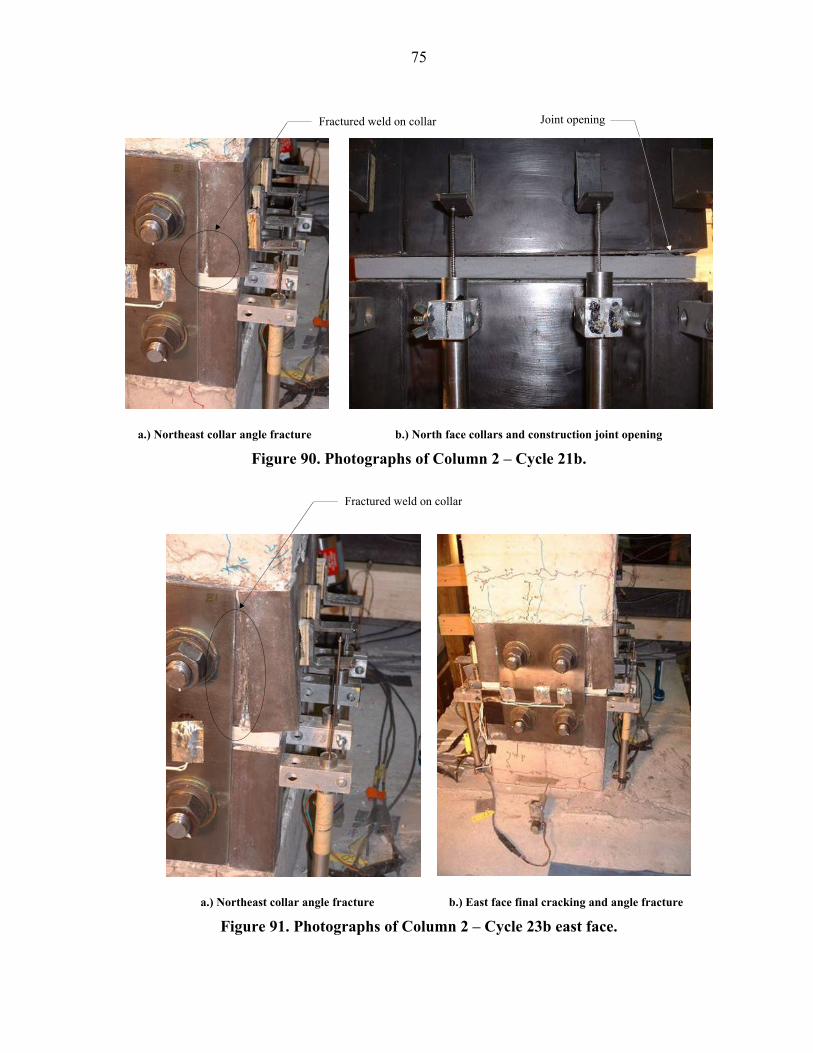
75
a.) Northeast collar angle fracture b.) North face collars and construction joint opening
Figure 90. Photographs of Column 2 – Cycle 21b.
a.) Northeast collar angle fracture b.) East face final cracking and angle fracture
Figure 91. Photographs of Column 2 – Cycle 23b east face.
Fractured weld on collar
Fractured weld on collar
Joint opening
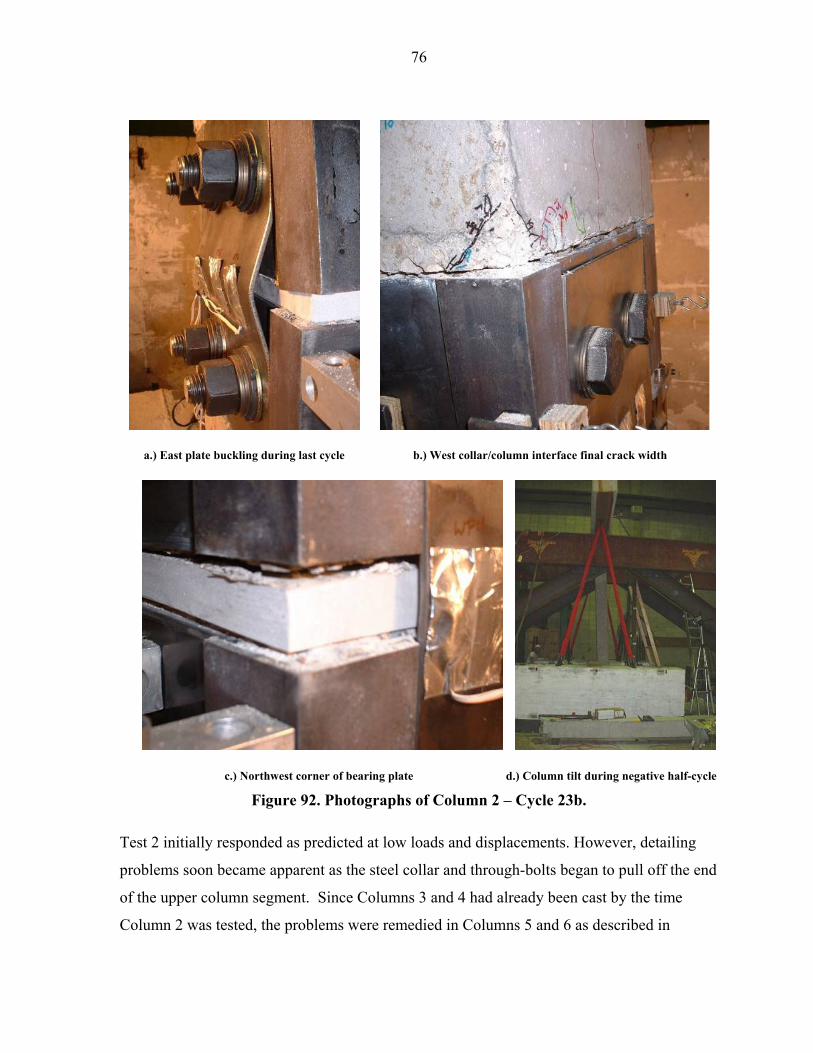
76
a.) East plate buckling during last cycle b.) West collar/column interface final crack width
c.) Northwest corner of bearing plate d.) Column tilt during negative half-cycle
Figure 92. Photographs of Column 2 – Cycle 23b.
Test 2 initially responded as predicted at low loads and displacements. However, detailing
problems soon became apparent as the steel collar and through-bolts began to pull off the end
of the upper column segment. Since Columns 3 and 4 had already been cast by the time
Column 2 was tested, the problems were remedied in Columns 5 and 6 as described in
77
Chapter 3. The collar pull-off problem led to premature failure of Columns 2–4, so
meaningful comparisons of behavior with the control column at large displacements could
not be made. The premature failure mode did, however, give valuable insight into important
detailing issues at the ends of the precast segments.
6.4 Column 3 Results
Testing of Column 3 commenced and continued until +/- 9.0 in. displacements were reached.
The incremental damage accrued over the imposed displacement regimen is illustrated in
Figures 93-105. Cracking across the entire column was observed on Cycle 10a (displacement
= +/- .75 in.) (see Figures 94 and 95). On the positive (push) half-cycle, cracking occurred at
the base of the column on the east face, as well as 1 ft. above the top collar; on the negative
(pull) half-cycle, cracking occurred 1 in. above the base on the west face of the column.
During the next several cycles, small cracks formed every 6 in. to 10 in. up the column face
for several feet above the construction joint (see Figures 97a and 97b).
On Cycle 13a, a loss of control of the actuator occurred at a - 0.59 in. displacement. Also, on
Cycle 13a, minor compression damage was observed around the collar. Buckling could be
seen in the compression fuse plates, and a small amount of compression damage was noted in
the bearing plate on the west side on Cycle 14a (displacement = +/- 2 in.) (see Figure 98).
Loss of control of the actuator also occurred on Cycle 16a at + 0.47 in. By Cycle 16a, the
fuse plates had buckled to a large degree when under compression indicating that they had
yielded in tension on previous cycles. This was also the predetermined cycle to replace fuse
plates, so testing was stopped and new fuse plates were mounted on the column. At this
juncture, a peak horizontal load of +/- 6.30 kips had been applied to the column.
After replacing the fuse plates (see Figure 98), the displacement regimen was restarted.
"Ticking" was heard in the east plate on Cycle 15b indicating slippage between the fuse plate
and the collar. On Cycle 16b (displacement = +/- 2.5 in.), the crack opening was noted
between the top collar and the column segment (see Figure 99). Actuator problems occurred
again on Cycle 17b (displacement = +/- 3.0 in.) at - 0.30 in. At this point, the gain control
was turned down in an attempt to regain control of the actuator.
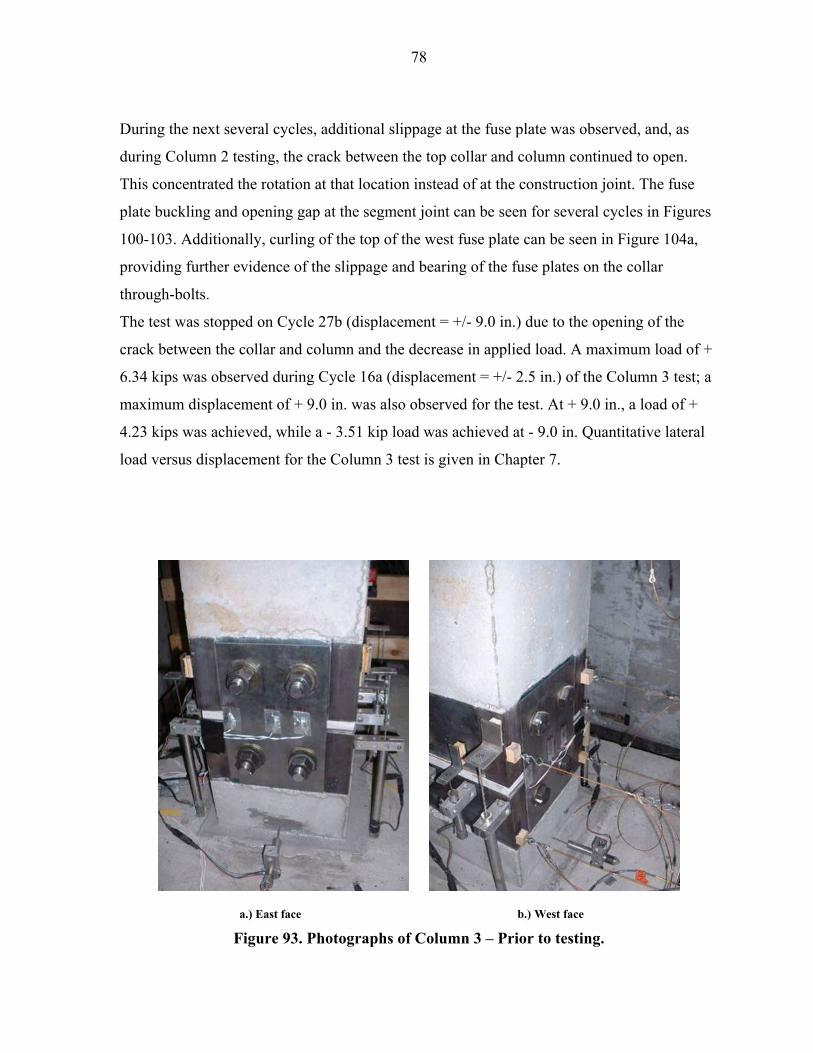
78
During the next several cycles, additional slippage at the fuse plate was observed, and, as
during Column 2 testing, the crack between the top collar and column continued to open.
This concentrated the rotation at that location instead of at the construction joint. The fuse
plate buckling and opening gap at the segment joint can be seen for several cycles in Figures
100-103. Additionally, curling of the top of the west fuse plate can be seen in Figure 104a,
providing further evidence of the slippage and bearing of the fuse plates on the collar
through-bolts.
The test was stopped on Cycle 27b (displacement = +/- 9.0 in.) due to the opening of the
crack between the collar and column and the decrease in applied load. A maximum load of +
6.34 kips was observed during Cycle 16a (displacement = +/- 2.5 in.) of the Column 3 test; a
maximum displacement of + 9.0 in. was also observed for the test. At + 9.0 in., a load of +
4.23 kips was achieved, while a - 3.51 kip load was achieved at - 9.0 in. Quantitative lateral
load versus displacement for the Column 3 test is given in Chapter 7.
a.) East face b.) West face
Figure 93. Photographs of Column 3 – Prior to testing.
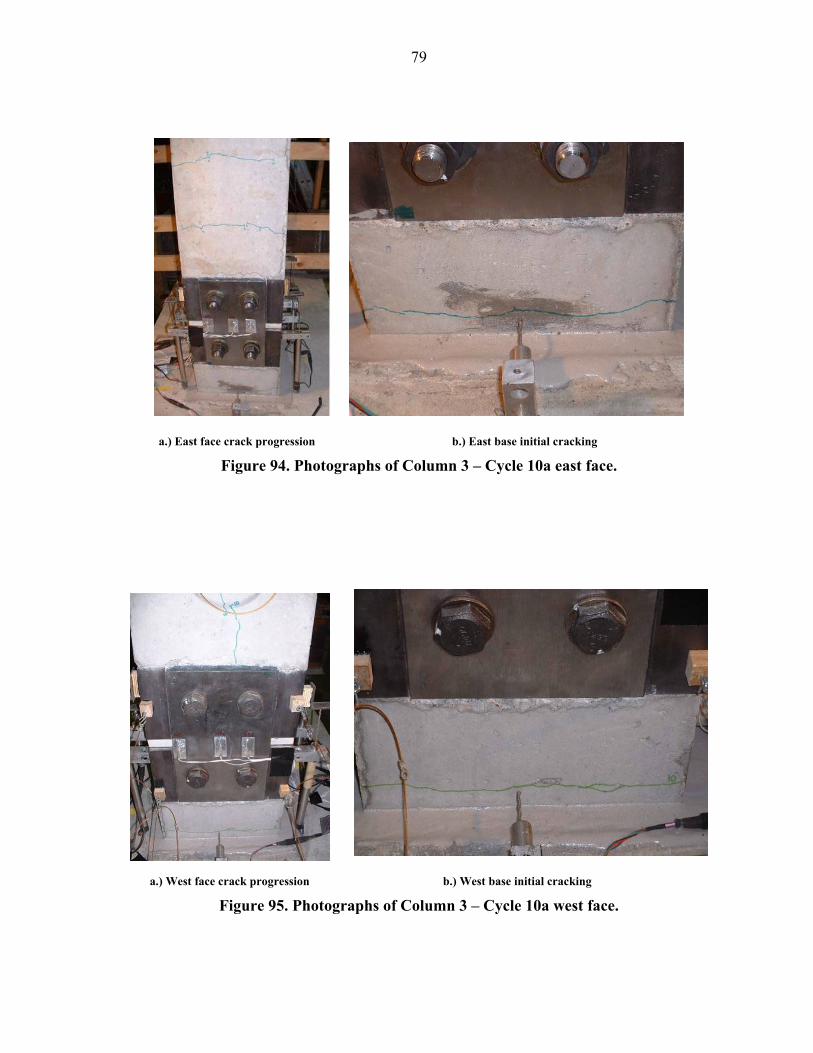
79
a.) East face crack progression b.) East base initial cracking
Figure 94. Photographs of Column 3 – Cycle 10a east face.
a.) West face crack progression b.) West base initial cracking
Figure 95. Photographs of Column 3 – Cycle 10a west face.
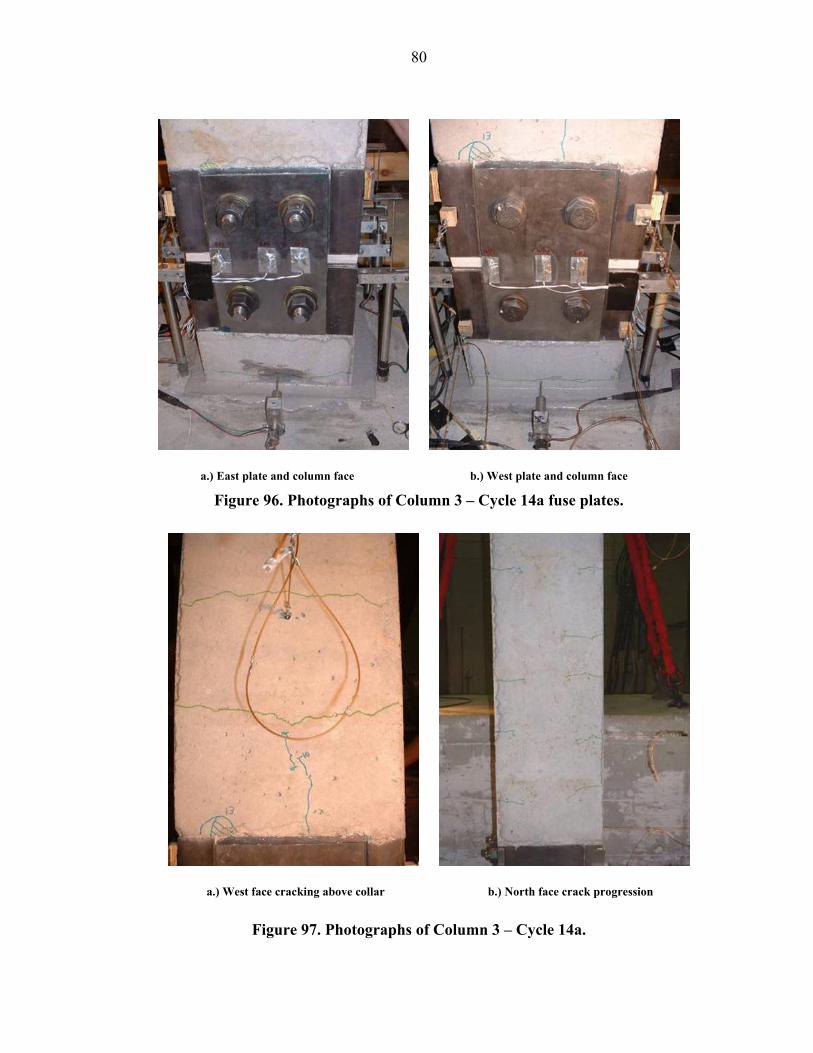
80
a.) East plate and column face b.) West plate and column face
Figure 96. Photographs of Column 3 – Cycle 14a fuse plates.
a.) West face cracking above collar b.) North face crack progression
Figure 97. Photographs of Column 3 – Cycle 14a.
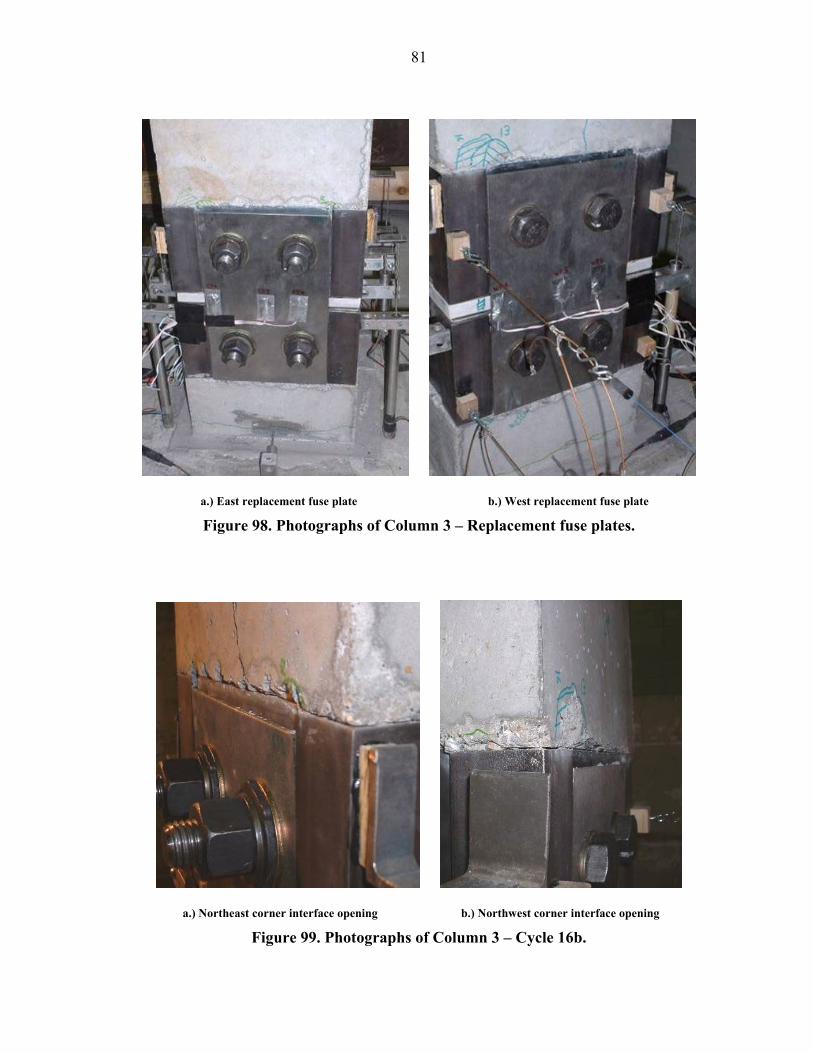
81
a.) East replacement fuse plate b.) West replacement fuse plate
Figure 98. Photographs of Column 3 – Replacement fuse plates.
a.) Northeast corner interface opening b.) Northwest corner interface opening
Figure 99. Photographs of Column 3 – Cycle 16b.
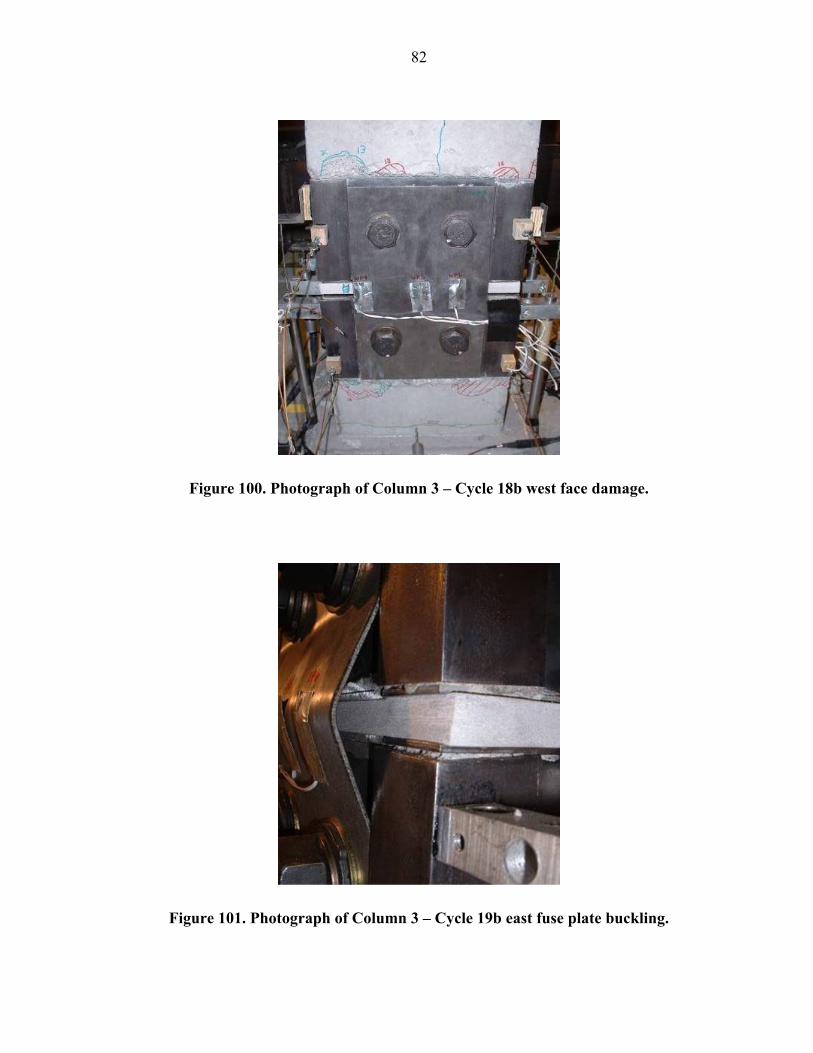
82
Figure 100. Photograph of Column 3 – Cycle 18b west face damage.
Figure 101. Photograph of Column 3 – Cycle 19b east fuse plate buckling.
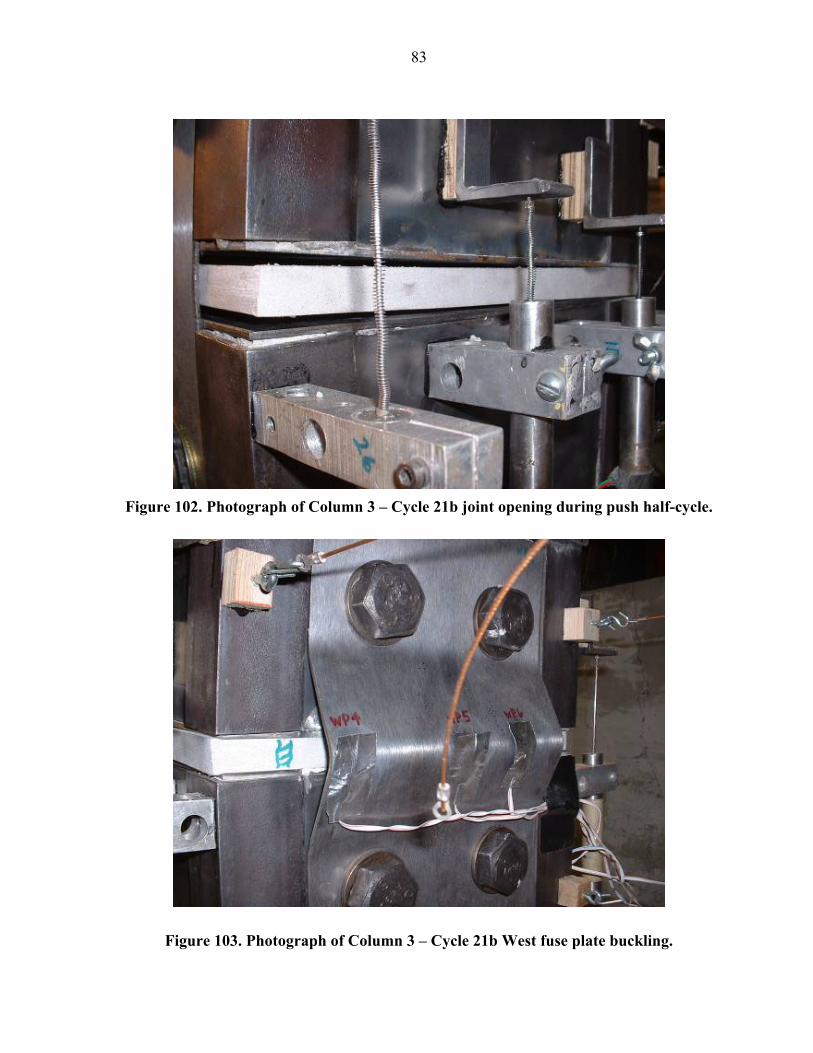
83
Figure 102. Photograph of Column 3 – Cycle 21b joint opening during push half-cycle.
Figure 103. Photograph of Column 3 – Cycle 21b West fuse plate buckling.
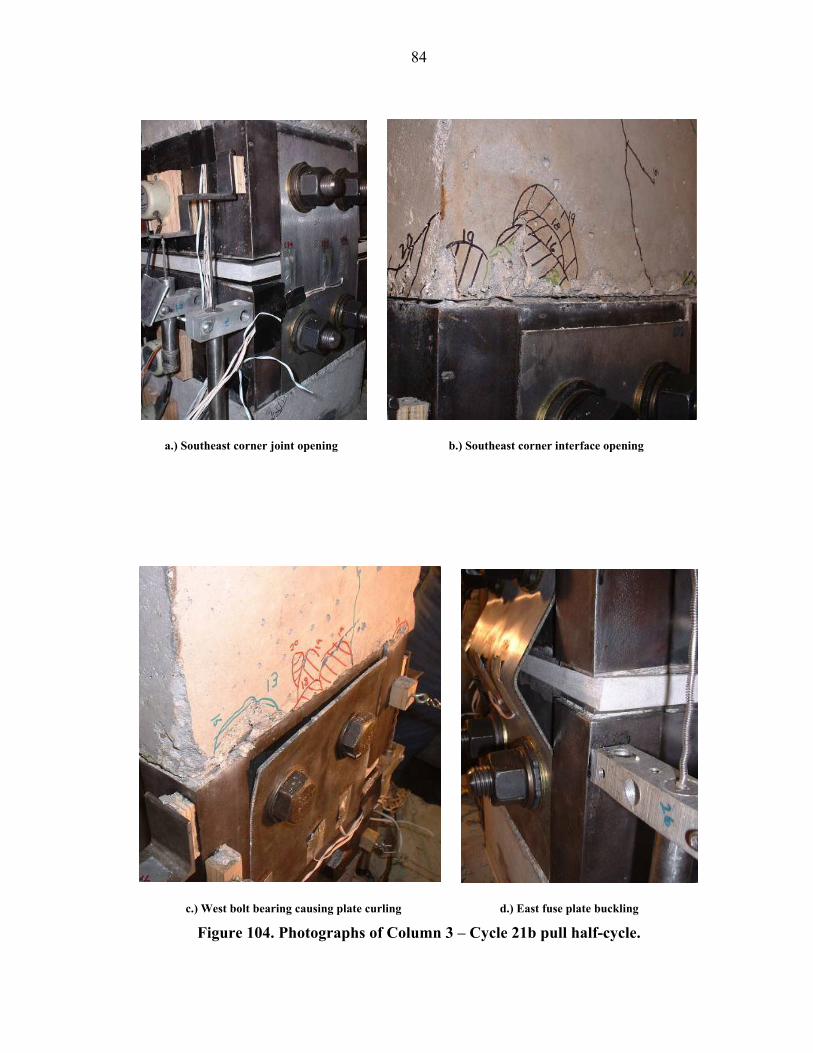
84
a.) Southeast corner joint opening b.) Southeast corner interface opening
c.) West bolt bearing causing plate curling d.) East fuse plate buckling
Figure 104. Photographs of Column 3 – Cycle 21b pull half-cycle.
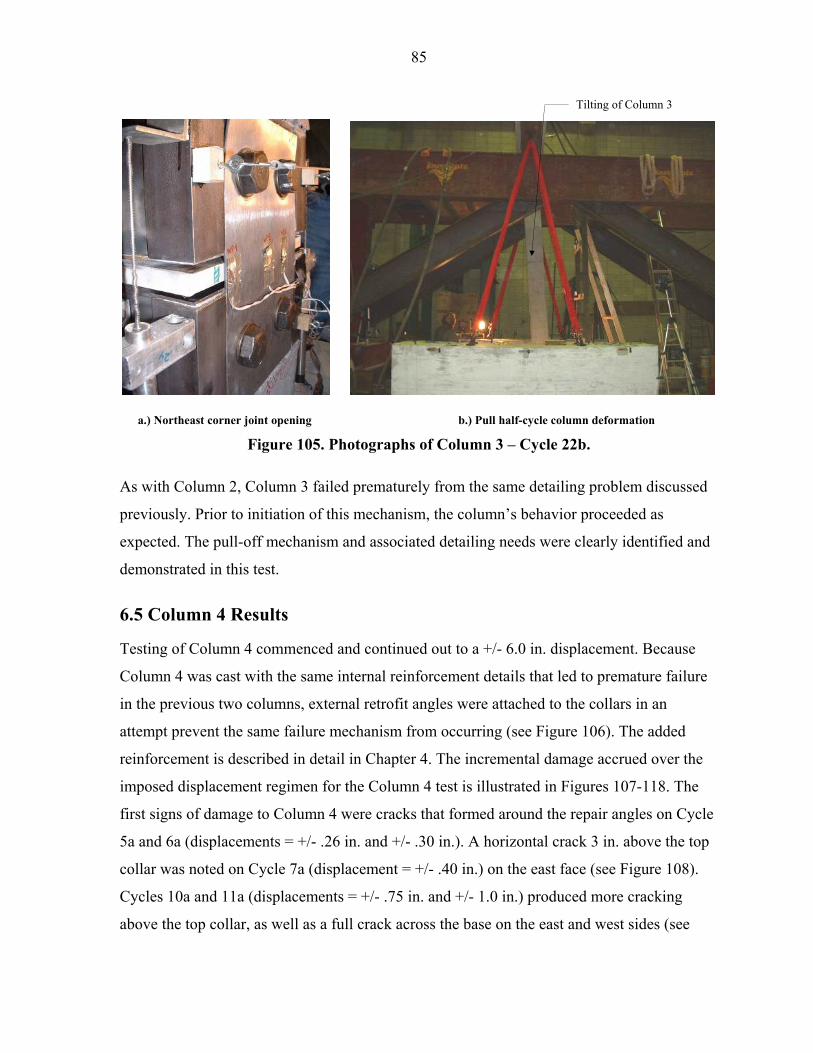
85
a.) Northeast corner joint opening b.) Pull half-cycle column deformation
Figure 105. Photographs of Column 3 – Cycle 22b.
As with Column 2, Column 3 failed prematurely from the same detailing problem discussed
previously. Prior to initiation of this mechanism, the column’s behavior proceeded as
expected. The pull-off mechanism and associated detailing needs were clearly identified and
demonstrated in this test.
6.5 Column 4 Results
Testing of Column 4 commenced and continued out to a +/- 6.0 in. displacement. Because
Column 4 was cast with the same internal reinforcement details that led to premature failure
in the previous two columns, external retrofit angles were attached to the collars in an
attempt prevent the same failure mechanism from occurring (see Figure 106). The added
reinforcement is described in detail in Chapter 4. The incremental damage accrued over the
imposed displacement regimen for the Column 4 test is illustrated in Figures 107-118. The
first signs of damage to Column 4 were cracks that formed around the repair angles on Cycle
5a and 6a (displacements = +/- .26 in. and +/- .30 in.). A horizontal crack 3 in. above the top
collar was noted on Cycle 7a (displacement = +/- .40 in.) on the east face (see Figure 108).
Cycles 10a and 11a (displacements = +/- .75 in. and +/- 1.0 in.) produced more cracking
above the top collar, as well as a full crack across the base on the east and west sides (see
Tilting of Column 3
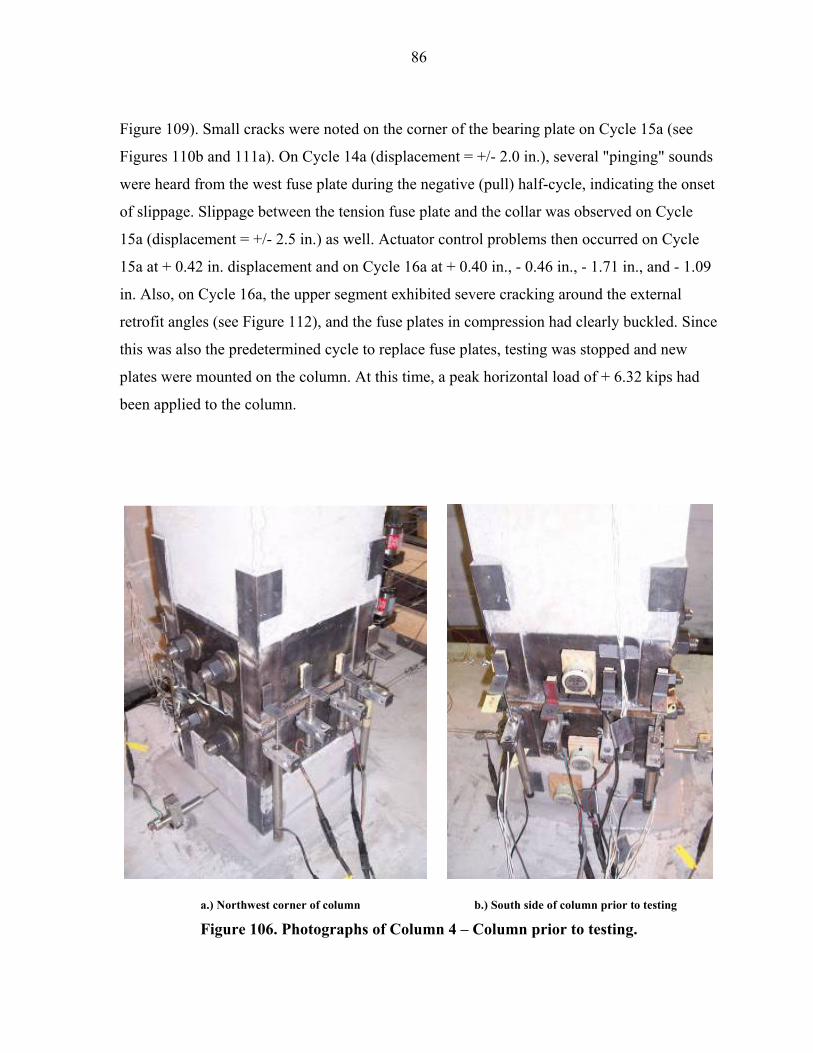
86
Figure 109). Small cracks were noted on the corner of the bearing plate on Cycle 15a (see
Figures 110b and 111a). On Cycle 14a (displacement = +/- 2.0 in.), several "pinging" sounds
were heard from the west fuse plate during the negative (pull) half-cycle, indicating the onset
of slippage. Slippage between the tension fuse plate and the collar was observed on Cycle
15a (displacement = +/- 2.5 in.) as well. Actuator control problems then occurred on Cycle
15a at + 0.42 in. displacement and on Cycle 16a at + 0.40 in., - 0.46 in., - 1.71 in., and - 1.09
in. Also, on Cycle 16a, the upper segment exhibited severe cracking around the external
retrofit angles (see Figure 112), and the fuse plates in compression had clearly buckled. Since
this was also the predetermined cycle to replace fuse plates, testing was stopped and new
plates were mounted on the column. At this time, a peak horizontal load of + 6.32 kips had
been applied to the column.
a.) Northwest corner of column b.) South side of column prior to testing
Figure 106. Photographs of Column 4 – Column prior to testing.
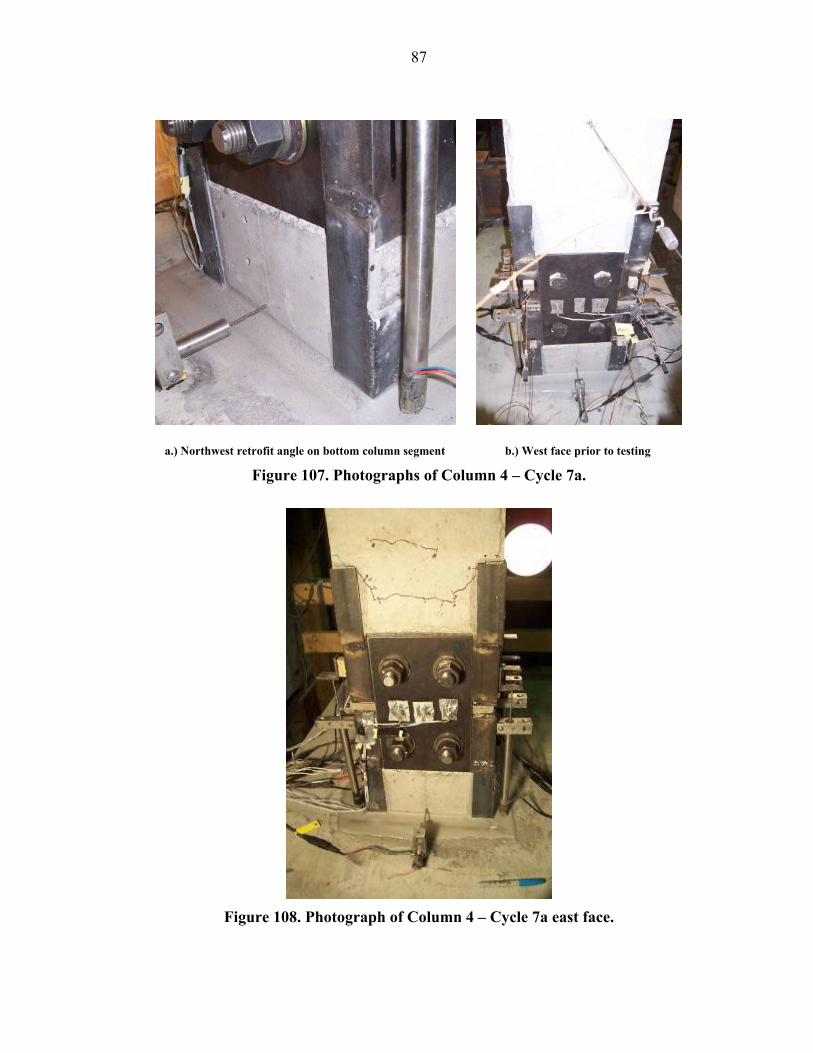
87
a.) Northwest retrofit angle on bottom column segment b.) West face prior to testing
Figure 107. Photographs of Column 4 – Cycle 7a.
Figure 108. Photograph of Column 4 – Cycle 7a east face.
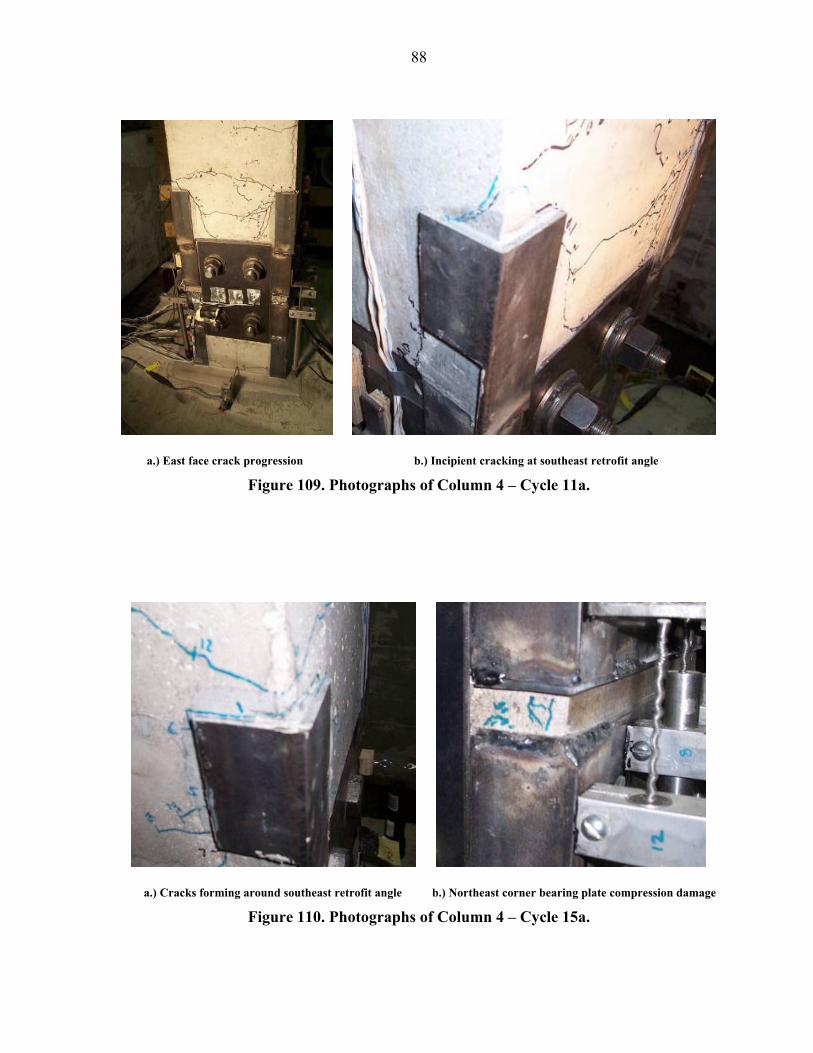
88
a.) East face crack progression b.) Incipient cracking at southeast retrofit angle
Figure 109. Photographs of Column 4 – Cycle 11a.
a.) Cracks forming around southeast retrofit angle b.) Northeast corner bearing plate compression damage
Figure 110. Photographs of Column 4 – Cycle 15a.
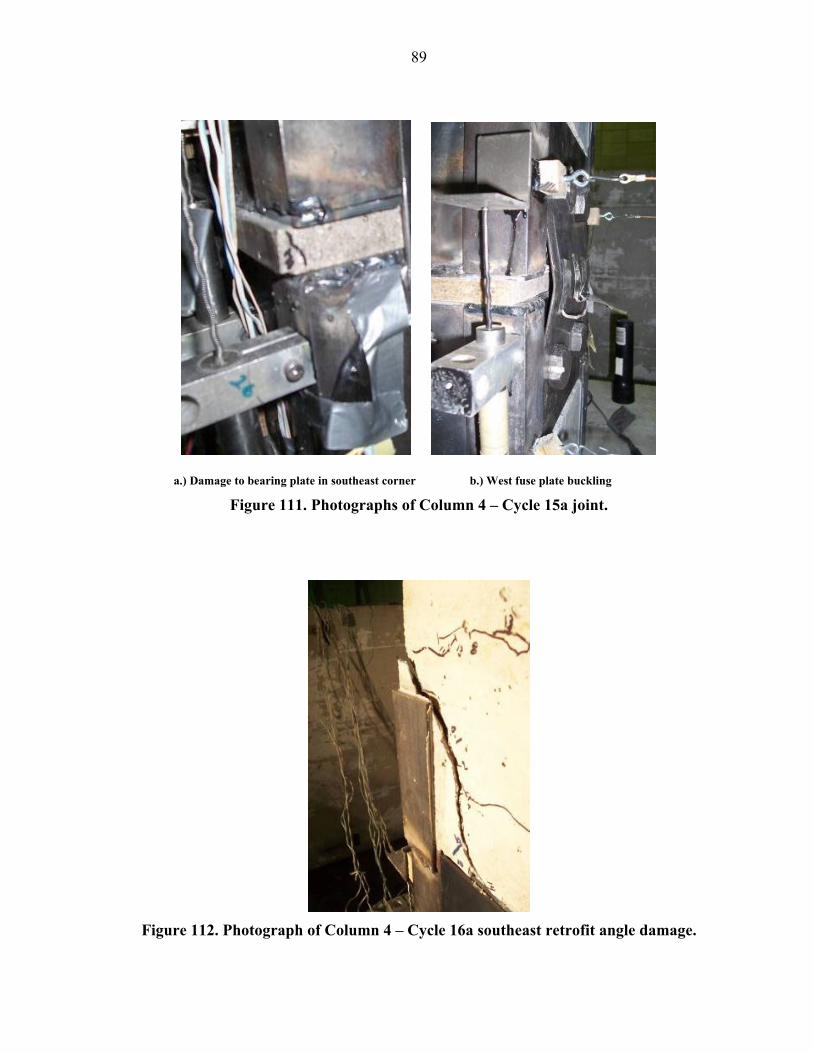
89
a.) Damage to bearing plate in southeast corner b.) West fuse plate buckling
Figure 111. Photographs of Column 4 – Cycle 15a joint.
Figure 112. Photograph of Column 4 – Cycle 16a southeast retrofit angle damage.
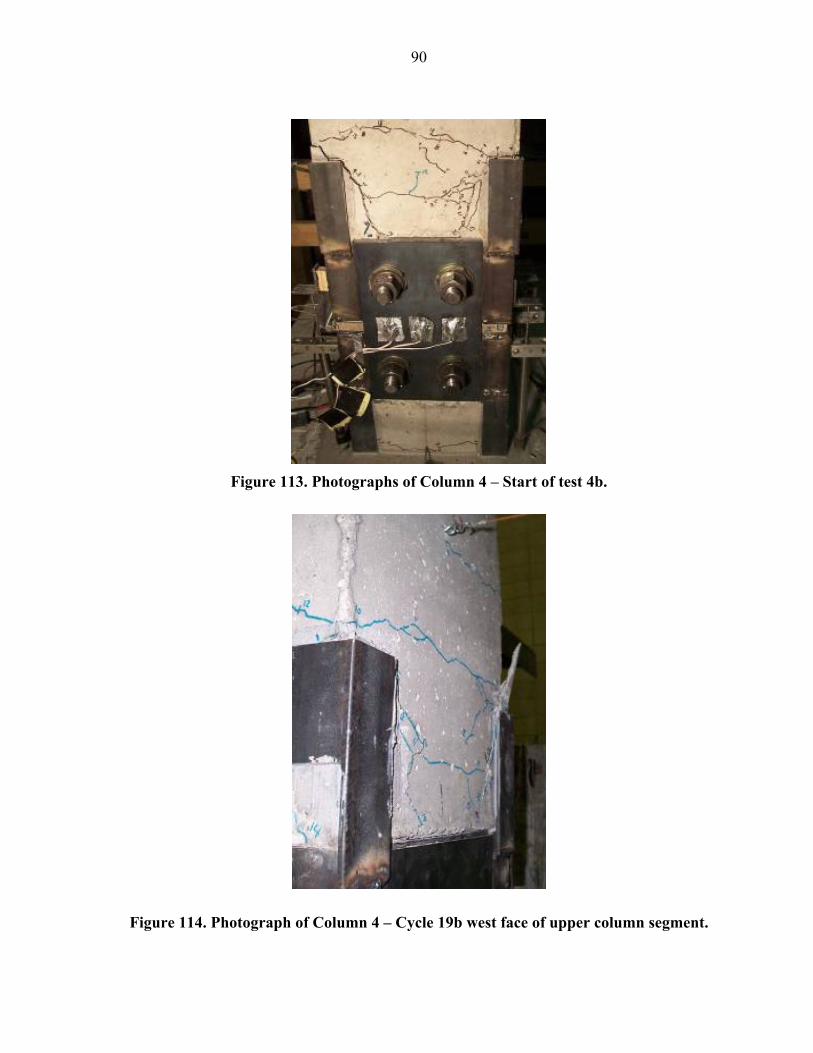
90
Figure 113. Photographs of Column 4 – Start of test 4b.
Figure 114. Photograph of Column 4 – Cycle 19b west face of upper column segment.
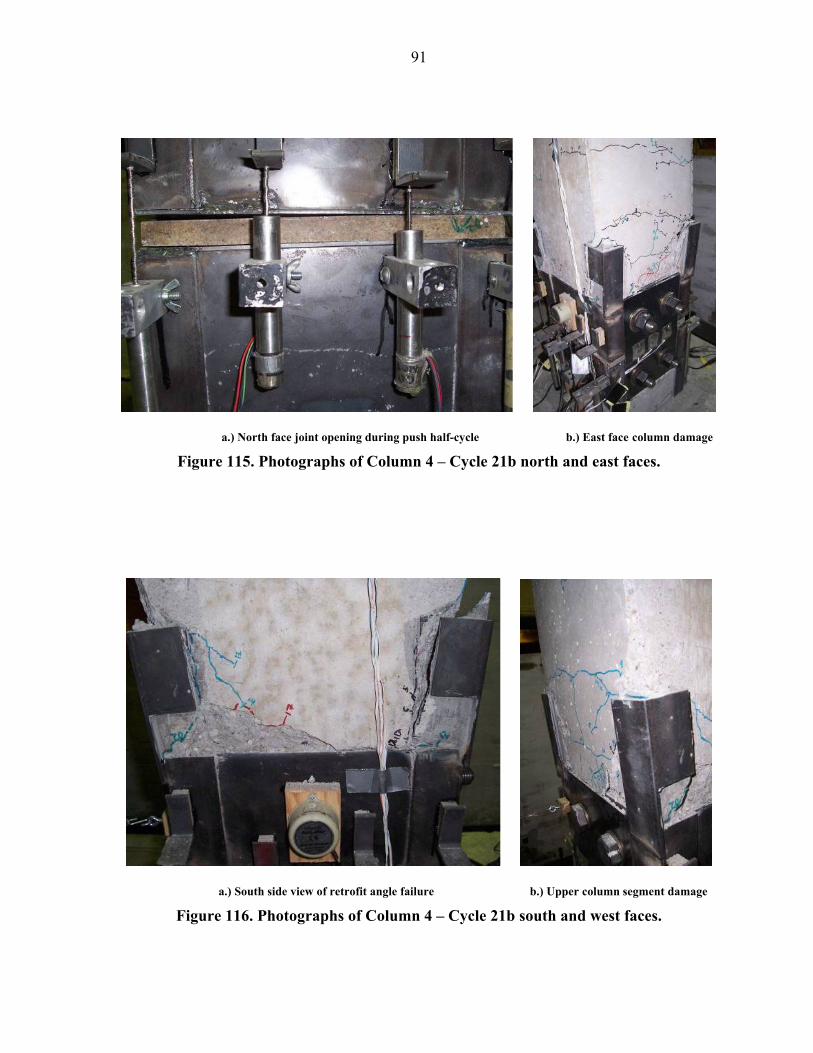
91
a.) North face joint opening during push half-cycle b.) East face column damage
Figure 115. Photographs of Column 4 – Cycle 21b north and east faces.
a.) South side view of retrofit angle failure b.) Upper column segment damage
Figure 116. Photographs of Column 4 – Cycle 21b south and west faces.
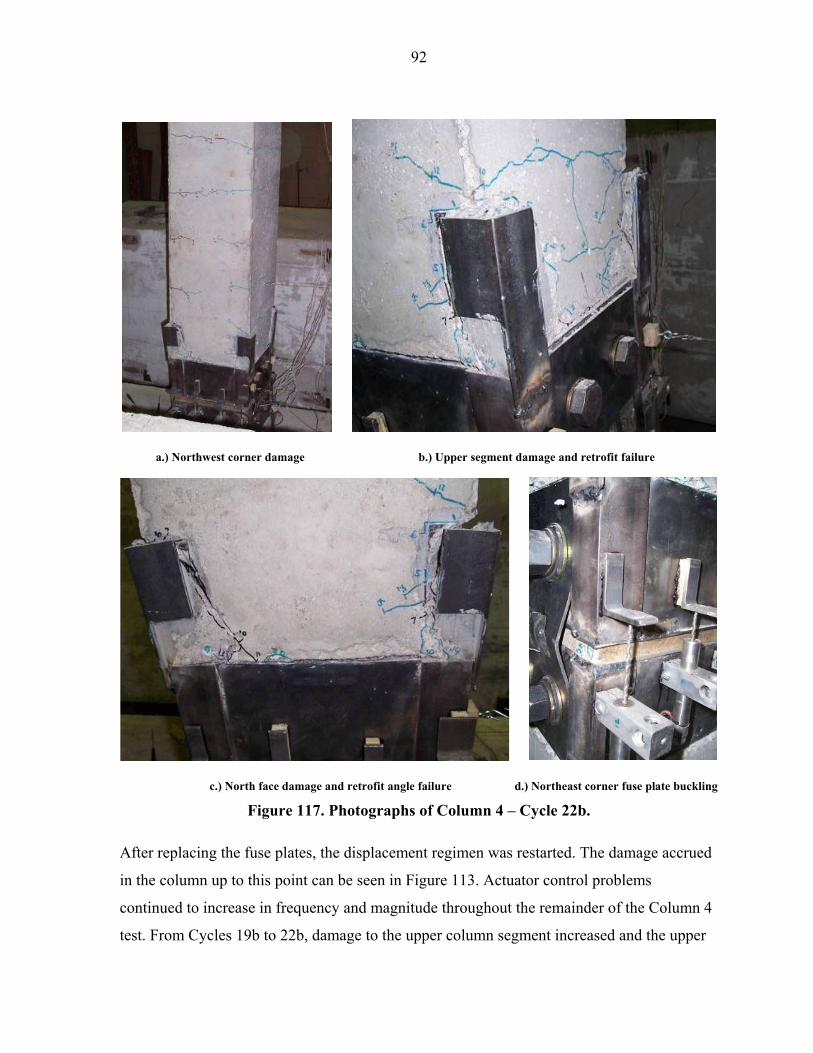
92
a.) Northwest corner damage b.) Upper segment damage and retrofit failure
c.) North face damage and retrofit angle failure d.) Northeast corner fuse plate buckling
Figure 117. Photographs of Column 4 – Cycle 22b.
After replacing the fuse plates, the displacement regimen was restarted. The damage accrued
in the column up to this point can be seen in Figure 113. Actuator control problems
continued to increase in frequency and magnitude throughout the remainder of the Column 4
test. From Cycles 19b to 22b, damage to the upper column segment increased and the upper
93
repair angles became detached from the column face (see Figures 114-117). By this point,
rotation of the column concentrated almost exclusively at this location as the collar again
pulled off the end of the segment. Testing of Column 4 was stopped after Cycle 23b, as it
was again evident that the decrease in load at each displacement was due to this pull-off
phenomenon. A maximum horizontal load of + 6.39 kips was observed on Cycle 19b
(displacement = +/- 4.0 in.) and a maximum displacement of 6.0 in. was observed for the test.
At + 6.0 in., a load of + 4.45 kips was achieved, while a - 5.16 kip load was achieved at - 6.0
in. Quantitative lateral load versus displacement data from the testing of Column 4 are
presented in Chapter 7.
The attempt to reinforce the collar (described in Section 4.2.3.1) against pull-off was
unsuccessful as behavior of Column 4 was similar to that observed in Columns 2 and 3. Once
again, little could be determined about the ability of the column to withstand its design load
due to the premature failure mode. However, Tests 2, 3, and 4 allowed selection of the most
effective fuse plate and bearing plate materials for subsequent tests of Columns 5 and 6, as
well as identification of key detailing issues for the segmented columns.
6.6 Column 5 Results
Testing of Column 5 commenced and continued to a + 11.14 in. displacement on the positive
(push) half-cycle and a -12.00 in. displacement on the negative (pull) half-cycle, using the
entire stroke of the actuator. The + 12.00 in. displacement was not able to be reached,
because the difficult nature of positioning the column caused the column to be slightly to the
east of the center of the actuator shaft. Column 5 is shown before testing in Figure 118, and
the incremental damage accrued over the imposed displacement regimen is shown in Figures
119-139. Cracking across the entire column base was noted during Cycle 10a. On the
positive (push) half-cycle, cracking occurred at the base of the column on the east face (see
Figure 119). Cracks also formed approximately every 6 in. up the column for several feet. On
the negative (pull) half-cycle, cracking occurred at the base of the west face of the column.
Testing was halted on Cycle 11a (displacement = +/- 1.0 in.), because the load-displacement
cable to the DAS had become disconnected during the first portion of testing. Thus nearly all
the data measured over these cycles were lost. Once the load-displacement cable was
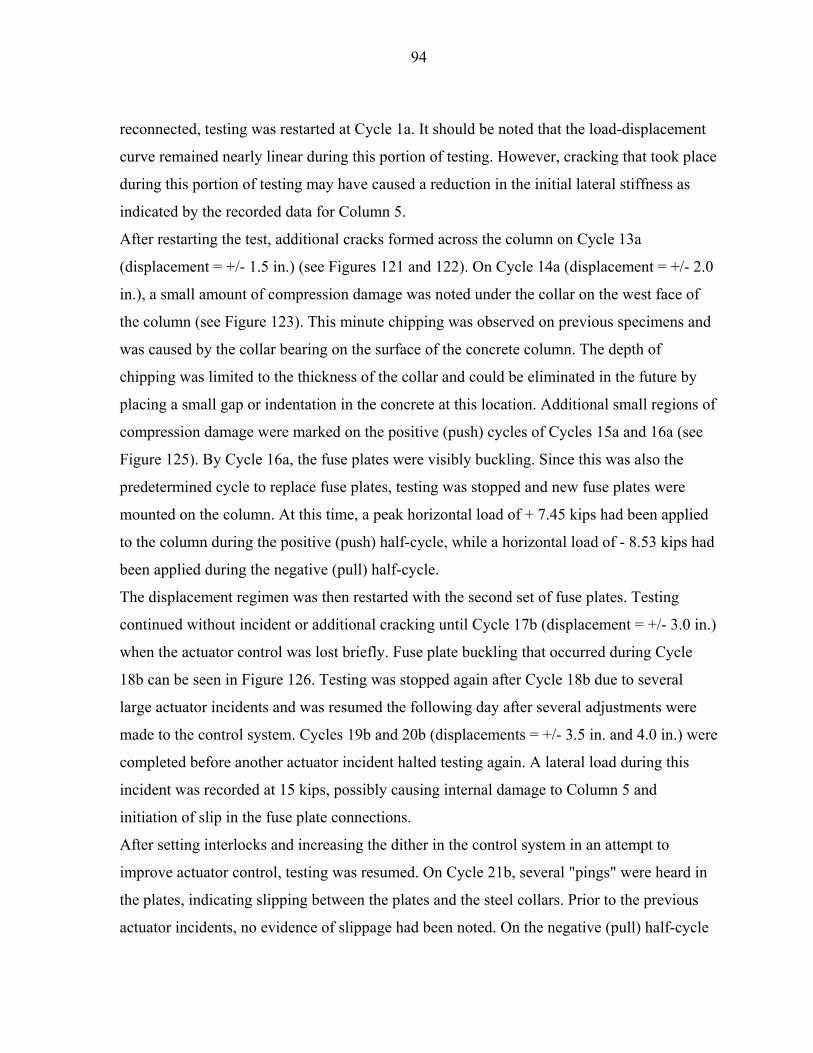
94
reconnected, testing was restarted at Cycle 1a. It should be noted that the load-displacement
curve remained nearly linear during this portion of testing. However, cracking that took place
during this portion of testing may have caused a reduction in the initial lateral stiffness as
indicated by the recorded data for Column 5.
After restarting the test, additional cracks formed across the column on Cycle 13a
(displacement = +/- 1.5 in.) (see Figures 121 and 122). On Cycle 14a (displacement = +/- 2.0
in.), a small amount of compression damage was noted under the collar on the west face of
the column (see Figure 123). This minute chipping was observed on previous specimens and
was caused by the collar bearing on the surface of the concrete column. The depth of
chipping was limited to the thickness of the collar and could be eliminated in the future by
placing a small gap or indentation in the concrete at this location. Additional small regions of
compression damage were marked on the positive (push) cycles of Cycles 15a and 16a (see
Figure 125). By Cycle 16a, the fuse plates were visibly buckling. Since this was also the
predetermined cycle to replace fuse plates, testing was stopped and new fuse plates were
mounted on the column. At this time, a peak horizontal load of + 7.45 kips had been applied
to the column during the positive (push) half-cycle, while a horizontal load of - 8.53 kips had
been applied during the negative (pull) half-cycle.
The displacement regimen was then restarted with the second set of fuse plates. Testing
continued without incident or additional cracking until Cycle 17b (displacement = +/- 3.0 in.)
when the actuator control was lost briefly. Fuse plate buckling that occurred during Cycle
18b can be seen in Figure 126. Testing was stopped again after Cycle 18b due to several
large actuator incidents and was resumed the following day after several adjustments were
made to the control system. Cycles 19b and 20b (displacements = +/- 3.5 in. and 4.0 in.) were
completed before another actuator incident halted testing again. A lateral load during this
incident was recorded at 15 kips, possibly causing internal damage to Column 5 and
initiation of slip in the fuse plate connections.
After setting interlocks and increasing the dither in the control system in an attempt to
improve actuator control, testing was resumed. On Cycle 21b, several "pings" were heard in
the plates, indicating slipping between the plates and the steel collars. Prior to the previous
actuator incidents, no evidence of slippage had been noted. On the negative (pull) half-cycle
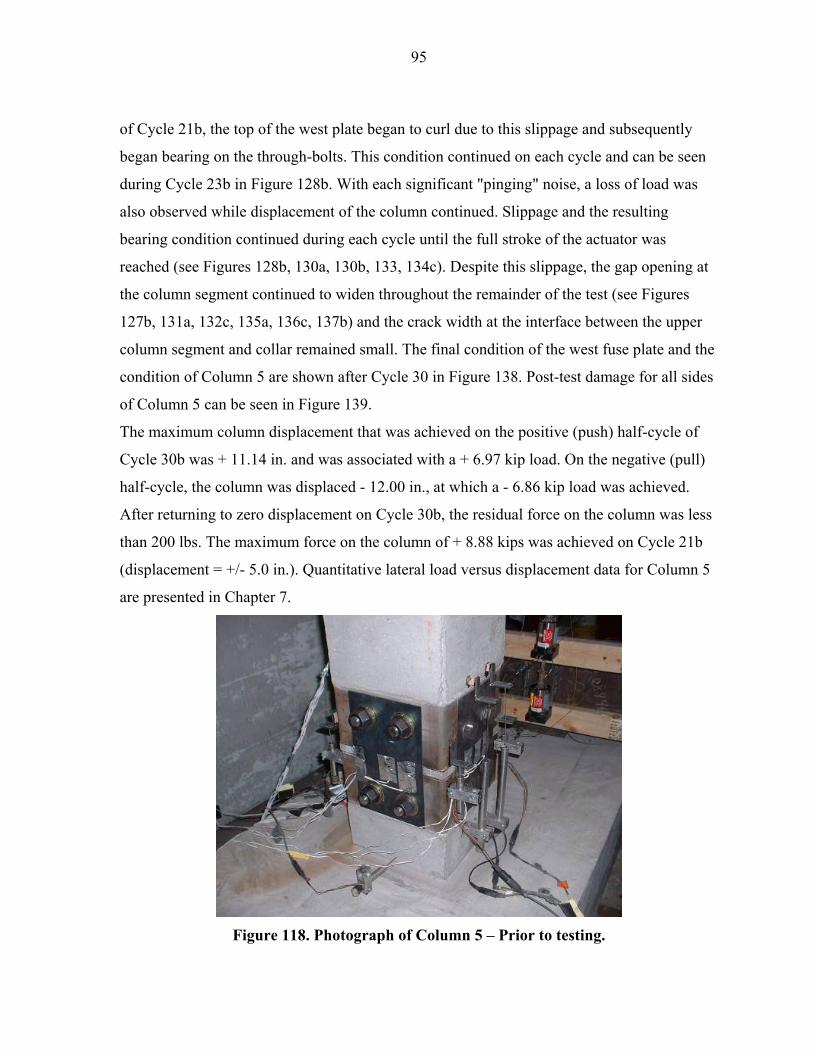
95
of Cycle 21b, the top of the west plate began to curl due to this slippage and subsequently
began bearing on the through-bolts. This condition continued on each cycle and can be seen
during Cycle 23b in Figure 128b. With each significant "pinging" noise, a loss of load was
also observed while displacement of the column continued. Slippage and the resulting
bearing condition continued during each cycle until the full stroke of the actuator was
reached (see Figures 128b, 130a, 130b, 133, 134c). Despite this slippage, the gap opening at
the column segment continued to widen throughout the remainder of the test (see Figures
127b, 131a, 132c, 135a, 136c, 137b) and the crack width at the interface between the upper
column segment and collar remained small. The final condition of the west fuse plate and the
condition of Column 5 are shown after Cycle 30 in Figure 138. Post-test damage for all sides
of Column 5 can be seen in Figure 139.
The maximum column displacement that was achieved on the positive (push) half-cycle of
Cycle 30b was + 11.14 in. and was associated with a + 6.97 kip load. On the negative (pull)
half-cycle, the column was displaced - 12.00 in., at which a - 6.86 kip load was achieved.
After returning to zero displacement on Cycle 30b, the residual force on the column was less
than 200 lbs. The maximum force on the column of + 8.88 kips was achieved on Cycle 21b
(displacement = +/- 5.0 in.). Quantitative lateral load versus displacement data for Column 5
are presented in Chapter 7.
Figure 118. Photograph of Column 5 – Prior to testing.
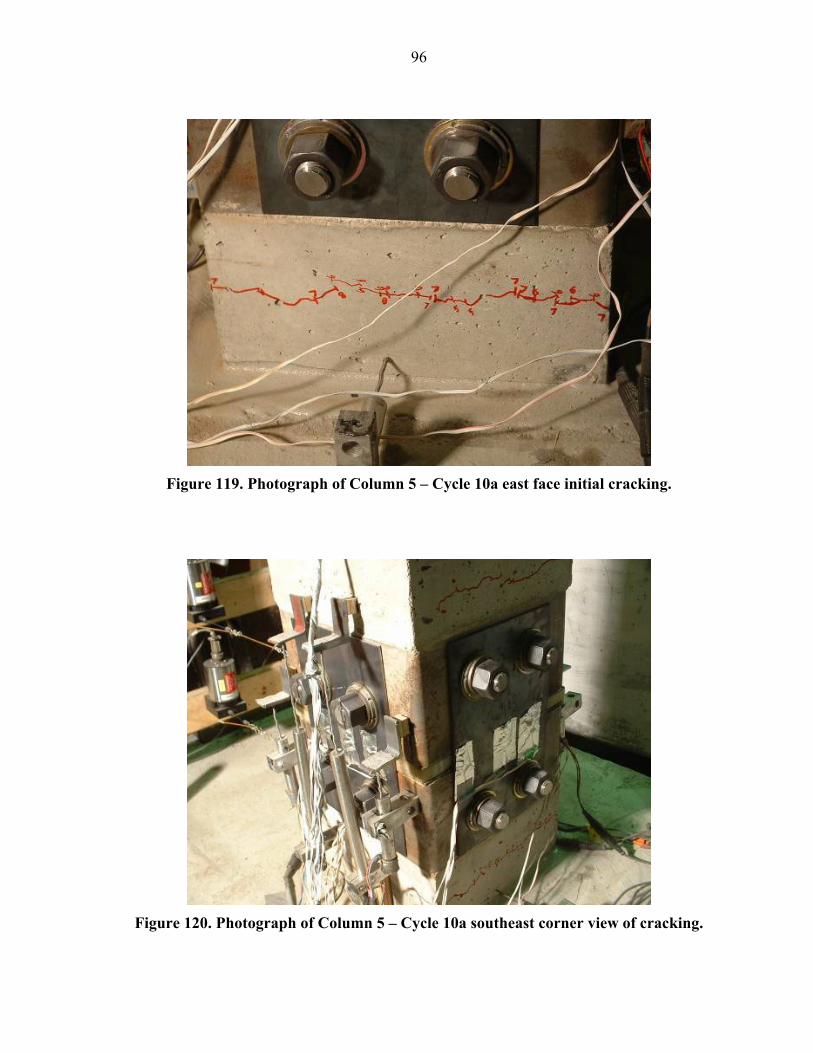
96
Figure 119. Photograph of Column 5 – Cycle 10a east face initial cracking.
Figure 120. Photograph of Column 5 – Cycle 10a southeast corner view of cracking.
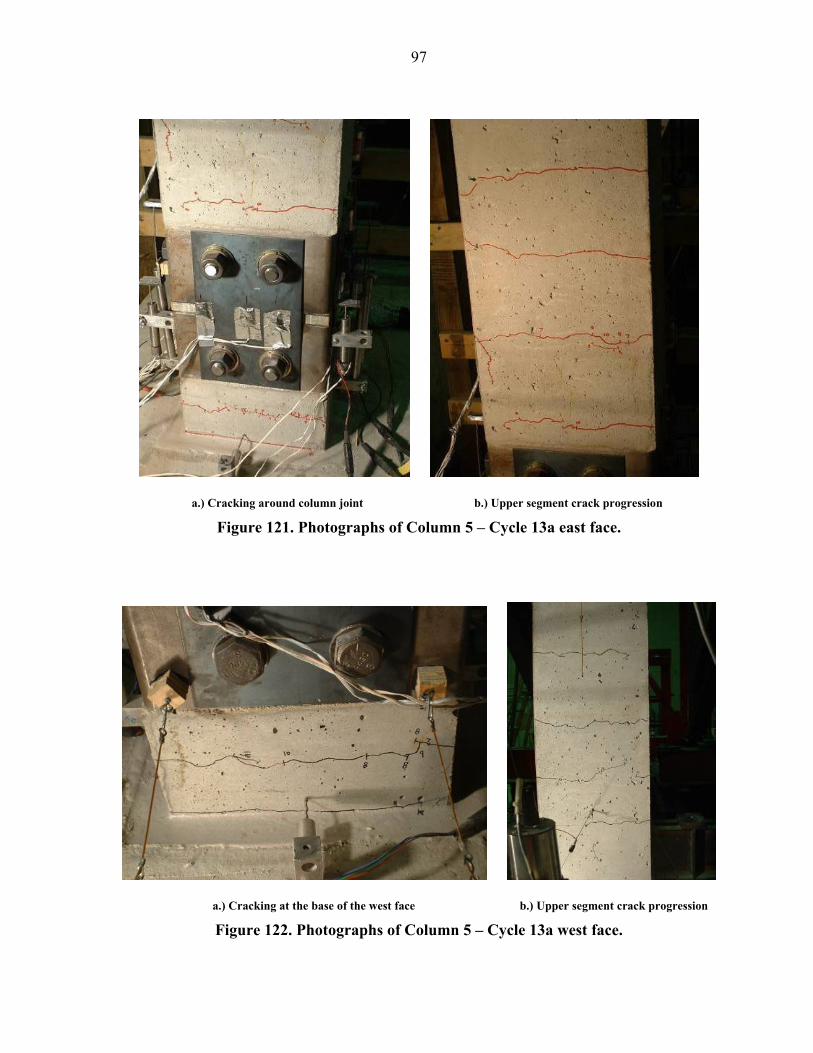
97
a.) Cracking around column joint b.) Upper segment crack progression
Figure 121. Photographs of Column 5 – Cycle 13a east face.
a.) Cracking at the base of the west face b.) Upper segment crack progression
Figure 122. Photographs of Column 5 – Cycle 13a west face.
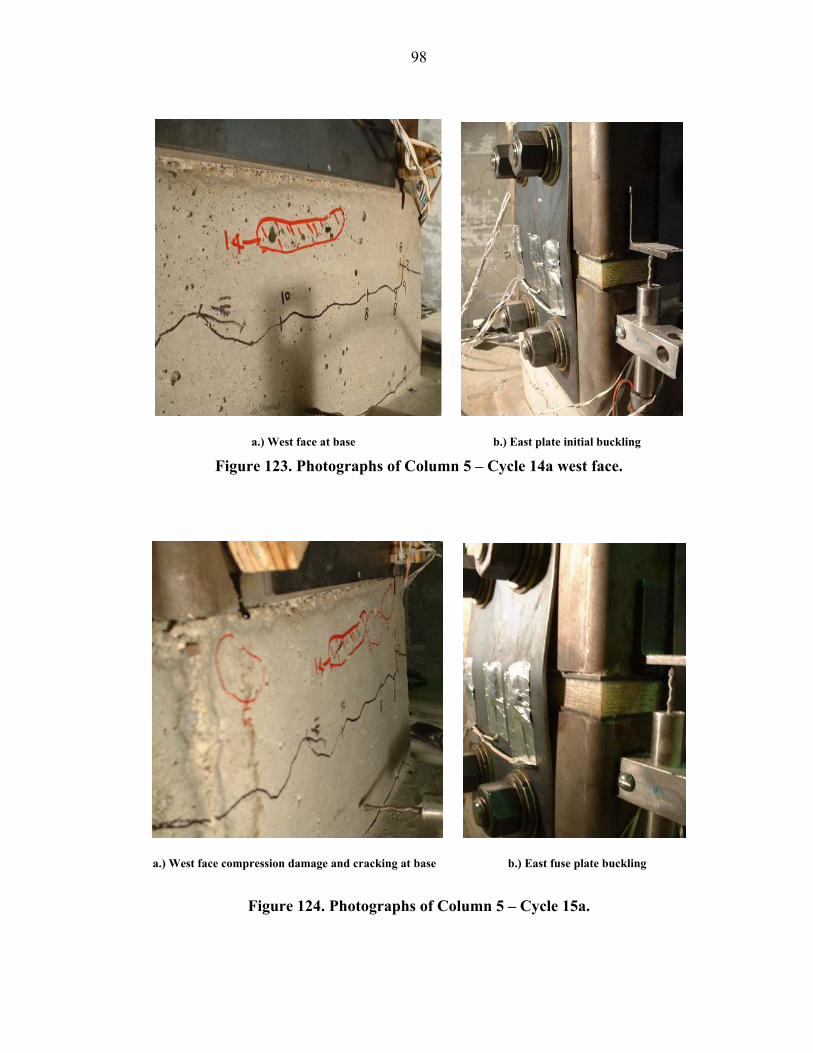
98
a.) West face at base b.) East plate initial buckling
Figure 123. Photographs of Column 5 – Cycle 14a west face.
a.) West face compression damage and cracking at base b.) East fuse plate buckling
Figure 124. Photographs of Column 5 – Cycle 15a.
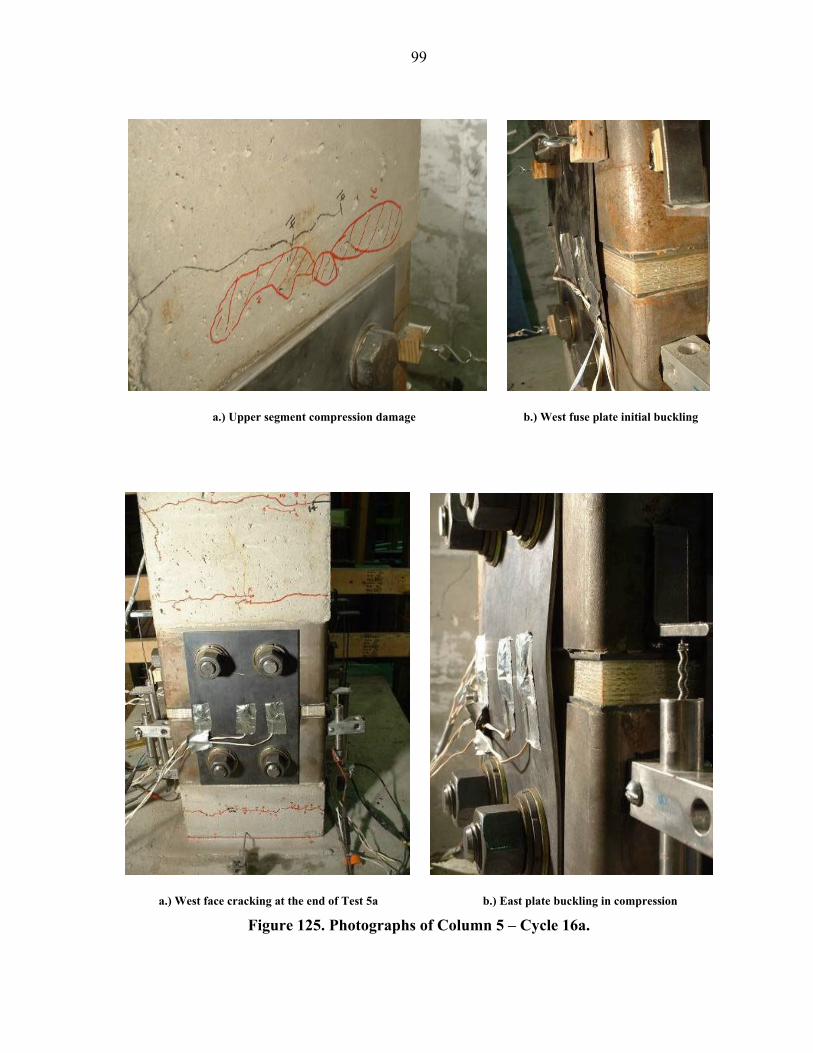
99
a.) Upper segment compression damage b.) West fuse plate initial buckling
a.) West face cracking at the end of Test 5a b.) East plate buckling in compression
Figure 125. Photographs of Column 5 – Cycle 16a.
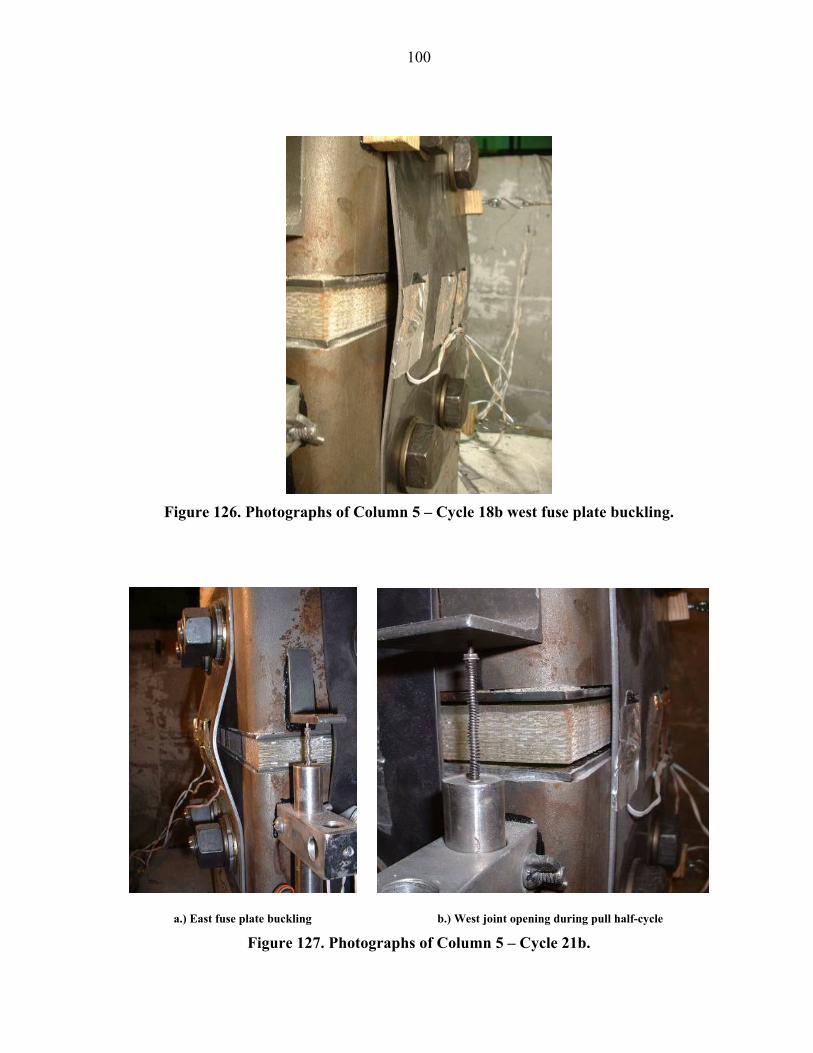
100
Figure 126. Photographs of Column 5 – Cycle 18b west fuse plate buckling.
a.) East fuse plate buckling b.) West joint opening during pull half-cycle
Figure 127. Photographs of Column 5 – Cycle 21b.
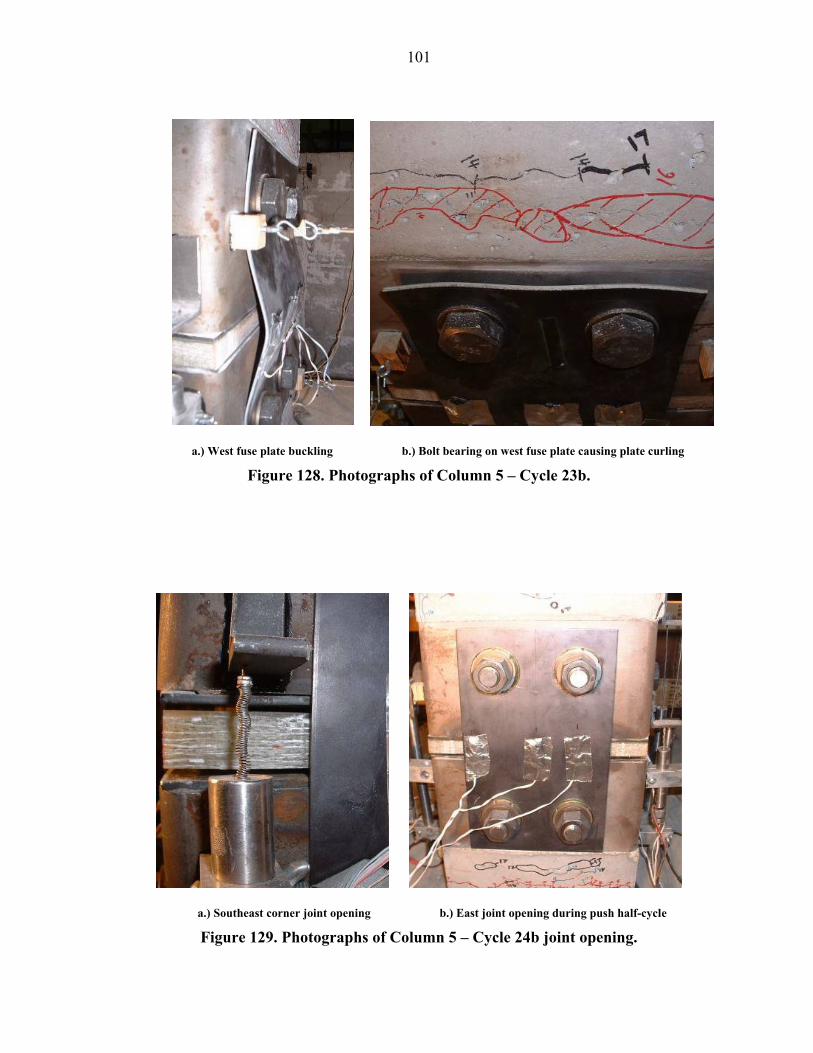
101
a.) West fuse plate buckling b.) Bolt bearing on west fuse plate causing plate curling
Figure 128. Photographs of Column 5 – Cycle 23b.
a.) Southeast corner joint opening b.) East joint opening during push half-cycle
Figure 129. Photographs of Column 5 – Cycle 24b joint opening.
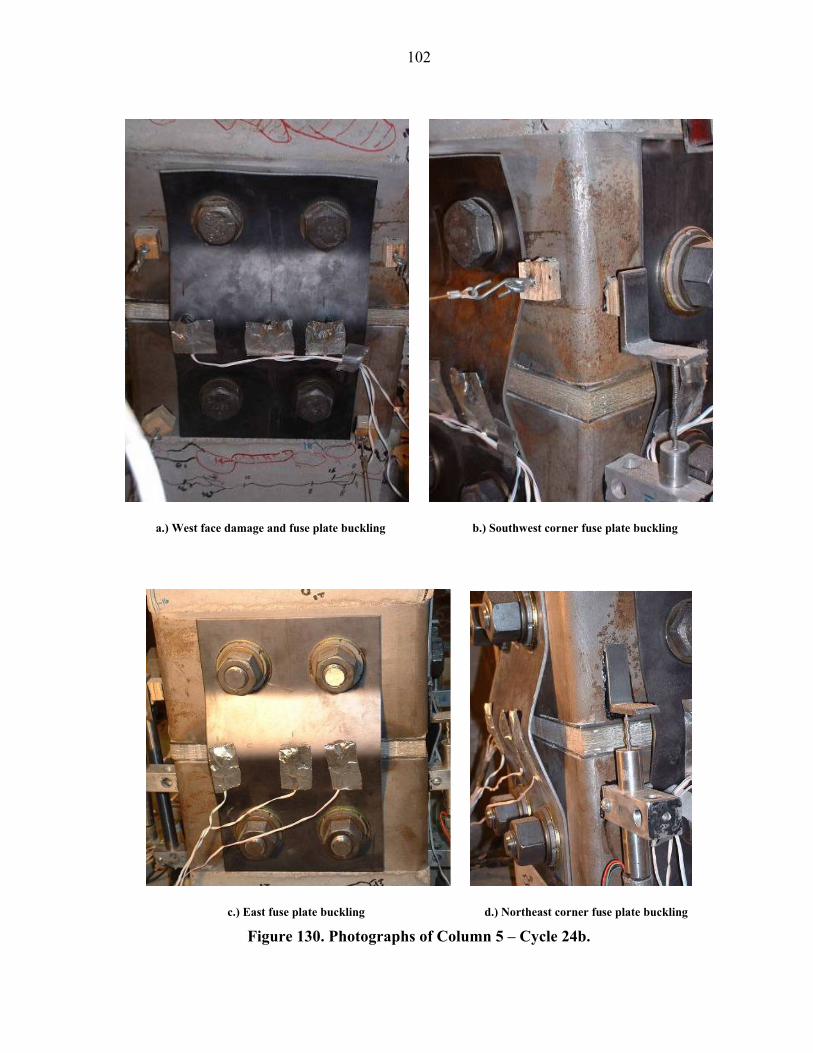
102
a.) West face damage and fuse plate buckling b.) Southwest corner fuse plate buckling
c.) East fuse plate buckling d.) Northeast corner fuse plate buckling
Figure 130. Photographs of Column 5 – Cycle 24b.
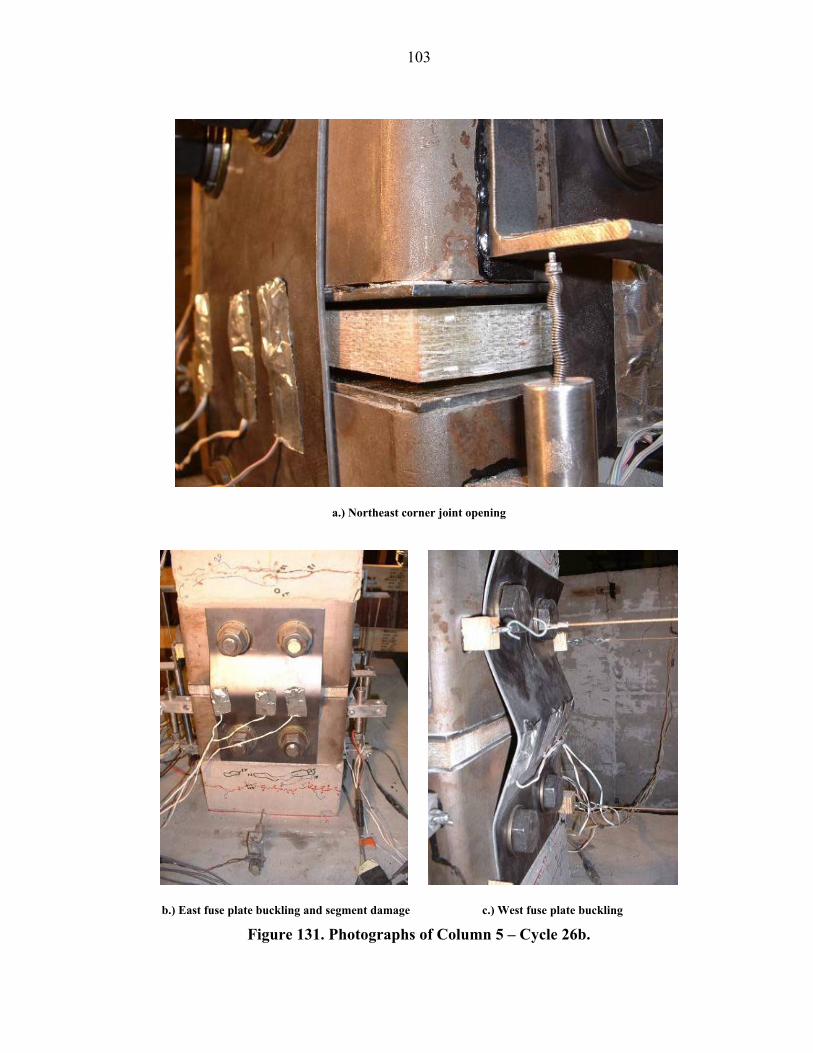
103
a.) Northeast corner joint opening
b.) East fuse plate buckling and segment damage c.) West fuse plate buckling
Figure 131. Photographs of Column 5 – Cycle 26b.
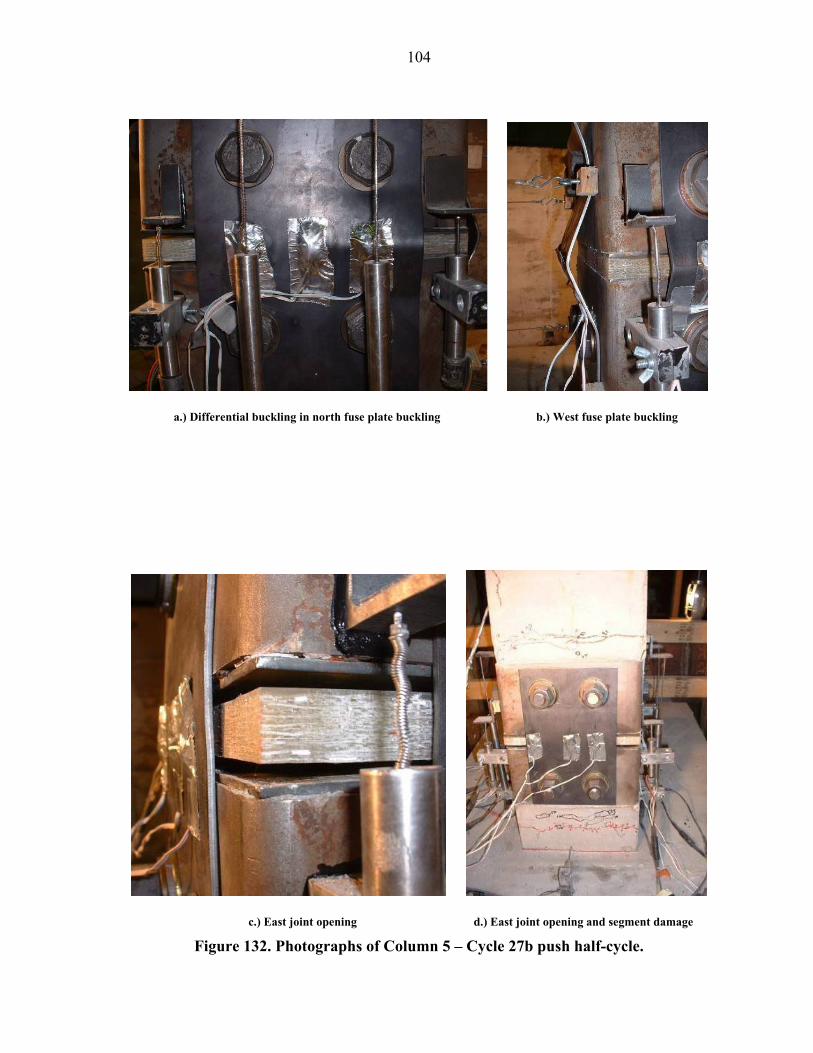
104
a.) Differential buckling in north fuse plate buckling b.) West fuse plate buckling
c.) East joint opening d.) East joint opening and segment damage
Figure 132. Photographs of Column 5 – Cycle 27b push half-cycle.
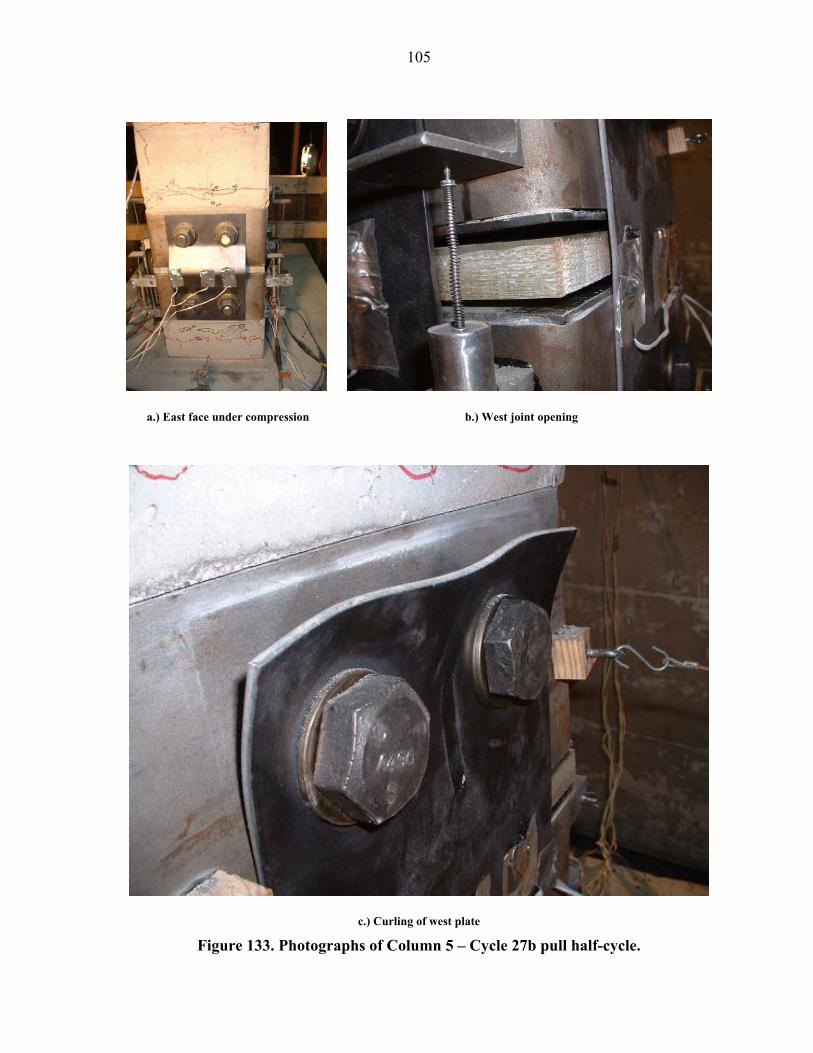
105
a.) East face under compression b.) West joint opening
c.) Curling of west plate
Figure 133. Photographs of Column 5 – Cycle 27b pull half-cycle.
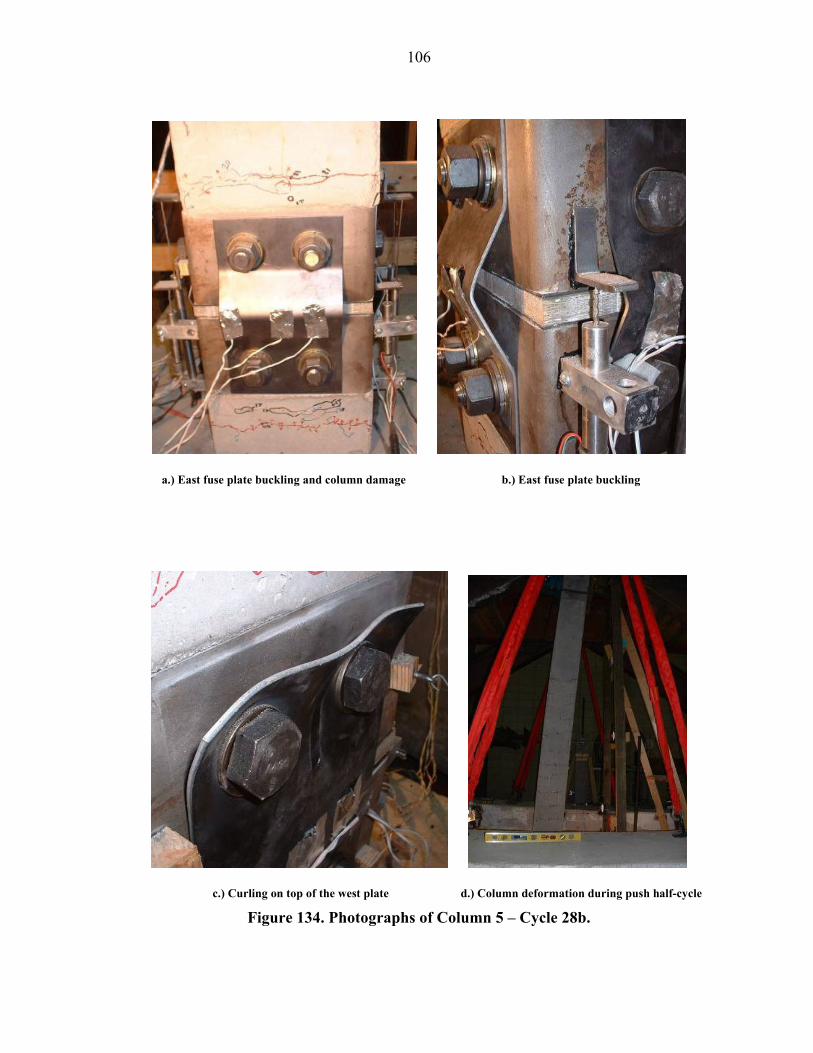
106
a.) East fuse plate buckling and column damage b.) East fuse plate buckling
c.) Curling on top of the west plate d.) Column deformation during push half-cycle
Figure 134. Photographs of Column 5 – Cycle 28b.
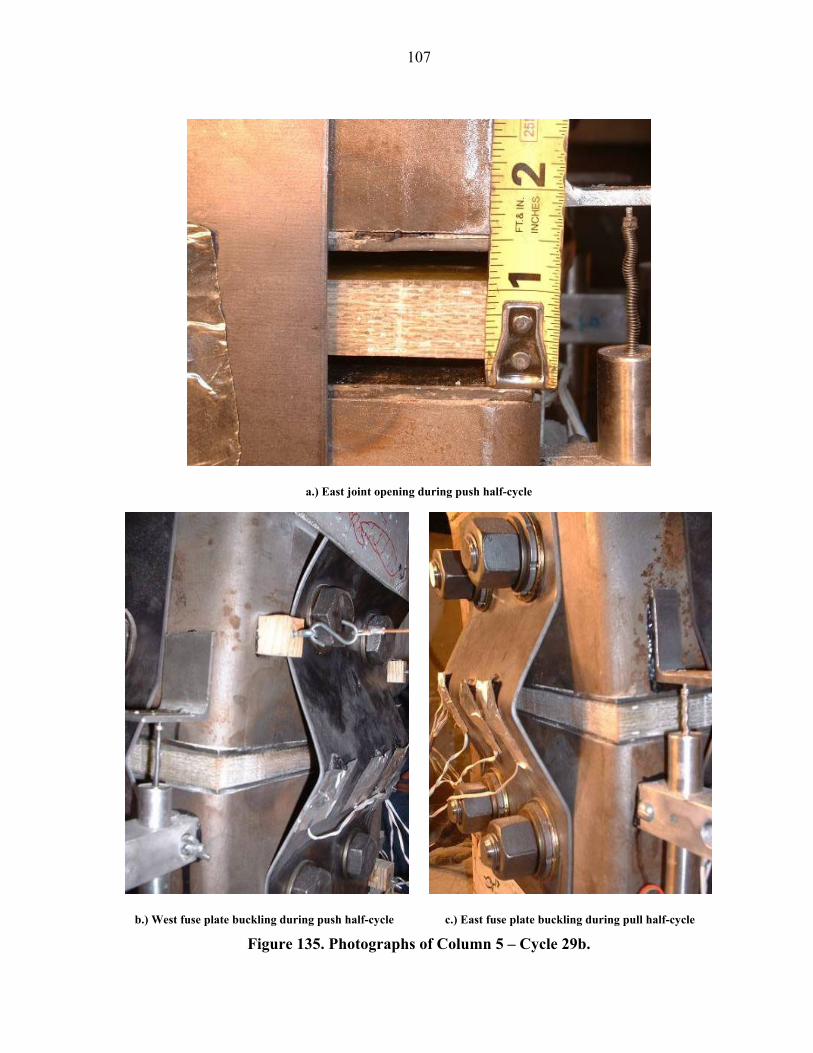
107
a.) East joint opening during push half-cycle
b.) West fuse plate buckling during push half-cycle c.) East fuse plate buckling during pull half-cycle
Figure 135. Photographs of Column 5 – Cycle 29b.
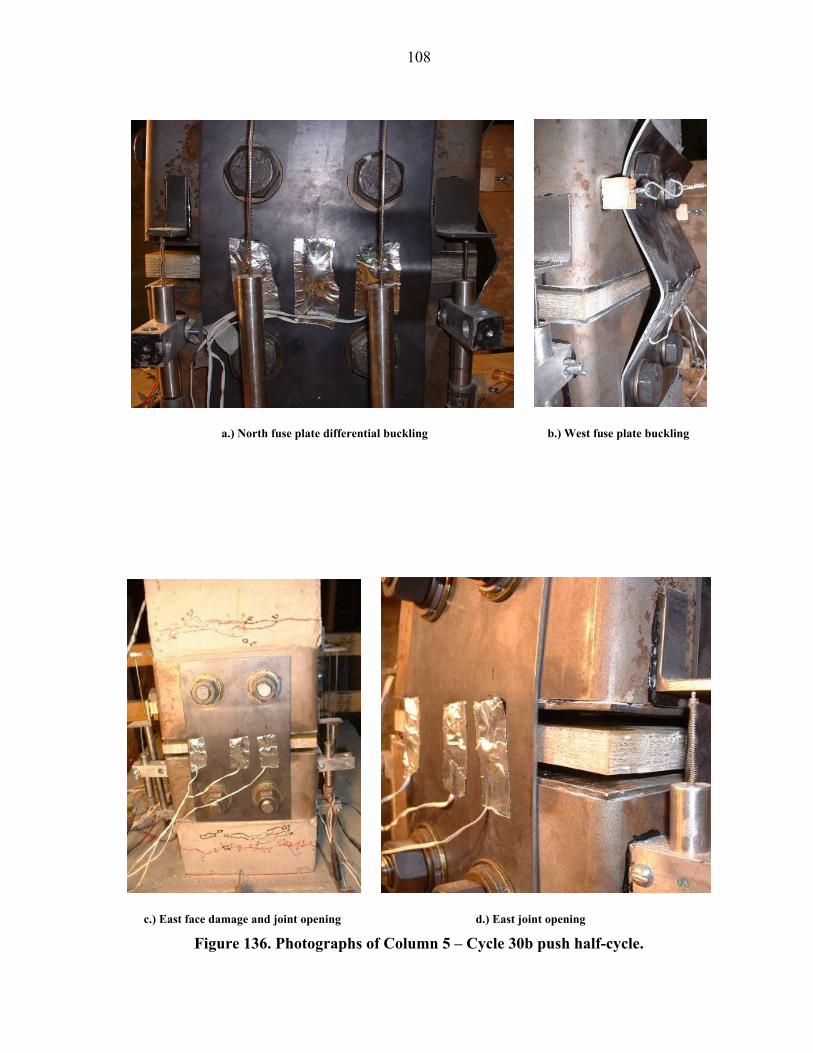
108
a.) North fuse plate differential buckling b.) West fuse plate buckling
c.) East face damage and joint opening d.) East joint opening
Figure 136. Photographs of Column 5 – Cycle 30b push half-cycle.
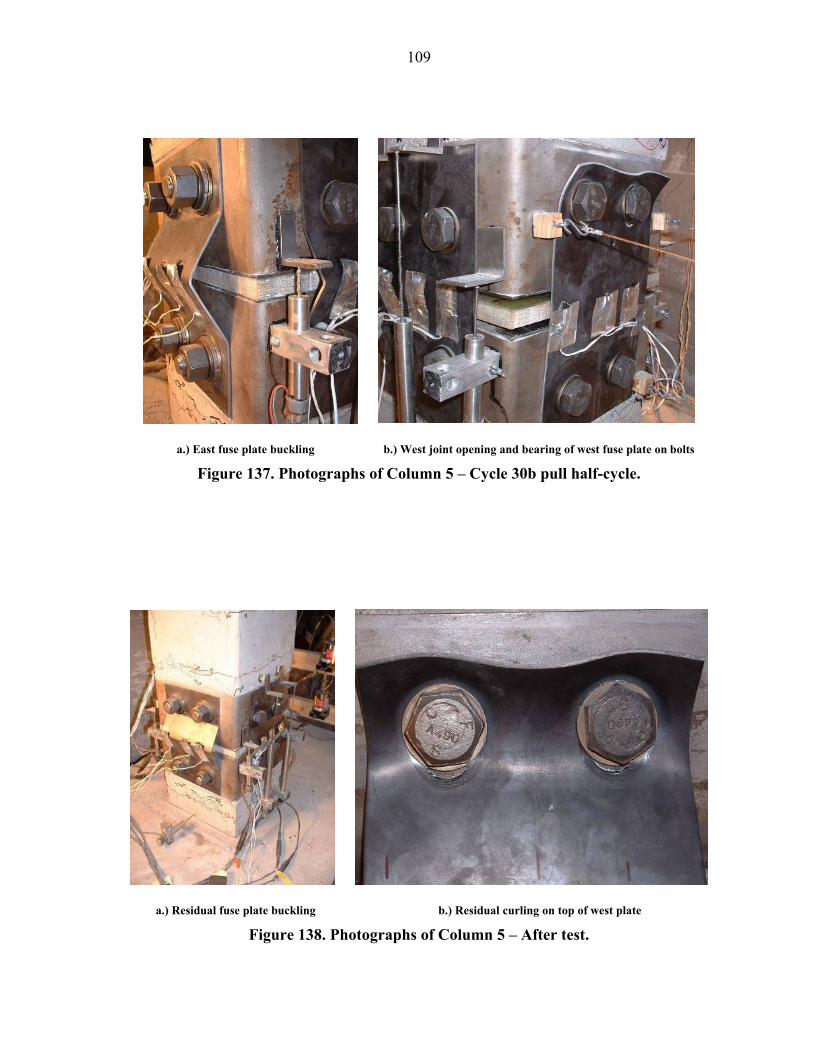
109
a.) East fuse plate buckling b.) West joint opening and bearing of west fuse plate on bolts
Figure 137. Photographs of Column 5 – Cycle 30b pull half-cycle.
a.) Residual fuse plate buckling b.) Residual curling on top of west plate
Figure 138. Photographs of Column 5 – After test.
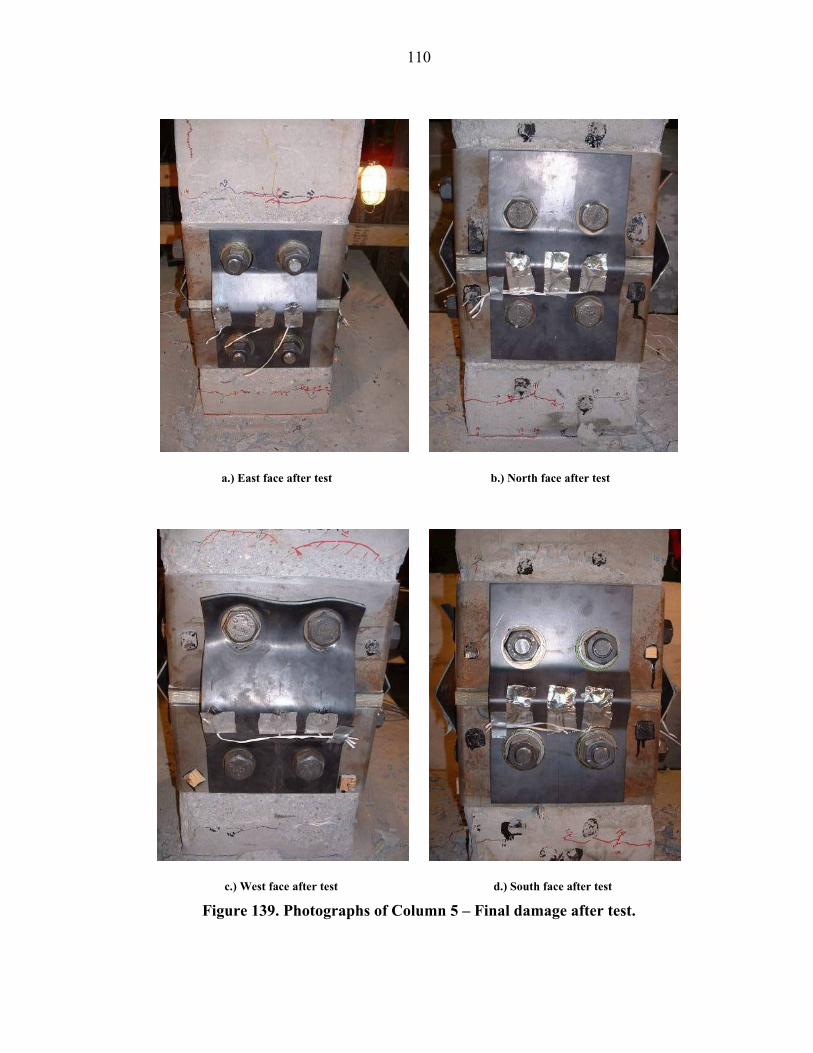
110
a.) East face after test b.) North face after test
c.) West face after test d.) South face after test
Figure 139. Photographs of Column 5 – Final damage after test.
111
After resolving the detailing issues identified in Columns 2–4, Column 5 performed as
designed with the exception of the fuse plate slippage. The fuse plates at the column segment
clearly exhibited tensile yielding and buckling. In addition, the joint section demonstrated
large deformation capacity, which prevented the concrete segments from sustaining major
damage (i.e., buckling of bonded reinforcement). By allowing a large amount of rotation to
take place at the segment joint, less bending of the column segments occurred during large
lateral displacements. Because the full stroke of the actuator was reached, greater damage
such as fuse plate fracture, yielding of the post-tensioning, or crushing of concrete was not
achieved.
Sandblasting of the faying surfaces at the slip-critical connection had been performed to
increase the coefficient of static friction in the connection, and it was unclear whether or not
the slippage or slightly lower lateral strength relative to the control column was caused by the
actuator control incidents associated with the malfunctioning servo valve. The slippage of the
fuse plates almost certainly caused the gradual decrease in lateral load at large lateral
displacements. In future tests or field application, slippage could be readily addressed by
increasing the clamping forces through the use of more or larger through-bolts. The large
displacements achieved while maintaining high lateral loads relative to the control column,
however, were considered a major improvement in performance. Repair by replacing fuse
plates was also highly successful as evidenced by the nearly identical load-displacement
performance of the repaired column to that of the column prior to repair.
6.7 Column 6 Results
Testing of Column 6 commenced and continued to a + 10.33 in. displacement on the positive
(push) half-cycle and a - 10.00 in. displacement on the negative (pull) half-cycle, using the
entire stroke of the actuator on the positive side of the displacement regimen. As discussed in
Section 6.6, the difficulty of positioning the column with respect to the actuator limited the
stroke of the actuator during the positive (push) half-cycle of testing to less than the actual
stroke limit of the actuator of +12.00 in. Column 6 prior to testing is shown in Figure 140
and 141, and the incremental damage accrued over the imposed displacement regimen is
illustrated in Figures 142-158. A small crack was first noted at the base of the east face on
112
Cycle 8a (displacement = +/- 0.5 in.). Cracking across the entire base of the column (see
Figure 142a), as well as cracks 6 in. and 18 in. above the base of the column, was observed
on Cycle 10a (displacement = +/- 1.0 in.) on the east face of the column. Cracking across the
west face was noted at the base on Cycle 11a (displacement = +/- 1.0 in.) (see Figure 142b).
Additional cracking of Column 6 was noted on subsequent cycles until replacement of the
fuse plates took place (see Figure 143). Relative to Column 5, Column 6 had a narrower
opening of the construction joint up to this point. On Cycle 16a (displacement = +/- 2.5 in.),
buckling in the plates was barely detectable due to the shape recovery of the SMA material.
However, this was the predetermined cycle to replace fuse plates, so testing was stopped and
new SMA fuse plates were mounted on the column. Up to this point, a peak horizontal load
of + 7.22 kips had been applied to the column.
The displacement regimen was then restarted with the second set of plates. The extent of
cracking that took place during the entire “a” portion testing can be seen in Figure 145.
Testing resumed without further cracking until Cycle 14b (displacement = +/- 2.0 in.), when
several cracks extended, and a small amount of compression damage was noted on the west
face of the column near the base. Compression damage on the northwest and southeast
corners of the column increased above and below the collars for several cycles (see Figures
146-148). As previously discussed, this damage was minor and due to the collar bearing on
the shallow face shell of concrete.
"Pinging" in the fuse plates was noted during Cycle 19b (displacement = +/- 3.5 in.), again
indicating slippage between the fuse plates and through-bolts. Also during this cycle, the
construction joint gap between column segments began to widen significantly. More
"pinging" was heard from the fuse plates during Cycle 21b (displacement = +/- 5.0 in.),
Cycle 22b (displacement = +/- 5.0 in.), and Cycle 23b (displacement = +/- 6.0 in.). After
Cycle 23b, continuous "pinging" was heard in the fuse plates during the remaining cycles of
the test. Compression damage continued to increase over the next few cycles, along with
superficial, shallow (< 0.25 in. deep) spalling of the concrete around the collars (see Figures
151a, 151b, and 153). A decrease in lateral load was noted as the slippage in the fuse plates
continued, as with previous tests.
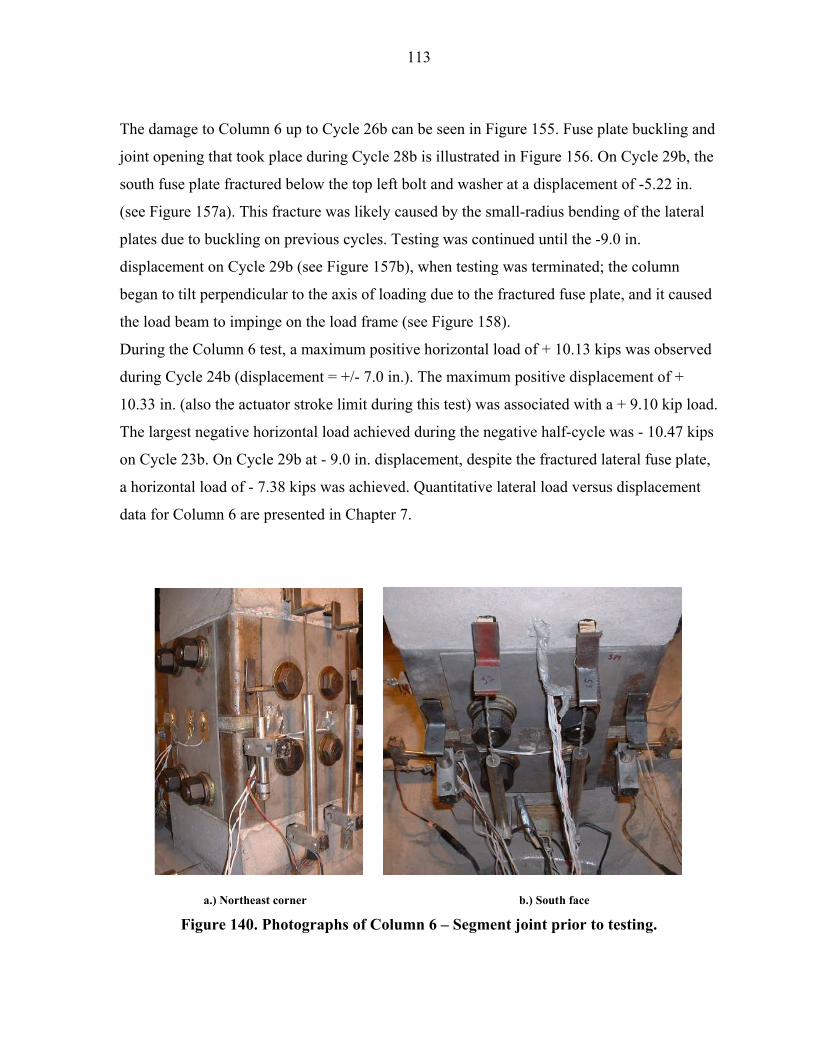
113
The damage to Column 6 up to Cycle 26b can be seen in Figure 155. Fuse plate buckling and
joint opening that took place during Cycle 28b is illustrated in Figure 156. On Cycle 29b, the
south fuse plate fractured below the top left bolt and washer at a displacement of -5.22 in.
(see Figure 157a). This fracture was likely caused by the small-radius bending of the lateral
plates due to buckling on previous cycles. Testing was continued until the -9.0 in.
displacement on Cycle 29b (see Figure 157b), when testing was terminated; the column
began to tilt perpendicular to the axis of loading due to the fractured fuse plate, and it caused
the load beam to impinge on the load frame (see Figure 158).
During the Column 6 test, a maximum positive horizontal load of + 10.13 kips was observed
during Cycle 24b (displacement = +/- 7.0 in.). The maximum positive displacement of +
10.33 in. (also the actuator stroke limit during this test) was associated with a + 9.10 kip load.
The largest negative horizontal load achieved during the negative half-cycle was - 10.47 kips
on Cycle 23b. On Cycle 29b at - 9.0 in. displacement, despite the fractured lateral fuse plate,
a horizontal load of - 7.38 kips was achieved. Quantitative lateral load versus displacement
data for Column 6 are presented in Chapter 7.
a.) Northeast corner b.) South face
Figure 140. Photographs of Column 6 – Segment joint prior to testing.
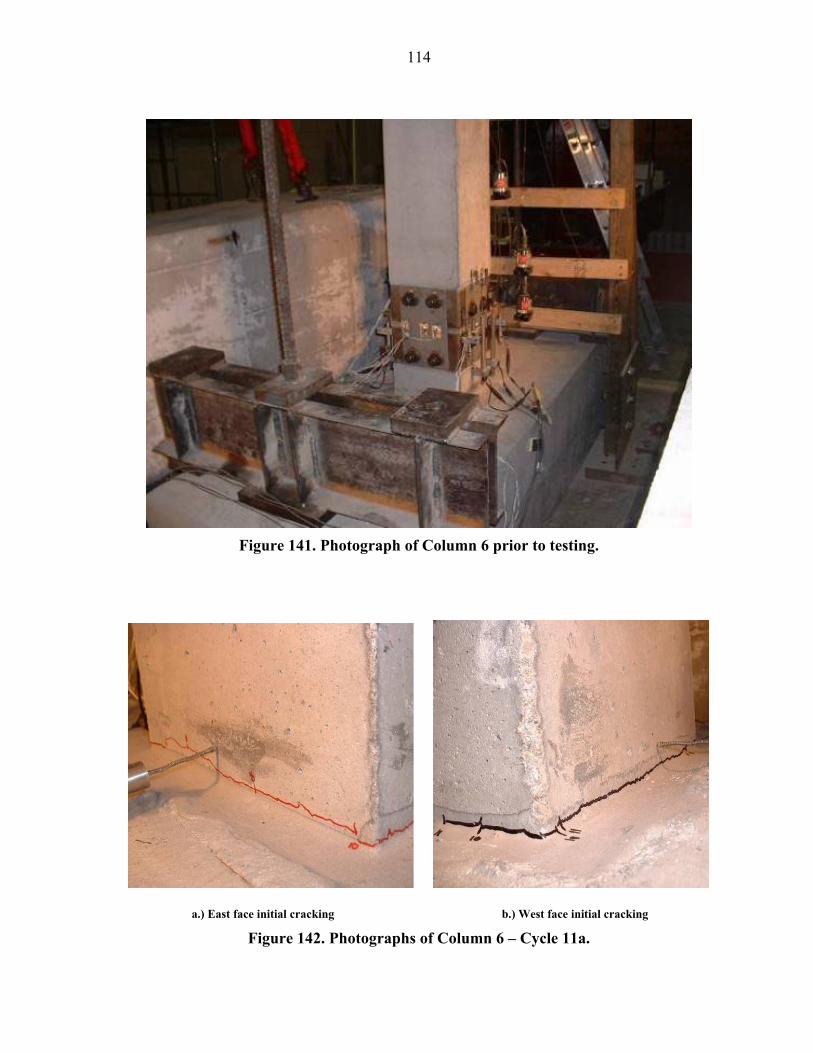
114
Figure 141. Photograph of Column 6 prior to testing.
a.) East face initial cracking b.) West face initial cracking
Figure 142. Photographs of Column 6 – Cycle 11a.
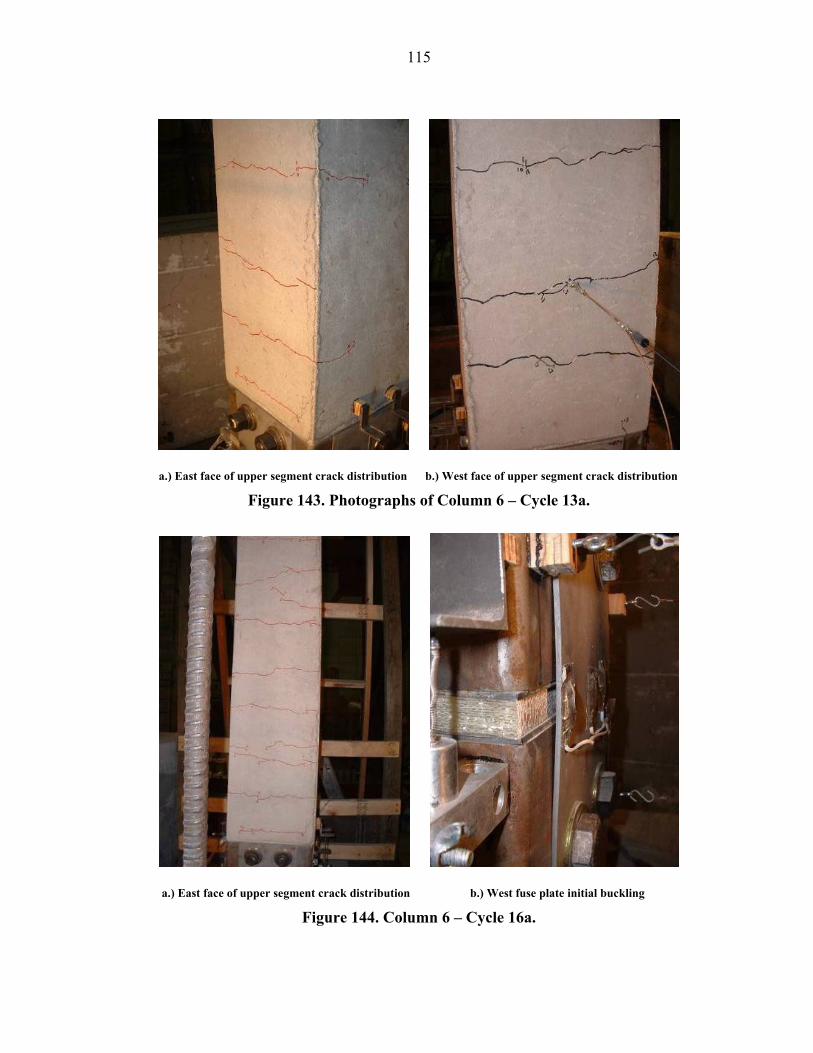
115
a.) East face of upper segment crack distribution b.) West face of upper segment crack distribution
Figure 143. Photographs of Column 6 – Cycle 13a.
a.) East face of upper segment crack distribution b.) West fuse plate initial buckling
Figure 144. Column 6 – Cycle 16a.
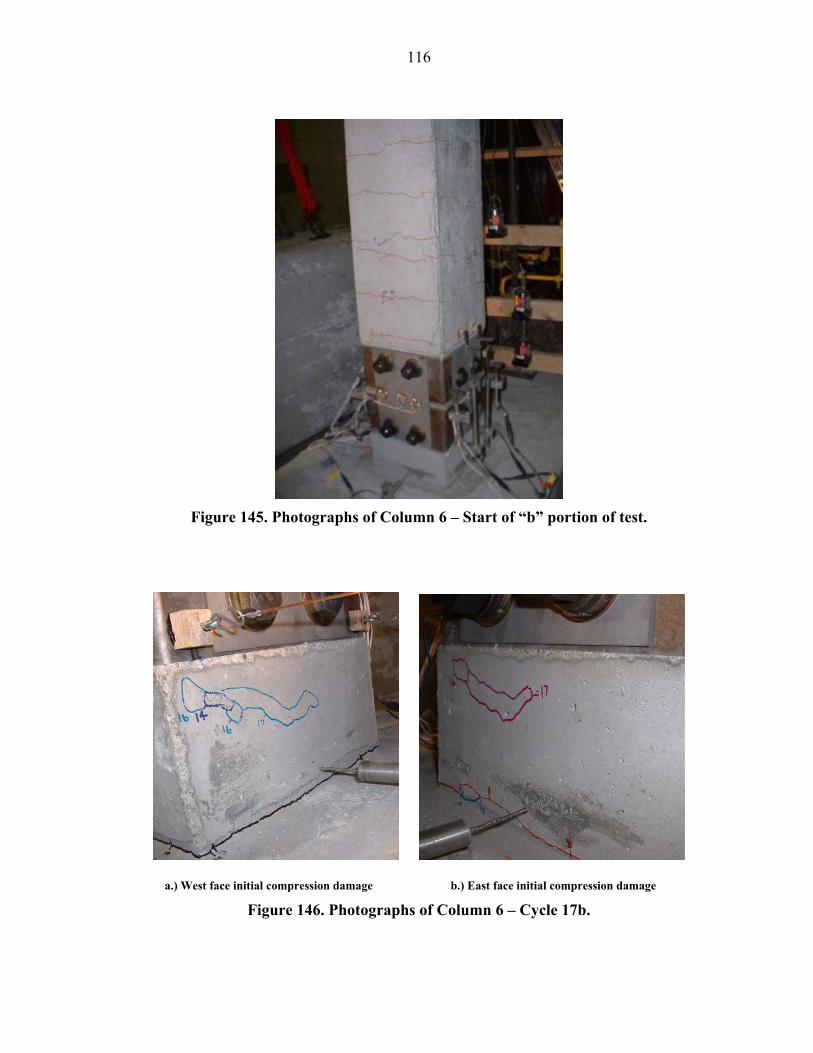
116
Figure 145. Photographs of Column 6 – Start of “b” portion of test.
a.) West face initial compression damage b.) East face initial compression damage
Figure 146. Photographs of Column 6 – Cycle 17b.
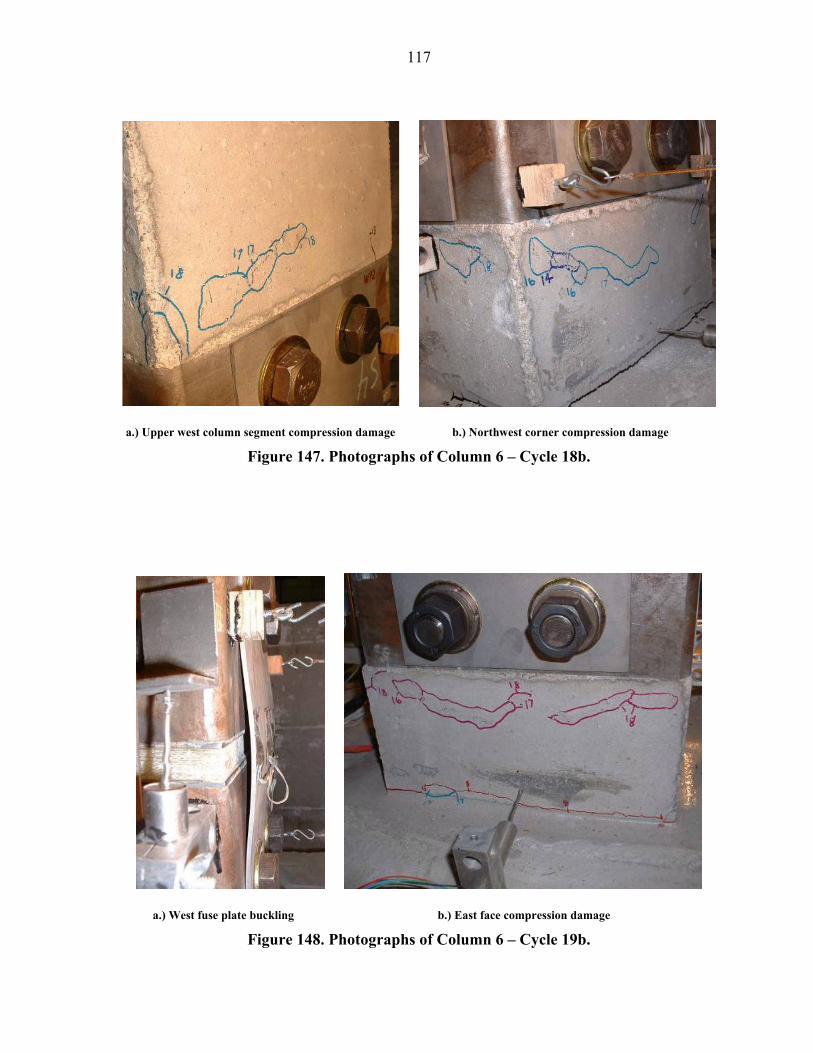
117
a.) Upper west column segment compression damage b.) Northwest corner compression damage
Figure 147. Photographs of Column 6 – Cycle 18b.
a.) West fuse plate buckling b.) East face compression damage
Figure 148. Photographs of Column 6 – Cycle 19b.
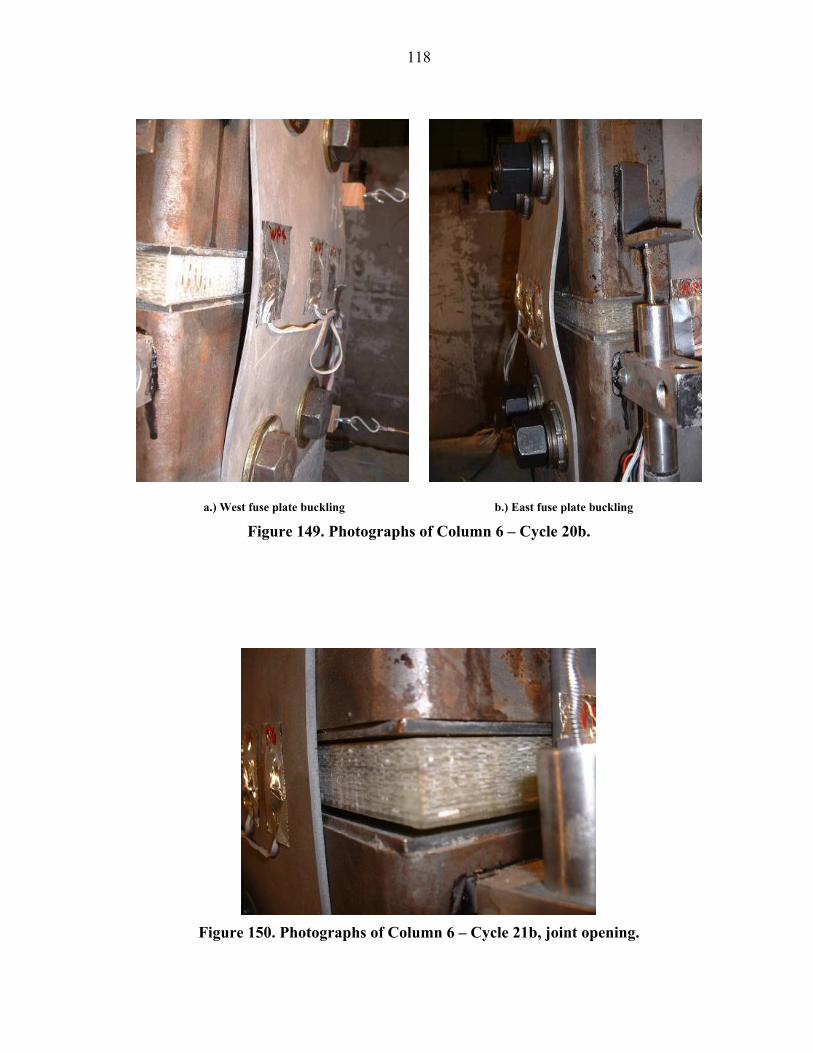
118
a.) West fuse plate buckling b.) East fuse plate buckling
Figure 149. Photographs of Column 6 – Cycle 20b.
Figure 150. Photographs of Column 6 – Cycle 21b, joint opening.
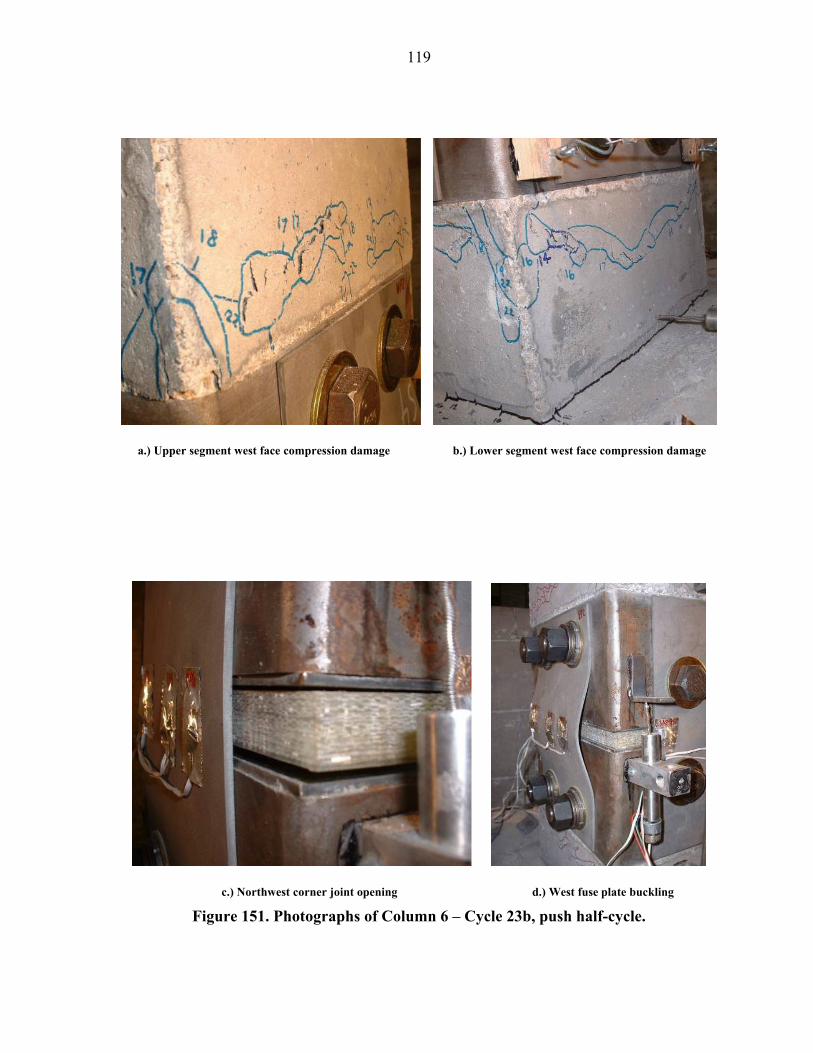
119
a.) Upper segment west face compression damage b.) Lower segment west face compression damage
c.) Northwest corner joint opening d.) West fuse plate buckling
Figure 151. Photographs of Column 6 – Cycle 23b, push half-cycle.
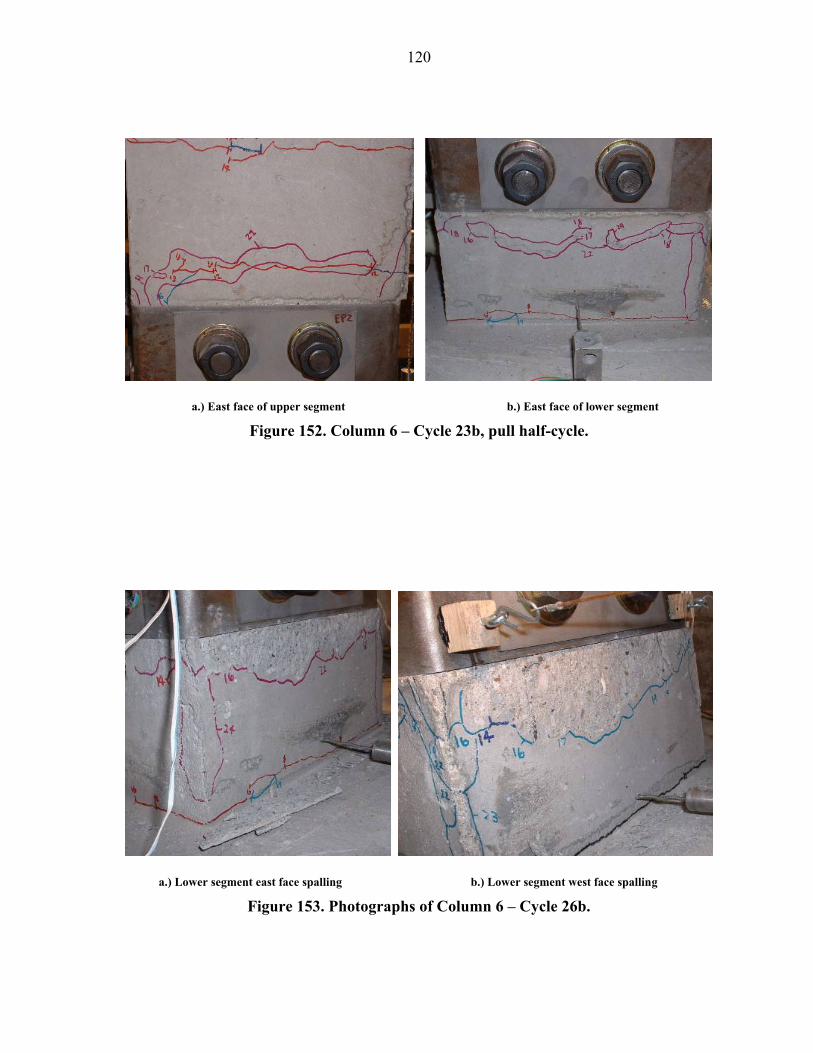
120
a.) East face of upper segment b.) East face of lower segment
Figure 152. Column 6 – Cycle 23b, pull half-cycle.
a.) Lower segment east face spalling b.) Lower segment west face spalling
Figure 153. Photographs of Column 6 – Cycle 26b.
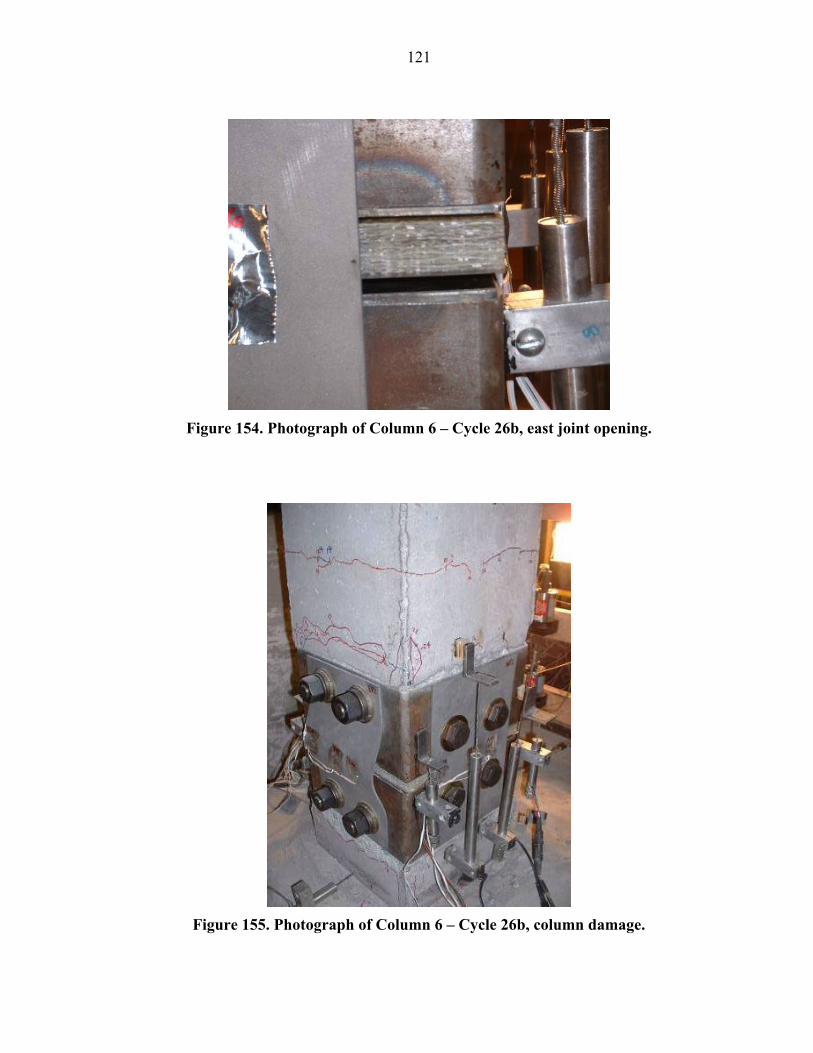
121
Figure 154. Photograph of Column 6 – Cycle 26b, east joint opening.
Figure 155. Photograph of Column 6 – Cycle 26b, column damage.
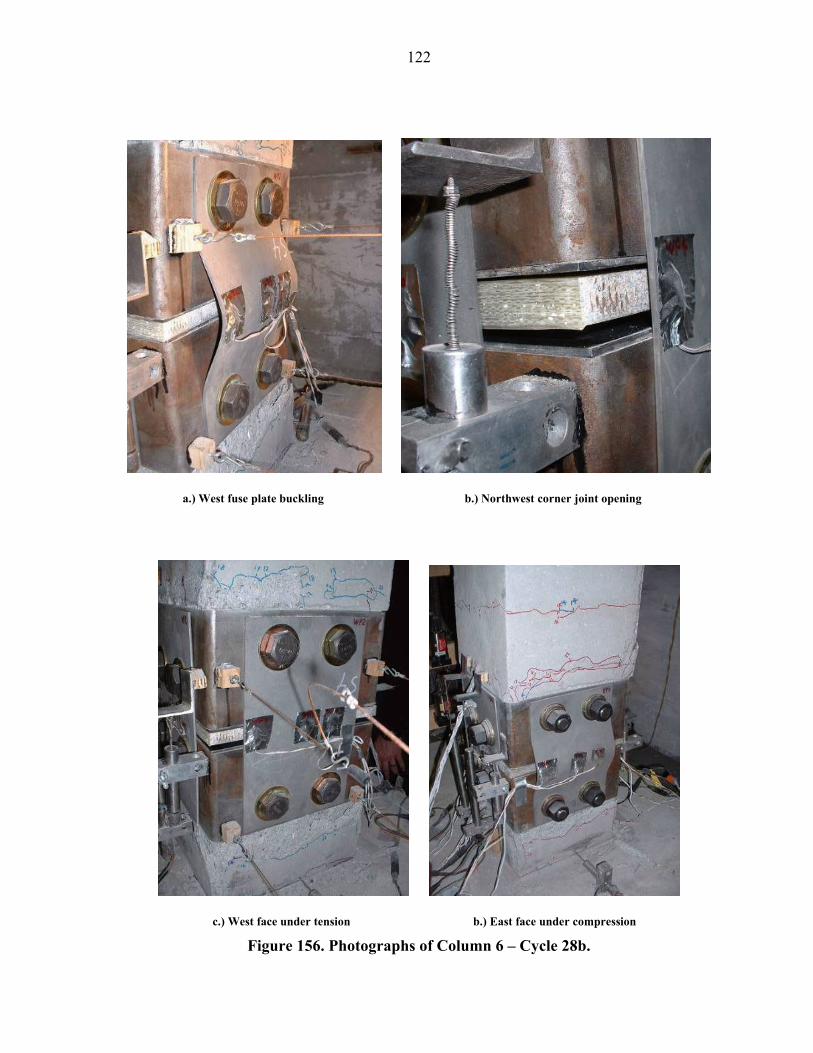
122
a.) West fuse plate buckling b.) Northwest corner joint opening
c.) West face under tension b.) East face under compression
Figure 156. Photographs of Column 6 – Cycle 28b.
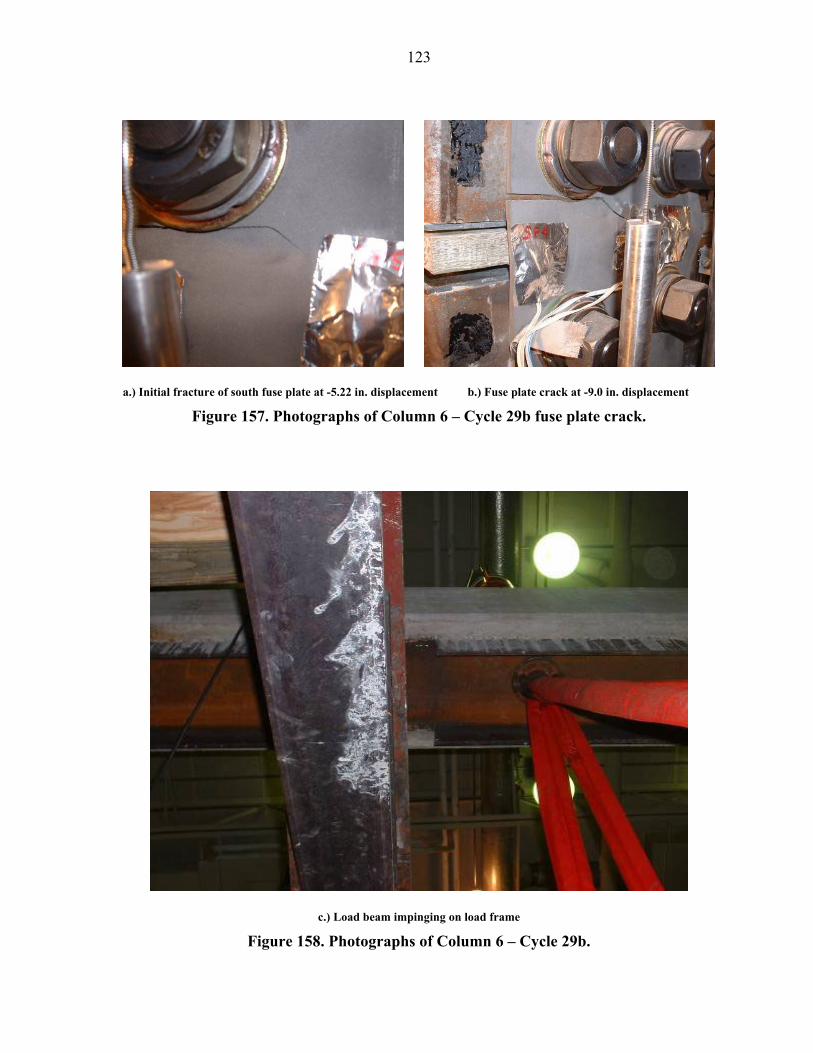
123
a.) Initial fracture of south fuse plate at -5.22 in. displacement b.) Fuse plate crack at -9.0 in. displacement
Figure 157. Photographs of Column 6 – Cycle 29b fuse plate crack.
c.) Load beam impinging on load frame
Figure 158. Photographs of Column 6 – Cycle 29b.
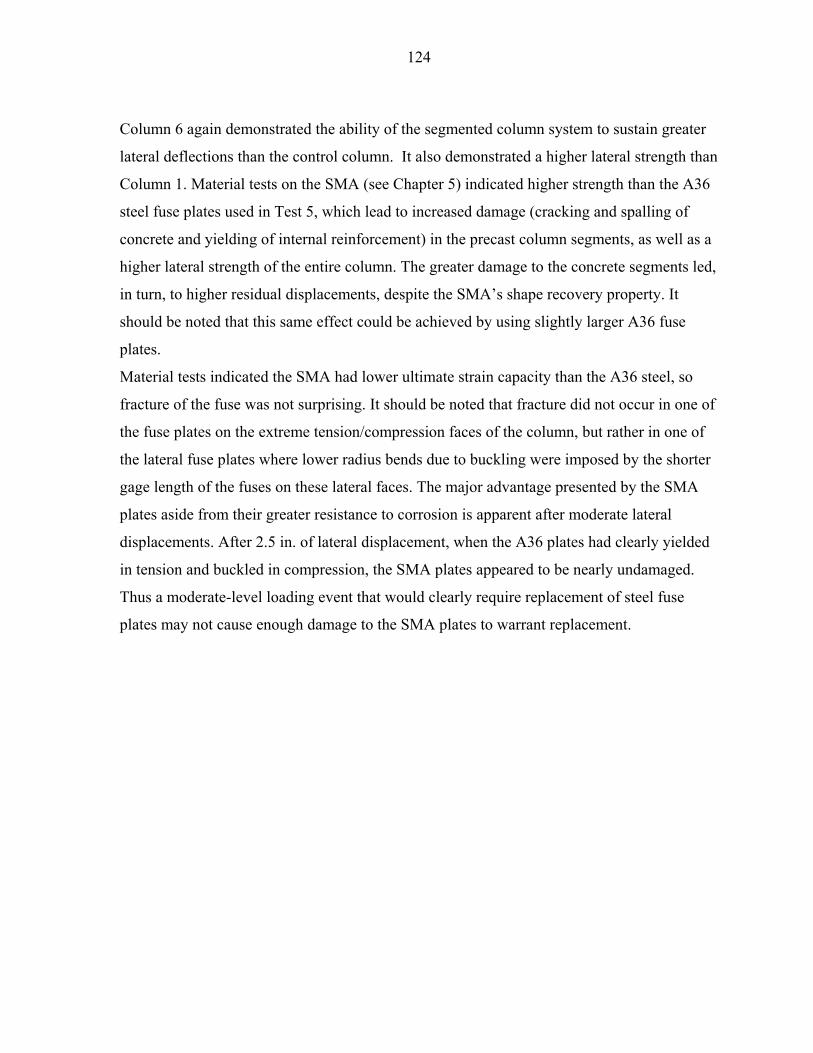
124
Column 6 again demonstrated the ability of the segmented column system to sustain greater
lateral deflections than the control column. It also demonstrated a higher lateral strength than
Column 1. Material tests on the SMA (see Chapter 5) indicated higher strength than the A36
steel fuse plates used in Test 5, which lead to increased damage (cracking and spalling of
concrete and yielding of internal reinforcement) in the precast column segments, as well as a
higher lateral strength of the entire column. The greater damage to the concrete segments led,
in turn, to higher residual displacements, despite the SMA’s shape recovery property. It
should be noted that this same effect could be achieved by using slightly larger A36 fuse
plates.
Material tests indicated the SMA had lower ultimate strain capacity than the A36 steel, so
fracture of the fuse was not surprising. It should be noted that fracture did not occur in one of
the fuse plates on the extreme tension/compression faces of the column, but rather in one of
the lateral fuse plates where lower radius bends due to buckling were imposed by the shorter
gage length of the fuses on these lateral faces. The major advantage presented by the SMA
plates aside from their greater resistance to corrosion is apparent after moderate lateral
displacements. After 2.5 in. of lateral displacement, when the A36 plates had clearly yielded
in tension and buckled in compression, the SMA plates appeared to be nearly undamaged.
Thus a moderate-level loading event that would clearly require replacement of steel fuse
plates may not cause enough damage to the SMA plates to warrant replacement.
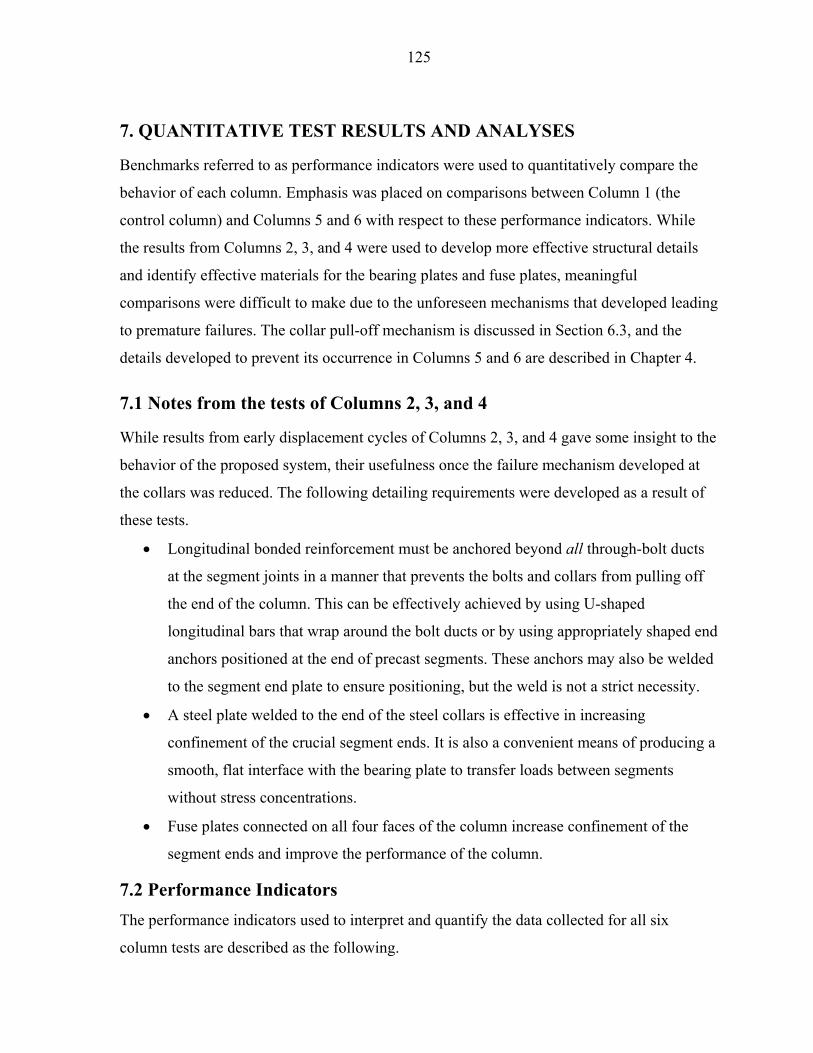
125
7. QUANTITATIVE TEST RESULTS AND ANALYSES
Benchmarks referred to as performance indicators were used to quantitatively compare the
behavior of each column. Emphasis was placed on comparisons between Column 1 (the
control column) and Columns 5 and 6 with respect to these performance indicators. While
the results from Columns 2, 3, and 4 were used to develop more effective structural details
and identify effective materials for the bearing plates and fuse plates, meaningful
comparisons were difficult to make due to the unforeseen mechanisms that developed leading
to premature failures. The collar pull-off mechanism is discussed in Section 6.3, and the
details developed to prevent its occurrence in Columns 5 and 6 are described in Chapter 4.
7.1 Notes from the tests of Columns 2, 3, and 4
While results from early displacement cycles of Columns 2, 3, and 4 gave some insight to the
behavior of the proposed system, their usefulness once the failure mechanism developed at
the collars was reduced. The following detailing requirements were developed as a result of
these tests.
• Longitudinal bonded reinforcement must be anchored beyond all through-bolt ducts
at the segment joints in a manner that prevents the bolts and collars from pulling off
the end of the column. This can be effectively achieved by using U-shaped
longitudinal bars that wrap around the bolt ducts or by using appropriately shaped end
anchors positioned at the end of precast segments. These anchors may also be welded
to the segment end plate to ensure positioning, but the weld is not a strict necessity.
• A steel plate welded to the end of the steel collars is effective in increasing
confinement of the crucial segment ends. It is also a convenient means of producing a
smooth, flat interface with the bearing plate to transfer loads between segments
without stress concentrations.
• Fuse plates connected on all four faces of the column increase confinement of the
segment ends and improve the performance of the column.
7.2 Performance Indicators The performance indicators used to interpret and quantify the data collected for all six
column tests are described as the following.
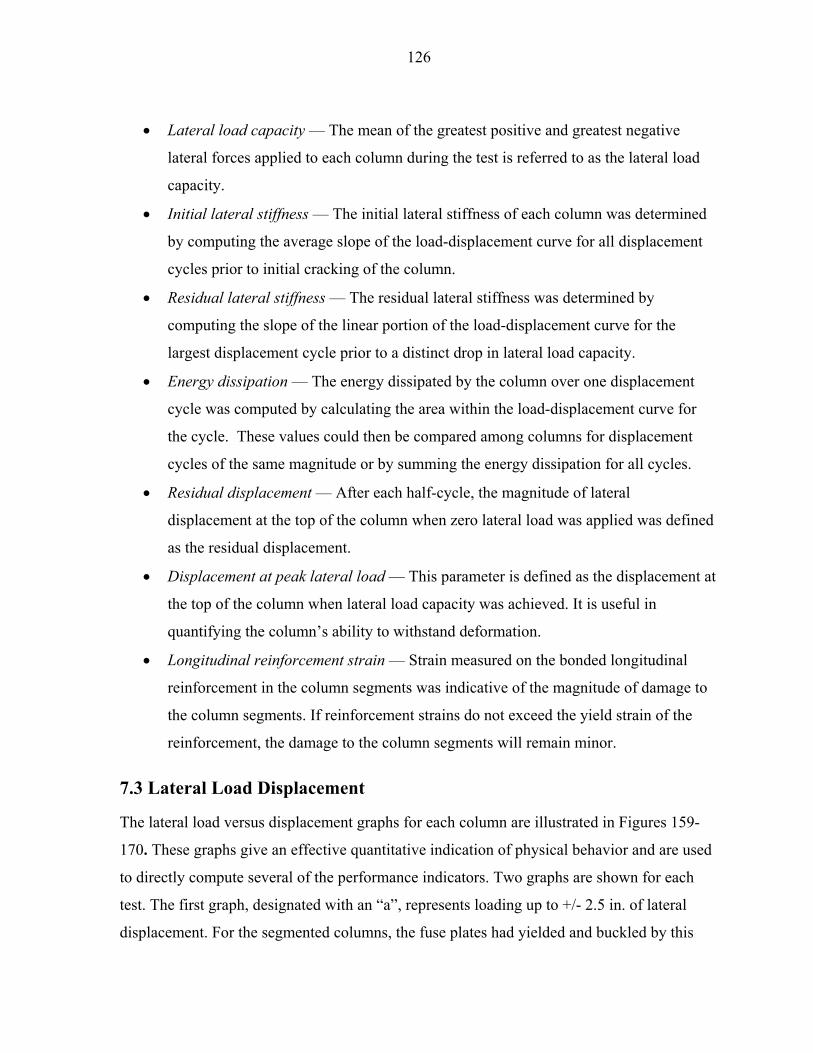
126
• Lateral load capacity — The mean of the greatest positive and greatest negative
lateral forces applied to each column during the test is referred to as the lateral load
capacity.
• Initial lateral stiffness — The initial lateral stiffness of each column was determined
by computing the average slope of the load-displacement curve for all displacement
cycles prior to initial cracking of the column.
• Residual lateral stiffness — The residual lateral stiffness was determined by
computing the slope of the linear portion of the load-displacement curve for the
largest displacement cycle prior to a distinct drop in lateral load capacity.
• Energy dissipation — The energy dissipated by the column over one displacement
cycle was computed by calculating the area within the load-displacement curve for
the cycle. These values could then be compared among columns for displacement
cycles of the same magnitude or by summing the energy dissipation for all cycles.
• Residual displacement — After each half-cycle, the magnitude of lateral
displacement at the top of the column when zero lateral load was applied was defined
as the residual displacement.
• Displacement at peak lateral load — This parameter is defined as the displacement at
the top of the column when lateral load capacity was achieved. It is useful in
quantifying the column’s ability to withstand deformation.
• Longitudinal reinforcement strain — Strain measured on the bonded longitudinal
reinforcement in the column segments was indicative of the magnitude of damage to
the column segments. If reinforcement strains do not exceed the yield strain of the
reinforcement, the damage to the column segments will remain minor.
7.3 Lateral Load Displacement
The lateral load versus displacement graphs for each column are illustrated in Figures 159-
170. These graphs give an effective quantitative indication of physical behavior and are used
to directly compute several of the performance indicators. Two graphs are shown for each
test. The first graph, designated with an “a”, represents loading up to +/- 2.5 in. of lateral
displacement. For the segmented columns, the fuse plates had yielded and buckled by this
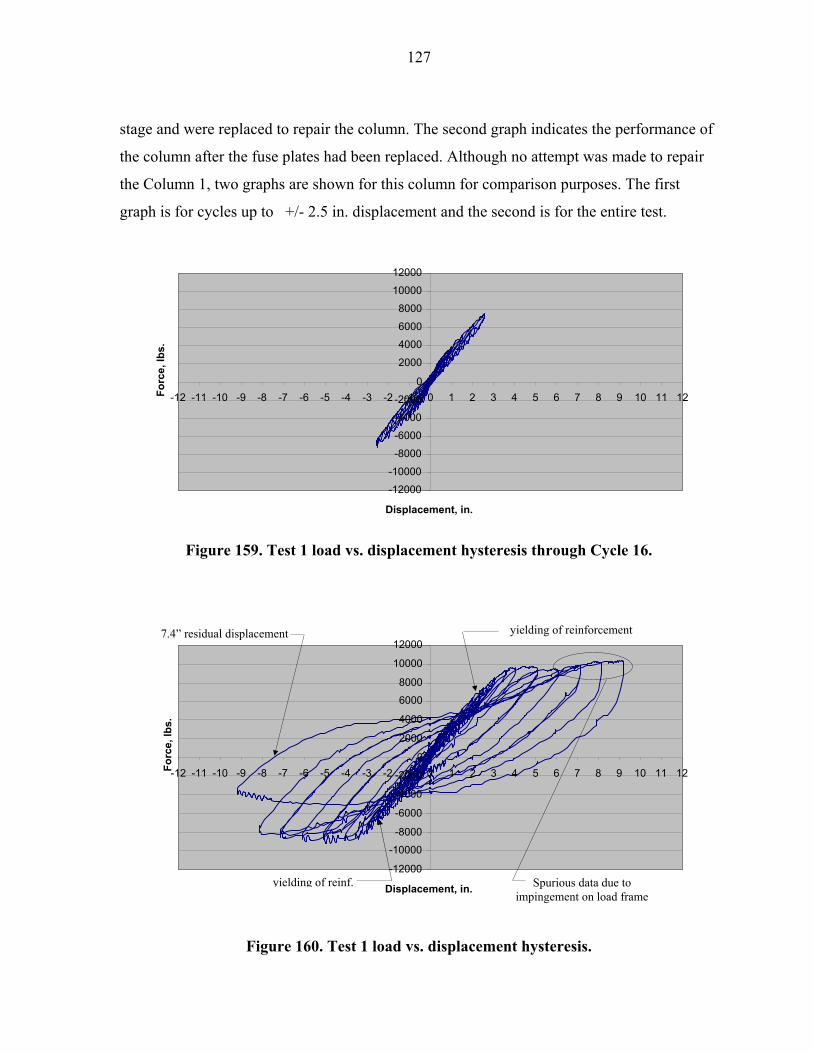
127
stage and were replaced to repair the column. The second graph indicates the performance of
the column after the fuse plates had been replaced. Although no attempt was made to repair
the Column 1, two graphs are shown for this column for comparison purposes. The first
graph is for cycles up to +/- 2.5 in. displacement and the second is for the entire test.
Figure 159. Test 1 load vs. displacement hysteresis through Cycle 16.
Figure 160. Test 1 load vs. displacement hysteresis.
-12000
-10000
-8000
-6000
-4000
-2000
0
2000
4000
6000
8000
10000
12000
-12 -11 -10 -9 -8 -7 -6 -5 -4 -3 -2 -1 0 1 2 3 4 5 6 7 8 9 10 11 12
Displacement, in.
Forc
e, lb
s.
yielding of reinf. Spurious data due to impingement on load frame
-12000
-10000
-8000
-6000
-4000
-2000
0
2000
4000
6000
8000
10000
12000
-12 -11 -10 -9 -8 -7 -6 -5 -4 -3 -2 -1 0 1 2 3 4 5 6 7 8 9 10 11 12
Displacement, in.
Forc
e, lb
s.
7.4” residual displacement yielding of reinforcement
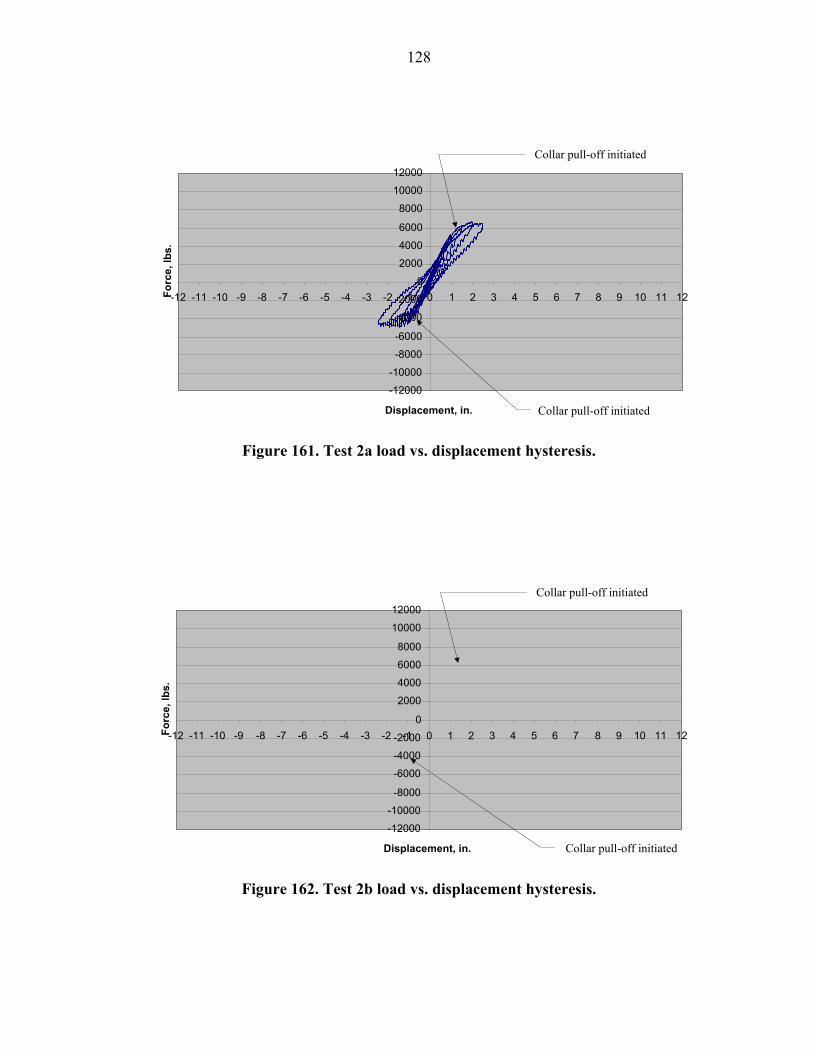
128
Figure 161. Test 2a load vs. displacement hysteresis.
Figure 162. Test 2b load vs. displacement hysteresis.
-12000
-10000
-8000
-6000
-4000
-2000
0
2000
4000
6000
8000
10000
12000
-12 -11 -10 -9 -8 -7 -6 -5 -4 -3 -2 -1 0 1 2 3 4 5 6 7 8 9 10 11 12
Displacement, in.
Forc
e, lb
s.
Collar pull-off initiated
Collar pull-off initiated
-12000
-10000
-8000
-6000
-4000
-2000
0
2000
4000
6000
8000
10000
12000
-12 -11 -10 -9 -8 -7 -6 -5 -4 -3 -2 -1 0 1 2 3 4 5 6 7 8 9 10 11 12
Displacement, in.
Forc
e, lb
s.
Collar pull-off initiated
Collar pull-off initiated
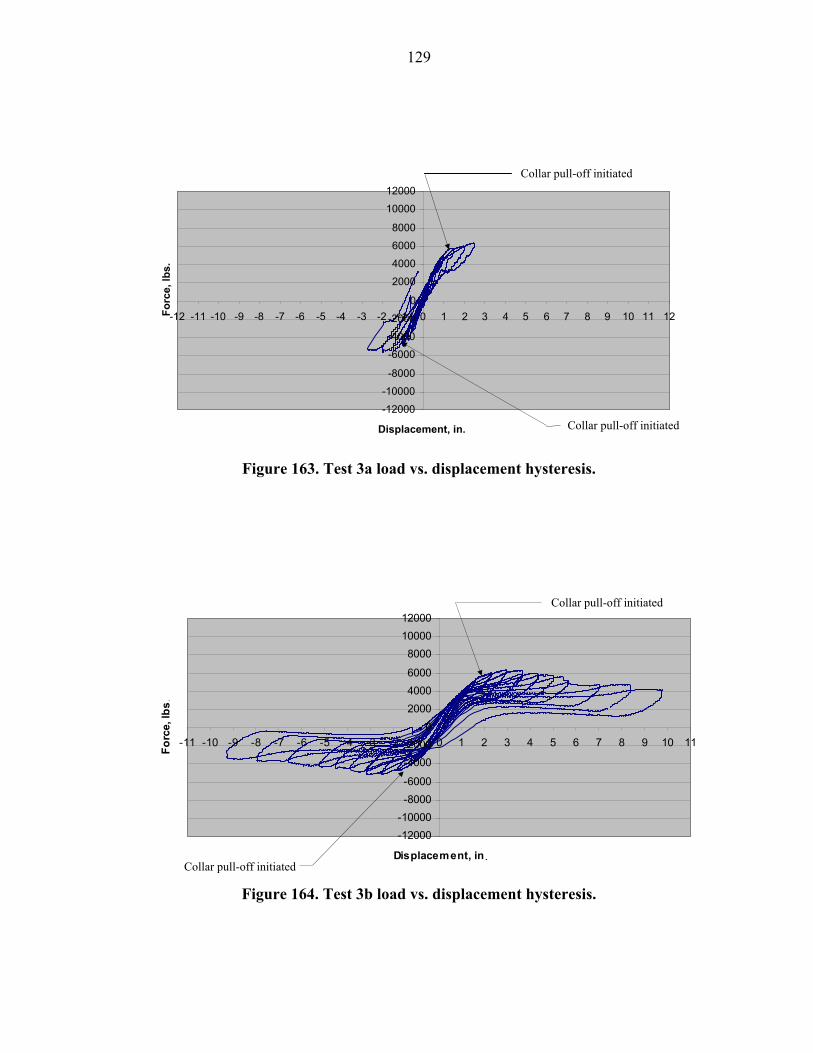
129
Figure 163. Test 3a load vs. displacement hysteresis.
Figure 164. Test 3b load vs. displacement hysteresis.
-12000
-10000
-8000
-6000
-4000
-2000
0
2000
4000
6000
8000
10000
12000
-12 -11 -10 -9 -8 -7 -6 -5 -4 -3 -2 -1 0 1 2 3 4 5 6 7 8 9 10 11 12
Displacement, in.
Forc
e, lb
s.
Collar pull-off initiated
Collar pull-off initiated
-12000-10000-8000-6000
-4000-2000
0200040006000
80001000012000
-11 -10 -9 -8 -7 -6 -5 -4 -3 -2 -1 0 1 2 3 4 5 6 7 8 9 10 11
Displacement, in
Forc
e, lb
s
Collar pull-off initiated
Collar pull-off initiated .
.
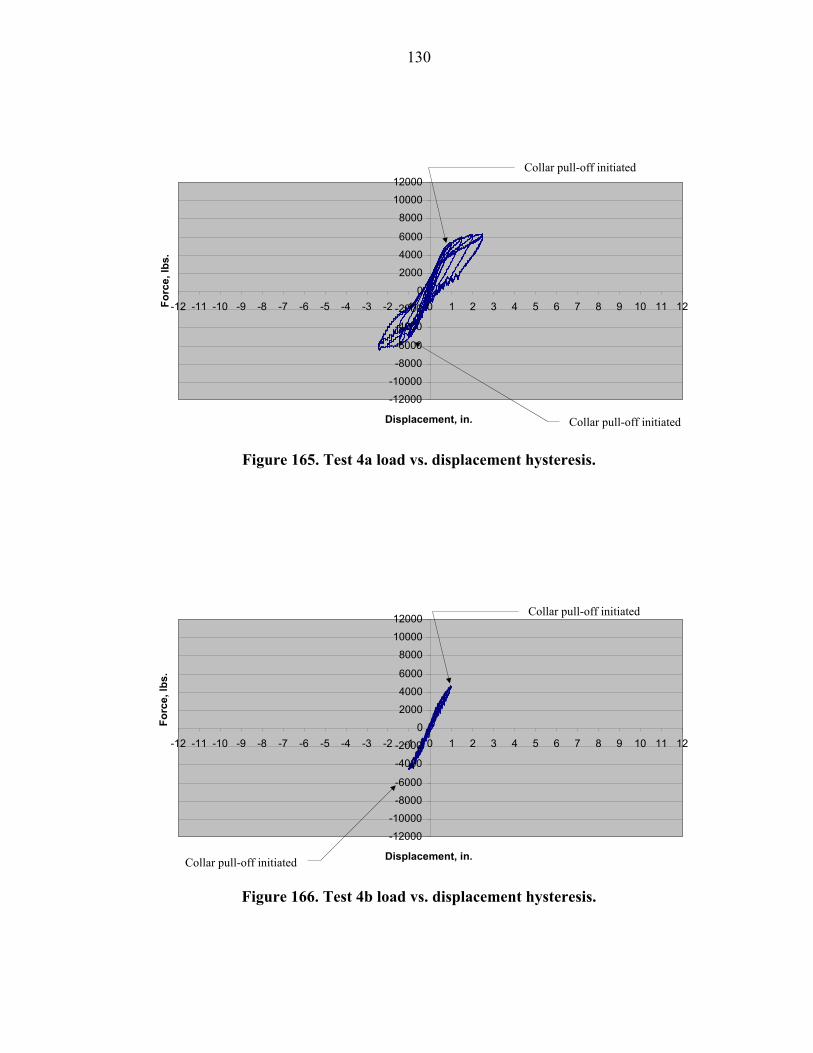
130
Figure 165. Test 4a load vs. displacement hysteresis.
Figure 166. Test 4b load vs. displacement hysteresis.
-12000
-10000
-8000
-6000
-4000
-2000
0
2000
4000
6000
8000
10000
12000
-12 -11 -10 -9 -8 -7 -6 -5 -4 -3 -2 -1 0 1 2 3 4 5 6 7 8 9 10 11 12
Displacement, in.
Forc
e, lb
s.
Collar pull-off initiated
Collar pull-off initiated
-12000
-10000
-8000
-6000
-4000
-2000
0
2000
4000
6000
8000
10000
12000
-12 -11 -10 -9 -8 -7 -6 -5 -4 -3 -2 -1 0 1 2 3 4 5 6 7 8 9 10 11 12
Displacement, in.
Forc
e, lb
s.
Collar pull-off initiated
Collar pull-off initiated
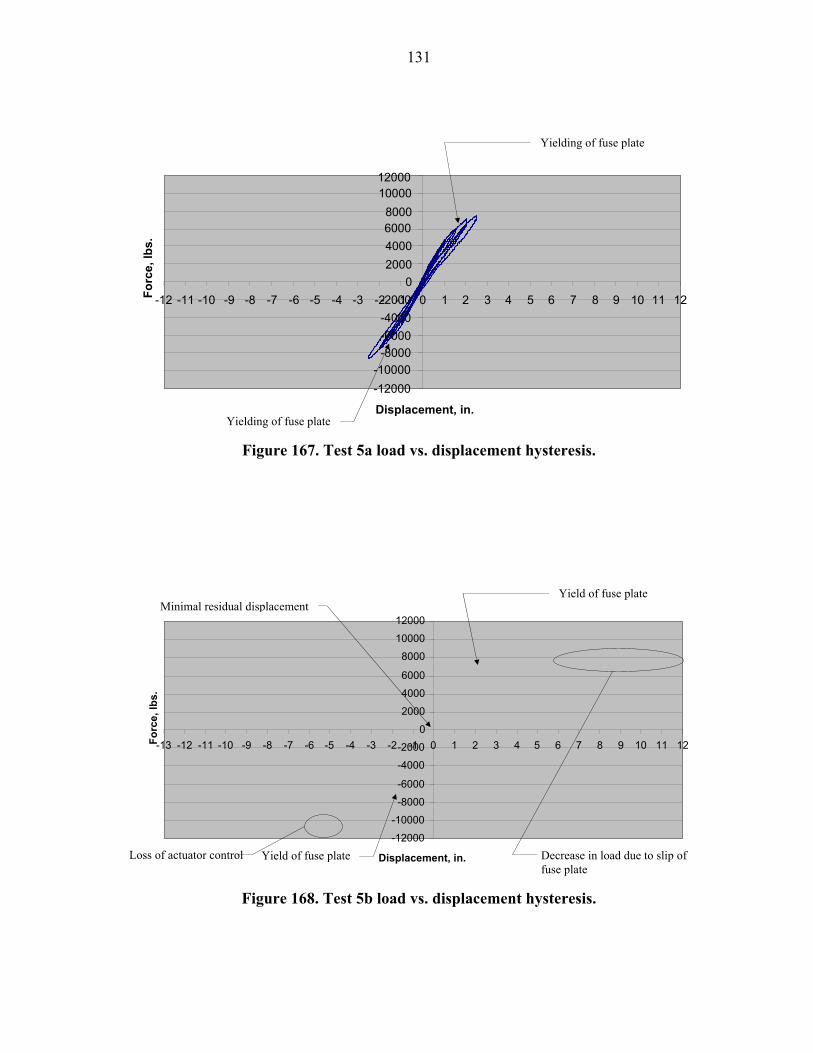
131
Figure 167. Test 5a load vs. displacement hysteresis.
Figure 168. Test 5b load vs. displacement hysteresis.
-12000
-10000
-8000
-6000
-4000
-2000
0
2000
4000
6000
8000
10000
12000
-13 -12 -11 -10 -9 -8 -7 -6 -5 -4 -3 -2 -1 0 1 2 3 4 5 6 7 8 9 10 11 12
Displacement, in.
Forc
e, lb
s.
Yield of fuse plate
Yield of fuse plate Minimal residual displacement
Forc
e, lb
s.
-12000-10000
-8000-6000-4000-2000
02000400060008000
1000012000
-12 -11 -10 -9 -8 -7 -6 -5 -4 -3 -2 -1 0 1 2 3 4 5 6 7 8 9 10 11 12
Displacement, in.
Yielding of fuse plate
Decrease in load due to slip of fuse plate
Loss of actuator control
Yielding of fuse plate
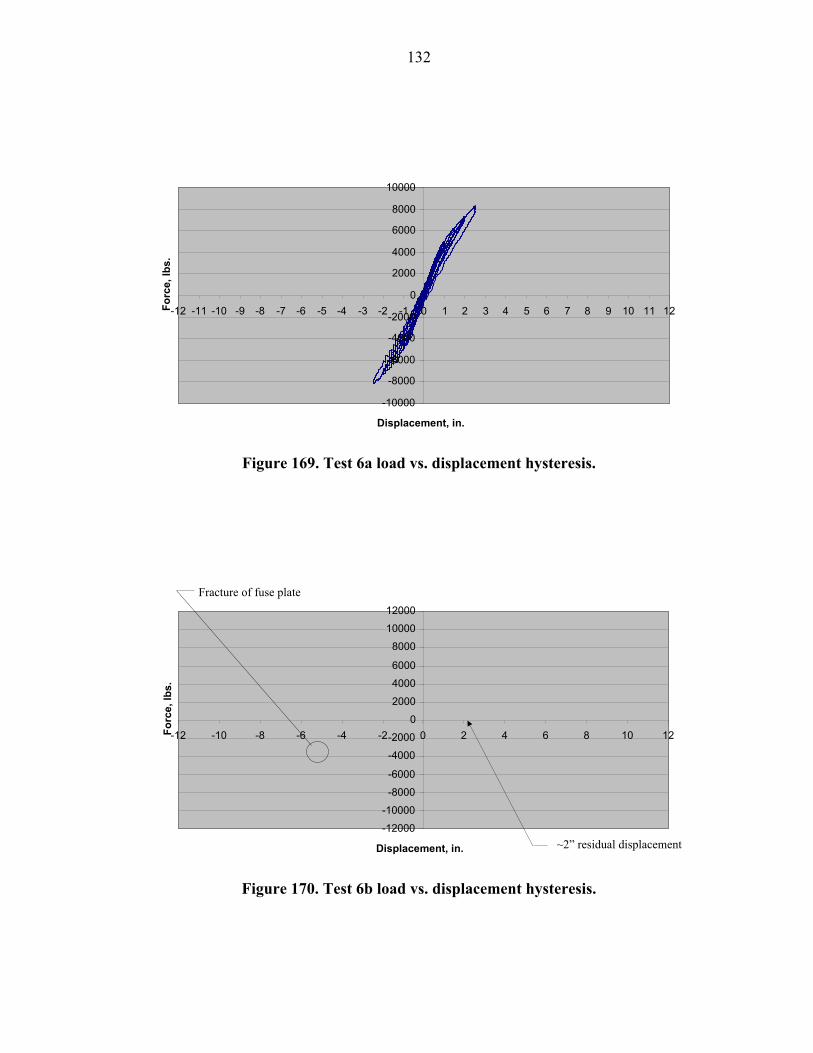
132
Figure 169. Test 6a load vs. displacement hysteresis.
Figure 170. Test 6b load vs. displacement hysteresis.
-12000
-10000
-8000
-6000
-4000
-2000
0
2000
4000
6000
8000
10000
12000
-12 -10 -8 -6 -4 -2 0 2 4 6 8 10 12
Displacement, in.
Forc
e, lb
s.
Fracture of fuse plate
~2” residual displacement
Displacement, in.
-10000
-8000
-6000
-4000
-2000
0
2000
4000
6000
8000
10000
-12 -11 -10 -9 -8 -7 -6 -5 -4 -3 -2 -1 0 1 2 3 4 5 6 7 8 9 10 11 12Forc
e, lb
s.
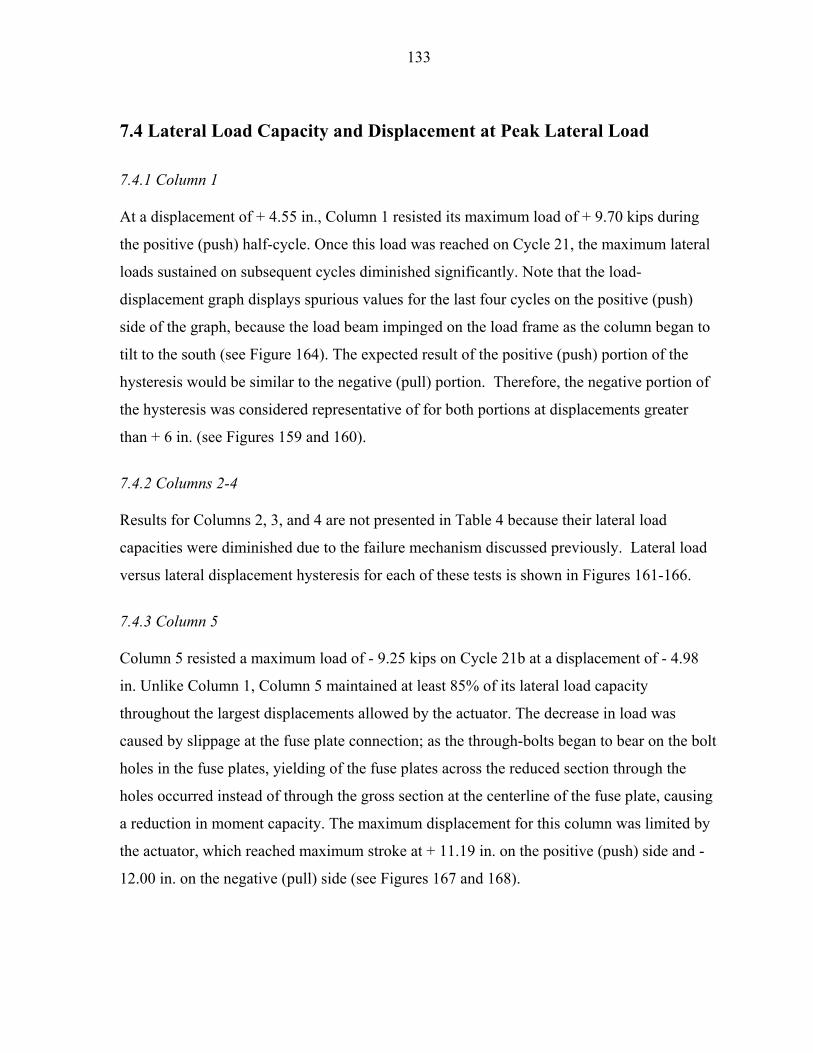
133
7.4 Lateral Load Capacity and Displacement at Peak Lateral Load
7.4.1 Column 1
At a displacement of + 4.55 in., Column 1 resisted its maximum load of + 9.70 kips during
the positive (push) half-cycle. Once this load was reached on Cycle 21, the maximum lateral
loads sustained on subsequent cycles diminished significantly. Note that the load-
displacement graph displays spurious values for the last four cycles on the positive (push)
side of the graph, because the load beam impinged on the load frame as the column began to
tilt to the south (see Figure 164). The expected result of the positive (push) portion of the
hysteresis would be similar to the negative (pull) portion. Therefore, the negative portion of
the hysteresis was considered representative of for both portions at displacements greater
than + 6 in. (see Figures 159 and 160).
7.4.2 Columns 2-4
Results for Columns 2, 3, and 4 are not presented in Table 4 because their lateral load
capacities were diminished due to the failure mechanism discussed previously. Lateral load
versus lateral displacement hysteresis for each of these tests is shown in Figures 161-166.
7.4.3 Column 5
Column 5 resisted a maximum load of - 9.25 kips on Cycle 21b at a displacement of - 4.98
in. Unlike Column 1, Column 5 maintained at least 85% of its lateral load capacity
throughout the largest displacements allowed by the actuator. The decrease in load was
caused by slippage at the fuse plate connection; as the through-bolts began to bear on the bolt
holes in the fuse plates, yielding of the fuse plates across the reduced section through the
holes occurred instead of through the gross section at the centerline of the fuse plate, causing
a reduction in moment capacity. The maximum displacement for this column was limited by
the actuator, which reached maximum stroke at + 11.19 in. on the positive (push) side and -
12.00 in. on the negative (pull) side (see Figures 167 and 168).
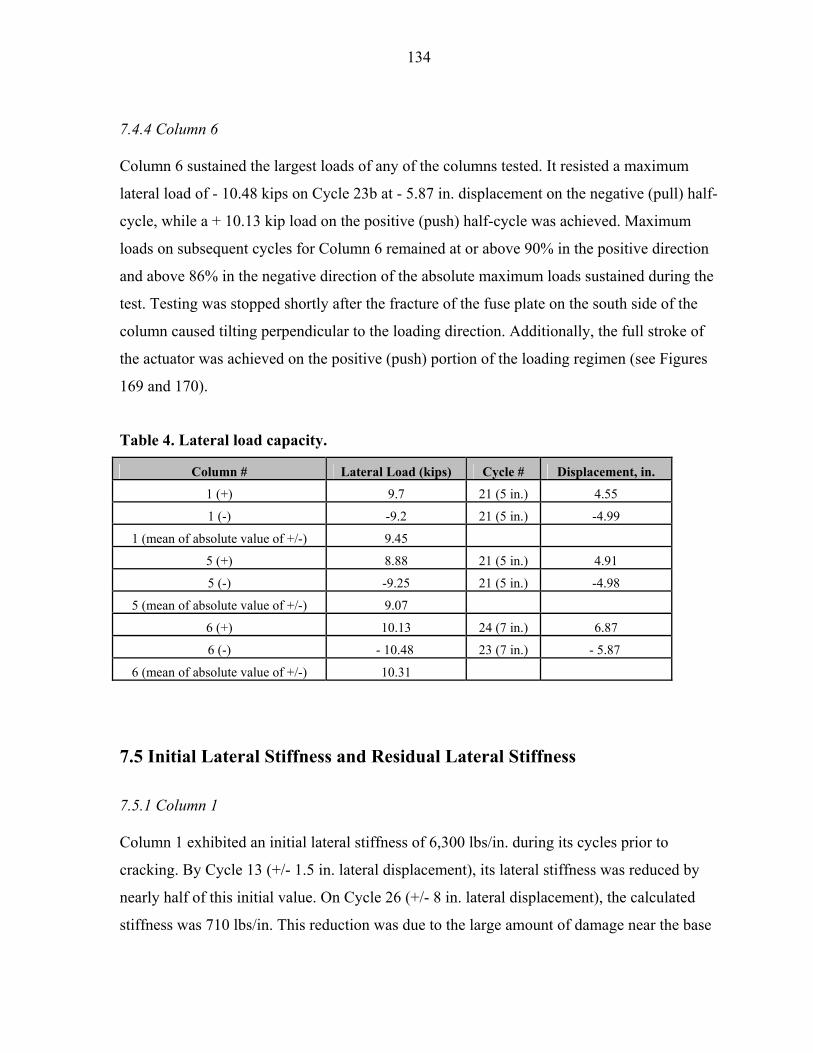
134
7.4.4 Column 6
Column 6 sustained the largest loads of any of the columns tested. It resisted a maximum
lateral load of - 10.48 kips on Cycle 23b at - 5.87 in. displacement on the negative (pull) half-
cycle, while a + 10.13 kip load on the positive (push) half-cycle was achieved. Maximum
loads on subsequent cycles for Column 6 remained at or above 90% in the positive direction
and above 86% in the negative direction of the absolute maximum loads sustained during the
test. Testing was stopped shortly after the fracture of the fuse plate on the south side of the
column caused tilting perpendicular to the loading direction. Additionally, the full stroke of
the actuator was achieved on the positive (push) portion of the loading regimen (see Figures
169 and 170).
Table 4. Lateral load capacity.
Column # Lateral Load (kips) Cycle # Displacement, in.
1 (+) 9.7 21 (5 in.) 4.55
1 (-) -9.2 21 (5 in.) -4.99
1 (mean of absolute value of +/-) 9.45
5 (+) 8.88 21 (5 in.) 4.91
5 (-) -9.25 21 (5 in.) -4.98
5 (mean of absolute value of +/-) 9.07
6 (+) 10.13 24 (7 in.) 6.87
6 (-) - 10.48 23 (7 in.) - 5.87
6 (mean of absolute value of +/-) 10.31
7.5 Initial Lateral Stiffness and Residual Lateral Stiffness
7.5.1 Column 1
Column 1 exhibited an initial lateral stiffness of 6,300 lbs/in. during its cycles prior to
cracking. By Cycle 13 (+/- 1.5 in. lateral displacement), its lateral stiffness was reduced by
nearly half of this initial value. On Cycle 26 (+/- 8 in. lateral displacement), the calculated
stiffness was 710 lbs/in. This reduction was due to the large amount of damage near the base
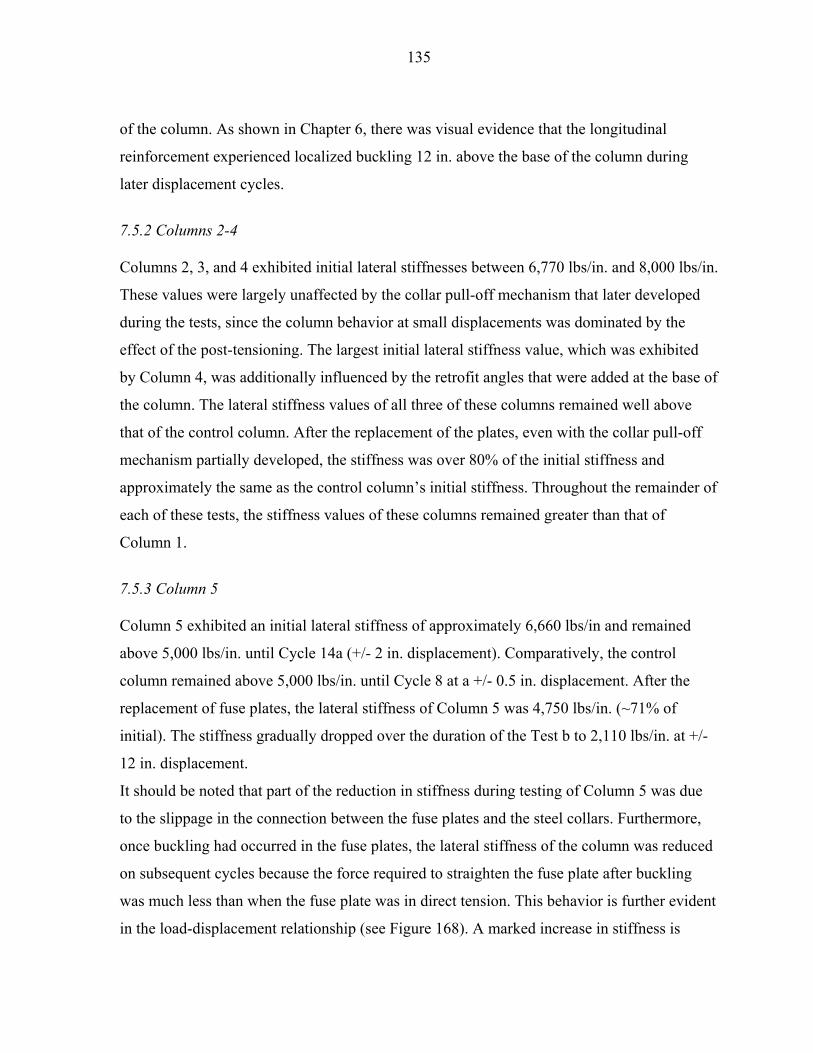
135
of the column. As shown in Chapter 6, there was visual evidence that the longitudinal
reinforcement experienced localized buckling 12 in. above the base of the column during
later displacement cycles.
7.5.2 Columns 2-4
Columns 2, 3, and 4 exhibited initial lateral stiffnesses between 6,770 lbs/in. and 8,000 lbs/in.
These values were largely unaffected by the collar pull-off mechanism that later developed
during the tests, since the column behavior at small displacements was dominated by the
effect of the post-tensioning. The largest initial lateral stiffness value, which was exhibited
by Column 4, was additionally influenced by the retrofit angles that were added at the base of
the column. The lateral stiffness values of all three of these columns remained well above
that of the control column. After the replacement of the plates, even with the collar pull-off
mechanism partially developed, the stiffness was over 80% of the initial stiffness and
approximately the same as the control column’s initial stiffness. Throughout the remainder of
each of these tests, the stiffness values of these columns remained greater than that of
Column 1.
7.5.3 Column 5
Column 5 exhibited an initial lateral stiffness of approximately 6,660 lbs/in and remained
above 5,000 lbs/in. until Cycle 14a (+/- 2 in. displacement). Comparatively, the control
column remained above 5,000 lbs/in. until Cycle 8 at a +/- 0.5 in. displacement. After the
replacement of fuse plates, the lateral stiffness of Column 5 was 4,750 lbs/in. (~71% of
initial). The stiffness gradually dropped over the duration of the Test b to 2,110 lbs/in. at +/-
12 in. displacement.
It should be noted that part of the reduction in stiffness during testing of Column 5 was due
to the slippage in the connection between the fuse plates and the steel collars. Furthermore,
once buckling had occurred in the fuse plates, the lateral stiffness of the column was reduced
on subsequent cycles because the force required to straighten the fuse plate after buckling
was much less than when the fuse plate was in direct tension. This behavior is further evident
in the load-displacement relationship (see Figure 168). A marked increase in stiffness is
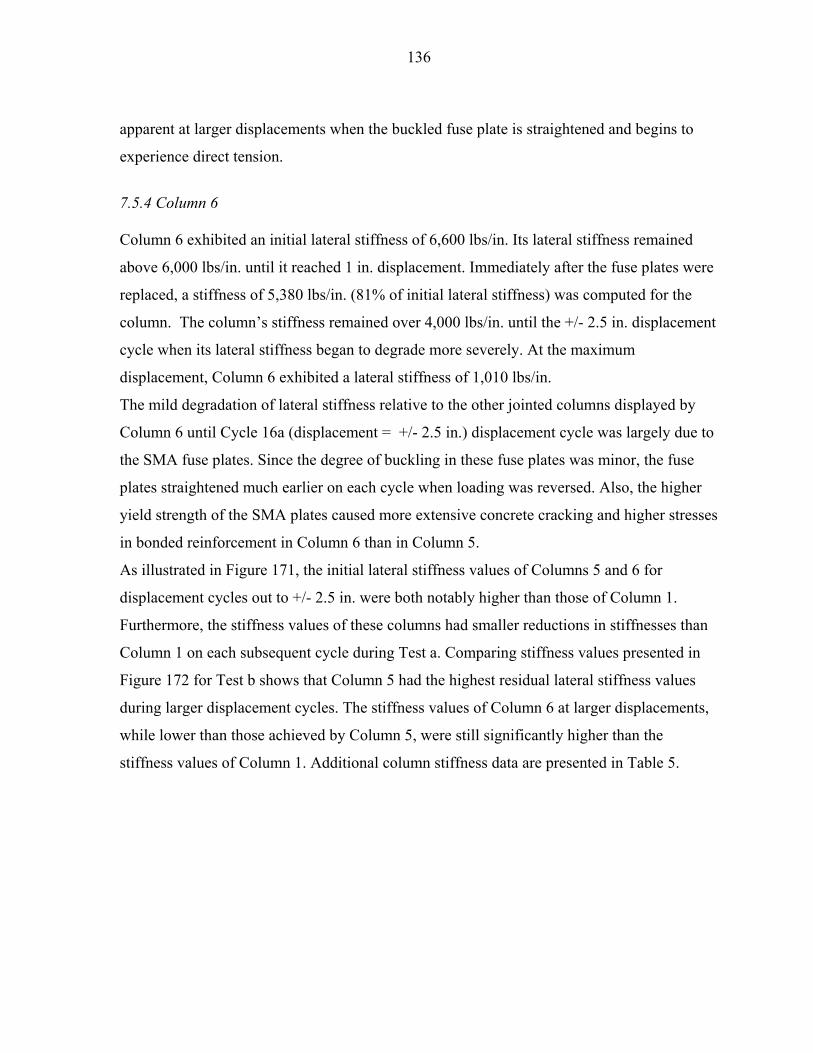
136
apparent at larger displacements when the buckled fuse plate is straightened and begins to
experience direct tension.
7.5.4 Column 6
Column 6 exhibited an initial lateral stiffness of 6,600 lbs/in. Its lateral stiffness remained
above 6,000 lbs/in. until it reached 1 in. displacement. Immediately after the fuse plates were
replaced, a stiffness of 5,380 lbs/in. (81% of initial lateral stiffness) was computed for the
column. The column’s stiffness remained over 4,000 lbs/in. until the +/- 2.5 in. displacement
cycle when its lateral stiffness began to degrade more severely. At the maximum
displacement, Column 6 exhibited a lateral stiffness of 1,010 lbs/in.
The mild degradation of lateral stiffness relative to the other jointed columns displayed by
Column 6 until Cycle 16a (displacement = +/- 2.5 in.) displacement cycle was largely due to
the SMA fuse plates. Since the degree of buckling in these fuse plates was minor, the fuse
plates straightened much earlier on each cycle when loading was reversed. Also, the higher
yield strength of the SMA plates caused more extensive concrete cracking and higher stresses
in bonded reinforcement in Column 6 than in Column 5.
As illustrated in Figure 171, the initial lateral stiffness values of Columns 5 and 6 for
displacement cycles out to +/- 2.5 in. were both notably higher than those of Column 1.
Furthermore, the stiffness values of these columns had smaller reductions in stiffnesses than
Column 1 on each subsequent cycle during Test a. Comparing stiffness values presented in
Figure 172 for Test b shows that Column 5 had the highest residual lateral stiffness values
during larger displacement cycles. The stiffness values of Column 6 at larger displacements,
while lower than those achieved by Column 5, were still significantly higher than the
stiffness values of Column 1. Additional column stiffness data are presented in Table 5.
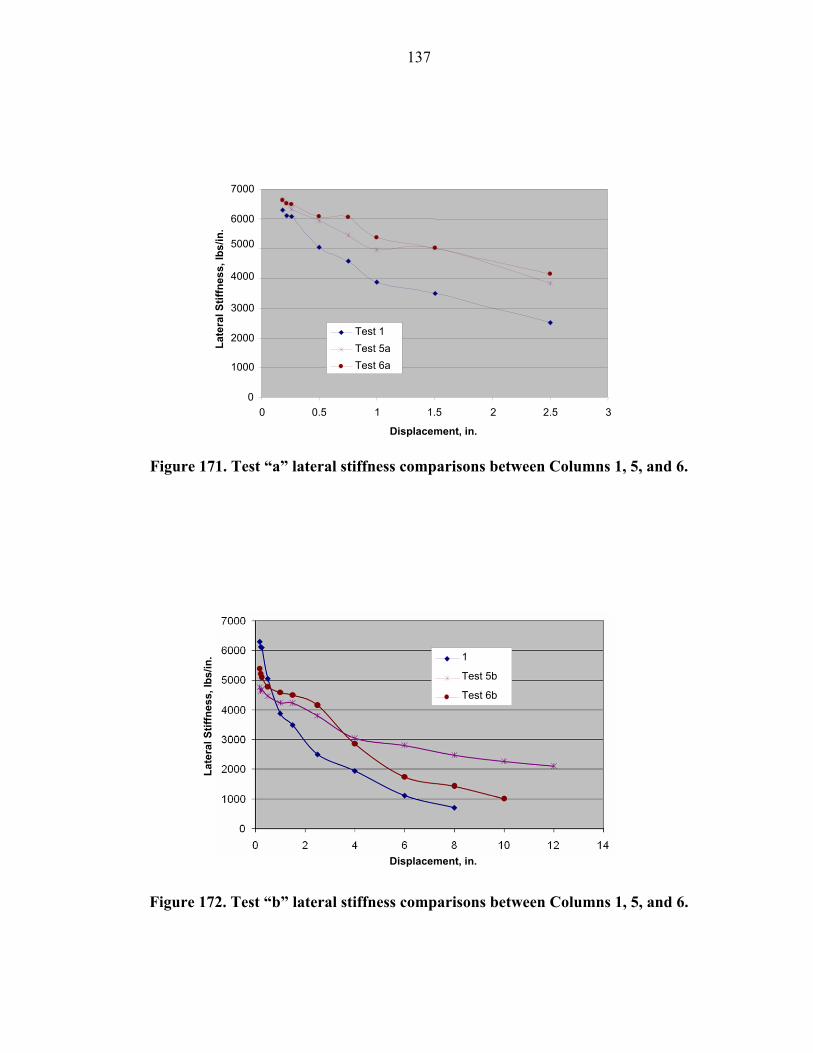
137
Figure 171. Test “a” lateral stiffness comparisons between Columns 1, 5, and 6.
Figure 172. Test “b” lateral stiffness comparisons between Columns 1, 5, and 6.
0
1000
2000
3000
4000
5000 6000
7000
0 0.5 1 1.5 2 2.5 3 Displacement, in.
Late
ral S
tiffn
ess,
lbs/
in.
Test 1Test 5aTest 6a
Late
ral S
tiffn
ess,
lbs/
in.
Displacement, in.
1
Test 5b
Test 6b
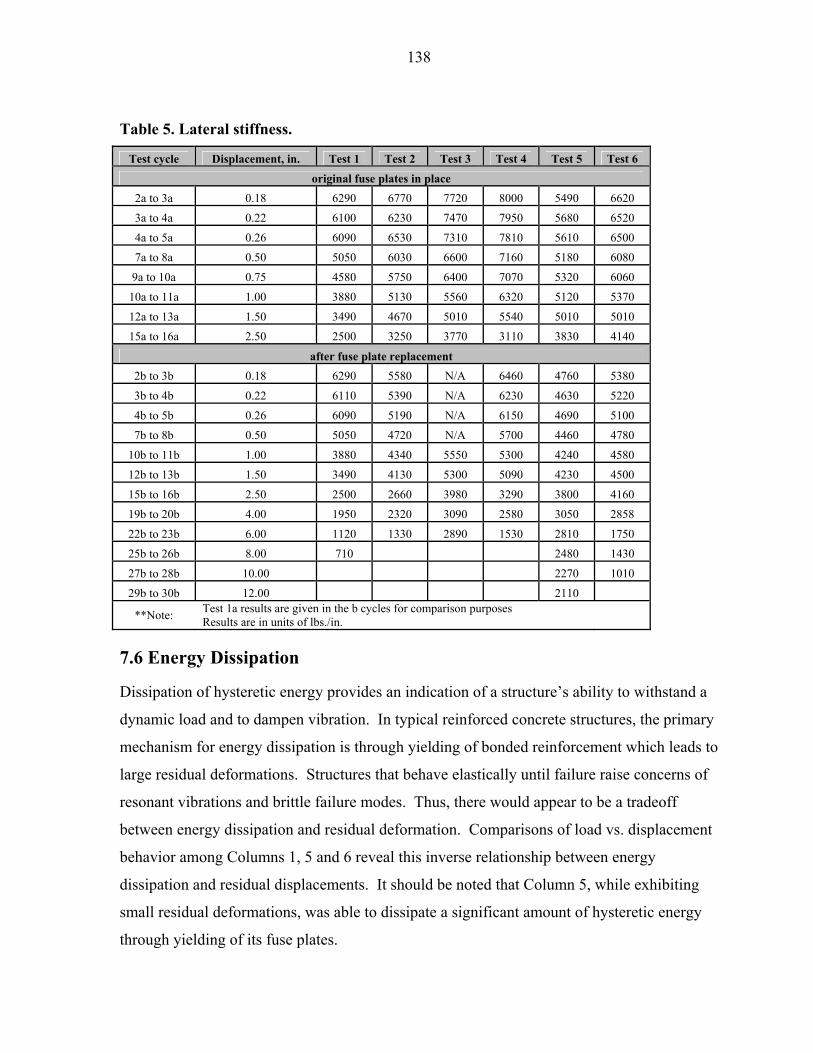
138
Table 5. Lateral stiffness.
Test cycle Displacement, in. Test 1 Test 2 Test 3 Test 4 Test 5 Test 6
original fuse plates in place 2a to 3a 0.18 6290 6770 7720 8000 5490 6620
3a to 4a 0.22 6100 6230 7470 7950 5680 6520
4a to 5a 0.26 6090 6530 7310 7810 5610 6500
7a to 8a 0.50 5050 6030 6600 7160 5180 6080
9a to 10a 0.75 4580 5750 6400 7070 5320 6060
10a to 11a 1.00 3880 5130 5560 6320 5120 5370
12a to 13a 1.50 3490 4670 5010 5540 5010 5010
15a to 16a 2.50 2500 3250 3770 3110 3830 4140
after fuse plate replacement 2b to 3b 0.18 6290 5580 N/A 6460 4760 5380
3b to 4b 0.22 6110 5390 N/A 6230 4630 5220
4b to 5b 0.26 6090 5190 N/A 6150 4690 5100
7b to 8b 0.50 5050 4720 N/A 5700 4460 4780
10b to 11b 1.00 3880 4340 5550 5300 4240 4580
12b to 13b 1.50 3490 4130 5300 5090 4230 4500
15b to 16b 2.50 2500 2660 3980 3290 3800 4160
19b to 20b 4.00 1950 2320 3090 2580 3050 2858
22b to 23b 6.00 1120 1330 2890 1530 2810 1750
25b to 26b 8.00 710 2480 1430
27b to 28b 10.00 2270 1010
29b to 30b 12.00 2110
**Note: Test 1a results are given in the b cycles for comparison purposes Results are in units of lbs./in.
7.6 Energy Dissipation
Dissipation of hysteretic energy provides an indication of a structure’s ability to withstand a
dynamic load and to dampen vibration. In typical reinforced concrete structures, the primary
mechanism for energy dissipation is through yielding of bonded reinforcement which leads to
large residual deformations. Structures that behave elastically until failure raise concerns of
resonant vibrations and brittle failure modes. Thus, there would appear to be a tradeoff
between energy dissipation and residual deformation. Comparisons of load vs. displacement
behavior among Columns 1, 5 and 6 reveal this inverse relationship between energy
dissipation and residual displacements. It should be noted that Column 5, while exhibiting
small residual deformations, was able to dissipate a significant amount of hysteretic energy
through yielding of its fuse plates.
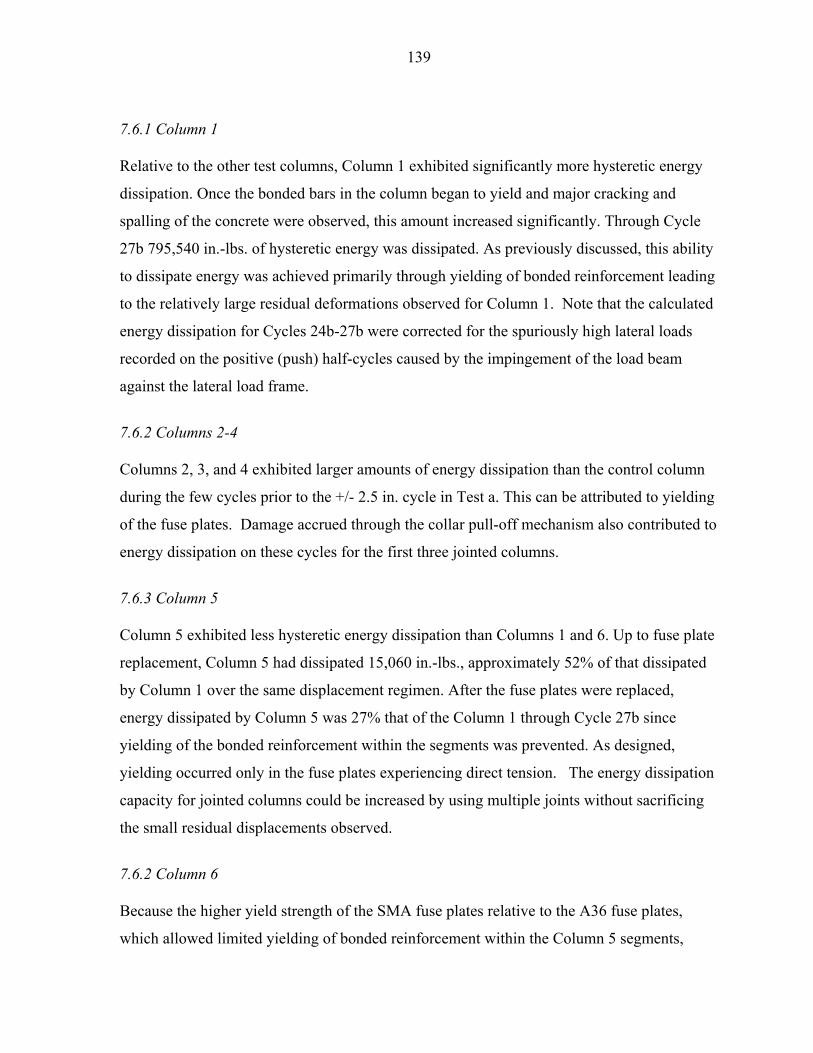
139
7.6.1 Column 1
Relative to the other test columns, Column 1 exhibited significantly more hysteretic energy
dissipation. Once the bonded bars in the column began to yield and major cracking and
spalling of the concrete were observed, this amount increased significantly. Through Cycle
27b 795,540 in.-lbs. of hysteretic energy was dissipated. As previously discussed, this ability
to dissipate energy was achieved primarily through yielding of bonded reinforcement leading
to the relatively large residual deformations observed for Column 1. Note that the calculated
energy dissipation for Cycles 24b-27b were corrected for the spuriously high lateral loads
recorded on the positive (push) half-cycles caused by the impingement of the load beam
against the lateral load frame.
7.6.2 Columns 2-4
Columns 2, 3, and 4 exhibited larger amounts of energy dissipation than the control column
during the few cycles prior to the +/- 2.5 in. cycle in Test a. This can be attributed to yielding
of the fuse plates. Damage accrued through the collar pull-off mechanism also contributed to
energy dissipation on these cycles for the first three jointed columns.
7.6.3 Column 5
Column 5 exhibited less hysteretic energy dissipation than Columns 1 and 6. Up to fuse plate
replacement, Column 5 had dissipated 15,060 in.-lbs., approximately 52% of that dissipated
by Column 1 over the same displacement regimen. After the fuse plates were replaced,
energy dissipated by Column 5 was 27% that of the Column 1 through Cycle 27b since
yielding of the bonded reinforcement within the segments was prevented. As designed,
yielding occurred only in the fuse plates experiencing direct tension. The energy dissipation
capacity for jointed columns could be increased by using multiple joints without sacrificing
the small residual displacements observed.
7.6.2 Column 6
Because the higher yield strength of the SMA fuse plates relative to the A36 fuse plates,
which allowed limited yielding of bonded reinforcement within the Column 5 segments,
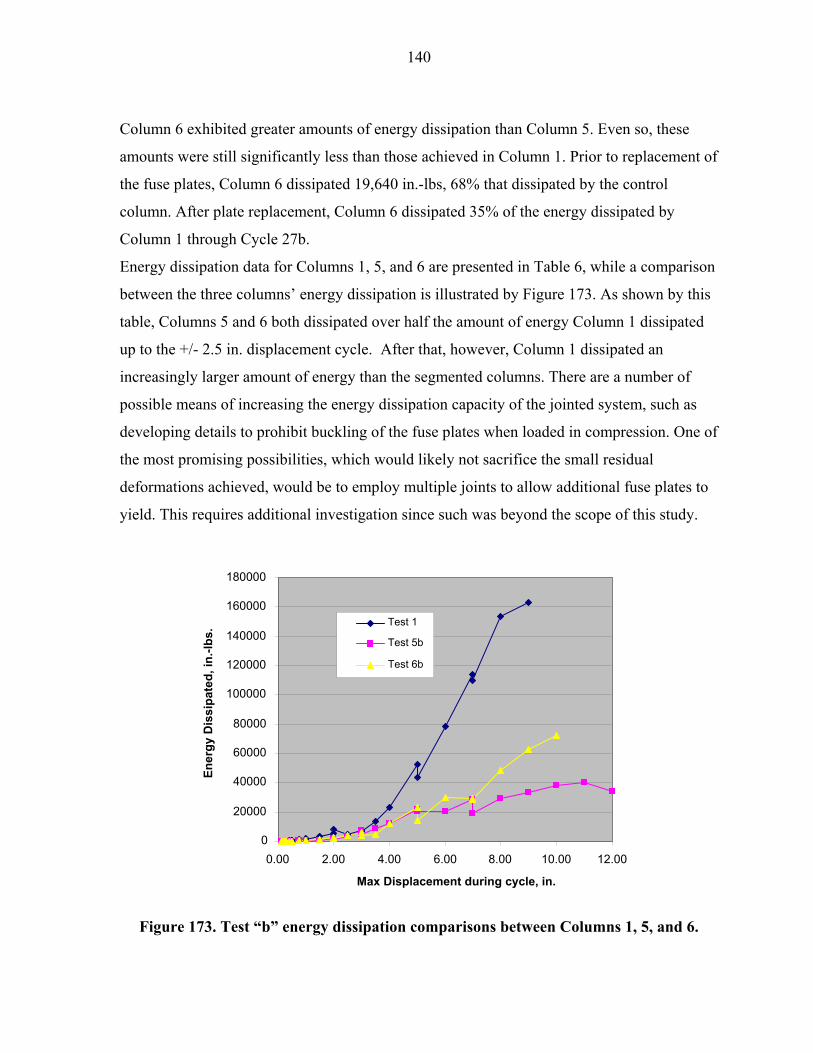
140
Column 6 exhibited greater amounts of energy dissipation than Column 5. Even so, these
amounts were still significantly less than those achieved in Column 1. Prior to replacement of
the fuse plates, Column 6 dissipated 19,640 in.-lbs, 68% that dissipated by the control
column. After plate replacement, Column 6 dissipated 35% of the energy dissipated by
Column 1 through Cycle 27b.
Energy dissipation data for Columns 1, 5, and 6 are presented in Table 6, while a comparison
between the three columns’ energy dissipation is illustrated by Figure 173. As shown by this
table, Columns 5 and 6 both dissipated over half the amount of energy Column 1 dissipated
up to the +/- 2.5 in. displacement cycle. After that, however, Column 1 dissipated an
increasingly larger amount of energy than the segmented columns. There are a number of
possible means of increasing the energy dissipation capacity of the jointed system, such as
developing details to prohibit buckling of the fuse plates when loaded in compression. One of
the most promising possibilities, which would likely not sacrifice the small residual
deformations achieved, would be to employ multiple joints to allow additional fuse plates to
yield. This requires additional investigation since such was beyond the scope of this study.
Figure 173. Test “b” energy dissipation comparisons between Columns 1, 5, and 6.
0
20000
40000
60000
80000
100000
120000
140000
160000
180000
0.00 2.00 4.00 6.00 8.00 10.00 12.00 Max Displacement during cycle, in.
Ener
gy D
issi
pate
d, in
.-lbs
. Test 1
Test 5b
Test 6b
141
Table 6. Energy dissipation.
Test cycle Displacement, in. Test 1 Test 2 Test 3 Test 4 Test 5 Test 6 original fuse plates in place
1a 0.10 30 30 50 30 20 2a 0.14 40 40 40 50 40 3a 0.18 60 30 60 60 50 4a 0.22 80 50 80 70 60 5a 0.26 120 70 110 100 70 6a 0.30 130 120 150 120 100 7a 0.40 240 280 320 170 170 8a 0.50 360 480 490 240 270 9a 0.50 330 350 350 220 260 10a 0.75 1090 1140 1410 400 1030 11a 1.00 1660 1890 2730 560 1500 12a 1.00 1190 1270 2360 450 1030 13a 1.50 4140 3930 5810 2300 2950 14a 2.00 7330 6120 8930 3490 4060 15a 2.00 10490 8870 11660 2180 2400 16a 2.50 9560 9440 4620 5630
After Replacement of Plates 1b 0.10 50 30 N/A 0 30 20 2b 0.14 70 40 N/A 50 50 40 3b 0.18 100 60 N/A 60 70 60 4b 0.22 150 80 N/A 50 90 70 5b 0.26 230 100 N/A 120 90 90 6b 0.30 250 120 N/A 100 120 110 7b 0.40 510 190 N/A 190 130 190 8b 0.50 850 290 360 N/A 250 270 9b 0.50 510 310 N/A 220 240 250 10b 0.75 1530 690 760 700 430 450 11b 1.00 1790 1240 1380 1360 670 680 12b 1.00 1160 1140 N/A 1120 610 640 13b 1.50 3340 3380 3640 4070 980 1310 14b 2.00 5790 6950 5960 6610 1870 2850 15b 2.00 7880 10240 8900 10550 1160 1910 16b 2.50 4690 9060 7230 7440 3460 4110 17b 3.00 7820 12910 10000 12530 7340 6400 18b 3.00 6580 11230 N/A 7600 4870 4310 19b 3.50 13850 14470 12400 N/A 8820 4720 20b 4.00 23450 17290 13340 18440 12030 12390 21b 5.00 52490 25330 17580 28260 21930 22970 22b 5.00 43590 31540 22740 25750 20290 14050 23b 6.00 78200 31430 40130 20130 30250 24b 7.00 113810 28520 29380 25b 7.00 110070 19200 28480 26b 8.00 153710 29130 48440 27b 9.00 163070 33720 62840 28b 10.00 38480 72490 29b 11.00 39900 30b 12.00 33820
**Note: Units are in in.-lbs.

142
7.7 Residual Displacement
7.7.1 Column 1
The residual displacements exhibited by Column 1 remained relatively small (<0.8 in.)
through Cycle 20 (+/- 4.0 in.). A significant increase up to an average of 1.48 in. residual
displacement was observed during Cycle 21 (+/- 5.0 in.). As greater lateral displacements
were imposed, residual displacements accrued rapidly. On the final cycle, Column 1
exhibited residual displacements of + 5.78 in. on the positive (push) half-cycle and - 7.40 in.
on the negative (pull) half-cycle. These values were 64% and 82% respectively of the
maximum displacements of +/- 9.0 in.
7.7.2 Columns 2-4
Columns 2, 3, and 4 experienced small initial residual displacements. However, once the
collar pull-off mechanism initiated, the residual displacements increased rapidly. After this
mechanism began to control the behavior of these columns, the data were no longer useful
for comparisons among other columns. Therefore, results for these tests are excluded from
Table 7.
7.7.3 Column 5
Column 5 exhibited negligible residual displacements through Cycle 16a when the fuse
plates were replaced. During the test's “b” cycles, the residual displacements remained less
than 0.22 in. on average of both the positive and negative half-cycles. Associated with these
smaller residual displacements was a more pronounced opening of the construction joint
during larger displacement cycles, as well as a reduction in column cracking relative to the
other columns tested. Such small residual displacements indicated that the column remained
nearly elastic with minimal damage to the column segments.
7.7.4 Column 6
Column 6 experienced residual displacements less than 0.2 in. prior to fuse plate
replacement. After the fuse plates were replaced, residual displacements remained negligible
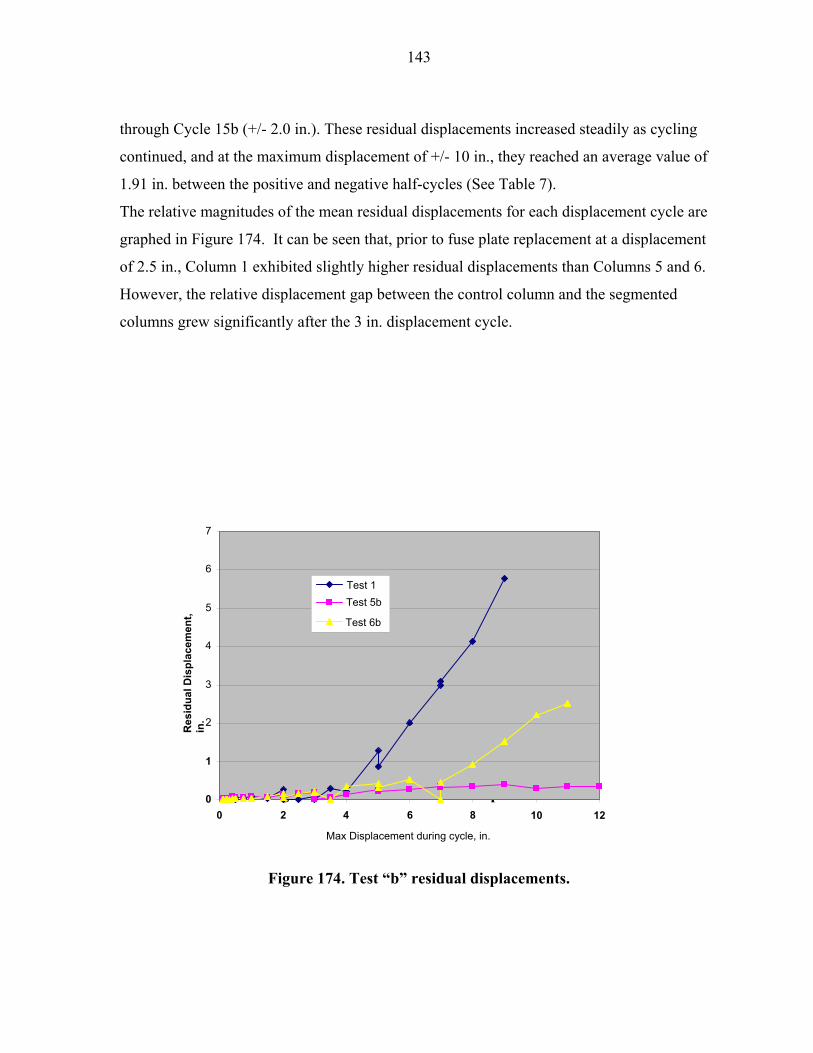
143
through Cycle 15b (+/- 2.0 in.). These residual displacements increased steadily as cycling
continued, and at the maximum displacement of +/- 10 in., they reached an average value of
1.91 in. between the positive and negative half-cycles (See Table 7).
The relative magnitudes of the mean residual displacements for each displacement cycle are
graphed in Figure 174. It can be seen that, prior to fuse plate replacement at a displacement
of 2.5 in., Column 1 exhibited slightly higher residual displacements than Columns 5 and 6.
However, the relative displacement gap between the control column and the segmented
columns grew significantly after the 3 in. displacement cycle.
Figure 174. Test "b" residual displacements.
Figure 174. Test “b” residual displacements.
0
1
2
3
4
5
6
7
0 2 4 6 8 10 12 Max Displacement during cycle, in.
Res
idua
l Dis
plac
emen
t, in
.
Test 1Test 5b
Test 6b
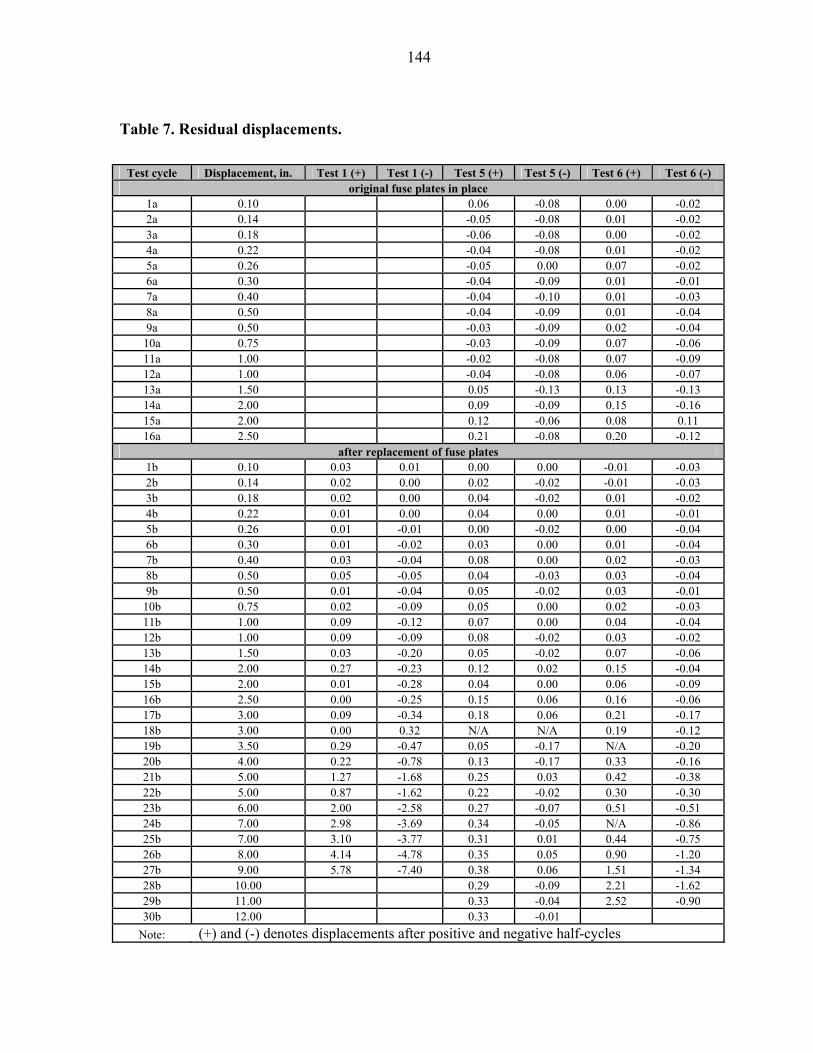
144
Table 7. Residual displacements.
Test cycle Displacement, in. Test 1 (+) Test 1 (-) Test 5 (+) Test 5 (-) Test 6 (+) Test 6 (-) original fuse plates in place
1a 0.10 0.06 -0.08 0.00 -0.02 2a 0.14 -0.05 -0.08 0.01 -0.02 3a 0.18 -0.06 -0.08 0.00 -0.02 4a 0.22 -0.04 -0.08 0.01 -0.02 5a 0.26 -0.05 0.00 0.07 -0.02 6a 0.30 -0.04 -0.09 0.01 -0.01 7a 0.40 -0.04 -0.10 0.01 -0.03 8a 0.50 -0.04 -0.09 0.01 -0.04 9a 0.50 -0.03 -0.09 0.02 -0.04 10a 0.75 -0.03 -0.09 0.07 -0.06 11a 1.00 -0.02 -0.08 0.07 -0.09 12a 1.00 -0.04 -0.08 0.06 -0.07 13a 1.50 0.05 -0.13 0.13 -0.13 14a 2.00 0.09 -0.09 0.15 -0.16 15a 2.00 0.12 -0.06 0.08 0.11 16a 2.50 0.21 -0.08 0.20 -0.12
after replacement of fuse plates 1b 0.10 0.03 0.01 0.00 0.00 -0.01 -0.03 2b 0.14 0.02 0.00 0.02 -0.02 -0.01 -0.03 3b 0.18 0.02 0.00 0.04 -0.02 0.01 -0.02 4b 0.22 0.01 0.00 0.04 0.00 0.01 -0.01 5b 0.26 0.01 -0.01 0.00 -0.02 0.00 -0.04 6b 0.30 0.01 -0.02 0.03 0.00 0.01 -0.04 7b 0.40 0.03 -0.04 0.08 0.00 0.02 -0.03 8b 0.50 0.05 -0.05 0.04 -0.03 0.03 -0.04 9b 0.50 0.01 -0.04 0.05 -0.02 0.03 -0.01 10b 0.75 0.02 -0.09 0.05 0.00 0.02 -0.03 11b 1.00 0.09 -0.12 0.07 0.00 0.04 -0.04 12b 1.00 0.09 -0.09 0.08 -0.02 0.03 -0.02 13b 1.50 0.03 -0.20 0.05 -0.02 0.07 -0.06 14b 2.00 0.27 -0.23 0.12 0.02 0.15 -0.04 15b 2.00 0.01 -0.28 0.04 0.00 0.06 -0.09 16b 2.50 0.00 -0.25 0.15 0.06 0.16 -0.06 17b 3.00 0.09 -0.34 0.18 0.06 0.21 -0.17 18b 3.00 0.00 0.32 N/A N/A 0.19 -0.12 19b 3.50 0.29 -0.47 0.05 -0.17 N/A -0.20 20b 4.00 0.22 -0.78 0.13 -0.17 0.33 -0.16 21b 5.00 1.27 -1.68 0.25 0.03 0.42 -0.38 22b 5.00 0.87 -1.62 0.22 -0.02 0.30 -0.30 23b 6.00 2.00 -2.58 0.27 -0.07 0.51 -0.51 24b 7.00 2.98 -3.69 0.34 -0.05 N/A -0.86 25b 7.00 3.10 -3.77 0.31 0.01 0.44 -0.75 26b 8.00 4.14 -4.78 0.35 0.05 0.90 -1.20 27b 9.00 5.78 -7.40 0.38 0.06 1.51 -1.34 28b 10.00 0.29 -0.09 2.21 -1.62 29b 11.00 0.33 -0.04 2.52 -0.90 30b 12.00 0.33 -0.01
Note: (+) and (-) denotes displacements after positive and negative half-cycles
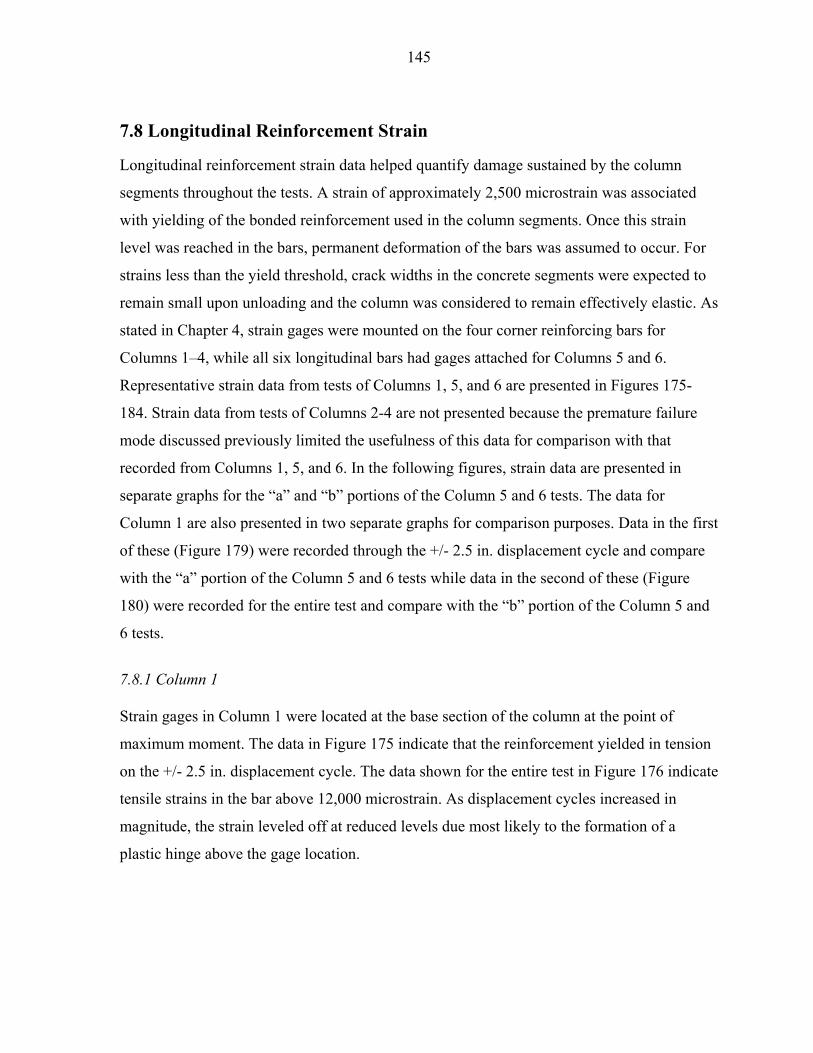
145
7.8 Longitudinal Reinforcement Strain
Longitudinal reinforcement strain data helped quantify damage sustained by the column
segments throughout the tests. A strain of approximately 2,500 microstrain was associated
with yielding of the bonded reinforcement used in the column segments. Once this strain
level was reached in the bars, permanent deformation of the bars was assumed to occur. For
strains less than the yield threshold, crack widths in the concrete segments were expected to
remain small upon unloading and the column was considered to remain effectively elastic. As
stated in Chapter 4, strain gages were mounted on the four corner reinforcing bars for
Columns 1–4, while all six longitudinal bars had gages attached for Columns 5 and 6.
Representative strain data from tests of Columns 1, 5, and 6 are presented in Figures 175-
184. Strain data from tests of Columns 2-4 are not presented because the premature failure
mode discussed previously limited the usefulness of this data for comparison with that
recorded from Columns 1, 5, and 6. In the following figures, strain data are presented in
separate graphs for the “a” and “b” portions of the Column 5 and 6 tests. The data for
Column 1 are also presented in two separate graphs for comparison purposes. Data in the first
of these (Figure 179) were recorded through the +/- 2.5 in. displacement cycle and compare
with the “a” portion of the Column 5 and 6 tests while data in the second of these (Figure
180) were recorded for the entire test and compare with the “b” portion of the Column 5 and
6 tests.
7.8.1 Column 1
Strain gages in Column 1 were located at the base section of the column at the point of
maximum moment. The data in Figure 175 indicate that the reinforcement yielded in tension
on the +/- 2.5 in. displacement cycle. The data shown for the entire test in Figure 176 indicate
tensile strains in the bar above 12,000 microstrain. As displacement cycles increased in
magnitude, the strain leveled off at reduced levels due most likely to the formation of a
plastic hinge above the gage location.
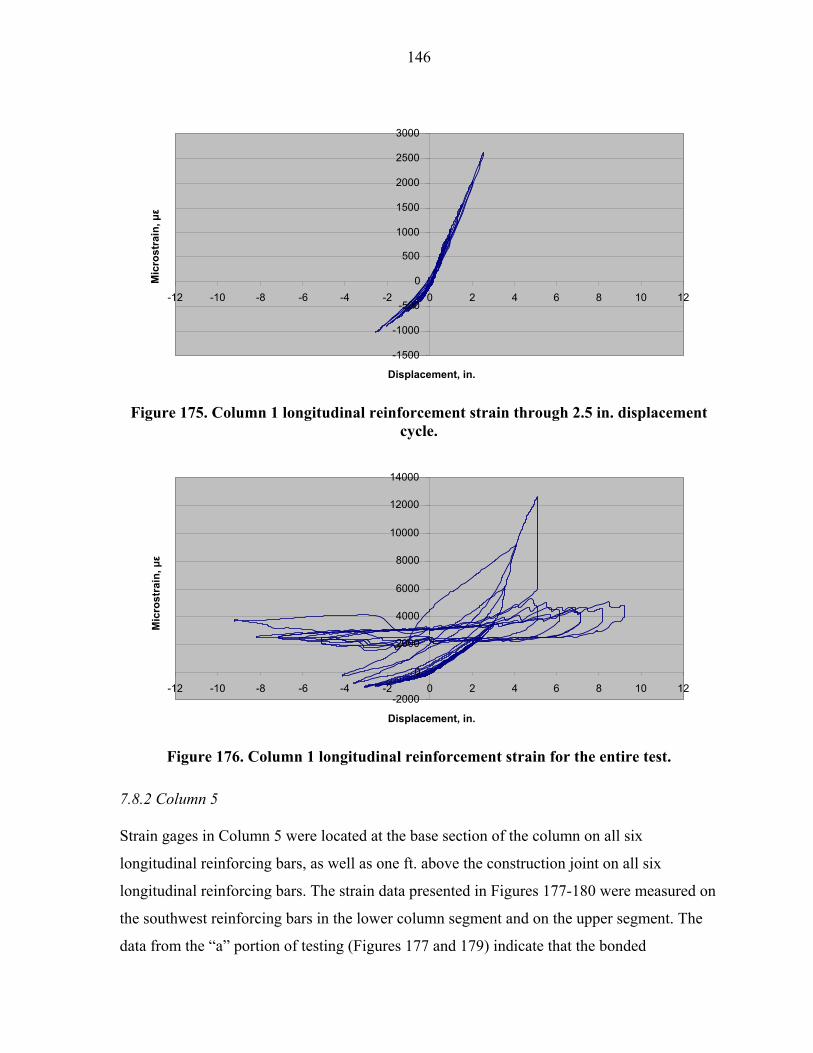
146
Figure 175. Column 1 longitudinal reinforcement strain through 2.5 in. displacement
cycle.
Figure 176. Column 1 longitudinal reinforcement strain for the entire test.
7.8.2 Column 5
Strain gages in Column 5 were located at the base section of the column on all six
longitudinal reinforcing bars, as well as one ft. above the construction joint on all six
longitudinal reinforcing bars. The strain data presented in Figures 177-180 were measured on
the southwest reinforcing bars in the lower column segment and on the upper segment. The
data from the “a” portion of testing (Figures 177 and 179) indicate that the bonded
-2000
0
2000
4000
6000
8000
10000
12000
14000
-12 -10 -8 -6 -4 -2 0 2 4 6 8 10 12
Displacement, in.
Mic
rost
rain
, µε
-1500
-1000
-500
0
500
1000
1500
2000
2500
3000
-12 -10 -8 -6 -4 -2 0 2 4 6 8 10 12
Displacement, in.
Mic
rost
rain
, µε
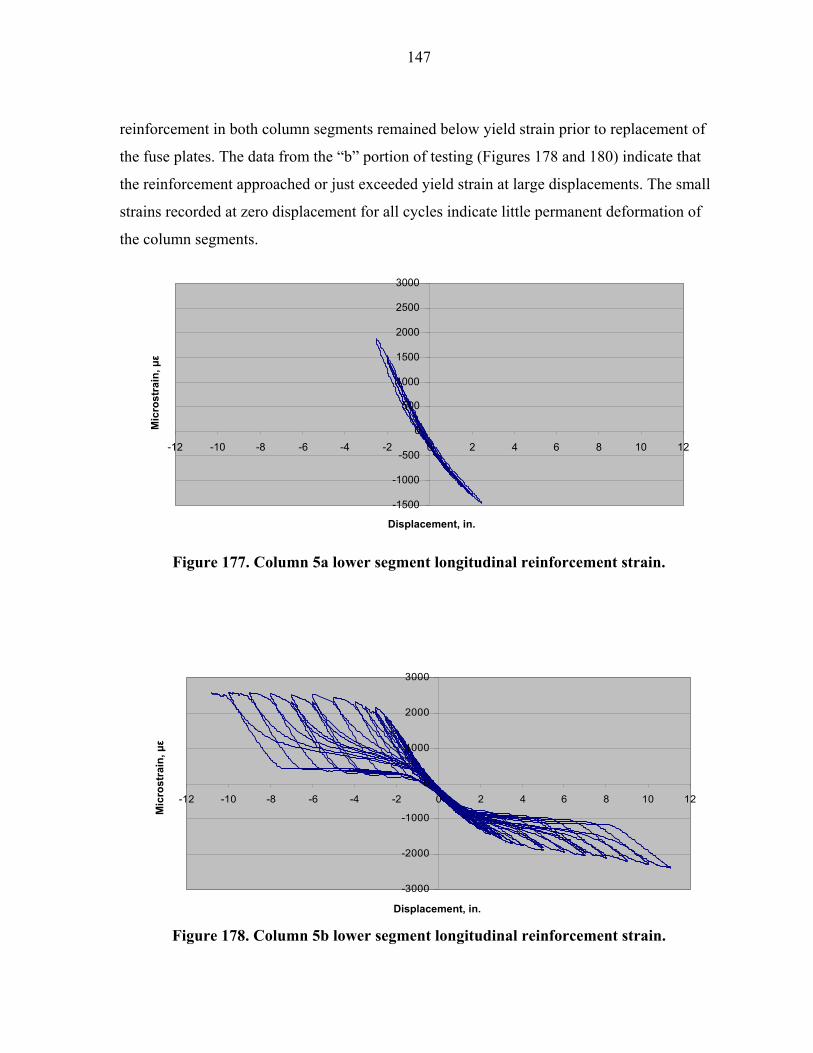
147
reinforcement in both column segments remained below yield strain prior to replacement of
the fuse plates. The data from the “b” portion of testing (Figures 178 and 180) indicate that
the reinforcement approached or just exceeded yield strain at large displacements. The small
strains recorded at zero displacement for all cycles indicate little permanent deformation of
the column segments.
Figure 177. Column 5a lower segment longitudinal reinforcement strain.
Figure 178. Column 5b lower segment longitudinal reinforcement strain.
-1500
-1000
-500
0
500
1000
1500
2000
2500
3000
-12 -10 -8 -6 -4 -2 0 2 4 6 8 10 12
Displacement, in.
Mic
rost
rain
, µε
-3000
-2000
-1000
0
1000
2000
3000
-12 -10 -8 -6 -4 -2 0 2 4 6 8 10 12
Displacement, in
Mic
roSt
rain
Mic
rost
rain
, µε
Displacement, in.
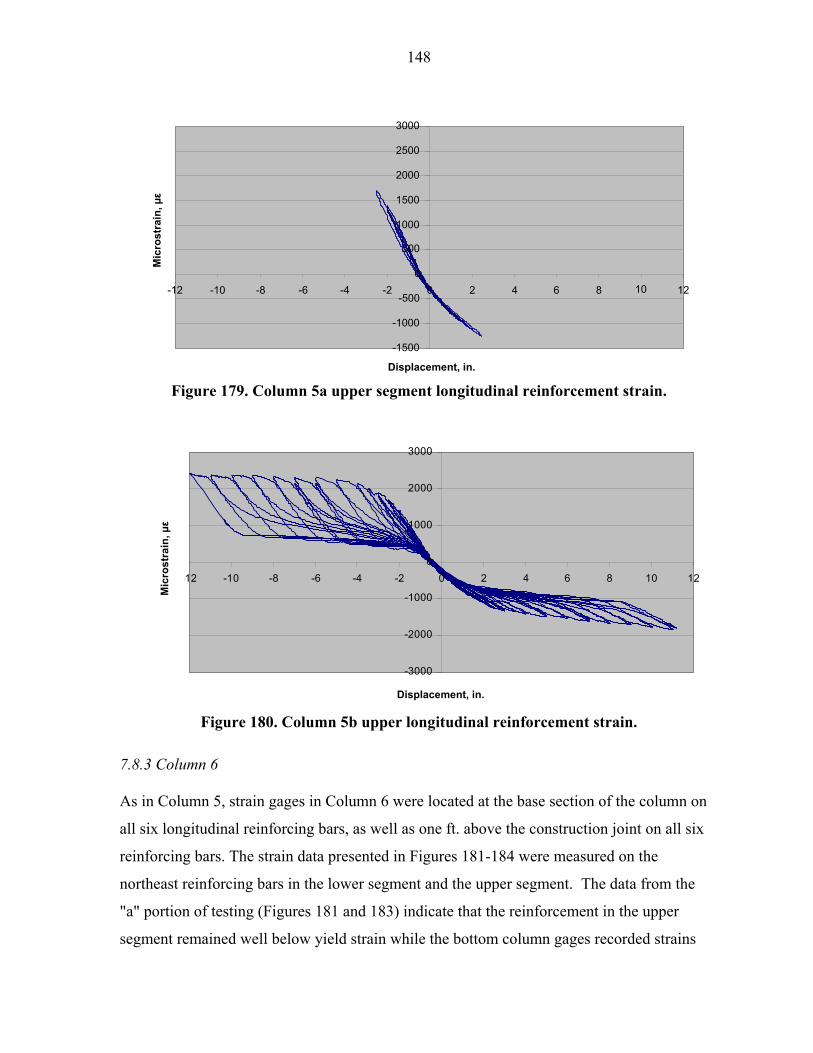
148
Figure 179. Column 5a upper segment longitudinal reinforcement strain.
Figure 180. Column 5b upper longitudinal reinforcement strain.
7.8.3 Column 6
As in Column 5, strain gages in Column 6 were located at the base section of the column on
all six longitudinal reinforcing bars, as well as one ft. above the construction joint on all six
reinforcing bars. The strain data presented in Figures 181-184 were measured on the
northeast reinforcing bars in the lower segment and the upper segment. The data from the
"a" portion of testing (Figures 181 and 183) indicate that the reinforcement in the upper
segment remained well below yield strain while the bottom column gages recorded strains
-1500
-1000
-500
0
500
1000
1500
2000
2500
3000
-12 -10 -8 -6 -4 -2 0 2 4 6 8 10 12
Displacement, in.
Mic
rost
rain
, µε
-3000
-2000
-1000
0
1000
2000
3000
-12 -10 -8 -6 -4 -2 0 2 4 6 8 10 12
Displacement, in
Mic
roSt
rain
Mic
rost
rain
, µε
Displacement, in.
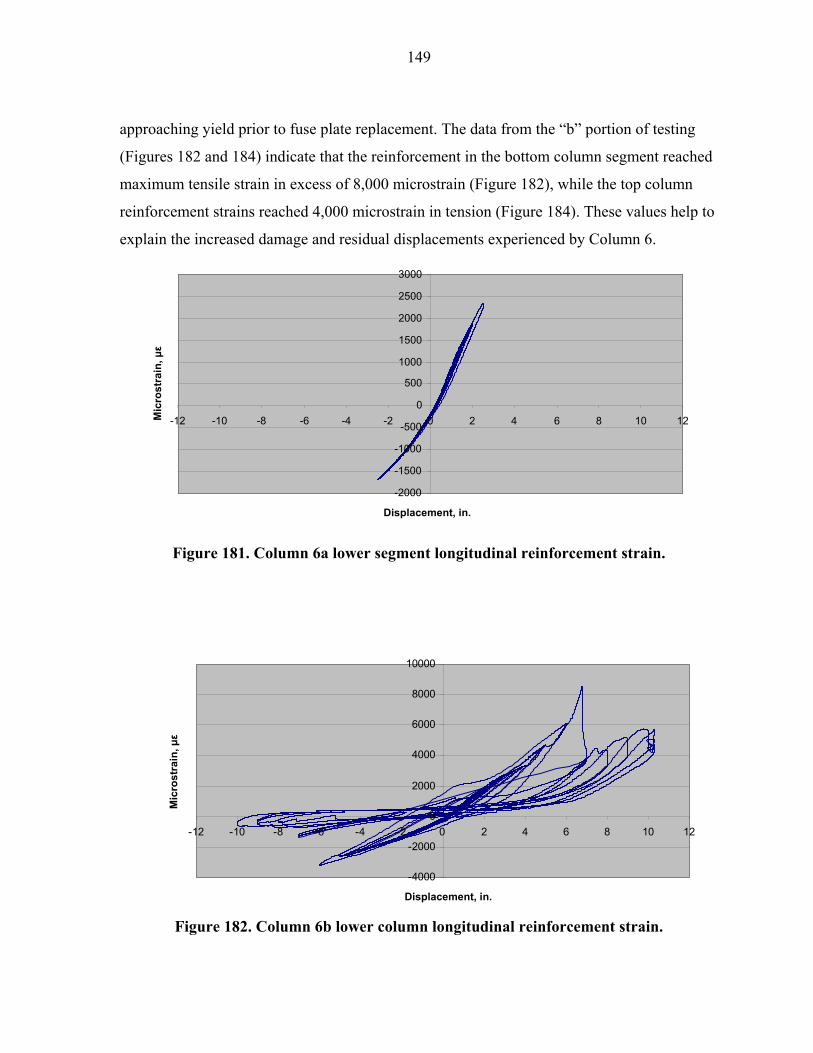
149
approaching yield prior to fuse plate replacement. The data from the “b” portion of testing
(Figures 182 and 184) indicate that the reinforcement in the bottom column segment reached
maximum tensile strain in excess of 8,000 microstrain (Figure 182), while the top column
reinforcement strains reached 4,000 microstrain in tension (Figure 184). These values help to
explain the increased damage and residual displacements experienced by Column 6.
Figure 181. Column 6a lower segment longitudinal reinforcement strain.
Figure 182. Column 6b lower column longitudinal reinforcement strain.
-2000
-1500
-1000
-500
0
500
1000
1500
2000
2500
3000
-12 -10 -8 -6 -4 -2 0 2 4 6 8 10 12
Displacement, in.
Mic
rost
rain
, µε
-4000
-2000
0
2000
4000
6000
8000
10000
-12 -10 -8 -6 -4 -2 0 2 4 6 8 10 12
Displacement, in
Mic
rost
rain
Mic
rost
rain
, µε
Displacement, in.
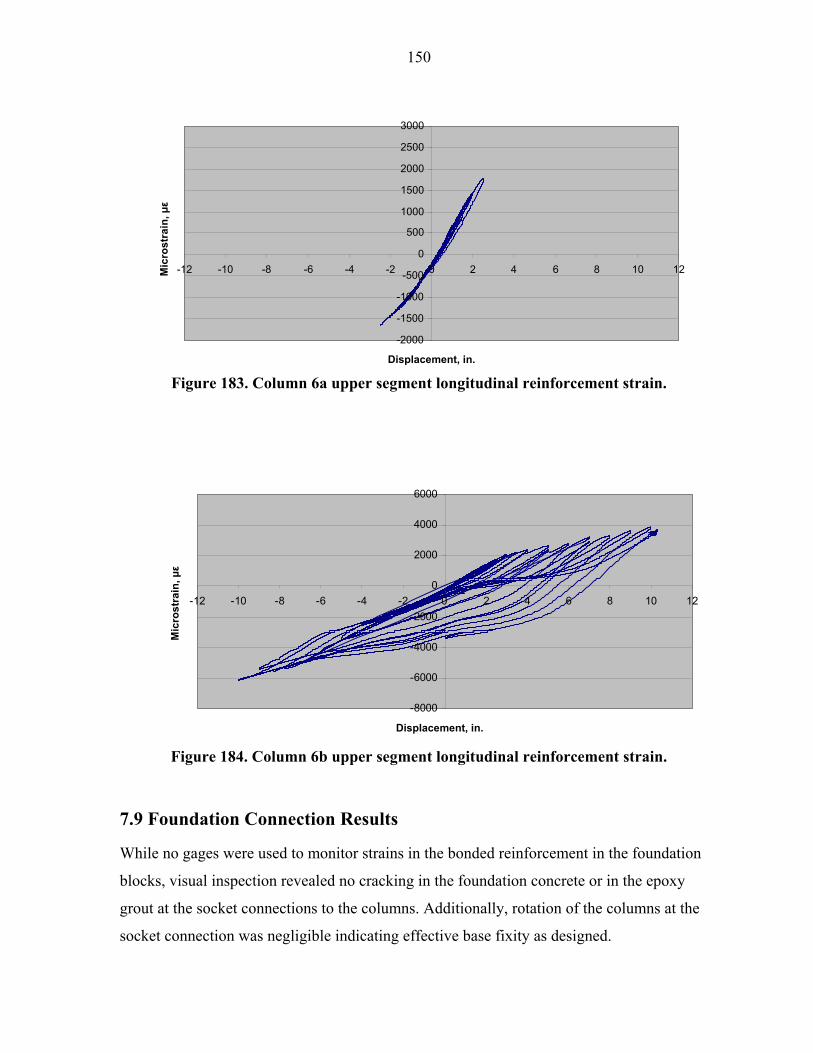
150
Figure 183. Column 6a upper segment longitudinal reinforcement strain.
Figure 184. Column 6b upper segment longitudinal reinforcement strain.
7.9 Foundation Connection Results
While no gages were used to monitor strains in the bonded reinforcement in the foundation
blocks, visual inspection revealed no cracking in the foundation concrete or in the epoxy
grout at the socket connections to the columns. Additionally, rotation of the columns at the
socket connection was negligible indicating effective base fixity as designed.
-2000
-1500
-1000
-500
0
500
1000
1500
2000
2500
3000
-12 -10 -8 -6 -4 -2 0 2 4 6 8 10 12
Displacement, in.
Mic
rost
rain
, µε
-8000
-6000
-4000
-2000
0
2000
4000
6000
-12 -10 -8 -6 -4 -2 0 2 4 6 8 10 12
Displacement, in
Mic
rost
rain
Mic
rost
rain
, µε
Displacement, in.
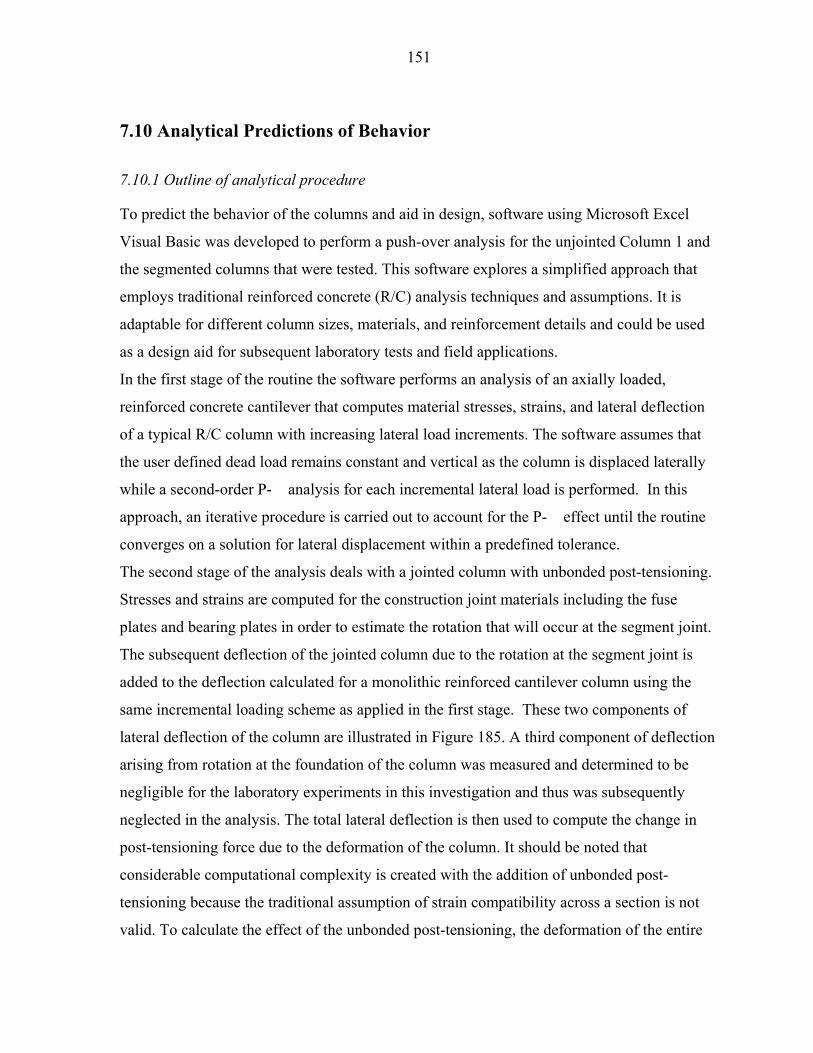
151
7.10 Analytical Predictions of Behavior
7.10.1 Outline of analytical procedure
To predict the behavior of the columns and aid in design, software using Microsoft Excel
Visual Basic was developed to perform a push-over analysis for the unjointed Column 1 and
the segmented columns that were tested. This software explores a simplified approach that
employs traditional reinforced concrete (R/C) analysis techniques and assumptions. It is
adaptable for different column sizes, materials, and reinforcement details and could be used
as a design aid for subsequent laboratory tests and field applications.
In the first stage of the routine the software performs an analysis of an axially loaded,
reinforced concrete cantilever that computes material stresses, strains, and lateral deflection
of a typical R/C column with increasing lateral load increments. The software assumes that
the user defined dead load remains constant and vertical as the column is displaced laterally
while a second-order P-� analysis for each incremental lateral load is performed. In this
approach, an iterative procedure is carried out to account for the P-� effect until the routine
converges on a solution for lateral displacement within a predefined tolerance.
The second stage of the analysis deals with a jointed column with unbonded post-tensioning.
Stresses and strains are computed for the construction joint materials including the fuse
plates and bearing plates in order to estimate the rotation that will occur at the segment joint.
The subsequent deflection of the jointed column due to the rotation at the segment joint is
added to the deflection calculated for a monolithic reinforced cantilever column using the
same incremental loading scheme as applied in the first stage. These two components of
lateral deflection of the column are illustrated in Figure 185. A third component of deflection
arising from rotation at the foundation of the column was measured and determined to be
negligible for the laboratory experiments in this investigation and thus was subsequently
neglected in the analysis. The total lateral deflection is then used to compute the change in
post-tensioning force due to the deformation of the column. It should be noted that
considerable computational complexity is created with the addition of unbonded post-
tensioning because the traditional assumption of strain compatibility across a section is not
valid. To calculate the effect of the unbonded post-tensioning, the deformation of the entire
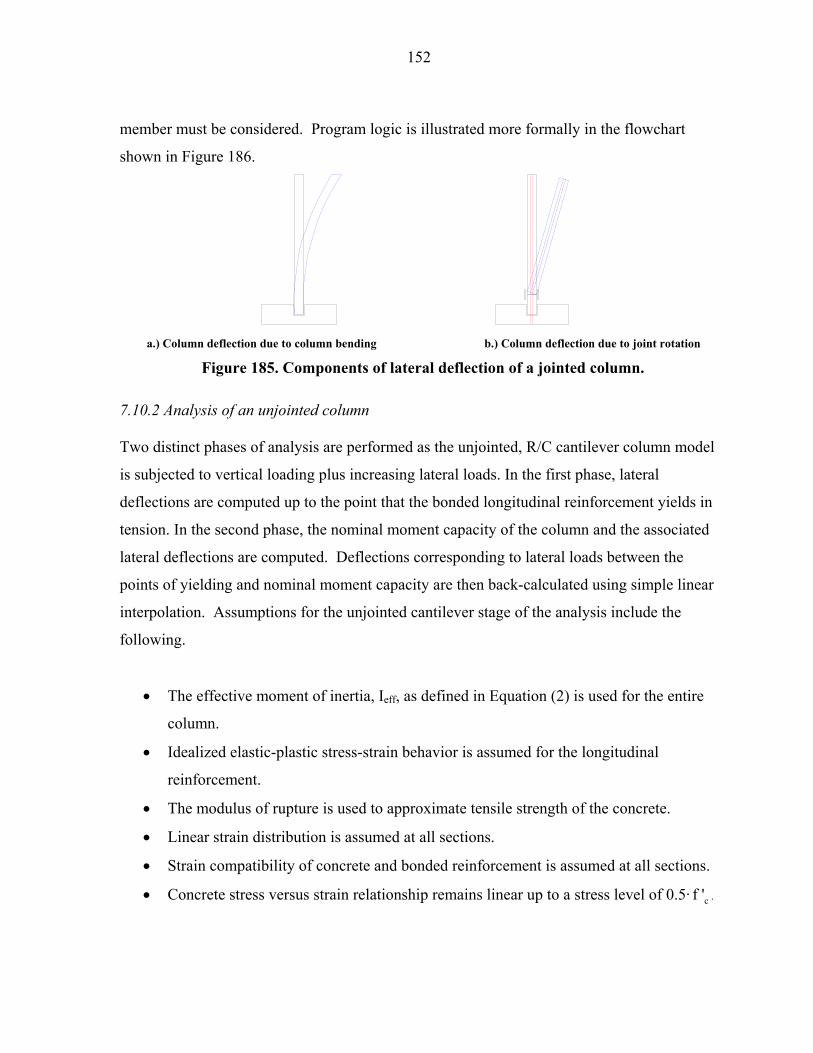
152
member must be considered. Program logic is illustrated more formally in the flowchart
shown in Figure 186.
a.) Column deflection due to column bending b.) Column deflection due to joint rotation
Figure 185. Components of lateral deflection of a jointed column.
7.10.2 Analysis of an unjointed column
Two distinct phases of analysis are performed as the unjointed, R/C cantilever column model
is subjected to vertical loading plus increasing lateral loads. In the first phase, lateral
deflections are computed up to the point that the bonded longitudinal reinforcement yields in
tension. In the second phase, the nominal moment capacity of the column and the associated
lateral deflections are computed. Deflections corresponding to lateral loads between the
points of yielding and nominal moment capacity are then back-calculated using simple linear
interpolation. Assumptions for the unjointed cantilever stage of the analysis include the
following.
• The effective moment of inertia, Ieff, as defined in Equation (2) is used for the entire
column.
• Idealized elastic-plastic stress-strain behavior is assumed for the longitudinal
reinforcement.
• The modulus of rupture is used to approximate tensile strength of the concrete.
• Linear strain distribution is assumed at all sections.
• Strain compatibility of concrete and bonded reinforcement is assumed at all sections.
• Concrete stress versus strain relationship remains linear up to a stress level of 0.5· cf ' .
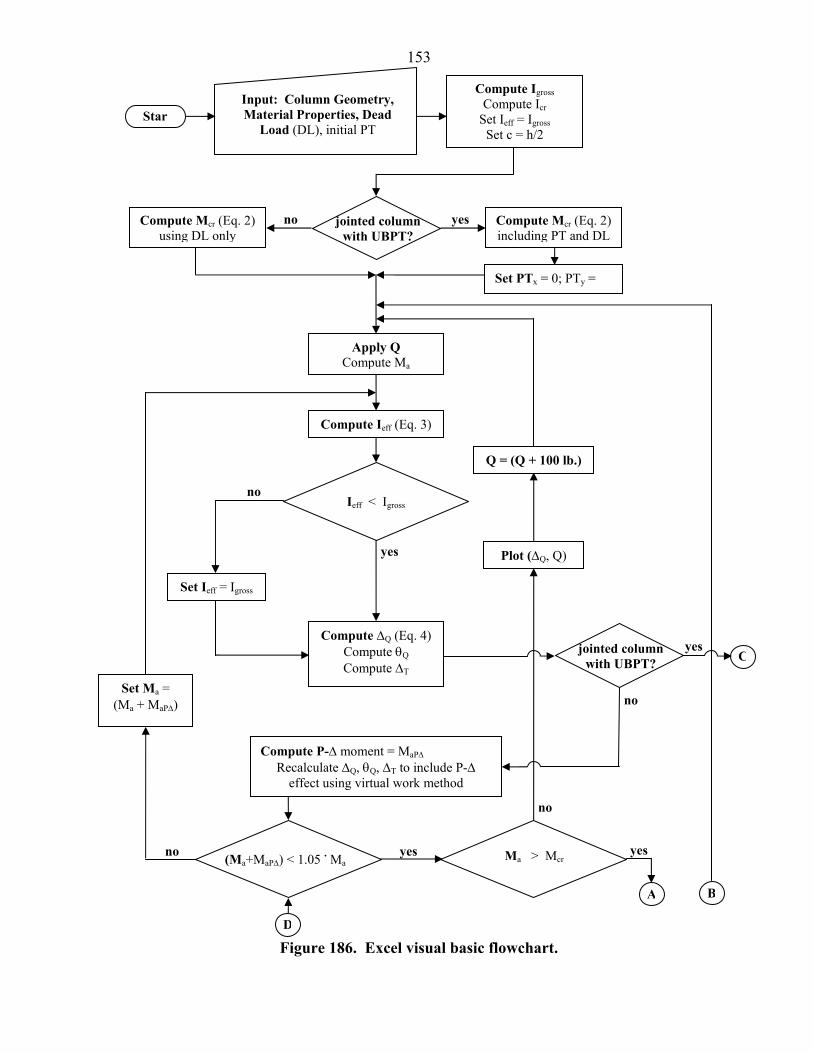
153
Figure 186. Excel visual basic flowchart.
C
no
jointed column with UBPT?
no
yes
B
Compute P-∆ moment = MaP∆ Recalculate ∆Q, θQ, ∆T to include P-∆
effect using virtual work method
Set Ma = (Ma + MaP∆)
yesno (Ma+MaP∆) < 1.05 . Ma yes
A
D
Compute ∆Q (Eq. 4)Compute θQ Compute ∆T
Set Ieff = Igross
Plot (∆Q, Q) yes
Apply Q Compute Ma
Compute Ieff (Eq. 3)
Q = (Q + 100 lb.)
no
Set PTx = 0; PTy =
Compute Mcr (Eq. 2) including PT and DL
jointed column with UBPT?
Compute Mcr (Eq. 2) using DL only
no yes
Input: Column Geometry, Material Properties, Dead
Load (DL), initial PT
Compute Igross Compute Icr
Set Ieff = Igross Set c = h/2
Star
Ieff < Igross
Ma > Mcr
154
Figure 186 continued. Excel visual basic flowchart.
If this threshold is exceeded, the program will continue to run but results will be invalid.
yes
Compute Mn (Eq. 8, 9, and strain
compatibility)
Compute ∆n (Eq. 10 and 11) and
Compute ∆topn
Compute Qn accounting for P-∆
moment
Plot (∆n, Qn)
Plot line between points of yield and nominal moment
capacity
End
Compute c, fc, fs, and f’s (Eq. 6, 7, and strain
compatibility)
A
f’s < fy Set f’s = fy
Print fc > (0.5 . f’c)
fs > fy
Plot (∆Q, Q)
Q = (Q + 100
B
yes
yes
no
no
no
perform section analysis at base
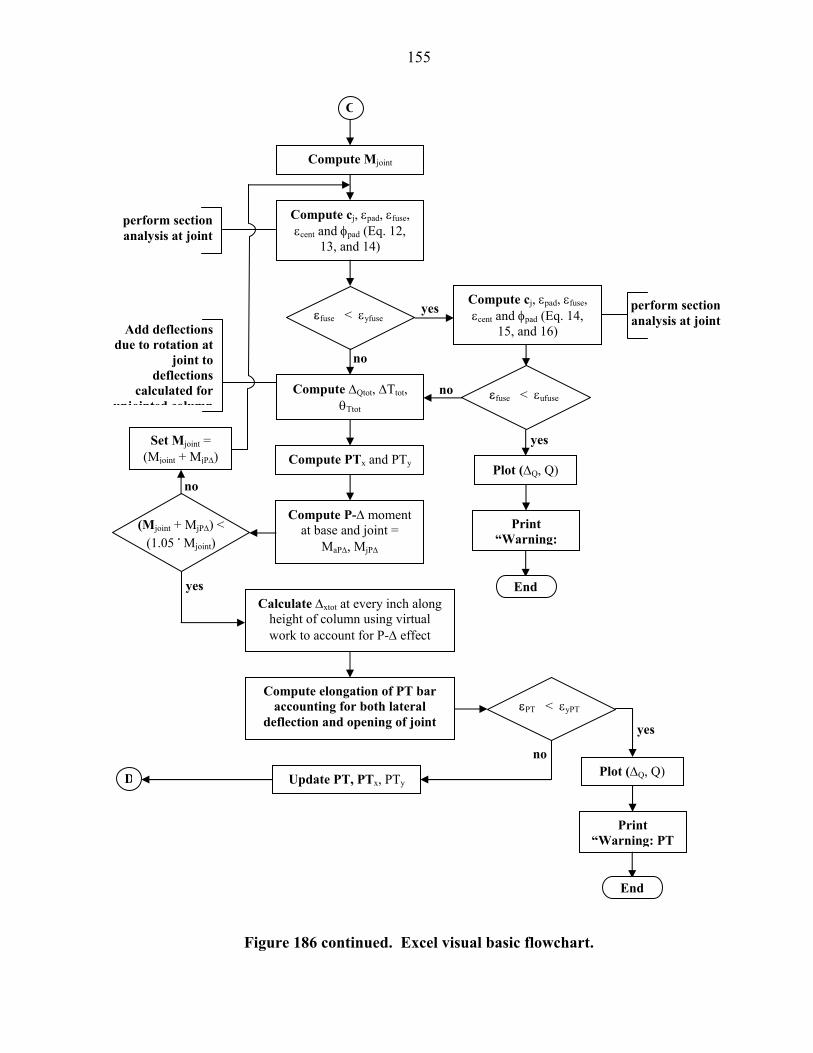
155
Figure 186 continued. Excel visual basic flowchart.
Calculate ∆xtot at every inch along height of column using virtual work to account for P-∆ effect
Compute elongation of PT bar accounting for both lateral
deflection and opening of joint
Update PT, PTx, PTy
εPT < εyPT
no Plot (∆Q, Q)
Print “Warning: PT
End
yes
D
yes
Compute P-∆ moment at base and joint =
MaP∆, MjP∆
Set Mjoint = (Mjoint + MjP∆)
no
perform section analysis at joint
Compute cj, εpad, εfuse, εcent and φpad (Eq. 14,
15, and 16)
yes
Compute PTx and PTy
εfuse < εufuse no
Plot (∆Q, Q)
Print “Warning:
End
yes
Add deflections due to rotation at
joint to deflections
calculated for unjointed column
Compute cj, εpad, εfuse, εcent and φpad (Eq. 12,
13, and 14)
C
no
Compute Mjoint
εfuse < εyfuse
Compute ∆Qtot, ∆Ttot, θTtot
perform section analysis at joint
(Mjoint + MjP∆) < (1.05 . Mjoint)
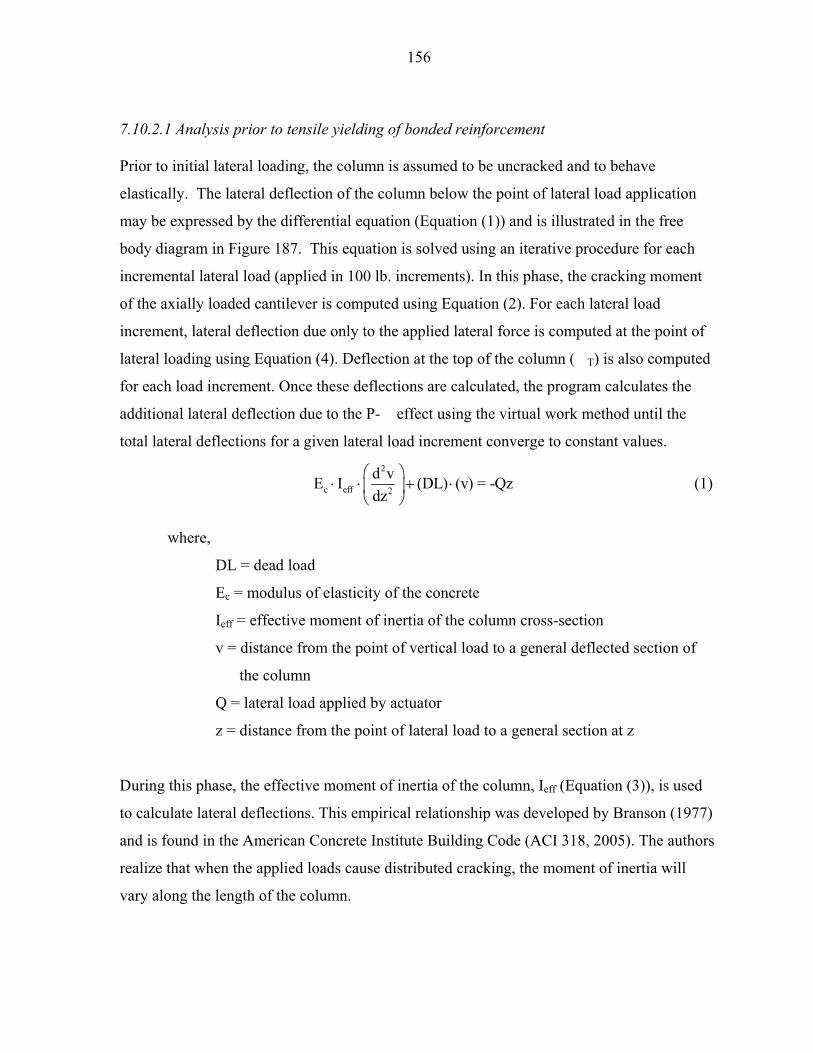
156
7.10.2.1 Analysis prior to tensile yielding of bonded reinforcement
Prior to initial lateral loading, the column is assumed to be uncracked and to behave
elastically. The lateral deflection of the column below the point of lateral load application
may be expressed by the differential equation (Equation (1)) and is illustrated in the free
body diagram in Figure 187. This equation is solved using an iterative procedure for each
incremental lateral load (applied in 100 lb. increments). In this phase, the cracking moment
of the axially loaded cantilever is computed using Equation (2). For each lateral load
increment, lateral deflection due only to the applied lateral force is computed at the point of
lateral loading using Equation (4). Deflection at the top of the column (�T) is also computed
for each load increment. Once these deflections are calculated, the program calculates the
additional lateral deflection due to the P-� effect using the virtual work method until the
total lateral deflections for a given lateral load increment converge to constant values. 2
c eff 2
d vE I (DL) (v) = -Qzdz
⋅ ⋅ + ⋅
(1)
where,
DL = dead load
Ec = modulus of elasticity of the concrete
Ieff = effective moment of inertia of the column cross-section
v = distance from the point of vertical load to a general deflected section of
the column
Q = lateral load applied by actuator
z = distance from the point of lateral load to a general section at z
During this phase, the effective moment of inertia of the column, Ieff (Equation (3)), is used
to calculate lateral deflections. This empirical relationship was developed by Branson (1977)
and is found in the American Concrete Institute Building Code (ACI 318, 2005). The authors
realize that when the applied loads cause distributed cracking, the moment of inertia will
vary along the length of the column.
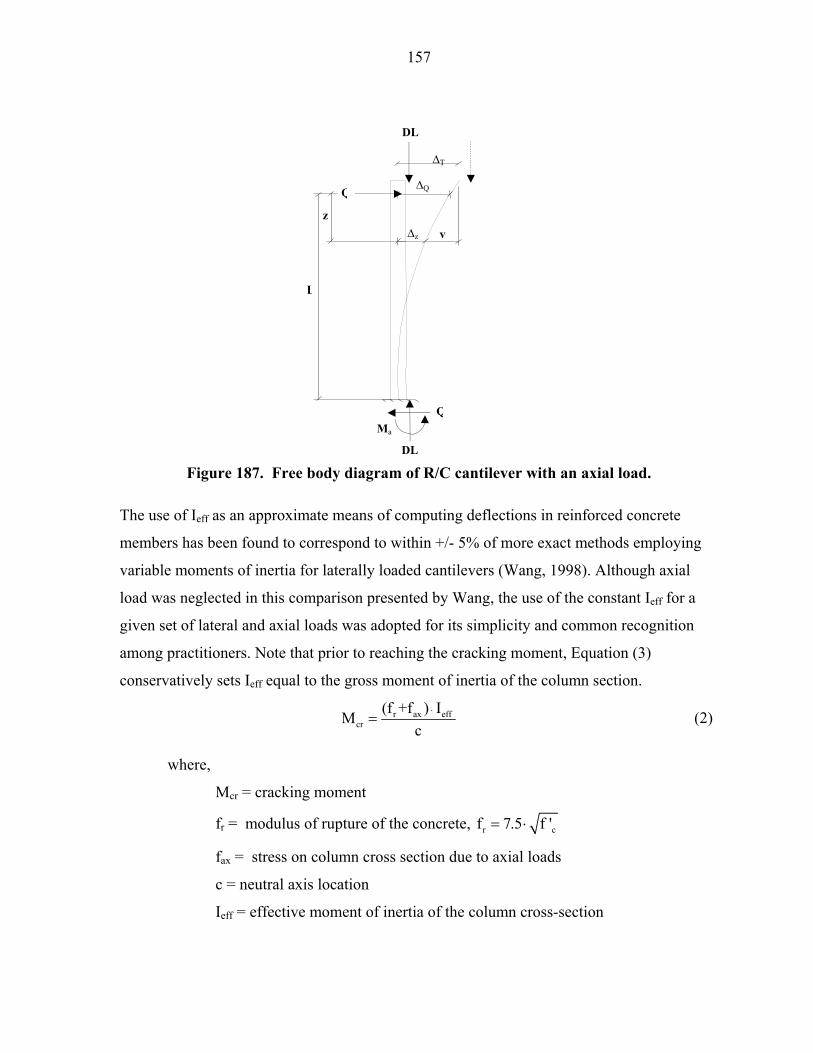
157
Figure 187. Free body diagram of R/C cantilever with an axial load.
The use of Ieff as an approximate means of computing deflections in reinforced concrete
members has been found to correspond to within +/- 5% of more exact methods employing
variable moments of inertia for laterally loaded cantilevers (Wang, 1998). Although axial
load was neglected in this comparison presented by Wang, the use of the constant Ieff for a
given set of lateral and axial loads was adopted for its simplicity and common recognition
among practitioners. Note that prior to reaching the cracking moment, Equation (3)
conservatively sets Ieff equal to the gross moment of inertia of the column section.
r ax effcr
(f +f ) IMc
⋅= (2)
where,
Mcr = cracking moment
fr = modulus of rupture of the concrete, r cf 7.5 f '= ⋅
fax = stress on column cross section due to axial loads
c = neutral axis location
Ieff = effective moment of inertia of the column cross-section
∆Q
v ∆z
Q
DL
∆T
L
z
Ma
DL
Q
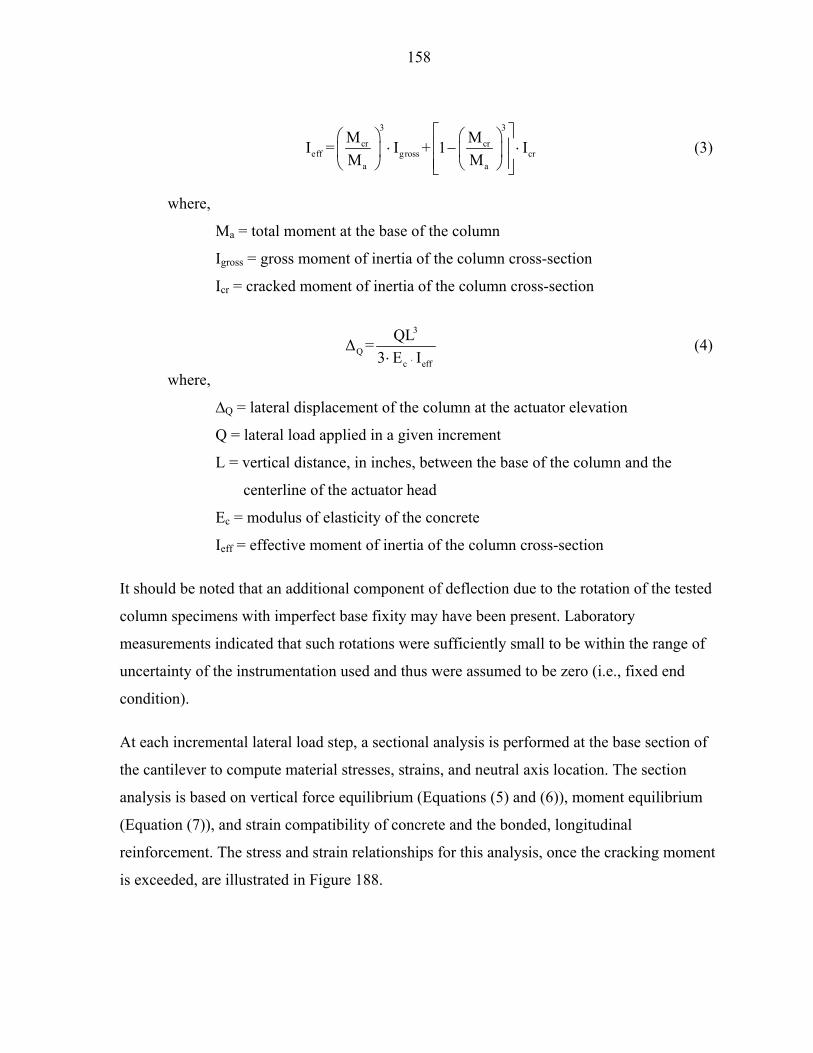
158
3 3
cr creff gross cr
a a
M MI = I + 1 IM M
⋅ − ⋅
(3)
where,
Ma = total moment at the base of the column
Igross = gross moment of inertia of the column cross-section
Icr = cracked moment of inertia of the column cross-section
3
Qc eff
QL∆ =3 E I⋅⋅
(4)
where,
∆Q = lateral displacement of the column at the actuator elevation
Q = lateral load applied in a given increment
L = vertical distance, in inches, between the base of the column and the
centerline of the actuator head
Ec = modulus of elasticity of the concrete
Ieff = effective moment of inertia of the column cross-section
It should be noted that an additional component of deflection due to the rotation of the tested
column specimens with imperfect base fixity may have been present. Laboratory
measurements indicated that such rotations were sufficiently small to be within the range of
uncertainty of the instrumentation used and thus were assumed to be zero (i.e., fixed end
condition).
At each incremental lateral load step, a sectional analysis is performed at the base section of
the cantilever to compute material stresses, strains, and neutral axis location. The section
analysis is based on vertical force equilibrium (Equations (5) and (6)), moment equilibrium
(Equation (7)), and strain compatibility of concrete and the bonded, longitudinal
reinforcement. The stress and strain relationships for this analysis, once the cracking moment
is exceeded, are illustrated in Figure 188.
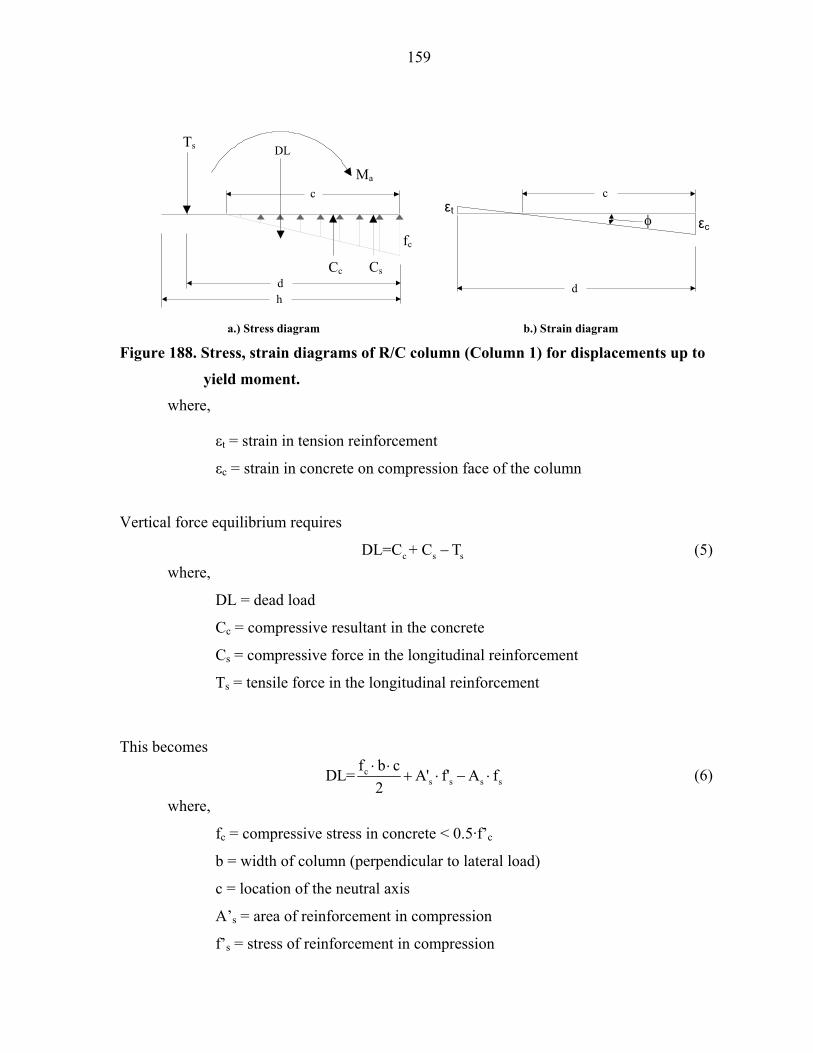
159
a.) Stress diagram b.) Strain diagram
Figure 188. Stress, strain diagrams of R/C column (Column 1) for displacements up to
yield moment. where,
εt = strain in tension reinforcement
εc = strain in concrete on compression face of the column
Vertical force equilibrium requires
c s sDL=C + C T− (5) where,
DL = dead load
Cc = compressive resultant in the concrete
Cs = compressive force in the longitudinal reinforcement
Ts = tensile force in the longitudinal reinforcement
This becomes
cs s s s
f b cDL= A' f' A f2⋅ ⋅
+ ⋅ − ⋅ (6)
where,
fc = compressive stress in concrete < 0.5·f’c
b = width of column (perpendicular to lateral load)
c = location of the neutral axis
A’s = area of reinforcement in compression
f’s = stress of reinforcement in compression
εc φ εt
d
c
Cc Cs
fc
Ts
Ma c
DL
h d
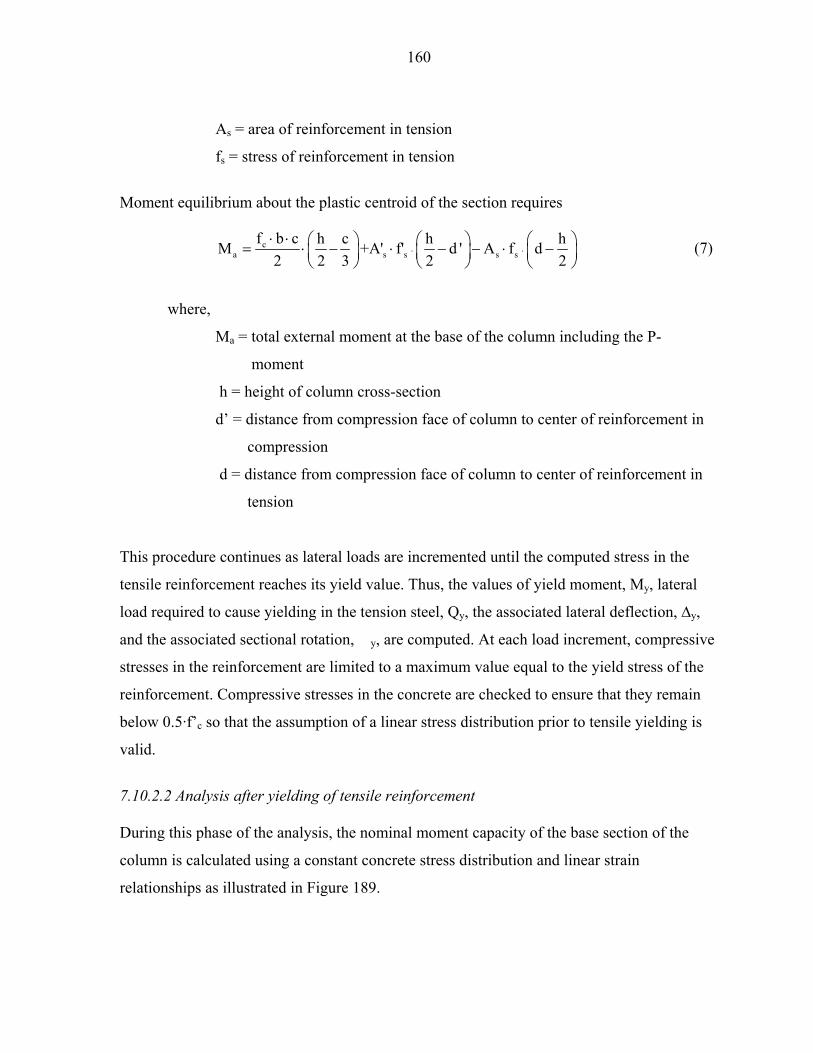
160
As = area of reinforcement in tension
fs = stress of reinforcement in tension
Moment equilibrium about the plastic centroid of the section requires
ca s s s s
f b c h c h hM +A' f' d ' A f d2 2 3 2 2
⋅ ⋅⋅ ⋅ = ⋅ − ⋅ − − ⋅ −
(7)
where,
Ma = total external moment at the base of the column including the P-�
moment
h = height of column cross-section
d’ = distance from compression face of column to center of reinforcement in
compression
d = distance from compression face of column to center of reinforcement in
tension
This procedure continues as lateral loads are incremented until the computed stress in the
tensile reinforcement reaches its yield value. Thus, the values of yield moment, My, lateral
load required to cause yielding in the tension steel, Qy, the associated lateral deflection, ∆y,
and the associated sectional rotation, �y, are computed. At each load increment, compressive
stresses in the reinforcement are limited to a maximum value equal to the yield stress of the
reinforcement. Compressive stresses in the concrete are checked to ensure that they remain
below 0.5·f’c so that the assumption of a linear stress distribution prior to tensile yielding is
valid.
7.10.2.2 Analysis after yielding of tensile reinforcement
During this phase of the analysis, the nominal moment capacity of the base section of the
column is calculated using a constant concrete stress distribution and linear strain
relationships as illustrated in Figure 189.
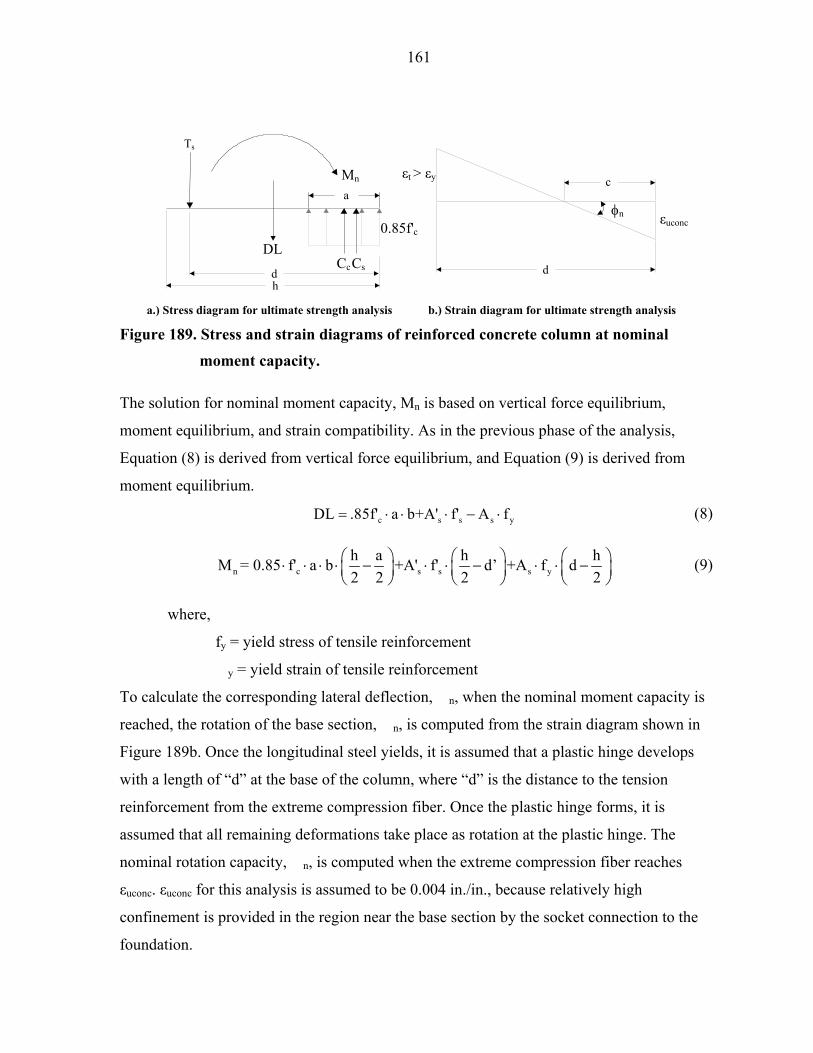
161
a.) Stress diagram for ultimate strength analysis b.) Strain diagram for ultimate strength analysis
Figure 189. Stress and strain diagrams of reinforced concrete column at nominal
moment capacity.
The solution for nominal moment capacity, Mn is based on vertical force equilibrium,
moment equilibrium, and strain compatibility. As in the previous phase of the analysis,
Equation (8) is derived from vertical force equilibrium, and Equation (9) is derived from
moment equilibrium.
c s s s yDL .85f' a b+A' f' A f= ⋅ ⋅ ⋅ − ⋅ (8)
n c s s s yh a h hM = 0.85 f' a b +A' f' d’ +A f d2 2 2 2
⋅ ⋅ ⋅ ⋅ − ⋅ ⋅ − ⋅ ⋅ −
(9)
where,
fy = yield stress of tensile reinforcement
�y = yield strain of tensile reinforcement
To calculate the corresponding lateral deflection, �n, when the nominal moment capacity is
reached, the rotation of the base section, �n, is computed from the strain diagram shown in
Figure 189b. Once the longitudinal steel yields, it is assumed that a plastic hinge develops
with a length of “d” at the base of the column, where “d” is the distance to the tension
reinforcement from the extreme compression fiber. Once the plastic hinge forms, it is
assumed that all remaining deformations take place as rotation at the plastic hinge. The
nominal rotation capacity, �n, is computed when the extreme compression fiber reaches
εuconc. εuconc for this analysis is assumed to be 0.004 in./in., because relatively high
confinement is provided in the region near the base section by the socket connection to the
foundation.
εuconc
d
c
φn
Cc Cs
0.85f'c DL
a Mn
Ts
h d
εt > εy
162
Once the strain profile of the base section at nominal moment capacity is established, the
nominal rotation capacity, �n, is computed using Equation (10).
uconcn arc tan
cε φ =
(10)
where,
�n = rotation at nominal moment capacity
εuconc = ultimate concrete compressive strain
Using the moment area method, the nominal deflection capacity of the column, ∆n, at the
point of lateral loading is found by Equation (11).
n y n yd( ) d (L )2
∆ = ∆ + φ − φ ⋅ ⋅ − (11)
where,
∆n = nominal deflection of the column at the lateral loading point when
nominal moment capacity is reached
∆y = lateral deflection at which tensile yielding of bonded reinforcement
occurs
d = distance to the tension reinforcement from the extreme compression face
L = vertical distance, in inches, between the base of the column and the
centerline of the actuator head
After accounting for the P-� moment as described previously, the nominal lateral load
capacity, Qn, is computed. Lateral loads and the corresponding deflections between the point
of first tensile yielding and nominal lateral load capacity are then back calculated using
simple linear interpolation.
7.10.3 Analysis of a jointed column with unbonded post-tensioning
In addition to the deflection of an unjointed reinforced column, columns with a segment joint
have another deflection component due to the rotation at the relatively compliant
construction joint as illustrated schematically in Figure 185b. Furthermore, the effects of the
unbonded post-tensioning must be taken into account for the jointed columns. To predict the
lateral force versus deflection behavior of the jointed columns, an additional section analysis
is performed at the construction joint. Due to the small relative thickness of the joint, a single
163
cross section at the center of the bearing plate is analyzed to determine rotation at this joint.
Here an additional incremental procedure for the member is performed to account for
changes in post-tensioning force as the column deflects laterally.
Similar to the analysis of an unjointed column, two phases of analysis are required: one phase
prior to yielding of the tension fuse plate and another phase after the tension fuse plate yields.
The following additional assumptions are associated with the section analysis of the
construction joint.
• The force in the compression fuse plate is neglected because the fuse plate will buckle
before sustaining significant compressive forces.
• A linear strain distribution is assumed in the bearing plate material.
• A linear stress distribution is assumed in the bearing plate material. Since the bearing
plate used in each test had at least twice the compressive strength of the surrounding
concrete, the compressive stress in the plate will be limited to less than half its
compressive strength and thus should remain approximately linear.
• Due to the relatively short length of the fuse plates, the tension fuse plate is treated as
if bonded to the concrete and thus is subjected to strain compatibility with the
concrete. Forces in the fuse plates are conservatively assumed to act at the extreme
fiber of the column cross section.
• An idealized elastic-plastic stress-strain curve is used for the fuse plate in tension.
• The stress and strain diagrams shown in Figure 189 are used at the construction joint
to determine the rotation at the joint section.
• The contribution of the side fuse plates are conservatively neglected.
7.10.3.1 Analysis prior to yielding of tension fuse plate
Again, force and moment equilibrium in conjunction with the assumed linear stress-strain
relationships formulate the basis used in the approach to develop the lateral load vs.
deflection, stress, and strain relationships of the segmented columns. These relationships are
given in Equations (12)-(14). Since the fuse plates and the bearing plate material for this
portion of the analysis are in their linear-elastic ranges, linear stress and strain relationships
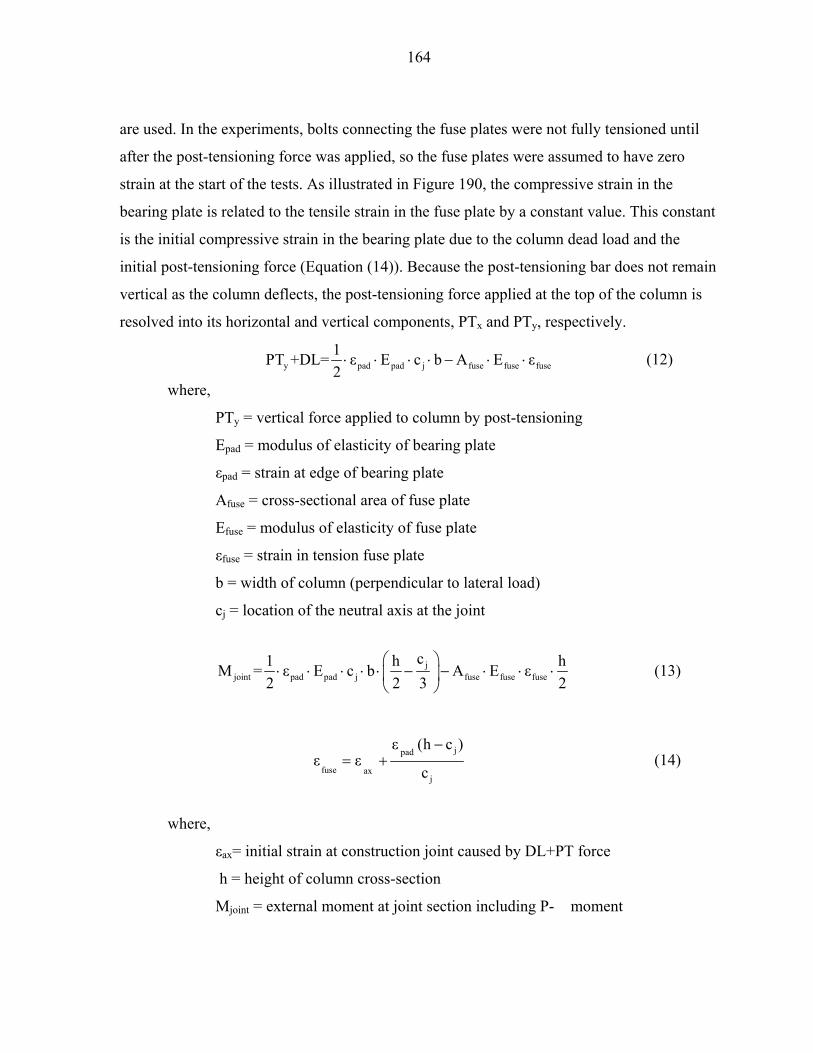
164
are used. In the experiments, bolts connecting the fuse plates were not fully tensioned until
after the post-tensioning force was applied, so the fuse plates were assumed to have zero
strain at the start of the tests. As illustrated in Figure 190, the compressive strain in the
bearing plate is related to the tensile strain in the fuse plate by a constant value. This constant
is the initial compressive strain in the bearing plate due to the column dead load and the
initial post-tensioning force (Equation (14)). Because the post-tensioning bar does not remain
vertical as the column deflects, the post-tensioning force applied at the top of the column is
resolved into its horizontal and vertical components, PTx and PTy, respectively.
y pad pad j fuse fuse fuse1PT +DL= ε E c b A E ε2
⋅ ⋅ ⋅ ⋅ − ⋅ ⋅ (12)
where,
PTy = vertical force applied to column by post-tensioning
Epad = modulus of elasticity of bearing plate
εpad = strain at edge of bearing plate
Afuse = cross-sectional area of fuse plate
Efuse = modulus of elasticity of fuse plate
εfuse = strain in tension fuse plate
b = width of column (perpendicular to lateral load)
cj = location of the neutral axis at the joint
j
joint pad pad j fuse fuse fuse
c1 h hM = ε E c b A E ε2 2 3 2
⋅ ⋅ ⋅ ⋅ ⋅ − − ⋅ ⋅ ⋅
(13)
jpad
fuse axj
ε (h c )ε ε
c
−= + (14)
where,
εax= initial strain at construction joint caused by DL+PT force
h = height of column cross-section
Mjoint = external moment at joint section including P-� moment
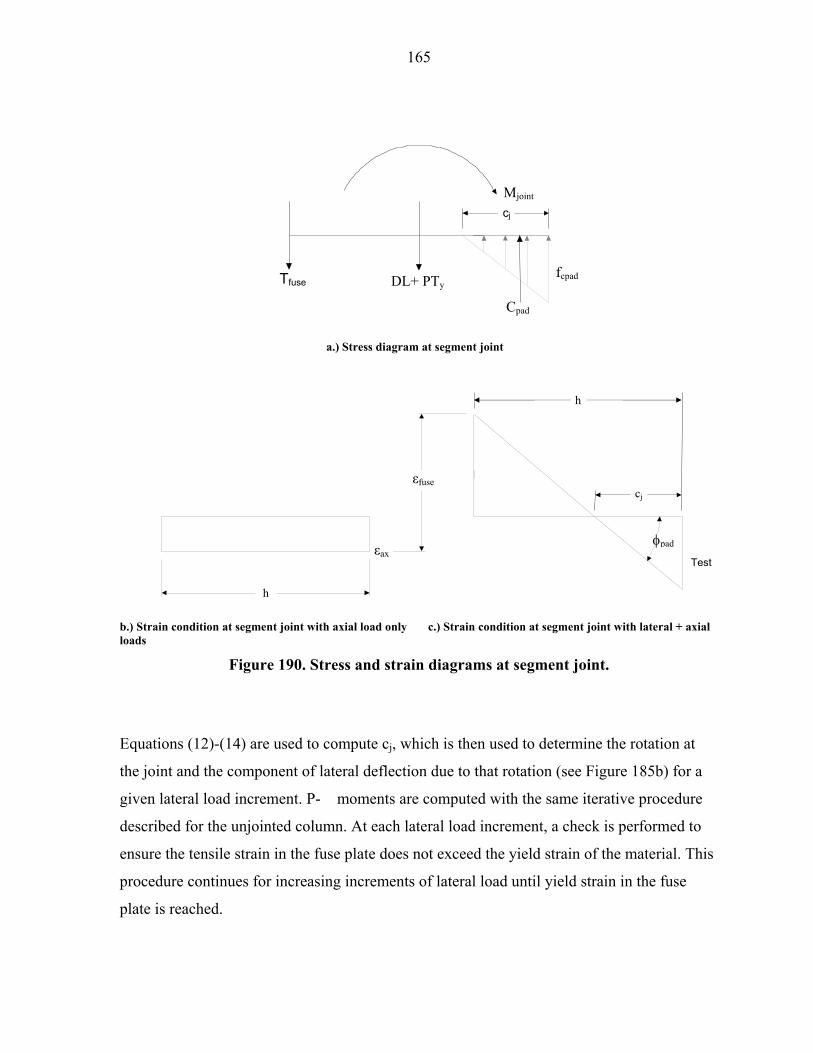
165
a.) Stress diagram at segment joint
b.) Strain condition at segment joint with axial load only c.) Strain condition at segment joint with lateral + axial loads
Figure 190. Stress and strain diagrams at segment joint.
Equations (12)-(14) are used to compute cj, which is then used to determine the rotation at
the joint and the component of lateral deflection due to that rotation (see Figure 185b) for a
given lateral load increment. P-� moments are computed with the same iterative procedure
described for the unjointed column. At each lateral load increment, a check is performed to
ensure the tensile strain in the fuse plate does not exceed the yield strain of the material. This
procedure continues for increasing increments of lateral load until yield strain in the fuse
plate is reached.
Tfuse DL+ PTy
Cpad
fcpad
Mjoint cj
φpad
εfuse
εax
h
cj
Test
h
166
7.10.3.2 Analysis after yielding of fuse plates
Once the fuse plate has yielded in tension, it is assumed to remain in a constant state of
stress. The value of cj is calculated from Equation (14) coupled with the following equations
representing force and moment equilibrium (Equations (15) and (16)).
y pad pad j fuse fusey
1PT +DL E c b A f2
= ⋅ε ⋅ ⋅ ⋅ − ⋅ (15)
jjoint pad pad j fuse fusey
c1 h hM E c b A f2 2 3 2
= ⋅ε ⋅ ⋅ ⋅ ⋅ − − ⋅ ⋅
(16)
where,
fuseyf = yield strength of fuse plate
Note that the term Mjoint includes the P-� moment computed for the lateral load increment.
The rotation at the joint and the resulting lateral deflections due to the joint rotation can then
be determined. The total lateral deflection of the column is computed by adding the
deflection of the unjointed column to the deflection due to the rotation at the relatively
compliant construction joint. Once the total lateral deflection is computed, the program
cycles until the total P-� moment converges on a stable value. The ultimate state rotation at
the joint is reached when the strain in the tension fuse plate reaches its ultimate strain, when
the post-tensioning bar yields, or when the concrete at the base of the column reaches its
ultimate compressive strain.
7.10.3.3 Unbonded post-tensioning analysis
To calculate the stresses induced in the unbonded post-tensioning, deflections are calculated
incrementally at every inch from the base of the column to the top. Between each increment,
linear interpolation is used to determine the elongation in the post-tensioning bar. The
elongations computed for each 1 inch increment of height are summed to determine the total
elongation of the post-tensioning bar.
An additional component of elongation is added to the post-tensioning bar when the
construction joint is included in the analysis. As a gap at the construction joint opens, the
post-tensioning bar elongates a corresponding amount. The additional component of
167
elongation of the post-tensioning bar is determined by computing the opening of the gap at
the center of the column.
Once the total elongation is computed for the bar, a linear stress-strain relationship is used to
determine the stress reached in the post-tensioning bar. A check is then performed to ensure
the stress in the post-tensioning bar does not exceed its yield stress of 120 ksi. The effect of
the post-tensioning change is computed within each of the loops for each lateral load
increment, so Equations (12)-(16) are updated continuously to correlate post-tensioning force
with lateral displacement.
7.11 Analytical Predictions
This analytical procedure was used with the applied loads, material properties, and geometry
of the columns tested in this study to compare the theoretical behavior with behavior
measured in the laboratory. Comparisons of the theoretical and measured lateral load versus
lateral deflection for Columns 1 and 5 are presented in Table 8. Such comparisons are not
shown for Columns 2-4 since these specimens failed prematurely through a mechanism that
the program did not consider. Neither are comparisons presented for Column 6 because the
nonlinear stress versus strain response of the SMA fuse plates was not accounted for in the
analytical procedure.
Analytical predictions for Column 1 matched the test results closely with the exception that
the program underpredicted the ultimate lateral load by 15%. If the yield stress of the
bonded reinforcement were actually greater than the specified minimum of 60 ksi, this
discrepancy could be reduced significantly.
Predictions for Column 5 were not as precise. Predicted values for the jointed column were
particularly dependent on deflection calculations required to predict behavior of the
unbonded post-tensioning. Deflection estimates for any concrete members are difficult due
to variations in moment of inertia caused by cracking patterns as well as to high sensitivity to
estimates of the concrete’s modulus of elasticity. This analysis is also sensitive to stress and
strain distributions computed at the construction joint.
Results are encouraging, but additional test data would be beneficial in further calibration
and refinement of the program. Slippage of the fuse plates also obscured the quantitative data
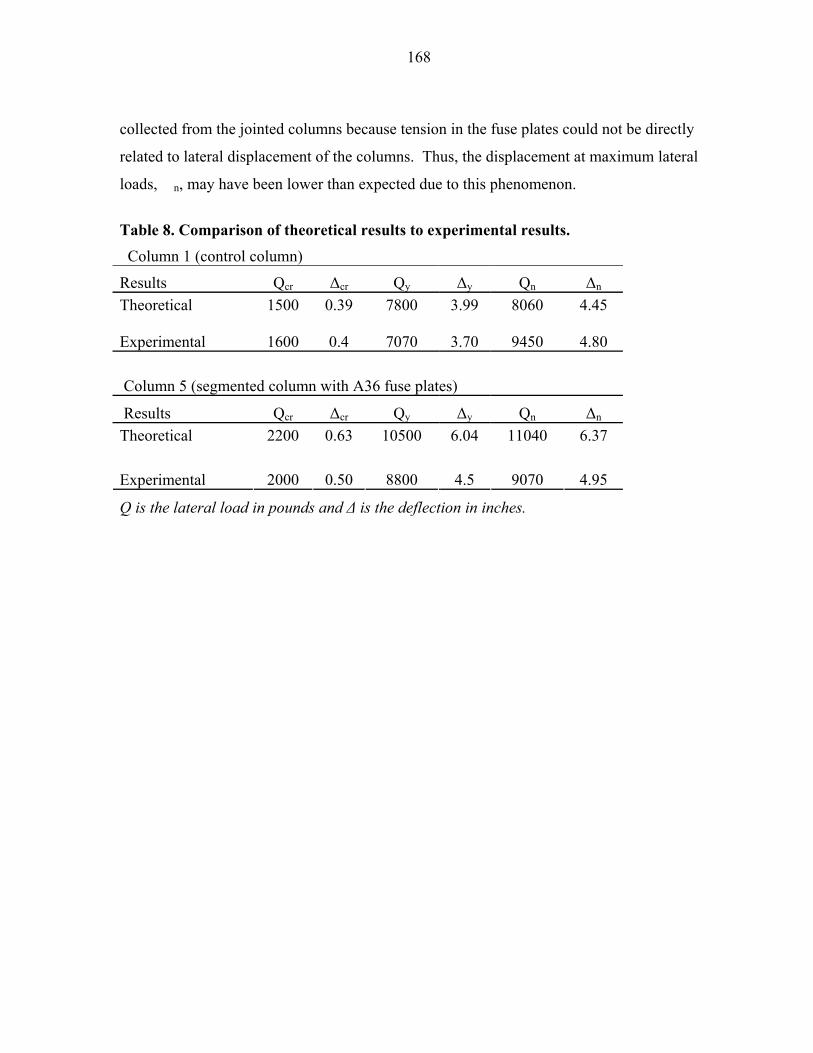
168
collected from the jointed columns because tension in the fuse plates could not be directly
related to lateral displacement of the columns. Thus, the displacement at maximum lateral
loads, �n, may have been lower than expected due to this phenomenon.
Table 8. Comparison of theoretical results to experimental results. Column 1 (control column)
Results Qcr ∆cr Qy ∆y Qn ∆n Theoretical 1500 0.39 7800 3.99 8060 4.45 Experimental 1600 0.4 7070 3.70 9450 4.80 Column 5 (segmented column with A36 fuse plates)
Results Qcr ∆cr Qy ∆y Qn ∆n Theoretical 2200 0.63 10500 6.04 11040 6.37 Experimental 2000 0.50 8800 4.5 9070 4.95
Q is the lateral load in pounds and ∆ is the deflection in inches.
169
8. CONCLUSIONS
8.1 Summary
Six concrete columns were constructed and tested in laboratory experiments that were
conducted to investigate the feasibility of a precast bridge pier column system. The columns
were evaluated for constructability, structural performance, and effectiveness of repair. Each
column was subjected to constant vertical dead loads and a regimen of cyclic, quasi-static
lateral loads. After sustaining significant lateral displacements, the jointed columns were
repaired by replacing the structural fuses at the segment joint. The columns were then
retested to failure to investigate the effectiveness of the repair.
To represent the behavior of a conventional reinforced concrete column and provide a basis
for comparison, Column 1 was cast as a single R/C column. Columns 2-4 failed prematurely
due to a detailing issue. Few results could be quantified, but several valuable detailing
improvements were recognized from these tests. Columns 5 and 6 were then tested and
compared with the control column using performance indicators. The results of the structural
performance of the columns are presented in Chapter 7.
8.2 Construction Aspects
Several details for expediting construction of the proposed system proved to be effective
from both labor and structural performance perspectives.
• Use of a prefabricated bearing plate at segment joints may reduce on-site labor by
eliminating grouting procedures at segment joints.
• Socket connections to the foundation were quick, clean, and robust, and simplified
positioning and alignment of the precast columns.
• The fuse plate connections at segment joints ensured alignment and eliminated the
need for temporary bracing during erection.
• Steel encasement of column segment ends protected concrete corners during handling
and erection. These steel collars also provided a flat, smooth surface for joining the
segments and eliminated the need for match casting.
• Because the post-tensioning was designed to be unbonded, no grouting of ducts was
required after post-tensioning.
170
• Concrete segments can be cast horizontally, eliminating the need for pumping,
scaffolding, or tall lifting equipment for handling.
• Repairing the columns by replacing damaged fuse plates was effective and required
minimal labor (~1 man-hour).
8.3 Structural Detailing
Testing identified both effective and unsatisfactory details in the jointed columns. Specific
detailing requirements identified include the following.
• The longitudinal bonded reinforcement must be anchored below all through-bolt
ducts at the segment joints in a manner to prevent the bolts and collars from “pulling
off” the end of the column. This is effectively achieved by using U-shaped bars that
wrap around the bolt ducts or by using appropriately shaped end anchors positioned at
the end of the precast segment. These anchors can even be welded to the segment end
plate to ensure positioning, but the weld is not structurally required.
• A steel plate welded to the end of the steel collars is effective in increasing
confinement of the crucial segment ends and is also a convenient means of producing
a smooth, flat interface with the bearing plate.
• Fuse plates connected on all four faces of the column provide additional confinement
of the segment ends and improve the performance of the column.
• The glass fiber reinforced polymer (GFRP) appeared to be the most effective material
for the bearing plate, showing no evidence of bulging, splitting or other damage.
Furthermore, this material is durable and easily laid up flat and cut to the required
dimensions. Its strength and elastic modulus matched well with requirements for the
desired system performance.
• A36 steel performed satisfactorily for the fuse plates. A36 is readily available in a
wide variety of plate thickness, is relatively inexpensive, and has a high ultimate
elongation.
• The advantages demonstrated by SMA fuse plates could be achieved more cost-
effectively by other means such as higher strength steel plates. In addition, the
relatively low strain capacity presents a risk of fracture as occurred in Column 6.
171
• Bolted slip-critical connections designed and tensioned to AISC standards for steel-
to-steel connections may not maintain clamping force when bearing on concrete. Slip
of the fuse plates adversely affected structural performance of the jointed columns.
More research on this effect is recommended.
8.4 Structural Behavior Aspects
The proposed segmented columns compared favorably in many respects to the control
column, which was a conventional reinforced concrete column.
• Similar or greater lateral strength can be achieved with the jointed column relative to
the conventional column.
• Both initial and (especially) residual lateral stiffnesses were greater for the jointed
column system than for the conventional column.
• The jointed columns had greater lateral deformation capacity than the conventional
column. The jointed system sustained their maximum loads to larger lateral
displacements and experienced a more gradual decrease in load capacity when
displaced beyond ultimate loads when compared to the conventional column. Column
5, in fact, developed no obvious failure mechanism even when displaced to the
maximum stroke of the actuator (10% drift).
• The jointed system dissipated far less hysteretic energy than the conventional
columns.
• The self-centering capability of the jointed system was demonstrated. Residual
deformations could be nearly eliminated. This property could allow a bridge
subjected to an extreme lateral load to remain in service until repair is performed.
8.5 Repair Aspects
One major advantage of the proposed system is the possibility for rapid, cost-effective repair
if damaged by an extreme load event. Repairs to jointed columns when subjected to design
level loads were highly effective. Some loss of lateral stiffness was observed, but no
evidence of reduction in lateral strength was apparent. Columns behaved similarly after
repair as they did initially. With fuse plates proportioned to yield prior to longitudinal
172
reinforcement, damage to precast column segments can be minimized as demonstrated in
Column 5. Cracks in the concrete remain small and close to the point of being difficult to
identify with the naked eye due to the combined post-tensioning force and dead loads.
Buckled plates offer clear evidence for maintenance engineers or technicians that
replacement is required.
173
9. RECOMMENDED RESEARCH Based on research completed to date, the proposed segmented column system is a feasible
alternative to conventional pier systems. Additional research is recommended to verify these
findings and address the following items.
• Slippage of the bolted fuse plates occurred during all of the segmented column tests.
Although the initial clamping force in the bolts was verified with direct tension
indicating washers, the friction between the fuse plates and column segments was
inadequate to prevent slip at large displacements. Factors that may have contributed
to this occurrence include strain hardening of the fuse plates, inelastic deformation of
the concrete within the steel collars leading to a reduction of clamping force, and
prying forces generated by the buckling of the fuse plates leading to inelastic
elongation of the bolts. Eliminating slippage of this friction connection would
improve the structural performance of the columns.
• Column 5 and 6 dissipated approximately ¼ and ½ of the total energy dissipated by
Column 1, respectively. Increasing the energy dissipation capacity of the jointed
columns could improve the global performance of a structure subjected to dynamic
loads. Possible means of achieving this goal without sacrificing small residual
displacements could be provided through the use of multiple joints or through the use
of advanced, nonlinear elastic materials for post-tensioning.
• Systems with multiple joints could provide opportunities to more precisely tailor
structural response and optimize cost savings. Multiple joints placed at strategic
locations could provide improvements in ductility, energy dissipation, redundancy,
and safety.
• Alternative materials and details for both the continuous elastic elements and
structural fuses could increase the effectiveness of the system. For example, the use
of unbonded composite strips on the external faces of the column might reduce post-
tensioning demands and increase deformation capacity.
• Corrosion protection for all components of the system is crucial. Corrosion and
environmental exposure should be systematically considered in material selection,
174
detailing, and coating selection. Cathodic protection systems might also be effectively
employed to protect exposed metallic components such as fuse plates.
• Connection details and procedures for attaching pier caps to columns should to be
investigated with respect to both constructability and structural performance. A
connection similar to the foundation socket used at the base of the column may prove
effective.
• Design specifications and procedures should calibrated and formalized to advance
this technology from the laboratory to general practice.
• Standardization of the structural elements could streamline precast operations and
make the proposed system more cost-effective. An inventory of standard components
could significantly reduce lead times for design, construction and repair as well as
reduce fabrication costs.
175
10. REFERNCES
Billington, S. L., Barnes, R. W., Breen, J. E. 2001. “Alternate substructure systems for standard highway bridges.” J. Bridge Eng., 6(2), 87-94.
Billington, S. L., Yoon, J.K. 2004. “Cyclic response of unbounded posttensioned precast columns
with ductile fiber-reinforced concrete.” J. Bridge Eng., 9(4), 353-363. Branson, Dan E. Deformation of Concrete Structures. New York: McGraw-Hill, 1977.
Hieber, D.G., J.M. Wacker, M.O. Eberhard, and J.F. Stanton. State-of-the-Art Report on Precast Concrete Systems for Rapid Construction of Bridges. Washington State Department of
Transportation Technical Report # WA-RD 594.1, Mar. 2005. Ikeda, S. (1998). “Seismic behavior of reinforced concrete columns and improvement by vertical
prestressing.” Challenges for Concrete in the Next Millennium, Proc., XIIIth FIP Congress, D. Stoelhorst and G. P. L. den Boer, eds, Vol. 1, Balkema Rotterdam, The Netherlands, 879-884.
Ito, T., Yamaguchi, T., and Ikeda, S. (1997). “Seismic performance of concrete piers prestressed in
vertical direction.” Proc., Japan Concrete Institute, 19(2), 1197-1202 (in Japanese). Kwan, W.-P., Billington, S.L. “Unbonded posttensioning concrete bridge piers. I: Monotonic and
cyclic analysis.” J. Bridge Eng., 8(2), 92-101. Rouse, J. M. 2003. Behavior of bridge pier columns with ductile fiber reinforced hinge regions and
vertical, unbonded posttensioning. PhD Thesis, Cornell University. Stephan, B., Restrepo, J., Seible, F. 2003. Seismic behavior of bridge columns built incorporating
MMFX steel. Final report. University of California, San Diego. Wang, Chu-Kia, Salmon, Charles G. Reinforced Concrete Design, Sixth Edition. United States of
America: Addison Wesley Educational Publishers, Inc, 1998.
176
ACKNOWLEDGEMENTS Funding for this investigation was provided by the Iowa Department of Transportation
Highway Division and the Iowa Highway Research Board. The authors are also grateful to
Sika, USA, Polymer Pipe Technology, LLC, Fyfe Company, LLC, and Dayton Superior for
their generous donations of both materials and advice. The authors also deeply appreciate
keen insight and support of the technical advisory committee consisting of Dean Bierwagen
of the Iowa Department of Transportation, Mark Nahra of Delaware County, Tom Schoellen
of Butler County, and Kim Triggs of Godbersen-Smith Construction Company. Furthermore,
the authors are thankful to Doug Wood at the Iowa State University Research Laboratory for
helping with many construction, setup, and testing aspects of the project, student assistants
Mike Siedsma, Xuhao Wang, and Bin Tong for their assistance with laboratory work, and
Casey Faber for his programming support and laboratory assistance.
177
BIOGRAPHICAL SKETCH Mark Christopher Currie was born September 14, 1984, in Ida Grove, Iowa. He received his
Bachelor of Science in Civil Engineering from Iowa State University in 2007 and the Master
of Science in Civil Engineering from Iowa State University in 2009. He served as a Research
Assistant in the Civil, Construction, and Environmental Engineering Department at Iowa
State University.


