Embed Size (px)
Citation preview

Semi-Annual Report & Unaudited Consolidated Financial Statements
31 JULY 2010

HarbourVest Global Private Equity Limited (“HVPE” or the “Company”) is a Guernsey-incorporated company listed on the Specialist Fund Market of the London Stock Exchange and Euronext Amsterdam by NYSE Euronext, the regulated market of Euronext Amsterdam, registered with the Netherlands Authority for the Financial Markets as a closed-end investment company pursuant to section 1:107 of the Dutch Financial Markets Supervision Act, and authorised as a closed-ended investment scheme in accordance with section 8 of the Protection of Investors (Bailiwick of Guernsey) Law, 1987, as amended, and rule 6.02 of the Authorised Closed-ended Investment Scheme Rules 2008. HVPE is managed by HarbourVest Advisers L.P. (the “Investment Manager”), an affiliate of HarbourVest Partners, LLC (“HarbourVest”), a private equity firm whose history dates back to 1982. HarbourVest is headquartered in Boston and has committed more than $30 billion to investments.
The Company issued 83,000,000 shares at $10.00 per share in December 2007.
COM
PANY
OVE
RVIE
W
Contents01 Key Highlights and Investment Strategy
Key DevelopmentsKey Financial HighlightsFinancial SummaryInvestment Strategy
04 Chairman’s Letter from Sir Michael Bunbury
06 Investment Manager’s ReviewResults for the Financial Period Ended 31 July 2010Portfolio ReviewKey Portfolio Facts as at 31 July 2010Commitments and Balance Sheet ReviewRecent EventsInvestment Manager’s Market CommentaryHVPE OutlookInvestment ManagerKey Definitions and Methodologies
43 Board of Directors and Statement of ResponsibilitiesBoard of Directors
45 Unaudited Consolidated Financial StatementsConsolidated Financial StatementsNotes to Consolidated Financial Statements
58 Forward-Looking StatementsPublication and Calculation of Net Asset ValueCertain Information
60 Advisors and Contact InformationKey InformationManagement and AdministrationContactCalendar of Events 2010/2011
Key Highlights and Investment Strategy 1
Key Highlights and Investment Strategy
As At, OR fOR thE sIx MONths ENdEd, 31 JulY 2010
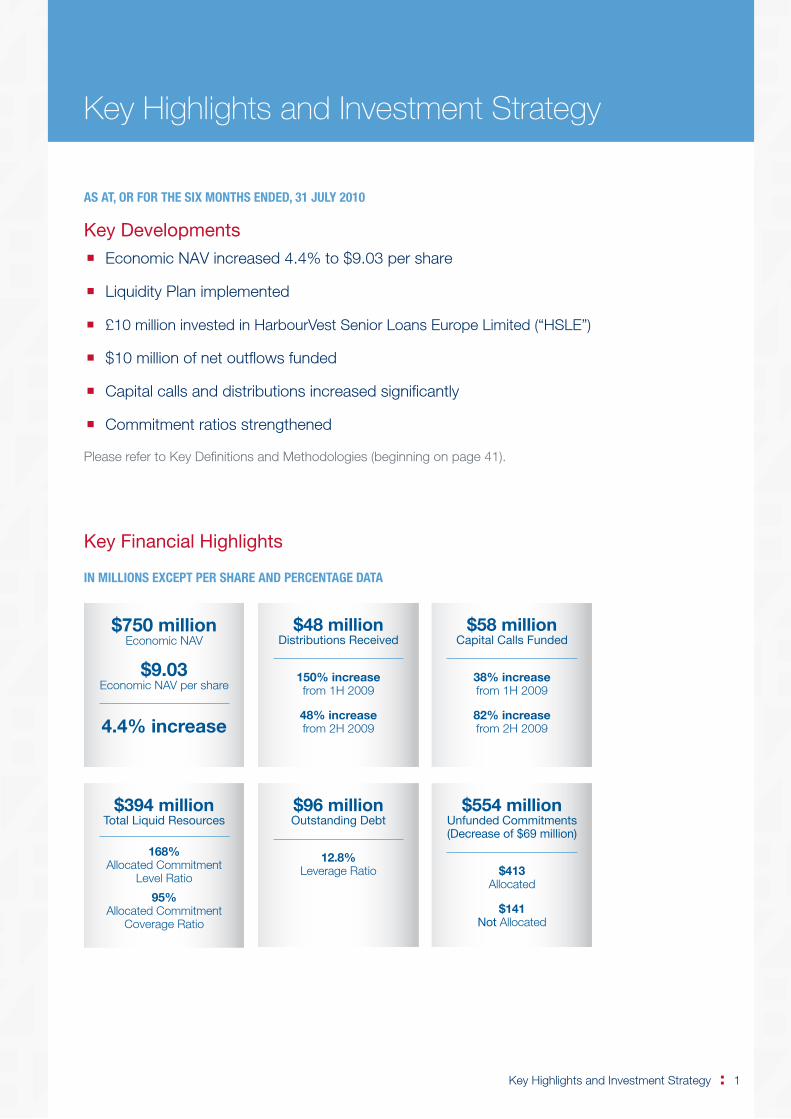
Key Developments
�� Economic NAV increased 4.4% to $9.03 per share
�� Liquidity Plan implemented
�� £10 million invested in HarbourVest Senior Loans Europe Limited (“HSLE”)
�� $10 million of net outflows funded
�� Capital calls and distributions increased significantly
�� Commitment ratios strengthened
Please refer to Key Definitions and Methodologies (beginning on page 41).
Key Financial Highlights
IN MIllIONs ExCEPt PER shARE ANd PERCENtAgE dAtA
$394 millionTotal Liquid Resources
168% Allocated Commitment
Level Ratio
95% Allocated Commitment
Coverage Ratio
$96 millionOutstanding Debt
12.8% Leverage Ratio
$554 millionUnfunded Commitments (Decrease of $69 million)
$413 Allocated
$141 Not Allocated
$48 millionDistributions Received
150% increase from 1H 2009
48% increase from 2H 2009
$58 millionCapital Calls Funded
38% increase from 1H 2009
82% increase from 2H 2009
$750 millionEconomic NAV
$9.03Economic NAV per share
4.4% increase

2 HarbourVest Global Private Equity
Financial Summary
(A) fINANCIAl hIghlIghts 31 July 2010 31 January 2010 Change
suMMARY Of ECONOMIC NEt AssEt VAluE1
(in millions except per share data)
NAV of Investments $844.9 $783.4 $61.5
Cash and Cash Equivalents 4.0 10.6 (6.6)
Outstanding Debt (95.7) (75.0) (20.7)
Net Other Assets (Liabilities) (3.6) (0.8) (2.8)
Economic NAV $749.6 $718.2 $31.4
Economic NAV per share (83.0 million shares outstanding) $9.03 $8.65 $0.38
suMMARY Of COMMItMENtsUnfunded Commitments (Allocated to Underlying Partnerships) $413.5 $447.7 ($34.2)
Unfunded Commitments (Not Allocated to Underlying Partnerships) 140.9 175.3 (34.4)
total unfunded Commitments $554.4 $623.0 ($68.6)
NAV of Investments + total unfunded Commitments $1,399.3 $1,406.4 ($7.1)
% Invested 113% 109% 4%
Commitment Level (Total Unfunded Commitments)2 187% 196% (9%)
Commitment Level (Allocated to Underlying Partnerships)3 168% 171% (3%)
Cash + Unused Committed Credit Facility $408.3 $435.6 ($27.3)
Cash + Remaining Available Credit Facility4 $393.6 $399.6 ($6.0)
1 The Company’s Investment Manager believes that Economic NAV per share is the most appropriate measure of economic value for investors. Economic NAV excludes the “fair value” of liabilities, booked under U.S. GAAP, related to Put Rights the Company has issued in connection with its Liquidity Plan. Please refer to the Liquidity Plan section (page 10) for additional information. As at 31 July 2010, HVPE’s NAV per share reported under U.S. GAAP is $8.98.
2 Reflects the NAV of investments plus total unfunded commitments divided by Economic NAV.
3 Reflects the NAV of investments plus unfunded commitments (allocated to underlying partnerships) divided by Economic NAV.
4 Available credit facility reflects amount available subject to most restrictive covenant limit applicable.

Key Highlights and Investment Strategy 3
Investment Strategy
HVPE seeks to provide a comprehensive private equity solution that delivers top-quartile performance
over a multi-year investment cycle. This goal is best achieved through a strategy which combines
a highly diversified portfolio of private equity assets with a strong balance sheet that can
support ongoing commitments through a range of economic environments.
All dAtA As At, OR fOR thE sIx-MONth PERIOd ENdEd, 31 JulY 2010
diversification� geography 64% U.S. | 28% Europe | 8% Asia Pacific and Rest of World� strategy 59% Buyout | 36% Venture | 5% Other� Vintage Year 18 Vintage years back to 1993
Historical data demonstrates the benefits of a well-diversified portfolio. Long-term returns tend to be cyclical across various segments, and a comprehensive private equity portfolio should strive to be consistently exposed to the most successful managers in their areas of expertise.
Conservative Balance sheet� $500 million Credit facility committed through 2014 (established at inception)� $393.6 million total liquid Resources (cash and available credit facility) available to fund $413 million
of allocated commitments and $554 million of total commitments
Based on the long-term and often uncertain timing of private equity commitments, listed private equity vehicles should maintain conservative balance sheets with adequate reserves to finance obligations.
Ongoing Commitments�� New Commitment: $14.4 million (£10.0 million) invested in HSLE�� Investments made through existing commitments to harbourVest funds: $43 million invested with
26 private equity managers in 40 partnership and direct investments (including secondary investments)
An efficient portfolio should be fully and consistently committed to the asset class, regardless of economic cycle. Many of the most successful vintage years for private equity have been during or just after recessionary periods when investments were more attractively priced.

4 HarbourVest Global Private Equity
Dear Shareholder, In the six months to 31 July 2010 your Company has continued to make steady progress in an uncertain economic climate. Sentiment in markets has waxed and waned. As I write this letter, confidence is on the up; but I anticipate that HVPE will operate in a volatile and uncertain environment for many months to come.
Once again the world economy has been driven by growth in developing markets. Indeed, some are showing signs of overheating, and some countries have begun to tighten monetary policy. However, in the major Western economies of the U.S. and Europe, growth continues to be relatively slow – but at least it is growth. There continues to be talk of a “double-dip” recession; but whilst I consider this to be a risk, I think it is still less likely than a continuation of relatively slow growth, perhaps for several years to come. Although the percentage of global GDP represented by the U.S. is slowly declining, nevertheless it is still far and away the largest economy in the world and the most important economy as far as the Company is concerned.
In line with other deeply indebted nations, recovery from the U.S. recession has been slower and less robust than normal. In my view, renewed confidence and a meaningful reduction in unemployment are not likely until the U.S. housing market, and the mortgage problems that go with it, have stabilised. I believe that this recovery remains some way in the future, and meanwhile I expect the relevant authorities to continue to run a very loose monetary policy with interest rates remaining close to zero. This environment is allowing banks to rebuild balance sheets and debt markets to open. Both of these have impacts on the Company’s investments, with funding available once again to finance new transactions and the opportunity to refinance existing funding, particularly by extending maturities.
THE COMPANY AND ITS PORTFOLIOIn the six months to 31 July 2010, the Company made further steady progress with Economic Net Asset Value (“Economic NAV”) per share rising from $8.65 to $9.03, or by 4.4%. Over the same period the MSCI World Index (U.S. dollar) increased by 1.2%. The Economic NAV is based overwhelmingly on 30 June valuations of private equity assets received from underlying managers together with 31 July valuations of listed investments. Many of
those private equity valuations were not available when the Company released its preliminary estimate of Economic NAV of $8.76 per share at 31 July on 13 August, which was based on 31 March valuations updated for events, currency movement, and cash flows. The availability of the actual 30 June numbers has resulted in an uplift over that preliminary estimate of 27 cents, or 3.1%. While this positive adjustment is rather larger than the Company has shown in earlier reporting periods, it is a reflection of the increase in underlying valuation over the 31 March to 30 June reporting period.
The freeze in transactions, which has been evident since 2008, began to thaw, and consequently, the pace of capital calls and distributions picked up significantly. Excluding the investment of £10 million in HarbourVest Senior Loans Europe Limited, details of which are given in the Investment Manager’s Review, the Company paid calls of $57.9 million and received distributions of $48.2 million in the six-month period.
The maturity of the Company’s portfolio, which contains investments dating back as far as 1987, gives me confidence that, as long as listed markets remain stable and corporations choose to use their substantial cash balances for trade acquisitions, realisations will continue to flow. It is this maturity, combined with a three-tiered investment structure and the staged drawdowns typical of a largely fund-of-funds portfolio, that allows our Investment Manager to maintain a higher Commitment Level Ratio than many other listed private equity companies. A higher Commitment Level Ratio increases exposure to private equity assets, which are, after all, what our shareholders seek exposure to. The position is underpinned by our debt facility provided by the Bank of Scotland plc, now a subsidiary of Lloyds Banking Group plc, which is available until December 2014. As I have previously written, our Investment Manager models our portfolio on the basis that any debt will be repaid out of normal cash flow before the expiry of the facility. Meanwhile, the Company continues to use a proportion of its debt facility to smooth cash flows, and, at 31 July, was 12.8% geared.
Our Investment Manager’s experience is that commitments should be made regularly throughout the cycle. Consequently, the Board has recently approved an initial commitment of $50 million to
Chairman’s Letter from Sir Michael Bunbury

Chairman’s Letter 5
HarbourVest Partners IX, a U.S. fund-of-funds. The commitment is divided between buy-out, venture, and debt funds and is expected to be drawn down over a period of seven to nine years.
THE LIQUIDITY PLANIn my letter dated 26 May in the Annual Report to 31 January 2010, I set out in detail the Liquidity Plan that the Company had implemented that month. 4.76 million shares were placed by our Joint Brokers at a price of $5.75 per share. Buyers had the right to register for a Put Right to sell their shares back to the Company in November 2011 at the lower of $5.75 or Economic Net Asset Value at 31 October 2011. The Company committed $40 million to fund the Put Rights, and, after the Secondary Placing, some 2.19 million further Put Rights were available for issue.
In the last few weeks prior to the publication of this report, there has been significant turnover in our shares, with 1.7 million changing hands at various prices, mostly at or around $5.20 per share. The purchasers were eligible to register for identical Put Rights and most did so. The principal exceptions were in relation to 13,500 further shares bought by directors who did not consider it appropriate to avail themselves of the Put Right. As I write this letter, 211,460 Put Rights remain available for issue.
The Company has a contingent obligation to buy back up to $40 million of its shares. If the holders of the Put Rights exercise their rights in November 2011, that is very likely to be NAV accretive for ongoing shareholders. At worst, it will not be dilutive. The Liquidity Plan is a step along the road of broadening the Company’s shareholder base. We have been able to welcome new shareholders and there has been a very material, albeit sporadic, pick up in liquidity. We hope this will continue and will work with our advisers to build on the progress made so far.
At 31 July 2010 the last trade at $5.35 per share was at the equivalent of a discount to NAV of 41%. Whilst there has been some recovery in listed private equity companies’ discounts from the depths of early 2009, the sector continues to be out of favour with investors. It is impossible to tell how long that situation will continue. However, as long as our Investment Manager continues to grow the underlying NAV in the
way it has succeeded in doing with its funds-of-funds for 28 years, I and my fellow directors are confident that eventually patience will be rewarded. All of the Independent Directors are shareholders, and four increased their holdings in July and August 2010.
As previously advised, the Company’s shares are now dual-listed on Euronext Amsterdam and the Specialist Fund Market of the London Stock Exchange. The London market listing allows shares to be registered into CREST so the Company knows the identity of, and can keep in direct contact with, shareholders. The same cannot be said of those shares registered through Euroclear in Amsterdam, and unless and until Euroclear changes its practice, I very much hope that shareholders will choose to register their shares in CREST in London so the Company can ensure direct communication.
CONCLUSIONWe live in uncertain and, indeed in many respects, unprecedented times. Although there has been recovery from the dangerous trough of late 2008, many aspects of the world’s financial system and economy, particularly those in developed Western nations, remain uncertain and fragile. Meanwhile, though, the unquenchable entrepreneurial spirit of individuals and of teams within companies continues, and that spirit provides opportunities for profitable investing in private equity assets. Our Investment Manager will continue to seek those managers and opportunities that will add value to our Company and we look forward to more normal market conditions in which our shareholders can benefit fully from that added value.
I would like to thank our shareholders for their support and, as always, we welcome any comments. We have further expanded the information disclosed in our semi-annual report and continue to strive to make sure that our shareholders and other readers of our reports are as well informed as possible.
Yours sincerely,
Michael Bunbury 29 September 2010

6 HarbourVest Global Private Equity
Investment Manager’s Review
Results for the Financial Period Ended 31 July 2010
�� Economic NAV increased 4.4% to $9.03 per share
�� Valuation gains across the portfolio despite challenging public markets and declining euro
CHANGE IN ECONOMIC NET ASSET VALUE�� Six-month increase driven primarily by
U.S. fund-of-funds�� Declining euro and other foreign currencies
resulted in $0.12 per share negative impact
As at 31 July 2010, HVPE’s Economic Net Asset Value (“Economic NAV”) was $749.6 million, or $9.03 per share. This represents an increase of $0.38 per share, or 4.4% over the financial period from 31 January 2010 ($8.65).
HVPE’s Investment Manager believes that Economic NAV is the most appropriate measure of economic value to holders of its shares. Economic NAV excludes the fair value of the liability arising as a result of the issuance of Put Rights as part of the Company’s Liquidity Plan (see following) and represents the most conservative outcome upon the maturity of the Put Rights in November 2011. As at 31 July 2010, HVPE’s NAV per share reported under U.S. GAAP in the accompanying unaudited financial statements is $8.98.
The increase in Economic NAV during the six-month period ended 31 July 2010 took place despite a more challenging economic and market environment, particularly in the second half of the period. During the period from 31 December 2009 to 30 June 2010, the valuation period for HVPE’s underlying private investments, public markets (MSCI World Index-Local) were down 7.8%. Likewise, the 5.9% depreciation of the euro relative to the U.S. dollar from 31 January 2010 through to 31 July 2010 negatively affected HVPE, as approximately 19% of the underlying portfolio is denominated in euros. While currency changes had a negative impact on HVPE’s dollar-based Economic NAV per share during the financial period, the Company’s U.K. and Europe-based investors that may value their
investments in local currency may have been positively affected by the U.S. dollar’s movement. The Economic NAV per share in euro terms was €6.92 at 31 July 2010, and Economic NAV per share in sterling terms was £5.76. This represented a semi-annual Economic NAV per share increase of 10.9% in euros and 6.5% in sterling, as illustrated in the chart below.
ECONOMIC NAV PER shARE
$ € £31-Jan-2010 8.65 6.24 5.4131-Jul-2010 9.03 6.92 5.76Change 0.38 0.68 0.35% Increase 4.4% 10.9% 6.5%
When analysing changes in Economic NAV per share, HVPE’s Investment Manager reviews realised and unrealised gains and losses by HarbourVest fund category, as well as the impact of foreign currency movement and expenses. As shown in Exhibit B, of the $0.38 increase in Economic NAV per share in the financial period ended 31 July 2010, $0.35 resulted from HarbourVest U.S. fund-of-funds, $0.18 from HarbourVest international fund-of-funds, $0.07 from HarbourVest direct funds, and $0.04 from the global secondary fund. Unrealised foreign currency losses reduced NAV by $0.12 per share, and operating expenses reduced NAV by $0.14 per share.
(B) ChANgEs IN hVPE ECONOMIC NAV PER shARE31 January 2010 to 31 July 2010
$9.03
$8.65
$0.18
$0.35
$0.07 $0.04 ($0.12)($0.14)
$7.00
$7.50
$8.00
$8.50
$9.00
$9.50
NAV
at
31-J
AN-1
0
Harb
ourV
est
U.S.
Fun
d-of
-Fun
ds
Harb
ourV
est
Inte
rnat
iona
l Fun
d-of
-Fun
ds
Harb
ourV
est
Dire
ct F
unds
Harb
ourV
est
Seco
ndar
y Fu
nd
Unre
alis
ed F
orei
gn
Curre
ncy
Loss
es
Oper
atin
g Ex
pens
es
NAV
at
31-J
UL-1
0

Investment Manager’s Review 7
Gains for HarbourVest’s U.S., international, and direct funds were enhanced by improving operating results at many underlying companies, which offset declining market multiples and the generally negative market environment in the second half of the period. Secondary investment activity increased during the financial period, and Dover VII, HVPE’s global secondary fund, made a number of new investments. Some portfolios that were purchased at discounts to NAV during the period experienced valuation increases as 30 June 2010 valuations were received. The largest gains within the HVPE portfolio were generated by HarbourVest VI Partnership, a mature U.S. fund-of-funds that is currently harvesting its investments, and HarbourVest VIII Buyout, an actively investing fund-of-funds focused on buyouts.
VALUE CHANGES BY STRATEGY�� Buyout outperformed venture�� Greatest sub-segment gain was large buyout
The strategic benefit of maintaining a diverse portfolio remains clear in HVPE’s performance for the financial period ended 31 July 2010.
The overall change in the value of the portfolio was driven by the varying performance results for venture capital and buyout strategies in the underlying investments. Exhibit C highlights the NAV performance experienced by the venture portfolio (and its sub-segments), the buyout portfolio (and its sub-segments), and the portion of the portfolio invested in other private equity strategies, including mezzanine and distressed debt. Each bar in the chart reflects the six-month performance gain in that segment, while the numbers at the top of the chart represent each segment’s share of HVPE’s NAV at 31 July 2010. For comparison, each segment’s NAV performance for the prior year ended 31 January 2010 has been provided at the bottom of each bar.
(C) PERfORMANCE BY stRAtEgY*31 January 2010 to 31 July 2010
-5%
0%
5%
10%
15%
Large Buyout
12%
Medium Buyout
28%
Small Buyout
19%
Growth Equity 11%
Balanced Venture
11%
Early Venture
14%
-5%
0%
5%
10%
15%
Total Other5%
Total Buyout
59%
Total Venture
36%
HVPE Overall
5%3%
0.1%
3%
-2%
8%
13%
2%
6%
0.6%
7%18% 26% 31%15% 41%13% 0% 15%7%
% ofNAV
Year Ended 31/01/2010Strategy Performance
PORTFOLIO STRATEGY VENTURE AND BUYOUT STRATEGY
* Based on NAV of Investments, adjusted for cash flows.
Data includes primary, secondary, and direct investments.

8 HarbourVest Global Private Equity
During the financial period ended 31 July 2010, buyout, which makes up 59% of the portfolio, increased in value by 5%, while venture, representing 36% of the portfolio, was effectively flat with an increase in value of 0.1%. The Other category, which represents primarily mezzanine and distressed debt, experienced the largest gain at 13%, but represents only 5% of HVPE’s NAV.
Buyout valuations, which tend to be benchmarked to public markets, showed improvement despite the negative movement of these markets. During the underlying valuation period from 31 December 2009 through to 30 June 2010, the MSCI World Index was down 7.8% in local currency terms. The negative impact of foreign currency movement, which has a disproportionate effect on buyouts, also was overcome as the euro declined by 5.9% during the period from 31 January 2010 through to 31 July 2010.
Within the sub-segments of the buyout and venture portfolios, there was significant variation in performance. Within buyout, large buyouts (up 8%) and small buyouts (up 6%) outpaced medium buyouts (up 3%). Within venture, which is less
correlated to public markets, early stage and balanced venture were up 2% and 0.6%, respectively, while growth equity was down 2%.
In addition, the Investment Manager has reviewed changes in the Value to Cost (V/C) multiple for the portfolio by sector, from 31 January 2010 to 31 July 2010. The V/C multiple indicates the gain or loss of underlying company investments relative to cost. The sector analysis is relevant as the valuations of companies in the portfolio are often driven by both market multiples for peer companies in their industry as well as the underlying industry trends that drive company financial performance. The V/C multiples by sector are shown in Exhibit D. The HVPE portfolio’s overall V/C ratio increased from 1.07 times at 31 January 2010 to 1.16 times at 31 July 2010, with the largest increase in the Financial sector. While Media/Telecom remains below cost at 0.86 times, all sectors experienced V/C ratio increases during the financial period.
Detail on recent events that affected HVPE’s underlying portfolio NAV is included in the Commitments and Balance Sheet Review section of the Investment Manager’s Review. These include underlying 2010 IPO and M&A events by strategy.
(d) VAluE-tO-COst MultIPlE BY sECtOR31 January 2010 to 31 July 2010
0.0x
0.5x
1.0x
1.5x
HVPE Portfolio
OtherBusinessServices
FinancialIndustrialTechnologyConsumerMedia/ Telecom
Medical/Biotech
1.231.17
0.860.85
1.271.21
1.17
1.05
1.30
1.161.22
1.01
1.17
1.03
1.211.17 1.16
1.07
31 JANUARY 201031 JULY 2010
% of Portfolio 18% 17% 13% 12% 18% 18% 25% 24% 9% 10% 7% 6% 5% 5% 5% 8%

Investment Manager’s Review 9
EXPENSES�� $12 million, or $0.14 per share for the period�� Include management fees, fees related to credit
facility, and operating expenses (including non-recurring Liquidity Plan expenses)
Expenses represented $12.0 million, or a $0.14 per share impact on Economic NAV, during the financial period ended 31 July 2010. HVPE has three major categories of expenses: (i) management fees paid to HarbourVest funds; (ii) financing fees and expenses related to its $500 million credit facility; and (iii) operating expenses including compensation, travel, insurance, and directors’ fees, as well as third party legal, administrative, accounting, and other expenses.
The $12.0 million of expenses exclude $4.3 million of non-cash expenses ($0.05 per share) related to the issuance of Put Rights in connection with HVPE’s Liquidity Plan.
As an investor in HarbourVest funds, HVPE is charged the same management fees on committed capital and is subject to the same performance allocations as other investors in those funds. In HVPE’s Unaudited Consolidated Financial Statements, these fees are included in the change in NAV for the HarbourVest funds. However, for the purposes of this analysis, they have been reclassified as direct HVPE expenses in order to provide a comprehensive and transparent view of operating costs. For the financial period ended 31 July 2010, management fees totaled $7.4 million, or a rate of 106 basis points on average Private Equity Exposure (NAV of Investments plus Total Unfunded Commitments) on an annualised basis.
The multi-currency revolving credit facility, which expires in December 2014, bears variable interest at LIBOR plus 150 basis points on drawn amounts and carries an annual commitment fee of 40 basis points on the unused portion. During the financial period ended 31 July 2010, total facility-related expenses were $1.6 million. On average, HVPE had $83.4 million of borrowing outstanding over the period. During the period, the Company continued to benefit from historically low interest rates with one-month LIBOR (USD) costs averaging 27 basis points over the six months to 31 July 2010.
HVPE’s operating costs were approximately $3.1 million in the financial period ended 31 July 2010, compared to $1.5 million during the six months ended 31 July 2009. The primary driver of the increase was expenses related to HVPE’s Liquidity Plan (see following section), which was implemented in May 2010. Expenses related to this plan totaled $1.7 million, primarily related to financial advice and placement fees, as well as legal expenses. Excluding the one-time impact of the Liquidity Plan, operating costs for the six-month period were lower by $0.1 million or 6.7% compared to the six months ended 31 July 2009.

10 HarbourVest Global Private Equity
LIQUIDITY PLAN�� Implemented in May 2010�� 1,720,423 shares traded from 1 August 2010
through to 29 September 2010�� 211,460 Put Rights remain to be issued as at
29 September 2010
In May 2010, HVPE implemented its Liquidity Plan, which took actions intended to:�� Diversify HVPE’s shareholder base;�� Provide a trading platform that is more easily
accessible to U.K.-based investors; �� Raise the Company’s profile in the London market;�� Increase liquidity in HVPE’s shares; and�� Enhance the long-term marketability of the
Company’s shares.
On 12 May 2010, HVPE was admitted to the Specialist Fund Market of the London Stock Exchange. Additionally, on 18 May 2010, HVPE’s joint corporate brokers, J.P. Morgan Cazenove and Oriel Securities Limited, co-ordinated a secondary placing of 4.8 million existing HVPE shares at $5.75 per share, which were predominantly placed with new investors. Finally, HVPE provided a “Put Right” to eligible purchasers of its shares both in the secondary placing and thereafter, in the public markets (the “Market Put Right Offer”). The Put Right allows holders to sell their shares back to HVPE on 15 November 2011 at the lower of $5.75 or estimated Economic NAV per share as at 31 October 2011.
The Company’s maximum potential obligation related to the Put Rights is to repurchase 6,956,521 of its shares in November 2011 at a maximum aggregate price of $40 million, which would be funded through available resources, including HVPE’s credit facility. Any share repurchase under the Put Right Offer would be accretive, or at worst neutral to HVPE’s NAV per share.
As at 31 July 2010, 5,035,958 Put Rights had been issued and 1,920,563 Put Rights remained to be issued.
As at 29 September 2010, the number of Put Rights issued had increased to 6,745,061, and 211,460 Put Rights remain available for eligible investors who purchase shares in the market and follow the required registration process. For additional information on the Liquidity Plan, please refer to the press releases on HVPE’s website at www.hvgpe.com/press_releases.
The Liquidity Plan is the first step in an
ongoing process to improve trading in
the Company’s shares.
NET ASSET VALUE METHODOLOGY�� NAV based on 30 June 2010 valuations for
private holdings and 31 July 2010 valuations for public securities
�� Valuations represent Fair Market Value under U.S. GAAP
HVPE’s 31 July 2010 Economic NAV is based on the 30 June 2010 NAV of each HarbourVest fund, adjusted for changes in the value of public securities, foreign currency, known material events, cash flows, and operating expenses during July 2010. The valuation of each HarbourVest fund is presented on a fair market value basis in accordance with U.S. GAAP.
The 2008 adoption of ASC 820 (formerly FAS 157) in the U.S., which requires managers to present their portfolios on a fair market value basis in accordance with U.S. GAAP, has resulted in some private valuations, particularly buyouts, trending more closely alongside public markets. HVPE’s NAV is influenced by public markets in two primary ways. First, the public securities in the portfolio (approximately 17%) are directly influenced by market movements. Second, the private companies in the portfolio whose values are benchmarked against public company comparables can be influenced by market movements in related sectors. In many cases, venture valuations tend to be less correlated to market movements than buyout valuations due to the smaller size of the companies and fewer comparable public companies.

Investment Manager’s Review 11
NEW COMMITMENTS�� One new HarbourVest fund investment: HSLE�� HVPE’s HarbourVest funds committed $43 million
to primary, secondary, and direct investments during the six-month period (excluding HSLE)
On 26 May 2010, HVPE made its first new commitment to a HarbourVest fund since July 2008. The Company invested £10.0 million ($14.4 million) in HarbourVest Senior Loans Europe Limited (HSLE), a new fund managed by an affiliate of HarbourVest Partners and listed on the London Stock Exchange. HSLE invests in existing and new senior secured loans to private equity-backed, mid-market companies in Europe, including the U.K. HVPE’s Investment Manager believes that the HSLE investment provides an attractive opportunity to further diversify the HVPE portfolio with fixed income exposure while providing incremental opportunities for capital appreciation and current cash earnings. The HSLE investment was funded using sterling-denominated credit facility borrowings.
In addition to the commitment to HSLE, during the financial period to 31 July 2010, the Company also continued to benefit from the ongoing commitments made by six of the actively-investing HarbourVest funds in the portfolio. In total, these funds made new commitments to 26 private equity managers and 40 partnerships and direct investments (including secondary investments, which can include transactions made up of multiple partnerships) during the six-month period. Secondary investments often include managers and partnerships already held in the portfolio. The funds committed a total of approximately $9 million to primary investments, $31 million to secondary investments, and $3 million to direct investments (excluding HSLE) on HVPE’s behalf (see Exhibit E).
New primary commitments during the six-month period were to partnerships with the following characteristics:
MANAgER gEOgRAPhY stRAtEgY
ABRY Partners U.S. Mezzanine Debt
Battery Ventures U.S. Balanced Venture
gilde Buy-Out Partners Europe Medium Buyout
Redpoint Ventures U.S. Early Stage Venture
southern Cross Capital Management
Latin America Small Buyout
third Rock Ventures U.S. Early Stage Venture
(E) hVPE’s shARE Of hARBOuRVEst fuNds’ NEW COMMItMENts*
Six Months Ended 31 July 2010
U.S.
Europe
Asia Pacific
Rest of World
Primary Partnerships
Secondary Investments
Direct Investments
58%
37%
15%
31%
2%
30%
3%
3%
4%
29%
20%
11%
3%
54%
Early Stage Venture
Balanced Venture
Venture/Growth Equity
Small Buyouts
Medium Buyouts
Large Buyouts
Other
TYPE
STRATEGY
GEOGRAPHY
* Represents $57 million of new commitments, including HSLE.
HSLE is categorised as a Direct Investment/Other/Europe.
HVPE’s HarbourVest funds continue to
evaluate new opportunities across markets,
selecting those with the most attractive
return potential.
12 HarbourVest Global Private Equity
Portfolio Review
PORTFOLIO DIVERSIFICATION STRATEGY�� Diversification by geography, strategy, vintage year,
and industry are key to HVPE’s ongoing success
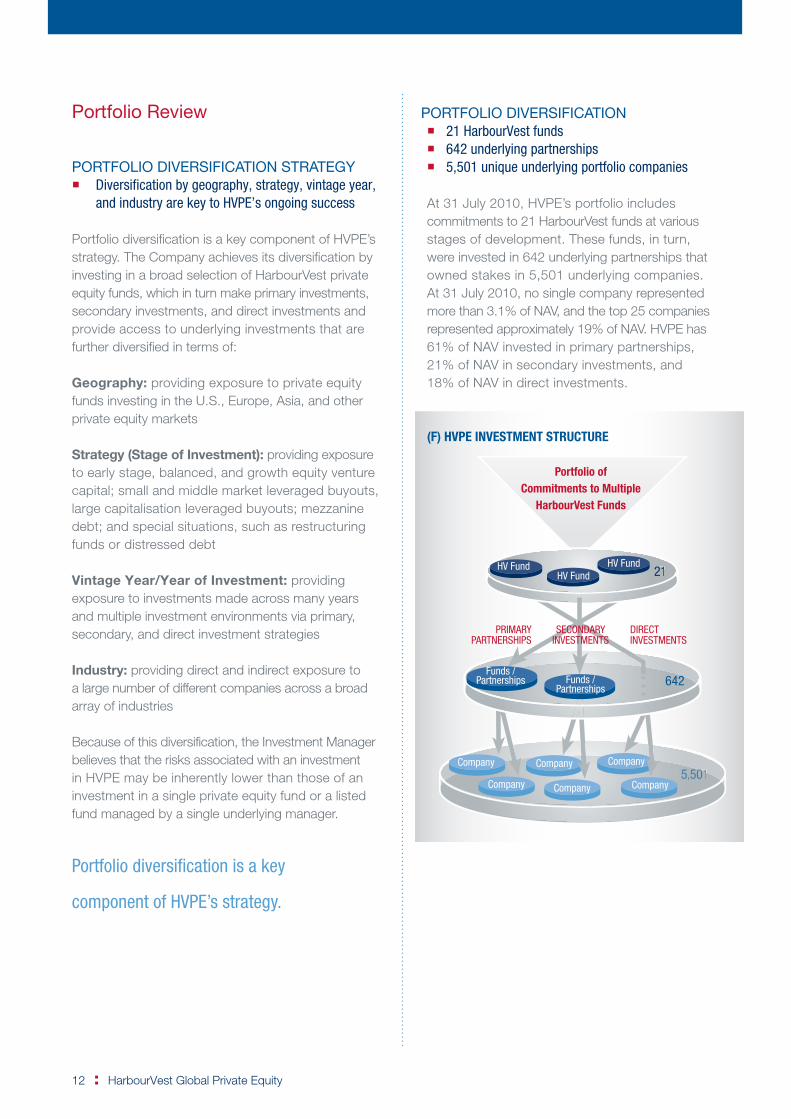
Portfolio diversification is a key component of HVPE’s strategy. The Company achieves its diversification by investing in a broad selection of HarbourVest private equity funds, which in turn make primary investments, secondary investments, and direct investments and provide access to underlying investments that are further diversified in terms of:
Geography: providing exposure to private equity funds investing in the U.S., Europe, Asia, and other private equity markets
Strategy (Stage of Investment): providing exposure to early stage, balanced, and growth equity venture capital; small and middle market leveraged buyouts, large capitalisation leveraged buyouts; mezzanine debt; and special situations, such as restructuring funds or distressed debt
Vintage Year/Year of Investment: providing exposure to investments made across many years and multiple investment environments via primary, secondary, and direct investment strategies
Industry: providing direct and indirect exposure to a large number of different companies across a broad array of industries
Because of this diversification, the Investment Manager believes that the risks associated with an investment in HVPE may be inherently lower than those of an investment in a single private equity fund or a listed fund managed by a single underlying manager.
Portfolio diversification is a key
component of HVPE’s strategy.
PORTFOLIO DIVERSIFICATION�� 21 HarbourVest funds�� 642 underlying partnerships�� 5,501 unique underlying portfolio companies
At 31 July 2010, HVPE’s portfolio includes commitments to 21 HarbourVest funds at various stages of development. These funds, in turn, were invested in 642 underlying partnerships that owned stakes in 5,501 underlying companies. At 31 July 2010, no single company represented more than 3.1% of NAV, and the top 25 companies represented approximately 19% of NAV. HVPE has 61% of NAV invested in primary partnerships, 21% of NAV in secondary investments, and 18% of NAV in direct investments.
(f) hVPE INVEstMENt stRuCtuRE
Company
Company
Company
Company
Company
Company
PRIMARYPARTNERSHIPS
Funds /Partnerships
HV FundHV Fund
HV Fund
Funds /Partnerships
DIRECTINVESTMENTS
SECONDARYINVESTMENTS
5, 01501
21
642
Portfolio ofCommitments to Multiple
HarbourVest Funds

Investment Manager’s Review 13
PORtfOlIO lIstINgThe Portfolio Listing illustrates HVPE’s diversity and shows the major attributes of the 21 HarbourVest funds in which HVPE is invested.
types of Investments Primary geographic focus strategy
fund/Investment Name PRIMARY SECONDARY DIRECT U.S. EUROPE ASIA ROW VENTURE BUYOUT MEZZ/DEBT
u.s. fuNd-Of-fuNds
HarbourVest IV Partnership • • • • •
HarbourVest V Partnership • • • • •
HarbourVest VI Partnership • • • • •
HarbourVest VI Buyout Partnership • • • •
HarbourVest VII Venture Partnership • • • •
HarbourVest VII Buyout Partnership • • • •
HarbourVest VIII Venture • • • • •
HarbourVest VIII Buyout • • • • •
HarbourVest VIII Mezzanine and Distressed Debt • • • • • •
INtERNAtIONAl fuNd-Of-fuNds
HIPEP II Partnership • • • • • • •
HIPEP III Partnership • • • • • • •
HIPEP IV Partnership • • • • • • •
HIPEP V 2007 European Buyout • • •
HIPEP VI Partnership • • • • • •
dIRECt fuNds
HarbourVest V Direct • • • •
HarbourVest VI Direct • • • •
HIPEP II Direct • • • • • •
HIPEP IV Direct • • • • • •
2007 Direct Fund • • • • • •
HarbourVest Senior Loans Europe • • • •
glOBAl sECONdARY fuNd
Dover VII • • • • • • • •

14 HarbourVest Global Private Equity
dIVERsIfICAtION At A glANCE
Key Portfolio Facts as at 31 July 2010
HVPE analyses its portfolio by vintage year, year
of investment, strategy, geography, and industry
and strives to be fully diversified across all of
these metrics, as illustrated in Exhibit g.
Vintage Year and Year of Investment are broken out
between Buyout and Venture and, where appropriate
for comparison, the number in parentheses next
to a bar represents the percentage of NAV as at
31 January 2010.
VINTAGE YEAR AND YEAR OF INVESTMENT�� HVPE’s vintage year diversification is measured
using the year of initial capital call for primary partnerships and direct funds and the year of purchase for secondary investments. Year of investment diversification is based on the year the underlying portfolio company investment was made.
�� Investments spread over a range of 18 vintage years back to 1993, and 24 years of investment back to 1987�– By vintage year, 62% of NAV is in years prior
to 2005 and post 2007�– By year of investment, 56% of NAV is in
years prior to 2005 and post 2007–Within the 2005 to 2007 year of investment,
the portfolio remains well diversified by strategy with buyouts made during this period representing 28% of total NAV (large buyout investments made during this period represent 9% of NAV)
(g) PORtfOlIO dIVERsIfICAtION BY INVEstMENt PERIOdAs at 31 July 2010
2010
2009
2008
2007
2006
2005
2004
2003
2002
2001
2000
1999
Pre-1999
4%
4%
8%
14%
14%
8%
8%
5%
8%
1%
5%
11%
10%
2010
2009
2008
2007
2006
2005
2004
2003
2002
2001
2000
1999
Pre-1999
4%
2%
7%
13%
17%
12%
4%
2%
4%
4%
4%
14%
13%
VINTAGE YEAR* YEAR OF INVESTMENT*
VentureBuyout/Other
* Percentages reflect total Vintage Year / Year of Investment.Diversification charts add to 100% of NAV. Please refer to Key Definitions and Methodologies.

Investment Manager’s Review 15
STRATEGY (STAGE OF INVESTMENT)�� Venture capital assets (early stage, balanced,
and growth equity) make up 36% of NAV�� Buyout investments make up 59% of NAV,
with only 12% of the total portfolio in large, leveraged buyout transactions
GEOGRAPHY�� The portfolio is invested 64% in the U.S.,
28% in Europe, and 8% in the rest of the world with significant geographic variability between venture and buyout
�� Within the venture portfolio (36% of NAV), approximately 80% is held in the U.S., with 15% in Europe and 5% in the rest of the world
�� Within the buyout portfolio (59% of NAV), approximately 57% is held in the U.S., with 34% in Europe and 9% in the rest of the world
�� Underlying partnerships are based in 26 countries and denominated in eight different currencies (See Management of Foreign Currency Exposure)
INDUSTRY�� HVPE’s broadly diversified industry allocation
is positioned defensively in the current economic environment
�� Diversification reflects HVPE’s significant venture capital allocation with meaningful exposure to technology and software (22%) and medical/biotech (17%)
�� Approximately 67% of HVPE’s NAV is held in sectors that have outperformed the MSCI World Index over the last six months
(g) PORtfOlIO dIVERsIfICAtION BY stRAtEgY, gEOgRAPhY, ANd INdustRYAs at 31 July 2010 (and 31 January 2010)
64% (64%)
28% (28%)
4% (4%)
4% (4%) Cleantech
Tech Services
Consumer Other
Business Services
Financial
Tech Other
Other
Industrial
Software
Media/Telecom
Consumer Products
Medical/Biotech
Asia Pacific
Rest of World
Europe
U.S.
Other
Large Buyouts
Medium Buyouts
Small Buyouts
Venture/Growth Equity
Balanced Venture
Early Stage Venture 17% (18%)
13% (12%)
12% (13%)
10% (11%)
10% (9%)
8% (5%)
2% (3%)
4% (4%)
5% (6%)
6% (7%)
8% (7%)
5% (5%)
28% (30%)
19% (19%)
11% (12%)
11% (12%)
14% (14%)
12% (10%)
5% (3%)
INDUSTRY
GEOGRAPHY
STRATEGY

16 HarbourVest Global Private Equity
fuNd lIstINg21 harbourVest funds across 18 Vintage Years at different stages of developmentAll data shown in U.S. dollars (millions) at 31 July 2010
fund/Investment Name (fund Currency) Vintage Year(s)
Original Commitment
Amount ($)
% of fund owned by
hVPE % Called
u.s. fuNd-Of-fuNds
HarbourVest IV Partnership ($) 1993 – 1996 $56.0 28.5% 95.0%
HarbourVest V Partnership ($) 1996 – 1999 148.0 24.4 98.0
HarbourVest VI Partnership ($) 1999 – 2005 258.8 9.2 95.5
HarbourVest VI Buyout Partnership ($) 1999 – 2003 10.0 0.9 94.0
HarbourVest VII Venture Partnership ($) 2003 – 2006 132.5 6.6 80.5
HarbourVest VII Buyout Partnership ($) 2003 – 2007 70.0 3.5 78.0
HarbourVest VIII Venture ($) 2006 – 2010 50.0 2.4 53.5
HarbourVest VIII Buyout ($) 2006 – 2010 250.0 8.5 46.5
HarbourVest VIII Mezzanine and Distressed Debt($) 2006 – 2010 50.0 10.3 41.5
total u.s. fund-of-funds (9)
INtERNAtIONAl fuNd-Of-fuNds
HIPEP II Partnership ($) 1995 – 1998 $145.0 18.1% 98.1%
HIPEP III Partnership ($) 1998 – 2001 230.0 13.8 97.0
HIPEP IV Partnership ($) 2001 – 2005 125.0 5.8 93.0
HIPEP V 2007 European Buyout (€) 2007 – 2008 69.8 24.9 44.5
HIPEP VI Partnership (€)* 2008 – 2011 138.6 10.4 3.5
total International fund-of-funds (5)
dIRECt fuNds
HarbourVest V Direct ($) 1997 $48.0 15.8% 100.0%
HarbourVest VI Direct ($) 1999 87.5 17.3 98.5
HIPEP II Direct ($) 1995 21.0 20.8 100.0
HIPEP IV Direct ($) 2001 80.0 21.4 100.0
2007 Direct Fund ($) 2007 100.0 13.6 41.8
HarbourVest Senior Loans Europe (£) 2010 14.4 9.9 100.0
total direct funds (6)
glOBAl sECONdARY fuNd
Dover VII ($) 2007 – 2010 $100.0 3.4% 29.5%
tOtAl
* Fund has not held final close at 31 July 2010.

Investment Manager’s Review 17
(h) PORtfOlIO AllOCAtIONBased on Investment Value ($844.9 million) Amount unfunded ($554.4 million)
59% U.S. Fund-of-Funds23% International Fund-of-Funds14% Direct Funds 4% Global Secondary Fund
44% U.S. Fund-of-Funds32% International Fund-of-Funds11% Direct Funds13% Global Secondary Fund
$ Called during six Months
Ended 31 July 2010
$ distributed during six
Months Ended 31 July 2010
Investment Value (NAV) at 31 July 2010
($)
Investment Value as %
of total
Amount unfunded at 31 July 2010
($)
Amount unfunded as
% of total
total Exposure at 31 July 2010
($)
$0.0 $0.0 $4.2 1% $2.8 0% $7.0
0.0 1.9 26.6 3 3.0 1 29.6
2.6 12.3 142.2 17 11.6 2 153.8
0.0 0.7 5.9 1 0.6 0 6.5
4.0 3.3 106.9 13 25.8 5 132.7
3.1 2.6 52.4 6 15.4 3 67.8
3.0 0.0 25.8 3 23.3 4 49.1
23.8 0.0 114.1 13 133.7 24 247.8
2.0 1.7 18.3 2 29.2 5 47.5
$38.5 $22.5 $496.4 59% $245.4 44% $741.8
$0.0 $0.0 $7.9 1% $2.9 1% $10.8
0.0 13.9 77.8 9 6.9 1 84.7
2.5 3.5 80.1 10 8.7 1 88.8
3.6 0.0 28.0 3 34.4 6 62.4
3.0 0.0 3.3 0 126.0 23 129.3
$9.1 $17.4 $197.1 23% $178.9 32% $376.0
$0.0 $0.0 $5.5 1% $0.0 0% $5.5
0.0 7.6 16.0 2 1.3 0 17.3
0.0 0.0 0.2 0 0.0 0 0.2
0.0 0.0 39.1 4 0.0 0 39.1
1.8 0.0 43.2 5 58.3 11 101.5
N/M 0.0 16.0 2 0.0 0 16.0
$1.8 $7.6 $120.0 14% $59.6 11% $179.6
$8.5 $0.7 $31.4 4% $70.5 13% $101.9
$57.9 $48.2 $844.9 100% $554.4 100% $1,399.3

18 HarbourVest Global Private Equity
LARGEST MANAGERS AS AT 31 JULY 2010�� No external manager represents more than 1.8% of NAV�� HVPE’s investments provided exposure to 642 fund interests across multiple high-quality managers
(compared to 630 at 31 January 2010 and 628 at 31 July 2009)
For each strategy and region, the largest private equity managers based on HVPE’s NAV at 31 July 2010 are listed here. The managers are grouped by percentage of investment value and shown in alphabetical order. As the investment manager of the HarbourVest direct funds, HarbourVest Partners, LLC is the largest manager held in HVPE, although not listed here.
lARgEst MANAgERs BY stRAtEgY BAsEd ON INVEstMENt VAluE
top 25 Venture Capital/growth Equity top 25 Buyout top 10 Mezzanine and Other
�� In aggregate, these managers represented 18.7% of investment value
�� The five largest managers represented 6.7% of investment value
�� In aggregate, these managers represented 23.9% of investment value
�� The five largest managers represented 8.0% of investment value
�� In aggregate, these managers represented 2.2% of investment value
�� The five largest managers represented 1.4% of investment value
1.5% to 2.0% of Investment Value 1.5% to 2.0% of Investment Value up to 0.5% of Investment ValueNew Enterprise Associates BC Partners ABRY PartnersOak Investment Partners The Blackstone Group Capital Resource Partners
1.0% to 1.5% of Investment Value CVC Capital Partners Clearwater Capital Partners
Accel Partners Silver Lake Management Falcon Investment AdvisorsTA Associates 1.0% to 1.5% of Investment Value Indigo Capital
0.5% to 1.0% of Investment Value American Capital Levine Leichtman Capital Partners
Atlas Venture Doughty Hanson & Co. Oaktree Capital ManagementAustin Ventures IK Investment Partners RBS Asset ManagementBattery Ventures The Jordan Company Sun Capital Partners†Draper Fisher Jurvetson Nordic Capital Welsh, Carson, Anderson & StoweFoundation Capital 0.5% to 1.0% of Investment ValueHighland Capital Partners Accretive Exit Capital PartnersInterWest Partners Alpha GroupJerusalem Venture Partners† Apax PartnersMenlo Ventures Bain CapitalPitango Venture Capital BS Investments
Polaris Venture Partners Clyde Blowers CapitalSanderling Venture Partners GTCR Golder RaunerSequoia Capital Hellman & FriedmanSofinnova Partners* Kelso & CompanySummit Partners KKR Associates EuropeThoma Bravo Kohlberg Kravis Roberts & Co.
up to 0.5% of Investment Value Leonard Green & Partners
DCM Providence Equity PartnersHealthCare Ventures TPG Asia†Mayfield Fund TPG Capital†Tenaya Capital Welsh, Carson, Anderson & Stowe† Versant Ventures
* Jean-Bernard Schmidt, an Independent Director of HVPE, is Managing Partner of Sofinnova Partners.
† Manager not included in largest managers at 31 January 2010.

Investment Manager’s Review 19
lARgEst MANAgERs BY REgION BAsEd ON INVEstMENt VAluE
top 25 u.s. top 25 Europe top 10 Asia and Rest of World
�� In aggregate, these managers represented 24.3% of investment value
�� The five largest managers represented 8.2% of investment value
�� In aggregate, these managers represented 16.7% of investment value
�� The five largest managers represented 6.8% of investment value
�� In aggregate, these managers represented 4.4% of investment value
�� The five largest managers represented 2.8% of investment value
1.5% to 2.0% of Investment Value 1.5% to 2.0% of Investment Value 0.5% to 1.0% of Investment ValueThe Blackstone Group BC Partners Advent InternationalNew Enterprise Associates CVC Capital Partners Jerusalem Venture PartnersOak Investment Partners 1.0% to 1.5% of Investment Value Pitango Venture Capital
Silver Lake Management Doughty Hanson & Co. TPG Asia†
1.0% to 1.5% of Investment Value IK Investment Partners up to 0.5% of Investment ValueAmerican Capital Nordic Capital Brait Manager Mauritius LimitedThe Jordan Company 0.5% to 1.0% of Investment Value CHAMP
TA Associates Alpha Group Clearwater Capital PartnersThoma Bravo Apax Partners CVC Capital Partners AsiaWelsh, Carson, Anderson & Stowe Atlas Venture Gestion TechnoCap†
0.5% to 1.0% of Investment Value BS Investments Mid Europa Partners
Accel Partners† Clyde Blowers Capital
Accretive Exit Capital Partners† KKR Associates Europe Bain Capital Quadriga CapitalDraper Fisher Jurvetson Sofinnova Partners*GTCR Golder Rauner up to 0.5% of Investment ValueHellman & Friedman Accel Partners InterWest Partners Bain Capital Europe†Kelso & Company CapVis Limited Leonard Green & Partners Cinven LimitedMenlo Ventures Encore Ventures Polaris Venture Partners EQT ManagersProvidence Equity Partners Exponent Private EquitySanderling Venture Partners Index VentureSequoia Capital† Kennet Venture PartnersSummit Partners Permira AdvisersTPG Capital† RBS Asset Management†
Tempo Capital Partners
* Jean-Bernard Schmidt, an Independent Director of HVPE, is Managing Partner of Sofinnova Partners.
† Manager not included in largest managers at 31 January 2010.

20 HarbourVest Global Private Equity
LARGEST UNDERLYING COMPANIES AS AT 31 JULY 2010�� No single portfolio company represents more than 3.1% of NAV�� Only four companies are greater than 1% of NAV
At 31 July 2010, the HVPE portfolio included interests in 5,501 company investments (held by the HarbourVest funds both directly and indirectly), compared to 5,529 at 31 January 2010 and 5,600 at 31 July 2009. The 25 largest portfolio company investments based on NAV at 31 July 2010 are listed by percentage of investment value. Companies in bold below are held at least in part in HarbourVest direct funds and represent 14 of the top 25 holdings. In most cases, HarbourVest has access to more detailed financial and operating information on these companies, and in some cases, HarbourVest representatives sit on the companies’ Board of Directors. There are five companies listed below that were not included in HVPE’s top 25 companies at 31 January 2010. During the six-month period, Shenzhen Development Bank was sold to Ping An Insurance Company of China, Ltd. for approximately 13 times cost and The Hillman Group was sold to Oak Hill Capital Partners for 2.9 times cost. Additionally, Unity Media SCA was sold to Liberty Media. The remaining changes reflect valuation increases and decreases or secondary purchases during the period.
lARgEst uNdERlYINg COMPANIEs BAsEd ON INVEstMENt VAluE�� In aggregate, these investments represented 19.4% of investment value�� The five largest investments represented 7.9% of investment value
Company
% of Investment Value as at
31 July 2010 location status description
Nycomed sCA-sICAR 3.05% denmark Private specialty pharmaceuticals
the sun Products Corporation 1.82 u.s. Private Private-label household products
MYOB limited 1.11 Australia Private Accounting softwareAvago Technologies, Inc. 1.06 Singapore Public Semiconductor components
Acromas holdings (saga/AA) 0.90 u.K. Private financial, insurance, and travel servicesLegrand Holdings S.A.* 0.88 France Public Electrical products and systems
Ping An Insurance Company of China, Ltd.* 0.86 China Public Multi-line insurance underwriting
CDW Corporation�†� 0.76 u.s. Private Multi-branded information technology services
AWs Convergence technologies, Inc. 0.72 u.s. Private localised convergence contentAmadeus Global Travel Distribution 0.69 Spain Public Global airline travel and logistics
falcon group (t-Mobile Czech Republic, Ceske Rakiokomunikace)
0.65 Czech Republic
Private telecommunications services
Radiation therapy services 0.58 u.s. Private Radiation therapy for cancer treatment
PsI holdings Inc. (Akibia) 0.57 u.s. Private Network integration servicesFacebook, Inc.† 0.55 U.S. Private Online social network
Mimeo.com, Inc. 0.55 u.s. Private Online digital printing Isilon Systems, Inc.† 0.50 U.S. Public Video network storage systems
transmode 0.50 sweden Private Optical solutions for metro telecommunication networks
flexera software, Inc. 0.49 u.s. Private Enterprise software solutions
smurfit Kappa Plc 0.49 Ireland Public Paper-based packaging products
Invitel holdings A/s 0.48 hungary Private telecommunications servicesQlik Technologies, Inc.† 0.44 U.S. Public Interactive data analysis software
Brenntag Group 0.43 Germany Public Industrial and specialty chemicals
LM Windpower A/S 0.43 Netherlands Private Wind power components and systems
Pepkor Holdings 0.43 South Africa Private Clothing retailer
PODS Enterprises, Inc.† 0.43 U.S. Private Mobile storage, moving, and packing
* Legrand Holdings S.A. partially sold in September 2010; Ping An Insurance Company of China, Ltd. position liquidated in September 2010.
† Company not included in top 25 at 31 January 2010.

Investment Manager’s Review 21
LARGEST UNDERLYING PUBLICLY-LISTED SECURITIES AS AT 31 JULY 2010�� 17% of the portfolio represents publicly-listed securities�� No single public holding represents more than 1.1% of NAV
Approximately 17% of the HVPE investment portfolio was made up of publicly-listed securities compared to 13% at 31 January 2010 and 12% at 31 July 2009. The increase in publicly-listed securities primarily reflects the impact of IPOs over the financial period. HVPE holds many of its publicly-listed securities indirectly through fund interests managed by third parties. In many cases, the shares are subject to lock-up provisions following an IPO. The liquidation of indirectly held publicly-listed securities is at the discretion of the third party manager, which can sell shares and distribute the proceeds to HarbourVest funds or distribute the shares to HarbourVest funds. When HarbourVest funds receive stock distributions, HarbourVest focuses on achieving liquidity for investors as soon as is practical, subject to market conditions.
lARgEst uNdERlYINg PuBlIClY-lIstEd sECuRItIEs BAsEd ON INVEstMENt VAluE�� In aggregate, these investments represented 8.5% of investment value�� The five largest investments represented 4.0% of investment value
Company
% of Investment Value as at
31 July 2010 location description
Avago Technologies, Inc. 1.06% Singapore Semiconductor components
Legrand Holdings S.A.* 0.88 France Electrical products and systems
Ping An Insurance Company of China, Ltd.* 0.86 China Multi-line insurance underwriting
Amadeus Global Travel Distribution†‡ 0.69 Spain Global airline travel and logistics
Isilon Systems, Inc. 0.50 U.S. Video network storage systems
Smurfit Kappa 0.49 Ireland Paper-based packaging products
Qlik Technologies, Inc.†‡ 0.44 U.S. Interactive data analysis software
Brenntag Group†‡ 0.43 Germany Industrial and specialty chemicals
Green Dot Corporation†‡ 0.36 U.S. General purpose reloadable debit cards
KAR Auction Services (Adesa Inc.) 0.26 U.S. Vehicle auctions
Otor SA† 0.21 France Corrugated cardboard
Dufry AG 0.20 Switzerland Duty-free retailer
Network Engines, Inc. 0.20 U.S. Internet content services
Rockwood Holdings, Inc. 0.20 U.S. Specialty chemicals
Talecris Biotherapeutics, Inc. 0.19 U.S. Blood treatment products
Ablynx NV 0.17 Belgium Antibody therapeutics and screening
Emeritus Corporation 0.17 U.S. Assisted living communities
TAL International Group† 0.17 U.S. Maritime containers
TRW Automotive Holdings 0.17 U.S. Automotive systems
International Mining Machinery, Ltd.†‡ 0.16 China Coal mining equipment
Sensata Technologies, Inc.†‡ 0.16 U.S. Auto sensors and controls
Alpha Radio BV 0.15 France Radio stations
Kabel Deutschland GmbH†‡ 0.15 Germany Broadband service and cable operator
Select Medical Corporation 0.15 U.S. Long-term hospital and rehabilitation services
MetroPCS Communications, Inc.† 0.13 U.S. Wireless communications
* Legrand Holdings S.A. partially sold in September 2010; Ping An Insurance Company of China, Ltd. position liquidated in September 2010.
† Company not included in top 25 at 31 January 2010.
� Company completed IPO during six-month period to 31 July 2010.

22 HarbourVest Global Private Equity
MANAGEMENT OF FOREIGN CURRENCY EXPOSURE�� Two euro-denominated HarbourVest funds;
one sterling-denominated HarbourVest fund�� Approximately 19% of underlying holdings
denominated in euros (€124.3 million)�� Euro-denominated unfunded commitments
of €122.8 million
Changes in foreign currency exchange rates impact HVPE in two primary ways. First, the value of non-U.S dollar investments will appreciate or depreciate with exchange rates, causing the NAV of investments to increase or decrease. For example, during the six month period to 31 July 2010, the 5.9% decrease in the euro caused HVPE’s NAV of Investments to decline by approximately 1.4%.
The second impact is on HVPE’s level of unfunded commitments, which are stated in U.S. dollars. While unfunded commitments are not balance sheet liabilities of the Company and therefore do not affect NAV when they increase or decrease, they are legal obligations that are expected to be funded from distributions as investments are liquidated. A depreciating euro will cause euro-denominated unfunded commitments to decrease in U.S. dollar terms. During the six-month period to 31 July 2010, the depreciation of the euro resulted in a $10.7 million decline in the level of euro-denominated unfunded commitments, excluding capital calls.
At 31 July 2010, HVPE held interests in two euro-denominated funds: HIPEP V 2007 European Buyout and HIPEP VI Partnership; and one sterling-denominated fund: HarbourVest Senior Loans Europe Limited (HSLE). A number of HarbourVest direct funds in the HVPE portfolio have also made investments in companies denominated in foreign currencies, and HarbourVest fund-of-funds have made investments in foreign currency-denominated partnerships.
from an asset perspective, hVPE had exposure to the following currencies at 31 July 2010 (approximate, based on NAV):
Euro* 19%
Sterling 4
Australian Dollar 2
Swedish Krona 1
Total Exposure to foreign currency 26%
* Euro-denominated asset exposure represents €124.3 million at 31 July 2010.
The unfunded commitments associated with HIPEP V 2007 European Buyout and HIPEP VI Partnership totalled €122.8 million at 31 July 2010. There are no unfunded commitments related to HSLE as it was fully funded at the time of the investment. Given the similarity in size of the euro-based asset exposure (€124.3 million) and the euro-based unfunded commitments, changes in the euro offset each other from an economic perspective. When the level of investments decreases, so do the unfunded commitments that those assets are ultimately expected to fund. Therefore, while NAV continues to be affected by currency movement, the Company’s commitment ratios and other elements of exposure to currency are effectively hedged.
It is therefore the Company’s current policy to take no further action to hedge euro exposure. However, the Company continues to monitor this exposure and could take action in the future.
With respect to the HSLE investment, the Company has effectively hedged the currency impact by borrowing in sterling to fund the investment. Since the £10 million investment is offset by a £10 million funding liability, changes in currency will not affect NAV and have only a limited impact on the Company’s commitment ratios.
In addition to the direct currency exposure discussed above, HVPE’s NAV is also affected by investments in U.S. dollar-denominated partnerships that have made investments in foreign companies or companies that have significant foreign currency-based business activities.
Given the similarity in size of the euro-
based asset exposure (€124.3 million)
and the euro-based unfunded commitments
(€122.8 million), changes in the euro
offset each other from an economic
perspective.

Investment Manager’s Review 23
(I) hVPE INVEstMENt stRuCtuRE
Company
Company
Company
Company
Company
Company
PRIMARYPARTNERSHIPS
Funds /Partnerships
HV FundHV Fund
HV Fund
Funds /Partnerships
DIRECTINVESTMENTS
SECONDARYINVESTMENTS
PRIVATE EQUITY EXPOSURE*
$141 million Unfunded Commitments(Not Allocated to Underlying Partnerships)†
$413 million Unfunded Commitments(Allocated to Underlying Partnerships)
$554 MILLION TOTAL UNFUNDED COMMITMENTS
$845 MILLION NAV OF INVESTMENTS
$1,399 millionTotal Private Equity Exposure
5,501501
21
642
Portfolio ofCommitments to Multiple
HarbourVest Funds
* Private Equity Exposure equals the sum of NAV of Investments plus total Unfunded Commitments
† At 31 July 2010, $141 million of HVPE’s total unfunded commitments of $554 million represent commitments to HarbourVest funds that have not yet been committed to underlying partnerships.
Commitments and Balance Sheet Review
COMMITMENTS�� Total commitments of $554 million�� Commitments reduced by $69 million
during the period
As at 31 July 2010, HVPE had total outstanding unfunded commitments of $554.4 million (compared to $623.0 million at 31 January 2010). The Investment Manager’s analysis of the appropriate level of commitments considers various factors, including HVPE’s distinct three-tiered fund-of-funds structure, the anticipated pace of capital calls and distributions, the current economic environment, and the flexibility provided by HVPE’s long-term credit facility.
Exhibit I illustrates the impact on commitments of HVPE’s distinct three-tiered fund-of-funds structure. HVPE makes commitments to HarbourVest funds, which in turn commit capital to underlying partnerships and/or companies. As a result of this three-tiered investment structure, HVPE’s expected drawdown schedule differs significantly from its listed peers. Most listed fund-of-funds vehicles make commitments directly to newly-formed third party partnerships, which are expected to draw down most of their commitments over three to five years. In contrast, HVPE makes the majority of its commitments to newly-formed HarbourVest fund-of-funds, which typically have a seven to nine-year drawdown period. This extended drawdown period reflects the fact that HarbourVest fund-of-funds commit capital to partnerships over a period of three to four years, which in turn build their portfolios and generally draw down most capital over the next three to five years. This drawdown model could increase the level of commitments that HVPE can support in comparison to some of its listed peers.

24 HarbourVest Global Private Equity
In order to reflect the differences in expected drawdown periods appropriately, the Company divides its total commitments into “allocated” and “unallocated” segments. Of the Company’s total outstanding unfunded commitments to HarbourVest funds of $554.4 million at 31 July 2010, approximately $413.5 million (75%) has been allocated by such HarbourVest funds to underlying investments, while $140.9 million (25%) has not yet been allocated to underlying partnerships. All of the Company’s commitments to HarbourVest direct and secondary funds are classified as “allocated” commitments because their drawdown profiles are more similar to those of third party partnerships. The Company anticipates that its allocated commitments will be drawn down over a three to five-year period. In contrast, the commitments that have not been allocated are expected to be drawn over a longer period of up to seven to nine years.
Exhibit J illustrates the change in HVPE’s unfunded commitments in the six-month financial period ended 31 July 2010 and the movement of those commitments from “not allocated” to “allocated” to drawn capital (and part of HVPE’s NAV). During the financial period, unfunded commitments decreased by $68.6 million, arising from $57.9 million of capital calls, as well as a $10.7 million decrease in the U.S. dollar value of euro-denominated commitments, as a result of the 5.9% depreciation of the euro against the U.S. dollar (please refer to Management of Foreign Currency Exposure). As at 31 January 2010, HVPE had $177.7 million (€128.2 million) in commitments to euro-denominated HarbourVest funds. During the six-month financial period to 31 July 2010, unfunded commitments to euro-denominated funds fell to $160.4 million as a result of $6.6 million of capital calls and the $10.7 million decrease in the U.S. dollar value of euro-denominated commitments.
The Investment Manager’s analysis of the
appropriate level of commitments considers
factors including HVPE’s three-tiered fund-of-
funds structure, the pace of capital calls and
distributions, the economic environment, and
the flexibility provided by HVPE’s credit facility.
(J) ANAlYsIs Of uNfuNdEd COMMItMENts ($ MIllION)
COMMIttEd – NOt AllOCAtEd (31 January 2010) $175.3
New Commitments to HarbourVest Funds 0.0
Commitments Allocated (net)* (27.7)
FX Change† (6.7)
COMMIttEd – NOt AllOCAtEd (31 July 2010) $140.9
COMMIttEd – AllOCAtEd (31 January 2010) $447.7
Commitments Allocated (net)* 27.7
Drawdowns (57.9)
FX Change† (4.0)
COMMIttEd – AllOCAtEd (31 July 2010) $413.5
tOtAl COMMItMENts (31 January 2010) $623.0
New Commitments to harbourVest funds 0.0
drawdowns (57.9)
fx Change† (10.7)
tOtAl COMMItMENts (31 July 2010) $554.4
* Commitments allocated during the period are net of (i) timing differences between underlying partnership capital calls and related HarbourVest fund capital calls, (ii) foreign currency changes for underlying partnerships, and (iii) changes in HVPE ownership levels of HarbourVest funds that have not yet held their final close.
† Foreign Currency (FX) Change relates solely to non-U.S. dollar
denominated HarbourVest funds.
�� At the beginning of the period (31 January 2010), HVPE had $623.0 million of unfunded commitments to HarbourVest funds, of which $447.7 million was allocated to underlying partnerships and $175.3 million was not allocated to underlying partnerships.
�� Over the financial period from 31 January 2010 to 31 July 2010, $27.7 million (net), or 15.8% of the unfunded commitments that were not allocated at the beginning of the period, were allocated to underlying partnerships as HarbourVest fund-of-funds made new partnership commitments.
�� During the financial period, $57.9 million, or 12.9% of HVPE’s allocated but unfunded commitments at the beginning of the period were drawn and became part of the Company’s NAV.

Investment Manager’s Review 25
MIX OF ALLOCATED COMMITMENTS�� The mix of HVPE’s allocated but unfunded
commitments indicates the potential evolution of NAV over time
HVPE’s allocated (but unfunded) commitments of $413.5 million at 31 July 2010 include commitments to U.S. and international partnerships, secondary funds, and direct funds across vintage years, strategies, and geographies. The mix related to the fund-of-funds portfolio as well as commitments purchased by secondary funds is shown in Exhibit K.
(K) dIVERsIfICAtION Of AllOCAtEd uNfuNdEd COMMItMENts
As at 31 July 2010 (Vintage, Strategy, Geography)*
Other
Large Buyouts
Medium Buyouts
Small Buyouts
Venture/Growth Equity
Balanced Venture
Early Stage Venture
Asia Pacific
Rest of World
Europe
U.S.
9%
65%
19%
8%
6%
3%
6%
27%
5%
20%
32%
STRATEGY
GEOGRAPHY
VINTAGE2%
1%
19%
3%
2%
1%
26%
11%
19%
0%
1%
6%
9%
2010
2009
2008
2007
2006
2005
2004
2003
2002
2001
2000
1999
Pre-1999
Diversification charts add to 100%.
* Allocated primary commitments plus commitments purchased by secondary funds, totalling $304.5 million.
CREDIT FACILITY�� $500 million multi-currency credit facility
in place through December 2014
HVPE’s commitment strategy is predicated on a typical operating environment for private equity where distributions received are generally at a level sufficient to fund capital calls. However, private equity cash flows can vary greatly in different markets and cannot always be predicted with a high degree of accuracy. In order to address the natural variability between the receipt of distributions and the requirement to fund commitments, HVPE secured its long-term $500 million multi-currency revolving credit facility with The Bank of Scotland plc, now a subsidiary of Lloyds Banking Group plc, on 4 December 2007.
Under the terms of the agreement, HVPE may borrow, repay, and reborrow to fund commitments and working capital requirements through to the facility’s expiry date in December 2014. The Company has pledged substantially all of its assets as collateral for such borrowings. As noted previously, the revolving credit facility bears variable interest at LIBOR plus 150 basis points on drawn amounts and carries an annual commitment fee of 40 basis points on the unused portion of the facility.
The credit facility contains financial covenants that limit the Company’s indebtedness to 40% of assets (“Asset Test Covenant”), with the calculated value of the assets also subject to certain diversification tests. All financial covenants are tested and calculated on a quarterly basis. In addition, other covenants confer customary limitations that restrict HVPE’s ability to make unduly concentrated commitments to funds, incur additional indebtedness or liens above the facility level, pay dividends above certain levels, or merge, consolidate, or substantially change its business without bank approval. Under the terms of the agreement, Bank of Scotland plc may choose to syndicate the facility.

26 HarbourVest Global Private Equity
With respect to the credit facility, during the six-month financial period ended 31 July 2010, the Company drew down an additional $19.4 million, including £10.0 million to fund the HSLE investment. As at 31 July 2010, $95.7 million of borrowings were outstanding under the facility, and HVPE had $4.0 million in cash on its balance sheet. Based on the Asset Test Covenant, the remaining maximum amount available to be drawn at 31 July 2010 was $389.6 million compared to $389.0 million at 31 January 2010. While the Investment Manager expects borrowings under the facility to increase if drawdowns continue to rise, the Company intends to repay the facility as distributions begin to increase. HVPE’s Investment Manager does not believe that permanent leverage is appropriate for the Company’s balance sheet.
The Company intends to repay the facility
as distributions begin to increase. HVPE’s
Investment Manager does not believe
that permanent leverage is appropriate
for the Company’s balance sheet.
COMMITMENT RATIOS�� HVPE’S total resources represent
223% of commitments�� Total liquid resources represent
95% of allocated commitments
As illustrated in Exhibit L, at 31 July 2010, HVPE had total liquid resources, including cash and the remaining available credit facility, of $393.6 million (compared to $399.6 million at 31 January 2010); and total resources to meet its commitments, including NAV of Investments, of $1,238.5 million (compared to $1,183.0 million as at 31 January 2010). Total resources represent 223% of total commitments (compared to 190% as at 31 January 2010).
(l) hVPE REsOuRCEs RElAtIVE tO uNfuNdEd COMMItMENts
Resources Total 223% of Commitments at 31 July 2010
$0
$250
$500
$750
$1000
$1250
CommitmentsHVPE ResourcesCash $4
AvailableCredit
Facility (ACF) $390
NAV of Investments
$845
$1,239 ($ millions)
AllocatedCommitments
$413
CommitmentsNot Allocated
$141
$554
LiquidResourcesEqual 95%of Allocated
Commitmentsand 71%of Total
Commitments
LIQ
UID
RE
SO
UR
CE
S
HVPE’s Investment Manager considers two ratios to be most useful in analysing its balance sheet position and commitment levels:
The Commitment Level Ratio measures the ratio of private equity exposure (NAV of Investments plus unfunded commitments) relative to NAV.
The Commitment Coverage Ratio, calculated as the ratio of liquid resources (cash plus available credit facility) to commitments, measures the Company’s ability to fund its obligations.
When analysing HVPE’s commitment exposure, the Investment Manager believes that the most meaningful measure is allocated commitments, which includes only those commitments that have been allocated to underlying partnerships. This measure is most consistent with the commitment levels disclosed by peers and reflects the commitments most likely to be called over the near to medium term.

Investment Manager’s Review 27
(M) sEMI-ANNuAl BAlANCE shEEt INfORMAtION
Cash and Remaining Available Credit Facility (Liquid Resources)
Commitment Level Ratio (Allocated Unfunded Commitments)Commitment Coverage Ratio (Allocated Unfunded Commitments)
NAV of Investments
0%
50%
100%
150%
200%
250%
July 2010January 2010*July 2009January 2009*July 2008†January 2008*$0
$200
$400
$600
$800
$1000$847.6
$783.4
$521.0$399.6
150% 171%168%
117%
89%
$714.4
$347.7
182%
73%95%
$393.6
$844.9
($ millions)
$668.1
$352.3
183%
72%
$872.0
$479.3
157%
104%
* Reflect audited results.
† HVPE made a €100 million commitment to HIPEP VI Partnership in July 2008.
Exhibit M illustrates the trend of HVPE’s Commitment Level Ratio (Allocated) and Commitment Coverage Ratio (Allocated) since 31 January 2008, as well as the Company’s NAV of Investments and liquid resources. These metrics indicate a positive trend since 31 January 2009 as the Company has benefited from rising NAV and more positive cash flows starting in the fourth quarter of the last fiscal year.
The trend in the commitment ratios reflects deterioration during the second half 2008 financial crisis, followed by the gradual recovery and stabilisation of the last 18 months. The area between the red and blue dotted lines illustrates the significant NAV decline during the latter part of the financial year to 31 January 2009. As HVPE’s NAV of Investments fell from $872.0 million at 31 July 2008 to $668.1 million at 31 January 2009, the denominator of the Commitment Level Ratio declined, causing this ratio to increase. Similarly, the declining NAV resulted in a reduction of liquid resources as borrowing capacity declined, causing the Commitment Coverage Ratio to decrease.
The area to the right of the blue dotted line reflects the partial recovery of HVPE’s NAV in the prior and current financial year, as the NAV of Investments increased from $668.1 million at 31 January 2009 to $783.4 million at 31 January 2010, and $844.9 million at 31 July 2010. The increase in NAV of Investments, combined with an increase in distributions starting in the fourth quarter of the last financial year, resulted in increased liquid resources and a higher Commitment Coverage Ratio.
These metrics indicate a positive trend
since 31 January 2009 as the Company
has benefited from rising NAV and more
positive cash flows starting in the fourth
quarter of the last fiscal year.

28 HarbourVest Global Private Equity
CASH FLOWS �� Increased capital calls during six-month period
driven by significant secondary and U.S. buyout investment activity
�� Six-month distributions approached the full year total to 31 January 2010
From 1 February 2010 to 31 July 2010, HVPE funded $57.9 million of capital calls and received $48.2 million in distributions from HarbourVest funds. The pace of capital calls and distributions has increased significantly from the second half of the prior fiscal year, when HVPE funded $31.9 million of capital calls and received $32.5 million in distributions. In addition to capital calls from existing funds described above, HVPE chose to invest $14.4 million (£10.0 million) in HSLE during May 2010 (please refer to New Commitments). The cost of this discretionary investment is not included in the capital call and distribution information provided in this section.
Cash flow trends, shown in Exhibit N, varied significantly from month to month over the course of the financial period. While the first financial quarter saw $4.0 million in positive flows and two of the three months reflected positive cash flow, cash flows were more negative in the second financial quarter as capital calls accelerated more quickly than distributions. Cash flows were negative $13.7 million for the second quarter, with two of the three months reflecting negative cash flow. The significant increase in capital calls in the second quarter was driven by activity in two funds. HarbourVest VIII Buyout, HVPE’s largest currently investing commitment at $250 million, called 7.5% of committed capital in the quarter and Dover VII, the global secondary fund to which HVPE has committed $100 million, called 8.5% of committed capital. Funding for HarbourVest’s secondary and direct funds can vary significantly between periods, depending on transaction activity.
From 1 February 2010 to 31 July 2010,
$57.9 million of capital was funded to 11
of the 21 HarbourVest funds in the portfolio,
excluding the initial HSLE investment.
Capital CallsFrom 1 February 2010 to 31 July 2010, $57.9 million of capital was funded to 11 of the 21 HarbourVest funds in the portfolio, excluding the initial HSLE investment. As described above, the largest capital calls were funded to the following HarbourVest funds, which together represent 56% of the total drawdowns in the financial period ended 31 July 2010.�� HarbourVest VIII Buyout (U.S. fund-of-funds)�� Dover VII (global secondary fund)
From 1 February 2010 to 31 July 2010,
distributions of $48.2 million were received
from 10 of HVPE’s 21 HarbourVest funds.
DistributionsFrom 1 February 2010 to 31 July 2010, distributions of $48.2 million were received from 10 of HVPE’s 21 HarbourVest funds, including U.S. and international fund-of-funds focused on venture capital and buyout, a direct fund, and the global secondary fund.
�� HIPEP III Partnership accounted for approximately 29% of total distributions.�– HIPEP III Partnership was formed in 1998
to make European, Asian, and other venture and buyout partnership investments (primary and secondary).
�– 2009 and 2010 liquidity events within the HIPEP III Partnership portfolio providing proceeds in the six months to 31 July 2010 include:�y the sales of Unity Media SCA (one of
HVPE’s 25 largest underlying companies at 31 January 2010) to Liberty Global Inc.; Sensitive Objects SA to Tyco Electronics; Novexel to Astra Zeneca
�y the IPOs of Avago Technologies, Inc. (HVPE top 25); Médica; Brenntag Group (HVPE top 25); and Amadeus Global Travel Distribution (HVPE top 25)
�– HIPEP III Partnership also distributed significant proceeds from the sale of Shenzhen Development Bank to Ping An Insurance Company of China, Ltd. in May 2010.

Investment Manager’s Review 29
(N) tOtAl QuARtERlY CAPItAl CAlls ANd dIstRIButIONs*1 August 2009 to 31 July 2010
$0
$10
$20
$30
$40
$50
Q2 DistQ2 CallsQ1 DistQ1 CallsQ4 DistQ4 CallsQ3 DistQ3 Calls
$7.4
$13.3
$25.1
$15.3
$19.3
$42.6
$28.9
$18.6
NetCashFlow
($11.2)
NetCashFlow $11.8
NetCashFlow $4.0
NetCashFlow
($13.7)
U.S. FUND-OF-FUNDS
INTERNATIONAL FUND-OF-FUNDS
DIRECT FUNDS
SECONDARY FUNDS
Six Months to 31 July 2010
($9.7)(7.8)
5.8
8.3
($16.0)Net Cash Flow
$48.2($57.9)0.7 (8.5)
7.6 (1.8)
17.4(9.1)
$22.5($38.5)DistributionsCapital Calls
($ millions)
AUG – OCT ’09 NOV ’09 – JAN ’10 FEB – APR ’10 MAY – JUL ’10
* May cash flows exclude the HSLE investment of £10.0 million ($14.4 million).
�� HarbourVest VI Partnership accounted for approximately 25% of total distributions.–�HarbourVest VI Partnership was formed in 1999
to make primarily U.S.-based venture capital and buyout partnership investments (primary and secondary). HarbourVest VI Partnership distributed cash and stock proceeds from primary and secondary investments related to recent IPO and M&A activity across the U.S. and international markets. One of the largest sources of proceeds was HarbourVest VI Partnership’s secondary investment in Tresser, L.P., the 2003 purchase of a portfolio of buyout assets from UBS AG.
�� HarbourVest VI Direct accounted for approximately 16% of total distributions.–�HarbourVest VI Direct was formed in 1999
to make direct growth equity and buyout investments in operating companies. HarbourVest VI Direct distributed proceeds from the May 2010 sale of The Hillman Group (one of HVPE’s 25 largest underlying companies at 31 January 2010) to Oak Hill Capital Partners for 2.9 times cost.
HarbourVest VI Partnership, HIPEP III Partnership, and HarbourVest VI Direct are currently harvesting their investments.

30 HarbourVest Global Private Equity
LIQUIDITY EVENTS: IPOS AND M&A The exit activity that began to pick up in the final months of 2009 has continued into 2010. The increase in distributions described above reflects proceeds from a number of recent liquidity events.
Exhibit O illustrates quarter by quarter liquidity events over the 12 months to 31 July 2010, segmented between venture and buyout and type of liquidity event (M&A or IPO). The bars reflect the number of liquidity events (based on closing date) while the line reflects the percentage of NAV represented by the companies affected by the liquidity events. Overall, the positive trend of liquidity events has continued in the current financial year, although IPO activity decreased during 2010, dropping from 30 offerings in the first quarter to 11 in the second quarter due to market uncertainty.
22 of HVPE’s underlying venture-backed companies went public in the six months to 31 July 2010, including Calix, Inc. (CALX), Financial Engines, Inc. (FNGN), and Tesla Motors, Inc. (TSLA). While many shares remain under lockup, these offerings are expected to provide some liquidity to HVPE in the near to medium term. Also within the venture portfolio, 108 companies completed sales during the period including Ethicon Endo-Surgery, Inc.’s (a subsidiary of Johnson & Johnson) acquisition of Acclarent, Inc.,
Apple Inc.’s acquisition of Quattro Wireless, Inc., MSCI Inc.’s acquisition of RiskMetrics Group, Inc., and the sales of Healthvision, Inc. to Lawson Software (NASDAQ: LWSN), OpenLink Financial, Inc. to The Carlyle Group, and Advisory Research, Inc. to Piper Jaffray Companies.
Within the buyout portfolio, five of HVPE’s largest underlying holdings at 31 January 2010 completed realisations during the six months to 31 July 2010. Shenzhen Development Bank was sold to Ping An Insurance Company of China, Ltd. for approximately 13 times cost. Additionally, The Hillman Group was sold for 2.9 times cost, and Unity Media SCA was sold to Liberty Media. Finally, Brenntag Group completed an IPO in March 2010, and Amadeus Global Travel Distribution completed an IPO in April 2010 (the largest European buyout-backed IPO since 2008). HVPE has received proceeds related to all of these events.
The volume of liquidity events across HVPE’s portfolio in the financial period ended 31 July 2010 illustrates its maturity, with a number of HarbourVest funds actively harvesting their investments. Of the 33 M&A liquidity events representing more than $200,000 of NAV in the HVPE portfolio over the last six months, the average value-to-funded multiple was 4.1 times.
(O) hVPE lIQuIdItY EVENts1 August 2009 to 31 July 2010
(# of transactions) (% of NAV)
VENTURE: M&A IPO BUYOUT/OTHER: M&A IPO Percentage of NAV Represented by Companies with Liquidity Events
99
8879
46
0
20
40
60
80
100
MAY – JUL ’10FEB – APR ’10NOV ’09 – JAN ’10AUG – OCT ’090%
2%
4%
6%
8%
10%

Investment Manager’s Review 31
Recent Events
The following events occurred subsequent to the financial period ended 31 July 2010:�� Additional trading in HVPE shares and issuance
of Put Rights�� Cancellation of 1,330,378 replacement shares issued
in connection with the Company’s Liquidity Plan �� Publication of estimated NAV at 31 August 2010�� $50 million commitment to HarbourVest Partners IX
programme
ADDITIONAL TRADING IN HVPE SHARES AND ISSUANCE OF PUT RIGHTSIn May 2010, in connection with its Liquidity Plan (see Liquidity Plan), the Company agreed to issue Put Rights to eligible purchasers of its shares in the Secondary Placing and thereafter, in the market, up to an aggregate of 6,956,521 Put Rights. As at 31 July 2010, 5,035,958 Put Rights had been issued. Since 1 August 2010, there has been a significant increase in HVPE trading activity, and 1,709,173 additional Put Rights have been issued between 1 August 2010 and 29 September 2010. In total, 6,745,061 puts have been issued as at 29 September 2010.
CANCELLATION OF 1,330,378 REPLACEMENT SHARES ISSUED IN CONNECTION WITH THE COMPANY’S LIQUIDITY PLANAt the time of the Secondary Placing of its shares in May 2010, the Company issued 1,330,378 replacement shares to a shareholder who wished to participate as a seller but whose shares were held in custody by an affiliate of Lehman Brothers International (Europe) (in administration) (“Lehman Brothers”) and therefore could not be transferred. In consideration for the reissuance, the shareholder agreed to deliver to the Company the original shares held by Lehman Brothers once they became available.
At the time of the reissue, the Company’s auditors confirmed that, for the purposes of U.S. GAAP, the Company would not be required to show an increase in the number of shares outstanding in its financial statements during the period between the issuance of the replacement shares and the subsequent cancellation of the shares held by Lehman Brothers. As at 20 September, the initial shares have been returned by Lehman Brothers and have been cancelled, leaving 83,000,000 total HVPE shares in issue. This transaction has no impact on the financial statements of the Company.
PUBLICATION OF ESTIMATED ECONOMIC NAV AT 31 AUGUST 2010HVPE publishes its estimated Economic NAV on a monthly basis. These reports are available at the Company’s website, generally within 15 days after month end.
As at 31 August 2010, HVPE’s estimated Economic NAV per share was $8.90. Results declined from 31 July 2010 as a result of negative foreign currency movement and ongoing operating expenses. HVPE did not make any new commitments or purchase additional interests in HarbourVest funds during August 2010. During the month, the Company funded $2.5 million of capital calls to two international HarbourVest fund-of-funds and received distributions of $5.0 million, resulting in net positive cash flow of $2.5 million. Of HVPE’s total unfunded commitments of $547.4 million at 31 August 2010, approximately $405.2 million has been committed by HarbourVest funds to underlying partnerships, while the remaining $142.2 million has not yet been committed.
During August, the Company drew down additional capital of $5.0 million against its $500.0 million credit facility in order to fund capital calls and working capital needs. As at 31 August 2010, a total of $100.3 million was outstanding, a $4.6 million increase over 31 July 2010 due to the August drawdown and foreign currency movement related to the £10.0 million sterling-denominated outstanding drawdown. Based on the facility’s most restrictive covenant, the remaining amount currently available is $383.6 million. The Company also has $8.6 million in cash on its balance sheet. As at 31 August 2010, liquid resources (cash and available credit facility)represent 97% of commitments allocated to underlying partnerships and 72% of total commitments.

32 HarbourVest Global Private Equity
$50 MILLION COMMITMENT TO HARBOURVEST PARTNERS IX PROGRAMMEOn 27 September 2010, HVPE committed a total of $50 million to the HarbourVest Partners IX programme, a U.S.-focused fund-of-funds vehicle currently raising capital. HVPE allocated $25 million (50% of the commitment) to HarbourVest IX Buyout, $20 million (40%) to HarbourVest IX Venture, and $5 million (10%) to HarbourVest IX Credit Opportunities. The allocation mix reflects the attractive opportunities that the Investment Manager and HVPE’s Board of Directors believe are available in these investment segments, particularly venture.
The size of the commitment reflects the Investment Manager’s analysis of the appropriate investment capacity of the Company, given the current market environment, cash flows, the potential $40 million Put Right obligation in 2011, and balance sheet trends. Pro forma for the $50 million commitment, as at 31 August 2010, the Company’s Commitment Level Ratio (total) would increase from 187% to 194%, and its Commitment Coverage Ratio (total) would decrease from 72% to 66%. Total unfunded commitments would increase to $597.4 million, which is still $25.6 million lower than total unfunded commitments as at 31 January 2010. The Investment Manager will consider an additional commitment to the HarbourVest IX programme prior to its final round of subscriptions.
Investment Manager’s Market Commentary
(All quarterly data refers to calendar quarters.)
U.S. MARKET OVERVIEW�� Continued GDP growth of 1.6% in the second quarter
of 2010�� Buyout and venture fundraising remain challenged�� Mezzanine and distressed debt fundraising
up from 2009�� Buyout-backed M&A activity improving�� 13 buyout-backed IPOs; on pace with full year
2009 levels�� 26 venture-backed IPOs during the first half of 2010;
more than triple the 8 in all of 2009�� Venture-backed M&A activity increasing
The U.S. economy continued to grow during the first half of 2010, but at a slower pace than the fourth quarter of 2009 when GDP growth reached 5.6%. GDP increased 3.7% in the first quarter of 2010 and by an estimated 1.6% in the second quarter of 2010, marking the fourth straight quarter of growth (U.S. Department of Commerce). Economists predict GDP growth will continue to moderate in the second half of 2010 as the economy remains constrained by high unemployment rates, which were largely unchanged at near 10%, and the benefits of government stimulus funding diminish. As the economy continues to recover, fundraising and investment activity across the private equity industry is expected to follow a similar path.
Venture Capital ActivityAfter significant declines in 2009, U.S. venture fundraising continued to contract. According to Thomson Reuters, venture managers raised $6.6 billion in the first half of 2010, approximately 40% of the $16 billion raised in 2009. After reaching a ten-year low in 2009, venture disbursements had an active start during the first half of 2010, with a total of $11.4 billion invested, a 49% increase from the same period in 2009. In the second quarter of 2010, $6.5 billion was invested in 906 deals, compared to $4.9 billion invested in 740 deals in the first quarter of 2010. All major sectors, including cleantech, life sciences, and software, experienced increases in dollars invested.

Investment Manager’s Review 33
The liquidity environment for venture-backed companies showed continued momentum during the first half of 2010. According to Thomson Reuters, 211 venture-backed companies completed M&A exits, generating $8.5 billion. This represents a 166% increase compared to $3.2 billion of M&A exits during the same period in 2009.
During the first quarter of 2010, venture-backed IPO activity had its highest quarterly total since the fourth quarter of 2007, with 17 IPOs completed. Thomson Reuters reported that 26 venture-backed companies completed IPOs in the first six months of 2010, generating $2.2 billion, surpassing the eight venture-backed IPOs completed for $1.6 billion in all of 2009.
Buyout ActivityFollowing two consecutive years of declines, buyout fundraising remained weak and continued its downward trend during the first six months of 2010. According to Thomson Reuters, the total amount raised during the period declined by 56% compared to the first half of 2009, with just $10.7 billion raised by 53 funds. Smaller fund sizes and the absence of mega funds in the market are driving fundraising figures lower. While fundraising is expected to accelerate during the second half of the year, full-year fundraising activity could remain lower than in recent years. While buyout investment activity remains slow relative to its peak, deal activity and sizes have been increasing from 2009 levels. However, a significant increase in investment activity is not expected, given the limited availability of attractively-priced debt, weak earnings, and increasing deal prices. According to Thomson Reuters, U.S. buyout managers closed 266 deals in the first half of 2010 for a disclosed value of $21.8 billion, more than double the $10.6 billion of disclosed deal value in the first half of 2009.
As economic concerns eased from 2009 and buyout managers sought liquidity, buyout-backed M&A and IPO activity has increased. Thomson Reuters estimates that during the first six months of 2010, 67 buyout-backed companies completed M&A events, with a disclosed value of $9.8 billion. This exceeds the 64 buyout-backed companies that completed M&A events in all of 2009.
While buyout-backed IPO activity through the second quarter of 2010 is on pace with full-year 2009 data, volatile public stock markets resulted in many IPOs being postponed, cancelled, or pricing below their original offering ranges. Through the second quarter, Thomson Reuters reported 13 buyout-backed IPOs. These offerings raised over $3.2 billion, roughly half of the $7.0 billion generated by buyout-backed IPOs in all of 2009.
Debt ActivityThe mezzanine market remains attractive as competition from non-traditional credit sources, such as collateralised debt obligations (CDOs) and collateralised loan obligations (CLOs), is still limited. Although mezzanine managers are often able to achieve better pricing with stricter covenant terms, lower leverage ratios, and warrant coverage as a result of the favourable competitive dynamics, deal activity remains muted due to limited buyout investment activity. Mezzanine providers, who are viewed as one of the few sources of reliable and patient junior capital, remain well positioned when buyout investment activity recovers. An already robust high-yield market continued to progress in the first half of 2010. While some companies were able to find relief by refinancing debt with near-term maturities, distressed managers continue to see a strong pipeline of opportunities as a number of companies remain in covenant default, distressed situations, or bankruptcy despite the recent market stabilisation.
According to Thomson Reuters, fundraising activity by distressed debt and mezzanine managers remained significantly lower than the record levels of 2008 but higher than 2009. In the first half of 2010, distressed debt managers attracted $6.9 billion of new commitments. This is a 15% increase from the $6.0 billion raised during the first half of 2009. Mezzanine managers also experienced higher fundraising levels, attracting $5.1 billion during the first half of 2010, compared to $3.8 billion in the same period last year.

34 HarbourVest Global Private Equity
OutlookThe U.S. economy continued to grow during the first half of 2010, albeit at a slower rate, after emerging from the recession in the third and fourth quarters of 2009. While the worst of the downturn appears to have passed, unemployment remains near 10%, and economists caution that the recovery will remain slow through at least the end of 2010. As market conditions continue to improve gradually, both the investment and liquidity environments across the private equity industry have shown signs of optimism, although the fundraising environment could remain challenging for the foreseeable future. Existing portfolios for venture and buyout managers have withstood much of the economic pressure and are experiencing positive results due to the defensive measures taken since the beginning of the downturn. As a result of stronger balance sheets, some portfolio companies are able to place a renewed emphasis on revenue improvement. The Investment Manager will continue to monitor global economic conditions and their impact on the private equity marketplace.
EUROPEAN MARKET OVERVIEW�� European economy stabilising and returning
to modest growth after deep recession�� Public markets recovering value following declines
in the first half of 2010�� Buyout and venture fundraising down; expect
increases in 2011�� Buyout investment activity increased while
venture declined�� Buyout-backed IPO market opened with 13 IPOs;
no venture-backed IPOs completed�� Buyout-backed M&A exits doubled�� Private equity valuations stabilising as portfolio
company operating performance improves
The European economy experienced some improvement in the first half of 2010 following the global financial crisis that caused GDP growth for the EU 27 countries to decline by 4.2% in 2009. The Economist Intelligence Unit forecasts growth at a modest pace of 0.8% in 2010 and 1.0% in 2011.
The macroeconomic situation in Europe
significantly improved after European
governments, the European Central Bank, and
the International Monetary Fund intervened
with a €750 billion stabilisation package.
Late in the first quarter of 2010, unsustainably high levels of government borrowing and the risk of sovereign default among several countries in Southern Europe (most notably Greece) led to concerns over Europe’s recovery, placing downward pressure on the euro. The macroeconomic situation in Europe significantly improved after European governments, the European Central Bank, and the International Monetary Fund intervened with a €750 billion stabilisation package. Over the next 18 months, most European countries are expected to focus on lowering budget deficits and building more sustainable government balance sheets.
While public markets in Europe were down approximately 10% at mid-year 2010 compared to the beginning of the year, they began to recover value through July and August. The euro depreciated by approximately 15% against the U.S. dollar in the first half of the year, from 1.44 at the start of 2010 to 1.22 at the end of June 2010, but has strengthened to 1.34 through mid-September 2010.

Investment Manager’s Review 35
Buyout ActivityEuropean private equity fundraising continued to lag in the first half of 2010. According to Thomson Reuters, European buyout managers raised a total of €2.8 billion in the first six months of 2010, a 74% decrease from the €10.6 billion raised in the first half of 2009. An absence of fundraising activity among large and mega buyout firms, who continued to focus on deploying large funds raised during 2006 to 2008, contributed to the low fundraising totals.
Conversely, European buyout investment activity has increased significantly since the first half of 2009. In the first half of 2010, a total of 177 deals with a combined value of €20.8 billion were completed, a 270% increase from €5.6 billion of deals in the same period in 2009. The improving health of the buyout market is also evident in the average deal size, which increased from just €48 million in the first half of 2009 to €117 million in the first half of 2010. This trend is in part being fuelled by improved availability of debt capital. According to Standard & Poors, €8 billion of leveraged loans were issued in the first half of 2010, an increase from €2 billion in the first half of 2009 and €5 billion in all of 2009.
Following a challenging year for private equity exits in 2009, there was a marked increase in both M&A and IPO activity during the first six months of 2010. According to Mergermarket, there were €18.7 billion of buyout-backed M&A exits in the first half of 2010, more than double the €9.0 billion in the same period last year. The IPO markets were also open for buyout-backed companies in the first part of the year, with 13 IPOs completed for a total value of €6.5 billion in the first six months of 2010 (Incisive Media).
European buyout investment activity
has increased significantly since the
first half of 2009.
In the first half of 2010, investment activity
continued to build on the strong fourth
quarter of 2009 as the availability of debt
financing increased and the environment
began to stabilise.
Venture Capital ActivityEuropean venture capital fundraising was also slow in the first half of 2010. According to Thomson Reuters, there was a total of €1.9 billion raised in the first half of 2010, a 44% decline from €3.6 billion raised in the same period in 2009. In the first half of 2010, European venture investment activity declined from 2009, with 108 investments worth a combined €505 million completed. This represents a 24% reduction in number of investments and 15% decline in deal value compared to the same period in 2009.
OutlookIn the first half of 2010, investment activity continued to build on the strong fourth quarter of 2009 as the availability of debt financing increased and the environment began to stabilise. On another positive note, exit activity is increasing, and the European IPO window has opened for the first time since 2007. This increased investment pace, combined with an increase in liquidity from private equity portfolios, should stimulate fundraising in the latter half of 2010 and into 2011. Private equity managers, particularly in the mid-market, should continue to be well positioned to acquire stable companies at reasonable valuations. We expect valuations for high quality businesses with strong management teams to remain elevated due to tight competition. Many portfolio companies continue to face a challenging operating environment as consumer spending remains relatively low and growth rates across many markets are modest. However, management teams have endured the recession through cost cutting and maintaining or improving margins, and companies are now operating more efficiently with enhanced margins. This should position portfolio companies well as the economy continues to improve.

36 HarbourVest Global Private Equity
ASIA PACIFIC MARKET OVERVIEW�� Asian economies showed strong growth in the first
half of 2010 �� Australia, India, Malaysia, and Taiwan have all raised
interest rates to contain inflation�� Modest improvement in private equity fundraising
environment, with $15.4 billion raised�� Growth and expansion funds dominated fundraising,
accounting for 69% of capital raised�� Investment activity increased, with $10.7 billion
deployed, driven by deals in China and India�� With fewer IPOs, managers focused on exits via
trade sales
Most Asia Pacific economies experienced strong growth in the first half of 2010 following expansionary economic stimulus packages implemented after the financial crisis. As a result, certain countries in the region shifted their focus from economic growth to controlling inflation. Australia, India, Malaysia, and Taiwan all raised interest rates during the first half of the year, signaling confidence in their economies. In China, fear of inflation, economic overheating, and a possible wave of bad loans resulted in a 1.5% increase in the deposit reserve requirement ratio for local banks. Additionally, changes in the political landscape brought some uncertainty to the business environment in Asia Pacific as the markets reacted to new policies and election results.
Performance of the Asian public equity markets was mixed in the first half of 2010. While markets in China, Taiwan, Hong Kong, Australia, and Japan declined between 8% and 27% in the first six months of 2010, the Indonesian market rallied 15%. Despite market volatility, increased availability of debt and an improved economic environment led to an increase in private equity investment activity in the first half of 2010. As a consequence of the volatile public equity markets, a number of planned IPOs were put on hold. However, some private equity managers completed successful exits through trade sales as corporations with healthy balance sheets took the opportunity to acquire accretive businesses.
The private equity fundraising environment
improved modestly in Asia Pacific during
the first half of 2010 over the second half
of 2009.
Growth Equity and Buyout ActivityThe private equity fundraising environment improved modestly in Asia Pacific during the first half of 2010 over the second half of 2009. Based on data from Asia Private Equity Review, $15.4 billion was raised in the first half of 2010, a 49% increase compared to the same period in 2009, and a 9% increase compared to the second half of 2009. Capital raised by growth and expansion funds, particularly those focused on developing markets, continued to gain favour over buyout funds, representing approximately 69% of the total raised. Buyout funds raised 14% of the total, while early stage venture, mezzanine, and infrastructure managers accounted for the remainder. By geography, China led fundraising, accounting for 68% of the total.
Asia Pacific private equity investment activity totaled $10.7 billion in the first half of 2010 (Asia Private Equity Review). While this is 20% higher than the $8.9 billion recorded in the first half of 2009, it is only a 4.9% increase from the second half of 2009. Similar to the fundraising trend, growth and expansion investments significantly outpaced buyout activity, receiving 70% and 21% of capital, respectively. China and India captured the majority of investments, with $3.6 billion and $2.4 billion, respectively.
Private equity liquidity events contracted during the first half of 2010 relative to the second half of 2009 as a result of volatile public markets and mixed economic data. The Asia Private Equity Review shows that 190 liquidity events were recorded in the first six months of 2010. While this represents an 88% increase compared to the first half of 2009, it is a 3% decline from the second half of 2009. By value, exit transactions totaled $5.9 billion in the first half of 2010, representing a 51% increase from the same period in 2009, but a 45% decline from the second half of 2009. Trade sales dominated the landscape, accounting for 69% of the exits, up from 50% in the second half of 2009.

Investment Manager’s Review 37
OutlookFundraising and investment activity increased in Asia Pacific in the first six months of 2010, a trend that is expected to continue into the second half of the year. As managers benefit from operational improvements within their portfolio companies and successfully navigate refinancing issues, valuation uplifts are expected. The private equity-backed IPOs that have been postponed could come back to market if the global economy continues its recovery. Additionally, increased distributions to limited partners could stimulate fundraising activity.
SECONDARY MARKET OVERVIEWBecause there is little accurate data available to track secondary dealflow generally, only HarbourVest secondary dealflow is described here.
�� Deal activity up 60% over the prior year period, with $43.2 billion in deals reviewed during the first half of 2010
�� Narrowing of bid-ask spreads and higher quality opportunities resulted in a dramatic rise in completed investment activity
�� Banks were by far the largest sellers during the period�� Continued increase in activity expected, particularly
from financial institutions given pending regulatory changes
After a relatively slow 2009 on the investment front, the first half of 2010 marked a resurgence in completed deal activity and a continued rise in secondary deal flow. Many potential sellers who explored a secondary sale during 2009 ultimately chose to hold their assets due to a disparity in bid-ask spreads. A number of these sellers returned to the market in the first half of 2010 to sell portions of their portfolios as secondary pricing improved. There were also many new sellers in the market. As deal flow continued to rise, HarbourVest evaluated $43.2 billion in original commitments for sale during the first half of 2010, up 60% from the $27.0 billion evaluated during the first half of 2009. In addition to this uplift in deal flow, there was a noticeable increase in the estimated number of completed transactions during the first half of the year compared to 2009 levels.
Following a comparatively slow first half of 2009, where financial institutions represented only 20% of HarbourVest’s deal flow (well below historic averages), these sellers returned as the largest source of deals evaluated in the first half of 2010, representing over 50% of the total. Looking to reduce their exposure to private equity, many of these institutions were slow to access the secondary market due to internal issues through most of 2009. The first half of 2010 has been dominated by deal flow from banks, with further volume expected through the remainder of the year. The Investment Manager expects financial institutions to remain active sellers for the near to medium term.
While venture-oriented opportunities dominated deal flow during 2009, buyout assets represented the major source of deal flow during the first half of 2010. At 57% of the total, it was clear that sellers were looking to reduce exposure to their largest buyout commitments through secondary sales. Additionally, the deal flow of U.S.-based assets during the first half of the year increased to over three-quarters of the total, up from approximately two-thirds during 2008 and 2009.
Within financial institutions, a surge in activity from banks has driven the significant increase in deal flow in the first half of the year. While some of these institutions merely tested the market, others have sold significant assets during the period. With the July 2010 passage of the Dodd-Frank Act by the United States Congress and the associated Volcker Rule placing restrictions on the levels of private equity that banks operating in the U.S. can hold, deal flow from banks is expected to remain high for the foreseeable future. These new regulations are not expected to take effect for nearly two years, and many institutions are likely to receive extensions to reach full compliance. However, banks could continue to explore the sale of significant portions of their private equity portfolios over the next several quarters, leading to meaningful new secondary investment opportunities.
The first half of 2010 marked a resurgence
in completed deal activity and a continued
rise in secondary deal flow.

38 HarbourVest Global Private Equity
HVPE Outlook*
While HVPE’s Investment Manager remains encouraged by the continued uplift in NAV during the first half of the financial year to 31 July 2010, despite significant headwinds, the market environment remains uncertain. Both currency and public markets have been volatile, with the euro declining 5.9% over the six-month period and the MSCI World (local) increasing 7.9% from 31 January to 30 April and declining 6.1% from 30 April to 31 July. Likewise, there has been significant variability in the Company’s capital calls and distributions over the financial period, resulting in net outflows of $9.7 million, compared to breakeven cash flows in the second half of the Company’s last fiscal year.
While market and cash flow trends are difficult to forecast, they do not affect the Company’s fundamental strategy or its positioning. In fact, it is uncertain periods that highlight HVPE’s strengths. The current environment is one that should reward diversification and a strong mature portfolio, as well as a flexible balance sheet.
The Company’s increasing NAV during the six-month period to 31 July 2010 has continued to enhance financial flexibility and enabled HVPE to use its balance sheet to benefit shareholders. During the financial period, the Company made an investment in HSLE and also committed to issue up to $40 million of Put Rights, an important part of its Liquidity Plan. More recently, on 27 September 2010, the Investment Manager committed $50 million to the HarbourVest Partners IX U.S. fund-of-funds programme.
The diversification of the HVPE portfolio, which features 36% venture exposure and lower levels of large buyout exposure relative to its peers, leaves the Company well positioned even in a difficult market. The venture allocation remains an exciting element of the portfolio, particularly given the recent increase in liquidity events and a market dynamic characterised by reduced fundraising and attractive investment opportunities. Of note, HVPE has continued to invest during this period of uncertainty. In addition to the HSLE investment, it has continued to benefit from the HarbourVest funds’ ongoing allocation of committed capital to newly-formed primary partnerships, secondary investments, and direct investments. HarbourVest’s 28 years of experience show that investments made during and just after recessions
can produce strong returns, and HVPE’s Investment Manager expects the 2010 vintage year to generate attractive results for shareholders.
At 31 July 2010, HVPE had cash and available credit facility of $393.6 million to cover capital calls or other cash requirements. The Investment Manager has repeatedly forecast that while capital calls and net borrowing may increase over the short term as a recovering economy drives increasing private equity activity, an improved economic environment will drive distributions and positive cash flows in the medium term. The recent increase in capital calls reflects this enhanced activity during the first half. However, the pace at which it will continue is unclear. Regardless, HVPE is managing its balance sheet in order to be in a position to repay its outstanding borrowings in full by no later than year-end 2014, while continuing to ensure future diversification of the investment portfolio.
The Investment Manager remains positive about the long-term potential of private equity markets and HVPE. The Investment Manager will continue to consider additional opportunities for HVPE to invest in new HarbourVest funds, to purchase existing fund interests for cash or stock, and to co-invest alongside HarbourVest funds. Investment decisions will be based on the potential impact on portfolio diversification, commitment levels and coverage, value creation for existing shareholders, and the Investment Manager’s assessment of the economic outlook.
Note Unless otherwise specified, all information is current at the time of issue. Unless otherwise noted, all data represents HarbourVest’s own estimates. Any opinions expressed are those of HarbourVest and not a statement of fact. The opinions expressed do not constitute investment advice.
* All quarterly and financial data refers to HVPE accounting periods.
First Quarter: 1 February to 30 April Second Quarter: 1 May to 31 July Third Quarter: 1 August to 31 October Fourth Quarter: 1 November to 31 January
The Investment Manager remains positive
about the long-term potential of private
equity markets and HVPE.

Investment Manager’s Review 39
Investment Manager
INDEPENDENT, EXPERIENCED, CONSISTENT, FOCUSEDGiven the long-term nature of private equity investing, where committed capital is invested over multiple years, some of the most important indicators of a prospective investment manager’s success are experience, track record, organisational stability, a consistent strategy, and a proven process. These attributes are embodied in HarbourVest.
HarbourVest is a private equity firm whose history dates back to 1982. HarbourVest has committed more than $30 billion to investments. Over the past 28 years, HarbourVest has grown to 236 employees who are based in Boston and the Firm’s London, Hong Kong, and Tokyo subsidiaries.
�� HarbourVest is independently owned by its senior investment professionals. The team of 21 managing directors averages 17 years with HarbourVest.
�� The HarbourVest team has a 28-year track record, investing successfully in private equity over numerous market cycles.
�� In an era of acquisitions and management changes, the HarbourVest team is characterised by low turnover, which creates continuity of service and retention of expertise.
�� The team relies on a consistent, time-tested investment process to source, evaluate, and select private equity opportunities with the strongest potential for returns across private equity markets, which has resulted in a long track record of success.
�� The investment process is implemented within a controlled operational environment with a built-in system of checks and balances designed to monitor and minimise risk.
INDEPENDENT PRIVATE EQUITY MANAGERAs an independent, privately-owned firm, HarbourVest is focused on its business and its clients and has control of its future. The benefits of HarbourVest’s independent private structure have become particularly clear over the past two years. Aligned with the success of its business and its investors, HarbourVest’s employee partners have significant incentive to focus on long-term investment performance and continued value creation.
SUCCESS ACROSS MARKET CYCLES AND EXTENSIVE EXPERIENCE IN THE PRIVATE EQUITY ASSET CLASSThe HarbourVest team has invested in private equity since the late 1970s, managing assets through a variety of market cycles and experiencing the ups and downs of venture capital and leveraged buyout investments, stock market volatility, and financial crises. Throughout its history, the team has learned to capitalise on opportunities created from market dislocations and aims to do so in the current cycle.
HarbourVest’s expertise encompasses all areas of global private equity. Team members based in key investment regions throughout the world provide an important local perspective and enable HarbourVest to identify and evaluate a broad range of global investment opportunities.
Consistency is a central theme throughout HarbourVest. HarbourVest hires talented investment professionals, and most remain with the firm for the long term – years longer than the industry average. As a result, HVPE benefits from decades of teamwork and investing expertise. HarbourVest’s leadership has remained stable, bringing a consistent, proven approach to investing in global private equity.
CONSISTENT STRATEGY AND FOCUSED INVESTMENT PROCESS HAS RESULTED IN STRONG TRACK RECORDThe Investment Manager remains confident about the continued innovation and success of the private equity industry and intends to follow its consistent strategy of striving for top-quartile returns by partnering with high quality managers.
Within a focused due diligence process, the Investment Manager searches for exceptional investments, evaluates them carefully, and selects those opportunities that it believes offer the strongest potential for superior returns.

40 HarbourVest Global Private Equity
As an independent, privately-owned firm,
HarbourVest is focused on its business and
its clients and has control of its future.
Throughout its history, the HarbourVest investment team has used a consistent, time-tested investment process, following the same rigorous approach to due diligence whether making a primary partnership, secondary, or direct investment and regardless of stage or location. The insights gained over years of primary, secondary, and direct investing enhance the comprehensive evaluation of potential investments. The investment team includes more than 70 professionals who can effectively cover the global private equity markets and are encouraged to communicate within an open and collaborative environment.
The HarbourVest team has one of the longest verifiable track records of investment performance in primary, secondary, and direct investments. This track record demonstrates HarbourVest’s historic ability to outperform recognised private equity benchmarks, while also providing diversification. HarbourVest’s continued ability to identify and gain access to the top-tier private equity players has been a key factor in establishing this track record. Of course, past performance is no assurance that such results will be achieved in the future, either by HarbourVest generally or by HVPE’s Investment Manager.
INVESTMENT PROCESS IMPLEMENTED WITHIN CONTROLLED ENVIRONMENT TO MINIMISE RISKHarbourVest operates within a strictly-controlled environment with multiple checks and balances in place. In December 2009, the firm successfully completed a SAS 70 Review and issued a Type II SAS 70 Report on its internal control environment and operating effectiveness.
HarbourVest’s independent auditor conducted the SAS 70 review, which covered the period from 1 April 2009 to 30 September 2009. The report, Private Equity Fund Administration Report on Controls Placed in Operation and Tests of Operating Effectiveness, documents controls across the firm’s operations including investment policy, reporting to clients, capital calls, distributions, cash management, and financial records. HarbourVest is one of the first independent private equity managers to issue a SAS 70 report. The compliance, treasury, finance, partnership performance, tax, reporting, and communications staff is among the largest and most developed in the private equity industry and includes approximately 150 professionals. Teams are focused on:
�� Compliance: A dedicated compliance officer is responsible for the overall compliance of the Investment Manager and HarbourVest funds. Outside legal counsel also manages compliance issues.
�� Cash Management: A treasury team of more than 15 dedicated professionals manages and monitors cash (including all incoming and outgoing wires) for all HarbourVest funds on a daily basis.
�� Finance/Accounting: A finance team of over 25 professionals is responsible for preparing accounts for all HarbourVest funds and reconciling data continuously with the partnership performance group.
�� Partnership Performance: A dedicated team of more than 20 professionals tracks all primary and secondary partnership investments, capital calls and distributions, performance, and underlying company investment data (currently more than 6,500 companies).
In December 2009, the firm successfully
completed a SAS 70 Review and issued a
Type II SAS 70 Report on its internal control
environment and operating effectiveness.
Investment Manager’s Review 41
Key Definitions and Methodologies
HARBOURVEST�� HarbourVest Partners, LLC acts as general partner
of HarbourVest Partners L.P., a limited partnership organised under the laws of the State of Delaware, which terms shall, as the context requires, include affiliates and predecessors of HarbourVest Partners, LLC. HarbourVest has its headquarters in Boston and three wholly-owned subsidiaries, HarbourVest Partners (U.K.) Limited, in London, HarbourVest Partners (Asia) Limited, in Hong Kong, and HarbourVest Partners (Japan) Limited, in Tokyo, established in 1990, 1996, and 2010, respectively.
THE HARBOURVEST TEAM�� The team originated in the late 1970s when D.
Brooks Zug and Edward W. Kane began making primary investments on behalf of John Hancock, a Boston-based insurance company. In 1982, they founded Hancock Venture Partners, Inc. (‘‘HVP Inc.’’). On 29 January 1997, the management team of HVP Inc. formed a new management company known as HarbourVest Partners, LLC or HarbourVest, which assumed responsibility for all prior investment activities of HVP Inc. Concurrent with the formation of HarbourVest, all of the employees of HVP Inc. became owners and/or employees of HarbourVest.
PORTFOLIOUnderlying Investments�� Investments in funds or companies in which
HVPE has an interest through its investment in HarbourVest fund(s)
Primary Investment�� Investment in a private equity fund during its initial
fund-raising
Secondary Investment�� Purchase of interests in private equity funds after
their initial fund-raising and after some or all capital has already been invested by those funds in operating companies, as well as the purchase of a portfolio of interests in operating companies
Direct Investment�� Acquisition of equity participation or debt in
an operating business
Parallel Investment�� Investment in a primary, secondary, or direct
investment alongside a HarbourVest fund on the same terms at the same time
Diversification�� The diversification analysis of HVPE’s portfolio
is based on the fair value of the underlying investments, as estimated by the Investment Manager.
�� Strategy, vintage year, and geography diversification are based on the net asset value of Primary and Secondary Investments within HVPE’s fund-of-funds and Direct Investments within HVPE’s direct funds.
�� Industry and year of investment diversification is based on the reported value of the underlying company investments.
�� Large buyout includes funds of more than $7 billion in size, medium buyout includes those between $1 billion and $7 billion in size, and small buyout includes those less than $1 billion in size. Direct investments in operating companies are categorised by deal size.
Vintage Year�� Vintage year is generally the year in which an
underlying private equity fund begins to invest capital. Although a private equity fund ultimately invests capital over several years, it has only one vintage year. For a fund-of-funds, vintage year is presented as the range of vintage years during which it made commitments to underlying partnerships. A fund’s vintage year can provide a sense of the market environment during which it made investments. Additionally, grouping similar funds by vintage year allows for performance comparison among those funds. For HVPE’s portfolio, vintage year is determined on the following basis:�– Primary Investments: year of first capital call�– Secondary Investments: year of purchase
–Direct Investments: year of first capital call of HarbourVest direct fund
Year of Investment�� Year of partnership’s initial investment in a company

42 HarbourVest Global Private Equity
COMMITMENTS AND BALANCE SHEETNet Asset Value (NAV) of Investments�� Total NAV (which represents fair market value)
of all Underlying Investments
NAV�� The sum of the NAV of Investments and cash
and other assets less the fair market value of HVPE’s liabilities
Economic NAV�� NAV excluding the fair market value of liabilities
associated with the Put Rights issued as part of the Company’s Liquidity Plan (see page 10.)
Unfunded Commitments(Allocated to Underlying Partnerships)�� Capital committed to a HarbourVest fund that
has been allocated to an underlying partnership but has not yet been called
�� Includes all capital committed to secondary and direct HarbourVest funds
Unfunded Commitments(Not Allocated to Underlying Partnerships)�� Capital committed to a HarbourVest fund that
has not yet been allocated by such HarbourVest fund to an underlying partnership
Total Unfunded Commitments�� Capital committed to a HarbourVest fund that
has not yet been called�� Sum of Unfunded Commitments (Allocated
to Underlying Partnerships) and Unfunded Commitments (Not Allocated to Underlying Partnerships)
Total Private Equity Exposure�� Sum of NAV of Investments and
Total Unfunded Commitments
Commitment Level Ratio (Total Unfunded) �� Sum of the NAV of Investments and
Total Unfunded Commitments divided by Economic NAV
Commitment Level Ratio(Allocated to Underlying Partnerships)�� Sum of the NAV of Investments and Unfunded
Commitments (Allocated to Underlying Partnerships) divided by Economic NAV
Available Credit Facility�� Amount of HVPE’s $500 million credit facility
currently available to be drawn subject to most restrictive covenant limit applicable
Asset Test Covenant�� Covenant in HVPE’s credit facility that limits
borrowings (and other liabilities) to 40% of the sum of HVPE’s NAV of Investments and cash, subject to certain adjustments
�� Key borrowing constraint that determines the maximum amount HVPE is able to borrow under its facility
Commitment Coverage Ratio (Total Unfunded)�� Sum of cash on the balance sheet and Available
Credit Facility (together, “Liquid Resources”) divided by Total Unfunded Commitments
Commitment Coverage Ratio (Allocated)�� Sum of cash on the balance sheet and Available
Credit Facility (together, “Liquid Resources”) divided by Unfunded Commitments (Allocated to Underlying Partnerships)

Board of Directors and Statement of Responsibilities 43
George Anson, Paul Christopher, Andrew Moore, and Brooks Zug were appointed directors on incorporation on 18 October 2007. Sir Michael Bunbury, Jean-Bernard Schmidt, and Keith Corbin were appointed on 19 October 2007.
STATEMENT OF DIRECTORS’ RESPONSIBILITIES IN RESPECT OF THE FINANCIAL STATEMENTSThe directors are required to prepare financial statements for each financial year and the first six months of each financial year, which give a true and fair view of the state of affairs of the Company at the end of the financial period and of the gain or loss for that period. In preparing those financial statements, the directors are required to:
�� Select suitable accounting policies and apply them consistently;
�� Make judgements and estimates that are reasonable and prudent;
�� State whether applicable accounting standards have been followed subject to any material departures disclosed and explained in the financial statements; and
�� Prepare the financial statements on the going concern basis unless it is inappropriate to presume that the Company will continue in business.
The directors are responsible for keeping proper accounting records which disclose with reasonable accuracy at any time the financial position of the Company and to enable them to ensure that the financial statements have been properly prepared in accordance with The Companies (Guernsey) Law, 2008, the requirements of NYSE Euronext, and the applicable regulations under Dutch law. They are also responsible for safeguarding the assets of the Company and hence for taking reasonable steps for the prevention and detection of fraud and other irregularities.
Board of Directors and Statement of Responsibilities
Board of Directors
Sir Michael Bunbury Chairman, Independent Director
D. Brooks Zug Director
George R. Anson Director
Jean-Bernard Schmidt Independent Director
Andrew W. Moore Independent Director
Keith B. Corbin Independent Director
Paul R.P. Christopher Independent Director

44 HarbourVest Global Private Equity
STATEMENT BY RESPONSIBLE PERSONS IN ACCORDANCE WITH THE FMSA TRANSPARENCY DECREE IMPLEMENTATION DIRECTIVE TRANSPARENCY ISSUING INSTITUTION
The directors confirm:1. That the unaudited financial statements for
the six months ended 31 July 2010 for the Company have been prepared in accordance with applicable laws and U.S. generally accepted accounting principles.
2. The fairness of the management review included in the management report.
AUDIT COMMITTEEAn Audit Committee has been established consisting of Mr. Keith Corbin (Chairman), Mr. Andrew Moore, and Mr. Jean-Bernard Schmidt. The Audit Committee examines the effectiveness of the Company’s internal control systems, the annual and interim reports and financial statements, the auditor’s remuneration and engagement, as well as the auditor’s independence and any non-audit services provided by them. The Audit Committee ensures that the Company’s contracts of engagement with the Investment Manager, Administrator, and other service providers are operating satisfactorily so as to ensure the safe and accurate management and administration of the Company’s affairs and business and are competitive and reasonable for the shareholders. Additionally, the Audit Committee makes appropriate recommendations to the Board and ensures that the Company complies to the best of its ability with applicable laws and regulations and adheres to the tenet of generally-accepted codes of conduct.
The Audit Committee receives information from the Company Secretary’s compliance department and the external auditor.
By order of the Board
Michael Bunbury Chairman
Keith Corbin Chairman of the Audit Committee
29 September 2010

Unaudited Consolidated Financial Statements 45
Consolidated Financial Statements
CONsOlIdAtEd stAtEMENt Of AssEts ANd lIABIlItIEs31 July 2010 and 31 January 2010
31 JuLY 2010 (unaudited)
31 JANuARY 2010 (Audited)
ASSETS
Investments (Notes 2 and 4) $844,925,373 $783,400,934Cash and equivalents 3,952,146 10,602,303Notes receivable (Note 2) 5,000,000 —Other assets 372,049 474,727Total assets 854,249,568 794,477,964
LIABILITIES
Notes payable (Note 6) 95,689,000 75,000,000Contribution payable (Note 2) 7,500,000 —Put Rights (Note 10) 4,266,486 —Accounts payable and accrued expenses 1,471,452 1,117,242Accounts payable to HarbourVest Advisers L.P. (Note 9) 7,521 127,518Total liabilities 108,934,459 76,244,760
Commitments (Note 5)
NET ASSETS $745,315,109 $718,233,204
NET ASSETS CONSIST OF
Class A shares, Unlimited shares authorised, 83,000,000 shares issued and outstanding, no par value $745,315,008 $718,233,103 Class B shares, 10,000 shares authorised, 101 shares issued and outstanding, no par value 101 101
Net assets $745,315,109 $718,233,204
Net asset value per share for Class A shares (Note 10) $8.98 $8.65Net asset value per share for Class B shares $1.00 $1.00
The accompanying notes are an integral part of the consolidated financial statements.
The Unaudited Consolidated Financial Statements were approved by the Board on 29 September 2010 and were signed on its behalf by:
Michael Bunbury Keith Corbin Chairman Chairman of the Audit Committee
Unaudited Consolidated Financial Statements

46 HarbourVest Global Private Equity
CONsOlIdAtEd sChEdulE Of INVEstMENts31 July 2010(Unaudited)
u.s. fuNds unfunded
Commitment
Cumulative Amount
Invested at or since hVPE’s
Inception*
Cumulative distributions
Received at or since hVPE’s
Inception* fair Value
fair Value as a % of
Net Assets
harbourVest Partners IV-Partnership fund l.P.
$2,800,000 $13,506,820 $6,413,149 $4,166,620 0.6%
harbourVest Partners V- direct fund l.P.
— 4,365,345 — 5,533,475 0.7
harbourVest Partners V-Partnership fund l.P.
2,960,000 45,969,079 17,830,469 26,584,043 3.6
harbourVest Partners VI- direct fund l.P.
1,312,500 46,722,408 23,380,664 15,986,746 2.1
harbourVest Partners VI-Partnership fund l.P.
11,643,750 198,154,299 52,891,115 142,247,783 19.1
harbourVest Partners VI-Buyout Partnership fund l.P.
600,000 8,483,048 2,270,873 5,929,298 0.8
harbourVest Partners VII-Venture Partnership fund l.P.†
25,837,500 111,771,698 5,219,703 106,894,531 14.3
harbourVest Partners VII-Buyout Partnership fund l.P.†
15,400,000 62,867,291 7,734,417 52,443,147 7.0
harbourVest Partners VIII-Cayman Mezzanine and distressed debt fund l.P.
29,250,000 20,951,553 1,697,697 18,261,919 2.5
harbourVest Partners VIII-Cayman Buyout fund l.P.
133,750,000 119,008,801 1,486,488 114,116,707 15.3
harbourVest Partners VIII-Cayman Venture fund l.P.
23,250,000 26,941,736 — 25,816,448 3.5
harbourVest Partners 2007 Cayman direct fund l.P.
58,250,000 41,876,849 — 43,199,158 5.8
tOtAl u.s. fuNds 305,053,750 700,618,927 118,924,575 561,179,875 75.3
The accompanying notes are an integral part of the consolidated financial statements.

Unaudited Consolidated Financial Statements 47
CONsOlIdAtEd sChEdulE Of INVEstMENts31 July 2010(Unaudited)
INtERNAtIONAl fuNdsunfunded
Commitment
Cumulative Amount
Invested at or since hVPE’s
Inception*
Cumulative distributions
Received at or since hVPE’s
Inception* fair Value
fair Value as a % of
Net Assets
harbourVest International Private Equity Partners II-direct fund l.P.
— 980,279 669,967 247,870 0.0%
harbourVest International Private Equity Partners II-Partnership fund l.P.
2,900,000 23,463,610 12,937,387 7,936,654 1.1
harbourVest International Private Equity Partners III-Partnership fund l.P.
6,900,000 144,278,557 58,042,800 77,779,743 10.4
harbourVest International Private Equity Partners IV-direct fund l.P.
— 61,452,400 — 39,108,740 5.2
harbourVest International Private Equity Partners IV-Partnership fund l.P.
8,750,000 121,022,051 39,104,802 80,045,274 10.8
dover street VII Cayman fund l.P. 70,500,000 29,500,000 1,353,502 31,378,173 4.2
hIPEP V - 2007 Cayman European Buyout Companion fund l.P.‡
34,372,116 30,910,406 — 27,957,453 3.8
hIPEP VI-Cayman Partnership fund l.P.§
125,951,800 4,373,800 — 3,249,588 0.4
harbourVest senior loans Europe limited**
— 14,409,000 — 16,042,003 2.2
tOtAl INtERNAtIONAl fuNds 249,373,916 430,390,103 112,108,458 283,745,498 38.1
tOtAl INVEstMENts $554,427,666 $1,131,009,030 $231,033,033 $844,925,373 113.4%
* Includes purchase of limited partner interests for shares and cash at the time of HVPE’s IPO.
† Includes ownership interests in HarbourVest Partners VII-Cayman Partnership entities.
� Fund denominated in euros. Commitment amount is €47,450,000.
§ Fund denominated in euros. Commitment amount is €100,000,000.
** Fund denominated in British pounds. 10,000,000 shares held at 31 July 2010.
The accompanying notes are an integral part of the consolidated financial statements.

48 HarbourVest Global Private Equity
CONsOlIdAtEd stAtEMENt Of OPERAtIONsFor the Period Ended 31 July 2010 and 2009(Unaudited)
2010 2009INVESTMENT INCOME
Dividends from cash and equivalents $3,977 $60,651
Interest from cash and equivalents 200 301
Total investment income 4,177 60,952
EXPENSES
Non-recurring liquidity plan expenses (Note 10) 1,667,377 —
Non-utilisation fees (Note 6) 842,450 858,889
Interest expense (Note 6) 737,772 718,548
Investment services (Note 3) 648,055 716,745
Professional fees 292,929 301,461
Directors’ fees and expenses (Note 9) 180,723 162,939
Insurance expense 149,350 149,348
Administration fees (Note 3) 61,450 58,970
Marketing expenses 33,575 50,703
Other expenses 49,494 81,722
Total expenses 4,663,175 3,099,325
NET INVESTMENT LOSS (4,658,998) (3,038,373)
REALISED AND UNREALISED GAINS (LOSSES) ON INVESTMENTS AND PUT RIGHTS
Net realised gain (loss) on investments 2,061,567 (18,116,369)
Net change in unrealised appreciation (depreciation) on:
Investments 35,300,822 41,855,765
Put Rights (4,266,486) —
Translation of other assets and liabilities denominated in foreign currency
(1,355,000)
—
Net change in unrealised appreciation (depreciation) 29,679,336 41,855,765
Net gain (loss) on investments and Put Rights 31,740,903 23,739,396
NET INCREASE (DECREASE) IN NET ASSETS RESULTING FROM OPERATIONS
$27,081,905
$20,701,023
The accompanying notes are an integral part of the consolidated financial statements.

Unaudited Consolidated Financial Statements 49
CONsOlIdAtEd stAtEMENt Of ChANgEs IN NEt AssEtsFor the Period ended 31 July 2010 and Year ended 31 January 2010
31 JuLY 2010 (unaudited)
31 JANuARY 2010 (Audited)
INCREASE IN NET ASSETS FROM OPERATIONS:
Net investment loss ($4,658,998) ($6,337,536)
Net realised gain (loss) on investments 2,061,567 (27,232,274)
Net change in unrealised appreciation (depreciation) 29,679,336 120,521,185
Net increase in net assets resulting from operations 27,081,905 86,951,375
NET ASSETS AT BEGINNING OF PERIOD 718,233,204 631,281,829
NET ASSETS AT END OF PERIOD $745,315,109 $718,233,204
The accompanying notes are an integral part of the consolidated financial statements.

50 HarbourVest Global Private Equity
CONsOlIdAtEd stAtEMENt Of CAsh flOWsFor the Period ended 31 July 2010 and Year ended 31 January 2010
31 JuLY 2010 (unaudited)
31 JANuARY 2010 (Audited)
CASH FLOWS FROM OPERATING ACTIVITIES
Net increase in net assets resulting from operations $27,081,905 $86,951,375
Adjustments to reconcile net increase in net assets resulting from operations to net cash used in operating activities:
Net realised (gain) loss on investments (2,061,567) 27,232,274
Net change in unrealised (appreciation) depreciation (29,679,336) (120,521,185)
Contributions to private equity investments (57,930,456) (73,811,721)
Purchase of private equity investment (14,409,000) —
Distributions from private equity investments 48,177,406 51,751,457
Change in notes receivable (5,000,000) —
Change in other assets 102,678 (41,215)
Change in accounts payable to HarbourVest Advisers L.P. (119,997) (219,142)
Change in contributions payable 7,500,000 —
Change in accounts payable and accrued expenses 354,210 (1,954,862)
Net cash used in operating activities (25,984,157) (30,613,019)
FINANCING ACTIVITIES
Proceeds from notes payable 19,334,000 30,000,000
Payments on notes payable — (15,000,000)
Net cash provided by financing activities 19,334,000 15,000,000
NET DECREASE IN CASH AND EQUIVALENTS (6,650,157) (15,613,019)
CASH AND EQUIVALENTS AT BEGINNING OF PERIOD 10,602,303 26,215,322
CASH AND EQUIVALENTS AT END OF PERIOD $3,952,146 $10,602,303
SUPPLEMENTAL DISCLOSURE
Interest paid $819,046 $1,339,638
The accompanying notes are an integral part of the consolidated financial statements.

Unaudited Consolidated Financial Statements 51
Notes to Consolidated Financial Statements
NOTE 1 COMPANY ORGANISATION AND INVESTMENT OBJECTIVEHarbourVest Global Private Equity Limited (the “Company” or “HVPE”) is a closed-end investment company registered with the Registrar of Companies in Guernsey under The Companies (Guernsey) Law, 2008. The Company’s registered office is Anson Place, Mill Court, La Charroterie St. Peter Port, Guernsey GY1 2BE. The Company was incorporated and registered in Guernsey on 18 October 2007. HVPE is designed to offer shareholders long-term capital appreciation by investing in a diversified portfolio of private equity investments. The Company invests in private equity through private equity funds and may make co-investments or opportunistic investments. The Company is managed by HarbourVest Advisers L.P. (the “Investment Manager”), an affiliate of HarbourVest Partners, LLC (“HarbourVest”), a private equity fund-of-funds manager. The Company is intended to invest in and alongside existing and newly formed HarbourVest funds. HarbourVest is a global private equity fund-of-funds manager and typically invests capital in primary partnerships, secondary investments, and direct investments across vintage years, geographies, industries, and strategies. Operations commenced on 6 December 2007, following the initial global offering of the Class A ordinary shares.
Share CapitalThe Company’s Class A shares are listed on the Specialist Fund Market (“SFM”) of the London Stock Exchange and Euronext Amsterdam by NYSE Euronext under the symbol “HVPE”. As of 31 July 2010 there are 83,000,000 issued Class A ordinary shares of no par value. The Class A shares are entitled to the income or increases and decreases in the net asset value of the Company, and to any dividends declared and paid, but have limited voting rights. Dividends may be declared by the Board of Directors and paid from available assets subject to the directors being satisfied that the Company will, after payment of the dividend, satisfy a statutory solvency test. Dividends will be paid to shareholders pro rata to their shareholdings. Final dividends must be approved by the holders of the Class B shares.
The Class B shares were issued to HVGPE Holdings Limited, a Guernsey limited liability company, which is owned by affiliates of HarbourVest. The Class B shares have the right to elect all of the directors and make other decisions usually made by shareholders. As at 31 July 2010, 101 Class B shares of no par value have been issued. The Class B shares are not entitled to income or any increases and decreases in the net asset value of the Company or to any dividends declared and paid.
The Class A shareholders must approve any amendment to the memorandum and articles of association except any changes that are administrative in nature, any material change from the investment strategy and/or investment objective of the Company, or the terms of the investment management agreement. These require the approval of 75% of each of the Class A and Class B shares.
There is no minimum statutory capital requirement under Guernsey law.
Investment ManagerThe directors have delegated the day-to-day operations of the Company to the Investment Manager pursuant to an investment management and services agreement. The Investment Manager is responsible for, among other things, selecting, acquiring, and disposing of the Company’s investments, carrying out financing, cash management, and risk management activities, providing investment advisory services, including with respect to HVPE’s investment policies and procedures, and arranging for personnel and support staff to assist in the administrative functions of the Company.
DirectorsThe directors are responsible for the determination of the investment policy of the Company and have overall responsibility for the Company’s activities. This includes the periodic review of the Investment Manager’s compliance with the Company’s investment policies and procedures and the approval of certain investments. The directors have delegated the day-to-day operations of the Company to the Investment Manager. A majority of directors must be independent directors and not affiliated with HarbourVest or any affiliate of HarbourVest.

52 HarbourVest Global Private Equity
NOTE 2 SUMMARY OF SIGNIFICANT ACCOUNTING POLICIESThe following accounting policies have been applied consistently in dealing with items which are considered material in relation to the Company’s consolidated financial position.
Basis of PresentationThe consolidated financial statements include the accounts of HarbourVest Global Private Equity Limited and its five wholly owned subsidiaries, HVGPE - Domestic A L.P., HVGPE - Domestic B L.P., HVGPE - Domestic C L.P., HVGPE - International A L.P., and HVGPE - International B L.P. Each of the subsidiaries is a Cayman Islands limited partnership formed to facilitate the purchase of certain investments. All intercompany accounts and transactions have been eliminated in consolidation. Certain comparative amounts have been reclassified to conform to the current year’s presentation.
Method of AccountingThe consolidated financial statements are prepared in conformity with U.S. generally accepted accounting principles (“U.S. GAAP”), The Companies (Guernsey) Law, 2008, and the Principal Documents by using the exemption provided in Section 5:25v of the Dutch Financial Markets Supervision Act.
EstimatesThe preparation of the financial statements in conformity with U.S. GAAP requires management to make estimates and assumptions that affect the amounts reported in the consolidated financial statements and accompanying notes. Actual results could differ from those estimates.
InvestmentsInvestments are stated at fair value in accordance with the Company’s investment valuation policy. In establishing the fair value of the partnership investments, the Company takes into consideration the information received from those partnerships, including their financial statements, the currency in which the investment is denominated and other information deemed appropriate. However, because of the inherent uncertainty of valuation, those estimated values may differ significantly from the values that would have been used had a ready market for the investment existed, and the differences could be material. Securities for which public markets do exist are valued by the Company at quoted market prices at the balance sheet date.
Generally, the investments have a defined term and cannot be transferred without the consent of the General Partner of the limited partnership in which the investment has been made.
Foreign Currency TransactionsThe currency in which the Company operates is U.S. dollars, which is also the presentation currency. Transactions denominated in foreign currencies are recorded in the local currency at the exchange rate in effect at the transaction dates. Foreign currency investments, investment commitments, and other assets and liabilities are translated at the rates in effect at the balance sheet date. Foreign currency translation gains and losses are included in realised and unrealised gains and losses on investments as incurred. The Company does not segregate that portion of realised or unrealised gains and losses attributable to foreign currency translation on investments.
Cash and EquivalentsThe Company considers all highly liquid investments with an original maturity of three months or less to be cash equivalents. The carrying amount included in the balance sheet for cash and equivalents approximates the fair value. The Company maintains bank accounts denominated in U.S. dollars, in euros, and in pound sterling. The Company may invest excess cash balances in highly liquid instruments such as certificates of deposit, sovereign debt obligations and commercial paper as well as money market funds that are highly rated by the credit rating agencies.
Notes ReceivableNotes receivable represents amounts borrowed against the multi-currency revolving credit facility and not yet received.
Contribution PayableContribution payable includes an amount called from an underlying partnership investment and not yet paid.
Investment IncomeInvestment income includes interest and dividends from cash and equivalents. Dividends are recorded when they are declared and interest is recorded when earned.
Operating ExpensesOperating expenses include amounts directly incurred by the Company as part of its operations, and do not include amounts incurred from the operations of the investment entities.

Unaudited Consolidated Financial Statements 53
Net Realised Gains and Losses on InvestmentsFor investments in private equity funds, the Company records its share of realised gains and losses as reported by the Investment Manager.
Net Change in Unrealised Appreciation and Depreciation on InvestmentsGains and losses arising from changes in investment values are recorded as an increase or decrease in the unrealised appreciation or depreciation of investments.
Income TaxesThe Company is registered in Guernsey as an exempt company. The States of Guernsey Income Tax Authority has granted the Company exemption from Guernsey income tax under the provision of the Income Tax (Exempt Bodies) (Guernsey) Ordinance 1989 (as amended) and the Company will be charged an annual exemption fee of £600.
Income may be subject to withholding taxes imposed by the U.S. or other countries which will impact the Company’s effective tax rate.
Investments made in entities that generate U.S. source income may subject the Company to certain U.S. federal and state income tax consequences. A U.S. withholding tax at the rate of 30% may be applied on the distributive share of any U.S. source dividends and interest (subject to certain exemptions) and certain other income that is received directly or through one or more entities treated as either partnerships or disregarded entities for U.S. federal income tax purposes. Furthermore, investments made in entities that generate income that is effectively connected with a U.S. trade or business may also subject the Company to certain U.S. federal and state income tax consequences. The U.S. requires withholding on effectively connected income at the highest U.S. rate (generally 35%). In addition, the Company may also be subject to a branch profits tax which can be imposed at a rate of up to 30% of any after-tax, effectively connected income associated with a U.S. trade or business. However, no amounts have been accrued.
The Company accounts for income taxes under the provisions of ASC 740-10, “Accounting for Uncertainty in Income Taxes.” This standard establishes consistent thresholds as it relates to accounting for income taxes. It defines the threshold for recognising the benefits of tax-return positions in the financial statements as “more-likely-than-not” to be sustained by the taxing authority and requires measurement of a tax position meeting the more- likely-than-not criterion, based on the largest benefit
that is more than fifty percent likely to be realised. For the six-month period ended 31 July 2010, the Investment Manager has analysed the Company’s inventory of tax positions taken with respect to all applicable income tax issues for all open tax years (in each respective jurisdiction), and had concluded that no provision for income tax is required in the Company’s financial statements.
Shareholders in certain jurisdictions may have individual tax consequences from ownership of the Company’s shares. The Company has not accounted for any such tax consequences in these consolidated financial statements.
Market and Other Risk FactorsThe Company’s investments are subject to various risk factors including market, credit, interest rate and currency risk. Investments are based primarily in the U.S. and Europe and thus have concentrations in such regions. The Company’s investments are also subject to the risks associated with investing in leveraged buyout and venture capital transactions that are illiquid and non-publicly traded. Such investments are inherently more sensitive to declines in revenues and to increases in expenses that may occur due to general downward swings in the world economy or other risk factors including increasingly intense competition, rapid changes in technology, changes in federal, state and foreign regulations, and limited capital investments.
NOTE 3 MATERIAL AGREEMENTS AND RELATED FEESAdministration AgreementThe Company has retained Anson Fund Managers Limited (“AFML”) as Company Secretary and Administrator. Fees for these services are paid as invoiced by AFML and include an administration fee of £22,000 per annum, a secretarial fee of £25,000 per annum, an additional value fee equal to 1/12 of 0.005% of the net asset value of the Company above $100 million as at the last business day of each month, and reimbursable expenses. During the period ended 31 July 2010, fees of $61,450 were incurred to AFML.
RegistrarAs of 6 May 2010, the Company has retained Capita as share registrar. Fees for this service include an annual base fee of £7,500 per annum and a £5,000 put right registration fee over the 18-month life of the put rights. Anson Registrars Limited (“ARL”) served as share registrar for the period ended 6 May 2010.
54 HarbourVest Global Private Equity
Independent Auditor’s Fees For the period ended 31 July 2010, $51,250 has been accrued for auditor’s fees and is included in professional fees in the Consolidated Statement of Operations.
Investment Management AgreementThe Company has retained HarbourVest Advisers L.P. as the Investment Manager. The Investment Manager is reimbursed for costs and expenses incurred on behalf of the Company in connection with the management and operation of the Company. During the period ended 31 July 2010, reimbursements for services provided by the Investment Manager were $648,055. The Investment Manager does not charge HVPE management fees or performance fees other than with respect to parallel investments (of which there are none at 31 July 2010). As an investor in the HarbourVest funds, HVPE is charged the same management fees and subject to the same performance allocations as other investors in such HarbourVest funds. A management fee will be paid for any parallel investments made by the Company consistent with the fees charged by the fund alongside which the parallel investment is made.
NOTE 4 INVESTMENTSNet gain includes the following activity related to the Company’s investments:
FOR THE PERIOD ENDED 31 JuLY 2010Net realised gain (loss) on investments $2,061,567
Net change in unrealised appreciation (depreciation) on investments
35,300,822
Net gain (loss) on investments $37,362,389
In accordance with the ASC 820, “Fair Value Measurements and Disclosures,” the Company reports its investments at fair value.
The hierarchy established under the FASB Fair Value Topic gives the highest priority to unadjusted quoted prices in active markets for identical assets or liabilities (Level 1) and the lowest priority to unobservable inputs (Level 3). As required by the FASB Fair Value Topic, the partnership investments are classified within the fair value hierarchy based on the lowest level of input that is significant to the fair value measurement. The three levels of the fair value hierarchy under the FASB Fair Value Topic, and its applicability to the Company’s investments, are described below:
Level 1 – Unadjusted quoted prices in active markets that are accessible at the measurement date for identical, unrestricted assets or liabilities.
Level 2 – Quoted prices for similar assets or liabilities, or inputs that are observable, either directly or indirectly, for substantially the full term through corroboration with observable market data. Level 2 includes investments valued at quoted prices adjusted for legal or contractual restrictions specific to the security.
Level 3 – Pricing inputs are unobservable for the asset or liability, that is, inputs that reflect the reporting entity’s own assumptions about the assumptions market participants would use in pricing the asset or liability. Level 3 includes private investments that are supported by little or no market activity.
Level 3 partnership investments include limited partnership interests in other investment partnerships. The inputs used by the Investment Manager in estimating the value of Level 3 investments includes the information received from those partnerships, including their financial statements, the currency in which the investment is denominated and other information deemed appropriate.

Unaudited Consolidated Financial Statements 55
The following table summarises the Company’s investments that were accounted for at fair value by Level within the fair value hierarchy under FASB Fair Value Topic:
LEVEL 1 LEVEL 2 LEVEL 3 TOTAL
Balance at 31 January 2010 — — $783,400,934 $783,400,934
Purchase of investment $14,409,000 — — 14,409,000
Contributions to investments — — 57,930,456 57,930,456
Net realised gain (loss) on investments — — 2,061,567 2,061,567
Net change in unrealised appreciation (depreciation) on investments related to investments 1,633,003 — 33,667,819 35,300,822
Distributions received from investments — — (48,177,406) (48,177,406)
Transfers in and/or (out) of Level — — — —
Balance at 31 July 2010 $16,042,003 — $828,883,370 $844,925,373
Net change in unrealised gain (loss) on investments related to investments still held at 31 July 2010
$35,300,822
Investments include limited partnership interests in private equity partnerships, all of which carry restrictions on redemption.
The investments are non-redeemable, and the Investment Manager estimates an average remaining life of 9.1 years (excluding HarbourVest Senior Loans Europe Limited).
NOTE 5 COMMITMENTSAs of 31 July 2010, the Company has unfunded investment commitments to other limited partnerships of $554,427,666 which are payable upon notice by the partnerships to which the commitments have been made. Unfunded investment commitments of $160,323,916 within this balance are denominated in euros.
NOTE 6 NOTES PAYABLEOn 4 December 2007 the Company entered into an agreement with Bank of Scotland plc regarding a multi-currency revolving credit facility (“Facility”) for an aggregate amount up to $500 million. Amounts borrowed against the Facility accrue interest at LIBOR plus 1.5% per annum. At 31 July 2010, interest rates on the outstanding balance ranged from 1.72875% to 2.1326%. The Facility expires on 4 December 2014. The Facility is secured by the private equity investments and cash equivalents of the Company, as defined in the agreement. Availability of funds under the Facility and interim repayments of amounts borrowed are subject to certain covenants and diversity tests applied to the investment portfolio of the Company. At 31 July 2010, $95,689,000 was outstanding against the Facility. The Company is required to pay a non-utilisation fee calculated as 40 basis points per annum on the daily balance of the unused Facility amount. For the period ended 31 July 2010, $842,450 in non-utilisation fees and $737,772 in interest expense have been incurred.

56 HarbourVest Global Private Equity
NOTE 7 FINANCIAL HIGHLIGHTS*For the Period ended 31 July 2010 and Year ended 31 January 2010
CLASS A SHARES
31 JuLY 2010 (unaudited)
31 JANuARY 2010 (Audited)
PER SHARE OPERATING PERFORMANCE
Net Asset Value, beginning of period $8.65 $7.61
Net investment loss (0.05) (0.08)
Net realised and unrealised gains (losses) 0.38 1.12
Total from investment operations 0.33 1.04
Net asset value, end of period $8.98 $8.65
Total return 3.8%† 13.7%
RATIOS TO AVERAGE NET ASSETS
Expenses� 1.27%§ 0.95%
Expenses – excluding non-recurring Liquidity Plan expenses� 1.05%§ 0.95%
Net investment income (loss) (1.27)%§ (0.94)%
PORTFOLIO TURNOVER** 0.0% 0.0%
* The class B shares are not entitled to any income or increases and decreases in the net asset value of the Company.
† Unannualised.
� Does not include operating expenses of underlying investments.
§ Annualised.
** The turnover ratio has been calculated as the number of transactions divided by the average net assets.
NOTE 8 PUBLICATION AND CALCULATION OF NET ASSET VALUEThe Net Asset Value (“NAV”) of the Company is equal to the value of its total assets less its total liabilities. The NAV per share of each class is calculated by dividing the net asset value of the relevant class account by the number of shares of the relevant class in issue on that day. The Company intends to publish the Economic NAV and NAV per share of the Class A shares as calculated, monthly in arrears, as at each month-end, generally within 15 days.
NOTE 9 RELATED PARTY TRANSACTIONSThe shareholders of HVGPE Holdings Limited are members of HarbourVest Partners, LLC, and are the partners or members of the General Partner entities of each of the HarbourVest funds in which the Company owns an interest.
Other amounts payable to HarbourVest Advisers L.P. of $7,521 represent expenses of the Company incurred in the ordinary course of business, which have been paid by and are reimbursable to HarbourVest Advisers L.P. at 31 July 2010.
One of the directors, Paul Christopher, is a Partner of Mourant Ozannes, which acts as Guernsey counsel to the Company. HarbourVest fund-of-funds invest in partnerships managed by Sofinnova Partners, of which Director Jean-Bernard Schmidt is Managing Partner.
Each director, with the exception of the Chairman, Keith Corbin, D. Brooks Zug, and George R. Anson, is paid an annual fee of $50,000 per annum, paid quarterly. The Chairman of the Board receives an annual fee of $100,000 plus $10,000 for expenses. The Chairman of the Audit Committee receives an annual fee of

Unaudited Consolidated Financial Statements 57
$60,000. George R. Anson and D. Brooks Zug do not receive any fee from the Company. Board-related expenses, primarily fees, of $180,723 were paid during the period ended 31 July 2010.
NOTE 10 LIQUIDITY PLANOn 12 May 2010, HVPE was admitted to the Specialist Fund Market of the London Stock Exchange. In conjunction with the listing, on 18 May 2010, HVPE’s joint corporate brokers coordinated a secondary placing of 4.8 million shares of HVPE held by existing shareholders. HVPE provided a Put Right to purchasers of the shares for both shares purchased in the secondary placing and for shares purchased thereafter, in the public markets. The Put Right allows shareholders to sell their shares back to HVPE on 15 November 2011 at the lower of $5.75 or estimated Economic NAV per share as at 31 October 2011. 4,763,208 puts were issued in connection with the secondary placing, with 2,193,313 additional puts available to be issued to purchasers of shares in the market. As at 31 July 2010, 5,035,958 puts were issued and outstanding, and 1,920,563 were available to be issued. The Investment Manager has used a binomial option pricing model to value the put liability. As at 31 July 2010, the fair value of the liability associated with the Put Rights was $4,266,486 and is included in the Consolidated Statement of Operations under net change in unrealised appreciation (depreciation) on Put Rights. Non-recurring expenses associated with the liquidity plan totaled $1,667,377 and were expensed.
The Company’s maximum obligation under the put offer is $40 million of stock buyback in November 2011, which would be funded through available resources, including HVPE’s credit facility. Any share repurchase under the put offer would be either neutral or accretive to HVPE’s NAV per share.
RECONCIlIAtION Of NEt AssEt VAluE PER ClAss A shARE tO ECONOMIC NEt AssEt VAluE PER ClAss A shARE:Net asset value per share $8.98
Fair value of put liability per share 0.05
Economic net asset value per share $9.03
NOTE 11 INDEMNIFICATIONSGeneral IndemnificationsIn the normal course of business, the Company may enter into contracts that contain a variety of representations and warranties and which provide for general indemnifications. The Company’s maximum exposure under these arrangements is unknown, as this would involve future claims that may be made against the Company that have not yet occurred. Based on the prior experience of the Investment Manager, the Company expects the risk of loss under these indemnifications to be remote.
Investment Manager IndemnificationsConsistent with standard business practices in the normal course of business, the Company has provided general indemnifications to the Investment Manager, any affiliate of the Investment Manager and any person acting on behalf of the Investment Manager or such affiliate when they act in good faith, in the best interest of the Company. The Company is unable to develop an estimate of the maximum potential amount of future payments that could potentially result from any hypothetical future claim, but expects the risk of having to make any payments under these general business indemnifications to be remote.
NOTE 12 SUBSEQUENT EVENTSIn the preparation of the financial statements, the Company has evaluated the effects, if any, of events occurring after 31 July 2010 through 29 September 2010, which is the date that the financial statements were issued.
In connection with the Company’s Liquidity Plan, in order to facilitate the sale of shares in the secondary placing by a shareholder whose shares were held by an affiliate of Lehman Brothers International (Europe) (in administration) and therefore could not be transferred, the Company issued 1,330,378 replacement shares on 13 May 2010. The issuance of the replacement shares did not affect the Company’s outstanding shares as an agreement was put in place to return the shares to HVPE upon their release from Lehman Brothers. On 9 August 2010, the relevant shares were released by the Lehman Brothers administrator to the shareholder. On 20 September 2010, the relevant shares were cancelled.
As at 29 September 2010, 6,745,061 puts were issued and outstanding and 211,460 were available to be issued.

58 HarbourVest Global Private Equity
This report contains certain forward-looking statements. Forward-looking statements relate to expectations, beliefs, projections, future plans and strategies, anticipated events or trends and similar expressions concerning matters that are not historical facts. In some cases, forward-looking statements can be identified by terms such as ‘‘anticipate,’’ ‘‘believe,’’ ‘‘could,’’ ‘‘estimate,’’ ‘‘expect,’’ ‘‘intend,’’ ‘‘may,’’ ‘‘plan,’’ ‘‘potential,’’ ‘‘should,’’ ‘‘will,’’ and ‘‘would,’’ or the negative of those terms or other comparable terminology. The forward-looking statements are based on the Investment Manager’s beliefs, assumptions, and expectations of future performance and market developments, taking into account all information currently available. These beliefs, assumptions, and expectations can change as a result of many possible events or factors, not all of which are known or are within the Investment Manager’s control. If a change occurs, the Company’s business, financial condition, liquidity, and results of operations may vary materially from those expressed in forward-looking statements. Some of the factors that could cause actual results to vary from those expressed in forward-looking statements include, but are not limited to:
�� the factors described in this report;
�� the rate at which HVPE deploys its capital in investments and achieves expected rates of return;
�� HarbourVest’s ability to execute its investment strategy, including through the identification of a sufficient number of appropriate investments;
�� the ability of third-party managers of funds in which the HarbourVest funds are invested and of funds in which the Company may invest through parallel investments to execute their own strategies and achieve intended returns;
�� the continuation of the Investment Manager as manager of the Company’s investments, the continued affiliation with HarbourVest of its key investment professionals and the continued willingness of HarbourVest to sponsor the formation of and capital raising by, and to manage, new private equity funds;
�� HVPE’s financial condition and liquidity, including its ability to access or obtain new sources of financing at attractive rates in order to fund short term liquidity needs in accordance with the investment strategy and commitment policy;
�� changes in the values of, or returns on, investments that the Company makes;
�� changes in financial markets, interest rates or industry, general economic or political conditions; and
�� the general volatility of the capital markets and the market price of HVPE’s shares.
By their nature, forward-looking statements involve known and unknown risks and uncertainties because they relate to events, and depend on circumstances, that may or may not occur in the future. Forward-looking statements are not guarantees of future performance. Any forward-looking statements are only made as at the date of this document, and the Investment Manager neither intends nor assumes any obligation to update forward-looking statements set forth in this document whether as a result of new information, future events, or otherwise, except as required by law or other applicable regulation.
In light of these risks, uncertainties, and assumptions, the events described by any such forward-looking statements might not occur. The Investment Manager qualifies any and all of its forward-looking statements by these cautionary factors.
Please keep this cautionary note in mind while reading this report.
Forward-Looking Statements

Forward-Looking Statements 59
Publication and Calculation of Net Asset Value
The Net Asset Value of the Company is equal to the value of its total assets less its total liabilities. The NAV per share of each class is calculated by dividing the net asset value of the relevant class account by the number of shares of the relevant class in issue on that day. Economic NAV excludes the “fair value” of liabilities, booked under U.S. GAAP, related to Put Rights the Company has issued in connection with its Liquidity Plan. Please refer to the Liquidity Plan section on page 10 for additional information. The Company’s Investment Manager believes that Economic NAV per share is the most appropriate measure of economic value for investors. The Company intends to publish the Economic NAV per share and NAV per share for the Class A shares as calculated, monthly in arrears, as at each month-end, generally within 15 days.
Certain Information
HVPE is subject to the Dutch Financial Markets Supervision Act (Wet op het financieel toezicht, “FMSA”) and is registered with the Netherlands Authority for the Financial Markets as a closed-end investment company pursuant to section 1:107 of the FMSA. It is also authorised by the Guernsey Financial Services Commission as an authorised closed-ended investment scheme under the Protection of Investors (Bailiwick of Guernsey) Law, 1987 (the “POI Law”). HVPE is subject to certain ongoing requirements under the FMSA and POI Law and certain rules promulgated thereunder relating to the disclosure of certain information to investors, including the publication of annual and semi-annual financial statements.

60 HarbourVest Global Private Equity
Key InformationExchange Euronext Amsterdam & London Stock Exchangeticker HVPElisting date 6 December 2007 (Euronext), 12 May 2010 (LSE)fiscal Year End 31 JanuaryBase Currency U.S. DollarsIsIN GG00B28XHD63Bloomberg HVPE NA, HVPE LNReuters HVPE.AS, HVPE.LCommon Code 032908187Amsterdam security Code 612956Investment Manager HarbourVest Advisers L.P. (affiliate of HarbourVest Partners, LLC)Registration Netherlands Authority for the Financial Marketsfund Consent Guernsey Financial Services CommissionIssued shares 83,000,000 Class A ordinary shares
Management and Administration
REgIstEREd OffICEharbourVest global Private Equity limitedCompany Registration Number: 47907Anson PlaceMill CourtLa CharroterieSt Peter PortGuernsey GY1 1EJTel +44 1481 722 260Fax +44 1481 729 829
COMPANY sECREtARY ANd fuNd AdMINIstRAtORAnson fund Managers limitedPO Box 405Anson PlaceMill CourtLa CharroterieSt Peter PortGuernsey GY1 3GFTel +44 1481 722 260Fax +44 1481 729 [email protected]
INVEstMENt MANAgER harbourVest Advisers l.P.c/o HarbourVest Partners, LLCOne Financial CenterBoston MA 02111 U.S.A.Tel +1 617 348 3707Fax +1 617 350 0305
REgIstRARCapita RegistrarsThe Registry34 Beckenham RoadBeckenhamKent BR3 4TU U.K.Tel +44 (0)871 664 0300 (U.K.)Tel +44 (0)20 8369 3399 (outside U.K.)
AudItORsErnst & Young llP Royal ChambersSt Julian’s AvenueSt Peter PortGuernsey GY1 4AFTel +44 1481 717 400Fax +44 1481 713 901
JOINt CORPORAtE BROKERsOriel securities limited125 Wood StreetLondon EC2V 7AN U.K.Tel +44 20 7710 7600Fax +44 20 7710 7609
J.P. Morgan Cazenove*10 AldermanburyLondon EC2V 7RF U.K.Tel +44 20 7588 2828
* J.P. Morgan Securities Ltd., which conducts its U.K. investment banking activities as J.P. Morgan Cazenove.
Advisors and Contact Information

Advisors and Contact Information 61
Contact
Steve Belgrad, Chief Financial Officer [email protected] +1 617 348 3653
Calendar of Events 2010/2011
Monthly NAV Estimate Generally within 15 days of month end
Interim Management statement November 2010 / June 2011
Investor Meeting, london 10 November 2010
Annual Report and Audited Consolidated financial statements May 2011
Annual Information document June 2011
Informal Meeting for shareholders June 2011

www.hvgpe.com


