Embed Size (px)
Citation preview

Contents lists available at ScienceDirect
Journal of Quantitative Spectroscopy &Radiative Transfer
Journal of Quantitative Spectroscopy & Radiative Transfer 130 (2013) 134–146
0022-40http://d
n CorrE-m
xinchuaRichardTashkunDavid.WTimothy
journal homepage: www.elsevier.com/locate/jqsrt
Semi-empirical 12C16O2 IR line lists for simulationsup to 1500 K and 20,000 cm−1
Xinchuan Huang a,n, Richard S. Freedman a, Sergey A. Tashkun c,David W. Schwenke b, Timothy J. Lee d,n
a SETI Institute, 189 Bernardo Ave, Suite 100, Mountain View, CA 94043, USAb MS T27B-1, NASA Ames Research Center, Moffett Field, CA 94035-0001, USAc V.E. Zuev Institute of Atmospheric Optics, SB RAS, 1, Academician Zuev square, Tomsk 634021, Russiad MS 245-1, NASA Ames Research Center, Moffett Field, CA 94035-0001, USA
a r t i c l e i n f o
Article history:Received 5 March 2013Received in revised form15 May 2013Accepted 23 May 2013Available online 31 May 2013
Keywords:12C16O2
Infrared line listHigh temperatureTheoretical spectroscopyHigh energy
73/$ - see front matter & 2013 Elsevier Ltd.x.doi.org/10.1016/j.jqsrt.2013.05.018
esponding authors. Tel.: +1 650 604 6264.ail addresses: [email protected],[email protected] (X. Huang),[email protected] (R.S. Freedman),@rambler.ru (S.A. Tashkun),[email protected] (D.W. Schwenke),[email protected] (T.J. Lee).
a b s t r a c t
New semi-empirical Infrared (IR) line lists for 12C16O2, Ames-296 K and Ames-1000 K,have been computed using a newly updated ab initio CCSD(T)/aug-cc-pVQZ dipolemoment surface (denoted DMS-N2) and an empirically refined potential energy surface(Ames-1). J¼0–150 rovibrational levels are computed up to 30,000 cm−1, and relatedtransitions are cut off at 1E−42 cm molecule−1 (296 K) and 1E−36 cm molecule−1
(1000 K). These are the first line lists available to cover reliably the energy region as highas �20,000 cm−1. Recent experimental data at 1.1 μm has confirmed the predictedintensities for the 50013-00001 and 50014-00001 band transitions have better than90% agreement. Comparisons are made against the Wattson 750 K line list and HITEMP/HITRAN at 300 K, 500 K, 725 K, 1000 K, 1500 K, 2000 K and 3000 K. The temperaturedependence and accuracy of the new Ames-296 K/1000 K line lists are investigated andwe claim both line lists are capable of providing reliable opacities up to 18,000–23,000 cm−1, while the highest applicable wavenumber range drops as T rises. We suggestcaution is used for T41000 K simulations. Comparison to recent experiments at 1000 K,1550 K and 1773 K shows that the Ames-1000 K line list and HITEMP perform similarly inthe 3200–3800 cm−1 and 4600–5200 cm−1 ranges. In the 2000–2100 cm−1 range, Ames-1000 K yields better agreement relative to experiment. Existing problems and possiblefuture solutions in the new Ames-296 K/1000 K line lists for line positions and intensitiesare also discussed.
& 2013 Elsevier Ltd. All rights reserved.
1. Introduction
Carbon dioxide, CO2, is the major component gas of theatmosphere of Venus and it is known to be an important, if
All rights reserved.
not dominant, component of many other planetary atmo-spheres (e.g., Mars), and although it is a minor constituentof Earth's atmosphere it is highly significant. Indeed, forEarth's atmosphere it is established that CO2 is the secondmost important greenhouse gas and the main driver ofclimate change via global warming. The atmosphere ofVenus is extremely thick (e.g., surface pressure of 90 bar)and it has a significant temperature gradient from thestratosphere down through the troposphere to the plane-tary surface [1]. Venus has exhibited a run-away globalwarming, partly as a result of the significant concentrationof CO2 [2]. Thus, with the various planetary environments

X. Huang et al. / Journal of Quantitative Spectroscopy & Radiative Transfer 130 (2013) 134–146 135
in which CO2 is observed, it is important to have accuraterovibrational spectroscopic line lists at various tempera-tures. Moreover, as the space science community moves tothe spectroscopic characterization of exoplanets, the tem-perature range for which accurate rovibrational spectro-scopic line lists of CO2 is needed will most likely expand.
Recently we reported an empirically refined potentialenergy surface (PES), denoted Ames-1, and an initialinfrared (IR) line list for 12C16O2, denoted Ames-296 K [3].In this paper it is denoted Ames-296 K(0Z) where the ‘0Z’ isthe internal version for the dipole moment surface (DMS)used in that work. The root-mean-square deviation (sRMS)for 6873 experimentally determined rovibrational energylevels (J¼0–117) is 0.0156 cm−1. The deviation for transitionfrequencies is usually less than 0.05–0.10 cm−1. With apurely ab initio DMS, denoted DMS-0Z, the agreementbetween experiment and theory for the intensities is betterthan 80% for more than 80% of measured bands (231 bandsin total). However, the published Ames-296 K(0Z) line list didnot have appropriate vibrational quantum numbers forcertain linear bend vibrations, and discrepancies were foundat 1.18 μm between HITRAN2008 [4] and Ames-296 K(0Z) forIR intensities based on IR simulations. The DMS-0Z was builtupon the same geometry grid used for the original purely abinitio PES construction. However, the DMS will not necessa-rily have the same shape as the PES, and in fact is likely notto have the same shape. This means that there will begeometrical regions where the DMS is changing rapidlywhile the PES does not. Hence, geometrical requirementsfor data points differ between the PES and the DMS, and maydiffer significantly. In order to provide the most reliable IRintensities, it is necessary to investigate the discrepanciesand reduce the errors in higher order dipole derivatives. Itwill be quite valuable also to provide an IR line list that willbe reliable for temperatures as high as 1000 K (or higher),and reliable IR intensities for rovibrational bands up to20,000 cm−1.
This paper reports our latest and the most reliable linelists computed at 296 K and 1000 K for 12C16O2 using theAmes-1 PES and a new DMS. The updated CCSD(T)/aug-cc-pVQZ DMS is still purely ab initio, and spans the whole 0–30,000 cm−1 range. With tightly converged J¼0–150 levels(E¼0–30,000 cm−1), the new Ames-296 K and Ames-1000 Kline lists are expected to facilitate future experimental IRassignments, as well as Venus atmospheric data analysis andmodels. It should be noted that these latest line lists includereasonable quantum numbers for the linear bending mode.Additionally, after finalizing our improved DMS and IRintensities, the 1.18 μmdiscrepancies remained, and we show
Table 112C16O2 partition sum at selected temperatures (this work), compare to CDSD-
296 K 300 K
J¼0–125a 286.0964J¼0–150b 286.0937 291.0403J¼0–200 286.0938 291.0404CDSD-4000b 291.045
a Old Ames-296 K line list was computed with different parameters and allPES coverage), consequently its partition function at 296 K is slightly larger th
b Used for latest Ames-296 K and Ames-1000 K line lists.
by comparison to new experiments that our IR intensities areindeed very reliable.
Section 2 briefly describes several new technical detailsincorporated in this work, including how the new DMS isconstructed and selected. Section 3 compares to the newexperiments in the 0.9–1.1 μm region which providesevidence for the reliability of the IR intensities containedin our new Ames line lists. In Sections 4 and 5, thereliability limits of the new Ames-296 K and Ames-1000 K line lists are investigated up to 3000 K, andcompared to the available databases and recent high-temperature experiments up to 1773 K.
2. Technical details
2.1. Rovibrational calculations (J¼0–150)
Details of the Ames-1 PES refinement and accuracywere given in Ref. [3], hence are not repeated here.Rovibrational and intensity calculations using the Ames-1PES and various dipole surfaces were performed with theVTET program [5]. The maximum bending quantum usedin the llk coupling scheme is 240. The one-dimensionstretching basis was cut off at 0.3 Hartree, i.e. 65,842 cm−1.All bending functions with energies below 0.36 Hartree(79,011 cm−1) are kept at each K. Coupled bending+stretching functions with a sum of energies below0.25 Hartree (54,868 cm−1) are utilized to solve Hamilto-nian matrices and to extract all eigenvalues with energieslower than 0.15 Hartree (32,921 cm−1), i.e. �30,000 cm−1
above the zero-point energy (2535.9171 cm−1). Otherparameters in the rovibrational and intensity calculationsare the same as reported in Ref. [3].
The published Ames-296 K(0Z) line list included J¼0–125levels and transitions. Now we extend it to J¼0–150. Table 1presents three sets of partition sums at 296 K, 300 K, 1000 K,2000 K, and 3000 K, and compares these to the CDSD-4000values [6]. At 1000 K, J¼0–150 is probably sufficient, whilehigher J's are required for ever higher temperatures. There-fore, we have computed the Ames-1000 K line list with a 1E−36 cmmolecule−1 cutoff. The new Ames-296 K line list iscut off at 1E−42 cmmolecule−1.
2.2. New dipole surfaces: DMS-N1/2/3
For DMS fits, the first step is to locate the most cost-effective fitting basis with respect to fitting RMS. Thepublished DMS-0Z fit the pseudo/effective charge on O
4000 (taken from Ref. [6]).
1000 K 2000 K 3000 K
2838.151 107,470.22838.472 24,578.59 113,009.02838.480 24,621.27 114,593.12838.58 24,622.7 114,762
the energy levels were slightly less converged (with respect to the effectivean the value reported in this work.

X. Huang et al. / Journal of Quantitative Spectroscopy & Radiative Transfer 130 (2013) 134–146136
atoms to 228 coefficients with a fitting sRMS¼1.1E−5 a.u.for those geometries below 40,000 cm−1.
In this work, MP2/aug-cc-pVTZ calculations were firstrun on a 3-dimensional grid expanded around Re¼1.160478 Å, ∠OCO¼1801 with step lengths 0.01 Å (for r1and r2) and 11. The dipole calculations successfully finishedon 13,302 geometries, in which potential energies arebelow 60,000 cm−1 on the Ames-1 PES. Then we chosethe 1st, 2nd, and 5th points in every group of 10 geome-tries to run CCSD(T)/aug-cc-pVQZ dipole calculations(finite field strength 0.0001) using MOLPRO2008 [7].We end up with 3893 (2531) dipole vectors with corre-sponding energies on Ames-1 PESo60,000 (30,000) cm−1.The weighting function is modified to focus on the regionbelow 30,000 cm−1, instead of the 40,000 cm−1 used in theDMS-0Z and Ames-1 PES fits:
s¼ ½ tan hð−0:00035−4ðE−30;000ÞÞþ1:002002002�=2:002002002weight¼ s=maxðE;30;000Þ
Three dipole fits are presented here to demonstrate theeffects of geometry set, energy cutoffs, and fitting basis.They are denoted DMS-N1, DMS-N2, and DMS-N3, andthey are least-squares fit from 60 K/30 K/30 K cm−1 datasets using full 16th/16th/20th-order polynomials (with969/969/1783 coefficients), respectively. The 1783 coeffi-cient set includes 12 extra terms for the 21st–24th mono-mials of Δr1, Δr1 and Δα. Below 30,000 cm−1, the averagedeviation and sRMS for the 5062 non-zero CCSD(T)/aug-cc-pVQZ dipole components on DMS-N1/2/3 are 1.7E−5/3.2E−6/ 1.8E−6 a.u. and 3.6E−5/8.0E−6/2.9E−6 a.u., respec-tively. Note that the purpose of the DMS tests is an attemptto minimize the least squares fitting errors. We selected30,000 cm−1 instead of 40,000 cm−1 solely to verify andimprove the DMS fitting accuracy because we need toconfirm that the 1.18 μm discrepancy was not caused byDMS fitting problems.
The rovibrational wavefunctions used in the previousAmes-296 K line list computations are utilized again togenerate three new line lists for DMS-N1/2/3. Note thatnew rovibrational variational Configuration Interaction(CI) calculations were not performed in this step. Thesenew line lists are for testing purposes only, and are not thefinal Ames-296 K IR line list discussed later.
Table 2Statistics of intensity accuracy of DMS-N1/2/3 and old DMS-0Z based Ames-296of modeling and the measurement uncertainty (both in %), respectively. The tot
Nbands
srms (ΔI)a (%) DMS-0Z DMS-N1 DMS-N2 DMS-N3
o1 5 5 5 5o3 35 40 41 38o5 78 94 98 95
o10 136 162 164 162o20 194 208 209 208o40 219 227 227 226
o100 227 229 229 229o250 231 231 231 231
a ΔI¼(SAmes/SExpt−SExpt/SAmes)�50%.
The line list intensities are compared to the sameexperimental intensity dataset used before in Ref. [3].Interested readers please see the references given thereand its supplementary file for more details. Intensityaccuracy statistics are summarized in Table 2. Comparedto DMS-0Z, notable improvements are found for all threenew dipole fits. The differences between DMS-N1/N3 andDMS-N2 are small, but DMS-N2 consistently gives thebetter agreement. The only exception is that DMS-N3 hasone more band with ΔI/δobso2. It is interesting to notethat DMS-N3 performs relative to DMS-N2, when DMS-N3sRMS is less than 50% of DMS-N2. This may indicate acertain degree of over-refinement. Hence, we are moreinclined to choose DMS-N2, but more comparisons need tobe done before determining the best DMS, especially inhigher energy region.
Fig. 1(a) shows how band intensity agreement varieswith respect to the transition frequency. For each band, thelowest measured wavenumber is used in the plot. Thebiggest improvement occurs for 51104-00001, where sRMS
is reduced from 44.3% (on DMS-0Z) to 9.1% (DMS-N1) and8.9% (DMS-N2). Three more bands exhibit 10–20% reduc-tions in sRMS: 32211/21122/51102-00001. All the majorimprovements (or changes) occur in the range of 6000–8000 cm−1. It should be noted that the sRMS of the 51104-00001 band was already dramatically improved from224.4% in the first published line list to 44.3% for DMS-0Z, which obviously is due to the much higher fittingaccuracy. The sRMS variations shown in this plot explicitlydemonstrate the uncertainties and convergence of ourcomputer IR intensities with respect to the DMSs.
Fig. 1(b) compares the four Ames-296 K line lists(Gaussian convolution with 1s¼5 cm−1, i.e. the full widthat half magnitude (FWHM)¼8.3 cm−1) for 0–8000 cm−1.No significant differences can be found for bands strongerthan 1E−28 cmmolecule−1, and all four Ames DMS-basedline lists are very similar for bands stronger than 1E−31 cm molecule−1. It is important to note that the notableimprovements in the 6000–8000 cm−1 range, as shown inFig. 1(a), do not cause observable changes in the convo-luted spectra.
Fig. 1(c) shows the real differences for 8000–15,000 cm−1
among the four IR line lists (so the four DMSs). No obviousdifferences among our four line lists are found below9700 cm−1, similar to what is observed in Fig. 1(b). However,
K line lists, compare to measured intensity data. srms and δobs are the rmsal number of the measured bands is 231.
Nbands
srms (ΔI/δobs) DMS-0Z DMS-N1 DMS-N2 DMS-N3
o1 57 64 64 61o2 127 154 159 160o3 169 188 190 189o5 197 209 209 208
o10 221 228 228 227o20 228 230 230 230o40 230 231 231 231o60 231

Fig. 1. DMS-0Z and new DMS-N1/2/3 based 296 K IR line lists, compared with HITRAN: (a) band IR intensity accuracy improvements and differences;(b) smoothed spectra (FWHM¼8.3 cm−1) in 0–8000 cm−1 and (c) smoothed spectra (FWHM¼8.3 cm−1) in 8000–15,000 cm−1.
X. Huang et al. / Journal of Quantitative Spectroscopy & Radiative Transfer 130 (2013) 134–146 137
all our line lists are consistently higher than HITRAN in the8300–9200 cm−1 range by almost two orders of magnitude.This indicates the discrepancy is not caused by fitting errorsin the previously published DMS-0Z. See the next section forfurther discussion.
For other HITRAN absorption features in the 9200–13,000 cm−1 range, which are relatively stronger, all fourline lists show similar agreement. The main differencesoccur for weaker bands at higher energies. From9700 cm−1 and higher, the old DMS-0Z spectrum is alwaysthe strongest. For the 9700–9900 cm−1 and 11,000–11,200 cm−1 ranges, it is much stronger than the otherDMS-Nx spectra, which agree well with each other. Inter-estingly, DMS-N3 appears very similar to DMS-0Z from11,600 cm−1 and higher. An exception is at 12,300 cm−1
where DMS-0Z is still the strongest but DMS-N3 is higherthan DMS-N1 and DMS-N2. For the entire range of0–15,000 cm−1, DMS-N1 and DMS-N2 are always theclosest to each other. Compared to DMS-N1, the DMS-N2spectrum gives lower intensities and the sharper bandshapes at higher energies. This suggests that the noisecontained in the DMS-N2 dipoles at higher energies is theleast. We attribute the noise in DMS-N3 to the possibleover refinement and oscillations within the boundaries ofdipole data sets resulting from the high-order exponentialpolynomial basis, although the fitted deviations and sRMS
are the smallest for DMS-N3.Based on the comparisons shown in Fig. 1, we conclude
that DMS-N2 is the most reliable DMS and it has been usedin the latest IR intensity calculations. We note that the newDMS-N2 can be further improved in various ways, as isalways the case, but it serves an important step going up tohigher temperatures and higher energies. New rovibra-tional and intensity calculations are carried out with VTETinput parameters specified in Section2.1 to generate thenecessary J¼0–150 wavefunctions and transition dipolematrix elements using the Ames-1 PES and DMS-N2. Fromnow on, in this study all new Ames line list intensities arebased on DMS-N2 so we do not put Ni after the line listnames. Details of the updated Ames-296 K and new Ames-1000 K line lists are discussed in following sections.
2.3. Linear bending quantum number
To assign the linear molecule bending quantum num-bers, we modified the procedure described by Partridgeand Schwenke [5] as follows. When computing the
contracted rotation-bending functions, we first diagonalizewith fixed K, where K is the projection of the total angularmomentum quantum number on the body fixed axis,which in the present case is taken along one of the Radauvectors. These contracted functions are labeled by i, theroot number, and K. We then couple the different i, Kfunctions to get final contracted rotation-bending func-tions. The linear bending quantum numbers assigned to aparticular contracted function are 2(ix−1)+Kx, and Kx,where ix and Kx are the labels of the dominant functionin the basis. Quantum numbers for both anti-symmetricand symmetric stretches are still as same as before.
It should be noted that our quantum numbers may ormay not be directly associated with the conventional bandnames adopted by the HITRAN community. The rotation-bending bases are highly mixed for most rovibrationallevels we computed. Therefore, it is not unusual for ourband assignment to be different relative to others for somespecific J's.
3. The 5001r-00001 (r¼3, 4), 2003r-00001 (r¼1, 2, 3) and2113r-01101 (r¼1, 2) bands: comparison of measurementswith existing databases
In the current updated version of Carbon DioxideSpectroscopy Database (CDSD) [8], the spectral line para-meters for the 5001r-00001 (r¼3, 4) bands (1.18 μmregion) are absent. The reason is that the effective dipolemoment parameters used for the generation of CDSD werefitted to the observed line intensities which were unavail-able before. CDSD line positions and intensities of the2003r-00001 (r¼1, 2, 3) and 2113r-01101 (r¼1, 2) bands(1.10 μm region) are based on the measurementsperformed in Ref. [9]. However, the uncertainties of thosemeasurements are rather large (about 15%) becauseof small signal-to-noise (S/N) ratio in the respectiveexperiment.
In the current version of HITRAN, intensities for the5001r-00001 (r¼3, 4) bands were taken from a previousversion of CDSD. They are two orders of magnitude lowerthan the measured values reported in a recent work [10]and should be considered as erroneous. HITRAN linepositions and intensities of the 2003r-00001 (r¼1, 2, 3)cold bands is a mixture of data from CDSD for high J valuesand calculated DND data [11] for low J values. Another750 K line list from Wattson [12] was designed to studyVenus’ atmosphere. It is based on the DND approach [11].

X. Huang et al. / Journal of Quantitative Spectroscopy & Radiative Transfer 130 (2013) 134–146138
Currently both Wattson 750 K (also called “High-T” or“HOT-CO2”) and CDSD are used to study the night sidewindows of Venus [13].
The discrepancy found between HITRAN2008 and theold Ames-296 K(0Z) at 1.18 μm is mainly due to the 5001r-00001 (r¼3, 4) bands. Fig. 2 compares the measured linepositions and intensities to our new Ames-296 K (DMS-N2based) and Wattson 750 K line lists. We choose regularscale instead of log scale for the intensities to demonstratethe differences between various data. As was discussedearlier, the 5001r-00001 (r¼3, 4) bands were removedfrom CDSD-296. Corresponding HITRAN data is excludedbecause its intensities are too low by about two orders ofmagnitude. Now we see the discrepancy is completelyresolved. The Ames-296 intensities of the 5001r-00001(r¼3, 4) bands are in excellent agreement with measure-ments. A typical residual is less than 10%. In addition,Ames-296 K fills several additional lines in the gaps ofbranches. The Wattson 750 K line intensities have accep-table agreement for 50014-00001 transitions (left side),while its 50013-00001 intensities are 20–40% higher thanexperimental values.
Line position residuals over the full range of the newexperiments [10] are summarized as follows: CDSD-296residuals are within 70.02 cm−1 for all bands. Ames-296line positions for the 5001r-00001, (r¼3, 4) bands aredisplaced by −0.05 cm−1 with a rather narrow spread. Theline positions for the 2003r-00001 (r¼1, 2, 3), andassociated hot bands are within the −0.02–0.05 cm−1
interval. On the other hand, Wattson 750 K residuals aremuch larger. They cover the −0.2–1.0 cm−1 interval. Finally,the HITRAN residuals are similar to the CDSD-296 values.
Fig. 2. Measured 5001r-00001 (r¼3, 4) line positions and intensities,compare to Ames-296 K line list and Wattson 750 K (also called High-T orHOT-CO2) line list.
Fig. 3. Intensity comparison: available databases vs. experimental data measurelines with intensities less than 1E−26 cm molecule−1 belong to corresponding 2
This is expected since HITRAN data are mostly taken fromCDSD and there is only a small fraction of low J data takenfrom the DND calculations.
A comparison of measured line intensities with avail-able databases is given in Fig. 3. CDSD-296 intensities ofthe 2003r-00001 (r¼1, 2, 3) and associated hot bands liefrom −40% to 20%. A systematic offset by −10% is evidentfor all three bands. The Ames-296 K calculated intensitiesof the 2003r-00001 (r¼1, 2, 3) and associated hot bandsare systematically displaced with respect to measurementsby �30%. The Wattson 750 K calculations exhibit theopposite tendency. The 2003r-00001 (r¼1, 2, 3) andassociated hot bands are in better agreement with mea-surements than the 5001r-00001 (r¼3, 4) bands. Finally,HITRAN intensities of the 5001r-00001 (r¼3, 4) are wrong(see an earlier discussion) whereas the residuals of the2003r-00001 (r¼1, 2, 3) bands are close to those ofWattson 750 K. It is obvious that there is not a singledatabase which provides better agreement with measuredintensities for all bands.
It should be noted that we have carried out line-by-linecomparisons between this latest Ames-296 K line list,HITRAN, and experimentally measured data (line positionsand intensities) for the 0–14,000 cm−1 range. This willhelp to identify the most reliable experimental data thatcan be used to further refine our CO2 PES and the Ames-296 line list, so that it may provide even better agreementand predictions. Finally this will lead to a new Ames-2 PESand a more accurate Ames-296 K line list. The details ofcomparisons are beyond the scope of this paper, but willbe presented along with the further refinement in duecourse.
4. IR simulations at 750 K and above
After verifying the Ames-296 K intensity predictions atroom temperature, we continue to estimate the reliabilityof both Ames-296 K and Ames-1000 K intensities extra-polated to temperatures close to those present in theVenus atmosphere or even higher. It should be noted thatour main concern includes both filling up the gaps inexisting databases, and exploring not yet experimentallystudied zone beyond 13,000 cm−1, which is the upperthreshold wavenumber of available line sets. In this sectionwe compare various line sets at different temperatures,trying to determine the most applicable region for eachindividual line set. In the next section we will compare to
d in Ref. [10]: (a) 20033-00001; (b) 20032-00001; (c) 20031-00001, the113r-01101 (r¼1, 2).

X. Huang et al. / Journal of Quantitative Spectroscopy & Radiative Transfer 130 (2013) 134–146 139
experimental spectra directly measured at T4750 K, butat the lower energy end, i.e. o6000 cm−1.
In order to compare the different available data sets ofCO2, simulations of the absorption coefficient were doneunder a variety of conditions. The line profile used was thestandard Voigt profile with a set of line widths for CO2
supplied by HITRAN [4] and Gamache [14,15]. The linewidths due to foreign (air) broadening were used in allcases as the objective of these tests was simply to compareone data set to another. The line shape was not modified inany way to take account of the known sub-Lorenztianbehavior of the line wings of CO2. As our only goal here is adirect comparison with older data we did not consider thedetailed shape of the line wings. All line wings wereextended to 25 cm−1 in the calculations. The partitionfunctions were taken from the HITRAN TIPS_2011 compi-lation [16]. Since we have used the same partition functionfor all the calculations and we were interested only in acomparison, this will not affect the following comparisonplots. Furthermore, at 300 K, 1000 K, 2000 K and 3000 K,the deviation of partition function values are 0.29%, 0.23%,1.24%, and 2.39%. Such small differences will not cause anyobservable differences in the transmittance plot scales.
The older data sets consisted of Wattson 750 K and theHITEMP2010 list. The Wattson 750 K set from RichardWattson [17] was produced using the DND method [11].This set has lines up to �10,000 cm−1 and has been usedin the past to model observations from Venus. Up untilquite recently this was considered by many to be the bestdata set for use in analyzing observations of Venus. Thereare many references in astronomy that use this list, e.g.Pollack et al. [12] and Bézard et al. [13] used it to study thenight side windows on Venus. The HITEMP2010 set isavailable from the HITRAN website.
Our Ames-296 K set with a line strength cutoff of 1.E−42 cmmolecule−1 and Ames-1000 K set with a cutoff of 1.E−36 cmmolecule−1 are compared with other available linesets at various temperatures. The opacity was computed fromthese sets and from filtered Ames sets in which the upperenergy levels were restricted to values o24,000 cm−1 ando22,000 cm−1 respectively, denoted as Ames-1000 K(E_upo24 K cm−1) and Ames-1000 K(E_up o22 K cm−1) The filtercutoffs are selected to investigate the absorption contributionsoriginated from those transitions with higher E_up, as well asto examine and reduce the non-physical behavior of unfilteredline set appearing at the higher wavenumbers and tempera-tures, e.g. 2000–3000 K. See below for details.
The plots in Fig. 4 show the absorption cross sectionscomputed with each line set in 0–13,000 cm−1 at 300 K,750 K, 1000 K, 1500 K, 2000 K, and 3000 K. Ames-296 K 1E−42 (in a) and HITEMP2010 (in e) have similar spectracurvatures, but both lack opacities for T41500 K and theirspectra vary little from 2000 K to 3000 K. The Wattson750 K absorptions (in f) have noticeable increases forT41500 K, but most are below 4500 cm−1. It also hasthe largest absorptions in the three windows at 1400 cm−1,2800 cm−1 and 4000 cm−1, especially at higher tempera-tures. This behavior of the Wattson 750 K simulationsabove 1500 K is considered an erroneous one [18–20].For applications to all types of remote sensing both on theearth and in objects such as brown dwarfs and extra solar
planets the behavior in the window regions can have animportant effect on the modeling as this will be wheremost of the observable flux escapes.
The unfiltered Ames-1000 K (in b) absorption demon-strates significant increases at high T's, but it starts losingfeatures at 1500 K and becomes flat out at 2000 K and 3000 K.By including Ames-1000 K(E_up o24 K cm−1) (in c) andAmes-1000 K(E_up o22 K cm−1) (in d), we can partiallyrecover the features. The lower cutoff (22,000 cm−1) clearlyleads to less intensity increases when T rises.
Based on Fig. 4, we suggest 1500 K to be the highesttemperature where Ames-296 K 1E−42 and HITEMP2010line lists can give reliable opacities for the spectral rangeshown. The Wattson 750 K line list works well forTo1000 K, but fails for T41000–1500 K, as was pointedout in [18–20]. The Ames-1000 K line lists are safe at1000 K for the range shown, but using at higher T wouldbe at user's own discretion. It should be noted that our1500 K (upper limit for Ames-296 K) and 1000 K (lowerbound for Ames-1000 K) claims are based on visualinspection of plots, and only valid for the 0–13,000 cm−1
range. Ames-296 K may have some important hot bandfeatures missing starting from To1500 K, while the Ames-1000 K list accuracy may depend on the wavenumberrange at T41000 K. Higher temperature experimentaldata are needed to determine the most reliable 1000 Kline list.
Beyond 13,000 cm−1, the Ames-296 K and Ames-1000 K line lists are the only line sets available to compare.Fig. 5 shows their high temperature absorptions in the13,000–30,000 cm−1 range. Again, we see in plot (a) thatthe Ames-296 K cross sections at 2000 K and 3000 K arelower than those at 1500 K and 2000 K. This probablyresults from the missing opacities which are weaker thanthe 1E−42 cutoff at 296 K. On the other hand, the unfil-tered Ames-1000 K line list (in b) has the 3000 K crosssections as the largest for all T in the 13000–24,000 cm−1
range. From 24,000 cm−1 to 30,000 cm−1, the intensityorder becomes reversed.
Two groups of grass-like spikes appear at 23,500 and25,000 cm−1 in plots (a) (Ames-296 K) and (b) (unfilteredAmes-1000 K). Note that the spikes only exist at T¼1500 Kand above, i.e. not for T¼300–1000 K. This suggests thatwe might have incorrectly computed the intensities of acouple of bands by at least two orders of magnitude. Thosebands are very weak below 1000 K but quickly becomesignificant when temperature rises. This noise or contam-ination may be the consequence of less-well convergedrovibrational wavefunctions or accessing less reliableregions of the DMS at high energies. Therefore, we con-clude that the absorptions beyond 23,000 cm−1 are unreli-able when T41000 K.
As shown by Figs. 4(b) and 5(b), the total opacity for thehigher temperatures increases and tends to flatten out,again partially due to “noise” in the calculations. This“noise” may result from the Ames-1 PES imperfectionsand residual contamination in the computed rovibra-tional wavefunctions, which accumulate to noticeablelevels at higher energies. No experimental information420,000 cm−1 has been included in the Ames-1 empiricalrefinement [3], which suggests its accuracy will slowly
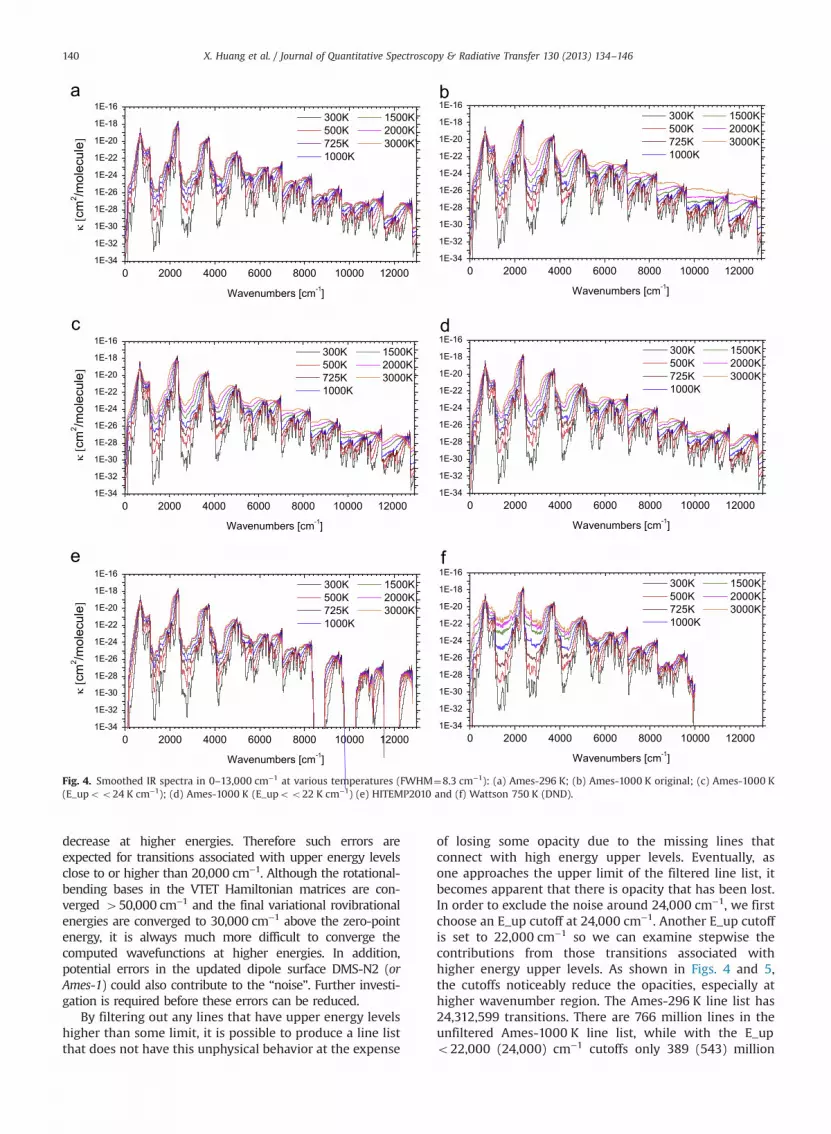
Fig. 4. Smoothed IR spectra in 0–13,000 cm−1 at various temperatures (FWHM¼8.3 cm−1): (a) Ames-296 K; (b) Ames-1000 K original; (c) Ames-1000 K(E_upoo24 K cm−1); (d) Ames-1000 K (E_upoo22 K cm−1) (e) HITEMP2010 and (f) Wattson 750 K (DND).
X. Huang et al. / Journal of Quantitative Spectroscopy & Radiative Transfer 130 (2013) 134–146140
decrease at higher energies. Therefore such errors areexpected for transitions associated with upper energy levelsclose to or higher than 20,000 cm−1. Although the rotational-bending bases in the VTET Hamiltonian matrices are con-verged 450,000 cm−1 and the final variational rovibrationalenergies are converged to 30,000 cm−1 above the zero-pointenergy, it is always much more difficult to converge thecomputed wavefunctions at higher energies. In addition,potential errors in the updated dipole surface DMS-N2 (orAmes-1) could also contribute to the “noise”. Further investi-gation is required before these errors can be reduced.
By filtering out any lines that have upper energy levelshigher than some limit, it is possible to produce a line listthat does not have this unphysical behavior at the expense
of losing some opacity due to the missing lines thatconnect with high energy upper levels. Eventually, asone approaches the upper limit of the filtered line list, itbecomes apparent that there is opacity that has been lost.In order to exclude the noise around 24,000 cm−1, we firstchoose an E_up cutoff at 24,000 cm−1. Another E_up cutoffis set to 22,000 cm−1 so we can examine stepwise thecontributions from those transitions associated withhigher energy upper levels. As shown in Figs. 4 and 5,the cutoffs noticeably reduce the opacities, especially athigher wavenumber region. The Ames-296 K line list has24,312,599 transitions. There are 766 million lines in theunfiltered Ames-1000 K line list, while with the E_upo22,000 (24,000) cm−1 cutoffs only 389 (543) million

Fig. 5. Smoothed IR spectra in 13,000–24,000 cm−1 at various temperatures (FWHM¼8.3 cm−1): (a) Ames-296 K; (b) Ames-1000 K unfiltered; (c) Ames-1000 K, Eupo24,000 cm−1 and (d) Ames-1000 K, Eupo22,000 cm−1.
X. Huang et al. / Journal of Quantitative Spectroscopy & Radiative Transfer 130 (2013) 134–146 141
lines are included and 377 (223) million lines are rejected.This dramatic rise in the number of included lines as E_upis increased, may indicate either that the opacity asso-ciated with higher energies increases rapidly, or thecontamination increases in the PES or the DMS or both.The distribution of the number of rejected lines is asmooth function of J.
In addition, we have examined how the accumulatedintensity contributions (from each cm−1) in the 13,000–18,000 cm−1 and 18,000–24,000 cm−1 spectral ranges varywith respect to lower or upper level energies. Similarnoise is found at E_up �25,000 cm−1 and higherenergies. Therefore, the Ames-1000 K(E_upo24 K cm−1)is expected to represent the best balance between noiseand hot-band features.
Now we are ready to make line set comparisons atseparate temperatures. Fig. 6 explicitly demonstrates howthe agreement between several line lists deteriorates andhow the differences evolve along with rising T. Generally,the sets all agree well at the band centers but there can besubstantial disagreement on opacity in the windowregions. At higher wavenumbers as the Wattson andHITEMP list approach their upper limit[s] there can bemore disagreement due to gaps in these line lists andbecause both of these lists do not include vibrationalenergy levels that extend as high as the Ames lists.
At 300 K, all six line lists look similar. At 725 K, smalldifferences appear in the 1000–6000 cm−1 range.At 1000 K, the Wattson line list has those extra opacitiesin windows, while the overall agreement between Ames
line lists and HITEMP is fair. Up to 1500 K, the maindifference between HITEMP and Ames spectra is in the4000 cm−1 window. At 2000 K and 3000 K, the differencebetween Ames-1000 K and Ames-296 K becomes moreapparent, as well as the discrepancies between Ames andHITEMP. However, the 24,000 cm−1 and 22,000 cm−1 cut-offs do not have much impact on the absorption patterns.We believe part of the differences between Ames-1000 Kand Ames-296 K are real, i.e. many transitions weaker than1E−42 cm molecule−1 at 296 K contribute to the absorp-tions in windows at high T's.
The Ames-based absorption cross sections computed inthe 13,000–24,000 cm−1 range are compared in Fig. 7. From300 K to 1000 K, we see no significant differences amongthe lists except a little opacity is lost due to the cutoffs.The difference between the unfiltered Ames-1000 K andAmes-296 K is small below 19,000 cm−1. From 1500 K to3000 K, the disagreeing point between the unfiltered Ames-1000 K and Ames-296 K opacities is reduced from18,000 cm−1 to o14,000 cm−1 and 8000–10,000 cm−1 (seeFig. 6). It is also interesting to see the Ames-1000 K(E_upo24 K cm−1) agree well with the Ames-296 K up to19,000 cm−1, at T¼3000 K. This agreement at 3000 K indi-cates the internal consistency between Ames-296 K andAmes-1000 K(E_upo24 K cm−1). In other words, the noisein both line lists is not significant. Using Ames-296 K andAmes-1000 K(E_upo24 K cm−1) as reference spectra, we canroughly estimate the reliability of unfiltered Ames-1000 K andAmes-1000 K(E_upo22 K cm−1). It is concluded that even at1000 K all four Ames line lists are probably still reliable up to

Fig. 6. Smoothed IR spectra in 0–13,000 cm−1 using various line sets at 300 K, 725 K, 1000 K, 1500 K, 2000 K, and 3000 K (FWHM¼8.3 cm−1).
X. Huang et al. / Journal of Quantitative Spectroscopy & Radiative Transfer 130 (2013) 134–146142
18,000 cm−1 (or slightly higher). When T goes beyond 1000 K,the highest applicable wavenumber range will be reduced.
In order to get a more reliable 3000 K line list, J4150calculations are required along with additional energylevels converged beyond 30,000 cm−1 (the built in cutoffof both Ames-296 K and unfiltered Ames-1000 K line lists).As shown in Table 1, our partition sum is off by 0.2% at2000 K, but 1.5% is missing at 3000 K. The partition sumused by CDSD-4000 is based on J¼0–300, though weexpect J¼200–250 should work for a future Ames-2000 Kline list.
5. Comparison to recent experiments in the 1000–1773 Krange
In 2007, Bharadwaj and Modest [21] reported the firstmedium resolution IR measurement up to 1550 K. In 2012,Evseev et al. [20] present the best available high-resolution
transmission measurements up to 1773 K. The Ref. [21]data has 4 cm−1 resolution at 1000 K and 1550 K, while thelatest Ref. [20] spectra have 0.125 cm−1 resolution and Twas extended to 1773 K. Here we choose 1000 K, 1550 Kand 1773 K to make comparisons. The Wattson 750 K list isexcluded due to the defects discussed above. The 3�3plots shown in Fig.8 use the Gaussian convoluted datawith Half-Width-at-Half-Magnitude (HWHM)¼4 cm−1, i.e.1s¼4.8 cm−1, L¼50 cm, P¼1 atm and 100% 12C16O2.
The first conclusion we can draw from these plots isthat Ames-296 K with 1E−42 cm molecule−1 cutoff is notsufficient at such high temperatures. Secondly, the Ames-1000 K line lists yield results very similar to HITEMP2010in several plots. The two E_up cutoffs we applied to thefiltered Ames-1000 K lists do not really have much notice-able impact in the spectral curve shown here. This sug-gests that the Ames-1000 K opacities shown in Fig. 8 couldbe real, and we use “Ames-1000 K” for both unfiltered andfiltered sets. However, it is interesting to note that the
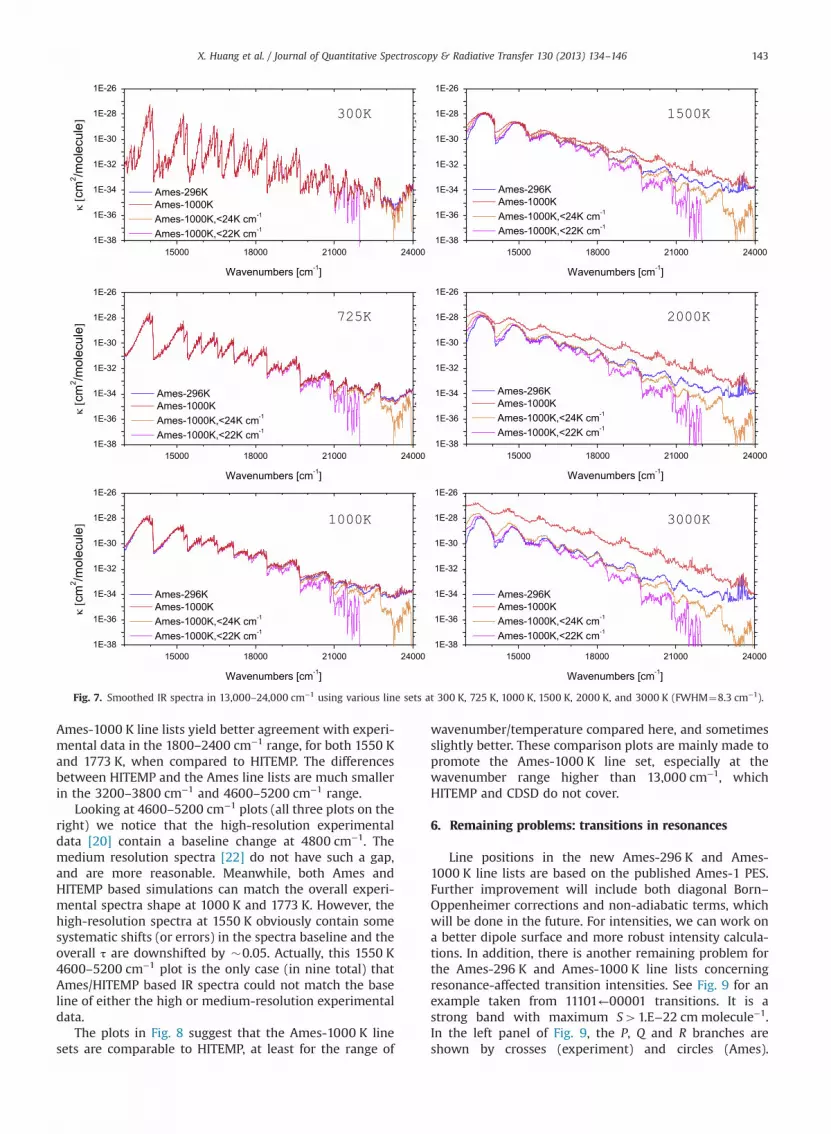
Fig. 7. Smoothed IR spectra in 13,000–24,000 cm−1 using various line sets at 300 K, 725 K, 1000 K, 1500 K, 2000 K, and 3000 K (FWHM¼8.3 cm−1).
X. Huang et al. / Journal of Quantitative Spectroscopy & Radiative Transfer 130 (2013) 134–146 143
Ames-1000 K line lists yield better agreement with experi-mental data in the 1800–2400 cm−1 range, for both 1550 Kand 1773 K, when compared to HITEMP. The differencesbetween HITEMP and the Ames line lists are much smallerin the 3200–3800 cm−1 and 4600–5200 cm−1 range.
Looking at 4600–5200 cm−1 plots (all three plots on theright) we notice that the high-resolution experimentaldata [20] contain a baseline change at 4800 cm−1. Themedium resolution spectra [22] do not have such a gap,and are more reasonable. Meanwhile, both Ames andHITEMP based simulations can match the overall experi-mental spectra shape at 1000 K and 1773 K. However, thehigh-resolution spectra at 1550 K obviously contain somesystematic shifts (or errors) in the spectra baseline and theoverall τ are downshifted by �0.05. Actually, this 1550 K4600–5200 cm−1 plot is the only case (in nine total) thatAmes/HITEMP based IR spectra could not match the baseline of either the high or medium-resolution experimentaldata.
The plots in Fig. 8 suggest that the Ames-1000 K linesets are comparable to HITEMP, at least for the range of
wavenumber/temperature compared here, and sometimesslightly better. These comparison plots are mainly made topromote the Ames-1000 K line set, especially at thewavenumber range higher than 13,000 cm−1, whichHITEMP and CDSD do not cover.
6. Remaining problems: transitions in resonances
Line positions in the new Ames-296 K and Ames-1000 K line lists are based on the published Ames-1 PES.Further improvement will include both diagonal Born–Oppenheimer corrections and non-adiabatic terms, whichwill be done in the future. For intensities, we can work ona better dipole surface and more robust intensity calcula-tions. In addition, there is another remaining problem forthe Ames-296 K and Ames-1000 K line lists concerningresonance-affected transition intensities. See Fig. 9 for anexample taken from 11101←00001 transitions. It is astrong band with maximum S41.E−22 cm molecule−1.In the left panel of Fig. 9, the P, Q and R branches areshown by crosses (experiment) and circles (Ames).

Fig. 8. Compare IR simulations to experimental data [21,22] at 1000 K, 1550 K and 1773 K, using HITEMP2010, Ames-296 K, unfiltered Ames-1000 K, andthe filtered Ames-1000 K with E_up less than 24,000 cm−1 and 22,000 cm−1. Top row spectra are taken at 1000 K, middle row spectra are taken 1550 K,while the bottom row plots are taken at 1773 K. We use “Expt 2012” for data taken from Ref. [21], and “Expt 2007” for data taken from Ref. [22].
Fig. 9. Example of troubled transition intensities in 11101←00001 band. (a) Computed intensities vs. experimental intensities and (b) line positiondeviations and relative intensity deviations.
X. Huang et al. / Journal of Quantitative Spectroscopy & Radiative Transfer 130 (2013) 134–146144
Agreement for the P and Q branch transitions are accep-table, but we have 440% deviation for the intensities of R(16), R(18), R(32) and R(34) lines in the 2090–2104 cm−1
range. Initially, these errors were thought to be caused byimpurities in the energy levels/transition frequencies androvibrational wavefunctions. However, Fig. 9 right panelindicates there is no correlation between the wavenumberdeviation and the intensity divergence.
The reason for this peculiar behavior of the R branchintensities is a J dependent Coriolis interaction with thevery strong (vibrational band strength is about 1E−16 cm molecule−1) fundamental band 00011-00001. Thisinteraction connects vibrational states ν1,ν2,l2,ν3 and ν1−1,ν2−1,l271,ν3+1. Calculations, based on the effective opera-tor approach [22–25], showed that line intensities of the11101-00001 band are extremely sensitive to the value of

X. Huang et al. / Journal of Quantitative Spectroscopy & Radiative Transfer 130 (2013) 134–146 145
the principal Coriolis interaction parameter Ce. A 1%variation of Ce leads to up to 200% change of lineintensities. The line positions of both interacting bands11101-00001 and 00011-00001 are also affected by a smallchange of Ce. The same 1% variation of Ce gives variation ofline positions reaching 0.02 cm−1. These findings mayexplain the behavior of position and intensity residualsplotted in Fig. 9. Accurate calculations of the intensities ofthe 00011-00001 and similar Coriolis interacting bandsrequire a very accurate modeling of this interaction. It ispretty clear that the resonance that causes the unusualstructure in the R branch is not treated adequately andthus this feature may prove to a very sensitive probe intothe dynamics of this system. Since our kinetic energyoperator is exact in the Born–Oppenheimer approxima-tion, the only possible influence we can have on theCoriolis interaction is the inclusion of non-adiabaticeffects. This will be the subject of future work.
Another unsolved mystery is the J-jump found inrovibrational levels computed on Ames-1 PES [3]. Thesegmented wavenumber deviations in Fig. 9 right panel arethe consequence of those J jumps. The deviations Δ(EAmes-1
−EExpt/HITRAN) vary smoothly along with J but a gap occursat J¼41 (if the ν2+ν3 quanta sum is odd) or J¼64 (if theν2+ν3 quanta sum is even). We do not yet understand thesource of these J-jumps, or the specific J's where theyoccur. However, we believe that it might be related to thesimilar ν2+ν3 quanta sum dependence which occurs in thee/f parities. For the ν240 bands of 12C16O2, if the ν2+ν3quanta sum is even, only the e levels exist for even J's andthe f levels exist for odd J's; if the ν2+ν3 quanta sum is odd,only the f levels exist for even J's and the e levels exist forodd J's. This is purely a result of nuclei spin statisticalweights. One possible explanation for the two J's is that theexperimentally determined rovibrational levels includedin the Ames-1 PES refinements were not well balancedbetween even and odd ν2+ν3 quanta sums, or betweeneven J's and odd J's. Neglected non-adiabatic effects couldcontribute to the problem, too. One additional findingconcerning the J-jumps is that the specific jump-occurring J's are isotopologue dependent. We are comput-ing similar Ames-296 K/1000 K IR line lists for the 2ndmost abundant isotopologue, 13C16O2. Some J-jumps arefound at J¼36 and J¼44.
Further investigation is needed to resolve both theintensity divergence and the J-jump issues.
7. Conclusions
New IR line lists are reported for 12C16O2 at 296 K witha 1.E−42 cm molecule−1 cutoff and at 1000 K with a 1.E−36 cm molecule−1 cutoff. A significantly improved CCSD(T)/aug-cc-pVQZ dipole moment surface, denoted DMS-N2, has led to much more reliable and more stableintensities in both the 1.6 μm region and as high as30,000 cm−1 above the zero-point level. The previouslypublished Ames-1 PES is used to compute J¼0–150 linepositions. As revealed by recent measurements [10], theDMS-N2 based line list intensities provide the bestagreement relative to experiment for the 50013←00001and 50014←00001 transitions when compared to other
available databases. Agreement for other bands in the 0.9–1.1 μm region are similar or comparable to HITRAN2008and Wattson 750 K line lists.
The high temperature performance of the Ames-296 Kand Ames-1000 K line lists is investigated at T¼300 K,500 K, 725 K, 1000 K, 1500 K, 2000 K and 3000 K. Detailedplots and discussion are presented for each line set and ateach T. It is found that the reliable application transitionwavenumber range varies with respect to T. At 300 K, it isestimated to be valid up to 23,000 cm−1. At 1000 K, Ames-1000 K should perform well for spectra up to 20,000 cm−1.At 1500 K, the filtered Ames-1000 K (E_upo24 K cm−1) isexpected to be reliable up to approximately 18,000 cm−1.Larger and better converged rovibrational calculations andpossibly together with a more complete DMS would berequired to achieve a more reliable line list for the 2000–3000 K temperature range. Compared to recent experi-ments, the Ames-296 K line list is found to be insufficientat higher wavenumber end for T≥1000 K. However, theAmes-1000 K line list is at least as reliable as HITEMP fortemperatures up to 1773 K and wavenumber o6000 cm−1.
Due to the large file sizes, both the Ames-296 K and theAmes-1000 K line lists will be available upon request tothe authors. Later they will be accessible for downloadthrough NASA facilities.
Acknowledgment
DWS, TJL, and XH gratefully acknowledge financialsupport from the NASA Venus Express Supporting Inves-tigator Program. X. Huang acknowledges the NASA/SETICo-operative Agreement NNX09AI9A and NNX12AG96A.R.S. Freedman acknowledges the NASA/SETI Co-operativeAgreement NNX12AJ19A and NASA ROSES funding NN-H11ZDA001N11-OSS-0134 and NNH11ZDA001N11-PATM-11-0014. TJL and XH thank Dr. Jeff Hollingsworth forhelpful discussions. S.A. Tashkun thanks Dr. V.I. Perevalovfor useful discussions.
References
[1] Schubert G, Covey C, Del Genio A, Elson LS, Keating G, Seiff A, et al.Structure and circulation of the Venus atmosphere. J Geophys Res1980;85:8007–25.
[2] Tomasko MG, Smith PH, Suomi VE, Sromovsky LA, Revercomb HE,Taylor FW, et al. The thermal balance of Venus in light of thePioneer Venus mission. J Geophys Res 1980;85:8187–99.
[3] Huang X, Schwenke DW, Tashkun SA, Lee TJ. An isotopic-independent highly accurate potential energy surface for CO2 iso-topologues and an initial 12C16O2 infrared line list. J Chem Phys2012;136:124311.
[4] Rothman LS, Gordon IE, Barbe A, Chris Benner D, Bernath PF, Birk M.The HITRAN 2008 molecular spectroscopic database. J Quant Spec-trosc Radiat Transfer 2009;110:533–72.
[5] Partridge H, Schwenke DW. The determination of an accurateisotope dependent potential energy surface for water from extensiveab initio calculations and experimental data. J Chem Phys 1997;106:4618–39.
[6] Tashkun SA, Perevalov VI. CDSD-4000: high-resolution, high-temperature carbon dioxide spectroscopic databank. J Quant Spec-trosc Radiat Transfer 2011;112:1403–10.
[7] Werner H-J, Knowles PJ, Knizia G, Manby FR, Schütz M, Celani P,et al. MOLPRO, version 2008.1, a package of ab initio programs.⟨http://www.molpro.net⟩.

X. Huang et al. / Journal of Quantitative Spectroscopy & Radiative Transfer 130 (2013) 134–146146
[8] Perevalov VI, Tashkun SA. CDSD-296 (Carbon Dioxide Spectro-scopic Databank): updated and enlarged version for atmosphericapplications. In: Proceedings of the 10th HITRAN database confer-ence. Cambridge MA, USA; 2008. ⟨http://cdsd.iao.ru⟩ and ⟨ftp.iao.ru/pub/CDSD-2008/296⟩.
[9] Wang L, Perevalov VI, Tashkun SA, Liu AW, Hu SM. Absorptionspectra of 12C16O2 and 13C16O2 near 1.05 μm. J Mol Spectrosc2005;233:297–300.
[10] Petrova TM, Solodov AM, Solodov AA, Lyulin OM, Tashkun SA,Perevalov VI. Measurements of 12C16O2 line parameters in the8790–8860, 9340–9650 and 0–8860, 9340–9650 and 11,430–11,505 cm−1 wavenumber regions by means of Fourier transformspectroscopy. J Quant Spectrosc Radiat Transfer 2013;124:21–7.
[11] Wattson RB, Rothman LS. Direct numerical diagonalization: wave ofthe future. J Quant Spectrosc Radiat Transfer 1992;48:763–80.
[12] Pollack JB, Dalton JB, Grinspon D, Wattson RB, Freedman R, Crisp D,et al. Near-infrared light from Venus' nightside: a spectroscopicanalysis. Icarus 1993;103:1–42.
[13] Bézard B, Fedorova A, Bertaux J-L, Rodin A, Korablev O. The 1.10- and1.18-μm nightside windows of Venus observed by SPICAV-IR aboardVenus Express. Icarus 2011;216:173–83.
[14] Gamache RR. Private communications; 1990.[15] Gamache RR, Lamouroux J. The vibrational dependence of half-
widths of CO2 transitions broadened by N2, O2, air, and CO2. J QuantSpectrosc Radiat Transfer 2013;117:93–103.
[16] Laraia AL, Gamache RR, Lamouroux J, Gordon IE, Rothman LS. Totalinternal partition sums to support planetary remote sensing. Icarus2011;215:391–400.
[17] Wattson RB. Private comm.; 1991.[18] Modest MF, Bharadwaj SP. Medium resolution transmission mea-
surements of CO2 at high temperature. J Quant Spectrosc RadiatTransfer 2002;73:329–38.
[19] Tashkun SA, Perevalov VI, Teffo J-L, Bykov AD, Lavrentieva NN.CDSD-1000, the high-temperature carbon dioxide spectroscopicdatabank. J Quant Spectrosc Radiat Transfer 2003;82:165–96.
[20] Evseev V, Fateev A, Clausen S. High-resolution transmission mea-surements of CO2 at high temperatures for industrial applications.J Quant. Spectrosc. Radiat. Transfer 2012;113:2222–33.
[21] Bharadwaj SP, Modest MF. Medium resolution transmission mea-surements of CO2 at high temperature—an update. J Quant SpectroscRadiat Transfer 2007;103:146–55.
[22] Teffo JL, Sulakshina ON, Perevalov VI. Effective Hamiltonian forrovibrational energies and line intensities of carbon dioxide. J MolSpectrosc 1992;156:48–64.
[23] Perevalov VI, Lobodenko EI, Lyulin OM, Teffo JL. Effective dipolemoment and band intensities problem for carbon dioxide. J MolSpectrosc 1995;171:435–52.
[24] Tashkun SA, Perevalov VI, Teffo JL, Rothman LS, Tyuterev VlG. Globalfitting of 12C16O2 vibrational–rotational line positions using theeffective Hamiltonian approach. J Quant Spectrosc Radiat Transfer1998;60:785–801.
[25] Tashkun SA, Perevalov VI, Teffo JL, Tyuterev VlG. Global fit of 12C16O2
vibrational–rotational line intensities using the effective operatorapproach. J Quant Spectrosc Radiat Transfer 1999;62:571–98.