Embed Size (px)
Citation preview
European RadiologyExperimental
Tibiletti et al. European Radiology Experimental (2017) 1:5 DOI 10.1186/s41747-017-0009-2
ORIGINAL ARTICLE Open Access
Semi-quantitative evaluation of signalintensity and contrast-enhancement inModic changes
Marta Tibiletti1, Cristina Ciavarro2, Vlasta Bari3, Iain W. McCall4, Jill P. G. Urban5, Marco Brayda-Bruno6and Fabio Galbusera2*
Abstract
Background: Semi-quantitative evaluation of Modic changes (MCs) has recently been proposed as a way tostandardise and increase repeatability of clinical studies. This study is aimed at developing semi-quantitativemeasures of enhancement, given by contrast agent injection, on T1-weighted images in MCs, and to investigatetheir reliability and relation with MC types.
Methods: Thirty-seven subjects suffering from low back pain underwent T1-weighted and T2-weighted turbospin-echo sequences. Five minutes after the injection of a paramagnetic contrast agent, a second T1-weightedsequence was acquired. Regions of interest (ROIs) corresponding to MCs were selected manually on theunenhanced image; control ROIs in the “healthy” bone marrow were selected. For each ROI, the mean signalintensity (SI) of unenhanced pixels and the mean absolute and normalised difference in SI betweenunenhanced and contrast-enhanced pixels values were calculated.
Results: A total of 103 MCs were recognised and 61 were semi-quantitatively analysed: 16 type I, 34 type IIand 11 type I/II. Regarding controls, MCs I showed a lower SI on the unenhanced T1-weighted images and amarked contrast enhancement (CE); MCs II showed a higher SI than controls on unenhanced images and alower or comparable CE; and MCs I/II presented an intermediate SI on the unenhanced images and a markedCE. Inter-rater and intra-rater agreements were found to be excellent or substantial.
Conclusions: Semi-quantitative measurements could differentiate MC types in terms of unenhanced SI and ofCE with respect to “healthy” bone marrow.
Keywords: Modic changes, Gadolinium-based contrast agent, Contrast enhancement, Magnetic resonanceimaging, Spine
Key points
� Contrast enhancement differed between Modicchanges and healthy bone marrow.
� Type I Modic changes showed a marked contrastenhancement.
� Type II Modic changes showed a low contrastenhancement.
* Correspondence: [email protected] Galeazzi Orthopedic Institute, Via Galeazzi 4, 20161 Milan, ItalyFull list of author information is available at the end of the article
© The Author(s). 2017 Open Access This articleInternational License (http://creativecommons.oreproduction in any medium, provided you givthe Creative Commons license, and indicate if
IntroductionModic changes (MCs) are common variations of signalintensity in the endplate and vertebral body seen onmagnetic resonance imaging (MRI) [1, 2]. Depending ontheir characteristics on T1-weighted and T2-weightedimages, MCs are classified into type I (hypointense onT1 images and hyperintense on T2 images), type II(hyperintense on both T1-weighted and T2-weightedimages) and type III (hypointense in both T1-weightedand T2-weighted images). A normal endplate is consid-ered grade 0, and mixed types can co-exist in the sameendplate [3]. MC types can change with time, but nofixed evolution pattern has been recognised [4]. MCs
is distributed under the terms of the Creative Commons Attribution 4.0rg/licenses/by/4.0/), which permits unrestricted use, distribution, ande appropriate credit to the original author(s) and the source, provide a link tochanges were made.
Tibiletti et al. European Radiology Experimental (2017) 1:5 Page 2 of 8
I are thought to represent an ongoing active degenera-tive process demonstrated by fissured endplates withadjacent vascular granulation tissue within the bonemarrow [1]. MCs II are considered signs of fatty marrowdegeneration [1]: fatty marrow, which consists mainly offat cells, is characterised by sparse vascularisation [5].MCs I commonly progress to MCs II, and mixed-typeMCs I/II are observed frequently [3, 6]. Although MCsII are believed to be more stable [1], transition to MCs Ihas also been documented [7].The relationship between low back pain (LBP) and
MCs is controversial, although it has been suggested thatMCs could help to classify patients suffering from non-specific LBP [8] and could influence the outcome ofsurgical treatment [9–12]. Conflicting results have beenobtained in different studies, possibly in part due to vari-ations in study methodology and MC diagnosis. In mostMC studies to date, evaluations are made with the nakedeye and are thus subjective [13]. A semi-quantitativeevaluation of MCs may be helpful in investigating therelationship between MCs, clinical signs of LBP andsurgical outcome.Although MCs are defined as signal intensity abnor-
malities, only two studies have recently proposed semi-quantitative analysis of their signal intensity [13, 14].Wang et al. [13] in particular proposed semi-quantitativemeasures on T1-weighted and T2-weighted images andshowed the reliability of such methods.In the case of suspected tumours, infections and
vascular malformations [15], spinal MRI examinationsare often accompanied by the intravenous injection ofa contrast agent, a gadolinium chelate; this is not thecase for LBP, for which a contrast injection is notcommonly executed. Because the contrast agentshortens the T1 relaxation time, the tissues where thecontrast agent pools (typically vessels, hyperaemic tis-sues and joint spaces) result in a higher signal oncontrast-enhanced T1-weighted images compared withunenhanced T1-weighted images [15], in proportionto the concentration of the contrast agent [16].Given the different vascular characteristics of MCs,
the aim of the present study was to evaluate thecontrast enhancement of MCs on T1-weighted im-ages, hypothesising differences among the differenttypes of MCs, by means of a semi-quantitativeanalysis.
MethodsPopulationThirty-seven patients affected by LBP were enrolledprospectively in this study, in which the primary out-come was to study contrast diffusion in intervertebraldiscs [17]. The selected population included male andfemale subjects, with an age of 42.5 ± 9.1 years (mean
± standard deviation) and an age range from 18 to 60years. Each patient received detailed information re-garding the study protocol and gave her/his consent.Exclusion criteria were: age under 18 or over 60years, contrast agent allergy, reduced renal function,and contraindications to MRI. The study wasapproved by the local ethical committee.
Radiological evaluationMRI of the lumbar spine was performed with a 1.5-Tscanner (Avanto; Siemens, Erlangen, Germany) with aphased-array back coil. Standard examinationsincluded routine sagittal and axial T1-weighted (repe-tition time = 500 ms, echo time = 13 ms) and T2-weighted (repetition time = 4180 ms, echo time = 104ms) turbo spin-echo sequences as well as axial T2-weighted sequences. In addition, ProHance® (gadoteri-dol; Bracco Diagnostics, Princeton, RI, USA), a para-magnetic macrocyclic non-ionic contrast agent, wasinjected at a dose of 0.2 mmol/kg and a second T1-weighted image was taken approximately 5 minutesafter contrast injection. A higher dose with respect tostandard clinical applications was used following theindications of a previous study about diffusion in theintervertebral disc [18].A musculoskeletal radiologist with more than 30 years
of experience noted the presence and the type of MCs inthe endplates from T12–L1 to L5–S1. Only the MCswith a vertical height of more than 5 mm wereconsidered for the semi-quantitative evaluation, but thepresence of smaller MCs was noted [13].
Semi-quantitative measure of Modic changesFrom the scans showing at least one MC, the unen-hanced slice where each MC had the greatest depthwas selected; the same slice was selected for thecontrast-enhanced series. Unenhanced and contrast-enhanced T1-weighted scans were co-registered toensure alignment using Elastix, a registration toolkitbased on the National Library of Medicine InsightSegmentation and Registration Toolkit (ITK) [19]. Tothis aim, two-dimensional affine registrations (sixdegrees of freedom) were performed.In order to obtain semi-quantitative data, software
allowing for manual selection of a polygonal region ofinterest (ROI) on the unenhanced image (Figs. 1 and 2)and pixel-based calculation of the signal intensity of theselected area was developed in Matlab® (MathWorks,Natick, MA, USA).For each MC under consideration, the developed
protocol asked the operator to select a ROI correspond-ing to the zone of altered intensity on the unenhancedimage and two ROIs as controls, because a reference forthe “healthy” bone marrow in at least one control ROI
� �
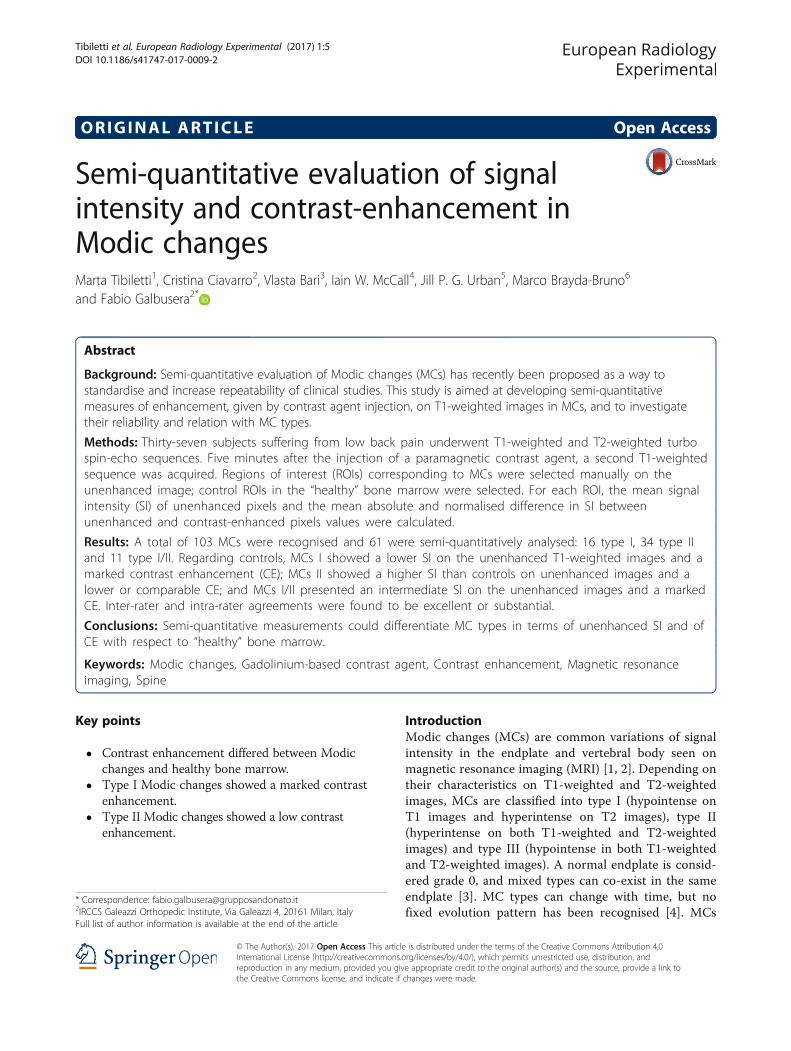
Fig. 1 Example of ROI selection for MCs I and same vertebra control areas on (a) unenhanced and (b) contrast-enhanced images. Two MCs I arepresent at the lower endplate of L5 and the upper endplate of S1. ROI region of interest
Tibiletti et al. European Radiology Experimental (2017) 1:5 Page 3 of 8
was necessary. The ideal control ROI would be closeenough to the MC to minimise the influence of localfield fluctuation [20], but also wide enough and free ofsignal alteration, which in some cases would be possibleonly in another site. These considerations lead to an in-vestigation of two different kinds of control ROI:
1. a ROI in the same vertebra affected with the MC(same vertebra [SV]);
2. a ROI corresponding to the section of the closestupper vertebra without MC—in this case one ROIwas used as reference for all the MCs in the sameimage (other vertebra [OV]).
For each ROI, the following three indexes were calculated:
1. mean value of the pixels encompassed in the ROI(PRE):
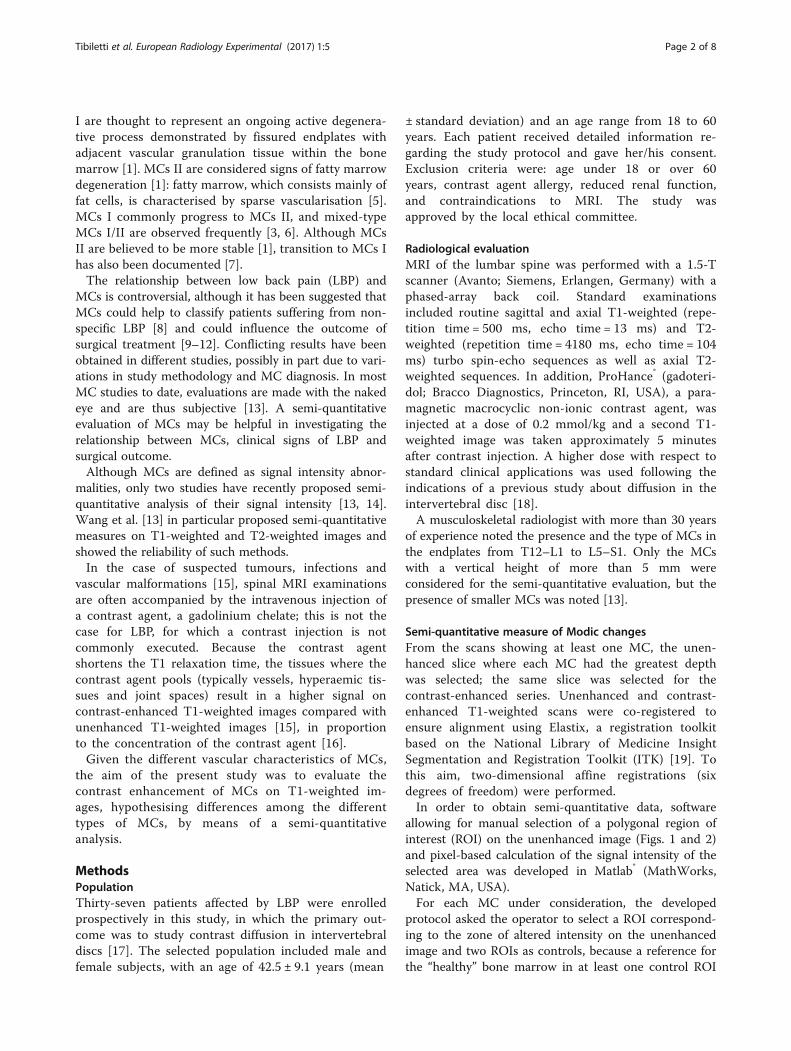
Fig. 2 Example of ROI selection for MCs II and same vertebra control areaspresent at the lower endplate of L1 and the upper endplate of L2, surroun
PRE ¼ mean ROIpre
2. mean value of the difference between post and precontrast signal intensity (DIFF):
DIFF ¼ mean ROIpost−ROIpre� �
3. ratio between PRE and DIFF, multiplied by 100(NORM.DIFF):
NORM:DIFF ¼ DIFFPRE
� �� 100
The three indexes calculated per ROI encompassingan MC were normalised with respect to the relevantcontrol ROIs, to calculate the normalised signal intensity(NSI), as follows:
on (a) unenhanced and (b) contrast-enhanced images. MCs II areding an endplate defect. ROI region of interest
Tibiletti et al. European Radiology Experimental (2017) 1:5 Page 4 of 8
NSIPRE ¼ PREMC−PRECONTROLð ÞPRECONTROL
� 100
NSI was extracted for PRE, DIFF and NORM.DIFFvalues and for each control ROI (SV, OV), for a total ofsix indexes.In order to analyse inter-rater and intra-rater reliability,
this procedure was repeated by the same operator 5months after the first evaluation. A second operator, aresident in radiology with 3 years of experience not dir-ectly involved in the research, received a brief explanationabout the software and the aim of the study before ratingall data in one session.
Statistical analysisInter-rater and intra-rater agreement was analysed withthe interclass correlation coefficient (ICC) (two-waymixed model, type absolute agreement), taking intoconsideration that an ICC of 0–0.2 represents slightagreement, 0.21–0.4 fair agreement, 0.41–0.6 moderateagreement, 0.61–0.8 substantial agreement and 0.81–1excellent agreement [21].The existence of significant differences in the described
indexes among MC I, MC II and MC I/II was evaluatedwith a rank-sum test or Kruskal–Wallis one-way analysisof variance. The choice of a non-parametric test was justi-fied by the non-normal distribution of data as confirmedby the Shapiro–Wilk test. If a statistical difference amonggroups was found, a multiple comparison procedure withDunn’s method was performed to establish the existenceof difference among pairs. One-sample t tests were carriedout to test whether data had a mean significantly differentwith respect to zero. The presence of correlation betweendata was studied by Spearman rank-order correlation.Differences were considered significant when p < 0.050.
ResultsAmong the 37 subjects enrolled in the study, 29 (78%)were diagnosed as having at least one MC. Of the 444considered endplates, 103 (23%) had an MC and wereclassified as follows: 26 type I, 64 type II and 13 type I/II. Sixty-one MCs with a height greater than 5 mm werethen considered for the semi-quantitative analysis: 16type I, 34 type II and 11 type I/II. MCs type III were ab-sent in all patients.
Intra-rater and inter-rater agreementIntra-rater agreement was excellent for all indexesconsidered (ICC 0.846–0.928). Inter-rater agreementwas substantial or excellent (ICC 0.652–0.833). Thetype of control ROI did not influence reliability inany particular way.
Control ROIsThe choice of control ROI had no significant effect onthe calculated indexes when all MCs were consideredtogether (NSIPRE, p = 0.715; NSIDIFF, p = 0.539; NSI-NORM.DIFF, p = 0.971; rank-sum test). The same indexcalculated with respect to different control ROIs alsoshowed high correlations: R2 values calculated withSpearman correlation were 0.849 for NSIPRE, 0.79 forNSIDIFF and 0.72 for NSINORM.DIFF (p < 0.001 for all).
Index for different MC typesFigure 3 summarises the results of NSIPRE, NSIDIFF andNSINORM.DIFF, per MC type and control ROI. Everyindex reported a strong statistical difference (p < 0.001)among MC types and was able to discriminate betweenMC I and MC II. However, no index was able to dis-criminate between MCs I and MCs I/II. In particular,NSIPRE was higher than zero (p < 0.001) for MCs II, butlower than zero for MCs I (p < 0.001). For MCs I/II,NSIPRE was not statistically different from zero. MCs Iand MCs I/II had a higher NSIDIFF than MCs II, andMCs I and MCs I/II had a median NSIDIFF higher thanzero (all cases, p < 0.001), while for MCs II only for SVcontrol was the median value lower than zero (p = 0.029;for OV, p = 0.213). MCs I and MCs I/II had a higherNSINORM.DIFF than MCs II; the median NSINORM.DIFF forMCs I/II was lower than MCs I but the difference wasnot statistically significant. NSINORM.DIFF for MCs I andMCs I/II were higher than zero (p < 0.001; but NSI-
NORM.DIFF SV, p = 0.004), while MCs II had medianvalues lower than zero (p < 0.001).Fig. 4 shows scatter plots of NSIDIFF against NSIPRE
and of NSINORM.DIFF against NSIPRE for each controlROI. MCs I pool on the left of each graphic, becausetheir PRE values are mostly negative, while MCs II poolon the right, with positive values. Considering enhance-ment indexes for NSIDIFF and NSINORM.DIFF, MCs I werecharacterised by positive values, while MCs II presentedmostly negative values for NSINORM.DIFF (7 of 34 for SVand for OV were higher than zero) and were morescattered for NSIDIFF (9 ROIs report values higher thanzero in SV, 14 for OV). MCs I/II always reportedpositive enhancement (apart from one case in NSINORM.-
DIFF SV, which is –1%).
DiscussionIn this study we developed semi-quantitative indexes toanalyse contrast enhancement of MCs with respect to“healthy” bone marrow on T1-weighted images. MCs Iconsistently showed a lower signal intensity comparedwith controls on unenhanced T1-weighted images asexpected, and a marked enhancement on contrast-enhanced T1-weighted images, significantly greater thanthe enhancement present in the “healthy” marrow.
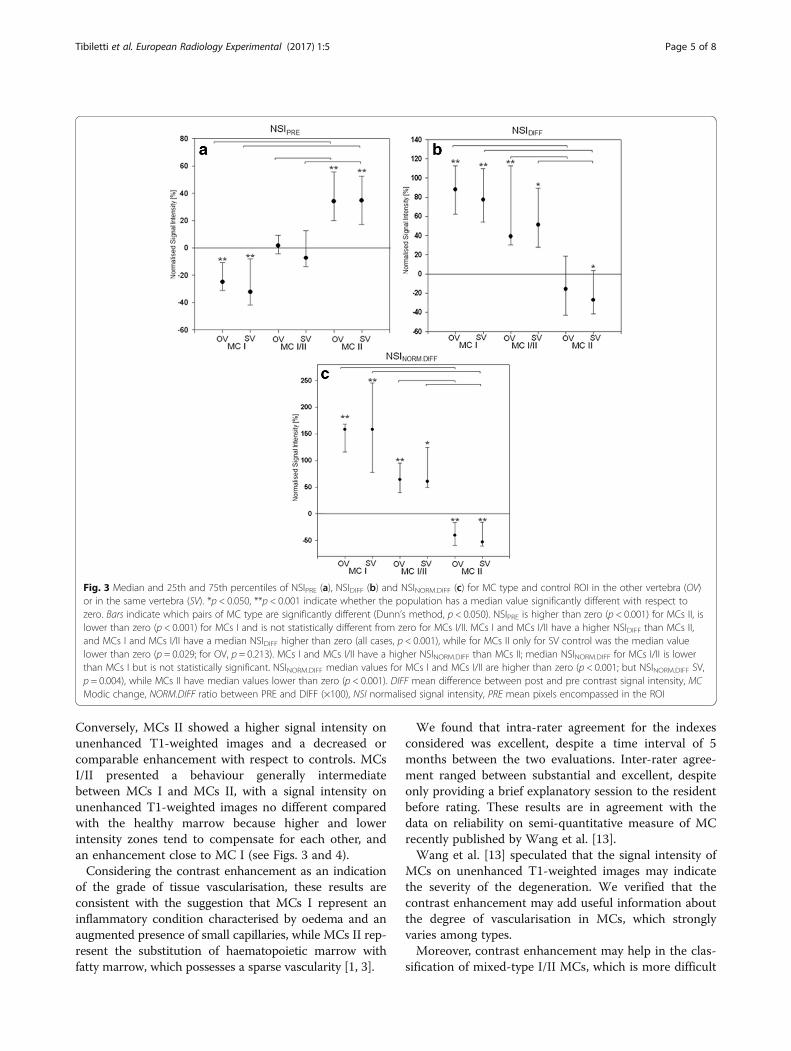
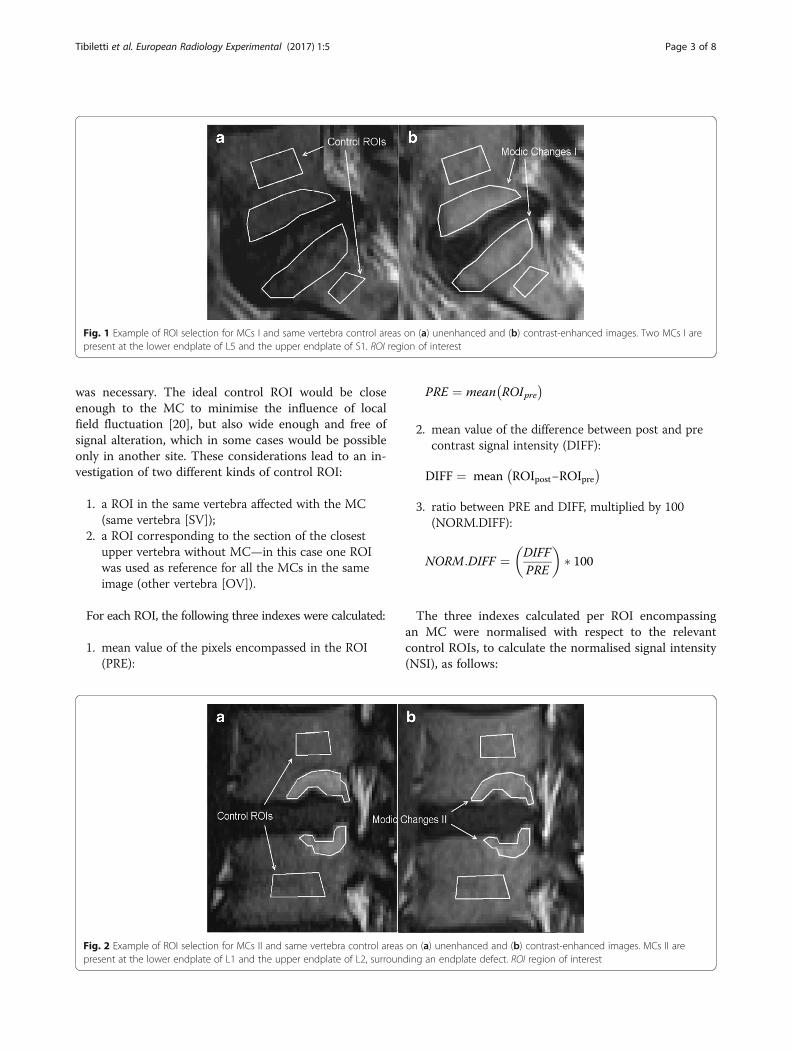
Fig. 3 Median and 25th and 75th percentiles of NSIPRE (a), NSIDIFF (b) and NSINORM.DIFF (c) for MC type and control ROI in the other vertebra (OV)or in the same vertebra (SV). *p < 0.050, **p < 0.001 indicate whether the population has a median value significantly different with respect tozero. Bars indicate which pairs of MC type are significantly different (Dunn’s method, p < 0.050). NSIPRE is higher than zero (p < 0.001) for MCs II, islower than zero (p < 0.001) for MCs I and is not statistically different from zero for MCs I/II. MCs I and MCs I/II have a higher NSIDIFF than MCs II,and MCs I and MCs I/II have a median NSIDIFF higher than zero (all cases, p < 0.001), while for MCs II only for SV control was the median valuelower than zero (p = 0.029; for OV, p = 0.213). MCs I and MCs I/II have a higher NSINORM.DIFF than MCs II; median NSINORM.DIFF for MCs I/II is lowerthan MCs I but is not statistically significant. NSINORM.DIFF median values for MCs I and MCs I/II are higher than zero (p < 0.001; but NSINORM.DIFF SV,p = 0.004), while MCs II have median values lower than zero (p < 0.001). DIFF mean difference between post and pre contrast signal intensity, MCModic change, NORM.DIFF ratio between PRE and DIFF (×100), NSI normalised signal intensity, PRE mean pixels encompassed in the ROI
Tibiletti et al. European Radiology Experimental (2017) 1:5 Page 5 of 8
Conversely, MCs II showed a higher signal intensity onunenhanced T1-weighted images and a decreased orcomparable enhancement with respect to controls. MCsI/II presented a behaviour generally intermediatebetween MCs I and MCs II, with a signal intensity onunenhanced T1-weighted images no different comparedwith the healthy marrow because higher and lowerintensity zones tend to compensate for each other, andan enhancement close to MC I (see Figs. 3 and 4).Considering the contrast enhancement as an indication
of the grade of tissue vascularisation, these results areconsistent with the suggestion that MCs I represent aninflammatory condition characterised by oedema and anaugmented presence of small capillaries, while MCs II rep-resent the substitution of haematopoietic marrow withfatty marrow, which possesses a sparse vascularity [1, 3].
We found that intra-rater agreement for the indexesconsidered was excellent, despite a time interval of 5months between the two evaluations. Inter-rater agree-ment ranged between substantial and excellent, despiteonly providing a brief explanatory session to the residentbefore rating. These results are in agreement with thedata on reliability on semi-quantitative measure of MCrecently published by Wang et al. [13].Wang et al. [13] speculated that the signal intensity of
MCs on unenhanced T1-weighted images may indicatethe severity of the degeneration. We verified that thecontrast enhancement may add useful information aboutthe degree of vascularisation in MCs, which stronglyvaries among types.Moreover, contrast enhancement may help in the clas-
sification of mixed-type I/II MCs, which is more difficult
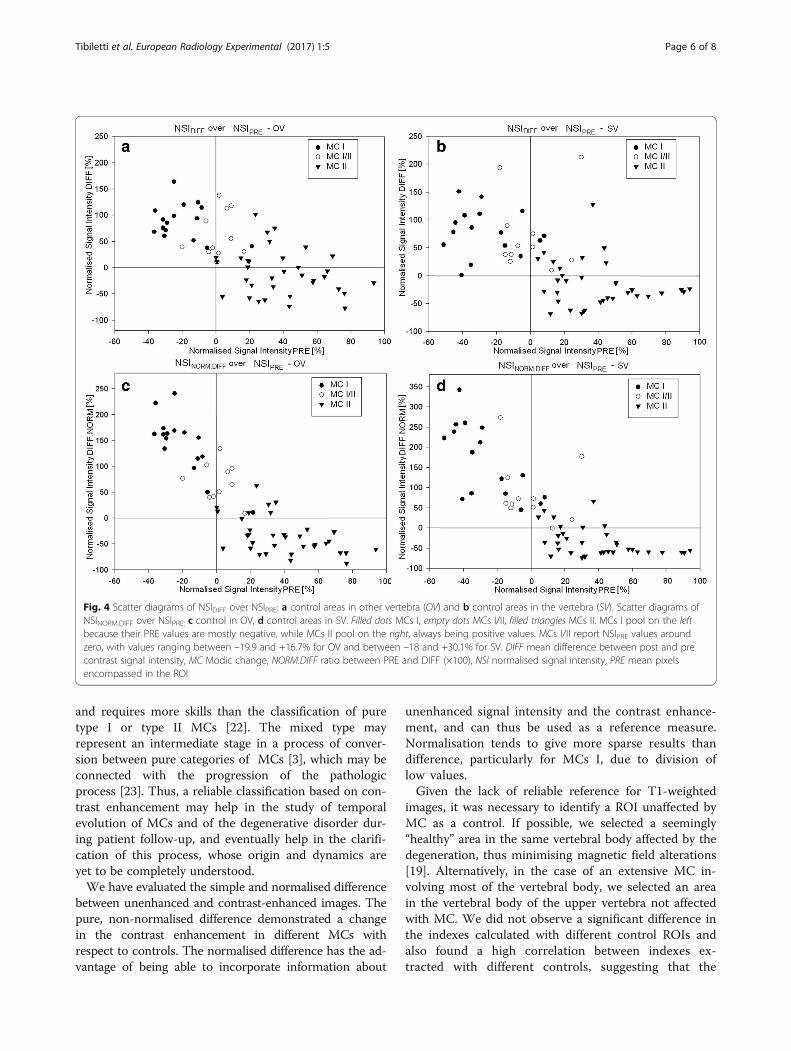
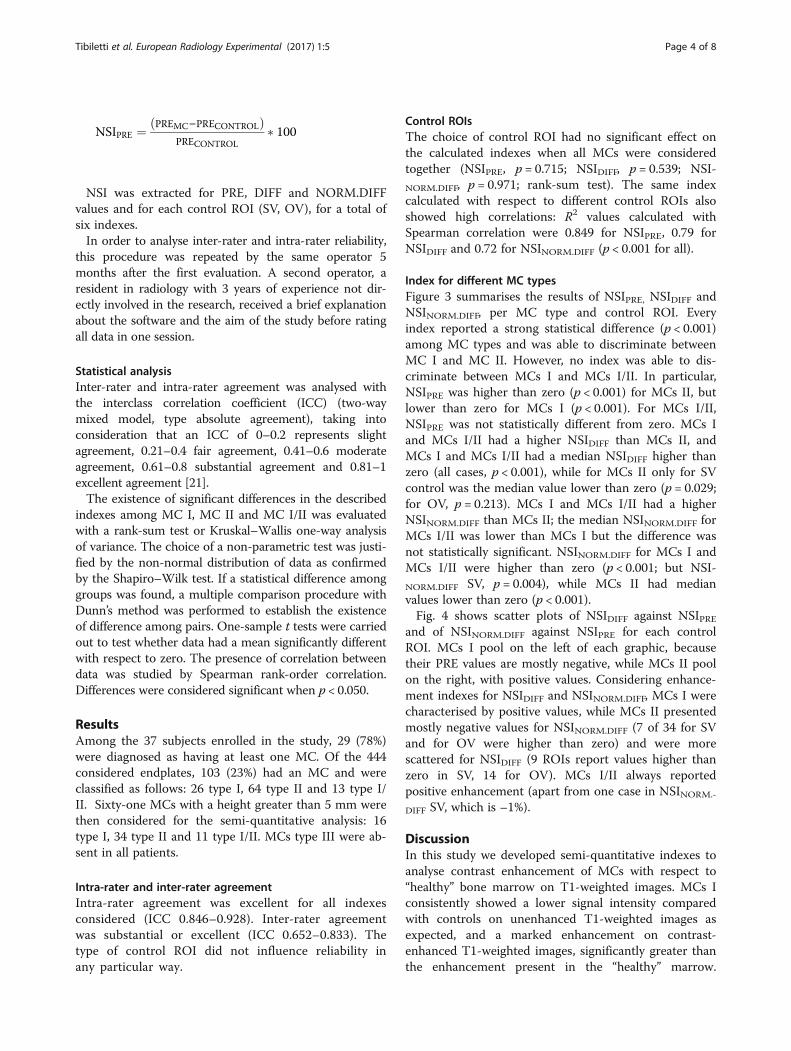
Fig. 4 Scatter diagrams of NSIDIFF over NSIPRE: a control areas in other vertebra (OV) and b control areas in the vertebra (SV). Scatter diagrams ofNSINORM.DIFF over NSIPRE: c control in OV, d control areas in SV. Filled dots MCs I, empty dots MCs I/II, filled triangles MCs II. MCs I pool on the leftbecause their PRE values are mostly negative, while MCs II pool on the right, always being positive values. MCs I/II report NSIPRE values aroundzero, with values ranging between –19.9 and +16.7% for OV and between –18 and +30.1% for SV. DIFF mean difference between post and precontrast signal intensity, MC Modic change, NORM.DIFF ratio between PRE and DIFF (×100), NSI normalised signal intensity, PRE mean pixelsencompassed in the ROI
Tibiletti et al. European Radiology Experimental (2017) 1:5 Page 6 of 8
and requires more skills than the classification of puretype I or type II MCs [22]. The mixed type mayrepresent an intermediate stage in a process of conver-sion between pure categories of MCs [3], which may beconnected with the progression of the pathologicprocess [23]. Thus, a reliable classification based on con-trast enhancement may help in the study of temporalevolution of MCs and of the degenerative disorder dur-ing patient follow-up, and eventually help in the clarifi-cation of this process, whose origin and dynamics areyet to be completely understood.We have evaluated the simple and normalised difference
between unenhanced and contrast-enhanced images. Thepure, non-normalised difference demonstrated a changein the contrast enhancement in different MCs withrespect to controls. The normalised difference has the ad-vantage of being able to incorporate information about
unenhanced signal intensity and the contrast enhance-ment, and can thus be used as a reference measure.Normalisation tends to give more sparse results thandifference, particularly for MCs I, due to division oflow values.Given the lack of reliable reference for T1-weighted
images, it was necessary to identify a ROI unaffected byMC as a control. If possible, we selected a seemingly“healthy” area in the same vertebral body affected by thedegeneration, thus minimising magnetic field alterations[19]. Alternatively, in the case of an extensive MC in-volving most of the vertebral body, we selected an areain the vertebral body of the upper vertebra not affectedwith MC. We did not observe a significant difference inthe indexes calculated with different control ROIs andalso found a high correlation between indexes ex-tracted with different controls, suggesting that the
Tibiletti et al. European Radiology Experimental (2017) 1:5 Page 7 of 8
choice of the control ROI only has a marginal influ-ence on the results.The first limitation of this study is the low number of
MCs considered, due to the relatively low number of sub-jects enrolled. Other studies based on a wider populationwould be necessary to verify the possibility of establishingreference values of contrast enhancement for MCs, toinvestigate whether the indexes described may be an indi-cator of the severity grade of the degenerative process asindicated by clinical indexes. Indeed, besides contributingto the basic knowledge about contrast-enhanced MRI ofthe spine, the availability of a semi-quantitative indexcould be useful to evaluate the progression of thedegenerative disorder. Given the risk associated with theinjection of gadolinium chelates [24, 25], we recognise thatthe simple investigation of MCs cannot be considered ajustification for a contrast-enhanced MRI of the spine.Nevertheless, because this examination is performed forspecific purposes in patients with previous history of spinesurgeries or for other conditions such as fever, immuno-suppression or oncological history, data on contrast en-hancement of MCs may be available for a non-negligiblenumber of patients. Second, we included only MCs with aheight greater than 5 mm, although an investigation ofsmaller MCs would be valuable for understanding theinitiation mechanisms of endplate defects. This choicewas related to the low spatial resolution of the images andthe use of a subjective, manual method for the ROIcreation, preventing an accurate and repeatable selectionof the few pixels with altered signal intensity of smallMCs. Third, T2-weighted fat-saturated images, commonlyused to assess oedematous changes in MCs I [26], werenot acquired in this study. Fourth, we did not investigatethe possible correlation between MC enhancement andclinical data such as pain or quality of life scores, whichwere not collected in the primary study [17]. Finally, thestudy was conducted on a single 1.5-T scanner, and thefindings are therefore to be considered valid only at thatfield strength.In conclusion, based on the present results we do not
recommend contrast injection for the MRI assessment ofMCs alone, because they can be diagnosed qualitativelywithout contrast injection. However, the novel data re-ported interestingly show the difference in signal intensityof MCs on unenhanced and contrast-enhanced T1-weighted images with respect to “healthy” bone marrow:MCs I consistently showed lower signal intensity thancontrol areas on unenhanced images and marked contrastenhancement; MCs II showed a higher signal intensity onunenhanced images and a decreased or comparable con-trast enhancement when compared with control areas; andMCs I/II presented a behaviour generally intermediate be-tween MCs I and MCs II (unenhanced signal intensity closeto MCs II and contrast enhancement close to MCs I).
FundingThe work was funded by the Seventh Framework Programme of theEuropean Commission (grant number HEALTH-F2-2008-201626).
Authors’ contributionsMT drafted the paper, performed statistical analysis and data processing, andparticipated to the data interpretation. CC participated to the study designand performed data collection and processing. VB participated to thestatistical analysis. IMC performed the image analysis and participated to thedata interpretation. JU and MBB contributed to the study design and thedata interpretation. FG contributed to the data interpretation and criticallyrevised the paper draft. All authors read and approved the final manuscript.
Competing interestsThe authors declare that they have no competing interests.
Publisher’s NoteSpringer Nature remains neutral with regard to jurisdictional claims inpublished maps and institutional affiliations.
Author details1Department of Internal Medicine II—Cardiology, Ulm University,Helmholtzstrasse 16, 89081 Ulm, Germany. 2IRCCS Galeazzi OrthopedicInstitute, Via Galeazzi 4, 20161 Milan, Italy. 3IRCCS Policlinico San Donato,Piazza Edmondo Malan 1, 20097 San Donato Milanese, Italy. 4KeeleUniversity, Keele ST5 5BG, UK. 5Department of Physiology, Anatomy andGenetics, Oxford University, Oxford OX1 3PA, UK. 6Department of SpineSurgery III, IRCCS Galeazzi Orthopaedic Institute, Via Galeazzi 4, 20161 Milan,Italy.
Received: 17 January 2017 Accepted: 28 March 2017
References1. Modic M, Masaryk T, Ross J, Carter J (1988) Imaging of degenerative disk
disease. Radiology 168:177–1862. Modic M, Steinberg P, Ross J, Masaryk T, Carter J (1988) Degenerative disk
disease: Assessment of changes in vertebral body marrow with MR imaging.Radiology 166:193–199
3. Braithwaite I, White J, Saifuddin A, Renton P, Taylor B (1998) Vertebralend-plate (Modic) changes on lumbar spine MRI: correlation with painreproduction at lumbar discography. Eur Spine J 7:363–368
4. Zhang YH, Zhao CQ, Jiang LS, Chen XD, Dai LY (2008) Modic changes: asystematic review of the literature. Eur Spine J 17:1289–1299
5. Vogler J III, Murphy W (1988) Bone marrow imaging. Radiology 168:679–6936. Kerttula L, Luoma K, Vehmas T, Grönblad M, Kääpä E (2012) Modic type I
change may predict rapid progressive, deforming disc degeneration: aprospective 1-year follow-up study. Eur Spine J 21:1135–1142
7. Kuisma M, Karppinen J, Niinimäki J et al (2006) A three-year follow-up of lumbarspine endplate (Modic) changes. Spine (Phila Pa 1976) 31:1714–1718
8. Jensen TS, Karppinen J, Sorensen JS, Niinimäki J, Leboeuf-Yde C (2008)Vertebral endplate signal changes (modic change): a systematic literaturereview of prevalence and association with non-specific low back pain. EurSpine J 17:1407–1422
9. Hutton MJ, Bayer JH, Powell JM (2011) Modic vertebral body changes: thenatural history as assessed by consecutive magnetic resonance imaging.Spine 36:2304
10. Rahme R, Moussa R, Bou-Nassif R et al (2010) What happens to modicchanges following lumbar discectomy? Analysis of a cohort of 41 patientswith a 3-to 5-year follow-up period. J Neurosurg Spine 13:562–567
11. Barth M, Weiss C, Thomé C (2008) Two-year outcome after lumbarmicrodiscectomy versus microscopic sequestrectomy: Part 1: evaluation ofclinical outcome. Spine 33:265–272
12. Jensen MC, Brant-Zawadzki MN, Obuchowski N et al (1994) Magneticresonance imaging of the lumbar spine in people without back pain. NEngl J Med 331:69–73
13. Wang Y, Videman T, Niemeläinen R, Battié MC (2011) Quantitative measuresof modic changes in lumbar spine magnetic resonance imaging: intra-andinter-rater reliability. Spine 36:1236–1243

Tibiletti et al. European Radiology Experimental (2017) 1:5 Page 8 of 8
14. Kuisma M, Karppinen J, Haapea M et al (2009) Modic changes in vertebralendplates: a comparison of MR imaging and multislice CT. Skeletal Radiol38:141–147
15. Boos N (2008) Spinal disorders: fundamentals of diagnosis and treatment.Springer Verlag, Heidelberg
16. Rosen BR, Belliveau JW, Vevea JM, Brady TJ (1990) Perfusion imaging withNMR contrast agents. Magn Reson Med 14:249–265
17. Tibiletti M, Galbusera F, Ciavarro C, Brayda-Bruno M (2013) Is the transportof a gadolinium-based contrast agent decreased in a degenerated or ageddisc? A post contrast MRI study. PLoS One 8:e76697
18. Rajasekaran S, Babu JN, Arun R et al (2004) ISSLS prize winner: A study ofdiffusion in human lumbar discs: a serial magnetic resonance imaging studydocumenting the influence of the endplate on diffusion in normal anddegenerate discs. Spine 29:2654–2667
19. Klein S, Staring M, Murphy K, Viergever MA, Pluim JPW (2010) Elastix: atoolbox for intensity-based medical image registration. IEEE Trans MedImaging 29:196–205
20. Luoma E, Raininko R, Nummi P et al (1997) Suitability of cerebrospinal fluidas a signal-intensity reference on MRI: evaluation of signal-intensityvariations in the lumbosacral dural sac. Neuroradiology 39:728–732
21. Shrout PE, Fleiss JL (1979) Intraclass correlations: uses in assessing raterreliability. Psychol Bull 86:420–428
22. Fayad F, Lefevre-Colau MM, Drapé JL et al (2009) Reliability of a modifiedmodic classification of bone marrow changes in lumbar spine MRI. JointBone Spine 76:286–289
23. Kääpä E, Luoma K, Pitkäniemi J, Kerttula L, Grönblad M (2012) Correlation ofsize and type of modic types 1 and 2 lesions with clinical symptoms: adescriptive study in a subgroup of patients with chronic low back pain onthe basis of a university hospital patient sample. Spine 37:134
24. Dillman JR, Ellis JH, Cohan RH, Strouse PJ, Jan SC (2007) Frequency andseverity of acute allergic-like reactions to gadolinium-containing iv contrastmedia in children and adults. Am J Roentgenol 189:1533–1538
25. Lauenstein TC, Salman K, Morreira R et al (2007) Nephrogenic systemicfibrosis: center case review. J Magn Reson Imaging 26:1198–1203
26. Xu L, Chu B, Feng Y, Xu F, Zou YF (2016) Modic changes in lumbar spine:prevalence and distribution patterns of end plate oedema and end platesclerosis. Br J Radiol 89:20150650
Submit your manuscript to a journal and benefi t from:
7 Convenient online submission
7 Rigorous peer review
7 Immediate publication on acceptance
7 Open access: articles freely available online
7 High visibility within the fi eld
7 Retaining the copyright to your article
Submit your next manuscript at 7 springeropen.com


