Embed Size (px)
Citation preview
September 12 – 15, 2021
Gold Forum Americas 2021
2
Cautionary note regarding forward-looking statements
Cautionary Notes
Certain information contained in this presentation, including any information relating to New Gold’s future financial or operating
performance are “forward-looking”. All statements in this presentation, other than statements of historical fact, which address events,results, outcomes or developments that New Gold expects to occur are “forward-looking statements”. Forward-looking statements
are statements that are not historical facts and are generally, but not always, identified by the use of forward-looking terminology
such as “plans”, “expects”, “is expected”, “budget”, “scheduled”, “targeted”, “estimates”, “forecasts”, “intends”, “anticipates”,“projects”, “potential”, “believes” or variations of such words and phrases or statements that certain actions, events or results “may”,
“could”, “would”, “should”, “might” or “will be taken”, “occur” or “be achieved” or the negative connotation of such terms. Forward-
looking statements in this presentation include, among others, statements with respect to: the Company’s investment proposition;expectations regarding production and all-in sustaining costs at New Afton and Rainy River as well as on an annual consolidated basis;
the current and anticipated trajectory with respect to gold equivalent production guidance range at Rainy River and New Afton; the
potential for guidance ranges to be impacted by lower gold grade at Rainy River’s East Lobe; the development of the Intrepid Zone andproposed drilling program at Rainy River as well as the anticipated timing thereof; the potential to convert significant M&I resources to
reserves at Rainy River; the expected free cash flow to be generated at Rainy River; the planned increases in average gold grade at
Rainy River in the second half of 2021; the Intrepid Zone decline development and planned production for late 2022; the mining andmilling of the East Lobe and the grade expected to be mined in the East Lobe in the second half of 2021 and after 2021; the potential
for a modified mine plan at Rainy River for the remainder of 2021; the advancement of B3 production through the second half of 2021;
the development of the C-Zone at New Afton and the timing thereof; the potential for additional short-term extraction opportunitiesat New Afton; the Company’s plans to optimize metal recoveries at New Afton; the underground drilling and exploration program at
New Afton and timing expectations regarding the completion thereof; the potential for free cash flow generation to drive shareholder
value; the ability to redeem the 2025 and 2027 Senior Notes at maturity; expectations regarding cumulative free cash flow, averageannual free cash flow and average free cash flow per share per year to be generated over the next five years; the Company’s mineral
reserve and mineral resource estimates at New Afton and Rainy River; the potential for a standalone underground mine plan to add
additional value and extend the Rainy River life of mine beyond 2028; and the planned additional exploration activities at Rainy Riverin 2021.
All forward-looking statements in this presentation are based on the opinions and estimates of management that, while consideredreasonable as at the date of this presentation in light of management’s experience and perception of current conditions and expected
developments, are inherently subject to important risk factors and uncertainties, many of which are beyond New Gold’s ability to
control or predict. Certain material assumptions regarding such forward-looking statements are discussed in this presentation, NewGold’s latest annual management’s discussion and analysis (“MD&A”), its most recent annual information form and technical reports
on the Rainy River Mine and New Afton Mine filed on SEDAR at www.sedar.com and on EDGAR at www.sec.gov. In addition to, and
subject to, such assumptions discussed in more detail elsewhere, the forward-looking statements in this presentation are also subjectto the following assumptions: (1) there being no significant disruptions affecting New Gold’s operations other than as set out herein;
(2) political and legal developments in jurisdictions where New Gold operates, or may in the future operate, being consistent with New
Gold’s current expectations; (3) the accuracy of New Gold’s current mineral reserve and mineral resource estimates; (4) the exchangerate between the Canadian dollar and U.S. dollar, and to a lesser extent, the Mexican Peso, being approximately consistent with
current levels; (5) prices for diesel, natural gas, fuel oil, electricity and other key supplies being approximately consistent with current
levels; (6) equipment, labour and materials costs increasing on a basis consistent with New Gold’s current expectations; (7)arrangements with First Nations and other Aboriginal groups in respect of the New Afton Mine and Rainy River Mine being consistent
with New Gold’s current expectations; (8) all required permits, licenses and authorizations being obtained from the relevant
governments and other relevant stakeholders within the expected timelines; (9) there being no significant disruptions to theCompany’s workforce at either the Rainy River or New Afton Mine due to cases of COVID-19 or any required self-isolation
requirements (due, among other things, to cross-border travel to the United States or any other country); (10) the responses of the
relevant governments to the COVID-19 outbreak being sufficient to contain the impact of the COVID-19 outbreak; (11) there being nomaterial disruption to the Company’s supply chains and workforce that would interfere with the Company’s anticipated course of
action at the Rainy River Mine and the systematic ramp-up of operations; and (12) the long-term economic effects of the COVID-19
outbreak not having a material adverse impact on the Company’s operations or liquidity position.
3
Cautionary note regarding forward-looking statements
Cautionary Notes continued
Forward-looking statements are necessarily based on estimates and assumptions that are inherently subject to known and unknown
risks, uncertainties and other factors that may cause actual results, level of activity, performance or achievements to be materiallydifferent from those expressed or implied by such forward-looking statements. Such factors include, without limitation: significant
capital requirements and the availability and management of capital resources; additional funding requirements; price volatility in the
spot and forward markets for metals and other commodities; fluctuations in the international currency markets and in the rates ofexchange of the currencies of Canada, the United States and, to a lesser extent, Mexico; volatility in the market price of the Company’s
securities; hedging and investment related risks; dependence on the Rainy River Mine and New Afton Mine; discrepancies between
actual and estimated production, between actual and estimated mineral reserves and mineral resources and between actual andestimated metallurgical recoveries; risks related to early production at the Rainy River Mine, including failure of equipment,
machinery, the process circuit or other processes to perform as designed or intended; risks related to construction, including changing
costs and timelines; adequate infrastructure; fluctuation in treatment and refining charges; changes in national and local governmentlegislation in Canada, the United States and, to a lesser extent, Mexico or any other country in which New Gold currently or may in the
future carry on business; global economic and financial conditions; risks relating to New Gold’s debt and liquidity; the adequacy of
internal and disclosure controls; taxation; impairment; conflicts of interest; risks relating to climate change; controls, regulations andpolitical or economic developments in the countries in which New Gold does or may carry on business; the speculative nature of
mineral exploration and development, including the risks of obtaining and maintaining the validity and enforceability of the necessary
licenses and permits and complying with the permitting requirements of each jurisdiction in which New Gold operates; the lack ofcertainty with respect to foreign legal systems, which may not be immune from the influence of political pressure, corruption or other
factors that are inconsistent with the rule of law; the uncertainties inherent to current and future legal challenges New Gold is or may
become a party to; risks relating to proposed acquisitions and the integration thereof; information systems security threats;diminishing quantities or grades of mineral reserves and mineral resources; competition; loss of, or inability to attract, key employees;
rising costs of labour, supplies, fuel and equipment; actual results of current exploration or reclamation activities; uncertainties
inherent to mining economic studies; changes in project parameters as plans continue to be refined; accidents; labour disputes;defective title to mineral claims or property or contests over claims to mineral properties; unexpected delays and costs inherent to
consulting and accommodating rights of Indigenous groups; risks, uncertainties and unanticipated delays associated with obtaining and
maintaining necessary licenses, permits and authorizations and complying with permitting requirements; disruptions to the Company’sworkforce at either the Rainy River Mine or the New Afton Mine, or both, due to cases of COVID-19 or any required self-isolation (due
to cross-border travel, exposure to a case of COVID-19 or otherwise); the responses of the relevant governments to the COVID-19
outbreak not being sufficient to contain the impact of the COVID-19 outbreak; disruptions to the Company’s supply chain and
workforce due to the COVID-19 outbreak; an economic recession or downturn as a result of the COVID-19 outbreak that materially
adversely affects the Company’s operations or liquidity position; there being further shutdowns at the Rainy River or New AftonMines; the Company not being able to complete its construction projects at the Rainy River Mine or the New Afton Mines on the
anticipated timeline or at all; and the Company not being able to complete the exploration drilling program to be launched at the
Rainy River Mine and Cherry Creek on the anticipated timeline or at all. In addition, there are risks and hazards associated with thebusiness of mineral exploration, development and mining, including environmental events and hazards, industrial accidents, unusual
or unexpected formations, pressures, cave-ins, flooding and gold bullion losses (and the risk of inadequate insurance or inability to
obtain insurance to cover these risks) as well as “Risk Factors” included in New Gold’s most recent annual information form, MD&Aand other disclosure documents filed on and available on SEDAR at www.sedar.com and on EDGAR at www.sec.gov. Forward looking
statements are not guarantees of future performance, and actual results and future events could materially differ from those
anticipated in such statements. All forward-looking statements contained in this presentation are qualified by these cautionarystatements. New Gold expressly disclaims any intention or obligation to update or revise any forward-looking statements whether as a
result of new information, events or otherwise, except in accordance with applicable securities laws.
For further information on the Company’s response to COVID-19, please refer to: https://www.newgold.com/covid-19/

4
Investment Proposition
1. Proven and Probable Mineral Reserves as of December 31, 2020.
2. In 2021, the Company will continue to report production on a gold eq. basis as well as on a per-metal basis. Cash costs and AISC will be reported on a per gold eq. ounce basis. Guidance has been prepared assuming $1,800 per gold ounce, $3.50 pound of copper and $25.00 per silver ounce and a foreign exchange rate of 1.28 Canadian dollars to the US dollar.
3. Total liquidity includes C$50 million ($40 million) of cash received from Artemis Gold in August 2021 from the Blackwater sale plus cash and cash equivalents of $138 million and $326 million undrawn on the credit facility as at June 30, 2021.
4. Percentage increase compares estimated average annual production from 2022 to 2026 versus 2020 actual production. Gold eq. production assumes $1,600 per gold ounce, $20.00 per silver ounce, and $3.50 per pound of copper for 2022 to 2026 estimates.
Gold production and reserves1
Located in Canada
Canadian Focused
100%
History of operational delivery
Achieved guidance last two years
Operational Excellence
405 - 4502021 gold eq. koz
guidance2
Total liquidity3
No debt due until 2025
Enhanced Financial Flexibility
+$500million
Increase in gold eq. production4
2020 versus 2022E – 2026E average annual production
Growth Opportunities
Target reduction in GHG emissions
Corporate target for 2030
Commitment to Sustainability
30%
Growth Opportunities
+25%
5
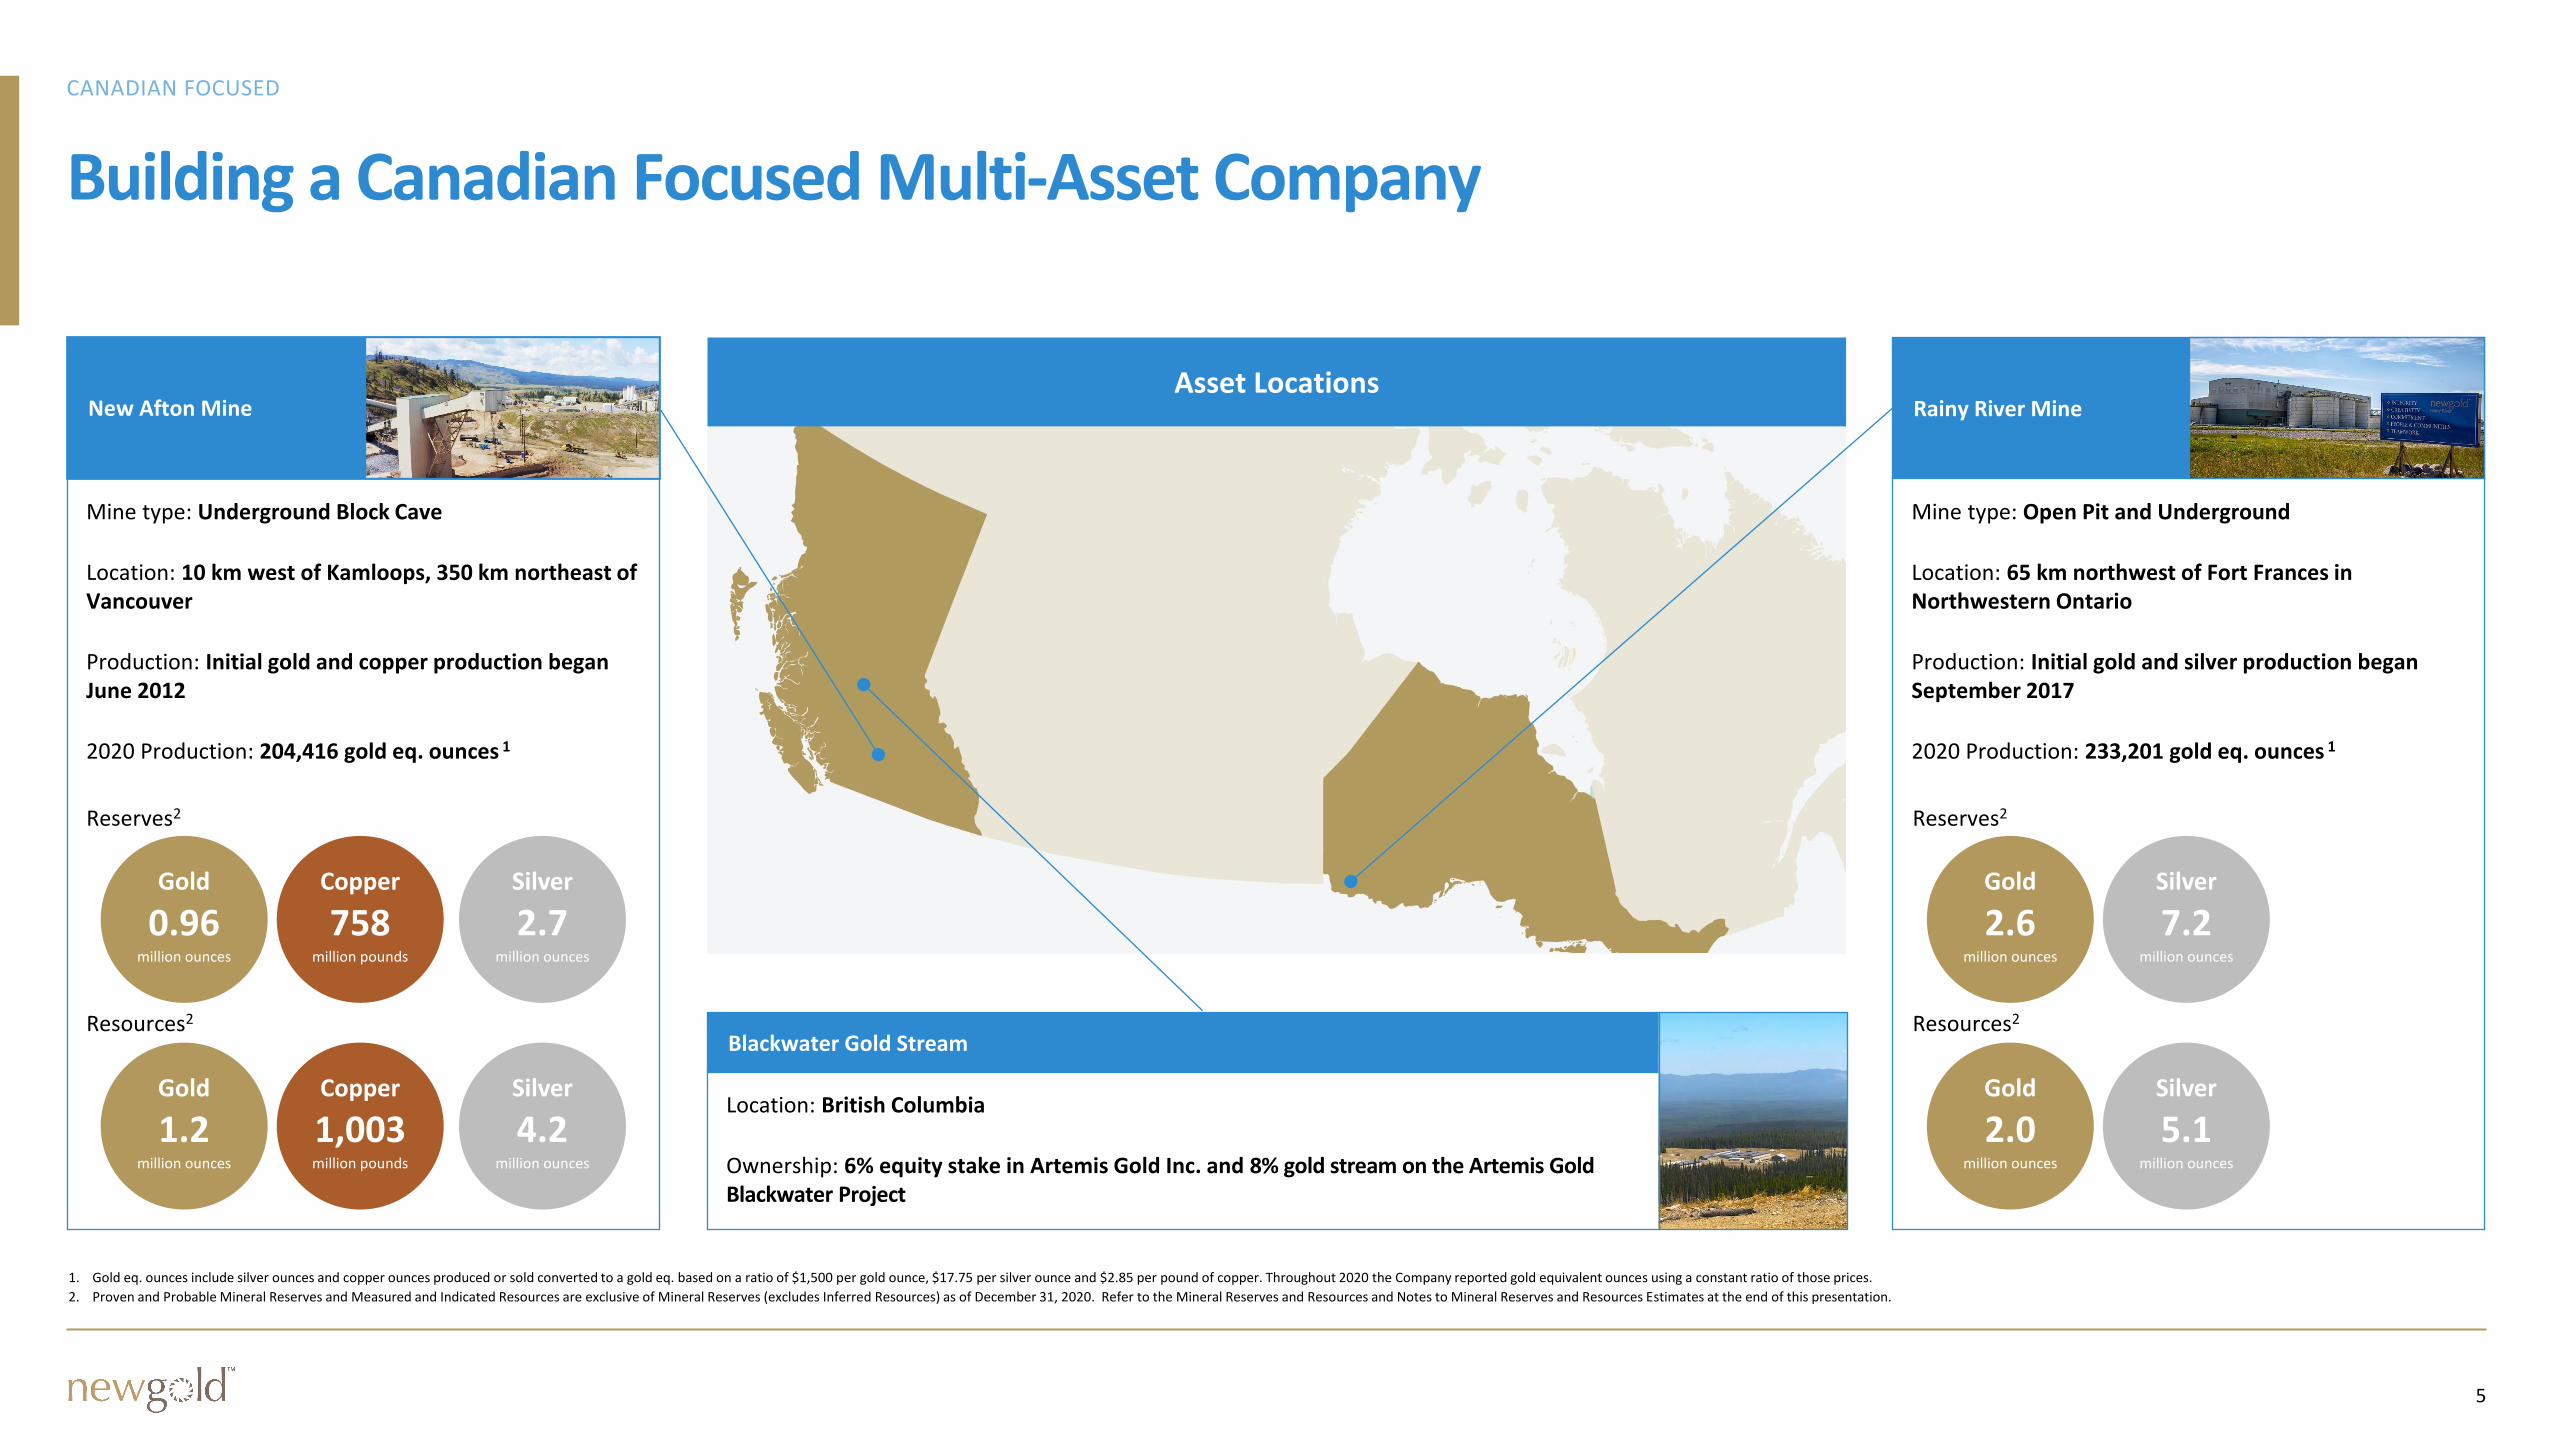
Building a Canadian Focused Multi-Asset Company
Mine type: Underground Block Cave
Location: 10 km west of Kamloops, 350 km northeast of Vancouver
Production: Initial gold and copper production began June 2012
2020 Production: 204,416 gold eq. ounces 1
0.96Gold
million ounces
758Copper
million pounds
2.7Silver
million ounces
1.2Gold
million ounces
1,003Copper
million pounds
4.2Silver
million ounces
Reserves2
Resources2
New Afton Mine
Mine type: Open Pit and Underground
Location: 65 km northwest of Fort Frances in Northwestern Ontario
Production: Initial gold and silver production began September 2017
2020 Production: 233,201 gold eq. ounces 1
Rainy River MineAsset Locations
Location: British Columbia
Ownership: 6% equity stake in Artemis Gold Inc. and 8% gold stream on the Artemis Gold Blackwater Project
Blackwater Gold Stream
2.6Gold
million ounces
7.2Silver
million ounces
2.7Silver
2.0Gold
million ounces
5.1Silver
million ounces
Reserves2
Resources2
1. Gold eq. ounces include silver ounces and copper ounces produced or sold converted to a gold eq. based on a ratio of $1,500 per gold ounce, $17.75 per silver ounce and $2.85 per pound of copper. Throughout 2020 the Company reported gold equivalent ounces using a constant ratio of those prices.
2. Proven and Probable Mineral Reserves and Measured and Indicated Resources are exclusive of Mineral Reserves (excludes Inferred Resources) as of December 31, 2020. Refer to the Mineral Reserves and Resources and Notes to Mineral Reserves and Resources Estimates at the end of this presentation.
6
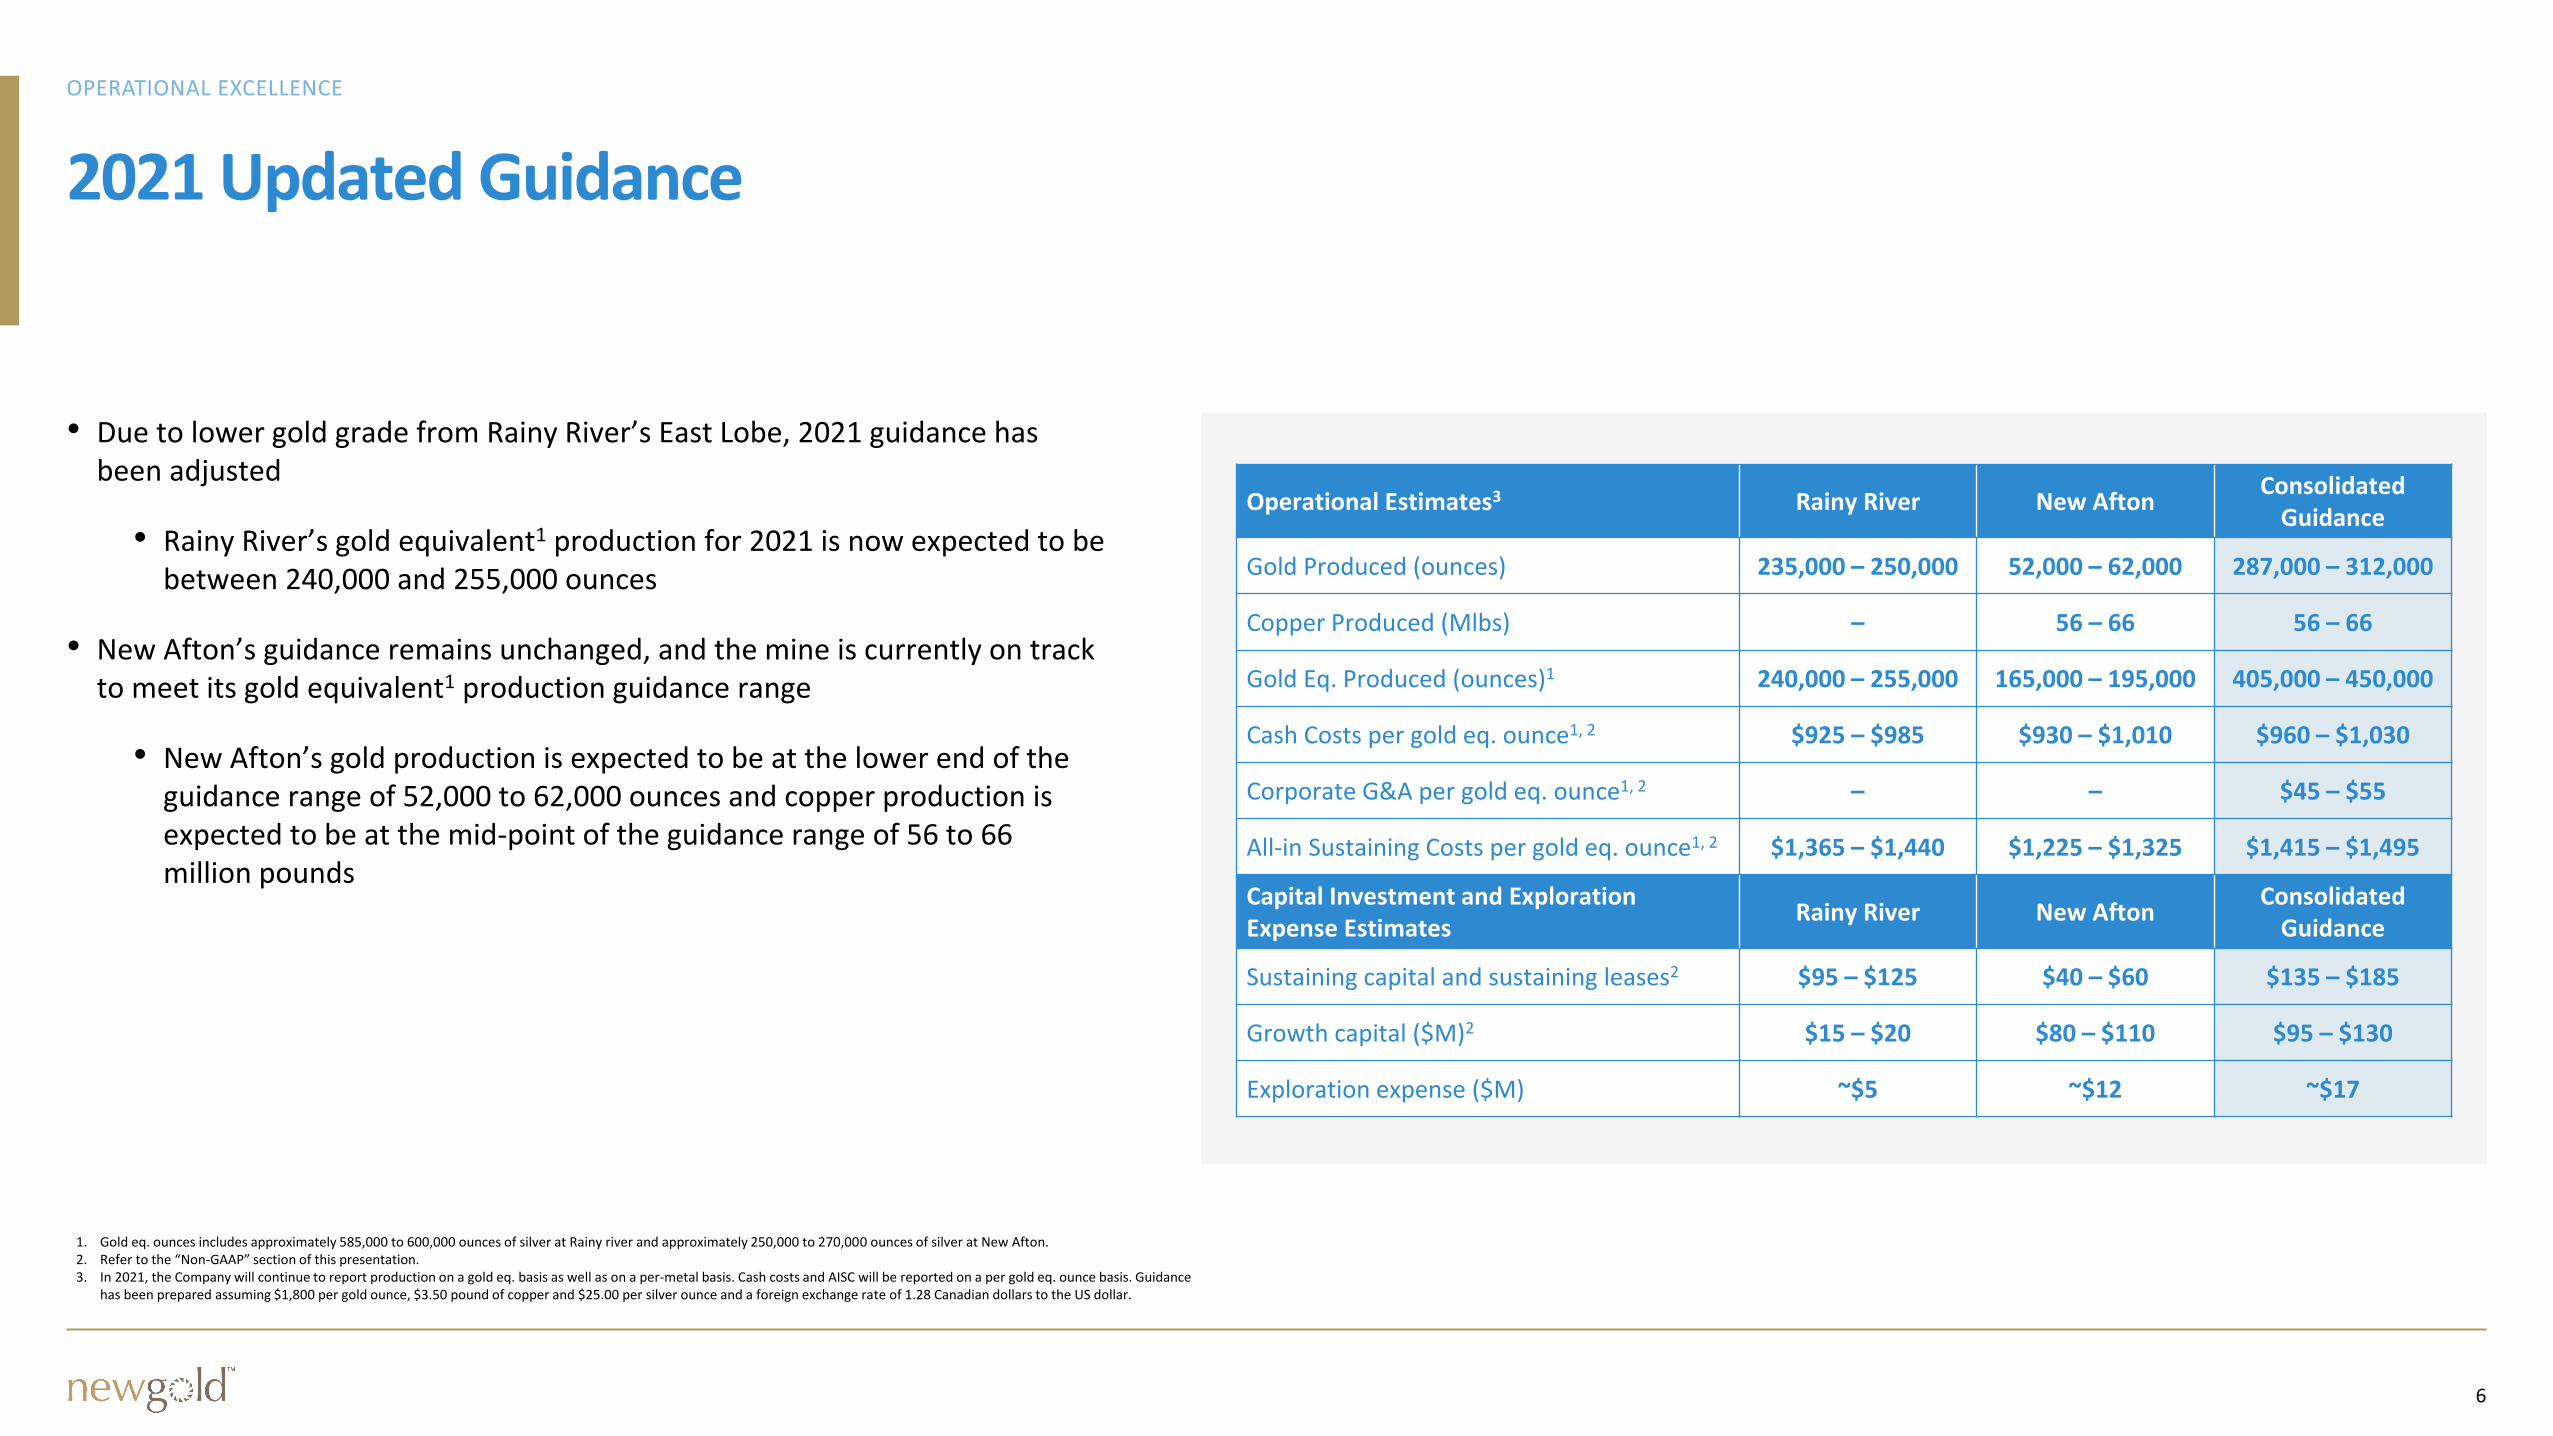
• Due to lower gold grade from Rainy River’s East Lobe, 2021 guidance has been adjusted
• Rainy River’s gold equivalent1 production for 2021 is now expected to be between 240,000 and 255,000 ounces
• New Afton’s guidance remains unchanged, and the mine is currently on track to meet its gold equivalent1 production guidance range
• New Afton’s gold production is expected to be at the lower end of the guidance range of 52,000 to 62,000 ounces and copper production is expected to be at the mid-point of the guidance range of 56 to 66 million pounds
2021 Updated Guidance
Operational Estimates3 Rainy River New AftonConsolidated
Guidance
Gold Produced (ounces) 235,000 – 250,000 52,000 – 62,000 287,000 – 312,000
Copper Produced (Mlbs) – 56 – 66 56 – 66
Gold Eq. Produced (ounces)1 240,000 – 255,000 165,000 – 195,000 405,000 – 450,000
Cash Costs per gold eq. ounce1, 2 $925 – $985 $930 – $1,010 $960 – $1,030
Corporate G&A per gold eq. ounce1, 2 – – $45 – $55
All-in Sustaining Costs per gold eq. ounce1, 2 $1,365 – $1,440 $1,225 – $1,325 $1,415 – $1,495
Capital Investment and Exploration Expense Estimates
Rainy River New AftonConsolidated
Guidance
Sustaining capital and sustaining leases2 $95 – $125 $40 – $60 $135 – $185
Growth capital ($M)2 $15 – $20 $80 – $110 $95 – $130
Exploration expense ($M) ~$5 ~$12 ~$17
1. Gold eq. ounces includes approximately 585,000 to 600,000 ounces of silver at Rainy river and approximately 250,000 to 270,000 ounces of silver at New Afton.2. Refer to the “Non-GAAP” section of this presentation. 3. In 2021, the Company will continue to report production on a gold eq. basis as well as on a per-metal basis. Cash costs and AISC will be reported on a per gold eq. ounce basis. Guidance
has been prepared assuming $1,800 per gold ounce, $3.50 pound of copper and $25.00 per silver ounce and a foreign exchange rate of 1.28 Canadian dollars to the US dollar.
7
Rainy River
8
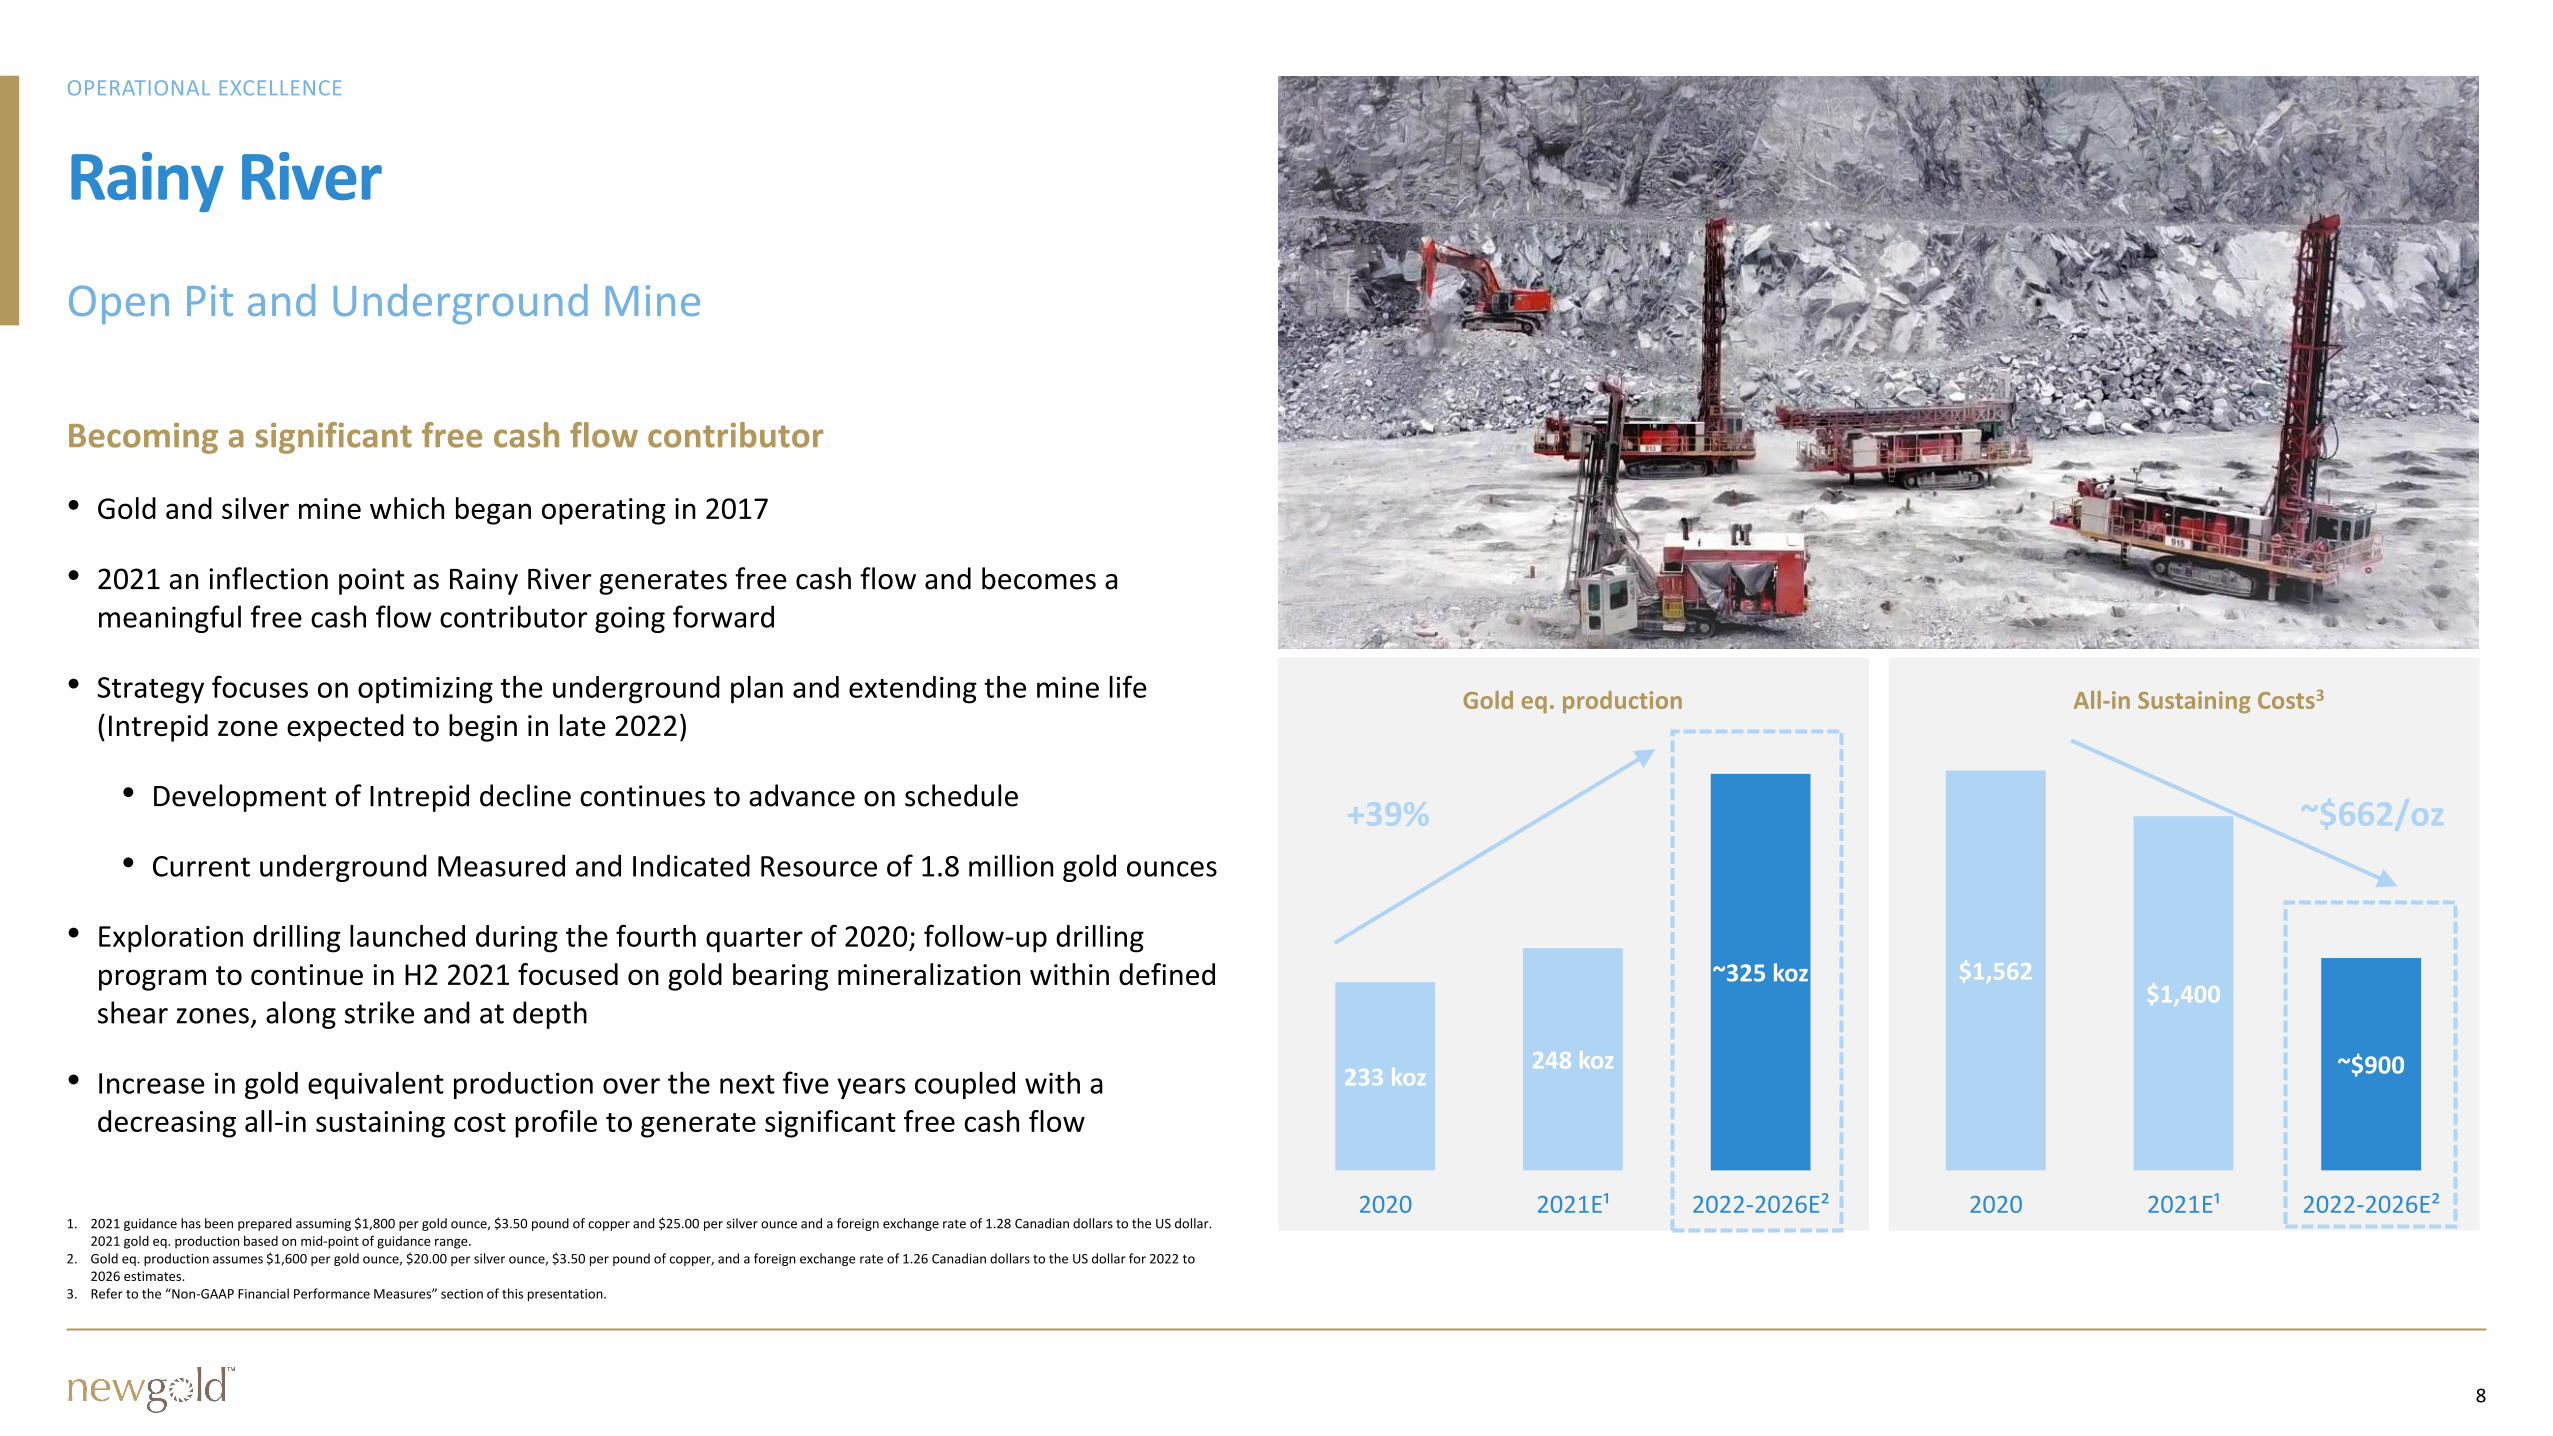
$1,562$1,400
~$900
2020 2021E¹ 2022-2026E²
All-in Sustaining Costs3
233 koz248 koz
~325 koz
2020 2021E¹ 2022-2026E²
Gold eq. production
Rainy River
Becoming a significant free cash flow contributor
1. 2021 guidance has been prepared assuming $1,800 per gold ounce, $3.50 pound of copper and $25.00 per silver ounce and a foreign exchange rate of 1.28 Canadian dollars to the US dollar. 2021 gold eq. production based on mid-point of guidance range.
2. Gold eq. production assumes $1,600 per gold ounce, $20.00 per silver ounce, $3.50 per pound of copper, and a foreign exchange rate of 1.26 Canadian dollars to the US dollar for 2022 to 2026 estimates.
3. Refer to the “Non-GAAP Financial Performance Measures” section of this presentation.
• Gold and silver mine which began operating in 2017
• 2021 an inflection point as Rainy River generates free cash flow and becomes a meaningful free cash flow contributor going forward
• Strategy focuses on optimizing the underground plan and extending the mine life (Intrepid zone expected to begin in late 2022)
• Development of Intrepid decline continues to advance on schedule
• Current underground Measured and Indicated Resource of 1.8 million gold ounces
• Exploration drilling launched during the fourth quarter of 2020; follow-up drilling program to continue in H2 2021 focused on gold bearing mineralization within defined shear zones, along strike and at depth
• Increase in gold equivalent production over the next five years coupled with a decreasing all-in sustaining cost profile to generate significant free cash flow
+39% ~$662/oz
9
Rainy River
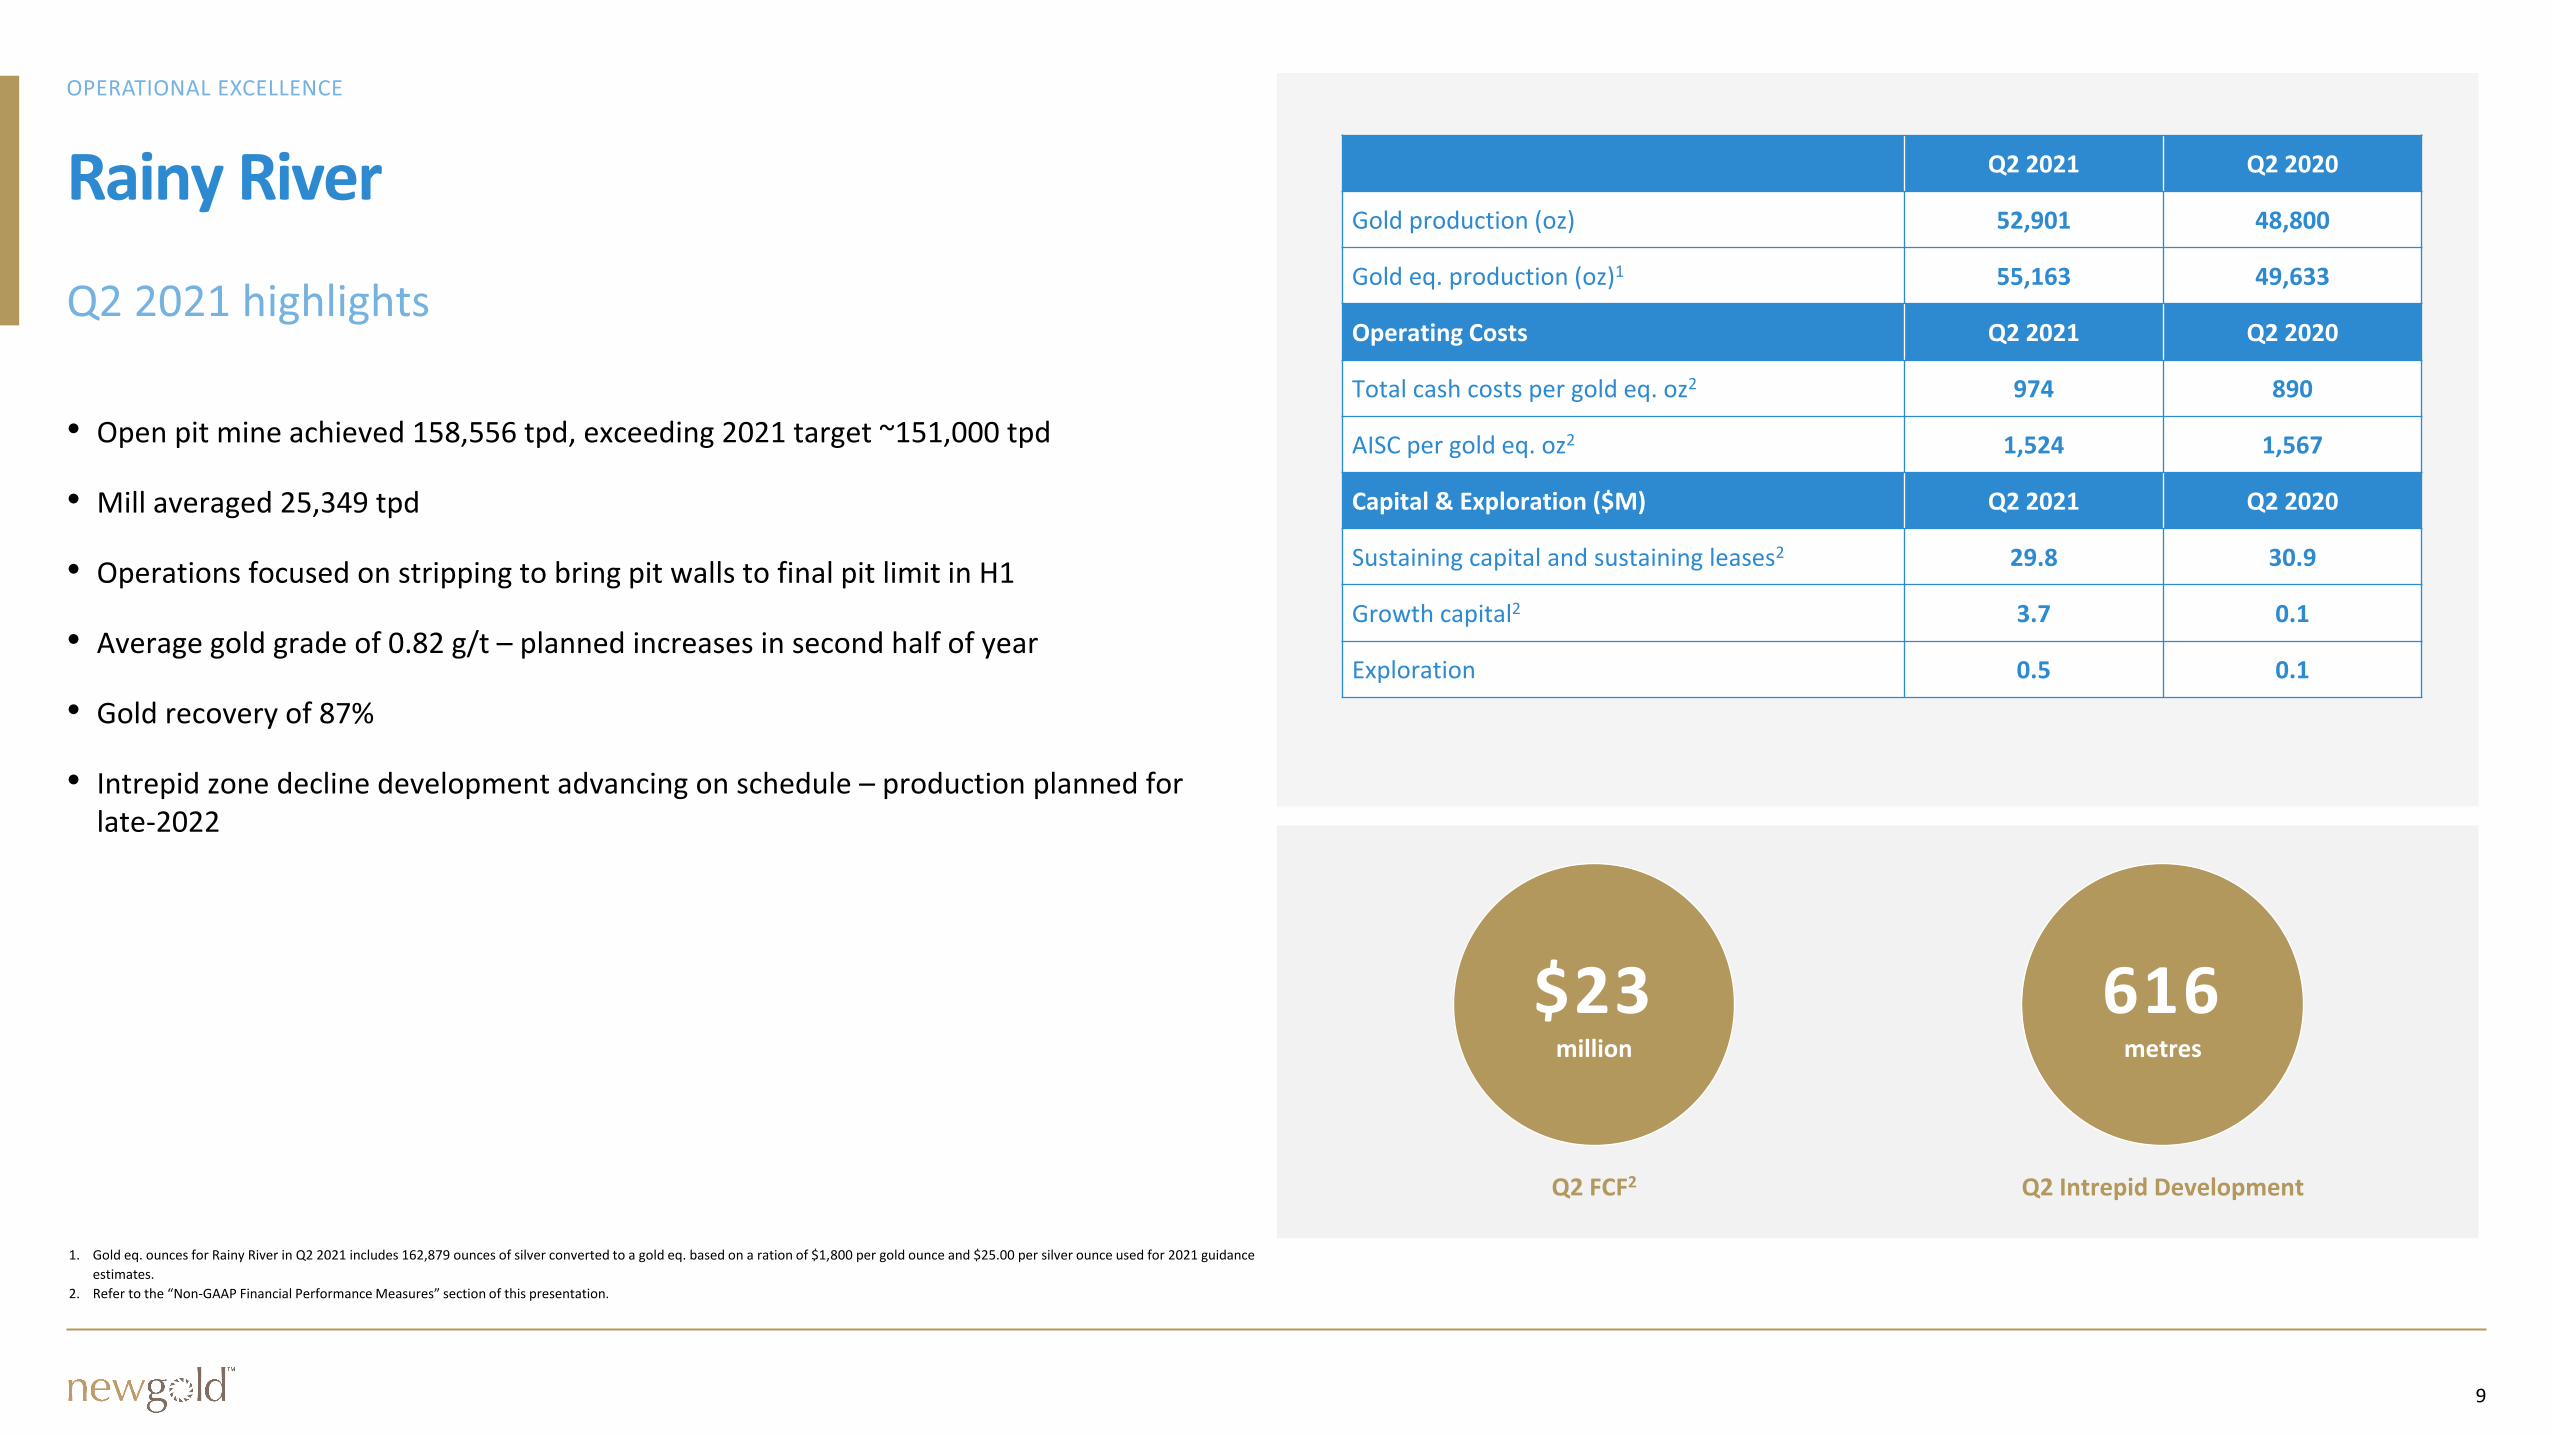
• Open pit mine achieved 158,556 tpd, exceeding 2021 target ~151,000 tpd
• Mill averaged 25,349 tpd
• Operations focused on stripping to bring pit walls to final pit limit in H1
• Average gold grade of 0.82 g/t – planned increases in second half of year
• Gold recovery of 87%
• Intrepid zone decline development advancing on schedule – production planned for late-2022
Q2 2021 Q2 2020
Gold production (oz) 52,901 48,800
Gold eq. production (oz)1 55,163 49,633
Operating Costs Q2 2021 Q2 2020
Total cash costs per gold eq. oz2 974 890
AISC per gold eq. oz2 1,524 1,567
Capital & Exploration ($M) Q2 2021 Q2 2020
Sustaining capital and sustaining leases2 29.8 30.9
Growth capital2 3.7 0.1
Exploration 0.5 0.1
Q2 Intrepid Development
616metres
Q2 FCF2
$23million
1. Gold eq. ounces for Rainy River in Q2 2021 includes 162,879 ounces of silver converted to a gold eq. based on a ration of $1,800 per gold ounce and $25.00 per silver ounce used for 2021 guidance
estimates.
2. Refer to the “Non-GAAP Financial Performance Measures” section of this presentation.
10
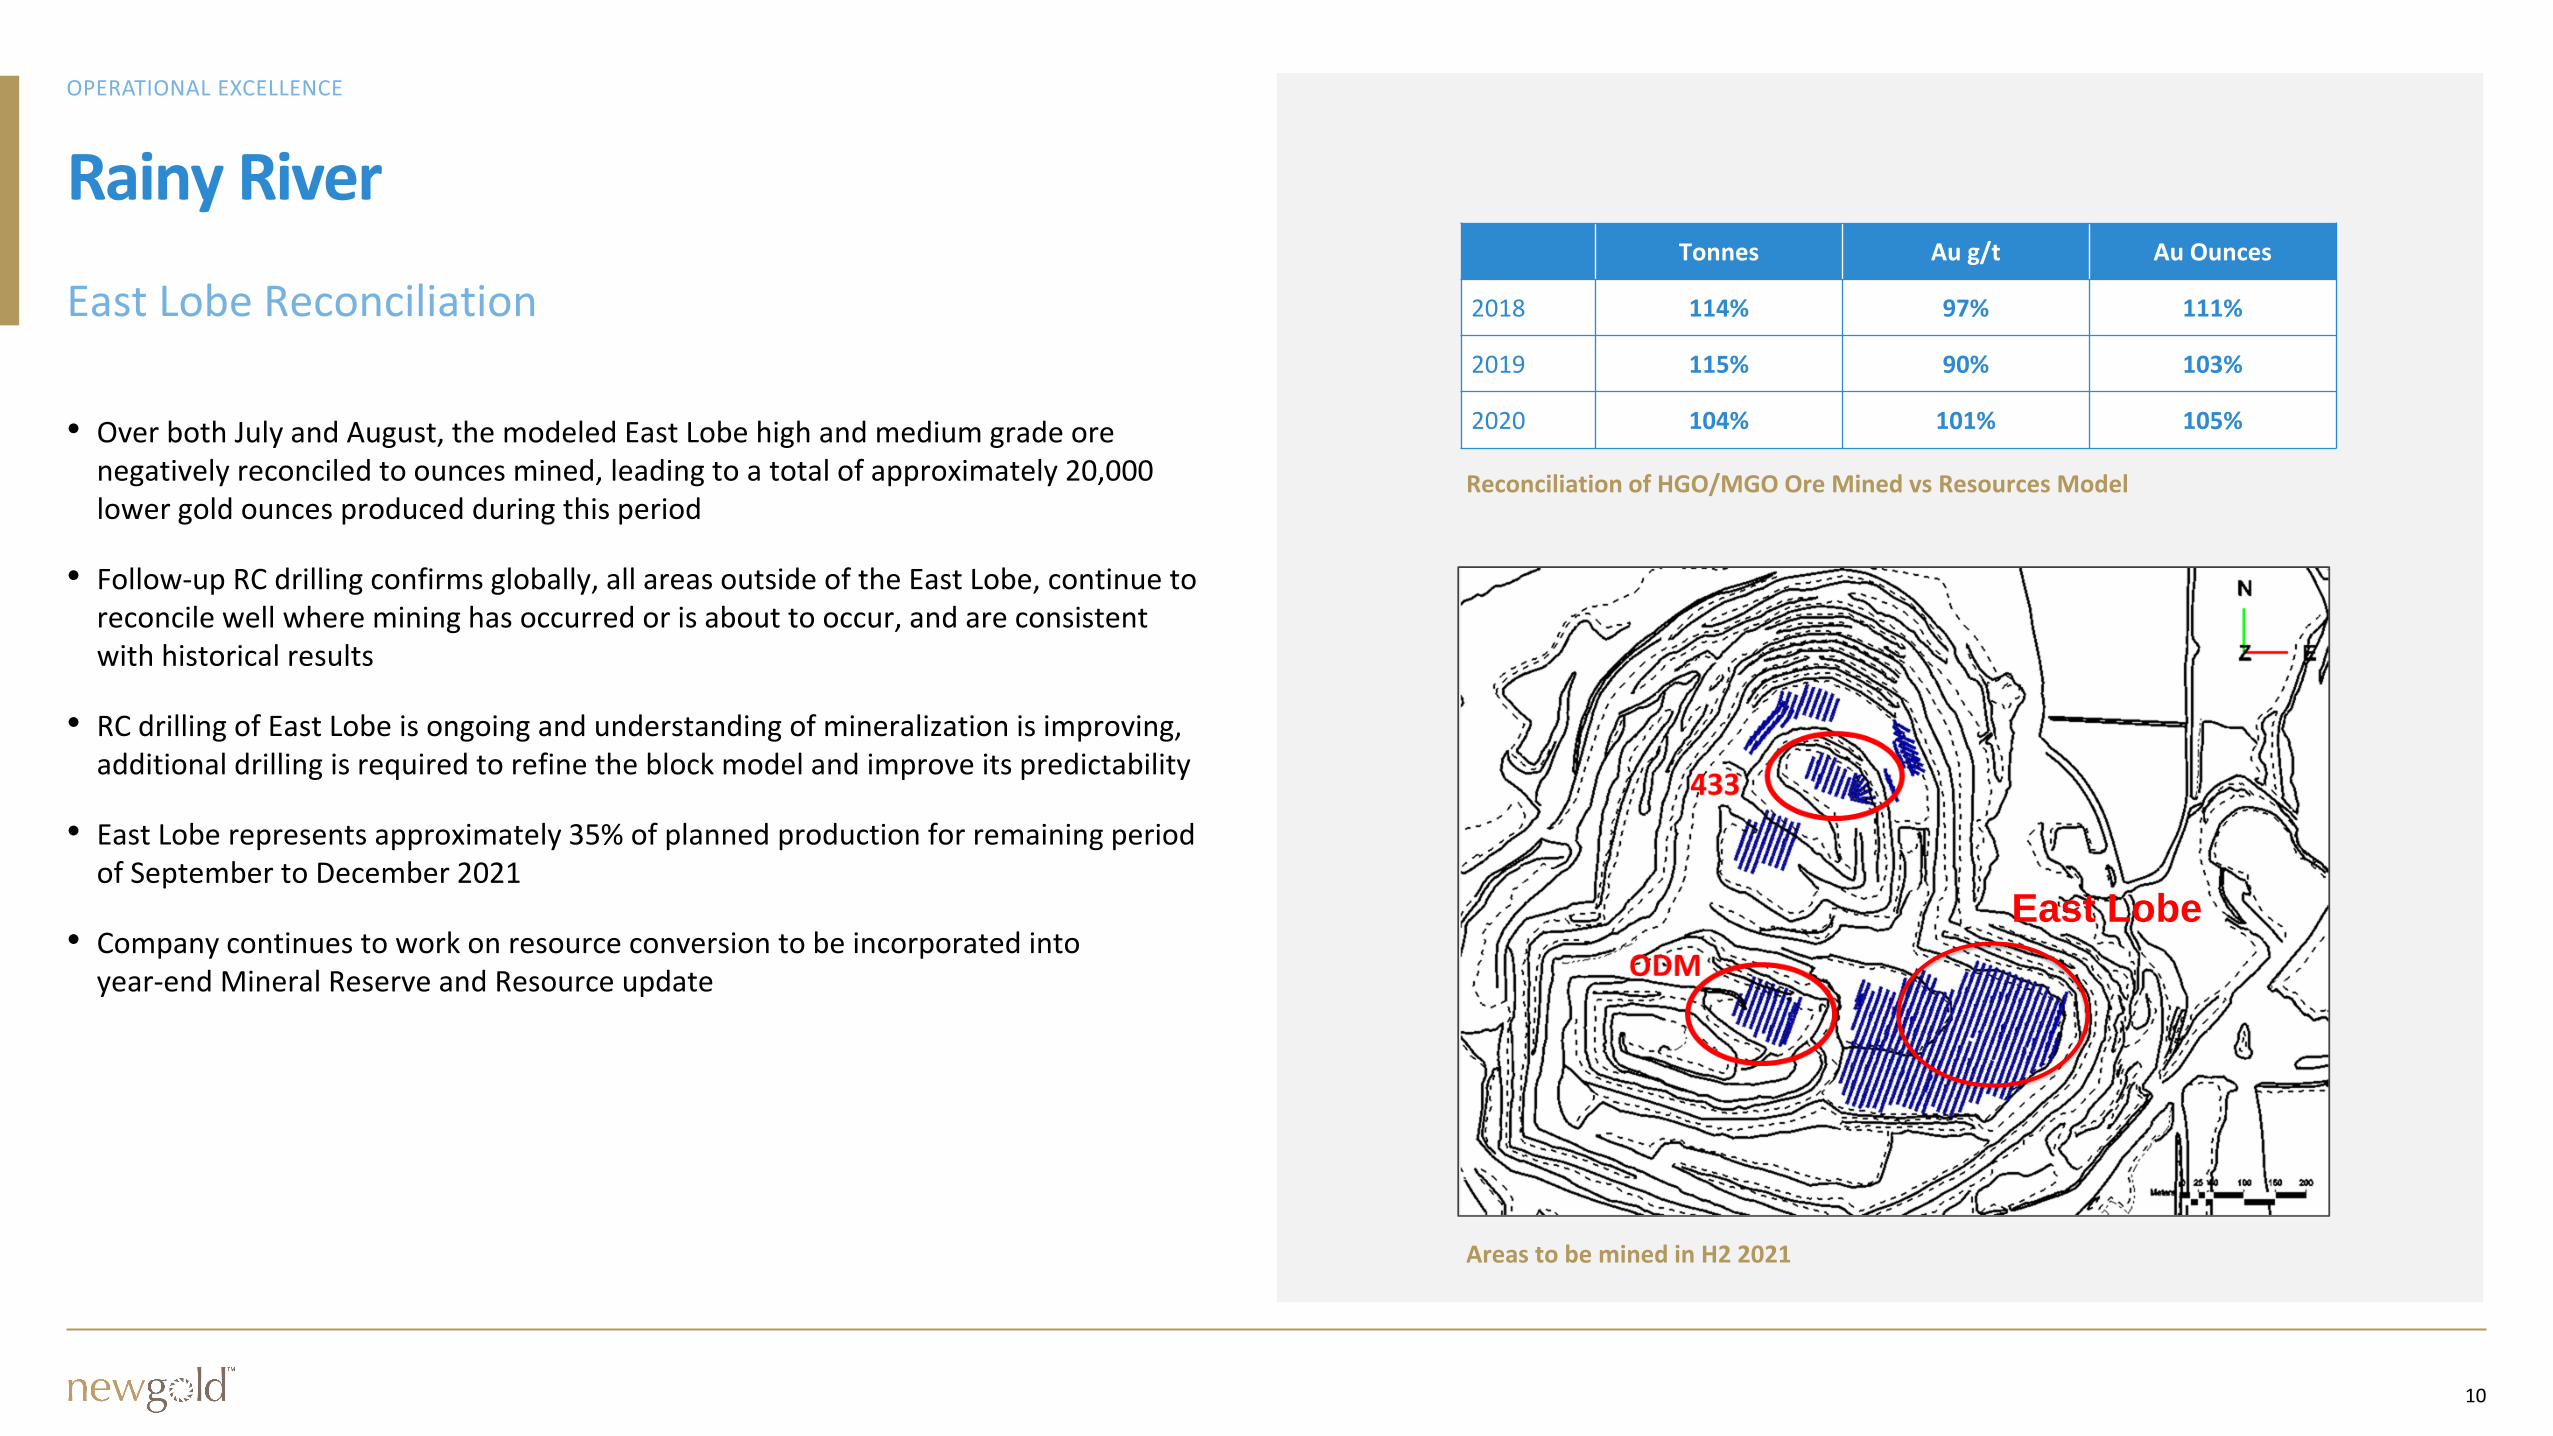
East Lobe
• Over both July and August, the modeled East Lobe high and medium grade ore negatively reconciled to ounces mined, leading to a total of approximately 20,000 lower gold ounces produced during this period
• Follow-up RC drilling confirms globally, all areas outside of the East Lobe, continue to reconcile well where mining has occurred or is about to occur, and are consistent with historical results
• RC drilling of East Lobe is ongoing and understanding of mineralization is improving, additional drilling is required to refine the block model and improve its predictability
• East Lobe represents approximately 35% of planned production for remaining period of September to December 2021
• Company continues to work on resource conversion to be incorporated into year-end Mineral Reserve and Resource update
Reconciliation of HGO/MGO Ore Mined vs Resources Model
Areas to be mined in H2 2021
Tonnes Au g/t Au Ounces
2018 114% 97% 111%
2019 115% 90% 103%
2020 104% 101% 105%
Rainy River
11
New Afton
12
New Afton
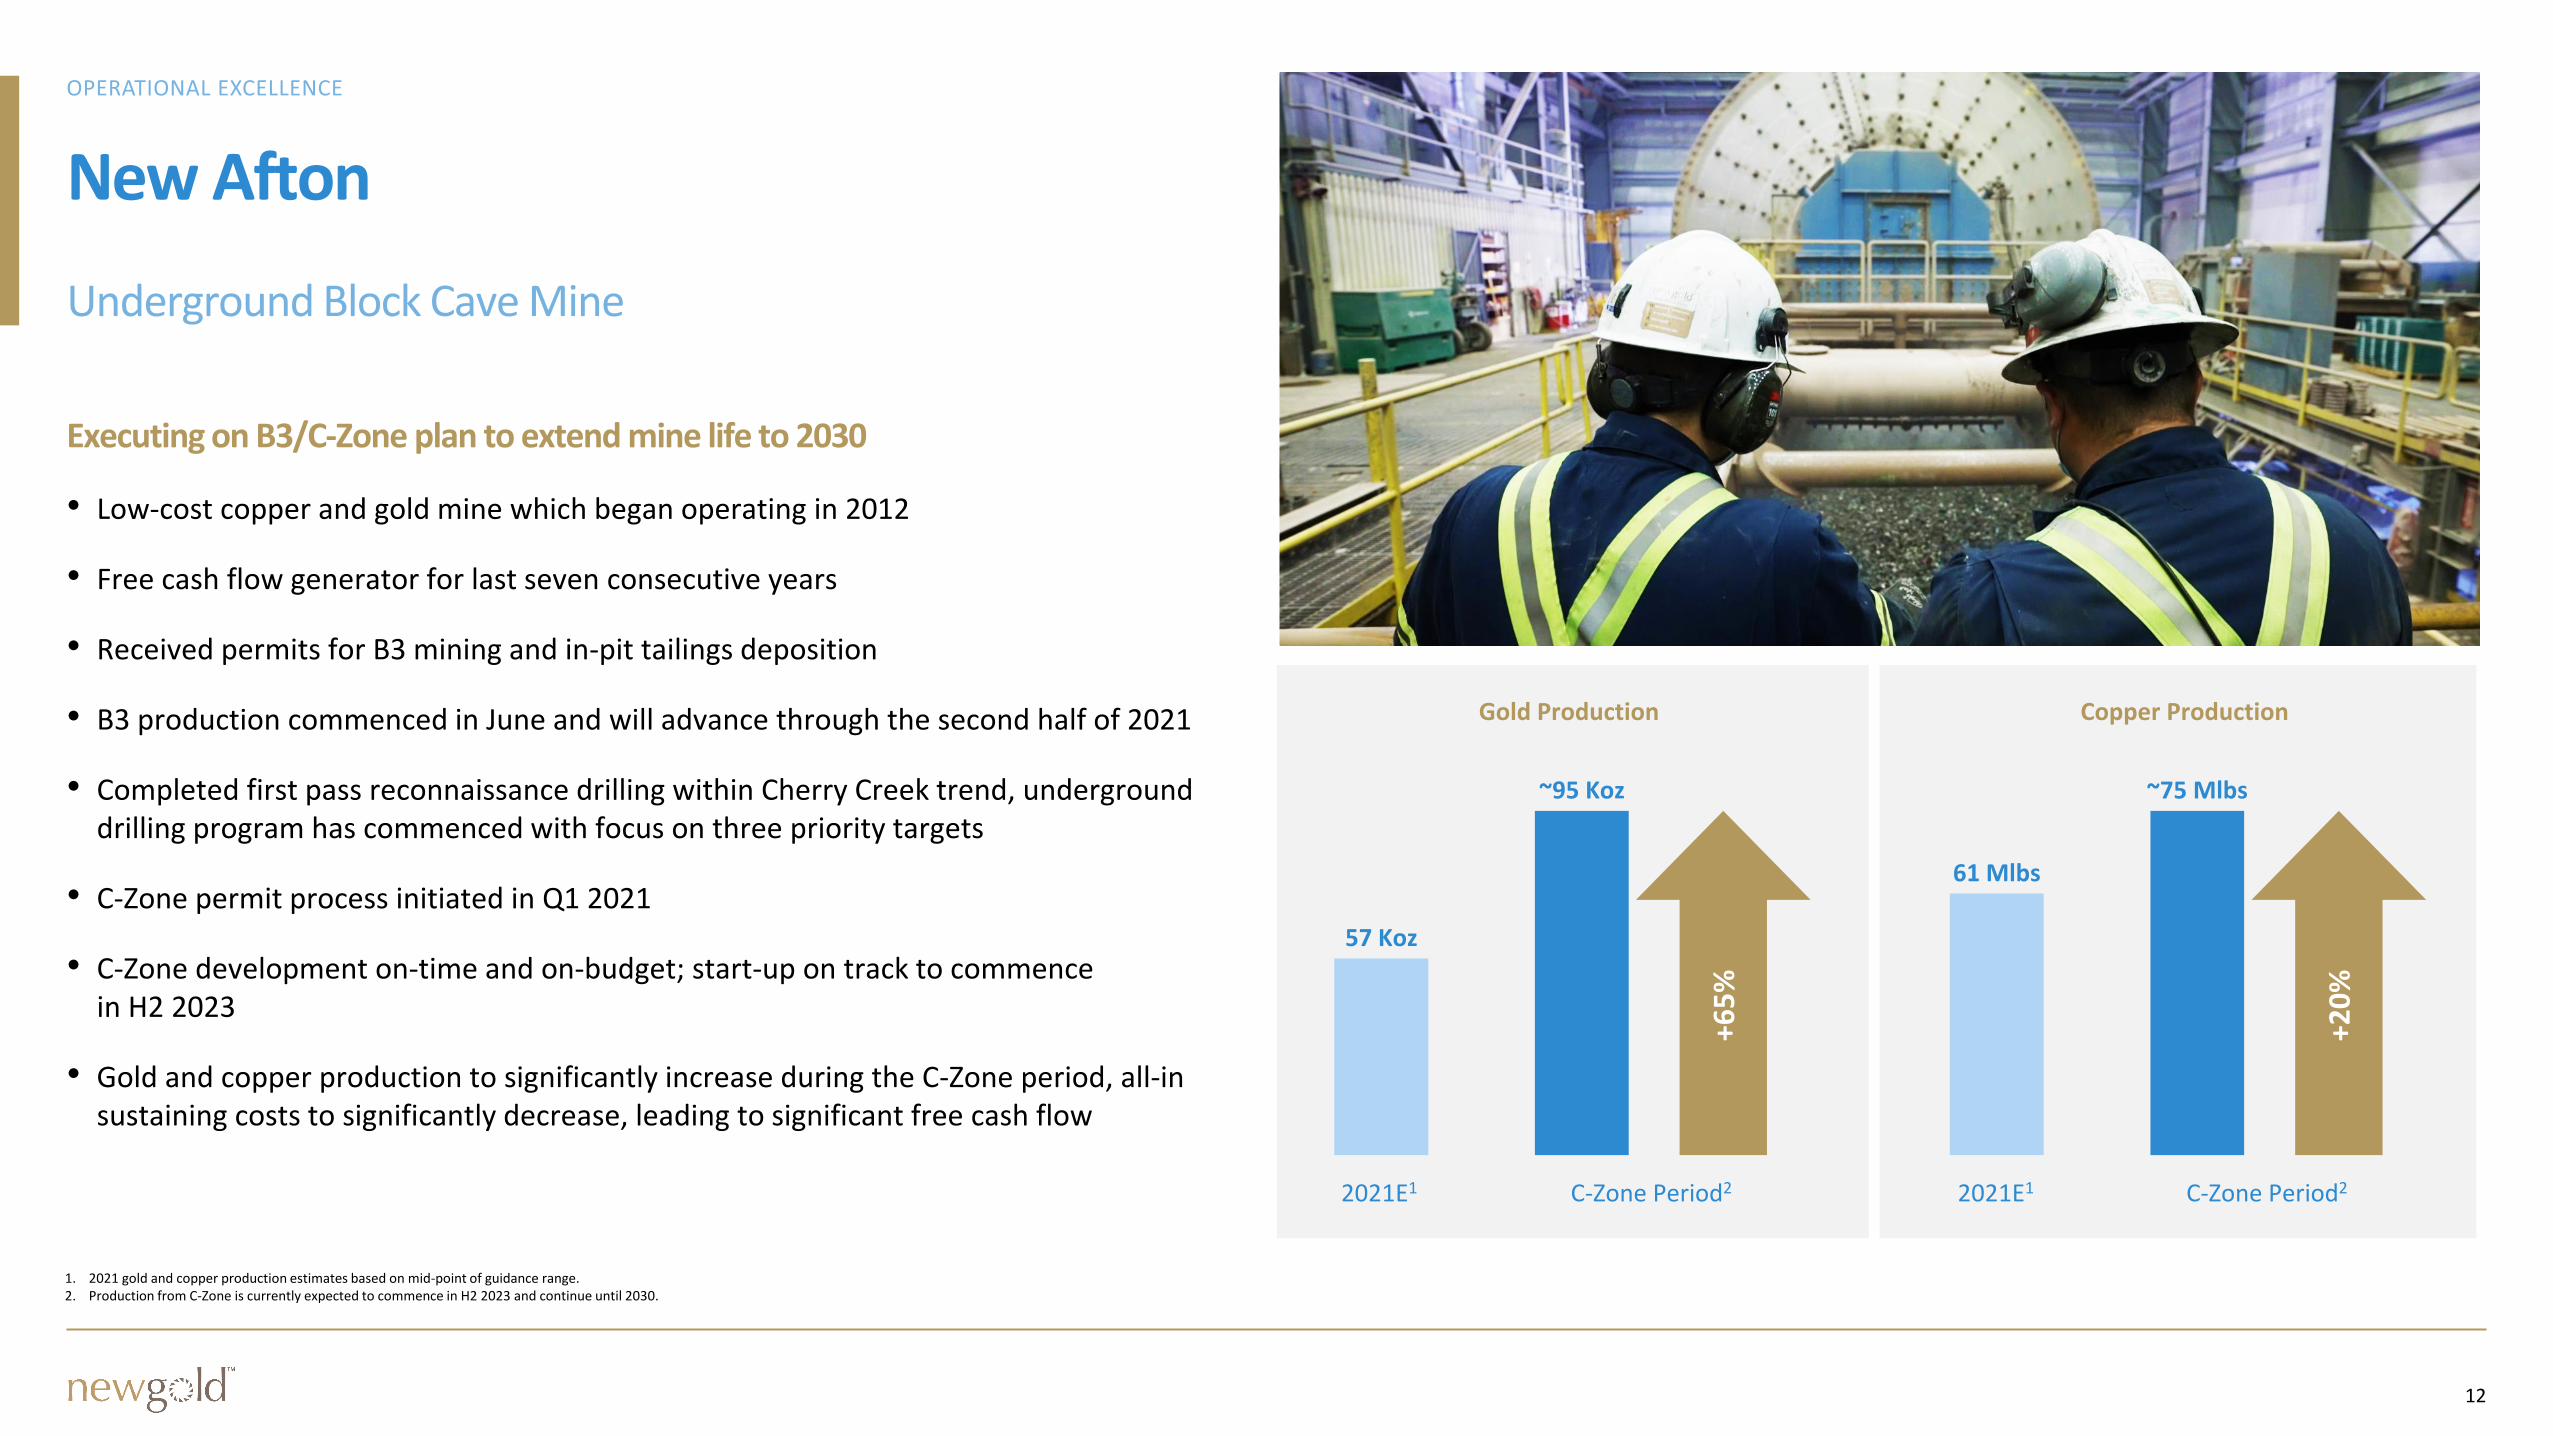
Executing on B3/C-Zone plan to extend mine life to 2030
1. 2021 gold and copper production estimates based on mid-point of guidance range. 2. Production from C-Zone is currently expected to commence in H2 2023 and continue until 2030.
• Low-cost copper and gold mine which began operating in 2012
• Free cash flow generator for last seven consecutive years
• Received permits for B3 mining and in-pit tailings deposition
• B3 production commenced in June and will advance through the second half of 2021
• Completed first pass reconnaissance drilling within Cherry Creek trend, underground drilling program has commenced with focus on three priority targets
• C-Zone permit process initiated in Q1 2021
• C-Zone development on-time and on-budget; start-up on track to commence in H2 2023
• Gold and copper production to significantly increase during the C-Zone period, all-in sustaining costs to significantly decrease, leading to significant free cash flow
+65
%
~95 Koz
57 Koz
Gold Production
2021E1 C-Zone Period2
+20
%
~75 Mlbs
61 Mlbs
Copper Production
2021E1 C-Zone Period2
13
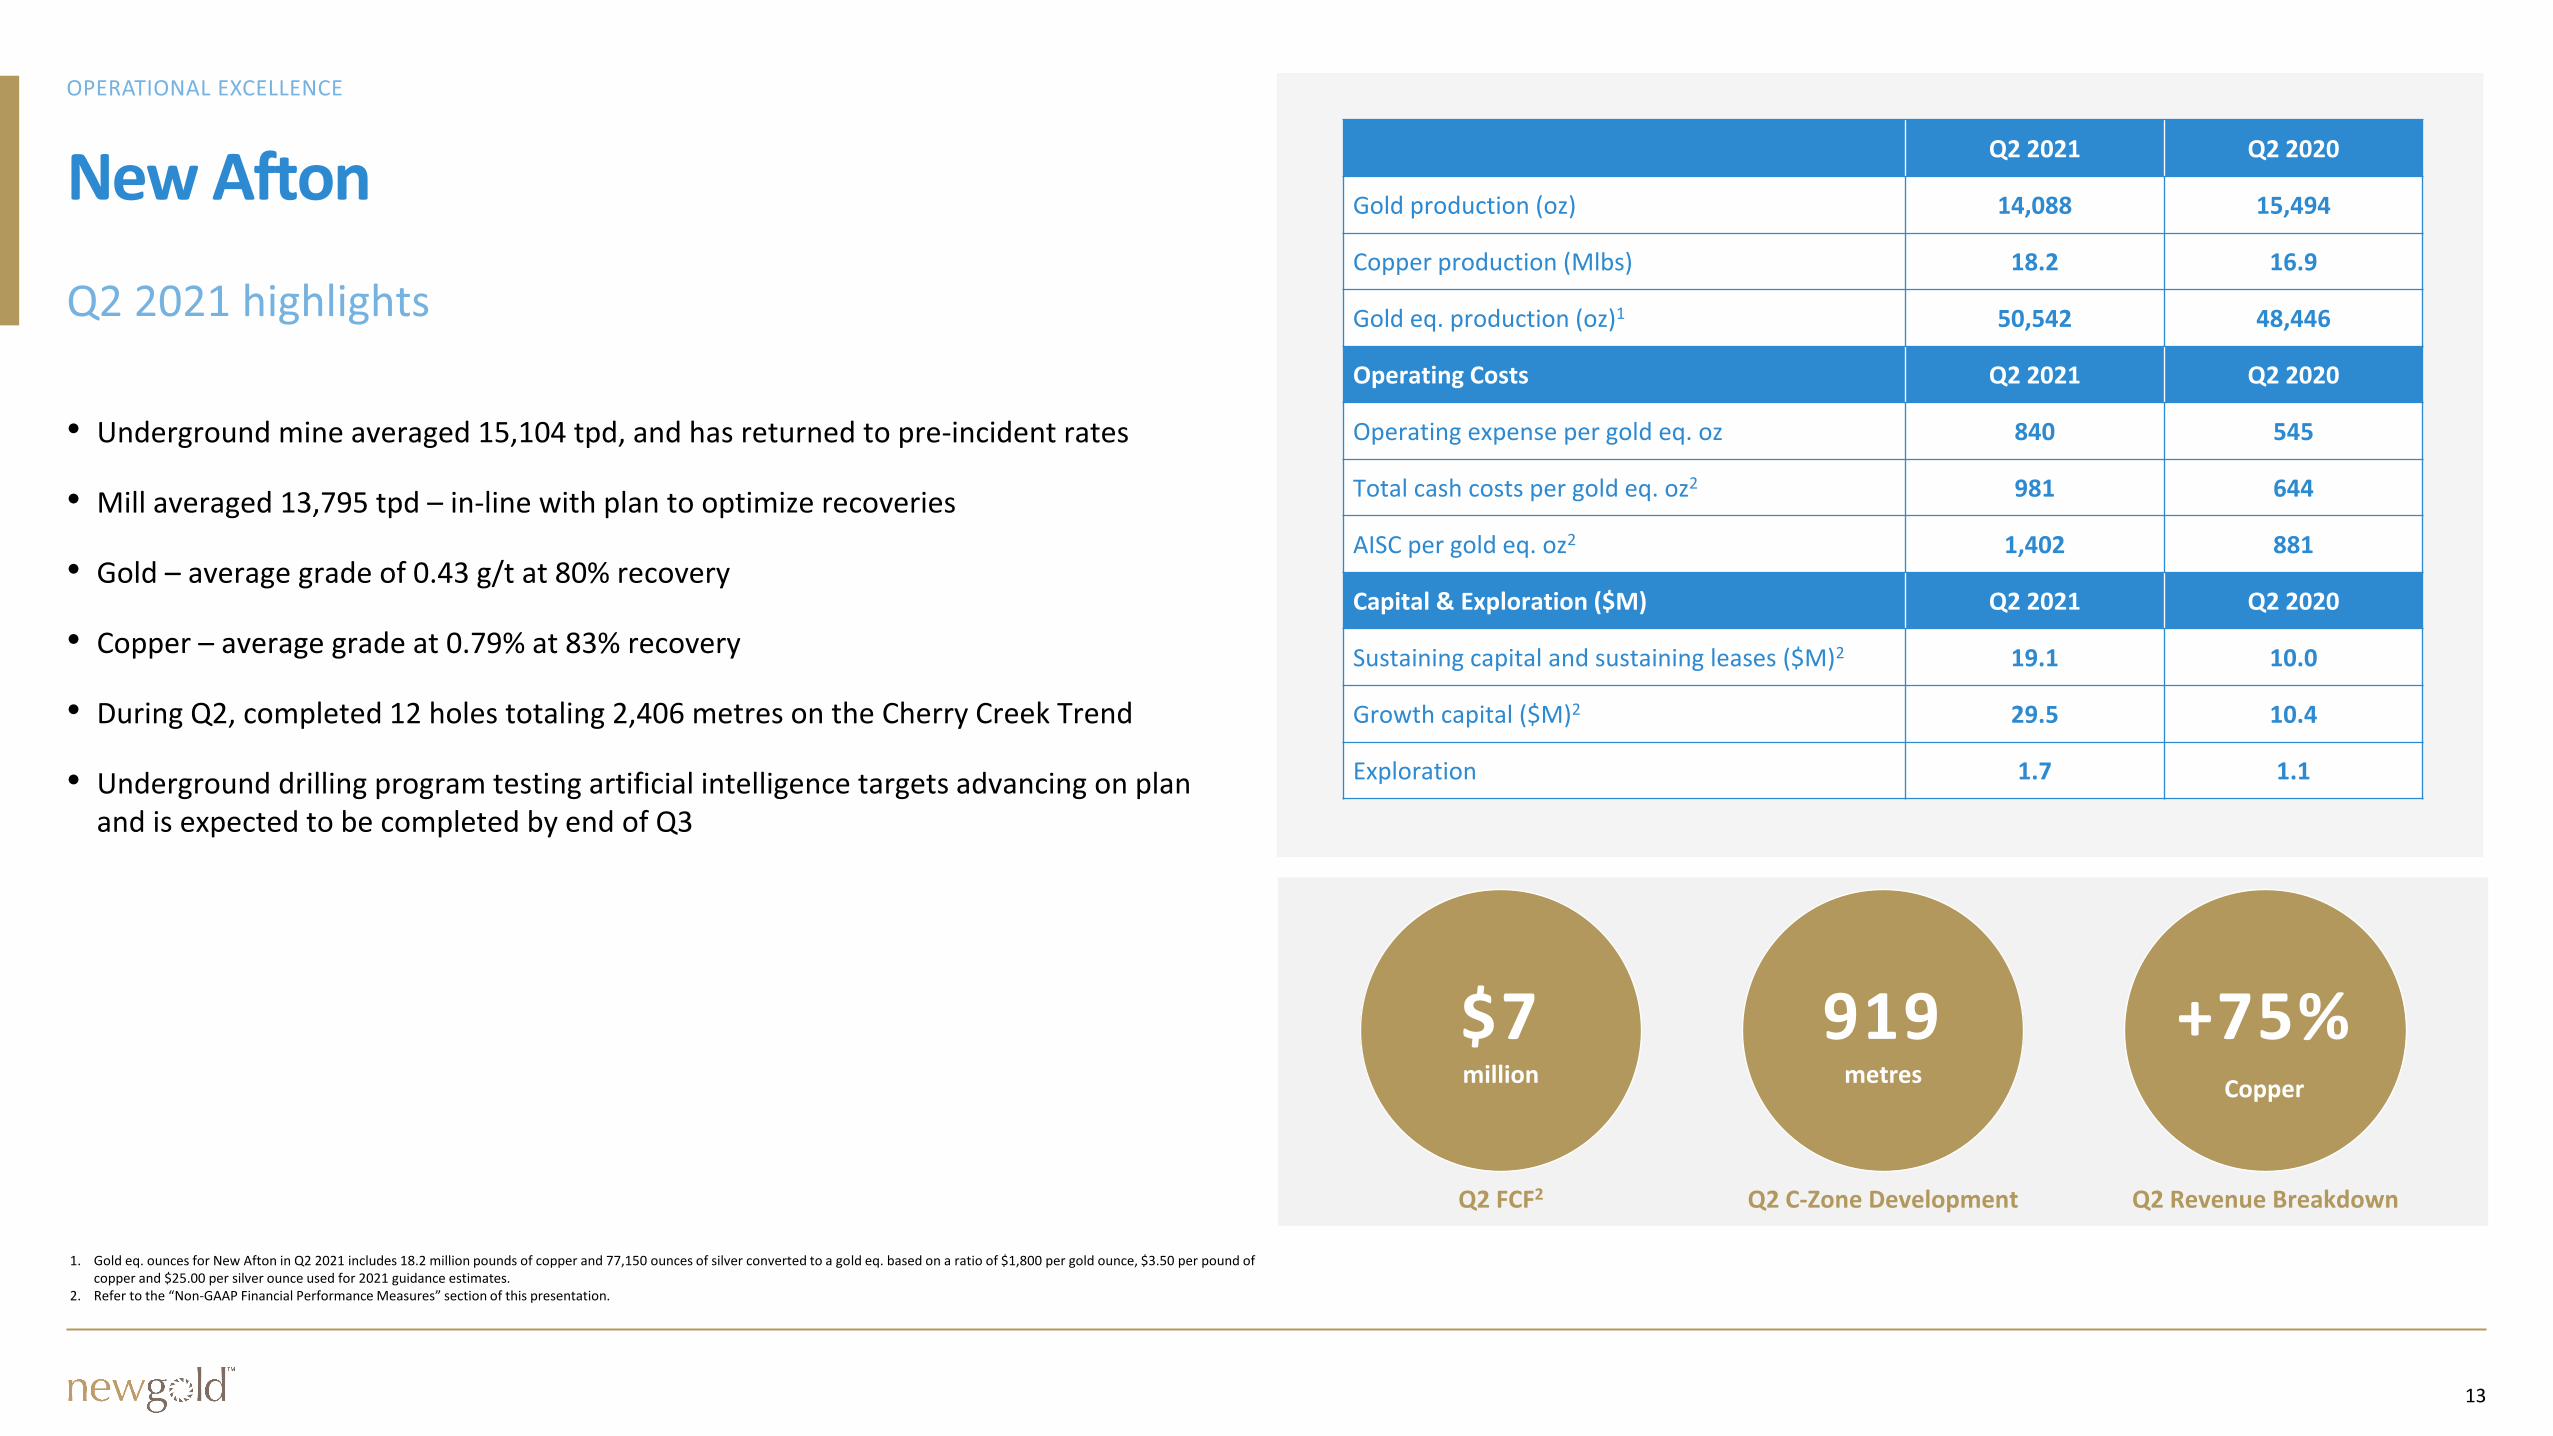
New Afton
1. Gold eq. ounces for New Afton in Q2 2021 includes 18.2 million pounds of copper and 77,150 ounces of silver converted to a gold eq. based on a ratio of $1,800 per gold ounce, $3.50 per pound of copper and $25.00 per silver ounce used for 2021 guidance estimates.
2. Refer to the “Non-GAAP Financial Performance Measures” section of this presentation.
• Underground mine averaged 15,104 tpd, and has returned to pre-incident rates
• Mill averaged 13,795 tpd – in-line with plan to optimize recoveries
• Gold – average grade of 0.43 g/t at 80% recovery
• Copper – average grade at 0.79% at 83% recovery
• During Q2, completed 12 holes totaling 2,406 metres on the Cherry Creek Trend
• Underground drilling program testing artificial intelligence targets advancing on plan and is expected to be completed by end of Q3
Q2 2021 Q2 2020
Gold production (oz) 14,088 15,494
Copper production (Mlbs) 18.2 16.9
Gold eq. production (oz)1 50,542 48,446
Operating Costs Q2 2021 Q2 2020
Operating expense per gold eq. oz 840 545
Total cash costs per gold eq. oz2 981 644
AISC per gold eq. oz2 1,402 881
Capital & Exploration ($M) Q2 2021 Q2 2020
Sustaining capital and sustaining leases ($M)2 19.1 10.0
Growth capital ($M)2 29.5 10.4
Exploration 1.7 1.1
Q2 C-Zone Development
919metres
Q2 FCF2
$7million
Q2 Revenue Breakdown
+75%Copper
14
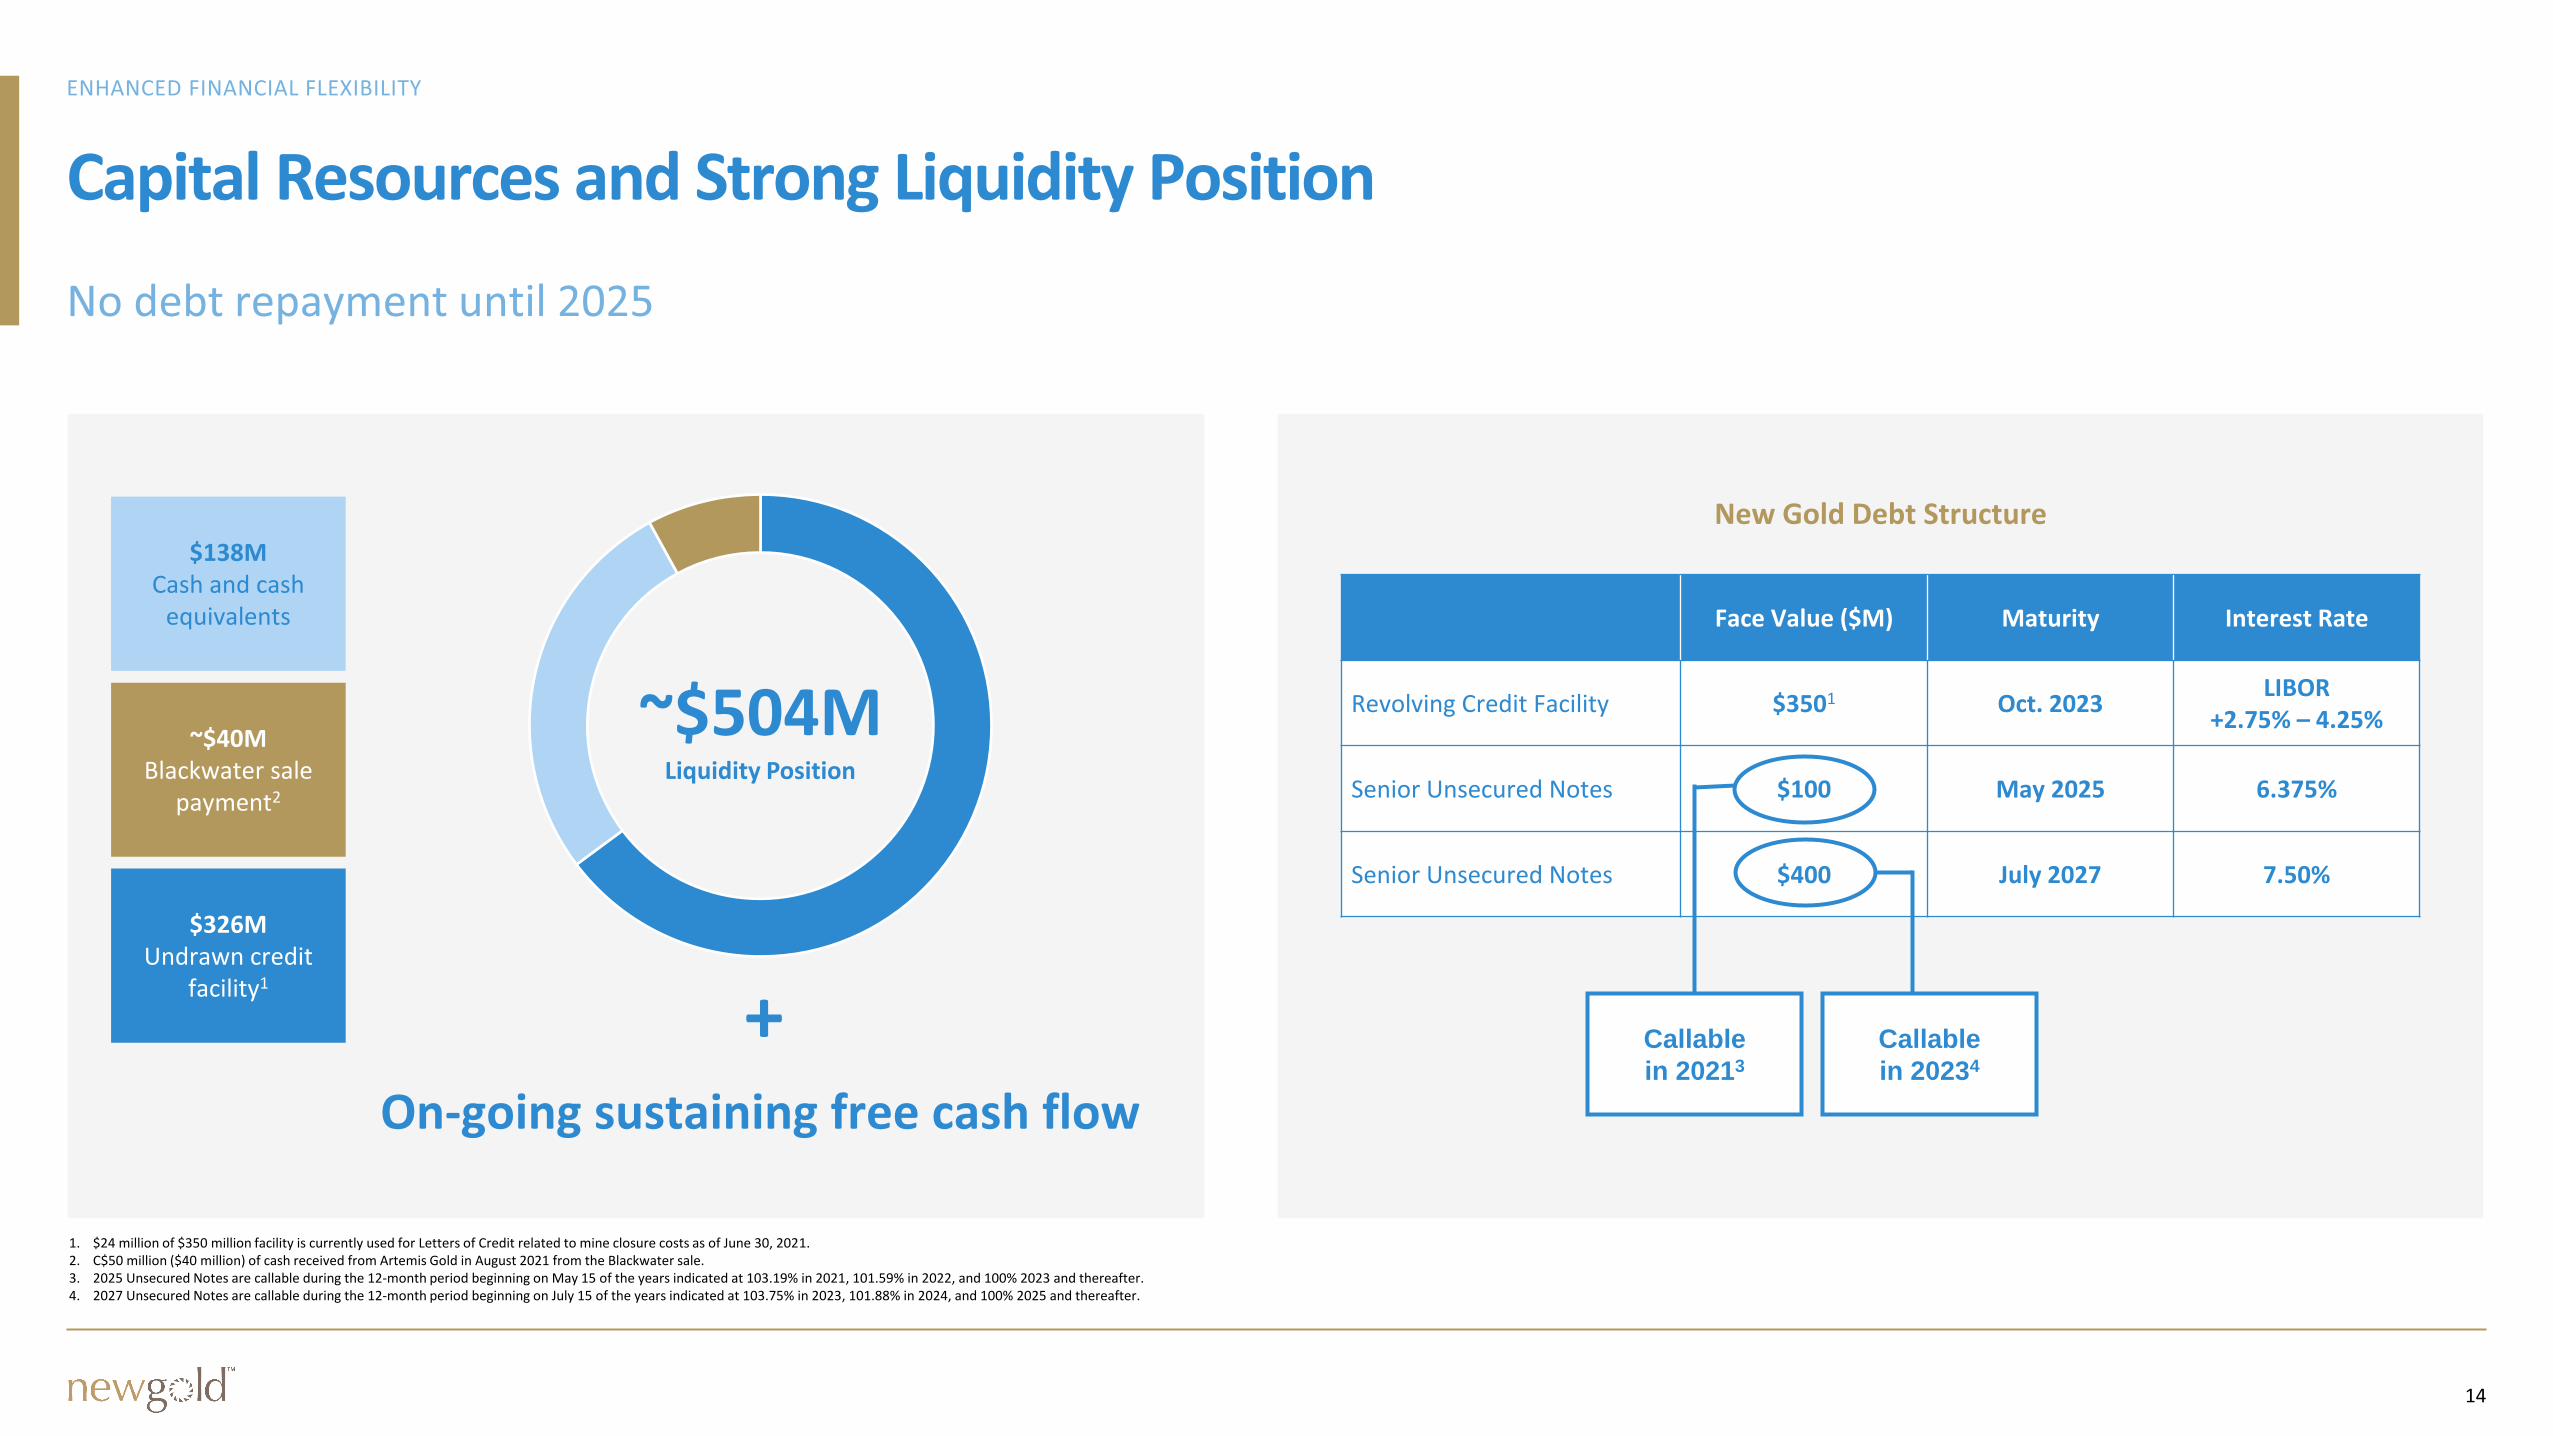
Capital Resources and Strong Liquidity Position
1. $24 million of $350 million facility is currently used for Letters of Credit related to mine closure costs as of June 30, 2021.2. C$50 million ($40 million) of cash received from Artemis Gold in August 2021 from the Blackwater sale.3. 2025 Unsecured Notes are callable during the 12-month period beginning on May 15 of the years indicated at 103.19% in 2021, 101.59% in 2022, and 100% 2023 and thereafter.4. 2027 Unsecured Notes are callable during the 12-month period beginning on July 15 of the years indicated at 103.75% in 2023, 101.88% in 2024, and 100% 2025 and thereafter.
New Gold Debt Structure
Face Value ($M) Maturity Interest Rate
Revolving Credit Facility $3501 Oct. 2023LIBOR
+2.75% – 4.25%
Senior Unsecured Notes $100 May 2025 6.375%
Senior Unsecured Notes $400 July 2027 7.50%
~$504MLiquidity Position
$138MCash and cash
equivalents
$326MUndrawn credit
facility1
On-going sustaining free cash flow
+ Callable
in 20213
Callable
in 20234
~$40MBlackwater sale
payment2
15
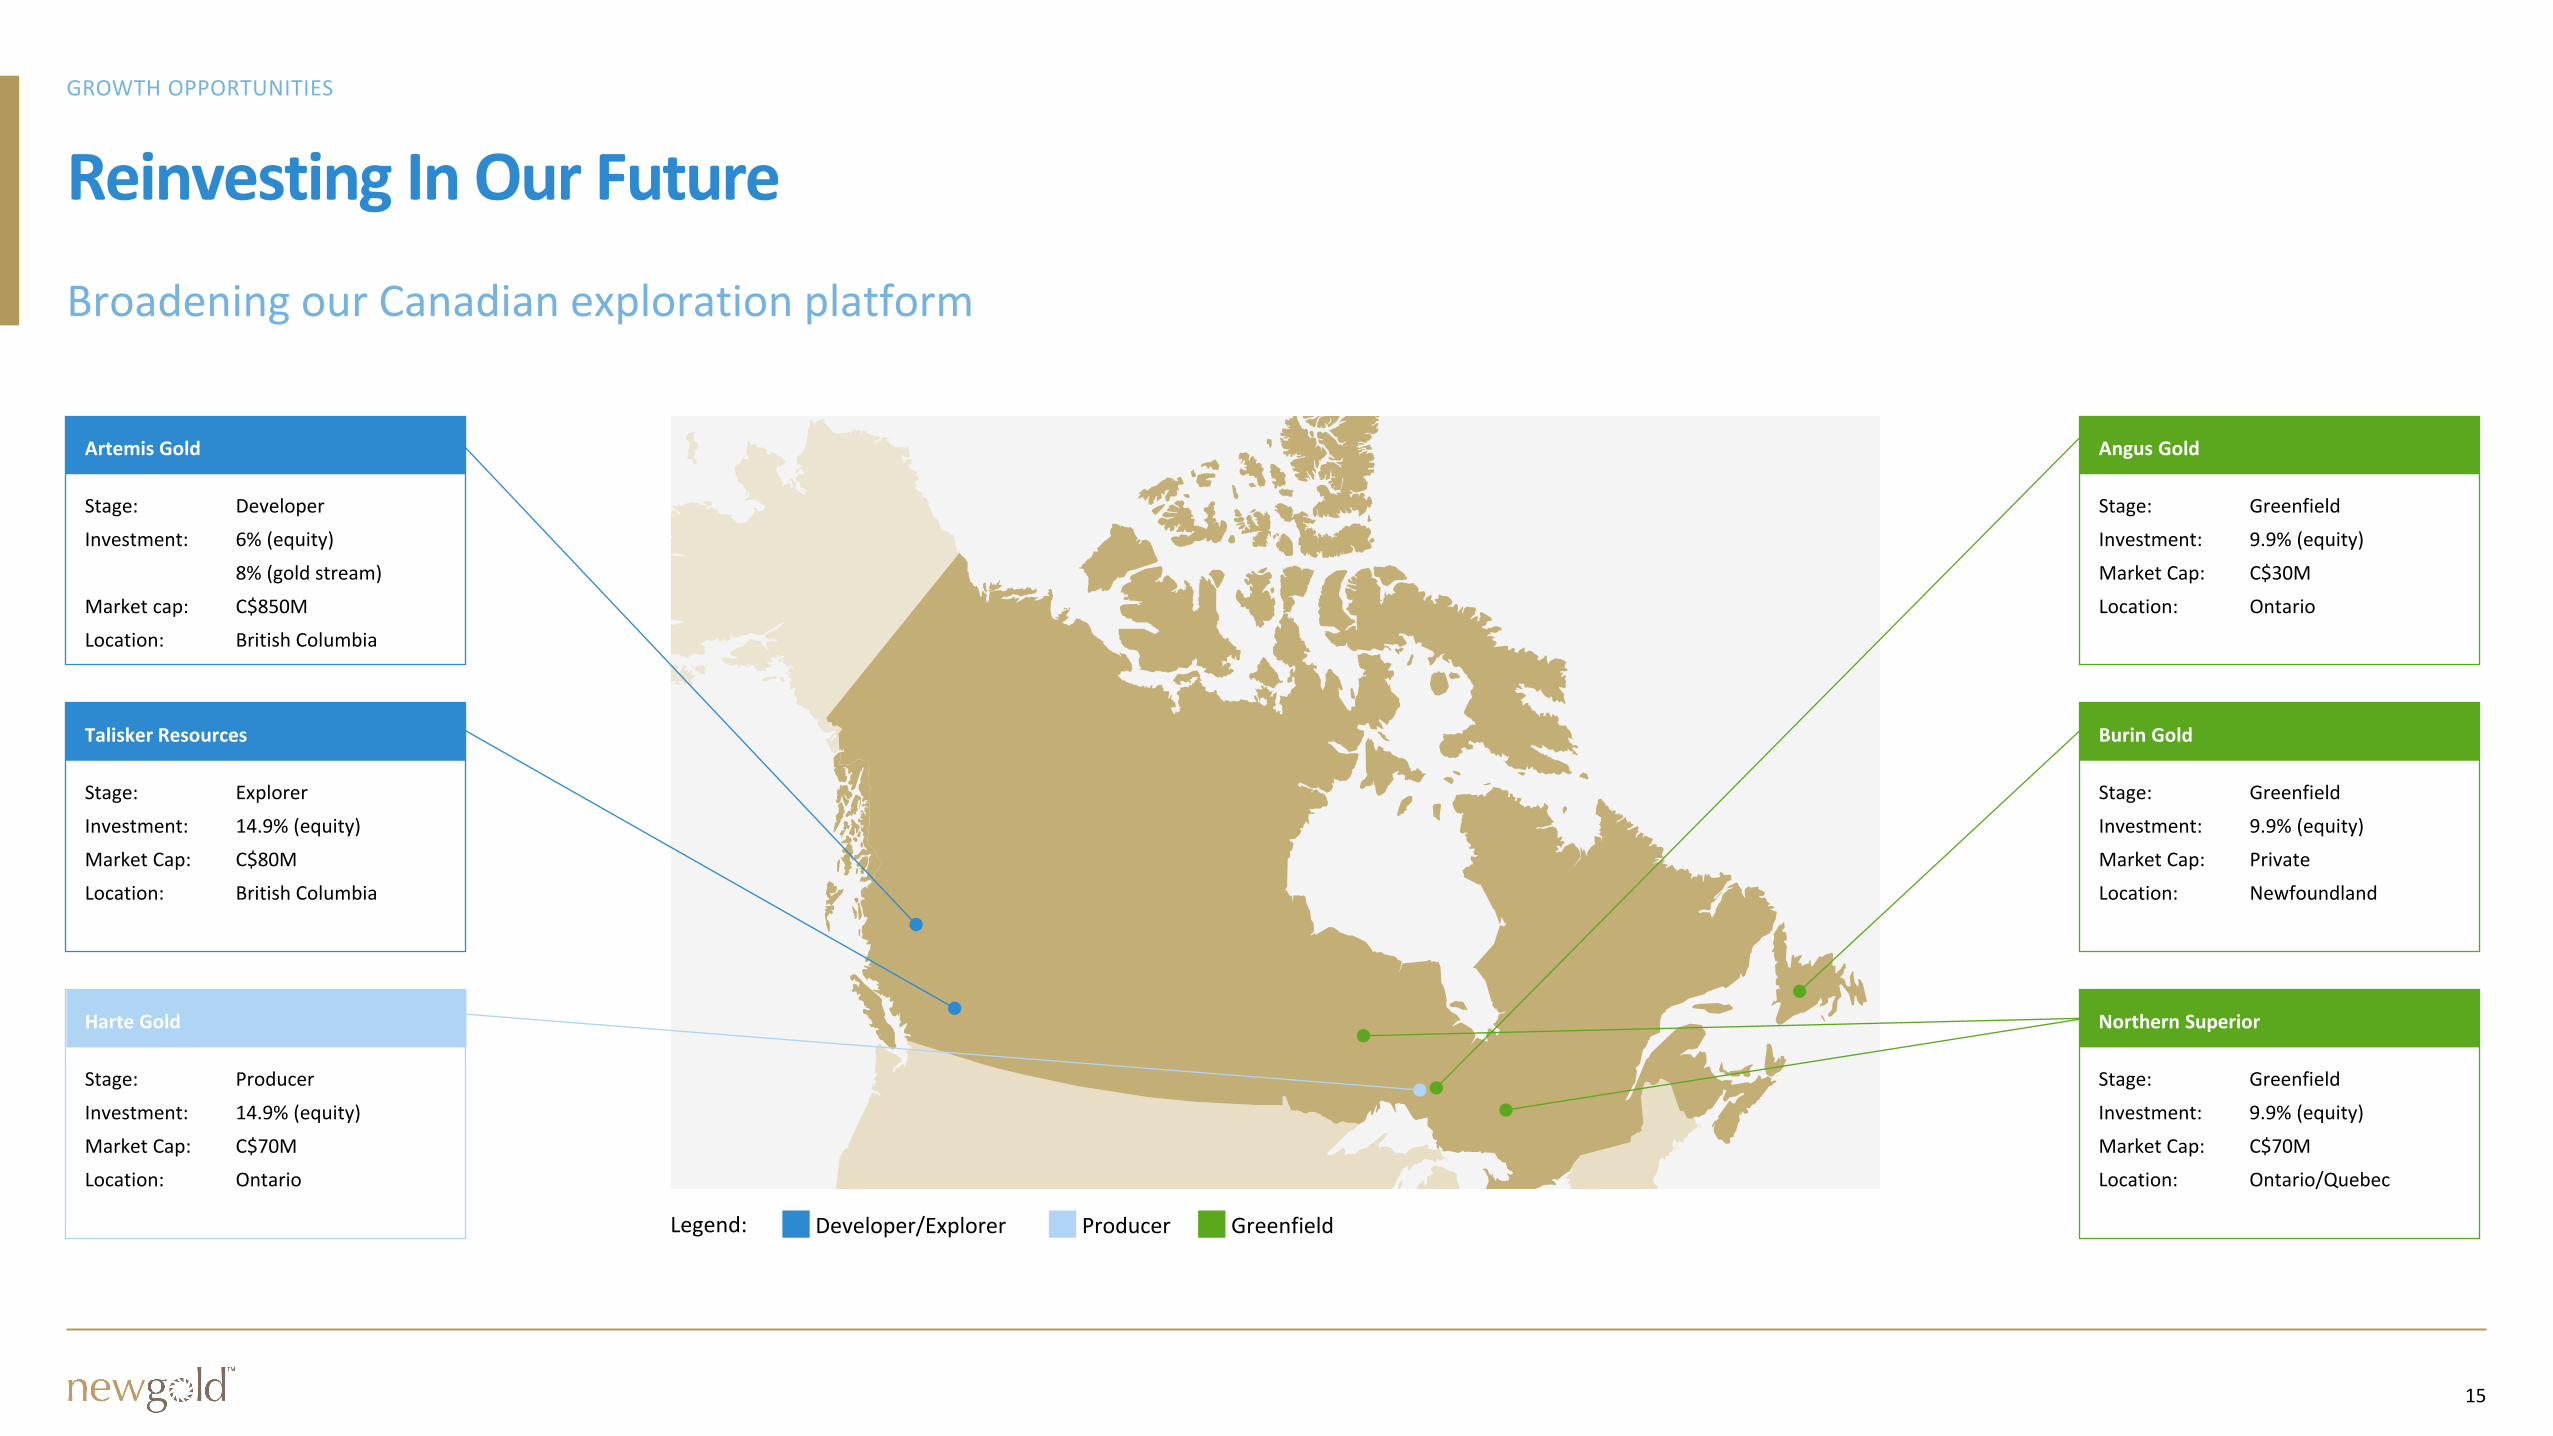
Harte Gold
Stage: Producer
Investment: 14.9% (equity)
Market Cap: C$70M
Location: Ontario
Reinvesting In Our Future
Angus Gold
Stage: Greenfield
Investment: 9.9% (equity)
Market Cap: C$30M
Location: Ontario
Burin Gold
Stage: Greenfield
Investment: 9.9% (equity)
Market Cap: Private
Location: Newfoundland
Northern Superior
Stage: Greenfield
Investment: 9.9% (equity)
Market Cap: C$70M
Location: Ontario/Quebec
Artemis Gold
Stage: Developer
Investment: 6% (equity)
8% (gold stream)
Market cap: C$850M
Location: British Columbia
Talisker Resources
Stage: Explorer
Investment: 14.9% (equity)
Market Cap: C$80M
Location: British Columbia
Legend: Developer/Explorer Producer Greenfield
16
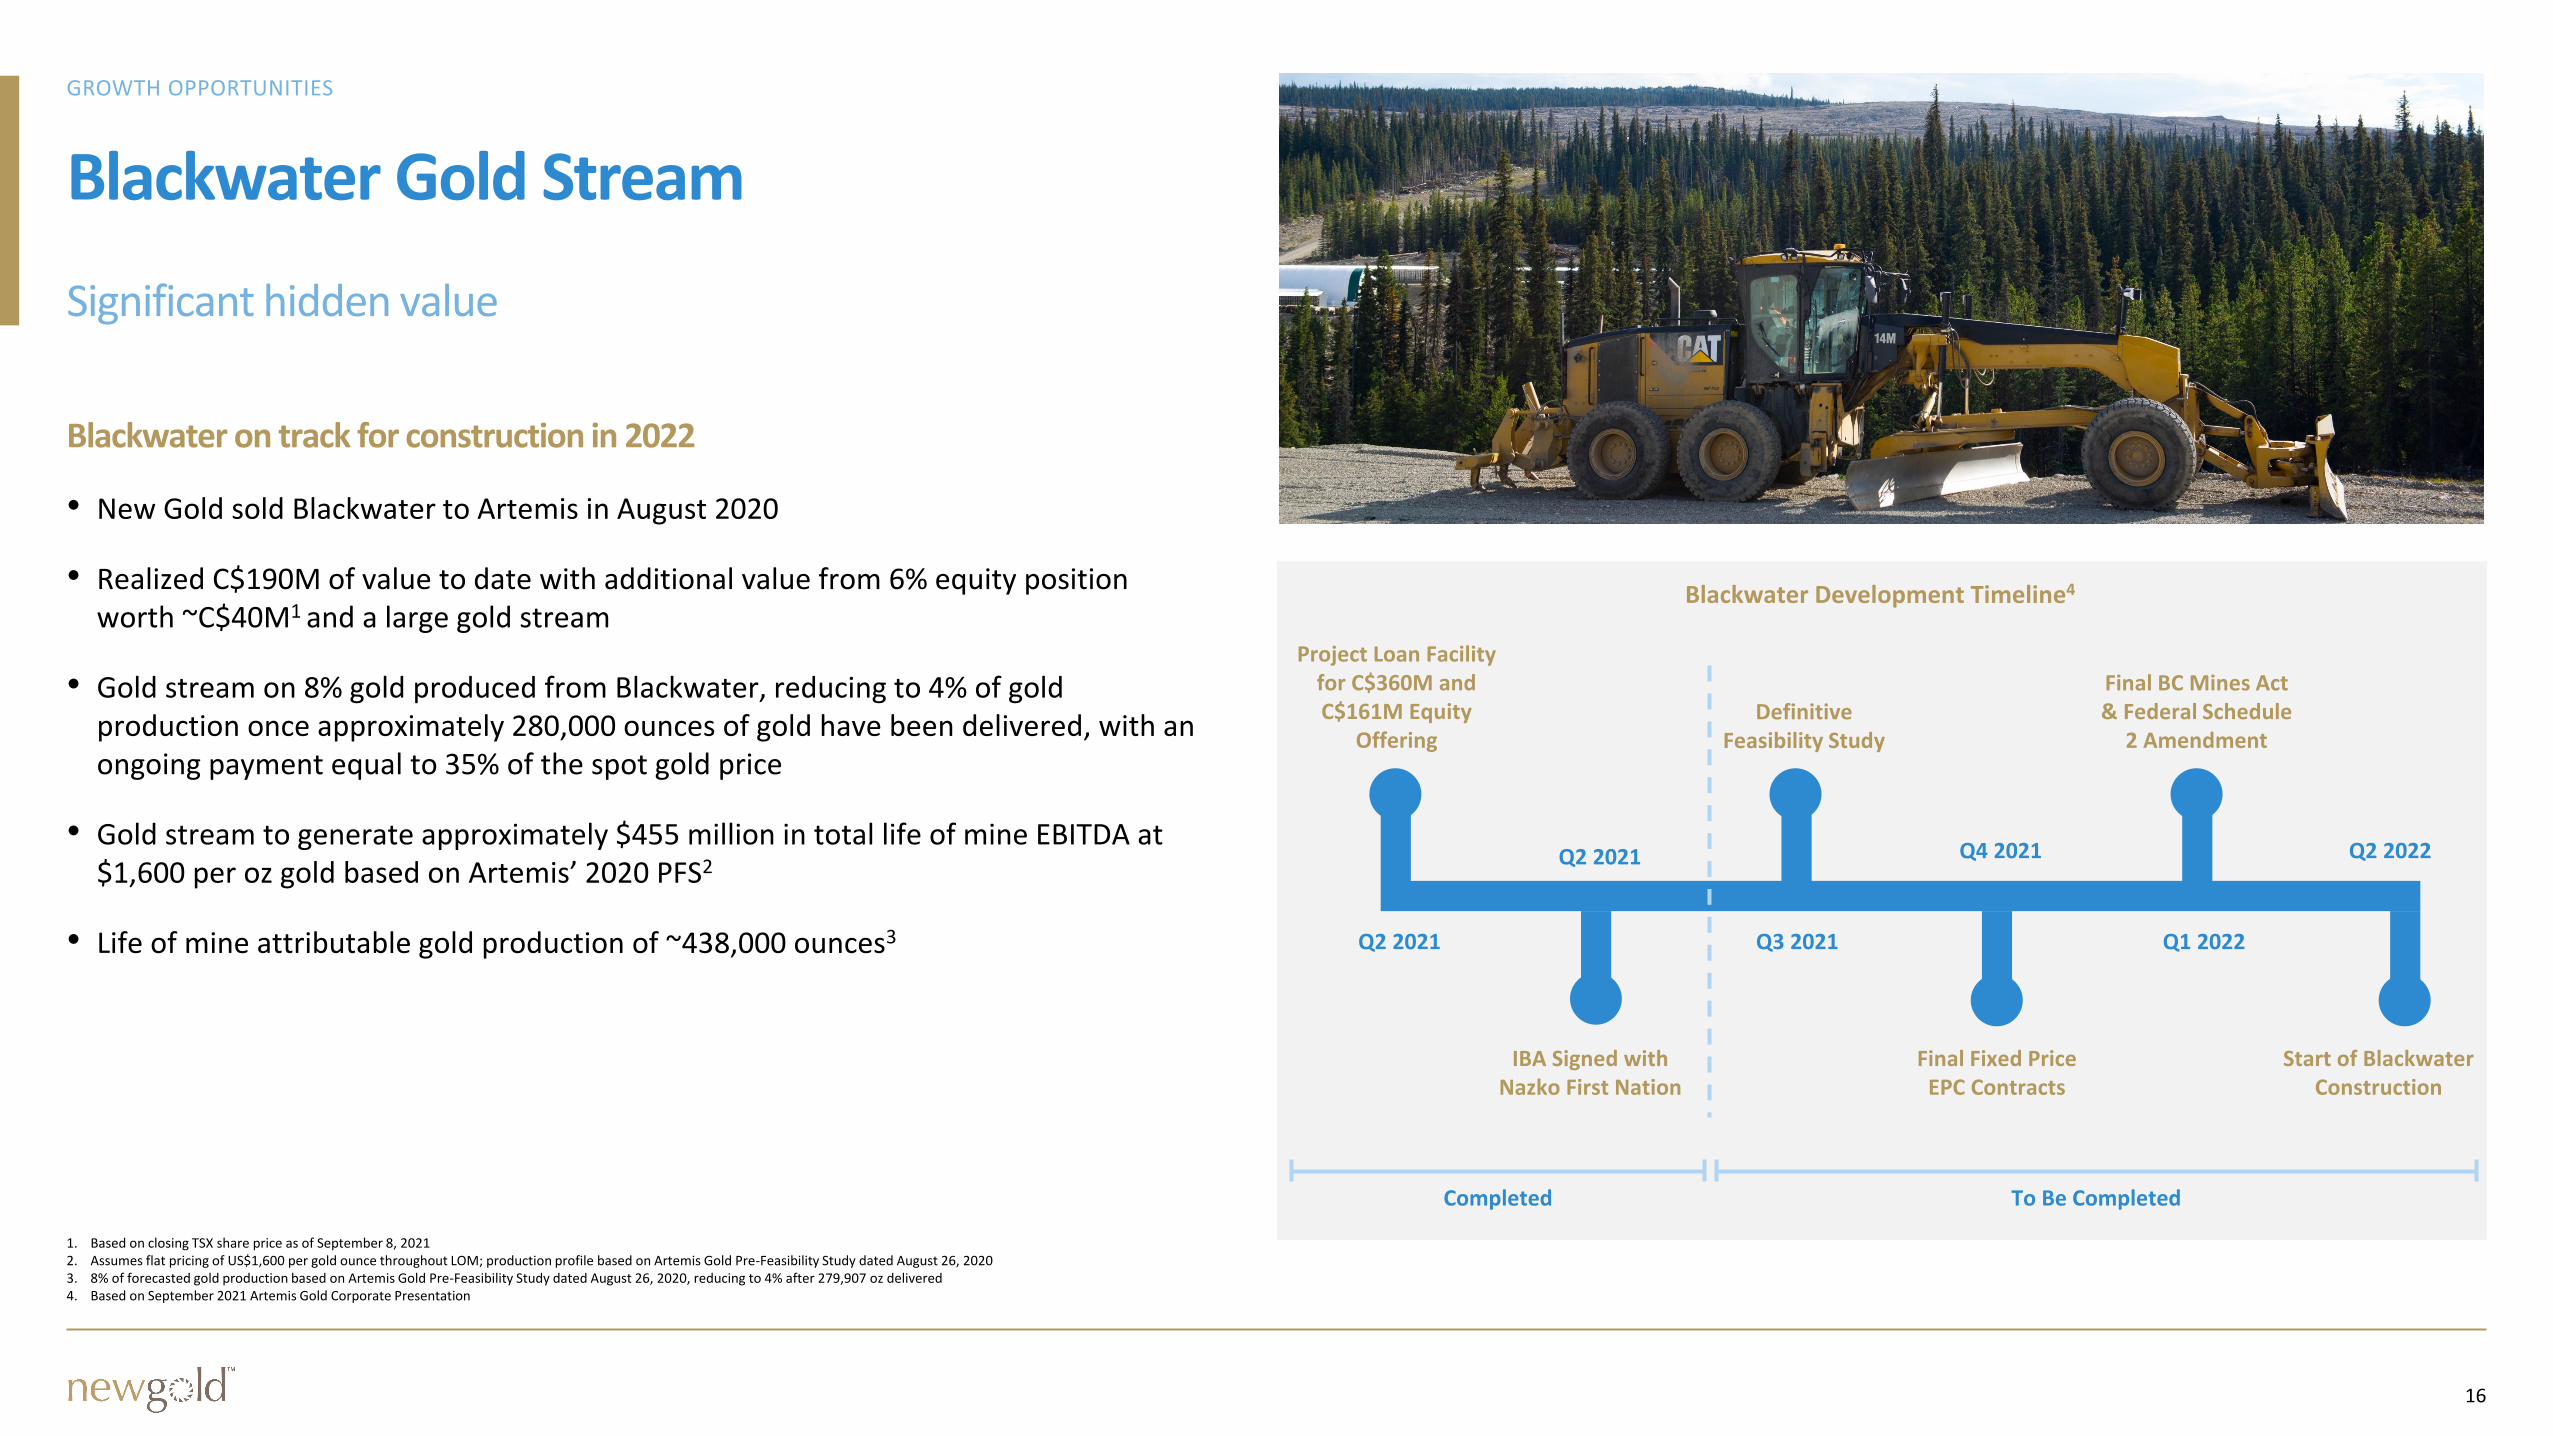
Blackwater Gold Stream
Blackwater on track for construction in 2022
1. Based on closing TSX share price as of September 8, 20212. Assumes flat pricing of US$1,600 per gold ounce throughout LOM; production profile based on Artemis Gold Pre-Feasibility Study dated August 26, 20203. 8% of forecasted gold production based on Artemis Gold Pre-Feasibility Study dated August 26, 2020, reducing to 4% after 279,907 oz delivered4. Based on September 2021 Artemis Gold Corporate Presentation
• New Gold sold Blackwater to Artemis in August 2020
• Realized C$190M of value to date with additional value from 6% equity position worth ~C$40M1 and a large gold stream
• Gold stream on 8% gold produced from Blackwater, reducing to 4% of gold production once approximately 280,000 ounces of gold have been delivered, with an ongoing payment equal to 35% of the spot gold price
• Gold stream to generate approximately $455 million in total life of mine EBITDA at $1,600 per oz gold based on Artemis’ 2020 PFS2
• Life of mine attributable gold production of ~438,000 ounces3
Blackwater Development Timeline4
Q2 2021 Q3 2021 Q1 2022
Q4 2021Q2 2021 Q2 2022
Project Loan Facility for C$360M and C$161M Equity
Offering
IBA Signed with Nazko First Nation
Definitive Feasibility Study
Final Fixed Price EPC Contracts
Final BC Mines Act & Federal Schedule
2 Amendment
Start of Blackwater Construction
Completed To Be Completed
17
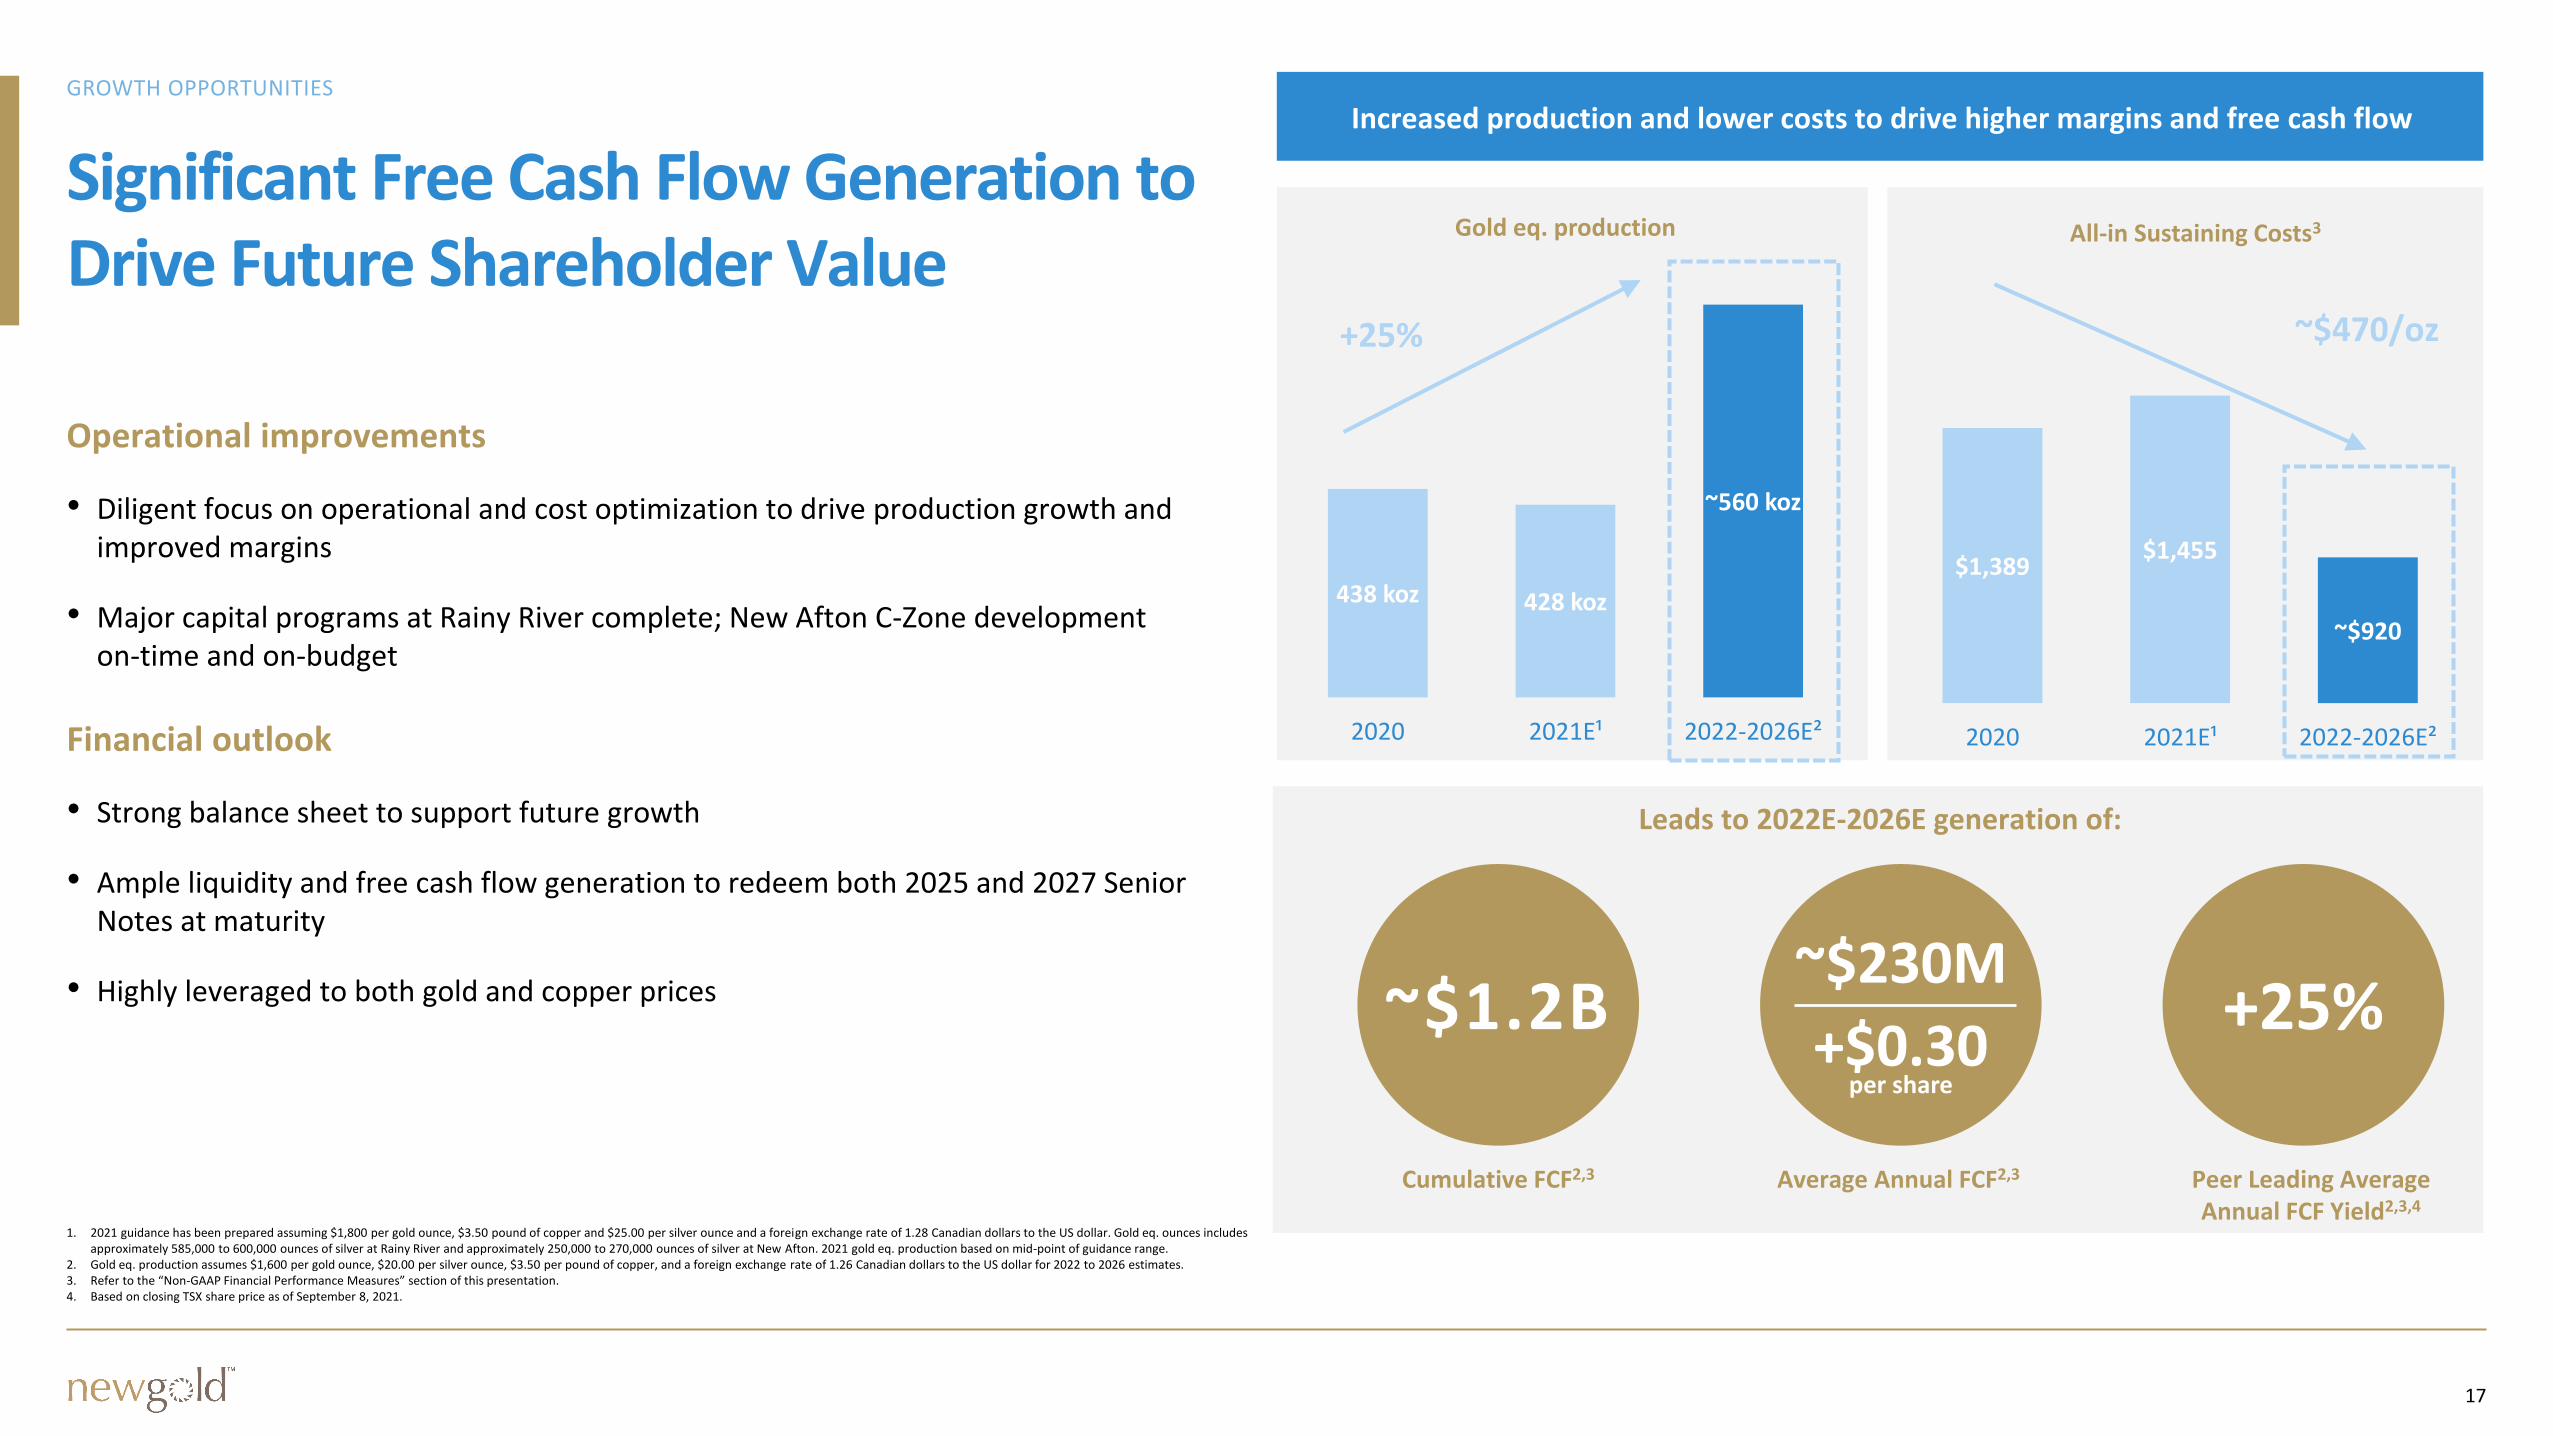
Significant Free Cash Flow Generation to Drive Future Shareholder Value
Operational improvements
1. 2021 guidance has been prepared assuming $1,800 per gold ounce, $3.50 pound of copper and $25.00 per silver ounce and a foreign exchange rate of 1.28 Canadian dollars to the US dollar. Gold eq. ounces includes approximately 585,000 to 600,000 ounces of silver at Rainy River and approximately 250,000 to 270,000 ounces of silver at New Afton. 2021 gold eq. production based on mid-point of guidance range.
2. Gold eq. production assumes $1,600 per gold ounce, $20.00 per silver ounce, $3.50 per pound of copper, and a foreign exchange rate of 1.26 Canadian dollars to the US dollar for 2022 to 2026 estimates. 3. Refer to the “Non-GAAP Financial Performance Measures” section of this presentation. 4. Based on closing TSX share price as of September 8, 2021.
• Diligent focus on operational and cost optimization to drive production growth and improved margins
• Major capital programs at Rainy River complete; New Afton C-Zone development on-time and on-budget
Financial outlook
• Strong balance sheet to support future growth
• Ample liquidity and free cash flow generation to redeem both 2025 and 2027 Senior Notes at maturity
• Highly leveraged to both gold and copper prices
Increased production and lower costs to drive higher margins and free cash flow
Leads to 2022E-2026E generation of:
~$1.2B~$230M
+$0.30
Cumulative FCF2,3 Average Annual FCF2,3 Peer Leading Average Annual FCF Yield2,3,4
+25%per share
438 koz 428 koz
~560 koz
2020 2021E¹ 2022-2026E²
Gold eq. production
$1,389$1,455
~$920
2020 2021E¹ 2022-2026E²
All-in Sustaining Costs3
+25% ~$470/oz
18
Strengthened by Sustainability
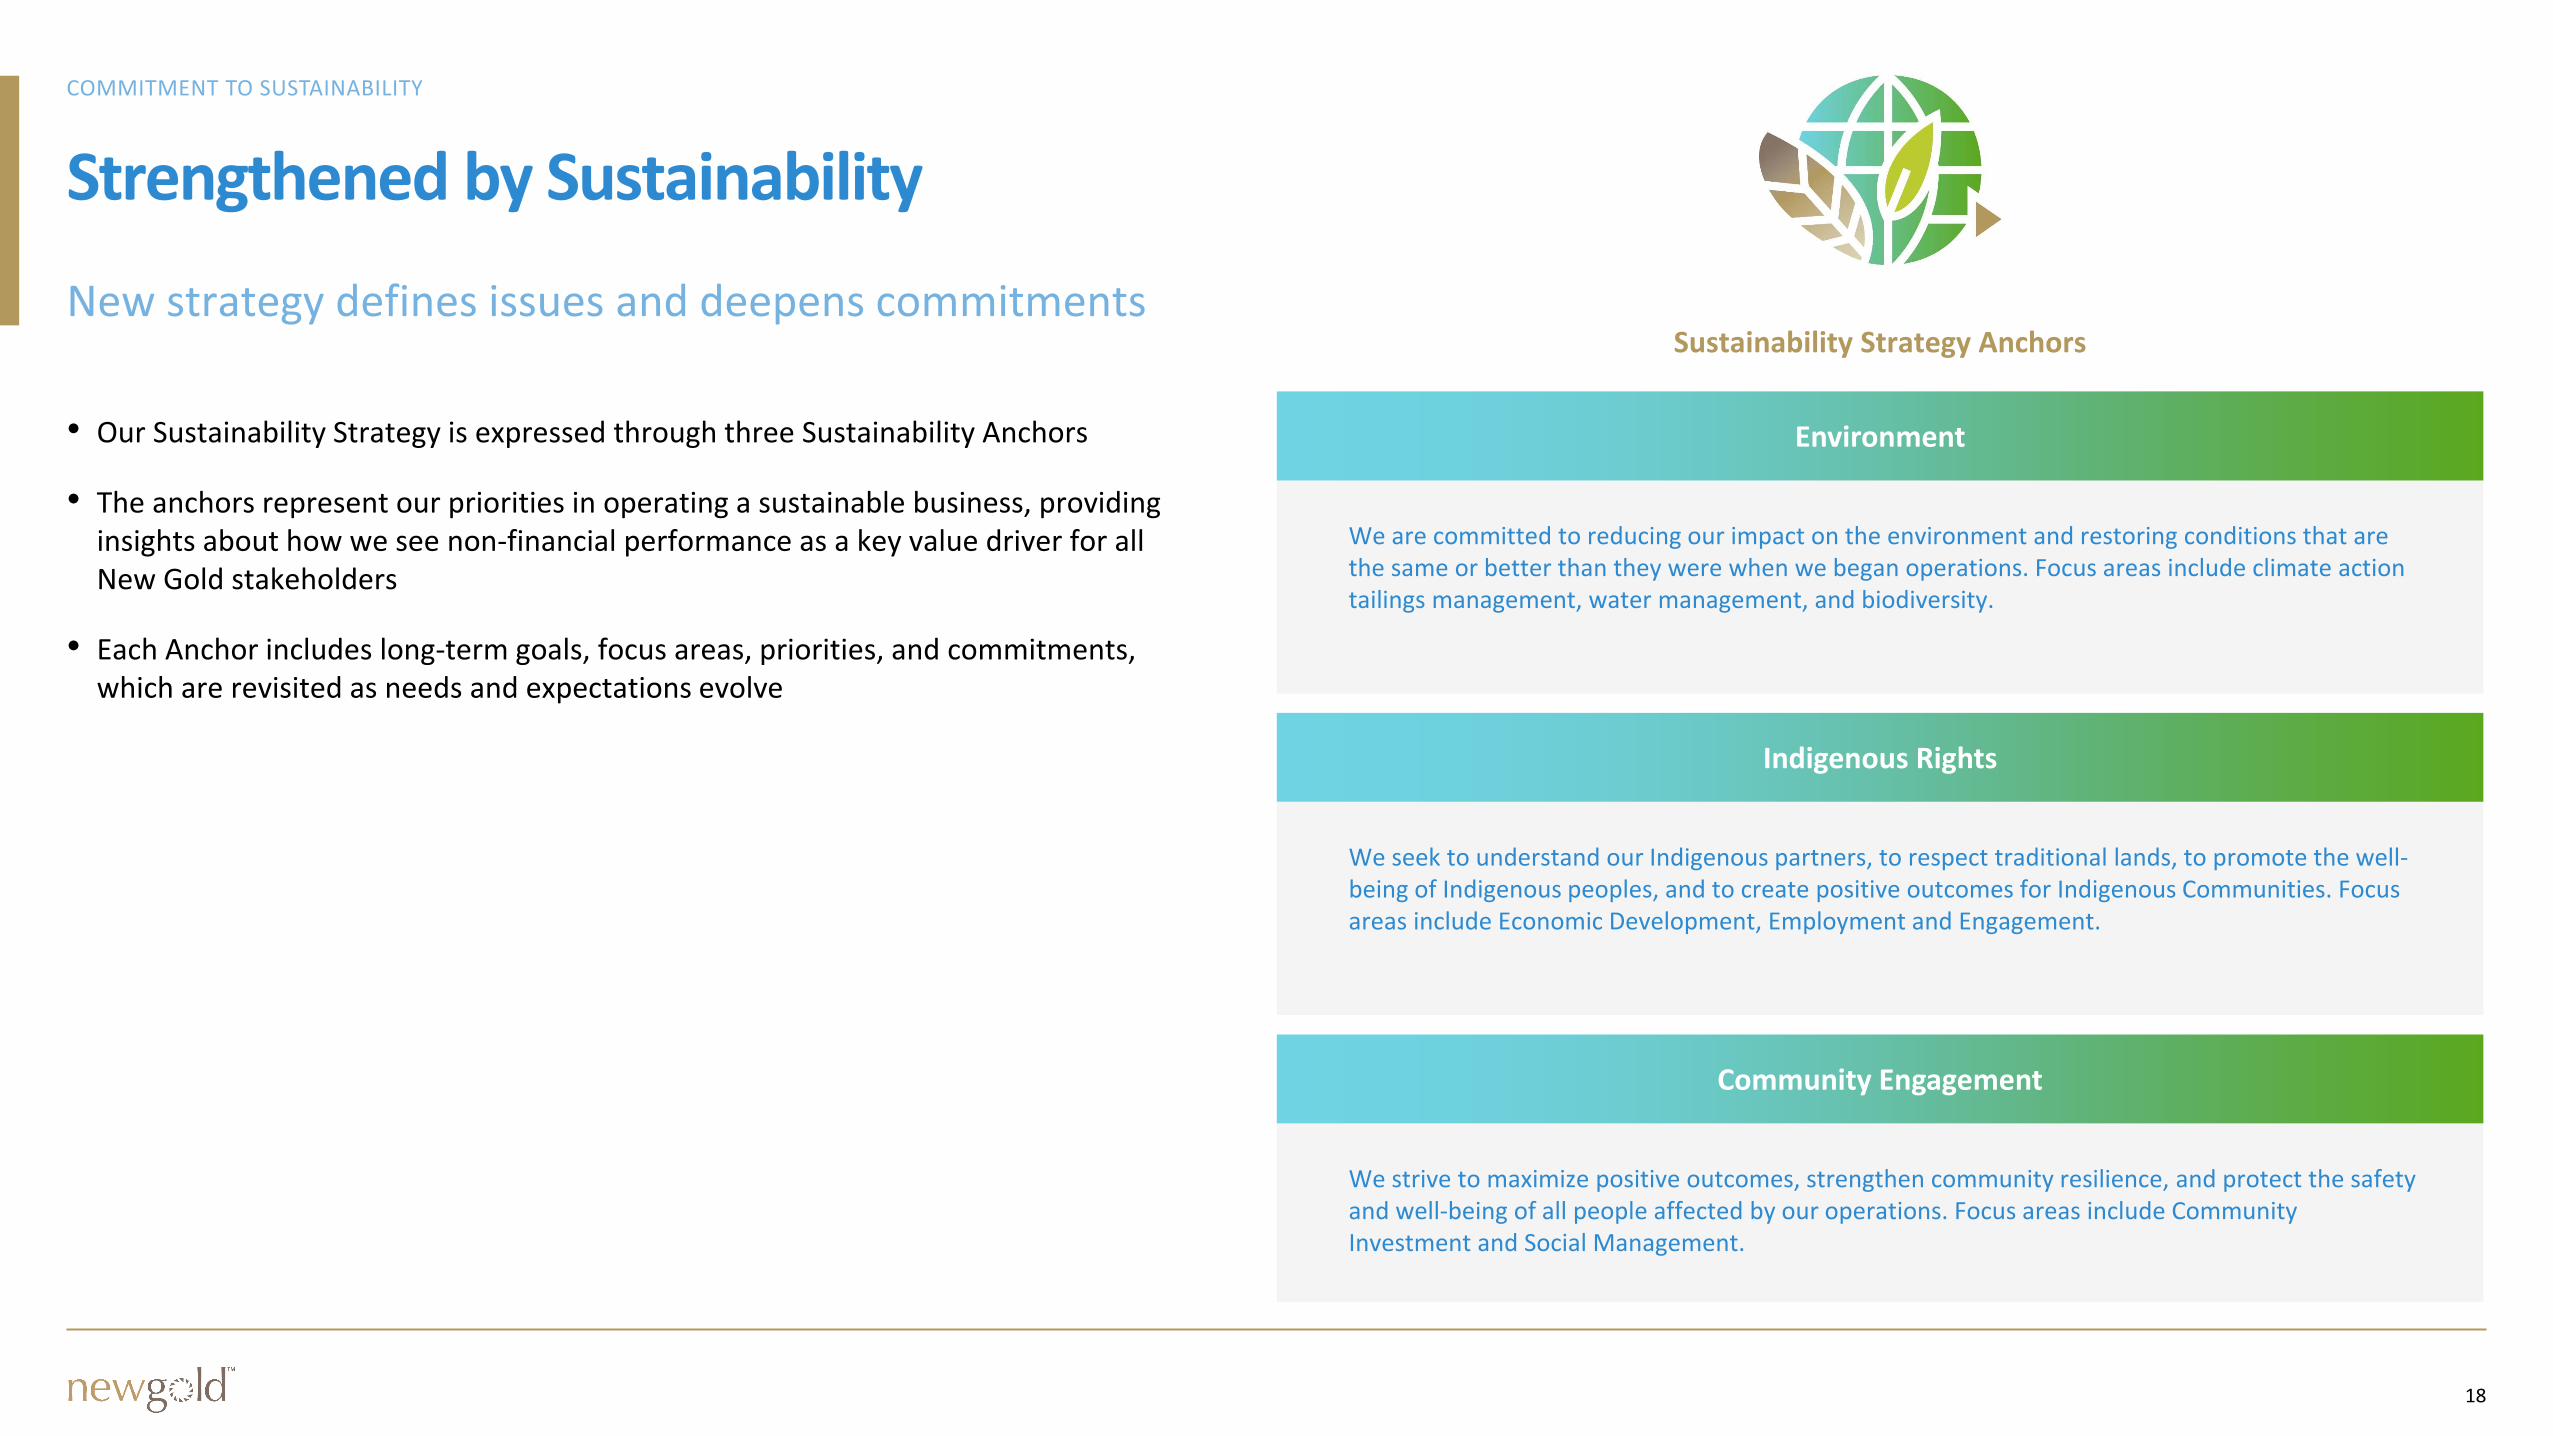
• Our Sustainability Strategy is expressed through three Sustainability Anchors
• The anchors represent our priorities in operating a sustainable business, providing insights about how we see non-financial performance as a key value driver for all New Gold stakeholders
• Each Anchor includes long-term goals, focus areas, priorities, and commitments, which are revisited as needs and expectations evolve
We are committed to reducing our impact on the environment and restoring conditions that are the same or better than they were when we began operations. Focus areas include climate action tailings management, water management, and biodiversity.
Environment
Sustainability Strategy Anchors
We seek to understand our Indigenous partners, to respect traditional lands, to promote the well-being of Indigenous peoples, and to create positive outcomes for Indigenous Communities. Focus areas include Economic Development, Employment and Engagement.
Indigenous Rights
We strive to maximize positive outcomes, strengthen community resilience, and protect the safety and well-being of all people affected by our operations. Focus areas include Community Investment and Social Management.
Community Engagement
19
2020 ESG Performance
1. Footnotes to be added
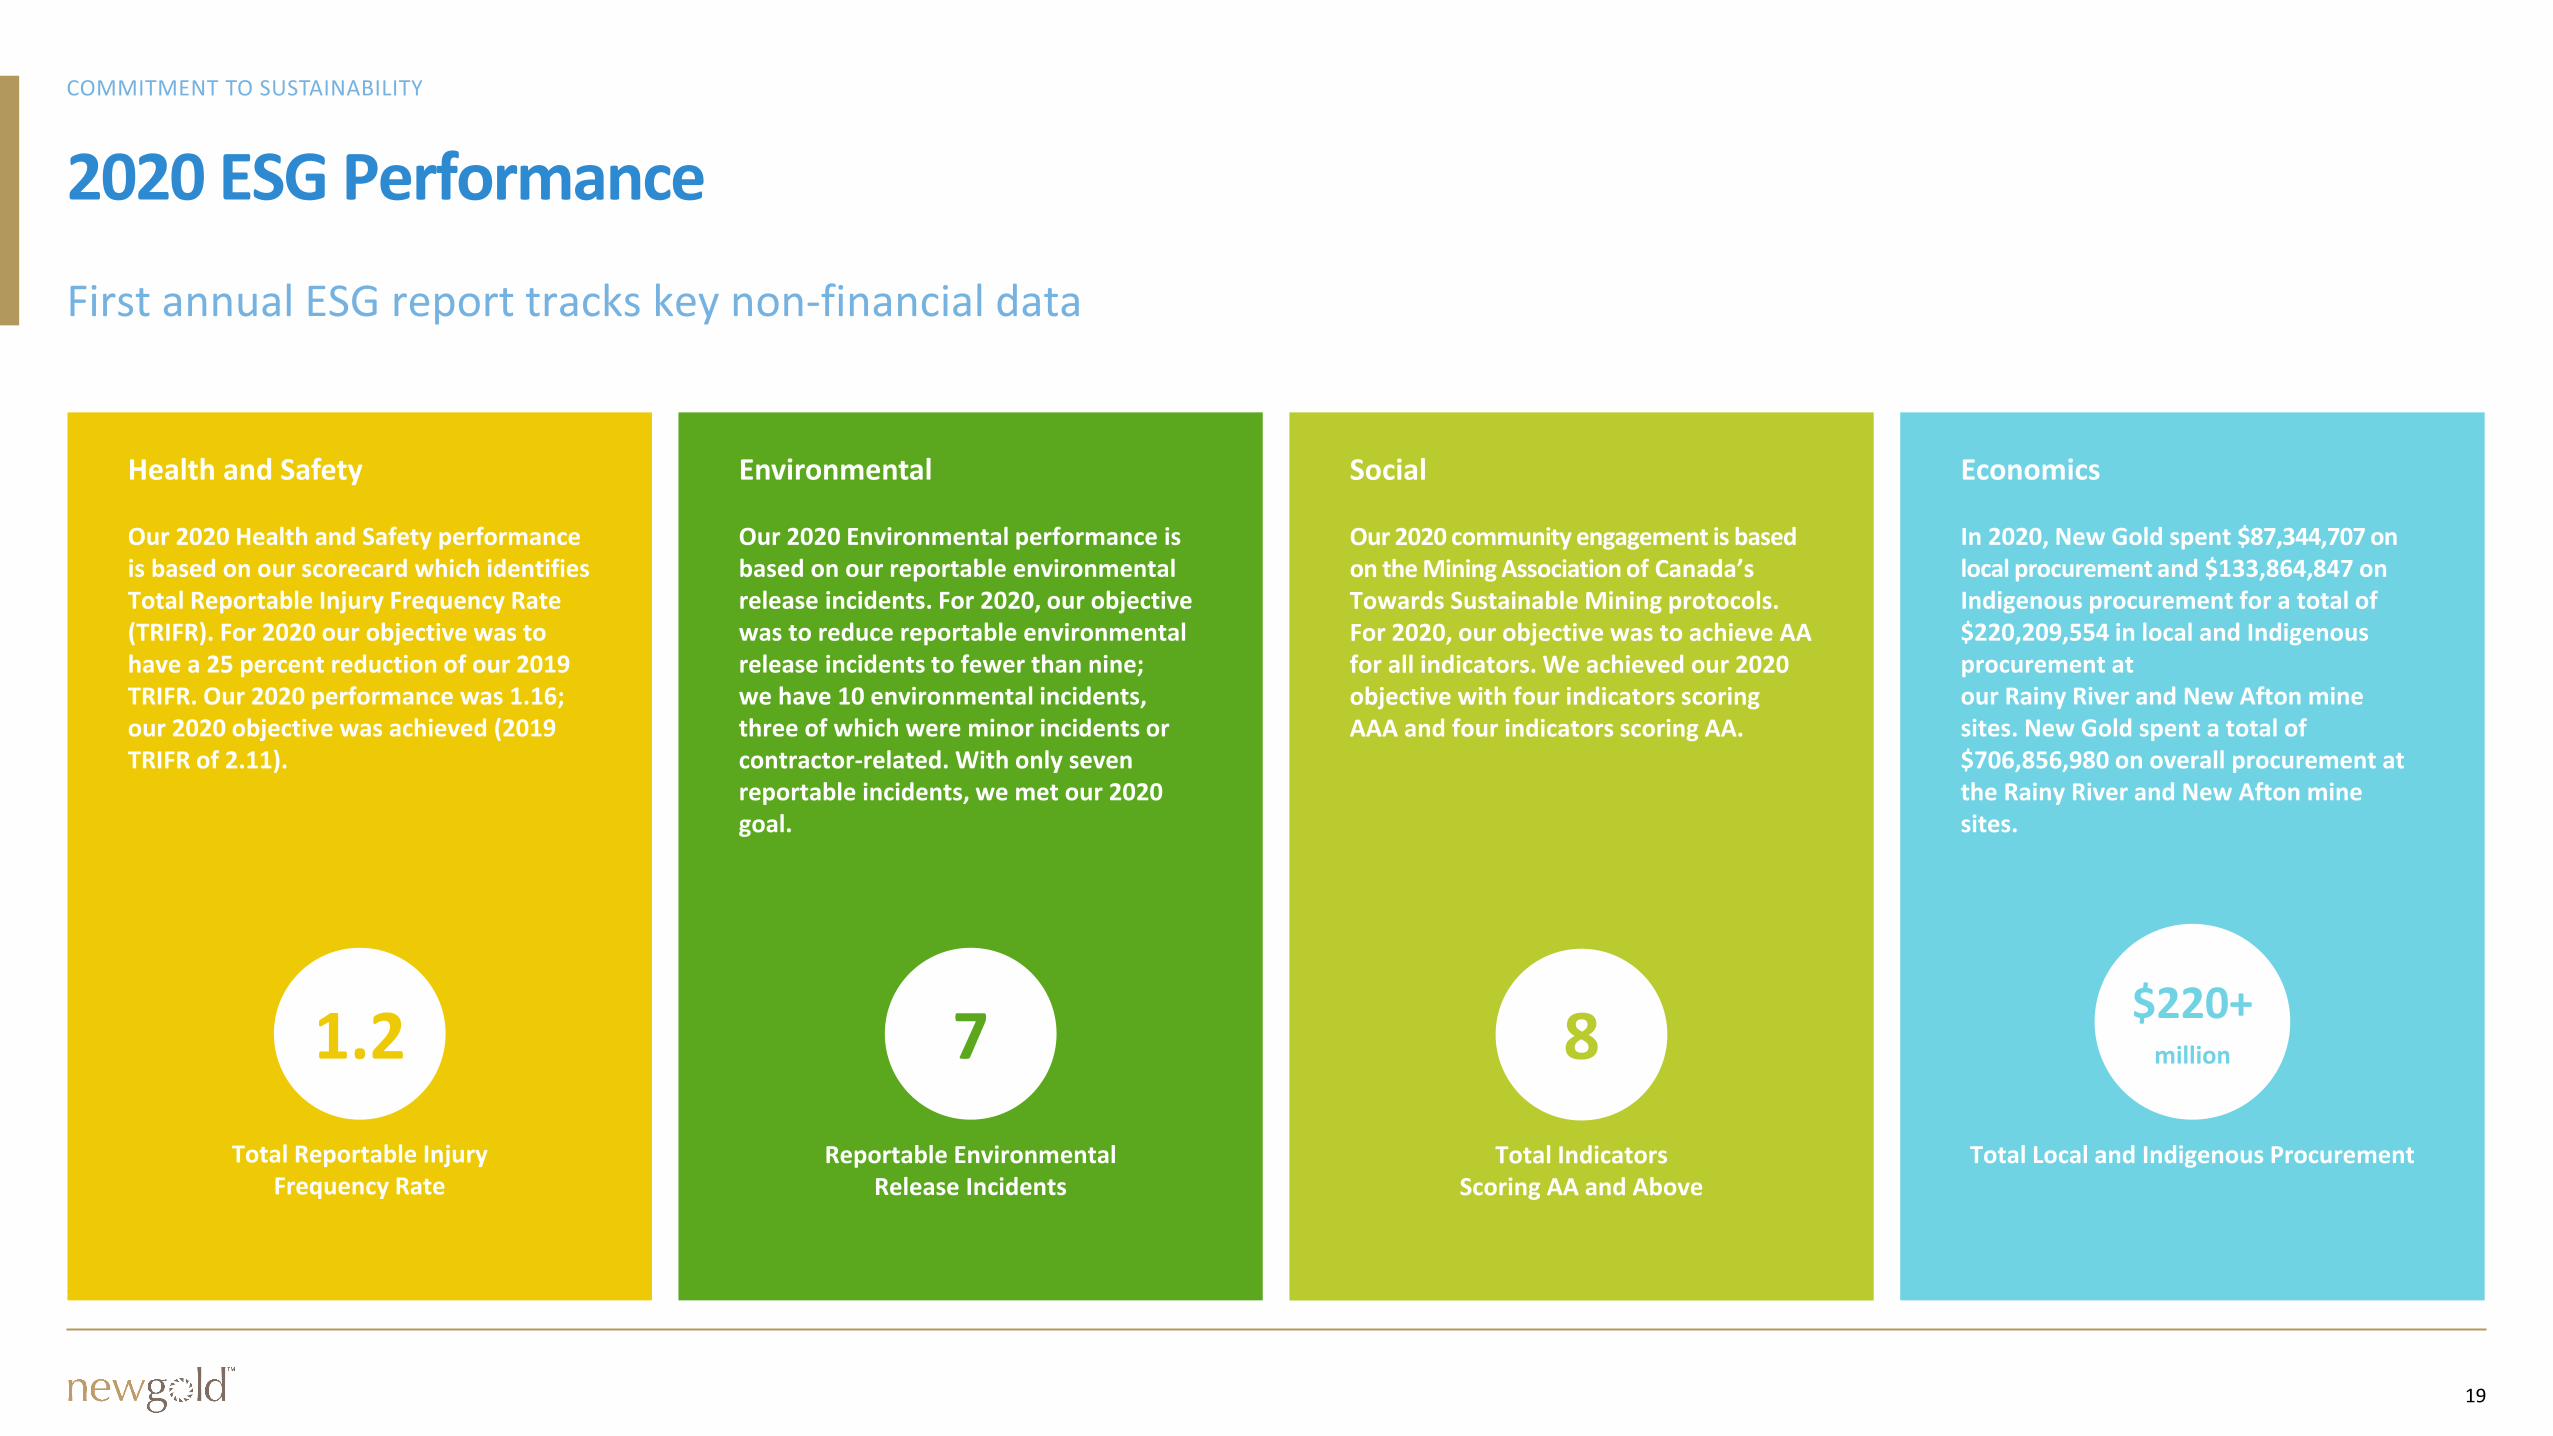
Health and Safety
Our 2020 Health and Safety performance is based on our scorecard which identifies Total Reportable Injury Frequency Rate (TRIFR). For 2020 our objective was to have a 25 percent reduction of our 2019 TRIFR. Our 2020 performance was 1.16; our 2020 objective was achieved (2019 TRIFR of 2.11).
Total Reportable InjuryFrequency Rate
1.2
Environmental
Our 2020 Environmental performance is based on our reportable environmental release incidents. For 2020, our objective was to reduce reportable environmental release incidents to fewer than nine; we have 10 environmental incidents, three of which were minor incidents or contractor-related. With only seven reportable incidents, we met our 2020 goal.
Reportable EnvironmentalRelease Incidents
7
Social
Our 2020 community engagement is based on the Mining Association of Canada’s Towards Sustainable Mining protocols. For 2020, our objective was to achieve AA for all indicators. We achieved our 2020 objective with four indicators scoring AAA and four indicators scoring AA.
Total IndicatorsScoring AA and Above
8
Economics
In 2020, New Gold spent $87,344,707 on local procurement and $133,864,847 on Indigenous procurement for a total of $220,209,554 in local and Indigenous procurement atour Rainy River and New Afton mine sites. New Gold spent a total of $706,856,980 on overall procurement at the Rainy River and New Afton mine sites.
Total Local and Indigenous Procurement
$220+million
20
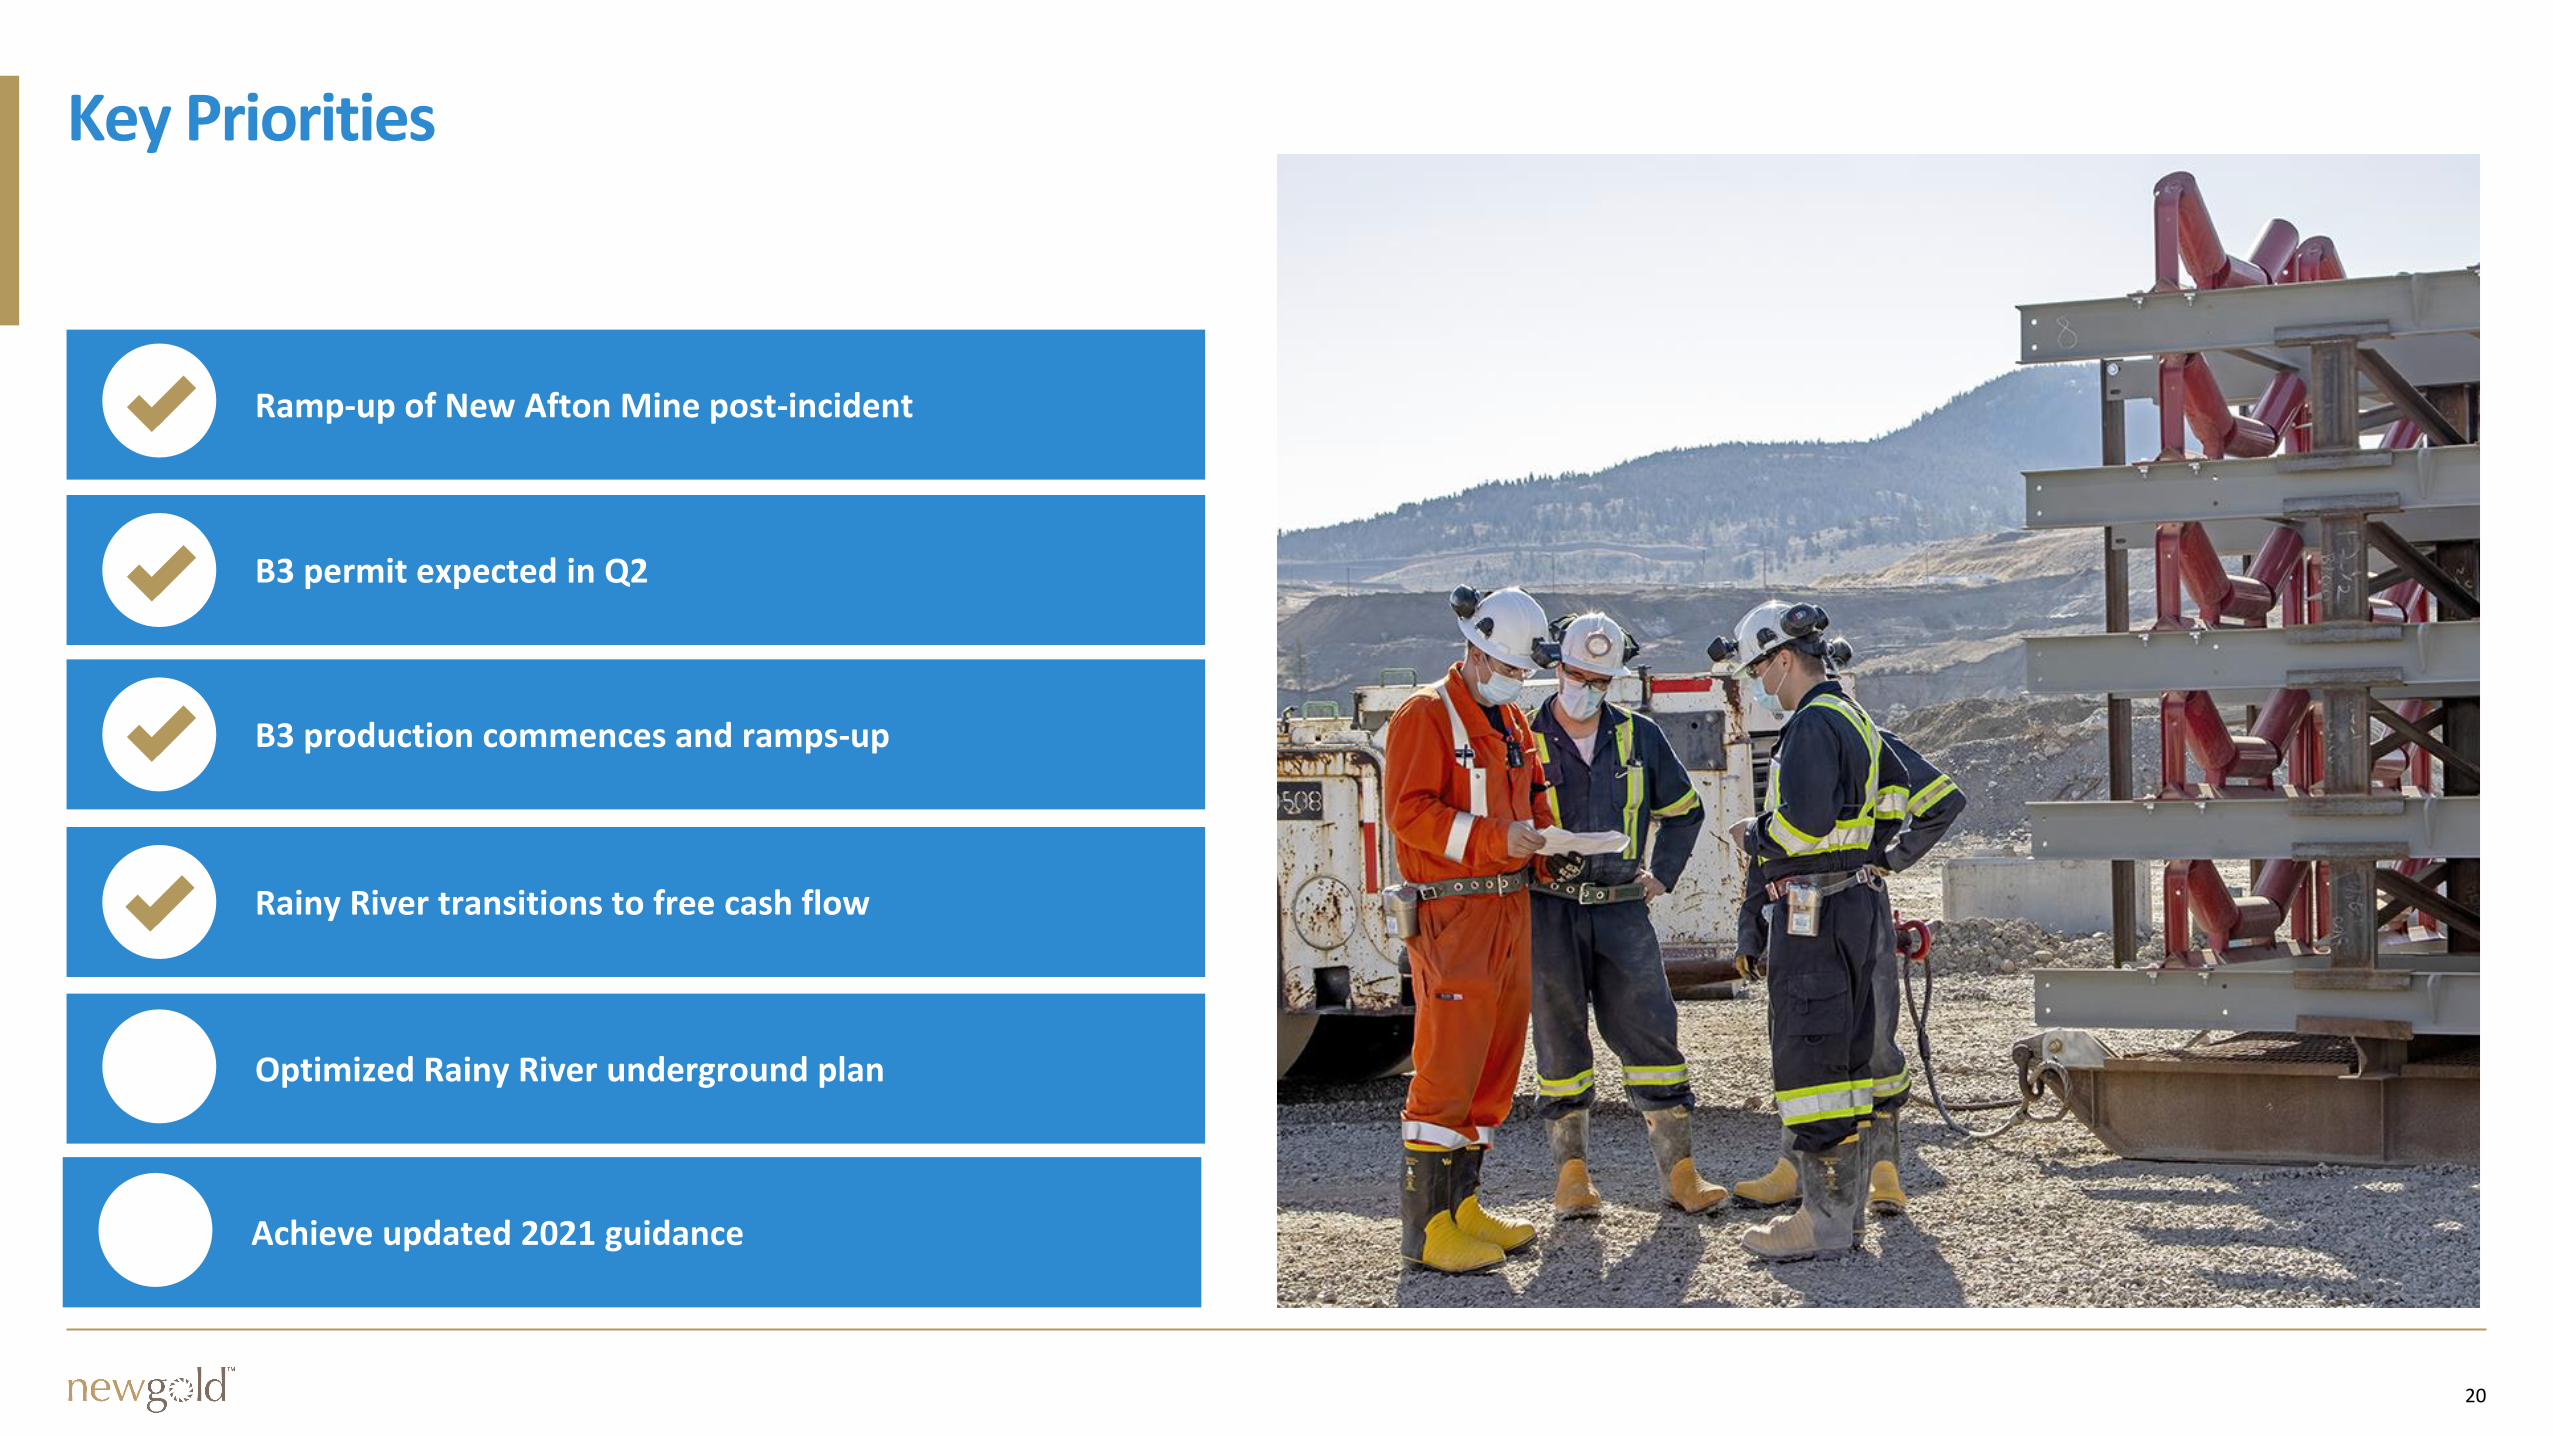
Ramp-up of New Afton Mine post-incident
B3 permit expected in Q2
B3 production commences and ramps-up
Rainy River transitions to free cash flow
Optimized Rainy River underground plan
Key Priorities
Achieve updated 2021 guidance
21
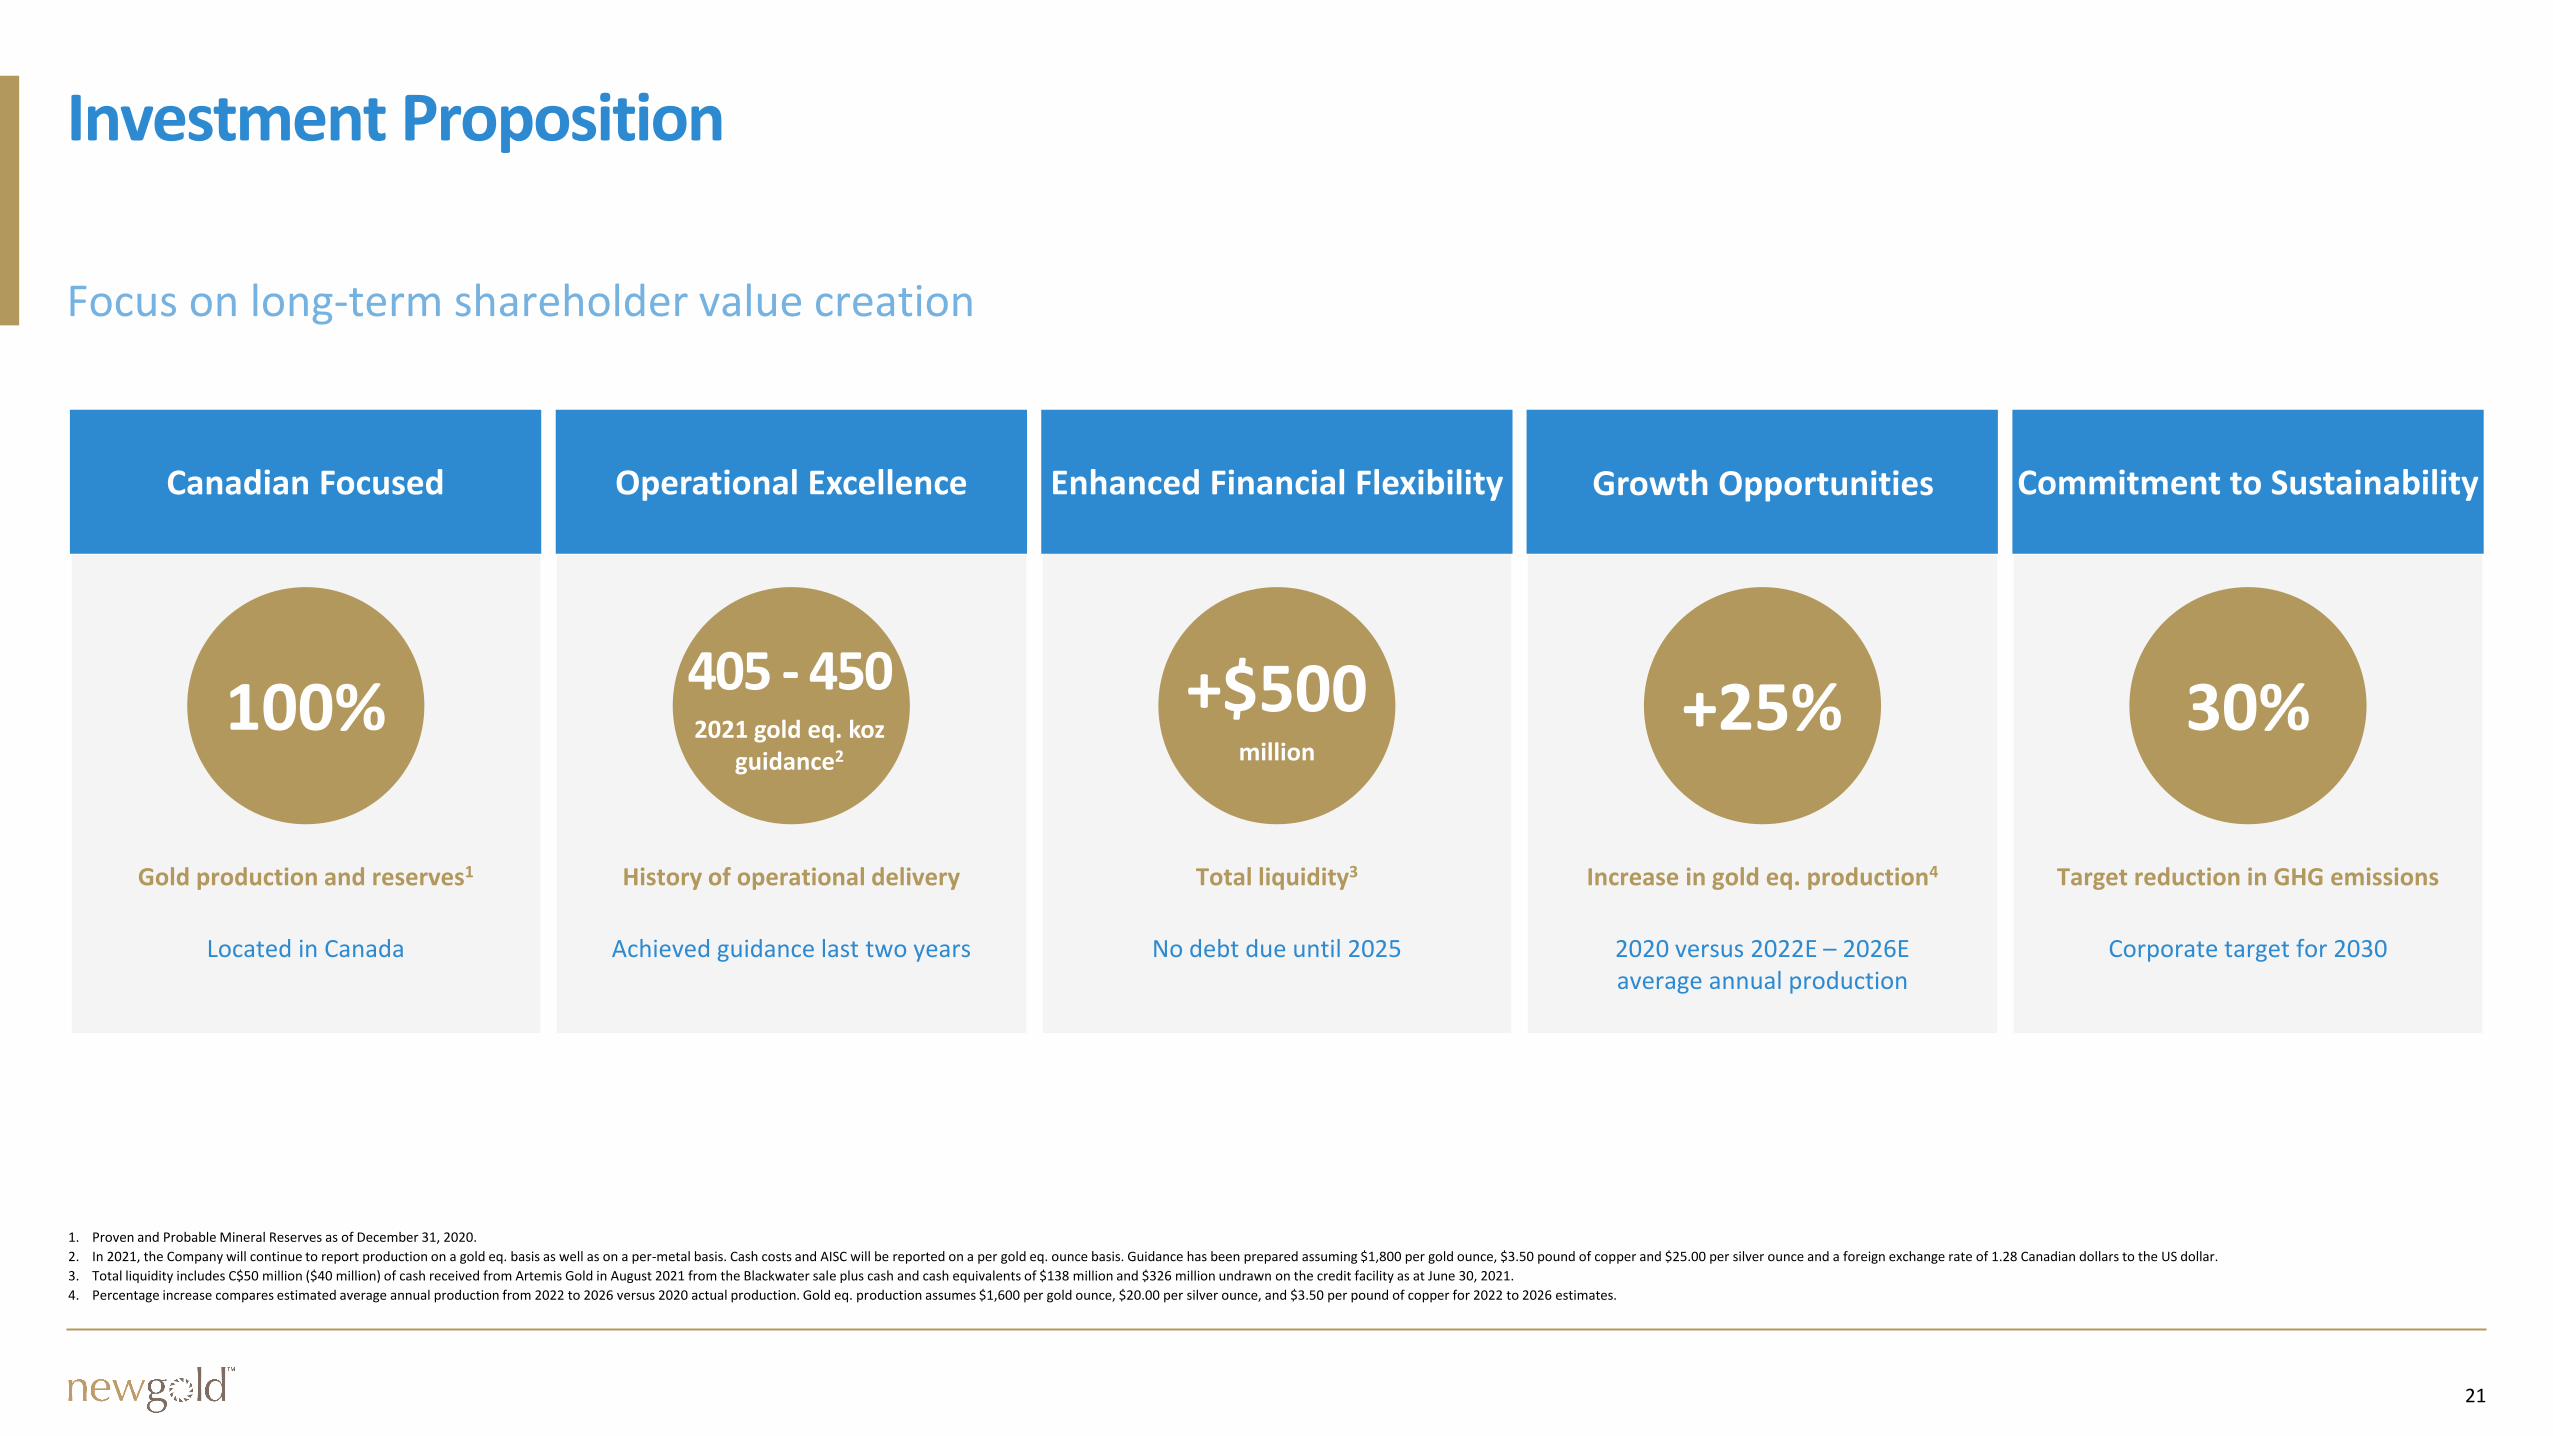
Investment Proposition
1. Proven and Probable Mineral Reserves as of December 31, 2020.
2. In 2021, the Company will continue to report production on a gold eq. basis as well as on a per-metal basis. Cash costs and AISC will be reported on a per gold eq. ounce basis. Guidance has been prepared assuming $1,800 per gold ounce, $3.50 pound of copper and $25.00 per silver ounce and a foreign exchange rate of 1.28 Canadian dollars to the US dollar.
3. Total liquidity includes C$50 million ($40 million) of cash received from Artemis Gold in August 2021 from the Blackwater sale plus cash and cash equivalents of $138 million and $326 million undrawn on the credit facility as at June 30, 2021.
4. Percentage increase compares estimated average annual production from 2022 to 2026 versus 2020 actual production. Gold eq. production assumes $1,600 per gold ounce, $20.00 per silver ounce, and $3.50 per pound of copper for 2022 to 2026 estimates.
Gold production and reserves1
Located in Canada
Canadian Focused
100%
History of operational delivery
Achieved guidance last two years
Operational Excellence
405 - 4502021 gold eq. koz
guidance2
Total liquidity3
No debt due until 2025
Enhanced Financial Flexibility
+$500million
Increase in gold eq. production4
2020 versus 2022E – 2026E average annual production
Growth Opportunities
Target reduction in GHG emissions
Corporate target for 2030
Commitment to Sustainability
30%
Growth Opportunities
+25%
22
Appendix
23
Our Strategic Pillars
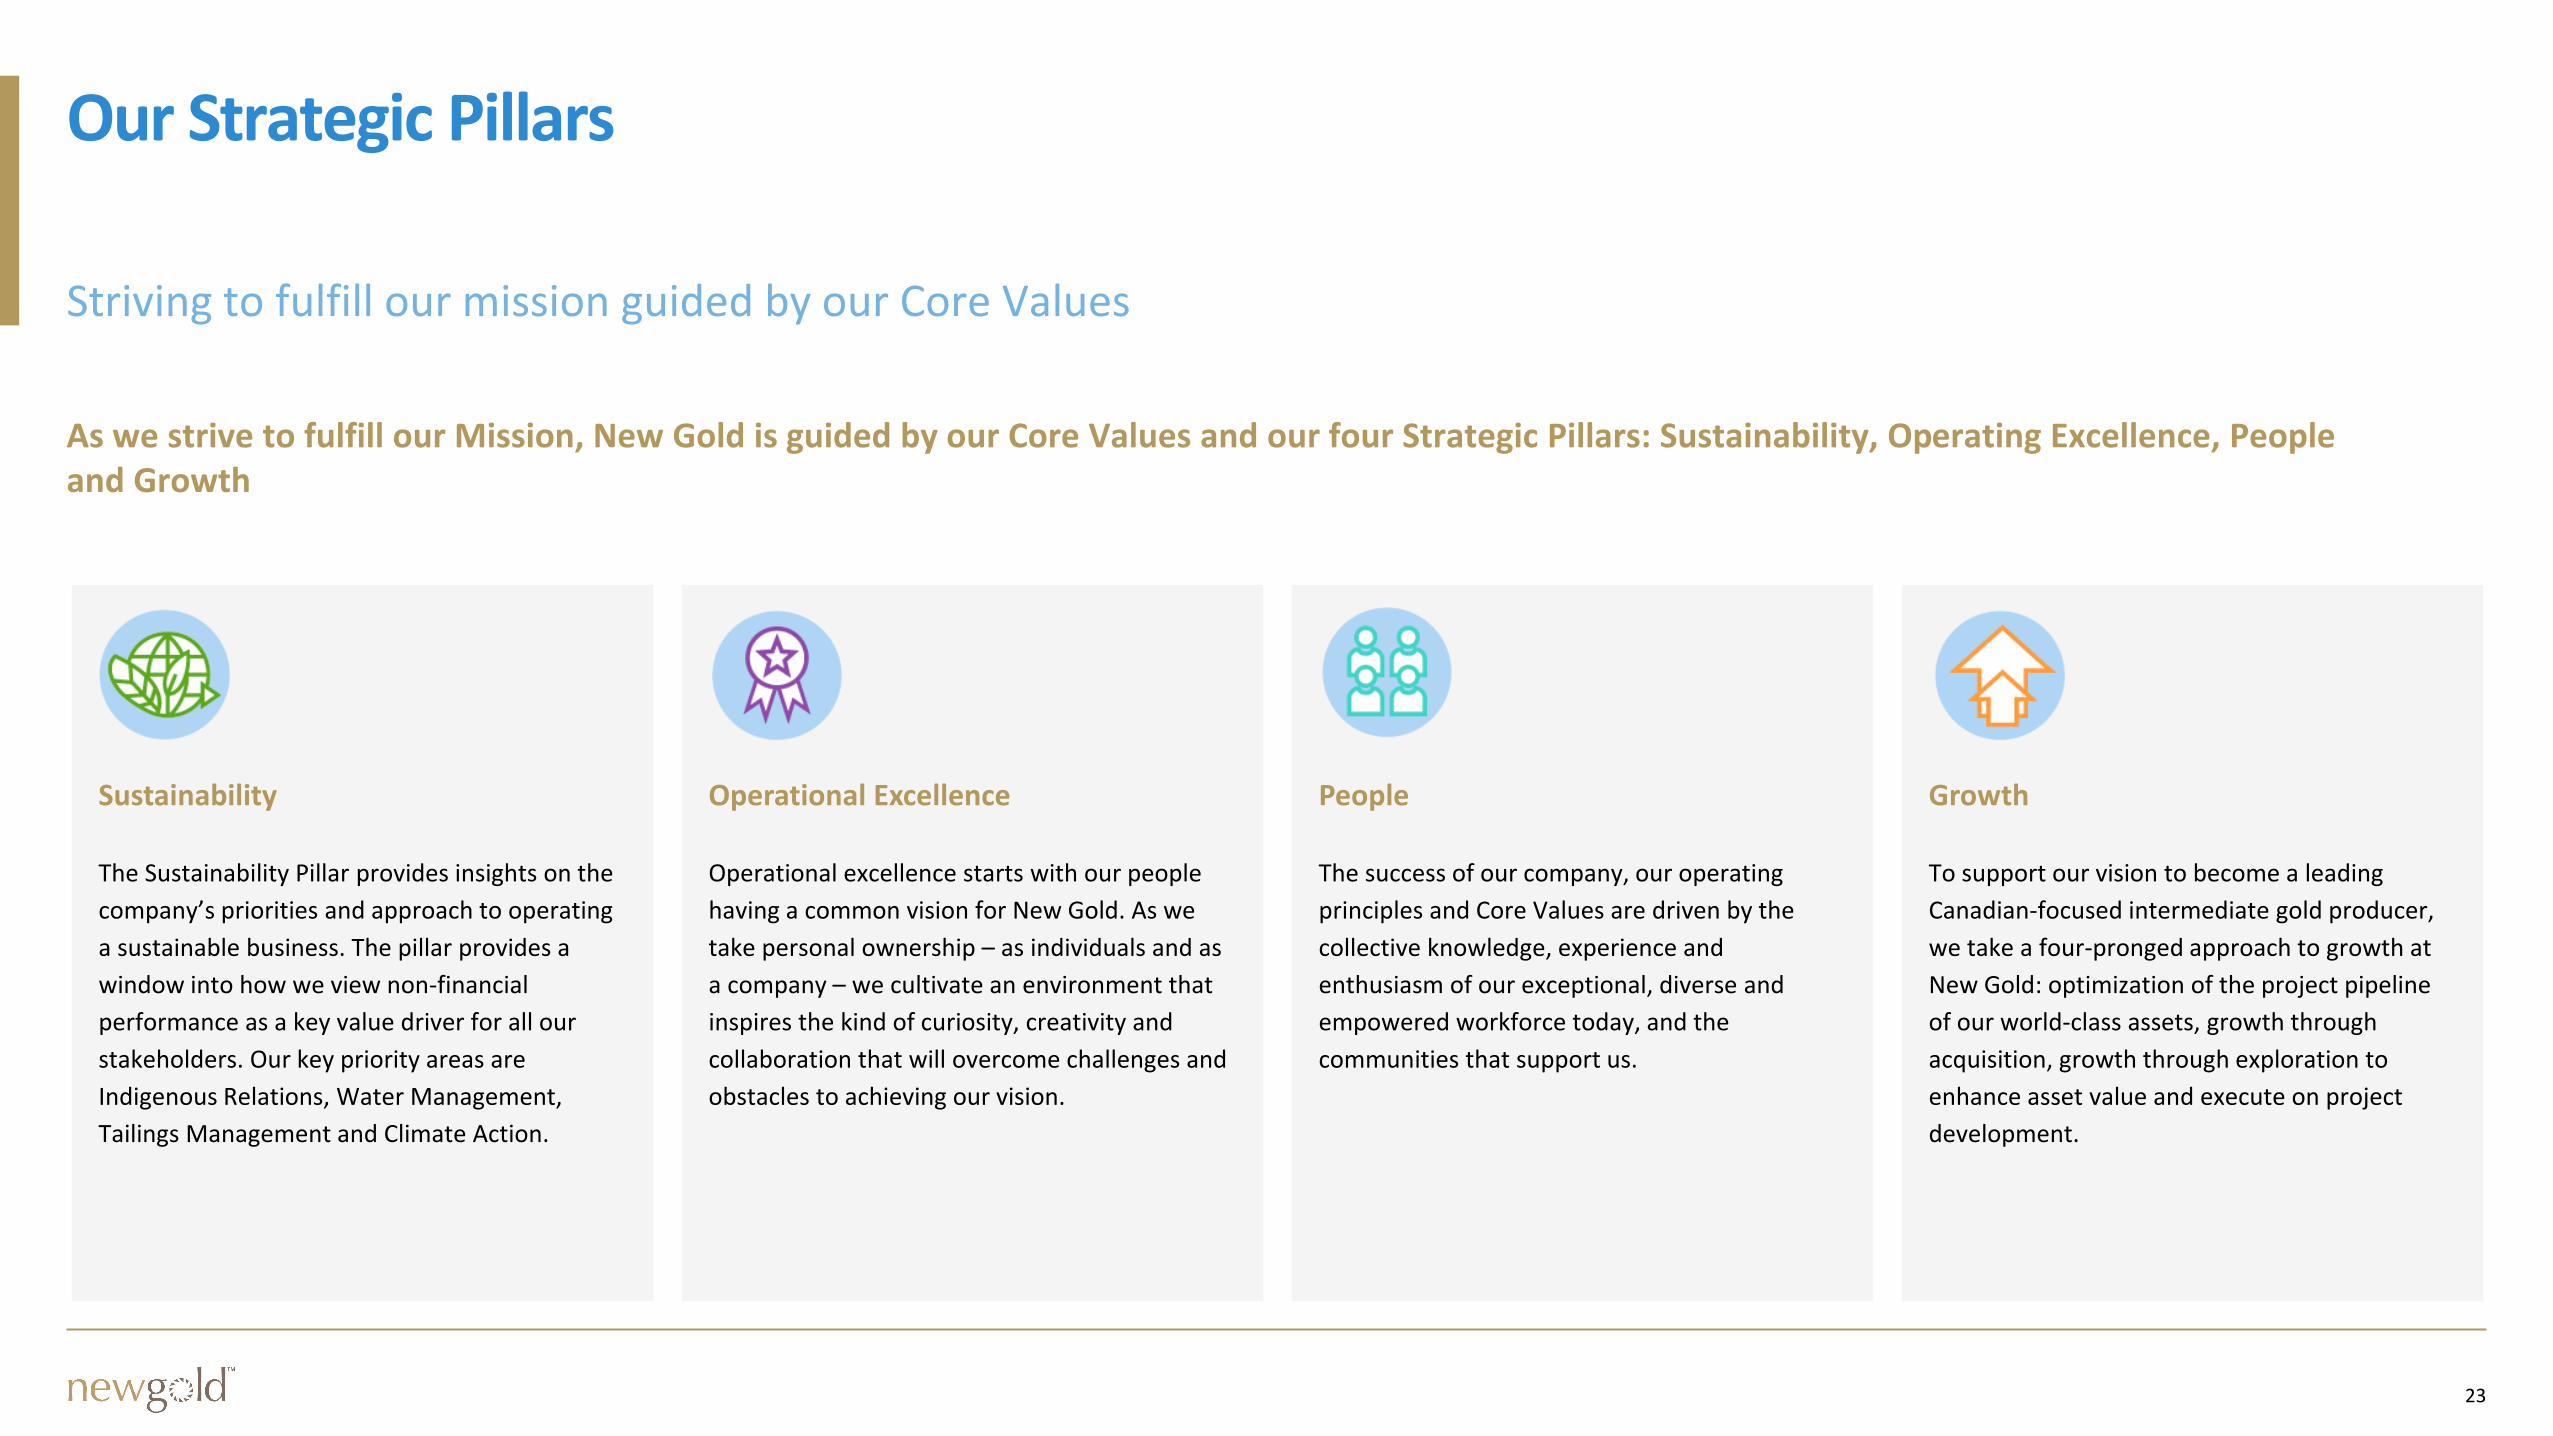
As we strive to fulfill our Mission, New Gold is guided by our Core Values and our four Strategic Pillars: Sustainability, Operating Excellence, People and Growth
Operational ExcellenceSustainability
The Sustainability Pillar provides insights on the
company’s priorities and approach to operating
a sustainable business. The pillar provides a
window into how we view non-financial
performance as a key value driver for all our
stakeholders. Our key priority areas are
Indigenous Relations, Water Management,
Tailings Management and Climate Action.
Operational excellence starts with our people
having a common vision for New Gold. As we
take personal ownership – as individuals and as
a company – we cultivate an environment that
inspires the kind of curiosity, creativity and
collaboration that will overcome challenges and
obstacles to achieving our vision.
People
The success of our company, our operating
principles and Core Values are driven by the
collective knowledge, experience and
enthusiasm of our exceptional, diverse and
empowered workforce today, and the
communities that support us.
Growth
To support our vision to become a leading
Canadian-focused intermediate gold producer,
we take a four-pronged approach to growth at
New Gold: optimization of the project pipeline
of our world-class assets, growth through
acquisition, growth through exploration to
enhance asset value and execute on project
development.
24
Rainy River
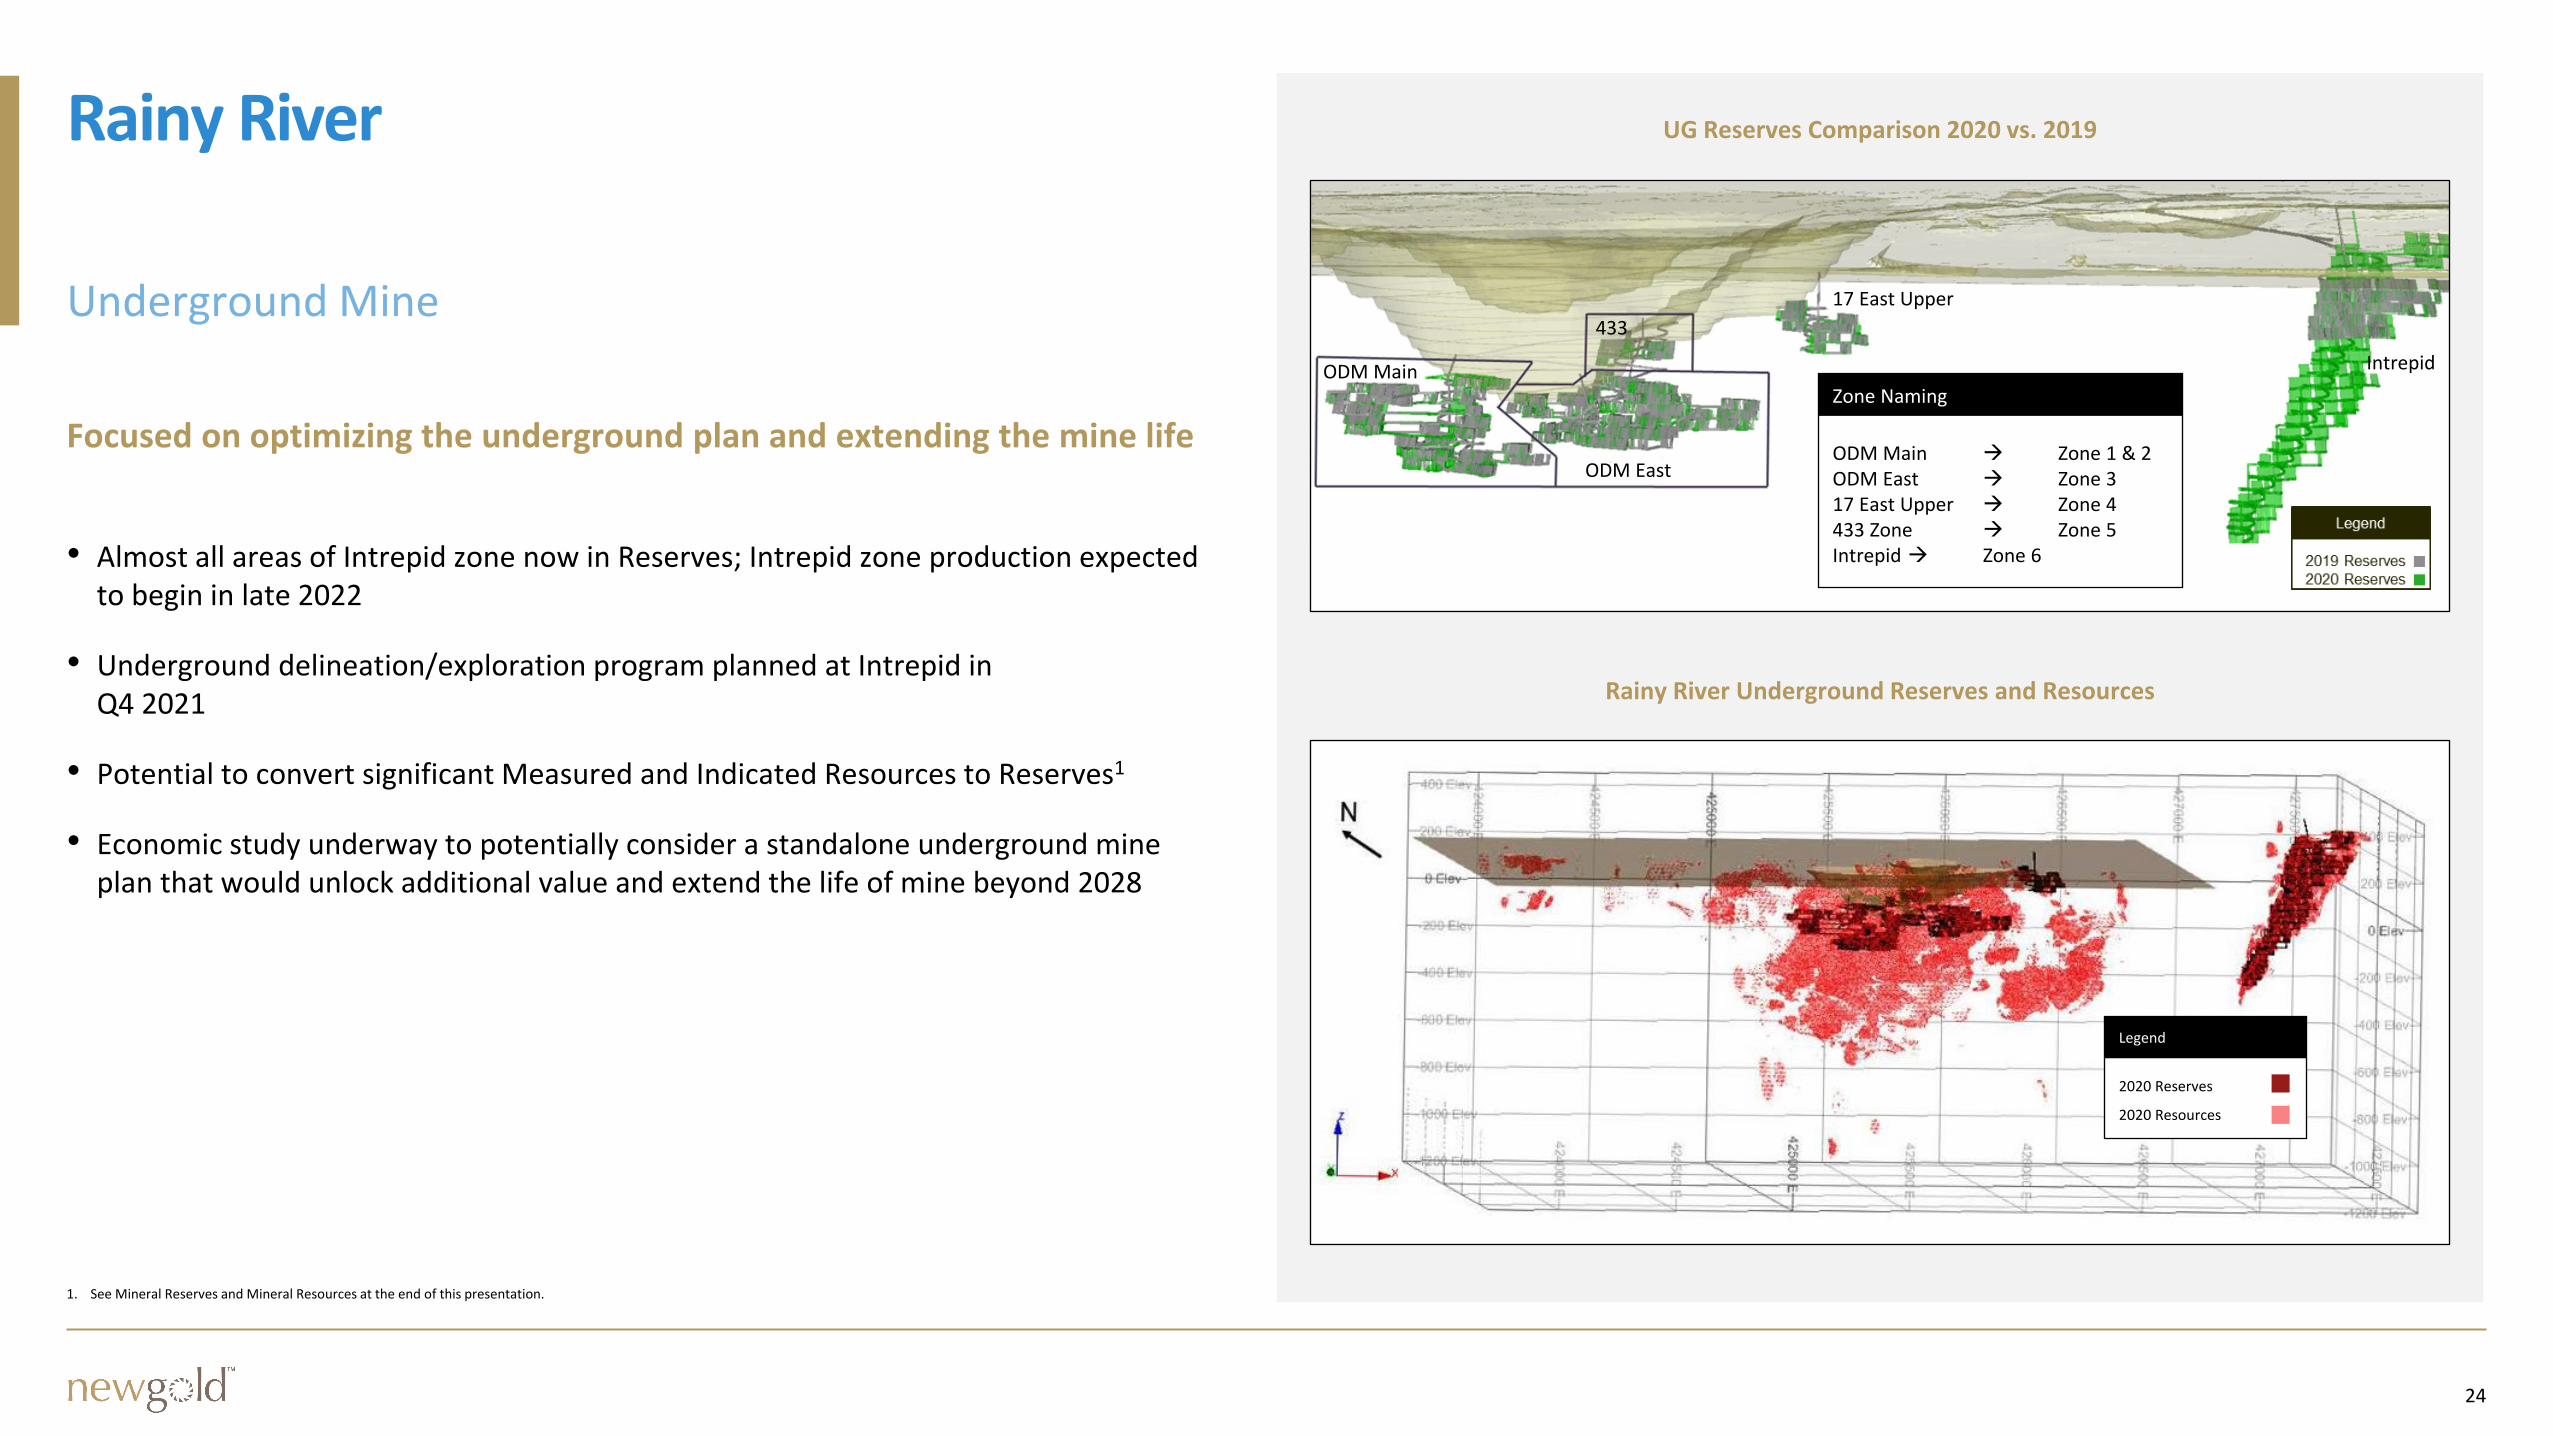
Focused on optimizing the underground plan and extending the mine life
1. See Mineral Reserves and Mineral Resources at the end of this presentation.
• Almost all areas of Intrepid zone now in Reserves; Intrepid zone production expected to begin in late 2022
• Underground delineation/exploration program planned at Intrepid inQ4 2021
• Potential to convert significant Measured and Indicated Resources to Reserves1
• Economic study underway to potentially consider a standalone underground mine plan that would unlock additional value and extend the life of mine beyond 2028
17 East Upper
433
ODM East
ODM Main Intrepid
UG Reserves Comparison 2020 vs. 2019
ODM Main → Zone 1 & 2ODM East → Zone 317 East Upper → Zone 4433 Zone → Zone 5Intrepid → Zone 6
Zone Naming
Rainy River Underground Reserves and Resources
2020 Reserves
2020 Resources
Legend
25
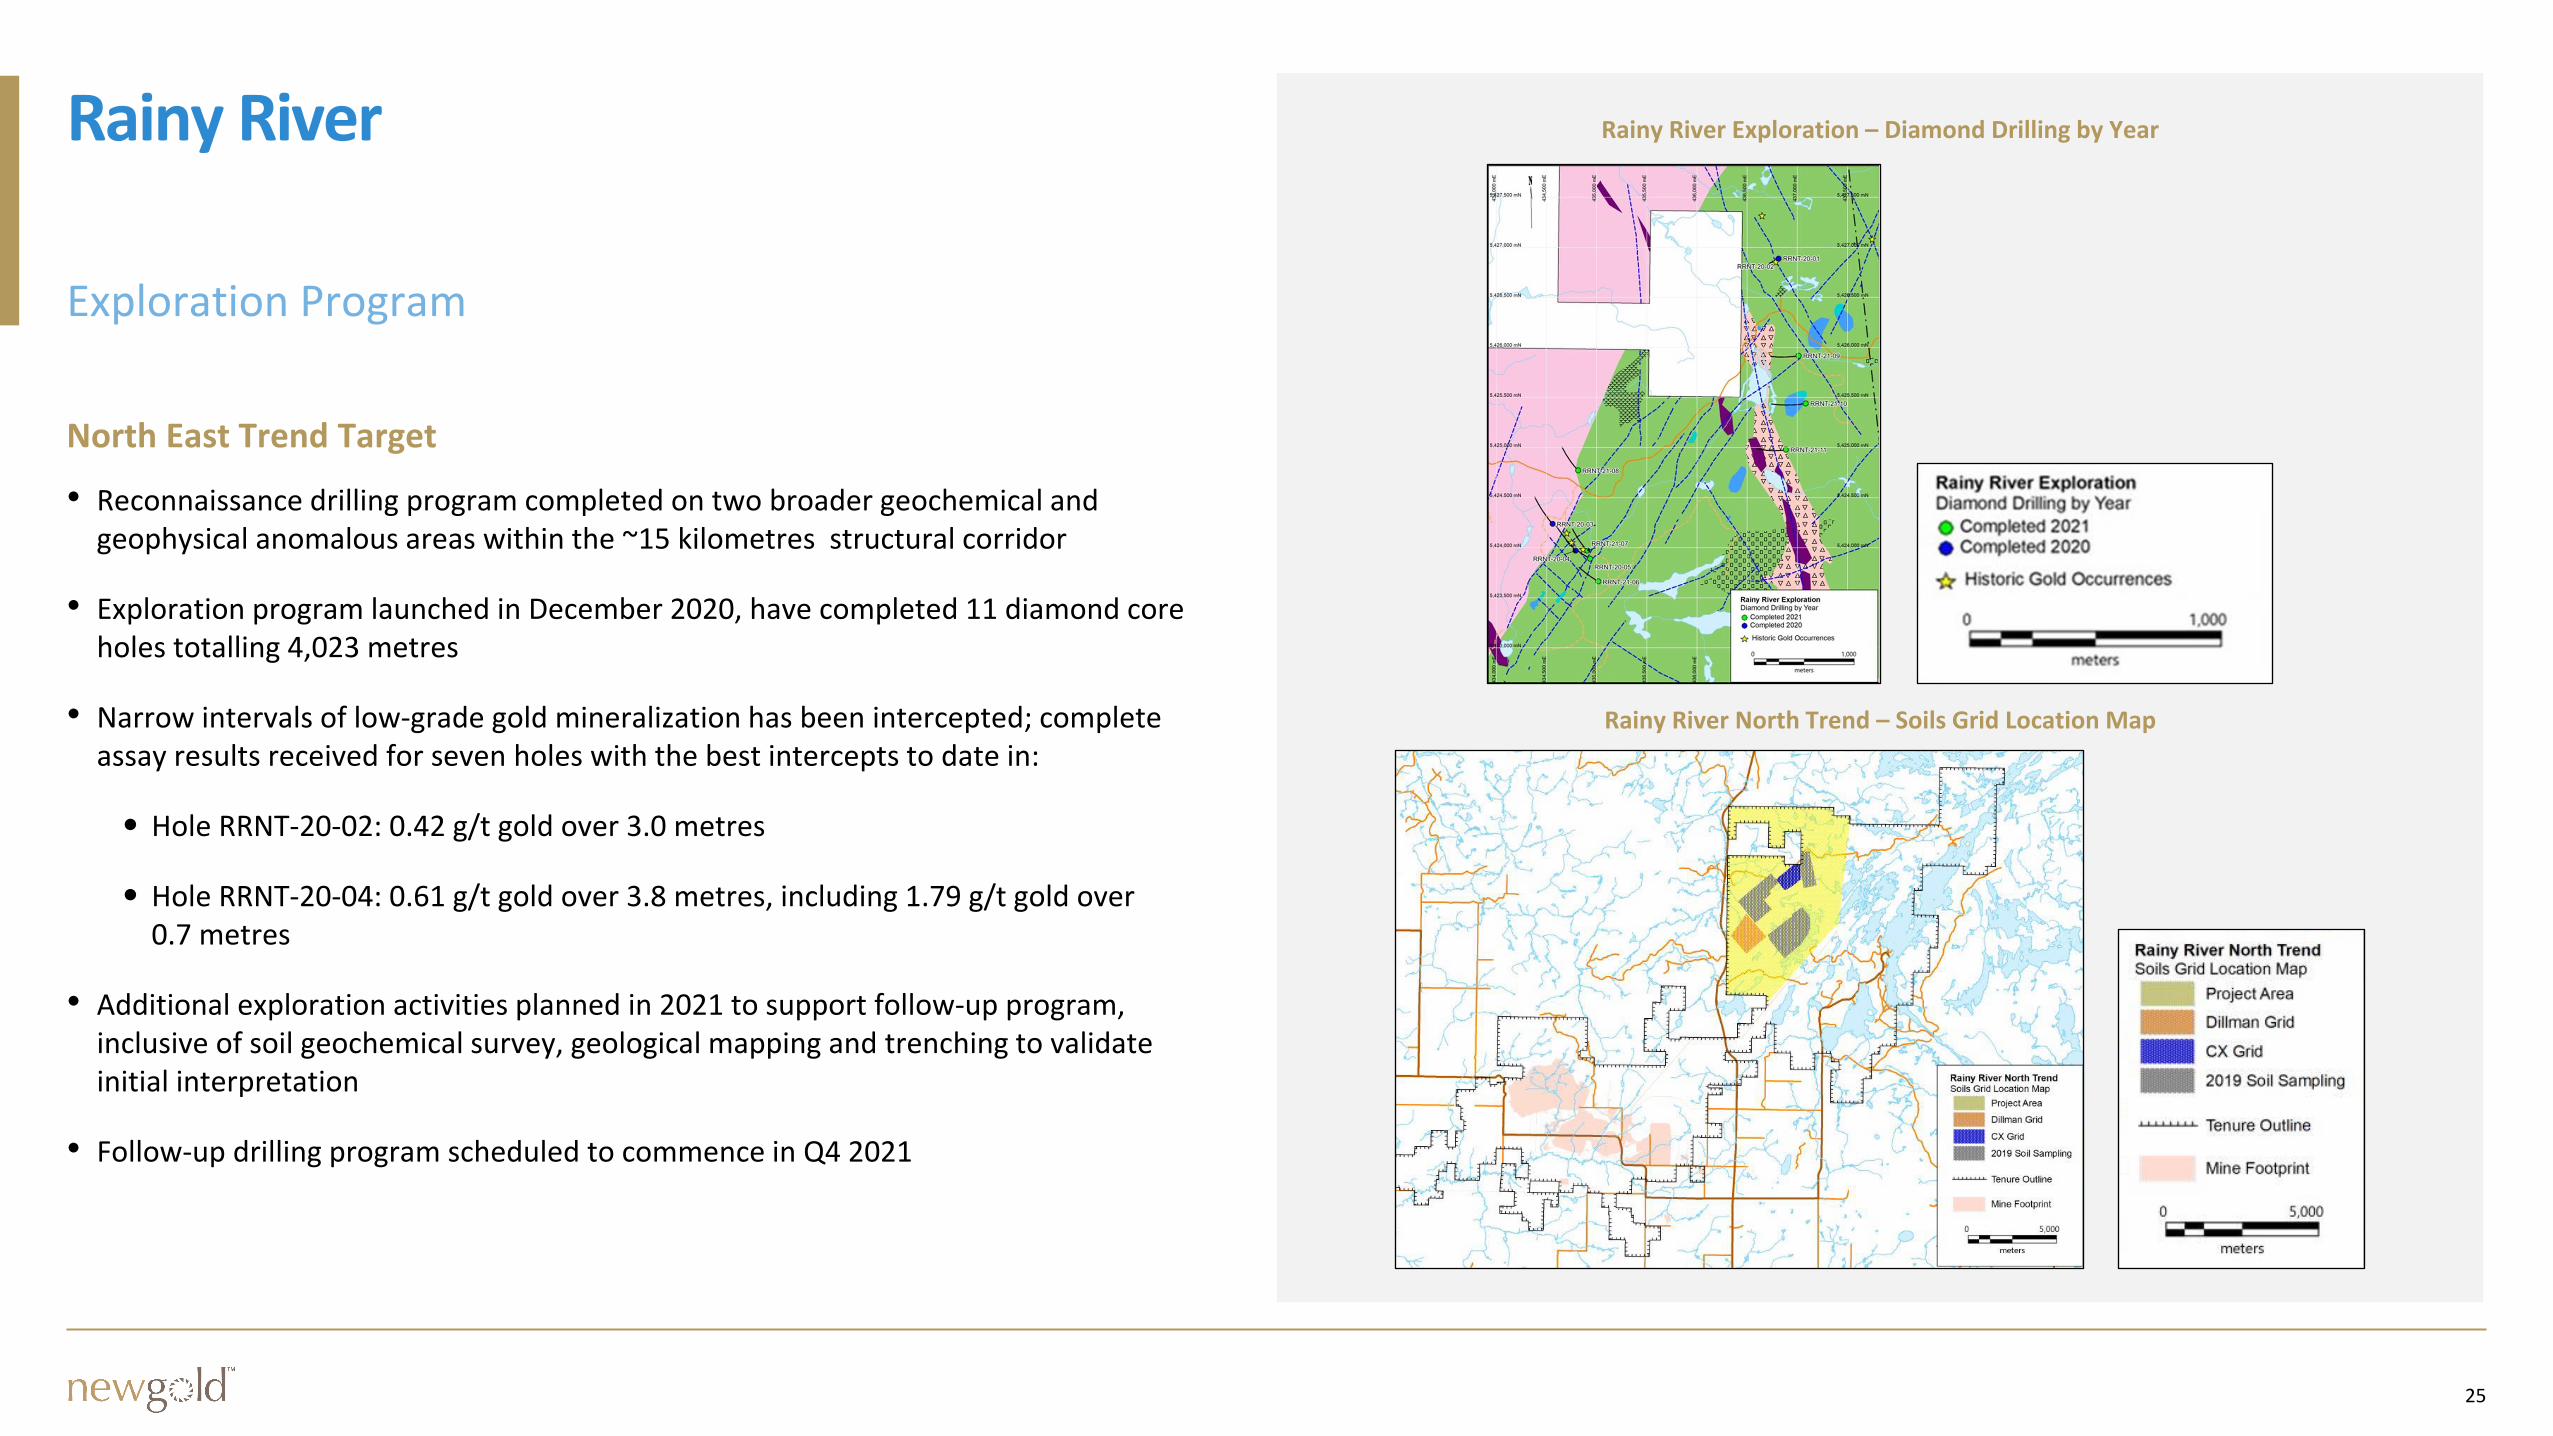
Rainy River Exploration – Diamond Drilling by Year
Rainy River North Trend – Soils Grid Location Map
Rainy River
North East Trend Target
• Reconnaissance drilling program completed on two broader geochemical and geophysical anomalous areas within the ~15 kilometres structural corridor
• Exploration program launched in December 2020, have completed 11 diamond core holes totalling 4,023 metres
• Narrow intervals of low-grade gold mineralization has been intercepted; complete assay results received for seven holes with the best intercepts to date in:
• Hole RRNT-20-02: 0.42 g/t gold over 3.0 metres
• Hole RRNT-20-04: 0.61 g/t gold over 3.8 metres, including 1.79 g/t gold over 0.7 metres
• Additional exploration activities planned in 2021 to support follow-up program, inclusive of soil geochemical survey, geological mapping and trenching to validate initial interpretation
• Follow-up drilling program scheduled to commence in Q4 2021
26
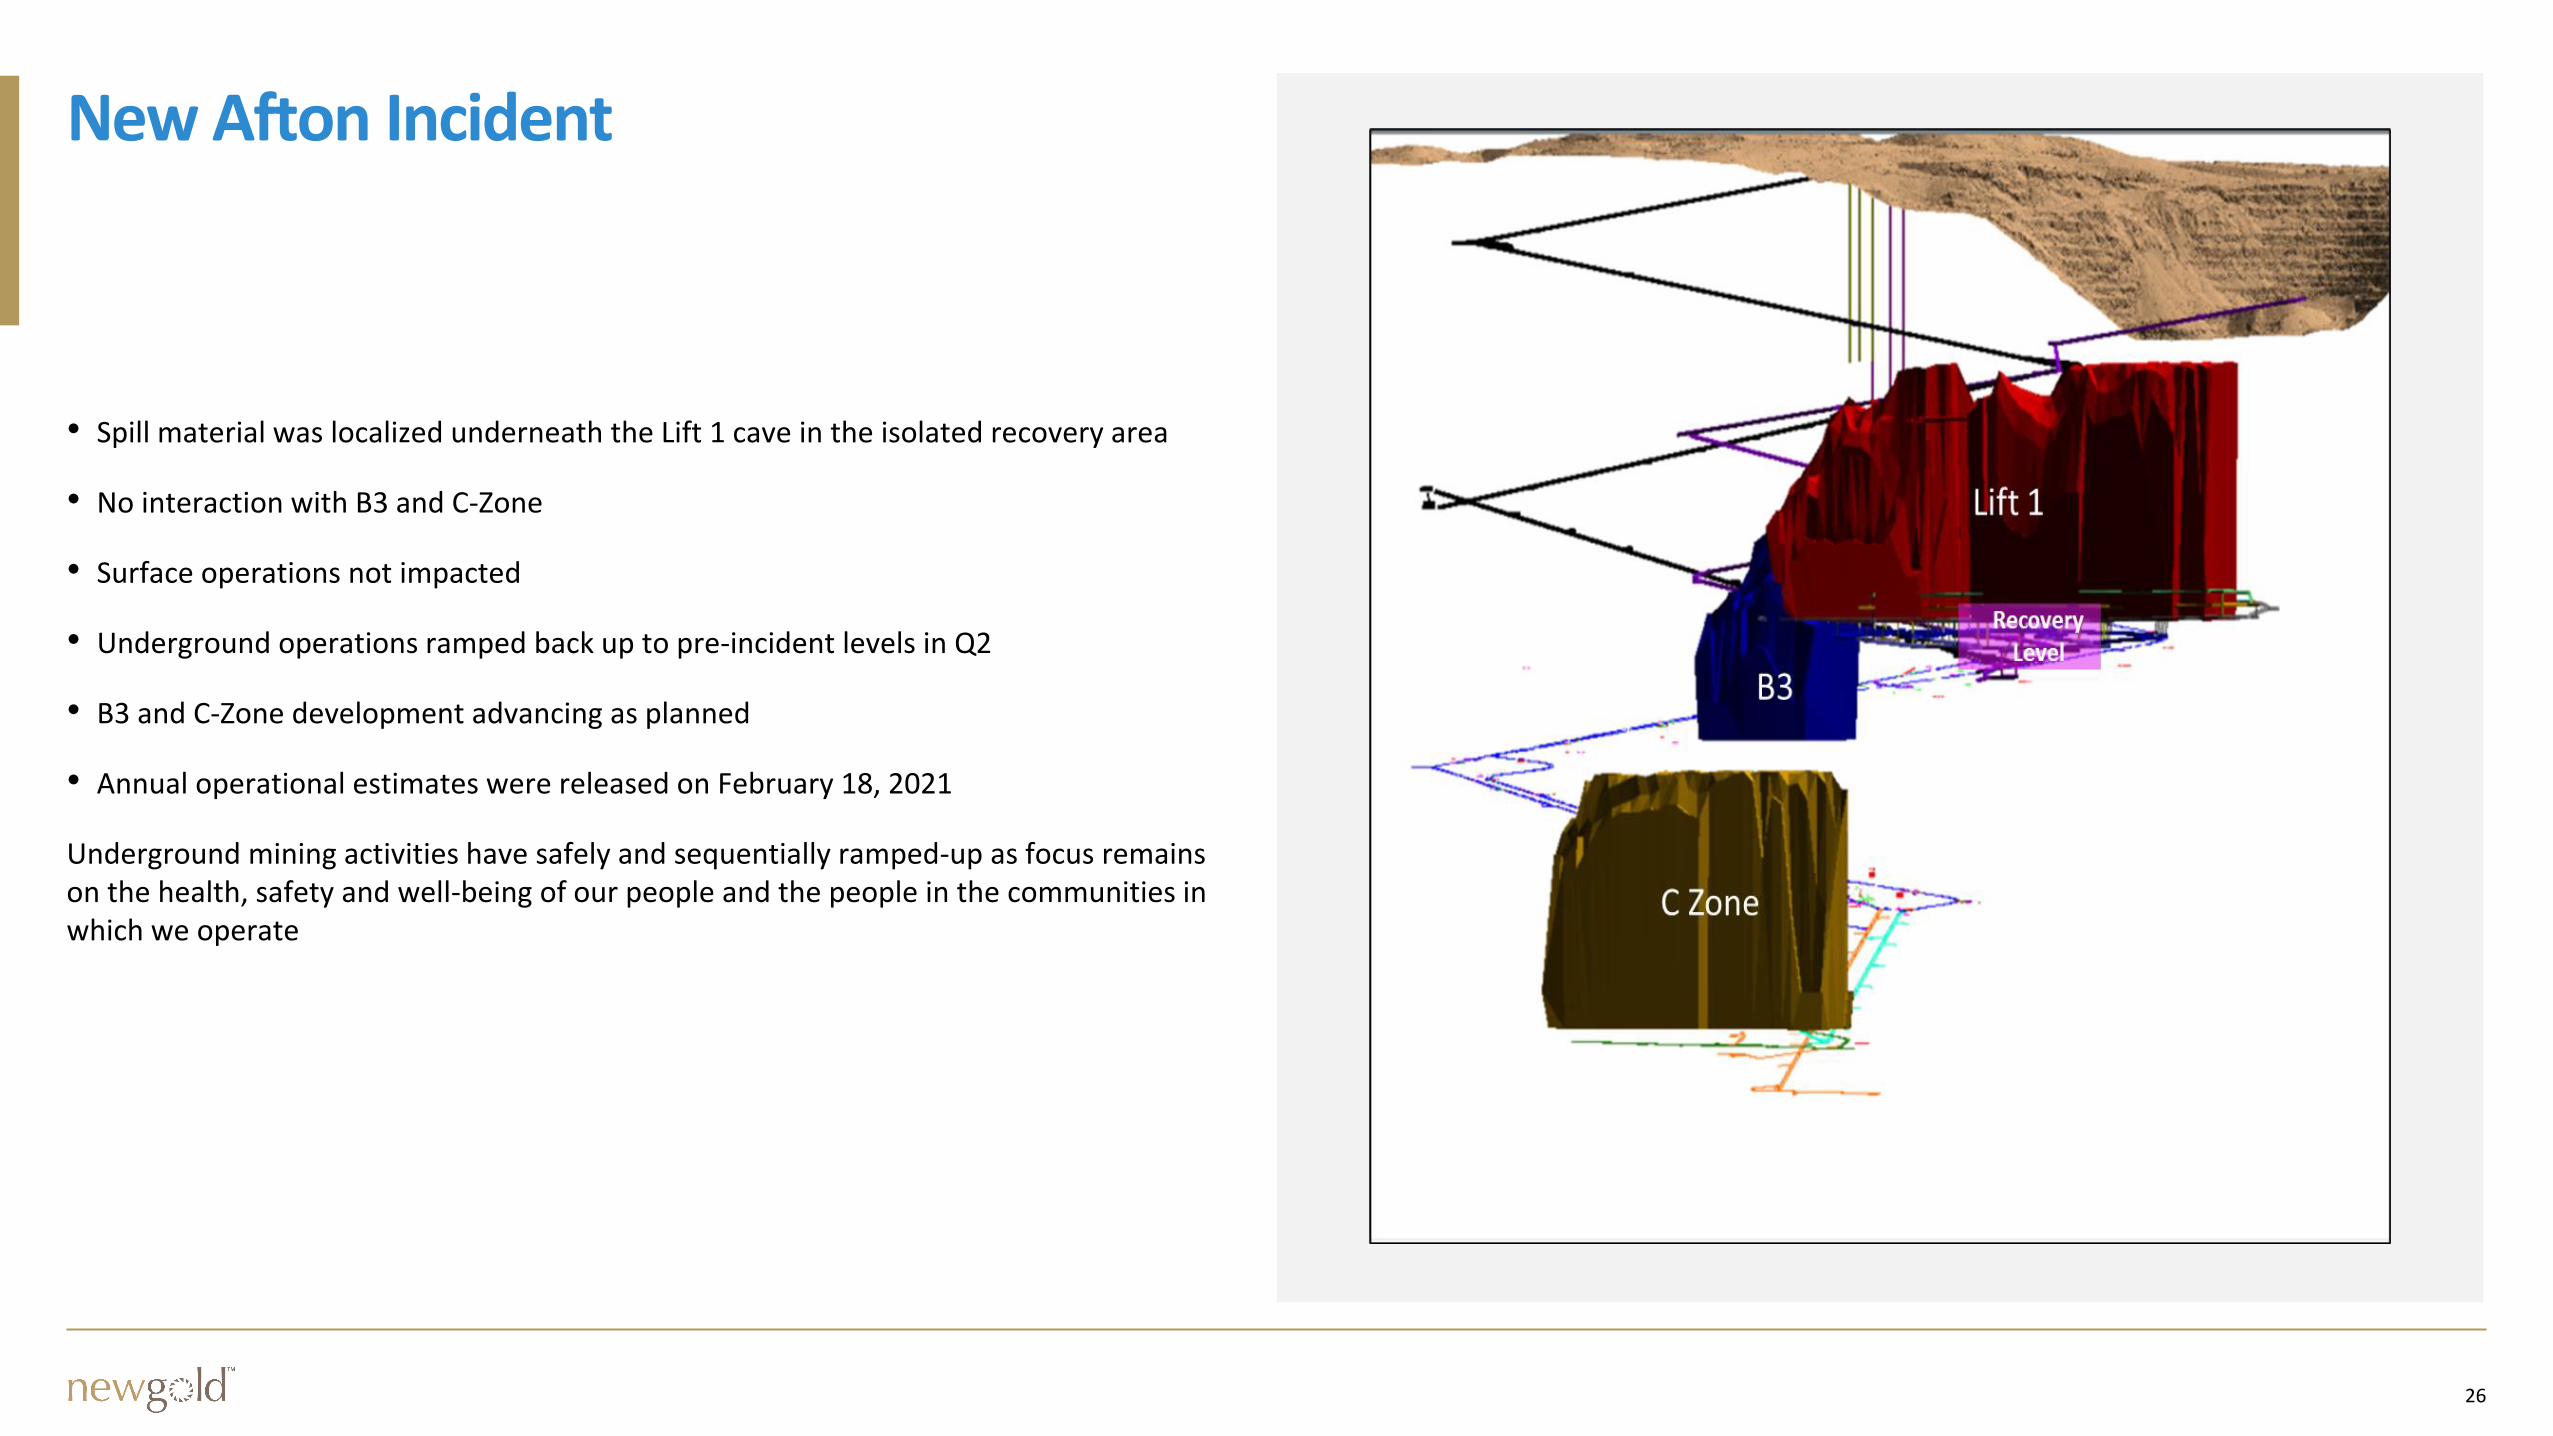
New Afton Incident
• Spill material was localized underneath the Lift 1 cave in the isolated recovery area
• No interaction with B3 and C-Zone
• Surface operations not impacted
• Underground operations ramped back up to pre-incident levels in Q2
• B3 and C-Zone development advancing as planned
• Annual operational estimates were released on February 18, 2021
Underground mining activities have safely and sequentially ramped-up as focus remains on the health, safety and well-being of our people and the people in the communities in which we operate
Lift 1
B3
C-Zone
27
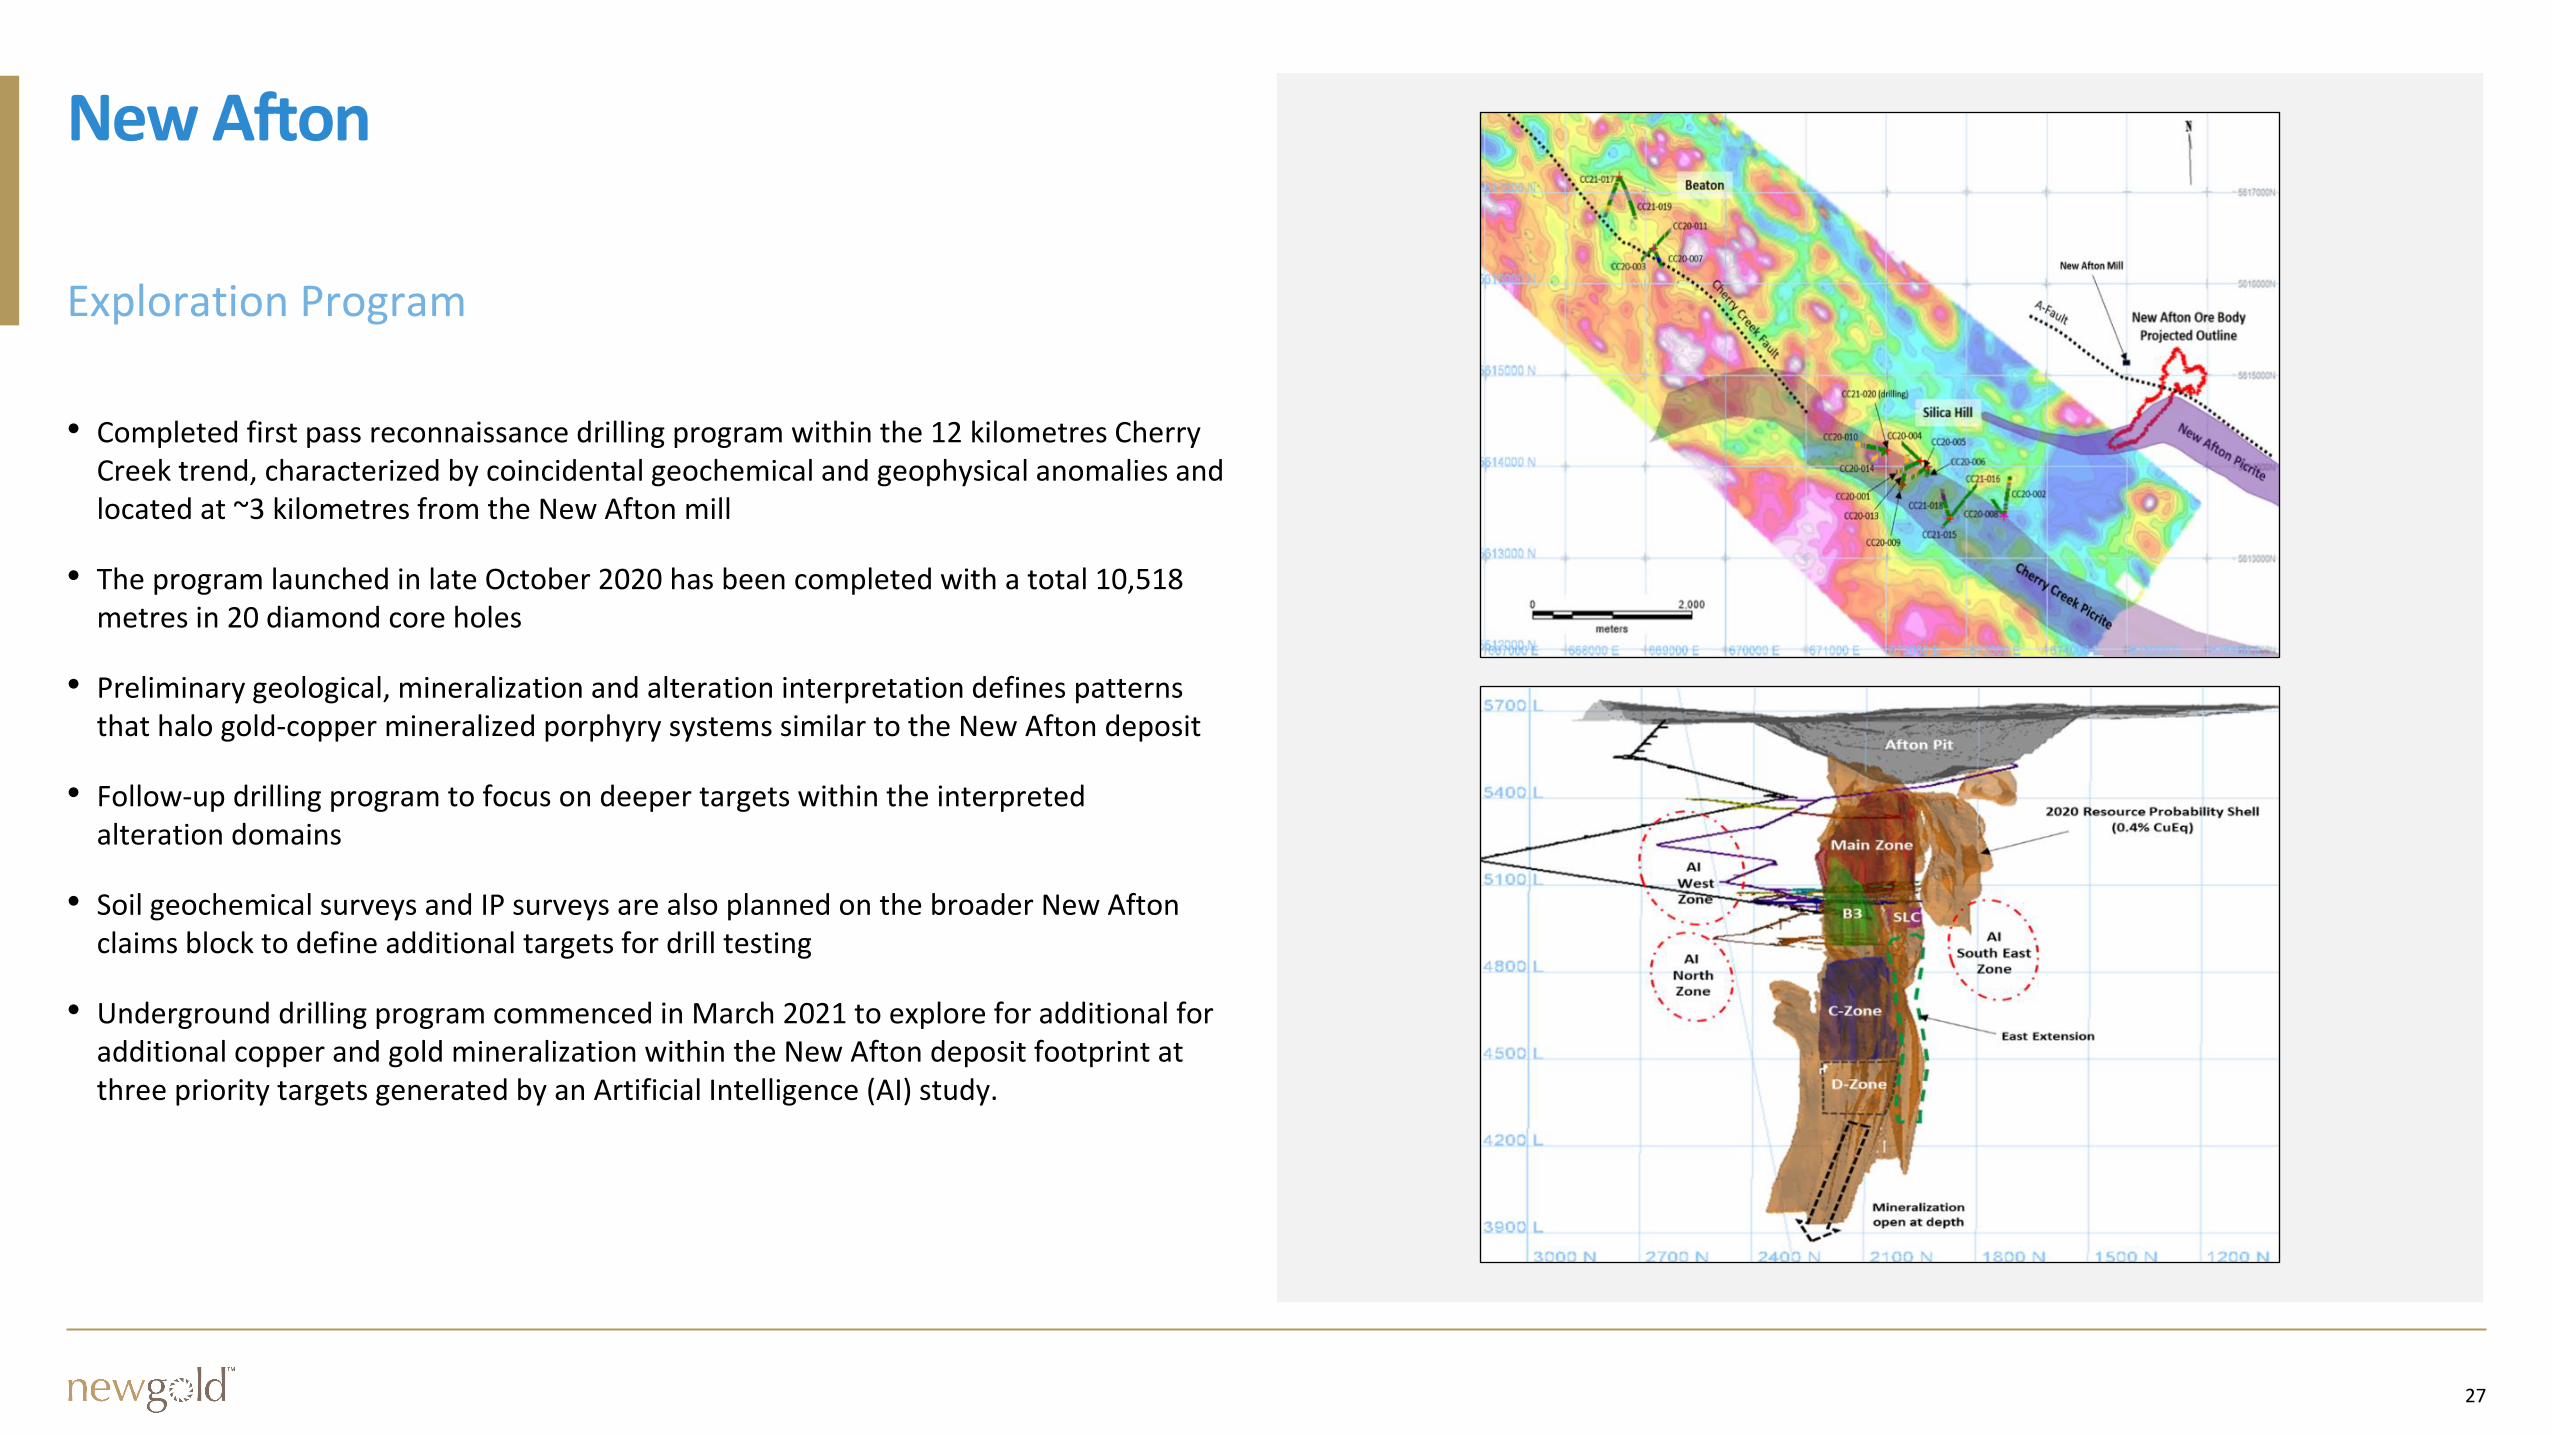
New Afton
• Completed first pass reconnaissance drilling program within the 12 kilometres Cherry Creek trend, characterized by coincidental geochemical and geophysical anomalies and located at ~3 kilometres from the New Afton mill
• The program launched in late October 2020 has been completed with a total 10,518 metres in 20 diamond core holes
• Preliminary geological, mineralization and alteration interpretation defines patterns that halo gold-copper mineralized porphyry systems similar to the New Afton deposit
• Follow-up drilling program to focus on deeper targets within the interpreted alteration domains
• Soil geochemical surveys and IP surveys are also planned on the broader New Afton claims block to define additional targets for drill testing
• Underground drilling program commenced in March 2021 to explore for additional for additional copper and gold mineralization within the New Afton deposit footprint at three priority targets generated by an Artificial Intelligence (AI) study.
28
COVID-19
Employee and community health and safety
• The health and safety of our employees and communities remains number one priority
• Full compliance with government and health agency recommendations
• Restricted access to sites; travel restrictions; enhanced sanitization practices; self-isolation; community-based consultations; optimized plans for transport and employee accommodation; social distancing; work from home options (see www.newgold.com/covid-19/ for further details)
Supply chain continuity
• Supply chain secure for key items; no disruptions to supply anticipated
• Standard inventory items on hand; required quantities being maintained
• Long-lead items remain on schedule
Business continuity plans and Rapid Response Team fully mobilized
• Scenario-based business continuity plans developed
• Rainy River continues rapid testing for COVID-19 for employees and contractors
• New Afton implemented wearable contact tracing devices and employs a team of trained contact tracers
29
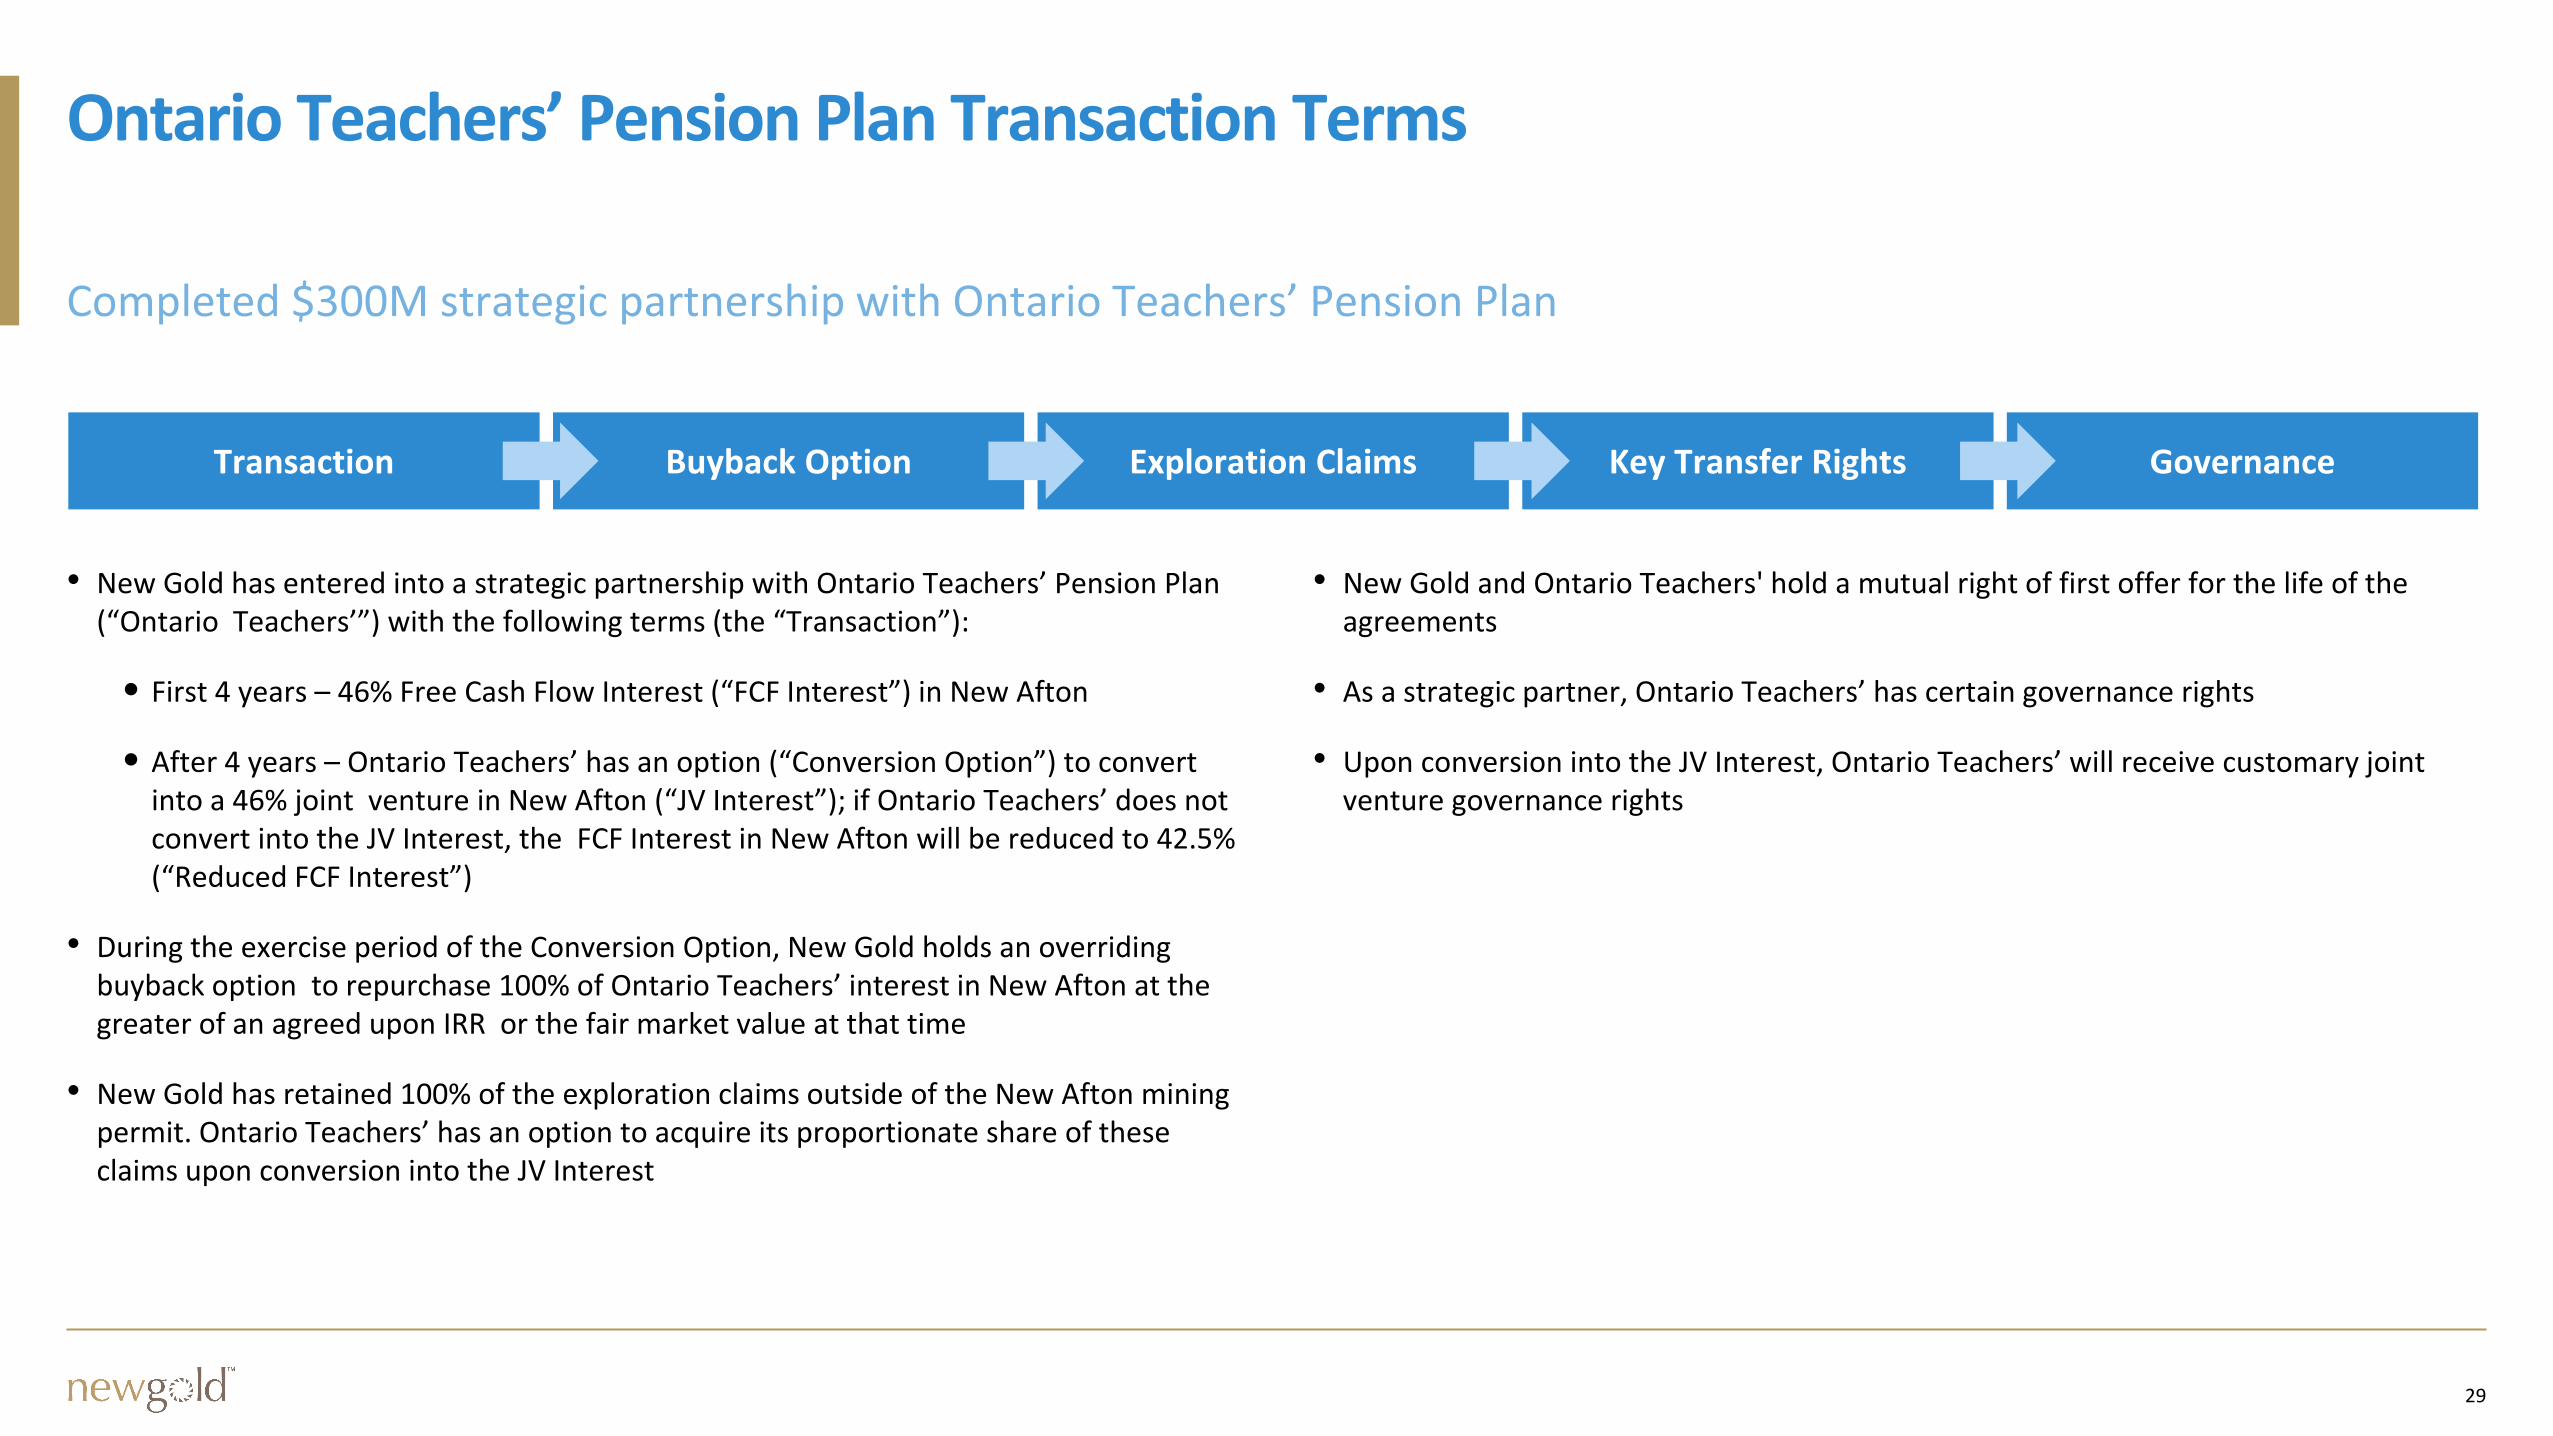
Ontario Teachers’ Pension Plan Transaction Terms
• New Gold has entered into a strategic partnership with Ontario Teachers’ Pension Plan (“Ontario Teachers’”) with the following terms (the “Transaction”):
• First 4 years – 46% Free Cash Flow Interest (“FCF Interest”) in New Afton
• After 4 years – Ontario Teachers’ has an option (“Conversion Option”) to convert into a 46% joint venture in New Afton (“JV Interest”); if Ontario Teachers’ does not convert into the JV Interest, the FCF Interest in New Afton will be reduced to 42.5% (“Reduced FCF Interest”)
• During the exercise period of the Conversion Option, New Gold holds an overriding buyback option to repurchase 100% of Ontario Teachers’ interest in New Afton at the greater of an agreed upon IRR or the fair market value at that time
• New Gold has retained 100% of the exploration claims outside of the New Afton mining permit. Ontario Teachers’ has an option to acquire its proportionate share of these claims upon conversion into the JV Interest
• New Gold and Ontario Teachers' hold a mutual right of first offer for the life of the agreements
• As a strategic partner, Ontario Teachers’ has certain governance rights
• Upon conversion into the JV Interest, Ontario Teachers’ will receive customary joint venture governance rights
Transaction Buyback Option Exploration Claims Key Transfer Rights Governance
30
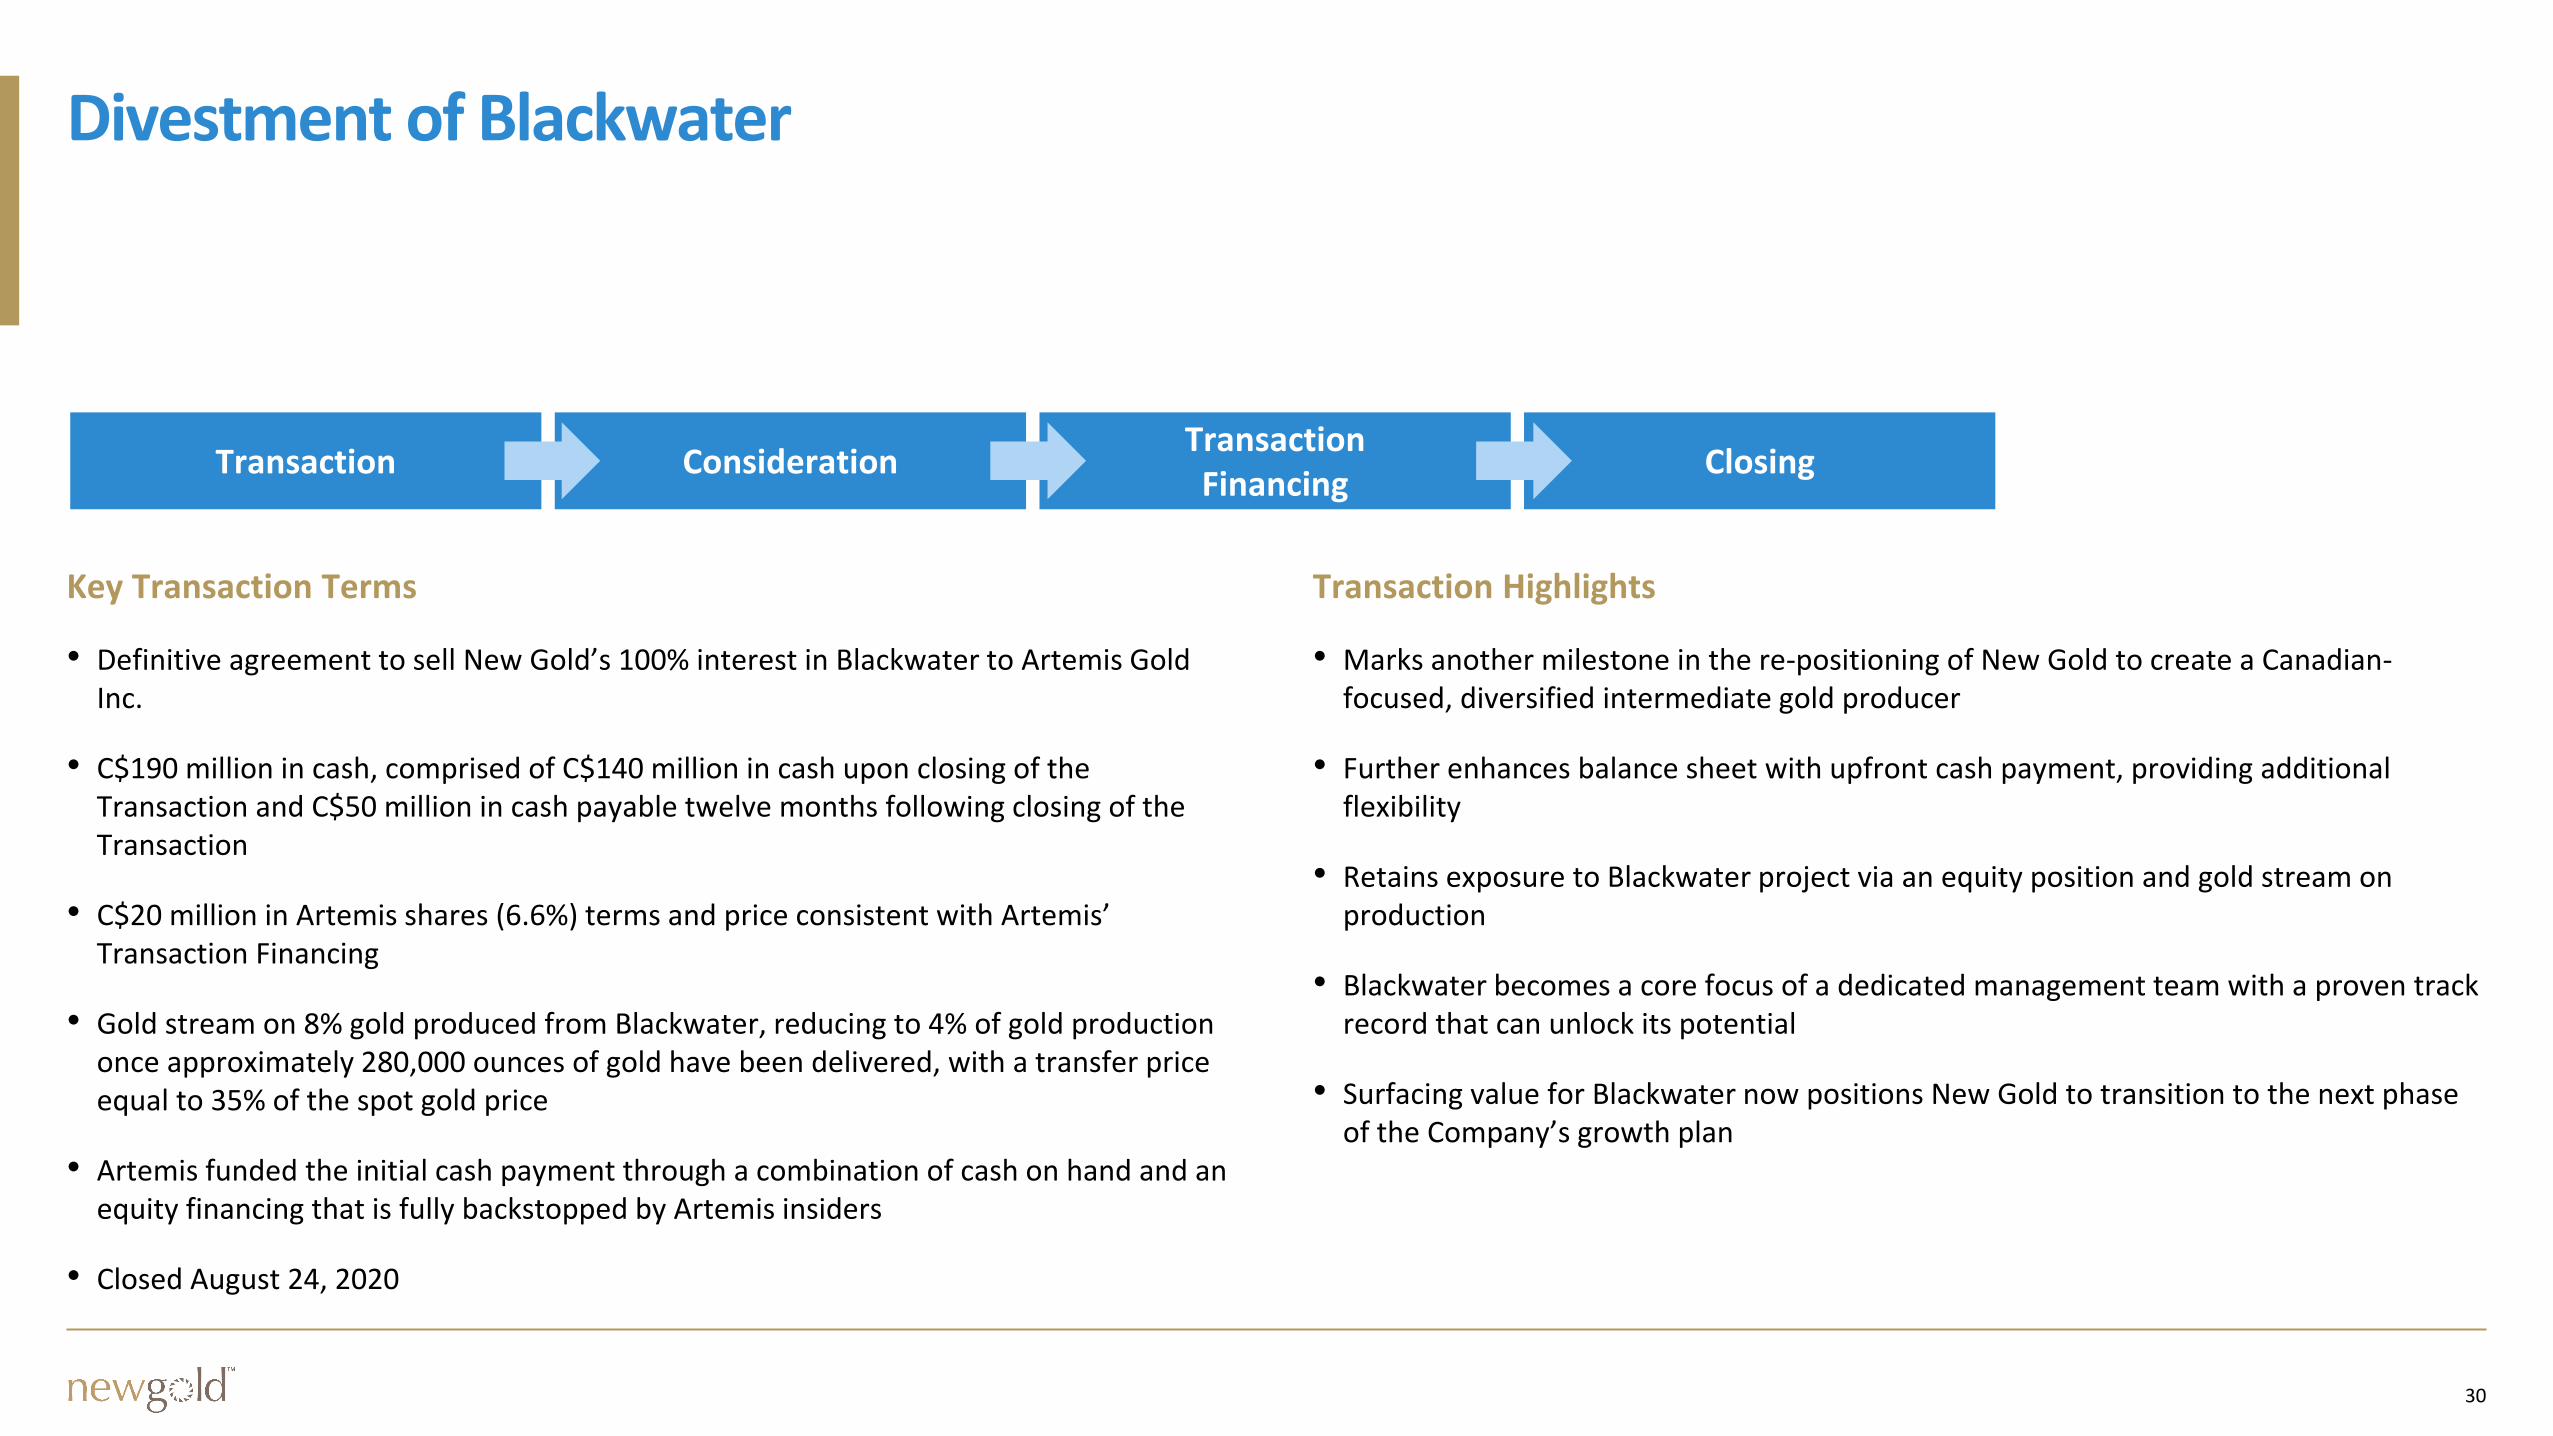
Divestment of Blackwater
Transaction ConsiderationTransaction
FinancingClosing
Key Transaction Terms
• Definitive agreement to sell New Gold’s 100% interest in Blackwater to Artemis Gold Inc.
• C$190 million in cash, comprised of C$140 million in cash upon closing of the Transaction and C$50 million in cash payable twelve months following closing of the Transaction
• C$20 million in Artemis shares (6.6%) terms and price consistent with Artemis’ Transaction Financing
• Gold stream on 8% gold produced from Blackwater, reducing to 4% of gold production once approximately 280,000 ounces of gold have been delivered, with a transfer price equal to 35% of the spot gold price
• Artemis funded the initial cash payment through a combination of cash on hand and an equity financing that is fully backstopped by Artemis insiders
• Closed August 24, 2020
Transaction Highlights
• Marks another milestone in the re-positioning of New Gold to create a Canadian-focused, diversified intermediate gold producer
• Further enhances balance sheet with upfront cash payment, providing additional flexibility
• Retains exposure to Blackwater project via an equity position and gold stream on production
• Blackwater becomes a core focus of a dedicated management team with a proven track record that can unlock its potential
• Surfacing value for Blackwater now positions New Gold to transition to the next phase of the Company’s growth plan
31
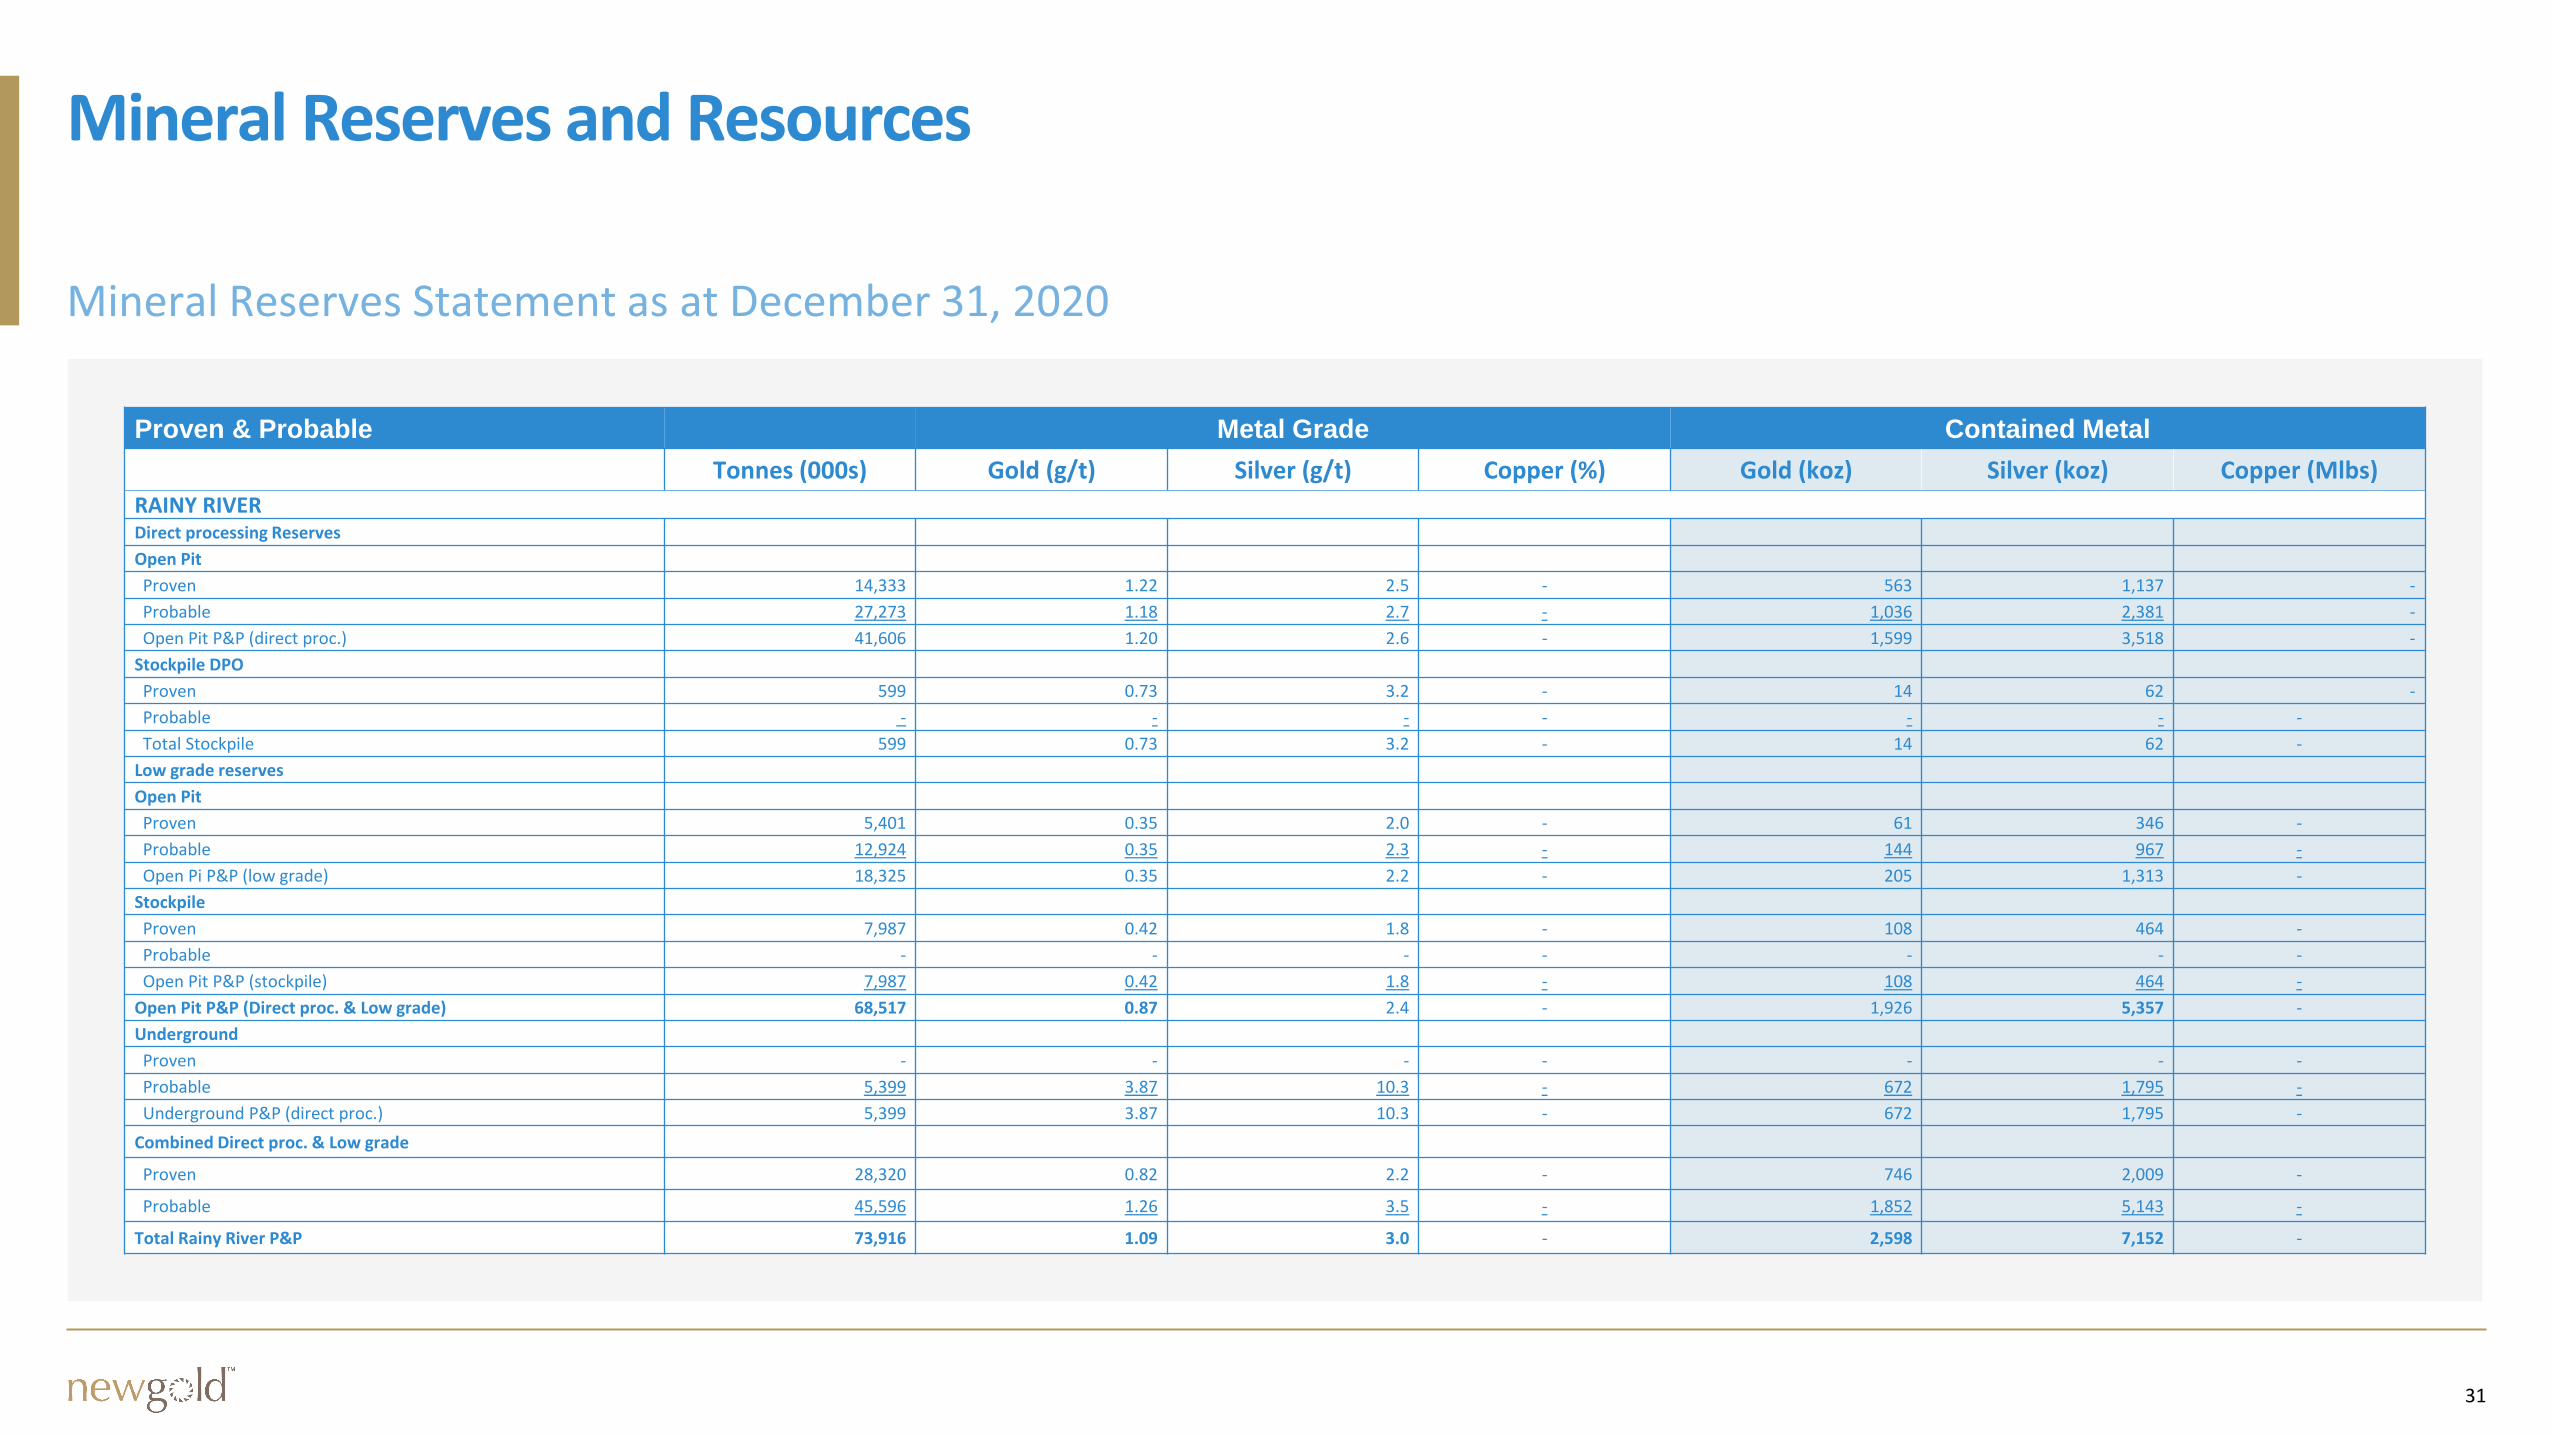
Mineral Reserves and Resources
Proven & Probable Metal Grade Contained Metal
Tonnes (000s) Gold (g/t) Silver (g/t) Copper (%) Gold (koz) Silver (koz) Copper (Mlbs)
RAINY RIVERDirect processing Reserves
Open Pit
Proven 14,333 1.22 2.5 - 563 1,137 -
Probable 27,273 1.18 2.7 - 1,036 2,381 -
Open Pit P&P (direct proc.) 41,606 1.20 2.6 - 1,599 3,518 -
Stockpile DPO
Proven 599 0.73 3.2 - 14 62 -
Probable - - - - - - -
Total Stockpile 599 0.73 3.2 - 14 62 -
Low grade reserves
Open Pit
Proven 5,401 0.35 2.0 - 61 346 -
Probable 12,924 0.35 2.3 - 144 967 -
Open Pi P&P (low grade) 18,325 0.35 2.2 - 205 1,313 -
Stockpile
Proven 7,987 0.42 1.8 - 108 464 -
Probable - - - - - - -
Open Pit P&P (stockpile) 7,987 0.42 1.8 - 108 464 -
Open Pit P&P (Direct proc. & Low grade) 68,517 0.87 2.4 - 1,926 5,357 -
Underground
Proven - - - - - - -
Probable 5,399 3.87 10.3 - 672 1,795 -
Underground P&P (direct proc.) 5,399 3.87 10.3 - 672 1,795 -
Combined Direct proc. & Low grade
Proven 28,320 0.82 2.2 - 746 2,009 -
Probable 45,596 1.26 3.5 - 1,852 5,143 -
Total Rainy River P&P 73,916 1.09 3.0 - 2,598 7,152 -
32
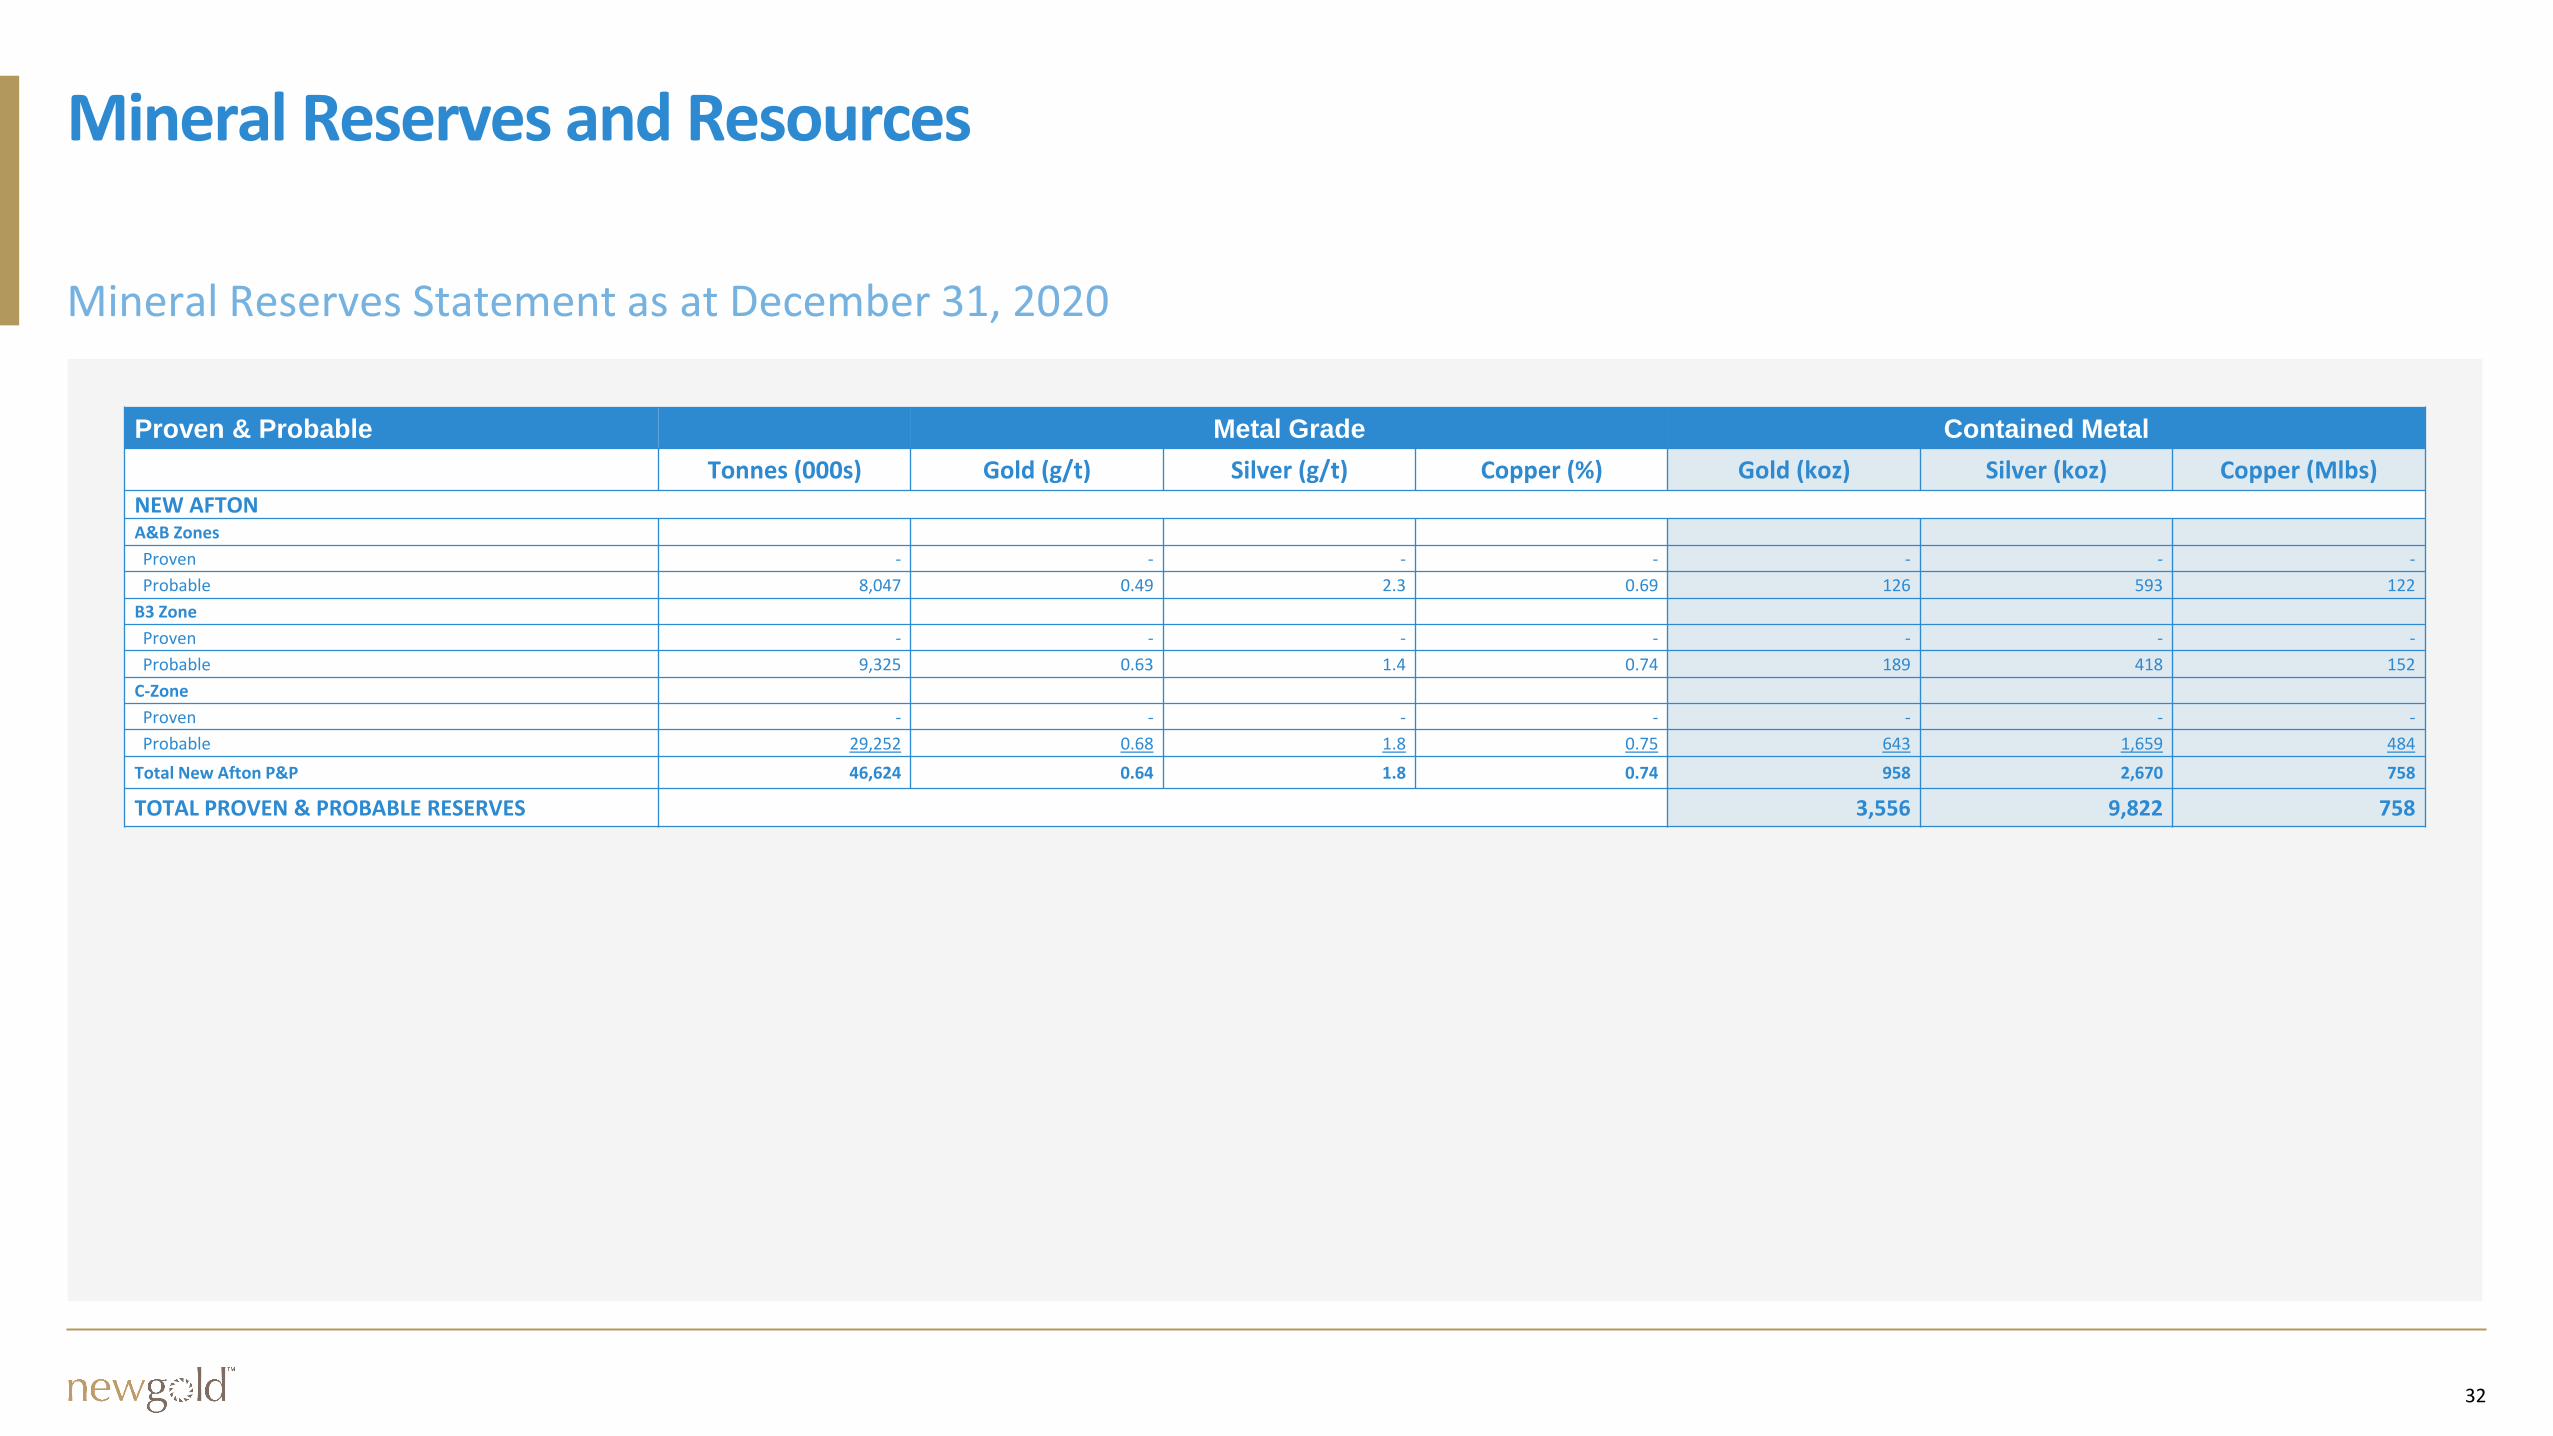
Mineral Reserves and Resources
Proven & Probable Metal Grade Contained Metal
Tonnes (000s) Gold (g/t) Silver (g/t) Copper (%) Gold (koz) Silver (koz) Copper (Mlbs)
NEW AFTONA&B Zones
Proven - - - - - - -
Probable 8,047 0.49 2.3 0.69 126 593 122
B3 Zone
Proven - - - - - - -
Probable 9,325 0.63 1.4 0.74 189 418 152
C-Zone
Proven - - - - - - -
Probable 29,252 0.68 1.8 0.75 643 1,659 484
Total New Afton P&P 46,624 0.64 1.8 0.74 958 2,670 758
TOTAL PROVEN & PROBABLE RESERVES 3,556 9,822 758
33
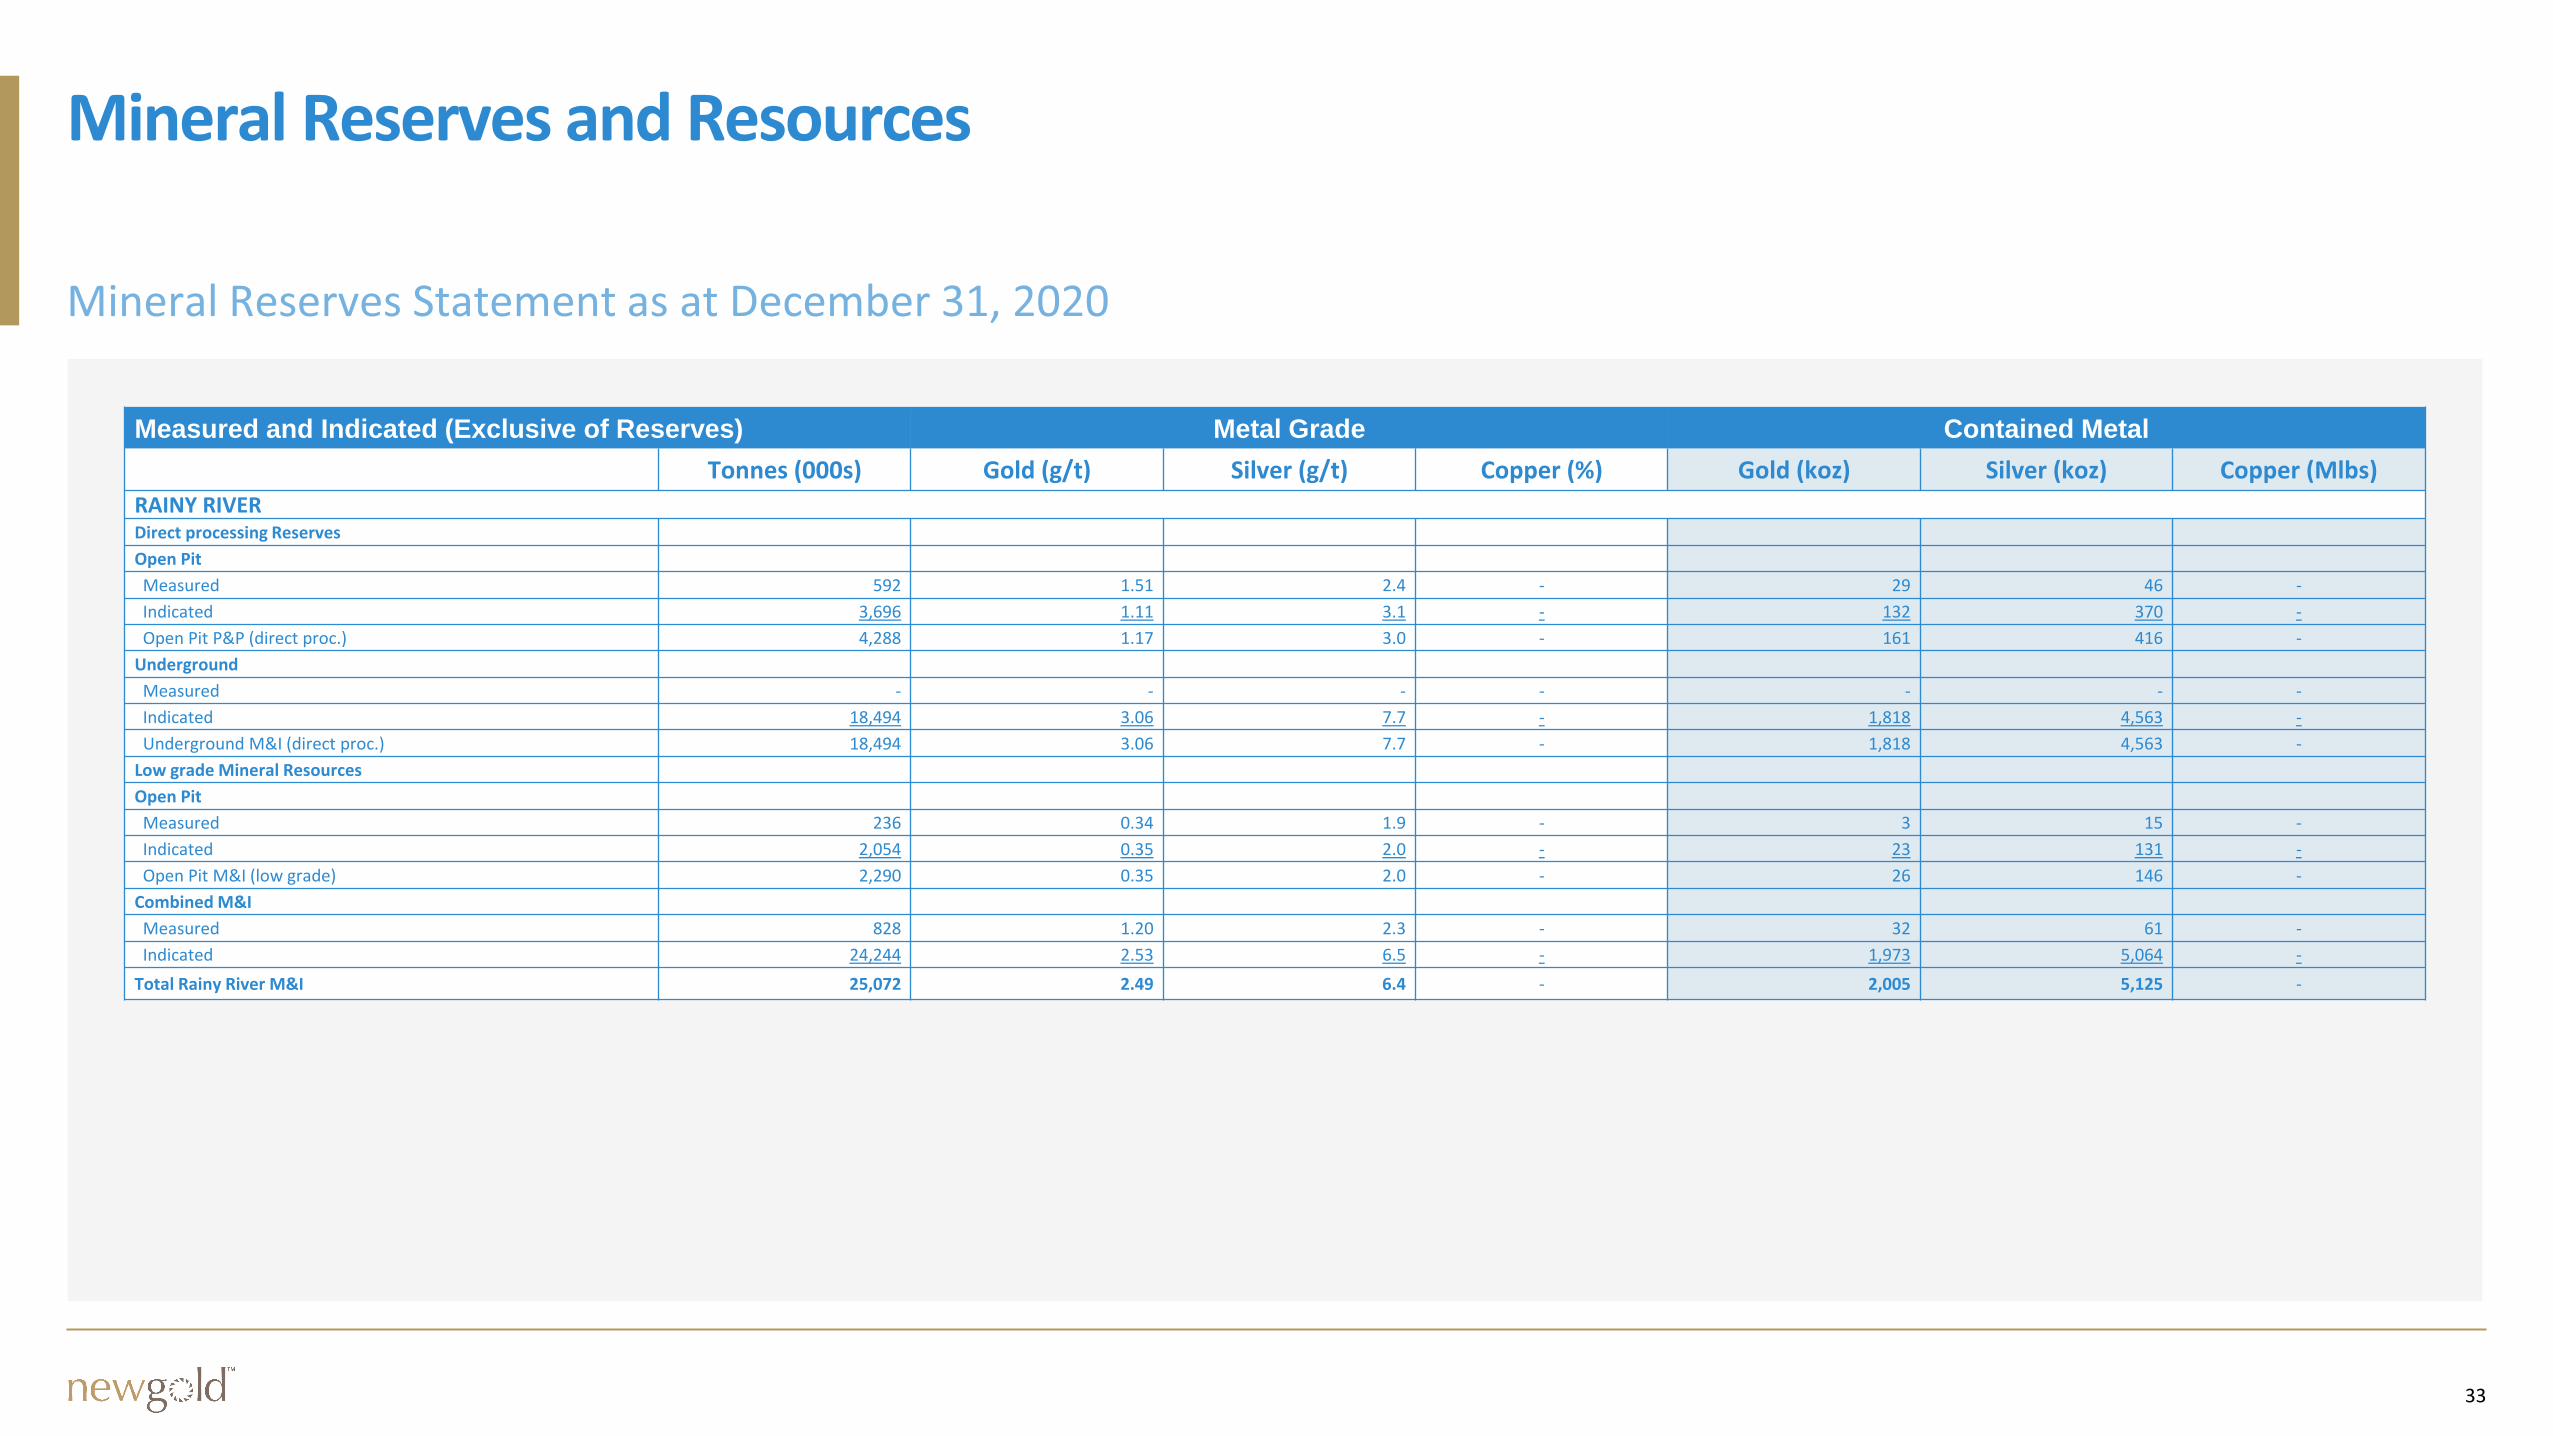
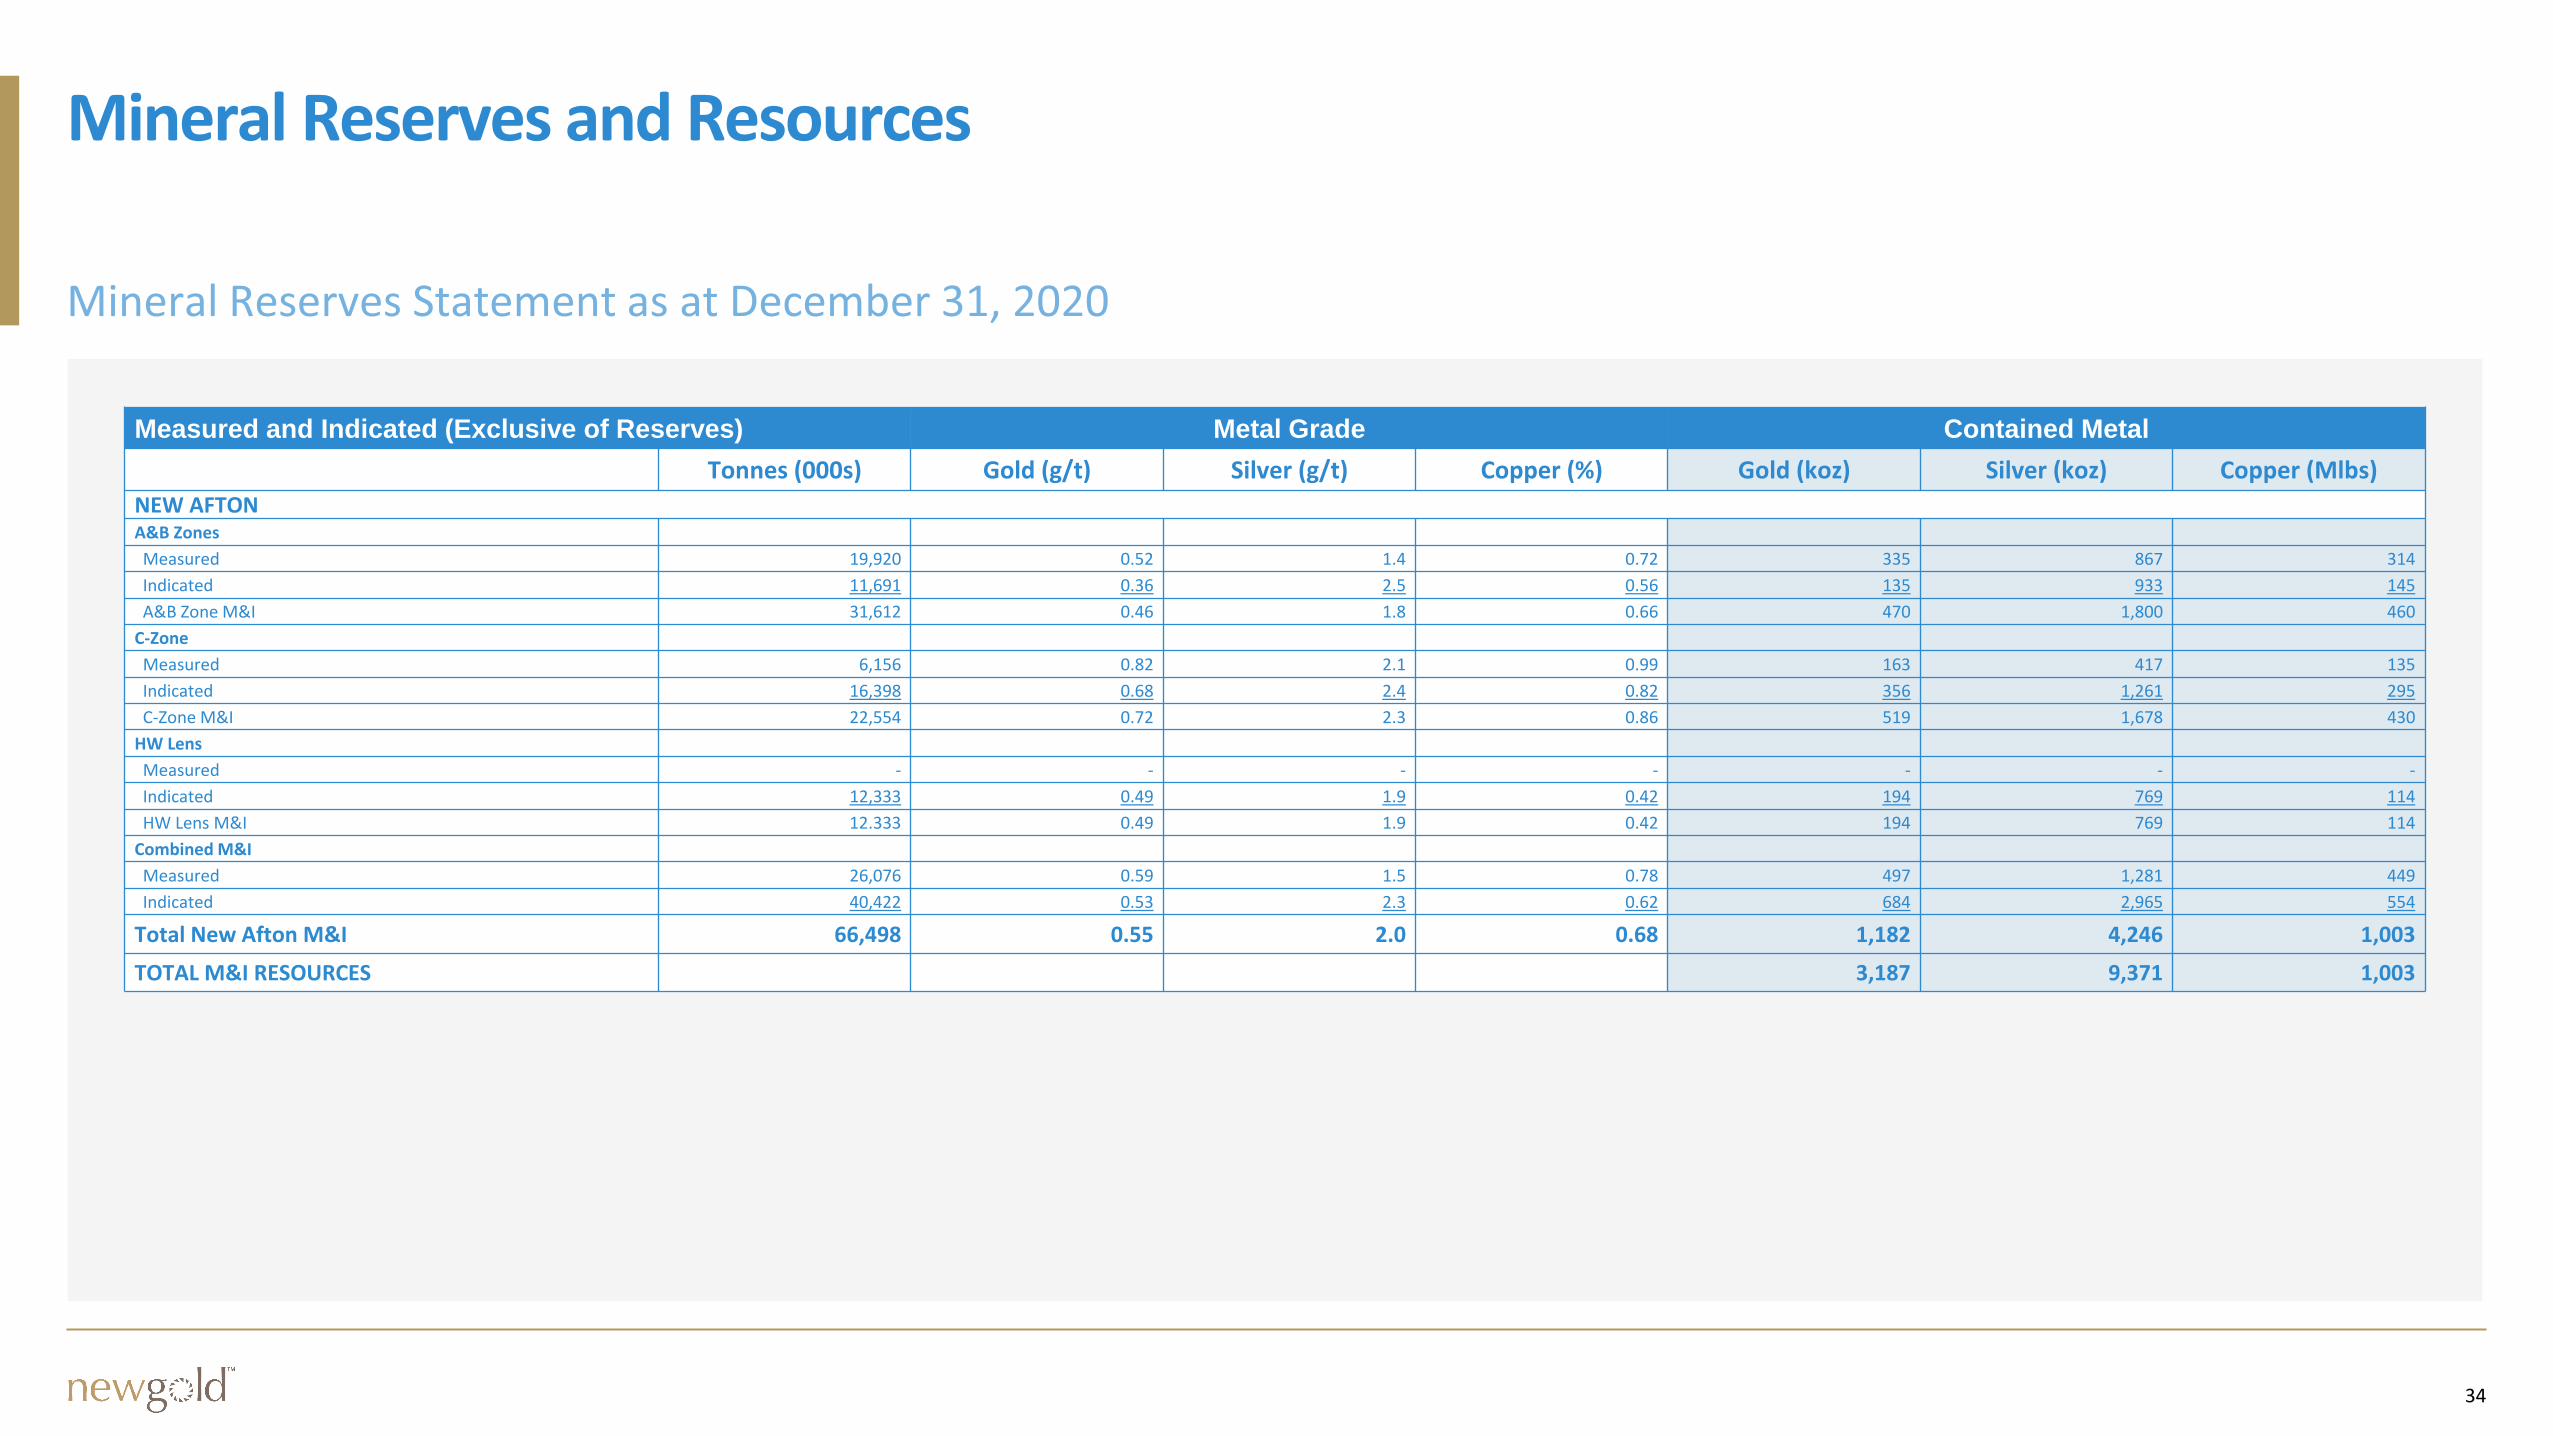
Mineral Reserves and Resources
Measured and Indicated (Exclusive of Reserves) Metal Grade Contained Metal
Tonnes (000s) Gold (g/t) Silver (g/t) Copper (%) Gold (koz) Silver (koz) Copper (Mlbs)
RAINY RIVERDirect processing Reserves
Open Pit
Measured 592 1.51 2.4 - 29 46 -
Indicated 3,696 1.11 3.1 - 132 370 -
Open Pit P&P (direct proc.) 4,288 1.17 3.0 - 161 416 -
Underground
Measured - - - - - - -
Indicated 18,494 3.06 7.7 - 1,818 4,563 -
Underground M&I (direct proc.) 18,494 3.06 7.7 - 1,818 4,563 -
Low grade Mineral Resources
Open Pit
Measured 236 0.34 1.9 - 3 15 -
Indicated 2,054 0.35 2.0 - 23 131 -
Open Pit M&I (low grade) 2,290 0.35 2.0 - 26 146 -
Combined M&I
Measured 828 1.20 2.3 - 32 61 -
Indicated 24,244 2.53 6.5 - 1,973 5,064 -
Total Rainy River M&I 25,072 2.49 6.4 - 2,005 5,125 -
34
Mineral Reserves and Resources
Measured and Indicated (Exclusive of Reserves) Metal Grade Contained Metal
Tonnes (000s) Gold (g/t) Silver (g/t) Copper (%) Gold (koz) Silver (koz) Copper (Mlbs)
NEW AFTONA&B Zones
Measured 19,920 0.52 1.4 0.72 335 867 314
Indicated 11,691 0.36 2.5 0.56 135 933 145
A&B Zone M&I 31,612 0.46 1.8 0.66 470 1,800 460
C-Zone
Measured 6,156 0.82 2.1 0.99 163 417 135
Indicated 16,398 0.68 2.4 0.82 356 1,261 295
C-Zone M&I 22,554 0.72 2.3 0.86 519 1,678 430
HW Lens
Measured - - - - - - -
Indicated 12,333 0.49 1.9 0.42 194 769 114
HW Lens M&I 12.333 0.49 1.9 0.42 194 769 114
Combined M&I
Measured 26,076 0.59 1.5 0.78 497 1,281 449
Indicated 40,422 0.53 2.3 0.62 684 2,965 554
Total New Afton M&I 66,498 0.55 2.0 0.68 1,182 4,246 1,003
TOTAL M&I RESOURCES 3,187 9,371 1,003
35
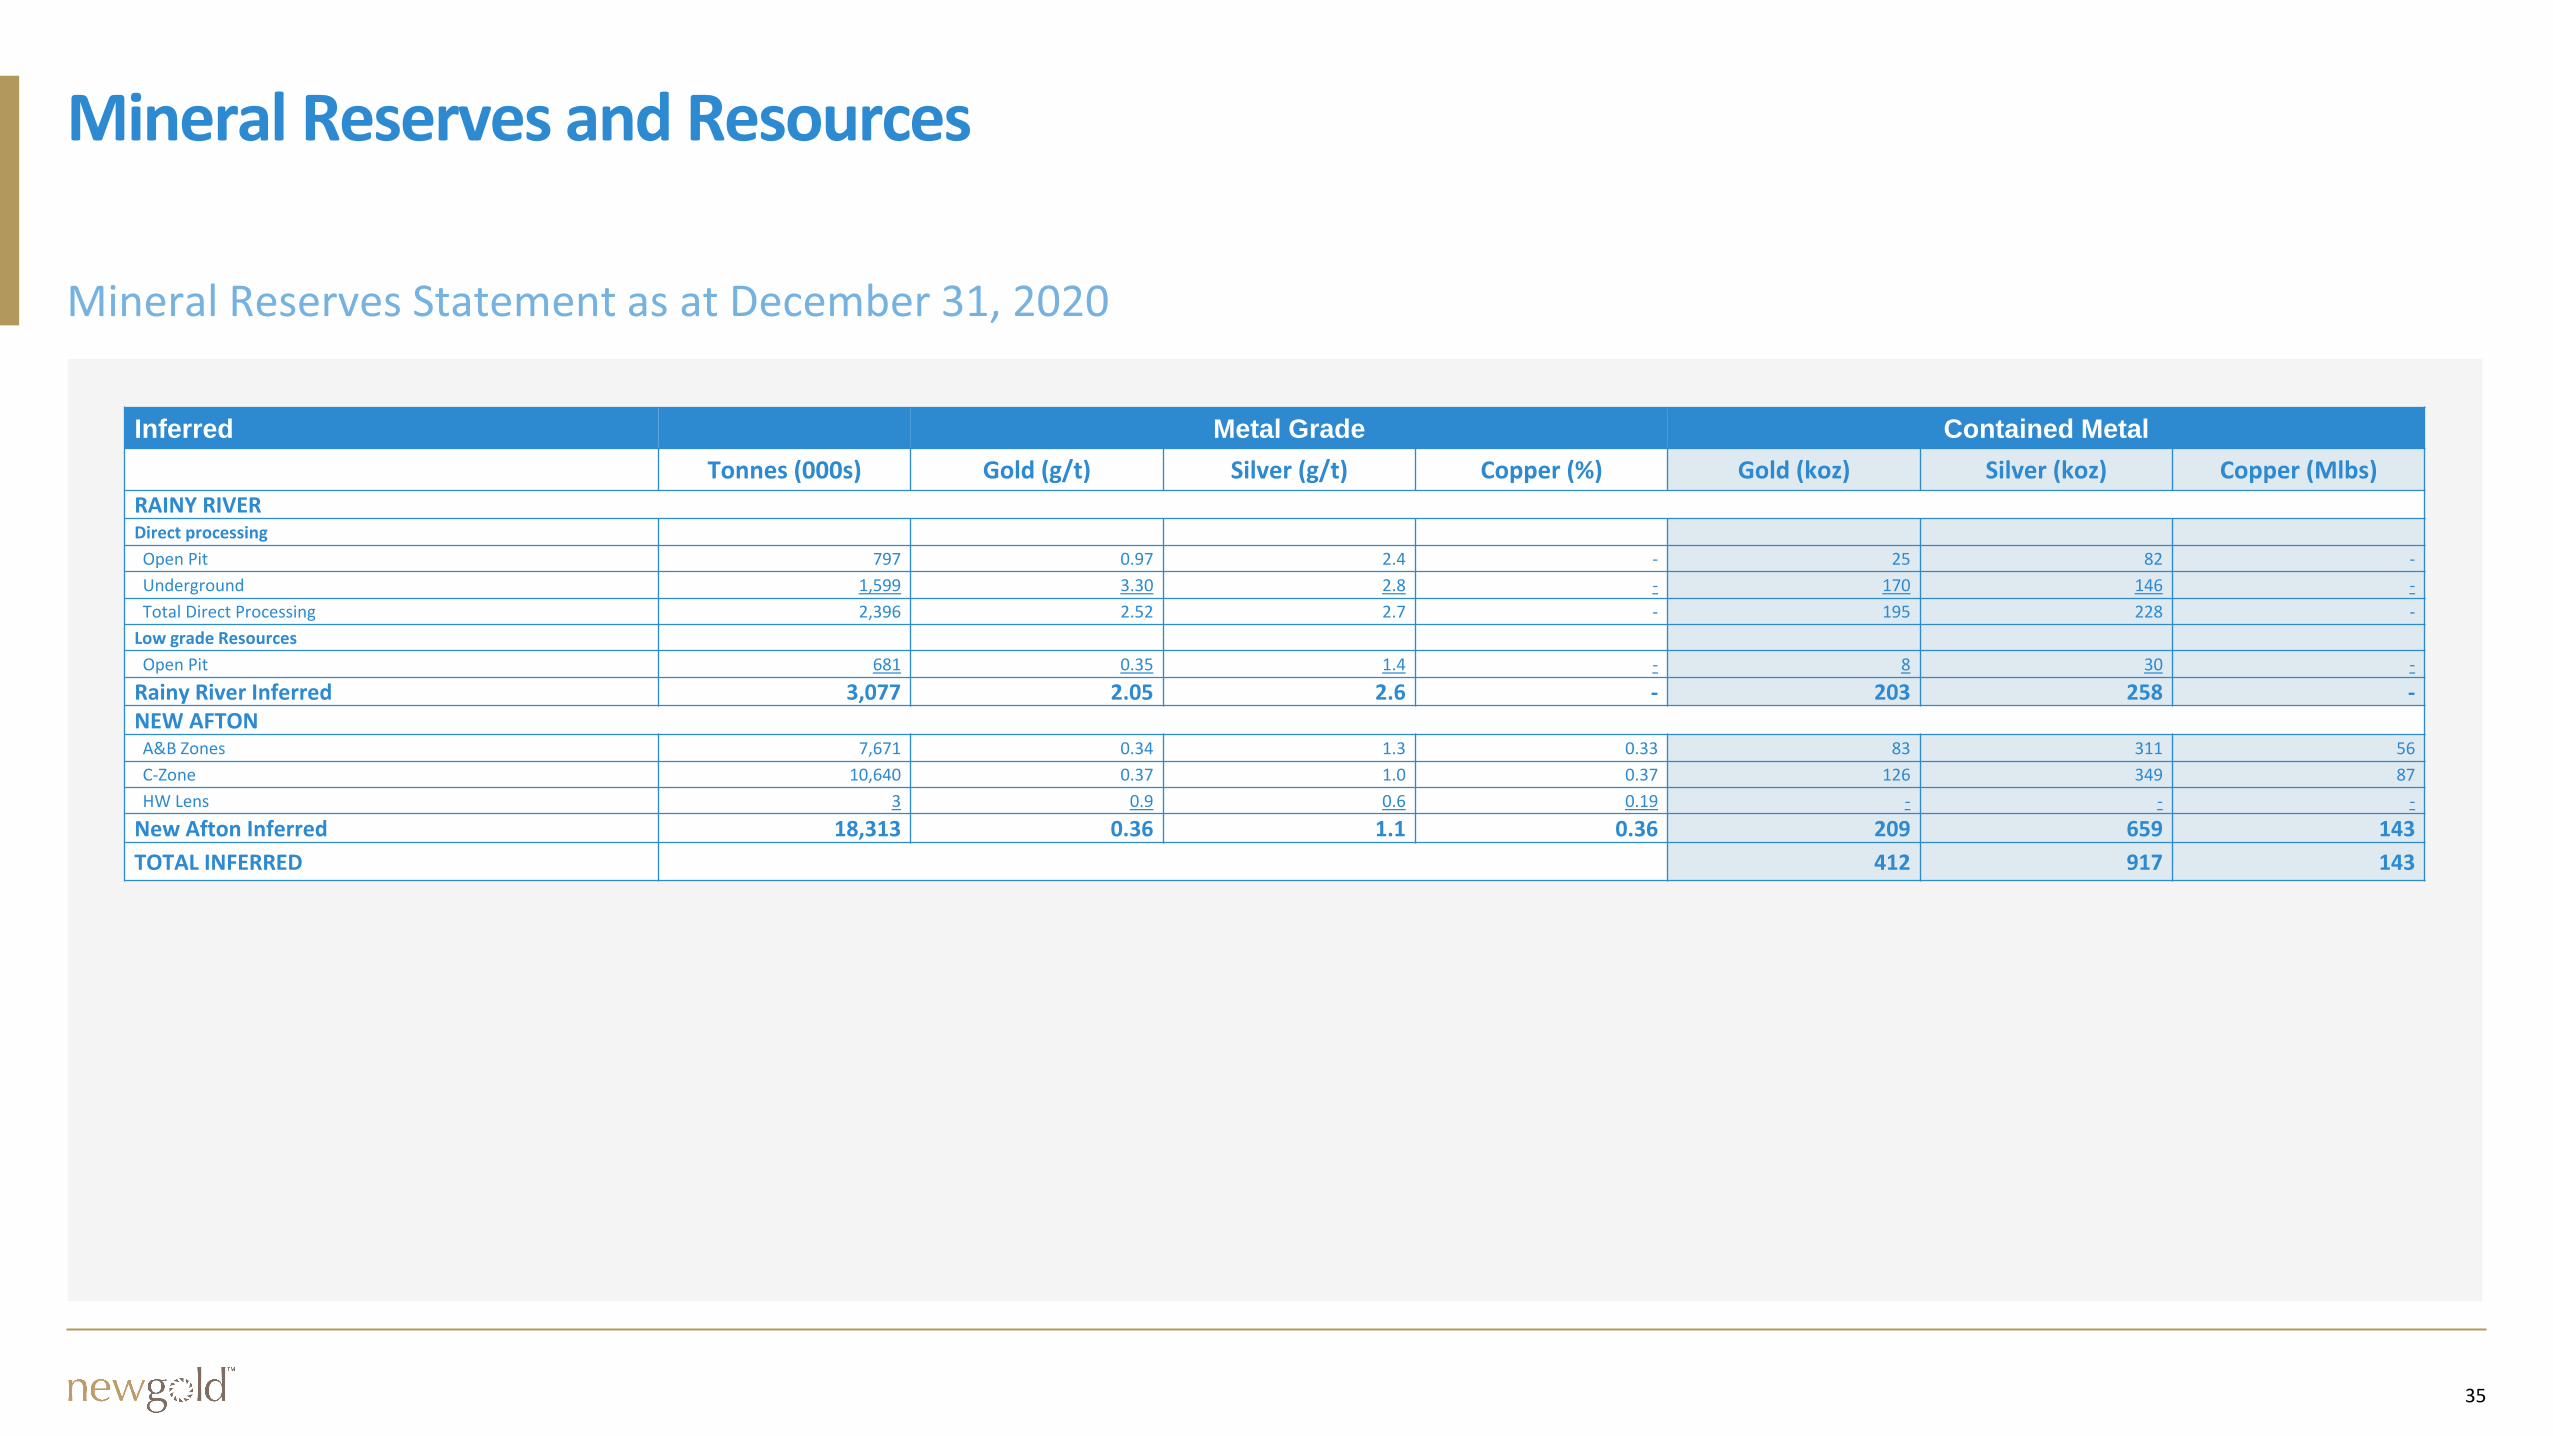
Mineral Reserves and Resources
Inferred Metal Grade Contained Metal
Tonnes (000s) Gold (g/t) Silver (g/t) Copper (%) Gold (koz) Silver (koz) Copper (Mlbs)
RAINY RIVERDirect processing
Open Pit 797 0.97 2.4 - 25 82 -
Underground 1,599 3.30 2.8 - 170 146 -
Total Direct Processing 2,396 2.52 2.7 - 195 228 -
Low grade Resources
Open Pit 681 0.35 1.4 - 8 30 -
Rainy River Inferred 3,077 2.05 2.6 - 203 258 -NEW AFTONA&B Zones 7,671 0.34 1.3 0.33 83 311 56
C-Zone 10,640 0.37 1.0 0.37 126 349 87
HW Lens 3 0.9 0.6 0.19 - - -
New Afton Inferred 18,313 0.36 1.1 0.36 209 659 143
TOTAL INFERRED 412 917 143
36
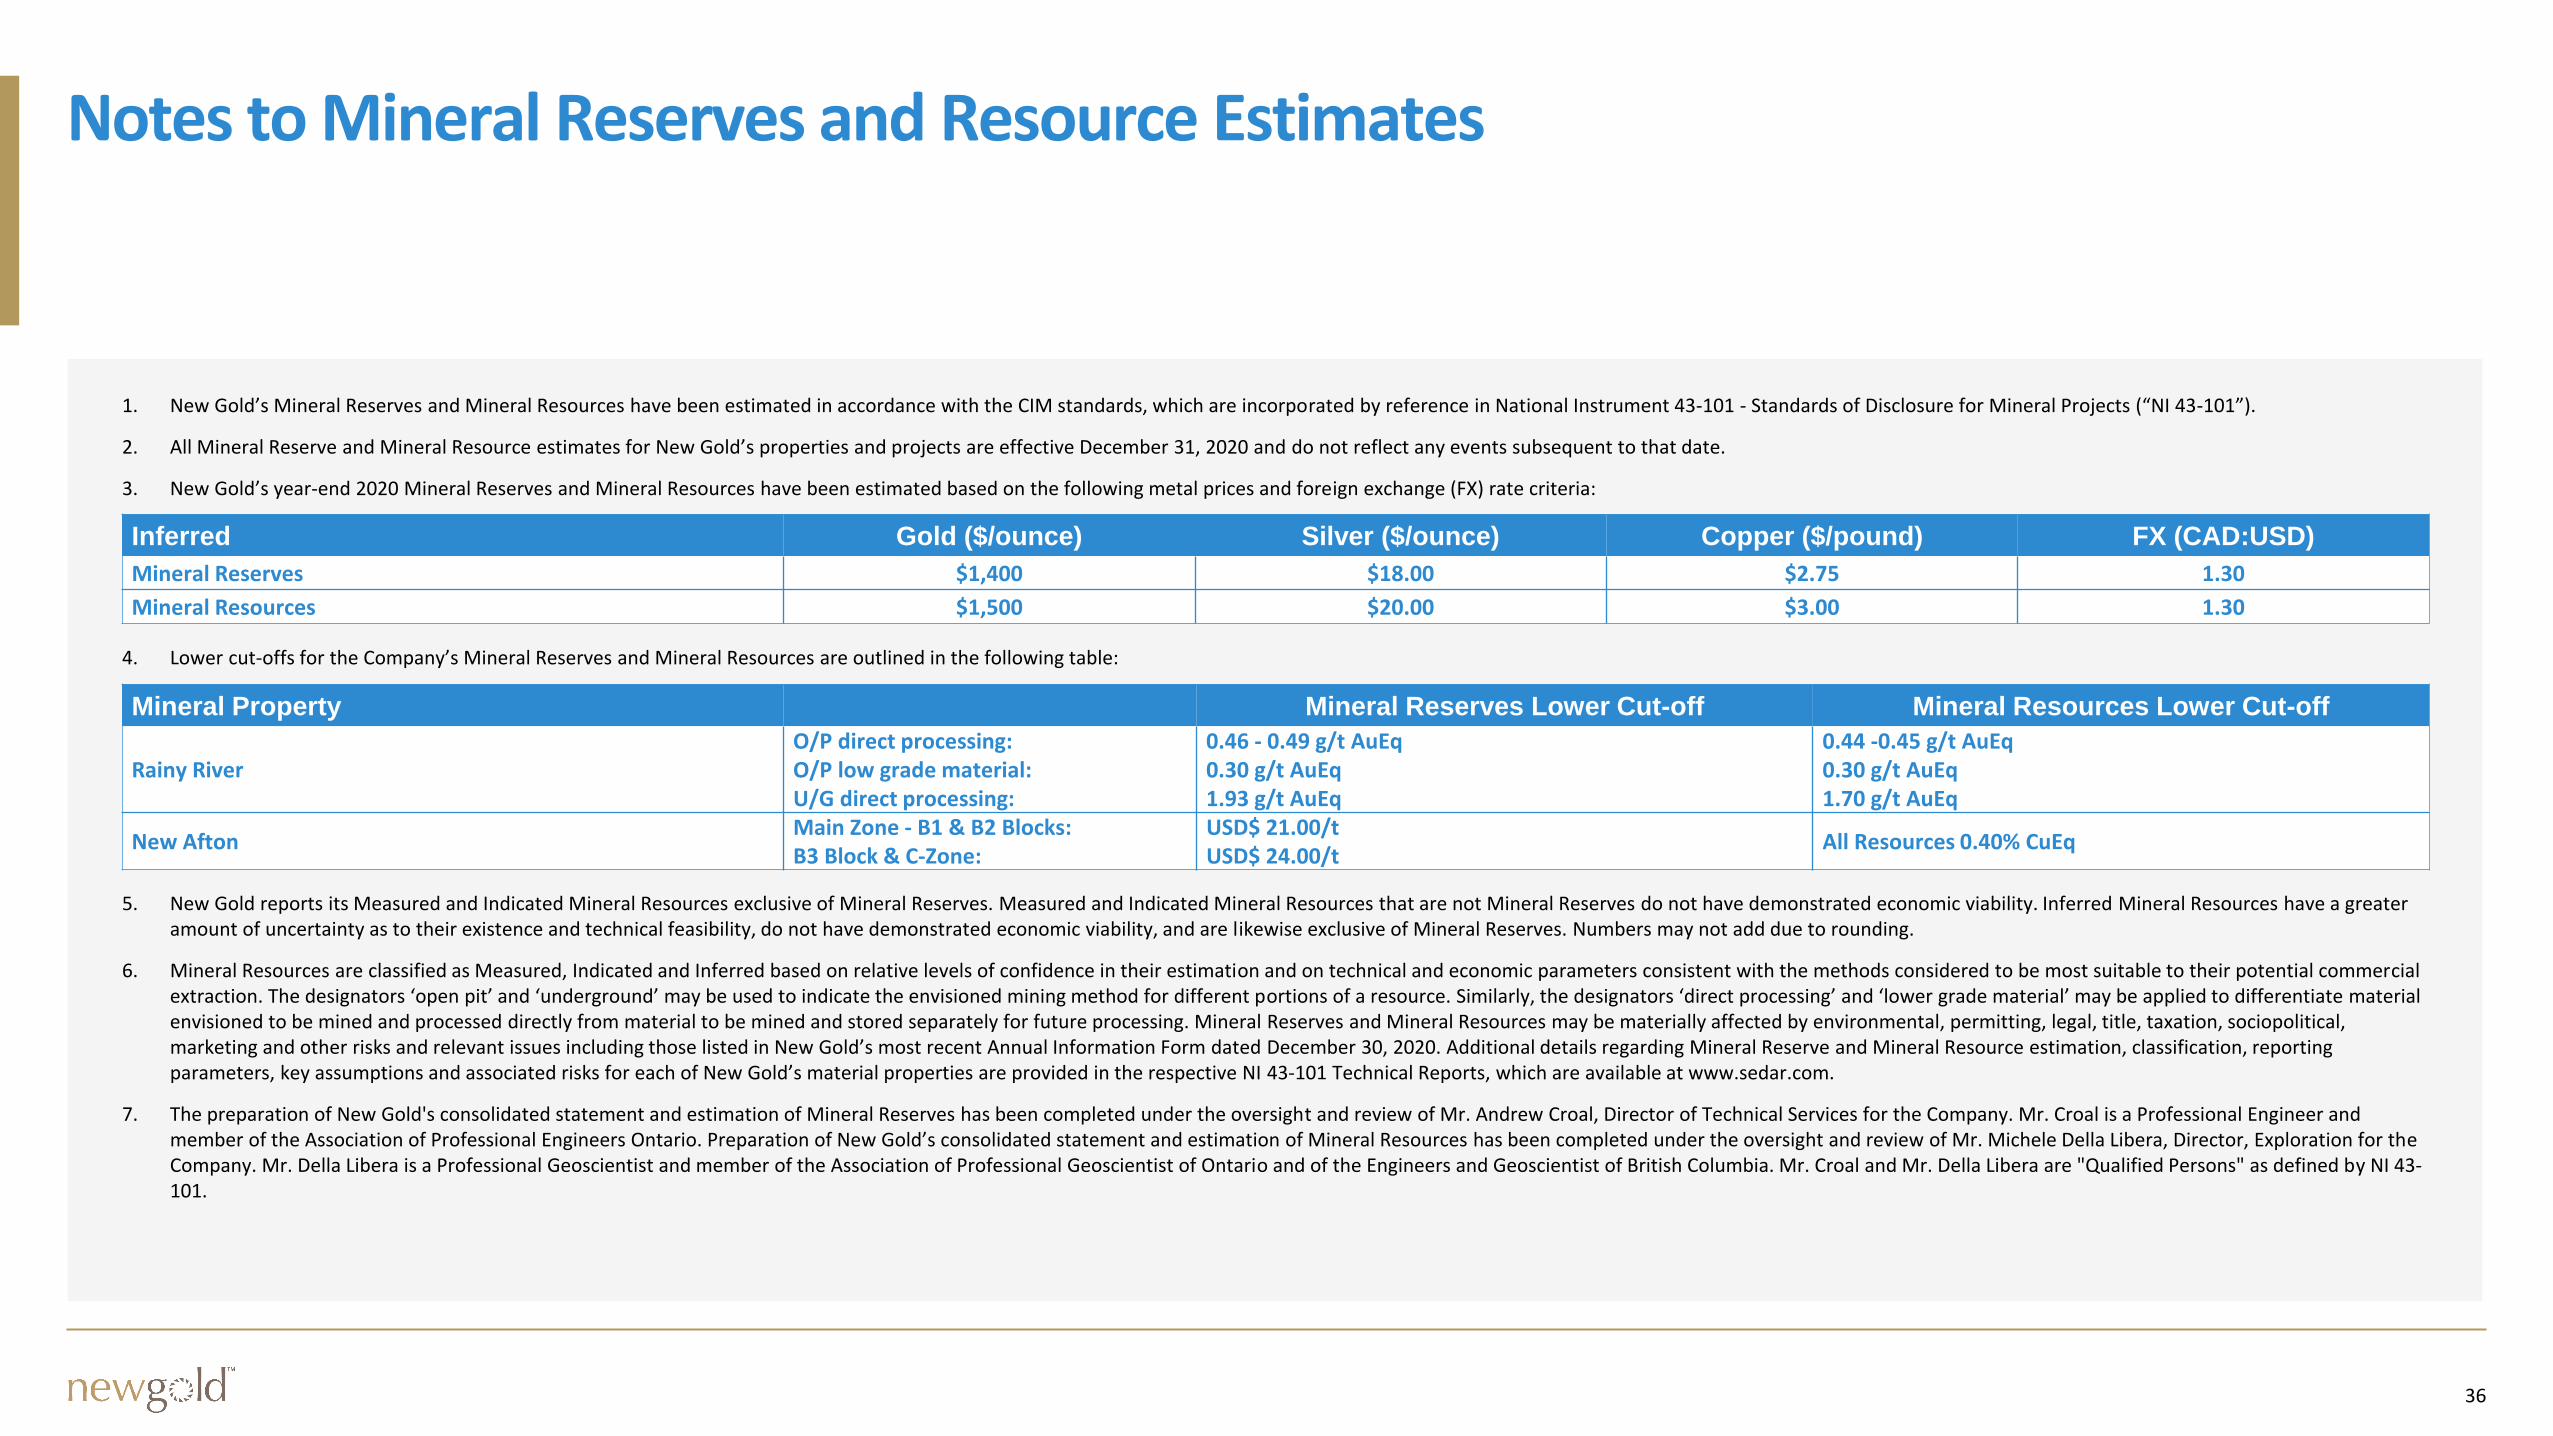
Notes to Mineral Reserves and Resource Estimates
Inferred Gold ($/ounce) Silver ($/ounce) Copper ($/pound) FX (CAD:USD)
Mineral Reserves $1,400 $18.00 $2.75 1.30
Mineral Resources $1,500 $20.00 $3.00 1.30
Mineral Property Mineral Reserves Lower Cut-off Mineral Resources Lower Cut-off
Rainy RiverO/P direct processing:O/P low grade material:U/G direct processing:
0.46 - 0.49 g/t AuEq0.30 g/t AuEq1.93 g/t AuEq
0.44 -0.45 g/t AuEq0.30 g/t AuEq1.70 g/t AuEq
New AftonMain Zone - B1 & B2 Blocks:B3 Block & C-Zone:
USD$ 21.00/tUSD$ 24.00/t
All Resources 0.40% CuEq
1. New Gold’s Mineral Reserves and Mineral Resources have been estimated in accordance with the CIM standards, which are incorporated by reference in National Instrument 43-101 - Standards of Disclosure for Mineral Projects (“NI 43-101”).
2. All Mineral Reserve and Mineral Resource estimates for New Gold’s properties and projects are effective December 31, 2020 and do not reflect any events subsequent to that date.
3. New Gold’s year-end 2020 Mineral Reserves and Mineral Resources have been estimated based on the following metal prices and foreign exchange (FX) rate criteria:
4. Lower cut-offs for the Company’s Mineral Reserves and Mineral Resources are outlined in the following table:
5. New Gold reports its Measured and Indicated Mineral Resources exclusive of Mineral Reserves. Measured and Indicated Mineral Resources that are not Mineral Reserves do not have demonstrated economic viability. Inferred Mineral Resources have a greater amount of uncertainty as to their existence and technical feasibility, do not have demonstrated economic viability, and are likewise exclusive of Mineral Reserves. Numbers may not add due to rounding.
6. Mineral Resources are classified as Measured, Indicated and Inferred based on relative levels of confidence in their estimation and on technical and economic parameters consistent with the methods considered to be most suitable to their potential commercial extraction. The designators ‘open pit’ and ‘underground’ may be used to indicate the envisioned mining method for different portions of a resource. Similarly, the designators ‘direct processing’ and ‘lower grade material’ may be applied to differentiate material envisioned to be mined and processed directly from material to be mined and stored separately for future processing. Mineral Reserves and Mineral Resources may be materially affected by environmental, permitting, legal, title, taxation, sociopolitical, marketing and other risks and relevant issues including those listed in New Gold’s most recent Annual Information Form dated December 30, 2020. Additional details regarding Mineral Reserve and Mineral Resource estimation, classification, reporting parameters, key assumptions and associated risks for each of New Gold’s material properties are provided in the respective NI 43-101 Technical Reports, which are available at www.sedar.com.
7. The preparation of New Gold's consolidated statement and estimation of Mineral Reserves has been completed under the oversight and review of Mr. Andrew Croal, Director of Technical Services for the Company. Mr. Croal is a Professional Engineer and member of the Association of Professional Engineers Ontario. Preparation of New Gold’s consolidated statement and estimation of Mineral Resources has been completed under the oversight and review of Mr. Michele Della Libera, Director, Exploration for the Company. Mr. Della Libera is a Professional Geoscientist and member of the Association of Professional Geoscientist of Ontario and of the Engineers and Geoscientist of British Columbia. Mr. Croal and Mr. Della Libera are "Qualified Persons" as defined by NI 43-101.
37
Endnotes
Cautionary note to U.S. readers concerning estimates of mineral reserves and mineral resourcesDisclosure regarding Mineral Reserve and Mineral Resource estimates included in this presentation was prepared in accordance with
NI 43-101 Standards of Disclosure for Mineral Projects (“NI 43-101”). NI 43-101 is a rule developed by the Canadian SecuritiesAdministrators that establishes standards for all public disclosure an issuer makes of scientific and technical information concerning
mineral projects. NI 43-101 differs significantly from the disclosure requirements of the United States Securities and Exchange
Commission (“SEC”) generally applicable to U.S. companies. For example, the terms “mineral reserve”, “proven mineral reserve”,“probable mineral reserve”, “mineral resource”, “measured mineral resource”, “indicated mineral resource” and “inferred mineral
resource” are defined in NI 43-101. These definitions differ from the definitions in the disclosure requirements promulgated by the
SEC. Accordingly, information contained in this presentation will not be comparable to similar information made public by U.S.companies reporting pursuant to SEC disclosure requirements.
Technical InformationThe scientific and technical information in this presentation relating to exploration and the associated tables and figures have beenreviewed and approved by Mr. Michele Della Libera, Director Exploration of New Gold. All other scientific and technical informationcontained in this presentation has been reviewed and approved by Eric Vinet, Senior Vice President, Operations of New Gold. Mr.Della Libera is a Professional Geoscientist (P.Geo.) and Practicing Member of the Association of Professional Geoscientists of Ontarioand the Engineers and Geoscientist of British Columbia. Mr. Vinet is a Professional Engineer and member of the Ordre des ingénieursdu Québec. Mr. Della Libera and Mr. Vinet are "Qualified Persons" for the purposes of NI 43-101 – Standards of Disclosure for MineralProjects. With respect to the scientific and technical information in this presentation relating to exploration and the associated tablesand figures, Mr. Della Libera has verified the data disclosed, including the exploration, analytical and testing data underlying theinformation. His verification included a review of the applicable assay databases and reviews of the assay certificates. No limitationswere imposed on Mr. Della Libera’s verification process. New Gold maintains a Quality Assurance / Quality Control (“QA/QC”) programat its New Afton mine operation using industry best practices and is consistent with the QA/QC protocols in use at all of the Company’sexploration and development projects. Key elements of New Gold’s QA/QC program include chain of custody of samples, regularinsertion of certified reference standards and blanks, and duplicate check assays. Drill core at New Afton is sampled commonly at 2metres intervals or less than 2 metres upon geological changes, halved and shipped in sealed bags to Actlabs Laboratories in Kamloops,British Columbia. Drill core at Rainy River is sampled at a regular 1.5 metres interval or less than 1.5 metres upon geological changes,halved and shipped in sealed bags to Actlabs Laboratories in Thunder Bay, Ontario. Additional information regarding the Company’squality assurance processes is set out in the New Afton and Rainy River NI 43-101 Technical Reports available at www.sedar.com.
For additional technical information on New Gold’s material properties, including a detailed breakdown of Mineral Reserves andMineral Resources by category, as well as key assumptions, parameters and risks, refer to New Gold’s Annual Information Form for theyear ended December 31, 2020.
38
Non-GAAP Measures
1. Cash costs and total cash costs per gold eq. ounces
“Total cash costs per gold equivalent ounce” is a non-GAAP financial performance measure that is a common financial performance
measure in the gold mining industry but does not have any standardized meaning under IFRS and therefore may not be comparable tosimilar measures presented by other issuers. New Gold reports total cash costs on a sales basis and not on a production basis. The
Company believes that, in addition to conventional measures prepared in accordance with IFRS, this measure, along with sales, is a key
indicator of the Company’s ability to generate operating earnings and cash flow from its mining operations. This measure allowsinvestors to better evaluate corporate performance and the Company's ability to generate liquidity through operating cash flow to fund
future capital exploration and working capital needs.
This measure is intended to provide additional information only and should not be considered in isolation or as a substitute formeasures of performance prepared in accordance with IFRS. This measure is not necessarily indicative of cash generated from
operations under IFRS or operating costs presented under IFRS.
Total cash cost figures are calculated in accordance with a standard developed by The Gold Institute, a worldwide association ofsuppliers of gold and gold products that ceased operations in 2002. Adoption of the standard is voluntary and the cost measures
presented may not be comparable to other similarly titled measures of other companies. Total cash costs include mine site operating
costs such as mining, processing and administration costs, royalties, production taxes, but are exclusive of amortization, reclamation,capital and exploration costs. Total cash costs are then divided by gold equivalent ounces sold to arrive at the total cash costs per
equivalent ounce sold.
In addition to gold the Company produces copper and silver. Gold equivalent ounces of copper and silver produced or sold in a quarterare computed using a consistent ratio of copper and silver prices to the gold price and multiplying this ratio by the pounds of copper
and silver ounces produced or sold during that quarter.
Notwithstanding the impact of copper and silver sales, as the Company is focused on gold production, New Gold aims to assess theeconomic results of its operations in relation to gold, which is the primary driver of New Gold’s business. New Gold believes this metric
is of interest to its investors, who invest in the Company primarily as a gold mining business. To determine the relevant costs associated
with gold equivalent ounces, New Gold believes it is appropriate to reflect all operating costs incurred in its operations.
2. All-in sustaining costs per gold eq. ounce
“All-in sustaining costs per gold equivalent ounce” is a non-GAAP financial performance measure that does not have any standardized
meaning under IFRS and therefore may not be comparable to similar measures presented by other issuers. New Gold calculates "all-in
sustaining costs per gold equivalent ounce" based on guidance announced by the World Gold Council (“WGC”) in September 2013. TheWGC is a non-profit association of the world’s leading gold mining companies established in 1987 to promote the use of gold to industry,
consumers and investors. The WGC is not a regulatory body and does not have the authority to develop accounting standards or
disclosure requirements. The WGC has worked with its member companies to develop a measure that expands on IFRS measures toprovide visibility into the economics of a gold mining company. Current IFRS measures used in the gold industry, such as operating
expenses, do not capture all of the expenditures incurred to discover, develop and sustain gold production. New Gold believes that "all-
in sustaining costs per gold equivalent ounce" provides further transparency into costs associated with producing gold and will assistanalysts, investors, and other stakeholders of the Company in assessing its operating performance, its ability to generate free cash flow
from current operations and its overall value. In addition, the Compensation Committee of the Board of Directors uses "all-in sustaining
costs", together with other measures, in its Company scorecard to set incentive compensation goals and assess performance.
All-in sustaining costs per gold equivalent ounce" is intended to provide additional information only and does not have any standardized
meaning under IFRS and may not be comparable to similar measures presented by other mining companies. It should not be considered
in isolation or as a substitute for measures of performance prepared in accordance with IFRS. The measure is not necessarily indicativeof cash flow from operations under IFRS or operating costs presented under IFRS.
New Gold defines "all-in sustaining costs per gold equivalent ounce" as the sum of total cash costs, net capital expenditures that are
sustaining in nature, corporate general and administrative costs, capitalized and expensed exploration that is sustaining in nature, leasepayments that are sustaining in nature, and environmental reclamation costs, all divided by the total gold equivalent ounces sold to
arrive at a per ounce figure. The definition of sustaining versus non-sustaining is similarly applied to capitalized and expensed
exploration costs and lease payments. Exploration costs and lease payments to develop new operations or that relate to major projectsat existing operations where these projects are expected to materially increase production are classified as non-sustaining and are
excluded. Gold equivalent ounces of copper and silver produced or sold in a quarter are computed using a consistent ratio of copper and
silver prices to the gold price and multiplying this ratio by the pounds of copper and silver ounces produced or sold during that quarter.
Costs excluded from all-in sustaining costs are non-sustaining capital expenditures, non-sustaining lease payments and exploration costs,
financing costs, tax expense, and transaction costs associated with mergers, acquisitions and divestitures, and any items that are
deducted for the purposes of adjusted earnings.
39
Non-GAAP Measures
3. Sustaining capital and sustaining leases
Sustaining capital" and "sustaining lease" are non-GAAP financial performance measures that do not have any standardized meaningunder IFRS and therefore may not be comparable to similar measures presented by other issuers. New Gold defines "sustainingcapital" as net capital expenditures that are intended to maintain operation of its gold producing assets. Similarly, a "sustaining lease“is a lease payment that is sustaining in nature. To determine "sustaining capital" expenditures, New Gold uses cash flow related tomining interests from its statement of cash flows and deducts any expenditures that are capital expenditures to develop newoperations or capital expenditures related to major projects at existing operations where these projects will materially increaseproduction. Management uses "sustaining capital" and "sustaining lease", to understand the aggregate net result of the drivers of all-insustaining costs other than total cash costs. These measures are intended to provide additional information only and should not beconsidered in isolation or as substitutes for measures of performance prepared in accordance with IFRS.
4. Growth capital
"Growth capital" is a non-GAAP financial performance measure that does not have any standardized meaning under IFRS and thereforemay not be comparable to similar measures presented by other issuers. New Gold considers non-sustaining capital costs to be “growthcapital”, which are capital expenditures to develop new operations or capital expenditures related to major projects at existingoperations where these projects will materially increase production. To determine "growth capital" expenditures, New Gold uses cashflow related to mining interests from its statement of cash flows and deducts any expenditures that are capital expenditures that areintended to maintain operation of its gold producing assets. Management uses "growth capital" to understand the cost to develop newoperations or related to major projects at existing operations where these projects will materially increase production. This measure isintended to provide additional information only and should not be considered in isolation or as a substitute for measures ofperformance prepared in accordance with IFRS.
5. Adjusted net earnings/(loss)
“Adjusted net earnings” and “adjusted net earnings per share” are non-GAAP financial performance measures that do not have anystandardized meaning under IFRS and therefore may not be comparable to similar measures presented by other issuers. "Adjusted netearnings" and "adjusted net earnings per share" exclude the following from net earnings: Inventory write downs, Items included in“Other gains and losses” as per Note 3 of the Company’s consolidated financial statements; and Certain non-recurring items. Netearnings have been adjusted, including the associated tax impact, for the group of costs in “Other gains and losses” on the condensedconsolidated income statements. Key entries in this grouping are: the fair value changes for the gold stream obligation; fair valuechanges for the free cash flow interest obligation; the gold and copper option contracts; foreign exchange forward contracts; foreignexchange gain or loss, loss on disposal of assets and fair value changes in investments. The income tax adjustments reflect the taximpact of the above adjustments.
The Company uses "adjusted net earnings" for its own internal purposes. Management’s internal budgets and forecasts and publicguidance do not reflect the items which have been excluded from the determination of "adjusted net earnings". Consequently, thepresentation of "adjusted net earnings" enables investors to better understand the underlying operating performance of theCompany's core mining business through the eyes of management. Management periodically evaluates the components of "adjustednet earnings" based on an internal assessment of performance measures that are useful for evaluating the operating performance ofNew Gold's business and a review of the non-GAAP financial performance measures used by mining industry analysts and other miningcompanies. "Adjusted net earnings" and "adjusted net earnings per share" are intended to provide additional information only andshould not be considered in isolation or as substitutes for measures of performance prepared in accordance with IFRS. These measuresare not necessarily indicative of operating profit or cash flows from operations as determined under IFRS.
6. Cash generated from operations, before changes in non-cash operating working capital
“Cash generated from operations, before changes in non-cash operating working capital” is a non-GAAP financial performancemeasure that does not have any standardized meaning under IFRS and therefore may not be comparable to similar measurespresented by other issuers. Other companies may calculate this measure differently and this measure is unlikely to be comparable tosimilar measures presented by other companies. "Cash generated from operations, before changes in non-cash operating workingcapital" excludes changes in non-cash operating working capital. New Gold believes this non-GAAP financial measure provides furthertransparency and assists analysts, investors and other stakeholders of the Company in assessing the Company’s ability to generate cashfrom its operations before temporary working capital changes.
Cash generated from operations, before non-cash changes in working capital is intended to provide additional information only andshould not be considered in isolation or as a substitute for measures of performance prepared in accordance with IFRS. This measure isnot necessarily indicative of operating profit or cash flows from operations as determined under IFRS.
40
Non-GAAP Measures
7. Free cash flow
“Free cash flow” is a non-GAAP financial performance measure that does not have any standardized meaning under IFRS and therefore may not be comparable to similar measures presented by other issuers. New Gold defines "free cash flow" as cash generated from operations and proceeds of sale of other assets less capital expenditures on mining interests, lease payments, settlement of non-current derivative financial liabilities which include the gold stream obligation and the Ontario Teachers’ Pension Plan free cash flow interest. New Gold believes this non-GAAP financial performance measure provides further transparency and assists analysts, investors and other stakeholders of the Company in assessing the Company's ability to generate cash flow from current operations. "Free cash flow" is intended to provide additional information only and should not be considered in isolation or as a substitute for measures of performance prepared in accordance with IFRS. This measure is not necessarily indicative of operating profit or cash flows from operations as determined under IFRS.
8. Average realized price
“Average realized price per ounce of gold sold” is a non-GAAP financial performance measure that does not have any standardizedmeaning under IFRS and therefore may not be comparable to similar measures presented by other issuers. Other companies maycalculate this measure differently and this measure is unlikely to be comparable to similar measures presented by other companies.Management uses this measure to better understand the price realized in each reporting period for gold sales. “Average realized priceper ounce of gold sold” is intended to provide additional information only and should not be considered in isolation or as a substitutefor measures of performance prepared in accordance with IFRS.
Further details regarding non-GAAP financial performance measures and a reconciliation to the nearest IFRS measures are provided inthe MD&A accompanying New Gold’s financial statements filed from time to time on www.sedar.com.


