Embed Size (px)
Citation preview

HAL Id: hal-03352071https://hal.archives-ouvertes.fr/hal-03352071
Submitted on 22 Sep 2021
HAL is a multi-disciplinary open accessarchive for the deposit and dissemination of sci-entific research documents, whether they are pub-lished or not. The documents may come fromteaching and research institutions in France orabroad, or from public or private research centers.
L’archive ouverte pluridisciplinaire HAL, estdestinée au dépôt et à la diffusion de documentsscientifiques de niveau recherche, publiés ou non,émanant des établissements d’enseignement et derecherche français ou étrangers, des laboratoirespublics ou privés.
Sequences flanking the core-binding site modulateglucocorticoid receptor structure and activity
Stefanie Schöne, Marcel Jurk, Mahdi Bagherpoor Helabad, Iris Dror, IsabelleLebars, Bruno Kieffer, Petra Imhof, Remo Rohs, Martin Vingron, Morgane
Thomas-Chollier, et al.
To cite this version:Stefanie Schöne, Marcel Jurk, Mahdi Bagherpoor Helabad, Iris Dror, Isabelle Lebars, et al.. Sequencesflanking the core-binding site modulate glucocorticoid receptor structure and activity. Nature Com-munications, Nature Publishing Group, 2016, 7 (1), �10.1038/ncomms12621�. �hal-03352071�

ARTICLE
Received 11 Apr 2016 | Accepted 18 Jul 2016 | Published 1 Sep 2016
Sequences flanking the core-binding site modulateglucocorticoid receptor structure and activityStefanie Schone1, Marcel Jurk1, Mahdi Bagherpoor Helabad2, Iris Dror3,w, Isabelle Lebars4, Bruno Kieffer4,
Petra Imhof2, Remo Rohs3, Martin Vingron1, Morgane Thomas-Chollier5 & Sebastiaan H. Meijsing1
The glucocorticoid receptor (GR) binds as a homodimer to genomic response elements,
which have particular sequence and shape characteristics. Here we show that the nucleotides
directly flanking the core-binding site, differ depending on the strength of GR-dependent
activation of nearby genes. Our study indicates that these flanking nucleotides change the
three-dimensional structure of the DNA-binding site, the DNA-binding domain of GR and the
quaternary structure of the dimeric complex. Functional studies in a defined genomic context
show that sequence-induced changes in GR activity cannot be explained by differences in GR
occupancy. Rather, mutating the dimerization interface mitigates DNA-induced changes in
both activity and structure, arguing for a role of DNA-induced structural changes in
modulating GR activity. Together, our study shows that DNA sequence identity of genomic
binding sites modulates GR activity downstream of binding, which may play a role in
achieving regulatory specificity towards individual target genes.
DOI: 10.1038/ncomms12621 OPEN
1Max Planck Institute for Molecular Genetics, Department of Computational Molecular Biology, Ihnestrasse 63-73, Berlin 14195, Germany. 2 Institute ofTheoretical Physics, Free University Berlin, 14195 Berlin, Germany. 3Molecular and Computational Biology Program, Department of Biological Sciences,University of Southern California, Los Angeles, California 90089, USA. 4 Institut de Genetique et de Biologie Moleculaire et Cellulaire (IGBMC), Departementde Biologie Structurale, Centre National de la Recherche Scientifique (CNRS) UMR 7104/Institute National de la Sante et de la Recherche Medicale(INSERM) U964/Universite de Strasbourg, 1 rue Laurent Fries, BP 10142, 67404 Illkirch Cedex, France. 5 Institut de Biologie de l’Ecole Normale Superieure,Institut National de la Sante et de la Recherche Medicale, U1024, Centre National de la Recherche Scientifique, Unite Mixte de Recherche 8197, F-75005Paris, France. w Present address: Department of Biological Chemistry, University of California, Los Angeles, California 90095, USA. Correspondence andrequests for materials should be addressed to M.T.-C. (email: [email protected]) or to S.H.M. (email: [email protected]).
NATURE COMMUNICATIONS | 7:12621 | DOI: 10.1038/ncomms12621 | www.nature.com/naturecommunications 1

Cells can exploit a variety of strategies to ensure that genesare expressed at a specific and well-defined level, includingthe tight control of the production process of transcripts.
The transcription of genes is controlled by the coordinated actionof transcriptional factors (TFs), which bind to cis-regulatoryelements to integrate a combination of inputs to specify whereand when a gene is expressed and how much gene product issynthesized1. Signals influencing the level of transcriptionaloutput include the sequence composition of cis-regulatoryelements that can, for example, direct the assembly of distinctregulatory complexes (reviewed in refs 2,3). Other mechanismsthat influence the transcriptional output of individual genesinclude the distance of regulatory elements to the transcriptionalstart site (TSS) of genes4, the chromatin context in whichregulatory elements are embedded5, DNA methylation6,7 andpost-translational modifications of proteins1.
For the glucocorticoid receptor (GR), a member of the steroidhormone receptor family, the sequence of its DNA-binding site isknown to modulate the receptor’s activity. Some studies suggeststhat depending on the sequence of the GR-binding sequence(GBS), the direction of regulation might be influenced,that is, whether GR will activate or repress transcription8–11.Furthermore, the magnitude of transcriptional activation by GRdepends on the exact sequence composition of the GBS, whichconsists of inverted repeats of two half-sites of 6 base pairs (bp)separated by a 3-bp spacer11. Affinity for specific GBSs canexplain some, but not all, of the modulation of GR activity by thesequence composition of the GBSs12. GR activity can also bemodulated by DNA shape, which can serve as an allosteric ligandthat fine-tunes the structure and activity of GR without apparentchanges in DNA binding affinity13. GR can ‘read’ the shape ofDNA through non-specific DNA contacts with the phosphatebackbone in the spacer region and at other positions within eachhalf-site11,13. In addition, GR contacts the minor groovejust outside the core 15-bp GBS11. How the DNA-inducedstructural changes in the associated protein result in differenttranscriptional outputs is largely unknown, but requires an intactdimerization interface and may involve sequence-specificcooperation with GR cofactors11,13.
Here we further investigated this question and uncovered thatthe 2 bp flanking the GBS, which are involved in modifying theshape of the DNA target, influence transcriptional output levels.We first studied if GBS variants can modulate GR activity in achromosomal context and found that GBS variants can indeedmodulate GR activity when integrated at a defined genomic locus.Interestingly, this modulation appears to occur downstreamof GR binding as the differences in transcriptional responsescannot be explained by differences in occupancy levels based onchromatin immunoprecipitation (ChIP) experiments. Further-more, we analysed genome-wide data on GR binding and generegulation and identified differences in the sequence compositionbetween GBSs associated with genes with strong and those withweak transcriptional responses to GR activation. Using acombination of experiments with atomic resolution and func-tional studies, we found that the base pairs directly flanking thecore 15-bp GBS modulate GR activity and induce structuralchanges in both DNA and the associated DNA-binding domainof GR. Together, our studies suggest that modulation of GRactivity and structure by GBS variation at positions directlyadjacent to the core recognition sequence plays a role infine-tuning the expression of endogenous target genes.
ResultsGenomic GR-binding site sequence affects GR activity. Pre-vious studies relied on transiently transfected reporters to show
that GBS composition can modulate GR activity11,13. Todetermine if GBS variants can also influence GR activity in achromosomal context, we used zinc finger nucleases (ZFN) togenerate isogenic cell lines with integrated GBS reporters14. TheGBS reporters consist of a GBS variant upstream of a minimalpromoter driving expression of a luciferase reporter gene(Fig. 1a). Single-cell-derived clonal cell lines with integratedreporters were isolated by flow-activated cell sorting (FACS) andgenotyped for correct integration at the AAVS1 locus(Supplementary Fig. 1A). Consistent with our expectation, noinduction by dexamethasone, a synthetic glucocorticoid hormone,was observed for the reporter lacking a GBS (Fig. 1b).For reporters with a single GBS, transcriptional activation wasobserved with sequence-specific activities ranging from B17-foldfor the Cgt, to B9-fold for the GILZ and B2-fold for the SGK2GBS (Fig. 1b). Notably, activation of the endogenous GR target
GBS
GBS
Targeted integration of GBS-reporters
GFP pA pALuciferase
GFP pA pALuciferase
AAVS1 locus
Modified AAVS1 locus
+ZFNs
Luc-fw R5
1.8 kbGBS: Cgt
GBS: Sgk2
GBS: Gilz
a
b
No GBS Gilz Cgt Sgk2
Fol
d ac
tivat
ion
(dex
/eto
h)
30
20
10
0
0
10
20
Fol
d re
crui
tmen
t(d
ex/e
toh)
Luciferase mRNA
ChIP AAVS1 locus
Figure 1 | GBS activity and binding in a genomic context. (a) Cartoon
depicting donor design, GBS sequence and the genotype at the AAVS1 locus
after integration of the GBS-reporters. Nucleotides that diverge from the
Gilz sequence are highlighted in red for the Cgt and Sgk2 GBSs,
respectively. (b) Top: transcriptional activation of the integrated luciferase
reporters by GBS variants. Clonal lines with integrated reporters as
indicated were treated for 8 h with 1 mM dexamethasone (dex) or 0.1%
ethanol as vehicle control. Fold induction of the luciferase reporter gene
(dex/etoh) was determined by qPCR. Averages±s.e.m. are shown (n¼ 3).
Bottom: GR binding to GBS reporter variants was quantified by chromatin
immunoprecipitation followed by qPCR. Average fold enrichment per
reporter variant on dex treatment (1mM dex, 1.5 h), relative to ethanol
vehicle control±s.e.m. is shown for at least three clonal lines with reporter
integration at the desired locus.
ARTICLE NATURE COMMUNICATIONS | DOI: 10.1038/ncomms12621
2 NATURE COMMUNICATIONS | 7:12621 | DOI: 10.1038/ncomms12621 | www.nature.com/naturecommunications

gene TSC22D3 was comparable for all clonal lines (Supplemen-tary Fig. 1B), arguing that the GBS-specific activities are not asimple consequence of clonal variation in GR activity.
To assess if the GBS-specific transcriptional activities could beexplained by differences in GR occupancy, we compared GRrecruitment to the GBS variants by ChIP. For all clonal lines, asimilar level of hormone-dependent GR recruitment wasobserved for the endogenous FKBP5 locus, indicating that theChIP efficiency was comparable between our clonal lines(Supplementary Fig. 1C). As expected, the integrated reporterlacking a GBS showed no GR binding, whereas GR was recruitedin the presence of a GBS (Fig. 1b). However, no clear correlationbetween the level of transcriptional activity and GR recruitmentwas observed. For instance, the GILZ GBS, which showed anintermediate transcriptional activity, showed the highest occu-pancy whereas recruitment was comparable for the GBSs with thehighest (Cgt) and lowest (Sgk2) activities (Fig. 1b).
Together these data show that GBS nucleotide variation canmodulate GR activity in a chromosomal context. Furthermore,this modulation appears to occur downstream of recruitment,consistent with the idea that DNA can change the structure andactivity of GR.
Genome-wide computational analysis of GBS variants. Theexperiments with integrated GBS reporters showed that GBSvariants can modulate the activity of GR towards target genes in achromosomal context. To assess whether GBS variants mayindeed play a role in fine-tuning the activity of GR towardsindividual endogenous target genes, we analysed genomic data tosee if the level of GR activity correlates with the presence ofspecific GBS variants near genes. Therefore, we first groupedgenes regulated by GR in U2OS cells15, a human osteosarcomacell line, into strong responders (top 20% with greatest foldinduction on dexamethasone treatment, 290 genes) and a controlgroup of weak responders (genes with significant changes inexpression, log2-fold change o0.72, 688 genes) (Fig. 2a). Next,we associated GR-bound regions, based on ChIP-seq data15, witha regulated gene when a ChIP-seq peak was located within awindow of 40 kb centred on the TSS of that gene (Fig. 2a). Thestrong GR-responsive genes were associated with 543 peaks. Tocompare our findings, a control group with similar peak numberwas generated consisting of 532 peaks that were associated withweak GR responsive genes. For each group of peaks, weconducted a de novo motif search with RSAT peak motifs16.For both groups, we identified the GR motif (Fig. 2a) and motifsof AP1 and SP1, which are known cofactors of GR17,18. The coreGR motif was similar for both groups (Fig. 2a) and closelymatches the GR consensus sequence15. However, we observedsubtle differences in preferred nucleotides at individual positions.For instance, the spacer for GBSs associated with weakresponders preferentially contains a G or C at position � 1,whereas no such preference is observed for GBSs associated withstrong responders. This is consistent with previous studiesshowing that the sequence of the spacer can modulate GRactivity11,13. Furthermore, we found that the nucleotide flankingeach half site (position � 8 and þ 8) exhibited high informationcontent in the strong responders data set, with sequencepreferences that were different for peaks associated with strongand weak responder genes (Fig. 2a). For GBSs associated withstrong GR responsive genes, the flanking nucleotide waspreferentially an A or T, whereas for GBSs associated withweak GR responsive genes the flanking nucleotide waspreferentially a G or C. Because the motifs discovered by the denovo motif search are not necessarily present at differentfrequencies in the two groups, we quantitatively compared the
occurrences of motif matches flanked by A/T and G/Cnucleotides 50 and 30 of the core motif, which are associatedwith ‘strong’ and ‘weak’ peaks, respectively. Consistent with theoutcome of the de novo motif search, this analysis showed moremotif matches for the A/T flanked motif for strong-responder-associated peaks compared with weak-responder-associatedpeaks, whereas the opposite was found when we scanned withthe G/C flanked motif (Supplementary Fig. 2). Together, thissuggests that GBS variants may indeed play a role in modulatingGR activity towards endogenous target genes, and hint at apossible role in this process for the base pairs directly flanking thehalf-sites.
GBS flanking nucleotides modulate GR activity. To test the roleof base pairs flanking the half-site (position � 8 and þ 8) inmodulating GR activity, we generated reporters where we flankedeach of five GBS variants (Cgt, FKBP5-1, FKBP5-2, Pal and Sgk)by either A/T or by G/C bp (Fig. 2b). These reporters displayedcomparable basal activities, whereas the level of induction ondexamethasone treatment varied between the sequence variants(Fig. 2b). Consistent with the observations for endogenous GRtarget genes the A/T flanked GBSs showed higher reporter geneactivity than the G/C flanked GBSs for four out of five tested GBSvariants, whereas little to no effect of changing the flanks wasobserved for the Pal sequence (Fig. 2b). For example, the activityof A/T flanked Cgt was twice that of the G/C flanked version ofthis GBS (Fig. 2b). Together, these experiments indicated that theproximal flanking nucleotides can indeed modulate GR activity,and from now on we use the term ’flank effect’ to refer to thedependency of GR target gene expression on flanking nucleotidesof the GBS core motif. Notably, the Sgk and Cgt GBSs showed thegreatest flank effect whereas the effect for the Pal and FKBP5-1GBSs was small. When comparing the sequences of these GBSvariants, we observed that the second half-site (position 2–7)forms an ‘imperfect’ palindromic sequence (not matchingTGTTCT) for the GBSs with the greatest flank effect (Cgt andSgk) whereas this sequence is palindromic for Pal and FKBP5-1.To test whether the ‘imperfect’ half-site of Cgt and Sgk isresponsible for the flank effect, we generated new luciferasereporter constructs with mixed flanking nucleotides 50 and 30 ofthe core motif (A/C and G/T) (Fig. 2c). These experimentsshowed that the imperfect half-site is indeed mainly responsiblefor the flank effect, with on average a 98% increase in activitywhen we change the flank of the imperfect site, whereas thisincrease was a more modest 18% when we changed the flank ofthe ‘perfect’ half-site.
We focused on the Cgt and Sgk GBS in further experiments asthey showed the strongest influence of the flanking nucleotides.To study the role of flanking nucleotides in the chromosomalcontext, we stably integrated a Sgk-GBS luciferase reporter inU2OS cells at the AAVS1 locus to simulate an endogenous geneenvironment. Matching what we observed with the transientlytransfected reporters, we again found that integrated A/T flankedSgk showed a B1.5 times greater reporter activity than the G/Cflanked GBS (Fig. 3a). At this point, we wondered how theproximal flanks influence GR activity. To determine whether theflank effect might be caused by a change in the intrinsic affinity ofthe DNA-binding domain (DBD) for GBSs, we conductedelectrophoretic mobility shift assays (EMSAs). However, arguingagainst a role for changes in the intrinsic affinity, we foundsimilar Kd values for both A/T and G/C flanked Cgt and SgkGBSs (Fig. 3b). In a second approach, we also studied GR bindingin vivo to A/T and G/C flanked Sgk versions of the stablyintegrated reporter constructs from the previous experiment byChIP (Fig. 3a). Remarkably, the GR occupancy of G/C flanked
NATURE COMMUNICATIONS | DOI: 10.1038/ncomms12621 ARTICLE
NATURE COMMUNICATIONS | 7:12621 | DOI: 10.1038/ncomms12621 | www.nature.com/naturecommunications 3

Sgk was twice that of the A/T flanked Sgk (Fig. 3c), despite thefact that A/T flanked Sgk leads to higher gene activation.Similarly, GR binding was essentially the same when comparingthe peak height of all endogenous GR ChIP-seq peaks containingan A/T flanked GBS with those flanked by G/C (SupplementaryFig. 3), showing that peak height and flanking site sequence areindependent. Together, we therefore conclude that the flank effectappears not to be a consequence of changes in DNA-bindingaffinity.
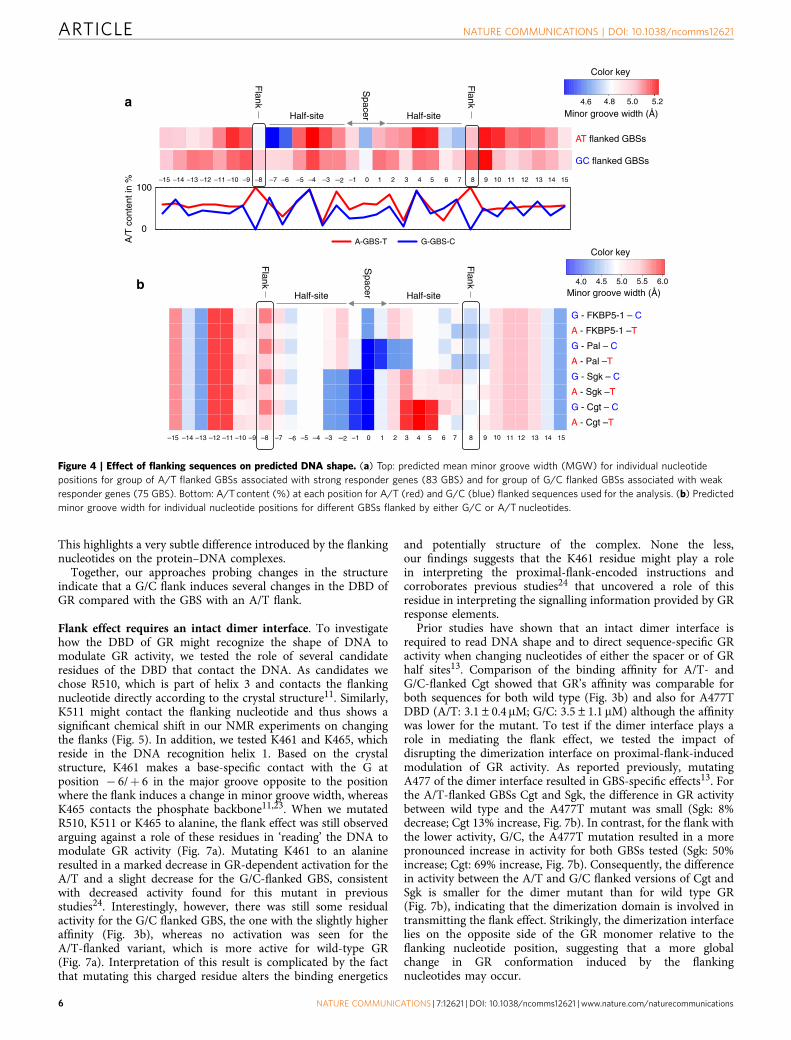
Flanking nucleotides modulate DNA shape. Previous studieshave shown that the sequence of the spacer influences DNA shapeand GR activity13. To test whether the local structure of theDNA-binding site is affected by the flanking nucleotides of theGBS, we compared DNA shape features between G/C (75 GBSs)and A/T (83 GBSs) flanked GBSs from peaks associated withweakly and strongly upregulated genes, respectively. The DNAshape features were predicted using a high-throughput methodthat has been extensively validated based on experimental data19.This analysis showed a slight difference in minor groove widthbetween GBSs flanked by G/C and A/T at positions � 8 and þ 8(proximal flanks) (Fig. 4a). More strikingly, at positions � 7, þ 7,� 6 and þ 6 the predicted minor groove width in A/T flankedGBSs is not only narrower than the rest of the GBS but alsonarrower than at the corresponding position in G/C flanked GBSs(Fig. 4a and Supplementary Fig. 4A). Importantly, the overall
nucleotide composition (given as A/T content in Fig. 4a) of theGBS and its surrounding region was comparable for the twogroups of sequences, indicating that the effect on the twoneighbouring nucleotides is a consequence of changing thesequence of the proximal flanks. We also predicted the propellertwist for the same sets of A/T and G/C flanked GBSs and foundthat the propeller twist differs between the two groups ofsequences, especially at positions � 8 and þ 8 (proximal flanks)(Supplementary Fig. 4B). Next, we repeated the DNA shapeprediction for individual GBSs, tested previously in the luciferasereporter assays (Fig. 4b). Since the first half-site (positions � 7 to� 2) is identical in all tested GBSs it is not surprising that allGBSs have a similar minor groove width at these positions.Notably, minor groove width of the spacer varies among GBSs,consistent with the known role of the spacer in modulating GRactivity13. Here we focus on the proximal flank of the second half-site (positions 6–8). For both Cgt and Sgk GBSs, the minor groovewidth at the flanking position þ 8 is slightly narrower in the G/Cflanked version than in the A/T flanked version. In contrast, theneighbouring positions þ 6 and þ 7 exhibit a narrower minorgroove width in A/T flanked versions. This result suggests thatthe crucial structural DNA shape change occurs at positions þ 6,þ 7 and þ 8. For the Pal and FKBP5-1 GBS variants (which donot exhibit a flank effect) the minor groove width is already quitenarrow at these positions perhaps explaining why these GBSs donot exhibit a flank effect.
Transcriptome data
WEAKGR responsive
genes TSS
TSS
Extract ChIP-seq peaks around TSS of genes
STRONGGR responsive
genes
De novo motif search
10
Half-site
bits
Half-siteSpacer
Flank
Flank
1
2
0
bits 1
2
0 1 2 3 4 5Fold activation (dex/etoh)
Sequence: Flanking site:
0 1 2 3 4 5
G/C
A/T
G/C
A/T
G/C
A/T
G/C
A/T
G/C
A/T
Pal
FK
BP
5-1
Cgt
Sgk
FK
BP
5-2
Impe
rfec
t pal
indr
ome
Per
fect
pal
indr
ome
a
b
c
–10 –9 –8 –7 –6 –5 –4 –3 –2 –1 0 1 2 3 4 5 6 7 8 9 10
–10 –9 –8 –7 –6 –5 –4 –3 –2 –1 0 1 2 3 4 5 6 7 8 9 10
Fold activation (dex/etoh)
Cgt
Sgk
AGAACAtccTGTGCC
AGAACA�tTGTCCG
AGAACA�tTGTACG
AGAACAgggTGTTCT
AGAACAaaaTGTTCT
AG
TC
AG
TC
AG
TC
AG
TC
AG
TC
GAGAACA�tTGTACGTAAGAACA�tTGTACGCAAGAACA�tTGTACGTGAGAACA�tTGTACGCGAGAACA�tTGTCCGTAAGAACA�tTGTCCGCAAGAACA�tTGTCCGTGAGAACA�tTGTCCGC
Sequence:
Figure 2 | Identification and characterization of high-activity GBS variants. (a) Overview of the workflow to identify candidate high-activity GBS variants.
Genes were grouped into strong (top 20% highest fold induction) and weak (log2 fold changeo0.72) transcriptional responders to dexamethasone
treatment. Next, ChIP-seq peaks in a 40 kb window centred on the TSS of responder genes were extracted for each group and subjected to de novo motif
searches resulting in the depicted motifs. The flank positions (�8 and þ 8) are highlighted by red (A/T) or blue (G/C) rectangles. (b) Transiently
transfected luciferase reporter induction of GBS sequences flanked by either A/T or G/C nucleotides. Average fold induction upon 1 mM dexamethasone
(dex) treatment relative to ethanol (etoh) vehicle±s.e.m. (nZ3) is shown. (c) Comparison of transcriptional induction of transiently transfected Cgt and
Sgk GBS variants with G/T and A/C ‘mixed flanking sites’ compared with A/T and G/C flanks. Average fold induction on 1 mM dexamethasone (dex)
treatment relative to ethanol (etoh) vehicle±s.e.m. (nZ3) is shown.
ARTICLE NATURE COMMUNICATIONS | DOI: 10.1038/ncomms12621
4 NATURE COMMUNICATIONS | 7:12621 | DOI: 10.1038/ncomms12621 | www.nature.com/naturecommunications

GBS flanking nucleotides affect GR-DBD conformation.Overall, the predicted changes in DNA structure induced by theflanking nucleotides suggest that DNA shape may serve as aninput signal that regulates GR activity. To determine if theflanking nucleotides influence GR structure and/or dynamics, weprobed the DBD of GR in complex with flank-site Cgt variants bytwo-dimensional nuclear magnetic resonance (2D NMR) spec-troscopy experiments in which nuclei of protein backbone amines(1H, 15N) are correlated. The resulting spectra provide one signalfor each amide and depict the so-called protein fingerprint region,which is unique for each protein construct and chemical (forexample, binding-dependent) environment. As expected, additionof proximal flank Cgt variants resulted in spectral changes whencompared with unbound DBD (Supplementary Fig. 5A). Whenwe compared the spectra of the complexes between GR DBD andG/C and A/T flanked Cgt oligonucleotides, we found a number of
differences between spectra (Supplementary Fig. 5B). To studythese differences in more detail, we analysed the normalizedchemical shift perturbation (CSP) data for each residue asdescribed previously13. Interestingly, we do not only observeaffected amino acid residues in direct vicinity of the altered basepair but rather affected residues reside throughout the wholeDBD indicative of global changes in DBD conformation inducedby the proximal flanks20–22 (Figs 5 and 6a).
Next, we selectively changed the flanks at either the ‘perfect’half-site (chain A) or at the ‘imperfect’ half-site (chain B), whichis mainly responsible for the flank effect. These experimentsshowed that changing the flanking nucleotides of the imperfecthalf-site (AT/AC; Figs 5 and 6b, Supplementary Fig. 5C), resultedin CSPs for several residues (T456, R488, N497, N506, K511).Similarly, changing the proximal flank of the perfect half-site(GC/AC, Fig. 5, Supplementary Fig. 5D) induced peak shifts formultiple residues. Interestingly, however, the residues affectedoverlapped for some residues (T456 and Y497), whereas theywere flank-specific for others (Fig. 5).
As a general rule, NMR spectroscopy is not able to distinguisholigomers with similar conformations or dynamics from oneanother. During the assignment and CSP calculation though, itbecame apparent that several residues, which map predominantlyto the DNA-recognition helix 1 (G458, C460 and K461),show split peaks meaning more than one signal for a givenDBD amino acid (Supplementary Fig. 6). Notably, split peakswere not observed for all residues (example shown for Q520,Supplementary Fig. 6) and a comparison of apo and DNA-boundGR DBD spectra (Supplementary Fig 5a) showed that the extrapeaks are not a simple consequence of having a fraction of GRDBD in our samples that is not DNA-bound. Splitted peakpatterns are characteristic for either conformational exchangewithin each monomer or different chemical environments(that is, conformations or DNA sequence) of the individualmonomers within the ternary DNA/DBD complex. Observationof a third peak for C460 on substitution of A/T by G/Cnucleotides at the proximal flank positions indicates the possiblepresence of two distinct conformations for one of the individualmonomers.
Helix 1 sits in the major groove opposite to the minor groove atpositions (� 6, � 7/þ 6, þ 7) where the flanking nucleotidesinduce a narrowing of that groove. Consequently, the DBD of GRmight contact DNA differently, for example, by contacting othernucleotide positions when we change the sequence of the flanks.To test this, we analysed the protein–DNA complex again byNMR spectroscopy but this time by not observing the resonancesof the protein but those of the DNA itself. We assigned the iminoprotons in the 1D spectra for Cgt flanked by either A/T orG/C nucleotides (Supplementary Fig. 7A) and titrated botholigonucleotides with increasing amounts of protein to determinewhether the proximal flanks influence protein–DNA contactswithin the complex (Supplementary Fig. 7). Consistent with thecrystal structure of the GR–DNA complex, these experimentsindicate that the DBD contacts both half-sites of the motif atpositions � 6 (G6), � 4 (T41), � 3 (G40) or þ 2 (T14), þ 4(T16). On protein addition, we observed a progressive uniformline broadening for both DNAs, indicative of similar Kd values,which is in agreement with EMSA experiments. When wecompared the base pairs contacted between A/T and G/C flankedDNAs, the same set of residues showed evidence for bindingto the DBD of GR. However, the imino proton of G46(position � 9), whose resonance is well-resolved, led to a morepronounced broadening in the case of the A/T-flanked DNA(Supplementary Fig. 7). This base pair located outside the 15-bpconsensus sequence interacts with the DBD of GR, in agreementwith contacts formed by helix 3 in the crystal structure10.
a
b
c
0
25
50
G-Sgk-C A-Sgk-T
Fol
d ac
tivat
ion
(dex
/eto
h)
0.00
0.25
0.50
+ – + –
G_Sgk_C A_Sgk_T
Rel
ativ
e en
richm
ent
dex:
GBS Flank Kd (µM) s.d.
Sgk G/C 0.55 0.07
A/T 0.70 0.3
Cgt G/C 0.98 0.09
A/T 1.09 0.12
Figure 3 | Effect of flanking sites on binding and on regulation in a
genomic context. (a) Transcriptional activation of the targeted integrated
luciferase reporters with Sgk GBS flanked by either A/Tor G/C nucleotides.
Average fold induction of the luciferase reporter gene on 1 mMdexamethasone (dex) treatment relative to ethanol (etoh) vehicle±s.e.m.
(nZ3) is shown. (b) Table of EMSA-derived DNA-binding constant (KD) for
Sgk and Cgt GBSs with flanking sequences as indicated. S.d. from three
independent replicates. (c) GR occupancy levels for integrated
Sgk-GBS reporters with flanks as indicated was analysed by chromatin
immunoprecipitation followed by qPCR for cells treated with either dex
(1mM, 1.5 h) or ethanol as vehicle control. Average relative enrichment at
the GBS locus±s.d. for three clonal lines and three independent replicates
is shown.
NATURE COMMUNICATIONS | DOI: 10.1038/ncomms12621 ARTICLE
NATURE COMMUNICATIONS | 7:12621 | DOI: 10.1038/ncomms12621 | www.nature.com/naturecommunications 5
This highlights a very subtle difference introduced by the flankingnucleotides on the protein–DNA complexes.
Together, our approaches probing changes in the structureindicate that a G/C flank induces several changes in the DBD ofGR compared with the GBS with an A/T flank.
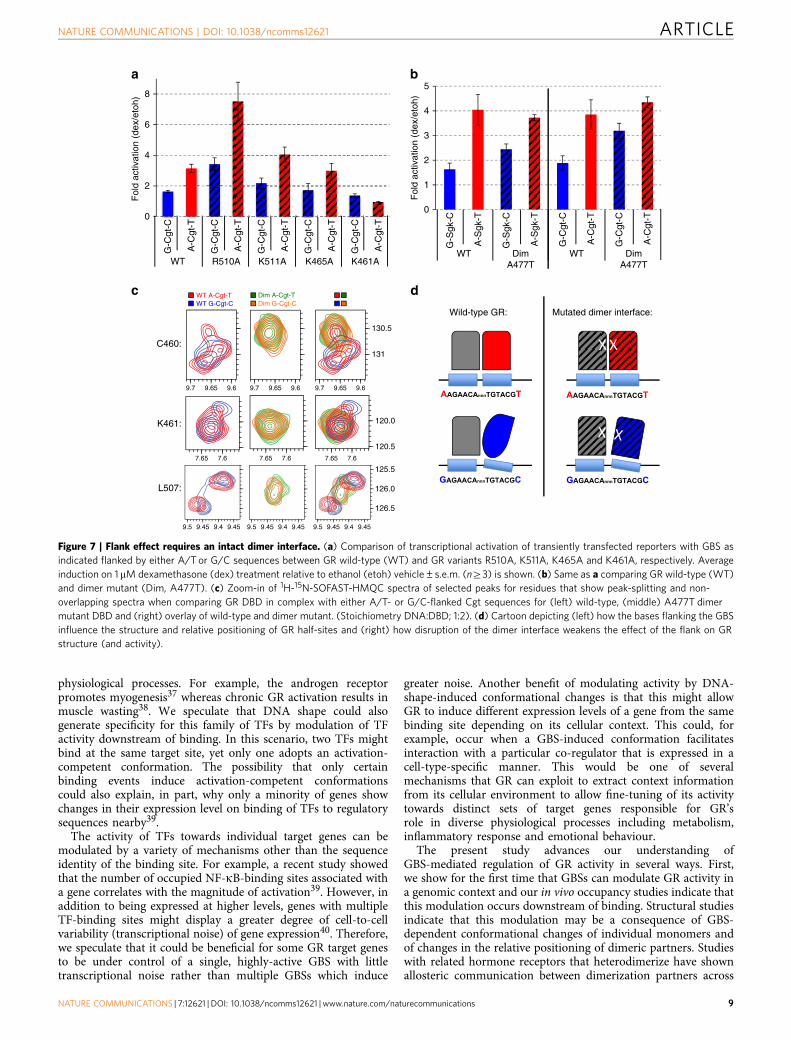
Flank effect requires an intact dimer interface. To investigatehow the DBD of GR might recognize the shape of DNA tomodulate GR activity, we tested the role of several candidateresidues of the DBD that contact the DNA. As candidates wechose R510, which is part of helix 3 and contacts the flankingnucleotide directly according to the crystal structure11. Similarly,K511 might contact the flanking nucleotide and thus shows asignificant chemical shift in our NMR experiments on changingthe flanks (Fig. 5). In addition, we tested K461 and K465, whichreside in the DNA recognition helix 1. Based on the crystalstructure, K461 makes a base-specific contact with the G atposition � 6/þ 6 in the major groove opposite to the positionwhere the flank induces a change in minor groove width, whereasK465 contacts the phosphate backbone11,23. When we mutatedR510, K511 or K465 to alanine, the flank effect was still observedarguing against a role of these residues in ‘reading’ the DNA tomodulate GR activity (Fig. 7a). Mutating K461 to an alanineresulted in a marked decrease in GR-dependent activation for theA/T and a slight decrease for the G/C-flanked GBS, consistentwith decreased activity found for this mutant in previousstudies24. Interestingly, however, there was still some residualactivity for the G/C flanked GBS, the one with the slightly higheraffinity (Fig. 3b), whereas no activation was seen for theA/T-flanked variant, which is more active for wild-type GR(Fig. 7a). Interpretation of this result is complicated by the factthat mutating this charged residue alters the binding energetics
and potentially structure of the complex. None the less,our findings suggests that the K461 residue might play a rolein interpreting the proximal-flank-encoded instructions andcorroborates previous studies24 that uncovered a role of thisresidue in interpreting the signalling information provided by GRresponse elements.
Prior studies have shown that an intact dimer interface isrequired to read DNA shape and to direct sequence-specific GRactivity when changing nucleotides of either the spacer or of GRhalf sites13. Comparison of the binding affinity for A/T- andG/C-flanked Cgt showed that GR’s affinity was comparable forboth sequences for both wild type (Fig. 3b) and also for A477TDBD (A/T: 3.1±0.4 mM; G/C: 3.5±1.1 mM) although the affinitywas lower for the mutant. To test if the dimer interface plays arole in mediating the flank effect, we tested the impact ofdisrupting the dimerization interface on proximal-flank-inducedmodulation of GR activity. As reported previously, mutatingA477 of the dimer interface resulted in GBS-specific effects13. Forthe A/T-flanked GBSs Cgt and Sgk, the difference in GR activitybetween wild type and the A477T mutant was small (Sgk: 8%decrease; Cgt 13% increase, Fig. 7b). In contrast, for the flank withthe lower activity, G/C, the A477T mutation resulted in a morepronounced increase in activity for both GBSs tested (Sgk: 50%increase; Cgt: 69% increase, Fig. 7b). Consequently, the differencein activity between the A/T and G/C flanked versions of Cgt andSgk is smaller for the dimer mutant than for wild type GR(Fig. 7b), indicating that the dimerization domain is involved intransmitting the flank effect. Strikingly, the dimerization interfacelies on the opposite side of the GR monomer relative to theflanking nucleotide position, suggesting that a more globalchange in GR conformation induced by the flankingnucleotides may occur.
a
b
0
100
A/T
con
tent
in %
A-GBS-T G-GBS-C
AT flanked GBSs
GC flanked GBSs
Half-site Half-site
Flank
Spacer
Flank
Color key
4.6 4.8 5.0 5.2
4.0 4.5 5.0 6.05.5
Half-site
Flank
Spacer Half-site
Flank
Color key
Minor groove width (Å)
Minor groove width (Å)
–15 –14 –13 –12 –11 –10 –9 –8 –7 –6 –5 –4 –3 –2 –1 0 1 2 3 4 5 6 7 8 9 10 11 12 13 14 15
–15 –14 –13 –12 –11 –10 –9 –8 –7 –6 –5 –4 –3 –2 –1 0 1 2 3 4 5 6 7 8 9 10 11 12 13 14 15
G - FKBP5-1 – C
A - FKBP5-1 –T
G - Pal – C
A - Pal –T
G - Sgk – C
A - Sgk –T
G - Cgt – C
A - Cgt –T
Figure 4 | Effect of flanking sequences on predicted DNA shape. (a) Top: predicted mean minor groove width (MGW) for individual nucleotide
positions for group of A/T flanked GBSs associated with strong responder genes (83 GBS) and for group of G/C flanked GBSs associated with weak
responder genes (75 GBS). Bottom: A/Tcontent (%) at each position for A/T (red) and G/C (blue) flanked sequences used for the analysis. (b) Predicted
minor groove width for individual nucleotide positions for different GBSs flanked by either G/C or A/T nucleotides.
ARTICLE NATURE COMMUNICATIONS | DOI: 10.1038/ncomms12621
6 NATURE COMMUNICATIONS | 7:12621 | DOI: 10.1038/ncomms12621 | www.nature.com/naturecommunications

To further elucidate the role of the dimer interface intransmitting the flank effect, we studied the impact of theA477T mutation on proximal-flank induced conformationalchanges of GR by 2D NMR spectroscopy (SupplementaryFig. 5E,F). This analysis uncovered two main results. First,several of the residues with significant CSPs for wild type (C460,F464, M505, L507, R511, T512, K514) no longer show asignificant shift when we compare the G/C and A/T flankedCgt for the A477T mutant (Fig. 5, Supplementary Fig. 5F).Second, several peaks that show flank-specific patterns of peaksplitting for wild type GR (for example, C460) show anoverlapping single peak for the mutated A477T DBD (Fig. 7c).This indicates that proximal flanks can only induce alternativeconformations of the DBD when the dimerization interface isintact. Together, these functional and structural analyses of theconsequences of disrupting the dimer interface, argue for its rolein facilitating flank-induced changes in GR conformation andactivity.
DiscussionSpecific recognition of DNA sequences by TFs is a consequence ofboth base readout and shape readout of the DNA-binding site25.In addition to specifying which genes are regulated by a particularTF, the binding site sequence can also play a role in fine-tuningthe expression level of genes. For example, binding sites might beable to modulate gene expression as a consequence of differences
in affinity12,26–28, where high affinity binding sites induce ahigher level of transcriptional activation than low affinity bindingsites. However, in vitro affinity and in vivo activity often do notcorrelate11,29–31. Accordingly, we find in this study that sequencesflanking the core GBS induce changes in activity withoutapparent changes in affinity derived from in vitro bindingstudies. One explanation for this apparent disconnect betweenbinding affinity and activity could be that in vitro binding affinitydoes not reflect binding affinity in vivo. Yet, here we also fail tosee a correlation when we compare in vivo occupancy derivedfrom ChIP experiments as a proxy for in vivo affinity. Wewould like to point out that the interpretation of quantitativecomparisons of ChIP efficiencies between binding sites iscomplicated by possible sequence-specific efficiencies offormaldehyde cross-linking32. In this study, we focused on thefirst flanking nucleotide or ‘proximal flank’. However, when wechanged the second flanking position, we found an even moredramatic effect, where depending on the sequence of this positionGR could either robustly activate transcription, or completely lackthe ability to activate transcription (Supplementary Fig. 8A).Again, the modulation of GR activity appears independent ofbinding affinity, and could be a consequence of conformationalchanges of the DNA (Supplementary Fig. 8B,C). Together, thesefindings argue that GBSs can modulate GR activity downstreamof binding.
Structural studies8,11,13, including those presented here,indicate that GBS variants with distinct transcriptional activities
Che
mic
al s
hift
pert
urba
tion
(p.p
.m.)
1
0.8
0.6
0.4
0.2
0
H1 H2
Leverarm
D-
loop
Amino-acid residue
1
0.8
0.6
0.4
0.2
01
0.8
0.6
0.4
0.2
0440 445 450 455 460 465 470 475 480 485 490 495 500 505 510 515 520 525
S448 T456 R488 Y497 N506 K511
H3
1
0.8
0.6
0.4
0.2
0
Cgt AT/GC wt
Cgt AT/AC wt
Cgt GC/AC wt
Cgt AT/GC Dim
Figure 5 | NMR chemical shift difference analysis between GBSs with different flanks. Chemical shift difference of spectra between (top three panels)
Cgt flanked by A/T versus G/C; A/T versus A/C; G/C versus A/C for wild-type DBD and (bottom panel) Cgt A/T versus G/C for the dimer mutant
DBD (A477T). Horizontal dashed grey lines indicate significance cut-off (average þ 1 s.d.). Green dashed lines demark amino acid residues with significant
shifts when comparing the A/T and A/C sequences.
NATURE COMMUNICATIONS | DOI: 10.1038/ncomms12621 ARTICLE
NATURE COMMUNICATIONS | 7:12621 | DOI: 10.1038/ncomms12621 | www.nature.com/naturecommunications 7

induce alternative conformations in the DBD of GR. Thesestructural changes can be induced by changing the sequence ofthe spacer, of the half-sites, or as we show here of the nucleotidesflanking the core-binding site. Based on the structure, the sidechain of R510 and K511 can contact the flanking nucleotides andthus serve as potential ‘readers’ that interpret the DNA-encodedinstructions and translate these into changes in activity. However,when we change these residues to alanines, the flank effect is stillobserved. This suggests that direct contacts with the flankingnucleotides are not responsible for the flank effect. Instead, theeffects of the proximal flanks might be a consequence of thepredicted changes in DNA shape. DNA shape, in turn, couldinduce structural changes in the associated GR dimer partners. Tofurther understand the molecular basis that gives rise to theaforementioned split peaks in our NMR spectra, we turned tomolecular dynamics (MD) to simulate how changing the flanksinfluences the individual monomers. When we compared theoverall trajectories, however, we did not observe significantstructural differences for either chain A or chain B when wecompared the root mean squared deviation (r.m.s.d.) valuesbetween the A/T- and the G/C-flanked Cgt GBS. Similarly, weonly observed subtle changes when we compared the root meansquared fluctuation (r.m.s.f.) (Supplementary Fig. 9), a measure of
flexibility of the DBD, between the two Cgt flank variants. Thechanges that do occur, predominantly map to residues at thedimerization interface (Supplementary Fig 10A). In addition, ther.m.s.f. values for monomer B when bound to the G/C-flankedGBS show higher values than those observed for the A/Tcounterpart indicating that chain B’s interaction with the DNAfor this sequence is more dynamic (Supplementary Figs 10Aand 9). Finally, we compared the median GR-DBD structures(computed from the last 50 ns of the MD simulations) whenbound to A/T- or G/C-flanked Cgt. Again, the deviations betweenthese two structures are only small except for the lever arm, whichconnects the dimerization interface with the DNA recognitionhelix (Supplementary Fig. 10B). Interestingly, however, changingthe flanking nucleotides appears to result in a different relativepositioning of the dimer-halves as can be seen from the medianconformations for both flank-variants when aligned on chain A(Supplementary Fig. 10C).
Together, our structural approaches showed flank-inducedchanges in the dynamics and conformation of the dimer partnersand in the relative positioning of GR dimer halves. Consistentwith previous studies13, we find that GR’s ability to ‘read’DNA-shape encoded instructions, in this case as a consequence ofchanging the flanks, requires an intact dimer interface.Importantly, the mutation in the dimerization domain westudied (A477T) does not result in an inability of GR todimerize in vivo33. Therefore, our interpretation of the effect ofmutating the dimerization interface is that they are a consequenceof perturbing an interface important for communication betweendimerization partners or for communication between differentGR domains of each monomer, rather than a consequence of aninability of the mutant to bind DNA as a dimer. We find thatmutating the dimer interface diminishes flank-induced changes inboth GR structure and activity. This suggests that the dimerinterface prevents the monomers from adopting an optimalpositioning in the major groove and consequently the dimerpartners switch between different conformational states toaccommodate conflicting optimal contacts at the dimerinterface and those with the DNA (Fig. 7d). This might alsoexplain the high degree of flexibility that the dimer interface andconnected lever arm display based on the r.m.s.f. values of theMD experiments (Supplementary Figs 9 and 10). Mutation of thedimer interface might release this stress and allow optimalpositioning of both dimer partners for contacting the DNA in themajor groove. Similarly, conflicts in the optimal positioning ofdimer halves might be relieved when mutating K461, whichweakens the interactions between DNA and protein24 thusfavouring optimal positioning of the GR partners for interactionsat the dimerization interface. To link the structural changes tovariations in transcriptional output, we propose that DNA-shape-induced effects on the conformation, dynamics or relativepositioning of GR partners influence its interactions withco-regulators by making or breaking interaction surfaces toultimately modulate the recruitment or activity of the RNApolymerase machinery.
In addition to fine-tuning the activity of TFs, DNA shapealso enables paralogous TFs to have distinct DNA-bindingpreferences34,35. For example, members of the Hox family ofTFs share a similar consensus recognition sequence, yet havedistinct functions in vivo. This specificity was explained byHox-specific DNA shape preferences which enabled the exchangeof binding site preferences from one Hox protein to anotherby swapping shape-recognizing residues34. In addition, severalother studies have shown a role of nucleotides flanking thecore-binding site in guiding TFs to their cognate bindingsites35,36. For GR, several related nuclear receptors share thesame DNA binding specificity in vitro yet regulate different
Flank
aA/T versus G/C
Chain B
Flank
R488
Y497
T456
K511
S448
N506
Flank
Chain A
A/T versus A/C
b
Figure 6 | Influence of flanking nucleotides on GR structure. (a) Side view
of GR DBD crystal structure (PDB: 3G9J) with chains A and B
corresponding to each monomer. Amino-acid residues with significant
combined 1H and 15N chemical shift differences between A/T- and
G/C-flanked Cgt sequences are projected onto this GR DBD structure and
coloured in red. (b) Side view of GR DBD crystal structure with amino acid
residues with significant combined 1H and 15N chemical shift differences
between A/T and A/C flanked Cgt sequence projected in green onto the
GR DBD, chain B.
ARTICLE NATURE COMMUNICATIONS | DOI: 10.1038/ncomms12621
8 NATURE COMMUNICATIONS | 7:12621 | DOI: 10.1038/ncomms12621 | www.nature.com/naturecommunications
physiological processes. For example, the androgen receptorpromotes myogenesis37 whereas chronic GR activation results inmuscle wasting38. We speculate that DNA shape could alsogenerate specificity for this family of TFs by modulation of TFactivity downstream of binding. In this scenario, two TFs mightbind at the same target site, yet only one adopts an activation-competent conformation. The possibility that only certainbinding events induce activation-competent conformationscould also explain, in part, why only a minority of genes showchanges in their expression level on binding of TFs to regulatorysequences nearby39.
The activity of TFs towards individual target genes can bemodulated by a variety of mechanisms other than the sequenceidentity of the binding site. For example, a recent study showedthat the number of occupied NF-kB-binding sites associated witha gene correlates with the magnitude of activation39. However, inaddition to being expressed at higher levels, genes with multipleTF-binding sites might display a greater degree of cell-to-cellvariability (transcriptional noise) of gene expression40. Therefore,we speculate that it could be beneficial for some GR target genesto be under control of a single, highly-active GBS with littletranscriptional noise rather than multiple GBSs which induce
greater noise. Another benefit of modulating activity by DNA-shape-induced conformational changes is that this might allowGR to induce different expression levels of a gene from the samebinding site depending on its cellular context. This could, forexample, occur when a GBS-induced conformation facilitatesinteraction with a particular co-regulator that is expressed in acell-type-specific manner. This would be one of severalmechanisms that GR can exploit to extract context informationfrom its cellular environment to allow fine-tuning of its activitytowards distinct sets of target genes responsible for GR’srole in diverse physiological processes including metabolism,inflammatory response and emotional behaviour.
The present study advances our understanding ofGBS-mediated regulation of GR activity in several ways. First,we show for the first time that GBSs can modulate GR activity ina genomic context and our in vivo occupancy studies indicate thatthis modulation occurs downstream of binding. Structural studiesindicate that this modulation may be a consequence of GBS-dependent conformational changes of individual monomers andof changes in the relative positioning of dimeric partners. Studieswith related hormone receptors that heterodimerize have shownallosteric communication between dimerization partners across
a b
0
1
2
3
4
5
c d
Wild-type GR: Mutated dimer interface:
Fol
d ac
tivat
ion
(dex
/eto
h)
Fol
d ac
tivat
ion
(dex
/eto
h)
G-C
gt-C
A-C
gt-T
WT
G-C
gt-C
A-C
gt-T
R510AG
-Cgt
-C
A-C
gt-T
K511A
G-C
gt-C
A-C
gt-T
K465A
G-C
gt-C
A-C
gt-T
K461A
G-S
gk-C
A-S
gk-T
WT
G-S
gk-C
A-S
gk-T
DimA477T
G-C
gt-C
A-C
gt-T
WT
G-C
gt-C
A-C
gt-T
DimA477T
C460:
K461:
L507:
9.7 9.65 9.6 9.7 9.65 9.6 9.7 9.65 9.6
130.5
131
7.65 7.6 7.65 7.6 7.65 7.6
120.0
120.5
125.5
126.0
126.5
9.5 9.45 9.4 9.45 9.5 9.45 9.4 9.459.5 9.45 9.4 9.45
WT A-Cgt-TWT G-Cgt-C
Dim A-Cgt-TDim G-Cgt-C
0
2
4
6
8
AAGAACAnnnTGTACGT AAGAACAnnnTGTACGT
GAGAACAnnnTGTACGCGAGAACAnnnTGTACGC
Figure 7 | Flank effect requires an intact dimer interface. (a) Comparison of transcriptional activation of transiently transfected reporters with GBS as
indicated flanked by either A/T or G/C sequences between GR wild-type (WT) and GR variants R510A, K511A, K465A and K461A, respectively. Average
induction on 1mM dexamethasone (dex) treatment relative to ethanol (etoh) vehicle±s.e.m. (nZ3) is shown. (b) Same as a comparing GR wild-type (WT)
and dimer mutant (Dim, A477T). (c) Zoom-in of 1H-15N-SOFAST-HMQC spectra of selected peaks for residues that show peak-splitting and non-
overlapping spectra when comparing GR DBD in complex with either A/T- or G/C-flanked Cgt sequences for (left) wild-type, (middle) A477T dimer
mutant DBD and (right) overlay of wild-type and dimer mutant. (Stoichiometry DNA:DBD; 1:2). (d) Cartoon depicting (left) how the bases flanking the GBS
influence the structure and relative positioning of GR half-sites and (right) how disruption of the dimer interface weakens the effect of the flank on GR
structure (and activity).
NATURE COMMUNICATIONS | DOI: 10.1038/ncomms12621 ARTICLE
NATURE COMMUNICATIONS | 7:12621 | DOI: 10.1038/ncomms12621 | www.nature.com/naturecommunications 9

the dimerization interface to fine-tune the structure and activityof the complex41. Here we propose that GR monomers canchange their shape and that the homodimerization partners canchange their relative positioning to assemble multiple distinctcomplexes, effectively allowing a kind of combinatorial regulationof transcriptional output by a single TF. Whether GBSs indeedplay a role in modulating the activity of GR towards endogenousGR target genes is still unclear. Arguing in favour of thispossibility, we show that GBS sequence features found atGR-bound regions in the genome, specifically the nucleotidesflanking the core GBS, show different preferences depending onstrength of regulation of the nearby gene. The next step to studythe role of GBS composition in the modulation of endogenoustarget gene expression would be to test the consequences ofchanging the sequence identity of endogenous binding sites,which, given the recent advances in the ability to edit the genome,has now become within reach.
MethodsPlasmids. Luciferase reporter constructs were generated by inserting a GBS ofinterest (Supplementary Table 1) by ligating oligonucleotides with overhangs tofacilitate direct cloning into the KpnI and XhoI sites of pGL3 promoter (Promega).Mutations of the second flank position (Supplementary Fig. 8) were introduced bysite-directed mutagenesis (oligos listed in Supplementary Table 2). Expressionconstructs for wild-type rat GR, GR dim mutant (A477T) and GR R510A mutanthave been described previously11. GR mutants K465A and K511A were generatedby site-directed mutagenesis (oligos listed in Supplementary Table 2).
Constructs expressing ZFNs against the AAVS1 locus have been describedelsewhere14,42. Donor constructs for luciferase reporter addition to the AAVS1locus were assembled as described14. The donor constructs consisted of regions ofhomology flanking the position where the ZFNs induce the double strand break, apromoter-less GFP gene and the GBS sequence as indicated upstream of a minimalSV40 promoter driving expression of the firefly luciferase gene derived from thepGL3-promoter plasmid (Promega).
Cell lines, transient transfections and luciferase assays. U2OS (ATCCHTB-96) and U2OS cells stably transfected with rat GRa43,44 were grown inDMEM supplemented with 5% FBS. Transient transfections were done essentiallyas described11. Luciferase activity was measured using the dual luciferase assay kit(Promega).
Electrophoretic mobility shift assays. EMSAs were performed as describedpreviously15. Briefly, a series of GR DBD dilutions were mixed with 1.25� 10� 9 M
DNA (oligos listed in Supplementary Table 3) in 20mM Tris pH 7.5, 2mM MgCl2,1mM EDTA, 10% glycerol, 0.3mgml� 1 BSA, 4mM DTT, 0.05 mgml� 1 dIdC.Reaction mixes were incubated for 30min to reach equilibrium, loaded ontorunning native gels and scanned using a FLA 5,100 scanner (Fujifilm) to quantifyfree [D] versus total [D]t DNA. Equilibrium binding constants (KD) weredetermined by non-linear least squares fitting of the free protein concentration [P]versus the fraction of DNA bound ([PD]/[D]t) to the equation [PD]/[D]t¼1/(1þ (KD/[P])).
Targeted Integration of GBS reporters. Cell lines with stably integrated GBSreporters were isolated as described previously14. Briefly, cells were transformedwith ZFN and donor construct by nucleofection (Amaxa), GFP-positive pools ofcells were isolated by flow-activated cell sorting (FACS) and single-cell-derivedclonal lines were isolated. To identify clones with a correct integration of the donorconstruct at the AAVS1 locus, 40 ng of chromosomal DNA was analysed by PCRusing a primer targeting the donor construct (Luc-fw: 50-Tcaaagaggcgaactgtgtg-30)and a primer targeting the genomic AAVS1 locus that directly flanks the site ofintegration (R5: 50-ctgggataccccgaagagtg-30)(Fig. 1a and Supplementary Fig. 1A).
Chromatin immunoprecipitation. ChIP assays were performed as described usingthe N499 GR-antibody15. For each ChIP assay, approximately five million cellswere treated with 0.1% ethanol vehicle or 1 mM dexamethasone for 1.5 h. Primersused for quantitative PCR (qPCR) are listed in Supplementary Table 4.
RNA isolation and analysis by qPCR. RNA was isolated from cells treated for 8 hwith 1 mM dexamethasone or with 0.1% ethanol vehicle using the RNeasy mini kit(Qiagen). The Turbo DNA-free kit (Ambion) was used to remove trace amounts ofcontaminating chromosomal DNA prior to reverse transcription using randomprimers and 500 ng of total RNA as input. Resulting cDNA was analysed by qPCRusing Rpl19 as an internal control for normalization. Primers used are listed inSupplementary Table 4.
Computational analysis of ChIP-seq and gene expression data. Microarraydata sets in U2OS cells were taken from ref. 15 (E-GEOD-38971). ChIP-seq datasets from the same study were downloaded as processed peaks from GEO(E-MTAB-2731). The differentially expressed (adjusted P value o0.05) genes inU2OS cells were assigned to two different groups. The first group consistedof the 20% most upregulated genes on hormone treatment (log2-fold changedexamethasone/ethanol vehicle ranging from 1.91 to 7.86; 290 of 1,447 genes).Next, we extracted the ChIP-seq peaks falling in a 40 kb window centred on thetranscription start site of each gene (543 peaks in total from 290 genes of thisgroup). For comparison, we extracted a similar number of peaks (532) from genes(688) showing only weak regulation (absolute log2-fold changer|0.72|). For eachgroup of peaks, we performed de novo motif discovery using RSAT peak motifs(default settings, including dyad-analysis algorithm and the TRANSFAC version2010.1 motif collection)16. Peak motifs automatically compare detected motifs toannotated motif collections, and motifs matching the GR consensus motif(depicted in Fig. 2a) were manually extracted.
To compare ChIP-seq peak heights between GR-bound regions harbouringeither A/T or G/C flanked GBSs, GR peaks were first scanned for the occurrence ofa GBS-match with RSAT matrix scan (Transfac matrix M00205, P value cut-off:10� 4 (refs 16,45)). Next, peaks were grouped according to the sequence of theflanks (A/T versus G/C) and median peak height was calculated to produceSupplementary Fig. 3.
To score the enrichment of A/T GBS and G/C-flanked GBSs in the peaksassociated with strong and weak upregulation, respectively (Supplementary Fig. 2),RSAT matrix-quality was used to compute normalized weight differences(NWD)46. The input motifs for matrix-quality were derived from the above-mentioned matrices corresponding to GR motifs found with peak motifs, enforcingonly A/T or G/C at the flank position.
DNA shape prediction. For DNA shape prediction, we used GBSs associated withweakly and strongly responsive GR target genes. For the weak and strong peak datasets, we extracted the sequence of all GBSs flanked by either G and C (75 GBSs) orA and T (83 GBSs), respectively. The sequences were aligned based on theGBS spacer by setting the centre spacer position to 0. Minor groove width andpropeller twist were derived for each position in the aligned sequences using ahigh-throughput DNA shape prediction approach19. To test for differences inDNA shape features between the weak and strong peaks, Wilcoxon test P valueswere calculated for each nucleotide position separately.
NMR. Protein expression and purification. 15N-labelled wild-type and A477Tmutant rat GR DBD (residues 440–525) were expressed and purified essentially asdescribed previously13 except that a codon optimized construct for expression inEscherichia coli was used here. In brief, proteins were expressed in E. coli(T7 Express; NEB) using the pET expression system in M9 minimal medium47.Expression was induced at an OD600 of 0.6–0.9 using 0.25mM IPTG (Amresco).Temperature was lowered from 37 to 25 �C on addition of IPTG and culturesgrown overnight. Cells were harvested and lysed followed by protein separation byIMAC and IEX chromatography. The latter was done after extensive dialysisagainst salt-free buffer. Final dialysis at the end of protein purification was carriedout against NMR buffer (20mM sodium phosphate; 100mM NaCl; 1mM DTT;pH 6.7).
Protein–DNA complex formation. Single-stranded DNA oligos (salt-free andlyophilized) were purchased from MWG and purified as described13. Buffer wasexchanged to water using NAP10 gravity flow columns (GE Healthcare) andannealed according to a standard protocol. Success of annealing was evaluatedusing proton-detected 1D NMR spectra. Protein–DNA complexes for 2D NMRwere prepared essentially as described13 by mixing protein solution of either GRaor GRa-dim in onefold NMR buffer with dsDNA oligos. Final concentrations ofprotein and DNA was 40 mM and 53 mM, respectively, resulting in a molar ratio of1:1.33. Samples were supplemented with 5% D2O the lock. Water and twofoldNMR buffer was added to give a final sample volume of 500 ml. Sequence of oligosis described in Supplementary Table 5.
NMR and CSP analysis. 1H-15N-HSQC spectra were recorded as SOFASTversions48 at 35 �C on a Bruker AV 600MHz spectrometer (Bruker, Karlsruhe,Germany) equipped with a cryo-probehead. TopSpin (version 3.1, Bruker) wasused for data processing, including zero filling and linear prediction. The transferof previous assignment13 and general data evaluation were done using the CCPNsoftware package (version 2.1.5)49.
CSP was calculated using the following formula50:ffiffiffiffiffiffiffiffiffiffiffiffiffiffiffiffiffiffiffiffiffiffiffiffiffiffiffiffiffiffiffiffiffiffiffiffiffiffiffiffiffiffiffiffiffiffiffiffiffiffiffiffiffiffiffiffiffiffiffiffiffiffiffiffiffiffiffiffiffiffiffiffiffiffiffiffiffiffiffiffiffi1H½p:p:m:�ð Þ2 þ 15N½p:p:m:� � g15N
�g1H
� �2q
where 1H and 15N refer to the mathematical difference of individual hydrogen andnitrogen chemical shifts of two distinct peak maxima. Gyromagnetic ratio (gi) ofnuclei i, where i is 1H or 15N, is used for normalization.
DNA assignment. NMR experiments were recorded at 700MHz on an AvanceIII Bruker spectrometer equipped with a TCI z-gradient cryoprobe. NMR data wereacquired at 15 and 20 �C. Solvent suppression was achieved using the ‘Jump andReturn’ sequence combined to WATERGATE51–53. 2D NOESY spectra wereacquired with mixing times of 400 and 50ms. NMR data were processed using
ARTICLE NATURE COMMUNICATIONS | DOI: 10.1038/ncomms12621
10 NATURE COMMUNICATIONS | 7:12621 | DOI: 10.1038/ncomms12621 | www.nature.com/naturecommunications

TopSpin and analysed with Sparky software packages (Goddard, T.D. and Kneller,D.G., SPARKY 3, the University of California, San Francisco). 1H assignments wereobtained using standard homonuclear experiments. The resonances found between10 and 14 p.p.m. are characteristic of protons involved in hydrogen bonds,generally due to the formation of base pairs. The imino proton spectra of A/T- andG/C-flanked DNAs, showed the formation of DNA duplexes. The A:T Watson–Crick base-pairs were discriminated from G:C base-pairs by the strong correlationbetween the thymine H3 imino proton and the H2 proton of adenine. In a G:CWatson–Crick base-pair, two strong NOEs cross-peaks are observable between theguanine H1 imino proton and the cytosine amino protons. Base-pairings were nextestablished via sequential nuclear Overhauser effects observed in 2D NOESYspectra at different mixing times.
DNA–protein titration. Proton detected 1D NMR spectra with doubleWATERGATE sequence for water suppression54 were used for titrationexperiments. Inter-gradient delay of WATERGATE sequence was set to 80 ms toobtain a maximum signal intensity of dsDNA-specific hydrogen bonds atB12 p.p.m. About 500 ml of 50 mM dsDNA in 1� NMR buffer without proteinwas used as initial concentration (incl. 5% D2O). Unlabelled GRa (1.2mM stockconcentration in NMR buffer) was added stepwise to achieve DNA–sprotein ratiosof 0.25; 0.50; 0.75; 1.00; 1.25; 1.50; 1.75; 2.00; 2.50; 3.00, while minimal dilution ofdsDNA occurred (final concentration of dsDNA at 1:3 ratio was 45 mM). Alltitrations experiments were performed at 25 �C, monitoring the imino protonsregion of 1D spectra. Intensities of imino protons were measured at each point ofthe titration. Ratios of intensities between bound-DNA and free-DNA werecalculated for both A/T DNA and G/C DNA. All peaks showed similar decreases inintensity with increasing DNA–protein ratios, with the exception of G46 whichexhibited a more pronounced broadening in the case of the A/T DNA.
MD simulations.Molecular systems. Classical MD simulations were carried out forA/T and G/C flank variants of the Cgt GBS. The initial structure was preparedbased on a crystal structure of the GR DNA-binding site in complex with theCgt-binding site (PDB ID 3FYL11). Position þ 5 was mutated in silico (C to A).Five and four nucleotides per strand in a perfect B-form were added to the 50 and 30
side of the DNA fragment, respectively, resulting in DNA fragments with 24nucleotides length: 50-CACCAAGAACATTTTGTACGTCTC-30 and 50-CACCGAGAACATTTTGTACGCCTC-30 for the A/T and G/C Cgt flank variant,respectively.
Molecular dynamic simulation. The simulations were performed with theprogram package NAMD 2.10 (ref. 55) using CHARMM27 force field56. The DNAfragments of initial structures were energy minimized (3,000 steps of conjugategradient) to remove energetically unfavourable conformations resulting from theaddition of the additional nucleotides. The systems were solvated in TIP3P water57
and a total of 35 sodium ions were placed randomly within a minimum distance of10.5 Å from the solute and 5Å between sodium ions to ensure a zero net charge forthe solute–solvent–counterion complex. The systems contained B127,000 atoms.The final complexes were equilibrated by 5,000 steps of energy minimization,followed by a 30 ps MD simulation (time step 1 fs) to heat up the system to 300Kby velocity scaling. Next, a relaxation 200 ps (time step 1 fs) was performed for anNPT ensemble. Periodic boundary conditions were implemented with the particle-mesh Ewald method58 for electrostatic interactions with cut-off distance 14Å.Lennard–Jones interactions were truncated at 14Å. The SHAKE algorithm wasapplied to constraint all bonds involving hydrogen atoms. Three independent,100-ns-long MD simulations were performed in constant pressure (1 bar) andconstant temperature (300 K) with a 2 fs time step for each A/T and G/C flank GBS.During these simulations, pressure and temperature were maintained constantusing langevin dynamic barostat and Nose�Hoover Langevin thermostat.The terminal base pairs of the DNA fragments were restrained harmonically.A simulation run was further prolonged to 300 ns for complexes with bothA/T- and G/C-flanking nucleotides.
Data availability. Microarray (E-GEOD-38971) and ChIP-seq (E-MTAB-2731)data are deposited in the GEO repository. All other data are available from thecorresponding authors upon request.
References1. Alberts, B. et al. Molecular Biology of the Cell (Garland Science, New York, NY,
USA, 2002).2. Levo, M. & Segal, E. In pursuit of design principles of regulatory sequences.
Nat. Rev. Genet. 15, 453–468 (2014).3. Spitz, F. & Furlong, E. E. Transcription factors: from enhancer binding to
developmental control. Nat. Rev. Genet. 13, 613–626 (2012).4. Sharon, E. et al. Inferring gene regulatory logic from high-throughput
measurements of thousands of systematically designed promoters. Nat.Biotechnol. 30, 521–530 (2012).
5. Akhtar, W. et al. Chromatin position effects assayed by thousands of reportersintegrated in parallel. Cell 154, 914–927 (2013).
6. Schubeler, D. Function and information content of DNA methylation. Nature517, 321–326 (2015).
7. Stolzenburg, S. et al. Targeted silencing of the oncogenic transcription factorSOX2 in breast cancer. Nucleic Acids Res. 40, 6725–6740 (2012).
8. Hudson, W. H., Youn, C. & Ortlund, E. A. The structural basis of directglucocorticoid-mediated transrepression. Nat. Struct. Mol. Biol. 20, 53–58(2013).
9. Langlais, D., Couture, C., Balsalobre, A. & Drouin, J. The Stat3/GR interactioncode: predictive value of direct/indirect DNA recruitment for transcriptionoutcome. Mol. Cell 47, 38–49 (2012).
10. Surjit, M. et al. Widespread negative response elements mediate directrepression by agonist-liganded glucocorticoid receptor. Cell 145, 224–241(2011).
11. Meijsing, S. H. et al. DNA-binding site sequence directs glucocorticoid receptorstructure and activity. Science 324, 407–410 (2009).
12. Bain, D. L. et al. Glucocorticoid receptor-DNA interactions: binding energeticsare the primary determinant of sequence-specific transcriptional activity.J. Mol. Biol. 422, 18–32 (2012).
13. Watson, L. C. et al. The glucocorticoid receptor dimer interface allostericallytransmits sequence-specific DNA signals. Nat. Struct. Mol. Biol. 20, 876–883(2013).
14. DeKelver, R. C. et al. Functional genomics, proteomics, and regulatory DNAanalysis in isogenic settings using zinc finger nuclease-driven transgenesis intoa safe harbor locus in the human genome. Genome Res. 20, 1133–1142 (2010).
15. Thomas-Chollier, M. et al. A naturally occurring insertion of a single aminoacid rewires transcriptional regulation by glucocorticoid receptor isoforms.Proc. Natl Acad. Sci. USA 110, 17826–17831 (2013).
16. Thomas-Chollier, M. et al. RSAT peak-motifs: motif analysis in full-sizeChIP-seq data sets. Nucleic Acids Res. 40, e31 (2012).
17. Diamond, M. I., Miner, J. N., Yoshinaga, S. K. & Yamamoto, K. R.Transcription factor interactions: selectors of positive or negative regulationfrom a single DNA element. Science 249, 1266–1272 (1990).
18. Strahle, U., Schmid, W. & Schutz, G. Synergistic action of the glucocorticoidreceptor with transcription factors. EMBO J. 7, 3389–3395 (1988).
19. Zhou, T. et al. DNAshape: a method for the high-throughput prediction ofDNA structural features on a genomic scale. Nucleic Acids Res. 41, W56–W62(2013).
20. Zhuravleva, A. & Gierasch, L. M. Allosteric signal transmission in thenucleotide-binding domain of 70-kDa heat shock protein (Hsp70) molecularchaperones. Proc. Natl Acad. Sci. USA 108, 6987–6992 (2011).
21. Selvaratnam, R., Chowdhury, S., VanSchouwen, B. & Melacini, G. Mappingallostery through the covariance analysis of NMR chemical shifts. Proc. NatlAcad. Sci. USA 108, 6133–6138 (2011).
22. Masterson, L. R., Mascioni, A., Traaseth, N. J., Taylor, S. S. & Veglia, G.Allosteric cooperativity in protein kinase A. Proc. Natl Acad. Sci. USA 105,506–511 (2008).
23. Luisi, B. F. et al. Crystallographic analysis of the interaction of theglucocorticoid receptor with DNA. Nature 352, 497–505 (1991).
24. Starr, D. B., Matsui, W., Thomas, J. R. & Yamamoto, K. R. Intracellularreceptors use a common mechanism to interpret signaling information atresponse elements. Genes Dev. 10, 1271–1283 (1996).
25. Rohs, R. et al. Origins of specificity in protein-DNA recognition. Annu. Rev.Biochem. 79, 233–269 (2010).
26. Bintu, L. et al. Transcriptional regulation by the numbers: models. Curr. Opin.Genet. Dev. 15, 116–124 (2005).
27. Buchler, N. E., Gerland, U. & Hwa, T. On schemes of combinatorialtranscription logic. Proc. Natl Acad. Sci. USA 100, 5136–5141 (2003).
28. Verfaillie, A. et al. Multiplex enhancer-reporter assays uncover unsophisticatedTP53 enhancer logic. Genome Res. 26, 882–895 (2016).
29. Garcia, H. G. et al. Operator sequence alters gene expression independently oftranscription factor occupancy in bacteria. Cell Rep. 2, 150–161 (2012).
30. Hammar, P. et al. Direct measurement of transcription factor dissociationexcludes a simple operator occupancy model for gene regulation. Nat. Genet.46, 405–408 (2014).
31. Crocker, J. et al. Low affinity binding site clusters confer hox specificity andregulatory robustness. Cell 160, 191–203 (2015).
32. Lu, K. et al. Structural characterization of formaldehyde-induced cross-linksbetween amino acids and deoxynucleosides and their oligomers. J. Am. Chem.Soc. 132, 3388–3399 (2010).
33. Presman, D. M. et al. Live cell imaging unveils multiple domain requirementsfor in vivo dimerization of the glucocorticoid receptor. PLoS Biol. 12, e1001813(2014).
34. Abe, N. et al. Deconvolving the recognition of DNA shape from sequence. Cell161, 307–318 (2015).
35. Gordan, R. et al. Genomic regions flanking E-box binding sites influence DNAbinding specificity of bHLH transcription factors through DNA shape. Cell Rep.3, 1093–1104 (2013).
36. Dror, I., Golan, T., Levy, C., Rohs, R. & Mandel-Gutfreund, Y. A widespreadrole of the motif environment in transcription factor binding across diverseprotein families. Genome Res. 25, 1268–1280 (2015).
NATURE COMMUNICATIONS | DOI: 10.1038/ncomms12621 ARTICLE
NATURE COMMUNICATIONS | 7:12621 | DOI: 10.1038/ncomms12621 | www.nature.com/naturecommunications 11

37. Celotti, F. & Negri Cesi, P. Anabolic steroids: a review of their effects on themuscles, of their possible mechanisms of action and of their use in athletics.J. Steroid Biochem. Mol. Biol. 43, 469–477 (1992).
38. Kelly, F. J. & Goldspink, D. F. The differing responses of four muscle types todexamethasone treatment in the rat. Biochem. J. 208, 147–151 (1982).
39. Jin, F. et al. A high-resolution map of the three-dimensional chromatininteractome in human cells. Nature 503, 290–294 (2013).
40. Sharon, E. et al. Probing the effect of promoters on noise in gene expressionusing thousands of designed sequences. Genome Res. 24, 1698–1706 (2014).
41. Kojetin, D. J. et al. Structural mechanism for signal transduction in RXRnuclear receptor heterodimers. Nat. Commun. 6, 8013 (2015).
42. Hockemeyer, D. et al. Efficient targeting of expressed and silent genes in humanESCs and iPSCs using zinc-finger nucleases. Nat. Biotechnol. 27, 851–857(2009).
43. Rogatsky, I., Trowbridge, J. M. & Garabedian, M. J. Glucocorticoidreceptor-mediated cell cycle arrest is achieved through distinct cell-specifictranscriptional regulatory mechanisms. Mol. Cell Biol. 17, 3181–3193 (1997).
44. Rogatsky, I. et al. Target-specific utilization of transcriptional regulatorysurfaces by the glucocorticoid receptor. Proc. Natl Acad. Sci. USA 100,13845–13850 (2003).
45. Turatsinze, J. V., Thomas-Chollier, M., Defrance, M. & van Helden, J. UsingRSAT to scan genome sequences for transcription factor binding sites andcis-regulatory modules. Nat. Protoc. 3, 1578–1588 (2008).
46. Medina-Rivera, A. et al. Theoretical and empirical quality assessment oftranscription factor-binding motifs. Nucleic Acids Res. 39, 808–824 (2011).
47. Cioni, G. et al. Duplex-Doppler ultrasonography in the evaluation of cirrhoticpatients with portal hypertension and in the analysis of their response to drugs.J. Gastroenterol. Hepatol. 7, 388–392 (1992).
48. Gal, M., Schanda, P., Brutscher, B. & Frydman, L. UltraSOFAST HMQC NMRand the repetitive acquisition of 2D protein spectra at Hz rates. J. Am. Chem.Soc. 129, 1372–1377 (2007).
49. Vranken, W. F. et al. The CCPN data model for NMR spectroscopy:development of a software pipeline. Proteins 59, 687–696 (2005).
50. Floor, S. N., Borja, M. S. & Gross, J. D. Interdomain dynamics and coactivationof the mRNA decapping enzyme Dcp2 are mediated by a gatekeepertryptophan. Proc. Natl Acad. Sci. USA 109, 2872–2877 (2012).
51. Plateau, P. & Blanquet, S. Zinc-dependent synthesis of various dinucleoside 50 ,50 00-P1,P3-Tri- or 500 ,50 00-P1,P4-tetraphosphates by Escherichia coli lysyl-tRNAsynthetase. Biochemistry 21, 5273–5279 (1982).
52. Sklenar, V., Peterson, R. D., Rejante, M. R. & Feigon, J. Two- and three-dimensional HCN experiments for correlating base and sugar resonances in15N,13C-labeled RNA oligonucleotides. J. Biomol. NMR 3, 721–727 (1993).
53. Piotto, M., Saudek, V. & Sklenar, V. Gradient-tailored excitation for single-quantum NMR spectroscopy of aqueous solutions. J. Biomol. NMR 2, 661–665(1992).
54. Liu, M. et al. Improved WATERGATE pulse sequences for solvent suppressionin NMR spectroscopy. J. Magn. Reson. 132, 125–129 (1998).
55. Phillips, J. C. et al. Scalable molecular dynamics with NAMD. J. Comput. Chem.26, 1781–1802 (2005).
56. Vanommeslaeghe, K. et al. CHARMM general force field: A force field fordrug-like molecules compatible with the CHARMM all-atom additivebiological force fields. J. Comput. Chem. 31, 671–690 (2010).
57. Jorgensen, W. L., Chandrasekhar, J., Madura, J. D., Impey, R. W. & Klein, M. L.Comparison of simple potential functions for simulating liquid water. J. Chem.Phys. 79, 926–935 (1983).
58. Darden, T., York, D. & Pedersen, L. Particle mesh Ewald: an N � log(N)method for Ewald sums in large systems. J. Chem. Phys. 98, 10089–10092(1993).
AcknowledgementsWe thank Edda Einfeldt and Katja Borzym for excellent technical support. This work wasfunded by the DFG (grant ME4154/1-1 to M.J.) and NIH (grant R01GM106056 to R.R.).
Author contributionsS.S. performed and conceived the experiments and analysed the data. M.J., I.L. and B.K.performed and analysed the NMR experiments. M.B.H. and P.I. performed and analysedthe MD simulations. I.D. and R.R. performed and analysed the DNA shape predictions.S.S., M.T.-C., M.V. and S.H.M. designed and supervised the study and wrote themanuscript with input from all authors.
Additional informationSupplementary Information accompanies this paper at http://www.nature.com/naturecommunications
Competing financial interests: The authors declare no competing financial interests.
Reprints and permission information is available online at http://npg.nature.com/reprintsandpermissions/
How to cite this article: Schone, S. et al. Sequences flanking the core-binding sitemodulate glucocorticoid receptor structure and activity. Nat. Commun. 7:12621doi: 10.1038/ncomms12621 (2016).
This work is licensed under a Creative Commons Attribution 4.0International License. The images or other third party material in this
article are included in the article’s Creative Commons license, unless indicated otherwisein the credit line; if the material is not included under the Creative Commons license,users will need to obtain permission from the license holder to reproduce the material.To view a copy of this license, visit http://creativecommons.org/licenses/by/4.0/
r The Author(s) 2016
ARTICLE NATURE COMMUNICATIONS | DOI: 10.1038/ncomms12621
12 NATURE COMMUNICATIONS | 7:12621 | DOI: 10.1038/ncomms12621 | www.nature.com/naturecommunications

Corrigendum: Sequences flanking the core-bindingsite modulate glucocorticoid receptor structure andactivityStefanie Schone, Marcel Jurk, Mahdi Bagherpoor Helabad, Iris Dror, Isabelle Lebars, Bruno Kieffer, Petra Imhof,
Remo Rohs, Martin Vingron, Morgane Thomas-Chollier & Sebastiaan H. Meijsing
Nature Communications 7:12621 doi: 10.1038/ncomms12621 (2016); Published 1 Sep 2016; Updated 22 Nov 2016
The financial support for this Article was not fully acknowledged. The Acknowledgements should have included the following:
M.B.H. and P.I. are grateful for computational resources provided by the North-German Supercomputing Alliance and the ZEDATcluster Soroban of the Freie Universitat Berlin.
This work is licensed under a Creative Commons Attribution 4.0 International License. The images or other third party material in this article are included in thearticle’s Creative Commons license, unless indicated otherwise in the credit line; if the material is not included under the Creative Commons license, users will need
to obtain permission from the license holder to reproduce the material. To view a copy of this license, visit http://creativecommons.org/licenses/by/4.0/
r The Author(s) 2016
DOI: 10.1038/ncomms13784 OPEN
NATURE COMMUNICATIONS | 7:13784 | DOI: 10.1038/ncomms13784 | www.nature.com/naturecommunications 1