Embed Size (px)
Citation preview
1
Serum Concentrations of Polybrominated Diphenyl Ethers
(PBDEs) and Polybrominated Biphenyl (PBB) in the United
States Population: 2003-2004
Andreas Sjödin*, Lee-Yang Wong, Richard S. Jones, Annie Park, Yalin Zhang, Carolyn
Hodge, Emily DiPietro, Cheryl McClure, Wayman Turner, Larry L. Needham and
Donald G. Patterson, Jr.
Centers for Disease Control and Prevention; National Center for Environmental Health;
4770 Buford Hwy NE, Atlanta, GA, 30341, USA.
* - Corresponding author
Contact information for corresponding author:
Phone: +1-770-488-4711
Fax: +1-770-488-0142
Email: [email protected]
2
Brief Study Description: Assessment of the exposure status of the U.S. population to
PBDEs and BB-153 and associations with demographic information, including
participants' age, sex and race/ethnicity.
Key words: Polybrominated Diphenyl Ethers (PBDEs)
Polybrominated Biphenyl (PBB)
NHANES
Biomonitoring
Reference Values
3
Abstract
Polybrominated diphenyl ethers (PBDEs) and 2,2',4,4',5,5'-hexabromobiphenyl (BB-153)
are chemicals known as brominated flame retardants. We have assessed the exposure
status of the U.S. population to PBDEs and BB-153 and explored associations with
demographic information, including participants' age, sex and race/ethnicity. 2,062 serum
samples, from participants in the National Health and Nutrition Examination Survey
(NHANES) 2003-2004 aged 12 years and older, were analyzed for PBDEs and BB-153;
stratified and regression analyses were used to examine levels among demographic
groups.
The congener with the highest serum concentration was 2,2’,4,4’-tetrabromodiphenyl
ether (BDE-47) [geometric mean 20.5 ng/g lipid]; followed by 2,2’,4,4’,5,5’-hexaBDE
(BDE-153) [5.7 ng/g lipid]; 2,2’,4,4’,5-pentaBDE (BDE-99) [5.0 ng/g lipid; a value equal
to the highest limit of detection for an individual sample]; 2,2’,4,4’,6-pentaBDE (BDE-
100) [3.9 ng/g lipid]; BB-153 [2.3 ng/g lipid]; and 2,4,4’-triBDE (BDE-28) [1.2 ng/g
lipid]. For BDE-47, we observed no significant difference in the least square geometric
mean (LSGM) by sex, but with age we found both a linear decrease (p=0.01) and a
positive quadratic trend (p=0.01). Its LSGM, 27.9 ng/lipid, in the 12-19 year olds
decreased to 17.2 ng/g lipid in the 40-49 year group, and then curved upwards to 20.4
ng/g lipid in the ≥ 60 years olds. Mexican Americans had the highest LSGM of BDE-47
(24.5 ng/g lipid), which was significantly higher than that of Non-Hispanic whites (19.7
ng/g lipid, p=0.01). Adults 60 years and older were twice as likely as adults 20-59 years
old to have a serum BDE-47 concentration above the 95th percentile (p=0.02).These data
provide needed exposure assessment data for public health decisions.
4
Introduction
The National Health and Nutrition Examination Survey (NHANES) provides an ongoing
exposure assessment of the civilian, non-institutionalized U.S. population to a wide range
of chemicals through biomonitoring. The survey results are reported in CDC’s National
Report on Human Exposure to Environmental Chemicals (1). We report here individual
serum concentrations of polybrominated diphenyl ethers (PBDEs) and 2,2’,4,4’,5,5’-
hexabromobiphenyl (BB-153), based on NHANES sampling conducted during the years
2003 and 2004.
PBDEs and BB-153 are chemicals commonly known as brominated flame retardants
(BFRs), of which PBDEs are the most well known class (2). BB-153, on the other hand,
is an older use BFR; its production was discontinued in the mid-1970s in the U.S. after its
accidental contamination into dairy feed (3) in the State of Michigan. This incident led to
wide spread exposure to cattle and poultry; to humans who consumed these food items;
and to breast feeding infants of exposed mothers (3).
PBDEs are produced in three different technical preparations, commonly named
according to their average bromine content; i.e., PentaBDE, OctaBDE, and DecaBDE (4).
Technical PentaBDE is a mixture of congeners containing approximately 37% by weight
tetraBDEs, 43% pentaBDEs and 6.8% hexaBDEs and trace levels of triBDEs and
heptaBDE (5). Technical OctaBDE is a mixture of congeners with six to eight bromine
atoms on the diphenyl ether backbone while the DecaBDE mixture almost exclusively
contains BDE-209 (6). PBDE congeners containing seven to ten bromine atoms have
5
relatively short biological half-lives in humans; e.g., 2,2',3,4,4',5',6-heptabromophenyl
ether (BDE-183) has a half-life of 94 days (95% CI 68-120 days) (7). These highly
brominated congeners are not likely to biomagnify through the food chain, and thus direct
exposures in the indoor environment and occupational exposures are most likely the
dominant pathways of human exposure. The half-lives of PBDE congeners with fewer
than seven bromine substituents have not been determined in humans, although, the
2,2’,4,4’,5,5’-hexabromodiphenyl ether (BDE-153) half-life has been estimated to be in
the range of 2 years (8).
The PentaBDE formulation has been used primarily in the U.S. Of the 7,500 metric
tonnes of technical PentaBDE produced in 2001, ~95% were consumed in North America
(9). The PentaBDE product is used in most modern homes in the U.S. as a flame
retardant in polyurethane, which is used in furniture applications and in the foam padding
under wall-to-wall carpets (4,10). The PBDEs originating from the PentaBDE mixture
have been reported at much higher concentrations in residential dust from the U.S. than
from Germany, England, and Australia (11) and in serum samples worldwide (12-17).
Technical PentaBDE and OctaBDE were voluntarily phased out in the United States
beginning at the end of 2004. However, because of the wide spread distribution in U.S.
homes, as measured in the indoor environment (11,18-20), and high environmental
levels, as measured and documented in, for example, herring gull eggs from the Great
Lakes (21), it is likely that human body burdens in the United States will remain higher
than European levels in the near future.
6
The OctaBDE and DecaBDE preparations are used in hard plastics, such as those found
in the casings of electronic equipment. The 2001 industrial consumptions of OctaBDE
and DecaBDE in the United States were estimated to be 1,500 and 24,500 metric tones
per year (9), respectively, which represent 40% and 44% of the total world market,
respectively.
From a toxicological standpoint, PBDEs have been shown to cause neurodevelopmental
effects, as measured by altered habituation patterns in pups born from mice dosed during
a critical window of the developing mice fetus (22). These experiments also indicated
that 2,2’,4,4’,5-pentabromodiphenyl ether (BDE-99) is more potent than 2,2’,4,4’-
tetrabromodiphenyl ether (BDE-47) (22). Potential toxicological endpoints of concern for
PBDEs also include thyroid hormone disruption and cancer (23).
We report here serum concentrations of ten PBDE congeners (tri- to heptaBDEs) and
BB-153 (Table 1) in a representative sampling of U.S. residents in 2003 and 2004; we
assess the variation of concentrations by age, sex, and race/ethnicity. Further, the
influences of life style factors, such as the age of the primary residence and country of
origin have been investigated. DecaBDE was not included in this survey due to
difficulties with analytical measurement.
Experimental Section
Survey overview and sampling: The National Center for Health Statistics (NCHS)
and the National Center for Environmental Health (NCEH), both of the Centers for
7
Disease Control and Prevention (CDC), administered NHANES and performed the
analytical analyses, respectively. The goal of the NHANES is to obtain a representative
sample of the non-institutionalized population residing in the United States and thus by
assessing the health and nutrition status of this sub-sample of the population, estimate the
status of the population as a whole. A statistically representative sample of the population
is collected by dividing the country into geographic areas known as primary sampling
units (PSUs). The PSUs are then combined to form strata, each strata is then divided into
a series of neighborhoods. Households are thereafter chosen at random from these
neighborhoods, and residents are interviewed to determine eligibility for participation in
the survey. Over sampling of demographic groups, such as Mexican Americans and the
socioeconomic underserved, ensures reliable sample size for these demographic groups.
This over sampling is adjusted during data analyses by sampling weights. Each year
approximately 5,000 subjects are recruited from 15 locations across the United States.
Although, the NHANES is not designed to assess geographical differences. A random
one-third subset of eligible participants (N=2,305) age 12 years and above of the
NHANES 2003/04 survey was chosen for measurement of BFRs. Of these, 2,062 serum
samples were available for analysis. The population consisted of 48.4% male subjects.
The race/ethnicity distribution of the sample was 71.5% non-Hispanic white (NHW),
12.0% non-Hispanic black (NHB) and 8.2% Mexican Americans (MA); other
race/ethnicity groups corresponded to 8.3%. The percentages of participants below the
age of 20 years and above the age of 60 years were 12.2 and 17.0%, respectively.
8
Analytical Methods: All sample preparation work was performed in a clean room; its
supply air is passed through UPLA (Ultra-Low Penetration Air) filters, which have a
99.999% efficiency for removal of particles of 0.12µm diameter or larger. Inside the
clean room, biological safety cabinets are used as a second barrier against particle
contamination during all phases of sample handling. The analytical methodology
employed for the measurement of BFRs in serum has been reported (24); detailed
information on the determination of the limit of detection (LOD) is given in
Supplemental Information 1.
Statistical Methods: SAS software (version 9.1.3, SAS Institute, Cary, NC) and
SUDAAN software (version 9.0.1, Research Triangle Institute, Research Triangle Park,
N.C) were used to produce estimates, regression coefficients, and related standard errors.
We used sample weights to account for the unequal probability of selection and log
transformed data to compute all the estimates. Geometric means are calculated for
analytes detected in ≥60% of the samples. For a concentration below the maximum LOD,
a value equal to the LOD divided by the square root of 2 was used. Weighted Pearson
correlation coefficients were calculated in SAS.
For race/ethnicity group, we included everyone in the calculation for total estimates, but
we only used MA, NHB and NHW for other descriptive analyses and for regression
analyses. We stratified age by 12-19, 20-39, 40-59 years old and 60 years and older for
the geometric mean and the various percentiles.
9
We compared the brominated chemical concentrations by the participants’ country of
birth (inside or outside of US; variable DMDBORN) and by the construction year of the
residents’ housing (before 1959, 1960 – 1977, and 1978 and later). Because only 74.5%
of the participants responded to construction year of the residents question and because
the number of the foreign born was very small in the NHW (n=50) and the NHB (n=52),
we did not include these two variables in the multiple regression.
We used analysis of covariance to examine the influence of demographic variation of the
log-transformed serum concentrations for the analytes with ≥60% detection frequency;
i.e., BB-153, BDE-28, BDE-47, BDE-99, BDE-100, and BDE-153. The least square
geometric mean (LSGM) was calculated from the regression model. For multiple
regression analyses, the variables included in the initial model are age (continuous), sex
(Male or Female), and race (MA, NHB, and NHW). We also included an age-squared
term in the model for BB-153, BDE-28, BDE-47, BDE-99, BDE-100, and BDE-153
because the unadjusted geometric mean by age groups indicated a curvilinear relationship
between age and the PBDE lipid-adjusted serum concentration. When both age and age-
squared were included in the model, we found that age and age-squared terms had the
least correlation at age 46 year old, so to avoid multi-collinearity, we subtracted 46 from
each participant’s age (25). We assessed all possible two-way interaction terms in the
model. To evaluate the relation between the log-transformed concentration of all analytes
and age, we changed the continuous age to be a categorical age-decades variable in the
model in order to generate a bar chart of LSGM concentrations by age decades.
10
To reach the final model, we used backward elimination with a threshold of p<0.05 for
retaining the variable in the model, using Satterwaite-adjusted F statistics. We evaluated
for potential confounding by adding each of the excluded variables back into the final
model one by one and examining changes in the β coefficients of the statistically
significant main effects. If addition of one of these excluded variables caused a change in
a β coefficient by ≥10%, the variable was added back into the model.
We conducted weighted univariate and multiple logistic regression to examine the
association of BDE-47 or BDE-153 concentrations above the 95th percentile with sex
(Male, Female), age (12-19, 20-59, and 60 year and older), and race/ethnicity. These
congeners were selected since they are the in concentration dominating congeners.
Results
The serum concentrations of ten PBDE congeners with three to seven bromine
substituents and BB-153 were measured in 2,062 serum samples from the NHANES
2003/04; 99% were analyzed successfully giving a total of 2,040 samples with data
available for statistical analysis. BDE-47 was measured above its LOD in 2016 samples
and also the concentration of this congener was the highest in all stratifications of the
population and the entire population. Its geometric mean concentration in all participants
was 20.5 ng/g lipid; followed by BDE-153 (5.7 ng/g lipid), BDE-99 (5.0 ng/g lipid; a
value equal to the highest limit of detection for an individual sample), BDE-100 (3.9 ng/g
lipid), BB-153 (2.3 ng/g lipid) and BDE-28 (1.2 ng/g lipid) (Tables 2-3). Geometric
means could not be calculated for BDE-17, BDE-66, BDE-85, BDE-154 and BDE-183
11
because these congeners had a detection frequency of less than 60% (Table 1). The
geometric mean concentration and various percentiles stratified by age groups (age 12-
19; 20-39; 40-59 and ≥60 years), race/ethnicity (MA, NHB, NHW) and sex are given in
Tables 2-3 and Figure 1 for congeners with a detection frequency above 60%, while
congeners with a lower detection frequency are given in Table S1.
When examining these data by multiple regression, the final model for BB-153 included
sex, age, age-square (p<0.01), race (p<0.01) and an interaction term between age and sex
(p=0.02); for BDE-28, age (p=0.18) and age-squared (p=0.04); for BDE- 47, race
(p=0.06), age (p=0.01), and age-squared (p=0.01); for BDE-99, race (p=0.02), age
(p=0.01), and age-squared (p<0.01); for BDE-100, age (p<0.01), and age-squared
(p=0.045); and for BDE-153, sex (p<0.01), age (p<0.01), and age-squared (p=0.02).
We observed a curvilinear relationship between the log-transformed lipid-adjusted BDE-
47 concentration and age (Tables S2-S3, Figure S1). We found both a linear decrease and
positive quadratic trend with age (linear p=0.01, quadratic p=0.01), cf. Table S3. The
LSGM of BDE-47 had the highest level (27.9 ng/g lipid) in the 12-19 years old and
decreased through the 40-49 years age group (17.2 ng/g lipid) and then curved upwards
to reach 20.4 ng/g lipid in the ≥60 year olds. MA participants had the highest LSGM of
BDE-47 (24.5 ng/g lipid), which was significantly higher than for NHW (19.7 ng/g lipid,
p=0.01). MA and NHB had similar LSGMs for BDE-47 concentrations. Similarly, no
significant difference of LSGMs for BDE-47 concentrations was observed between males
and females.
12
For log–transformed lipid adjusted BDE-153, we also observed a similar curvilinear trend
with age—both a linear decrease (p<0.01) and a positive quadratic (p=0.02) trend (Tables
S2-S3). The LSGM of BDE-153 had the highest level in the 12-19 years old (8.0 ng/g
lipid). Female participants had significantly lower BDE-153 lipid adjusted concentrations
then males (p<0.01). No significant difference of the LSGMs for BDE-153
concentrations was observed between race/ethnicity groups.
For BDE-99, we also observed a curvilinear relationship with age (Tables S2-S3). The
LSGM of lipid-adjusted BDE-99 concentrations was the highest in the 12-19 years old
(6.8 ng/g lipid). We observed a linear decreasing trend (p<0.01) as well as a positive
quadratic trend with age (p=0.01). For BDE-99: NHB participants had the highest LSGM
(6.1 ng/g lipid), which was significantly higher than the LSGM for NHW (4.8 ng/g lipid,
p=0.02). The LSGM of NHW was significantly lower than the LSGM for MA (5.7 ng/g
lipid, p=0.046). There was no significant difference in the LSGMs for BDE-99 between
NHB and MA, nor between males and females.
Similarly, we observed the curvilinear relationship between age and the log-transformed
lipid adjusted BDE-100 concentration. The highest LSGM of BDE-100 was in the 12-19
years old with both a linear decreasing trend (p<0.01) and a quadratic trend (p=0.045).
There was no significant difference in the LSGMs of BDE-100 among race/ethnicity
groups or between the sexes.
13
Although there was a curvilinear relationship between age and the log-transformed lipid
adjusted BDE-28 concentration, only the positive quadratic curve was significant
(p=0.04). No significant difference for LSGM of BDE-28 was observed between
race/ethnicity groups or between sexes.
For the log-transformed concentration of BB-153, there was a relationship with age
(Tables S2-S3 and Figure S1) characterized by a positive linear trend (p<0.01) and a
small negative quadratic trend (p<0.01). We also observed that both males and females
had an increasing LSGM with age (p<0.01 for both male and female); however,
concentrations in males increased more sharply with age than in females (β=0.002,
p=0.02). The LSGM of BB-153 in males is significantly higher than in female regardless
of age (p<0.001). The LSGM of both NHB and NHW were higher than that of MA
(p=0.001 and p<0.001 for NHB and NHW, respectively). NHB and NHW had similar
LSGM concentrations of BB-153.
Relating to potential pathways of exposure, we note that all PBDE congeners with a
detection frequency over 60% were significantly correlated with each other (Table S4).
BB-153 was significantly correlated (p=0.04) only with BDE-47 (Table S4). BDE-153
was found at a higher concentration than BDE-47 in 10.5% of the participants. The
median ratio of BDE-153 to BDE-47 was 0.54 (quartile range 0.38-0.75).
BB-153 was found at 18% higher geometric mean concentration in participants living in
housing constructed between 1960-77 as compared to participants living in housing
14
constructed after 1978 (p=0.03), cf. Table 4. The geometric means of BDE-47 and BDE-
153 did not vary significantly with the age of the participant’s primary residence (Table
4). The geometric mean of BDE-153 was found to be 31% lower (p<0.01) in foreign born
subjects than in participants born in the United States, while for BDE-47 no significant
difference was observed between these groups (Table 4). The geometric mean for BB-
153 was 62% lower in foreign born participants as compared to participants born in the
U.S. (p<0.01).
In examining those with the highest serum concentrations (above the 95th percentile) of
BDE 47, age, but not sex and race/ethnicity, was significantly associated. Senior adults
(60 years and older) were two times more likely to be above the 95th percentile than
adults 20-59 years old (p=0.02) (odds ratio (OR) (95% CI): 2.0 (1.1, 3.6)); and 54% more
likely than adolescents to be above the 95th percentile (p=0.067) (OR (95%CI): 1.5 (1.0,
2.5). There was no difference in the likelihood of being above the 95th percentile between
the 12-19 and 20-59 year old age groups.
For BDE-153, sex and race, but not age, were significantly associated with being above
the 95th percentile univariately (p=0.018, 0.03 for sex and race, respectively). In the final
multiple logistics regression, sex (p=0.04) and race (p=0.03) were significant. We found
that males were 2.1 times more likely than females to be above the 95th percentile
(adjusted OR (95%CI): 2.1 (1.0, 4.3)). MA were 62% less likely than NHW to be above
the 95th percentile (p=0.03) (adjusted OR (95%CI): 0.38 (0.15, 0.91 There was no
significant difference between NHB and MA.
15
Discussion
These NHANES data from a representative civilian, non-institutionalized US population
assess the internal dose concentrations of PBDE congeners and of BB-153, the congener
of highest concentration in commercial PBBs. Among the PBDE congeners, BDE-47 was
detected in serum from almost all of the participants and at the highest concentrations.
Compared to median data from smaller non-representative European studies, the median
NHANES BDE-47 serum concentration of 19.2 ng/g lipids is 7.1-35 times higher (13-
15). Among the PBDE congeners, in general BDE-47 serum concentrations were the
highest, but 10.5% of persons had higher BDE-153 concentrations, which is present in
both the PentaBDE and OctaBDE formulations (6); these formulations have different
commercial applications. Because of the short serum half life of BDE-183, which is
found only in the OctaBDE formulation, BDE-153 concentrations or the ratio of
concentrations of BDE-153/BDE-47 could potentially reflect exposure to the OctaBDE
formulation, although, the variance in this ratio could potentially also be explained by
differences in pharmacokinetics. The presence of BDE-153 in the two formulations is
also indicated by the lower correlation coefficients between its concentrations and those
of the other prevalent PBDE congeners, which are found only in the PentaBDE
formulation (Table S4).
In multiple regression models, we observed both a significant linear decrease and a
positive quadratic trend with age for PBDE congeners detectable in more than 60% of the
participants (Tables S2-S3), in contrast to the traditional chlorinated persistent organic
16
pollutants which tend to increase as age increases (26). The higher concentrations in the
youngest age groups examined (Tables S2-S3) are probably due to their lifestyle and
activity differences, which lead to higher exposures, although potential differences in the
pharmacokinetics of these chemicals in their bodies must be considered. The slight
increase in the oldest participants could potentially be explained by bioaccumulation
and/or by a slower metabolism and elimination of PBDEs at an older age.
For public health decisions, scientists are especially interested in persons with
concentrations above the 95th percentile. For BDE-47 concentrations, participants aged
60 years and older were twice as likely to be above the 95th percentile as those aged 20-
59 years. With regards to race/ethnicity, the BDE-47 LSGM of MA was significantly
higher than for NHW; however, although this was not statistically significant, the
likelihood for being above the 95th percentile was greater for NHW than for MA. For
BDE-153, we did see differences with sex and race/ethnicity as males were twice as
likely as females to have a concentration greater than the 95th percentile. This difference
in concentrations between the sexes is consistent with the LSGM data for BDE-153.
Also, NHW were more likely than MA to have a BDE-153 concentration above the 95th
percentile, which was not indicated with the LSGM data from multiple regression
analyses. The finding that MA participants are less likely to have the higher serum
concentrations of BDE-153 as well as BB-153 is consistent with a higher proportion of
immigrants who likely experienced a lower level of exposure in their country of origin,
cf. Table 4.
17
In multiple regression models, the LSGMs of BB-153 increased linearly with age with a
relatively small significantly negative quadratic term and a sex interaction term. An
increasing concentration of BB-153 with age (Tables S2-S3) is consistent with other
traditional chlorinated persistent organic pollutants (POPs) (26) that were phased out in
the 1970s. This increasing trend is because older participants have been exposed to BB-
153 for a longer period of time than younger participants and that the older participants
also were exposed to these chemicals when the environmental levels were higher than
today. For BB-153, higher LSGM concentrations were found in males in all age and
race/ethnicity groups (Figure S1 and Tables S2-S3); this differs somewhat from data for
traditional POPs which were found in higher concentrations in older females compared to
older males (26). The observed sex difference may potentially be explained by depuration
during nursing.
In addition to lower BB-153 concentrations being found in MA, the geometric mean for
BB-153 was 62% lower in foreign born participants compared to participants born in the
United States (p<0.001), cf. Table 4. We also found a significantly higher geometric
mean BB-153 concentration in participants living in housing constructed between 1960
and 1977 (2.6 ng/g lipid; 95% CI 2.0-3.4) compared to participants living in housing
constructed after 1978 (2.2 ng/g lipid; 95% CI 1.8-2.7, p=0.03). This observed difference
in geometric mean concentration by the construction year of primary residence could be
explained by the fact that BB-153 was phased out in the U.S. in the mid-1970s and hence
would be less likely to be found in homes constructed after 1978. Also, BDE-153 was
found at a lower geometric mean concentration in foreign born participants (4.1 ng/g
18
lipid; 95% CI 3.3-5.0) than in participants born in the United States (6.0 ng/g lipid; 95%
CI 5.4-6.7, p=0.01). This difference is most likely explained by a higher exposure level to
BDE-153 in the United States than abroad.
The 95th percentile for the sum of PBDEs was 291 ng/g lipid (95% CI, 224-540). The
highest sum of PBDE levels observed in the NHANES 2003-2004 participants was 3,680
ng/g lipid, which included BDE-47 at 2,350 ng/g lipid and concentrations of BDE-99,
BDE-100 and BDE-153 at 692, 339 and 152 ng/g lipid, respectively. In this individual,
the level of 2,2’,4,4’,5,5’-hexachlorobiphenyl (CB-153) was only 13 ng/g lipid,
indicating low exposure to PCBs (1). The concentration of BDE-47 was 180 times higher
than that of CB-153. Children less than 12 years of age and some PBDE congeners, such
as BDE-209, were not included in NHANES 2003-04. Based on a NHANES 2001-2002
serum pool study the mean concentration of BDE-209 is about 2 ng/g lipids in those 12
years of age and older (unpublished data); therefore, BDE-209 is unlikely to contribute
significantly to the total PBDE concentration. We are currently analyzing similar serum
pools in children aged 3- 11 years.
Although there have been no human health effects directly attributed to exposure to
PBDEs and animal data are limited, public health concern has been expressed regarding
the potential exposure to these persistent environmental chemicals (9). A recent time
trend study of U.S. residents, although non-representative, showed increasing serum
PBDE concentrations from the mid-1980s to 2002 (27). In future studies, it will be of
interest to compare changes in concentrations over time, particularly in light of the
19
discontinuation of the PentaBDE and OctaBDE production in the U.S. It is also important
to conduct studies that will target children and workers in certain occupational settings
and to focus on life style factors that result in exposures that produce the higher serum
concentrations of PBDEs.
Acknowledgement
The authors would like to acknowledge the hard work of those who contributed to this
work but are not listed as coauthors: Jeff Vancura for his expertise in high resolution
mass spectrometry, Cheryl McClure for database handling, Troy Cash for logistical
support, and Sarah Niehüser for proof reading this manuscript.
Supporting Information Available
Additional information are given in Tables S1-S4 and Figure S1 and supporting
information (SI-1). This material is available free of charge via the Internet at
http://pubs.acs.org.
20
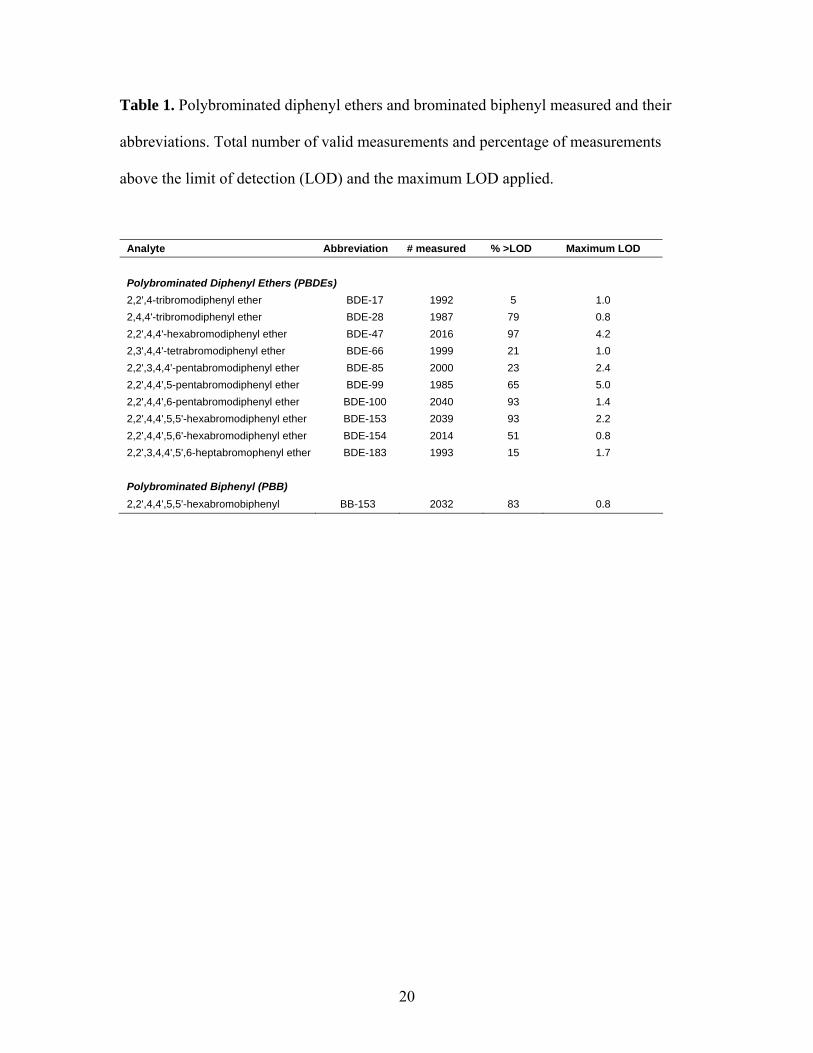
Table 1. Polybrominated diphenyl ethers and brominated biphenyl measured and their
abbreviations. Total number of valid measurements and percentage of measurements
above the limit of detection (LOD) and the maximum LOD applied.
Analyte Abbreviation # measured % >LOD Maximum LOD Polybrominated Diphenyl Ethers (PBDEs) 2,2',4-tribromodiphenyl ether BDE-17 1992 5 1.0 2,4,4'-tribromodiphenyl ether BDE-28 1987 79 0.8 2,2',4,4'-hexabromodiphenyl ether BDE-47 2016 97 4.2 2,3',4,4'-tetrabromodiphenyl ether BDE-66 1999 21 1.0 2,2',3,4,4'-pentabromodiphenyl ether BDE-85 2000 23 2.4 2,2',4,4',5-pentabromodiphenyl ether BDE-99 1985 65 5.0 2,2',4,4',6-pentabromodiphenyl ether BDE-100 2040 93 1.4 2,2',4,4',5,5'-hexabromodiphenyl ether BDE-153 2039 93 2.2 2,2',4,4',5,6'-hexabromodiphenyl ether BDE-154 2014 51 0.8 2,2',3,4,4',5',6-heptabromophenyl ether BDE-183 1993 15 1.7 Polybrominated Biphenyl (PBB) 2,2',4,4',5,5'-hexabromobiphenyl BB-153 2032 83 0.8
21
Demographic GeomeanGroup GM (95% CI) P10 (95% CI) P25 (95% CI) P50 (95% CI) P75 (95% CI) P90 (95% CI) P95 (95% CI)
All Participants 1.2(1.0-1.4) <LOD <LOD 1.1(0.9-1.2) 2.1(1.9-2.5) 4.8(3.3-6.7) 7.9(5.3-10.9)Age Groups12-19 Years 1.3(1.2-1.5) <LOD <LOD(<LOD-0.8) 1.2(1.0-1.3) 2.3(2.0-2.6) 3.9(2.8-4.9) 6.0(4.0-9.4)20-39 Years 1.1(1.0-1.3) <LOD <LOD 1.1(0.8-1.3) 1.9(1.5-2.3) 3.4(2.4-5.1) 6.1(3.7-9.3)40-59 Years 1.1(0.9-1.3) <LOD <LOD 1.0(0.8-1.3) 2.1(1.7-2.7) 4.7(2.8-8.3) 8.2(4.6-11.8)> 60 Years 1.4(1.1-1.7) <LOD <LOD 1.1(0.9-1.4) 3.2(2.1-4.8) 6.6(5.6-7.7) 9.6(7.2-18.1)Race/Ethnicity
MA 1.4(1.3-1.6) <LOD <LOD(<LOD-0.8) 1.4(1.2-1.5) 2.3(1.9-2.8) 4.7(3.7-5.5) 7.3(5.6-8.3)NHB 1.2(1.0-1.4) <LOD <LOD 1.0(0.8-1.2) 2.1(1.8-2.4) 5.2(3.5-6.7) 8.4(5.4-12.3)NHW 1.2(1.0-1.4) <LOD <LOD 1.1(0.8-1.3) 2.2(1.8-2.7) 4.8(3.0-8.0) 8.0(4.5-13.6)
SexFemales 1.2(1.0-1.4) <LOD <LOD 1.0(0.8-1.3) 2.1(1.7-2.5) 4.6(3.0-6.7) 7.7(4.7-11.8)Males 1.2(1.1-1.4) <LOD <LOD 1.0(0.9-1.2) 2.2(2.0-2.7) 5.1(3.5-7.3) 8.0(5.7-11.3)
All Participants 20.5(17.6-23.9) 5.0(4.3-6.1) 9.3(8.2-10.9) 19.2(15.7-22.3) 40.9(35.6-49.2) 84.9(66.8-127.0) 157.0(108.0-240.0)Age Groups12-19 Years 28.2(24.6-32.3) 7.8(5.2-10.6) 14.1(12.0-16.6) 27.2(22.1-33.6) 53.6(44.9-63.6) 104.0(82.4-145.0) 174.0(115.0-211.0)20-39 Years 21.5(18.3-25.4) 6.5(4.8-7.5) 10.3(9.2-12.0) 21.6(17.0-25.1) 38.3(34.8-44.2) 72.0(53.0-102.0) 114.0(73.9-216.0)40-59 Years 17.7(14.4-21.7) 4.6(<LOD-5.5) 7.7(6.3-10.0) 14.7(12.3-19.2) 35.8(27.1-50.8) 84.9(54.9-142.0) 142.0(94.3-240.0)> 60 Years 19.7(15.8-24.5) <LOD (<LOD-5.0) 7.7(6.1-9.1) 16.9(13.2-21.7) 48.9(31.2-70.7) 108.0(81.4-173.0) 235.0(171.0-283.0)Race/Ethnicity
MA 25.5(23.0-28.1) 8.0(7.2-9.1) 12.0(10.9-14.4) 23.4(21.2-25.5) 47.1(38.2-56.5) 85.8(72.0-105.0) 151.0(104.0-188.0)NHB 24.3(20.9-28.2) 6.0(4.8-7.4) 10.3(9.3-11.2) 21.3(18.2-25.4) 47.5(40.7-53.2) 116.0(81.8-149.0) 242.0(136.0-481.0)NHW 19.5(16.1-23.7) 4.7(<LOD-5.6) 8.6(7.5-10.1) 17.3(14.4-22.2) 40.2(33.1-51.9) 85.1(60.3-142.0) 157.0(90.2-283.0)
SexFemales 19.6(16.4-23.5) 4.8(<LOD-6.1) 9.2(8.0-10.7) 19.1(13.9-23.0) 38.3(31.5-44.7) 79.2(60.7-121.0) 155.0(102.0-235.0)Males 21.4(18.1-25.3) 5.1(<LOD-6.6) 9.5(7.8-11.3) 19.2(15.7-24.0) 45.2(37.3-54.9) 94.3(66.8-148.0) 168.0(112.0-382.0)
All Participants 5.0(4.4-5.6) <LOD <LOD <LOD 9.2(7.5-10.9) 21.7(17.0-29.1) 42.2(33.3-54.8)Age Groups12-19 Years 6.9(6.1-7.7) <LOD <LOD 5.6(<LOD-7.6) 12.8(11.4-15.7) 27.9(19.6-37.9) 45.2(35.9-56.8)20-39 Years 5.2(4.4-6.1) <LOD <LOD <LOD(<LOD-5.6) 8.3(7.1-10.6) 18.0(13.2-22.6) 28.8(20.4-52.7)40-59 Years * <LOD <LOD <LOD 8.7(5.5-10.9) 19.7(14.4-31.9) 41.2(25.1-80.7)> 60 Years * <LOD <LOD <LOD 9.4(6.5-12.8) 29.3(15.3-47.9) 52.3(33.5-74.0)Race/Ethnicity
MA 5.9(5.5-6.4) <LOD <LOD 5.4(<LOD-5.7) 10.6(9.3-12.6) 20.0(17.0-23.5) 30.8(24.5-41.7)NHB 6.2(5.4-7.1) <LOD <LOD 5.0(<LOD-5.7) 11.3(9.5-12.8) 30.2(21.5-42.2) 74.7(30.2-155.0)NHW * <LOD <LOD <LOD 8.8(6.8-11.3) 21.5(15.3-34.0) 43.6(30.7-71.4)
SexFemales * <LOD <LOD <LOD 8.6(6.6-10.6) 18.3(14.7-28.8) 41.2(22.9-60.3)Males 5.3(4.5-6.1) <LOD <LOD <LOD(<LOD-5.1) 10.0(8.4-11.5) 23.8(18.0-37.3) 44.0(33.8-57.3)
Abbreviations: MA, Mexican Americans; NHB, Non-Hispanic Black; NHW, Non-Hispanic White. * Estimate is below the highest limit of detection for individual samples.
Percentiles
2,4,4'-tribromodiphenyl ether (BDE-28)
2,2',4,4',5-pentabromodiphenyl ether (BDE-99)
2,2',4,4'-hexabromodiphenyl ether (BDE-47)
Table 2. Geometric mean (GM) concentrations (ng/g lipid), selected percentiles, and their 95% confidence
intervals (95% CI) for 2,4,4'-tribromodiphenyl ether (BDE-28), 2,2',4,4'-hexabromodiphenyl ether (BDE-47)
and 2,2',4,4',5-pentabromodiphenyl ether (BDE-99) for all participants in the NHANES 2003/04 stratified by
age, race/ethnicity and sex . The limits of detection are given in Table 1. All data adjusted for design
sampling weights.
22
Table 3. Geometric mean (GM) concentrations (ng/g lipid), selected percentiles, and their 95% confidence
intervals (95% CI) for 2,2',4,4',6-pentabromodiphenyl ether (BDE-100), 2,2',4,4',5,5'-hexabromodiphenyl
ether (BDE-153) and 2,2',4,4',5,5'-hexabromobiphenyl (BB-153) for all participants in the NHANES
2003/04 stratified by age, race/ethnicity and sex . The limits of detection are given in Table 1. All data
adjusted for design sampling weights.
Demographic GeomeanGroup GM (95% CI) P10 (95% CI) P25 (95% CI) P50 (95% CI) P75 (95% CI) P90 (95% CI) P95 (95% CI)
All Participants 3.9(3.4-4.5) <LOD 1.6(1.5-2.0) 3.6(3.1-4.1) 7.8(6.8-9.0) 18.3(15.4-22.0) 36.5(24.6-54.0)Age Groups12-19 Years 5.2(4.5-6.0) <LOD (<LOD-1.8) 2.6(2.2-3.1) 4.8(3.8-6.1) 9.4(7.9-12.8) 19.3(14.4-26.2) 34.3(25.0-45.0)20-39 Years 4.4(3.7-5.2) <LOD 2.1(1.7-2.6) 4.1(3.3-5.0) 8.0(6.6-10.0) 17.1(13.2-21.1) 23.6(19.7-47.1)40-59 Years 3.3(2.8-4.1) <LOD <LOD (<LOD-1.6) 2.8(2.1-3.4) 6.2(5.3-7.5) 16.3(10.5-29.2) 40.5(19.5-91.6)> 60 Years 3.6(3.0-4.4) <LOD <LOD (<LOD-1.7) 2.9(2.5-3.4) 8.1(6.9-11.1) 21.5(15.4-46.0) 56.6(26.0-74.8)Race/Ethnicity
MA 4.6(4.0-5.2) <LOD (<LOD-1.6) 2.4(2.2-2.6) 4.2(3.8-5.2) 8.1(6.5-9.0) 14.5(11.4-20.3) 26.2(20.3-36.2)NHB 4.7(4.0-5.6) <LOD 2.0(1.6-2.2) 4.2(3.3-5.2) 9.4(7.6-10.9) 23.7(16.6-34.3) 39.2(26.0-79.2)NHW 3.8(3.2-4.5) <LOD 1.5(<LOD-1.8) 3.3(2.8-4.1) 7.6(6.0-9.5) 18.5(14.5-23.3) 38.8(22.6-59.2)
SexFemales 3.7(3.2-4.4) <LOD 1.6(<LOD-1.8) 3.2(2.8-4.1) 7.0(6.0-8.0) 18.4(14.4-23.1) 32.8(23.3-46.0)Males 4.2(3.6-4.9) <LOD 1.6(1.5-1.9) 3.8(3.1-4.4) 8.4(7.5-9.9) 17.9(14.9-25.1) 44.1(21.9-61.5)
All Participants 5.7(5.1-6.3) <LOD 2.4(<LOD-2.6) 4.8(4.1-5.3) 11.3(9.8-12.7) 32.6(27.9-40.3) 65.7(54.9-88.4)Age Groups12-19 Years 8.1(6.7-9.7) 2.2(<LOD-2.7) 3.6(3.0-5.2) 7.4(6.0-9.5) 15.3(11.7-19.4) 30.8(22.9-44.2) 52.9(35.9-68.5)20-39 Years 6.6(5.6-7.9) <LOD 2.8(2.3-3.3) 5.4(4.7-6.3) 13.7(10.9-18.0) 34.6(22.5-59.6) 63.5(50.4-88.4)40-59 Years 4.6(3.9-5.4) <LOD <LOD(<LOD-2.2) 3.6(3.1-4.4) 7.3(5.8-10.0) 28.5(16.1-42.7) 62.8(31.6-115.0)> 60 Years 5.1(4.3-6.1) <LOD <LOD(<LOD-2.3) 3.9(3.3-5.1) 10.6(8.4-13.6) 45.3(20.9-58.9) 91.5(58.9-134.0)Race/Ethnicity
MA 5.1(4.3-6.1) <LOD 2.7(<LOD-3.1) 4.7(4.2-5.4) 8.6(6.5-11.0) 17.2(13.0-25.2) 34.0(18.3-55.1)NHB 6.1(5.4-6.8) <LOD 2.4(2.2-2.8) 5.5(4.7-6.1) 12.9(9.8-16.5) 30.0(21.0-42.7) 53.0(36.8-63.3)NHW 5.9(5.0-6.8) <LOD 2.4(<LOD-2.7) 4.9(3.9-5.5) 11.9(9.8-14.7) 39.0(28.5-54.9) 75.9(58.0-93.2)
SexFemales 4.8(4.2-5.4) <LOD <LOD( <LOD-2.4) 4.0(3.4-5.0) 9.7(7.4-11.7) 25.9(20.2-31.6) 54.5(34.6-62.9)Males 6.9(6.0-7.8) <LOD 2.9(2.4-3.2) 5.5(4.7-6.5) 12.6(11.2-16.1) 47.2(31.0-62.9) 88.4(63.4-115.0)
All Participants 2.3(1.8-2.9) <LOD 0.9(<LOD-1.3) 2.1(1.9-2.4) 4.4(3.4-6.3) 12.8(6.6-25.5) 26.1(11.7-60.5)Age Groups12-19 Years 0.7(0.6-0.8) <LOD <LOD <LOD 1.0(0.8-1.4) 2.7(2.0-3.0) 3.7(2.9-4.7)20-39 Years 1.6(1.3-2.1) <LOD <LOD(<LOD-0.9) 1.6(1.2-1.8) 3.0(2.3-3.9) 6.6(3.9-12.2) 12.2(7.0-36.7)40-59 Years 3.4(2.6-4.4) 0.8(<LOD-1.5) 1.8(1.6-2.1) 2.9(2.4-3.2) 5.9(3.7-11.9) 15.9(7.9-38.9) 36.9(13.7-70.3)> 60 Years 4.5(3.2-6.2) 1.4(1.2-1.6) 2.0(1.8-2.5) 3.4(2.8-4.5) 8.1(4.7-15.8) 25.0(8.8-69.8) 52.8(19.2-114.0)Race/Ethnicity
MA 1.1(0.9-1.3) <LOD <LOD 1.1(<LOD-1.3) 2.5(2.0-2.9) 6.0(3.5-8.6) 10.0(6.5-15.2)NHB 2.4(1.6-3.4) <LOD 0.8(<LOD-1.4) 2.1(1.6-2.8) 4.8(3.0-12.1) 13.9(7.0-38.2) 29.7(12.1-70.2)NHW 2.7(2.1-3.4) <LOD 1.2(0.9-1.6) 2.4(2.2-2.8) 4.9(3.4-7.3) 13.5(6.6-35.4) 34.1(11.6-70.3)
SexFemales 1.9(1.5-2.5) <LOD <LOD(<LOD-1.1) 2.0(1.6-2.2) 3.6(2.8-4.9) 9.7(4.6-27.5) 23.9(7.4-56.6)Males 2.8(2.2-3.5) <LOD 1.1(0.8-1.6) 2.6(2.2-3.1) 5.3(3.8-8.4) 15.8(9.3-27.2) 34.9(13.5-70.3)
2,2',4,4',5,5'-hexabromodiphenyl ether (BDE-153)
Abbreviations: MA, Mexican Americans; NHB, Non-Hispanic Black; NHW, Non-Hispanic White.
Percentiles
2,2',4,4',6-pentabromodiphenyl ether (BDE-100)
2,2',4,4',5,5'-hexabromobiphenyl (BB-153)
23
Table 4. Geometric mean (GM) concentrations (ng/g lipid) of 2,2’,4,4’,5,5’-hexabromobiphenyl (BB-153),
2,2’,4,4’-tetrabromodiphenyl ether (BDE-47) and 2,2’,4,4’,5,5’-hexaBDE (BDE-153) in participants
having a primary residence constructed before 1959, between 1960 and 1977 and after 1978, and in foreign
born participants and participants born in the United States, adjusted for design sampling weights. All data
adjusted for design sampling weights. p-Values for all pair wise comparisons are given.
Strata GroupComparison BB-153 BDE-47 BDE-153
GM (95% CI) N GM (95% CI) N GM (95% CI) N p-value p-value p-value
<1959 2.7(1.9-3.9) 574 19.8(16.6-23.6) 564 5.7(4.8-6.8) 575 >1978 vs. 1960-77 0.03 0.45 0.14 1960-77 2.6(2.0-3.4) 430 19.3(14.8-25.3) 428 5.0(3.9-6.4) 430 >1978 vs. <1959 0.10 0.78 0.49 >1978 2.2(1.8-2.7) 534 20.4(17.1-24.4) 536 6.2(5.1-7.5) 536 1960-77 vs. <1959 0.56 0.86 0.36
USA 2.6(2.0-3.3) 1658 20.7(17.4-24.6) 1647 6.0(5.4-6.7) 1664 USA vs. Other <0.01 0.46 <0.01Other 1.0(0.84-1.3) 373 19.4(17.1-22.0) 368 4.1(3.3-5.0) 374
BDE-47Serum Level (ng/g lipid)
BDE-153
Country of Origin
Pair wise Comparisons
Construction Year of Primary Residence
BB-153
24
BDE-47
10
20
30
40
ng/g
lipi
d
BDE-153
4
8
12
All S
ubje
cts
12-1
9 Ye
ars
20-3
9 Ye
ars
40-5
9 Ye
ars
60+
Year
s
MA
NH
B
NH
W
Fem
ales
Mal
es
ng/g
lipi
d
BDE-99
4
8
12
BB-153
4
8
12
All
Subj
ects
12-1
9 Ye
ars
20-3
9 Ye
ars
40-5
9 Ye
ars
60+
Year
s
MA
NH
B
NH
W
Fem
ales
Mal
esAge Stratified Race / Ethnicity Gender Age Stratified Race / Ethnicity Gender
* * * *
Figure 1. Geometric mean concentrations (ng/g lipid) and 95% confidence intervals adjusted for design
sampling weights. Data stratified by age, race/ ethnicity (MA, Mexican-Americans; NHB, Non-Hispanic
Black; and NHW, Non-Hispanic White) and sex. Congener abbreviations are given in Table 1. * Estimate
is below the highest limit of detection for individual samples.
25
Literature Cited
1. NCEH Third national report on human exposure to environmental chemicals,
National Center for Environmental Health (NCEH), Centers for Disease Control
and Prevention (CDC): Atlanta, Georgia, USA. 2005.
2. WHO Environmental Health Criteria 192. Flame retardants: A general
introduction, International Program on Chemical Safety, WHO: Geneva,
Switzerland. 1997.
3. Fries, G. F. The PBB episode in Michigan. an overall appraisal. Crit Rev Toxicol
1985, 16, 105-156.
4. WHO Environmental Health Criteria 162. Brominated diphenyl ethers,
International Program on Chemical Safety, WHO: Geneva, Switzerland. 1994.
5. Sjödin, A.; Bergman, Å.; Jakobsson, E.; Kierkegaard, A.; Marsh, G.; Sellström,
U. Identification and quantification of polybrominated diphenyl ethers (PBDEs) in
the commercial product Bromkal 70-5 DE. Organohalogen Comp 1997, 32, 388-
393.
6. Alaee, M.; Arias, P.; Sjödin, A.; Bergman, Å. An overview of commercially used
brominated flame retardants, their application, their use patterns in different
countries/regions and possible modes of release. Environ Int 2003, 29, 683-689.
7. Thuresson, K.; Höglund, P.; Hagmar, L.; Sjödin, A.; Bergman, Å.; Jakobsson, K.
Apparent half-lives of hepta- to decabrominated diphenyl ethers in human serum as
determined in occupationally exposed workers. Environ Health Perspect 2006, 114,
176-181.
26
8. Jakobsson, K.; Thuresson, K.; Höglund, P.; Sjödin, A.; Hagmar, L.; Bergman, Å.
A summary of exposures to polybrominated diphenyl ethers (PBDEs) in Swedish
workers, and determination of half-lives of PBDEs. Organohalogen Comp 2003,
61, 17-20.
9. Birnbaum, L.; Staskal, D. F. Brominated flame retardants: Cause for concern?
Environ Health Perspect 2004, 112, 9-17.
10. Stapleton, H. M. In What's in your home? Determination of PBDEs in carpet
samples and mattress pads; The Seventh Annual Workshop on Brominated Flame
Retardants in the Environment; National Institute of Standards and Technology:
Gaithersburg, Maryland, 2005; p 67.
11. Sjödin, A.; Päpke, O.; Focant, J.-F.; Jones, R. S.; Pless-Mulloli, T.; Leontjew
Toms, L.-M.; Herrmann, T.; Mueller, J.; Needham, L. L.; Patterson Jr, D. G.
Concentration of polybrominated diphenyl ethers (PBDEs) in household dust from
various countries - Is dust a major source of human exposure? Organohalogen
Comp 2006, 68, 2181-2185.
12. Schecter, A.; Pavuk, M.; Päpke, O.; Ryan, J. J.; Birnbaum, L.; Rosen, R.
Polybrominated diphenyl ethers (PBDEs) in U.S. mothers' Milk. Environ Health
Perspect 2003, 111, 1723-1729.
13. Meironyté Guvenius, D.; Aronsson, A.; Ekman-Ordeberg, G.; Bergman, A.;
Norén, K. Human prenatal and postnatal exposure to polybrominated diphenyl
ethers, polychlorinated biphenyls, polychlorobiphenylols, and pentachlorophenol.
Environ Health Perspect 2003, 111, 1235-1241.
27
14. Kalantzi, O. L.; Martin, F. L.; Thomas, G. O.; Alcock, R. E.; Tang, H. R.; Drury,
S. C.; Carmichael, P. L.; Nicholson, J. K.; Jones, K. C. Diferent levels of
polybrominated diphenyl ethers (PBDEs) and chlorinated compounds in breast milk
from two U.K. regions. Environ Health Perspect 2004, 112, 1085-1091.
15. Vieth, B.; Herrmann, T.; Mielke, H.; Ostermann, B.; Päpke, O.; Rüdiger, T.
PBDE levels in human milk: the situation in Germany and potential influencing
factors - a controlled study. Organohalogen Comp 2004, 66, 2643-2648.
16. Harden, F. A.; Toms, L.-M.; Moore, M.; Symons, R.; Ahokas, J.; Burniston, D.
A.; Furst, P.; Mueller, J. Polybrominated diphenyl ethers in human milk from
Australia. Organohalogen Comp 2005, 67, 662-666.
17. Moreland, K. B.; Landrigan, P. J.; Sjödin, A.; Gobeille, A. K.; Jones, R. S.;
McGahee, E.; Needham, L. L.; Patterson Jr, D. G. Body burdens of polybrominated
diphenyl ethers among urban anglers. Environ Health Perspect 2005, 113, 1689-
1692.
18. Sjödin, A.; Päpke, O.; McGahee, E. E. I.; Jones, R. S.; Focant, J.-F.; Pless-
Mulloli, T.; Toms, L.-M.; Wang, R.; Zhang, Y.; Needham, L. L.; Herrmann, T.;
Patterson Jr, D. G. Concentration of polybrominated diphenyl ethers (PBDEs) in
house hold dust from various countries - inhalation a potential route of human
exposure. Organohalogen Comp 2004, 66, 3817-3822.
19. Stapleton, H. M.; Dodder, N. G.; Offenberg, J. H.; Schantz, M. M.; Wise, S.
Polybrominated diphenyl ethers in house dust and clothes dryer lint. Environ Sci
Technol 2005, 39, 925-931.
28
20. Wu, N.; Herrmann, T.; Paepke, O.; Tickner, J.; Hale, R.; Harvey, E.; La Guardia,
M.; McClean, M. D.; Webster, T. F. Human exposure to PBDEs: Associations of
PBDE body burdens with food consumption and house dust concentrations. Environ
Sci Technol 2007, 41, 1584-1589.
21. Norstrom, R. J.; Simon, M.; Moisey, J.; Wakeford, B.; Weseloh, D. V. C.
Geographical distribution (2000) and temporal trends (1981 - 2000) of brominated
diphenyl ethers in Great Lakes herring gull eggs. Environ Sci Technol 2002, 36,
4783-4789.
22. Eriksson, P.; Jakobsson, E.; Fredriksson, A. Brominated flame retardants: a novel
class of developmental neurotoxicants in our environment? Environ Health
Perspect 2001, 109, 903-908.
23. McDonald, T. A. A perspective on the potential health risk of PBDEs.
Chemosphere 2002, 46, 745-755.
24. Sjödin, A.; Jones, R. S.; Lapeza, C. R.; Focant, J.-F.; McGahee, E. I.; Patterson Jr,
D. G. Semi-Automated High-Throughput Extraction and Cleanup Method for the
Measurement of Polybrominated Diphenyl Ethers, Polybrominated Biphenyls and
Polychlorinated Biphenyls In Human Serum. Anal Chem 2004, 76, 1921-1927.
25. Bradley, R. A.; Srivastava, S. S. Correlation in Polynomial Regression. The
American Statistician 1979, 33, 11-14.
26. Needham, L.; Patterson Jr, D. G.; Calafat, A. M.; Sjödin, A.; Turner, W.;
Kuklenyik, Z. Distribution of halogenated environmental chemicals among people
of different ages, races, and sexes in the United States. Organohalogen Comp 2006,
68, 484-487.
29
27. Sjödin, A.; Jones, R. S.; Focant, J.-F.; Lapeza, C. R.; Wang, R. Y.; McGahee, E.
E. I.; Zhang Y; Turner, W. E.; Slazyk, B.; Needham, L. L.; Patterson Jr, D. G.
Retrospective Time-Trend Study of Polybrominated Diphenyl Ether and
Polybrominated and Polychlorinated Biphenyl Levels in Human Serum from the
United States. Environ Health Perspect 2004, 112, 655-658.