Embed Size (px)
Citation preview
EMODnet Thematic Lot n° 4 - Chemistry
Mediterranean Sea
Quality Checks and first DIVA Products of
Nutrients Data in the water column
Sissy Iona, HCMR/HNODC
Date: 21/08/2014
EMODnet Thematic Lot n° 4 - Chemistry Mediterranean Area QC & Nutrients Products Report
Contents 1 Abstract ............................................................................................................................................... 3
2 Introduction ........................................................................................................................................ 3
2.1 Regional Data Set description and import in ODV ....................................................................... 3
3 Methodology ....................................................................................................................................... 5
3.1 Assumptions ................................................................................................................................. 5
3.2 Data Aggregation and Validation ................................................................................................. 6
4 ODV Data Processing........................................................................................................................... 6
4.1 Selection and filter criteria ........................................................................................................... 6
4.2 Units Conversions ......................................................................................................................... 7
5 Aggregation and Regional QC/QA ....................................................................................................... 8
5.1 New collections ............................................................................................................................ 8
5.2 QC/QA ........................................................................................................................................... 8
5.3 Export ........................................................................................................................................... 9
6 Results ................................................................................................................................................. 9
7 DIVA maps in the water column ....................................................................................................... 14
8 Next steps.......................................................................................................................................... 16
9 Annexes ............................................................................................................................................. 17
2
EMODnet Thematic Lot n° 4 - Chemistry Mediterranean Area QC & Nutrients Products Report
1 Abstract
This document is part of the WP2 activities and describes the regional quality control checks, aggregation and validation processing that were applied by HCMR/HNODC to the first harvested by robot (MARIS) data set for the Mediterranean Sea during the first cycle of data collection and products generation of EMODnet Chemistry project. The first year harvesting focused on nutrients and six regional data sets were prepared: Ammonium, Silicate, Phosphate, Nitrate and Nitrite, Nitrate, and Nitrite in the water column. The ODV (AWI) tool was used for the data processing and the QA/QC. Detected errors and potential outliers were sent back to the data providers to check and revise their data sets were needed for the second harvesting. The second step of the WP2 work is the production of the data products for the Mediterranean MSFD regions with the use of the DIVA (ULG) tool. The first regional data products and identification of trends are presented in this report.
2 Introduction
2.1 Regional Data Set description and import in ODV On 24 April 2014, HCMR/HNODC -the Regional Coordinator for the Mediterranean Sea products preparation, received the 1st harvested by robot/MARIS nutrient data for the Mediterranean Sea which included a SDN zip file with 29805 SDN Spreadsheet data files called "initial data" hereafter and a CSV file with the associated CDI metadata. The data files were organized in folders and subfolders, according to the CDI Global identifier.
The data were read by ODV and some format errors (see Annex I) and a few empty data files (see Annex II) were identified. The format errors at the semantic headers of the ODV data files were corrected by HCMR/HNODC in order not to lose these data. The two empty files were not included in this first regional data pool. Relevant notifications were sent to data providers in order to correct them.
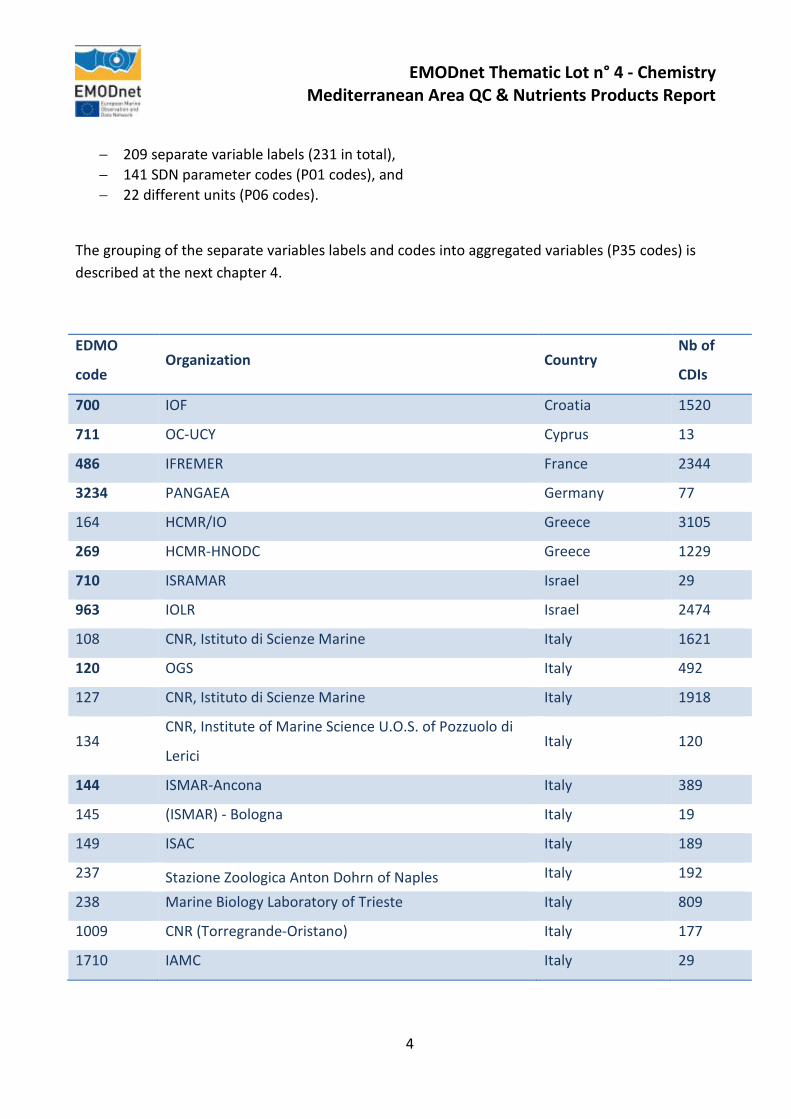
Three different data types were encountered during the "initial data" entry in ODV: vertical profiles (with Pressure or Depth as primary variable), time series and sediment data, originated from 25 NODCs and Marine Centres, and distributed by 14 Organizations (EDMO Code in bold fonts), from 12 countries as it can be seen at Table 1 below.
During data import in ODV, six ODV collections (called "initial ODV collections" hereafter) were created which included:
3
EMODnet Thematic Lot n° 4 - Chemistry Mediterranean Area QC & Nutrients Products Report
− 209 separate variable labels (231 in total), − 141 SDN parameter codes (P01 codes), and − 22 different units (P06 codes).
The grouping of the separate variables labels and codes into aggregated variables (P35 codes) is described at the next chapter 4.
EDMO
code Organization Country
Nb of
CDIs
700 IOF Croatia 1520
711 OC-UCY Cyprus 13
486 IFREMER France 2344
3234 PANGAEA Germany 77
164 HCMR/IO Greece 3105
269 HCMR-HNODC Greece 1229
710 ISRAMAR Israel 29
963 IOLR Israel 2474
108 CNR, Istituto di Scienze Marine Italy 1621
120 OGS Italy 492
127 CNR, Istituto di Scienze Marine Italy 1918
134 CNR, Institute of Marine Science U.O.S. of Pozzuolo di
Lerici Italy 120
144 ISMAR-Ancona Italy 389
145 (ISMAR) - Bologna Italy 19
149 ISAC Italy 189
237 Stazione Zoologica Anton Dohrn of Naples Italy 192
238 Marine Biology Laboratory of Trieste Italy 809
1009 CNR (Torregrande-Oristano) Italy 177
1710 IAMC Italy 29
4
EMODnet Thematic Lot n° 4 - Chemistry Mediterranean Area QC & Nutrients Products Report
2431 OGS- Department of Biological Oceanography Italy 2637
708 UMT.IOI.PO Malta 128
681 RIHMI-WDC Russian
Federation 1027
1229 NIB Slovenia 3150
353 IEO Spain 4034
696 IMS Turkey 2081
Table 1: Distribution of the "initial data" per EDMO Code, Organization and Country
3 Methodology
3.1 Assumptions The overall work was based in four assumptions:
No duplicates exist in the harvested data set: within SeadataNet-MyOcean projects collaboration, a duplicates check was done in the central CDI system. This check covered T&S profiles only but as the majority of nutrients data include T&S data, no further duplication detection checks were performed in this first cycle. However, such checks are planned within the second year activities.
Only "good" originators data were kept: only data values flagged with QF=0, 1, 2, 6 (SeadataNet flag scale) were kept from the initial data. Although the zero flag value means that no QA/QC has been done by the data originator, these values were kept and subjected to regional QC/QA because they represented a significant part (7.6%) of the whole data set and improve thus the data distribution both in horizontal and vertical scale.
The preferred products units is [µmol/l]: the EMODnet Chemistry vocabulary discussion group concluded that the molar units per volume units are the most appropriate and the preferable unit for nutrients variables in the water column will be [µmol/l].
Only the first priority nutrients in the water column were examined: the first round of the Robot harvester has extracted only nutrients in the water column and the work in this document is focused on: Ammonium, Silicates, Phosphate, Nitrate and Nitrite, Nitrate, and Nitrite.
Units Conversion: Ammonium, Phosphate, Nitrite, and Nitrate values in [µg/l] converted to [µmol/l] by division with the atomic weight of the element (P, N). For Silicates, the molecular weight of the
5
EMODnet Thematic Lot n° 4 - Chemistry Mediterranean Area QC & Nutrients Products Report
compound (SiO4) instead of the atomic weight of the element (Si) was used. This decision was taken after comparisons of neighborhood stations.
3.2 Data Aggregation and Validation The procedure followed is summarized as follows:
1. Format errors that detected at the "initial data" were corrected. 2. The “initial data” entry in ODV resulted in six "initial ODV collections" with primary variables:
depth [m], pressure [db], time [years since 0000-01-01], and depth below seabed [m]. 3. Each separate labeled variable of the "initial ODV collections" was mapped with the first
priority nutrients products in the water column and the “good” data exported and saved at separate ODV spreadsheets (called “good initial data” hereafter).
4. The “good initial data” were aggregated, validated and analyzed with DIVA tool for the first year nutrient products preparation.
5. Reports with detected and possible outliers were sent to data originators for confirmation, corrections or updates.
4 ODV Data Processing
4.1 Selection and filter criteria
Mapping of nutrients parameters with P35 The first and second columns of Tables 2-7 of Annex III, list the nutrients parameters and P01 codes which were identified and mapped as Ammonium (NH4), Silicates (SiO4), Phosphate (PO4), Nitrate and Nitrite (NOx), Nitrate (NO3) and Nitrite (NO2) data in the "initial ODV collections" (<user>/ODV/data/sdn/Recent Files/import.log)
Stations selection Each parameter of Tables 2-7 of Annex III was plotted in screen maps (View>Station Selection Criteria>Availability) and their vertical distributions were visualized (View>Layout Templates> SCATTER Windows).
Data filter Then, from each "initial ODV collections", the nutrient parameters of Tables 2-7 of Annex III and their primary variable were selected and exported as ODV spreadsheets (Export>Station data). During export, data quality filters were applied (Sample Selection Criteria>Quality>Acceptable Quality Flags=0, 1, 2, 6).
6
EMODnet Thematic Lot n° 4 - Chemistry Mediterranean Area QC & Nutrients Products Report
After this export, data values with flags other than 0, 1, 2 and 6 remained in the data sets if the primary variable is flagged as good. Therefore, the above spreadsheets were imported again in ODV and during the second export the same data quality filters were applied again to all variables (Sample Selection Criteria>Quality>Acceptable Quality Flags=0, 1, 2, 6). The new saved ODV spreadsheets will be called "good initial data" hereafter.
Note: For the derived variables (see § 4.2), only data with QF=1 were selected.
The third columns of Tables 2-7 of Annex III show the composition of all nutrient parameters (number of stations and the total measurements with all originators data QC flags in the "initial ODV collections").
Data availability in stations The fourth column show the “good initial” data that will be used for the preparation of the aggregated regional data. Stations empty of data are not counted (Station Selection Criteria>Availability> select the nutrient parameter).
The corresponding geographical distributions and vertical plots are shown in Figures 1-6 of Annex IV. As it can be seen from subplots 5 and 6 of Figure (1) or subplots 5 and 6 of Figure (2), etc of Annex IV, errors and potential outliers remain in the collections although only data of good quality were chosen. Therefore additional QC/QA checks are required.
4.2 Units Conversions Tables 8-13 of Annex V summarize the conversions that were applied for every separate variable.
The units conversions from [µg/l] to [µmol/l] were done manually using the ODV “Expression” derived variables:
− View>Derived Variables>Expressions, Derivatives, Integrals>Expression: − Label: Ammonium, Units: µmol/l, Digits: 4
for NH4, NOx,NO3 and NO2 Expression in Postfix Notation: #1 14.00670 / for SiO4 Expression in Postfix Notation: #1 92.0831 / for PO4Expression in Postfix Notation: #1 30.97376 /
The units conversions from [µmol/kg] to [µmol/l] is done by ODV during the manual aggregation (see §5) through the import options dialogue (Import options>Variables Association>Convert> select suitable conversion>Any [.../kg]>>Any [.../l]).
7
EMODnet Thematic Lot n° 4 - Chemistry Mediterranean Area QC & Nutrients Products Report
5 Aggregation and Regional QC/QA
5.1 New collections New ODV collections for the aggregated variables were created using a pre-defined spreadsheet as template with Depth [m] as primary variable. The LOCAL_CDI_ID and EDMO_code meta-variables will be used for contacts with the data originators.
The Data Variables properties are:
− Collection>Properties>Data Variables> Depth [m]>Edit> Decimal Places: 2, QF Scheme: SEADATANET
− Collection>Properties>Data Variables> Preferred P35 Label [µmol/l]>Edit> Decimal Places: 4, QF Scheme: SEADATANET
The "good initial data" (of § 4.1) were then imported as QDV spreadsheets and the appropriate units conversions and variables association were implemented.
5.2 QC/QA The detected errors and possible outliers were not deleted but flagged as 3 or 4 and excluded from the next step of DIVA analysis. The following QC checks were applied:
1. Broad range control checks (Tools>Find Outliers): − High values compared with the existing climatological ranges were detected
(http://www.ifremer.fr/sismer/program/medar/htql/region_param_medar.htql?CODE=AMON) but kept because they are located in coastal areas, lagoons, or estuaries.
− High values and equal to defaults like 999.99 or 999 were flagged from 0 or 1 to bad (4). − Values equal to or close to defaults like 9.9 or 99.99 but very far from the successive layers
were flagged from 0 or 1 to questionable (3) because they were considered as rounded values.
− Negatives were flagged from 0 or 1 to bad (4) − Zero values have been flagged from 0 or 1 to bad (4) and excluded from the first products
versions. Partners have been asked to provide the lower detection limits so as this information is not lost from DIVA analysis.
2. No checks for duplicates vertical levels (as DIVA average these doubles entries) 3. No Spikes detection was applied
8
EMODnet Thematic Lot n° 4 - Chemistry Mediterranean Area QC & Nutrients Products Report
All the flags modifications are listed in Annex VI to XII for Depth, NH4, SIO4, PO4, NOx, NO3 and NO2, and were sent to data originators for confirmation.
5.3 Export Finally, the checked and cleaned aggregated data were exported (Sample Selection Criteria>Quality>Acceptable Quality Flags=0, 1, 2, 6) and saved as spreadsheets for further usage with DIVA tool called “final data” hereafter.
6 Results
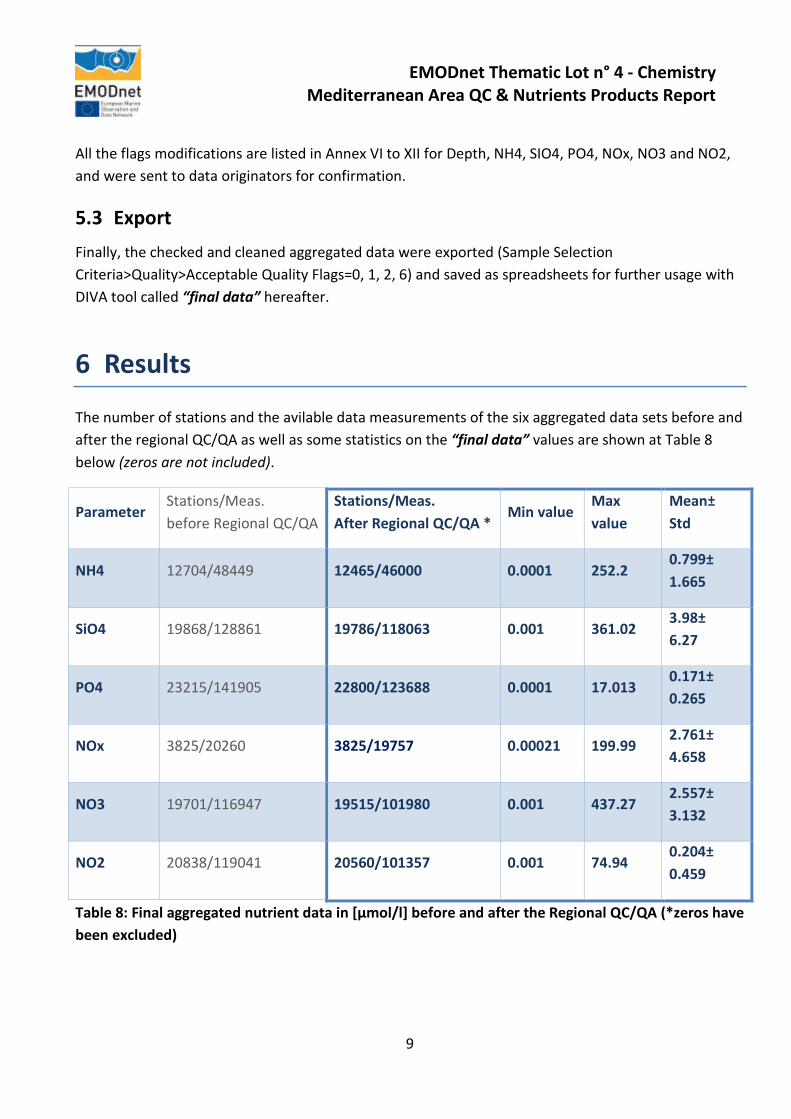
The number of stations and the avilable data measurements of the six aggregated data sets before and after the regional QC/QA as well as some statistics on the “final data” values are shown at Table 8 below (zeros are not included).
Parameter Stations/Meas. before Regional QC/QA
Stations/Meas. After Regional QC/QA *
Min value Max value
Mean± Std
NH4 12704/48449 12465/46000 0.0001 252.2 0.799± 1.665
SiO4 19868/128861 19786/118063 0.001 361.02 3.98± 6.27
PO4 23215/141905 22800/123688 0.0001 17.013 0.171± 0.265
NOx 3825/20260 3825/19757 0.00021 199.99 2.761± 4.658
NO3 19701/116947 19515/101980 0.001 437.27 2.557± 3.132
NO2 20838/119041 20560/101357 0.001 74.94 0.204± 0.459
Table 8: Final aggregated nutrient data in [µmol/l] before and after the Regional QC/QA (*zeros have been excluded)
9
EMODnet Thematic Lot n° 4 - Chemistry Mediterranean Area QC & Nutrients Products Report
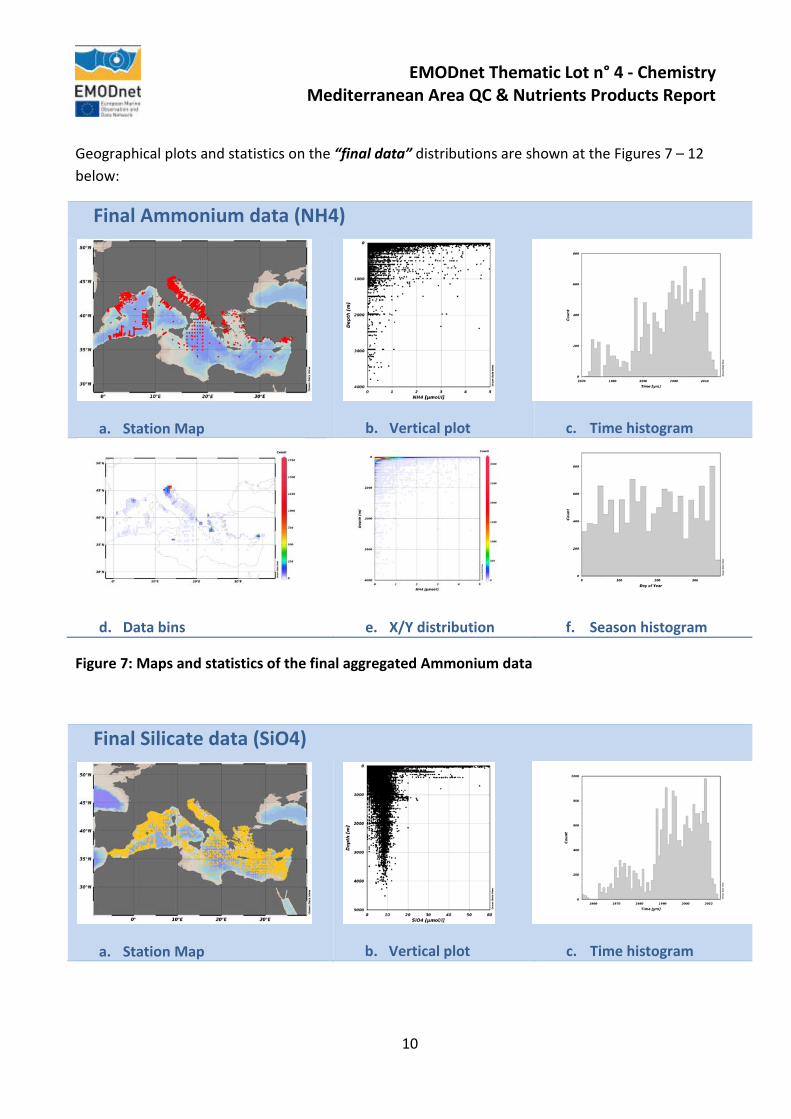
Geographical plots and statistics on the “final data” distributions are shown at the Figures 7 – 12 below:
Final Ammonium data (NH4)
a. Station Map
b. Vertical plot
c. Time histogram
d. Data bins
e. X/Y distribution
f. Season histogram
Figure 7: Maps and statistics of the final aggregated Ammonium data
Final Silicate data (SiO4)
a. Station Map
b. Vertical plot
c. Time histogram
10
EMODnet Thematic Lot n° 4 - Chemistry Mediterranean Area QC & Nutrients Products Report
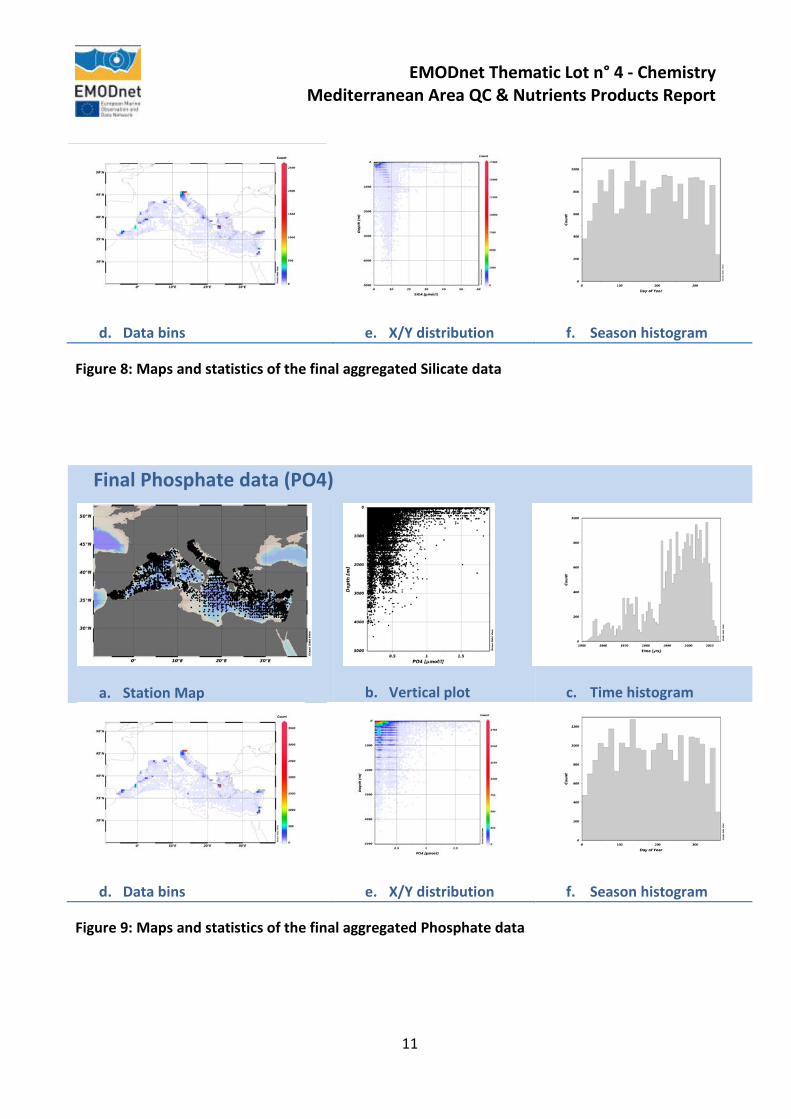
d. Data bins
e. X/Y distribution
f. Season histogram
Figure 8: Maps and statistics of the final aggregated Silicate data
Final Phosphate data (PO4)
a. Station Map
b. Vertical plot
c. Time histogram
d. Data bins
e. X/Y distribution
f. Season histogram
Figure 9: Maps and statistics of the final aggregated Phosphate data
11
EMODnet Thematic Lot n° 4 - Chemistry Mediterranean Area QC & Nutrients Products Report
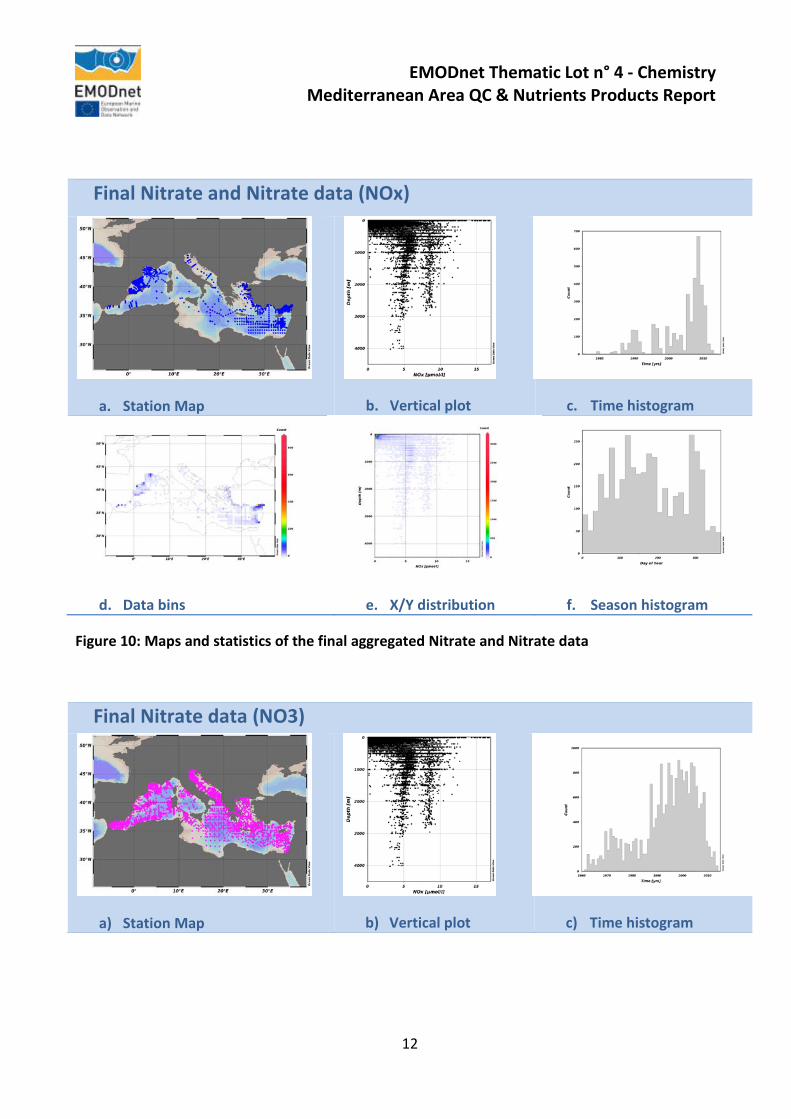
Final Nitrate and Nitrate data (NOx)
a. Station Map
b. Vertical plot
c. Time histogram
d. Data bins
e. X/Y distribution
f. Season histogram
Figure 10: Maps and statistics of the final aggregated Nitrate and Nitrate data
Final Nitrate data (NO3)
a) Station Map
b) Vertical plot
c) Time histogram
12
EMODnet Thematic Lot n° 4 - Chemistry Mediterranean Area QC & Nutrients Products Report
d) Data bins
e) X/Y distribution
f) Season histogram
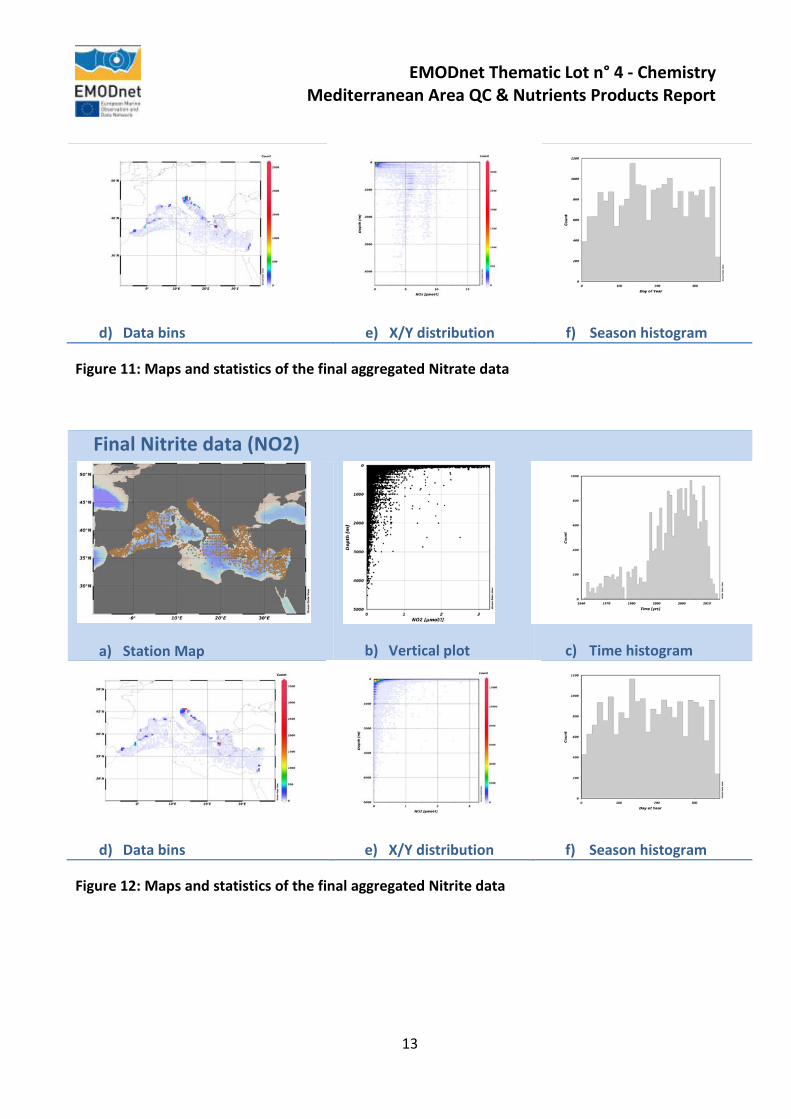
Figure 11: Maps and statistics of the final aggregated Nitrate data
Final Nitrite data (NO2)
a) Station Map
b) Vertical plot
c) Time histogram
d) Data bins
e) X/Y distribution
f) Season histogram
Figure 12: Maps and statistics of the final aggregated Nitrite data
13
EMODnet Thematic Lot n° 4 - Chemistry Mediterranean Area QC & Nutrients Products Report
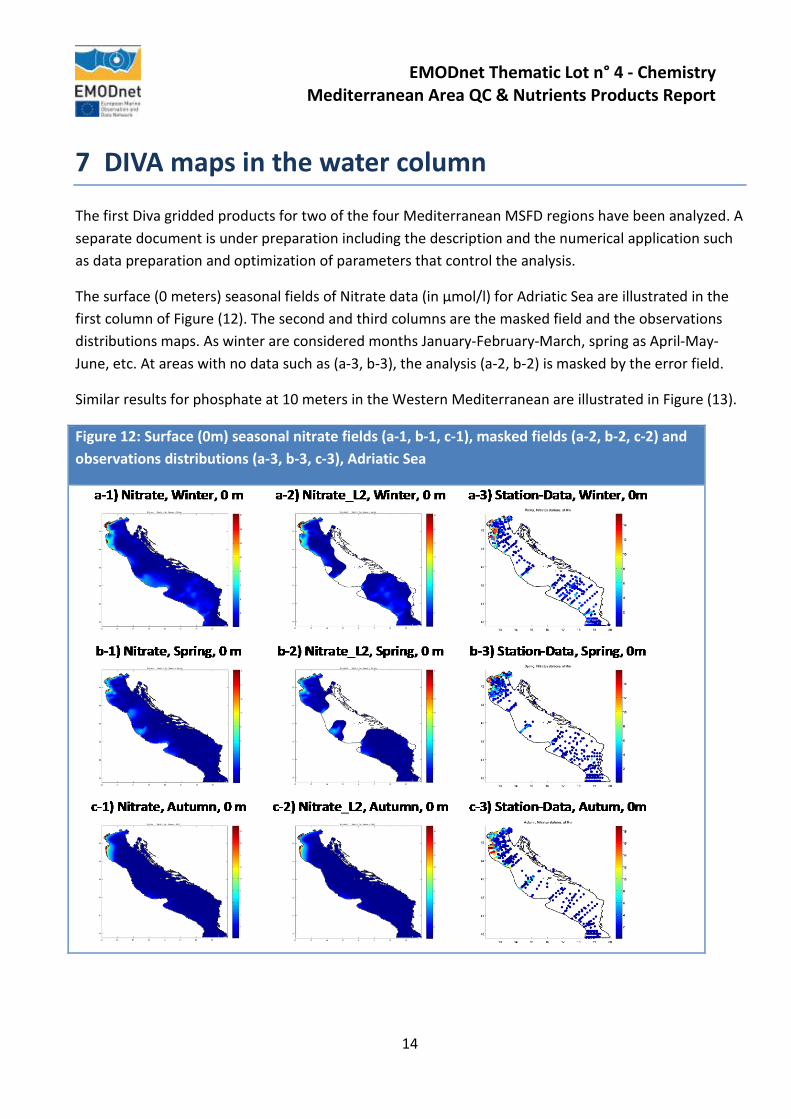
7 DIVA maps in the water column
The first Diva gridded products for two of the four Mediterranean MSFD regions have been analyzed. A separate document is under preparation including the description and the numerical application such as data preparation and optimization of parameters that control the analysis.
The surface (0 meters) seasonal fields of Nitrate data (in µmol/l) for Adriatic Sea are illustrated in the first column of Figure (12). The second and third columns are the masked field and the observations distributions maps. As winter are considered months January-February-March, spring as April-May-June, etc. At areas with no data such as (a-3, b-3), the analysis (a-2, b-2) is masked by the error field.
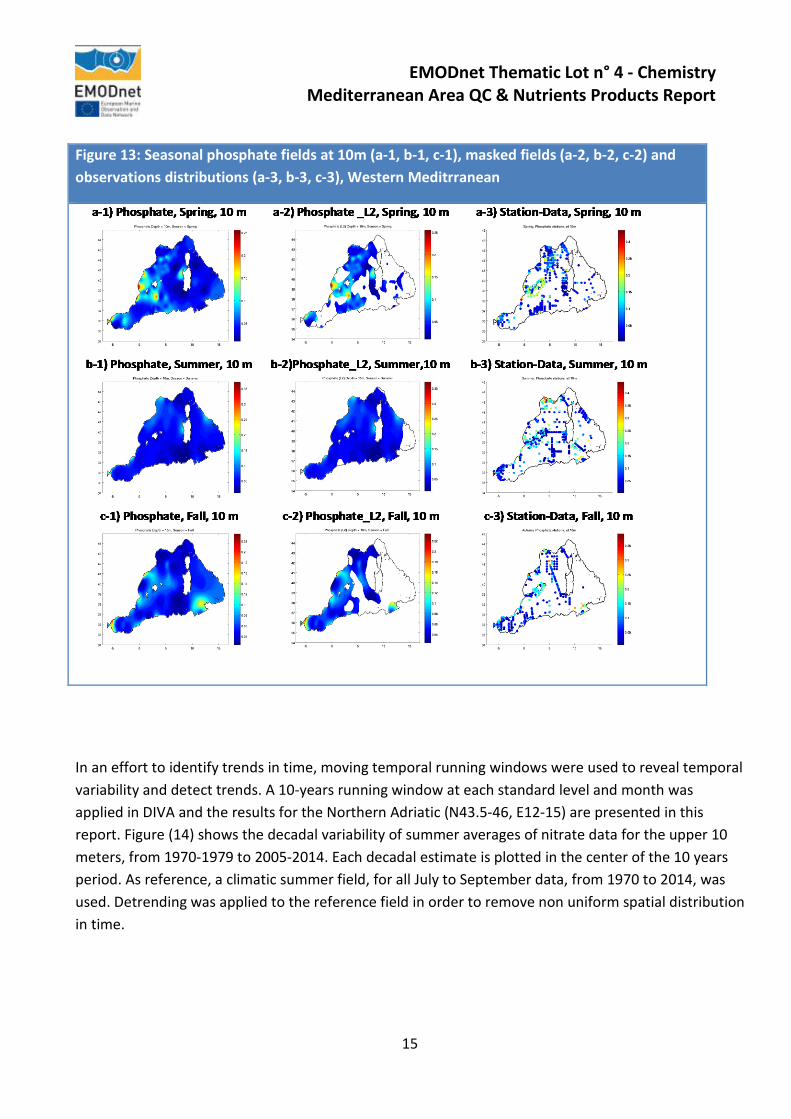
Similar results for phosphate at 10 meters in the Western Mediterranean are illustrated in Figure (13).
Figure 12: Surface (0m) seasonal nitrate fields (a-1, b-1, c-1), masked fields (a-2, b-2, c-2) and observations distributions (a-3, b-3, c-3), Adriatic Sea
14
EMODnet Thematic Lot n° 4 - Chemistry Mediterranean Area QC & Nutrients Products Report
Figure 13: Seasonal phosphate fields at 10m (a-1, b-1, c-1), masked fields (a-2, b-2, c-2) and observations distributions (a-3, b-3, c-3), Western Meditrranean
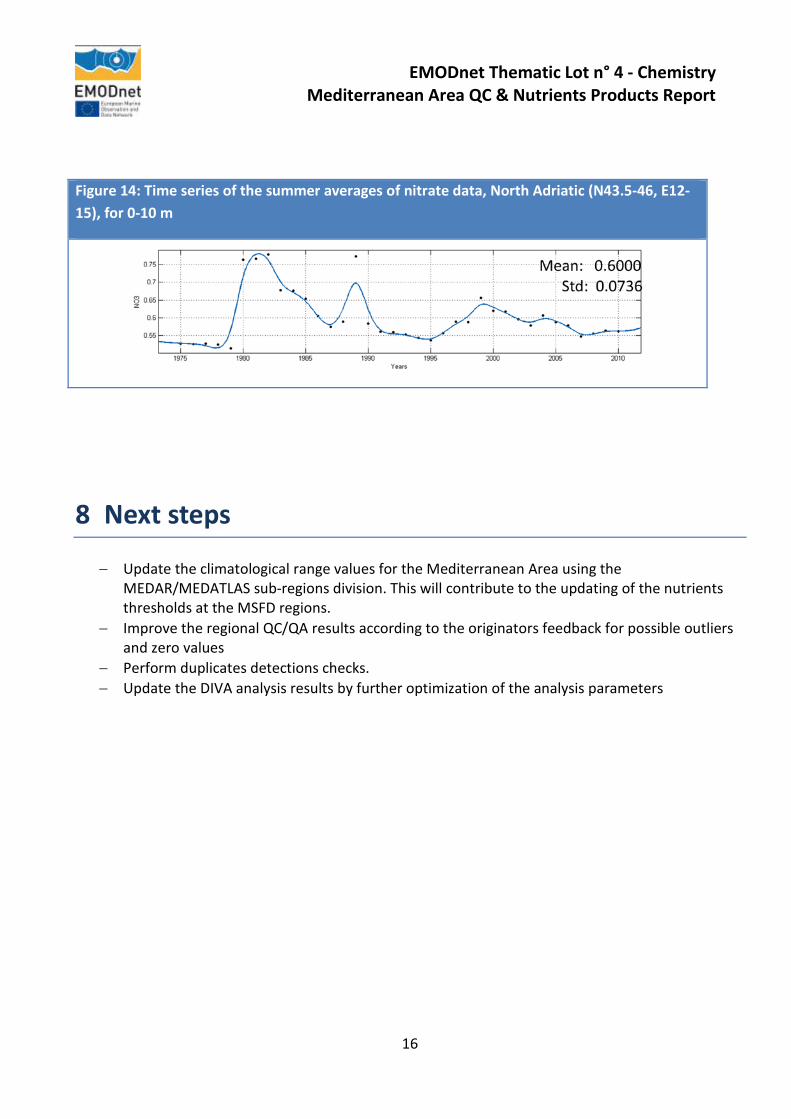
In an effort to identify trends in time, moving temporal running windows were used to reveal temporal variability and detect trends. A 10-years running window at each standard level and month was applied in DIVA and the results for the Northern Adriatic (N43.5-46, E12-15) are presented in this report. Figure (14) shows the decadal variability of summer averages of nitrate data for the upper 10 meters, from 1970-1979 to 2005-2014. Each decadal estimate is plotted in the center of the 10 years period. As reference, a climatic summer field, for all July to September data, from 1970 to 2014, was used. Detrending was applied to the reference field in order to remove non uniform spatial distribution in time.
15
EMODnet Thematic Lot n° 4 - Chemistry Mediterranean Area QC & Nutrients Products Report
Figure 14: Time series of the summer averages of nitrate data, North Adriatic (N43.5-46, E12-15), for 0-10 m
8 Next steps
− Update the climatological range values for the Mediterranean Area using the MEDAR/MEDATLAS sub-regions division. This will contribute to the updating of the nutrients thresholds at the MSFD regions.
− Improve the regional QC/QA results according to the originators feedback for possible outliers and zero values
− Perform duplicates detections checks. − Update the DIVA analysis results by further optimization of the analysis parameters
16
EMODnet Thematic Lot n° 4 - Chemistry Mediterranean Area QC & Nutrients Products Report
9 Annexes
List of Annexes
Annex I: Format Errors
Annex II: Empty Files
Annex III: Nutrient parameters in the “initial data”, Tables 2-7
Annex IV: Maps and vertical profiles of the nutrient parameters, Figures 1-6
Annex V: Units conversions for nutrient parameters, Tables 8-13
Annex VI: Depth [m] QC flag changes-negatives values
Annex VII: Ammonium QC flag changes
Annex VIII: Silicate QC flag changes
Annex IX: Phosphate QC flag changes
Annex X: Nitrate and Nitrite QC flag changes
Annex XI: Nitrate QC flag changes
Annex XII: Nitrite QC flag changes
17


