Embed Size (px)
Citation preview

SEX DIFFERENCES STRUGGLING LEARNERS 1
Cognition, Behaviour, and Mental Health in Struggling Learners: A Spotlight on Girls
Jacalyn Guy1*, Silvana Mareva1, Grace Franckel1, the CALM Team1, and Joni Holmes1
1 Medical Research Council Cognition & Brain Sciences Unit, University of Cambridge, UK
*Corresponding author
Acknowledgments: The Centre for Attention Learning and Memory (CALM) research clinic is based
at the Medical Research Council (MRC) Cognition and Brain Sciences Unit, University of Cambridge,
funded by the MRC through UKRI. The lead investigators are Duncan Astle, Kate Baker, Susan E.
Gathercole, Joni Holmes, Rogier A. Kievit, and Tom Manly. Data collection is assisted by a team of
researchers and PhD students that includes Danyal Akarca, Joe Bathelt, Marc Bennett, Giacomo
Bignardi, Sarah Bishop, Erica Bottacin, Lara Bridge, Diandra Brkic, Annie Bryant, Sally Butterfield,
Elizabeth Byrne, Gemma Crickmore, Edwin Dalmaijer, Fánchea Daly, Tina Emery, Laura Forde, Grace
Franckel, Delia Furhmann, Andrew Gadie, Sara Gharooni, Jacalyn Guy, Erin Hawkins, Agnieszka
Jaroslawska, Sara Joeghan, Amy Johnson, Jonathan Jones, Silvana Mareva, Elise Ng‐Cordell, Sinead
O'Brien, Cliodhna O'Leary, Joseph Rennie, Ivan Simpson‐Kent, Roma Siugzdaite, Tess Smith, Stepheni
Uh, Maria Vedechkina, Francesca Woolgar, Natalia Zdorovtsova, Mengya Zhang. The authors would
like to thank all the children who took part in the study, as well as their families. We would also like
to thank the professionals working in children’s services in southeast and east of England for their
assistance in referring participants to the study.

SEX DIFFERENCES STRUGGLING LEARNERS 2
Abstract
Objectives: Fewer girls than boys are identified as struggling at school. The objectives of this study
were to: i) identify dimensions of cognition, behaviour and mental health in a unique transdiagnostic
sample of struggling learners; ii) test whether these constructs were equivalent for boys and girls,
and; iii) compare their performance across the dimensions.
Methods: 805 school‐aged children, identified by practitioners as experiencing problems in cognition
and learning, completed cognitive assessments, and parents/carers rated their behaviour and
mental health problems.
Results: Three cognitive, three behavioural, and two mental health dimensions distinguished the
sample. Dimensions were structurally comparable between boys and girls, but differences in severity
were present: girls had greater cognitive impairments; boys had more severe externalising problems.
Conclusions: Gender biases to stereotypically male behaviours are prevalent among practitioners,
even when the focus is on identifying cognitive and learning difficulties. This underscores the need
to include cognitive and female‐representative criteria in diagnostic systems to identify girls whose
difficulties could go easily undetected.
Keywords: sex differences, learning difficulties, cognition, behaviour, mental health, transdiagnostic
SEX DIFFERENCES STRUGGLING LEARNERS 3
Approximately 15% of children have special educational needs (SENs), and the majority of
these are boys (Department of Education, 2020). Diagnoses of developmental disorders associated
with learning problems, including Attention Deficit Hyperactivity Disorder (ADHD) and Autism
Spectrum Disorder (ASD), are made earlier and more often for boys. Clinical estimates often indicate
a higher boy: girl ratio for ADHD and ASD (e.g., Polanczyk & Rohde, 2007; Maenner et al., 2020).
However, there is increasing recognition that these sex1 differences may not reflect the number of
girls who are struggling, with lower ratios reported in community and population studies (Gershon,
2002; Loomes et al., 2017). These discrepancies likely reflect both the different manifestations of
learning and developmental difficulties between sexes, and the use of diagnostic rubrics used to
identify children’s difficulties. The primary aim of the current study is to investigate whether
dimensions of cognition, behaviour and mental health differ between boys and girls in a large mixed
sample of struggling learners with and without diagnoses.
Why more boys than girls?
One possibility for the high male: female sex ratio might relate to a reliance on diagnostic
systems that have emerged from descriptions and categorisations of overt behaviours (discussed in
Kreiser & White, 2014; Mowlem et al., 2019a). Criteria related to overt and externalising behaviours,
such as hyperactivity for ADHD, are likely recognised more easily by practitioners and tolerated less
well by parents and teachers (Gaub & Carlson, 1997). Add to that socially constructed gender‐biased
or stereotypical views of boys as being disruptive, the problem becomes apparent: overt behaviours
are more likely to raise concern and expected to be more prevalent in boys. Indeed, studies have
shown that boys are rated as more disruptive (e.g., Sciutto et al., 2004).
1 As defined by the American Psychological Association’s Dictionary of Psychology (APA, 2015), sex usually refers to an individual’s “biological aspects of maleness or femaleness”, whereas gender connotes the “psychological, behavioural, social, and cultural aspects of being male or female”. We acknowledge that sex can interact with gender in different ways; while some individuals’ identities are informed by both sex and gender, others are not (Lai et al., 2015; Gur and Gur, 2016). However, we use the term “sex” throughout the paper, as the majority of neurodevelopmental studies, and indeed our own, record biological sex at birth.

SEX DIFFERENCES STRUGGLING LEARNERS 4
Another explanation is that symptom manifestations differ between boys and girls. The way
in which girls express their difficulties may preclude diagnoses, or make their challenges more
difficult to detect. Girls with ADHD often present with predominantly inattentive and internalising
symptoms (Biederman et al., 2002; Levy et al., 2005; Rucklidge & Tannock, 2001). In contrast, boys
typically present with hyperactive/impulsive symptoms and externalising behaviours (Abikoff et al.,
2002; Quinn, 2008). Similarly, some autistic2 girls use behavioural camouflaging strategies, appearing
less autistic in social interactions (Dean et al., 2017; Hull et al., 2020) and more able from others’
perspectives (Hiller et al., 2014), meaning they are less likely to receive a diagnosis. The same is also
true in schools, where boys are more likely to manifest externalising behaviours and receive a
referral for special education assessment (Dhuey & Lipscomb, 2010).
Sex differences in at‐risk developmental populations
Extant research investigating sex differences in cognition, behaviour and mental health in
developmental populations has produced mixed results (e.g., Duvall et al., 2020; Gershon, 2002; R.
C. Gur & Gur, 2017; R. E. Gur & Gur, 2016; Mandy et al., 2012; Mayes et al., 2020; Rucklidge, 2008),
and is dominated by the study of clinical samples of diagnosed children (e.g. discussed in Kreiser &
White, 2014; Mowlem et al., 2019a,b). This likely biases our understanding towards a male
phenotype, both because clinical samples typically include a greater number of boys, and girls
included in such samples are likely to present with overt behaviours more similar to those typically
expressed in boys (Mowlem et al., 2019b). Recruiting selective samples based on the presence of a
particular diagnosis means that we do not understand sex differences either in children with milder
needs, or in those with more complex and co‐occurring needs who are often excluded on the basis
of comorbidity being treated as a confound.
Developmental problems are increasingly studied using transdiagnostic approaches. These
aim to identify dimensions of difficulty that occur across individuals irrespective of diagnostic status
2 Identity‐first language is sometimes preferred among people on the autism spectrum (e.g., Kenny et al., 2016). We therefore use this terminology throughout the article to respect this preference.

SEX DIFFERENCES STRUGGLING LEARNERS 5
(Cuthbert & Insel, 2013). Such approaches offer an alternative way to understand sex differences in
struggling learners. Rather than focussing on diagnoses informed by diagnostic criteria, which may
be biased towards stereotypically male behaviours, transdiagnostic sampling provides the
opportunity to recruit children with a broader range of developmental and learning difficulties (e.g.,
Casey et al., 2014): they provide a way to explore sex differences in the common struggling learner.
The current study
The current study adopts a transdiagnostic approach to characterise male and female
phenotypes in a large mixed sample of children identified as experiencing problems in attention,
learning and / or memory by education and health professionals. Using this sample, we explored the
prevalence of male and female struggling learners. A latent variable approach was used to identify
dimensions of difficulty in the whole sample, and then to test whether these dimensions differed in
structure and severity between boys and girls. We broadly classified multiple individual tasks into
three domains, cognition, behaviour and mental health, based on their common use in clinical and
educational practice. Our analyses were data‐driven and exploratory, so we had no specific
predictions about whether the factor compositions would be similar for male and female struggling
learners, or whether the severity of impairments would differ between boys and girls on specific
dimensions.
Method
Procedure and Measures
The cognitive, behavioural and mental health data from the Centre for Attention, Learning
and Memory (CALM) cohort were used (see Table S1 for a description of the tasks). Recruitment
details and testing procedures are described in the study protocol (Holmes et al., 2019). Ethical
approval was granted by the National Health Service (REC: 13/EE/0157). Parents/caregivers provided
written consent and child verbal assent was obtained.

SEX DIFFERENCES STRUGGLING LEARNERS 6
Raw scores were used in all analyses as some measures factor sex into their age
standardization (Mayes et al., 2020). To control for age, raw scores were regressed on age and the
residuals were used. Higher raw scores were associated with better performance for the cognitive
tasks, but greater severity for the behavioural and mental health questionnaires. Residuals for Rapid
Naming, Simple Reaction Time (SRT; TEA‐Ch2; Manly et al., 2016) and Prosocial Behaviour (SDQ;
Goodman, 1997) were reverse coded to streamline the interpretation of respective cognitive and
mental health measures. Missing data were imputed with a full information maximum likelihood
estimator for all models (Rosseel, 2012).
Participants
The sample included 805 children, whose average age was M = 9.48 years, SD = 2.38 (552
boys Mage = 9.41, SD = 2.35; 253 girls Mage = 9.63, SD = 2.46, t(468.6) = ‐1.21, p = .23). Characteristics,
including diagnostic status and referral route, are presented in Table S2.
Performance was close to age‐appropriate levels for Mr X and Cancellation (see Table 1). All
other cognitive scores were approximately one standard deviation below age‐normed population
means. Behavioural problems were elevated for the whole sample (see Table 1), with the exception
of Organisational problems (BRIEF; Gioia et al., 2000). The majority of mental health ratings on the
RCADS‐P (Chorpita et al., 2000) were elevated, but still within age‐typical and subclinical bounds (i.e.
RCADS‐P T score less than 65).
Insert Table 1
Analysis Plan
Analyses were conducted in four steps: exploratory factor analysis (EFA), confirmatory factor
analysis (CFA), multigroup CFA with measurement invariance (Steenkamp & Baumgartner, 1998; van
de Schoot et al., 2013), and comparisons of latent means (intercepts). A detailed description of this
approach is provided in the Supporting Information. All analyses were conducted using R version

SEX DIFFERENCES STRUGGLING LEARNERS 7
4.0.3 using the Psych (2.0.12; Revelle, 2020), Lavaan (0.6‐7; Rosseel, 2012) and semTools packages
(0.5‐4, Jorgensen et al., 2020).
Results
Descriptive Statistics
Descriptive statistics for boys and girls are presented in Table 2. Correlations between the
measures are provided in Tables S3‐S5.
Insert Table 2
Considerably more boys than girls were referred: 552 boys and 253 girls. Comparisons
between boys and girls revealed girls performed more poorly than boys on the majority of cognitive
measures (see Table 2). Boys were rated higher than girls on most of the behaviour rating scales,
except WM (BRIEF; p =.05), Organisation (Conners Parent Short Form (CPSF); Conners, 2008; p = .83),
and Peer Relations (CPSF; p =.07; see Table 2). Boys also had elevated ratings on mental health
subscales measuring conduct problems, hyperactivity, and prosocial behaviours (all SDQ; all ps <.05;
see Table 2).
Dimensions of Cognition, Behaviour and Mental Health
Cognition
Parallel analysis followed by an EFA with an oblimin rotation suggested a four‐factor model
was a good fit to the cognitive data, χ2 (32) = 63.47, p <.001, RMSEA = 0.035 (90% confidence
interval [CI] = 0.022, 0.048), CFI =0.986, RMSR = 0.02; see Schermelleh‐Engel et al., 2003). This model
included factors corresponding to executive function (Matrix Reasoning, Following Instructions, Mr
X), verbal short‐term (STM) and working memory (WM, Digit Recall, Nonword Repetition, Backward
Digit Recall), phonological processing and attention (Alliteration, Rapid Naming, Cancellation, SRT,
Vigil), and visual STM (Dot Matrix; see Table S6). Despite the good fit, this model was difficult to
interpret because the fourth factor representing visual STM had only one indicator and the factor

SEX DIFFERENCES STRUGGLING LEARNERS 8
reflecting phonological processing and attention had loadings from measures with little in common.
For these reasons, a three‐factor model was tested.
Fit statistics for a three‐factor solution indicated that this model was a good fit, χ2 (42) =
105.5, p <.001, RMSEA = 0.044 (90% confidence interval [CI] = 0.033, 0.054), CFI = 0.947, RMSR =
0.030, see Table S6). The first factor was most strongly associated with measures that draw on
executive resources (Dot Matrix, Backward Digit Recall, Mr X and Matrix Reasoning). The second
factor was linked mostly to speeded tasks or tasks that were completed under time constraints (SRT,
Rapid Naming, Cancellation, and Vigil). This factor was also linked to tasks that were not speeded
(Alliteration, Delayed Recall, and Following Instructions), but that might be performed better if they
are performed quickly (e.g., due to less forgetting time). The third factor was associated with
measures involving the storage of phonological material (Digit Recall and Nonword Repetition).
These factors were labelled Executive, Speed, and Phonological Processing, respectively. The
labelling of Factor 2 as Speed does not necessarily reflect that all tasks were speeded, but that the
majority of tasks with a speeded component loaded on this factor. A confirmatory factor analysis
revealed the three‐factor model was an acceptable fit to the data, χ2(62) =203.12 p <.001, RMSEA =
0.053 (90% confidence interval [CI] = 0.045, 0.061), CFI = 0.930, SRMR =0.039, so it was selected for
further analyses exploring sex differences (see Figure 1).
Insert Figure 1
Behaviour
Parallel and EFA analyses identified a three‐factor solution as an acceptable fit to the
behavioural data (see Table S7), χ2(42) = 417.75, p <.001, RMSEA = 0.105 (90% confidence interval
[CI] = 0.096, 0.115 ), CFI =0. 947, RMSR = 0.03). The Monitor subscale loaded on all three factors in
this model, and excluding it yielded a marginally better fit, χ2 (33) = 311.50, p <.001, RMSEA = 0.102
(90% confidence interval [CI] = 0.092, 0.113), CFI =0.956, RMSR = 0.03). This latter model, excluding
the Monitor subscale, was selected for further analysis in the interests of parsimony, Δχ2(9) =

SEX DIFFERENCES STRUGGLING LEARNERS 9
106.24, p <.001. Symptoms related to everyday difficulties with cognitive control loaded most highly
on Factor 1. These included WM, planning, executive functions, inattention, initiation, and
organization. Problems with emotional control, shifting, aggression, and peer relationships loaded
most highly on Factor 2. Subscales measuring behavioural control, including hyperactivity and
inhibition, loaded on Factor 3. The factors were labelled Cognitive Control (Factor 1), Emotion
Regulation (Factor 2) and Behaviour Regulation (Factor 3). These labels were given based on the
hypothesized dimension underlying differences in performance based on the constellation of tasks
with the highest loadings. It is important to note that they do not represent a rigid mapping of tasks
on factors and could be labelled differently depending on the sample (e.g., Simpson‐Kent et al.,
2020).
A CFA testing the fit of the three‐factor model indicated it was a poor fit to the data, χ2(51) =
676.21, p <.001, RMSEA = 0.124 (90% confidence interval [CI] = 0.115, 0.132), CFI = 0.900, SRMR =
0.054. Modification indices revealed that scores for the Initiation subscale loaded highly on two
factors: Emotion Regulation and Cognitive Control. Allowing this measure to cross‐load on both
factors significantly improved the goodness of fit, Δχ2(1) =52.43, p <.001, but the overall model
remained an inadequate fit, χ2(50) = 615.08, p <.001, RMSEA = 0.119 (90% confidence interval [CI] =
0.110 0.127), SRMR = 0.047, CFI= 0.909. Further inspection of the modification indices suggested
that allowing hyperactivity and inattention, symptoms that co‐occur in ADHD, to co‐vary might
improve the model. Adding this covariance significantly improved the model, Δχ2(1) = 113.36, p
<.001, and produced a model with adequate fit to use in subsequent analyses exploring sex
differences, χ2(49) = 488.98, p <.001, RMSEA = 0.106 (90% confidence interval [CI] = 0.097, 0.114),
SRMR = 0.043, CFI = 0.929 (Figure 1).
Mental Health
A parallel analysis indicated a two‐factor solution would be a good fit, which was confirmed
by an EFA, χ2(26) = 59.4, p <.001, RMSEA = 0.056 (90% confidence interval [CI] = 0.038, 0.076), CFI =

SEX DIFFERENCES STRUGGLING LEARNERS 10
0.981, RMSR = 0.02; see Table S8). Factor 1 was associated with symptoms of generalised, social and
separation anxiety, panic and obsessive‐compulsive disorders, and depression. Factor 2 was linked
to conduct and peer relationship problems, low prosocial behaviour, and hyperactivity. These factors
were labelled Internalising (Factor 1) and Externalising (Factor 2), respectively. CFA fit indices
revealed that this two‐factor model was an acceptable fit to the data, χ2(34) =179.44, p <.001,
RMSEA = 0.103 (90% confidence interval [CI] = 0.088 0.118), SRMR = 0.069, CFI= 0.918, with the
exception of the RMSEA statistic (e.g. > 0.08). Modification indices suggested that allowing
depression to cross‐load on both factors would improve the model. The model was re‐estimated
with this cross‐loading, and the fit was improved significantly, Δχ2(1) = 75.49, p <.001, yielding fit
statistics within an acceptable range, χ2(33) = 111.72, p <.001, RMSEA = 0.077 (90% confidence
interval [CI] = 0.062, 0.093), SRMR = 0.054, CFI= 0.956. This model was used in all subsequent
analyses (see Figure 1).
Comparing Boys and Girls
Cognition
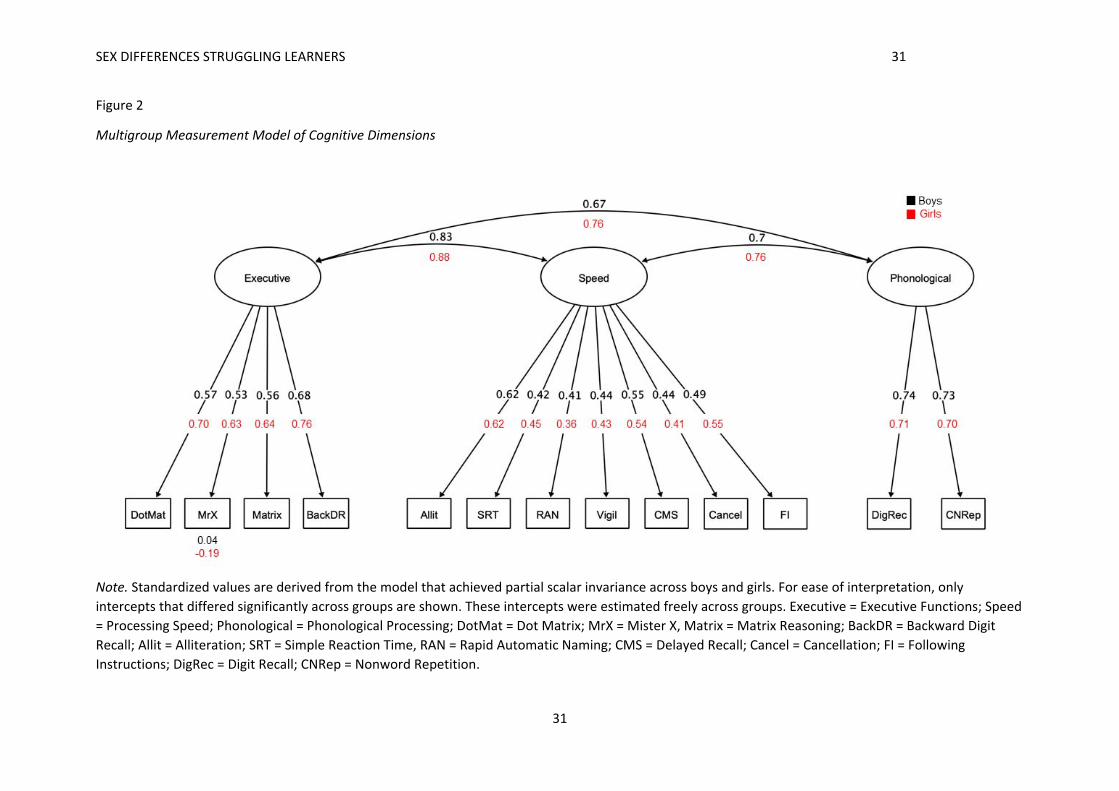
Tests of configural invariance revealed that the three factor model captured the data well
for both boys and girls, χ2(124) = 280.70, p <.001, RMSEA = 0.056 (90% confidence interval [CI] =
0.047, 0.065), SRMR = 0.046, CFI = 0.922. Tests of metric invariance showed no significant
deterioration of model fit when loadings were constrained to be equal across groups, Δχ2(10) =
11.48, p =.321. However, tests of scalar invariance indicated that the intercepts differed between
boys and girls, Δχ2(10) = 18.86, p =.04. Inspection of the modification indices revealed a large
discrepancy for the MrX test. Releasing the equality constraint on these intercepts improved the
model fit to the data, Δχ2(9) = 7.85, p =.550, and partial scalar invariance was supported (see Table
S9).
Group differences in latent means were explored by comparing the freely estimated and
constrained models (see Figure 2). The freely estimated model fit better than the constrained model,

SEX DIFFERENCES STRUGGLING LEARNERS 11
suggesting that latent intercepts (i.e. means) differed between boys and girls. Applying individual
constraints on the latent intercepts revealed a significant difference between groups on the
Executive factor alone, Δχ2(1) = 11.62, p <.001, with girls performing significantly worse than boys
(girls M= ‐0.49, SD =2.87, boys M=0.44, SD = 2.44). Intercepts for Speed and Phonological Processing
did not differ significantly between groups, (Speed Δχ2(1) = 3.46, p =.06, Phonological Processing
Δχ2(1) = 3.48, p =.06; see Figure 5).
Insert Figure 2
Behaviour
The behavioural model met conditions for configural and metric invariance but not for scalar
invariance (see Table S9). Modification indices for subtest mean scores revealed discrepancies for
Organisation, Planning and WM. Allowing these intercepts to vary freely between groups improved
the model fit and partial scalar invariance was achieved, Δχ2(5) = 11.69, p =.07 (see Figure 3).
Insert Figure 3
The freely estimated model fit better than the constrained model, indicating that latent
intercepts were significantly different between boys and girls. Boys had significantly more difficulties
on all three factors, Cognitive Control (Δχ2(1) =17.56 , p <.001, boys M=0.11, SD = 0.95, girls M= ‐
0.24, SD =1.06), Emotion Regulation (Δχ2(1) =10.39 , p =.001, boys M=0.09, SD = 0.97, girls M= ‐0.20,
SD =1.03), and Behaviour Regulation (Δχ2(1) = 37.34 , p <.001, boys M=0.16, SD =0.98; girls M=‐0.34,
SD =0.97; see Figure 5).
Mental Health
For mental health, there was no significant deterioration of model fit with increasing
constraints. The conditions of configural, metric and scalar invariance were met indicating that the
overall structure, loadings and intercepts were similar across groups (see Table S9 and Figure 4).
Insert Figure 4

SEX DIFFERENCES STRUGGLING LEARNERS 12
Comparisons between boys and girls revealed that constraining intercepts for the
Externalising factor significantly degraded the fit, Δχ2(1) = 18.56, p <.001. Boys exhibited significantly
more externalising problems than girls (boys M=0.10, SD = 0.95; girls M =‐0.23, SD = 1.07). No
significant group differences were found for internalising problems, Δχ2(1) = 0.03, p =.871 (see
Figure 5).
Insert Figure 5
Discussion
This is the first study, to our knowledge, to adopt a transdiagnostic dimensional approach to
understanding sex differences in children with developmental difficulties. The key findings were that
more boys than girls were referred, and while dimensions of cognition, behaviour and mental health
were invariant across boys and girls, cognitive problems were more severe in girls and behavioural
difficulties and externalising problems greater in boys.
Prevalence of boys and girls
Prevalence estimates indicating a high boy:girl ratio for developmental difficulties are drawn
predominantly from studies of clinical populations (e.g. autistic children or those with ADHD,
discussed in Kreiser & White, 2014; Mowlem et al., 2019a,b). Using a novel sampling frame, which
aimed to represent the full spectrum of children with learning‐related difficulties, including those
with relatively mild problems in addition to those with diagnosed conditions, we also found a high
boy:girl ratio, with twice as many boys than girls referred. This might reflect implicit gender biases
and stereotyping (e.g., discussed in Anderson, 1997), or different manifestations, drivers and
expressions of difficulties in boys and girls (e.g. Dhuey & Lipscomb, 2010; Hiller et al., 2014), but we
suspect it is also related to practitioners using heuristics for diagnostic criteria that emphasize overt
behaviours.

SEX DIFFERENCES STRUGGLING LEARNERS 13
Referrers to this study identified children based on observations of cognitive and learning
problems. Despite this, health and education practitioners referred more children with behavioural
difficulties than cognitive problems, suggesting they were spotting and raising concern for overt
behaviours more easily than cognitive problems. This bias towards male‐focussed diagnostic criteria
makes it less likely for a girl to be diagnosed with conditions such as ASD (Lai et al., 2015), and here
we see it extends to the broader population of children struggling at school. Moving forward it will
be important to decrease these biases towards diagnostic criteria, and increase knowledge of the
female phenotype among professionals involved in referrals, to ensure we meet the needs of girls
who are struggling.
Differences between boys and girls
The broad dimensions underpinning the cognitive abilities of the whole sample included
Executive Function, Speed and Phonological Processing factors. These factors correspond to those
previously identified in a study investigating the cognitive dimensions of learning in the same
children from the CALM cohort (Holmes et al., 2020), showing again that the key constructs that
distinguish cognitive abilities in typically developing children and adults also differentiate cognitive
function in struggling learners.
The cognitive dimensions were invariant across boys and girls, indicating that the overall
latent structure of cognitive skills does not differ between sexes. There were no differences in scores
on the phonological or speed dimensions, but girls were more impaired on the executive function
dimension. These data support the notion that girls must show greater cognitive deficits for
educational or health practitioners to notice their struggles (e.g., Dworzynski et al., 2012; Gaub &
Carlson, 1997). They also suggest the biggest driver of problems for girls in our sample is executive
function difficulties. Executive functions are associated with learning outcomes in typical and
neurodiverse groups (e.g., Peng et al., 2018; Swanson & Ashbaker, 2000). However, there is evidence
that girls may draw more on these resources than boys: girls take a more effortful, mastery‐based

SEX DIFFERENCES STRUGGLING LEARNERS 14
approach to learning that draws on general higher‐order cognitive skills, while boys draw more on
domain‐specific knowledge and skills during learning (Brunner et al., 2008; Kenney‐Benson et al.,
2006). If this is the case, then impairments in executive function problems might be expected to
have a more significant impact on girls’ school progress, and this might explain why the girls referred
to the CALM cohort were characterised by more severe executive function problems than the boys.
Parent/carer ratings of the children’s behaviour and mental health captured three
dimensions of behaviour and two of mental health. For behaviour, factors corresponding to
Cognitive Control, Emotion Regulation and Behaviour Regulation emerged. Two of these factors,
Behaviour Regulation and Cognitive Control, map on to dimensions of impairment proposed by
multiple pathway models of ADHD (e.g., Castellanos et al., 2006). According these models, ADHD
symptoms arise as consequence of impairments in two neurobiological pathways: one serves cool
cognitive functions such as working memory, planning and switching, and the other hot executive
functions that contribute to hyperactivity/ impulsivity and emotional‐reward dysregulation (Zelazo &
Müller, 2002). The third dimension, Emotional Regulation, resembles part of a broader self‐
regulation concept, which is also linked to increased risks for ADHD (Walcott & Landau, 2004) and
other psychopathologies (e.g., McLaughlin et al., 2011; Röll et al., 2012). For mental health, two
dimensions emerged, internalising and externalising. These align with models of child
psychopathology (Achenbach, 1966; McElroy, et al., 2018; Patalay et al., 2015).
Dimensions of behaviour and mental health were the same for boys and girls, but the
severity of their impairments differed on specific dimensions. There were no differences on the
internalising symptoms dimension, but girls had fewer externalising problems and fewer difficulties
across all three dimensions of behaviour than boys. This could mean that externalising symptoms
and overt behaviours commonly associated with ADHD are genuinely more prevalent and manifest
in boys (e.g., Abikoff et al., 2002). Alternatively, elevated problem behaviours in boys could reflect
socially constructed gender‐biased or stereotypical views of boys as being disruptive, and the

SEX DIFFERENCES STRUGGLING LEARNERS 15
application and use of diagnostic criteria that emphasise overt behaviours (Hiller et al., 2014;
Mowlem et al., 2019a). Both boys and girls had elevated symptoms of internalising problems.
Internalising problems have been linked to stressful and negative life events (Kim et al., 2003;
March‐Llanes et al., 2017), which are likely common among our sample, and may explain why
symptoms were elevated for both sexes.
Conclusion
This study shows that when health and education professionals identify children with cognitive and
learning problems, they recognise more boys than girls. Despite this, the girls referred showed
greater cognitive difficulties, with significantly more impairments on executive functions. They also
exhibited fewer externalising problems. These results underscore the need to include cognitive and
female‐representative criteria in diagnostic systems. Including these criteria, and / or routinely
administering cognitive assessments in schools may help to identify girls whose difficulties could
easily go undetected. By raising awareness of the profile of struggling girls, and drawing attention to
the systemic and implicit bias present in the fields of both healthcare and education, we have the
potential to increase the likelihood that girls’ difficulties will be recognised.
Key Points
Our understanding of sex differences in at‐risk developmental populations is dominated by
studies of clinical samples, likely biasing knowledge towards a male phenotype.
Male and female phenotypes were characterised in a large transdiagnostic sample of
children identified by practitioners as experiencing problems in cognition and learning,
irrespective of diagnostic status.
Practitioners recognised more boys than girls as struggling.

SEX DIFFERENCES STRUGGLING LEARNERS 16
Dimensions of cognition, behaviour and mental health were structurally invariant between
boys and girls, but cognitive problems were more severe in girls, and behavioural difficulties
and externalising problems greater in boys.
These findings illustrate the profile of struggling girls, and highlight systemic and implicit
biases in the fields of healthcare and education that need to be addressed to provide
appropriate support.

SEX DIFFERENCES STRUGGLING LEARNERS 17
References
Abikoff, H. B., Jensen, P. S., Arnold, L. L. E., Hoza, B., Hechtman, L., Pollack, S., Martin, D., Alvir, J.,
March, J. S., Hinshaw, S., Vitiello, B., Newcorn, J., Greiner, A., Cantwell, D. P., Conners, C. K.,
Elliott, G., Greenhill, L. L., Kraemer, H., Pelham, W. E., … Wigal, T. (2002). Observed Classroom
Behavior of Children with ADHD: Relationship to Gender and Comorbidity. Journal of Abnormal
Child Psychology, 30(4), 349–359. https://doi.org/10.1023/A:1015713807297
Achenbach, T. M. (1966). The classification of children’s psychiatric symptoms: A factor‐analytic
study. Psychological Monographs: General and Applied, 80(7), 1–37.
https://doi.org/https://doi.org/10.1037/h0093906
Anderson, K. G. (1997). Gender bias and special education referrals. Annals of Dyslexia, 47(1), 151–
162. https://doi.org/10.1007/s11881‐997‐0024‐8
Biederman, J., Mick, E., Faraone, S., Braaten, E., Doyle, A., Spencer, T., Wilens, T. E., Frazier, E., &
Mary Ann Johnson. (2002). Influence of Gender on Attention Deficit Hyperactivity Disorder in
Children Referred to a Psychiatric Clinic. American Journal of psychiatry, 159(1), 36‐42.
https://ajp.psychiatryonline.org/doi/pdfplus/10.1176/appi.ajp.159.1.36
Brunner, M., Krauss, S., & Kunter, M. (2008). Gender differences in mathematics: Does the story
need to be rewritten? Intelligence, 36(5), 403–421.
https://doi.org/https://doi.org/10.1016/j.intell.2007.11.002
Casey, B. J., Oliveri, M. E., & Insel, T. (2014). A neurodevelopmental perspective on the research
domain criteria (RDoC) framework. Biological Psychiatry, 76(5), 350–353.
https://doi.org/10.1016/j.biopsych.2014.01.006
Castellanos, F. X., Sonuga‐Barke, E. J. S., Milham, M. P., & Tannock, R. (2006). Characterizing
cognition in ADHD: beyond executive dysfunction. Trends in Cognitive Sciences, 10(3), 117–123.

SEX DIFFERENCES STRUGGLING LEARNERS 18
Chorpita, B. F., Yim, L., Moffitt, C., Umemoto, L. A., & Francis, S. E. (2000). Assessment of symptoms
of DSM‐IV anxiety and depression in children: a revised child anxiety and depression scale.
Behaviour Research and Therapy, 38(8), 835–855. https://doi.org/10.1016/S0005‐
7967(99)00130‐8.
Conners, C. (2008). Conners 3rd edition (Conners 3). Toronto, ON: Multi‐Health Systems.
Cuthbert, B. N., & Insel, T. R. (2013). Toward the future of psychiatric diagnosis: the seven pillars of
RDoC. BMC Medicine, 11(1), 126. https://doi.org/10.1186/1741‐7015‐11‐126
Dean, M., Harwood, R., & Kasari, C. (2017). The art of camouflage: Gender differences in the social
behaviors of girls and boys with autism spectrum disorder. Autism, 21(6), 678–689.
Department of Education. (2020). Special educational needs and disability: an analysis and summary
of data sources.
https://assets.publishing.service.gov.uk/government/uploads/system/uploads/attachment_dat
a/file/882802/Special_educational_needs_and_disability_an_analysis_and_summary_of_data_
sources.pdf
Dhuey, E., & Lipscomb, S. (2010). Disabled or young? Relative age and special education diagnoses in
schools. Economics of Education Review, 29(5), 857–872.
https://doi.org/https://doi.org/10.1016/j.econedurev.2010.03.006
Duvall, S. W., Huang‐Storms, L., Presmanes Hill, A., Myers, J., & Fombonne, E. (2020). No Sex
Differences in Cognitive Ability in Young Children with Autism Spectrum Disorder. Journal of
Autism & Developmental Disorders, 50(5), 1770‐1785. https://doi.org/10.1007/s10803‐019‐
03933‐1
Dworzynski, K., Ronald, A., Bolton, P., & Happé, F. (2012). How different are girls and boys above and
below the diagnostic threshold for autism spectrum disorders? Journal of the American
Academy of Child & Adolescent Psychiatry, 51(8), 788–797.

SEX DIFFERENCES STRUGGLING LEARNERS 19
Gaub, M., & Carlson, C. L. (1997). Gender Differences in ADHD: A Meta‐Analysis and Critical Review.
Journal of the American Academy of Child & Adolescent Psychiatry, 36(8), 1036–1045.
https://doi.org/https://doi.org/10.1097/00004583‐199708000‐00011
Gershon, J. (2002). A meta‐analytic review of gender differences in ADHD. Journal of Attention
Disorders, 5(3), 143–154. https://doi.org/10.1177/108705470200500302
Gioia, G. A., Isquith, P. K., Guy, S. C., & Kenworthy, L. (2000). Behavior rating inventory of executive
function: BRIEF. Psychological Assessment Resources Odessa, FL.
Goodman, R. (1997). The Strengths and Difficulties Questionnaire: A research note. Journal of Child
Psychology and Psychiatry, 38(5), 581–586. https://doi.org/https://doi.org/10.1111/j.1469‐
7610.1997.tb01545.x
Gur, R. C., & Gur, R. E. (2017). Complementarity of sex differences in brain and behavior: From
laterality to multimodal neuroimaging. Journal of Neuroscience Research, 95(1–2), 189–199.
https://doi.org/10.1002/jnr.23830
Gur, R. E., & Gur, R. C. (2016). Sex differences in brain and behavior in adolescence: Findings from
the Philadelphia Neurodevelopmental Cohort. Neuroscience and Biobehavioral Reviews, 70,
159–170. https://doi.org/10.1016/j.neubiorev.2016.07.035
Hiller, R. M., Young, R. L., & Weber, N. (2014). Sex differences in autism spectrum disorder based on
DSM‐5 criteria: evidence from clinician and teacher reporting. Journal of Abnormal Child
Psychology, 42(8), 1381–1393. https://doi.org/10.1007/s10802‐014‐9881‐x
Holmes, J., Bryant, A., Gathercole, S. E., & Team, the C. (2019). Protocol for a transdiagnostic study
of children with problems of attention, learning and memory (CALM). BMC Pediatrics, 19(1),
10. https://doi.org/10.1186/s12887‐018‐1385‐3
Holmes, J., Guy, J., Kievit, R. A., Bryant, A., Mareva, S., & Gathercole, S. E. (2020). Cognitive
dimensions of learning in children with problems in attention, learning, and memory. Journal of

SEX DIFFERENCES STRUGGLING LEARNERS 20
Educational Psychology. https://doi.org/10.1037/edu0000644
Hull, L., Petrides, K. V., & Mandy, W. (2020). The Female Autism Phenotype and Camouflaging: a
Narrative Review. Review Journal of Autism and Developmental Disorders, 7, 306–317.
https://doi.org/10.1007/s40489‐020‐00197‐9
Jorgensen, T. D., Pornprasertmanit, S., Schoemann, A. M., & Rosseel, Y. (2020). semTools: Useful
tools for structural equation modeling. R package version 0.5‐1 (R package version 0.5‐1).
https://cran.r‐project.org/package=semTools
Kenney‐Benson, G. A., Pomerantz, E. M., Ryan, A. M., & Patrick, H. (2006). Sex differences in math
performance: The role of children’s approach to schoolwork. Developmental Psychology, 42(1),
11–26. https://doi.org/10.1037/0012‐1649.42.1.11
Kenny, L., Hattersley, C., Molins, B., Buckley, C., Povey, C., & Pellicano, E. (2016). Which terms should
be used to describe autism? Perspectives from the UK autism community. Autism, 20(4), 442–
462. https://doi.org/10.1177/1362361315588200
Kim, K. J., Conger, R. D., Elder Jr., G. H., & Lorenz, F. O. (2003). Reciprocal Influences Between
Stressful Life Events and Adolescent Internalizing and Externalizing Problems. Child
Development, 74(1), 127–143. https://doi.org/https://doi.org/10.1111/1467‐8624.00525
Kreiser, N. L., & White, S. W. (2014). ASD in females: are we overstating the gender difference in
diagnosis? Clinical Child and Family Psychology Review, 17(1), 67–84.
Lai, M.‐C., Lombardo, M. V, Auyeung, B., Chakrabarti, B., & Baron‐Cohen, S. (2015). Sex/gender
differences and autism: setting the scene for future research. Journal of the American Academy
of Child and Adolescent Psychiatry, 54(1), 11–24. https://doi.org/10.1016/j.jaac.2014.10.003
Levy, F., Hay, D. A., Bennett, K. S., & McStephen, M. (2005). Gender differences in ADHD subtype
comorbidity. Journal of the American Academy of Child & Adolescent Psychiatry, 44(4), 368–
376.

SEX DIFFERENCES STRUGGLING LEARNERS 21
Loomes, R., Hull, L., & Mandy, W. P. L. (2017). What Is the Male‐to‐Female Ratio in Autism Spectrum
Disorder? A Systematic Review and Meta‐Analysis. Journal of the American Academy of Child &
Adolescent Psychiatry, 56(6), 466–474.
https://doi.org/https://doi.org/10.1016/j.jaac.2017.03.013
Maenner, M. J., Shaw, K. A., & Baio, J. (2020). Prevalence of autism spectrum disorder among
children aged 8 years—autism and developmental disabilities monitoring network, 11 sites,
United States, 2016. MMWR Surveillance Summaries, 69(4), 1.
Mandy, W., Chilvers, R., Chowdhury, U., Salter, G., Seigal, A., & Skuse, D. (2012). Sex Differences in
Autism Spectrum Disorder: Evidence from a Large Sample of Children and Adolescents. Journal
of Autism and Developmental Disorders, 42(7), 1304–1313. https://doi.org/10.1007/s10803‐
011‐1356‐0
Manly, T., Anderson, V., Crawford, J., George, M., Underbjerg, M., & Robertson, I. (2016). Test of
everyday attention for children. (TEA–Ch2) London. UK: Harcourt Assessment.
March‐Llanes, J., Marqués‐Feixa, L., Mezquita, L., Fañanás, L., & Moya‐Higueras, J. (2017). Stressful
life events during adolescence and risk for externalizing and internalizing psychopathology: a
meta‐analysis. European Child & Adolescent Psychiatry, 26(12), 1409–1422.
https://doi.org/10.1007/s00787‐017‐0996‐9
Mayes, S. D., Castagna, P. J., & Waschbusch, D. A. (2020). Sex differences in externalizing and
internalizing symptoms in ADHD, autism, and general population samples. Journal of
Psychopathology and Behavioral Assessment, 42(3), 519‐526.
McElroy, E., Belsky, J., Carragher, N., Fearon, P., & Patalay, P. (2018). Developmental stability of
general and specific factors of psychopathology from early childhood to adolescence: dynamic
mutualism or p‐differentiation? Journal of Child Psychology and Psychiatry, 59(6), 667–675.
https://doi.org/https://doi.org/10.1111/jcpp.12849

SEX DIFFERENCES STRUGGLING LEARNERS 22
McLaughlin, K. A., Hatzenbuehler, M. L., Mennin, D. S., & Nolen‐Hoeksema, S. (2011). Emotion
dysregulation and adolescent psychopathology: A prospective study. Behaviour Research and
Therapy, 49(9), 544–554. https://doi.org/https://doi.org/10.1016/j.brat.2011.06.003
Mowlem, F., Agnew‐Blais, J., Taylor, E., & Asherson, P. (2019a). Do different factors influence
whether girls versus boys meet ADHD diagnostic criteria? Sex differences among children with
high ADHD symptoms. Psychiatry Research, 272, 765–773.
https://doi.org/https://doi.org/10.1016/j.psychres.2018.12.128
Mowlem, F., Rosenqvist, M. A., Martin, J., Lichtenstein, P., Asherson, P., & Larsson, H. (2019b). Sex
differences in predicting ADHD clinical diagnosis and pharmacological treatment. European
Child & Adolescent Psychiatry, 28(4), 481–489.
Patalay, P., Fonagy, P., Deighton, J., Belsky, J., Vostanis, P., & Wolpert, M. (2015). A general
psychopathology factor in early adolescence. British Journal of Psychiatry, 207(1), 15–22.
https://doi.org/10.1192/bjp.bp.114.149591
Peng, P., Wang, C., & Namkung, J. (2018). Understanding the Cognition Related to Mathematics
Difficulties: A Meta‐Analysis on the Cognitive Deficit Profiles and the Bottleneck Theory. Review
of Educational Research, 88(3), 434–476. https://doi.org/10.3102/0034654317753350
Polanczyk, G., & Rohde, L. A. (2007). Epidemiology of attention‐deficit/hyperactivity disorder across
the lifespan. Current Opinion in Psychiatry, 20(4), 386–392.
https://doi.org/10.1097/yco.0b013e3281568d7a
Quinn, P. O. (2008). Attention‐deficit/hyperactivity disorder and its comorbidities in women and
girls: an evolving picture. Current Psychiatry Reports, 10(5), 419–423.
https://doi.org/10.1007/s11920‐008‐0067‐5
Revelle, W. (2020). psych: Procedures for Psychological, Psychometric, and Personality Research. (R
package version 2.0.12). Northwestern University.

SEX DIFFERENCES STRUGGLING LEARNERS 23
Röll, J., Koglin, U., & Petermann, F. (2012). Emotion Regulation and Childhood Aggression:
Longitudinal Associations. Child Psychiatry & Human Development, 43(6), 909–923.
https://doi.org/10.1007/s10578‐012‐0303‐4
Rosseel, Y. (2012). Lavaan: An R package for structural equation modeling and more. Journal of
Statistical Software, 48(2), 1–36.
Rucklidge, J. J. (2008). Gender differences in ADHD: implications for psychosocial treatments. Expert
Review of Neurotherapeutics, 8(4), 643–655. https://doi.org/10.1586/14737175.8.4.643
Rucklidge, J. J., & Tannock, R. (2001). Psychiatric, Psychosocial, and Cognitive Functioning of Female
Adolescents With ADHD. Journal of the American Academy of Child & Adolescent Psychiatry,
40(5), 530–540. https://doi.org/https://doi.org/10.1097/00004583‐200105000‐00012
Schermelleh‐Engel, K., Moosbrugger, H., & Müller, H. (2003). Evaluating the fit of structural equation
models: Tests of significance and descriptive goodness‐of‐fit measures. Methods of
Psychological Research Online, 8(2), 23–74.
Sciutto, M. J., Nolfi, C. J., & Bluhm, C. (2004). Effects of Child Gender and Symptom Type on Referrals
for ADHD by Elementary School Teachers. Journal of Emotional and Behavioral Disorders, 12(4),
247–253. https://doi.org/10.1177/10634266040120040501
Simpson‐Kent, I. L., Fuhrmann, D., Bathelt, J., Achterberg, J., Borgeest, G. S., Kievit, R. A., & Team, C.
(2020). Neurocognitive reorganization between crystallized intelligence, fluid intelligence and
white matter microstructure in two age‐heterogeneous developmental cohorts. Developmental
Cognitive Neuroscience, 41, 100743. https://doi.org/10.1016/j.dcn.2019.100743
Steenkamp, J.‐B. E. M., & Baumgartner, H. (1998). Assessing Measurement Invariance in Cross‐
National Consumer Research. Journal of Consumer Research, 25(1), 78–90.
https://doi.org/10.1086/209528
Swanson, H. L., & Ashbaker, M. H. (2000). Working memory, short‐term memory, speech rate, word
SEX DIFFERENCES STRUGGLING LEARNERS 24
recognition and reading comprehension in learning disabled readers: Does the executive
system have a role? Intelligence, 28(1), 1–30. https://doi.org/10.1016/S0160‐2896(99)00025‐2
van de Schoot, R., Kluytmans, A., Tummers, L., Lugtig, P., Hox, J., & Muthén, B. (2013). Facing off with
Scylla and Charybdis: a comparison of scalar, partial, and the novel possibility of approximate
measurement invariance. Frontiers in Psychology, 4. https://doi.org/10.3389/fpsyg.2013.00770
Walcott, C. M., & Landau, S. (2004). The Relation Between Disinhibition and Emotion Regulation in
Boys With Attention Deficit Hyperactivity Disorder. Journal of Clinical Child & Adolescent
Psychology, 33(4), 772–782. https://doi.org/10.1207/s15374424jccp3304_12
Zelazo, P. D., & Müller, U. (2002). The Balance Beam in the Balance: Reflections on Rules, Relational
Complexity, and Developmental Processes. Journal of Experimental Child Psychology, 81(4),
458–465. https://doi.org/https://doi.org/10.1006/jecp.2002.2667

SEX DIFFERENCES STRUGGLING LEARNERS 25
25
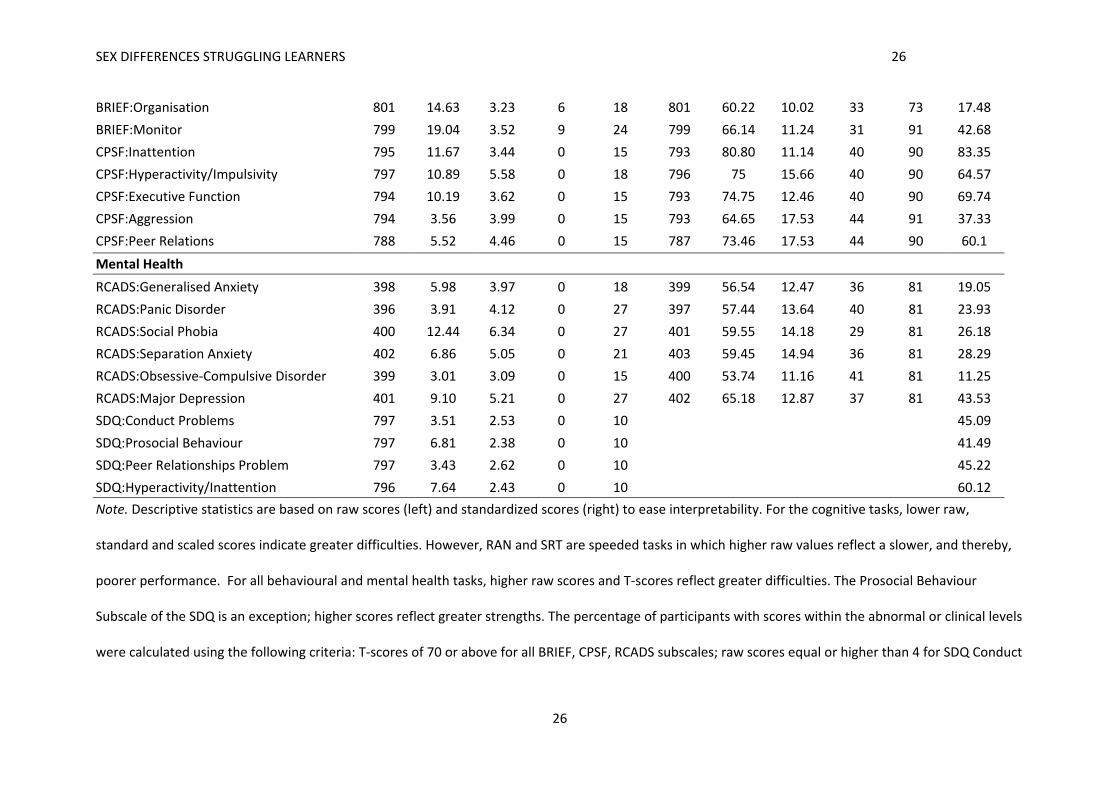
Table 1
Descriptive Statistics for Whole Sample (N=805) on Cognitive, Behavioural and Mental Health Measures with Raw (left) Standardized (right) Scores
Raw Scores Standardized Scores
Measures N M SD Min Max N M SD Min Max Above Cutoff
Cognition
Alliteration 788 7.93 2.50 0 10 788 91.31 10.12 69 107 ‐
Rapid Naming 786 121.53 43.03 55 377 787 88.68 15.13 0 131 ‐
Nonword Repetition 481 25.58 6.87 2 38 481 82.41 20.62 45 125 ‐
Digit Recall 801 24.58 5.38 7 47 801 92.63 15.41 60 149 ‐
Dot Matrix 799 18.03 5.69 2 43 799 90.63 14.98 47 141.20 ‐
Backward Digit Recall 780 9.69 4.42 0 25 780 91.53 12.62 58 137 ‐
MrX 795 9.34 5.14 0 32 795 97.38 15.35 61 148 ‐
Following Instructions 750 11.20 4.04 1 33 750 0 3.64 ‐9.60 18.58 ‐
Delayed Recall 775 28.77 16.16 0 71 775 7.88 3.30 1 19 ‐
Cancellation 771 14.96 3.70 4.67 27 771 10.17 3.31 1 19 ‐
SRT 739 726.54 314.23 233.51 2,276.36 739 7.80 4.06 1 19 ‐
Vigil/Barking 748 7.10 2.42 0 10 748 8.01 3.29 3 19 ‐
Matrix Reasoning 804 11.20 5.56 0 28 803 43.04 9.57 20 80 ‐
Behaviour
BRIEF:Inhibit 800 21.59 6.17 10 30 800 65.74 14.65 36 98 45.5
BRIEF:Shift 801 17.08 4.24 8 24 801 68.15 14.82 36 99 50.56
BRIEF:Emotion Control 800 22.18 5.57 10 30 800 64.70 13.35 35 91 41.88
BRIEF:Initiate 800 17.70 3.32 8 24 800 66.49 10.74 35 95 40.62
BRIEF:WM 800 25.74 4.05 11 30 800 73.84 9.71 38 93 72.5
BRIEF:Planning 789 29.02 5.00 13 36 789 71.40 10.46 35 100 62.74
SEX DIFFERENCES STRUGGLING LEARNERS 26
26
BRIEF:Organisation 801 14.63 3.23 6 18 801 60.22 10.02 33 73 17.48
BRIEF:Monitor 799 19.04 3.52 9 24 799 66.14 11.24 31 91 42.68
CPSF:Inattention 795 11.67 3.44 0 15 793 80.80 11.14 40 90 83.35
CPSF:Hyperactivity/Impulsivity 797 10.89 5.58 0 18 796 75 15.66 40 90 64.57
CPSF:Executive Function 794 10.19 3.62 0 15 793 74.75 12.46 40 90 69.74
CPSF:Aggression 794 3.56 3.99 0 15 793 64.65 17.53 44 91 37.33
CPSF:Peer Relations 788 5.52 4.46 0 15 787 73.46 17.53 44 90 60.1
Mental Health
RCADS:Generalised Anxiety 398 5.98 3.97 0 18 399 56.54 12.47 36 81 19.05
RCADS:Panic Disorder 396 3.91 4.12 0 27 397 57.44 13.64 40 81 23.93
RCADS:Social Phobia 400 12.44 6.34 0 27 401 59.55 14.18 29 81 26.18
RCADS:Separation Anxiety 402 6.86 5.05 0 21 403 59.45 14.94 36 81 28.29
RCADS:Obsessive‐Compulsive Disorder 399 3.01 3.09 0 15 400 53.74 11.16 41 81 11.25
RCADS:Major Depression 401 9.10 5.21 0 27 402 65.18 12.87 37 81 43.53
SDQ:Conduct Problems 797 3.51 2.53 0 10 45.09
SDQ:Prosocial Behaviour 797 6.81 2.38 0 10 41.49
SDQ:Peer Relationships Problem 797 3.43 2.62 0 10 45.22
SDQ:Hyperactivity/Inattention 796 7.64 2.43 0 10 60.12
Note. Descriptive statistics are based on raw scores (left) and standardized scores (right) to ease interpretability. For the cognitive tasks, lower raw,
standard and scaled scores indicate greater difficulties. However, RAN and SRT are speeded tasks in which higher raw values reflect a slower, and thereby,
poorer performance. For all behavioural and mental health tasks, higher raw scores and T‐scores reflect greater difficulties. The Prosocial Behaviour
Subscale of the SDQ is an exception; higher scores reflect greater strengths. The percentage of participants with scores within the abnormal or clinical levels
were calculated using the following criteria: T‐scores of 70 or above for all BRIEF, CPSF, RCADS subscales; raw scores equal or higher than 4 for SDQ Conduct

SEX DIFFERENCES STRUGGLING LEARNERS 27
27
problems and Peer relationships problems; raw scores equal or higher than 7 for SDQ Hyperactivity/Inattention; and raw scores equal or lower than 5 for
SDQ Prosocial behaviour. Following Instructions is an experimental task that is not age‐standardized. To control for age, raw scores were regressed on age
and residual scores were used. BRIEF = The Behaviour Rating Inventory of Executive Function; CPSF = Conners‐3 Parent Rating Scale Short Form; RCADS =
Revised Child and Anxiety and Depression Scale (Parent Version); SDQ = Strengths and Difficulties Questionnaire.

SEX DIFFERENCES STRUGGLING LEARNERS 28
28
Table 2
Descriptive Statistics for Boys and Girls on Cognitive, Behavioural and Mental Health Measures with Residual Scores
Group
Boys Girls Group Comparisons
Measures N M SD Min Max N M SD Min Max t p d
Cognition
Alliteration 539 0.07 2.26 ‐9.24 3.94 249 ‐0.16 2.17 ‐6.81 3.44 1.40 .16 ‐0.11
Rapid Naming 538 2.36 33.14 ‐163.69 83.33 248 ‐5.13 37.71 ‐221.02 50.59 2.69 .01* ‐0.22
Nonword Repetition 339 0.20 6.22 ‐18.21 12.78 142 ‐0.47 5.82 ‐15.46 11.79 1.13 .26 ‐0.11
Digit Recall 550 0.19 4.92 ‐16.70 17.93 251 ‐0.41 4.95 ‐18.99 15.77 1.59 .11 ‐0.12
Dot Matrix 547 0.35 4.89 ‐19.95 20.81 252 ‐0.76 4.41 ‐15.28 11.39 3.18 <.001*** ‐0.23
Backward Digit Recall 534 0.21 3.62 ‐11.09 14.56 246 ‐0.45 3.62 ‐12.18 10.16 2.33 .02* ‐0.18
MrX 544 0.55 4.35 ‐13.54 18.23 251 ‐1.19 4.28 ‐13.38 13.71 5.31 <.001*** ‐0.40
Following Instructions 516 0.07 3.84 ‐9.60 18.58 234 ‐0.16 3.16 ‐9.11 9.10 0.87 .38 ‐0.06
Delayed Recall 530 0.48 14.82 ‐39.08 36.50 245 ‐1.03 15.25 ‐47.49 34.58 1.30 .20 ‐0.10
Cancellation 525 0.10 3.28 ‐9.89 10.12 246 ‐0.21 3.47 ‐10.10 9.04 1.16 .25 ‐0.09
SRT 501 0.19 274.20 ‐1,373.14 465.06 238 ‐0.40 253.58 ‐1,047.39 451.09 0.03 .98 0
Vigil/Barking 514 0.01 2.37 ‐7.01 3.35 234 ‐0.03 2.45 ‐7.32 3.35 0.22 .82 ‐0.02
Matrix Reasoning 551 0.29 4.58 ‐14.24 13.00 253 ‐0.64 4.46 ‐12.24 14.56 2.73 .01* ‐0.21
Behaviour
BRIEF:Inhibit 548 0.77 6.01 ‐12.14 9.37 252 ‐1.68 6.11 ‐11.98 9.88 5.30 <.001*** ‐0.41
BRIEF:Shift 549 0.35 4.17 ‐9.22 7.32 252 ‐0.76 4.27 ‐9.27 7.37 3.43 <.001*** ‐0.26
BRIEF:Emotion Control 548 0.37 5.44 ‐12.23 7.91 252 ‐0.80 5.76 ‐12.13 7.90 2.70 .01* ‐0.21
BRIEF:Initiate 548 0.16 3.14 ‐10.29 6.74 252 ‐0.36 3.51 ‐8.92 6.36 2.02 .04* ‐0.16
BRIEF:WM 548 0.19 3.93 ‐14.72 4.51 252 ‐0.42 4.26 ‐14.63 4.65 1.94 .05 ‐0.15
BRIEF:Planning 539 0.55 4.80 ‐16.14 7.91 250 ‐1.19 5.07 ‐14.71 8.23 4.55 <.001*** ‐0.36

SEX DIFFERENCES STRUGGLING LEARNERS 29
29
BRIEF:Organisation 549 0.02 3.22 ‐9.01 3.63 252 ‐0.04 3.25 ‐8.99 3.62 0.22 .83 ‐0.02
BRIEF:Monitor 547 0.37 3.37 ‐10.08 5.40 252 ‐0.81 3.69 ‐9.95 5.39 4.33 <.001*** ‐0.34
CPSF:Inattention 544 0.31 3.20 ‐11.66 3.51 251 ‐0.67 3.83 ‐11.72 3.56 3.50 <.001*** ‐0.29
CPSF:Hyperactivity/Impulsivity 546 0.79 5.28 ‐11.78 8.71 251 ‐1.73 5.57 ‐11.68 10.58 6.03 <.001*** ‐0.47
CPSF:Executive Function 544 0.37 3.50 ‐10.64 5.27 250 ‐0.80 3.70 ‐11.00 5.27 4.17 <.001*** ‐0.33
CPSF: Aggression 544 0.29 4.04 ‐3.78 11.52 250 ‐0.63 3.80 ‐3.71 11.36 3.10 <.001*** ‐0.23
CPSF:Peer Relations 539 0.20 4.37 ‐7.73 9.92 249 ‐0.43 4.50 ‐7.04 10.51 1.83 .07 ‐0.14
Mental Health
RCADS:Generalised Anxiety 274 0.04 4.04 ‐6.34 12.18 124 ‐0.09 3.81 ‐6.55 10.11 0.29 .77 ‐0.03
RCADS:Panic Disorder 273 ‐0.11 3.99 ‐4.83 22.24 123 0.25 4.30 ‐4.95 18.86 ‐0.78 .43 0.09
RCADS:Social Phobia 276 ‐0.32 6.19 ‐14.13 14.62 124 0.71 6.39 ‐12.11 14.42 ‐1.51 .13 0.17
RCADS:Separation Anxiety 277 0.02 4.85 ‐7.99 13.41 125 ‐0.05 5.31 ‐7.62 13.04 0.14 .89 ‐0.02
RCADS:Obsessive‐Compulsive 275 0.06 3.10 ‐3.02 11.99 124 ‐0.14 3.05 ‐3.02 11.99 0.62 .54 ‐0.07
RCADS:Major Depression 276 0.16 5.17 ‐9.89 14.97 125 ‐0.34 4.89 ‐9.04 17.38 0.93 .35 ‐0.10
SDQ:Conduct Problems 546 0.19 2.51 ‐3.68 6.67 251 ‐0.41 2.54 ‐3.85 6.60 3.10 <.001*** ‐0.24
SDQ:Prosocial Behaviour 546 0.26 2.31 ‐3.37 6.98 251 ‐0.56 2.41 ‐3.60 5.98 4.52 <.001*** ‐0.35
SDQ:Peer Relationships Problem
546 0.09 2.55 ‐5.20 6.97 251 ‐0.19 2.63 ‐4.65 6.82 1.37 .17 ‐0.11
SDQ:Hyperactivity/Inattention 545 0.32 2.30 ‐7.59 3.12 251 ‐0.69 2.52 ‐7.84 2.93 5.37 <.001*** ‐0.42
Note. Descriptive statistics are based on age regressed residuals on raw scores. For the cognitive tasks, lower scores indicate greater difficulties. For all
behavioural and mental health tasks, higher ratings reflect greater difficulties. Residuals for Rapid Naming, Simple Reaction Time (SRT; TEA‐Ch2) and
Prosocial Behaviour (SDQ) were reverse coded to streamline the interpretation of respective cognitive and mental health measures. BRIEF = The Behaviour
Rating Inventory of Executive Function; CPSF = Conners‐3 Parent Rating Scale Short Form; RCADS = Revised Child and Anxiety and Depression Scale (Parent
Version); SDQ = Strengths and Difficulties Questionnaire.

SEX DIFFERENCES STRUGGLING LEARNERS 30
30
Figure 1
Confirmatory Factor Models for Cognitive (Top), Behavioural (Middle) and Mental Health (Bottom)
Dimensions
Note. For ease of interpretation, schematic representations are presented. Cognitive Dimensions: Executive = Executive Functions; Speed = Processing Speed; Phonological = Phonological Processing; DotMat = Dot Matrix; MrX = Mister X, Matrix = Matrix Reasoning; BackDR = Backward Digit Recall; Allit = Alliteration; SRT = Simple Reaction Time, RAN = Rapid Automatic Naming; CMS = Delayed Recall; Cancel = Cancellation; FI = Following Instructions; DigRec = Digit Recall; CNRep = Nonword Repetition. Behavioural Dimensions: WM = Working Memory; Plan = Planning; Exec = Executive Functions; Inatt = Inattention; Org = Organisation; Emo = Emotion Control; Shift = Shifting; Agg = Aggression; PeerRel = Peer Relations; Hyper = Hyperactivity/impulsivity; Inhibit = Inhibition. Mental Health Dimensions: GAD = Generalized Anxiety Disorder; Panic = Panic Disorder; SocPhob = Social Phobia; SepAnx = Separation Anxiety; OCD = Obsessive Compulsive Disorder; Dep = Depression; Conduct = Conduct Problems; ProSoc = Prosocial Behaviour; Hyper = Hyperactivity/inattention; PeerProb = Peer Relationship Problems.
SEX DIFFERENCES STRUGGLING LEARNERS 31
31
Figure 2
Multigroup Measurement Model of Cognitive Dimensions
Note. Standardized values are derived from the model that achieved partial scalar invariance across boys and girls. For ease of interpretation, only
intercepts that differed significantly across groups are shown. These intercepts were estimated freely across groups. Executive = Executive Functions; Speed
= Processing Speed; Phonological = Phonological Processing; DotMat = Dot Matrix; MrX = Mister X, Matrix = Matrix Reasoning; BackDR = Backward Digit
Recall; Allit = Alliteration; SRT = Simple Reaction Time, RAN = Rapid Automatic Naming; CMS = Delayed Recall; Cancel = Cancellation; FI = Following
Instructions; DigRec = Digit Recall; CNRep = Nonword Repetition.

SEX DIFFERENCES STRUGGLING LEARNERS 32
32
Figure 3
Multigroup Measurement Model of Behaviour Dimensions
Note. Standardized values are derived from the model that achieved partial scalar invariance across boys and girls. For ease of interpretation, only
intercepts that differed significantly across groups are shown. These intercepts were estimated freely across groups. Executive = Executive Functions; WM
= Working Memory; Plan = Planning; Exec = Executive Functions; Inatt = Inattention; Org = Organisation; Emo = Emotion Control; Shift = Shifting; Agg =
Aggression; Peer = Peer Relations; Hyper = Hyperactivity; Inhibit = Inhibition.

SEX DIFFERENCES STRUGGLING LEARNERS 33
33
Figure 4
Multigroup Measurement Model of Mental Health Dimensions
Note. Standardized values are derived from the model that achieved scalar invariance across boys and girls. For ease of interpretation, intercepts are not shown. GAD = Generalized Anxiety Disorder; Panic = Panic Disorder; SocAnx = Social Anxiety; SepAnx = Separation Anxiety; OCD = Obsessive Compulsive Disorder; Dep = Depression; Conduct = Conduct Problems; ProSoc = Prosocial Behaviour; Hyper = Hyperactivity/Inattention; Peer = Peer Relationship Problems.

SEX DIFFERENCES STRUGGLING LEARNERS 34
34
Figure 5
Mean Cognitive, Behavioural and Mental Health Factor Scores for Boys and Girls
Note. Factor scores were converted to Z scores for visualization. Error bars represent the standard error of the mean. Executive = Executive Functions;
Speed = Processing Speed; Phonological = Phonological Processing.