Embed Size (px)
Citation preview
JOURNAL OF COLLOID AND INTERFACE SCIENCE 185, 57–67 (1997)ARTICLE NO. CS964581
Shear-Thickening Response of Fumed Silica Suspensionsunder Steady and Oscillatory Shear
SRINIVASA R. RAGHAVAN AND SAAD A. KHAN1
Department of Chemical Engineering, North Carolina State University, Raleigh, North Carolina 27695-7905
Received March 14, 1996; accepted September 3, 1996
studies, used a combination of rheology with in situ lightSuspensions of fumed silica in polypropylene glycol exhibit diffraction to elucidate microstructural changes that occur
shear-thickening under steady shear and ‘‘strain-thickening’’ un- during shear-thickening (1, 2). He concluded that the incipi-der oscillatory shear. Strain-thickening refers to a sharp increase ence of shear-thickening at a critical shear rate g
h c corre-in the complex viscosity h* observed at critical combinations of
sponds to a transition from an easy flowing state where thestrain-amplitude and frequency. Two regimes of strain-thickeningparticles are ordered into layers to a disordered state wherebehavior have been found: The first occurs at high critical strainsthis ordering is absent. This mechanism is generally calledand low frequencies, whereas the second occurs at high criticalan order-disorder transition.frequencies and a constant lower strain. Strain-thickening in the
Subsequent researchers have questioned whether an order-first regime can be explicitly correlated with steady shear-thick-ening, using a modified version of the Cox–Merz rule. Accord- disorder transition indeed takes place in all shear-thickeningingly, strain-thickening data for the complex viscosity h* as a systems. Stokesian dynamics simulations have shown thatfunction of the maximum dynamic shear-rate g0v can be super- the shear-thickened state is characterized by clusters of parti-posed against shear-thickening data for the steady viscosity as a cles (5–8). The formation of these flow-induced clustersfunction of the steady shear rate. Such a correlation between the results in an increased dissipation of energy and, conse-two kinds of thickening phenomena has not been reported pre- quently, the viscosity increases. Thus, according to theseviously. The combination of shear- and strain-thickening behavior
researchers, shear-thickening is not related to the destructioncan be qualitatively explained using a clustering mechanism,of ordered layers but to the generation of particle clusters.which attributes the various phenomena to the formation of tem-It should be noted that under certain conditions both eventsporary, flow-induced clusters. The two regimes of strain-thick-may occur simultaneously (i.e., the disruption of the orderedening are a result of differences in the relative ease of clusterlayer structure can be caused by the clustering of particles).formation. q 1997 Academic Press
Key Words: shear-thickening; strain-thickening; suspensions; rhe- However, for the clustering theory to hold, it is not at allology; fumed silica. necessary to assume the existence of an ordered state before
the shear-thickening transition. Further evidence for the clus-tering hypothesis has been provided recently by the work ofBender and Wagner, through optical dichroism measure-
1. INTRODUCTION ments (9, 10).For a suspension to exhibit shear-thickening, two condi-
The shear-thickening behavior of concentrated dispersions tions must hold. Firstly, the volume fraction of solids in thehas been a major topic of interest for rheologists over the suspension must be very high; in addition, the suspensionlast two decades (1–4). The term shear-thickening is typi- must be nonflocculated (3, 4). The latter criterion requirescally used to refer to the increase in apparent viscosity when that the particles be either neutral or repel one another bythe applied shear rate is increased. The phenomenon is fre- virtue of electrostatic, steric, or entropic interactions (3).quently encountered during the processing of concentrated Many experimental studies of shear-thickening have beendispersions in various industries. performed on model suspensions of monodisperse spheres,
The onset of shear-thickening marks the point when hy- stabilized by steric or electrostatic means (e.g., 4, 11). Mostdrodynamic interactions begin to predominate in the system of the experimentation involved steady shear rheology.(3, 4). However, the microstructural basis for this phenome- Very few researchers have investigated the dynamic rheo-non still remains unresolved. Hoffman, in his pioneering logical properties of shear-thickening dispersions. The linear
viscoelastic response of such dispersions typically showssol-like behavior: the elastic (G*) and viscous (G9) moduli1 To whom correspondence should be addressed. E-mail: khan@che.
ncsu.edu. depend strongly on frequency, with G9 exceeding G* (12).
57 0021-9797/97 $25.00Copyright q 1997 by Academic Press
All rights of reproduction in any form reserved.
AID JCIS 4581 / 6g1a$$$721 12-18-96 01:41:23 coida
58 RAGHAVAN AND KHAN
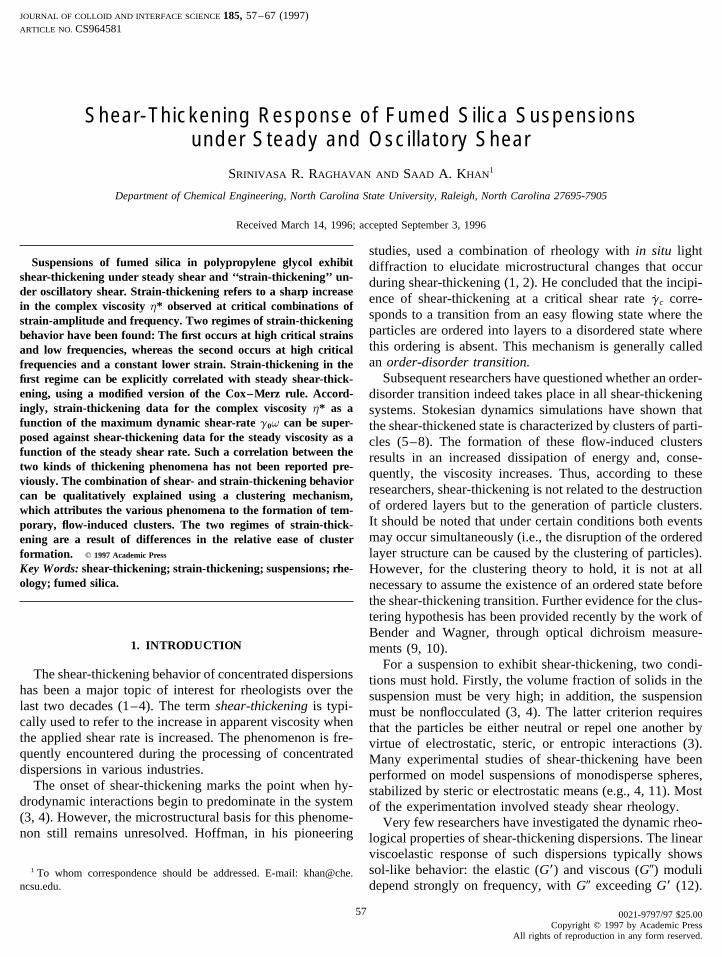
This is the expected response for such systems, as it reflects fractals), with a characteristic fractal dimension df equal to1.71 { 0.05 in three-dimensional space. This value for dfthe nonflocculated nature of the dispersions. However, the
viscoelastic response under nonlinear oscillatory conditions, corresponds to diffusion-limited aggregation of the primaryparticles in the latter stages of flame hydrolysis (16, 19).involving large strain amplitudes, shows some remarkable
features. It has been found that the moduli make an abrupt The continuous phase in our studies is a polypropyleneglycol having an average molecular weight of 725 (Aldrichtransition to higher levels when the strain amplitude and the
frequency of the deformation exceed certain values (12– Chemicals). The viscosity of the PPG liquid under ambientconditions was É1.2 poise. Each suspension was prepared14). This phenomenon has been variously termed strain-
thickening or flow-blocking. Independent observations of by adding the liquid to the silica in a blender and mixingfor approximately 1 minute (17). Samples were made inthis phenomenon have also been made on solutions of asso-
ciative polymers, although there is little published data for batches of 60 ml and placed under vacuum at room tempera-ture for about 12 h to remove air bubbles. The silica concen-the same.
In this study, we report the shear-thickening as well as tration in the suspension was varied between 3 and 10% (w/w basis).strain-thickening behavior of nonflocculated fumed silica
suspensions. Fumed silica is an amorphous, nonporous silica Rheological experiments were carried out on a Rheome-trics Mechanical Spectrometer (RMS-800). A cone-and-prepared by a flame hydrolysis process (15, 16). Its primary
structure consists of branched aggregates formed by the fu- plate fixture having a cone angle of 0.04 radians and a diame-ter of 50 mm was used. At the higher fumed silica concentra-sion of primary spherical particles of SiO2. As a result of
this complex aggregated structure, the silicas exhibit high tions, the results were checked on a different cone-and-platefixture having a cone angle of 0.1 radians and a diametersurface areas (ú100 m2/g). The surface chemistry of fumed
silica is hydrophilic due to the presence of hydroxyl groups of 25 mm. The use of two different fixtures ensured thatinstrumental artifacts, such as wall slip, were absent.on the surface. When dispersed in a nonpolar liquid, aggre-
gates of silica can interact through hydrogen bonding of Experiments were conducted under both steady as wellas dynamic oscillatory shear. The steady-shear rate sweepssurface hydroxyls. This gives rise to larger structures called
flocs, which can be further connected into a three-dimen- involved the measurement of the torque response at discreteshear rates in succession. At each shear rate, the sample wassional network. The formation of these structures leads to
large increases in viscosity and gel-like behavior (17). How- sheared for about 60 s before any data were collected. Stepshear experiments showed that this time was sufficient forever, if the liquid is polar, its molecules preferentially form
hydrogen bonds with the surface hydroxyls present on the the attainment of steady state. Dynamic experiments weremainly twofold: strain sweeps, where the frequency was heldsilica aggregates.
We have used a polar liquid, viz. poly(propylene glycol) fixed and the strain amplitude increased in discrete steps,and frequency sweeps performed at a constant strain, with(PPG) as the continuous phase in our study. The molecular
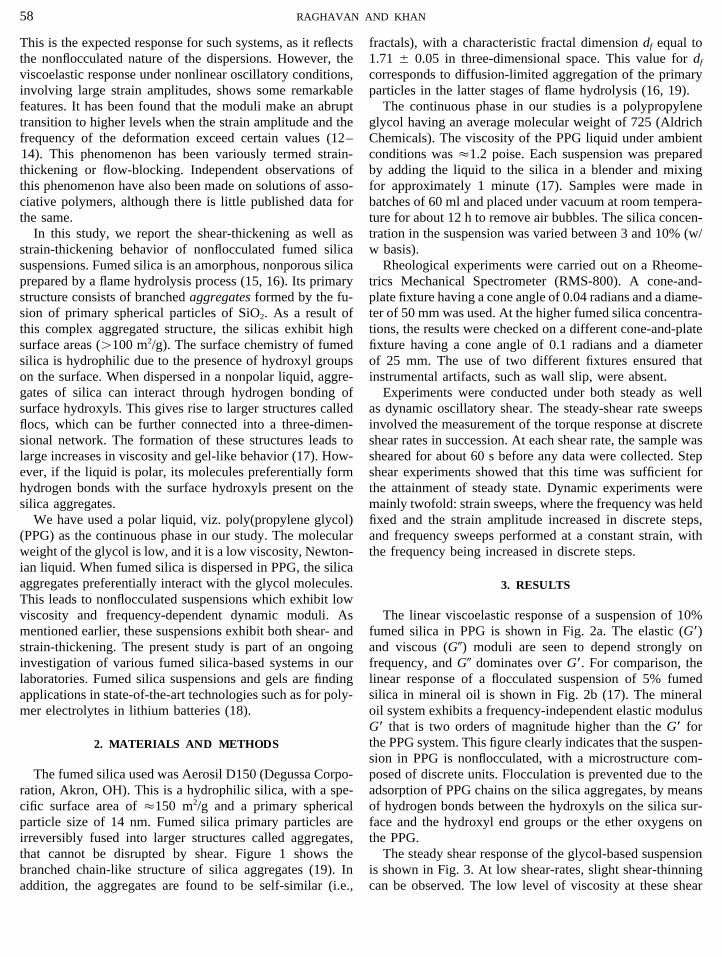
weight of the glycol is low, and it is a low viscosity, Newton- the frequency being increased in discrete steps.ian liquid. When fumed silica is dispersed in PPG, the silicaaggregates preferentially interact with the glycol molecules. 3. RESULTSThis leads to nonflocculated suspensions which exhibit lowviscosity and frequency-dependent dynamic moduli. As The linear viscoelastic response of a suspension of 10%
fumed silica in PPG is shown in Fig. 2a. The elastic (G*)mentioned earlier, these suspensions exhibit both shear- andstrain-thickening. The present study is part of an ongoing and viscous (G9) moduli are seen to depend strongly on
frequency, and G9 dominates over G*. For comparison, theinvestigation of various fumed silica-based systems in ourlaboratories. Fumed silica suspensions and gels are finding linear response of a flocculated suspension of 5% fumed
silica in mineral oil is shown in Fig. 2b (17). The mineralapplications in state-of-the-art technologies such as for poly-mer electrolytes in lithium batteries (18). oil system exhibits a frequency-independent elastic modulus
G* that is two orders of magnitude higher than the G* forthe PPG system. This figure clearly indicates that the suspen-2. MATERIALS AND METHODSsion in PPG is nonflocculated, with a microstructure com-posed of discrete units. Flocculation is prevented due to theThe fumed silica used was Aerosil D150 (Degussa Corpo-
ration, Akron, OH). This is a hydrophilic silica, with a spe- adsorption of PPG chains on the silica aggregates, by meansof hydrogen bonds between the hydroxyls on the silica sur-cific surface area of É150 m2/g and a primary spherical
particle size of 14 nm. Fumed silica primary particles are face and the hydroxyl end groups or the ether oxygens onthe PPG.irreversibly fused into larger structures called aggregates,
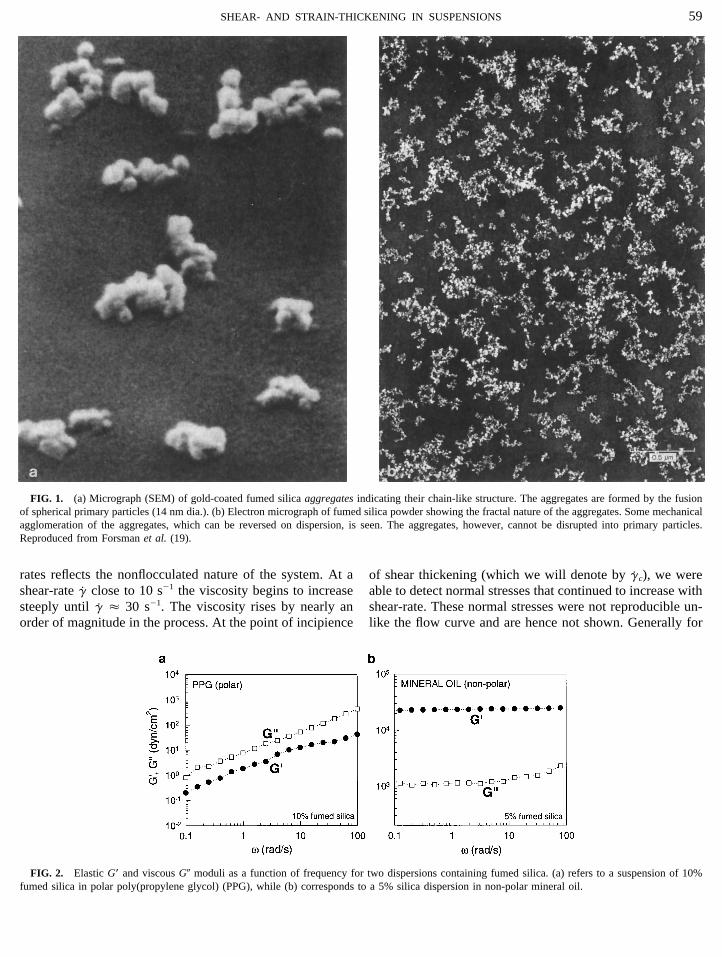
that cannot be disrupted by shear. Figure 1 shows the The steady shear response of the glycol-based suspensionis shown in Fig. 3. At low shear-rates, slight shear-thinningbranched chain-like structure of silica aggregates (19). In
addition, the aggregates are found to be self-similar (i.e., can be observed. The low level of viscosity at these shear
AID JCIS 4581 / 6g1a$$$722 12-18-96 01:41:23 coida
59SHEAR- AND STRAIN-THICKENING IN SUSPENSIONS
FIG. 1. (a) Micrograph (SEM) of gold-coated fumed silica aggregates indicating their chain-like structure. The aggregates are formed by the fusionof spherical primary particles (14 nm dia.). (b) Electron micrograph of fumed silica powder showing the fractal nature of the aggregates. Some mechanicalagglomeration of the aggregates, which can be reversed on dispersion, is seen. The aggregates, however, cannot be disrupted into primary particles.Reproduced from Forsman et al. (19).
rates reflects the nonflocculated nature of the system. At a of shear thickening (which we will denote by gh c), we were
shear-rate gh
close to 10 s01 the viscosity begins to increase able to detect normal stresses that continued to increase withshear-rate. These normal stresses were not reproducible un-steeply until g
hÉ 30 s01. The viscosity rises by nearly an
order of magnitude in the process. At the point of incipience like the flow curve and are hence not shown. Generally for
FIG. 2. Elastic G* and viscous G9 moduli as a function of frequency for two dispersions containing fumed silica. (a) refers to a suspension of 10%fumed silica in polar poly(propylene glycol) (PPG), while (b) corresponds to a 5% silica dispersion in non-polar mineral oil.
AID JCIS 4581 / 6g1a$$$722 12-18-96 01:41:23 coida
60 RAGHAVAN AND KHAN
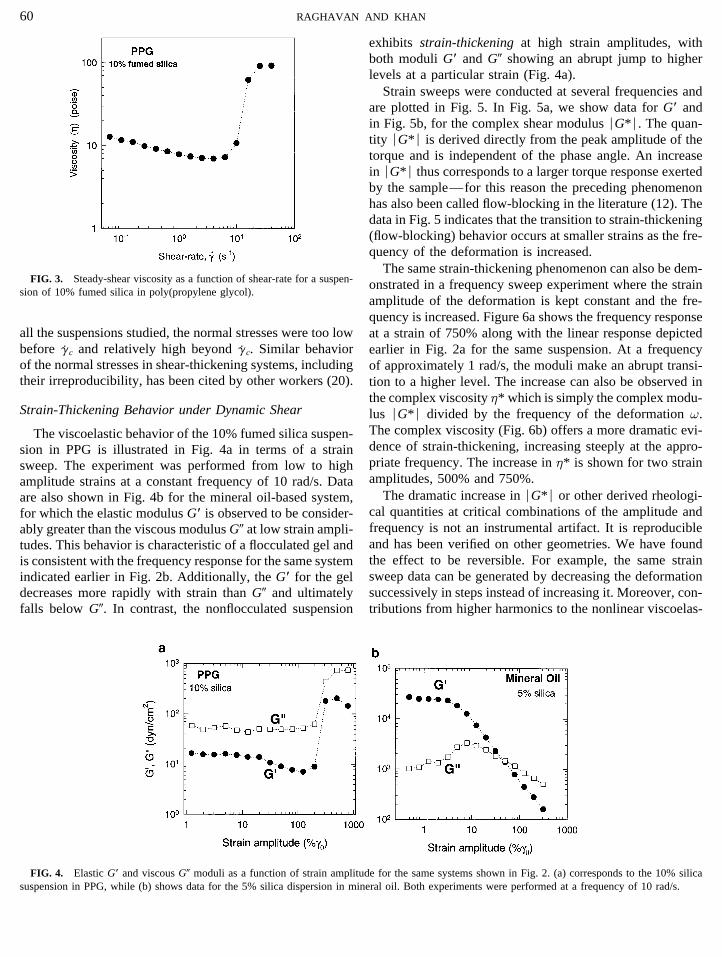
exhibits strain-thickening at high strain amplitudes, withboth moduli G* and G9 showing an abrupt jump to higherlevels at a particular strain (Fig. 4a).
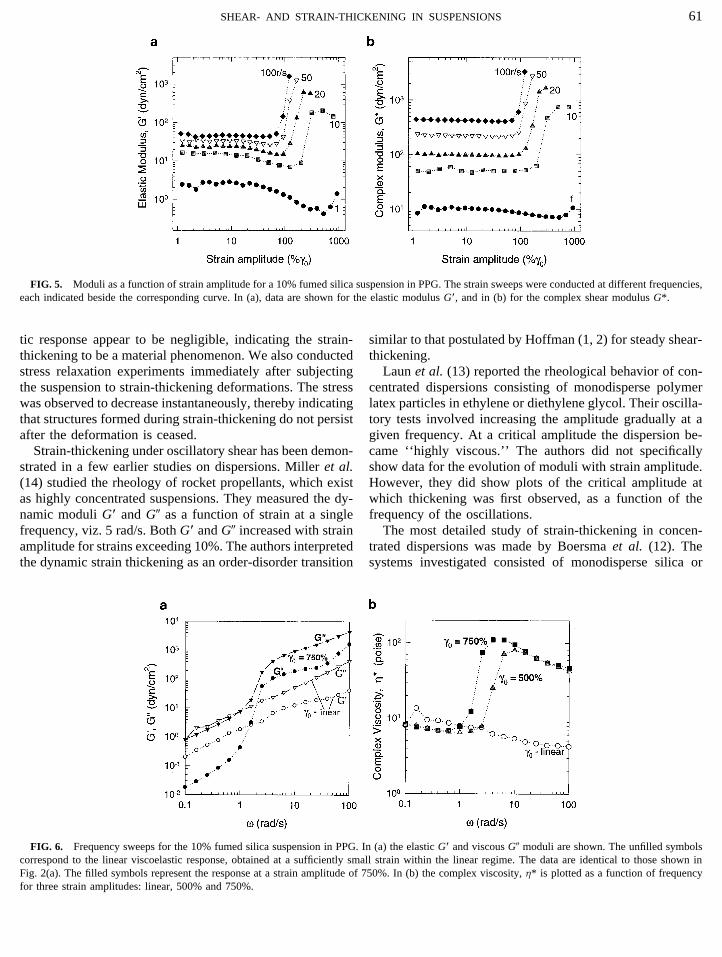
Strain sweeps were conducted at several frequencies andare plotted in Fig. 5. In Fig. 5a, we show data for G* andin Fig. 5b, for the complex shear modulus ÉG*É. The quan-tity ÉG*É is derived directly from the peak amplitude of thetorque and is independent of the phase angle. An increasein ÉG*É thus corresponds to a larger torque response exertedby the sample—for this reason the preceding phenomenonhas also been called flow-blocking in the literature (12). Thedata in Fig. 5 indicates that the transition to strain-thickening(flow-blocking) behavior occurs at smaller strains as the fre-quency of the deformation is increased.
The same strain-thickening phenomenon can also be dem-FIG. 3. Steady-shear viscosity as a function of shear-rate for a suspen- onstrated in a frequency sweep experiment where the strain
sion of 10% fumed silica in poly(propylene glycol).amplitude of the deformation is kept constant and the fre-quency is increased. Figure 6a shows the frequency response
all the suspensions studied, the normal stresses were too low at a strain of 750% along with the linear response depictedbefore g
h c and relatively high beyond gh c. Similar behavior earlier in Fig. 2a for the same suspension. At a frequency
of the normal stresses in shear-thickening systems, including of approximately 1 rad/s, the moduli make an abrupt transi-their irreproducibility, has been cited by other workers (20). tion to a higher level. The increase can also be observed in
the complex viscosity h* which is simply the complex modu-Strain-Thickening Behavior under Dynamic Shear lus ÉG*É divided by the frequency of the deformation v.
The complex viscosity (Fig. 6b) offers a more dramatic evi-The viscoelastic behavior of the 10% fumed silica suspen-dence of strain-thickening, increasing steeply at the appro-sion in PPG is illustrated in Fig. 4a in terms of a strainpriate frequency. The increase in h* is shown for two strainsweep. The experiment was performed from low to highamplitudes, 500% and 750%.amplitude strains at a constant frequency of 10 rad/s. Data
The dramatic increase in ÉG*É or other derived rheologi-are also shown in Fig. 4b for the mineral oil-based system,cal quantities at critical combinations of the amplitude andfor which the elastic modulus G* is observed to be consider-frequency is not an instrumental artifact. It is reproducibleably greater than the viscous modulus G9 at low strain ampli-and has been verified on other geometries. We have foundtudes. This behavior is characteristic of a flocculated gel andthe effect to be reversible. For example, the same strainis consistent with the frequency response for the same systemsweep data can be generated by decreasing the deformationindicated earlier in Fig. 2b. Additionally, the G* for the gelsuccessively in steps instead of increasing it. Moreover, con-decreases more rapidly with strain than G9 and ultimately
falls below G9. In contrast, the nonflocculated suspension tributions from higher harmonics to the nonlinear viscoelas-
FIG. 4. Elastic G* and viscous G9 moduli as a function of strain amplitude for the same systems shown in Fig. 2. (a) corresponds to the 10% silicasuspension in PPG, while (b) shows data for the 5% silica dispersion in mineral oil. Both experiments were performed at a frequency of 10 rad/s.
AID JCIS 4581 / 6g1a$$$722 12-18-96 01:41:23 coida
61SHEAR- AND STRAIN-THICKENING IN SUSPENSIONS
FIG. 5. Moduli as a function of strain amplitude for a 10% fumed silica suspension in PPG. The strain sweeps were conducted at different frequencies,each indicated beside the corresponding curve. In (a), data are shown for the elastic modulus G*, and in (b) for the complex shear modulus G*.
tic response appear to be negligible, indicating the strain- similar to that postulated by Hoffman (1, 2) for steady shear-thickening.thickening to be a material phenomenon. We also conducted
stress relaxation experiments immediately after subjecting Laun et al. (13) reported the rheological behavior of con-centrated dispersions consisting of monodisperse polymerthe suspension to strain-thickening deformations. The stress
was observed to decrease instantaneously, thereby indicating latex particles in ethylene or diethylene glycol. Their oscilla-tory tests involved increasing the amplitude gradually at athat structures formed during strain-thickening do not persist
after the deformation is ceased. given frequency. At a critical amplitude the dispersion be-came ‘‘highly viscous.’’ The authors did not specificallyStrain-thickening under oscillatory shear has been demon-
strated in a few earlier studies on dispersions. Miller et al. show data for the evolution of moduli with strain amplitude.However, they did show plots of the critical amplitude at(14) studied the rheology of rocket propellants, which exist
as highly concentrated suspensions. They measured the dy- which thickening was first observed, as a function of thefrequency of the oscillations.namic moduli G* and G9 as a function of strain at a single
frequency, viz. 5 rad/s. Both G* and G9 increased with strain The most detailed study of strain-thickening in concen-trated dispersions was made by Boersma et al. (12). Theamplitude for strains exceeding 10%. The authors interpreted
the dynamic strain thickening as an order-disorder transition systems investigated consisted of monodisperse silica or
FIG. 6. Frequency sweeps for the 10% fumed silica suspension in PPG. In (a) the elastic G* and viscous G9 moduli are shown. The unfilled symbolscorrespond to the linear viscoelastic response, obtained at a sufficiently small strain within the linear regime. The data are identical to those shown inFig. 2(a). The filled symbols represent the response at a strain amplitude of 750%. In (b) the complex viscosity, h* is plotted as a function of frequencyfor three strain amplitudes: linear, 500% and 750%.
AID JCIS 4581 / 6g1a$$$722 12-18-96 01:41:23 coida
62 RAGHAVAN AND KHAN
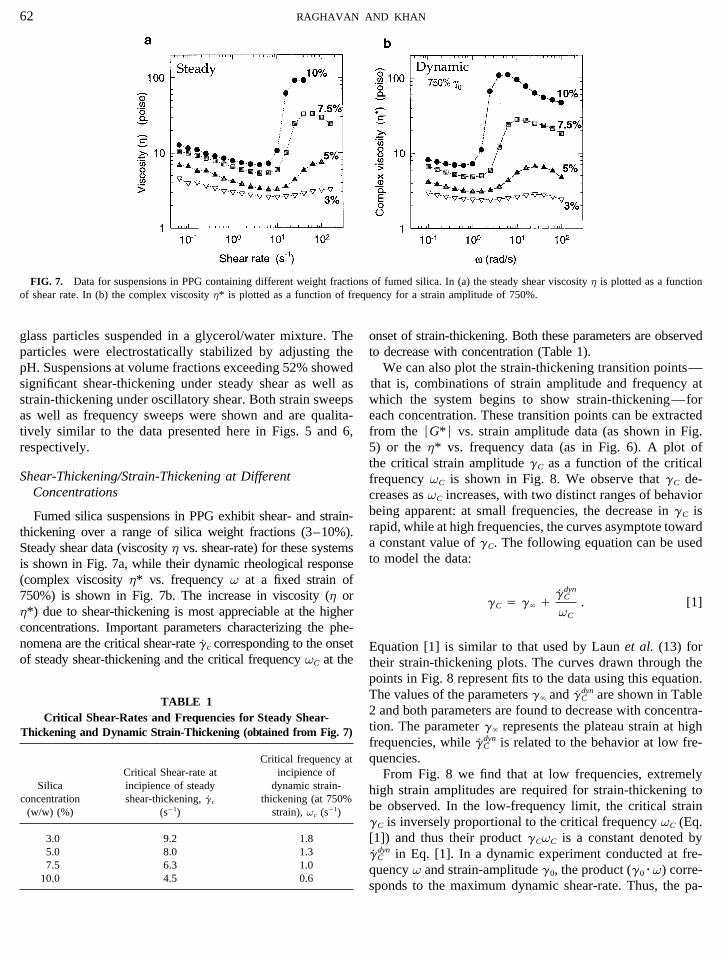
FIG. 7. Data for suspensions in PPG containing different weight fractions of fumed silica. In (a) the steady shear viscosity h is plotted as a functionof shear rate. In (b) the complex viscosity h* is plotted as a function of frequency for a strain amplitude of 750%.
glass particles suspended in a glycerol/water mixture. The onset of strain-thickening. Both these parameters are observedto decrease with concentration (Table 1).particles were electrostatically stabilized by adjusting the
pH. Suspensions at volume fractions exceeding 52% showed We can also plot the strain-thickening transition points—that is, combinations of strain amplitude and frequency atsignificant shear-thickening under steady shear as well as
strain-thickening under oscillatory shear. Both strain sweeps which the system begins to show strain-thickening—foreach concentration. These transition points can be extractedas well as frequency sweeps were shown and are qualita-
tively similar to the data presented here in Figs. 5 and 6, from the ÉG*É vs. strain amplitude data (as shown in Fig.5) or the h* vs. frequency data (as in Fig. 6). A plot ofrespectively.the critical strain amplitude gC as a function of the critical
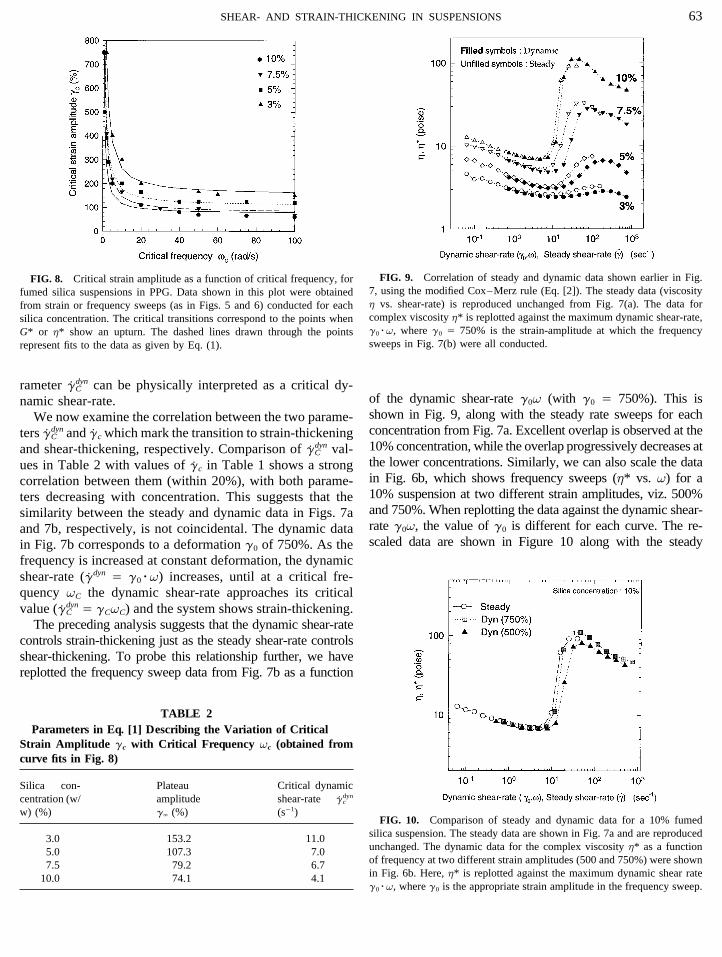
Shear-Thickening/Strain-Thickening at Different frequency vC is shown in Fig. 8. We observe that gC de-Concentrations creases as vC increases, with two distinct ranges of behavior
being apparent: at small frequencies, the decrease in gC isFumed silica suspensions in PPG exhibit shear- and strain-rapid, while at high frequencies, the curves asymptote towardthickening over a range of silica weight fractions (3–10%).a constant value of gC. The following equation can be usedSteady shear data (viscosity h vs. shear-rate) for these systemsto model the data:is shown in Fig. 7a, while their dynamic rheological response
(complex viscosity h* vs. frequency v at a fixed strain of750%) is shown in Fig. 7b. The increase in viscosity (h or gC Å g` /
gh
dynC
vC
. [1]h*) due to shear-thickening is most appreciable at the higherconcentrations. Important parameters characterizing the phe-nomena are the critical shear-rate g
h c corresponding to the onset Equation [1] is similar to that used by Laun et al. (13) forof steady shear-thickening and the critical frequency vC at the their strain-thickening plots. The curves drawn through the
points in Fig. 8 represent fits to the data using this equation.The values of the parameters g` and g
h
dynC are shown in Table
TABLE 12 and both parameters are found to decrease with concentra-
Critical Shear-Rates and Frequencies for Steady Shear-tion. The parameter g` represents the plateau strain at highThickening and Dynamic Strain-Thickening (obtained from Fig. 7)frequencies, while g
h
dynC is related to the behavior at low fre-
quencies.Critical frequency atCritical Shear-rate at incipience of From Fig. 8 we find that at low frequencies, extremely
Silica incipience of steady dynamic strain- high strain amplitudes are required for strain-thickening toconcentration shear-thickening, gh c thickening (at 750%
be observed. In the low-frequency limit, the critical strain(w/w) (%) (s01) strain), vc (s01)gC is inversely proportional to the critical frequency vC (Eq.[1]) and thus their product gCvC is a constant denoted by3.0 9.2 1.8
5.0 8.0 1.3 gh
dynC in Eq. [1]. In a dynamic experiment conducted at fre-
7.5 6.3 1.0 quency v and strain-amplitude g0, the product (g0rv) corre-10.0 4.5 0.6
sponds to the maximum dynamic shear-rate. Thus, the pa-
AID JCIS 4581 / 6g1a$$$723 12-18-96 01:41:23 coida
63SHEAR- AND STRAIN-THICKENING IN SUSPENSIONS
FIG. 9. Correlation of steady and dynamic data shown earlier in Fig.FIG. 8. Critical strain amplitude as a function of critical frequency, for7, using the modified Cox–Merz rule (Eq. [2]). The steady data (viscosityfumed silica suspensions in PPG. Data shown in this plot were obtainedh vs. shear-rate) is reproduced unchanged from Fig. 7(a). The data forfrom strain or frequency sweeps (as in Figs. 5 and 6) conducted for eachcomplex viscosity h* is replotted against the maximum dynamic shear-rate,silica concentration. The critical transitions correspond to the points wheng0rv, where g0 Å 750% is the strain-amplitude at which the frequencyG* or h* show an upturn. The dashed lines drawn through the pointssweeps in Fig. 7(b) were all conducted.represent fits to the data as given by Eq. (1).
rameter gh
dynC can be physically interpreted as a critical dy-
of the dynamic shear-rate g0v (with g0 Å 750%). This isnamic shear-rate.shown in Fig. 9, along with the steady rate sweeps for eachWe now examine the correlation between the two parame-concentration from Fig. 7a. Excellent overlap is observed at theters g
h
dynC and g
h c which mark the transition to strain-thickening10% concentration, while the overlap progressively decreases atand shear-thickening, respectively. Comparison of g
h
dynC val-
the lower concentrations. Similarly, we can also scale the dataues in Table 2 with values of gh c in Table 1 shows a strong
in Fig. 6b, which shows frequency sweeps (h* vs. v) for acorrelation between them (within 20%), with both parame-10% suspension at two different strain amplitudes, viz. 500%ters decreasing with concentration. This suggests that theand 750%. When replotting the data against the dynamic shear-similarity between the steady and dynamic data in Figs. 7arate g0v, the value of g0 is different for each curve. The re-and 7b, respectively, is not coincidental. The dynamic datascaled data are shown in Figure 10 along with the steadyin Fig. 7b corresponds to a deformation g0 of 750%. As the
frequency is increased at constant deformation, the dynamicshear-rate (g
h
dyn Å g0rv) increases, until at a critical fre-quency vC the dynamic shear-rate approaches its criticalvalue (g
h
dynC Å gCvC) and the system shows strain-thickening.
The preceding analysis suggests that the dynamic shear-ratecontrols strain-thickening just as the steady shear-rate controlsshear-thickening. To probe this relationship further, we havereplotted the frequency sweep data from Fig. 7b as a function
TABLE 2Parameters in Eq. [1] Describing the Variation of Critical
Strain Amplitude gc with Critical Frequency vc (obtained fromcurve fits in Fig. 8)
Critical dynamicSilica con- Plateaucentration (w/ amplitude shear-rate g
h
dync
w) (%) g` (%) (s01)FIG. 10. Comparison of steady and dynamic data for a 10% fumed
silica suspension. The steady data are shown in Fig. 7a and are reproduced3.0 153.2 11.0unchanged. The dynamic data for the complex viscosity h* as a function5.0 107.3 7.0of frequency at two different strain amplitudes (500 and 750%) were shown7.5 79.2 6.7in Fig. 6b. Here, h* is replotted against the maximum dynamic shear rate10.0 74.1 4.1g0rv, where g0 is the appropriate strain amplitude in the frequency sweep.
AID JCIS 4581 / 6g1a$$$723 12-18-96 01:41:23 coida
64 RAGHAVAN AND KHAN
rate sweep for the same system, and the overlap observed is tionship between steady and dynamic behavior. Our findingsthereby indicate a much broader applicability of the MCMreasonably good. We have thus found the following correlation
in our system, between the dynamic viscosities (obtained from rule, consistent with Krieger’s hypothesis.Krieger also predicts other interesting features in the rhe-a frequency sweep at a strain amplitude g0) and the steady
shear viscosities ology of systems that follow the MCM rule. He notes thatthe stress response of these systems, despite being highlynonlinear at the strains concerned, should nevertheless beh*(g0v) Å h(g
h)Ég
hÅg0v, [2]
sinusoidal (i.e., with negligible harmonic content) over theentire frequency regime. This is because the structure of thewhere g0v Å g
h
dyn (i.e., the maximum dynamic shear-rate).system would remain invariant throughout the cycle. Thisprediction is nicely borne out in our system, where the contri-4. DISCUSSIONbution of higher harmonics was found to be negligible. Weshould reiterate here that since the response is sinusoidal,Validity and Significance of the Viscosity Superpositionwe are indeed dealing with material properties rather thanRuleinstrumental artifacts.
The preceding correlation between steady and dynamic A correlation between steady and dynamic viscosities hasviscosities has been proposed earlier by Doraiswamy et al. never before been demonstrated for a shear-thickening dis-(21) for suspensions with a yield stress. The authors rigor- persion. We have shown here that such a correlation indeedously derived this relationship using a nonlinear rheological exists, as given by the modified Cox–Merz rule (Eq. [2]).model and experimentally demonstrated its applicability for We must emphasize that the predicted MCM rule is obeyedsuspensions of silicon spheres in low-density polyethylene. by shear-thickening suspensions only when the strain-ampli-They called it a modified Cox–Merz rule in view of its tude in the frequency sweep is very high (g0 § 500%).obvious resemblance to the well-known Cox–Merz rule for Under these conditions, the system assumes a degree ofpolymers which states that (22) structure consistent with the maximum shear rate during
each cycle, which is equal to g0v. Our suspensions do noth*(v) Å h(g
h)Ég
hÅv . [3] show conventional Cox–Merz behavior, since the complex
viscosity, h* in the linear viscoelastic region monotonicallydecreases with v (Fig. 6) and hence cannot be superposedKrieger (23) in a correspondence relating to the paper
by Doraiswamy, pointed out a few significant differences with the steady viscosity.Will the MCM rule be obeyed by other shear-thickeningbetween the two correlations. Firstly, the Cox–Merz rule
relates the linear viscoelastic response of the system under suspensions? We have reason to believe so, particularly forthe systems investigated by Laun et al. (13) and Boersmaoscillatory shear to the steady-shear properties. On the other
hand, the modified Cox–Merz relationship compares the et al. (12). Both have hinted at a correlation between thesteady shear-thickening and the strain-thickening behaviorinherently nonlinear behavior under oscillatory shear with
the steady shear properties. Thus the new rule is not exactly of their systems, although they did not experimentally dem-onstrate this relationship. From the data reported, it appearsan extension of the original rule, and the similarity in names
is rather misleading. Nevertheless, we propose that the modi- likely that the steady and complex viscosities of their suspen-sions can be made to superpose using the MCM rule.fied Cox–Merz (or MCM) appellation be retained since it
suggests a correspondence, albeit of a different kind, be-tween steady and dynamic data. ‘Clustering’ Mechanism for Shear-Thickening/Strain-
A second point made by Krieger (23) concerns the appli- Thickeningcability of the MCM rule. He suggested that the precedingcorrelation should apply to any system whose structural re- The preceding correlation between shear-thickening
(steady) and strain-thickening (dynamic) show that the twocovery time is longer than the period of oscillation. Thiscomment assumes particular significance in the light of our phenomena are closely related in terms of their underlying
mechanism. As mentioned in the introduction, there are twostudy. As mentioned earlier, the MCM rule was originallyderived by Doraiswamy et al. for suspensions exhibiting a microstructural models that have been offered to explain
shear-thickening. These are the order-disorder transitionyield stress. The mathematical formulation of the nonlinearmodel used by Doraiswamy requires the suspension to be- (ODT) theory and the cluster-formation theory (clustering
for short). There is increasing indication that clustering is ahave as a Hookean elastic solid below the yield stress sy
and as a Herschel–Bulkley fluid beyond sy. In our case, the more accurate and generalized model, with the ODT beinga possible concomitant effect in many cases (5–9).suspensions do not possess a yield stress, and the mathemati-
cal model used by Doraiswamy is clearly inapplicable. Nev- We believe that our results offer evidence in support ofthe clustering theory. We will, however, discuss first theertheless, our shear-thickening systems obey the same rela-
AID JCIS 4581 / 6g1a$$$723 12-18-96 01:41:23 coida
65SHEAR- AND STRAIN-THICKENING IN SUSPENSIONS
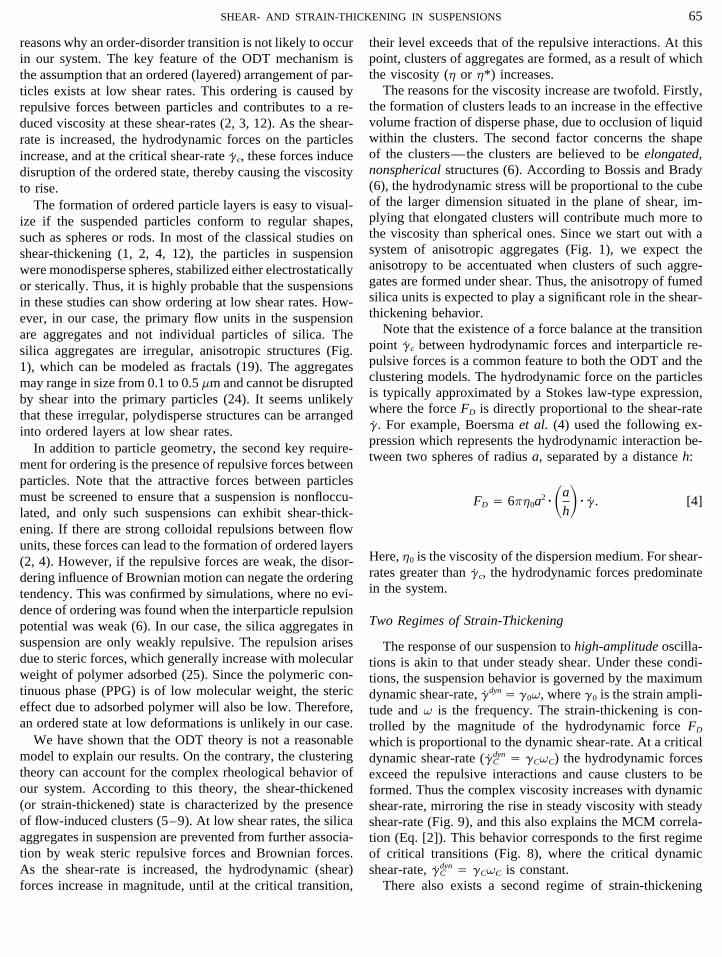
reasons why an order-disorder transition is not likely to occur their level exceeds that of the repulsive interactions. At thispoint, clusters of aggregates are formed, as a result of whichin our system. The key feature of the ODT mechanism isthe viscosity (h or h*) increases.the assumption that an ordered (layered) arrangement of par-
The reasons for the viscosity increase are twofold. Firstly,ticles exists at low shear rates. This ordering is caused bythe formation of clusters leads to an increase in the effectiverepulsive forces between particles and contributes to a re-volume fraction of disperse phase, due to occlusion of liquidduced viscosity at these shear-rates (2, 3, 12). As the shear-within the clusters. The second factor concerns the shaperate is increased, the hydrodynamic forces on the particlesof the clusters—the clusters are believed to be elongated,increase, and at the critical shear-rate g
h c, these forces inducenonspherical structures (6). According to Bossis and Bradydisruption of the ordered state, thereby causing the viscosity(6), the hydrodynamic stress will be proportional to the cubeto rise.of the larger dimension situated in the plane of shear, im-The formation of ordered particle layers is easy to visual-plying that elongated clusters will contribute much more toize if the suspended particles conform to regular shapes,the viscosity than spherical ones. Since we start out with asuch as spheres or rods. In most of the classical studies onsystem of anisotropic aggregates (Fig. 1), we expect theshear-thickening (1, 2, 4, 12), the particles in suspensionanisotropy to be accentuated when clusters of such aggre-were monodisperse spheres, stabilized either electrostaticallygates are formed under shear. Thus, the anisotropy of fumedor sterically. Thus, it is highly probable that the suspensionssilica units is expected to play a significant role in the shear-in these studies can show ordering at low shear rates. How-thickening behavior.ever, in our case, the primary flow units in the suspension
Note that the existence of a force balance at the transitionare aggregates and not individual particles of silica. Thepoint g
h c between hydrodynamic forces and interparticle re-silica aggregates are irregular, anisotropic structures (Fig.pulsive forces is a common feature to both the ODT and the1), which can be modeled as fractals (19). The aggregatesclustering models. The hydrodynamic force on the particlesmay range in size from 0.1 to 0.5 mm and cannot be disruptedis typically approximated by a Stokes law-type expression,by shear into the primary particles (24). It seems unlikelywhere the force FD is directly proportional to the shear-ratethat these irregular, polydisperse structures can be arrangedgh. For example, Boersma et al. (4) used the following ex-into ordered layers at low shear rates.
pression which represents the hydrodynamic interaction be-In addition to particle geometry, the second key require-
tween two spheres of radius a, separated by a distance h:ment for ordering is the presence of repulsive forces betweenparticles. Note that the attractive forces between particlesmust be screened to ensure that a suspension is nonfloccu- FD Å 6ph0a
2rSa
hDrgh . [4]lated, and only such suspensions can exhibit shear-thick-ening. If there are strong colloidal repulsions between flowunits, these forces can lead to the formation of ordered layers
Here, h0 is the viscosity of the dispersion medium. For shear-(2, 4). However, if the repulsive forces are weak, the disor-rates greater than g
h c, the hydrodynamic forces predominatedering influence of Brownian motion can negate the orderingin the system.tendency. This was confirmed by simulations, where no evi-
dence of ordering was found when the interparticle repulsionTwo Regimes of Strain-Thickeningpotential was weak (6). In our case, the silica aggregates in
suspension are only weakly repulsive. The repulsion arises The response of our suspension to high-amplitude oscilla-due to steric forces, which generally increase with molecular tions is akin to that under steady shear. Under these condi-weight of polymer adsorbed (25). Since the polymeric con- tions, the suspension behavior is governed by the maximumtinuous phase (PPG) is of low molecular weight, the steric dynamic shear-rate, g
h
dyn Å g0v, where g0 is the strain ampli-effect due to adsorbed polymer will also be low. Therefore, tude and v is the frequency. The strain-thickening is con-an ordered state at low deformations is unlikely in our case. trolled by the magnitude of the hydrodynamic force FD
We have shown that the ODT theory is not a reasonable which is proportional to the dynamic shear-rate. At a criticalmodel to explain our results. On the contrary, the clustering dynamic shear-rate (g
h
dynC Å gCvC) the hydrodynamic forces
theory can account for the complex rheological behavior of exceed the repulsive interactions and cause clusters to beour system. According to this theory, the shear-thickened formed. Thus the complex viscosity increases with dynamic(or strain-thickened) state is characterized by the presence shear-rate, mirroring the rise in steady viscosity with steadyof flow-induced clusters (5–9). At low shear rates, the silica shear-rate (Fig. 9), and this also explains the MCM correla-aggregates in suspension are prevented from further associa- tion (Eq. [2]). This behavior corresponds to the first regimetion by weak steric repulsive forces and Brownian forces. of critical transitions (Fig. 8), where the critical dynamicAs the shear-rate is increased, the hydrodynamic (shear) shear-rate, g
h
dynC Å gCvC is constant.
There also exists a second regime of strain-thickeningforces increase in magnitude, until at the critical transition,
AID JCIS 4581 / 6g1a$$$723 12-18-96 01:41:23 coida
66 RAGHAVAN AND KHAN
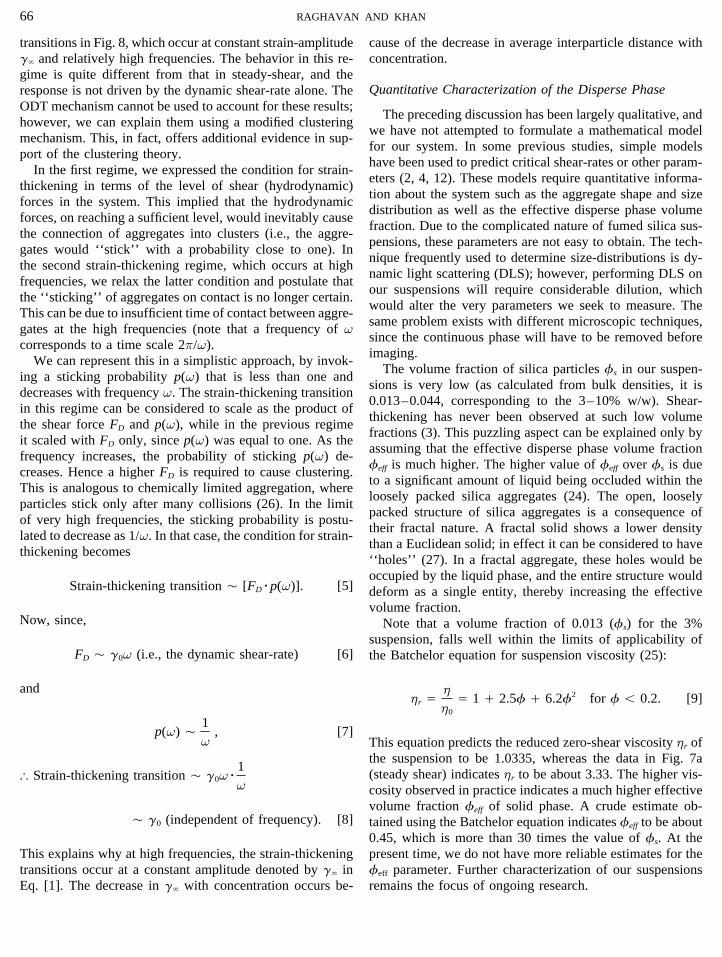
transitions in Fig. 8, which occur at constant strain-amplitude cause of the decrease in average interparticle distance withconcentration.g` and relatively high frequencies. The behavior in this re-
gime is quite different from that in steady-shear, and theQuantitative Characterization of the Disperse Phaseresponse is not driven by the dynamic shear-rate alone. The
ODT mechanism cannot be used to account for these results;The preceding discussion has been largely qualitative, and
however, we can explain them using a modified clusteringwe have not attempted to formulate a mathematical model
mechanism. This, in fact, offers additional evidence in sup-for our system. In some previous studies, simple models
port of the clustering theory.have been used to predict critical shear-rates or other param-
In the first regime, we expressed the condition for strain-eters (2, 4, 12). These models require quantitative informa-
thickening in terms of the level of shear (hydrodynamic)tion about the system such as the aggregate shape and size
forces in the system. This implied that the hydrodynamicdistribution as well as the effective disperse phase volume
forces, on reaching a sufficient level, would inevitably causefraction. Due to the complicated nature of fumed silica sus-
the connection of aggregates into clusters (i.e., the aggre-pensions, these parameters are not easy to obtain. The tech-
gates would ‘‘stick’’ with a probability close to one). Innique frequently used to determine size-distributions is dy-
the second strain-thickening regime, which occurs at highnamic light scattering (DLS); however, performing DLS on
frequencies, we relax the latter condition and postulate thatour suspensions will require considerable dilution, which
the ‘‘sticking’’ of aggregates on contact is no longer certain.would alter the very parameters we seek to measure. The
This can be due to insufficient time of contact between aggre-same problem exists with different microscopic techniques,
gates at the high frequencies (note that a frequency of vsince the continuous phase will have to be removed before
corresponds to a time scale 2p/v).imaging.
We can represent this in a simplistic approach, by invok-The volume fraction of silica particles fs in our suspen-
ing a sticking probability p(v) that is less than one andsions is very low (as calculated from bulk densities, it is
decreases with frequency v. The strain-thickening transition0.013–0.044, corresponding to the 3–10% w/w). Shear-
in this regime can be considered to scale as the product ofthickening has never been observed at such low volume
the shear force FD and p(v), while in the previous regimefractions (3). This puzzling aspect can be explained only by
it scaled with FD only, since p(v) was equal to one. As theassuming that the effective disperse phase volume fraction
frequency increases, the probability of sticking p(v) de-feff is much higher. The higher value of feff over fs is due
creases. Hence a higher FD is required to cause clustering.to a significant amount of liquid being occluded within the
This is analogous to chemically limited aggregation, whereloosely packed silica aggregates (24). The open, loosely
particles stick only after many collisions (26). In the limitpacked structure of silica aggregates is a consequence of
of very high frequencies, the sticking probability is postu-their fractal nature. A fractal solid shows a lower density
lated to decrease as 1/v. In that case, the condition for strain-than a Euclidean solid; in effect it can be considered to have
thickening becomes‘‘holes’’ (27). In a fractal aggregate, these holes would beoccupied by the liquid phase, and the entire structure would
Strain-thickening transition Ç [FDrp(v)]. [5] deform as a single entity, thereby increasing the effectivevolume fraction.
Now, since, Note that a volume fraction of 0.013 (fs) for the 3%suspension, falls well within the limits of applicability of
FD Ç g0v (i.e., the dynamic shear-rate) [6] the Batchelor equation for suspension viscosity (25):
andhr Å
h
h0
Å 1 / 2.5f / 6.2f2 for f õ 0.2. [9]
p(v) Ç 1v
, [7]This equation predicts the reduced zero-shear viscosity hr ofthe suspension to be 1.0335, whereas the data in Fig. 7a(steady shear) indicates hr to be about 3.33. The higher vis-[ Strain-thickening transition Ç g0vr
1v cosity observed in practice indicates a much higher effective
volume fraction feff of solid phase. A crude estimate ob-Ç g0 (independent of frequency). [8] tained using the Batchelor equation indicates feff to be about
0.45, which is more than 30 times the value of fs. At thepresent time, we do not have more reliable estimates for theThis explains why at high frequencies, the strain-thickening
transitions occur at a constant amplitude denoted by g` in feff parameter. Further characterization of our suspensionsremains the focus of ongoing research.Eq. [1]. The decrease in g` with concentration occurs be-
AID JCIS 4581 / 6g1a$$$723 12-18-96 01:41:23 coida
67SHEAR- AND STRAIN-THICKENING IN SUSPENSIONS
5. CONCLUSIONS ACKNOWLEDGMENTS
The authors gratefully acknowledge the support of the Department ofFumed silica suspensions in low molecular weight poly-Energy, Office of Basic Energy Sciences and NACE International for con-propylene glycol exhibit shear-thickening under steady flowducting this work.
and strain-thickening under oscillatory shear. Strain-thick-ening refers to the abrupt increase in the complex modulus
REFERENCESG* (or equivalently the complex viscosity h*) and occurs atcritical combinations of amplitude gC and frequency vC.
1. Hoffman, R. L., Trans. Soc. Rheol. 16, 155 (1972).Strain-thickening at high strain amplitudes is qualitatively2. Hoffman, R. L., J. Colloid Interface Sci. 46, 491 (1974).
similar to steady shear-thickening. Data for the complex 3. Barnes, H. A., J. Rheol. 33, 329 (1989).viscosity plotted as a function of dynamic shear rate g0v 4. Boersma, W. H., Laven, J., and Stein, H. N., AIChE J. 36, 321 (1990).
5. Boersma, W. H., Laven, J., and Stein, H. N., J. Rheol. 39, 841 (1995).can be superposed with viscosity—shear-rate data obtained6. Bossis, G., and Brady, J. F., J. Chem. Phys. 91, 1866 (1989).under steady shear. The preceding correlation is a modified7. Brady, J. F., and Bossis, G., J. Fluid Mech. 155, 105 (1985).form of the Cox–Merz rule and has been found to be obeyed8. Bossis, G., Grasselli, Y., Lemaire, E., Meunier, A., Brady, J. F., and
by Bingham plastic-like materials as well. At high frequen- Phung, T., Physica Scripta T49, 89 (1993).cies, transitions to strain-thickening behavior occur at a rela- 9. Bender, J. W., and Wagner, N. J., J. Colloid Interface Sci. 172, 171
(1995).tively constant strain amplitude g`, which is independent of10. Bender, J. W., Ph.D. thesis, Univ. of Delaware, 1995.frequency.11. Collins, E. A., Hoffman, D. J., and Soni, P. L., J. Colloid Interface Sci.The combination of shear- and strain-thickening behav-
71, 21 (1979).ior can be explained through a clustering mechanism, 12. Boersma, W. H., Laven, J., and Stein, H. N., J. Colloid Interface Sci.which attributes the thickening phenomena to the presence 149, 10 (1992).
13. Laun, H. M., Bung, R., and Schmidt, F., J. Rheol. 35, 999 (1991).of temporary, flow-induced clusters. These clusters are14. Miller, R. R., Lee, E., and Powell, R. L., J. Rheol. 35, 901 (1991).generated by the action of hydrodynamic forces on the15. Degussa Technical Bulletin No. 23, Degussa Corp., 1989.silica aggregates. Under steady shear or under oscillatory16. Cab-o-sil Fumed Silica: Properties and Functions, Cabot Corp., 1987.
shear at high amplitudes the connection of aggregates into 17. Khan, S. A., and Zoeller, N. J., J. Rheol. 37, 1225 (1993).clusters readily occurs. In the high-frequency limit of 18. Khan, S. A., Baker, G. L., and Colson, S., Chem. Mater. 6, 2359 (1994).
19. Forsman, J., Harrison, J. P., and Rutenberg, A., Can. J. Phys. 65, 767strain-thickening, the aggregates do not ‘‘stick’’ readily(1987).to form clusters. These qualitative arguments can be used
20. D’Haene, P. D., Mewis, J., and Fuller, G. G., J. Colloid Interface Sci.to explain our results.156, 350 (1993).
It is likely that every system that exhibits shear-thickening 21. Doraiswamy, D., Mujumdar, A. N., Tsao, I., Beris, A. N., Danforth,under steady shear would also show strain-thickening under S. C., and Metzner, A. B., J. Rheol. 35, 647 (1991).
22. Cox, W. P., and Merz, E. H., J. Polym. Sci. 28, 619 (1958).oscillatory shear. The two phenomena have been simultane-23. Krieger, I. M., J. Rheol. 36, 215 (1992).ously observed in a variety of systems. Moreover, it should24. Eisenlauer, J., and Killman, E., J. Colloid Interface Sci. 74, 108 (1980).be possible to explicitly correlate the two kinds of behavior,25. Russel, W. B., Saville, D. A., and Schowalter, W. R., ‘‘Colloidal Dis-
using the modified Cox–Merz rule. Our results also lend persions,’’ Cambridge University Press, Cambridge, 1989.further support to the clustering theory for shear-thickening 26. Rouw, W. P., and de Kruif, C. G., Phys. Rev. A 39, 5399 (1989).
27. Feder, J., ‘‘Fractals.’’ Plenum Press, New York, 1988.in suspensions.
AID JCIS 4581 / 6g1a$$$724 12-18-96 01:41:23 coida


