Embed Size (px)
Citation preview

Am. J. Hum. Genet. 67:901–925, 2000
901
Short Tandem-Repeat Polymorphism/Alu Haplotype Variation at the PLATLocus: Implications for Modern Human OriginsS. A. Tishkoff,1,* A. J. Pakstis,2 M. Stoneking,3 J. R. Kidd,2 G. Destro-Bisol,4 A. Sanjantila,5R.-b. Lu,6 A. S. Deinard,7 G. Sirugo,8 T. Jenkins,9 K. K. Kidd,2 and A. G. Clark1
1Institute of Molecular Evolutionary Genetics, Department of Biology, Pennsylvania State University, University Park; 2Department ofGenetics, School of Medicine, Yale University, New Haven; 3Max Planck Institute for Evolutionary Anthropology, Leipzig; 4Department ofAnimal and Human Biology, University “La Sapienza” Rome; 5Department of Forensic Medicine, University of Helsinki, Helsinki;6Department of Psychiatry, Tri-Service General Hospital, National Defense Medical Center, Taipei, Taiwan; 7Department of Anthropology,University of California at Davis, Davis; 8Human Molecular Genetics Laboratory, Medical Research Council, Fajara, The Gambia; and9Department of Human Genetics, School of Pathology, The South African Institute for Medical Research, University of the Witwatersrand,Johannesburg
Two dinucleotide short tandem-repeat polymorphisms (STRPs) and a polymorphic Alu element spanning a 22-kbregion of the PLAT locus on chromosome 8p12-q11.2 were typed in 1,287–1,420 individuals originating from 30geographically diverse human populations, as well as in 29 great apes. These data were analyzed as haplotypesconsisting of each of the dinucleotide repeats and the flanking Alu insertion/deletion polymorphism. The globalpattern of STRP/Alu haplotype variation and linkage disequilibrium (LD) is informative for the reconstruction ofhuman evolutionary history. Sub-Saharan African populations have high levels of haplotype diversity within andbetween populations, relative to non-Africans, and have highly divergent patterns of LD. Non-African populationshave both a subset of the haplotype diversity present in Africa and a distinct pattern of LD. The pattern of haplotypevariation and LD observed at the PLAT locus suggests a recent common ancestry of non-African populations, froma small population originating in eastern Africa. These data indicate that, throughout much of modern humanhistory, sub-Saharan Africa has maintained both a large effective population size and a high level of populationsubstructure. Additionally, Papua New Guinean and Micronesian populations have rare haplotypes observed oth-erwise only in African populations, suggesting ancient gene flow from Africa into Papua New Guinea, as well asgene flow between Melanesian and Micronesian populations.
Introduction
Haplotypic variation consisting of both fast-evolvingshort tandem-repeat polymorphisms (STRPs) and moreslowly evolving markers such as restriction-fragment-length polymorphisms (RFLPs), single-nucleotide poly-morphisms (SNPs), and insertion/deletion polymor-phisms (indels) have proved to be useful for both thetracing of population migrations and determining whenmutation events occurred (Tishkoff et al. 1996a, 1998a,1998b; Kidd et al. 1998). STRPs have moderate to highmutation rates (usually 1025–1022/generation [Weberand Wong 1993; Tautz and Schlotterer 1994; Chakra-borty et al. 1997; Brinkmann et al. 1998]) and are
Received March 13, 2000; accepted for publication July 18, 2000;electronically published September 14, 2000.
Address for correspondence and reprints: Dr. Sarah A. Tishkoff,University of Maryland, Department of Biology, Biology/PsychologyBuilding, #144, University of Maryland, College Park, MD 20742. E-mail: [email protected]
∗ Present affiliation: Department of Biology, University of Mary-land, College Park.
q 2000 by The American Society of Human Genetics. All rights reserved.0002-9297/2000/6704-0014$02.00
thought to mutate via the “stepwise” gain or loss ofsingle-repeat units, although larger “jumps” in repeatsize occasionally do occur (Shriver et al. 1993; Valdeset al. 1993; Di Rienzo et al. 1994; Tishkoff et al. 1998a).The instability of STRPs results in the formation of manyalleles, and stable flanking markers allow greater cer-tainty in tracing the lineage of each haplotype and indetermining the identity by descent of haplotype line-ages. Scoring these markers as haplotypes allows anal-ysis both in terms of haplotype frequencies and identityand in terms of linkage disequilibria. Thus, in additionto differing in the frequency of alleles at the individualpolymorphic sites, populations may differ in the partic-ular combination of alleles on a chromosome, and ashared pattern of linkage disequilibrium (LD) may beinformative for determination of recent common ances-try and for reconstruction of historic migration events(Tishkoff et al. 1996a, 1998a, 1998b; Kidd et al. 1998,2000). In addition, if one knows or can estimate themutation rate of an STRP, as well as the recombinationrate between the STRP and a stable allele marker, itbecomes possible to estimate the age of the stable SNPor indel marker. Such an analysis has been applied tothe CD4 gene, as well as to a number of mutations

902 Am. J. Hum. Genet. 67:901–925, 2000
Figure 1 Diagram of PLAT gene structure, showing location of the polymorphic PLAT Alu and the (CA)n-1 and (CA)n-2 STRPs used inthe haplotype analysis. Exons are shown as blackened boxes.
resulting in disease and disease resistance (Serre et al.1990; Hastbacka et al. 1992; Risch et al. 1995; Ber-tranpetit and Calafell 1996; Tishkoff et al. 1996a,1998b; Rannala and Slatkin 1998; Stephens et al. 1998).
We have examined the global frequency distributionof two dinucleotide STRPs and an Alu-insertion poly-morphism encompassing a 22-kb region within the tis-sue-plasminogen–activator locus (PLAT) located on theshort arm of chromosome 8 (8p12-q11.2; see fig. 1)(Degen et al. 1986). The polymorphic Alu element (of-ten referred to as “TPA Alu”) is located within intron8 of the PLAT gene (GenBank sequence position 28804[accession number K03021; see the NCBI GenBankOverview Web site]; see fig. 1) and is a member of thehuman-specific (HS) (also known as “PV”) subfamilyof Alu elements that recently have retroposed within thehuman genome (Batzer et al. 1991, 1996). It has beenhypothesized that the presence of the Alu-insertion al-lele, herein denoted “Alu(1),” at PLAT may predict riskfor coronary thrombosis. However, two recent studies(Ridker et al. 1997; Steeds et al. 1998) have observedno significant difference in the frequency of the Alu(1)allele in individuals at high risk for myocardial infarc-tion, compared with that in healthy control cases, sug-gesting that the indel is not a major independent riskfactor for coronary thrombosis.
Alu insertions are useful for the study of human ev-olution because they are unique, stable mutation eventsand because the ancestral state is known to be the ab-sence of the Alu element, herein denoted “Alu(2)”(Perna et al. 1992; Batzer et al. 1994, 1996; Tishkoffet al. 1996b; Sherry et al. 1997; Stoneking et al. 1997).We have examined haplotypes involving the PLAT Aluand the two closely linked STRPs in 1,225–1,375 in-dividuals originating from 30 geographically diverse hu-man populations (fig. 2). The patterns of haplotype var-iation and LD observed at the PLAT locus support arecent African origin of non-African human populations
and suggest that, throughout much of modern humanhistory, sub-Saharan Africa has maintained a large ef-fective population size and a high level of populationsubstructure.
Subjects and Methods
Subjects
Individuals originating from 30 geographically diversepopulations were typed for the Alu, PLAT (CA)n-1, andPLAT (CA)n-2 polymorphisms. In most cases popula-tions represent well-defined ethnic groups, but in somecases ethnically diverse populations from the same ge-ographic region have been pooled because of small sam-ple sizes. For example, the Bantu-speakers, Somali, andPapua New Guineans each represent here a pooling ofethnically diverse groups. Populations examined include13 African populations (country of origin is given inparentheses): Wolof (Senegal), Ewondo (Cameroon),Bamileke (Cameroon), Mbuti (Democratic Republic ofCongo), Biaka (Central African Republic), Bantu-speak-ers from various southern-African chieftainships (SouthAfrica), Herero (Namibia), Kwengo (Namibia), Nama(Namibia), Va/Sekele !Kung San (Namibia), Zu/Wasi!Kung San (Namibia), Somali, Ethiopian Jews; two Mid-dle Eastern populations—Yemenite Jews (Yemen) andDruze (Israel); two European populations—Finns andDanes; five Asian populations—Japanese, San FranciscoChinese, Ami (Taiwan), Atayal (Taiwan), and Yakuts(Siberia); three Oceanic populations—Micronesians (as-sorted islands), Nasioi (Melanesia), and Papua New Gui-neans; and five Amerindian populations— Cheyenne(Oklahoma), Maya (Yucatan, Mexico), Karitiana (Ron-donia, Brazil), Surui (Rondonia, Brazil), and Ticuna(Amazonia, Brazil). Most of the population sampleshave been described elsewhere, by Nurse et al. (1985),Scozzari et al. (1988, 1999), Stoneking et al. (1990),

Tishkoff et al.: STRP-Alu Haplotype Variation at PLAT 903
Figure 2 Global distribution of populations included in the PLAT haplotype study. 1 p Biaka; 2 p Mbuti; 3 p Wolof; 4 p Ewondo;5 p Bamileke; 6 p Bantu-speakers; 7 p Herero; 8 p Zu/Wasi !Kung San; 9 p Kwengo; 10 p Nama; 11 p Va/Sekele !Kung San; 12 pEthiopians; 13 p Somali; 14 p Papua New Guineans; 15 p Micronesians; 16 p Nasioi Melanesians; 17 p Ami; 18 p Atayal; 19 p Chinese;20 p Japanese; 21 p Yakut; 22 p Yemenites; 23 p Druze; 24 p Danes; 25 p Finns; 26 p Maya; 27 p Cheyenne; 28 p Ticuna; 29 pSurui; 30 p Karitiana.
Bowcock et al. (1991), Spurdle and Jenkins (1992), Barrand Kidd (1993), Goldman et al. (1993), Lichter et al.(1993), Destro-Bisol et al. (1994), Castiglione et al.(1995), Soodyall et al. (1996), Tishkoff et al. (1996a,1998a), Calafell et al. (1998), Kidd et al. (1998), andSpedini et al. (1999). Genomic DNA was extracted fromblood or from Epstein-Barr virus–transformed lympho-blastoid cell lines, by standard methods. The great apessampled for this project include 19 Pan troglodytes, 6Pan paniscus, and 4 Gorilla gorilla (described in Deinardand Kidd 1999). All blood samples were obtained withinformed consent, and typings were done under proto-cols approved by the human-subjects committees of alluniversities and research institutions involved in thisstudy.
PCR Methods
The Alu-insertion polymorphism was typed with thepublished primer sequences and methods described byTishkoff et al. (1996b). Amplification produces a 570-bp fragment from chromosomes with the Alu insertionand a 260-bp fragment from those without it. PCR prod-ucts were separated on a 1% agarose gel, were stainedwith ethidium bromide, and were visualized with UVlight.
The two dinucleotide repeats were typed by use of thepublished primers for (CA)n-1 (Thomas and Drayna1992) and (CA)n-2 (Sadler et al. 1991). Amplificationwas performed with 50 ng of genomic DNA in a 25-ml
(total volume) reaction mixture. The reaction mixturefor (CA)n-1 contained 5 pmol each of fluorescent-labeledprimer (PLAT1A 5′-GAC AGC ACA TTC TCT TAGCAA-3-′) and unlabeled primer (PLAT1B 5′-GTG ATGGAG TCA GAC CTT GTC-3′), 200 mM of each dNTP,50 mM KCl, 10 mM Tris-HCl, 1.5 mM MgCl2, and.625 U of Taq polymerase. Samples were denatured for1 min at 947C, followed by 25 cycles of 947C for 1 min,577C for 1 min, and 727C for 1 min, followed by a 10-min extension at 727C. The amplification conditions for(CA)n-2 were identical, except for the use of 5 pmol eachof fluorescent-labeled primer (PLAT2A 5′-GCC TGGACA ACA TAG AGA AAC C-3′) and unlabeled primer(PLAT2B 5′-ACT TCA GGC ATG TGC CAC TG-3′) andthe addition of 1.5 ml of deionized formamide to thereaction mix. Amplification products were run on a 6%polyacrylamide gel, on either an ABI 373 or ABI 377DNA sequencer, and fragment sizes were determinedwith GENESCAN software.
Sequencing
STRP alleles were sequenced either from clones ordirectly from PCR-amplification products. Cloning wasused to sequence large-sized alleles at (CA)n-1, whichwere present only as heterozygotes with small-sized al-leles. STRP alleles were amplified by the method de-scribed above and were visualized on a 3.5% Nusievegel. Bands containing the STRP alleles were excised fromthe gel, and the DNA was isolated by a Sephaglas DNA

904 Am. J. Hum. Genet. 67:901–925, 2000
isolation kit (Pharmacia). These purified products werecloned into a PT7Blue-3 plasmid vector by use of a Nov-agen cloning kit. Minipreps of the plasmids containingthe cloned alleles were performed by use of Promega’sWizard Plus SV miniprep kit. Plasmids containing theSTRP allele inserts were cycle sequenced in both direc-tions, with fluorescently labeled terminators, by use ofeither an ABI dideoxy terminator kit or a Beckman CEQDTCS sequencing kit and T7 and U19 primers specificto the PT7Blue-3 vector. PCR products were run on ei-ther an ABI 373 or Beckman CEQ2000 automated DNAsequencer. For sequencing from PCR products from in-dividuals homozygous for STRP alleles, alleles from(CA)n-1 were amplified with primers TpaSeq1A (5′-AAAGCT CAT CCA CCC TGC TC-3′) and TpaSeq1 B (5′-CAT GCC CCT GTA GTC CTA GC-39), which producea 302-bp product for a 113-bp allele. Alleles from (CA)n-2 were amplified with primers TpaSeq2A (5′-AAG GAAGGA AAA ATG CTG GG-3′) and TpaSeq2B (5′-GACTGG AGT GCA GTG GCA TG-3′), which produce a302-bp product for a 111-bp allele. Amplification wasperformed by use of 50–100 ng of genomic DNA in a25-ml (total volume) reaction mixture. The reaction mix-ture contained 10 pmol of each forward (A) and reverse(B) primer, 200 mM of each dNTP, 50 mM KCl, 10 mMTris-HCl, 1.5 mM MgCl2, and 0.625 U of Taq poly-merase. For TpaSeq1, samples were denatured for 1 minat 947C, followed by 25 cycles of 947C for 1 min, 607Cfor 1 min, and 727C for 1 min, followed by a 10-minextension at 727C. For TpaSeq2, samples were dena-tured for 1 min at 947C, followed by 25 cycles of 947Cfor 1 min, 587C for 1 min, and 727C for 1 min, followedby a 10-min extension at 727C. The amplified productswere purified by use of a Qiagen PCR purification kitand were cycle sequenced by use of a Beckman CEQDTCS sequencing kit. Products were run and analyzedon a Beckman CEQ2000 automated DNA sequencer.
Allele- and Haplotype-Frequency Estimates
The allele frequencies at the separate sites—(CA)n-1,(CA)n-2, and Alu—were estimated by gene counting.Heterozygosities for individual sites and for the haplo-types have been estimated as , where2n(1 2 Sp )/(n 2 1)i
pi represents the frequency of the ith allele or haplotypefor any given system and where n is the number of chro-mosomes in the sample. Probability values of Hardy-Weinberg (HW) exact tests and tests for heterozygosityexcess or deficiency (Guo and Thompson 1992; Roussetand Raymond 1995; Rousset 1996) as well as values ofFST (Weir and Cockerham 1984) were calculated withGENEPOP software (release 3.1b). Summary statisticsfor the STRP allele distributions were calculated by soft-ware available at the Microsat Web site. The computerprogram HAPLO (Hawley and Kidd 1995) was used to
generate maximum-likelihood estimates of the haplotypefrequencies for the (CA)n-1/Alu and (CA)n-2/Alu hap-lotypes. No individuals with missing STRP data wereincluded in the data set used to estimate STRP/Alu hap-lotype frequencies. The number of possible three-locushaplotypes, including the two dinucleotide repeats andthe Alu indel, was 1500, and most were rare. In theAfrican populations, nearly every individual had aunique three-locus phenotype. Consequently, haplotype-phase estimation would have very large standard errors,and, therefore, the complete three-locus haplotypes werenot estimated; however, frequencies of two-locus hap-lotypes could be obtained with high statistical accuracy,because there were fewer “ambiguous” multisite heter-ozygotes. Tishkoff et al. (2000) have demonstrated thatfrequencies of two-locus STRP/indel haplotypes inferredby the HAPLO program do not differ significantly fromfrequencies based on gene counting using haplotypesidentified unambiguously by molecular haplotypingmethods. The inaccuracy in statistically estimated hap-lotype frequencies is greatest for rare (i.e., populationfrequency !.05) haplotypes. Because these errors are re-stricted to rare haplotypes, and because statistics suchas haplotype diversity depend on the square of haplotypefrequencies, the errors have negligible impact on sub-sequent calculations of population statistics.
Tests of Population Subdivision and Principal-Components Analysis (PCA)
Genetic differentiation among populations groupedby geographic region were estimated by FST (Wright1931), DSW (Shriver et al. 1995), and DLR, the last ofwhich is a likelihood-ratio statistic developed by Paet-kau et al. (1997). FST (Wright 1931) partitions varianceinto within- and among-population components. DSW
(Shriver et al. 1995) is based on the stepwise-mutationmodel and makes use of the fact that STRP alleles ofsimilar size most likely have a more recent common an-cestor than do STRP alleles of grossly divergent size.The likelihood-ratio test DLR (Paetkau et al. 1997) isused for testing the observed data against the null hy-pothesis that the sample is drawn from a single panmicticpopulation. This measure is particularly sensitive to rarealleles or haplotypes that occur when highly variableSTRP systems are examined.
Let f0 be the probability (averaged over populations)that two identical haplotypes within a population willbe drawn, and let be the probability that two identi-fcal haplotypes will be drawn across the entire sample;then . Shriver et al. (1995) defined¯ ¯F p (f 2 f )/(1 2 f)ST 0
the statistic DSW as a measure of population divergencefor STRP loci. Let Xik be the frequency of a haplotypewith i copies of the repeat at locus k in population X,and let Yik be the corresponding frequency in population

Tishkoff et al.: STRP-Alu Haplotype Variation at PLAT 905
Y. Letting j be a dummy index, assume that W pX
, , andS S S d i 2 j d x x W p S S S d i 2 j d y yk i j ik jk Y k i j ik jk
; then, according to theW p S S S d i 2 j d x yXY k i j ik jk
method of Shriver et al. (1995), D p W 2 [(W 1SW XY X
. In applying this statistic to haplotypes, we needW )/2]Y
to consider the distance between haplotypes that differwith respect to the Alu indel. Two haplotypes that havethe same number of STRP repeats but differ at the Aluindel are treated as having a difference of x repeats forpurposes of the DSW calculation, where x is allowed tobe 1,2,3,…,5. This weighting is arbitrary and, in prac-tice, was found to change the absolute estimates of DSW,but it did not change either the level of significance orthe pattern of DSW among regions.
Define Lij as the likelihood that haplotype i will bedrawn in population j, and let LiT be the likelihood thathaplotype i will be drawn in any population other thanj. A slight modification of the method of Paetkau et al.(1997) gives
i jmax maxn Lj ijD p log ,O OLR [ ( )]n Lip1 jp1total iT
where n is the number of chromosomes in the sample.Tail probabilities for DSW and DLR were generated asdescribed by Hudson et al. (1992). Null distributionswere obtained by randomly permuting the genotypesacross the populations and calculating the test statisticsover 10,000 such randomized data sets.
PCA
PCA was performed by defining each population as avector of frequencies of two-locus haplotypes (composedof either the (CA)n-1 or (CA)n-2 repeat and the Aluindel). Frequencies were arcsine transformed and weretreated as measures from a multivariate Gaussian dis-tribution. PCA was performed on the correlation matrixof these scores, by Minitab Statistical Software (version12).
LD Analysis
For each STRP allele, a table was constructed2 # 2for counts of that allele versus counts of all other allelespooled, and for Alu(1) alleles versus Alu(2) alleles. Thestandardized, pairwise LD value D′ (Lewontin 1964) wascalculated for each such table, and the null hy-2 # 2pothesis of LD ( ) was tested by Fisher’s exact test′D p 0(Sokal and Rohlf 1995, pp. 730–736). The significanceof LD estimated by a likelihood-ratio test gave resultsthat were virtually identical to those of Fisher’s exacttests, so only the latter results are reported.
Results
Alu Polymorphism
The full sample typed for the Alu indel represents1,375 individuals originating from 30 geographically di-verse populations (fig. 2 and table 1). Allele frequen-cies for the Alu polymorphism are shown in table 1. TheAlu insertion is polymorphic, with moderate (>.30) het-erozygosity levels in most populations, with the excep-tions of the Nasioi and Papua New Guinean popula-tions, which have low frequencies (7% and 16%,respectively) of the Alu(1) allele, and the South Amer-ican Ticuna population, which has a very high frequency(91%) of the Alu(1) allele. All three of these populationsare small and isolated and have experienced high levelsof genetic drift, which likely played a role in the estab-lishment of one allele at very high frequency.
In general, African populations have low frequenciesof the Alu(1) allele, in the range of .18–.38, with theexception of the Wolof (.44) and the Somali (.47). Non-African populations have high frequencies of the Alu(1)allele, in the range of .27–.91, with the exception of theNasioi (.07) and Papua New Guineans (.16). These re-sults are consistent with those of previous studies of thePLAT Alu polymorphism in a smaller sample of popu-lations (Perna et al. 1992; Batzer et al. 1994; Tishkoffet al. 1996b; Stoneking et al. 1997; Novick et al. 1998).None of the populations exhibit a significant departurefrom HW equilibrium, with the exception of the Bam-ileke from Cameroon ( ), the Atayal from TaiwanP ! .04( ), and the Yakuts from Siberia ( ). How-P ! .02 P ! .01ever, these probability values are for individual tests, andnone of the departures from HW expectation were sig-nificant at the experiment-wide level after the Bonferro-ni correction for multiple tests was applied. Only theAlu(2) allele was detected in 29 nonhuman primatesexamined (19 common chimpanzees, 6 pygmy chim-panzees, and 4 gorillas). Both the absence of the HS Aluin the nonhuman primates and the high heterozygosityof the Alu indel in most human populations support thehypothesis that the Alu-insertion event occurred afterthe divergence of humans from the great apes, ∼5 millionyears ago (Tishkoff et al. 1996b).
(CA)n Polymorphisms
The (CA)n-1 repeat is located ∼21,940 bp from theAlu polymorphism, at sequence position 7173 of theGenBank sequence (accession number K03021; fig. 1).Published primers flanking the repeat produce a PCRproduct that is 99–173 bp in size (Thomas and Drayna1992). The GenBank sequence, which represents a 113-bp allele, is actually a compound repeat consisting ofthe sequence (GT)14(AT)12. The (CA)n-2 repeat is located∼12,200 bp from the Alu polymorphism at sequence
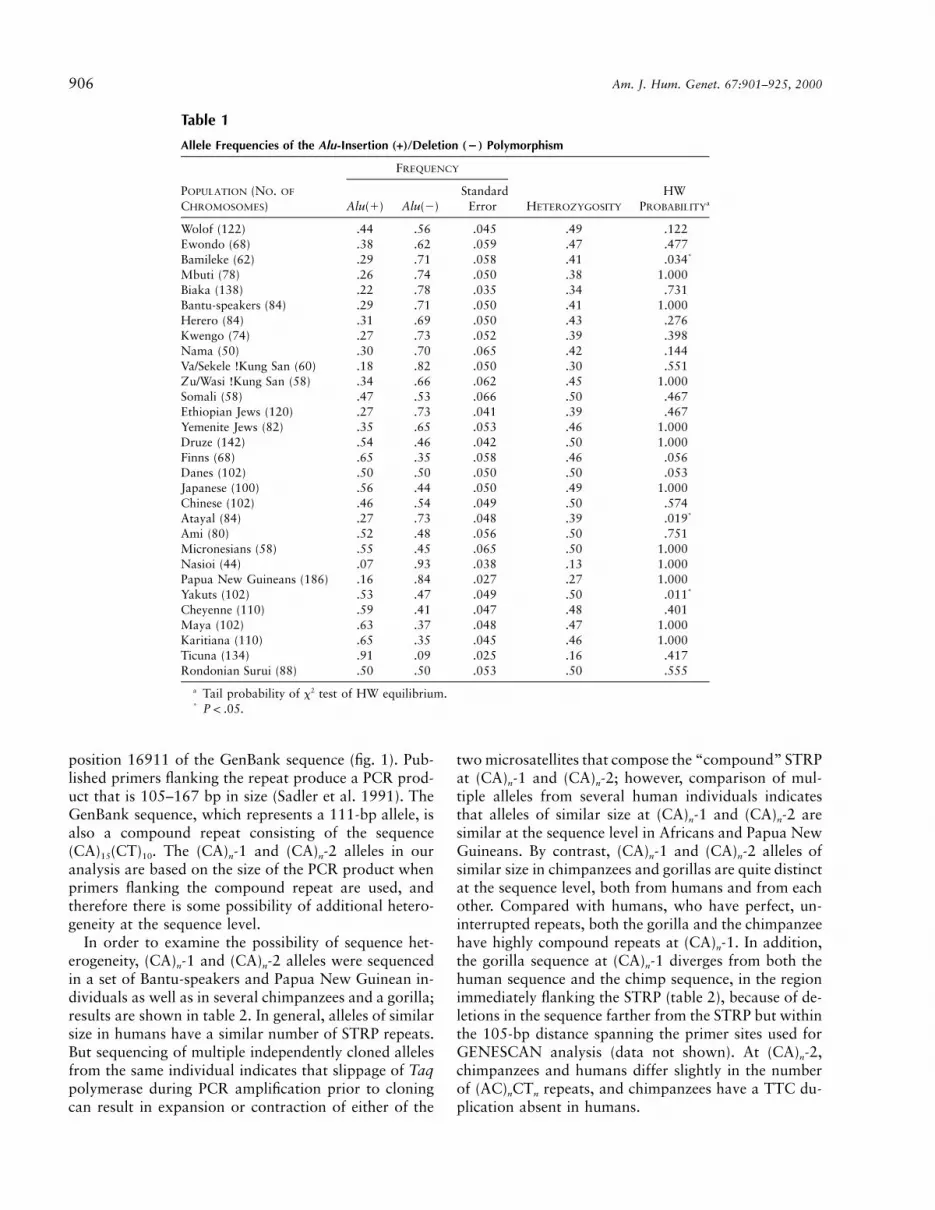
906 Am. J. Hum. Genet. 67:901–925, 2000
Table 1
Allele Frequencies of the Alu-Insertion (+)/Deletion (5) Polymorphism
POPULATION (NO. OF
CHROMOSOMES)
FREQUENCY
HETEROZYGOSITY
HWPROBABILITYaAlu(1) Alu(2)
StandardError
Wolof (122) .44 .56 .045 .49 .122Ewondo (68) .38 .62 .059 .47 .477Bamileke (62) .29 .71 .058 .41 .034*
Mbuti (78) .26 .74 .050 .38 1.000Biaka (138) .22 .78 .035 .34 .731Bantu-speakers (84) .29 .71 .050 .41 1.000Herero (84) .31 .69 .050 .43 .276Kwengo (74) .27 .73 .052 .39 .398Nama (50) .30 .70 .065 .42 .144Va/Sekele !Kung San (60) .18 .82 .050 .30 .551Zu/Wasi !Kung San (58) .34 .66 .062 .45 1.000Somali (58) .47 .53 .066 .50 .467Ethiopian Jews (120) .27 .73 .041 .39 .467Yemenite Jews (82) .35 .65 .053 .46 1.000Druze (142) .54 .46 .042 .50 1.000Finns (68) .65 .35 .058 .46 .056Danes (102) .50 .50 .050 .50 .053Japanese (100) .56 .44 .050 .49 1.000Chinese (102) .46 .54 .049 .50 .574Atayal (84) .27 .73 .048 .39 .019*
Ami (80) .52 .48 .056 .50 .751Micronesians (58) .55 .45 .065 .50 1.000Nasioi (44) .07 .93 .038 .13 1.000Papua New Guineans (186) .16 .84 .027 .27 1.000Yakuts (102) .53 .47 .049 .50 .011*
Cheyenne (110) .59 .41 .047 .48 .401Maya (102) .63 .37 .048 .47 1.000Karitiana (110) .65 .35 .045 .46 1.000Ticuna (134) .91 .09 .025 .16 .417Rondonian Surui (88) .50 .50 .053 .50 .555
a Tail probability of x2 test of HW equilibrium.* .P ! .05
position 16911 of the GenBank sequence (fig. 1). Pub-lished primers flanking the repeat produce a PCR prod-uct that is 105–167 bp in size (Sadler et al. 1991). TheGenBank sequence, which represents a 111-bp allele, isalso a compound repeat consisting of the sequence(CA)15(CT)10. The (CA)n-1 and (CA)n-2 alleles in ouranalysis are based on the size of the PCR product whenprimers flanking the compound repeat are used, andtherefore there is some possibility of additional hetero-geneity at the sequence level.
In order to examine the possibility of sequence het-erogeneity, (CA)n-1 and (CA)n-2 alleles were sequencedin a set of Bantu-speakers and Papua New Guinean in-dividuals as well as in several chimpanzees and a gorilla;results are shown in table 2. In general, alleles of similarsize in humans have a similar number of STRP repeats.But sequencing of multiple independently cloned allelesfrom the same individual indicates that slippage of Taqpolymerase during PCR amplification prior to cloningcan result in expansion or contraction of either of the
two microsatellites that compose the “compound” STRPat (CA)n-1 and (CA)n-2; however, comparison of mul-tiple alleles from several human individuals indicatesthat alleles of similar size at (CA)n-1 and (CA)n-2 aresimilar at the sequence level in Africans and Papua NewGuineans. By contrast, (CA)n-1 and (CA)n-2 alleles ofsimilar size in chimpanzees and gorillas are quite distinctat the sequence level, both from humans and from eachother. Compared with humans, who have perfect, un-interrupted repeats, both the gorilla and the chimpanzeehave highly compound repeats at (CA)n-1. In addition,the gorilla sequence at (CA)n-1 diverges from both thehuman sequence and the chimp sequence, in the regionimmediately flanking the STRP (table 2), because of de-letions in the sequence farther from the STRP but withinthe 105-bp distance spanning the primer sites used forGENESCAN analysis (data not shown). At (CA)n-2,chimpanzees and humans differ slightly in the numberof (AC)nCTn repeats, and chimpanzees have a TTC du-plication absent in humans.

Tishkoff et al.: STRP-Alu Haplotype Variation at PLAT 907
Table 2
Sequence Analysis of (CA)n-1 and (CA)n-2 Alleles in Selected Individuals Representing Various Human Populations and in NonhumanPrimates
Source or Individual
AlleleSize(bp)
No. ofIndependentSequences Sequence
(CA)n-1:GenBank (accession number K03021) 113 1 TATGTGTTTGTA(TG)14(TA)12ATTTAGAGACAAGGTCTPapua New Guinea 1 119 1 (TG)16(TA)13
a
2 (TG)17(TA)12b
1 (TG)15(TA)13c
Papua New Guinea 2 121 2 (TG)18(TA)12d
1 (TG)19(TA)11a
1 (TG)18(TA)11e
2 (TG)18(TA)10f
Papua New Guinea 3 121 2 (TG)18(TA)12g
1 (TG)18(TA)11e
Papua New Guinea 4 121 1 (TG)19(TA)11h
Papua New Guinea 5 121 1 (TG)18(TA)12h
Papua New Guinea 6 121 1 (TG)18(TA)12h
Papua New Guinea 7 121 1 (TG)18(TA)12h
Papua New Guinea 8 121 1 (TG)18(TA)12h
Bantu 1 121 5 (TG)18(TA)12i
Bantu 2 123 1 (TG)18(TA)13h
1 (TG)18(TA)12c
Bantu 3 125 1 (TG)17(TA)14a
Bantu 4 139 1 (TG)22(TA)12c
Papua New Guinea 9 161 1 (TG)28(TA)19e
Chimp 1 125 1 TATGTGTTTG(TA)2(TG)17(TA)1(TG)4(GG)1(TA)8TTTAGAG––AAGGTCT h
Chimp 2 121 1 (TA)2(TG)15(TA)1(TG)4(GG)1(TA)8h
Chimp 3 121 1 (TA)2(TG)15(TA)1(TG)4(GG)1(TA)8h
Gorilla 1 105 1 TATGTGTTTG(TA)3(TG)3(TA)1(TG)10(TA)8(GA)2CAGAGGTCT j
(CA) n-2:GenBank (accession number K03021) 111 1 TTGTCTCT(AC)16(TC)10AGCCAGGCACAGTPapua New Guinea 1 113 1 (AC)15(TC)12
h
Papua New Guinea 2 115 1 (AC)16(TA)12h
Papua New Guinea 3 125 1 (AC)17(TC)15c
Chimp 1 115 1 (AC)13(TC)11(TTC)2h
a One sequence from a plasmid clone.b Two sequences from PCR amplification.c One sequence from PCR amplification, which is smaller than would be expected on the basis of allele size as determined by GENESCAN
analysis.d Two sequences from a plasmid clone.e One sequence from a plasmid clone, which is smaller than would be expected on the basis of allele size as determined by GENESCAN
analysis.f One sequence from a plasmid clone and one sequence from PCR amplification, which are smaller than would be expected on the basis of
allele size as determined by GENESCAN analysis.g One sequence from a plasmid clone and one sequence from PCR amplificationh One sequence from PCR amplification.i Four sequences from a plasmid clone and one sequence from PCR amplification.j One sequence from PCR amplification, which is larger than would be expected on the basis of allele size as determined by GENESCAN
analysis.
Summary statistics of the size range, frequency, anddiversity of alleles of the (CA)n-1 and (CA)n-2 STRPs areshown in table 3. In general, heterozygosity and allele-size ranges are highest in African populations, lower inMiddle Eastern, European, and Asian populations, andlowest in Oceanic and New World populations (table3). For the (CA)n-1 polymorphism, the only populationsthat exhibit genotype proportions that deviate signifi-
cantly from HW expectations are the Central AfricanRepublic Biaka ( ), Namibian Kwengo (P ! .0001 P !
), Namibian Va/Sekele !Kung San ( ), Na-.0001 P ! .0001mibian Zu/Wasi !Kung San ( ), North AmericanP ! .002Cheyenne ( ), and Rondonian Surui ( )P ! .004 P ! .02(table 3). All six of these populations have an excess ofhomozygosity. For the (CA)n-2 polymorphism, the onlypopulations that exhibit genotype proportions that de-

Table 3
Allele-Size Statistics for PLAT (CA)n-1 and CA)n-2 STRP Markers, Based on PCR-Fragment Size
POPULATION (NO.OF CHROMOSOMES) Minimum Maximum Mean Median Mode Variance Heterozygosity
(CA)n-1:African:
Wolof (122) 115 169 131.20 127 123 168.62 .892Ewondo (70) 115 159 134.43 129 129 187.61 .912Bamileke (64) 117 169 134.22 131 121 203.89 .920Mbuti (68) 99 159 130.47 125 123 157.09 .863Biaka (94) 99 171 131.17 129 129 192.92 .902Bantu-speakers 113 159 133.03 113 159 173.74 .917Herero (86) 115 167 137.72 129 121 269.36 .905Kwengo (74) 115 157 126.51 125 129 59.49 .870Nama (48) 115 157 127.50 125 121 107.49 .853Va/Sekele !Kung San (60) 115 147 124.90 123 121 49.55 .854Zu/Wasi !Kung San (58) 117 145 126.41 125 125 35.23 .859Somali (60) 119 157 125.40 123 119 68.18 .738Ethiopian Jews (58) 111 157 127.52 121 121 136.64 .707
Middle East/Europe:Yemenite Jews (56) 119 133 122.04 121 121 7.56 .392Druze (110) 117 131 122.05 121 121 7.46 .485Finns (68) 115 133 121.59 121 121 5.14 .644Danes (100) 109 139 121.82 121 121 16.19 .530
Asia:Yakut (66) 109 125 120.91 121 121 3.25 .383Japanese (82) 117 125 121.15 121 121 2.45 .574Chinese (84) 119 145 121.62 121 121 9.44 .622Atayal (72) 119 127 121.69 121 121 4.75 .736Ami (62) 119 123 120.71 121 121 2.34 .649
Oceania:Micronesians (52) 113 169 125.42 121 121 209.31 .717Nasioi (46) 119 123 121.96 121 121 .98 .392Papua New Guineans (190) 115 173 123.66 121 134.65 .642
New World:Cheyenne (106) 119 125 121.27 121 121 1.56 .489Maya (102) 115 125 120.92 121 121 2.92 .597Karitiana (106) 119 123 121.00 121 121 .16 .075Ticuna (126) 117 131 120.43 121 121 2.74 .481Rondonian Surui (90) 121 125 121.09 121 121 .35 .043
(CA)n-2:African:
Wolof (124) 107 153 126.97 131 115 190.18 .898Ewondo (64) 109 159 127.34 131 141 97.81 .899Bamileke (62) 109 157 130.42 131 143 221.56 .905Mbuti (76) 113 155 133.79 139 115 153.50 .888Biaka (130) 109 151 127.49 125 123 134.20 .911Bantu-speakers (84) 109 165 127.05 125 113 222.36 .893Herero (86) 109 167 128.88 129 113 202.10 .906Kwengo (72) 109 145 125.97 129 129 120.22 .875Nama (50) 109 145 125.44 125 113 99.96 .891Va/Sekele !Kung San (58) 109 157 126.45 127 129 144.67 .908Zu/Wasi !Kung San (58) 109 157 125.14 125 113 129.94 .885Somali (54) 109 145 119.70 115 113 80.48 .826Ethiopian Jews (118) 109 151 125.83 125 113 121.05 .711
Middle East/Europe:Yemenite Jews (142) 105 139 120.68 123 113 54.68 .770Druze (94) 109 139 118.53 117 113 34.27 .766Finns (70) 113 131 116.97 117 113 13.48 .711Danes (100) 105 141 118.94 117 113 48.11 .797
Asia:Yakut (82) 107 139 115.51 113 113 25.86 .673
(continued)

Tishkoff et al.: STRP-Alu Haplotype Variation at PLAT 909
Table 3 Continued
POPULATION (NO.OF CHROMOSOMES) Minimum Maximum Mean Median Mode Variance Heterozygosity
Japanese (84) 109 131 116.71 113 113 16.68 .624Chinese (84) 109 139 118.40 115 113 21.24 .787Atayal (80) 113 127 118.88 115 113 33.15 .754Ami (72) 113 149 118.08 115 113 70.19 .733
Oceania:Micronesians (72) 113 131 118.58 117 113 35.37 .793Nasioi (46) 113 143 120.70 117 115 50.48 .798Papua New Guineans (180) 113 145 123.33 127 127 41.54 .774
New World:Cheyenne (86) 113 127 114.35 113 113 12.27 .345Maya (78) 109 127 113.79 113 113 10.77 .448Karitiana (100) 113 115 113.16 113 113 .30 .147Ticuna (90) 113 123 113.13 113 113 1.15 .044Rondonian Surui (68) 113 147 113.56 113 113 17.18 .058
viate significantly from HW expectations are the SouthAfrican Bantu-speakers ( ), Namibian NamaP ! .0001( ), Namibian Kwengo ( ), Namibian Va/P ! .0001 P ! .02Sekele !Kung San ( ), Namibian Zu/Wasi !KungP ! .008San ( ), Papua New-Guineans ( ), and theP ! .0001 P ! .04Rondonian Surui ( ) (table 3). All seven of theseP ! .01populations have an excess of homozygosity. With theexception of the Cheyenne and Bantu-speakers, pop-ulations exhibiting a deviation from HW expectationsfor both STRPs have small population sizes. Addition-ally, the Rondonian Surui are a small Amazonian Am-erindian tribe with high levels of consanguinity withinthe sample (Calafell 1999), which could account for de-viation from HW expectations. It is also possible thatthe deficit of heterozygotes in some of these populationsmay indicate the presence of “null alleles” that, becauseof either mutations within the primer sequences or pref-erential amplification of an allele, we are not detecting;however, the fact that the Kwengo, Va/Sekele, Zu/Wasi,and Surui have a deficit of heterozygotes for both the(CA)n-1 and (CA)n-2 polymorphisms makes this possi-bility less likely and suggests that the deviation from HWexpectations may be due to population-level effects (sub-structure, admixture, or inbreeding) or to chance devi-ations, rather than to the presence of “null alleles.”
(CA)n-1 and (CA)n-2 allele sizes for nonhuman pri-mates are within the range observed in humans but areless variable (table 4). The increased variability in hu-mans may be due to the larger sample size examined,the bias resulting from selection of these STRPs on thebasis of high heterozygosity in humans, and/or greaterinstability of the STRPs in humans, who have largernumbers of perfect repeats than do chimpanzees andgorillas (table 2).
Haplotype Diversity
Each of the (CA)n repeats was analyzed separately astwo-site haplotypes with the Alu polymorphism. Hap-lotype frequencies for both (CA)n-1/Alu and (CA)n-2/Aluhaplotype systems, as well as haplotype-diversity values,are in Appendices A and B at the Kidd Lab Home Pageand the Tishkoff lab Web page. Histograms of haplotypefrequencies from a subset of geographically diverse pop-ulations are shown in figure 3. The total number ofhaplotypes and haplotype-diversity statistics for eachmajor geographic region are given in table 5. For both(CA)n-1/Alu and (CA)n-2/Alu haplotype systems, boththe total number of haplotypes and haplotype diversityare greatest in African populations, lower in MiddleEastern, European, and Asian populations, and lowestin Pacific Island and New World populations (fig. 3 andtable 5). There are many more haplotypes specific toAfrican populations than to non-African populations(table 5). In general, non-African populations have asubset of the haplotype diversity observed in Africa. Thispattern of variation is consistent with results from theCD4 (Tishkoff et al. 1996a, 1998b), DM (Tishkoff etal. 1998a; S. A. Tishkoff, A. G. Clark, and T. Jenkins,unpublished data), DRD2 (Kidd et al. 1998), and PAH(Kidd et al. 2000) loci. In addition, African populationshave highly divergent patterns of haplotype variation,whereas the non-African populations share a more sim-ilar pattern of haplotype variation. However, geneticdrift has resulted in some divergent haplotype distri-butions in isolated populations from all regions of theworld (fig. 3; also see Appendices A and B at the KiddLab Home Page and the Tishkoff lab Web page).
The Papua New Guinean and Micronesian popu-lations have low frequencies (8% and 13% frequency,

910 Am. J. Hum. Genet. 67:901–925, 2000
Table 4
Frequencies of PLAT (CA)n-1 and (CA)n-2 Alleles inNonhuman Primates
STRP ALLELE SIZE
NO. OF CHROMOSOMES IN
Pantroglodytes
Panpaniscus
Gorillagorilla
(CA)n-1:105 0 0 6108 0 0 2111 1 0 0119 6 6 0121 7 4 0123 4 0 0125 4 0 0127 2 0 0129 4 0 0131 3 0 0139 3 0 0141 2 0 0
Total 36 10 8(CA)n-2:
103 1 0 0107 1 0 0109 4 1 3111 7 5 0113 6 1 0115 6 0 1117 1 3 0119 1 0 4121 2 0 0123 5 0 0
Total 34 10 8
respectively) of haplotypes containing large-sized(149–173 bp) (CA)n-1 alleles, which are absent in allother non-African populations studied (in which themaximum allele size is 145 bp). Such large alleles, how-ever, are present at low to moderate frequencies in sub-Saharan African populations, which have a broaderand more continuous distribution of alleles ranging upto 171 bp in size (fig. 3 and table 3). The very largenumber of dinucleotide repeats in the large-sized allelesmade cloning and sequencing analysis difficult. How-ever, sequence analysis of a 161-bp allele from a PapuaNew Guinean individual and a 139-bp allele in a Bantu-speaking individual demonstrates that both containperfect repeats with no interruptions (table 2). Thus,it is not possible to distinguish whether these allelesare identical by descent or arose independently becauseof recurrent mutation.
PCA was used to provide a visual representation ofpopulation clustering based on haplotype variation (fig.4). The first principal component (X-axis) accounts for55.1% of the variance, and the second principal com-ponent (Y-axis) accounts for 10.5% of the variance. Ingeneral, populations cluster by geographic origin. Themost distinct separation is between African and non-African populations. The northeastern-African—that is,
the Ethiopian and Somali—populations are located cen-trally between sub-Saharan African and non-Africanpopulations. Among the non-Africans, populations clus-ter by geographic region, with some exceptions; the Si-berian Yakut and the Japanese populations cluster withthe North American populations and the Papua NewGuinean and Taiwanese Ami populations have identicalcoordinates (fig. 4). On the PCA plot, the three Ama-zonian Amerindian populations (Ticuna, Surui, and Kar-itiana) and the Nasioi Melanesian population appear tobe the groups that are most isolated from other geo-graphically nearby populations, possibly because of highlevels of genetic drift among these small and isolatedpopulations.
Population Subdivision
The amount of population subdivision was quantifiedwith three statistics that capture different aspects of thedata as described in the Subjects and Methods section.These estimates were obtained from populationsgrouped by geographic region; results are shown in table6. FST values are lowest for European populations forthe (CA)n-1/Alu haplotype system and are lowest for theNew World populations for the (CA)n-2/Alu haplotypesystem; FST values are highest for the Oceanic and NewWorld populations for the (CA)n-1/Alu haplotype systemand for the Asian and Oceanic populations for the (CA)n-2/Alu haplotype system. However, FST is highly biasedby within-population diversity levels. As can be seen bythe formula for estimation of Wright’s FST (see the Sub-jects and Methods section), FST values will always be lowwhen within-population diversity levels (i.e., heterozy-gosity levels) are high. Therefore, FST is not a good mea-sure to use for comparison of levels of subdivision forhighly variable STRP systems that vary widely in het-erozygosity levels across geographic regions. The factthat African populations have FST values lower thanthose in other regions of the world is likely a result ofthe very high levels of STRP diversity within these pop-ulations, rather than a reflection of population history,subdivision, and migration.
Two measures of population subdivision that are par-ticularly useful for highly variable STRP systems areDSW, which takes into account the stepwise-mutationprocess of STRPs (Shriver et al. 1995), and a likelihood-ratio test—DLR—described by Paetkau et al. (1997). Val-ues for both DSW and DLR are lowest for the Oceanicpopulations and are highest for the African popula-tions. These results demonstrate considerably higherhaplotype heterogeneity among African populationsthan among populations from Europe and the MiddleEast, Asia, Oceania, or the New World.

911
Figure 3 Haplotype-frequency distributions of (CA)n-1 STRPs (this page) and (CA)n-2 STRPs (following page), on Alu(1) and Alu(2)chromosomes from a globally diverse subset of the populations included in this study. STRP allele sizes are shown on the X-axis. Alu(1)haplotypes are shown as unblackened bars, and Alu(2) haplotypes are shown as blackened bars.

912

Tishkoff et al.: STRP-Alu Haplotype Variation at PLAT 913
Table 5
Haplotype Diversity Statistics for Populations Grouped by Geographic Region
AfricanMiddle Eastern/
European Asian OceanicNew
World Non-Africana
(CA)n-1:No. of populations 13 4 5 3 5 17No. of chromosomes 924 352 386 284 540 1,562Mean heterozygosity .903 .739 .772 .639 .614 .694No. of haplotypes 54 21 12 22 11 35Mean no. of haplotypes/population 21.54 11 7.6 11.33 6.20 8.64No. of population-specific haplotypes 26 0 0 4 0 4
(CA)n-2:No. of populations 13 4 5 3 5 17No. of chromosomes 1,030 410 422 296 488 1,616Mean heterozygosity .909 .8 .767 .809 .506 .705No. of haplotypes 48 22 24 21 14 37Mean no. of haplotypes/population 21.69 14.25 12 13.667 5.80 11No. of population-specific haplotypes 15 1 1 1 0 3
a Includes pooled data from Europe, Asia, Oceania, and the New World.
Patterns of LD
Fisher’s exact test (Sokal and Rohlf 1995, pp.730–736) was used to test for significance of LD betweeneach STRP allele and the Alu indel polymorphism (table7). If allele frequencies are sufficiently low, some allelesmay fail to ever show statistically significant LD (Le-wontin 1995), and these cases are indicated by blankspaces in table 7. Significance values in table 7 are notcorrected for multiple comparisons. For the (CA)n-1/Alu haplotype system, with markers located ∼22 kbapart, there are sporadic cases of LD in both Africanand non-African populations (table 7). However, thepattern of LD in Africans and non-Africans is distinct.In 6 of the 13 African populations, there is an associa-tion between Alu(1) and either 121- or 123-bp alleles.However, in the non-African populations, only 3 of 18populations exhibit this association, and, in 6 popula-tions, the Alu(1) allele is most strongly associated witha 119-bp allele. The latter association is never observedin African populations. Alu(2) chromosomes are mostfrequently associated with 117–125-bp alleles in non-Africans (but rarely in Africa), whereas the Alu(2) chro-mosomes are most frequently associated with a 129-bpallele in Africans and in Middle Eastern Druze (this alleleis rare or absent in all other non-African populations).For the (CA)n-2/Alu haplotype system, with markers lo-cated ∼12.2 kb apart, we observe a strong positive as-sociation between the 113-bp and Alu(1) alleles in 21of the 31 African and non-African populations (table7). However, for many other STRP alleles, Africans andnon-Africans have distinct patterns of both allelic var-iation and LD (see table 7).
Overall, there are fewer significant LD values (eitherpositive or negative) in African populations than in non-African populations, relative to the number of allelespresent at frequencies high enough to allow detection of
significance. Also, the number of pairwise associationsis considerably greater for the (CA)n-2/Alu haplotypesystem than for the (CA)n-1/Alu haplotype system. Thispattern of LD is also demonstrated by the histogramsof haplotype frequencies, shown in fig. 3; both theAlu(1) and Alu(2) chromosomes are associated with awide range of STRP alleles for the (CA)n-1/Alu haplotypesystem. By contrast, for the (CA)n-2/Alu haplotype sys-tem, the Alu(1) allele tends to be associated predomi-nantly with small-sized alleles (107–127-bp alleles, with113 bp being most common) whereas the Alu(2) is as-sociated with many alleles in the 105–169-bp range.
Discussion
These results demonstrate the usefulness of haplotypeanalysis of STRPs, in combination with more-stable in-dels, for the reconstruction of human population history.Recently retroposed Alu elements are valuable tools forthe reconstruction of historical population and demo-graphic events, since they are unique, unidirectional, andstable mutation events for which the ancestral state (i.e.,absence of the Alu element) is known. Additionally, anal-ysis of Alu elements as haplotypes with highly variableSTRP repeats makes it possible to estimate the time ofinsertion of the Alu element, on the basis of erosion ofLD (A. G. Clark and S. A. Tishkoff, unpublished data).Knowledge of insertion times can be important for in-ference of the timing of historical evolutionary eventsand for reconstruction of human demographic history(Sherry et al. 1997).
Haplotype History at the PLAT Locus
STRP/Alu haplotype analysis can be useful for infer-ence of the evolutionary history of a locus of interest.The absence of the HS Alu in chimpanzees and gorillas,

914 Am. J. Hum. Genet. 67:901–925, 2000
Figure 4 PCA plot of populations, based on haplotype-frequency variation. v p Sub-Saharan African populations; 1 p northeastern-African populations; n p European and Middle Eastern populations; * p Oceanic populations; V p Asian populations; m p New Worldpopulations; 1 p Biaka; 2 p Mbuti; 3 p Bantu-speakers; 4 p Ewondo; 5 p Bamileke; 6 p Wolof; 7 p Herero; 8 p Zu/Wasi !Kung San;9 p Kwengo; 10 p Nama; 11 p Va/Sekele !Kung San; 12 p Ethiopians; 13 p Somali; 14p Papua New Guineans; 15 p Micronesians; 16p Nasioi Melanesians; 17 p Ami; 18 p Atayal; 19 p Chinese; 20 p Japanese; 21 p Yakut; 22 p Yemenites; 23 p Danes; 24 p Druze;25 p Finns; 26 p Maya; 27 p Cheyenne; 28 p Ticuna; 29 p Surui; 30 p Karitiana.
as well as the fact that the Alu element is highly variablefor presence/absence in populations from globally di-verse regions, suggests that the insertion of this retro-posable element occurred after the divergence of humansfrom the great apes, which occurred ∼5 million yearsago (Wilson and Sarich 1969; Kumar and Hedges 1998),but prior to the divergence of modern human popula-tions, which occurred during the past 150,000 years(Stringer and Andrews 1988; Harpending et al. 1993;Cavalli-Sforza et al. 1994; Goldstein et al. 1995; Nei1995; Tishkoff et al. 1996a, 1996b, 1998b; Stonekinget al. 1997). The two dinucleotide repeats (CA)n-1 and(CA)n-2, which are located ∼22 and ∼12.2 kb, respec-tively, from the polymorphic Alu, are variable in com-mon chimpanzees (P. troglodytes), pygmy chimpanzees(P. paniscus) and gorillas (G. gorilla). The allele sizesobserved in nonhuman primates are similar to those ob-served in humans. However, sequence analysis of theSTRPs in humans, chimpanzees, and gorillas demon-strates that alleles that (on the basis of PCR-product
length) are found to be of similar size are heterogeneousat the sequence level (table 2). These results confirm andextend previous studies demonstrating sequence heter-ogeneity of STRP alleles (Blanquer-Maumont andCrouau-Roy 1995; Garza and Freimer 1996; Grimaldiand Crouau-Roy 1997; Rosenbaum and Deinard 1998;Deinard and Kidd 1999). Sequence analysis of (CA)n-1in the gorilla also demonstrates that deletions outsidethe repeat unit can affect the size of the PCR product.Thus, one must be cautious about making inferencesabout the evolutionary history of different taxa basedon sizes of PCR amplicons of STRPs without sequenceanalysis of alleles. Additionally, our results demonstratethat slippage by Taq polymerase during PCR amplifi-cation can result in expansion or contraction of eitherof the two repeats composing a “compound” STRP.Thus, multiple clones from multiple individuals must besequenced, to obtain a “consensus sequence” of the di-nucleotide composition of compound STRPs. Suchknowledge could be important for determining whether

Tishkoff et al.: STRP-Alu Haplotype Variation at PLAT 915
Table 6
Estimates of Genetic Heterogeneity within GeographicRegions
FST (P) DSW (P) DLR(P)
(CA)n-1/Alu:Africa .050 (.000) 1.974 (.000) 3.175 (.000)Europe .029 (.001) .139 (.002) 2.312 (.041)Asia .045 (.000) .242 (.000) 2.088 (.055)Oceania .072 (.020) .084 (.000) .340 (.000)New World .078 (.000) .399 (.000) 1.932 (.000)
Global .094 (.000) 12.541 (.000) 7.170 (.000)(CA)n-2/Alu:
Africa .042 (.000) 1.968 (.000) 3.280 (.000)Europe .041 (.000) .153 (.000) 1.215 (.016)Asia .074 (.000) .268 (.000) 1.660 (.039)Oceania .062 (.000) .101 (.000) .391 (.000)New World .033 (.009) .576 (.000) 2.616 (.014)
Global .106 (.000) 15.202 (.000) 8.641 (.000)
NOTE.—P values are the tail probability that a heterogeneityestimate greater than that observed in a panmictic populationwill be obtained. Empirical null distributions under panmixiawithin each region were obtained by a permutation test (Hud-son et al. 1992).
alleles are identical by descent. However, even if STRPalleles are identical at the sequence level, this is not ab-solute proof of identity by descent, since identical allelescould have arisen by independent convergent mutation.In such a case, identity by descent can be determinedonly by detailed analysis of genetic diversity in the se-quence flanking the STRP.
Initially, the Alu insertion into intron 8 of the TPAgene occurred on a chromosome containing a single al-lele at each of the neighboring dinucleotide markers. The“TPA Alu” likely inserted into a chromosome containinga small-sized (CA)n-2 allele (possibly the 113-bp allele,which is most common in modern populations). Theclose proximity of the Alu marker and the (CA)n-2marker (which are 12.2 kb apart) has resulted in themaintenance of strong LD between the Alu(1) allele andthe 113-bp allele. The unimodal distribution of (CA)n-1 and (CA)n-2 alleles on Alu(1) and Alu(2) haplotypebackgrounds in most populations is consistent with astepwise-mutation model in which mutations result inexpansion or contraction by one or a few repeat units,as has been observed at many other STRP repeats inhumans (Shriver et al. 1993; Valdes et al. 1993; Weberand Wong 1993; Di Rienzo et al. 1994, 1998). Thegreater variance of STRP alleles on Alu(2) chromosomescompared with Alu(1) chromosomes (table 3) is con-sistent with a recent origin of the Alu-insertion allele.LD between (CA)n-1 and (CA)n-2 can erode by mutationas fast as by recombination. The variance of STRP allelesis similar for both (CA)n-1 STRPs and (CA)n-2 STRPs(table 3), suggesting that their mutation rates may besimilar. Additionally, at the sequence level, the numbers
of perfect repeats in a 121-bp (CA)n-1 allele and thosein a 113 bp (CA)n-2 allele (both of which are the allelesmost common on Alu(1) chromosomes) are nearly iden-tical, which makes it less likely that the differential pat-tern of LD observed could be due to fewer perfect repeatsproducing a lower mutation rate of the 113-bp (CA)n-2 allele. Thus, it seems likely that recombination hasresulted in low levels of LD between (CA)n-1 and theAlu polymorphism (which are 22 kb apart), whereashigh levels of LD have been maintained between (CA)n-2 and the Alu polymorphism (which are 12.2 kb apart).Because of the loss of LD between (CA)n-1 and the PLATAlu, the haplotype history has become obscured, and ithas become difficult to infer the ancestral (CA)n-1/Aluhaplotype. However, the narrower distribution of (CA)n-1 alleles on Alu(1) chromosomes compared with Alu(2)chromosomes, with most alleles being 119–129 bp insize, suggests that the Alu-insertion event occurred on achromosome containing a (CA)n-1 allele in this smallersize range, possibly on a chromosome containing a 121-bp allele, which is the most common Alu(1) haplotypein Africa (fig. 3). Analysis of variation of the two di-nucleotide repeats on Alu(1) and Alu(2) haplotypes, aswell as of the breakdown of disequilibrium between themarkers, suggests that the Alu insertion occurred duringthe past 500,000 years (A. G. Clark and S. A. Tishkoff,unpublished data), whereas the global distribution of theAlu(1) allele suggests that the insertion event occurredprior to migration of modern humans out of Africa,∼100,000 years ago.
Human Evolutionary History
The (CA)n-1/Alu and (CA)n-2/Alu haplotype systemsare highly informative for reconstructing historical mi-gration and population-differentiation events, as dem-onstrated by the PCA plot of population-clusteringbased on haplotype-frequency variation (fig. 4). Theseresults are consistent with anthropological knowledge,results from studies of classical markers (Nei and Roy-choudhury 1993; Cavalli-Sforza et al. 1994; Nei 1995),and results from molecular markers from autosomes(Bowcock et al. 1991, 1994; Jorde et al. 1995, 1997;Nei 1995; Armour et al. 1996; Tishkoff 1996a, 1998a,1998b; Harding et al. 1997; Stoneking et al. 1997; Ziet-kiewicz 1997, 1998; Calafell et al. 1998; Kidd et al.1998, 2000; Harris and Hey 1999), mtDNA (Cann etal. 1987; Vigilant et al. 1989, 1991; Merriwether 1991;Penny et al. 1995), and Y chromosome DNA (Ham-mer 1995; Hammer et al. 1997, 1998; Underhill et al.1997). These studies suggest a recent and primary sub-division between African and non-African populations,high levels of divergence among African populations,and a recent shared common ancestry of non-Africanpopulations, from a population originating in Africa.

916
Table 7
Fisher’s Exact Test of Allele-Specific Pairwise LD, Estimated by Comparisons of Each Microsatellite Allele and Alu(+) and Alu(5) Alleles
HAPLOTYPE SYSTEM
AND POPULATION RESULTS OF FISHER’S EXACT TEST OF D FOR STRP AND Alu ALLELESa
99 109 111 113 115 117 119 121 123 125 127 129 131 133 135 137 139 141 143 145 147 149 151 153 155 157 159 161 163 165
(CA)n-1/Alu:
African:
Biaka (94) . . . . . 1* . . . . . .
Mbuti (68) . . 5* . 5* . . .
Herero (86) . . . . 5* . . 5* . . 1***
Kwengo (74) . . . . . . . . .
Nama (48) . . . . . 1* . .
Sekele (60) . . 5* . . 1* . .
Zu/Wasi (58) . . . . . 1**
Bantu (70) . . 1*** 1** . 5* 5* . . . . . .
Ewondo (68) . . 1*** . . 5** . . . . .
Bamileke (62) . 1** 1* . . . . . . . .
Wolof (120) . . . . 1*** . . 5** . . . . . . .
Somali (58) . 1** . 5*
Ethiopians (58) 1** . . . . .
Non-African:
Yemenites (74) . . .
Druze (110) . . . 5** .
Danes (100) 5* 1* . 1* . . .
Finns (68) . . . .
Chinese (84) . . . .
Japanese (82) 1** . . 5**
Yakuts (78) 1* . .
Ami (70) . . .
Atayal (72) . 5*** 1** .
Micronesians (58) . 5* 1** 5** . 1*
Nasio (48) 1* . .
Papua New Gui-
neans (178)
. 5*** . . . . . .
Cheyenne (108) . . 1* .
Maya (102) . 1*** 5* . .
Karitiana (104) .
Surui (92) . .
Ticuna (134) . . . .

917
103
105
107
109
111
113
115
117
119
121
123
125
127
129
131
133
135
137
139
141
143
145
147
149
151
153
(CA
) n-2
/Alu
:
Afr
ican
:
Bia
ka(1
30)
1*
**
..
1*
1*
5*
*.
..
..
..
.
Mbu
ti(7
6)1
**
*1
**
..
..
5*
*.
..
Her
ero
(86)
1*
1*
**
..
1*
..
..
.5
*5
*
Kw
engo
(74)
1*
1*
**
1*
..
5*
*.
..
..
.
Nam
a(5
0)1
**
*.
..
..
.
Seke
le(5
8)1
*1
**
1*
**
..
..
.
Zu/
Was
i(5
8)1
*1
**
*.
..
5*
Ban
tu(8
4).
1*
**
1*
..
..
..
..
.
Ew
ondo
(62)
1*
**
1*
**
..
..
.5
**
.
Bam
ileke
(60)
1*
1*
*1
**
*.
..
5*
.
Wol
of(1
22)
1*
**
1*
**
1*
**
..
5*
..
5*
5*
*5
**
Som
ali
(52)
.1
**
*5
*.
.5
*
Eth
iopi
ans
(118
).
.1
**
*1
*.
..
.5
*.
..
..
..
..
Non
-Afr
ican
:
Yem
enit
es(1
46)
..
..
..
..
..
Dru
ze(9
4)1
**
*.
1*
*.
.5
**
*
Dan
es(1
00)
.1
**
*1
**
.5
*5
*5
**
*5
**
Finn
s(7
0)1
**
*.
.5
*5
*5
*
Chi
nese
(84)
1*
**
5*
*.
.5
**
*.
Japa
nese
(84)
1*
**
5*
**
..
5*
5*
**
.
Yak
uts
(102
)1
*1
**
*.
5*
**
5*
.5
*
Am
i(7
2)5
*1
**
5*
..
.
Ata
yal
(80)
1*
**
..
5*
**
.
Mic
rone
sian
s(7
6)1
**
*5
**
*1
**
*.
.5
**
*.
Nas
ioi
(48)
..
..
..
Papu
aN
ewG
ui-
nean
s(1
72)
..
5*
**
5*
**
5*
**
..
5*
**
5*
**
5*
**
Che
yenn
e(8
6).
..
5*
May
a(7
8).
..
..
Kar
itia
na(1
00)
1*
**
5*
**
Suru
i(9
0).
Tic
una
(134
).
aA
dot
(.)
deno
tes
that
the
alle
leis
pres
ent
ata
freq
uenc
yhi
ghen
ough
toal
low
ava
lidte
stof
LD
tobe
perf
orm
ed(L
ewon
tin
1995
);bl
ank
cells
deno
teei
ther
alle
leab
senc
eor
alle
lefr
eque
ncy
solo
wth
ata
sign
ifica
ntte
stco
uld
not
bepe
rfor
med
;a
plus
sign
(1)
indi
cate
sth
atth
ere
isan
over
repr
esen
tati
onof
that
STR
Pal
lele
onan
Alu
(1)
hapl
otyp
eba
ckgr
ound
,an
da
min
ussi
gn(2
)in
dica
tes
that
ther
eis
anov
erre
pres
enta
tion
ofth
atST
RP
alle
leon
anA
lu(2
)ha
plot
ype
back
grou
nd.
*.
Pp
.05
**
.P
p.0
1*
**
.P
p.0
01

918 Am. J. Hum. Genet. 67:901–925, 2000
The intermediate position, between African and non-African populations, that the Ethiopian Jews and So-malis occupy in the PCA plot also has been observed inother genetic studies (Ritte et al. 1993; Passarino et al.1998) and could be due either to shared common an-cestry or to recent gene flow. The fact that the Ethiopiansand Somalis have a subset of the sub-Saharan Africanhaplotype diversity—and that the non-African popula-tions have a subset of the diversity present in Ethiopiansand Somalis—makes simple-admixture models lesslikely; rather, these observations support the hypothesisproposed by other nuclear-genetic studies (Tishkoff etal. 1996a, 1998a, 1998b; Kidd et al. 1998)—that pop-ulations in northeastern Africa may have diverged fromthose in the rest of sub-Saharan Africa early in the his-tory of modern African populations and that a subsetof this northeastern-African population migrated out ofAfrica and populated the rest of the globe. These con-clusions are supported by recent mtDNA analysis (Quin-tana-Murci et al. 1999). In light of the high varianceexpected on the basis of the stochastic effects of geneticdrift at a single locus, it is particularly striking that thePCA plot of populations so accurately reflects popula-tion relationships as predicted on the basis of commonancestry as well as on the basis of geographic and lin-guistic similarity. For example, in the PCA plot of Af-rican populations (fig. 4), the Khoisan speakers (Nama,Va/Sekele, Zu/Wasi, and Kwengo) all cluster together,the Biaka and Mbuti populations cluster together, andthe western-African, central-African, and southern-Af-rican Bantu-speaking populations cluster together. Thelatter cluster is predicted in light of linguistic evidenceand the archeological record that suggest a Bantu mi-gration from central Africa during the past 3,000 years(Clark 1959; Guthrie 1962; Greenberg 1963; Nurse etal. 1985). Additionally, the three Amazonian popula-tions (Surui, Karitiana, and Ticuna) cluster together, asdo the two North and Central American populations(Cheyenne and Maya). Interestingly, the Siberian Yakutand Japanese populations cluster with these NorthAmerican Indian populations. This is consistent with thehypothesis, based on linguistic, archeological, and ge-netic data, that modern Amerindians may have origi-nated from one or more populations migrating fromSiberia or other regions in northeastern Asia (Kidd et al.1991; Kidd and Kidd 1996; Kolman et al. 1996; Calafellet al. 1998; Starikovskaya et al. 1998; Karafet 1999;Schurr et al. 1999). The fact that these haplotype systemsare so informative for the inference of population historyis likely due to the combined use of highly variable STRPmarkers with the stable Alu-insertion polymorphism.
Tests of population subdivision that consider the highvariability of STRP haplotypes (DSW and DLR) demon-strate that Africa has levels of population subdivisionthat are higher than those of any other geographic region
(table 6). The high heterozygosity levels, high STRP var-iance, and high haplotype-diversity levels, within andbetween African populations, compared with popula-tions from all other geographic regions (table 5), suggestthat African populations have an older population his-tory and have maintained both a large effective popu-lation size and high levels of population subdivision.These results are consistent with results of studies ofother STRP haplotype systems (Tishkoff et al. 1996a,1998a, 1998b; Kidd et al. 1998; S. A. Tishkoff, A. G.Clark, and T. Jenkins, unpublished data), Alu elements( Sherry et al. 1997; Stoneking 1997; Harpending et al.1998), STRPs (Shriver et al. 1997; Calafell et al. 1998;Kimmel et al. 1998; Reich and Goldstein 1998; Releth-ford and Jorde 1999), Y-chromosome DNA (Hammeret al. 1997, 1998; Pritchard et al. 1999; Scozzari et al.1999), mtDNA (Rogers and Harpending et al. 1992;Sherry et al. 1994; Rogers and Jorde 1995), and cra-niometric data (Relethford and Harpending 1994; Re-lethford 1995), all of which suggest that African pop-ulations (a) may have expanded in size earlier than havenon-African populations and (b) have maintained alarger effective population size. Africans have manymore region-specific haplotypes, and, in general, non-Africans have a subset of the haplotypes present in Af-rica. Compared with African populations, the non-Af-rican populations have less haplotype diversity, more-extensive LD, and a similar pattern of haplotype vari-ation across geographic regions (e.g., Asia, Europe, Oce-ania, and the New World) (fig. 3 and table 7). Theseresults are consistent with both an appreciable foundereffect associated with migration out of Africa and a re-cent shared common ancestry of non-African popula-tions that has been followed by rapid population ex-pansion. In addition, there is no indication thatnon-African populations have descended from multiplemigrations from different source populations in Africa;rather, the shared pattern of variation among geograph-ically diverse non-African populations supports previousfindings (Tishkoff et al. 1996a, 1998a, 1998b; Calafellet al. 1998; Kidd et al. 1998) that indicate that all non-African populations have descended from a single sourcepopulation, most likely from northeastern Africa (al-though subsequent gene flow from Africa to Australo-Melanesia remains a possibility, as is discussed below).
The pattern of LD between the (CA)n-1 and (CA)n-2STRPs and the Alu polymorphism is distinct in Africansvis-a-vis non-Africans (table 7). With respect to the num-ber of alleles present at high frequency, the African pop-ulations have more haplotypes, more-divergent patternsof LD, and, overall, fewer significant LD values than donon-Africans. These results are consistent with the pat-tern of LD observed at several loci: CD4 (Tishkoff et al.1996a, 1998b), DM (Tishkoff et al. 1998a), DRD2(Kidd et al. 1998), and PAH (Kidd et al. 2000). Levels

Tishkoff et al.: STRP-Alu Haplotype Variation at PLAT 919
and patterns of LD depend on a number of factors, in-cluding initial conditions (e.g., population size), popu-lation structure, founder effect, admixture, and the dy-namics of molecular processes of mutation and re-combination. If mutation and recombination rates areassumed to have remained constant across populations,then the global pattern of LD observed at these loci isa reflection of the population and demographic histo-ries of these populations. The pattern of LD in Africanpopulations is consistent with a larger, more subdividedpopulation structure in Africa. The divergent pattern ofLD in non-African populations relative to African pop-ulations is likely the result of a founding event by oneor more small populations emerging from Africa duringthe past 100,000 years and expanding and spreadingthroughout the rest of the world (Stringer and Andrews1988; Stringer 1993). During this founding event, theparticular pattern of pairwise allelic association may dif-fer from that in the parental African population, becauseof the stochastic effects of drift during population found-ing. The pattern of LD established at the time of pop-ulation founding will be preserved during subsequentrapid population expansion, because of the decreasedeffects of genetic drift. However, there are some excep-tions. For the (CA)n-2/Alu haplotype system, the Oceanicand several New World populations lack the strong as-sociation, present in most other populations, betweenthe 113-bp allele and the Alu(1) allele. This is due toan increase in the frequency of 113/Alu(2) chromo-somes, possibly because of the effects of genetic drift insmall populations that have recently undergone found-ing events; for example, in the Rondonian Surui sample,the 113/Alu(1) and 113/Alu(2) haplotypes exist at iden-tical frequencies, resulting in complete linkage equilib-rium (fig. 3). Interestingly, in the Amazonian Ticunasample, only the 113/Alu(1) haplotype exists at highfrequency (fig. 3), demonstrating the strong effects ofgenetic drift within these small, isolated tribal popula-tions. These results also demonstrate that genetic driftcan result in either the establishment of higher levels ofLD, as likely occurred during migration out of Africa,or a decrease in disequilibrium, as occurred in some ofthe Oceanic and New World populations, for the (CA)n-2/Alu haplotype system. Thus, because of the stochasticeffects of genetic drift, we anticipate that there will besome heterogeneity among loci, in their global patternsof LD (Peterson et al. 1999). In the case of commonSNPs in autosomal genes, in which the variation maypredate the expansion out of Africa, patterns of fine-scale LD among sites within genes may show less geo-graphic variation (Clark et al. 1998). Genetic variationthat arose after the time of population founding wouldexhibit the highest variability. A systematic study of pat-terns of LD of SNPs, indels, and STRPS at multiple lociamong geographically diverse populations will thus pro-
vide a more precise reconstruction of modern humanpopulation and demographic history.
Implications for Oceanic-Island Population History
The high variability of STRP/Alu haplotype systemscan be particularly informative for the reconstruction ofhistoric migration events. For example, Papua New Gui-nean and Micronesian populations have haplotypes con-taining large-sized (149–173 bp) (CA)n-1 STRP allelesthat have not been observed in any other non-Africanpopulations but that have been observed in sub-SaharanAfrican populations, the latter of which have a contin-uous distribution of (CA)n-1 alleles up to 171 bp in size.These alleles are present on both Alu(1) and Alu(2)haplotype backgrounds. This observation is intriguingin light of hypotheses based on archeological, morpho-logical, and genetic evidence that suggest that there couldhave been early colonization of Papua New Guinea bya distinct wave of migration out of Africa across south-ern and eastern Asia and into Australo-Melanesia(Birdsell 1967; 1993, pp. 22–23; Lahr and Foley 1995;Harpending et al. 1996; Stoneking et al. 1997). Ar-cheological data indicate that Australia and NewGuinea, which, during the Pleistocene, were a singlelandmass referred to as “Sahul,” were occupied as earlyas 40,000–65,000 years ago (Roberts and Jones 1994;Jones 1995; O’Connell and Allen 1998; Johnson et al.1999; Miller et al. 1999; Redd and Stoneking 1999).Papua New Guinea highland populations are thoughtto be the descendants of the earliest migration into thisregion, whereas coastal Papua New Guinea populationsare thought to be admixed with Austronesian speakersoriginating from Southeast Asia who colonized coastalPapua New Guinea during the past 5,000 years (Bell-wood 1989; Redd and Stoneking 1999). The hypothesisof ancient ties between Papua New Guinean and Africanpopulations is supported by craniometric studies (How-ells 1989, pp. 37–79), as well as by genetic studies ofmtDNA variation (Redd and Stoneking 1999), autoso-mal sequence variation (Kofler et al. 1995), and poly-morphic Alu loci (Harpending et al. 1996; Stoneking etal. 1997), all of which show Papua New Guinea pop-ulations as clustering near the ancestral African root ofphylogenetic trees constructed from the data. However,analyses of classical genetic polymorphisms (Cavalli-Sforza et al. 1994) and of haplotype variation at theCD4 (Tishkoff et al. 1996a, 1998b) and DRD2 loci(Kidd et al. 1998) do not find evidence for a closer re-lationship of Papua New Guinea populations to Africansthan to non-Africans. Thus, these nuclear-haplotype andclassical-genetic data sets do not support an independentorigin of Australo-Melanesians from a different sourcepopulation in Africa, but they do not rule out the pos-sibility of an ancient migration event from Africa, for
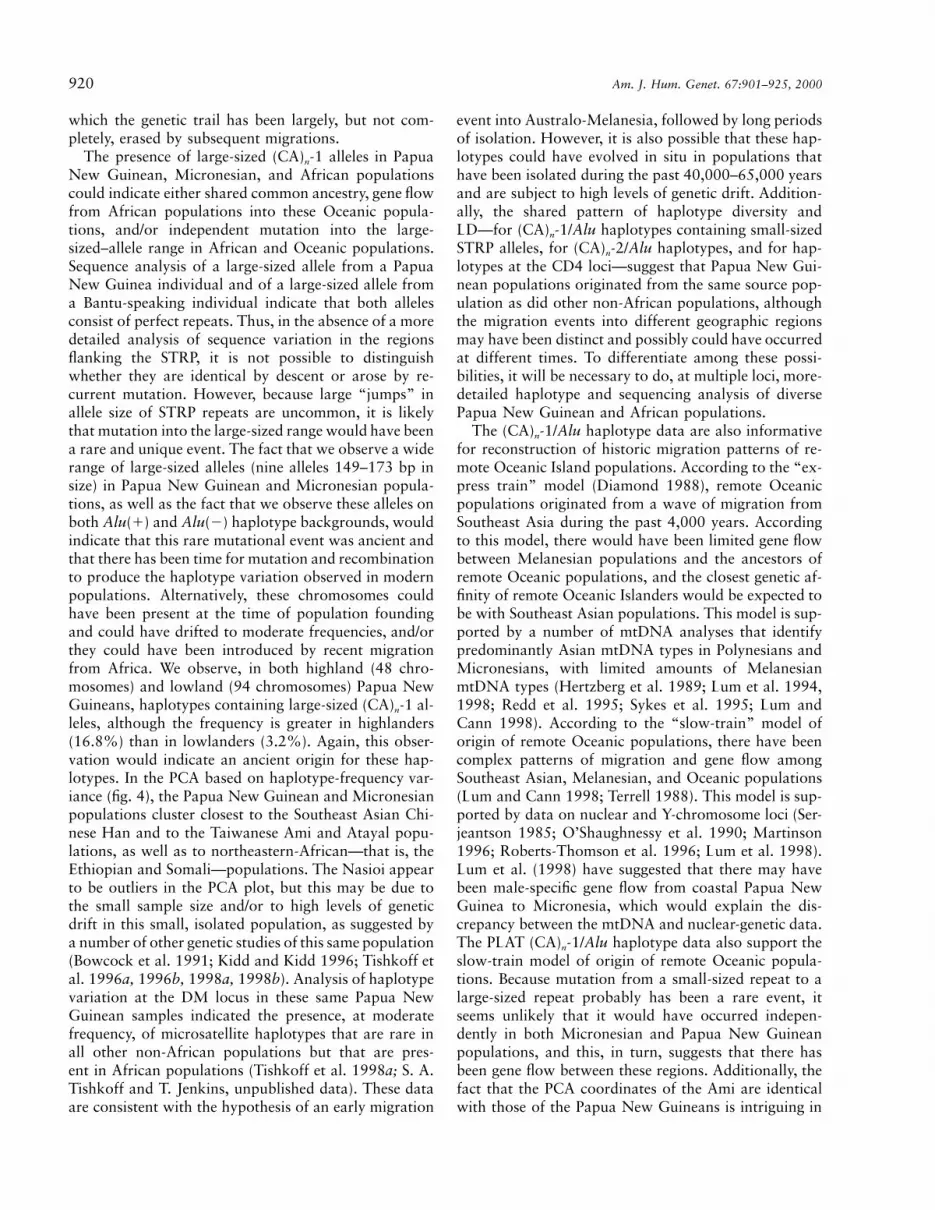
920 Am. J. Hum. Genet. 67:901–925, 2000
which the genetic trail has been largely, but not com-pletely, erased by subsequent migrations.
The presence of large-sized (CA)n-1 alleles in PapuaNew Guinean, Micronesian, and African populationscould indicate either shared common ancestry, gene flowfrom African populations into these Oceanic popula-tions, and/or independent mutation into the large-sized–allele range in African and Oceanic populations.Sequence analysis of a large-sized allele from a PapuaNew Guinea individual and of a large-sized allele froma Bantu-speaking individual indicate that both allelesconsist of perfect repeats. Thus, in the absence of a moredetailed analysis of sequence variation in the regionsflanking the STRP, it is not possible to distinguishwhether they are identical by descent or arose by re-current mutation. However, because large “jumps” inallele size of STRP repeats are uncommon, it is likelythat mutation into the large-sized range would have beena rare and unique event. The fact that we observe a widerange of large-sized alleles (nine alleles 149–173 bp insize) in Papua New Guinean and Micronesian popula-tions, as well as the fact that we observe these alleles onboth Alu(1) and Alu(2) haplotype backgrounds, wouldindicate that this rare mutational event was ancient andthat there has been time for mutation and recombinationto produce the haplotype variation observed in modernpopulations. Alternatively, these chromosomes couldhave been present at the time of population foundingand could have drifted to moderate frequencies, and/orthey could have been introduced by recent migrationfrom Africa. We observe, in both highland (48 chro-mosomes) and lowland (94 chromosomes) Papua NewGuineans, haplotypes containing large-sized (CA)n-1 al-leles, although the frequency is greater in highlanders(16.8%) than in lowlanders (3.2%). Again, this obser-vation would indicate an ancient origin for these hap-lotypes. In the PCA based on haplotype-frequency var-iance (fig. 4), the Papua New Guinean and Micronesianpopulations cluster closest to the Southeast Asian Chi-nese Han and to the Taiwanese Ami and Atayal popu-lations, as well as to northeastern-African—that is, theEthiopian and Somali—populations. The Nasioi appearto be outliers in the PCA plot, but this may be due tothe small sample size and/or to high levels of geneticdrift in this small, isolated population, as suggested bya number of other genetic studies of this same population(Bowcock et al. 1991; Kidd and Kidd 1996; Tishkoff etal. 1996a, 1996b, 1998a, 1998b). Analysis of haplotypevariation at the DM locus in these same Papua NewGuinean samples indicated the presence, at moderatefrequency, of microsatellite haplotypes that are rare inall other non-African populations but that are pres-ent in African populations (Tishkoff et al. 1998a; S. A.Tishkoff and T. Jenkins, unpublished data). These dataare consistent with the hypothesis of an early migration
event into Australo-Melanesia, followed by long periodsof isolation. However, it is also possible that these hap-lotypes could have evolved in situ in populations thathave been isolated during the past 40,000–65,000 yearsand are subject to high levels of genetic drift. Addition-ally, the shared pattern of haplotype diversity andLD—for (CA)n-1/Alu haplotypes containing small-sizedSTRP alleles, for (CA)n-2/Alu haplotypes, and for hap-lotypes at the CD4 loci—suggest that Papua New Gui-nean populations originated from the same source pop-ulation as did other non-African populations, althoughthe migration events into different geographic regionsmay have been distinct and possibly could have occurredat different times. To differentiate among these possi-bilities, it will be necessary to do, at multiple loci, more-detailed haplotype and sequencing analysis of diversePapua New Guinean and African populations.
The (CA)n-1/Alu haplotype data are also informativefor reconstruction of historic migration patterns of re-mote Oceanic Island populations. According to the “ex-press train” model (Diamond 1988), remote Oceanicpopulations originated from a wave of migration fromSoutheast Asia during the past 4,000 years. Accordingto this model, there would have been limited gene flowbetween Melanesian populations and the ancestors ofremote Oceanic populations, and the closest genetic af-finity of remote Oceanic Islanders would be expected tobe with Southeast Asian populations. This model is sup-ported by a number of mtDNA analyses that identifypredominantly Asian mtDNA types in Polynesians andMicronesians, with limited amounts of MelanesianmtDNA types (Hertzberg et al. 1989; Lum et al. 1994,1998; Redd et al. 1995; Sykes et al. 1995; Lum andCann 1998). According to the “slow-train” model oforigin of remote Oceanic populations, there have beencomplex patterns of migration and gene flow amongSoutheast Asian, Melanesian, and Oceanic populations(Lum and Cann 1998; Terrell 1988). This model is sup-ported by data on nuclear and Y-chromosome loci (Ser-jeantson 1985; O’Shaughnessy et al. 1990; Martinson1996; Roberts-Thomson et al. 1996; Lum et al. 1998).Lum et al. (1998) have suggested that there may havebeen male-specific gene flow from coastal Papua NewGuinea to Micronesia, which would explain the dis-crepancy between the mtDNA and nuclear-genetic data.The PLAT (CA)n-1/Alu haplotype data also support theslow-train model of origin of remote Oceanic popula-tions. Because mutation from a small-sized repeat to alarge-sized repeat probably has been a rare event, itseems unlikely that it would have occurred indepen-dently in both Micronesian and Papua New Guineanpopulations, and this, in turn, suggests that there hasbeen gene flow between these regions. Additionally, thefact that the PCA coordinates of the Ami are identicalwith those of the Papua New Guineans is intriguing in

Tishkoff et al.: STRP-Alu Haplotype Variation at PLAT 921
light of other studies suggesting that Austronesian-speaking indigenous Taiwanese populations (such as theAmi and Atayal) played a significant role in the Austro-nesian expansion into Papua New Guinean and otherregions of Oceania (Bellwood 1978, 1985, 1995; Meltonet al. 1995, 1998; Sykes et al. 1995; Redd and Stoneking1999). Further studies of autosomal, Y-chromosome,and mtDNA markers will help us to distinguish amongthese models of Oceanic Island origins.
Acknowledgments
We thank Nuria Navarro-Coy for technical assistance. Wethank Gabriella Spedini at the University of Rome “La Sap-ienza” for the Bamileke and Ewondo samples; Sylvana San-tachiarra-Benerecetti for the Wolof samples; and BatshevaBonne-Tamir for samples from the Ethiopian Jewish, YemeniteJewish, and Druze populations. We also thank the many otherindividuals, particularly the members of the indigenous pop-ulations studied, who have contributed DNA samples. Thisproject was funded by a National Science Foundation (NSF)Sloan postdoctoral fellowship, NSF grant BCS-9905396, anda Burroughs Wellcome Fund Career Award (all to S.A.T.); Na-tional Institutes of Health grant GM57672 (to K.K.K.); NSFgrant SBR-9632509 (to J.R.K.); a grant from the Sloan Foun-dation (to K.K.K. and J.R.K.); funding from the South AfricanMedical Research Council and the University of the Witwa-tersrand (to T.J.); NSF grant 9423118 (to M.S.); and Nation-al Science Council, Taiwan, ROC grant NSC 88-2314-B-106-081 (to R.-B. L.). S.A.T. would like to acknowledge the hos-pitality of the Jenkins Laboratory, the South African Instituteof Medical Research, and the University of the Witwatersrand,who hosted her as a Visiting Research Scientist duringJune–September 1997, during which time the data on thesouthern-African populations were collected. We thank JeffreyLong and an anonymous reviewer for comments on themanuscript.
Electronic-Database Information
Accession numbers and URLs for data in this article are asfollows:
Kidd Lab Home Page, http://info.med.yale.edu/genetics/kkidd(for haplotype frequencies, available via ALFRED)
Microsat (software), http://lotka.stanford.edu/microsatNCBI GenBank Overview, http://www.ncbi.nlm.nih.gov/Web
/Genbank (for human PLAT reference sequence [accessionnumber K03021])
Tishkoff lab Web page, http://www.life.umd.edu/biology/faculty/tishkoff/index.html (for haplotype frequencies)
References
Armour JA, Anttinen T, May CA, Vega EE, Sajantila A, KiddJ R, Kidd KK, Bertranpetit J, Paabo S, Jeffreys AJ (1996)Minisatellite diversity supports a recent African origin formodern humans. Nat Genet 13:154–160
Barr CL, Kidd KK (1993) Population frequencies of the A1
allele at the dopamine D2 receptor locus. Biol Psychiatry34(4): 204–209
Batzer MA, Arcot SS, Phinney JW, Alegria-Hartman M, KassDH, Milligan SM, Kimpton C, Gill P, Hochmeister M, Ioan-nou PA, Herrera RJ, Boudreau DA, Scheer WD, Keats BJ,Deininger PL, Stoneking M (1996) Genetic variation of re-cent Alu insertions in human populations. J Mol Evol 42:22–29
Batzer MA, Gudi VA, Mena JC, Foltz DW, Herrera RJ, Dein-inger PL (1991) Amplification dynamics of human-specific(HS) Alu family members. Nucleic Acids Res 19:3619–3623
Batzer MA, Stoneking M, Alegria-Hartman M, Bazan H, KassDH, Shaikh TH, Novick GE, Ioannou PA, Scheer WD, Her-rera RJ, Deininger PL (1994) African origin of human-spe-cific polymorphic Alu insertions. Proc Natl Acad Sci USA91:12288–12292
Bellwood PS (1978) Man’s conquest of the Pacific: the pre-history of Southeast Asia and Oceania. Oxford UniversityPress, New York
——— (1985) Prehistory of the Indo-Malayan archipelago.Academic Press, London
——— (1989) The colonization of the Pacific: some currenthypotheses. In: Hill AVS, Serjeantson SW (eds) The colo-nization of the Pacific: a genetic trail. Oxford UniversityPress, New York, pp 1–59
——— (1995) The Austronesian prehistory in SoutheastAsia: homeland, expansion, and transformation. In: Bell-wood P, Fox JJ, Tryon D (eds) The Austronesians: historicaland comparative perspectives. Department of Anthropology,Comparative Austronesian Project, Research School of Pa-cific and Asian Studies, Australian National University, Can-berra, pp 96–111
Bertranpetit J, Calafell F (1996) Genetic and geographical var-iability in cystic fibrosis: evolutionary considerations. CibaFound Symp 197:97–114
Birdsell JB (1967) Preliminary data on the trihybrid origin ofthe Australian Aborigines. Archeol Phys Anthropol Oceania2:100–155
——— (1993) Microevolutionary patterns in Aboriginal Aus-tralia: a gradient analysis of clines. Oxford University Press,New York
Blanquer-Maumont A, Crouau-Roy B (1995) Polymorphism,monomorphism, and sequences in conserved microsatellitesin primate species. J Mol Evol 41(4): 492–497
Bowcock AM, Kidd JR, Mountain JL, Hebert JM, CarotenutoL, Kidd KK, Cavalli-Sforza LL (1991) Drift, admixture, andselection in human evolution: a study with DNA polymor-phisms. Proc Natl Acad Sci USA 88:839–843
Bowcock AM, Ruiz-Linares A, Tomfohrde J, Minch E, KiddJR, Cavalli-Sforza LL (1994) High resolution of humanevolutionary trees with polymorphic STRPs. Nature 368:455–457
Brinkmann B, Klintschar M, Neuhuber F, Huhne J, Rolf B(1998) Mutation rate in human STRPs: influence of thestructure and length of the tandem repeat. Am J Hum Genet62:1408–1415
Calafell F, Shuster A, Speed WC, Kidd JR, Black FL, Kidd KK(1999) Genealogy reconstruction from short tandem repeatgenotypes in an Amazonian population. Am J Phys An-thropol 108(2): 137–146

922 Am. J. Hum. Genet. 67:901–925, 2000
Calafell F, Shuster A, Speed WC, Kidd JR, Kidd KK (1998)Short tandem repeat polymorphism evolution in humans.Eur J Hum Genet 6:38–49
Cann RL, Stoneking M, Wilson AC (1987) MitochondrialDNA and human evolution. Nature 325:31–36
Castiglione CM, Deinard AS, Speed WC, Sirugo G, Rosen-baum HC, Zhang Y, Grandy DK, Grigorenko EL, Bonne-Tamir B, Pakstis AJ, Kidd JR, Kidd KK (1995) Evolution ofhaplotypes at the DRD2 locus. Am J Hum Genet 57:1445
Cavalli-Sforza LL, Menozzi P, Piazza A (1994) The historyand geography of human genes. Princeton University Press,Princeton, NJ
Chakraborty R, Kimmel M, Stivers DN, Davison LJ, Deka R(1997) Relative mutation rates at di-, tri-, and tetranucle-otide STRP loci. Proc Natl Acad Sci USA 94:1041–1046
Clark AG, Weiss KM, Nickerson DA, Taylor SL, BuchananA, Stengaird J, Salomaa V, Vartiainen E, Perola M, Boer-winkle E, Sing CF (1998) Haplotype structure and popu-lation genetic inferences from nucleotide-sequence variationin human lipoprotein lipase. Am J Hum Genet 63:595–612
Clark DJ (1959) The prehistory of southern Africa. PenguinBooks, Middlesex, England
Degen SJ, Rajput B, Reich E (1986) The human tissue plas-minogen activator gene. J Biol Chem 261:6972–6985
Deinard A, Kidd K (1999) Evolution of a HOXB6 intergenicregion within the great apes and humans. J Hum Evol 36:687–703
Destro-Bisol G, Presciuttini S, d’Aloja E, Dobosz M, SpediniG, Pascali VL (1994) Genetic variation at the ApoB 3′ HVR,D2S44, and D7S21 loci in the Ewondo ethnic group of Cam-eroon. Am J Hum Genet 55:168–174
Diamond J (1988) Express train to Polynesia. Nature 336:307–308
Di Rienzo A, Donnelly P, Toomajian C, Sisk B, Hill A, Petzl-Erler ML, Haines GK, Barch DH (1998) Heterogeneity ofSTRP mutations within and between loci, and implicationsfor human demographic histories. Genetics 148:1269–1284
Di Rienzo A, Peterson AC, Garza JC, Valdes AM, Slatkin M,Freimer NB (1994) Mutational processes of simple-sequencerepeat loci in human populations. Proc Natl Acad Sci USA91:3166–3170
Garza JC, Freimer NB (1996) Homoplasy for size at micro-satellite loci in humans and chimpanzees. Genome Res 6(3):211–217
Goldman D, Brown GL, Albaugh B, Robin R, Goodson S,Trunzo M, Akhtar L, Lucas-Derse L, Long J, Linnoila M,Dean M (1993) DRD2 dopamine receptor genotype, linkagedisequilibrium, and alcoholism in American Indians andother populations. Alcohol Clin Exp Res 17:199–204
Goldstein DB, Ruiz Linares A, Cavalli-Sforza LL, FeldmanMW (1995) Genetic absolute dating based on STRPs andthe origin of modern humans. Proc Natl Acad Sci USA 92:6723–6727
Greenberg JH (1963) The languages of Africa. Indiana Uni-versity Press, Bloomington
Grimaldi MC, Crouau-Roy B (1997) Microsatellite allelic ho-moplasy due to variable flanking sequences. J Mol Evol 44:336–340
Guo SW, Thompson EA (1992) Performing the exact test of
Hardy-Weinberg proportion for multiple alleles. Biometrics48:361–372
Guthrie M (1962) Some developments in the prehistory of theBantu origins. J Afr Hist 3:273–282
Hammer MF (1995) A recent common ancestry for human Ychromosomes. Nature 378:376–378
Hammer MF, Karafet T, Rasanayagam A, Wood ET, AltheideTK, Jenkins T, Griffiths RC, Templeton AR, Zegura SL(1998) Out of Africa and back again: nested cladistic anal-ysis of human Y chromosome variation. Mol Biol Evol 15:427–441
Hammer MF, Spurdle AB, Karafet T, Bonner MR, Wood ET,Novelletto A, Malaspina P, Mitchell RJ, Horai S, Jenkins T,Zegura SL (1997) The geographic distribution of human Ychromosome variation. Genetics 145:787–805
Harding RM, Fullerton SM, Griffiths RC, Bond J, Cox MJ,Schneider JA, Moulin DS, Clegg JB (1997) Archaic Africanand Asian lineages in the genetic ancestry of modern hu-mans. Am J Hum Genet 60:772–789
Harpending H, Batzer M, Gurven M, Jorde L, Rogers A,Sherry S (1998) Genetic traces of ancient demography. ProcNatl Acad Sci USA 95:1961–1967
Harpending HC, Relethford J, Sherry ST (1996) Methodsand models for understanding human diversity. In: BoyceAJ, Mascie-Taylor CGN (eds) Molecular biology and hu-man diversity. Cambridge University Press, Cambridge, pp288–299
Harpending HC, Sherry ST, Rogers AR, Stoneking M (1993)Genetic structure of ancient human populations. Curr An-thropol 34:483–496
Harris EE, Hey J (1999) X chromosome evidence for ancienthuman histories. Proc Natl Acad Sci USA 96:3320–3324
Hastbacka J, de la Chapelle A, Kaitila I, Sistonen P, WeaverA, Lander E (1992) Linkage disequilibrium mapping in iso-lated founder populations: diastrophic dysplasia in Finland.Nat Genet 2:204–211
Hawley ME, Kidd KK (1995) HAPLO: a program using theEM algorithm to estimate the frequencies of multi-site hap-lotypes. J Hered 86:409–411
Hertzberg M, Mickleson KN, Serjeantson SW, Prior JF, TrentRJ (1989) An Asian-specific 9-bp deletion of mitochondrialDNA is frequently found in Polynesians. Am J Hum Genet44:504–510
Howells WW (1989) Skull shapes and the map: craniometricanalyses in the dispersion of modern Homo. Harvard Uni-versity Press, Cambridge, MA
Hudson RR, Boos DD, Kaplan NL (1992) A statistical test fordetecting geographic subdivision. Mol Biol Evol 9:138–151
Johnson BJ, Miller GH, Fogel ML, Magee JW, Gagan MK,Chivas AR (1999) 65,000 years of vegetation change in cen-tral Australia and the Australian summer monsoon. Science284:1150–1152
Jones R (1995) Tasmanian archaeology: establishing the se-quences. Annu Rev Anthropol 24:423–446
Jorde LB, Bamshad MJ, Watkins WS, Zenger R, Fraley AE,Krakowiak PA, Carpenter KD, Soodyall H, Jenkins T, Rog-ers AR (1995) Origins and affinities of modern humans: acomparison of mitochondrial and nuclear genetic data. AmJ Hum Genet 57:523–538

Tishkoff et al.: STRP-Alu Haplotype Variation at PLAT 923
Jorde LB, Rogers AR, Bamshad M, Watkins WS, KrakowiakP, Sung S, Kere J, Harpending HC (1997) STRP diversityand the demographic history of modern humans. Proc NatlAcad Sci USA 94:3100–3103
Karafet TM, Zegura SL, Posukh O, Osipova L, Bergen A, LongJ, Goldman D, et al (1999) Ancestral Asian source(s) of newworld Y-chromosome founder haplotypes. Am J Hum Genet64:817–831
Kidd JR, Black FL, Weiss KM, Balazs I, Kidd KK (1991) Stud-ies of three Amerindian populations using nuclear DNApolymorphisms. Hum Biol 63:775–794
Kidd JR, Pakstis AJ, Zhao H, Lu RB, Okonofua FE, OdunsiA, Grigorenko E, Tamir BB, Friedlaender J, Schulz LO, Par-nas J, Kidd KK (2000) Haplotypes and linkage disequilib-rium at the phenylalanine hydroxylase locus, PAH, in aglobal representation of populations. Am J Hum Genet 66:1882–1899
Kidd, KK, Kidd JR (1996) A nuclear perspective on humanevolution. In: Boyce AJ, Mascie-Taylor CGN (eds) Molec-ular biology and human diversity. Cambridge UniversityPress, Cambridge, pp 242–264
Kidd KK, Morar B, Castiglione CM, Zhao H, Pakstis AJ, SpeedWC, Bonne-Tamir B, Lu RB, Goldman D, Lee C, Nam YS,Grandy DK, Jenkins T, Kidd JR (1998) A global survey ofhaplotype frequencies and linkage disequilibrium at theDRD2 locus. Hum Genet 103:211–227
Kimmel M, Chakraborty R, King JP, Bamshad M, WatkinsWS, Jorde LB (1998) Signatures of population expansion inSTRP repeat data. Genetics 148:1921–1930
Kofler A, Braun A, Jenkins T, Serjeantson SW, Cleve H (1995)Characterization of mutants of the vitamin-D-binding pro-tein/group specific component: GC aborigine (1A1) fromAustralian aborigines and South African blacks, and 2A9from south Germany. Vox Sang 68:50–54
Kolman CJ, Sambuughin N, Bermingham E (1996) Mito-chondrial DNA analysis of Mongolian populations and im-plications for the origin of New World founders. Genetics142:1321–1334
Kumar S, Hedges SB (1998) A molecular timescale for verte-brate evolution. Nature 392:917–920
Lahr MM, Foley R (1995) Multiple dispersals and modernhuman origins. Evol Anthropol 3:48–50
Lewontin RC (1964) The interaction of selection and linkage.I. General considerations: heterotic models. Genetics 49:49–67
——— (1995) The detection of linkage disequilibrium in mo-lecular sequence data. Genetics 140:377–388
Lichter JB, Barr CL, Kennedy JL, Van Tol HH, Kidd KK, LivakKJ (1993) A hypervariable segment in the human dopaminereceptor D4 (DRD4) gene. Hum Mol Genet 2:767–773
Lum JK, Cann RL (1998) mtDNA and language support acommon origin of Micronesians and Polynesians in IslandSoutheast Asia. Am J Phys Anthropol 105:109–119
Lum JK, Cann RL, Martinson JJ, Jorde LB (1998) Mitochon-drial and nuclear genetic relationships among Pacific Islandand Asian populations. Am J Hum Genet 63:613–624
Lum JK, Rickards O, Ching C, Cann RL (1994) Polynesianmitochondrial DNAs reveal three deep maternal lineageclusters. Hum Biol 66:567–590
Martinson JJ (1996) Molecular perspectives on the coloniza-tion of the Pacific. In: Boyce AJ, Macie-Taylor CGN (eds)Molecular biology and human diversity. Cambridge Uni-versity Press, Cambridge, pp 171–195
Melton T, Clifford S, Martinson J, Batzer M, Stoneking M(1998) Genetic evidence for the proto-Austronesian home-land in Asia: mtDNA and nuclear DNA variation in Tai-wanese aboriginal tribes. Am J Hum Genet 63:1807–1823
Melton T, Peterson R, Redd AJ, Saha N, Sofro AS, MartinsonJ, Stoneking M (1995) Polynesian genetic affinities withSoutheast Asian populations as identified by mtDNA anal-ysis. Am J Hum Genet 57:403–414
Merriwether DA, Clark AG, Ballinger SW, Schurr TG, Sood-yall H, Jenkins T, Sherry ST, Wallace DC (1991) The struc-ture of human mitochondrial DNA variation. J Mol Evol33:543–555
Miller GH, Magee JW, Johnson BJ, Fogel ML, Spooner NA,McCulloch MT, Ayliffe LK (1999) Pleistocene extinction ofGenyornis newtoni: human impact on Australian mega-fauna. Science 283:205–208
Nei M (1995) Genetic support for the out-of-Africa theory ofhuman evolution. Proc Natl Acad Sci USA 92:6720–6722
Nei M, Roychoudhury AK (1993) Evolutionary relationshipsof human populations on a global scale. Mol Biol Evol 10:927–943
Novick GE, Novick CC, Yunis J, Yunis E, Antunez de MayoloP, Scheer WD, et al (1998) Polymorphic Alu insertions andthe Asian origin of Native American populations. Hum Biol70:23–39
Nurse GT, Weiner JS, Jenkins T (1985) The peoples of southernAfrica and their affinities. Claredon Press, Oxford
O’Connell JF, Allen J (1998) When did humans first arrive ingreater Australia and why is it important to know? EvolAnthropol 6:132–146
O’Shaughnessy DF, Hill AV, Bowden DK, Weatherall DJ, CleggJB (1990) Globin genes in Micronesia: origins and affinitiesof Pacific Island peoples. Am J Hum Genet 46:144–155
Paetkau D, Waits LP, Clarkson PL, Craighead L, Strobeck C(1997) An empirical evaluation of genetic distance statisticsusing STRP data from bear (Ursidae) populations. Genetics147:1943–1957
Passarino G, Semino O, Quintana-Murci L, Excoffier L, Ham-mer M, Santachiara-Benerecetti AS (1998) Different geneticcomponents in the Ethiopian population, identified bymtDNA and Y-chromosome polymorphisms. Am J Hum Ge-net 62:420–434
Penny D, Steel M, Waddell PJ, Hendy MD (1995) Improvedanalyses of human mtDNA sequences support a recent Af-rican origin for Homo sapiens. Mol Biol Evol 12:863–882
Perna NT, Batzer MA, Deininger PL, Stoneking M (1992) Aluinsertion polymorphism: a new type of marker for humanpopulation studies. Hum Biol 64:641–648
Peterson RJ, Goldman D, Long JC (1999) Effects of worldwidepopulation subdivision on ALDH2 linkage disequilibrium.Genome Res 9:844–852
Pritchard JK, Seilestad MT, Perez-Lezaun A, Feldman MW(1999) Population growth of human Y chromosomes: astudy of Y chromosome microsatellites. Mol Biol Evol 16:1791–1798

924 Am. J. Hum. Genet. 67:901–925, 2000
Quintana-Murci L, Semino O, Bandelt HJ, Passarino G,McElreavey K, Santachiara-Benerecetti AS (1999) Geneticevidence of an early exit of Homo sapiens sapiens fromAfrica through eastern Africa. Nat Genet 23:437–441
Rannalla B, Slatkin M (1998) Likelihood analysis of disequi-librium mapping, and related problems. Am J Hum Genet62:459–473
Redd AJ, Stoneking M (1999) Peopling of Sahul: mtDNA var-iation in aboriginal Australian and Papua New Guineanpopulations. Am J Hum Genet 65:808–828
Redd AJ, Takezaki N, Sherry ST, McGarvey ST, Sofro AS,Stoneking M (1995) Evolutionary history of the COII/t-RNALys intergenic 9 base pair deletion in human mito-chondrial DNAs from the Pacific. Mol Biol Evol 12:604–615
Reich DE, Goldstein DB (1998) Genetic evidence for a Pale-olithic human population expansion in Africa. Proc NatlAcad Sci USA 95:8119–8123
Relethford JH (1995) Genetics and modern human origins.Evol Anthropol 4:53–63
Relethford JH, Harpending HC (1994) Craniometric varia-tion, genetic theory, and modern human origins. Am J PhysAnthropol 95:249–270
Relethford JH, Jorde LB (1999) Genetic evidence for largerAfrican population size during recent human evolution. AmJ Phys Anthropol 108:251–260
Ridker PM, Baker MT, Hennekens CH, Stampfer MJ, VaughanDE (1997) Alu-repeat polymorphism in the gene coding fortissue-type plasminogen activator (t-PA) and risks of myo-cardial infarction among middle-aged men. ArteriosclerThromb Vasc Biol 17:1687–1690
Risch N, de Leon D, Ozelius L, Kramer P, Almasy L, SingerB, Fahn S, Breakefield X, Bressman S (1995) Genetic analysisof idiopathic torsion dystonia in Ashkenazi Jews and theirrecent descent from a small founder population. Nat Genet9:152–159
Ritte U, Neufeld E, Broit M, Shavit D, Motro U (1993) Thedifferences among Jewish communities—maternal and pa-ternal contributions. J Mol Evol 37:435–440
Roberts RG, Jones R (1994) Luminescence dating of sedi-ments: new light on the human colonization of Australia.Aust Aboriginal Stud 2:2–17
Roberts-Thomson JM, Martinson JJ, Norwich JT, HardingRM, Clegg JB, Boettcher B (1996) An ancient common or-igin of Aboriginal Australians and New Guinean highland-ers is supported by b-globin haplotype analysis. Am J HumGenet 58:1017–1024
Rogers AR, Harpending HC (1992) Population growth makeswaves in the distribution of pairwise genetic differences. MolBiol Evol 9:552–569
Rogers AR, Jorde LB (1995) Genetic evidence on modern hu-man origins. Hum Biol 67:1–36
Rosenbaum HC, Deinard A (1998) Caution before claim: anoverview of microsatellite analysis. In: Desalle R, Schier-water B (eds) Molecular approaches to ecology and evolu-tion. Birkhauser, Basel, pp 87–106
Rousset F (1996) Equilibrium values of measures of populationsubdivision for stepwise mutation processes. Genetics 142:1357–1362
Rousset F, Raymond M (1995) Testing heterozygote excess anddeficiency. Genetics 140:1413–1409
Sadler LA, Blanton SH, Daiger SP (1991) Dinucleotide repeatpolymorphism at the human tissue plasminogen activatorgene (PLAT). Nucleic Acids Res 19:6058
Schurr TG, Sukernik RI, Starikovskaya YB, Wallace DC (1999)Mitochondrial DNA variation in Koryaks and Itel’men:population replacement in the Okhotsk Sea-Bering Sea re-gion during the Neolithic. Am J Phys Anthropol 108:1–39
Scozzari R, Cruciani F, Santolamazza P, Malaspina P, TorroniA, Sellitto D, Arredi B, Destro-Bisol G, De Stefano G, Rick-ards O, Martinez-Labarga C, Modiano D, Biondi G, MoralP, Olckers A, Wallace DC, Novelletto A (1999) Combineduse of biallelic and STRP Y-chromosome polymorphisms toinfer affinities among African populations. Am J Hum Genet65:829–846
Scozzari R, Torroni A, Semino O, Sirugo G, Brega A, Santa-chiara-Benerecetti AS (1988) Genetic studies on the Senegalpopulation. I. Mitochondrial DNA polymorphisms. Am JHum Genet 43:534–544
Serre JL, Simon-Bouy B, Mornet E, Jaume-Roig B, Balasso-poulou A, Schwartz M, Taillandier A, Boue J, Boue A (1990)Studies of RFLP closely linked to the cystic fibrosis locusthroughout Europe lead to new considerations in popula-tions genetics. Hum Genet 84:449–554
Serjeantson SW (1985) Migration and admixture in the Pacific:insights provided by human leucocyte antigens. In: Kirk R,Szathmary E (eds) Out of Asia: peopling the Americas andthe Pacific. Journal of Pacific History, Canberra, pp 133–145
Sherry ST, Harpending HC, Batzer MA, Stoneking M (1997)Alu evolution in human populations: using the coalescentto estimate effective population size. Genetics 147:1977–1982
Sherry ST, Rogers AR, Harpending H, Soodyall H, Jenkins T,Stoneking M (1994) Mismatch distributions of mtDNA re-veal recent human population expansions. Hum Biol 66:761–775
Shriver MD, Jin L, Boerwinkle E, Deka R, Ferrell RE, Chak-raborty RA (1995) Novel measure of genetic distance forhighly polymorphic tandem repeat loci. Mol Biol Evol 12:914–920
Shriver MD, Jin L, Chakraborty R, Boerwinkle E (1993)VNTR allele frequency distributions under the stepwise mu-tation model: a computer simulation approach. Genetics134:983–993
Shriver MD, Jin L, Ferrell RE, Deka R (1997) STRP datasupport an early population expansion in Africa. GenomeRes 7:586–591
Sokal RR, Rohlf J (1995) Biometry, 3d ed. WH Freedman,New York
Soodyall H, Vigilant L, Hill AV, Stoneking M, Jenkins T (1996)mtDNA control-region sequence variation suggests multipleindependent origins of an “Asian-specific” 9-bp deletion insub-Saharan Africans. Am J Hum Genet 58:595–608
Spedini G, Destro-Bisol G, Mondovi S, Kaptue L, Taglioli L,Paoli G (1999) The peopling of sub-Saharan Africa: the casestudy of Cameroon. Am J Phys Anthropol 110:143–162
Spurdle A, Jenkins T (1992) Y chromosome probe p49a de-tects complex PvuII haplotypes and many new TaqI hap-lotypes in southern African populations. Am J Hum Genet50:107–125
Starikovskaya YB, Sukernik RI, Schurr TG, Kogelnik AM,

Tishkoff et al.: STRP-Alu Haplotype Variation at PLAT 925
Wallace DC (1998) mtDNA diversity in Chukchi and Si-berian Eskimos: implications for the genetic history of An-cient Beringia and the peopling of the New World. Am JHum Genet 63:1473–1491
Steeds R, Adams M, Smith P, Channer K, Samani NJ (1998)Distribution of tissue plasminogen activator insertion/dele-tion polymorphism in myocardial infarction and controlsubjects. Thromb Haemost 79:980–984
Stephens JC, Reich DE, Goldstein DB, Shin HD, Smith MW,Carrington M, Winkler C, et al (1998) Dating the origin ofthe CCR5-Delta32 AIDS-resistance allele by the coalescenceof haplotypes. Am J Hum Genet 62:1507–1515
Stoneking M, Fontius JJ, Clifford SL, Soodyall H, Arcot SS,Saha N, Jenkins T, Tahir MA, Deininger PL, Batzer MA(1997) Alu insertion polymorphisms and human evolution:evidence for a larger population size in Africa. Genome Res7:1061–1071
Stoneking M, Jorde LB, Bhatia K, Wilson AC (1990) Geo-graphic variation in human mitochondrial DNA from PapuaNew Guinea. Genetics 124:717–733
Stringer CB (1993) New issues in modern human origins. In:Rasmussen T (ed) The origin and evolution of humans andhumanness. Jones & Bartlett, Boston, pp 75–94
Stringer CB, Andrews P (1988) Genetic and fossil evidence forthe origin of modern humans. Science 239:1263–1268
Sykes B, Leiboff A, Low-Beer J, Tetzner S, Richards M (1995)The origins of the Polynesians: an interpretation from mitochondrial lineage analysis. Am J Hum Genet 57:1463–1475
Tautz D, Schlotterer C (1994) Simple sequences. Curr OpinGenet Dev 4:832–837
Terrell J (1988) History as a family tree, history as an entangledbank: constructing images and interpretations of prehistoryin the South Pacific. Antiquity 62:642–657
Thomas W, Drayna D (1992) A polymorphic dinucleotide re-peat in intron 1 of the human tissue plasminogen activatorgene. Hum Mol Genet 1:138
Tishkoff SA, Dietzsch E, Speed W, Pakstis AJ, Cheung K, KiddJR, Bonne-Tamir B, Santachiara-Benerecetti A-S, Moral P,Watson E, Krings M, Paabo S, Risch N, Jenkins T, KiddKK (1996a) Global patterns of linkage disequilibrium at theCD4 locus and modern human origins. Science 271:1380–1387
Tishkoff SA, Goldman A, Calafell F, Speed WC, Dienard AS,Bonne-Tamir B, Kidd JR, Pakstis AJ, Jenkins T, Kidd KK(1998a) A global haplotype analysis of the myotonic dys-
trophy locus: implications for the evolution of modern hu-mans and for the origin of myotonic dystrophy mutations.Am J Hum Genet 62:1389–1402
Tishkoff SA, Kidd KK, Clark AG (1998b) Inferences of modernhuman origins from variation in CD4 haplotypes. In: Uyen-oyama MK, von Haesler A (eds) Proceedings of the trina-tional workshop on molecular evolution. Duke UniversityPress, Raleigh-Durham, NC, pp 181–198
Tishkoff SA, Pakstis AJ, Ruano G, Kidd KK (2000) The ac-curacy of statistical methods for estimation of haplotypefrequencies: an example from the CD4 locus. Am J HumGenet 67:518–522
Tishkoff SA, Ruano G, Kidd JR, Kidd KK (1996b) Distributionand frequency of a polymorphic Alu insertion at the PLATlocus in humans. Hum Genet 97:759–764
Valdes AM, Slatkin M, Freimer MB (1993) Allelic frequenciesat STRP loci: the stepwise mutation model revisited. Ge-netics 133:737–749
Vigilant L, Pennington R, Harpending H, Kocher TD, WilsonAC (1989) Mitochondrial DNA sequences in single hairsfrom a southern African population. Proc Natl Acad Sci USA86:9350–9354
Vigilant L, Stoneking M, Harpending H, Hawkes K, WilsonAC (1991) African populations and the evolution of humanmitochondrial DNA. Science 253:1503–1507
Underhill PA, Jin L, Lin AA, Medhi SQ, Jenkins T, VollrathD, Davis RW, Cavalli-Sforza LL, Oefner PJ (1997) Detectionof numerous Y chromosome biallelic polymorphisms by de-naturing high-performance liquid chromatography. GenomeRes 7:996–1005
Weber JL, Wong C (1993) Mutation of human short tandemrepeats. Hum Mol Genet 2:1123–1128
Weir BS, Cockerham CC (1984) Estimating F statistics for theanalysis of population structure. Evolution 38:1358–1370
Wilson AC, Sarich VMA (1969) Molecular time scale for hu-man evolution. Proc Natl Acad Sci USA 63:1088–1093
Wright S (1931) Evolution in Mendelian populations. Genetics16:97–159
Zietkiewicz E, Yotova V, Jarnik M, Korab-Laskowska M, KiddKK, Modiano D, Scozzari R, et al (1997) Nuclear DNAdiversity in worldwide distributed human populations. Gene205:161–171
Zietkiewicz E, Yotova V, Jarnik M, Korab-Laskowska M, KiddKK, Modiano D, Scozzari R, Stoneking M, Tishkoff S,Batzer M, Labuda D (1998) Genetic structure of the ances-tral population of modern humans. J Mol Evol 47:146–155


