Embed Size (px)
Citation preview
Citation Li Y Wan Z Sun L
Simulation of Carbon Exchange from
a Permafrost Peatland in the Great
Hingrsquoan Mountains Based on
CoupModel Atmosphere 2022 13 44
httpsdoiorg103390
atmos13010044
Academic Editor Sergey
N Vorobyev
Received 14 October 2021
Accepted 21 December 2021
Published 28 December 2021
Publisherrsquos Note MDPI stays neutral
with regard to jurisdictional claims in
published maps and institutional affil-
iations
Copyright copy 2021 by the authors
Licensee MDPI Basel Switzerland
This article is an open access article
distributed under the terms and
conditions of the Creative Commons
Attribution (CC BY) license (https
creativecommonsorglicensesby
40)
atmosphere
Article
Simulation of Carbon Exchange from a Permafrost Peatland inthe Great Hingrsquoan Mountains Based on CoupModelYue Li 12 Zhongmei Wan 1 and Li Sun 2
1 College of Earth Sciences Jilin University Changchun 130061 China yli18mailsjlueducn2 Key Laboratory of Wetland Ecology and Environment Northeast Institute of Geography and Agroecology
Chinese Academy of Sciences Changchun 130102 China Correspondence wanzmjlueducn (ZW) sunliigaaccn (LS)
Abstract Climate change is accelerating its impact on northern ecosystems Northern peatlands storea considerable amount of C but their response to climate change remains highly uncertain In orderto explore the feedback of a peatland in the Great Hingrsquoan Mountains to future climate change wesimulated the response of the overall net ecosystem exchange (NEE) ecosystem respiration (ER) andgross primary production (GPP) during 2020ndash2100 under three representative concentration pathways(RCP26 RCP60 and RCP85) Under the RCP26 and RCP60 scenarios the carbon sink will increaseslightly until 2100 Under the RCP85 scenario the carbon sink will follow a trend of gradual decreaseafter 2053 These results show that when meteorological factors especially temperature reach acertain degree the carbon sourcesink of the peatland ecosystem will be converted In generalalthough the peatland will remain a carbon sink until the end of the 21st century carbon sinkswill decrease under the influence of climate change Our results indicate that in the case of futureclimate warming with the growing seasons experiencing overall dryer and warmer environmentsand changes in vegetation communities peatland NEE ER and GPP will increase and lead to theincrease in ecosystem carbon accumulation
Keywords climate change future climate scenario peatland CoupModel carbon exchange
1 Introduction
According to the IPCC lsquoSpecial Report on Global Warming of 15 Crsquo human-inducedglobal warming has reached 087 C since the Industrial Revolution and it is estimatedto reach 15 C in the period 2030ndash2052 [1] The global average temperature increasedby 09 C during 2011ndash2015 compared with that in 1750 and the average temperatureincreased by 02 C during 2015ndash2019 compared with that during 2011ndash2015 [2] The risein surface temperature induced by global warming is the most prominent in northernhigh latitudes [3] Temperatures in northern latitudes are currently increasing at a rate of06 C10 yr which is two times higher than the global average [4] In particular NortheastChina exhibits the largest warming trend with an increase rate of 036 C10 yr [5]
Climate change is usually regarded as the most important driver of global soil carbon(C) stocks [67] One of the most prominent aspects of climate change is global warmingwhich is mainly driven by the increase in greenhouse gas (GHG) concentrations in theatmosphere [89] To maintain global warming below 2 C GHG emissions have to bedrastically reduced Despite covering only 3 of the global land area northern peatlandshave accumulated large C stocks [10] According to statistics one-third (455 PgC) of theglobal soil C is stored in northern peatlands which play a critical role in C cycles onthe global scale [11] The balance between soil C storage and loss will drive powerfulcarbon-climate feedback over the coming century The representation of soil C cycling(both conceptually and numerically) has critical implications on the prediction of theresponse of peatlands to environmental change and anthropogenic forcing For example
Atmosphere 2022 13 44 httpsdoiorg103390atmos13010044 httpswwwmdpicomjournalatmosphere
Atmosphere 2022 13 44 2 of 18
the response of peatlands to warming represents a critical source of uncertainty in effortstoward projecting carbon-climate feedbacks over the upcoming century [12]
Permafrost refers to ground that remains frozen for two or more consecutive yearsand underlies many Arctic and boreal ecosystems In the current terrestrial ecosystempermafrost represents the largest soil carbon pool at 1330ndash1580 Pg [13ndash15] which is sig-nificantly higher than the C content in vegetation (650 Pg) and almost twice that in theatmosphere (730 Pg) [1617] Moreover soil C storage in permafrost regions accounts formore than 50 of the global soil carbon [18] However permafrost in high latitudes andhigh altitudes is highly sensitive to climate change and the growth rate of temperature inthese regions in the past 30 years has been twice the global growth rate [19] Permafrosttemperature has increased by 029 plusmn 012 C between 2007 and 2016 on the global scale [20]
Permafrost and peatlands are interdependent in Northeast China Under the uniquecold stagnant and anaerobic environment of peatlands in permafrost regions [21] a largeamount of C is stored in the soil In peatlands deeper water tables favor CO2 and N2Oemissions and shallower water tables favor CH4 emissions [2223] As a result theseregions are more vulnerable to climate change and likely to release more GHGs in responseto climate warming Specifically clarifying the carbon exchange process and emissioncharacteristics of the peatland in the Great Hingrsquoan Mountains in northern China is of greatsignificance for reducing GHG emissions and controlling climate warming [24]
Vegetation plays a crucial role in carbon cycling and the thermal state of permafrost [2526]Climate warming generally leads to changes in vegetation composition and structure [2728]In recent decades most boreal peatlands across the world have experienced substantialchanges in vegetation composition and structure as a consequence of climate warming [2728]Field observations have consistently indicated that the expansion of shrubs and forbs hasbeen changing pan-Arctic vegetation landscapes [2930] Specifically the relative abun-dance of woody plants (ie trees and deciduous shrubs) has increased and the cover ofSphagnum mosses and herbaceous plants has decreased and even disappeared [3132] Thepotential for ecosystems to store C on an annual basis depends on the equilibrium betweengross primary production (GPP) and the C released from ecosystem respiration (ER) in-cluding plant and microbial respiration Warmer temperatures can increase ER [33ndash35]which is driven by increases in both plant and microbial respiration [333637] Warmingpromotes woody-shrub expansion which will increase plant productivity and litter inputto soil [38ndash40] The enhancement of plant productivity increases C storage by plants andthus could compensate for some of the C loss from increased ER due to warmer tempera-tures [4142] However long-term field observations of experimental permafrost warminghave shown that ecosystem C losses exceed C gain after less than a decade [4344]
Global climate is now warming rapidly because of vegetation changes in responseto climatic change and some terrestrial surfaces are expected to experience less wateravailability during the growing season in the future [45] With the drying of the climatethe least drought-tolerant species are expected to disappear first In the coming decadeslong-term and continuous changes may have a significant impact on the distribution andfunction of vegetation [46] The key issue is that seasonal changes in precipitation aremore important to plant growth than annual changes To control the rise in global meantemperatures the reduction of CO2 emissions and storage of CO2 in land C sinks areindispensable While the Great Hingrsquoan Mountains ecosystem currently acts as a weak netcarbon sink [4748] with an average carbon accumulation rate of 4265 g C mminus2yrminus1 overthe past 2 ka [48] climate change could increase the ER of peatland and weaken or reversethe sink function of this region in the future [4849] The consequences of climate changeand vegetation change on the net ecosystem carbon balance remain uncertain [50ndash52] As aresult the role of the permafrost region of the Great Hingrsquoan Mountains as a carbon sink orsource in the future is being actively debated [53ndash57]
To understand the regional consequences of climate and vegetation change and es-timate the climate feedback of permafrost future carbon emissions from peatlands canbe quantified and predicted using CoupModel (a coupled heat and mass transfer model
Atmosphere 2022 13 44 3 of 18
for soilndashplantndashatmosphere systems) [58] CoupModel is a process-based biogeochemicalmodel that focuses on heat and water transfer and trace emissions from peatland ecosys-tems This model combines biogeochemical processes with hydrological dynamics andhas been constantly upgraded and improved A large number of studies have shown thatCoupModel is useful for simulating various types of emissions such as heat transfer watertransfer and GHGs [59ndash61]
With the continuous progress of global warming a typical peat swamp located in thepermafrost of the Great Hingrsquoan Mountains in Northern China is being severely affectedIn this study carbon exchange in the peatland in the next 80 years was simulated andpredicted To this end future scenario data of Coupled Model Intercomparison Project5 (CMIP5) were analyzed using CoupModel and various preset vegetation successionschemes The change trend and significant difference under different vegetation successionschemes were analyzed reasonably and the influencing factors of carbon exchange in thefuture were clarified This study could provide a reference in evaluating the changing trendand magnitude of the carbon exchange for the peatlands in the Great Hingrsquoan Mountains
2 Materials and Methods21 Study Area
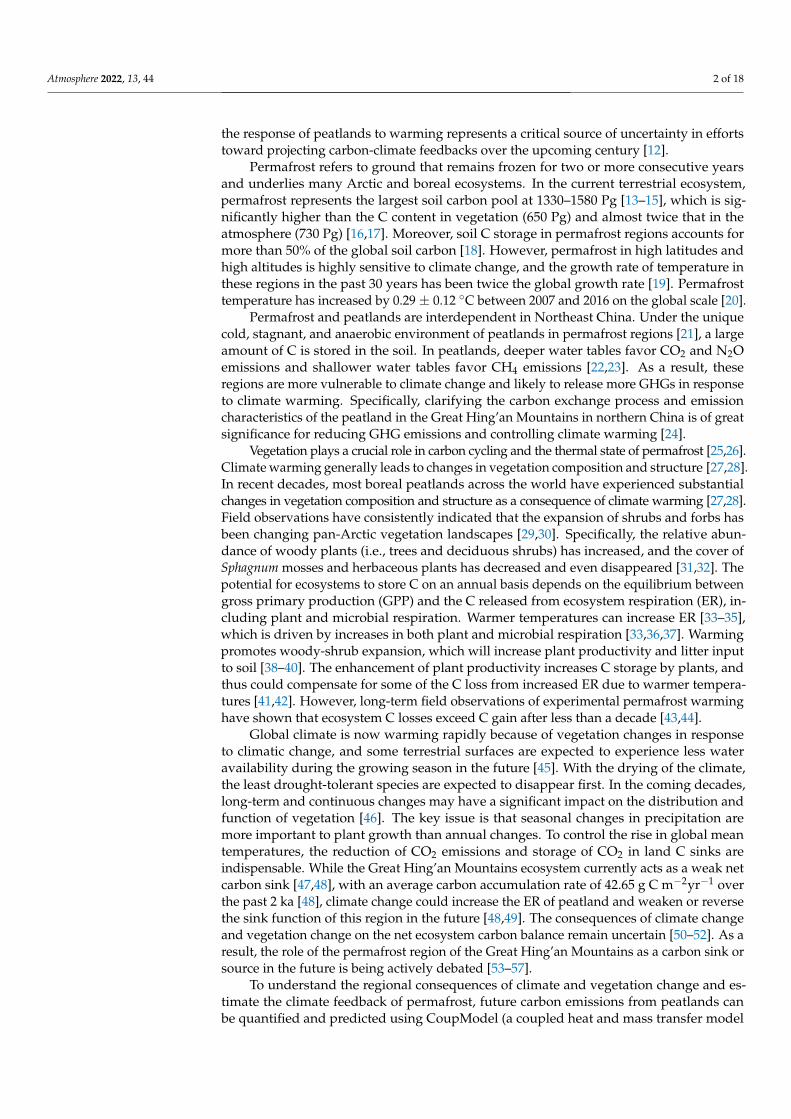
The study area is located in the Great Hingrsquoan Mountains in Heilongjiang Province(5256prime32400primeprime N 12251prime23203primeprime E 473 m asl) which is a major permafrost area in China(Figure 1) The ecosystem of the Great Hingrsquoan Mountains plays an important role inthe stability of Asiarsquos climate system biodiversity and regional carbon balance making itindispensable to global biosphere integrity and the sustainable development of surroundingareas The main soil type in the study area is humus swamp peat soil with rich organicmatter content The peatland has continuously been acting as a sink for atmospheric CO2The water table ranges between 10 and 32 cm below the soil surface in the growing seasonThe maximum thawing depth approximates 68 cm [62] and the depth greater than 70 cmis generally permafrost layer
Atmosphere 2021 13 x FOR PEER REVIEW 3 of 18
To understand the regional consequences of climate and vegetation change and esti-
mate the climate feedback of permafrost future carbon emissions from peatlands can be
quantified and predicted using CoupModel (a coupled heat and mass transfer model for
soilndashplantndashatmosphere systems) [58] CoupModel is a process-based biogeochemical
model that focuses on heat and water transfer and trace emissions from peatland ecosys-
tems This model combines biogeochemical processes with hydrological dynamics and
has been constantly upgraded and improved A large number of studies have shown that
CoupModel is useful for simulating various types of emissions such as heat transfer wa-
ter transfer and GHGs [59ndash61]
With the continuous progress of global warming a typical peat swamp located in the
permafrost of the Great Hingrsquoan Mountains in Northern China is being severely affected
In this study carbon exchange in the peatland in the next 80 years was simulated and
predicted To this end future scenario data of Coupled Model Intercomparison Project 5
(CMIP5) were analyzed using CoupModel and various preset vegetation succession
schemes The change trend and significant difference under different vegetation succes-
sion schemes were analyzed reasonably and the influencing factors of carbon exchange
in the future were clarified This study could provide a reference in evaluating the chang-
ing trend and magnitude of the carbon exchange for the peatlands in the Great Hingrsquoan
Mountains
2 Materials and Methods
21 Study Area
The study area is located in the Great Hingrsquoan Mountains in Heilongjiang Province
(52deg56prime32400primersquo N 122deg51prime23203primersquo E 473 m asl) which is a major permafrost area in China
(Figure 1) The ecosystem of the Great Hingrsquoan Mountains plays an important role in the
stability of Asiarsquos climate system biodiversity and regional carbon balance making it
indispensable to global biosphere integrity and the sustainable development of surround-
ing areas The main soil type in the study area is humus swamp peat soil with rich organic
matter content The peatland has continuously been acting as a sink for atmospheric CO2
The water table ranges between 10 and 32 cm below the soil surface in the growing season
The maximum thawing depth approximates 68 cm [62] and the depth greater than 70 cm
is generally permafrost layer
Figure 1 The study area in Heilongjiang Province
Figure 1 The study area in Heilongjiang Province
22 Vegetation and Meteorological Data
The vegetation in the study area mainly includes deciduous shrubs evergreen shrubssedges and moss [63] Seedlings of trees such as Larix gmelinii Betula platyphylla andAlnus sibirica have widely expanded into the peatland [32] In the simulation process thevegetation layer is divided into two layers the first layer is the herbaceous layer (averageheight lt 15 cm) and the second layer is the shrub layer (average height gt 15 cm) The areais located in the continental monsoon climate zone of the cold temperate zone with anannual average temperature above minus400 C and precipitation is frequent in the warmestperiod (July and August) of the year sustaining plant growth Accordingly we defined thegrowing season for the site as May to September The warmest month is July (1875 C) and
Atmosphere 2022 13 44 4 of 18
the coldest month is January (minus2960 C) The annual precipitation and air temperatureover the past 30 years (1981ndash2010) were 45201 mm and minus390 C respectively
23 CoupModel
CoupModel is a process-based model that describes the biogeochemical processes ofcarbon and nitrogen in various ecosystems [64] The current version can be downloadedfrom the CoupModel home page [65] A detailed description can be found in Jansson andKarlberg [66] In the model biological and physical processes that describe vegetationdynamics snow dynamics soil heat and water exchange and soil bio-geochemistry arerepresented as individual modules [67] The model can be used to project future conditionsunder given input scenarios CoupModel inputs include meteorological data (such asradiation precipitation daily average temperature and relative humidity) vegetationtype soil characteristics and vegetation and initial soil element parameters among othersDuring the simulation period meteorological data series are in the form of daily averagesThe model assumes constant physical properties of soil and vegetation type throughoutthe simulation period The performance of CoupModel has been evaluated and reportedto be reliable for C cycling simulation in previous studies For example based on eddy-covariance (EC) measurements CoupModel had been used to assess the annual CO2 budgetfor an Arctic ecosystem over a 5 year period [67]
24 Model-Driven Data Construction241 Data Source
In this study net ecosystem exchange (NEE) and ER fluxes in 2016 and 2019 wereobtained using the static chambergas chromatography techniques and the detailed op-eration processes were consistent with Miao et al 2012 [68] The measurement frequencyis one or two times per week (except for bad weather or fire prevention periods) andthe average value was obtained from four repetitions of each measurement In additionair temperature and relative humidity soil temperature soil water content wind speednet radiation and thawing depth in 2016 and 2019 were measured using the HMP45Ctemperature and relative humidity probe (Vaisala Inc Helsinki Finland) 107-l temperatureprobe (Campbell Scientific NE USA) CS616-l water content reflectometer (Campbell scien-tific NE USA) W200p wind vane (Vector Inc Kuopio Finland) CNR-1 net radiometer(Kipp and Zonen NY USA) and manual measurement respectively The thaw depthwas measured manually once or twice a week during the observation period (except forbad weather and fire prevention period) Along the diagonal directions of the peatlandwe measured the depth of the active layer by inserting a steel rod into the soil until max-imum resistance and then recorded the distance from the bottom of the probe to thesurface layer We chose 10 sites in each diagonal line and then calculated the averagesCurrent climate data and prediction data from five global climate models (GCMs) wereselected to assess the sensitivity of peatland responses to climate change In this studythe current climate data were obtained from the China National Meteorological Center(1959ndash2018 httpdatacmagovcn accessed on 10 December 2021) The future meteoro-logical data (2006ndash2100) using five GCMs (GFDL-ESM2M HadGEM2-ES IPSL-CM5A-LRMIROC-ESM-CHEM NorESM1-M) under different future emission scenarios (Table 1)were obtained from CMIP5 (httpscera-wwwdkrzdeWDCCuicerasearch accessedon 10 December 2021) Previous studies have tested the performance of CMIP5 GCMs innortheastern China and reported that it could effectively represent the warming trend andinterannual variation of precipitation in the study area [6970] In this study the spatialresolutions of the input data and results were 05 times 05
Atmosphere 2022 13 44 5 of 18
Table 1 Details of the 5 CMIP5 climate models
Model Name Institution Country Spatial Resolution
GFDL-ESM2M NOAA USA 05 times 05
HadGEM2-ES MOHC UK 05 times 05
IPSL-CM5A-LR IPSL France 05 times 05
MIROC-ESM-CHEM MIROC Japan 05 times 05
NorESM1-M NCC Norway 05 times 05
242 Future Climate-Driven Data
The daily meteorological data from 2020 to 2100 (including temperature precipitationwind speed net radiation relative humidity and snow) were selected to drive the Coup-Model v6 simulation of the carbon cycles under climate change in the peatland In additionthe model requires input describing the geographical coordinates vegetation type andsoil physical and chemical parameters (texture bulk density and soil depth as well asinitial soil C content) Most of these input parameters were obtained through experimentalmeasurements The simulation results of the model were compared with the experimentaldata of the sites to verify the applicability of CoupModel to the study area
243 Representative Concentration Pathway (RCP) Emission Scenarios
IPCC presented four future emission scenarios (RCP26 RCP45 RCP60 and RCP85)in 2014 which were combined with the changes in CO2 concentration To ensure compa-rability of the results RCP26 (mitigation scenario) RCP60 (stabilization scenario) andRCP85 (business-as-usual scenario) were selected in this study Different emission sce-narios were used to compare the radiative forcing reaching the Earthrsquos surface and theatmospheric CO2 concentration by the year 2100 [71] RCP emission scenarios can not onlyestimate the concentration of GHGs until the end of the 21st century or over longer timescales but also convert dates into radiative forcing (W mminus2) The basic information aboutthe three scenarios is listed in Table 2
Table 2 Radiation forcing reaching the Earthrsquos surface and equivalent CO2 concentrations by 2100under the three different emission scenarios
RCPScenarios Emission Pattern Radiative Forcing
(W mminus2) until 2100CO2 Concentration
(ppm)
RCP26 Mitigation scenarioReaches a peak of 30 W mminus2
before 2100 and then drops to26 W mminus2
Reaches a peak of 490ppm before 2100 and
then drops
RCP60 Stabilizationscenario
Stabilizes after reaching60 W mminus2
Reaches a peak of 850ppm before 2100 and
then drops
RCP85 Business-as-usualscenario Reaches more than 85 W mminus2
Reaches a peak of 1370ppm before 2100 and
then drops
244 Model Performance Tests
Based on the experimental results of the detailed survey data the simulation resultswere compared with the measured data The coefficient of determination (R2) and NashndashSutcliffe efficiency coefficient (NSE) were used to evaluate the goodness of fit betweenthe simulation results and the measurement results The mathematical expressions are asfollows
Atmosphere 2022 13 44 6 of 18
R2 = 1minus
nsum
i=1(Si minusMi)
2
nsum
i=1(SminusMi)
2
NSE = 1minus
nsum
i=1(Mi minus Si)
2
nsum
i=1(Mi minus S)2
where Mi is observed value Si is simulated value and S is average observed value
25 Methods
To reflect the actual conditions as accurately as possible we presented an estimate ofclimate warming for C losses of the peatland ecosystem under baseline (2020) and futureclimatic conditions (2100) and selected three representative time periods (2020ndash2030 2050ndash2060 and 2090ndash2100) which represented the pre-century mid-century and late-centuryIn the process of simulation we considered the change in vegetation type associated withlong-term changes Considering that terrestrial ecosystem models had quite differentresults on vegetation changes in both historical simulations and future predictions [72] weset a relatively moderate change on peatland vegetation by assuming a gradual increase inshrubs until the end of this century and an unchanged peatland vegetation patten as thecurrent state Accordingly we ran CoupModel using two vegetation evolution schemesFor Scheme I the proportion of herbaceous and shrub vegetation was assumed to remainclose to the current vegetation situation and to remain stable until 2100 For Scheme IIherbaceous vegetation was assumed to be replaced by shrubs year by year and the finalvegetation type comprises only shrubs by 2100 For the above two schemes NEE ER andGPP were simulated In the subsequent expressions Scheme I and Scheme II were used torepresent different trends on the succession schemes of peatland vegetations Some of theparameters used in this study are shown in Table 3
Table 3 The part of application parameters in the model
Parameters Value Default Unit
TemQ10 3 2 -
Theta Lower Range 25 13 Vol
CH4 Aerobic Ox Rate 02 01 day
Reference Height 18 2 m
Temp Air Mean minus21 10 C
Albedo Leaf 15 25
RespTemQ10 3 2 -
RespTemQ10Bas 15 20 C
Albedo Dry 10 30
Albedo Wet 9 15
Latitude 429 585 -
3 Results31 Comparison of Meteorological Observations and Meteorological Predictions
The average temperature in the Great Hingrsquoan Mountains was minus417 C from 1959 to2018 and the average warming rate reached 025 C10a in 2015 the highest and lowesttemperatures were minus251 C and minus627 C respectively (Figure 2) The annual averagetemperature was the lowest (minus268 C) under RCP26 followed by RCP60 (minus204 C)and it was the highest (minus019 C) under RCP85 Under the three scenarios temperature
Atmosphere 2022 13 44 7 of 18
increased at rates of 026 C10a 029 C10a and 067 C10a respectively (Figure 2)which are all higher than that during the past 60 years The average temperature of thegrowing season was 1061 C in the past 60 years (Figure 2) The average temperature inthe growing season was similar to the annual average temperature with values of 1160 C1231 C and 1382 C under RCP26 RCP60 and RCP85 respectively which are higherthan that in the past 60 years (1061 C) (Figures 3ndash5)
Atmosphere 2021 13 x FOR PEER REVIEW 7 of 18
temperatures were minus251 degC and minus627 degC respectively (Figure 2) The annual average tem-
perature was the lowest (minus268 degC) under RCP26 followed by RCP60 (minus204 degC) and it
was the highest (minus019 degC) under RCP85 Under the three scenarios temperature in-
creased at rates of 026 degC10a 029 degC10a and 067 degC10a respectively (Figure 2) which
are all higher than that during the past 60 years The average temperature of the growing
season was 1061 degC in the past 60 years (Figure 2) The average temperature in the grow-
ing season was similar to the annual average temperature with values of 1160 degC 1231
degC and 1382 degC under RCP26 RCP60 and RCP85 respectively which are higher than
that in the past 60 years (1061 degC) (Figures 3ndash5)
Figure 2 Interannual variations in air temperature (black solid line) interannual variations in grow-
ing season temperature (red solid line) the total annual precipitation (sum of column heights of
blue and light blue) the growing season precipitation (the column height of light blue)
Figure 2 Interannual variations in air temperature (black solid line) interannual variations ingrowing season temperature (red solid line) the total annual precipitation (sum of column heights ofblue and light blue) the growing season precipitation (the column height of light blue)
Atmosphere 2021 13 x FOR PEER REVIEW 7 of 18
temperatures were minus251 degC and minus627 degC respectively (Figure 2) The annual average tem-
perature was the lowest (minus268 degC) under RCP26 followed by RCP60 (minus204 degC) and it
was the highest (minus019 degC) under RCP85 Under the three scenarios temperature in-
creased at rates of 026 degC10a 029 degC10a and 067 degC10a respectively (Figure 2) which
are all higher than that during the past 60 years The average temperature of the growing
season was 1061 degC in the past 60 years (Figure 2) The average temperature in the grow-
ing season was similar to the annual average temperature with values of 1160 degC 1231
degC and 1382 degC under RCP26 RCP60 and RCP85 respectively which are higher than
that in the past 60 years (1061 degC) (Figures 3ndash5)
Figure 2 Interannual variations in air temperature (black solid line) interannual variations in grow-
ing season temperature (red solid line) the total annual precipitation (sum of column heights of
blue and light blue) the growing season precipitation (the column height of light blue)
Figure 3 RCP26 scenario forecast meteorological data (2020ndash2100) On the left interannual variationsin air temperature (black solid line) interannual variations in growing season temperature (red solid
Atmosphere 2022 13 44 8 of 18
line) interannual variations in relative humidity (blue purple square) the total annual precipitation(sum of column heights of blue and light blue) and the growing season precipitation (column heightof light blue) On the right interannual variations in annual air temperature precipitation andrelative humidity (black solid square) interannual variations in growing season air temperatureprecipitation and relative humidity (red solid circle)
Atmosphere 2021 13 x FOR PEER REVIEW 8 of 18
Figure 3 RCP26 scenario forecast meteorological data (2020ndash2100) On the left interannual varia-
tions in air temperature (black solid line) interannual variations in growing season temperature
(red solid line) interannual variations in relative humidity (blue purple square) the total annual
precipitation (sum of column heights of blue and light blue) and the growing season precipitation
(column height of light blue) On the right interannual variations in annual air temperature pre-
cipitation and relative humidity (black solid square) interannual variations in growing season air
temperature precipitation and relative humidity (red solid circle)
Figure 4 RCP60 scenario forecast meteorological data (2020ndash2100) The legend illustrates the same
as Figure 3 Figure 4 RCP60 scenario forecast meteorological data (2020ndash2100) The legend illustrates the sameas Figure 3
Precipitation initially decreased and then increased and the average annual precipita-tion was 43872 mm (Figure 2) The average annual precipitation in the growing season was38241 mm from 1959 to 2018 (Figure 2) The average annual precipitation under RCP26RCP60 and RCP85 was 66090 mm 67482 mm and 71989 mm respectively whichvalues are higher than the average precipitation of the past 60 years (Figures 3ndash5) Theaverage annual precipitation in the growing season under RCP26 RCP60 and RCP85 was52998 mm 53986 mm and 57205 mm respectively which values are higher than that inthe past 60 years Under the three scenarios the annual average relative humidity showeda decreasing trend with values of 8567 8558 and 8510 under RCP26 RCP60 andRCP85 respectively (Figures 3ndash5) In general precipitation increased at the annual scalebut no distinct intensity changes were observed between wet and dry seasons potentiallybecause of the warming-driven increase in evapotranspiration
Atmosphere 2022 13 44 9 of 18Atmosphere 2021 13 x FOR PEER REVIEW 9 of 18
Figure 5 RCP85 scenario forecast meteorological data (2020ndash2100) The legend illustrates the same
as Figure 3
Precipitation initially decreased and then increased and the average annual precipi-
tation was 43872 mm (Figure 2) The average annual precipitation in the growing season
was 38241 mm from 1959 to 2018 (Figure 2) The average annual precipitation under
RCP26 RCP60 and RCP85 was 66090 mm 67482 mm and 71989 mm respectively
which values are higher than the average precipitation of the past 60 years (Figures 3ndash5)
The average annual precipitation in the growing season under RCP26 RCP60 and
RCP85 was 52998 mm 53986 mm and 57205 mm respectively which values are higher
than that in the past 60 years Under the three scenarios the annual average relative hu-
midity showed a decreasing trend with values of 8567 8558 and 8510 under
RCP26 RCP60 and RCP85 respectively (Figures 3ndash5) In general precipitation increased
at the annual scale but no distinct intensity changes were observed between wet and dry
seasons potentially because of the warming-driven increase in evapotranspiration
32 Calibration and Validation of CoupModel
Firstly the model was calibrated based on the measured NEE ER soil temperatures
and soil water content at depths from minus5 cm to minus40 cm and freezing-thawing depth Sub-
sequently we validated the simulation results against the experimental site data (soil tem-
perature water content NEE ER and thawing depth during the growing season) to ver-
ify the applicability of the model to the study area We compared the output from model
simulations corresponding to the present day against the observations to validate the
model performance Finally we used observation data covering the growing seasons of
2016 and 2019 to calibrate plant parameters and soil parameters in the model Initial soil
temperature initial water content growing degree days carbonnitrogen ratios pH SOC
and bulk density are the most sensitive parameters In addition we also determined some
parameters applicable to the model in the region as shown in Table 3
Figure 5 RCP85 scenario forecast meteorological data (2020ndash2100) The legend illustrates the sameas Figure 3
32 Calibration and Validation of CoupModel
Firstly the model was calibrated based on the measured NEE ER soil temperaturesand soil water content at depths from minus5 cm to minus40 cm and freezing-thawing depthSubsequently we validated the simulation results against the experimental site data (soiltemperature water content NEE ER and thawing depth during the growing season) toverify the applicability of the model to the study area We compared the output frommodel simulations corresponding to the present day against the observations to validatethe model performance Finally we used observation data covering the growing seasons of2016 and 2019 to calibrate plant parameters and soil parameters in the model Initial soiltemperature initial water content growing degree days carbonnitrogen ratios pH SOCand bulk density are the most sensitive parameters In addition we also determined someparameters applicable to the model in the region as shown in Table 3
In the verification of the applicability of CoupModel to the study area we carriedselected representative dates from different years Figure 6 shows the comparison betweensimulated and measured soil temperature values at different depths The simulated soiltemperature and soil water contents were close to the measured value in terms of size andvariation trend
Atmosphere 2022 13 44 10 of 18
Atmosphere 2021 13 x FOR PEER REVIEW 10 of 18
In the verification of the applicability of CoupModel to the study area we carried
selected representative dates from different years Figure 6 shows the comparison be-
tween simulated and measured soil temperature values at different depths The simulated
soil temperature and soil water contents were close to the measured value in terms of size
and variation trend
Figure 6 Soil temperature water content NEE ER and thawing depth in growing seasons of 2016
and 2019 the red solid lines represent the simulation results of the model the black solid lines and
blue and white circles represent the observed results
33 Changes in Peatland NEE ER and GPP under Three Future Climate Change Scenarios
Changes in NEE ER and GPP during various time periods were analyzed under
various future climate change scenarios With Scheme I the simulated changes in NEE
followed the order of RCP26 (minus333 kgcmminus2) lt RCP85 (minus340 kgcmminus2) lt RCP60 (minus341
Figure 6 Soil temperature water content NEE ER and thawing depth in growing seasons of 2016and 2019 the red solid lines represent the simulation results of the model the black solid lines andblue and white circles represent the observed results
33 Changes in Peatland NEE ER and GPP under Three Future Climate Change Scenarios
Changes in NEE ER and GPP during various time periods were analyzed un-der various future climate change scenarios With Scheme I the simulated changes inNEE followed the order of RCP26 (minus333 kgcmminus2) lt RCP85 (minus340 kgcmminus2) lt RCP60(minus341 kgcmminus2) and the changes under RCP26 and RCP60 exhibited an increasing trendwith time (Figure 7) The change trend of NEE with Scheme I under RCP85 was themost prominent by the end of the century The predicted ER and GPP changes in varioustime periods under different scenarios from 2010 to 2100 are similar Positive effects werestronger under RCP60 and RCP85 than under RCP26 In particular the positive effectwas significantly stronger under RCP85 Among them the change trends were similar
Atmosphere 2022 13 44 11 of 18
between ER and GPP which followed the orders of RCP26 (3900 kgcmminus2) lt RCP60 (4148kgcmminus2) lt RCP85 (4742 kgcmminus2) and RCP26 (4234 kgcmminus2) lt RCP60 (4490 kgcmminus2) ltRCP85 (5088 kgcmminus2) respectively
Atmosphere 2021 13 x FOR PEER REVIEW 11 of 18
kgcmminus2) and the changes under RCP26 and RCP60 exhibited an increasing trend with
time (Figure 7) The change trend of NEE with Scheme I under RCP85 was the most prom-
inent by the end of the century The predicted ER and GPP changes in various time peri-
ods under different scenarios from 2010 to 2100 are similar Positive effects were stronger
under RCP60 and RCP85 than under RCP26 In particular the positive effect was signif-
icantly stronger under RCP85 Among them the change trends were similar between ER
and GPP which followed the orders of RCP26 (3900 kgcmminus2) lt RCP60 (4148 kgcmminus2) lt
RCP85 (4742 kgcmminus2) and RCP26 (4234 kgcmminus2) lt RCP60 (4490 kgcmminus2) lt RCP85 (5088
kgcmminus2) respectively
Figure 7 Simulation results of NEE ER and GPP from 2021 to 2100 in Scheme I
With Scheme II the simulated changes in NEE were slightly different (Figure 8) fol-
lowing the order of RCP26 (minus359 kgcmminus2) lt RCP60 (minus366 kgcmminus2) lt RCP85 (minus367 kgcmminus2)
The change trend of NEE with Scheme II under RCP85 was similar to that with Scheme I
by the end of the 21st century The predicted changes in ER and GPP during various time
periods under different scenarios from 2010 to 2100 were also similar to those with Scheme
I The positive effects were stronger under RCP60 and RCP85 than under RCP26 In par-
ticular the effect was significantly stronger under RCP85 The change trends were similar
between ER and GPP which followed the orders of RCP26 (4214 kgcmminus2) lt RCP60 (4390
kgcmminus2) lt RCP85 (5029 kgcmminus2) and RCP26 (4483 kgcmminus2) lt RCP60 (4766 kgcmminus2) lt
RCP85 (5396 kgcmminus2) respectively
Figure 8 Simulation results of NEE ER and GPP from 2021 to 2100 in Scheme II
4 Discussion
41 Comparison of Simulation Results between Scheme I and Scheme II
To explore the response trends of vegetation with the two schemes to future climate
change we analyzed the simulation results of NEE GPP and ER with the two vegetation
schemes in different time periods and compared the differences between them On the
Figure 7 Simulation results of NEE ER and GPP from 2021 to 2100 in Scheme I
With Scheme II the simulated changes in NEE were slightly different (Figure 8)following the order of RCP26 (minus359 kgcmminus2) lt RCP60 (minus366 kgcmminus2) lt RCP85 (minus367kgcmminus2) The change trend of NEE with Scheme II under RCP85 was similar to that withScheme I by the end of the 21st century The predicted changes in ER and GPP duringvarious time periods under different scenarios from 2010 to 2100 were also similar to thosewith Scheme I The positive effects were stronger under RCP60 and RCP85 than underRCP26 In particular the effect was significantly stronger under RCP85 The change trendswere similar between ER and GPP which followed the orders of RCP26 (4214 kgcmminus2)lt RCP60 (4390 kgcmminus2) lt RCP85 (5029 kgcmminus2) and RCP26 (4483 kgcmminus2) lt RCP60(4766 kgcmminus2) lt RCP85 (5396 kgcmminus2) respectively
Atmosphere 2021 13 x FOR PEER REVIEW 11 of 18
kgcmminus2) and the changes under RCP26 and RCP60 exhibited an increasing trend with
time (Figure 7) The change trend of NEE with Scheme I under RCP85 was the most prom-
inent by the end of the century The predicted ER and GPP changes in various time peri-
ods under different scenarios from 2010 to 2100 are similar Positive effects were stronger
under RCP60 and RCP85 than under RCP26 In particular the positive effect was signif-
icantly stronger under RCP85 Among them the change trends were similar between ER
and GPP which followed the orders of RCP26 (3900 kgcmminus2) lt RCP60 (4148 kgcmminus2) lt
RCP85 (4742 kgcmminus2) and RCP26 (4234 kgcmminus2) lt RCP60 (4490 kgcmminus2) lt RCP85 (5088
kgcmminus2) respectively
Figure 7 Simulation results of NEE ER and GPP from 2021 to 2100 in Scheme I
With Scheme II the simulated changes in NEE were slightly different (Figure 8) fol-
lowing the order of RCP26 (minus359 kgcmminus2) lt RCP60 (minus366 kgcmminus2) lt RCP85 (minus367 kgcmminus2)
The change trend of NEE with Scheme II under RCP85 was similar to that with Scheme I
by the end of the 21st century The predicted changes in ER and GPP during various time
periods under different scenarios from 2010 to 2100 were also similar to those with Scheme
I The positive effects were stronger under RCP60 and RCP85 than under RCP26 In par-
ticular the effect was significantly stronger under RCP85 The change trends were similar
between ER and GPP which followed the orders of RCP26 (4214 kgcmminus2) lt RCP60 (4390
kgcmminus2) lt RCP85 (5029 kgcmminus2) and RCP26 (4483 kgcmminus2) lt RCP60 (4766 kgcmminus2) lt
RCP85 (5396 kgcmminus2) respectively
Figure 8 Simulation results of NEE ER and GPP from 2021 to 2100 in Scheme II
4 Discussion
41 Comparison of Simulation Results between Scheme I and Scheme II
To explore the response trends of vegetation with the two schemes to future climate
change we analyzed the simulation results of NEE GPP and ER with the two vegetation
schemes in different time periods and compared the differences between them On the
Figure 8 Simulation results of NEE ER and GPP from 2021 to 2100 in Scheme II
4 Discussion41 Comparison of Simulation Results between Scheme I and Scheme II
To explore the response trends of vegetation with the two schemes to future climatechange we analyzed the simulation results of NEE GPP and ER with the two vegetationschemes in different time periods and compared the differences between them On theone hand at the same time scale the simulation results of NEE GPP and ER with thetwo schemes will increase under different scenarios from RCP26 to RCP85 It could beconcluded that relatively moderate climate change has an apparent positive effect on thepeatland ecosystems Extension of growing season [67] and more plant biomass couldlead to higher autotrophic respiration [73] Considering the impact of climate change
Atmosphere 2022 13 44 12 of 18
and plant biomass it is worth noting that ER and GPP will increase significantly underRCP60 and RCP85 Overall the carbon sequestration capacity of the peatland ecosystemshowed a weak increasing trend and remained stable by the end of the 21st century Onthe other hand when the climate change reaches a certain degree it will form a negativecorrelation with the carbon sequestration capacity of the peatland ecosystem which meansthe carbon sink capacity will be weakened In particular NEE shows a decreasing trendafter 2053 under RCP85 The results show that the changes in NEE of the two vegetationschemes under the RCP85 in the peatland ecosystem will decrease by the end of the 21stcentury relative to the values during 2050ndash2060 This trend is different from the emissionpattern under RCP26 and RCP60 Both the simulation results of the carbon dynamics ofpan-Arctic peatlands show that the carbon sink capacity of the peatlands will be weakenedfrom the middle of the 21st century under RCP85 [48] Finally the overall trends in thesimulation results with the two vegetation schemes are similar but the specific valuesshow that Scheme II is greater than Scheme I The main reason is that with Scheme II thenumber of shrubs will increase annually and the photosynthesis respiration and carbonsequestration capacities of shrubs are higher than those of herbaceous plants This showsthat the change in vegetation type will lead to the change in carbon budget In additionthere were significant differences in NEE ER and GPP for the two schemes Peatlandsassociated with graminoid-dominated vegetation experience greater carbon losses fromdecomposition and are more sensitive to temperature than shrub-dominated soils
42 Turning Point of NEE Trend
The two schemes showed clear trend changes in 2053 Before 2053 the NEE exchangerate was large but it became much gentler after 2053 The trend change of NEE in 2053under RCP85 may be mainly attributable to temperature Therefore the temperatureunder RCP85 was divided into two periods of 2021ndash2053 and 2053ndash2100 with 2053 as thedividing point and the average annual temperature was compared and the significance ofthe difference was analyzed The results show that the average annual temperatures during2021ndash2053 and 2053ndash2100 are minus188 C and 099 C respectively and the temperaturedifference between the two periods is extremely significant (p lt 001) We can conclude thatin the context of future warming and drying with the increase in shrub plants the carbonsink capacity of the peatland ecosystem in the Great Hingrsquoan Mountains will increase butwhen the temperature reaches a certain threshold the carbon sink capacity of the ecosystemwill be weakened
43 Analysis of Environmental Factors Affecting NEE ER and GPP Changes
Warming can have multiple effects on ER and primary productivity two of the majorvertical carbon fluxes [74] Higher temperatures can extend the growing season potentiallyenhancing vegetation GPP [75] The correlation analysis method was used to determine theinfluence of environmental factors on the NEE ER and GPP of the peatland ecosystem inthe permafrost region of the Great Hingrsquoan Mountains The results passed the significancetest at the level of 01 (Tables S1ndashS6 in Supplementary Materials) For different scenariosthe influence of environmental factors on ER and GPP was slightly different with the twoschemes It is worth noting that with Scheme II under RCP26 NEE ER and GPP exchangerates were significantly positively correlated with temperature (p lt 01) In addition bothER and GPP in Scheme I under RCP26 and NEE and ER in Scheme II under RCP85 weresignificantly positively correlated with relative humidity (p lt 01) Combined with theresults of the environmental factors analysis under climate change temperature appears tobe an important factor affecting ecosystem carbon exchange with precipitation radiationand relative humidity also having certain influences (Figure 9)
Atmosphere 2022 13 44 13 of 18
Atmosphere 2021 13 x FOR PEER REVIEW 13 of 18
temperature appears to be an important factor affecting ecosystem carbon exchange with
precipitation radiation and relative humidity also having certain influences (Figure 9)
Figure 9 Correlation diagram between simulation results and meteorological elements
44 Uncertainty Analysis of Simulation Results
Previous studies found that the annual carbon assimilations from swamp or peatland
in the regions of Hingrsquoan Mountains were mostly attributable to the uptakes during the
growing seasons particularly from June to August [536268] The net carbon assimilation
by plants during the growing seasons was generally higher than the carbon emitted dur-
ing the non-growing seasons [76] Climate warming extends or alters the growing season
[67] enhances the warmth of summer and increases the carbon sink capacity of vegeta-
tion However it should be noted that it is still unknown whether the carbon released by
the permafrost ecosystem and the carbon absorbed by summer plant growth can be com-
pletely offset There may be more uncertainties in the process of the model prediction with
the continuous change of climate in the future as well as a series of problems such as the
internal structure of the model and the uncertainty of key input parameters which even-
tually affect the simulation results of carbon sourcessinks in ecosystems to some extent
For example with climate change the effect of fertilization driven by the increase in CO2
concentration is also likely to increase the peatland carbon sink through increases in pri-
mary productivity Recent field experiments suggest that permafrost thawing might pro-
mote deeper rooting of some plant species [7778] that attempt to exploit plant-available
nutrients at the permafrost thaw front [7980]
Soil has high spatial variability slow change rate and many processes affecting its
decomposition rate Therefore variations in soil and its characteristics will lead to uncer-
tainties because most C is stored in soil In addition if the water content remains un-
changed and the vegetation changes increased woody vegetation will promote C accu-
mulation [81] Increases in shrubs and trees have also been shown to increase the pools of
phenolic compounds and decrease the loss of peat carbon to the atmosphere [82] The
additional rhizosphere effect also deserves further attention A previous study suggested
that additional rhizodeposition with climate warming will promote carbon decomposi-
tion [83] Higher temperatures and reduced rainfall have negative effects on productivity
by increasing evapotranspiration and decreasing soil moisture [84ndash87]
The different definitions of vegetation types between the initial input data and Coup-
Model could also introduce uncertainties in the model simulation Research relying only
on individual model simulations still have inherent limitations However the strength of
this feedback is highly uncertain indeed it is now one of the largest uncertainties in future
climate predictions [88] In addition because changes in the active layer of frozen soil af-
fect the measurements our simulation results contain some inevitable errors Neverthe-
less our results are expected to complement early detection of changes in the role of the
peatland as a source or sink In future efforts we will attempt to reduce these errors as
Figure 9 Correlation diagram between simulation results and meteorological elements
44 Uncertainty Analysis of Simulation Results
Previous studies found that the annual carbon assimilations from swamp or peatlandin the regions of Hingrsquoan Mountains were mostly attributable to the uptakes during thegrowing seasons particularly from June to August [536268] The net carbon assimilationby plants during the growing seasons was generally higher than the carbon emitted duringthe non-growing seasons [76] Climate warming extends or alters the growing season [67]enhances the warmth of summer and increases the carbon sink capacity of vegetationHowever it should be noted that it is still unknown whether the carbon released by thepermafrost ecosystem and the carbon absorbed by summer plant growth can be completelyoffset There may be more uncertainties in the process of the model prediction withthe continuous change of climate in the future as well as a series of problems such asthe internal structure of the model and the uncertainty of key input parameters whicheventually affect the simulation results of carbon sourcessinks in ecosystems to someextent For example with climate change the effect of fertilization driven by the increasein CO2 concentration is also likely to increase the peatland carbon sink through increasesin primary productivity Recent field experiments suggest that permafrost thawing mightpromote deeper rooting of some plant species [7778] that attempt to exploit plant-availablenutrients at the permafrost thaw front [7980]
Soil has high spatial variability slow change rate and many processes affecting itsdecomposition rate Therefore variations in soil and its characteristics will lead to un-certainties because most C is stored in soil In addition if the water content remainsunchanged and the vegetation changes increased woody vegetation will promote C accu-mulation [81] Increases in shrubs and trees have also been shown to increase the poolsof phenolic compounds and decrease the loss of peat carbon to the atmosphere [82] Theadditional rhizosphere effect also deserves further attention A previous study suggestedthat additional rhizodeposition with climate warming will promote carbon decomposi-tion [83] Higher temperatures and reduced rainfall have negative effects on productivityby increasing evapotranspiration and decreasing soil moisture [84ndash87]
The different definitions of vegetation types between the initial input data and Coup-Model could also introduce uncertainties in the model simulation Research relying onlyon individual model simulations still have inherent limitations However the strength ofthis feedback is highly uncertain indeed it is now one of the largest uncertainties in futureclimate predictions [88] In addition because changes in the active layer of frozen soil affectthe measurements our simulation results contain some inevitable errors Nevertheless ourresults are expected to complement early detection of changes in the role of the peatlandas a source or sink In future efforts we will attempt to reduce these errors as much aspossible Our model projections also did not incorporate all changes expected under futureclimates such as changes in permafrost distribution delayed seasonal freeze-up increasedfire frequency landscape-level hydrologic changes mycorrhizal type and mycorrhizal dis-
Atmosphere 2022 13 44 14 of 18
tribution Therefore we hope that the above factors can be taken into account in subsequentapplications
5 Conclusions
In this study CoupModel could be well applied to our study area and the simulationresults are also convincing According to the climate change trend in the future twovegetation succession schemes were set Combined with CoupModel the carbon exchangeof the ecosystem was simulated using meteorological data for the next 80 years of the GreatHingrsquoan Mountains Moreover the simulation results show that after 2053 under the highwarming scenario the carbon sink capacity of the Great Hingrsquoan Mountains ecosystemmay be reduced
It should be noted that long-term changes in vegetation structure and compositionmay alter the response and control of soil carbon exchange in ecosystems to future cli-mate change Therefore further studies are necessary to explore the effects of changes invegetation types and their response to elevated temperatures In this manner responsesand feedback in biogeochemical cycling to global warming in boreal peatlands can bemore accurately predicted Our results are reassuring showing that the carbon sink ofnatural peatland may increase in the future With the ongoing global change the functionof northern peatlands remains uncertain especially those underlain by permafrost in theclimate system Our research could thus provide some scientific references in assessingthe role of northern peatlands from the perspective of their carbon exchanges with theatmosphere
Supplementary Materials The following are available online at httpswwwmdpicomarticle103390atmos13010044s1 Table S1 The correlation analysis between NEE simulation value andenvironmental factors in Scheme I Table S2 The correlation analysis between NEE simulation valueand environmental factors in Scheme II Table S3 The correlation analysis between ER simulationvalue and environmental factors in Scheme I Table S4 The correlation analysis between ER simulationvalue and environmental factors in Scheme II Table S5 The correlation analysis between GPPsimulation value and environmental factors in Scheme I Table S6 The correlation analysis betweenGPP simulation value and environmental factors in Scheme II
Author Contributions Data curation ZW Writingmdashoriginal draft YL Writingmdashreview amp editingLS All authors have read and agreed to the published version of the manuscript
Funding This research received no external funding
Institutional Review Board Statement Not applicable
Informed Consent Statement Not applicable
Data Availability Statement Not applicable
Acknowledgments This work has been supported by the National Natural Science Foundation ofChina (41771102) We gratefully acknowledge the anonymous reviewers for their comments on earlierversions of this paper We thank Mousong Wu Wenxin Zhang Hongxing He and Guojie Hu for theirguidance on model running
Conflicts of Interest The authors declare no conflict of interest
References1 IPCC Special Report on Global Warming of 15 C Cambridge University Press London UK 20182 Mingle J IPCC Special Report on the Ocean and Cryosphere in a Changing Climate New York Review of Books New York NY USA
2020 pp 49ndash513 Overland JE Wang MY Walsh JE Stroeve JC Future Arctic climate changes Adaptation and mitigation time scales Earths
Future 2014 2 68ndash74 [CrossRef]4 IPCC Climate Change 2013 The Physical Science Basis Contribution of Working Group I to the Fifth Assessment Report of the
Intergovernmental Panel on Climate Change Cambridge University Press Cambridge UK New York NY USA 20135 Piao S Ciais P Huang Y The impacts of climate change on waterresources and agriculture in China Nature 2010 2 467
Atmosphere 2022 13 44 15 of 18
6 Jobbaacutegy EG Jackson RB The vertical distribution of soil organic carbon and its relation to climate and vegetation Ecol Appl2000 10 423ndash436 [CrossRef]
7 Wiesmeier M Urbanski L Hobley E Lang B Luumltzow M Marin-Spiotta E van Wesemael B Rabot E Lieszlig M Garcia-Franco N et al Soil organic carbon storage as a key function of soilsmdashA review of drivers and indicators at various scalesGeoderma 2019 333 149ndash162 [CrossRef]
8 Kumar A Kumar M Pandey R ZhiGuo Y Cabral-Pinto M Forest soil nutrient stocks along altitudinal range of UttarakhandHimalayas An aid to Nature Based Climate Solutions CATENA 2021 207 105667 [CrossRef]
9 Nilawar AP Waikar ML Impacts of climate change on streamflow and sediment concentration under RCP 45 and 85 A casestudy in Purna river basin India Sci Total Environ 2019 650 2685ndash2696 [CrossRef] [PubMed]
10 Roulet NT Lafleur PM Richard PJH Moore TR Humphreys ER Bubier J Contemporary carbon balance and lateHolocene carbon accumulation in a northern peatland Glob Chang Biol 2007 13 397ndash411 [CrossRef]
11 Gorham E Northern Peatlands Role in the Carbon Cycle and Probable Responses to Climatic Warming Ecol Appl 1991 1182ndash195 [CrossRef]
12 Bradford MA Wieder WR Bonan GB Fierer N Raymond PA Crowther TW Managing uncertainty in soil carbonfeedbacks to climate change Nat Clim Chang 2016 6 751ndash758 [CrossRef]
13 Zimov SA Schuur EAG Chapin FS Permafrost and the global carbon budget Science 2006 312 1612ndash1613 [CrossRef]14 Hugelius GJ Strauss S Zubrzycki JW Harden EAG Schuur CL Ping L Schirrmeister G Grosse GJ Michaelson C
Koven J et al Estimated stocks of circumpolar permafrost carbon with quantified uncertainty ranges and identified data gapsBiogeosciences 2014 11 6573ndash6593 [CrossRef]
15 Schuur EAG McGuire AD Schaumldel C Grosse G Harden JW Hayes DJ Hugelius G Koven CD Kuhry P LawrenceDM et al Climate change and the permafrost carbon feedback Nature 2015 520 171ndash179 [CrossRef]
16 Buchanan PJ Matear RJ Lenton A Phipps SJ Chase Z Etheridge DM The simulated climate of the Last Glacial Maximumand insights into the global marine carbon cycle Clim Past 2016 12 2271ndash2295 [CrossRef]
17 Lacerra M Lund D Yu JM Schmittner A Carbon storage in the mid-depth Atlantic during millennial-scale climate eventsPaleoceanography 2017 32 780ndash795 [CrossRef]
18 Johnston CE Ewing SA Harden JW Varner RK Wickland KP Koch JC Fuller CC Manies K Jorgenson MT Effectof permafrost thaw on CO2 and CH4 exchange in a western Alaska peatland chronosequence Environ Res Lett 2014 9 0850048
19 Poumlrtner HO Roberts DC Masson-Delmotte V Zhai P Tignor M Poloczanska E Mintenbeck K Alegriacutea A NicolaiM Weyer NM et al IPCC Special Report on the Ocean and Cryosphere in a Changing Climate 2019 Available onlinehttpswwweeaeuropaeudata-and-mapsindicatorsarctic-sea-ice-3ipcc-4th-assessment-report-2007 (accessed on 10 De-cember 2021)
20 Biskaborn BK Smith SL Noetzli J Matthes H Vieira G Lantuit H Permafrost is warming at a global scale Nat Commun2019 10 264 [CrossRef] [PubMed]
21 Baird AJ Belyea LR Comas X Reeve AS Slater LD Understanding Carbon Cycling in Northern Peatlands Recent Developmentsand Future Prospects American Geophysical Union Washington DC USA 2009
22 Couwenberg J Assessing greenhouse gas emissions from peatlands using vegetation as a proxy Hydrobiologia 2011 674 67ndash89[CrossRef]
23 Tiemeyer B High emissions of greenhouse gases from grasslands on peat and other organic soils Glob Chang Biol 2016 224134ndash4149 [CrossRef]
24 Zhang L Gałka M Kumar A Liu M Knorr KH Yu ZG Plant succession and geochemical indices in immature peatlandsin the Changbai Mountains northeastern region of China Implications for climate change and peatland development Sci TotalEnviron 2021 773 143776 [CrossRef]
25 Shur YL Jorgenson MT Patterns of permafrost formation and degradation in relation to climate and ecosystems PermafrPeriglac Process 2007 18 7ndash19 [CrossRef]
26 Loranty MM Abbott BW Blok D Douglas TA Epstein HE Forbes BC Jones BM Kholodov AL Kropp H MalhotraA Reviews and syntheses Changing ecosystem influences on soil thermal regimes in northern high-latitude permafrost regionsBiogeosciences 2018 15 5287ndash5313 [CrossRef]
27 Dieleman CM Branfireun BA McLaughlin JW Lindo Z Climate change drives a shift in peatland ecosystem plantcommunity Implications for ecosystem function and stability Glob Chang Biol 2015 21 388ndash395 [CrossRef]
28 Robroek BJM Jassey VEJ Payne RJ Marti M Bragazza L Bleeker A Buttler A Caporn SJM Dise NB Kattge Jet al Taxonomic and functional turnover are decoupled in European peat bogs Nat Commun 2017 8 1161 [CrossRef]
29 Elmendorf SC Henry GHR Hollister RD Bjork RG Boulanger-Lapointe N Cooper EJ Cornelissen JHC DorrepaalE Elumeeva TG Gould A et al Plot-scale evidence of tundra vegetation change and links to recent summer warming NatClim Chang 2012 2 453ndash457 [CrossRef]
30 Myers-Smith IH Elmendorf SC Beck PSA Wilmking M Hallinger M Blok D Tape KD Rayback SA Macias-FauriaM Forbes BC et al Climate sensitivity of shrub growth across the tundra biome Nat Clim Chang 2015 5 887ndash891 [CrossRef]
31 Buttler A Robroek BJM Laggoun-Defarge F Jassey VEJ Pochelon C Bernard G Delarue F Gogo S Mariotte PMitchell EAD et al Experimental warming interacts with soil moisture to discriminate plant responses in an ombrotrophicpeatland J Veg Sci 2015 26 964ndash974 [CrossRef]
Atmosphere 2022 13 44 16 of 18
32 Chen H Song C Shi F Zhang X Mao R Effects of alder expansion on plant community composition and biomass in thepeatland in the Darsquoxingan Mountain Chin J Appl Environ Biol 2017 23 778ndash784 (In Chinese)
33 Hobbie SE Chapin FS Response of tundra plant biomass aboveground production nitrogen and CO2 flux to experimentalwarming Ecology 1998 79 1526ndash1544
34 Natali SM Schuur EAG Webb EE Pries CEH Crummer KG Permafrost degradation stimulates carbon loss fromexperimentally warmed tundra Ecology 2014 95 602ndash608 [CrossRef]
35 Mauritz M Bracho R Celis G Hutchings J Natali SM Pegoraro E Salmon VG Schaumldel C Webb EE Schuur EAGNonlinear CO2 flux response to 7 years of experimentally induced permafrost thaw Glob Chang Biol 2017 23 3646ndash3666[CrossRef]
36 Pries CEH Schuur EAG Crummer KG Thawing permafrost increases old soil and autotrophic respiration in tundraPartitioning ecosystem respiration using delta 13C and Delta 14C Glob Chang Biol 2013 19 649ndash661 [CrossRef]
37 Pries CEH Schuur EAG Natali SM Crummer KG Old soil carbon losses increase with ecosystem respiration inexperimentally thawed tundra Nat Clim Chang 2016 6 214ndash218 [CrossRef]
38 Chapin FS Shaver GR Giblin AE Nadelhoffer KJ Laundre JA Responses of Arctic tundra to experimental and observedchanges in climate Ecology 1995 76 694ndash711 [CrossRef]
39 Natali SM Schuur EAG Rubin RL Increased plant productivity in Alaskan tundra as a result of experimental warming ofsoil and permafrost J Ecol 2012 100 488ndash498 [CrossRef]
40 Sistla SA Moore JC Simpson RT Gough L Shaver GR Schimel JP Long-term warming restructures Arctic tundrawithout changing net soil carbon storage Nature 2013 497 615ndash618 [CrossRef]
41 Hobbie SE Temperature and plant species control over litter decomposition in Alaskan tundra Ecol Monogr 1996 66 503ndash522[CrossRef]
42 Qian HF Joseph R Zeng N Enhanced terrestrial carbon uptake in the Northern High Latitudes in the 21st century from theCoupled Carbon Cycle Climate Model Intercomparison Project model projections Glob Chang Biol 2010 16 641ndash656 [CrossRef]
43 Schaumldel C Koven CD Lawrence DM Celis G Garnello AJ Hutchings J Mauritz M Natali S Pegoraro MERodenhizer H et al Divergent patterns of experimental and model-derived permafrost ecosystem carbon dynamics in responseto Arctic warming Environ Res Lett 2018 13 105002 [CrossRef]
44 Schaumldel C Mauritz M Taylor M Ledman J Natali S Schuur EAG Eight Mile Lake Research Watershed Carbon inPermafrost Experimental Heating Research (CiPEHR) Seasonal Water Table Depth Data 2012ndash2018 Environ Data Initiat 2018[CrossRef]
45 Laughlin BC Hydrologic refugia plants and climate change Glob Chang Biol 2017 23 2941ndash2961 [CrossRef]46 Meehl GA Stocker TF Global Climate Projections Cambridge University Press Cambridge UK 200747 Xing W Bao K Gallego-Sala AV Charman DJ Zhang Z Gao C Lu X Wang G Climate controls on carbon accumulation
in peatlands of Northeast China Quaternary Sci Rev 2015 118 78ndash88 [CrossRef]48 Chaudhary N Westermann S Lamba S Shurpali N Sannel ABK Schurgers G Milleret PA Smith B Modelling past
and future peatland carbon dynamics across the pan-Arctic Glob Chang Biol 2020 26 4119ndash4133 [CrossRef] [PubMed]49 He Y Dong WJ Guo XY Ji JJ Simulation of net primary productivity of terrestrial vegetation in China from 1971 to 2000 J
Glaciol Geocryol 2007 29 226ndash232 (In Chinese)50 McGuire AD Lawrence DM Koven C Clein JS Burke E Chen GS Jafarov E MacDougall AH Marchenko SD
Nicolsky D Dependence of the evolution of carbon dynamics in the northern permafrost region on the trajectory of climatechange Proc Natl Acad Sci USA 2018 115 3882ndash3887 [CrossRef] [PubMed]
51 Shogren AJ Zarnetske JP Abbott BW Iannucci F Frei RJ Griffin NA Bowden WB Revealing biogeochemical signaturesof Arctic landscapes with river chemistry Sci Rep 2019 9 12894 [CrossRef]
52 Vonk JE Tank SE Walvoord MA Integrating hydrology and biogeochemistry across frozen landscapes Nat Commun 201910 5377 [CrossRef]
53 Yu XY Song CC Sun L Wang XW Shi F Cui Q Tan WW Growing season methane emissions from a permafrostpeatland of northeast China Observations using open-path eddy covariance method Atmos Environ 2017 153 135ndash149[CrossRef]
54 Gao WF Yao LL Liang H Song H Emissions of Nitrous oxide from continuous permafrost region in the Da XinganMountains Northeast China Atmos Environ 2019 198 34ndash45 [CrossRef]
55 Chen SS Zang SY Sun L Characteristics of permafrost degradation in Northeast China and its ecological effects A reviewSci Cold Arid Regs 2020 12 1ndash11
56 Xue ZS Jiang M Zhang Z Wu H Zhang T Simulating potential impacts of climate changes on distribution pattern andcarbon storage function of high latitude wetland plant communities in the Xingrsquoanling Mountains China Land Degrad Dev 202132 2704ndash2714 [CrossRef]
57 Song YY Jiang L Song CC Wang XW Ma XY Zhang H Tan WW Gao JL Hou AX Microbial abundance andenzymatic activity from tussock and shrub soil in permafrost peatland after 6-year warming Ecol Indicat 2021 126 107589[CrossRef]
58 Jansson PE Moon DS A coupled model of water heat and mass transfer using object orientation to improve flexibility andfunctionality Environ Model Softw 2001 16 37ndash46 [CrossRef]
Atmosphere 2022 13 44 17 of 18
59 He HX Jansson PE Gaumlrdenaumls A CoupModel (v60) An ecosystem model for coupled phosphorus nitrogen and carbondynamicsmdashEvaluated against empirical data from a climatic and fertility gradient in Sweden Geosci Model Dev 2020 65 1ndash55[CrossRef]
60 Wu SH Jansson PE Kolari P Modeling seasonal course of carbon fluxes and evapotranspiration in response to low temperatureand moisture in a boreal Scots pine ecosystem Ecol Model 2011 222 3103ndash3119 [CrossRef]
61 Wu MS Ran YH Jansson PE Chen P Tan X Zhang WX Global parameters sensitivity analysis of modeling water energyand carbon exchange of an arid agricultural ecosystem Agric For Meteorol 2019 271 295ndash306 [CrossRef]
62 Sun L Song CC Lafleur PM Miao YQ Wang XW Gong C Qiao TH Yu XY Tan WW Wetland-atmosphere methaneexchange in northeast china A comparison of permafrost peatland and freshwater wetlands Agric For Meteorol 2018 249239ndash249 [CrossRef]
63 Yu XY Song CC Sun L Wang XW Tan WW Towards an improved utilization of eddy covariance data Growing seasonCO2 exchange from a permafrost peatland in the Great Hingrsquoan Mountains Northeast China Ecol Indic 2020 115 106427[CrossRef]
64 Jansson PE CoupModel Model use calibration and validation Trans ASABE 2012 4 1335ndash134465 CoupModel Current Version of COUP Model for Download Available online httpwwwcoupmodelcom (accessed on 15
December 2021)66 Jansson PE Karlberg L Coupled Heat and Masstransfer Model for SoilndashPlantndashAtmosphere Systems Royal Institute of Technology
Stockholm Sweden 2010 p 48467 Zhang W Jansson PE Sigsgaard C McConnell A Jammet MM Westergaard-Nielsen A Lund M Friborg T Michelsen
A Elberling B et al Model-data fusion to assess year-round CO2 fluxes for an arctic heath ecosystem in West Greenland (69
N) Agric Forest Meteorol 2019 272 176ndash186 [CrossRef]68 Miao YQ Song CC Sun L Wang XW Meng HN Mao R Growing season methane emission from a boreal peatland in
the continuous permafrost zone of Northeast China Effects of active layer depth and vegetation Biogeosciences 2012 9 4455ndash4464[CrossRef]
69 Chen L Frauenfeld OW A comprehensive evaluation of precipitation simulations over China based on CMIP5 multimodelensemble projections J Geophys Res Atmos 2014 119 5767ndash5786 [CrossRef]
70 Sun Q Miao C Duan Q Comparative analysis of CMIP3 and CMIP5 global climate models for simulating the daily meanmaximum and minimum temperatures and daily precipitation over China J Geophys Res-Atmos 2015 120 4806ndash4824[CrossRef]
71 Haberl H Erb KH Krausmann F Human appropriation of net primary production Patterns trends and planetary boundariesAnnu Rev Environ Resour 2014 39 363ndash391 [CrossRef]
72 Peng S Ciais P Chevallier F Peylin P Cadule P Sitch S Li X Benchmarking the seasonal cycle of CO2 fluxes simulated byterrestrial ecosystem models Glob Biogeochem Cycles 2015 29 46ndash64 [CrossRef]
73 Mu C Zhang T Zhao Q Su H Wang S Cao B Peng X Wu Q Wu X Permafrost affects carbon exchange and itsresponse to experimental warming on the northern Qinghai-Tibetan Plateau Agric Meteorol 2017 247 252ndash259 [CrossRef]
74 Chapin FS III Woodwell GM Randerson JT Rastetter EB Lovett GM Baldocchi DD Clark DA Harmon MESchimel DS Valentini R et al Reconciling Carbon-cycle Concepts Terminology and Methods Ecosystems 2006 9 1041ndash1050[CrossRef]
75 Abbott BW Jones JB Edward AGS Chapin FS III Zimov S Biomass offsets little or none of permafrost carbon releasefrom soils streams and wildfire An expert assessment Environ Res Lett 2016 11 034014 [CrossRef]
76 Kumar DA Sharma MP Tao Y Estimation of carbon stock for greenhouse gas emissions from hydropower reservoirs StochEnviron Res Risk Assess 2018 32 3183ndash3193 [CrossRef]
77 Keuper F Dorrepaal E van Bodegom PM van Logtestijn R Venhuizen G van Hal J Aerts R Experimentally increasednutrient availability at the permafrost thaw front selectively enhances biomass production of deep-rooting subarctic peatlandspecies Glob Chang Biol 2017 23 4257ndash4266 [CrossRef]
78 Finger RA Effects of permafrost thaw on nitrogen availability and plantndashsoil interactions in a boreal Alaskan lowland J Ecol2016 104 1542ndash1554 [CrossRef]
79 Keuper F A frozen feast Thawing permafrost increases plant-available nitrogen in subarctic peatlands Glob Chang Biol 201218 1998ndash2007 [CrossRef]
80 Wild B Amino acid production exceeds plant nitrogen demand in Siberian tundra Environ Res Lett 2018 13 034002 [CrossRef]81 Ott CA Chimner RA Long-term peat accumulation in temperate forested peatlands (Thuja occidentalis swamps) in the Great
Lakes region of North America Mires Peat 2016 18 1ndash982 Wang H Richardson CJ Ho M Dual controls on carbon loss during drought in peatlands Nat Clim Chang 2015 5 584ndash587
[CrossRef]83 Keuper F Wild B Kummu M Beer C Blume-Werry G Fontaine S Gavazov K Gentsch N Guggenberger G Hugelius
G et al Carbon loss from northern circumpolar permafrost soils amplified by rhizosphere priming Nat Geosci 2020 13 560ndash565[CrossRef]
84 Zhu K Chiariello NR Tobeck T Fukami T Field CB Nonlinear interacting responses to climate limit grassland productionunder global change Proc Natl Acad Sci USA 2016 113 10589ndash10594 [CrossRef]
Atmosphere 2022 13 44 18 of 18
85 Reich PB Effects of climate warming on photosynthesis in boreal tree species depend on soil moisture Nature 2018 562 263ndash267[CrossRef]
86 Albert K Effects of elevated CO2 warming and drought episodes on plant carbon uptake in a temperate heath ecosystem arecontrolled by soil water status Plant Cell Environ 2011 34 1207ndash1222 [CrossRef] [PubMed]
87 Morgan JA C4 grasses prosper as carbon dioxide eliminates desiccation in warmed semi-arid grassland Nature 2011 476202ndash205 [CrossRef]
88 Gregory JM Jones CD Cadule P Friedlingstein P Quantifying carbon cycle feedbacks J Clim 2009 22 5232ndash5250[CrossRef]
Atmosphere 2022 13 44 2 of 18
the response of peatlands to warming represents a critical source of uncertainty in effortstoward projecting carbon-climate feedbacks over the upcoming century [12]
Permafrost refers to ground that remains frozen for two or more consecutive yearsand underlies many Arctic and boreal ecosystems In the current terrestrial ecosystempermafrost represents the largest soil carbon pool at 1330ndash1580 Pg [13ndash15] which is sig-nificantly higher than the C content in vegetation (650 Pg) and almost twice that in theatmosphere (730 Pg) [1617] Moreover soil C storage in permafrost regions accounts formore than 50 of the global soil carbon [18] However permafrost in high latitudes andhigh altitudes is highly sensitive to climate change and the growth rate of temperature inthese regions in the past 30 years has been twice the global growth rate [19] Permafrosttemperature has increased by 029 plusmn 012 C between 2007 and 2016 on the global scale [20]
Permafrost and peatlands are interdependent in Northeast China Under the uniquecold stagnant and anaerobic environment of peatlands in permafrost regions [21] a largeamount of C is stored in the soil In peatlands deeper water tables favor CO2 and N2Oemissions and shallower water tables favor CH4 emissions [2223] As a result theseregions are more vulnerable to climate change and likely to release more GHGs in responseto climate warming Specifically clarifying the carbon exchange process and emissioncharacteristics of the peatland in the Great Hingrsquoan Mountains in northern China is of greatsignificance for reducing GHG emissions and controlling climate warming [24]
Vegetation plays a crucial role in carbon cycling and the thermal state of permafrost [2526]Climate warming generally leads to changes in vegetation composition and structure [2728]In recent decades most boreal peatlands across the world have experienced substantialchanges in vegetation composition and structure as a consequence of climate warming [2728]Field observations have consistently indicated that the expansion of shrubs and forbs hasbeen changing pan-Arctic vegetation landscapes [2930] Specifically the relative abun-dance of woody plants (ie trees and deciduous shrubs) has increased and the cover ofSphagnum mosses and herbaceous plants has decreased and even disappeared [3132] Thepotential for ecosystems to store C on an annual basis depends on the equilibrium betweengross primary production (GPP) and the C released from ecosystem respiration (ER) in-cluding plant and microbial respiration Warmer temperatures can increase ER [33ndash35]which is driven by increases in both plant and microbial respiration [333637] Warmingpromotes woody-shrub expansion which will increase plant productivity and litter inputto soil [38ndash40] The enhancement of plant productivity increases C storage by plants andthus could compensate for some of the C loss from increased ER due to warmer tempera-tures [4142] However long-term field observations of experimental permafrost warminghave shown that ecosystem C losses exceed C gain after less than a decade [4344]
Global climate is now warming rapidly because of vegetation changes in responseto climatic change and some terrestrial surfaces are expected to experience less wateravailability during the growing season in the future [45] With the drying of the climatethe least drought-tolerant species are expected to disappear first In the coming decadeslong-term and continuous changes may have a significant impact on the distribution andfunction of vegetation [46] The key issue is that seasonal changes in precipitation aremore important to plant growth than annual changes To control the rise in global meantemperatures the reduction of CO2 emissions and storage of CO2 in land C sinks areindispensable While the Great Hingrsquoan Mountains ecosystem currently acts as a weak netcarbon sink [4748] with an average carbon accumulation rate of 4265 g C mminus2yrminus1 overthe past 2 ka [48] climate change could increase the ER of peatland and weaken or reversethe sink function of this region in the future [4849] The consequences of climate changeand vegetation change on the net ecosystem carbon balance remain uncertain [50ndash52] As aresult the role of the permafrost region of the Great Hingrsquoan Mountains as a carbon sink orsource in the future is being actively debated [53ndash57]
To understand the regional consequences of climate and vegetation change and es-timate the climate feedback of permafrost future carbon emissions from peatlands canbe quantified and predicted using CoupModel (a coupled heat and mass transfer model
Atmosphere 2022 13 44 3 of 18
for soilndashplantndashatmosphere systems) [58] CoupModel is a process-based biogeochemicalmodel that focuses on heat and water transfer and trace emissions from peatland ecosys-tems This model combines biogeochemical processes with hydrological dynamics andhas been constantly upgraded and improved A large number of studies have shown thatCoupModel is useful for simulating various types of emissions such as heat transfer watertransfer and GHGs [59ndash61]
With the continuous progress of global warming a typical peat swamp located in thepermafrost of the Great Hingrsquoan Mountains in Northern China is being severely affectedIn this study carbon exchange in the peatland in the next 80 years was simulated andpredicted To this end future scenario data of Coupled Model Intercomparison Project5 (CMIP5) were analyzed using CoupModel and various preset vegetation successionschemes The change trend and significant difference under different vegetation successionschemes were analyzed reasonably and the influencing factors of carbon exchange in thefuture were clarified This study could provide a reference in evaluating the changing trendand magnitude of the carbon exchange for the peatlands in the Great Hingrsquoan Mountains
2 Materials and Methods21 Study Area
The study area is located in the Great Hingrsquoan Mountains in Heilongjiang Province(5256prime32400primeprime N 12251prime23203primeprime E 473 m asl) which is a major permafrost area in China(Figure 1) The ecosystem of the Great Hingrsquoan Mountains plays an important role inthe stability of Asiarsquos climate system biodiversity and regional carbon balance making itindispensable to global biosphere integrity and the sustainable development of surroundingareas The main soil type in the study area is humus swamp peat soil with rich organicmatter content The peatland has continuously been acting as a sink for atmospheric CO2The water table ranges between 10 and 32 cm below the soil surface in the growing seasonThe maximum thawing depth approximates 68 cm [62] and the depth greater than 70 cmis generally permafrost layer
Atmosphere 2021 13 x FOR PEER REVIEW 3 of 18
To understand the regional consequences of climate and vegetation change and esti-
mate the climate feedback of permafrost future carbon emissions from peatlands can be
quantified and predicted using CoupModel (a coupled heat and mass transfer model for
soilndashplantndashatmosphere systems) [58] CoupModel is a process-based biogeochemical
model that focuses on heat and water transfer and trace emissions from peatland ecosys-
tems This model combines biogeochemical processes with hydrological dynamics and
has been constantly upgraded and improved A large number of studies have shown that
CoupModel is useful for simulating various types of emissions such as heat transfer wa-
ter transfer and GHGs [59ndash61]
With the continuous progress of global warming a typical peat swamp located in the
permafrost of the Great Hingrsquoan Mountains in Northern China is being severely affected
In this study carbon exchange in the peatland in the next 80 years was simulated and
predicted To this end future scenario data of Coupled Model Intercomparison Project 5
(CMIP5) were analyzed using CoupModel and various preset vegetation succession
schemes The change trend and significant difference under different vegetation succes-
sion schemes were analyzed reasonably and the influencing factors of carbon exchange
in the future were clarified This study could provide a reference in evaluating the chang-
ing trend and magnitude of the carbon exchange for the peatlands in the Great Hingrsquoan
Mountains
2 Materials and Methods
21 Study Area
The study area is located in the Great Hingrsquoan Mountains in Heilongjiang Province
(52deg56prime32400primersquo N 122deg51prime23203primersquo E 473 m asl) which is a major permafrost area in China
(Figure 1) The ecosystem of the Great Hingrsquoan Mountains plays an important role in the
stability of Asiarsquos climate system biodiversity and regional carbon balance making it
indispensable to global biosphere integrity and the sustainable development of surround-
ing areas The main soil type in the study area is humus swamp peat soil with rich organic
matter content The peatland has continuously been acting as a sink for atmospheric CO2
The water table ranges between 10 and 32 cm below the soil surface in the growing season
The maximum thawing depth approximates 68 cm [62] and the depth greater than 70 cm
is generally permafrost layer
Figure 1 The study area in Heilongjiang Province
Figure 1 The study area in Heilongjiang Province
22 Vegetation and Meteorological Data
The vegetation in the study area mainly includes deciduous shrubs evergreen shrubssedges and moss [63] Seedlings of trees such as Larix gmelinii Betula platyphylla andAlnus sibirica have widely expanded into the peatland [32] In the simulation process thevegetation layer is divided into two layers the first layer is the herbaceous layer (averageheight lt 15 cm) and the second layer is the shrub layer (average height gt 15 cm) The areais located in the continental monsoon climate zone of the cold temperate zone with anannual average temperature above minus400 C and precipitation is frequent in the warmestperiod (July and August) of the year sustaining plant growth Accordingly we defined thegrowing season for the site as May to September The warmest month is July (1875 C) and
Atmosphere 2022 13 44 4 of 18
the coldest month is January (minus2960 C) The annual precipitation and air temperatureover the past 30 years (1981ndash2010) were 45201 mm and minus390 C respectively
23 CoupModel
CoupModel is a process-based model that describes the biogeochemical processes ofcarbon and nitrogen in various ecosystems [64] The current version can be downloadedfrom the CoupModel home page [65] A detailed description can be found in Jansson andKarlberg [66] In the model biological and physical processes that describe vegetationdynamics snow dynamics soil heat and water exchange and soil bio-geochemistry arerepresented as individual modules [67] The model can be used to project future conditionsunder given input scenarios CoupModel inputs include meteorological data (such asradiation precipitation daily average temperature and relative humidity) vegetationtype soil characteristics and vegetation and initial soil element parameters among othersDuring the simulation period meteorological data series are in the form of daily averagesThe model assumes constant physical properties of soil and vegetation type throughoutthe simulation period The performance of CoupModel has been evaluated and reportedto be reliable for C cycling simulation in previous studies For example based on eddy-covariance (EC) measurements CoupModel had been used to assess the annual CO2 budgetfor an Arctic ecosystem over a 5 year period [67]
24 Model-Driven Data Construction241 Data Source
In this study net ecosystem exchange (NEE) and ER fluxes in 2016 and 2019 wereobtained using the static chambergas chromatography techniques and the detailed op-eration processes were consistent with Miao et al 2012 [68] The measurement frequencyis one or two times per week (except for bad weather or fire prevention periods) andthe average value was obtained from four repetitions of each measurement In additionair temperature and relative humidity soil temperature soil water content wind speednet radiation and thawing depth in 2016 and 2019 were measured using the HMP45Ctemperature and relative humidity probe (Vaisala Inc Helsinki Finland) 107-l temperatureprobe (Campbell Scientific NE USA) CS616-l water content reflectometer (Campbell scien-tific NE USA) W200p wind vane (Vector Inc Kuopio Finland) CNR-1 net radiometer(Kipp and Zonen NY USA) and manual measurement respectively The thaw depthwas measured manually once or twice a week during the observation period (except forbad weather and fire prevention period) Along the diagonal directions of the peatlandwe measured the depth of the active layer by inserting a steel rod into the soil until max-imum resistance and then recorded the distance from the bottom of the probe to thesurface layer We chose 10 sites in each diagonal line and then calculated the averagesCurrent climate data and prediction data from five global climate models (GCMs) wereselected to assess the sensitivity of peatland responses to climate change In this studythe current climate data were obtained from the China National Meteorological Center(1959ndash2018 httpdatacmagovcn accessed on 10 December 2021) The future meteoro-logical data (2006ndash2100) using five GCMs (GFDL-ESM2M HadGEM2-ES IPSL-CM5A-LRMIROC-ESM-CHEM NorESM1-M) under different future emission scenarios (Table 1)were obtained from CMIP5 (httpscera-wwwdkrzdeWDCCuicerasearch accessedon 10 December 2021) Previous studies have tested the performance of CMIP5 GCMs innortheastern China and reported that it could effectively represent the warming trend andinterannual variation of precipitation in the study area [6970] In this study the spatialresolutions of the input data and results were 05 times 05
Atmosphere 2022 13 44 5 of 18
Table 1 Details of the 5 CMIP5 climate models
Model Name Institution Country Spatial Resolution
GFDL-ESM2M NOAA USA 05 times 05
HadGEM2-ES MOHC UK 05 times 05
IPSL-CM5A-LR IPSL France 05 times 05
MIROC-ESM-CHEM MIROC Japan 05 times 05
NorESM1-M NCC Norway 05 times 05
242 Future Climate-Driven Data
The daily meteorological data from 2020 to 2100 (including temperature precipitationwind speed net radiation relative humidity and snow) were selected to drive the Coup-Model v6 simulation of the carbon cycles under climate change in the peatland In additionthe model requires input describing the geographical coordinates vegetation type andsoil physical and chemical parameters (texture bulk density and soil depth as well asinitial soil C content) Most of these input parameters were obtained through experimentalmeasurements The simulation results of the model were compared with the experimentaldata of the sites to verify the applicability of CoupModel to the study area
243 Representative Concentration Pathway (RCP) Emission Scenarios
IPCC presented four future emission scenarios (RCP26 RCP45 RCP60 and RCP85)in 2014 which were combined with the changes in CO2 concentration To ensure compa-rability of the results RCP26 (mitigation scenario) RCP60 (stabilization scenario) andRCP85 (business-as-usual scenario) were selected in this study Different emission sce-narios were used to compare the radiative forcing reaching the Earthrsquos surface and theatmospheric CO2 concentration by the year 2100 [71] RCP emission scenarios can not onlyestimate the concentration of GHGs until the end of the 21st century or over longer timescales but also convert dates into radiative forcing (W mminus2) The basic information aboutthe three scenarios is listed in Table 2
Table 2 Radiation forcing reaching the Earthrsquos surface and equivalent CO2 concentrations by 2100under the three different emission scenarios
RCPScenarios Emission Pattern Radiative Forcing
(W mminus2) until 2100CO2 Concentration
(ppm)
RCP26 Mitigation scenarioReaches a peak of 30 W mminus2
before 2100 and then drops to26 W mminus2
Reaches a peak of 490ppm before 2100 and
then drops
RCP60 Stabilizationscenario
Stabilizes after reaching60 W mminus2
Reaches a peak of 850ppm before 2100 and
then drops
RCP85 Business-as-usualscenario Reaches more than 85 W mminus2
Reaches a peak of 1370ppm before 2100 and
then drops
244 Model Performance Tests
Based on the experimental results of the detailed survey data the simulation resultswere compared with the measured data The coefficient of determination (R2) and NashndashSutcliffe efficiency coefficient (NSE) were used to evaluate the goodness of fit betweenthe simulation results and the measurement results The mathematical expressions are asfollows
Atmosphere 2022 13 44 6 of 18
R2 = 1minus
nsum
i=1(Si minusMi)
2
nsum
i=1(SminusMi)
2
NSE = 1minus
nsum
i=1(Mi minus Si)
2
nsum
i=1(Mi minus S)2
where Mi is observed value Si is simulated value and S is average observed value
25 Methods
To reflect the actual conditions as accurately as possible we presented an estimate ofclimate warming for C losses of the peatland ecosystem under baseline (2020) and futureclimatic conditions (2100) and selected three representative time periods (2020ndash2030 2050ndash2060 and 2090ndash2100) which represented the pre-century mid-century and late-centuryIn the process of simulation we considered the change in vegetation type associated withlong-term changes Considering that terrestrial ecosystem models had quite differentresults on vegetation changes in both historical simulations and future predictions [72] weset a relatively moderate change on peatland vegetation by assuming a gradual increase inshrubs until the end of this century and an unchanged peatland vegetation patten as thecurrent state Accordingly we ran CoupModel using two vegetation evolution schemesFor Scheme I the proportion of herbaceous and shrub vegetation was assumed to remainclose to the current vegetation situation and to remain stable until 2100 For Scheme IIherbaceous vegetation was assumed to be replaced by shrubs year by year and the finalvegetation type comprises only shrubs by 2100 For the above two schemes NEE ER andGPP were simulated In the subsequent expressions Scheme I and Scheme II were used torepresent different trends on the succession schemes of peatland vegetations Some of theparameters used in this study are shown in Table 3
Table 3 The part of application parameters in the model
Parameters Value Default Unit
TemQ10 3 2 -
Theta Lower Range 25 13 Vol
CH4 Aerobic Ox Rate 02 01 day
Reference Height 18 2 m
Temp Air Mean minus21 10 C
Albedo Leaf 15 25
RespTemQ10 3 2 -
RespTemQ10Bas 15 20 C
Albedo Dry 10 30
Albedo Wet 9 15
Latitude 429 585 -
3 Results31 Comparison of Meteorological Observations and Meteorological Predictions
The average temperature in the Great Hingrsquoan Mountains was minus417 C from 1959 to2018 and the average warming rate reached 025 C10a in 2015 the highest and lowesttemperatures were minus251 C and minus627 C respectively (Figure 2) The annual averagetemperature was the lowest (minus268 C) under RCP26 followed by RCP60 (minus204 C)and it was the highest (minus019 C) under RCP85 Under the three scenarios temperature
Atmosphere 2022 13 44 7 of 18
increased at rates of 026 C10a 029 C10a and 067 C10a respectively (Figure 2)which are all higher than that during the past 60 years The average temperature of thegrowing season was 1061 C in the past 60 years (Figure 2) The average temperature inthe growing season was similar to the annual average temperature with values of 1160 C1231 C and 1382 C under RCP26 RCP60 and RCP85 respectively which are higherthan that in the past 60 years (1061 C) (Figures 3ndash5)
Atmosphere 2021 13 x FOR PEER REVIEW 7 of 18
temperatures were minus251 degC and minus627 degC respectively (Figure 2) The annual average tem-
perature was the lowest (minus268 degC) under RCP26 followed by RCP60 (minus204 degC) and it
was the highest (minus019 degC) under RCP85 Under the three scenarios temperature in-
creased at rates of 026 degC10a 029 degC10a and 067 degC10a respectively (Figure 2) which
are all higher than that during the past 60 years The average temperature of the growing
season was 1061 degC in the past 60 years (Figure 2) The average temperature in the grow-
ing season was similar to the annual average temperature with values of 1160 degC 1231
degC and 1382 degC under RCP26 RCP60 and RCP85 respectively which are higher than
that in the past 60 years (1061 degC) (Figures 3ndash5)
Figure 2 Interannual variations in air temperature (black solid line) interannual variations in grow-
ing season temperature (red solid line) the total annual precipitation (sum of column heights of
blue and light blue) the growing season precipitation (the column height of light blue)
Figure 2 Interannual variations in air temperature (black solid line) interannual variations ingrowing season temperature (red solid line) the total annual precipitation (sum of column heights ofblue and light blue) the growing season precipitation (the column height of light blue)
Atmosphere 2021 13 x FOR PEER REVIEW 7 of 18
temperatures were minus251 degC and minus627 degC respectively (Figure 2) The annual average tem-
perature was the lowest (minus268 degC) under RCP26 followed by RCP60 (minus204 degC) and it
was the highest (minus019 degC) under RCP85 Under the three scenarios temperature in-
creased at rates of 026 degC10a 029 degC10a and 067 degC10a respectively (Figure 2) which
are all higher than that during the past 60 years The average temperature of the growing
season was 1061 degC in the past 60 years (Figure 2) The average temperature in the grow-
ing season was similar to the annual average temperature with values of 1160 degC 1231
degC and 1382 degC under RCP26 RCP60 and RCP85 respectively which are higher than
that in the past 60 years (1061 degC) (Figures 3ndash5)
Figure 2 Interannual variations in air temperature (black solid line) interannual variations in grow-
ing season temperature (red solid line) the total annual precipitation (sum of column heights of
blue and light blue) the growing season precipitation (the column height of light blue)
Figure 3 RCP26 scenario forecast meteorological data (2020ndash2100) On the left interannual variationsin air temperature (black solid line) interannual variations in growing season temperature (red solid
Atmosphere 2022 13 44 8 of 18
line) interannual variations in relative humidity (blue purple square) the total annual precipitation(sum of column heights of blue and light blue) and the growing season precipitation (column heightof light blue) On the right interannual variations in annual air temperature precipitation andrelative humidity (black solid square) interannual variations in growing season air temperatureprecipitation and relative humidity (red solid circle)
Atmosphere 2021 13 x FOR PEER REVIEW 8 of 18
Figure 3 RCP26 scenario forecast meteorological data (2020ndash2100) On the left interannual varia-
tions in air temperature (black solid line) interannual variations in growing season temperature
(red solid line) interannual variations in relative humidity (blue purple square) the total annual
precipitation (sum of column heights of blue and light blue) and the growing season precipitation
(column height of light blue) On the right interannual variations in annual air temperature pre-
cipitation and relative humidity (black solid square) interannual variations in growing season air
temperature precipitation and relative humidity (red solid circle)
Figure 4 RCP60 scenario forecast meteorological data (2020ndash2100) The legend illustrates the same
as Figure 3 Figure 4 RCP60 scenario forecast meteorological data (2020ndash2100) The legend illustrates the sameas Figure 3
Precipitation initially decreased and then increased and the average annual precipita-tion was 43872 mm (Figure 2) The average annual precipitation in the growing season was38241 mm from 1959 to 2018 (Figure 2) The average annual precipitation under RCP26RCP60 and RCP85 was 66090 mm 67482 mm and 71989 mm respectively whichvalues are higher than the average precipitation of the past 60 years (Figures 3ndash5) Theaverage annual precipitation in the growing season under RCP26 RCP60 and RCP85 was52998 mm 53986 mm and 57205 mm respectively which values are higher than that inthe past 60 years Under the three scenarios the annual average relative humidity showeda decreasing trend with values of 8567 8558 and 8510 under RCP26 RCP60 andRCP85 respectively (Figures 3ndash5) In general precipitation increased at the annual scalebut no distinct intensity changes were observed between wet and dry seasons potentiallybecause of the warming-driven increase in evapotranspiration
Atmosphere 2022 13 44 9 of 18Atmosphere 2021 13 x FOR PEER REVIEW 9 of 18
Figure 5 RCP85 scenario forecast meteorological data (2020ndash2100) The legend illustrates the same
as Figure 3
Precipitation initially decreased and then increased and the average annual precipi-
tation was 43872 mm (Figure 2) The average annual precipitation in the growing season
was 38241 mm from 1959 to 2018 (Figure 2) The average annual precipitation under
RCP26 RCP60 and RCP85 was 66090 mm 67482 mm and 71989 mm respectively
which values are higher than the average precipitation of the past 60 years (Figures 3ndash5)
The average annual precipitation in the growing season under RCP26 RCP60 and
RCP85 was 52998 mm 53986 mm and 57205 mm respectively which values are higher
than that in the past 60 years Under the three scenarios the annual average relative hu-
midity showed a decreasing trend with values of 8567 8558 and 8510 under
RCP26 RCP60 and RCP85 respectively (Figures 3ndash5) In general precipitation increased
at the annual scale but no distinct intensity changes were observed between wet and dry
seasons potentially because of the warming-driven increase in evapotranspiration
32 Calibration and Validation of CoupModel
Firstly the model was calibrated based on the measured NEE ER soil temperatures
and soil water content at depths from minus5 cm to minus40 cm and freezing-thawing depth Sub-
sequently we validated the simulation results against the experimental site data (soil tem-
perature water content NEE ER and thawing depth during the growing season) to ver-
ify the applicability of the model to the study area We compared the output from model
simulations corresponding to the present day against the observations to validate the
model performance Finally we used observation data covering the growing seasons of
2016 and 2019 to calibrate plant parameters and soil parameters in the model Initial soil
temperature initial water content growing degree days carbonnitrogen ratios pH SOC
and bulk density are the most sensitive parameters In addition we also determined some
parameters applicable to the model in the region as shown in Table 3
Figure 5 RCP85 scenario forecast meteorological data (2020ndash2100) The legend illustrates the sameas Figure 3
32 Calibration and Validation of CoupModel
Firstly the model was calibrated based on the measured NEE ER soil temperaturesand soil water content at depths from minus5 cm to minus40 cm and freezing-thawing depthSubsequently we validated the simulation results against the experimental site data (soiltemperature water content NEE ER and thawing depth during the growing season) toverify the applicability of the model to the study area We compared the output frommodel simulations corresponding to the present day against the observations to validatethe model performance Finally we used observation data covering the growing seasons of2016 and 2019 to calibrate plant parameters and soil parameters in the model Initial soiltemperature initial water content growing degree days carbonnitrogen ratios pH SOCand bulk density are the most sensitive parameters In addition we also determined someparameters applicable to the model in the region as shown in Table 3
In the verification of the applicability of CoupModel to the study area we carriedselected representative dates from different years Figure 6 shows the comparison betweensimulated and measured soil temperature values at different depths The simulated soiltemperature and soil water contents were close to the measured value in terms of size andvariation trend
Atmosphere 2022 13 44 10 of 18
Atmosphere 2021 13 x FOR PEER REVIEW 10 of 18
In the verification of the applicability of CoupModel to the study area we carried
selected representative dates from different years Figure 6 shows the comparison be-
tween simulated and measured soil temperature values at different depths The simulated
soil temperature and soil water contents were close to the measured value in terms of size
and variation trend
Figure 6 Soil temperature water content NEE ER and thawing depth in growing seasons of 2016
and 2019 the red solid lines represent the simulation results of the model the black solid lines and
blue and white circles represent the observed results
33 Changes in Peatland NEE ER and GPP under Three Future Climate Change Scenarios
Changes in NEE ER and GPP during various time periods were analyzed under
various future climate change scenarios With Scheme I the simulated changes in NEE
followed the order of RCP26 (minus333 kgcmminus2) lt RCP85 (minus340 kgcmminus2) lt RCP60 (minus341
Figure 6 Soil temperature water content NEE ER and thawing depth in growing seasons of 2016and 2019 the red solid lines represent the simulation results of the model the black solid lines andblue and white circles represent the observed results
33 Changes in Peatland NEE ER and GPP under Three Future Climate Change Scenarios
Changes in NEE ER and GPP during various time periods were analyzed un-der various future climate change scenarios With Scheme I the simulated changes inNEE followed the order of RCP26 (minus333 kgcmminus2) lt RCP85 (minus340 kgcmminus2) lt RCP60(minus341 kgcmminus2) and the changes under RCP26 and RCP60 exhibited an increasing trendwith time (Figure 7) The change trend of NEE with Scheme I under RCP85 was themost prominent by the end of the century The predicted ER and GPP changes in varioustime periods under different scenarios from 2010 to 2100 are similar Positive effects werestronger under RCP60 and RCP85 than under RCP26 In particular the positive effectwas significantly stronger under RCP85 Among them the change trends were similar
Atmosphere 2022 13 44 11 of 18
between ER and GPP which followed the orders of RCP26 (3900 kgcmminus2) lt RCP60 (4148kgcmminus2) lt RCP85 (4742 kgcmminus2) and RCP26 (4234 kgcmminus2) lt RCP60 (4490 kgcmminus2) ltRCP85 (5088 kgcmminus2) respectively
Atmosphere 2021 13 x FOR PEER REVIEW 11 of 18
kgcmminus2) and the changes under RCP26 and RCP60 exhibited an increasing trend with
time (Figure 7) The change trend of NEE with Scheme I under RCP85 was the most prom-
inent by the end of the century The predicted ER and GPP changes in various time peri-
ods under different scenarios from 2010 to 2100 are similar Positive effects were stronger
under RCP60 and RCP85 than under RCP26 In particular the positive effect was signif-
icantly stronger under RCP85 Among them the change trends were similar between ER
and GPP which followed the orders of RCP26 (3900 kgcmminus2) lt RCP60 (4148 kgcmminus2) lt
RCP85 (4742 kgcmminus2) and RCP26 (4234 kgcmminus2) lt RCP60 (4490 kgcmminus2) lt RCP85 (5088
kgcmminus2) respectively
Figure 7 Simulation results of NEE ER and GPP from 2021 to 2100 in Scheme I
With Scheme II the simulated changes in NEE were slightly different (Figure 8) fol-
lowing the order of RCP26 (minus359 kgcmminus2) lt RCP60 (minus366 kgcmminus2) lt RCP85 (minus367 kgcmminus2)
The change trend of NEE with Scheme II under RCP85 was similar to that with Scheme I
by the end of the 21st century The predicted changes in ER and GPP during various time
periods under different scenarios from 2010 to 2100 were also similar to those with Scheme
I The positive effects were stronger under RCP60 and RCP85 than under RCP26 In par-
ticular the effect was significantly stronger under RCP85 The change trends were similar
between ER and GPP which followed the orders of RCP26 (4214 kgcmminus2) lt RCP60 (4390
kgcmminus2) lt RCP85 (5029 kgcmminus2) and RCP26 (4483 kgcmminus2) lt RCP60 (4766 kgcmminus2) lt
RCP85 (5396 kgcmminus2) respectively
Figure 8 Simulation results of NEE ER and GPP from 2021 to 2100 in Scheme II
4 Discussion
41 Comparison of Simulation Results between Scheme I and Scheme II
To explore the response trends of vegetation with the two schemes to future climate
change we analyzed the simulation results of NEE GPP and ER with the two vegetation
schemes in different time periods and compared the differences between them On the
Figure 7 Simulation results of NEE ER and GPP from 2021 to 2100 in Scheme I
With Scheme II the simulated changes in NEE were slightly different (Figure 8)following the order of RCP26 (minus359 kgcmminus2) lt RCP60 (minus366 kgcmminus2) lt RCP85 (minus367kgcmminus2) The change trend of NEE with Scheme II under RCP85 was similar to that withScheme I by the end of the 21st century The predicted changes in ER and GPP duringvarious time periods under different scenarios from 2010 to 2100 were also similar to thosewith Scheme I The positive effects were stronger under RCP60 and RCP85 than underRCP26 In particular the effect was significantly stronger under RCP85 The change trendswere similar between ER and GPP which followed the orders of RCP26 (4214 kgcmminus2)lt RCP60 (4390 kgcmminus2) lt RCP85 (5029 kgcmminus2) and RCP26 (4483 kgcmminus2) lt RCP60(4766 kgcmminus2) lt RCP85 (5396 kgcmminus2) respectively
Atmosphere 2021 13 x FOR PEER REVIEW 11 of 18
kgcmminus2) and the changes under RCP26 and RCP60 exhibited an increasing trend with
time (Figure 7) The change trend of NEE with Scheme I under RCP85 was the most prom-
inent by the end of the century The predicted ER and GPP changes in various time peri-
ods under different scenarios from 2010 to 2100 are similar Positive effects were stronger
under RCP60 and RCP85 than under RCP26 In particular the positive effect was signif-
icantly stronger under RCP85 Among them the change trends were similar between ER
and GPP which followed the orders of RCP26 (3900 kgcmminus2) lt RCP60 (4148 kgcmminus2) lt
RCP85 (4742 kgcmminus2) and RCP26 (4234 kgcmminus2) lt RCP60 (4490 kgcmminus2) lt RCP85 (5088
kgcmminus2) respectively
Figure 7 Simulation results of NEE ER and GPP from 2021 to 2100 in Scheme I
With Scheme II the simulated changes in NEE were slightly different (Figure 8) fol-
lowing the order of RCP26 (minus359 kgcmminus2) lt RCP60 (minus366 kgcmminus2) lt RCP85 (minus367 kgcmminus2)
The change trend of NEE with Scheme II under RCP85 was similar to that with Scheme I
by the end of the 21st century The predicted changes in ER and GPP during various time
periods under different scenarios from 2010 to 2100 were also similar to those with Scheme
I The positive effects were stronger under RCP60 and RCP85 than under RCP26 In par-
ticular the effect was significantly stronger under RCP85 The change trends were similar
between ER and GPP which followed the orders of RCP26 (4214 kgcmminus2) lt RCP60 (4390
kgcmminus2) lt RCP85 (5029 kgcmminus2) and RCP26 (4483 kgcmminus2) lt RCP60 (4766 kgcmminus2) lt
RCP85 (5396 kgcmminus2) respectively
Figure 8 Simulation results of NEE ER and GPP from 2021 to 2100 in Scheme II
4 Discussion
41 Comparison of Simulation Results between Scheme I and Scheme II
To explore the response trends of vegetation with the two schemes to future climate
change we analyzed the simulation results of NEE GPP and ER with the two vegetation
schemes in different time periods and compared the differences between them On the
Figure 8 Simulation results of NEE ER and GPP from 2021 to 2100 in Scheme II
4 Discussion41 Comparison of Simulation Results between Scheme I and Scheme II
To explore the response trends of vegetation with the two schemes to future climatechange we analyzed the simulation results of NEE GPP and ER with the two vegetationschemes in different time periods and compared the differences between them On theone hand at the same time scale the simulation results of NEE GPP and ER with thetwo schemes will increase under different scenarios from RCP26 to RCP85 It could beconcluded that relatively moderate climate change has an apparent positive effect on thepeatland ecosystems Extension of growing season [67] and more plant biomass couldlead to higher autotrophic respiration [73] Considering the impact of climate change
Atmosphere 2022 13 44 12 of 18
and plant biomass it is worth noting that ER and GPP will increase significantly underRCP60 and RCP85 Overall the carbon sequestration capacity of the peatland ecosystemshowed a weak increasing trend and remained stable by the end of the 21st century Onthe other hand when the climate change reaches a certain degree it will form a negativecorrelation with the carbon sequestration capacity of the peatland ecosystem which meansthe carbon sink capacity will be weakened In particular NEE shows a decreasing trendafter 2053 under RCP85 The results show that the changes in NEE of the two vegetationschemes under the RCP85 in the peatland ecosystem will decrease by the end of the 21stcentury relative to the values during 2050ndash2060 This trend is different from the emissionpattern under RCP26 and RCP60 Both the simulation results of the carbon dynamics ofpan-Arctic peatlands show that the carbon sink capacity of the peatlands will be weakenedfrom the middle of the 21st century under RCP85 [48] Finally the overall trends in thesimulation results with the two vegetation schemes are similar but the specific valuesshow that Scheme II is greater than Scheme I The main reason is that with Scheme II thenumber of shrubs will increase annually and the photosynthesis respiration and carbonsequestration capacities of shrubs are higher than those of herbaceous plants This showsthat the change in vegetation type will lead to the change in carbon budget In additionthere were significant differences in NEE ER and GPP for the two schemes Peatlandsassociated with graminoid-dominated vegetation experience greater carbon losses fromdecomposition and are more sensitive to temperature than shrub-dominated soils
42 Turning Point of NEE Trend
The two schemes showed clear trend changes in 2053 Before 2053 the NEE exchangerate was large but it became much gentler after 2053 The trend change of NEE in 2053under RCP85 may be mainly attributable to temperature Therefore the temperatureunder RCP85 was divided into two periods of 2021ndash2053 and 2053ndash2100 with 2053 as thedividing point and the average annual temperature was compared and the significance ofthe difference was analyzed The results show that the average annual temperatures during2021ndash2053 and 2053ndash2100 are minus188 C and 099 C respectively and the temperaturedifference between the two periods is extremely significant (p lt 001) We can conclude thatin the context of future warming and drying with the increase in shrub plants the carbonsink capacity of the peatland ecosystem in the Great Hingrsquoan Mountains will increase butwhen the temperature reaches a certain threshold the carbon sink capacity of the ecosystemwill be weakened
43 Analysis of Environmental Factors Affecting NEE ER and GPP Changes
Warming can have multiple effects on ER and primary productivity two of the majorvertical carbon fluxes [74] Higher temperatures can extend the growing season potentiallyenhancing vegetation GPP [75] The correlation analysis method was used to determine theinfluence of environmental factors on the NEE ER and GPP of the peatland ecosystem inthe permafrost region of the Great Hingrsquoan Mountains The results passed the significancetest at the level of 01 (Tables S1ndashS6 in Supplementary Materials) For different scenariosthe influence of environmental factors on ER and GPP was slightly different with the twoschemes It is worth noting that with Scheme II under RCP26 NEE ER and GPP exchangerates were significantly positively correlated with temperature (p lt 01) In addition bothER and GPP in Scheme I under RCP26 and NEE and ER in Scheme II under RCP85 weresignificantly positively correlated with relative humidity (p lt 01) Combined with theresults of the environmental factors analysis under climate change temperature appears tobe an important factor affecting ecosystem carbon exchange with precipitation radiationand relative humidity also having certain influences (Figure 9)
Atmosphere 2022 13 44 13 of 18
Atmosphere 2021 13 x FOR PEER REVIEW 13 of 18
temperature appears to be an important factor affecting ecosystem carbon exchange with
precipitation radiation and relative humidity also having certain influences (Figure 9)
Figure 9 Correlation diagram between simulation results and meteorological elements
44 Uncertainty Analysis of Simulation Results
Previous studies found that the annual carbon assimilations from swamp or peatland
in the regions of Hingrsquoan Mountains were mostly attributable to the uptakes during the
growing seasons particularly from June to August [536268] The net carbon assimilation
by plants during the growing seasons was generally higher than the carbon emitted dur-
ing the non-growing seasons [76] Climate warming extends or alters the growing season
[67] enhances the warmth of summer and increases the carbon sink capacity of vegeta-
tion However it should be noted that it is still unknown whether the carbon released by
the permafrost ecosystem and the carbon absorbed by summer plant growth can be com-
pletely offset There may be more uncertainties in the process of the model prediction with
the continuous change of climate in the future as well as a series of problems such as the
internal structure of the model and the uncertainty of key input parameters which even-
tually affect the simulation results of carbon sourcessinks in ecosystems to some extent
For example with climate change the effect of fertilization driven by the increase in CO2
concentration is also likely to increase the peatland carbon sink through increases in pri-
mary productivity Recent field experiments suggest that permafrost thawing might pro-
mote deeper rooting of some plant species [7778] that attempt to exploit plant-available
nutrients at the permafrost thaw front [7980]
Soil has high spatial variability slow change rate and many processes affecting its
decomposition rate Therefore variations in soil and its characteristics will lead to uncer-
tainties because most C is stored in soil In addition if the water content remains un-
changed and the vegetation changes increased woody vegetation will promote C accu-
mulation [81] Increases in shrubs and trees have also been shown to increase the pools of
phenolic compounds and decrease the loss of peat carbon to the atmosphere [82] The
additional rhizosphere effect also deserves further attention A previous study suggested
that additional rhizodeposition with climate warming will promote carbon decomposi-
tion [83] Higher temperatures and reduced rainfall have negative effects on productivity
by increasing evapotranspiration and decreasing soil moisture [84ndash87]
The different definitions of vegetation types between the initial input data and Coup-
Model could also introduce uncertainties in the model simulation Research relying only
on individual model simulations still have inherent limitations However the strength of
this feedback is highly uncertain indeed it is now one of the largest uncertainties in future
climate predictions [88] In addition because changes in the active layer of frozen soil af-
fect the measurements our simulation results contain some inevitable errors Neverthe-
less our results are expected to complement early detection of changes in the role of the
peatland as a source or sink In future efforts we will attempt to reduce these errors as
Figure 9 Correlation diagram between simulation results and meteorological elements
44 Uncertainty Analysis of Simulation Results
Previous studies found that the annual carbon assimilations from swamp or peatlandin the regions of Hingrsquoan Mountains were mostly attributable to the uptakes during thegrowing seasons particularly from June to August [536268] The net carbon assimilationby plants during the growing seasons was generally higher than the carbon emitted duringthe non-growing seasons [76] Climate warming extends or alters the growing season [67]enhances the warmth of summer and increases the carbon sink capacity of vegetationHowever it should be noted that it is still unknown whether the carbon released by thepermafrost ecosystem and the carbon absorbed by summer plant growth can be completelyoffset There may be more uncertainties in the process of the model prediction withthe continuous change of climate in the future as well as a series of problems such asthe internal structure of the model and the uncertainty of key input parameters whicheventually affect the simulation results of carbon sourcessinks in ecosystems to someextent For example with climate change the effect of fertilization driven by the increasein CO2 concentration is also likely to increase the peatland carbon sink through increasesin primary productivity Recent field experiments suggest that permafrost thawing mightpromote deeper rooting of some plant species [7778] that attempt to exploit plant-availablenutrients at the permafrost thaw front [7980]
Soil has high spatial variability slow change rate and many processes affecting itsdecomposition rate Therefore variations in soil and its characteristics will lead to un-certainties because most C is stored in soil In addition if the water content remainsunchanged and the vegetation changes increased woody vegetation will promote C accu-mulation [81] Increases in shrubs and trees have also been shown to increase the poolsof phenolic compounds and decrease the loss of peat carbon to the atmosphere [82] Theadditional rhizosphere effect also deserves further attention A previous study suggestedthat additional rhizodeposition with climate warming will promote carbon decomposi-tion [83] Higher temperatures and reduced rainfall have negative effects on productivityby increasing evapotranspiration and decreasing soil moisture [84ndash87]
The different definitions of vegetation types between the initial input data and Coup-Model could also introduce uncertainties in the model simulation Research relying onlyon individual model simulations still have inherent limitations However the strength ofthis feedback is highly uncertain indeed it is now one of the largest uncertainties in futureclimate predictions [88] In addition because changes in the active layer of frozen soil affectthe measurements our simulation results contain some inevitable errors Nevertheless ourresults are expected to complement early detection of changes in the role of the peatlandas a source or sink In future efforts we will attempt to reduce these errors as much aspossible Our model projections also did not incorporate all changes expected under futureclimates such as changes in permafrost distribution delayed seasonal freeze-up increasedfire frequency landscape-level hydrologic changes mycorrhizal type and mycorrhizal dis-
Atmosphere 2022 13 44 14 of 18
tribution Therefore we hope that the above factors can be taken into account in subsequentapplications
5 Conclusions
In this study CoupModel could be well applied to our study area and the simulationresults are also convincing According to the climate change trend in the future twovegetation succession schemes were set Combined with CoupModel the carbon exchangeof the ecosystem was simulated using meteorological data for the next 80 years of the GreatHingrsquoan Mountains Moreover the simulation results show that after 2053 under the highwarming scenario the carbon sink capacity of the Great Hingrsquoan Mountains ecosystemmay be reduced
It should be noted that long-term changes in vegetation structure and compositionmay alter the response and control of soil carbon exchange in ecosystems to future cli-mate change Therefore further studies are necessary to explore the effects of changes invegetation types and their response to elevated temperatures In this manner responsesand feedback in biogeochemical cycling to global warming in boreal peatlands can bemore accurately predicted Our results are reassuring showing that the carbon sink ofnatural peatland may increase in the future With the ongoing global change the functionof northern peatlands remains uncertain especially those underlain by permafrost in theclimate system Our research could thus provide some scientific references in assessingthe role of northern peatlands from the perspective of their carbon exchanges with theatmosphere
Supplementary Materials The following are available online at httpswwwmdpicomarticle103390atmos13010044s1 Table S1 The correlation analysis between NEE simulation value andenvironmental factors in Scheme I Table S2 The correlation analysis between NEE simulation valueand environmental factors in Scheme II Table S3 The correlation analysis between ER simulationvalue and environmental factors in Scheme I Table S4 The correlation analysis between ER simulationvalue and environmental factors in Scheme II Table S5 The correlation analysis between GPPsimulation value and environmental factors in Scheme I Table S6 The correlation analysis betweenGPP simulation value and environmental factors in Scheme II
Author Contributions Data curation ZW Writingmdashoriginal draft YL Writingmdashreview amp editingLS All authors have read and agreed to the published version of the manuscript
Funding This research received no external funding
Institutional Review Board Statement Not applicable
Informed Consent Statement Not applicable
Data Availability Statement Not applicable
Acknowledgments This work has been supported by the National Natural Science Foundation ofChina (41771102) We gratefully acknowledge the anonymous reviewers for their comments on earlierversions of this paper We thank Mousong Wu Wenxin Zhang Hongxing He and Guojie Hu for theirguidance on model running
Conflicts of Interest The authors declare no conflict of interest
References1 IPCC Special Report on Global Warming of 15 C Cambridge University Press London UK 20182 Mingle J IPCC Special Report on the Ocean and Cryosphere in a Changing Climate New York Review of Books New York NY USA
2020 pp 49ndash513 Overland JE Wang MY Walsh JE Stroeve JC Future Arctic climate changes Adaptation and mitigation time scales Earths
Future 2014 2 68ndash74 [CrossRef]4 IPCC Climate Change 2013 The Physical Science Basis Contribution of Working Group I to the Fifth Assessment Report of the
Intergovernmental Panel on Climate Change Cambridge University Press Cambridge UK New York NY USA 20135 Piao S Ciais P Huang Y The impacts of climate change on waterresources and agriculture in China Nature 2010 2 467
Atmosphere 2022 13 44 15 of 18
6 Jobbaacutegy EG Jackson RB The vertical distribution of soil organic carbon and its relation to climate and vegetation Ecol Appl2000 10 423ndash436 [CrossRef]
7 Wiesmeier M Urbanski L Hobley E Lang B Luumltzow M Marin-Spiotta E van Wesemael B Rabot E Lieszlig M Garcia-Franco N et al Soil organic carbon storage as a key function of soilsmdashA review of drivers and indicators at various scalesGeoderma 2019 333 149ndash162 [CrossRef]
8 Kumar A Kumar M Pandey R ZhiGuo Y Cabral-Pinto M Forest soil nutrient stocks along altitudinal range of UttarakhandHimalayas An aid to Nature Based Climate Solutions CATENA 2021 207 105667 [CrossRef]
9 Nilawar AP Waikar ML Impacts of climate change on streamflow and sediment concentration under RCP 45 and 85 A casestudy in Purna river basin India Sci Total Environ 2019 650 2685ndash2696 [CrossRef] [PubMed]
10 Roulet NT Lafleur PM Richard PJH Moore TR Humphreys ER Bubier J Contemporary carbon balance and lateHolocene carbon accumulation in a northern peatland Glob Chang Biol 2007 13 397ndash411 [CrossRef]
11 Gorham E Northern Peatlands Role in the Carbon Cycle and Probable Responses to Climatic Warming Ecol Appl 1991 1182ndash195 [CrossRef]
12 Bradford MA Wieder WR Bonan GB Fierer N Raymond PA Crowther TW Managing uncertainty in soil carbonfeedbacks to climate change Nat Clim Chang 2016 6 751ndash758 [CrossRef]
13 Zimov SA Schuur EAG Chapin FS Permafrost and the global carbon budget Science 2006 312 1612ndash1613 [CrossRef]14 Hugelius GJ Strauss S Zubrzycki JW Harden EAG Schuur CL Ping L Schirrmeister G Grosse GJ Michaelson C
Koven J et al Estimated stocks of circumpolar permafrost carbon with quantified uncertainty ranges and identified data gapsBiogeosciences 2014 11 6573ndash6593 [CrossRef]
15 Schuur EAG McGuire AD Schaumldel C Grosse G Harden JW Hayes DJ Hugelius G Koven CD Kuhry P LawrenceDM et al Climate change and the permafrost carbon feedback Nature 2015 520 171ndash179 [CrossRef]
16 Buchanan PJ Matear RJ Lenton A Phipps SJ Chase Z Etheridge DM The simulated climate of the Last Glacial Maximumand insights into the global marine carbon cycle Clim Past 2016 12 2271ndash2295 [CrossRef]
17 Lacerra M Lund D Yu JM Schmittner A Carbon storage in the mid-depth Atlantic during millennial-scale climate eventsPaleoceanography 2017 32 780ndash795 [CrossRef]
18 Johnston CE Ewing SA Harden JW Varner RK Wickland KP Koch JC Fuller CC Manies K Jorgenson MT Effectof permafrost thaw on CO2 and CH4 exchange in a western Alaska peatland chronosequence Environ Res Lett 2014 9 0850048
19 Poumlrtner HO Roberts DC Masson-Delmotte V Zhai P Tignor M Poloczanska E Mintenbeck K Alegriacutea A NicolaiM Weyer NM et al IPCC Special Report on the Ocean and Cryosphere in a Changing Climate 2019 Available onlinehttpswwweeaeuropaeudata-and-mapsindicatorsarctic-sea-ice-3ipcc-4th-assessment-report-2007 (accessed on 10 De-cember 2021)
20 Biskaborn BK Smith SL Noetzli J Matthes H Vieira G Lantuit H Permafrost is warming at a global scale Nat Commun2019 10 264 [CrossRef] [PubMed]
21 Baird AJ Belyea LR Comas X Reeve AS Slater LD Understanding Carbon Cycling in Northern Peatlands Recent Developmentsand Future Prospects American Geophysical Union Washington DC USA 2009
22 Couwenberg J Assessing greenhouse gas emissions from peatlands using vegetation as a proxy Hydrobiologia 2011 674 67ndash89[CrossRef]
23 Tiemeyer B High emissions of greenhouse gases from grasslands on peat and other organic soils Glob Chang Biol 2016 224134ndash4149 [CrossRef]
24 Zhang L Gałka M Kumar A Liu M Knorr KH Yu ZG Plant succession and geochemical indices in immature peatlandsin the Changbai Mountains northeastern region of China Implications for climate change and peatland development Sci TotalEnviron 2021 773 143776 [CrossRef]
25 Shur YL Jorgenson MT Patterns of permafrost formation and degradation in relation to climate and ecosystems PermafrPeriglac Process 2007 18 7ndash19 [CrossRef]
26 Loranty MM Abbott BW Blok D Douglas TA Epstein HE Forbes BC Jones BM Kholodov AL Kropp H MalhotraA Reviews and syntheses Changing ecosystem influences on soil thermal regimes in northern high-latitude permafrost regionsBiogeosciences 2018 15 5287ndash5313 [CrossRef]
27 Dieleman CM Branfireun BA McLaughlin JW Lindo Z Climate change drives a shift in peatland ecosystem plantcommunity Implications for ecosystem function and stability Glob Chang Biol 2015 21 388ndash395 [CrossRef]
28 Robroek BJM Jassey VEJ Payne RJ Marti M Bragazza L Bleeker A Buttler A Caporn SJM Dise NB Kattge Jet al Taxonomic and functional turnover are decoupled in European peat bogs Nat Commun 2017 8 1161 [CrossRef]
29 Elmendorf SC Henry GHR Hollister RD Bjork RG Boulanger-Lapointe N Cooper EJ Cornelissen JHC DorrepaalE Elumeeva TG Gould A et al Plot-scale evidence of tundra vegetation change and links to recent summer warming NatClim Chang 2012 2 453ndash457 [CrossRef]
30 Myers-Smith IH Elmendorf SC Beck PSA Wilmking M Hallinger M Blok D Tape KD Rayback SA Macias-FauriaM Forbes BC et al Climate sensitivity of shrub growth across the tundra biome Nat Clim Chang 2015 5 887ndash891 [CrossRef]
31 Buttler A Robroek BJM Laggoun-Defarge F Jassey VEJ Pochelon C Bernard G Delarue F Gogo S Mariotte PMitchell EAD et al Experimental warming interacts with soil moisture to discriminate plant responses in an ombrotrophicpeatland J Veg Sci 2015 26 964ndash974 [CrossRef]
Atmosphere 2022 13 44 16 of 18
32 Chen H Song C Shi F Zhang X Mao R Effects of alder expansion on plant community composition and biomass in thepeatland in the Darsquoxingan Mountain Chin J Appl Environ Biol 2017 23 778ndash784 (In Chinese)
33 Hobbie SE Chapin FS Response of tundra plant biomass aboveground production nitrogen and CO2 flux to experimentalwarming Ecology 1998 79 1526ndash1544
34 Natali SM Schuur EAG Webb EE Pries CEH Crummer KG Permafrost degradation stimulates carbon loss fromexperimentally warmed tundra Ecology 2014 95 602ndash608 [CrossRef]
35 Mauritz M Bracho R Celis G Hutchings J Natali SM Pegoraro E Salmon VG Schaumldel C Webb EE Schuur EAGNonlinear CO2 flux response to 7 years of experimentally induced permafrost thaw Glob Chang Biol 2017 23 3646ndash3666[CrossRef]
36 Pries CEH Schuur EAG Crummer KG Thawing permafrost increases old soil and autotrophic respiration in tundraPartitioning ecosystem respiration using delta 13C and Delta 14C Glob Chang Biol 2013 19 649ndash661 [CrossRef]
37 Pries CEH Schuur EAG Natali SM Crummer KG Old soil carbon losses increase with ecosystem respiration inexperimentally thawed tundra Nat Clim Chang 2016 6 214ndash218 [CrossRef]
38 Chapin FS Shaver GR Giblin AE Nadelhoffer KJ Laundre JA Responses of Arctic tundra to experimental and observedchanges in climate Ecology 1995 76 694ndash711 [CrossRef]
39 Natali SM Schuur EAG Rubin RL Increased plant productivity in Alaskan tundra as a result of experimental warming ofsoil and permafrost J Ecol 2012 100 488ndash498 [CrossRef]
40 Sistla SA Moore JC Simpson RT Gough L Shaver GR Schimel JP Long-term warming restructures Arctic tundrawithout changing net soil carbon storage Nature 2013 497 615ndash618 [CrossRef]
41 Hobbie SE Temperature and plant species control over litter decomposition in Alaskan tundra Ecol Monogr 1996 66 503ndash522[CrossRef]
42 Qian HF Joseph R Zeng N Enhanced terrestrial carbon uptake in the Northern High Latitudes in the 21st century from theCoupled Carbon Cycle Climate Model Intercomparison Project model projections Glob Chang Biol 2010 16 641ndash656 [CrossRef]
43 Schaumldel C Koven CD Lawrence DM Celis G Garnello AJ Hutchings J Mauritz M Natali S Pegoraro MERodenhizer H et al Divergent patterns of experimental and model-derived permafrost ecosystem carbon dynamics in responseto Arctic warming Environ Res Lett 2018 13 105002 [CrossRef]
44 Schaumldel C Mauritz M Taylor M Ledman J Natali S Schuur EAG Eight Mile Lake Research Watershed Carbon inPermafrost Experimental Heating Research (CiPEHR) Seasonal Water Table Depth Data 2012ndash2018 Environ Data Initiat 2018[CrossRef]
45 Laughlin BC Hydrologic refugia plants and climate change Glob Chang Biol 2017 23 2941ndash2961 [CrossRef]46 Meehl GA Stocker TF Global Climate Projections Cambridge University Press Cambridge UK 200747 Xing W Bao K Gallego-Sala AV Charman DJ Zhang Z Gao C Lu X Wang G Climate controls on carbon accumulation
in peatlands of Northeast China Quaternary Sci Rev 2015 118 78ndash88 [CrossRef]48 Chaudhary N Westermann S Lamba S Shurpali N Sannel ABK Schurgers G Milleret PA Smith B Modelling past
and future peatland carbon dynamics across the pan-Arctic Glob Chang Biol 2020 26 4119ndash4133 [CrossRef] [PubMed]49 He Y Dong WJ Guo XY Ji JJ Simulation of net primary productivity of terrestrial vegetation in China from 1971 to 2000 J
Glaciol Geocryol 2007 29 226ndash232 (In Chinese)50 McGuire AD Lawrence DM Koven C Clein JS Burke E Chen GS Jafarov E MacDougall AH Marchenko SD
Nicolsky D Dependence of the evolution of carbon dynamics in the northern permafrost region on the trajectory of climatechange Proc Natl Acad Sci USA 2018 115 3882ndash3887 [CrossRef] [PubMed]
51 Shogren AJ Zarnetske JP Abbott BW Iannucci F Frei RJ Griffin NA Bowden WB Revealing biogeochemical signaturesof Arctic landscapes with river chemistry Sci Rep 2019 9 12894 [CrossRef]
52 Vonk JE Tank SE Walvoord MA Integrating hydrology and biogeochemistry across frozen landscapes Nat Commun 201910 5377 [CrossRef]
53 Yu XY Song CC Sun L Wang XW Shi F Cui Q Tan WW Growing season methane emissions from a permafrostpeatland of northeast China Observations using open-path eddy covariance method Atmos Environ 2017 153 135ndash149[CrossRef]
54 Gao WF Yao LL Liang H Song H Emissions of Nitrous oxide from continuous permafrost region in the Da XinganMountains Northeast China Atmos Environ 2019 198 34ndash45 [CrossRef]
55 Chen SS Zang SY Sun L Characteristics of permafrost degradation in Northeast China and its ecological effects A reviewSci Cold Arid Regs 2020 12 1ndash11
56 Xue ZS Jiang M Zhang Z Wu H Zhang T Simulating potential impacts of climate changes on distribution pattern andcarbon storage function of high latitude wetland plant communities in the Xingrsquoanling Mountains China Land Degrad Dev 202132 2704ndash2714 [CrossRef]
57 Song YY Jiang L Song CC Wang XW Ma XY Zhang H Tan WW Gao JL Hou AX Microbial abundance andenzymatic activity from tussock and shrub soil in permafrost peatland after 6-year warming Ecol Indicat 2021 126 107589[CrossRef]
58 Jansson PE Moon DS A coupled model of water heat and mass transfer using object orientation to improve flexibility andfunctionality Environ Model Softw 2001 16 37ndash46 [CrossRef]
Atmosphere 2022 13 44 17 of 18
59 He HX Jansson PE Gaumlrdenaumls A CoupModel (v60) An ecosystem model for coupled phosphorus nitrogen and carbondynamicsmdashEvaluated against empirical data from a climatic and fertility gradient in Sweden Geosci Model Dev 2020 65 1ndash55[CrossRef]
60 Wu SH Jansson PE Kolari P Modeling seasonal course of carbon fluxes and evapotranspiration in response to low temperatureand moisture in a boreal Scots pine ecosystem Ecol Model 2011 222 3103ndash3119 [CrossRef]
61 Wu MS Ran YH Jansson PE Chen P Tan X Zhang WX Global parameters sensitivity analysis of modeling water energyand carbon exchange of an arid agricultural ecosystem Agric For Meteorol 2019 271 295ndash306 [CrossRef]
62 Sun L Song CC Lafleur PM Miao YQ Wang XW Gong C Qiao TH Yu XY Tan WW Wetland-atmosphere methaneexchange in northeast china A comparison of permafrost peatland and freshwater wetlands Agric For Meteorol 2018 249239ndash249 [CrossRef]
63 Yu XY Song CC Sun L Wang XW Tan WW Towards an improved utilization of eddy covariance data Growing seasonCO2 exchange from a permafrost peatland in the Great Hingrsquoan Mountains Northeast China Ecol Indic 2020 115 106427[CrossRef]
64 Jansson PE CoupModel Model use calibration and validation Trans ASABE 2012 4 1335ndash134465 CoupModel Current Version of COUP Model for Download Available online httpwwwcoupmodelcom (accessed on 15
December 2021)66 Jansson PE Karlberg L Coupled Heat and Masstransfer Model for SoilndashPlantndashAtmosphere Systems Royal Institute of Technology
Stockholm Sweden 2010 p 48467 Zhang W Jansson PE Sigsgaard C McConnell A Jammet MM Westergaard-Nielsen A Lund M Friborg T Michelsen
A Elberling B et al Model-data fusion to assess year-round CO2 fluxes for an arctic heath ecosystem in West Greenland (69
N) Agric Forest Meteorol 2019 272 176ndash186 [CrossRef]68 Miao YQ Song CC Sun L Wang XW Meng HN Mao R Growing season methane emission from a boreal peatland in
the continuous permafrost zone of Northeast China Effects of active layer depth and vegetation Biogeosciences 2012 9 4455ndash4464[CrossRef]
69 Chen L Frauenfeld OW A comprehensive evaluation of precipitation simulations over China based on CMIP5 multimodelensemble projections J Geophys Res Atmos 2014 119 5767ndash5786 [CrossRef]
70 Sun Q Miao C Duan Q Comparative analysis of CMIP3 and CMIP5 global climate models for simulating the daily meanmaximum and minimum temperatures and daily precipitation over China J Geophys Res-Atmos 2015 120 4806ndash4824[CrossRef]
71 Haberl H Erb KH Krausmann F Human appropriation of net primary production Patterns trends and planetary boundariesAnnu Rev Environ Resour 2014 39 363ndash391 [CrossRef]
72 Peng S Ciais P Chevallier F Peylin P Cadule P Sitch S Li X Benchmarking the seasonal cycle of CO2 fluxes simulated byterrestrial ecosystem models Glob Biogeochem Cycles 2015 29 46ndash64 [CrossRef]
73 Mu C Zhang T Zhao Q Su H Wang S Cao B Peng X Wu Q Wu X Permafrost affects carbon exchange and itsresponse to experimental warming on the northern Qinghai-Tibetan Plateau Agric Meteorol 2017 247 252ndash259 [CrossRef]
74 Chapin FS III Woodwell GM Randerson JT Rastetter EB Lovett GM Baldocchi DD Clark DA Harmon MESchimel DS Valentini R et al Reconciling Carbon-cycle Concepts Terminology and Methods Ecosystems 2006 9 1041ndash1050[CrossRef]
75 Abbott BW Jones JB Edward AGS Chapin FS III Zimov S Biomass offsets little or none of permafrost carbon releasefrom soils streams and wildfire An expert assessment Environ Res Lett 2016 11 034014 [CrossRef]
76 Kumar DA Sharma MP Tao Y Estimation of carbon stock for greenhouse gas emissions from hydropower reservoirs StochEnviron Res Risk Assess 2018 32 3183ndash3193 [CrossRef]
77 Keuper F Dorrepaal E van Bodegom PM van Logtestijn R Venhuizen G van Hal J Aerts R Experimentally increasednutrient availability at the permafrost thaw front selectively enhances biomass production of deep-rooting subarctic peatlandspecies Glob Chang Biol 2017 23 4257ndash4266 [CrossRef]
78 Finger RA Effects of permafrost thaw on nitrogen availability and plantndashsoil interactions in a boreal Alaskan lowland J Ecol2016 104 1542ndash1554 [CrossRef]
79 Keuper F A frozen feast Thawing permafrost increases plant-available nitrogen in subarctic peatlands Glob Chang Biol 201218 1998ndash2007 [CrossRef]
80 Wild B Amino acid production exceeds plant nitrogen demand in Siberian tundra Environ Res Lett 2018 13 034002 [CrossRef]81 Ott CA Chimner RA Long-term peat accumulation in temperate forested peatlands (Thuja occidentalis swamps) in the Great
Lakes region of North America Mires Peat 2016 18 1ndash982 Wang H Richardson CJ Ho M Dual controls on carbon loss during drought in peatlands Nat Clim Chang 2015 5 584ndash587
[CrossRef]83 Keuper F Wild B Kummu M Beer C Blume-Werry G Fontaine S Gavazov K Gentsch N Guggenberger G Hugelius
G et al Carbon loss from northern circumpolar permafrost soils amplified by rhizosphere priming Nat Geosci 2020 13 560ndash565[CrossRef]
84 Zhu K Chiariello NR Tobeck T Fukami T Field CB Nonlinear interacting responses to climate limit grassland productionunder global change Proc Natl Acad Sci USA 2016 113 10589ndash10594 [CrossRef]
Atmosphere 2022 13 44 18 of 18
85 Reich PB Effects of climate warming on photosynthesis in boreal tree species depend on soil moisture Nature 2018 562 263ndash267[CrossRef]
86 Albert K Effects of elevated CO2 warming and drought episodes on plant carbon uptake in a temperate heath ecosystem arecontrolled by soil water status Plant Cell Environ 2011 34 1207ndash1222 [CrossRef] [PubMed]
87 Morgan JA C4 grasses prosper as carbon dioxide eliminates desiccation in warmed semi-arid grassland Nature 2011 476202ndash205 [CrossRef]
88 Gregory JM Jones CD Cadule P Friedlingstein P Quantifying carbon cycle feedbacks J Clim 2009 22 5232ndash5250[CrossRef]
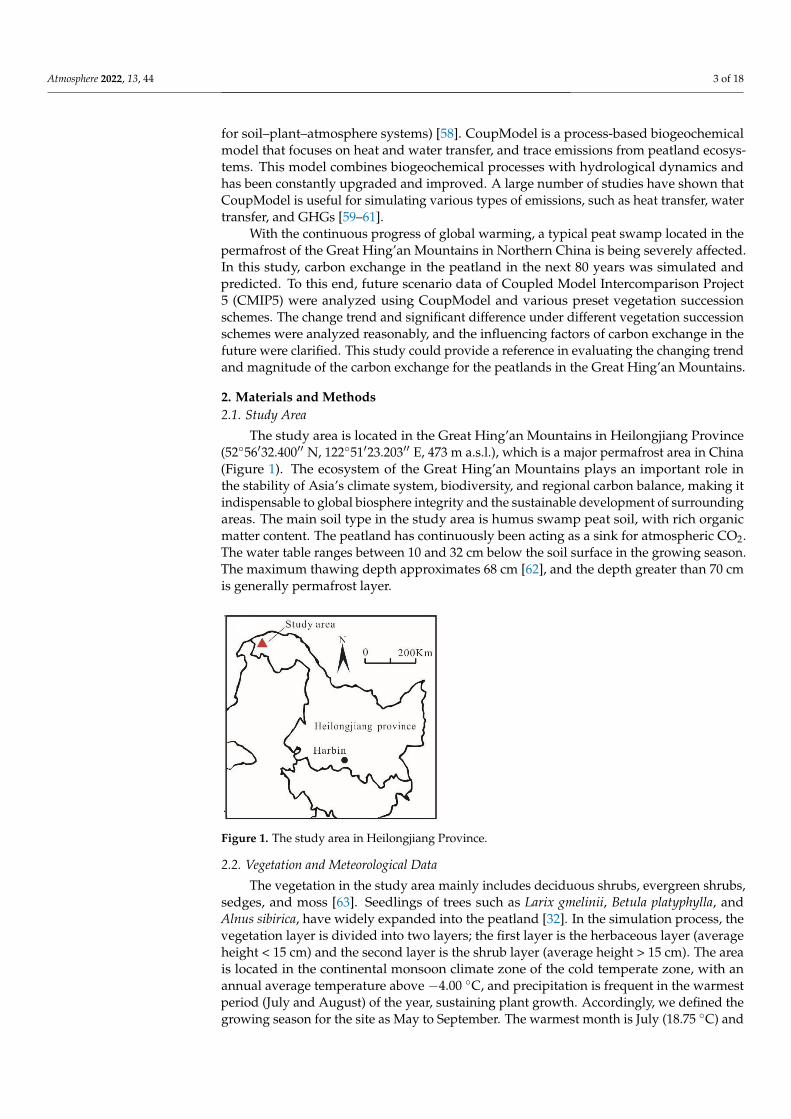
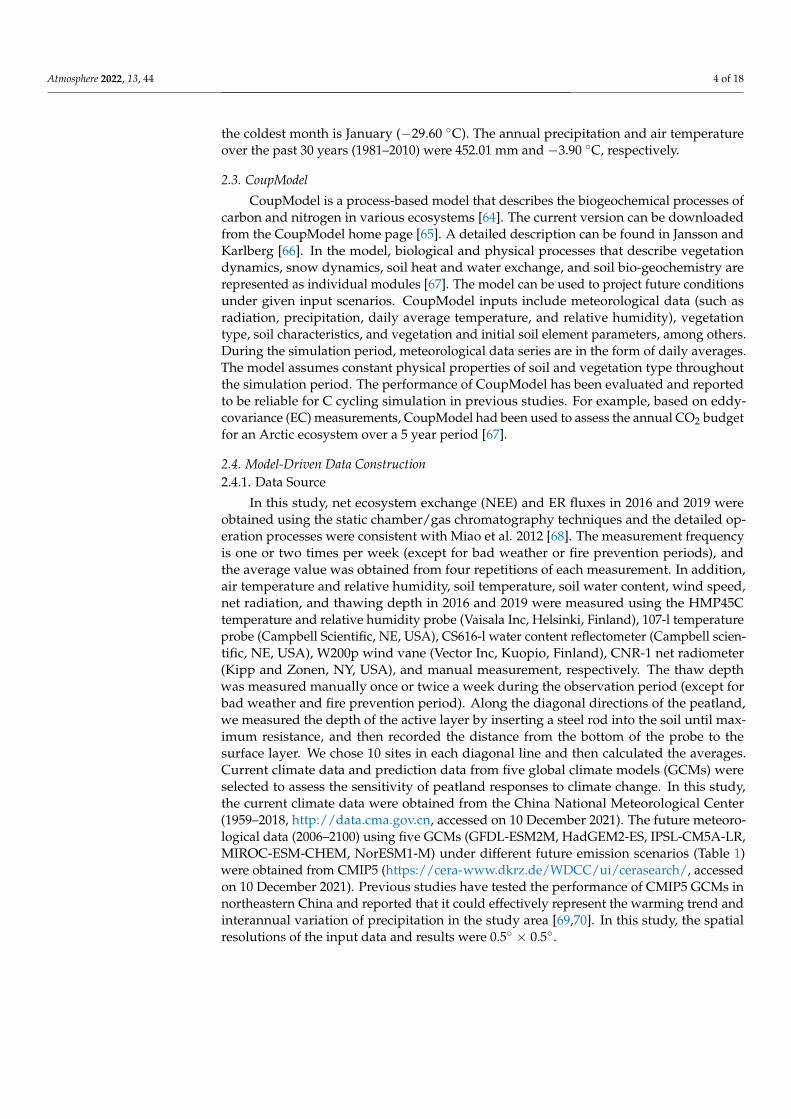
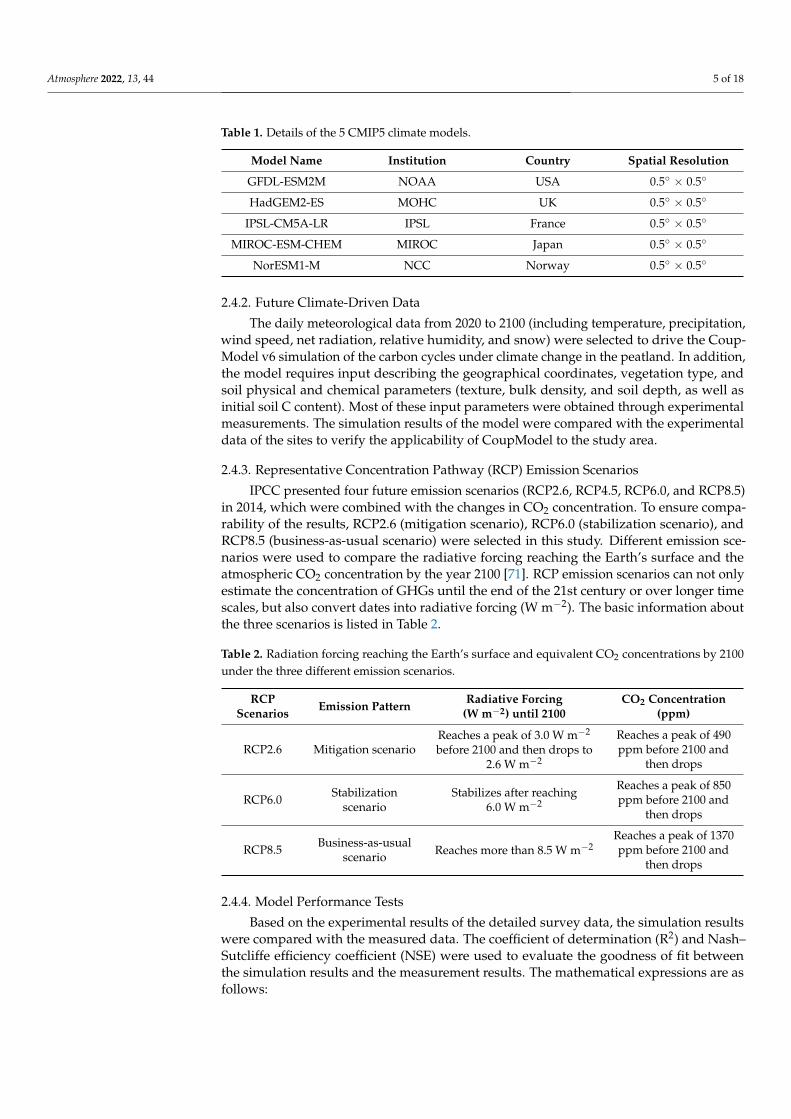
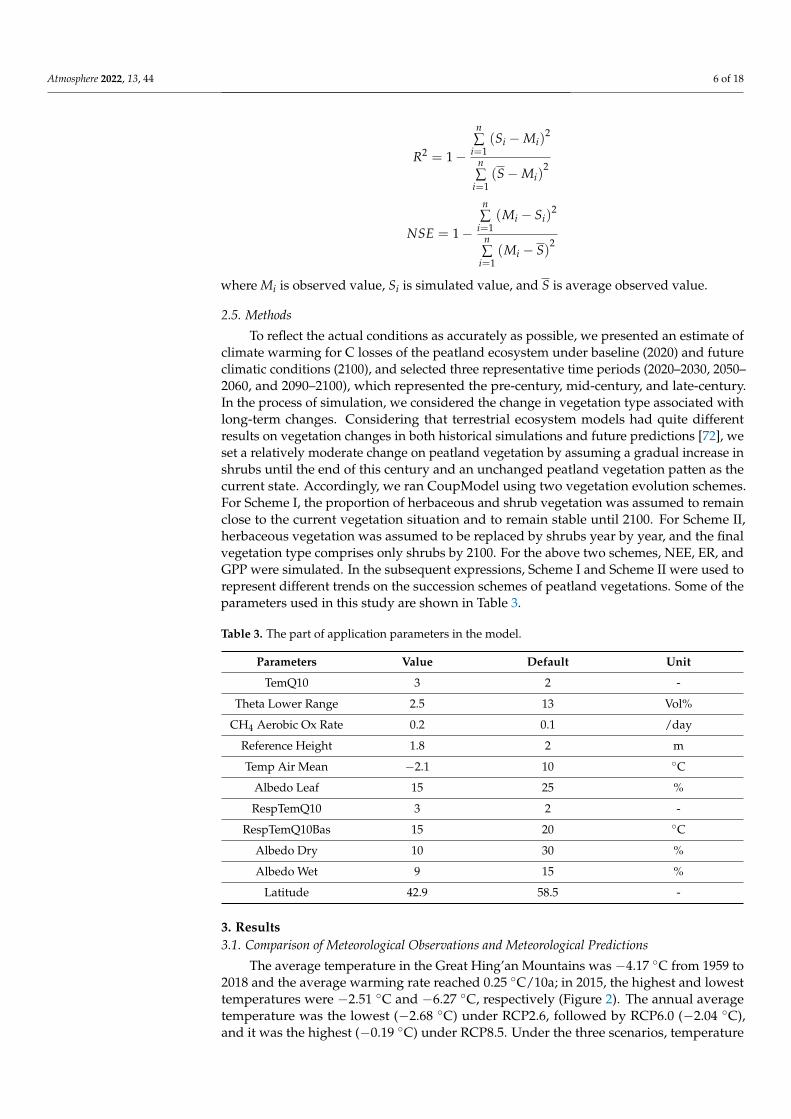
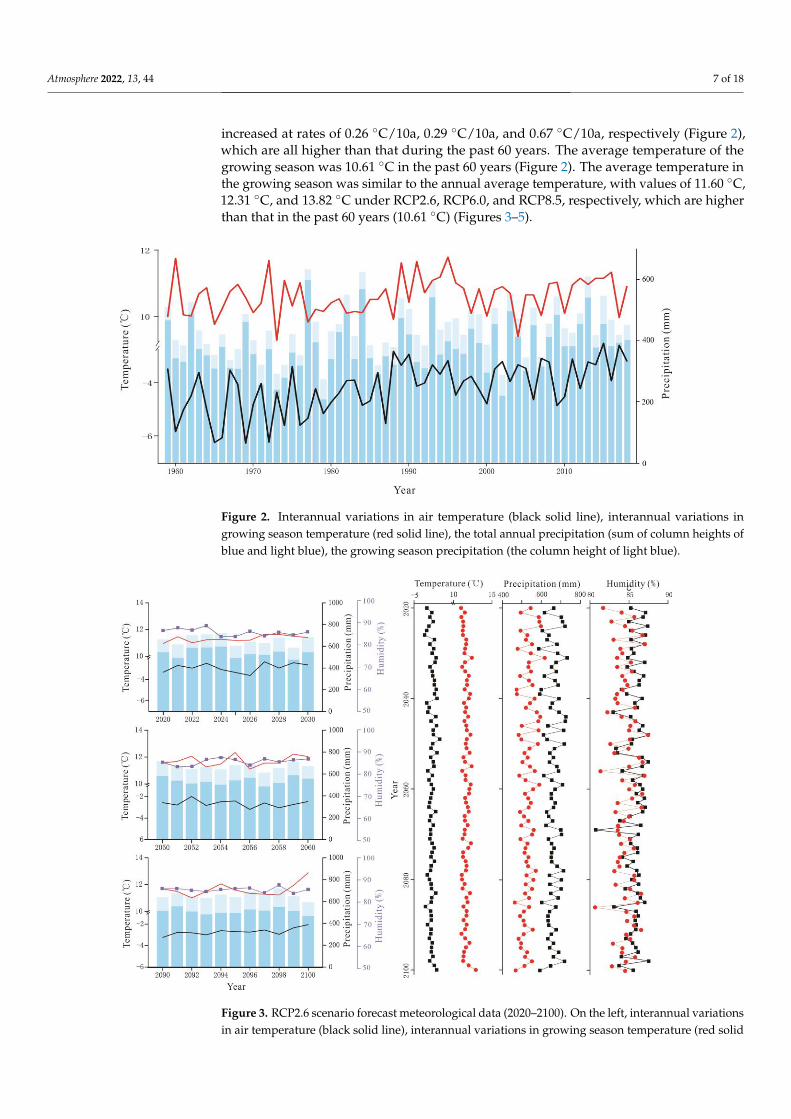
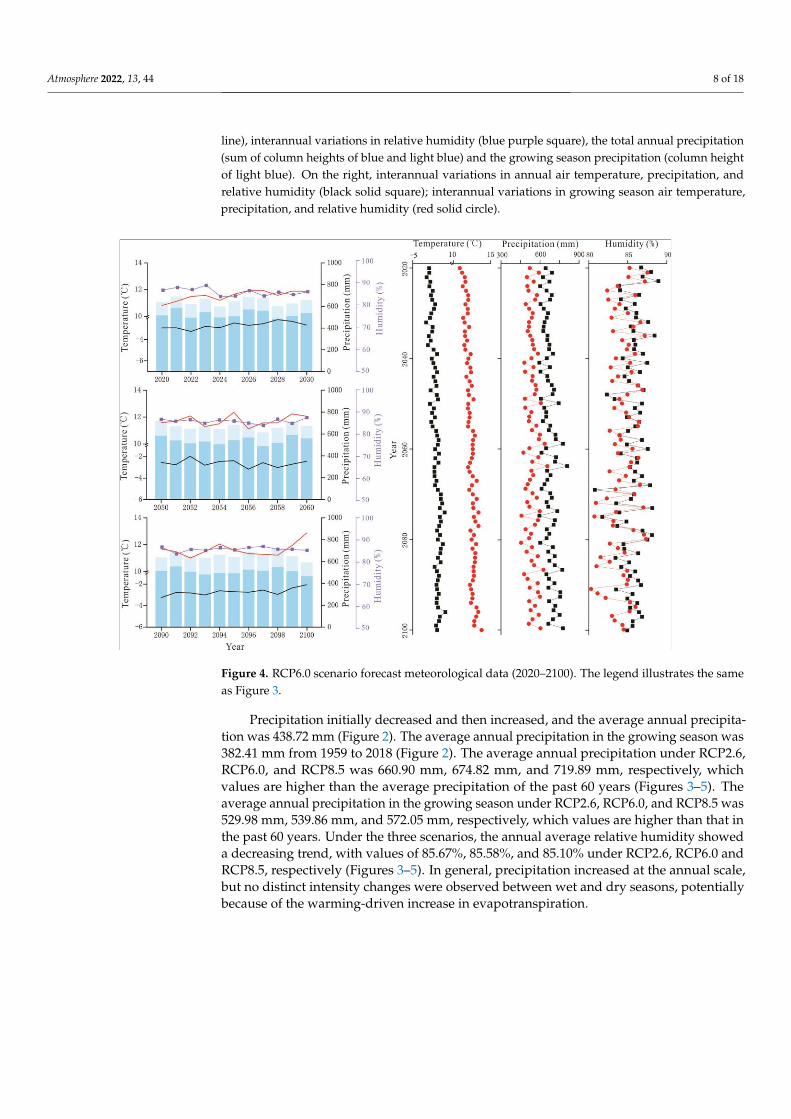
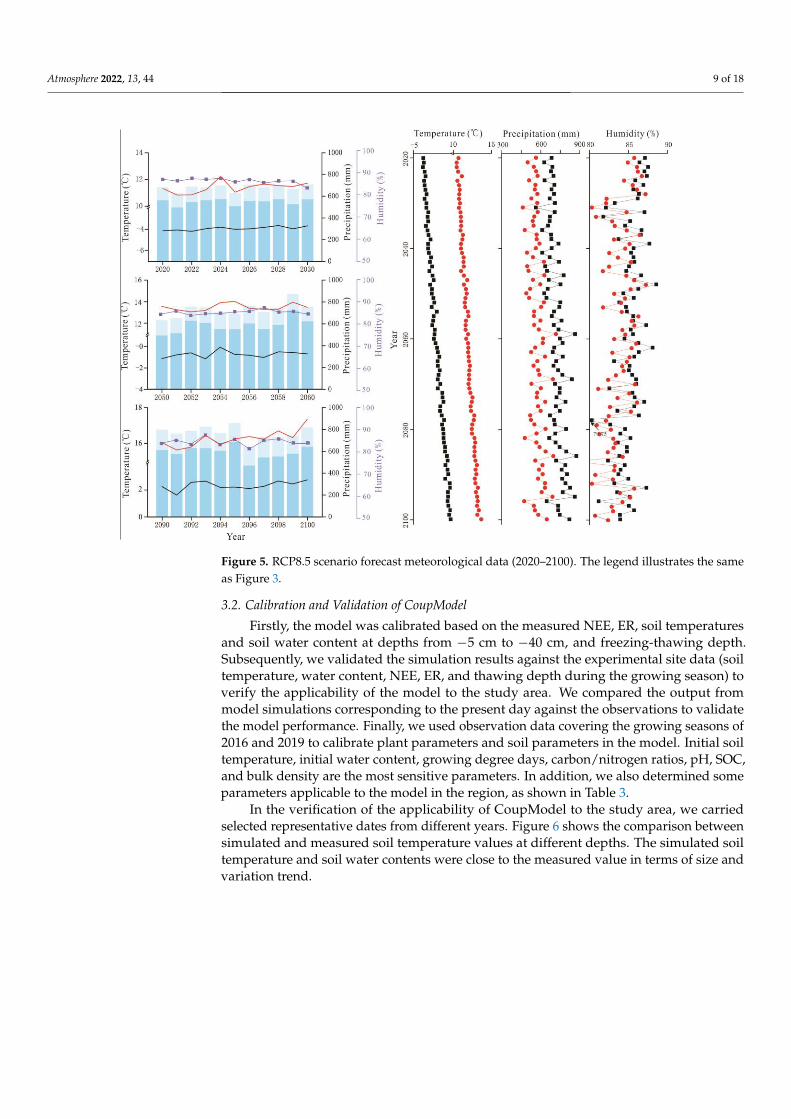
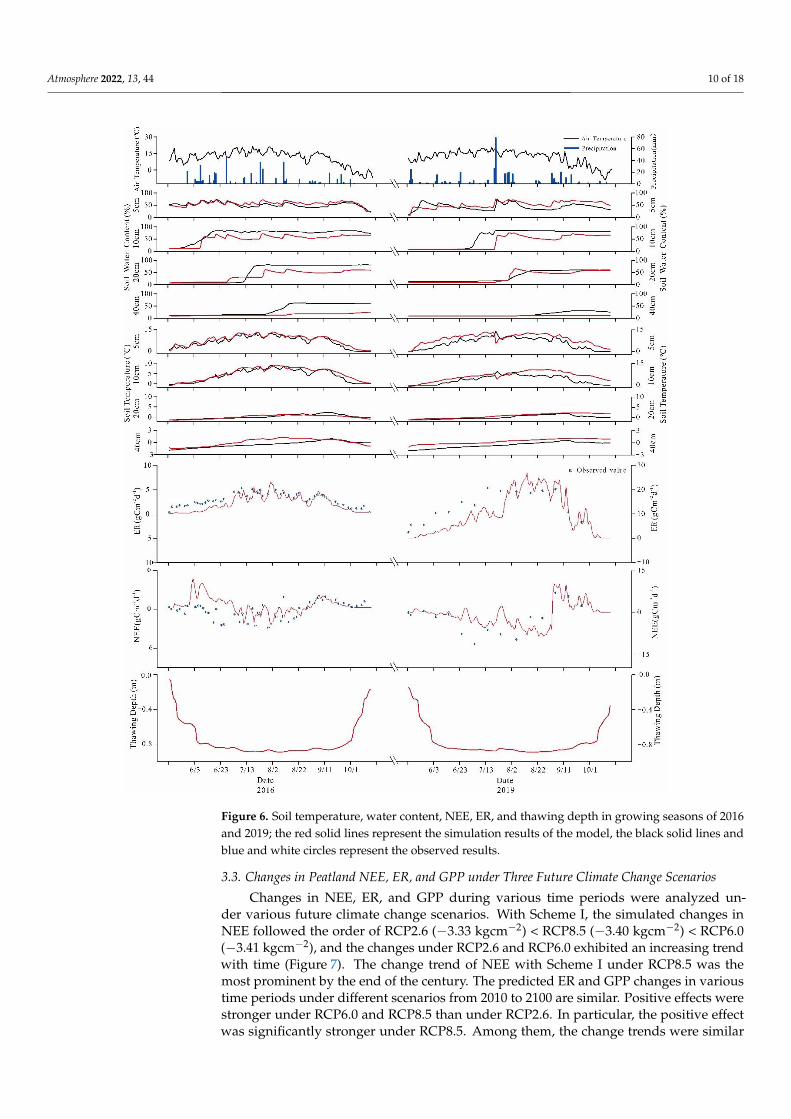
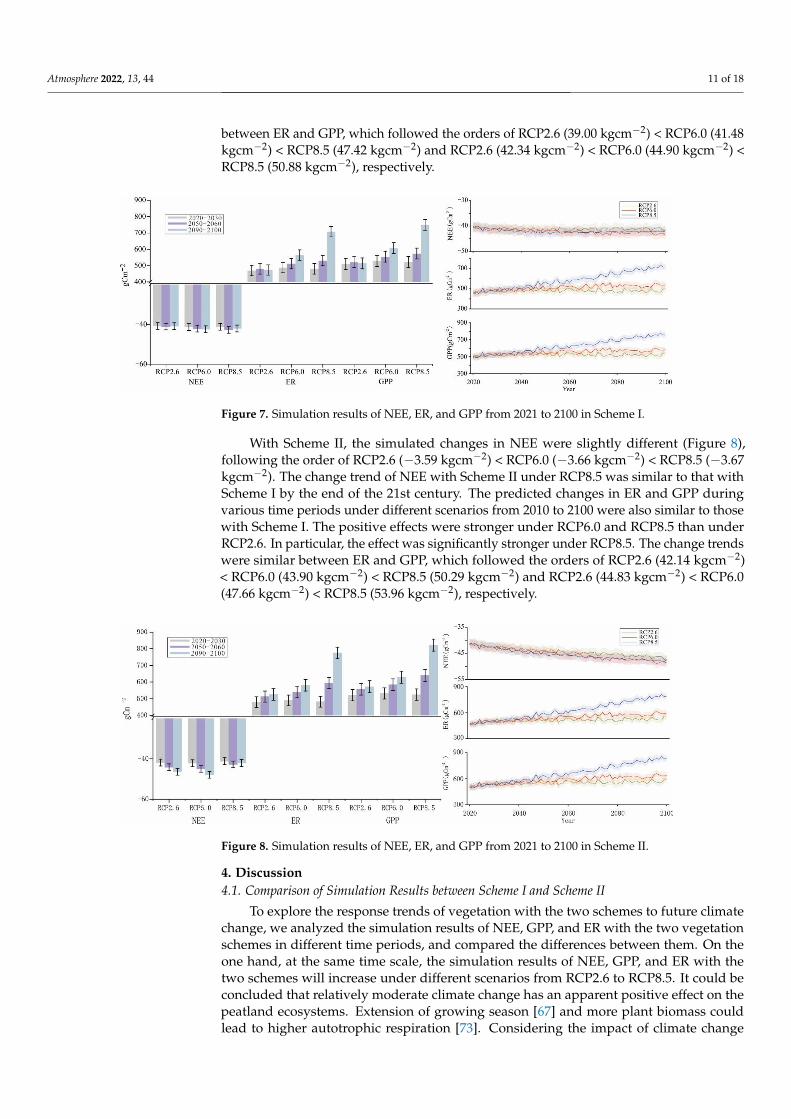
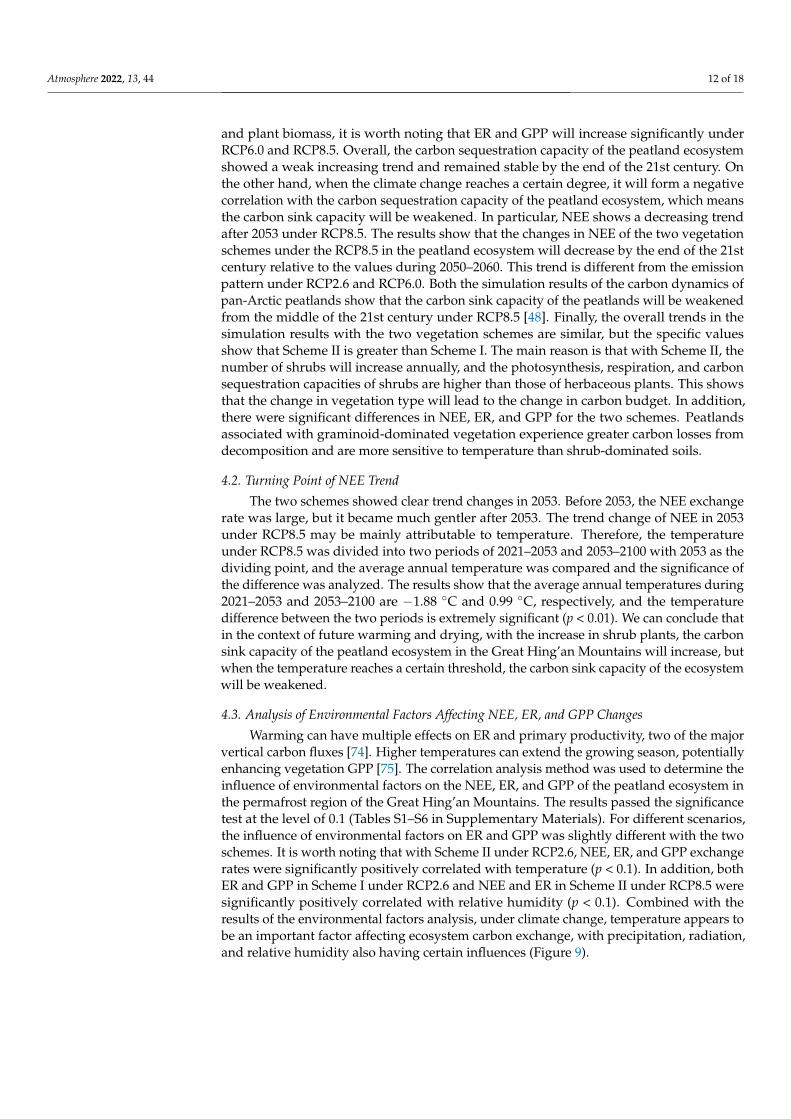
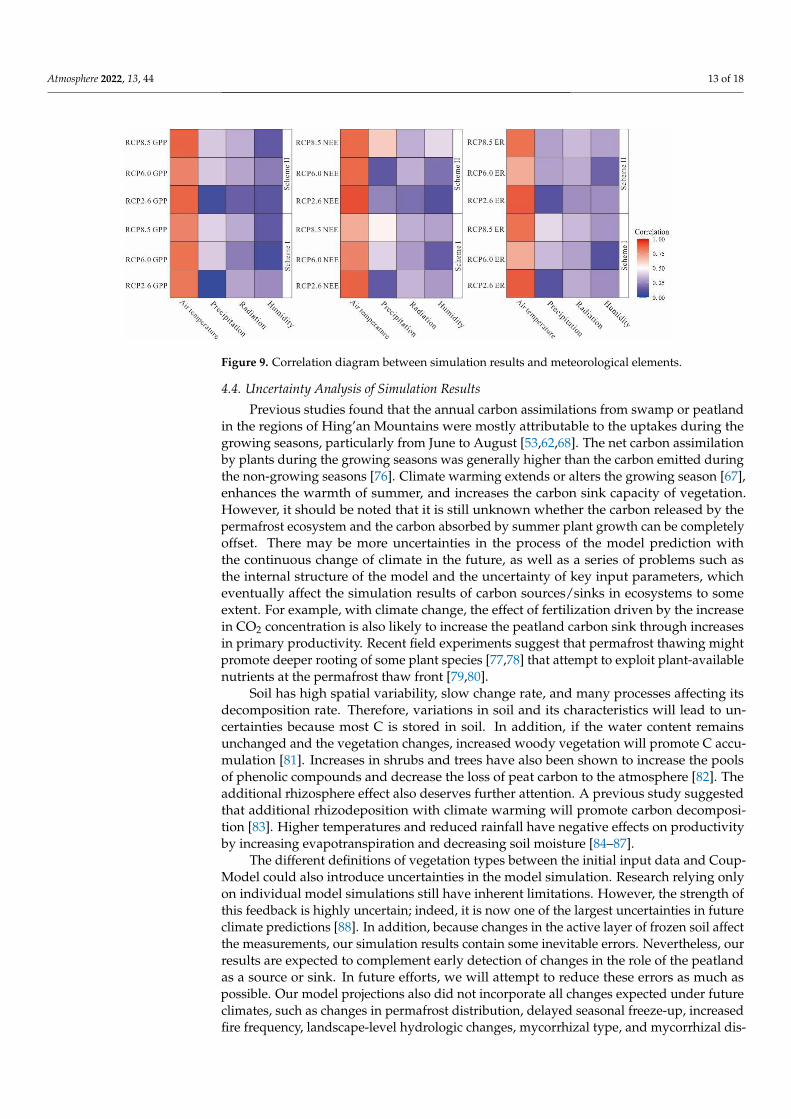


