Embed Size (px)
Citation preview
energies
Article
Simulation Research on Regenerative Braking Control Strategyof Hybrid Electric Vehicle
Cong Geng, Dawen Ning * , Linfu Guo, Qicheng Xue and Shujian Mei
�����������������
Citation: Geng, C.; Ning, D.; Guo, L.;
Xue, Q.; Mei, S. Simulation Research
on Regenerative Braking Control
Strategy of Hybrid Electric Vehicle.
Energies 2021, 14, 2202. https://
doi.org/10.3390/en14082202
Academic Editor: Luis Vaccaro
Received: 8 March 2021
Accepted: 10 April 2021
Published: 15 April 2021
Publisher’s Note: MDPI stays neutral
with regard to jurisdictional claims in
published maps and institutional affil-
iations.
Copyright: © 2021 by the authors.
Licensee MDPI, Basel, Switzerland.
This article is an open access article
distributed under the terms and
conditions of the Creative Commons
Attribution (CC BY) license (https://
creativecommons.org/licenses/by/
4.0/).
Beijing Key Laboratory of Powertrain Technology for New Energy Vehicles, Beijing Jiaotong University,Beijing 100044, China; [email protected] (C.G.); [email protected] (L.G.); [email protected] (Q.X.);[email protected] (S.M.)* Correspondence: [email protected]
Abstract: This paper proposes a double layered multi parameters braking energy recovery controlstrategy for Hybrid Electric Vehicle, which can combine the mechanical brake system with themotor brake system in the braking process to achieve higher energy utilization efficiency and atthe same time ensure that the vehicle has sufficient braking performance and safety performance.The first layer of the control strategy proposed in this paper aims to improve the braking forcedistribution coefficient of the front axle. On the basis of following the principle of braking forcedistribution, the braking force of the front axle and the rear axle is reasonably distributed accordingto the braking strength. The second layer is to obtain the proportional coefficient of regenerativebraking, considering the influence of vehicle speed, braking strength, and power battery state ofcharge (SOC) on the front axle mechanical braking force and motor braking force distribution, and athree-input single-output fuzzy controller is designed to realize the coordinated control of mechanicalbraking force and motor braking force of the front axle. Finally, the AMESim and Matlab/Simulinkco-simulation model was built; the braking energy recovery control strategy proposed in this paperwas simulated and analyzed based on standard cycle conditions (the NEDC and WLTC), and thesimulation results were compared with regenerative braking control strategies A and B. The researchresults show that the braking energy recovery rate of the proposed control strategy is respectively2.42%, 18.08% and 2.56%, 16.91% higher than that of the control strategies A and B, which significantlyimproves the energy recovery efficiency of the vehicle.
Keywords: hybrid electric vehicle; energy recovery; braking strength; control strategy
1. Introduction
Since hybrid electric vehicles (HEV) are equipped with a motor drive system that cannot only select the appropriate driving mode according to the current driving conditions,but can also recover energy during braking, thus improving energy utilization efficiencyand reducing exhaust gas pollution, which has gradually become a major developmenttrend in the automobile industry [1]. Among them, braking energy recovery technology isone of the core technologies of hybrid electric vehicles. It can convert the kinetic energygenerated during braking into electrical energy and store it in the energy storage device tostop it from turning into heat energy and dissipating in the air [2,3]. However, in the processof vehicle braking energy recovery, considering the influence of factors such as brakingsafety, overcharging of energy storage devices and energy recovery efficiency, the brakingforce provided by the motor is limited and cannot meet the braking requirements of thevehicle. At this time, in order to ensure that the vehicle can brake smoothly, the mechanicalbraking force and the motor braking force need to work together [4,5]. Therefore, thecoordinated control between the mechanical braking force and the motor braking forceoccupies an important position in the development of braking energy recovery technology.
At present, the research into braking energy recovery technology mainly aims atimproving the efficiency of vehicle braking energy recovery to distribute the braking
Energies 2021, 14, 2202. https://doi.org/10.3390/en14082202 https://www.mdpi.com/journal/energies
Energies 2021, 14, 2202 2 of 19
force reasonably. The literature [6] identifies the driver’s driving intention according tothe opening degree and change rate of the brake pedal, so that the motor can provideappropriate regenerative braking torque to meet the driver’s braking requirements andreduce the driving burden. In the literature [7], the torque distribution between mechanicalbraking force and motor braking force has been studied, and a series of regenerativebraking control strategies have been proposed. These strategies are based on the motorpower limitation and the driver’s braking requirements, so that the vehicle’s regenerativebraking force is always at the highest critical value to ensure efficient braking efficiency.In the literature [8], maximum energy recovery is aimed for, and the influence of motorspeed and battery SOC on regenerative braking is considered, distributing the brakingforce of the front and rear axles and the electromechanical braking force of the vehicle. Inthe literature [9], a fuzzy controller with a battery SOC and braking strength as variables forrear-drive hybrid electric vehicles have been designed, which has realized the coordinatedcontrol of the mechanical brake system and the motor brake system, and has achieved thepurpose of energy recovery. In [10], in order to solve the adverse effect of the current onthe battery during the regenerative braking of the vehicle, a regenerative braking controlstrategy is proposed. This strategy optimizes the distribution of electromechanical brakingforce according to the optimal slip rate of the vehicle, reducing battery capacity loss whilemaximizing braking energy. In [11], a new braking torque distribution control strategyto maximize the energy recovery of the regenerative braking system, and optimize thebraking torque distribution of the front and rear axles while ensuring braking safety wasdesigned, further improving the recovery of vehicle braking energy.
The above research mainly focuses on the coordinated control of the mechanical-motorcomposite braking system in the process of vehicle braking to realize the distribution ofmechanical braking force and motor braking force. However, the factors affecting energyrecovery were not comprehensive in the above studies, and the comparison of variousbraking energy recovery control strategies was not carried out, which could not directlyprove the effectiveness of the strategy. Therefore, in order to ensure the vehicle’s stablebraking performance and efficient energy recovery, this paper proposes a double layeredmulti parameters braking energy recovery control strategy. This strategy takes into accountthe influences of engine anti-drag torque, vehicle speed, braking strength and powerbattery SOC on the hierarchical control of vehicle braking force distribution, and comparesit with other braking force distribution control strategies.
This paper is organized as follows: In Section 2, the main components of the vehicle’sbraking system are analyzed, and the main framework of the control strategy in this paperis given; in Section 3, with the goal of increasing the front axle braking force distributioncoefficient, different braking modes are formulated according to the braking strength,and the front and rear axle braking forces are distributed for each mode; in Section 4,based on the designed multi parameters fuzzy controller, the front axle braking forceobtained from the upper layer is secondarily distributed to realize the coordinated controlof the electromechanical braking force of the front axle; in Section 5, the strategy is co-simulated and analyzed by AMESim and Matlab/Simulink software, and the controlstrategy proposed in this paper is compared with other “braking strength-fuzzy“ controlstrategies to verify the energy recovery effect of the control strategy proposed in paper;finally, Section 6 presents the conclusions of this study.
2. System Analysis and Modelling2.1. Structure of Braking Energy Recovery System
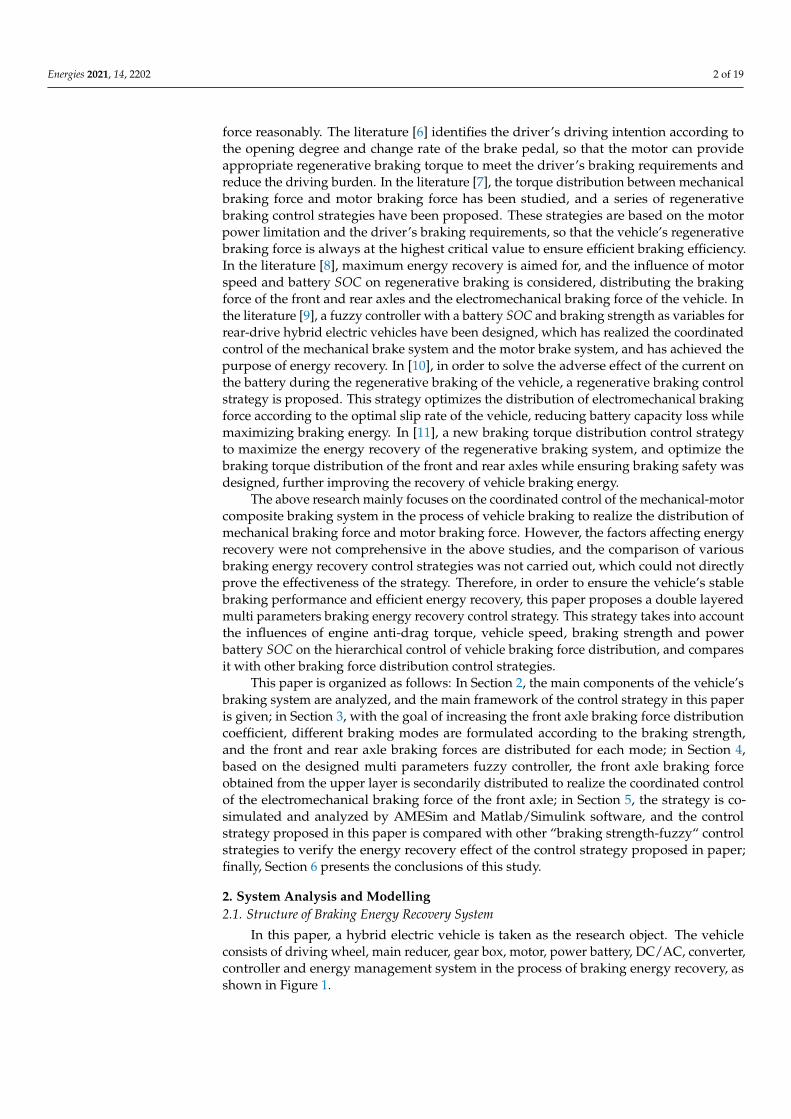
In this paper, a hybrid electric vehicle is taken as the research object. The vehicleconsists of driving wheel, main reducer, gear box, motor, power battery, DC/AC, converter,controller and energy management system in the process of braking energy recovery, asshown in Figure 1.
Energies 2021, 14, 2202 3 of 19
Energies 2021, 14, x FOR PEER REVIEW 3 of 20
controller and energy management system in the process of braking energy recovery, as
shown in Figure 1.
Figure 1. Schematic diagram of Hybrid Electric Vehicle.
When the vehicle is in the driving state, the engine and the motor are selected as the
power source. When the vehicle is in the braking state, the brake signal obtained according
to the position sensor on the brake pedal is transmitted to the vehicle controller to calcu-
late the total required braking force. The total braking force is distributed by the braking
energy recovery control unit between the front and rear axles and between the mechanical
and motor braking forces. Then the motor provides the required regenerative braking
torque, and part of the kinetic energy generated by braking is converted into electrical
energy and stored in the power battery. During braking, the dynamic equation for a hy-
brid car is Equation (1).
𝛴𝐹 = 𝐹𝑓 + 𝐹𝑤 + 𝐹𝑖 + 𝐹𝑏 (1)
where, 𝐹 is longitudinal force, 𝐹𝑤 is air resistance force, 𝐹𝑓 is rolling resistance, 𝐹𝑖 is
slope resistance force, 𝐹𝑏 is the ground braking force.
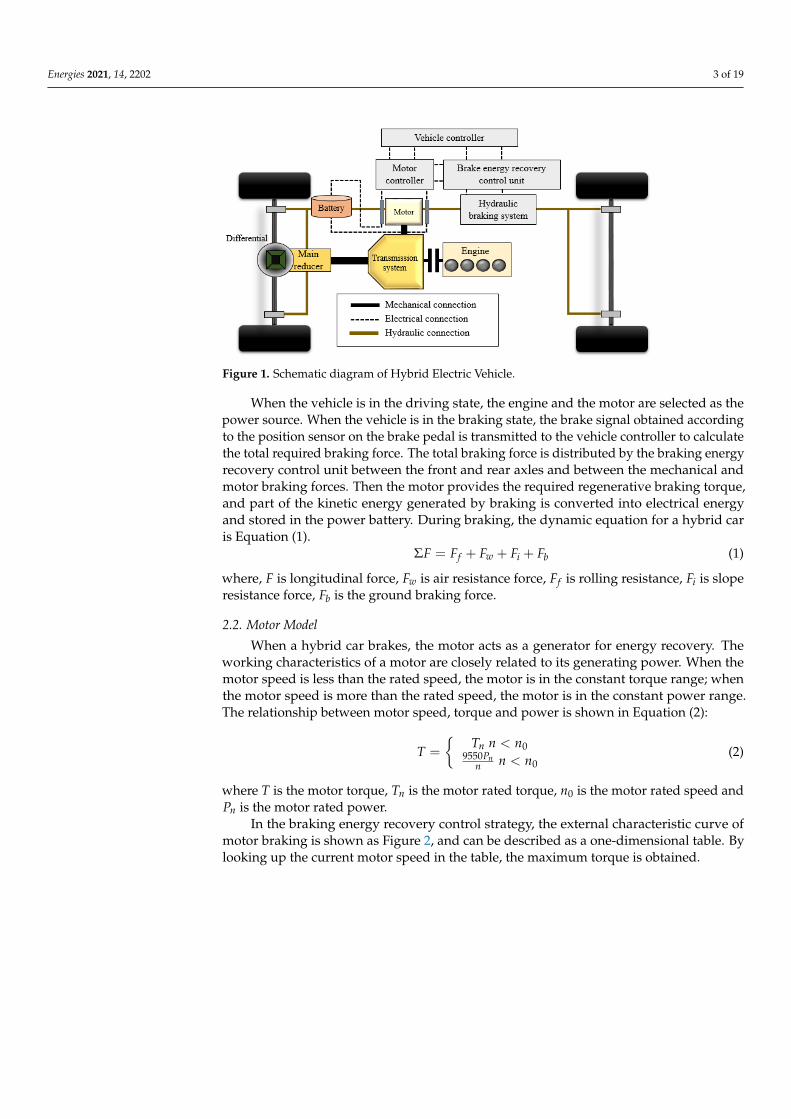
2.2. Motor Model
When a hybrid car brakes, the motor acts as a generator for energy recovery. The
working characteristics of a motor are closely related to its generating power. When the
motor speed is less than the rated speed, the motor is in the constant torque range; when
the motor speed is more than the rated speed, the motor is in the constant power range.
The relationship between motor speed, torque and power is shown in Equation (2):
𝑇 = {
𝑇𝑛 𝑛 < 𝑛09550𝑃𝑛𝑛
𝑛 < 𝑛0 (2)
where T is the motor torque, 𝑇𝑛 is the motor rated torque, 𝑛0 is the motor rated speed
and 𝑃𝑛 is the motor rated power.
In the braking energy recovery control strategy, the external characteristic curve of
motor braking is shown as Figure 2, and can be described as a one-dimensional table. By
looking up the current motor speed in the table, the maximum torque is obtained.
Figure 1. Schematic diagram of Hybrid Electric Vehicle.
When the vehicle is in the driving state, the engine and the motor are selected as thepower source. When the vehicle is in the braking state, the brake signal obtained accordingto the position sensor on the brake pedal is transmitted to the vehicle controller to calculatethe total required braking force. The total braking force is distributed by the braking energyrecovery control unit between the front and rear axles and between the mechanical andmotor braking forces. Then the motor provides the required regenerative braking torque,and part of the kinetic energy generated by braking is converted into electrical energyand stored in the power battery. During braking, the dynamic equation for a hybrid caris Equation (1).
ΣF = Ff + Fw + Fi + Fb (1)
where, F is longitudinal force, Fw is air resistance force, Ff is rolling resistance, Fi is sloperesistance force, Fb is the ground braking force.
2.2. Motor Model
When a hybrid car brakes, the motor acts as a generator for energy recovery. Theworking characteristics of a motor are closely related to its generating power. When themotor speed is less than the rated speed, the motor is in the constant torque range; whenthe motor speed is more than the rated speed, the motor is in the constant power range.The relationship between motor speed, torque and power is shown in Equation (2):
T =
{Tn n < n0
9550Pnn n < n0
(2)
where T is the motor torque, Tn is the motor rated torque, n0 is the motor rated speed andPn is the motor rated power.
In the braking energy recovery control strategy, the external characteristic curve ofmotor braking is shown as Figure 2, and can be described as a one-dimensional table. Bylooking up the current motor speed in the table, the maximum torque is obtained.
Energies 2021, 14, 2202 4 of 19Energies 2021, 14, x FOR PEER REVIEW 4 of 20
Figure 2. External characteristic curve of motor braking.
2.3. Power Battery Model
During the vehicle braking energy recovery process, the motor will restore the recov-
ered energy in the power battery. When the SOC of the power battery is too high, to avoid
damage to the battery, the braking energy will not be recovered.
In the process of braking energy recovery, the current open circuit voltage and the
internal resistance of charging and discharging are obtained according to the current
power battery SOC table to calculate the power battery’s voltage and maximum charging
and discharging power [12].
The SOC of the power battery is calculated by the ampere-hour integral method, as
shown in Equation (3):
𝑆𝑂𝐶 = 𝑆𝑂𝐶𝑛 −∫𝜂𝐼𝑑𝑡
𝑄𝑛 (3)
where 𝑆𝑂𝐶𝑛 is the current moment Power Battery 𝑆𝑂𝐶 value, 𝑄𝑛is the power battery
storage, 𝐼 is power battery charge and discharge current, and 𝜂 is the power battery
charge, discharge efficiency value.
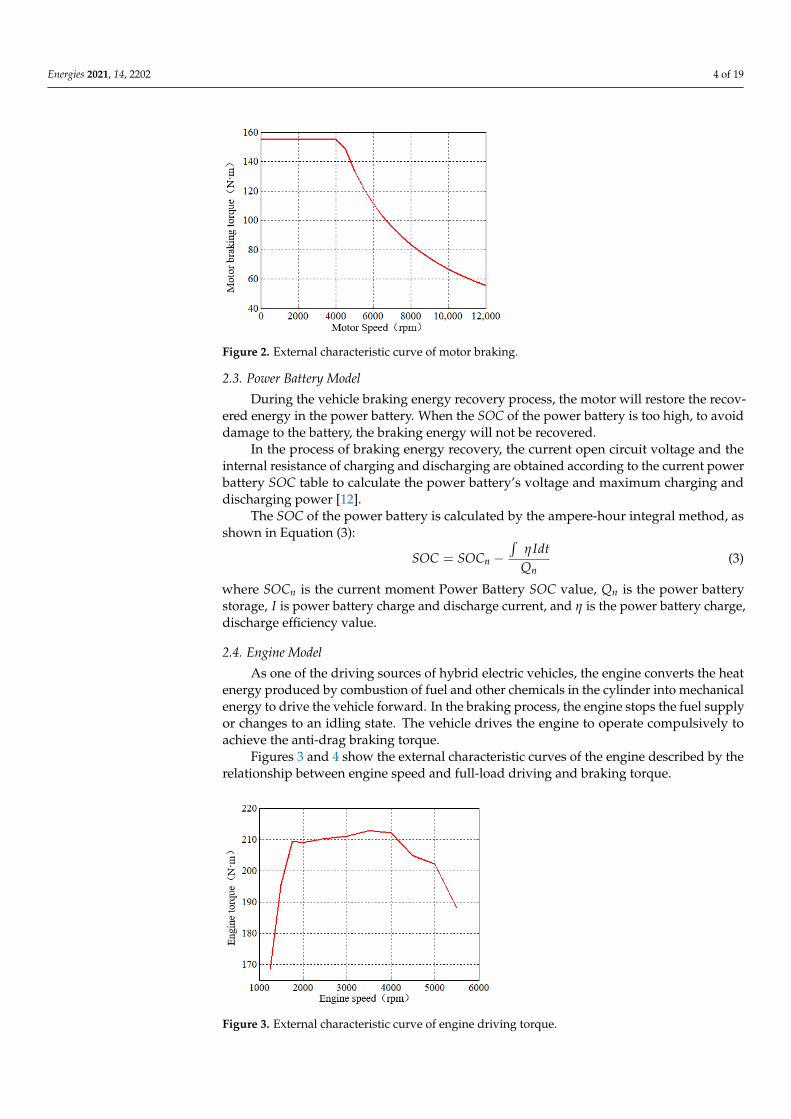
2.4. Engine Model
As one of the driving sources of hybrid electric vehicles, the engine converts the heat
energy produced by combustion of fuel and other chemicals in the cylinder into mechan-
ical energy to drive the vehicle forward. In the braking process, the engine stops the fuel
supply or changes to an idling state. The vehicle drives the engine to operate compulsively
to achieve the anti-drag braking torque.
Figures 3 and 4 show the external characteristic curves of the engine described by the
relationship between engine speed and full-load driving and braking torque.
Figure 3. External characteristic curve of engine driving torque.
Figure 2. External characteristic curve of motor braking.
2.3. Power Battery Model
During the vehicle braking energy recovery process, the motor will restore the recov-ered energy in the power battery. When the SOC of the power battery is too high, to avoiddamage to the battery, the braking energy will not be recovered.
In the process of braking energy recovery, the current open circuit voltage and theinternal resistance of charging and discharging are obtained according to the current powerbattery SOC table to calculate the power battery’s voltage and maximum charging anddischarging power [12].
The SOC of the power battery is calculated by the ampere-hour integral method, asshown in Equation (3):
SOC = SOCn −∫
η IdtQn
(3)
where SOCn is the current moment Power Battery SOC value, Qn is the power batterystorage, I is power battery charge and discharge current, and η is the power battery charge,discharge efficiency value.
2.4. Engine Model
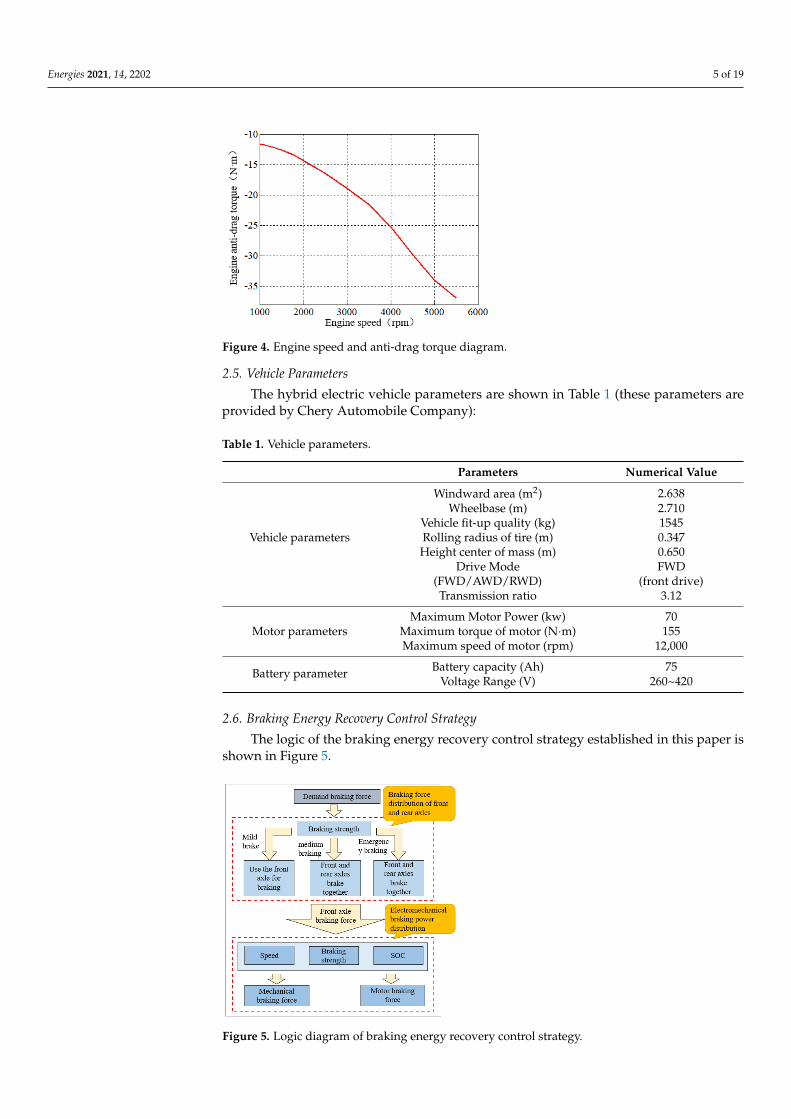
As one of the driving sources of hybrid electric vehicles, the engine converts the heatenergy produced by combustion of fuel and other chemicals in the cylinder into mechanicalenergy to drive the vehicle forward. In the braking process, the engine stops the fuel supplyor changes to an idling state. The vehicle drives the engine to operate compulsively toachieve the anti-drag braking torque.
Figures 3 and 4 show the external characteristic curves of the engine described by therelationship between engine speed and full-load driving and braking torque.
Energies 2021, 14, x FOR PEER REVIEW 4 of 20
Figure 2. External characteristic curve of motor braking.
2.3. Power Battery Model
During the vehicle braking energy recovery process, the motor will restore the recov-
ered energy in the power battery. When the SOC of the power battery is too high, to avoid
damage to the battery, the braking energy will not be recovered.
In the process of braking energy recovery, the current open circuit voltage and the
internal resistance of charging and discharging are obtained according to the current
power battery SOC table to calculate the power battery’s voltage and maximum charging
and discharging power [12].
The SOC of the power battery is calculated by the ampere-hour integral method, as
shown in Equation (3):
𝑆𝑂𝐶 = 𝑆𝑂𝐶𝑛 −∫𝜂𝐼𝑑𝑡
𝑄𝑛 (3)
where 𝑆𝑂𝐶𝑛 is the current moment Power Battery 𝑆𝑂𝐶 value, 𝑄𝑛is the power battery
storage, 𝐼 is power battery charge and discharge current, and 𝜂 is the power battery
charge, discharge efficiency value.
2.4. Engine Model
As one of the driving sources of hybrid electric vehicles, the engine converts the heat
energy produced by combustion of fuel and other chemicals in the cylinder into mechan-
ical energy to drive the vehicle forward. In the braking process, the engine stops the fuel
supply or changes to an idling state. The vehicle drives the engine to operate compulsively
to achieve the anti-drag braking torque.
Figures 3 and 4 show the external characteristic curves of the engine described by the
relationship between engine speed and full-load driving and braking torque.
Figure 3. External characteristic curve of engine driving torque. Figure 3. External characteristic curve of engine driving torque.
Energies 2021, 14, 2202 5 of 19Energies 2021, 14, x FOR PEER REVIEW 5 of 20
Figure 4. Engine speed and anti-drag torque diagram.
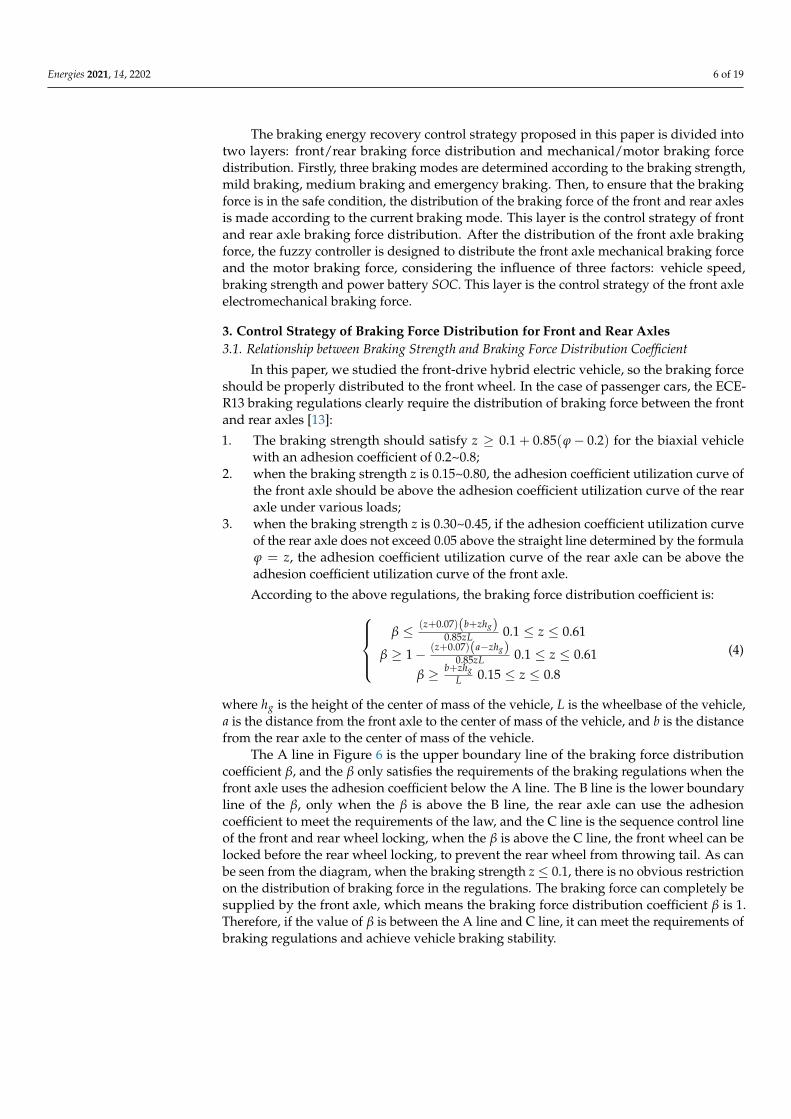
2.5. Vehicle Parameters
The hybrid electric vehicle parameters are shown in Table 1 (these parameters are
provided by Chery Automobile Company):
Table 1. Vehicle parameters.
Parameters Numerical Value
Windward area (m2) 2.638
Wheelbase (m) 2.710
Vehicle fit-up quality (kg) 1545
Vehicle parameters Rolling radius of tire (m) 0.347
Height center of mass (m) 0.650
Drive Mode
(FWD/AWD/RWD)
FWD
(front drive)
Transmission ratio 3.12
Maximum Motor Power (kw) 70
Motor parameters Maximum torque of motor (N·m) 155
Maximum speed of motor (rpm) 12,000
Battery parameter Battery capacity (Ah) 75
Voltage Range (V) 260~420
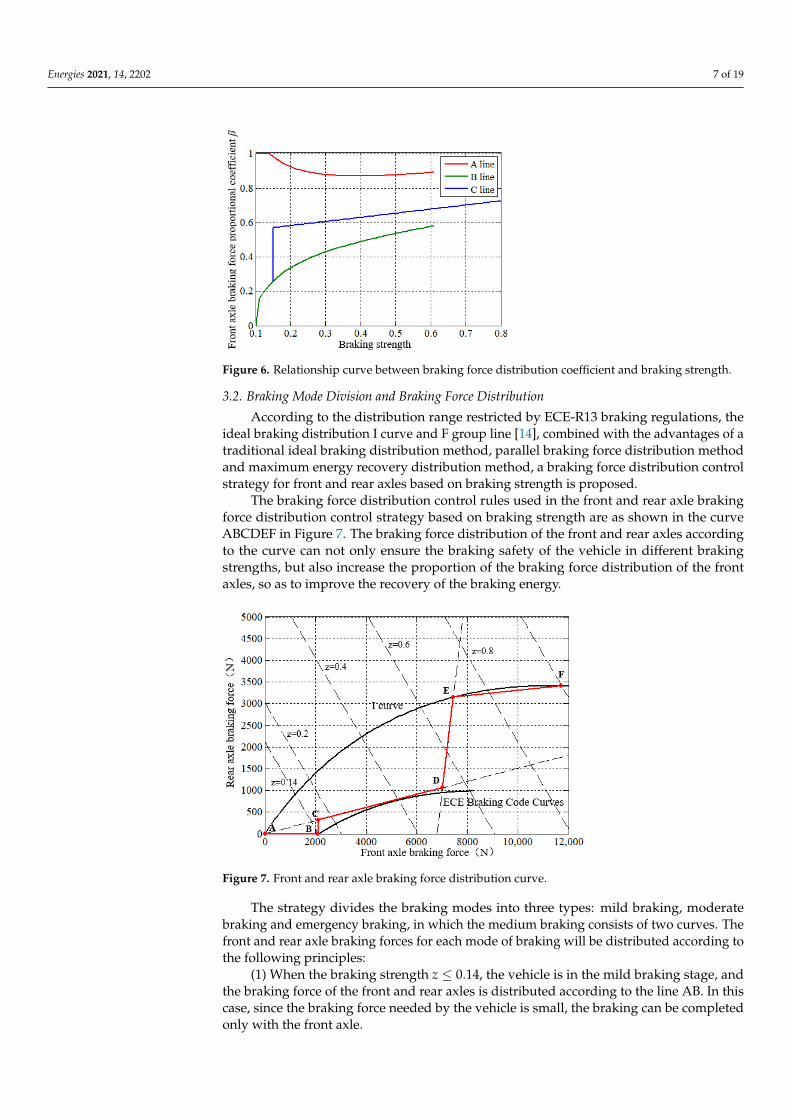
2.6. Braking Energy Recovery Control Strategy
The logic of the braking energy recovery control strategy established in this paper is
shown in Figure 5.
Figure 4. Engine speed and anti-drag torque diagram.
2.5. Vehicle Parameters
The hybrid electric vehicle parameters are shown in Table 1 (these parameters areprovided by Chery Automobile Company):
Table 1. Vehicle parameters.
Parameters Numerical Value
Windward area (m2) 2.638Wheelbase (m) 2.710
Vehicle fit-up quality (kg) 1545Vehicle parameters Rolling radius of tire (m) 0.347
Height center of mass (m) 0.650Drive Mode
(FWD/AWD/RWD)FWD
(front drive)Transmission ratio 3.12
Maximum Motor Power (kw) 70Motor parameters Maximum torque of motor (N·m) 155
Maximum speed of motor (rpm) 12,000
Battery parameter Battery capacity (Ah) 75Voltage Range (V) 260~420
2.6. Braking Energy Recovery Control Strategy
The logic of the braking energy recovery control strategy established in this paper isshown in Figure 5.
Energies 2021, 14, x FOR PEER REVIEW 5 of 20
Figure 4. Engine speed and anti-drag torque diagram.
2.5. Vehicle Parameters
The hybrid electric vehicle parameters are shown in Table 1 (these parameters are
provided by Chery Automobile Company):
Table 1. Vehicle parameters.
Parameters Numerical Value
Windward area (m2) 2.638
Wheelbase (m) 2.710
Vehicle fit-up quality (kg) 1545
Vehicle parameters Rolling radius of tire (m) 0.347
Height center of mass (m) 0.650
Drive Mode
(FWD/AWD/RWD)
FWD
(front drive)
Transmission ratio 3.12
Maximum Motor Power (kw) 70
Motor parameters Maximum torque of motor (N·m) 155
Maximum speed of motor (rpm) 12,000
Battery parameter Battery capacity (Ah) 75
Voltage Range (V) 260~420
2.6. Braking Energy Recovery Control Strategy
The logic of the braking energy recovery control strategy established in this paper is
shown in Figure 5.
Figure 5. Logic diagram of braking energy recovery control strategy.
Energies 2021, 14, 2202 6 of 19
The braking energy recovery control strategy proposed in this paper is divided intotwo layers: front/rear braking force distribution and mechanical/motor braking forcedistribution. Firstly, three braking modes are determined according to the braking strength,mild braking, medium braking and emergency braking. Then, to ensure that the brakingforce is in the safe condition, the distribution of the braking force of the front and rear axlesis made according to the current braking mode. This layer is the control strategy of frontand rear axle braking force distribution. After the distribution of the front axle brakingforce, the fuzzy controller is designed to distribute the front axle mechanical braking forceand the motor braking force, considering the influence of three factors: vehicle speed,braking strength and power battery SOC. This layer is the control strategy of the front axleelectromechanical braking force.
3. Control Strategy of Braking Force Distribution for Front and Rear Axles3.1. Relationship between Braking Strength and Braking Force Distribution Coefficient
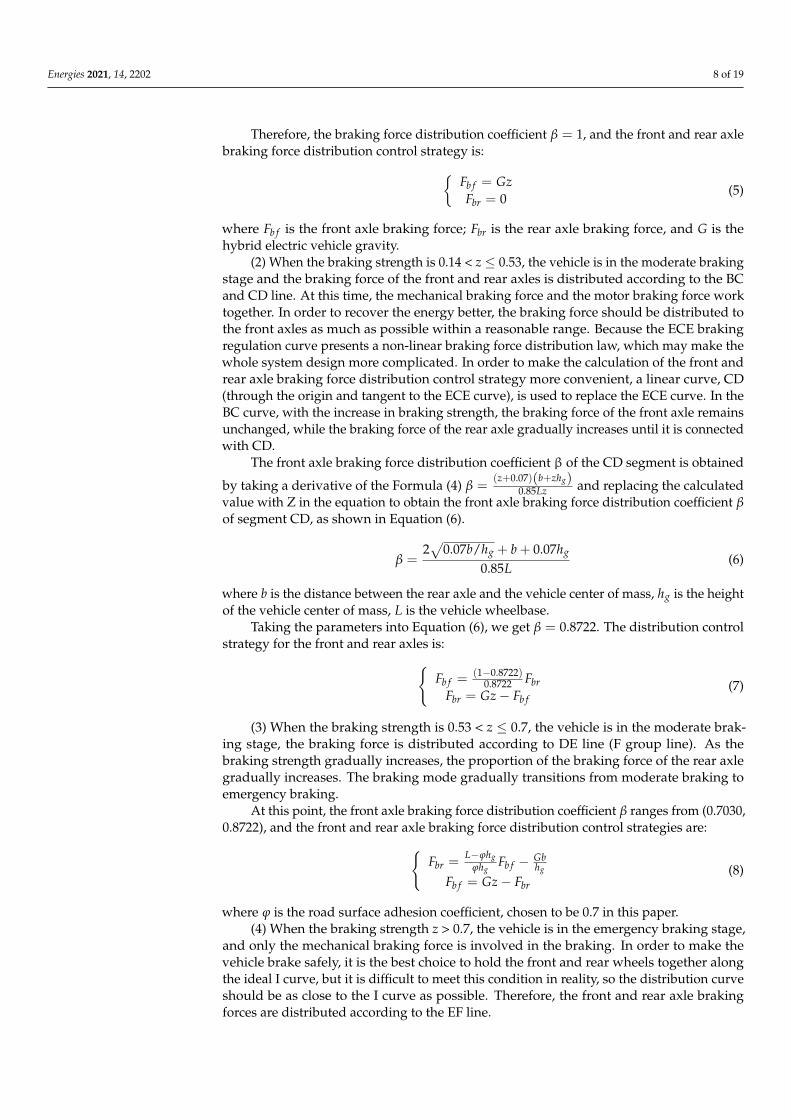
In this paper, we studied the front-drive hybrid electric vehicle, so the braking forceshould be properly distributed to the front wheel. In the case of passenger cars, the ECE-R13 braking regulations clearly require the distribution of braking force between the frontand rear axles [13]:
1. The braking strength should satisfy z ≥ 0.1 + 0.85(ϕ − 0.2) for the biaxial vehiclewith an adhesion coefficient of 0.2~0.8;
2. when the braking strength z is 0.15~0.80, the adhesion coefficient utilization curve ofthe front axle should be above the adhesion coefficient utilization curve of the rearaxle under various loads;
3. when the braking strength z is 0.30~0.45, if the adhesion coefficient utilization curveof the rear axle does not exceed 0.05 above the straight line determined by the formulaϕ = z, the adhesion coefficient utilization curve of the rear axle can be above theadhesion coefficient utilization curve of the front axle.
According to the above regulations, the braking force distribution coefficient is:β ≤ (z+0.07)(b+zhg)
0.85zL 0.1 ≤ z ≤ 0.61
β ≥ 1 − (z+0.07)(a−zhg)0.85zL 0.1 ≤ z ≤ 0.61
β ≥ b+zhgL 0.15 ≤ z ≤ 0.8
(4)
where hg is the height of the center of mass of the vehicle, L is the wheelbase of the vehicle,a is the distance from the front axle to the center of mass of the vehicle, and b is the distancefrom the rear axle to the center of mass of the vehicle.
The A line in Figure 6 is the upper boundary line of the braking force distributioncoefficient β, and the β only satisfies the requirements of the braking regulations when thefront axle uses the adhesion coefficient below the A line. The B line is the lower boundaryline of the β, only when the β is above the B line, the rear axle can use the adhesioncoefficient to meet the requirements of the law, and the C line is the sequence control lineof the front and rear wheel locking, when the β is above the C line, the front wheel can belocked before the rear wheel locking, to prevent the rear wheel from throwing tail. As canbe seen from the diagram, when the braking strength z ≤ 0.1, there is no obvious restrictionon the distribution of braking force in the regulations. The braking force can completely besupplied by the front axle, which means the braking force distribution coefficient β is 1.Therefore, if the value of β is between the A line and C line, it can meet the requirements ofbraking regulations and achieve vehicle braking stability.
Energies 2021, 14, 2202 7 of 19Energies 2021, 14, x FOR PEER REVIEW 7 of 20
Figure 6. Relationship curve between braking force distribution coefficient and braking strength.
3.2. Braking Mode Division and Braking Force Distribution
According to the distribution range restricted by ECE-R13 braking regulations, the
ideal braking distribution I curve and F group line [14], combined with the advantages of
a traditional ideal braking distribution method, parallel braking force distribution method
and maximum energy recovery distribution method, a braking force distribution control
strategy for front and rear axles based on braking strength is proposed.
The braking force distribution control rules used in the front and rear axle braking
force distribution control strategy based on braking strength are as shown in the curve
ABCDEF in Figure 7. The braking force distribution of the front and rear axles according
to the curve can not only ensure the braking safety of the vehicle in different braking
strengths, but also increase the proportion of the braking force distribution of the front
axles, so as to improve the recovery of the braking energy.
Figure 7. Front and rear axle braking force distribution curve.
The strategy divides the braking modes into three types: mild braking, moderate
braking and emergency braking, in which the medium braking consists of two curves.
The front and rear axle braking forces for each mode of braking will be distributed accord-
ing to the following principles:
(1) When the braking strength z ≤ 0.14, the vehicle is in the mild braking stage, and
the braking force of the front and rear axles is distributed according to the line AB. In this
case, since the braking force needed by the vehicle is small, the braking can be completed
only with the front axle.
Figure 6. Relationship curve between braking force distribution coefficient and braking strength.
3.2. Braking Mode Division and Braking Force Distribution
According to the distribution range restricted by ECE-R13 braking regulations, theideal braking distribution I curve and F group line [14], combined with the advantages of atraditional ideal braking distribution method, parallel braking force distribution methodand maximum energy recovery distribution method, a braking force distribution controlstrategy for front and rear axles based on braking strength is proposed.
The braking force distribution control rules used in the front and rear axle brakingforce distribution control strategy based on braking strength are as shown in the curveABCDEF in Figure 7. The braking force distribution of the front and rear axles accordingto the curve can not only ensure the braking safety of the vehicle in different brakingstrengths, but also increase the proportion of the braking force distribution of the frontaxles, so as to improve the recovery of the braking energy.
Energies 2021, 14, x FOR PEER REVIEW 7 of 20
Figure 6. Relationship curve between braking force distribution coefficient and braking strength.
3.2. Braking Mode Division and Braking Force Distribution
According to the distribution range restricted by ECE-R13 braking regulations, the
ideal braking distribution I curve and F group line [14], combined with the advantages of
a traditional ideal braking distribution method, parallel braking force distribution method
and maximum energy recovery distribution method, a braking force distribution control
strategy for front and rear axles based on braking strength is proposed.
The braking force distribution control rules used in the front and rear axle braking
force distribution control strategy based on braking strength are as shown in the curve
ABCDEF in Figure 7. The braking force distribution of the front and rear axles according
to the curve can not only ensure the braking safety of the vehicle in different braking
strengths, but also increase the proportion of the braking force distribution of the front
axles, so as to improve the recovery of the braking energy.
Figure 7. Front and rear axle braking force distribution curve.
The strategy divides the braking modes into three types: mild braking, moderate
braking and emergency braking, in which the medium braking consists of two curves.
The front and rear axle braking forces for each mode of braking will be distributed accord-
ing to the following principles:
(1) When the braking strength z ≤ 0.14, the vehicle is in the mild braking stage, and
the braking force of the front and rear axles is distributed according to the line AB. In this
case, since the braking force needed by the vehicle is small, the braking can be completed
only with the front axle.
Figure 7. Front and rear axle braking force distribution curve.
The strategy divides the braking modes into three types: mild braking, moderatebraking and emergency braking, in which the medium braking consists of two curves. Thefront and rear axle braking forces for each mode of braking will be distributed according tothe following principles:
(1) When the braking strength z ≤ 0.14, the vehicle is in the mild braking stage, andthe braking force of the front and rear axles is distributed according to the line AB. In thiscase, since the braking force needed by the vehicle is small, the braking can be completedonly with the front axle.
Energies 2021, 14, 2202 8 of 19
Therefore, the braking force distribution coefficient β = 1, and the front and rear axlebraking force distribution control strategy is:{
Fb f = GzFbr = 0
(5)
where Fb f is the front axle braking force; Fbr is the rear axle braking force, and G is thehybrid electric vehicle gravity.
(2) When the braking strength is 0.14 < z ≤ 0.53, the vehicle is in the moderate brakingstage and the braking force of the front and rear axles is distributed according to the BCand CD line. At this time, the mechanical braking force and the motor braking force worktogether. In order to recover the energy better, the braking force should be distributed tothe front axles as much as possible within a reasonable range. Because the ECE brakingregulation curve presents a non-linear braking force distribution law, which may make thewhole system design more complicated. In order to make the calculation of the front andrear axle braking force distribution control strategy more convenient, a linear curve, CD(through the origin and tangent to the ECE curve), is used to replace the ECE curve. In theBC curve, with the increase in braking strength, the braking force of the front axle remainsunchanged, while the braking force of the rear axle gradually increases until it is connectedwith CD.
The front axle braking force distribution coefficient β of the CD segment is obtained
by taking a derivative of the Formula (4) β =(z+0.07)(b+zhg)
0.85Lz and replacing the calculatedvalue with Z in the equation to obtain the front axle braking force distribution coefficient βof segment CD, as shown in Equation (6).
β =2√
0.07b/hg + b + 0.07hg
0.85L(6)
where b is the distance between the rear axle and the vehicle center of mass, hg is the heightof the vehicle center of mass, L is the vehicle wheelbase.
Taking the parameters into Equation (6), we get β = 0.8722. The distribution controlstrategy for the front and rear axles is:{
Fb f =(1−0.8722)
0.8722 FbrFbr = Gz − Fb f
(7)
(3) When the braking strength is 0.53 < z ≤ 0.7, the vehicle is in the moderate brak-ing stage, the braking force is distributed according to DE line (F group line). As thebraking strength gradually increases, the proportion of the braking force of the rear axlegradually increases. The braking mode gradually transitions from moderate braking toemergency braking.
At this point, the front axle braking force distribution coefficient β ranges from (0.7030,0.8722), and the front and rear axle braking force distribution control strategies are:{
Fbr =L−ϕhg
ϕhgFb f − Gb
hg
Fb f = Gz − Fbr(8)
where ϕ is the road surface adhesion coefficient, chosen to be 0.7 in this paper.(4) When the braking strength z > 0.7, the vehicle is in the emergency braking stage,
and only the mechanical braking force is involved in the braking. In order to make thevehicle brake safely, it is the best choice to hold the front and rear wheels together alongthe ideal I curve, but it is difficult to meet this condition in reality, so the distribution curveshould be as close to the I curve as possible. Therefore, the front and rear axle brakingforces are distributed according to the EF line.
Energies 2021, 14, 2202 9 of 19
At this point, the front axle braking force distribution coefficient β ranges from (0.7030,0.7749). The braking force distribution strategy for the front and rear axles is as follows:{
Fbr = 0.0607Fb f + 2696.3Fb f = Gz − Fbr
(9)
4. Control Strategy of Electromechanical Braking Force Distribution for Front Axle
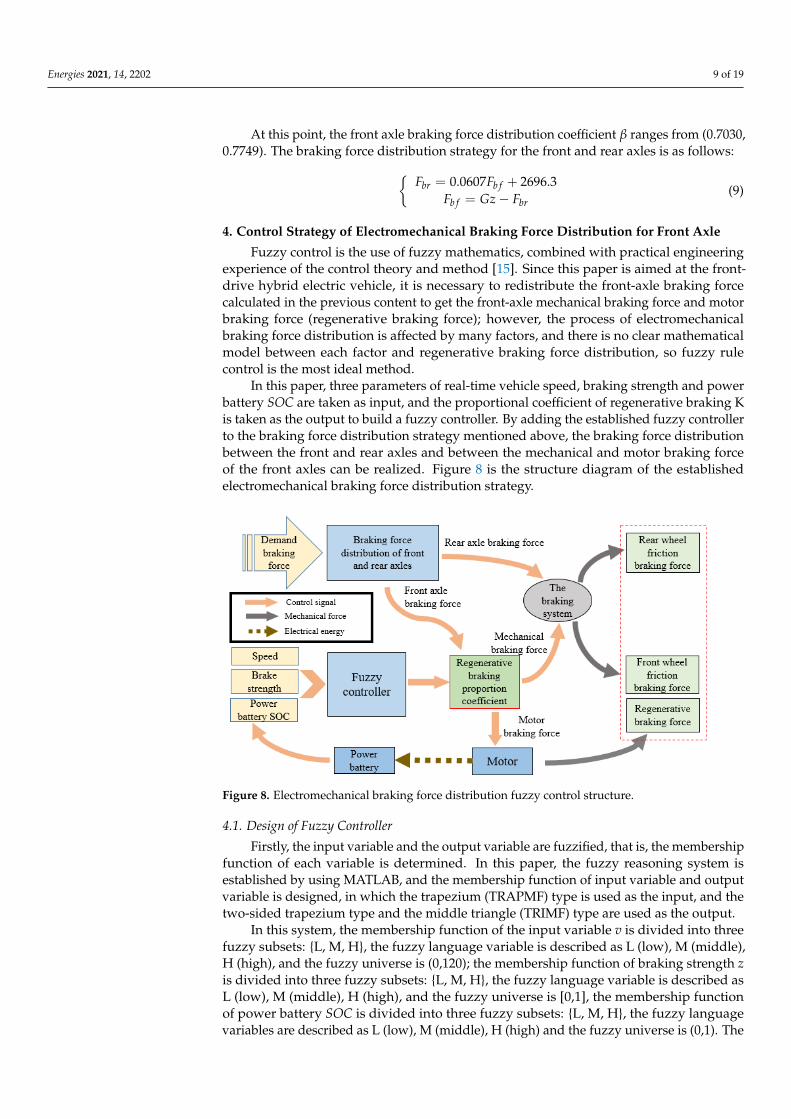
Fuzzy control is the use of fuzzy mathematics, combined with practical engineeringexperience of the control theory and method [15]. Since this paper is aimed at the front-drive hybrid electric vehicle, it is necessary to redistribute the front-axle braking forcecalculated in the previous content to get the front-axle mechanical braking force and motorbraking force (regenerative braking force); however, the process of electromechanicalbraking force distribution is affected by many factors, and there is no clear mathematicalmodel between each factor and regenerative braking force distribution, so fuzzy rulecontrol is the most ideal method.
In this paper, three parameters of real-time vehicle speed, braking strength and powerbattery SOC are taken as input, and the proportional coefficient of regenerative braking Kis taken as the output to build a fuzzy controller. By adding the established fuzzy controllerto the braking force distribution strategy mentioned above, the braking force distributionbetween the front and rear axles and between the mechanical and motor braking forceof the front axles can be realized. Figure 8 is the structure diagram of the establishedelectromechanical braking force distribution strategy.
Energies 2021, 14, x FOR PEER REVIEW 9 of 20
At this point, the front axle braking force distribution coefficient 𝛽 ranges from
(0.7030, 0.7749). The braking force distribution strategy for the front and rear axles is as
follows:
{𝐹𝑏𝑟 = 0.0607𝐹𝑏𝑓 + 2696.3
𝐹𝑏𝑓 = 𝐺𝑧 − 𝐹𝑏𝑟 (9)
4. Control Strategy of Electromechanical Braking Force Distribution for Front Axle
Fuzzy control is the use of fuzzy mathematics, combined with practical engineering
experience of the control theory and method [15]. Since this paper is aimed at the front-
drive hybrid electric vehicle, it is necessary to redistribute the front-axle braking force
calculated in the previous content to get the front-axle mechanical braking force and mo-
tor braking force (regenerative braking force); however, the process of electromechanical
braking force distribution is affected by many factors, and there is no clear mathematical
model between each factor and regenerative braking force distribution, so fuzzy rule con-
trol is the most ideal method.
In this paper, three parameters of real-time vehicle speed, braking strength and
power battery SOC are taken as input, and the proportional coefficient of regenerative
braking K is taken as the output to build a fuzzy controller. By adding the established
fuzzy controller to the braking force distribution strategy mentioned above, the braking
force distribution between the front and rear axles and between the mechanical and motor
braking force of the front axles can be realized. Figure 8 is the structure diagram of the
established electromechanical braking force distribution strategy.
Figure 8. Electromechanical braking force distribution fuzzy control structure.
4.1. Design of Fuzzy Controller
Firstly, the input variable and the output variable are fuzzified, that is, the member-
ship function of each variable is determined. In this paper, the fuzzy reasoning system is
established by using MATLAB, and the membership function of input variable and out-
put variable is designed, in which the trapezium (TRAPMF) type is used as the input, and
the two-sided trapezium type and the middle triangle (TRIMF) type are used as the out-
put.
In this system, the membership function of the input variable v is divided into three
fuzzy subsets: {L, M, H}, the fuzzy language variable is described as L (low), M (middle),
H (high), and the fuzzy universe is (0,120); the membership function of braking strength
z is divided into three fuzzy subsets: {L, M, H}, the fuzzy language variable is described
Figure 8. Electromechanical braking force distribution fuzzy control structure.
4.1. Design of Fuzzy Controller
Firstly, the input variable and the output variable are fuzzified, that is, the membershipfunction of each variable is determined. In this paper, the fuzzy reasoning system isestablished by using MATLAB, and the membership function of input variable and outputvariable is designed, in which the trapezium (TRAPMF) type is used as the input, and thetwo-sided trapezium type and the middle triangle (TRIMF) type are used as the output.
In this system, the membership function of the input variable v is divided into threefuzzy subsets: {L, M, H}, the fuzzy language variable is described as L (low), M (middle),H (high), and the fuzzy universe is (0,120); the membership function of braking strength zis divided into three fuzzy subsets: {L, M, H}, the fuzzy language variable is described asL (low), M (middle), H (high), and the fuzzy universe is [0,1], the membership functionof power battery SOC is divided into three fuzzy subsets: {L, M, H}, the fuzzy languagevariables are described as L (low), M (middle), H (high) and the fuzzy universe is (0,1). The
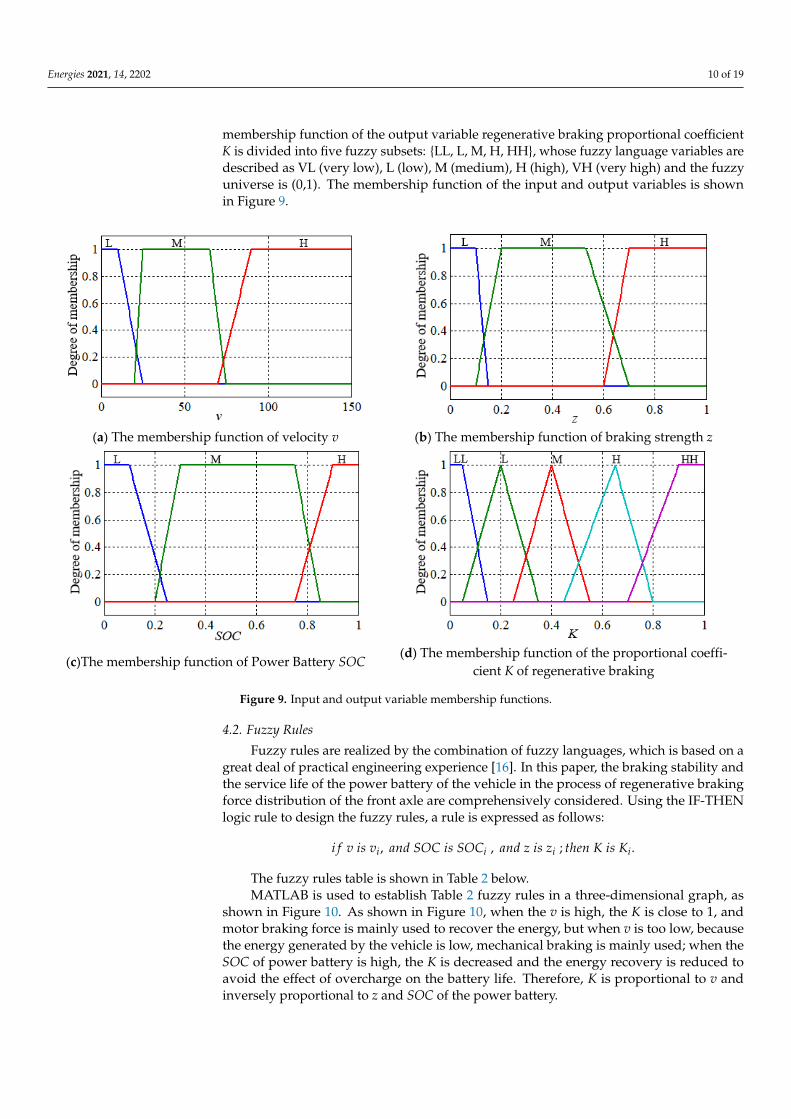
Energies 2021, 14, 2202 10 of 19
membership function of the output variable regenerative braking proportional coefficientK is divided into five fuzzy subsets: {LL, L, M, H, HH}, whose fuzzy language variables aredescribed as VL (very low), L (low), M (medium), H (high), VH (very high) and the fuzzyuniverse is (0,1). The membership function of the input and output variables is shownin Figure 9.
Energies 2021, 14, x FOR PEER REVIEW 10 of 20
as L (low), M (middle), H (high), and the fuzzy universe is [0,1], the membership function
of power battery SOC is divided into three fuzzy subsets: {L, M, H}, the fuzzy language
variables are described as L (low), M (middle), H (high) and the fuzzy universe is (0,1).
The membership function of the output variable regenerative braking proportional coef-
ficient K is divided into five fuzzy subsets: {LL, L, M, H, HH}, whose fuzzy language var-
iables are described as VL (very low), L (low), M (medium), H (high), VH (very high) and
the fuzzy universe is (0,1). The membership function of the input and output variables is
shown in Figure 9.
(a) The membership function of velocity v (b) The membership function of braking strength z
(c)The membership function of Power Battery SOC (d) The membership function of the proportional coeffi-
cient K of regenerative braking
Figure 9. Input and output variable membership functions.
4.2. Fuzzy Rules
Fuzzy rules are realized by the combination of fuzzy languages, which is based on a
great deal of practical engineering experience [16]. In this paper, the braking stability and
the service life of the power battery of the vehicle in the process of regenerative braking
force distribution of the front axle are comprehensively considered. Using the IF-THEN
logic rule to design the fuzzy rules, a rule is expressed as follows:
𝑖𝑓 𝑣 𝑖𝑠 𝑣𝑖 , 𝑎𝑛𝑑 𝑆𝑂𝐶 𝑖𝑠 𝑆𝑂𝐶𝑖 , 𝑎𝑛𝑑 𝑧 𝑖𝑠 𝑧𝑖 ; 𝑡ℎ𝑒𝑛 𝐾 𝑖𝑠 𝐾𝑖.
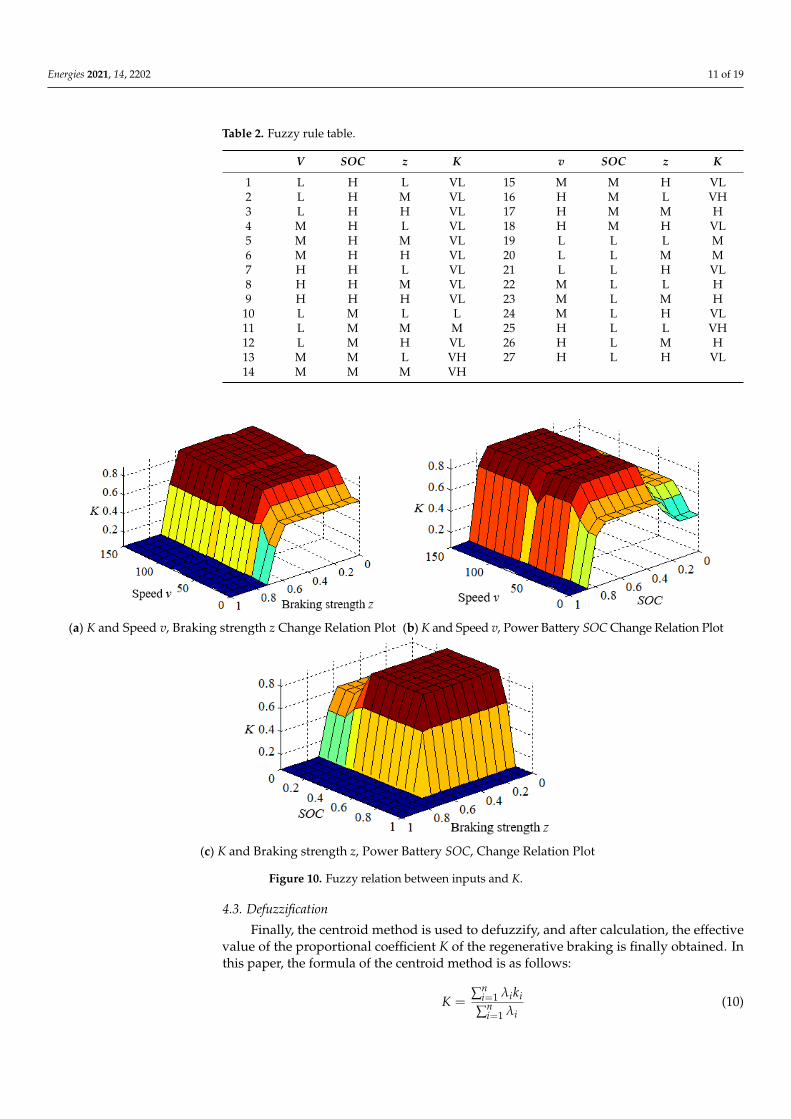
The fuzzy rules table is shown in Table 2 below.
Table 2. Fuzzy rule table.
V SOC z K v SOC z K
1 L H L VL 15 M M H VL
2 L H M VL 16 H M L VH
3 L H H VL 17 H M M H
4 M H L VL 18 H M H VL
Figure 9. Input and output variable membership functions.
4.2. Fuzzy Rules
Fuzzy rules are realized by the combination of fuzzy languages, which is based on agreat deal of practical engineering experience [16]. In this paper, the braking stability andthe service life of the power battery of the vehicle in the process of regenerative brakingforce distribution of the front axle are comprehensively considered. Using the IF-THENlogic rule to design the fuzzy rules, a rule is expressed as follows:
i f v is vi, and SOC is SOCi , and z is zi ; then K is Ki.
The fuzzy rules table is shown in Table 2 below.MATLAB is used to establish Table 2 fuzzy rules in a three-dimensional graph, as
shown in Figure 10. As shown in Figure 10, when the v is high, the K is close to 1, andmotor braking force is mainly used to recover the energy, but when v is too low, becausethe energy generated by the vehicle is low, mechanical braking is mainly used; when theSOC of power battery is high, the K is decreased and the energy recovery is reduced toavoid the effect of overcharge on the battery life. Therefore, K is proportional to v andinversely proportional to z and SOC of the power battery.
Energies 2021, 14, 2202 11 of 19
Table 2. Fuzzy rule table.
V SOC z K v SOC z K
1 L H L VL 15 M M H VL2 L H M VL 16 H M L VH3 L H H VL 17 H M M H4 M H L VL 18 H M H VL5 M H M VL 19 L L L M6 M H H VL 20 L L M M7 H H L VL 21 L L H VL8 H H M VL 22 M L L H9 H H H VL 23 M L M H
10 L M L L 24 M L H VL11 L M M M 25 H L L VH12 L M H VL 26 H L M H13 M M L VH 27 H L H VL14 M M M VH
Energies 2021, 14, x FOR PEER REVIEW 11 of 20
5 M H M VL 19 L L L M
6 M H H VL 20 L L M M
7 H H L VL 21 L L H VL
8 H H M VL 22 M L L H
9 H H H VL 23 M L M H
10 L M L L 24 M L H VL
11 L M M M 25 H L L VH
12 L M H VL 26 H L M H
13 M M L VH 27 H L H VL
14 M M M VH
MATLAB is used to establish Table 2 fuzzy rules in a three-dimensional graph, as
shown in Figure 10. As shown in Figure 10, when the v is high, the K is close to 1, and
motor braking force is mainly used to recover the energy, but when v is too low, because
the energy generated by the vehicle is low, mechanical braking is mainly used; when the
SOC of power battery is high, the K is decreased and the energy recovery is reduced to
avoid the effect of overcharge on the battery life. Therefore, K is proportional to v and
inversely proportional to z and SOC of the power battery.
(a) K and Speed v, Braking strength z Change Relation Plot (b) K and Speed v, Power Battery SOC Change Relation Plot
(c) K and Braking strength z, Power Battery SOC, Change Relation Plot
Figure 10. Fuzzy relation between inputs and K.
4.3. Defuzzification
Finally, the centroid method is used to defuzzify, and after calculation, the effective
value of the proportional coefficient K of the regenerative braking is finally obtained. In
this paper, the formula of the centroid method is as follows:
Figure 10. Fuzzy relation between inputs and K.
4.3. Defuzzification
Finally, the centroid method is used to defuzzify, and after calculation, the effectivevalue of the proportional coefficient K of the regenerative braking is finally obtained. Inthis paper, the formula of the centroid method is as follows:
K =∑n
i=1 λiki
∑ni=1 λi
(10)
Energies 2021, 14, 2202 12 of 19
where λi is the application of rule I calculated results; n is the number of fuzzy rules; kiis the calculated proportion of the output by the application of rule i; and K is the systemoutput accuracy.
5. Simulation Results and Analysis5.1. Simulation Analysis of Braking Energy Recovery Control Strategy for Hybrid Electric Vehicle
This paper chooses AMESim and MATLAB/Simulink software to carry on the jointsimulation, and AMESim simulation platform mainly aims at the structure modeling ofhybrid electric vehicle, including driver model, motor model, vehicle model, battery model,transmission model, etc. While the MATLAB/Simulink simulation platform mainly aimsat the establishment of a braking energy recovery control strategy model.
Using NEDC (New European Driving) and WLTC (Worldwide harmonized lightvehicles test procedure) conditions [17], the double layers multi parameters braking energyrecovery control strategy proposed in this paper was simulated and tested, setting theinitial value of the vehicle power battery SOC to 0.5.
(1) NEDC condition
The NEDC condition is shown in Figure 11 below.
Energies 2021, 14, x FOR PEER REVIEW 12 of 20
𝐾 =∑ 𝜆𝑖𝑘𝑖𝑛𝑖=1
∑ 𝜆𝑖𝑛𝑖=1
(10)
where 𝜆𝑖 is the application of rule I calculated results; n is the number of fuzzy rules; 𝑘𝑖
is the calculated proportion of the output by the application of rule i; and K is the system
output accuracy.
5. Simulation Results and Analysis
5.1. Simulation Analysis of Braking Energy Recovery Control Strategy for Hybrid Electric Vehicle
This paper chooses AMESim and MATLAB/Simulink software to carry on the joint
simulation, and AMESim simulation platform mainly aims at the structure modeling of
hybrid electric vehicle, including driver model, motor model, vehicle model, battery
model, transmission model, etc. While the MATLAB/Simulink simulation platform
mainly aims at the establishment of a braking energy recovery control strategy model.
Using NEDC (New European Driving) and WLTC (Worldwide harmonized light ve-
hicles test procedure) conditions [17], the double layers multi parameters braking energy
recovery control strategy proposed in this paper was simulated and tested, setting the
initial value of the vehicle power battery SOC to 0.5.
(1) NEDC condition
The NEDC condition is shown in Figure 11 below.
Figure 11. Working condition of NEDC.
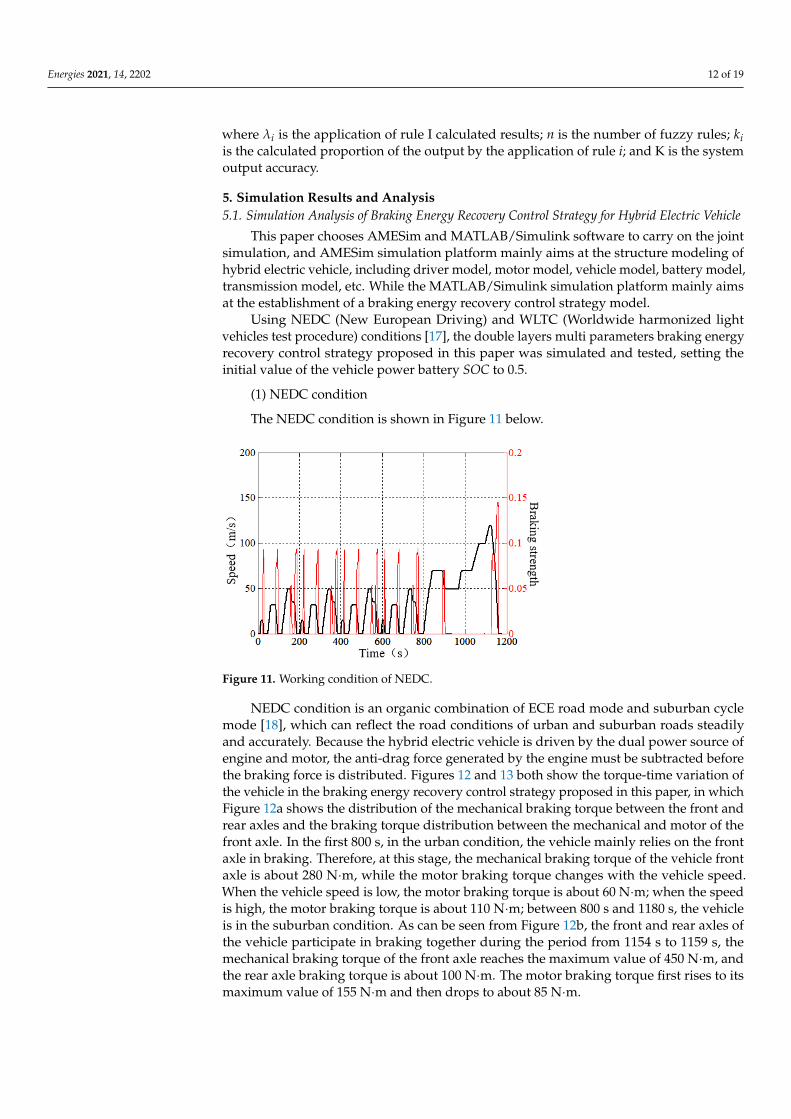
NEDC condition is an organic combination of ECE road mode and suburban cycle
mode [18], which can reflect the road conditions of urban and suburban roads steadily
and accurately. Because the hybrid electric vehicle is driven by the dual power source of
engine and motor, the anti-drag force generated by the engine must be subtracted before
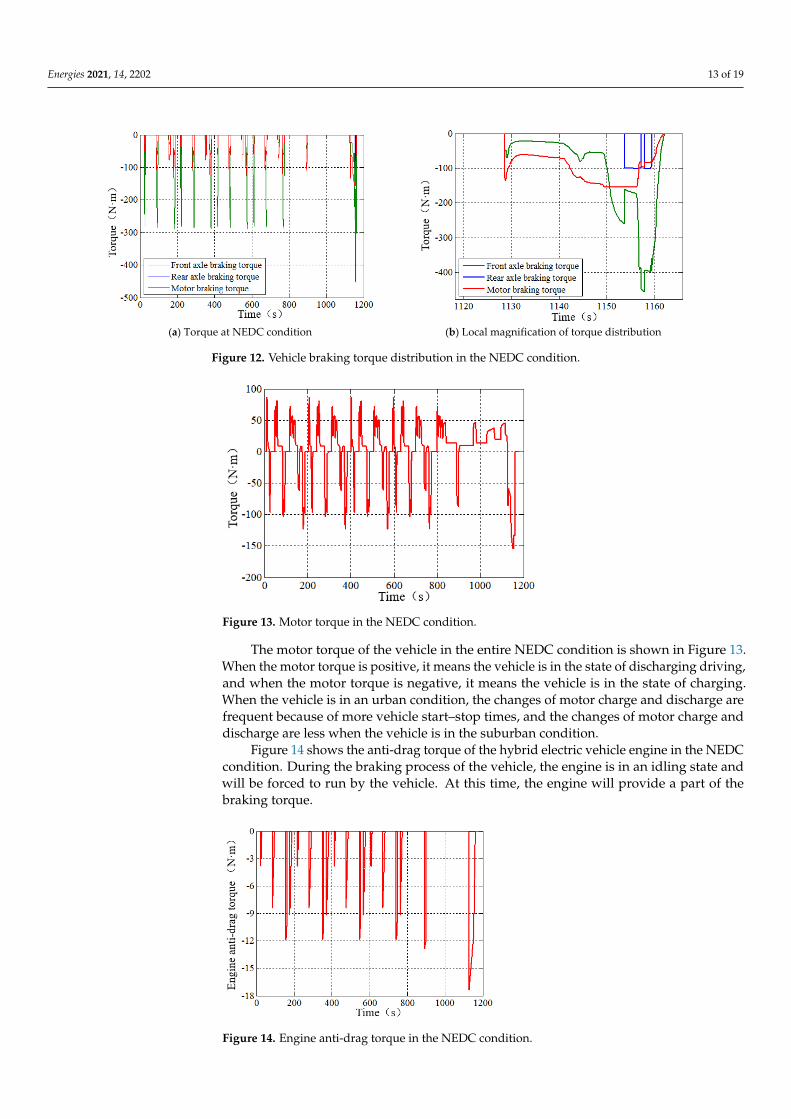
the braking force is distributed. Figures 12 and 13 both show the torque-time variation of
the vehicle in the braking energy recovery control strategy proposed in this paper, in
which Figure 12a shows the distribution of the mechanical braking torque between the
front and rear axles and the braking torque distribution between the mechanical and mo-
tor of the front axle. In the first 800 s, in the urban condition, the vehicle mainly relies on
the front axle in braking. Therefore, at this stage, the mechanical braking torque of the
vehicle front axle is about 280 N·m, while the motor braking torque changes with the ve-
hicle speed. When the vehicle speed is low, the motor braking torque is about 60 N·m;
when the speed is high, the motor braking torque is about 110 N·m; between 800 s and
1180 s, the vehicle is in the suburban condition. As can be seen from Figure 12b, the front
and rear axles of the vehicle participate in braking together during the period from 1154 s
to 1159 s, the mechanical braking torque of the front axle reaches the maximum value of
450 N·m, and the rear axle braking torque is about 100 N·m. The motor braking torque
first rises to its maximum value of 155 N·m and then drops to about 85 N·m.
Figure 11. Working condition of NEDC.
NEDC condition is an organic combination of ECE road mode and suburban cyclemode [18], which can reflect the road conditions of urban and suburban roads steadilyand accurately. Because the hybrid electric vehicle is driven by the dual power source ofengine and motor, the anti-drag force generated by the engine must be subtracted beforethe braking force is distributed. Figures 12 and 13 both show the torque-time variation ofthe vehicle in the braking energy recovery control strategy proposed in this paper, in whichFigure 12a shows the distribution of the mechanical braking torque between the front andrear axles and the braking torque distribution between the mechanical and motor of thefront axle. In the first 800 s, in the urban condition, the vehicle mainly relies on the frontaxle in braking. Therefore, at this stage, the mechanical braking torque of the vehicle frontaxle is about 280 N·m, while the motor braking torque changes with the vehicle speed.When the vehicle speed is low, the motor braking torque is about 60 N·m; when the speedis high, the motor braking torque is about 110 N·m; between 800 s and 1180 s, the vehicleis in the suburban condition. As can be seen from Figure 12b, the front and rear axles ofthe vehicle participate in braking together during the period from 1154 s to 1159 s, themechanical braking torque of the front axle reaches the maximum value of 450 N·m, andthe rear axle braking torque is about 100 N·m. The motor braking torque first rises to itsmaximum value of 155 N·m and then drops to about 85 N·m.
Energies 2021, 14, 2202 13 of 19Energies 2021, 14, x FOR PEER REVIEW 13 of 20
(a) Torque at NEDC condition (b) Local magnification of torque distribution
Figure 12. Vehicle braking torque distribution in the NEDC condition
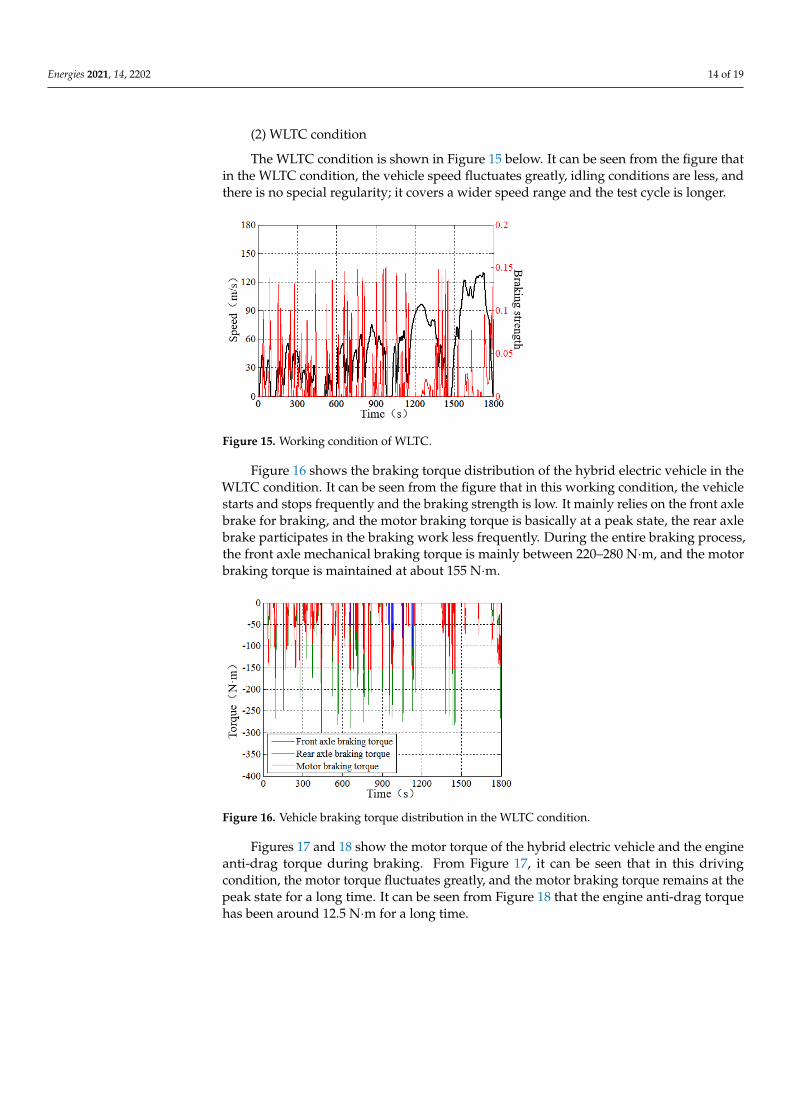
The motor torque of the vehicle in the entire NEDC condition is shown in Figure 13.
When the motor torque is positive, it means the vehicle is in the state of discharging driv-
ing, and when the motor torque is negative, it means the vehicle is in the state of charging.
When the vehicle is in an urban condition, the changes of motor charge and discharge are
frequent because of more vehicle start–stop times, and the changes of motor charge and
discharge are less when the vehicle is in the suburban condition.
Figure 13. Motor torque in the NEDC condition.
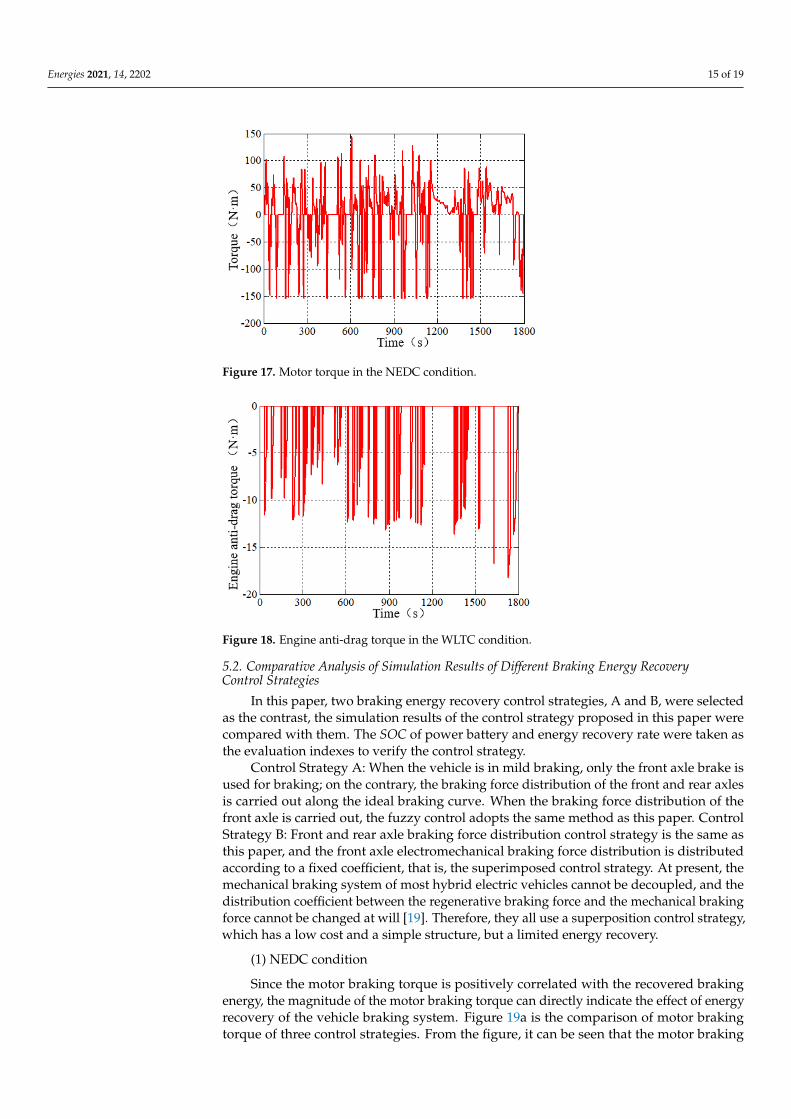
Figure 14 shows the anti-drag torque of the hybrid electric vehicle engine in the
NEDC condition. During the braking process of the vehicle, the engine is in an idling state
and will be forced to run by the vehicle. At this time, the engine will provide a part of the
braking torque.
Figure 12. Vehicle braking torque distribution in the NEDC condition.
Energies 2021, 14, x FOR PEER REVIEW 13 of 20
(a) Torque at NEDC condition (b) Local magnification of torque distribution
Figure 12. Vehicle braking torque distribution in the NEDC condition
The motor torque of the vehicle in the entire NEDC condition is shown in Figure 13.
When the motor torque is positive, it means the vehicle is in the state of discharging driv-
ing, and when the motor torque is negative, it means the vehicle is in the state of charging.
When the vehicle is in an urban condition, the changes of motor charge and discharge are
frequent because of more vehicle start–stop times, and the changes of motor charge and
discharge are less when the vehicle is in the suburban condition.
Figure 13. Motor torque in the NEDC condition.
Figure 14 shows the anti-drag torque of the hybrid electric vehicle engine in the
NEDC condition. During the braking process of the vehicle, the engine is in an idling state
and will be forced to run by the vehicle. At this time, the engine will provide a part of the
braking torque.
Figure 13. Motor torque in the NEDC condition.
The motor torque of the vehicle in the entire NEDC condition is shown in Figure 13.When the motor torque is positive, it means the vehicle is in the state of discharging driving,and when the motor torque is negative, it means the vehicle is in the state of charging.When the vehicle is in an urban condition, the changes of motor charge and discharge arefrequent because of more vehicle start–stop times, and the changes of motor charge anddischarge are less when the vehicle is in the suburban condition.
Figure 14 shows the anti-drag torque of the hybrid electric vehicle engine in the NEDCcondition. During the braking process of the vehicle, the engine is in an idling state andwill be forced to run by the vehicle. At this time, the engine will provide a part of thebraking torque.
Energies 2021, 14, x FOR PEER REVIEW 14 of 20
Figure 14. Engine anti-drag torque in the NEDC condition.
(2) WLTC condition
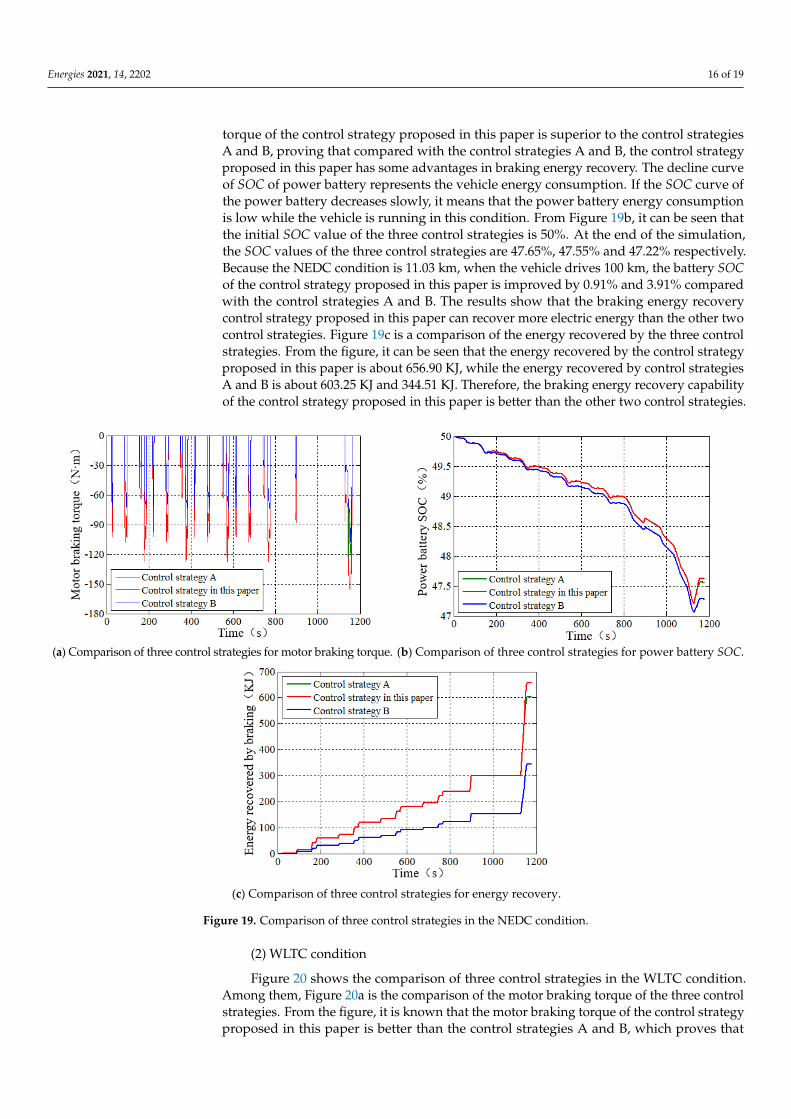
The WLTC condition is shown in Figure 15 below. It can be seen from the figure that
in the WLTC condition, the vehicle speed fluctuates greatly, idling conditions are less, and
there is no special regularity; it covers a wider speed range and the test cycle is longer.
Figure 15. Working condition of WLTC.
Figure 16 shows the braking torque distribution of the hybrid electric vehicle in the
WLTC condition. It can be seen from the figure that in this working condition, the vehicle
starts and stops frequently and the braking strength is low. It mainly relies on the front
axle brake for braking, and the motor braking torque is basically at a peak state, the rear
axle brake participates in the braking work less frequently. During the entire braking pro-
cess, the front axle mechanical braking torque is mainly between 220–280 N·m, and the
motor braking torque is maintained at about 155 N·m.
Figure 16. Vehicle braking torque distribution in the WLTC condition.
Figure 14. Engine anti-drag torque in the NEDC condition.
Energies 2021, 14, 2202 14 of 19
(2) WLTC condition
The WLTC condition is shown in Figure 15 below. It can be seen from the figure thatin the WLTC condition, the vehicle speed fluctuates greatly, idling conditions are less, andthere is no special regularity; it covers a wider speed range and the test cycle is longer.
Energies 2021, 14, x FOR PEER REVIEW 14 of 20
Figure 14. Engine anti-drag torque in the NEDC condition.
(2) WLTC condition
The WLTC condition is shown in Figure 15 below. It can be seen from the figure that
in the WLTC condition, the vehicle speed fluctuates greatly, idling conditions are less, and
there is no special regularity; it covers a wider speed range and the test cycle is longer.
Figure 15. Working condition of WLTC.
Figure 16 shows the braking torque distribution of the hybrid electric vehicle in the
WLTC condition. It can be seen from the figure that in this working condition, the vehicle
starts and stops frequently and the braking strength is low. It mainly relies on the front
axle brake for braking, and the motor braking torque is basically at a peak state, the rear
axle brake participates in the braking work less frequently. During the entire braking pro-
cess, the front axle mechanical braking torque is mainly between 220–280 N·m, and the
motor braking torque is maintained at about 155 N·m.
Figure 16. Vehicle braking torque distribution in the WLTC condition.
Figure 15. Working condition of WLTC.
Figure 16 shows the braking torque distribution of the hybrid electric vehicle in theWLTC condition. It can be seen from the figure that in this working condition, the vehiclestarts and stops frequently and the braking strength is low. It mainly relies on the front axlebrake for braking, and the motor braking torque is basically at a peak state, the rear axlebrake participates in the braking work less frequently. During the entire braking process,the front axle mechanical braking torque is mainly between 220–280 N·m, and the motorbraking torque is maintained at about 155 N·m.
Energies 2021, 14, x FOR PEER REVIEW 14 of 20
Figure 14. Engine anti-drag torque in the NEDC condition.
(2) WLTC condition
The WLTC condition is shown in Figure 15 below. It can be seen from the figure that
in the WLTC condition, the vehicle speed fluctuates greatly, idling conditions are less, and
there is no special regularity; it covers a wider speed range and the test cycle is longer.
Figure 15. Working condition of WLTC.
Figure 16 shows the braking torque distribution of the hybrid electric vehicle in the
WLTC condition. It can be seen from the figure that in this working condition, the vehicle
starts and stops frequently and the braking strength is low. It mainly relies on the front
axle brake for braking, and the motor braking torque is basically at a peak state, the rear
axle brake participates in the braking work less frequently. During the entire braking pro-
cess, the front axle mechanical braking torque is mainly between 220–280 N·m, and the
motor braking torque is maintained at about 155 N·m.
Figure 16. Vehicle braking torque distribution in the WLTC condition. Figure 16. Vehicle braking torque distribution in the WLTC condition.
Figures 17 and 18 show the motor torque of the hybrid electric vehicle and the engineanti-drag torque during braking. From Figure 17, it can be seen that in this drivingcondition, the motor torque fluctuates greatly, and the motor braking torque remains at thepeak state for a long time. It can be seen from Figure 18 that the engine anti-drag torquehas been around 12.5 N·m for a long time.
Energies 2021, 14, 2202 15 of 19
Energies 2021, 14, x FOR PEER REVIEW 15 of 20
Figures 17 and 18 show the motor torque of the hybrid electric vehicle and the engine
anti-drag torque during braking. From Figure 17, it can be seen that in this driving condi-
tion, the motor torque fluctuates greatly, and the motor braking torque remains at the
peak state for a long time. It can be seen from Figure 18 that the engine anti-drag torque
has been around 12.5 N·m for a long time.
Figure 17. Motor torque in the NEDC condition.
Figure 18. Engine anti-drag torque in the WLTC condition.
5.2. Comparative Analysis of Simulation Results of Different Braking Energy Recovery Control
Strategies
In this paper, two braking energy recovery control strategies, A and B, were selected
as the contrast, the simulation results of the control strategy proposed in this paper were
compared with them. The SOC of power battery and energy recovery rate were taken as
the evaluation indexes to verify the control strategy.
Control Strategy A: When the vehicle is in mild braking, only the front axle brake is
used for braking; on the contrary, the braking force distribution of the front and rear axles
is carried out along the ideal braking curve. When the braking force distribution of the
front axle is carried out, the fuzzy control adopts the same method as this paper. Control
Strategy B: Front and rear axle braking force distribution control strategy is the same as
this paper, and the front axle electromechanical braking force distribution is distributed
according to a fixed coefficient, that is, the superimposed control strategy. At present, the
mechanical braking system of most hybrid electric vehicles cannot be decoupled, and the
distribution coefficient between the regenerative braking force and the mechanical brak-
ing force cannot be changed at will [19]. Therefore, they all use a superposition control
strategy, which has a low cost and a simple structure, but a limited energy recovery.
Figure 17. Motor torque in the NEDC condition.
Energies 2021, 14, x FOR PEER REVIEW 15 of 20
Figures 17 and 18 show the motor torque of the hybrid electric vehicle and the engine
anti-drag torque during braking. From Figure 17, it can be seen that in this driving condi-
tion, the motor torque fluctuates greatly, and the motor braking torque remains at the
peak state for a long time. It can be seen from Figure 18 that the engine anti-drag torque
has been around 12.5 N·m for a long time.
Figure 17. Motor torque in the NEDC condition.
Figure 18. Engine anti-drag torque in the WLTC condition.
5.2. Comparative Analysis of Simulation Results of Different Braking Energy Recovery Control
Strategies
In this paper, two braking energy recovery control strategies, A and B, were selected
as the contrast, the simulation results of the control strategy proposed in this paper were
compared with them. The SOC of power battery and energy recovery rate were taken as
the evaluation indexes to verify the control strategy.
Control Strategy A: When the vehicle is in mild braking, only the front axle brake is
used for braking; on the contrary, the braking force distribution of the front and rear axles
is carried out along the ideal braking curve. When the braking force distribution of the
front axle is carried out, the fuzzy control adopts the same method as this paper. Control
Strategy B: Front and rear axle braking force distribution control strategy is the same as
this paper, and the front axle electromechanical braking force distribution is distributed
according to a fixed coefficient, that is, the superimposed control strategy. At present, the
mechanical braking system of most hybrid electric vehicles cannot be decoupled, and the
distribution coefficient between the regenerative braking force and the mechanical brak-
ing force cannot be changed at will [19]. Therefore, they all use a superposition control
strategy, which has a low cost and a simple structure, but a limited energy recovery.
Figure 18. Engine anti-drag torque in the WLTC condition.
5.2. Comparative Analysis of Simulation Results of Different Braking Energy RecoveryControl Strategies
In this paper, two braking energy recovery control strategies, A and B, were selectedas the contrast, the simulation results of the control strategy proposed in this paper werecompared with them. The SOC of power battery and energy recovery rate were taken asthe evaluation indexes to verify the control strategy.
Control Strategy A: When the vehicle is in mild braking, only the front axle brake isused for braking; on the contrary, the braking force distribution of the front and rear axlesis carried out along the ideal braking curve. When the braking force distribution of thefront axle is carried out, the fuzzy control adopts the same method as this paper. ControlStrategy B: Front and rear axle braking force distribution control strategy is the same asthis paper, and the front axle electromechanical braking force distribution is distributedaccording to a fixed coefficient, that is, the superimposed control strategy. At present, themechanical braking system of most hybrid electric vehicles cannot be decoupled, and thedistribution coefficient between the regenerative braking force and the mechanical brakingforce cannot be changed at will [19]. Therefore, they all use a superposition control strategy,which has a low cost and a simple structure, but a limited energy recovery.
(1) NEDC condition
Since the motor braking torque is positively correlated with the recovered brakingenergy, the magnitude of the motor braking torque can directly indicate the effect of energyrecovery of the vehicle braking system. Figure 19a is the comparison of motor brakingtorque of three control strategies. From the figure, it can be seen that the motor braking
Energies 2021, 14, 2202 16 of 19
torque of the control strategy proposed in this paper is superior to the control strategiesA and B, proving that compared with the control strategies A and B, the control strategyproposed in this paper has some advantages in braking energy recovery. The decline curveof SOC of power battery represents the vehicle energy consumption. If the SOC curve ofthe power battery decreases slowly, it means that the power battery energy consumptionis low while the vehicle is running in this condition. From Figure 19b, it can be seen thatthe initial SOC value of the three control strategies is 50%. At the end of the simulation,the SOC values of the three control strategies are 47.65%, 47.55% and 47.22% respectively.Because the NEDC condition is 11.03 km, when the vehicle drives 100 km, the battery SOCof the control strategy proposed in this paper is improved by 0.91% and 3.91% comparedwith the control strategies A and B. The results show that the braking energy recoverycontrol strategy proposed in this paper can recover more electric energy than the other twocontrol strategies. Figure 19c is a comparison of the energy recovered by the three controlstrategies. From the figure, it can be seen that the energy recovered by the control strategyproposed in this paper is about 656.90 KJ, while the energy recovered by control strategiesA and B is about 603.25 KJ and 344.51 KJ. Therefore, the braking energy recovery capabilityof the control strategy proposed in this paper is better than the other two control strategies.
Energies 2021, 14, x FOR PEER REVIEW 16 of 20
(1) NEDC condition
Since the motor braking torque is positively correlated with the recovered braking
energy, the magnitude of the motor braking torque can directly indicate the effect of en-
ergy recovery of the vehicle braking system. Figure 19a is the comparison of motor brak-
ing torque of three control strategies. From the figure, it can be seen that the motor braking
torque of the control strategy proposed in this paper is superior to the control strategies
A and B, proving that compared with the control strategies A and B, the control strategy
proposed in this paper has some advantages in braking energy recovery. The decline
curve of SOC of power battery represents the vehicle energy consumption. If the SOC
curve of the power battery decreases slowly, it means that the power battery energy con-
sumption is low while the vehicle is running in this condition. From Figure 19b, it can be
seen that the initial SOC value of the three control strategies is 50%. At the end of the
simulation, the SOC values of the three control strategies are 47.65%, 47.55% and 47.22%
respectively. Because the NEDC condition is 11.03 km, when the vehicle drives 100 km,
the battery SOC of the control strategy proposed in this paper is improved by 0.91% and
3.91% compared with the control strategies A and B. The results show that the braking
energy recovery control strategy proposed in this paper can recover more electric energy
than the other two control strategies. Figure 19c is a comparison of the energy recovered
by the three control strategies. From the figure, it can be seen that the energy recovered
by the control strategy proposed in this paper is about 656.90 KJ, while the energy recov-
ered by control strategies A and B is about 603.25 KJ and 344.51 KJ. Therefore, the braking
energy recovery capability of the control strategy proposed in this paper is better than the
other two control strategies.
(a) Comparison of three control strategies for motor braking torque. (b) Comparison of three control strategies for power battery SOC.
(c) Comparison of three control strategies for energy recovery.
Figure 19. Comparison of three control strategies in the NEDC condition. Figure 19. Comparison of three control strategies in the NEDC condition.
(2) WLTC condition
Figure 20 shows the comparison of three control strategies in the WLTC condition.Among them, Figure 20a is the comparison of the motor braking torque of the three controlstrategies. From the figure, it is known that the motor braking torque of the control strategyproposed in this paper is better than the control strategies A and B, which proves that
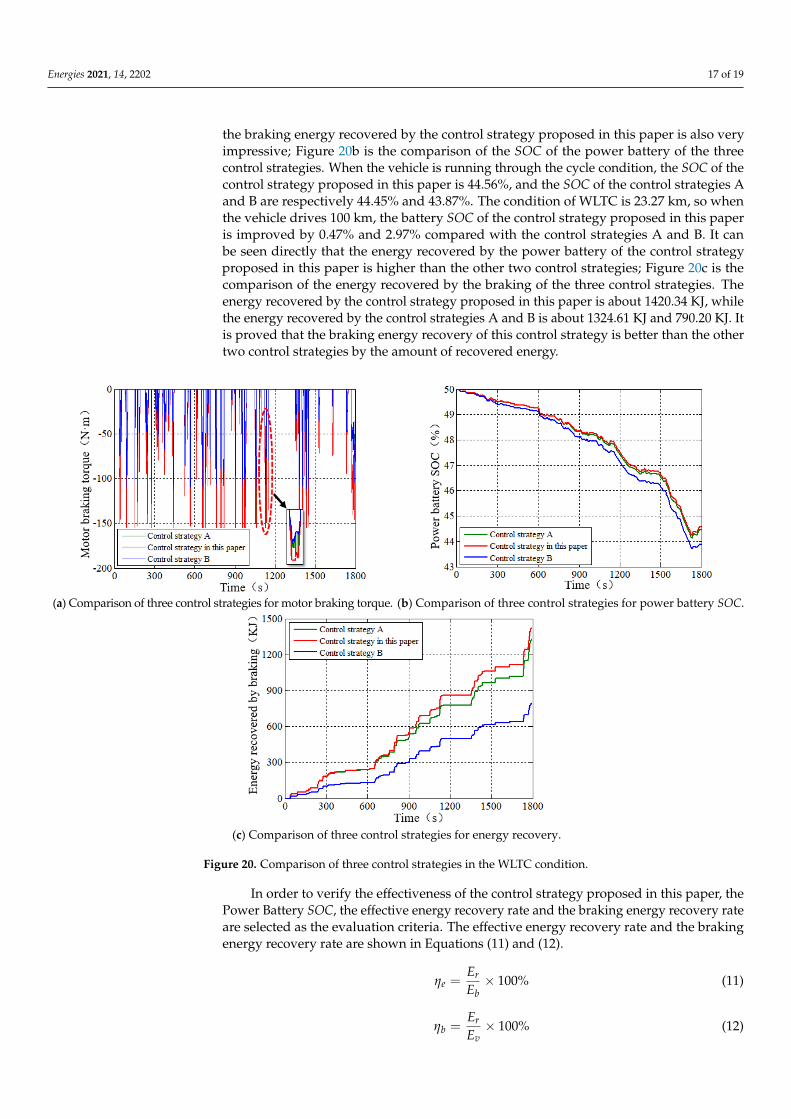
Energies 2021, 14, 2202 17 of 19
the braking energy recovered by the control strategy proposed in this paper is also veryimpressive; Figure 20b is the comparison of the SOC of the power battery of the threecontrol strategies. When the vehicle is running through the cycle condition, the SOC of thecontrol strategy proposed in this paper is 44.56%, and the SOC of the control strategies Aand B are respectively 44.45% and 43.87%. The condition of WLTC is 23.27 km, so whenthe vehicle drives 100 km, the battery SOC of the control strategy proposed in this paperis improved by 0.47% and 2.97% compared with the control strategies A and B. It canbe seen directly that the energy recovered by the power battery of the control strategyproposed in this paper is higher than the other two control strategies; Figure 20c is thecomparison of the energy recovered by the braking of the three control strategies. Theenergy recovered by the control strategy proposed in this paper is about 1420.34 KJ, whilethe energy recovered by the control strategies A and B is about 1324.61 KJ and 790.20 KJ. Itis proved that the braking energy recovery of this control strategy is better than the othertwo control strategies by the amount of recovered energy.
Energies 2021, 14, x FOR PEER REVIEW 17 of 20
(2) WLTC condition Figure 20 shows the comparison of three control strategies in the WLTC condition.
Among them, Figure 20a is the comparison of the motor braking torque of the three con-trol strategies. From the figure, it is known that the motor braking torque of the control strategy proposed in this paper is better than the control strategies A and B, which proves that the braking energy recovered by the control strategy proposed in this paper is also very impressive; Figure 20b is the comparison of the SOC of the power battery of the three control strategies. When the vehicle is running through the cycle condition, the SOC of the control strategy proposed in this paper is 44.56%, and the SOC of the control strategies A and B are respectively 44.45% and 43.87%. The condition of WLTC is 23.27 km, so when the vehicle drives 100 km, the battery SOC of the control strategy proposed in this paper is improved by 0.47% and 2.97% compared with the control strategies A and B. It can be seen directly that the energy recovered by the power battery of the control strategy pro-posed in this paper is higher than the other two control strategies; Figure 20c is the com-parison of the energy recovered by the braking of the three control strategies. The energy recovered by the control strategy proposed in this paper is about 1420.34 KJ, while the energy recovered by the control strategies A and B is about 1324.61 KJ and 790.20 KJ. It is proved that the braking energy recovery of this control strategy is better than the other two control strategies by the amount of recovered energy.
(a) Comparison of three control strategies for motor braking torque. (b) Comparison of three control strategies for power battery SOC.
(c) Comparison of three control strategies for energy recovery.
Figure 20. Comparison of three control strategies in the WLTC condition.
In order to verify the effectiveness of the control strategy proposed in this paper, the Power Battery SOC, the effective energy recovery rate and the braking energy recovery rate are selected as the evaluation criteria. The effective energy recovery rate and the brak-ing energy recovery rate are shown in Equations (11) and (12).
Figure 20. Comparison of three control strategies in the WLTC condition.
In order to verify the effectiveness of the control strategy proposed in this paper, thePower Battery SOC, the effective energy recovery rate and the braking energy recovery rateare selected as the evaluation criteria. The effective energy recovery rate and the brakingenergy recovery rate are shown in Equations (11) and (12).
ηe =Er
Eb× 100% (11)
ηb =Er
Ev× 100% (12)
Energies 2021, 14, 2202 18 of 19
where Er is the energy recovered by braking; Eb is the total braking energy; Ev is the energyconsumption of the whole vehicle; ηe is the effective energy recovery rate in the process ofvehicle braking; ηb is the braking energy recovery rate in the process of vehicle braking.The sum of ηe and ηb is calculated as shown in Table 3.
Table 3. Comparison of braking energy recovery in NEDC and WLTC conditions.
Control StrategyControl Strategy A Control Strategy B Control Strategy Proposed
in This Paper
NEDC WLTC NEDC WLTC NEDC WLTC
Total energy consumption of vehicles (KJ) 4212.36 12,141.2 4201.19 12,043.53 4224.82 12,131.13Total braking energy (KJ) 1640.81 3677.4 1632.72 3646.52 1676.80 3681.21
Energy recovered by braking (KJ) 603.25 1324.61 344.51 790.20 656.90 1420.34Effective energy recovery rate (%) 14.32 10.91 8.20 6.56 15.55 11.71Braking energy recovery rate (%) 36.76 36.02 21.10 21.67 39.18 38.58
Table 3 shows the comparison of the braking energy recovery effects of the threecontrol strategies based on NEDC and WLTC conditions. For the control strategy proposedin this paper, in the NEDC condition, the total energy consumption of the vehicle reached4224.82 KJ, the total braking energy produced was 1676.8 KJ and the energy recoveredduring braking was 656.90 KJ. Therefore, the effective braking energy recovery rate of thevehicle reached 15.55%, compared with control strategies A and B, which was increased by1.23% and 7.35%, and the recovery rate of the braking energy reached 39.18%, which wasrespectively increased by 2.42% and 18.08%. In addition, in the WLTC condition, the totalenergy consumption of the vehicle reached 12,131.13 KJ, the total energy generated duringbraking was 3681.21 KJ, and the energy recovered by braking was 1420.34 KJ. Therefore, theeffective recovery rate of braking energy of the vehicle reached 11.71%, which increased by0.80% and 5.15% respectively compared with the control strategies A and B. The recoveryrate of braking energy reached 38.58%, which increased by 2.56% and 16.91% respectivelythrough comparison. To sum up, the control strategy proposed in this paper can reasonablydistribute the braking force of the vehicle and effectively improve the energy recovered bythe vehicle during braking.
6. Conclusions
This paper proposes a double layers multi parameters braking energy recovery con-trol strategy. The first layer is to distribute the braking force of the front and rear axles.According to the braking strength, the braking mode is divided into three types. Withinthe limits of braking regulations, a corresponding front and rear axle braking force distri-bution control strategy is formulated for each braking mode. The second layer performs asecondary distribution of the distributed front axle braking force. By designing a fuzzycontroller, which takes the speed, braking strength and the state of charge of the powerbattery as the input and the proportion coefficient of regenerative braking as the output,and considering the anti-drag torque of the engine, it realizes the coordinated control ofthe front axle electromechanical braking force.
Based on the NEDC and WLTC conditions, the control strategy in this paper iscompared with control strategies A and B by simulation, and the SOC of power battery andthe recovery efficiency of braking energy are taken as the evaluation criteria. The resultsshow that in the NEDC condition, the battery SOC of the control strategy proposed inthis paper is increased by 0.10% and 0.43% compared with control strategies A and B, andthe braking energy recovery rate is increased by 2.42% and 18.08%, respectively. In theWLTC condition, the battery SOC of the control strategy proposed in this paper increasedby 0.11% and 0.69%, and the braking energy recovery rate was increased by 2.56% and16.91%, respectively.
The simulation results prove that the control strategy proposed in this paper has agreat energy recovery potential and can improve vehicle energy utilization efficiency on
Energies 2021, 14, 2202 19 of 19
the premise of meeting vehicle braking requirements. In terms of theoretical research, thispaper can provide a comprehensive reference for scholars in universities and automobilecompanies in energy recovery. In the future, the author will focus on the integrationof vehicle ABS systems and regenerative braking control strategies, as well as actualvehicle tests.
Author Contributions: D.N. designed the main idea, methods and experiments, and wrote the paper.C.G. and L.G. participated in the design of the algorithm. Q.X. and S.M. put forward suggestionsfor revision and helped to revise the manuscript. All authors have read and agreed to the publishedversion of the manuscript.
Funding: This work was supported by National Key Research and Development Program(2017YFB0103203).
Acknowledgments: The authors would like to thank the reviewers for their corrections and help-ful suggestions.
Conflicts of Interest: The authors declare no conflict of interest.
References1. Enang, W.; Bannister, C. Modelling and control of hybrid electric vehicles (A comprehensive review). Renew. Sustain. Energy Rev.
2017, 74, 1210–1239. [CrossRef]2. Sharma, M.; Singh, A.N.; Yadav, R.; Jha, A.; Vanshaj, K.; Fahim, M. Regenerative Braking System. J. Trend Sci. Res. Dev. 2019, 3,
298–300. [CrossRef]3. Xu, L.; He, X.; Shen, X. Improving Energy Recovery Rate of the Regenerative Braking System by Optimization of Influencing
Factors. Appl. Sci. 2019, 9, 3807. [CrossRef]4. Zhao, D.; Chu, L.; Xu, N.; Sun, C.; Xu, Y. Development of a Cooperative Braking System for Front-Wheel Drive Electric Vehicles.
Energies 2018, 11, 378. [CrossRef]5. Zhao, Q.; Zhang, H.; Xin, Y.; Salman, S. Research on Control Strategy of Hydraulic Regenerative Braking of Electrohydraulic
Hybrid Electric Vehicles. Math. Probl. Eng. 2021, 2021, 5391351. [CrossRef]6. He, H.; Wang, C.; Jia, H. A single-pedal regenerative braking control strategy of accelerator pedal for electric vehicles based on
adaptive fuzzy control algorithm. Energy Procedia 2018, 152, 624–629.7. Qiu, C.; Wang, G.; Meng, M.; Shen, Y. A novel control strategy of regenerative braking system for electric vehicles under safety
critical driving situations. Energy 2018, 149, 329–340. [CrossRef]8. Wu, Y.; Shu, M.; Ge, H. Research on Brake Force Distribution Control Strategy of Electric Vehicle Subtitle as needed. Iop Conf. Ser.
Mater. Sci. Eng. 2018, 452, 032054. [CrossRef]9. Xin, Y.; Zhang, T.; Zhang, H.; Zhao, Q.; Zheng, J.; Wang, C.; Pace, R.D. Fuzzy Logic Optimization of Composite Brake Control
Strategy for Load-Isolated Electric Bus. Math. Probl. Eng. 2019, 2019, 9735368. [CrossRef]10. Liu, H.; Lei, Y.; Fu, Y.; Li, X. An Optimal Slip Ratio-Based Revised Regenerative Braking Control Strategy of Range-Extended
Electric Vehicle. Energies 2020, 13, 1526. [CrossRef]11. Xu, W.; Chen, H.; Zhao, H.; Ren, B. Torque optimization control for electric vehicles with four in-wheel motors equipped with
regenerative braking system. Mechatronics 2019, 57, 95–108. [CrossRef]12. Wu, J.; Wang, X.; Li, L.; Qin, C.; Du, Y. Hierarchical control strategy with battery aging consideration for hybrid electric vehicle
regenerative braking control. Energy 2018, 145, 301–312. [CrossRef]13. Yang, Y.; He, Q.; Chen, Y.; Fu, C. Efficiency Optimization and Control Strategy of Regenerative Braking System with Dual Motor.
Energies 2020, 13, 711. [CrossRef]14. Li, S.; Yu, B.; Feng, X. Research on braking energy recovery strategy of electric vehicle based on ECE regulation and I curve.
Sci. Prog. 2020, 103, 36850419877762. [CrossRef] [PubMed]15. Xiao, B.; Lu, H.; Wang, H.; Ruan, J.; Zhang, N. Enhanced Regenerative Braking Strategies for Electric Vehicles: Dynamic
Performance and Potential Analysis. Energies 2017, 10, 1875.16. Zhou, M.; Wang, J.; Chen, Q. Research on vehicle controller and control strategy for pure electric vehicle with composite power.
Int. J. Electr. Hybrid Veh. 2019, 11, 170–193. [CrossRef]17. Ma, K.; Wang, Z.; Liu, H.; Yu, H.; Wei, C. Numerical Investigation on Fuzzy Logic Control Energy Management Strategy of
Parallel Hybrid Electric Vehicle. Energy Procedia 2019, 158, 2643–2648. [CrossRef]18. Pei, X.; Pan, H.; Chen, Z.; Guo, X.; Yang, B. Coordinated control strategy of electro-hydraulic braking for energy regeneration.
Control Eng. Pract. 2020, 96, 104324. [CrossRef]19. Sun, Y.; Wang, Y.; Zhu, R.; Geng, R.; Zhang, J.; Fan, D.; Wang, H. Study on the Control Strategy of Regenerative Braking for the
Hybrid Electric Vehicle under Typical Braking Condition. IOP Conf. Ser. Mater. Sci. Eng. 2018, 452, 032092. [CrossRef]


