Embed Size (px)
Citation preview
Singapore in Figures 2019
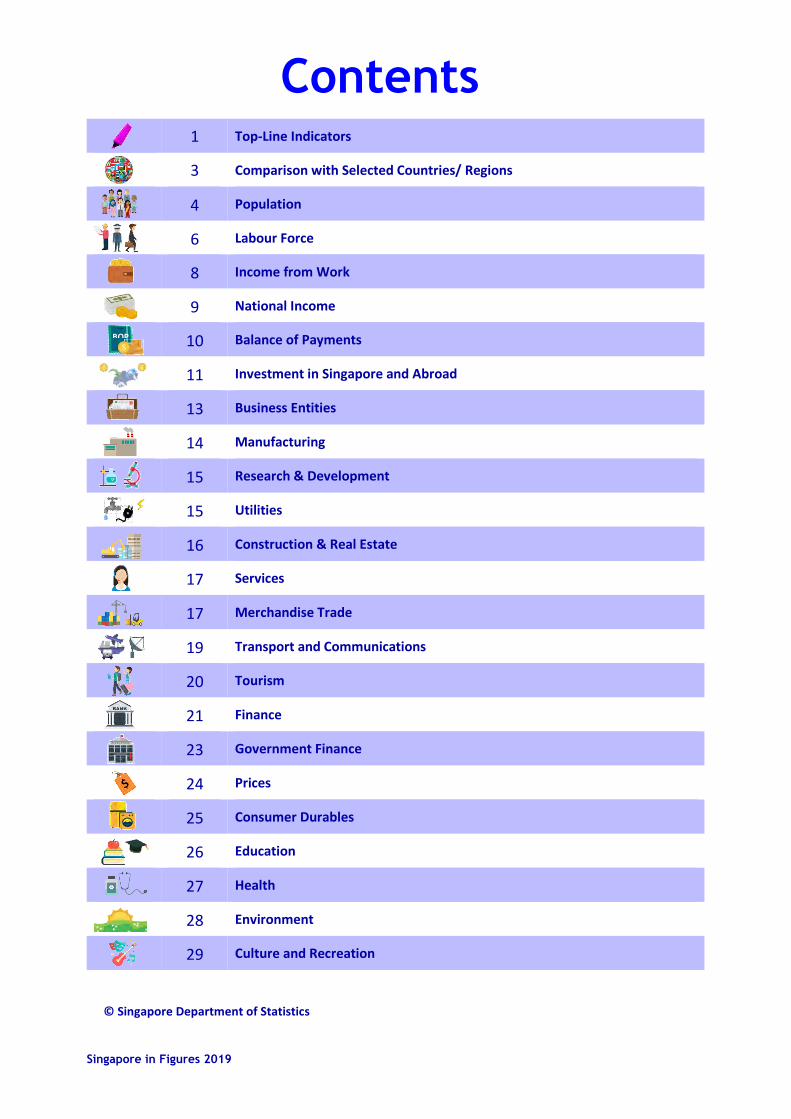
1 Top-Line Indicators
3 Comparison with Selected Countries/ Regions
4 Population
6 Labour Force
8 Income from Work
9 National Income
10 Balance of Payments
11 Investment in Singapore and Abroad
13 Business Entities
14 Manufacturing
15 Research & Development
15 Utilities
16 Construction & Real Estate
17 Services
17 Merchandise Trade
19 Transport and Communications
20 Tourism
21 Finance
23 Government Finance
24 Prices
25 Consumer Durables
26 Education
27 Health
28 Environment
29 Culture and Recreation
Contents
© Singapore Department of Statistics
BOP
Singapore in Figures 2019
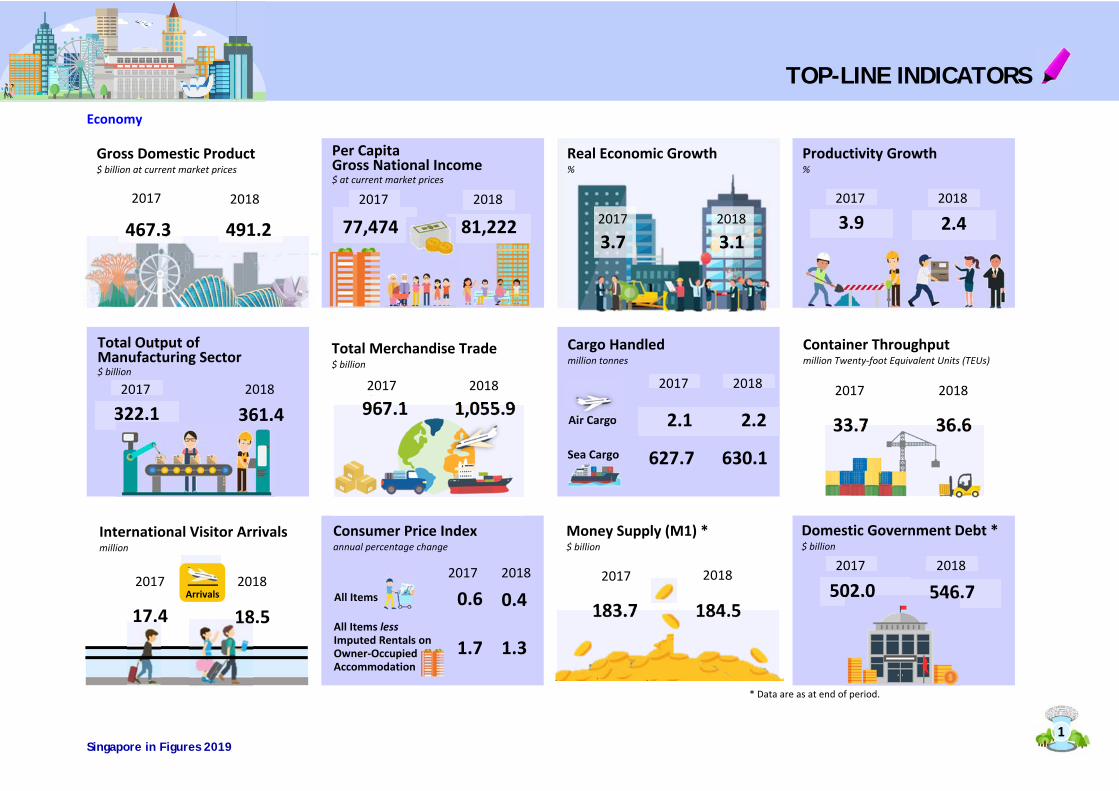
Economy
0
Gross Domestic Product $ billion at current market prices
Real Economic Growth %
Per Capita Gross National Income $ at current market prices
Productivity Growth %
Money Supply (M1) * $ billion
2017
77,474 2018
81,222 2017
3.9 2018
2.4
Total Merchandise Trade $ billion
2017
967.1 2018
1,055.9
Container Throughput million Twenty‐foot Equivalent Units (TEUs)
2017
33.7
2018
36.6
2017
183.7
2018
184.5
2018
0.4
Consumer Price Index annual percentage change
All Items
2017
0.6 All Items less Imputed Rentals on Owner‐Occupied Accommodation
1.3 1.7
2017
322.1
Total Output of Manufacturing Sector $ billion
2018
361.4
2018
18.5
International Visitor Arrivals million
2017
17.4
Cargo Handled million tonnes
2017
2.1
2018
2.2 Air Cargo
Sea Cargo 630.1 627.7
Domestic Government Debt * $ billion
2017
502.0 2018
546.7
* Data are as at end of period.
1
TOP-LINE INDICATORS
2017
3.7 2018
3.1
2017 2018
467.3 491.2
Arrivals
Singapore in Figures 2019
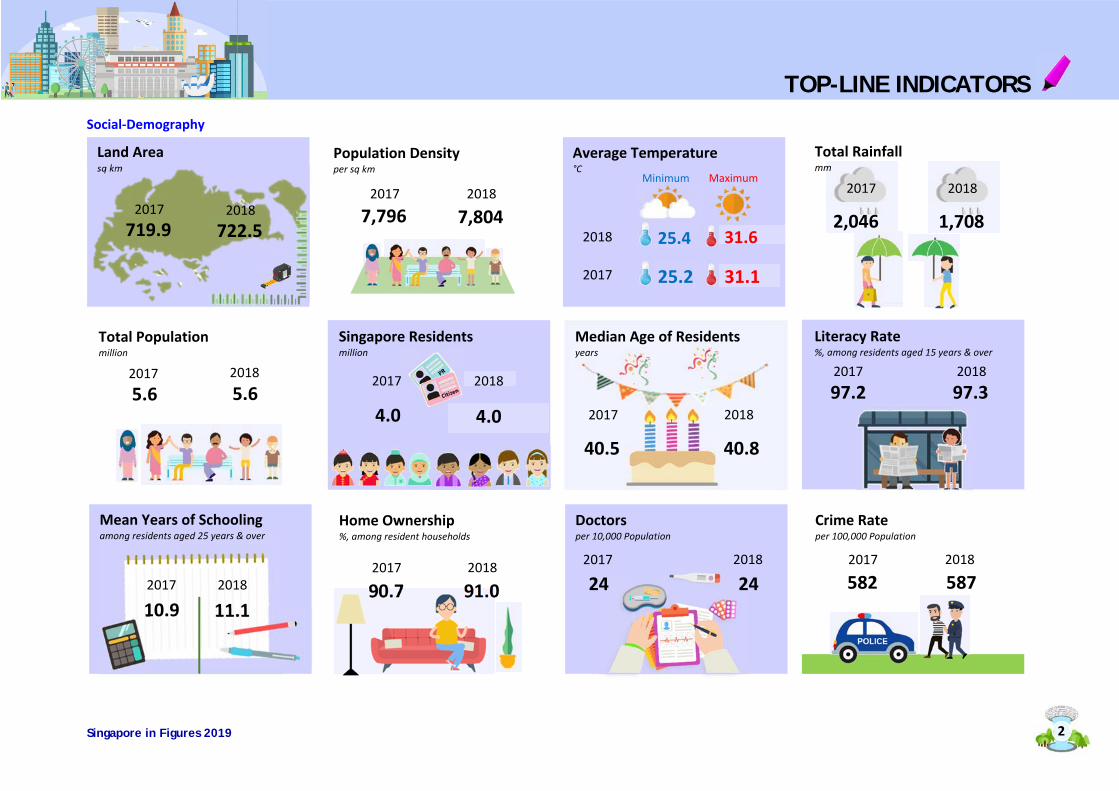
Social‐Demography
Average Temperature °C
Crime Rate per 100,000 Population
Land Area sq km
sq km
2017
2018
Maximum Minimum 2017
2,046 2017
7,796
2017 2018 97.2
2017 2018
10.9
Total Rainfall mm
2018
7,804
Population Density per sq km
2017719.9
2018 722.5
2018
1,708
Total Population million
20175.6
2018
5.6 2017
4.0
2018
4.0
Singapore Residents million
Median Age of Residents years
Literacy Rate %, among residents aged 15 years & over
97.3
Mean Years of Schooling among residents aged 25 years & over
11.1
Home Ownership %, among resident households
2017
90.7 2018
91.0
Doctors per 10,000 Population
2017 2018
24 24 2017 2018
582 587
2
TOP-LINE INDICATORS
31.1 25.2
31.6 25.4
2017 2018
40.5 40.8
Singapore in Figures 2019
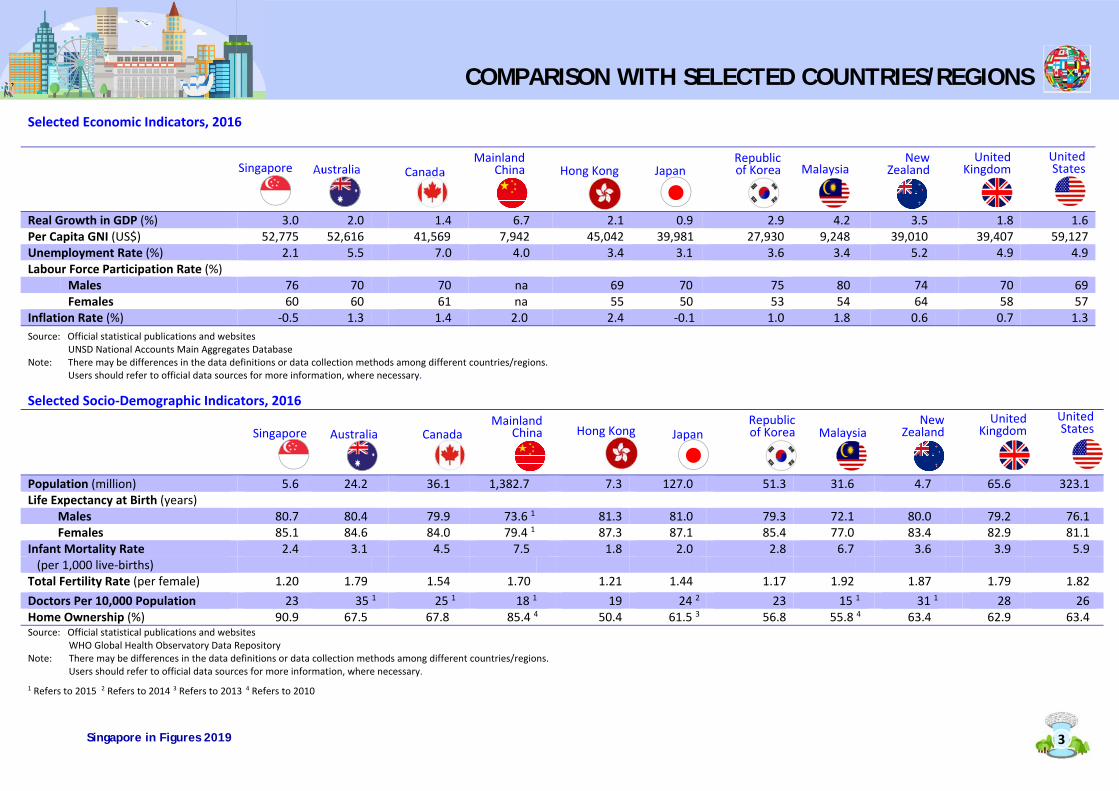
Selected Economic Indicators, 2016
Real Growth in GDP (%) 3.0 2.0 1.4 6.7 2.1 0.9 2.9 4.2 3.5 1.8 1.6 Per Capita GNI (US$) 52,775 52,616 41,569 7,942 45,042 39,981 27,930 9,248 39,010 39,407 59,127 Unemployment Rate (%) 2.1 5.5 7.0 4.0 3.4 3.1 3.6 3.4 5.2 4.9 4.9 Labour Force Participation Rate (%)
Males 76 70 70 na 69 70 75 80 74 70 69 Females 60 60 61 na 55 50 53 54 64 58 57
Inflation Rate (%) ‐0.5 1.3 1.4 2.0 2.4 ‐0.1 1.0 1.8 0.6 0.7 1.3 Source: Official statistical publications and websites
UNSD National Accounts Main Aggregates Database Note: There may be differences in the data definitions or data collection methods among different countries/regions.
Users should refer to official data sources for more information, where necessary.
Selected Socio‐Demographic Indicators, 2016
Population (million) 5.6 24.2 36.1 1,382.7 7.3 127.0 51.3 31.6 4.7 65.6 323.1 Life Expectancy at Birth (years)
Males 80.7 80.4 79.9 73.6 1 81.3 81.0 79.3 72.1 80.0 79.2 76.1 Females 85.1 84.6 84.0 79.4 1 87.3 87.1 85.4 77.0 83.4 82.9 81.1
Infant Mortality Rate 2.4 3.1 4.5 7.5 1.8 2.0 2.8 6.7 3.6 3.9 5.9 (per 1,000 live‐births) Total Fertility Rate (per female) 1.20 1.79 1.54 1.70 1.21 1.44 1.17 1.92 1.87 1.79 1.82 Doctors Per 10,000 Population 23 35 1 25 1 18 1 19 24 2 23 15 1 31 1 28 26 Home Ownership (%) 90.9 67.5 67.8 85.4 4 50.4 61.5 3 56.8 55.8 4 63.4 62.9 63.4 Source: Official statistical publications and websites
WHO Global Health Observatory Data Repository Note: There may be differences in the data definitions or data collection methods among different countries/regions.
Users should refer to official data sources for more information, where necessary. 1 Refers to 2015 2 Refers to 2014 3 Refers to 2013 4 Refers to 2010
COMPARISON WITH SELECTED COUNTRIES/REGIONS
Hong Kong Australia United
Kingdom United States Canada
Republic of Korea
Mainland China
New Zealand Singapore Malaysia Japan
United Kingdom
United States Australia
Republic of Korea
New Zealand Singapore Canada
Mainland China
3
Hong Kong Japan Malaysia
Singapore in Figures 2019
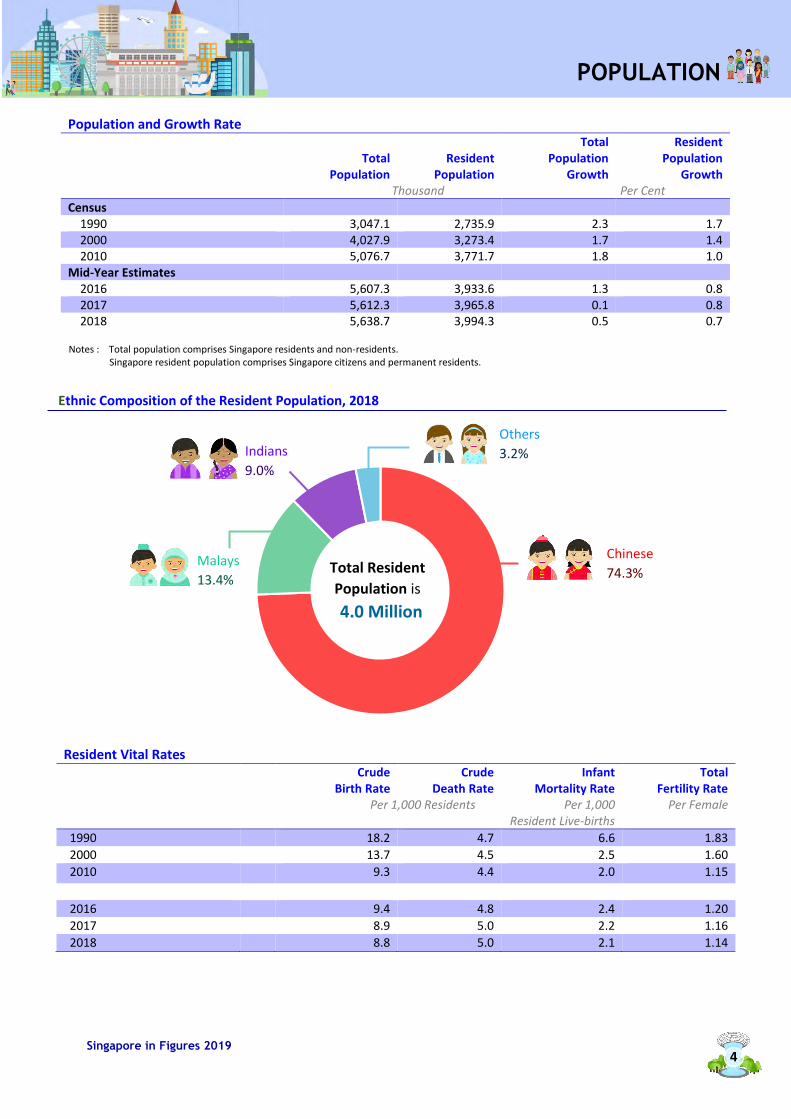
Total Resident
Population is
4.0 Million
Ethnic Composition of the Resident Population, 2018
Resident Vital Rates
Crude Birth Rate
Crude Death Rate
Infant Mortality Rate
Total Fertility Rate
Per 1,000 Residents Per 1,000 Resident Live-births
Per Female
1990 18.2 4.7 6.6 1.83
2000 13.7 4.5 2.5 1.60
2010 9.3 4.4 2.0 1.15
2016 9.4 4.8 2.4 1.20
2017 8.9 5.0 2.2 1.16
2018 8.8 5.0 2.1 1.14
Population and Growth Rate
Total Population
Resident Population
Total Population
Growth
Resident Population
Growth Thousand Per Cent
Census 1990 3,047.1 2,735.9 2.3 1.7 2000 4,027.9 3,273.4 1.7 1.4 2010 5,076.7 3,771.7 1.8 1.0 Mid-Year Estimates 2016 5,607.3 3,933.6 1.3 0.8 2017 5,612.3 3,965.8 0.1 0.8 2018 5,638.7 3,994.3 0.5 0.7
Notes : Total population comprises Singapore residents and non-residents. Singapore resident population comprises Singapore citizens and permanent residents.
Malays
13.4%
Indians
9.0%
Chinese
74.3%
Others
3.2%
4
POPULATION
Singapore in Figures 2019
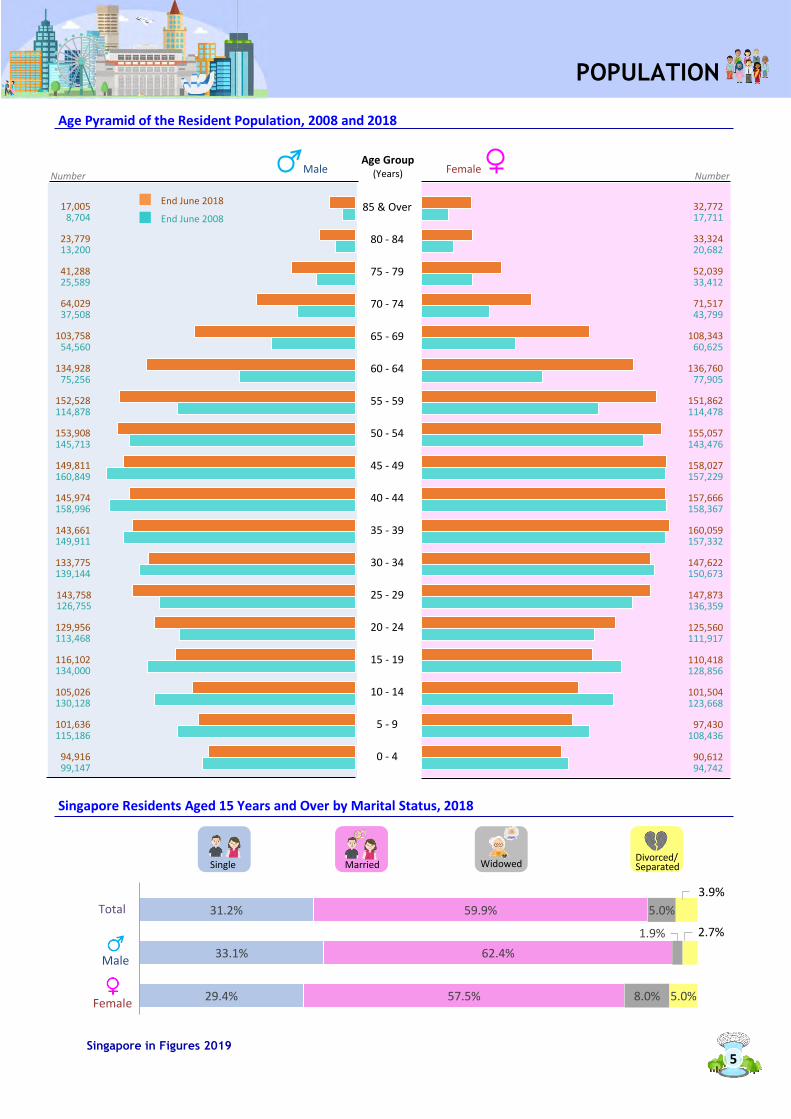
Age Pyramid of the Resident Population, 2008 and 2018
Singapore Residents Aged 15 Years and Over by Marital Status, 2018
31.2%
33.1%
29.4%
59.9%
62.4%
57.5%
5.0%
1.9%
8.0% 5.0%
52,039 33,412
0 - 4
Total
5 - 9
10 - 14
15 - 19
20 - 24
25 - 29
30 - 34
35 - 39
40 - 44
45 - 49
55 - 59
60 - 64
65 - 69
70 - 74
75 - 79
80 - 84
50 - 54
85 & Over
Female
Age Group (Years)
32,772 17,711
33,324 20,682
71,517 43,799
108,343 60,625
136,760 77,905
151,862 114,478
155,057 143,476
158,027 157,229
157,666 158,367
160,059 157,332
147,622 150,673
147,873 136,359
125,560 111,917
110,418 128,856
101,504 123,668
90,612 94,742
97,430 108,436
Male Number
End June 2018
End June 2008
Number Female
Widowed
Male
POPULATION
5
17,005 8,704
41,288 25,589
64,029 37,508
103,758 54,560
134,928 75,256
152,528 114,878
153,908 145,713
149,811 160,849
145,974 158,996
143,661 149,911
133,775 139,144
143,758 126,755
129,956 113,468
116,102 134,000
105,026 130,128
94,916 99,147
101,636 115,186
23,779 13,200
MarriedDivorced/ Separated Single
2.7%
3.9%
Singapore in Figures 2019
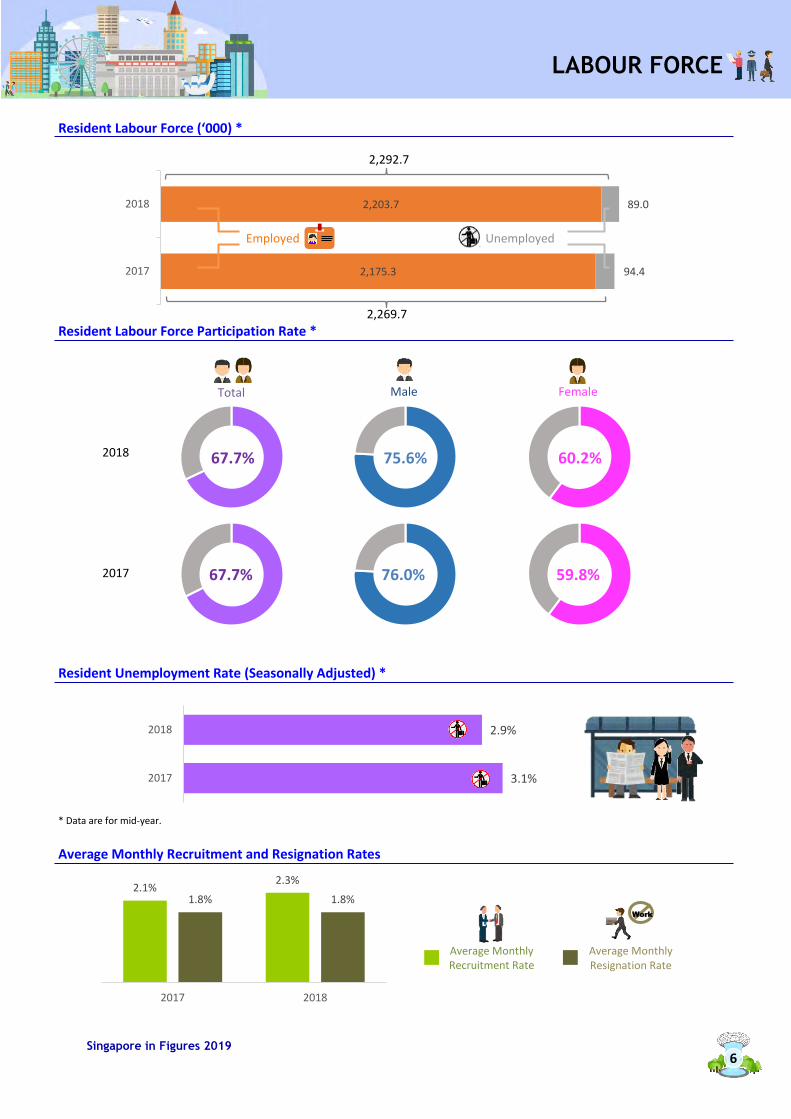
Resident Labour Force (‘000) *
Resident Labour Force Participation Rate *
Resident Unemployment Rate (Seasonally Adjusted) *
* Data are for mid-year.
Average Monthly Recruitment and Resignation Rates
2,203.7
2,175.3
89.0
94.4
2018
2017
Average Monthly Recruitment Rate
Average Monthly Resignation Rate
Work
2018
2017
Total Male Female
67.7% 76.0%
75.6%
59.8%
60.2%
2,269.7
Employed Unemployed
2,292.7
LABOUR FORCE
6
67.7%
2.9%
3.1%
2018
2017
2.1%2.3%
1.8% 1.8%
2017 2018
Singapore in Figures 2019
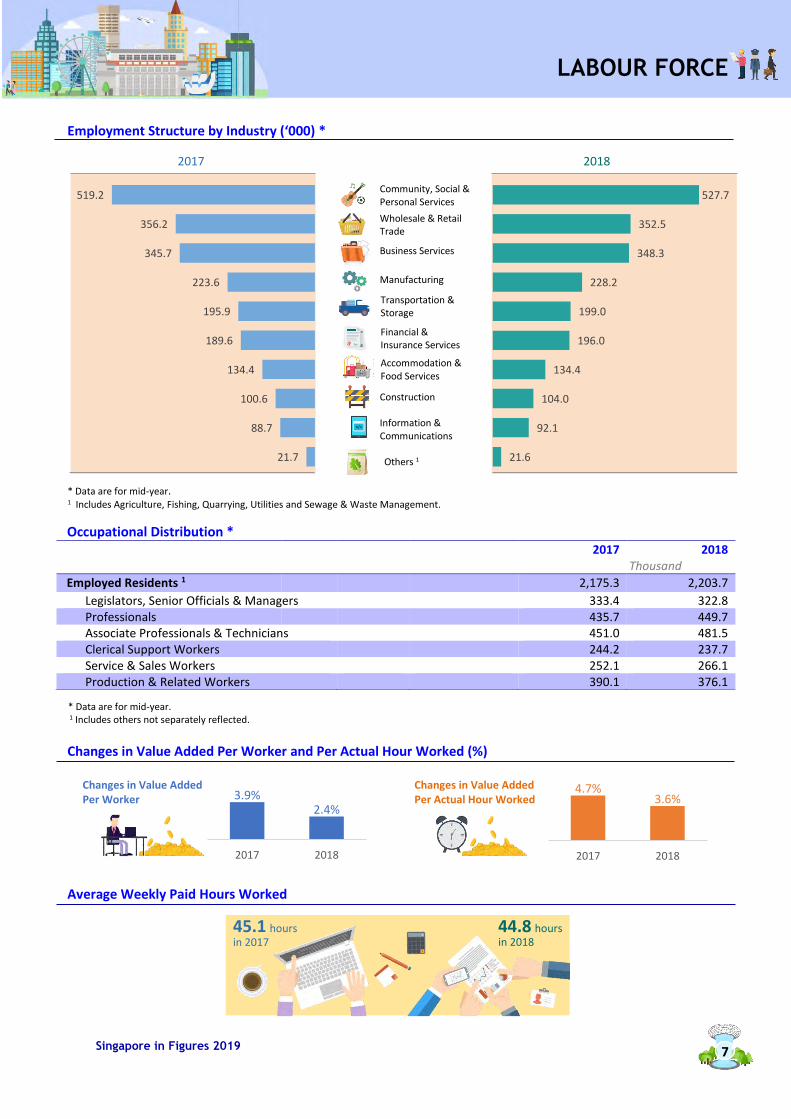
Employment Structure by Industry (‘000) *
* Data are for mid-year. 1 Includes Agriculture, Fishing, Quarrying, Utilities and Sewage & Waste Management.
Changes in Value Added Per Worker and Per Actual Hour Worked (%)
Average Weekly Paid Hours Worked
Occupational Distribution * 2017 2018
Thousand
Employed Residents 1 2,175.3 2,203.7
Legislators, Senior Officials & Managers 333.4 322.8 Professionals 435.7 449.7 Associate Professionals & Technicians 451.0 481.5 Clerical Support Workers 244.2 237.7 Service & Sales Workers 252.1 266.1 Production & Related Workers 390.1 376.1
* Data are for mid-year.1 Includes others not separately reflected.
Community, Social & Personal Services
Wholesale & Retail Trade
Business Services
Manufacturing
Transportation & Storage
Financial & Insurance Services
Accommodation & Food Services
Construction
Information & Communications
2018 2017
Others 1
Changes in Value Added Per Actual Hour Worked
Changes in Value Added Per Worker
LABOUR FORCE
7
7
3.9%2.4%
2017 2018
4.7%3.6%
2017 2018
45.1 hours in 2017
44.8 hours in 2018
519.2
356.2
345.7
223.6
195.9
189.6
134.4
100.6
88.7
21.7
527.7
352.5
348.3
228.2
199.0
196.0
134.4
104.0
92.1
21.6
Singapore in Figures 2019
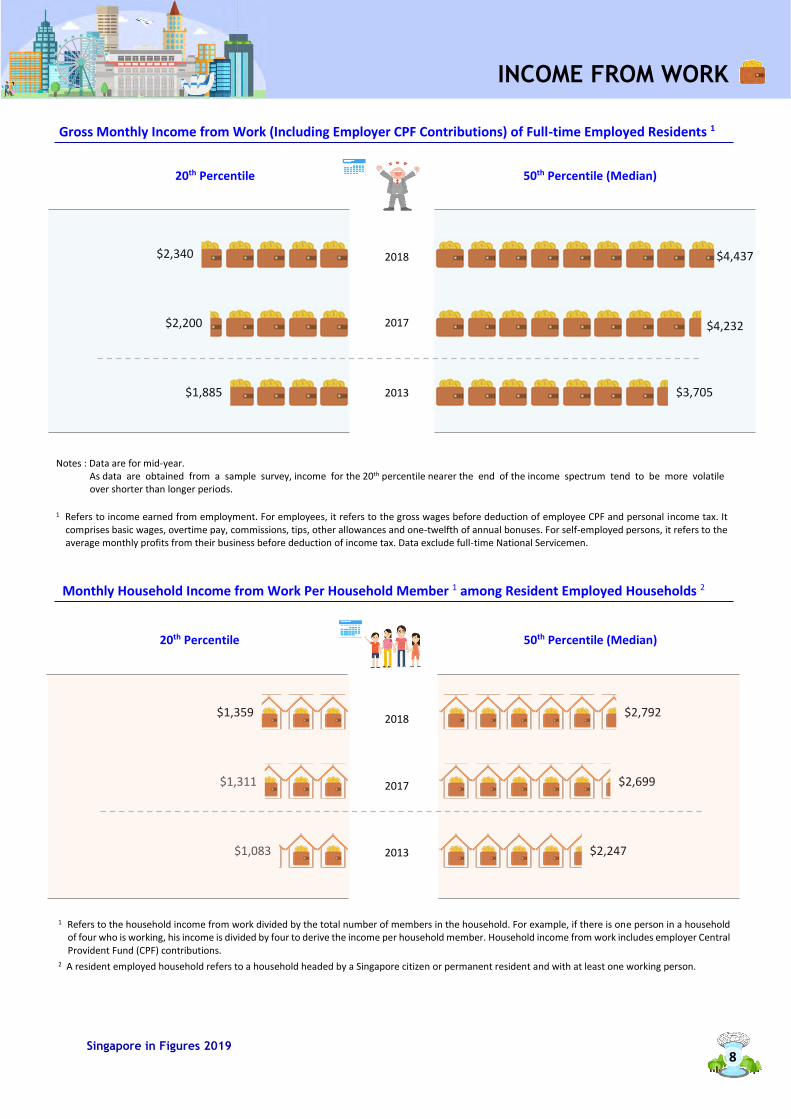
$1,083
$1,311
$1,359
$2,247
$2,699
$2,792
$3,705
$4,437
$4,232
$1,885
$2,200
$2,340
Gross Monthly Income from Work (Including Employer CPF Contributions) of Full-time Employed Residents 1
Monthly Household Income from Work Per Household Member 1 among Resident Employed Households 2
Notes : Data are for mid-year. As data are obtained from a sample survey, income for the 20th percentile nearer the end of the income spectrum tend to be more volatile 1over shorter than longer periods.
1 Refers to income earned from employment. For employees, it refers to the gross wages before deduction of employee CPF and personal income tax. It comprises basic wages, overtime pay, commissions, tips, other allowances and one-twelfth of annual bonuses. For self-employed persons, it refers to the average monthly profits from their business before deduction of income tax. Data exclude full-time National Servicemen.
1 Refers to the household income from work divided by the total number of members in the household. For example, if there is one person in a household of four who is working, his income is divided by four to derive the income per household member. Household income from work includes employer Central Provident Fund (CPF) contributions.
2 A resident employed household refers to a household headed by a Singapore citizen or permanent resident and with at least one working person.
2018
2017
2013
20th Percentile 50th Percentile (Median)
20th Percentile 50th Percentile (Median)
2018
2017
2013
INCOME FROM WORK
8
7
Singapore in Figures 2019
Gross Domestic Product Growth of Real GDP Share of Nominal GDP 2017 2018 2017 2018
Annual Percentage Change Percentage Share
Total 3.7 3.1 100.0 100.0
Goods Producing Industries 5.6 5.0 25.2 26.7
Manufacturing 10.4 7.0 20.1 22.0 Construction -11.5 -3.7 3.8 3.4
Services Producing Industries 2.8 2.9 70.8 69.6
Wholesale & Retail Trade 1.0 1.7 18.2 17.6
Transportation & Storage 4.4 1.3 7.1 6.7 Accommodation & Food Services 1.9 2.8 2.1 2.1
Information & Communications 5.2 5.4 4.1 4.1
Finance & Insurance 6.5 5.8 12.7 13.0
Business Services 0.8 2.8 15.1 14.9
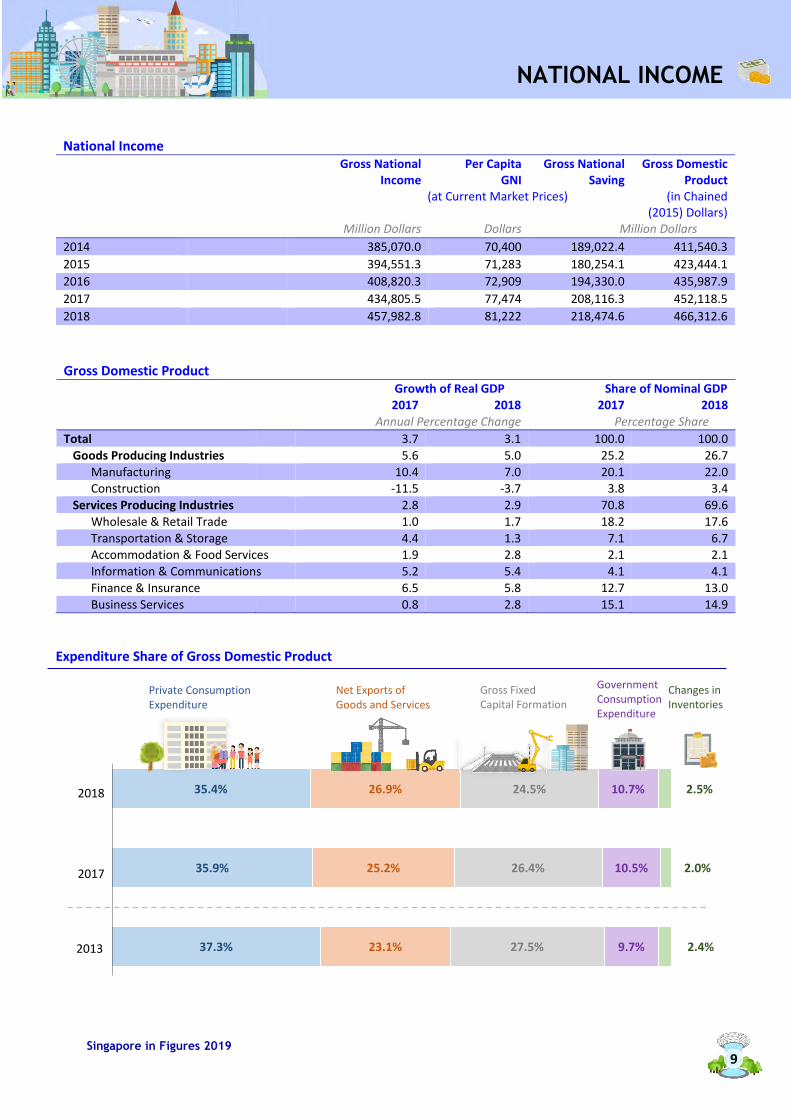
Expenditure Share of Gross Domestic Product
National Income
Gross National Income
Per Capita GNI
Gross National Saving
Gross Domestic Product
(at Current Market Prices) (in Chained (2015) Dollars)
Million Dollars Dollars Million Dollars
2014 385,070.0 70,400 189,022.4 411,540.3
2015 394,551.3 71,283 180,254.1 423,444.1
2016 408,820.3 72,909 194,330.0 435,987.9
2017 434,805.5 77,474 208,116.3 452,118.5
2018 457,982.8 81,222 218,474.6 466,312.6
37.3%
35.9%
35.4%
23.1%
25.2%
26.9%
27.5%
26.4%
24.5%
9.7%
10.5%
10.7%
2.4%
2.0%
2.5%
2013
2018
2017
8
8
NATIONAL INCOME
Private Consumption Expenditure
Government Consumption Expenditure
Net Exports of Goods and Services
Gross Fixed Capital Formation
Changes in Inventories
9
Singapore in Figures 2019
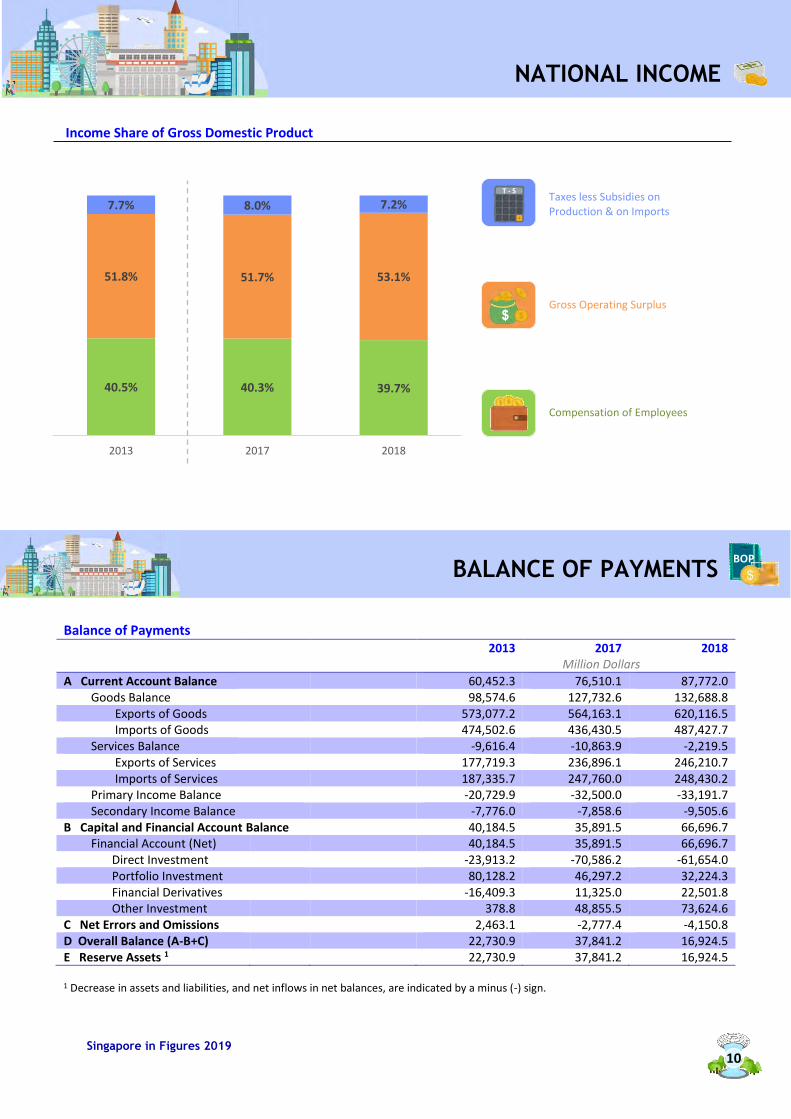
Income Share of Gross Domestic Product
Balance of Payments
2013 2017 2018 Million Dollars
A Current Account Balance 60,452.3 76,510.1 87,772.0 Goods Balance 98,574.6 127,732.6 132,688.8
Exports of Goods 573,077.2 564,163.1 620,116.5 Imports of Goods 474,502.6 436,430.5 487,427.7
Services Balance -9,616.4 -10,863.9 -2,219.5 Exports of Services 177,719.3 236,896.1 246,210.7 Imports of Services 187,335.7 247,760.0 248,430.2
Primary Income Balance -20,729.9 -32,500.0 -33,191.7 Secondary Income Balance -7,776.0 -7,858.6 -9,505.6B Capital and Financial Account Balance 40,184.5 35,891.5 66,696.7 Financial Account (Net)
40,184.5 35,891.5 66,696.7
Direct Investment -23,913.2 -70,586.2 -61,654.0 Portfolio Investment 80,128.2 46,297.2 32,224.3 Financial Derivatives -16,409.3 11,325.0 22,501.8 Other Investment 378.8 48,855.5 73,624.6
C Net Errors and Omissions 2,463.1 -2,777.4 -4,150.8D Overall Balance (A-B+C) 22,730.9 37,841.2 16,924.5E Reserve Assets 1 22,730.9 37,841.2 16,924.5
1 Decrease in assets and liabilities, and net inflows in net balances, are indicated by a minus (-) sign.
40.5% 40.3% 39.7%
51.8% 51.7% 53.1%
7.7% 8.0% 7.2%
2013 2017 2018
NATIONAL INCOME
BALANCE OF PAYMENTS
Taxes less Subsidies on Production & on Imports
T - S
Compensation of Employees
Gross Operating Surplus
BOP
10
7
Singapore in Figures 2019
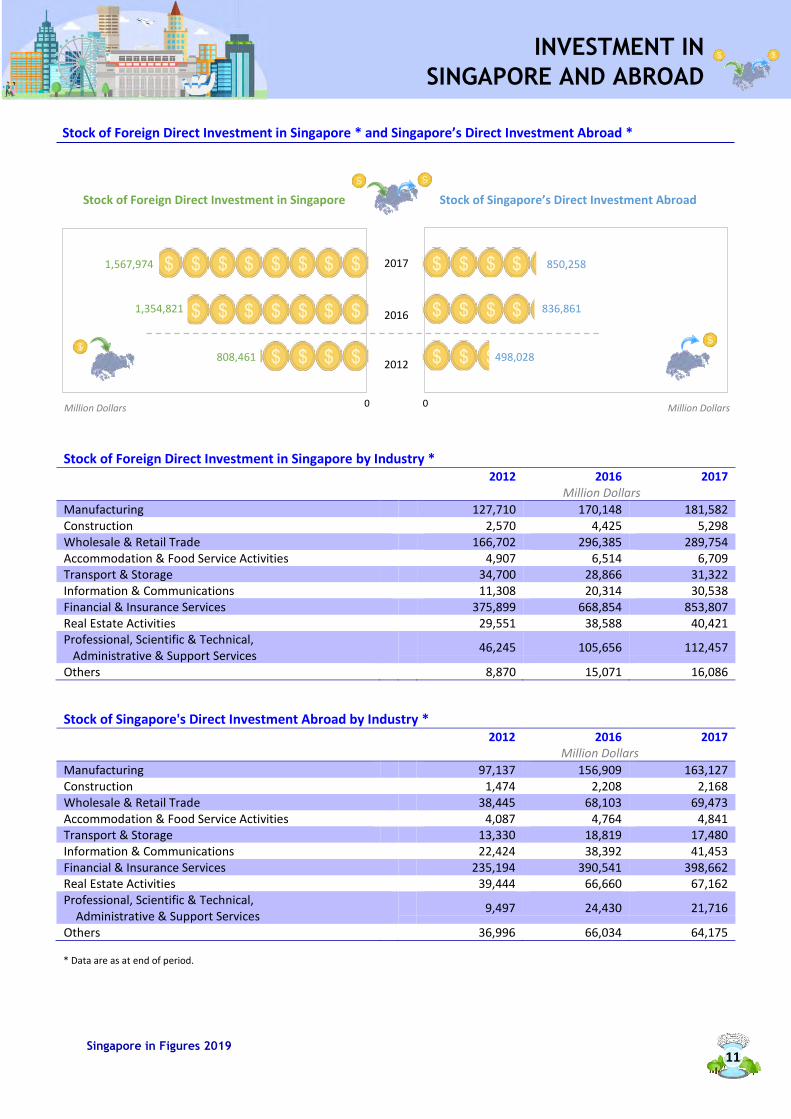
Stock of Foreign Direct Investment in Singapore * and Singapore’s Direct Investment Abroad *
Stock of Foreign Direct Investment in Singapore by Industry *
2012 2016 2017 Million Dollars
Manufacturing 127,710 170,148 181,582 Construction 2,570 4,425 5,298 Wholesale & Retail Trade 166,702 296,385 289,754 Accommodation & Food Service Activities 4,907 6,514 6,709 Transport & Storage 34,700 28,866 31,322 Information & Communications 11,308 20,314 30,538 Financial & Insurance Services 375,899 668,854 853,807 Real Estate Activities 29,551 38,588 40,421 Professional, Scientific & Technical, Administrative & Support Services
46,245 105,656 112,457
Others 8,870 15,071 16,086
Stock of Singapore's Direct Investment Abroad by Industry * 2012 2016 2017
Million Dollars
Manufacturing 97,137 156,909 163,127 Construction 1,474 2,208 2,168 Wholesale & Retail Trade 38,445 68,103 69,473 Accommodation & Food Service Activities 4,087 4,764 4,841 Transport & Storage 13,330 18,819 17,480 Information & Communications 22,424 38,392 41,453 Financial & Insurance Services 235,194 390,541 398,662 Real Estate Activities 39,444 66,660 67,162 Professional, Scientific & Technical, Administrative & Support Services
9,497 24,430 21,716
Others 36,996 66,034 64,175
* Data are as at end of period.
Stock of Foreign Direct Investment in Singapore Stock of Singapore’s Direct Investment Abroad
1,354,821
1,567,974
808,461
2017
2016
2012
0 0 Million Dollars Million Dollars
INVESTMENT IN
SINGAPORE AND ABROAD
836,861
850,258
498,028
11
7
Singapore in Figures 2019
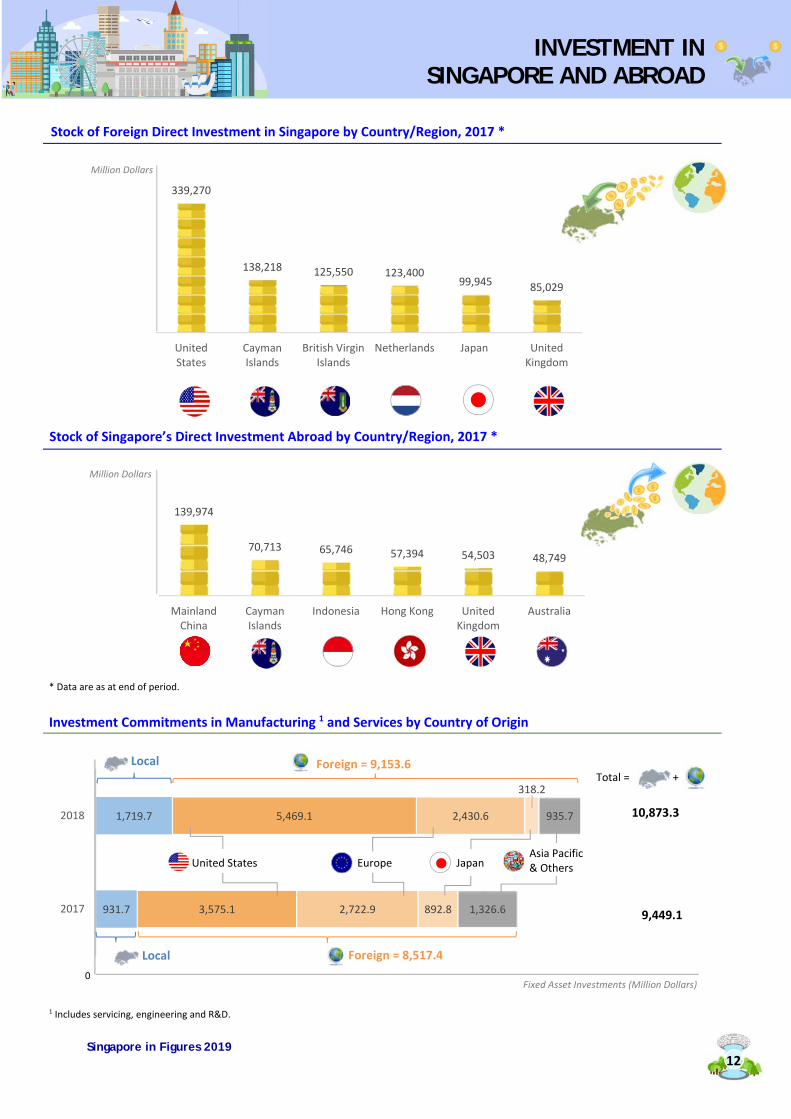
139,974
70,713 65,746 57,394 54,503 48,749
MainlandChina
CaymanIslands
Indonesia Hong Kong UnitedKingdom
Australia
Stock of Foreign Direct Investment in Singapore by Country/Region, 2017 *
Stock of Singapore’s Direct Investment Abroad by Country/Region, 2017 *
* Data are as at end of period.
Investment Commitments in Manufacturing 1 and Services by Country of Origin
1 Includes servicing, engineering and R&D.
Million Dollars
Million Dollars
INVESTMENT IN SINGAPORE AND ABROAD
12
339,270
138,218 125,550 123,40099,945 85,029
UnitedStates
CaymanIslands
British VirginIslands
Netherlands Japan UnitedKingdom
931.7
1,719.7
3,575.1
5,469.1
2,722.9
2,430.6
892.8
318.2
1,326.6
935.7
2017
2018
United States Europe Japan Asia Pacific & Others
Total = +
0 Fixed Asset Investments (Million Dollars)
Foreign = 9,153.6 Local
Foreign = 8,517.4 Local
10,873.3
9,449.1
Singapore in Figures 2019
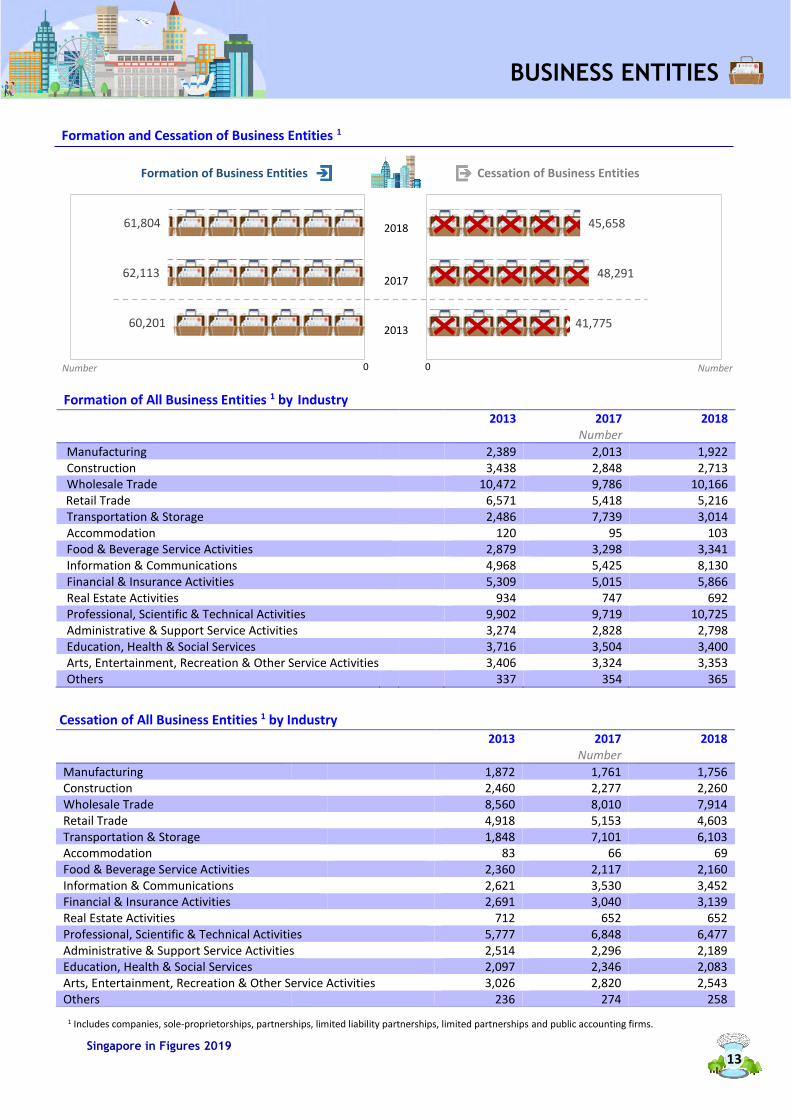
Formation and Cessation of Business Entities 1
Formation of All Business Entities 1 by Industry
2013 2017 2018 Number
Manufacturing 2,389 2,013 1,922 Construction 3,438 2,848 2,713 Wholesale Trade 10,472 9,786 10,166 Retail Trade 6,571 5,418 5,216 Transportation & Storage 2,486 7,739 3,014 Accommodation 120 95 103 Food & Beverage Service Activities 2,879 3,298 3,341 Information & Communications 4,968 5,425 8,130 Financial & Insurance Activities 5,309 5,015 5,866 Real Estate Activities 934 747 692 Professional, Scientific & Technical Activities 9,902 9,719 10,725 Administrative & Support Service Activities 3,274 2,828 2,798 Education, Health & Social Services 3,716 3,504 3,400 Arts, Entertainment, Recreation & Other Service Activities 3,406 3,324 3,353 Others 337 354 365
1 Includes companies, sole-proprietorships, partnerships, limited liability partnerships, limited partnerships and public accounting firms.
Cessation of All Business Entities 1 by Industry
2013 2017 2018 Number
Manufacturing 1,872 1,761 1,756 Construction 2,460 2,277 2,260 Wholesale Trade 8,560 8,010 7,914 Retail Trade 4,918 5,153 4,603 Transportation & Storage 1,848 7,101 6,103 Accommodation 83 66 69 Food & Beverage Service Activities 2,360 2,117 2,160 Information & Communications 2,621 3,530 3,452 Financial & Insurance Activities 2,691 3,040 3,139 Real Estate Activities 712 652 652 Professional, Scientific & Technical Activities 5,777 6,848 6,477 Administrative & Support Service Activities 2,514 2,296 2,189 Education, Health & Social Services 2,097 2,346 2,083 Arts, Entertainment, Recreation & Other Service Activities 3,026 2,820 2,543 Others
236 274 258
61,804
62,113
60,201
Formation of Business Entities Cessation of Business Entities
2018
2017
2013
0 0 Number Number
BUSINESS ENTITIES
45,658
48,291
41,775
13
7
Singapore in Figures 2019
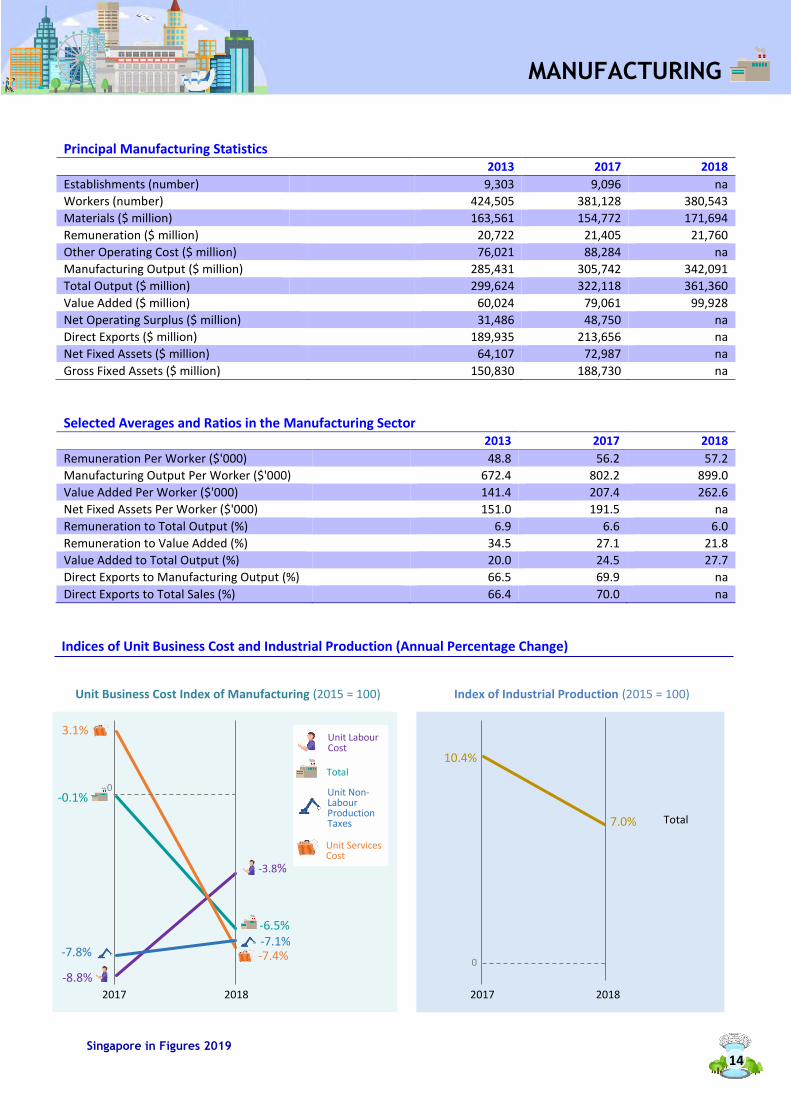
Principal Manufacturing Statistics 2013 2017 2018
Establishments (number) 9,303 9,096 na
Workers (number) 424,505 381,128 380,543
Materials ($ million) 163,561 154,772 171,694
Remuneration ($ million) 20,722 21,405 21,760
Other Operating Cost ($ million) 76,021 88,284 na
Manufacturing Output ($ million) 285,431 305,742 342,091
Total Output ($ million) 299,624 322,118 361,360
Value Added ($ million) 60,024 79,061 99,928
Net Operating Surplus ($ million) 31,486 48,750 na
Direct Exports ($ million) 189,935 213,656 na
Net Fixed Assets ($ million) 64,107 72,987 na
Gross Fixed Assets ($ million) 150,830 188,730 na
Selected Averages and Ratios in the Manufacturing Sector
2013 2017 2018
Remuneration Per Worker ($'000) 48.8 56.2 57.2
Manufacturing Output Per Worker ($'000) 672.4 802.2 899.0
Value Added Per Worker ($'000) 141.4 207.4 262.6
Net Fixed Assets Per Worker ($'000) 151.0 191.5 na
Remuneration to Total Output (%) 6.9 6.6 6.0
Remuneration to Value Added (%) 34.5 27.1 21.8
Value Added to Total Output (%) 20.0 24.5 27.7
Direct Exports to Manufacturing Output (%) 66.5 69.9 na
Direct Exports to Total Sales (%) 66.4 70.0 na
Indices of Unit Business Cost and Industrial Production (Annual Percentage Change)
-0.1%
-6.5%
-8.8%
-3.8%
3.1%
-7.4%-7.8%-7.1%
-10
-8
-6
-4
-2
0
2
4
10.4%
7.0%
0
2
4
6
8
10
12
Unit Business Cost Index of Manufacturing (2015 = 100)
2018
0
2017
Index of Industrial Production (2015 = 100)
0
2018 2017
Total
MANUFACTURING
Total
Unit Services Cost
Unit Non-Labour Production Taxes
Unit Labour Cost
14
7
Singapore in Figures 2019
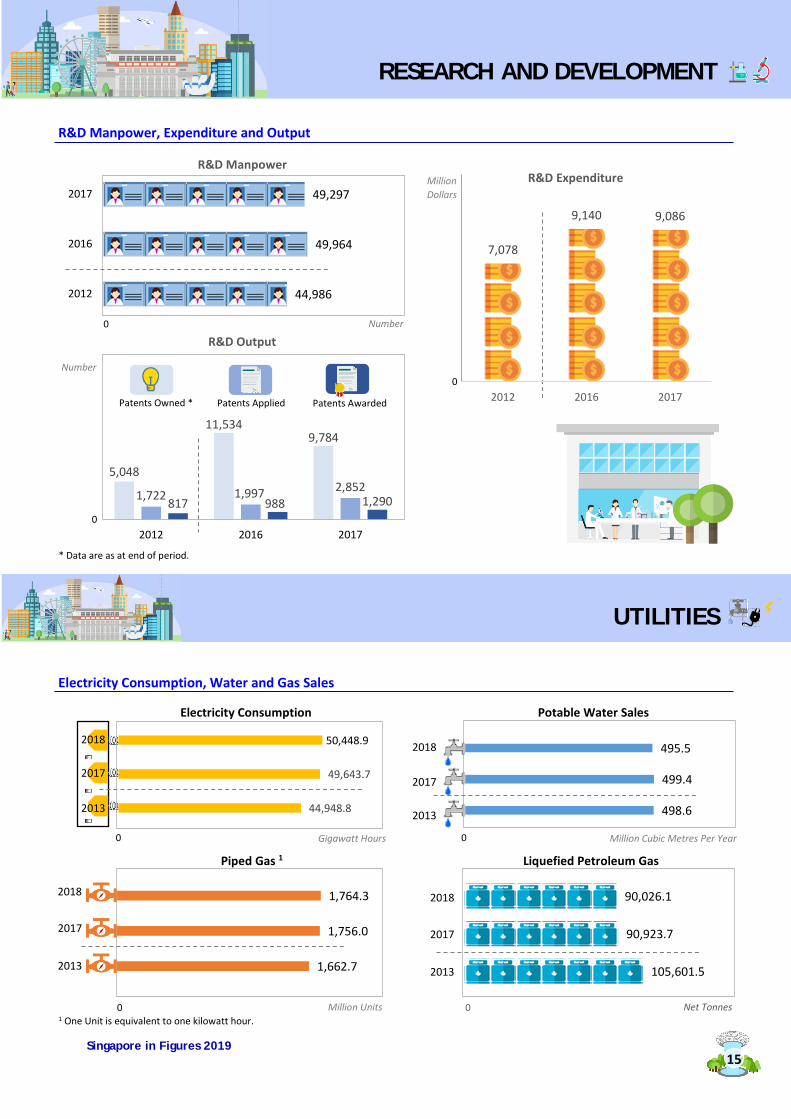
1,662.7
1,756.0
1,764.3
Piped Gas 1
0 Million Units
2017
2018
2013
2017
2018
2013
2017
2018
2013
R&D Manpower, Expenditure and Output
Electricity Consumption, Water and Gas Sales
5,048
11,5349,784
1,722 1,997 2,852817 988 1,290
2012 2016 2017
44,986
49,964
49,297
2012
2016
2017R&D Expenditure
0
Million Dollars
Electricity Consumption
0 Gigawatt Hours
R&D Manpower
0 Number
2018
2017
2013
Potable Water Sales
0 Million Cubic Metres Per Year
Liquefied Petroleum Gas
0 Net Tonnes 1 One Unit is equivalent to one kilowatt hour.
R&D Output
Number
Patents Awarded Patents Applied Patents Owned *
0
RESEARCH AND DEVELOPMENT
* Data are as at end of period.
UTILITIES
15
7,078
9,140 9,086
2012 2016 2017
44,948.8
49,643.7
498.6
499.4
495.5
105,601.5
90,923.7
90,026.1
50,448.9
Singapore in Figures 2019
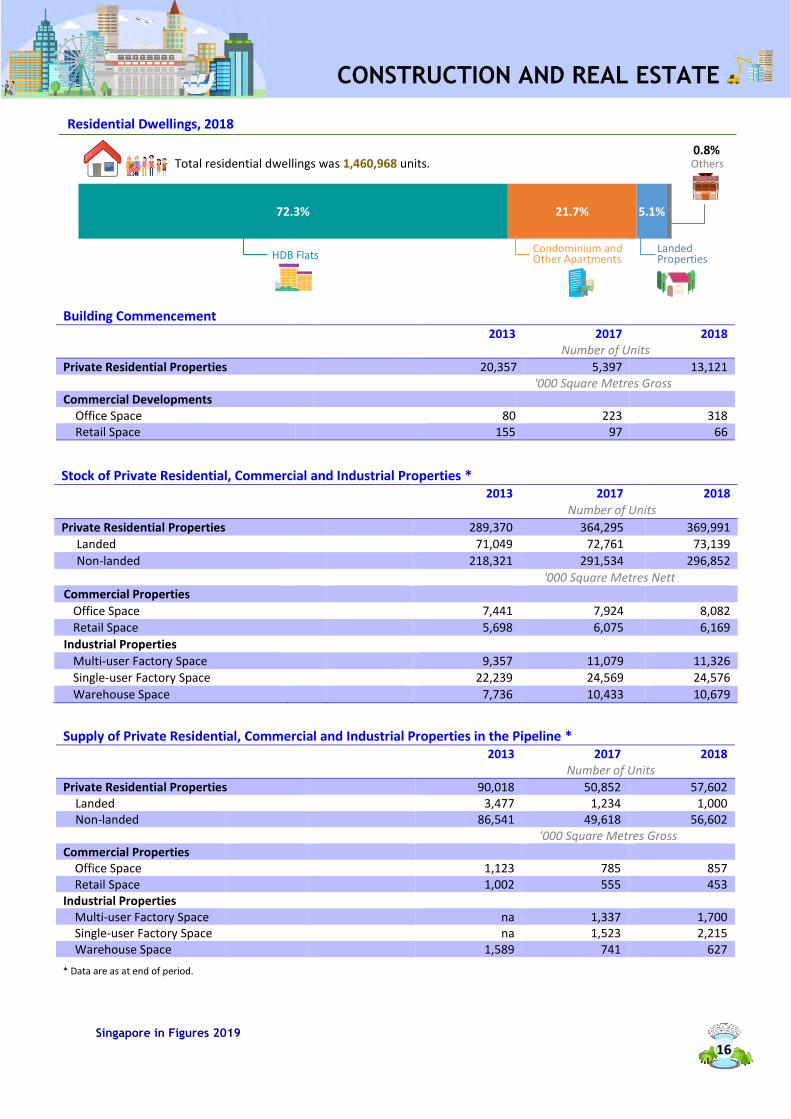
Residential Dwellings, 2018
Stock of Private Residential, Commercial and Industrial Properties * 2013 2017 2018
Number of Units
Private Residential Properties 289,370 364,295 369,991
Landed 71,049 72,761 73,139
Non-landed 218,321 291,534 296,852
'000 Square Metres Nett
Commercial Properties
Office Space 7,441 7,924 8,082
Retail Space 5,698 6,075 6,169
Industrial Properties
Multi-user Factory Space 9,357 11,079 11,326
Single-user Factory Space 22,239 24,569 24,576
Warehouse Space 7,736 10,433 10,679
* Data are as at end of period.
Building Commencement 2013 2017 2018
Number of Units
Private Residential Properties 20,357 5,397 13,121 '000 Square Metres Gross
Commercial Developments
Office Space 80 223 318 Retail Space 155 97 66
Supply of Private Residential, Commercial and Industrial Properties in the Pipeline * 2013 2017 2018
Number of Units
Private Residential Properties 90,018 50,852 57,602 Landed 3,477 1,234 1,000 Non-landed 86,541 49,618 56,602
'000 Square Metres Gross Commercial Properties
Office Space 1,123 785 857 Retail Space 1,002 555 453
Industrial Properties Multi-user Factory Space na 1,337 1,700 Single-user Factory Space na 1,523 2,215 Warehouse Space 1,589 741 627
72.3% 21.7% 5.1%
Landed Properties HDB Flats
Condominium and Other Apartments
Others Total residential dwellings was 1,460,968 units. 0.8%
CONSTRUCTION AND REAL ESTATE
16
7
Singapore in Figures 2019
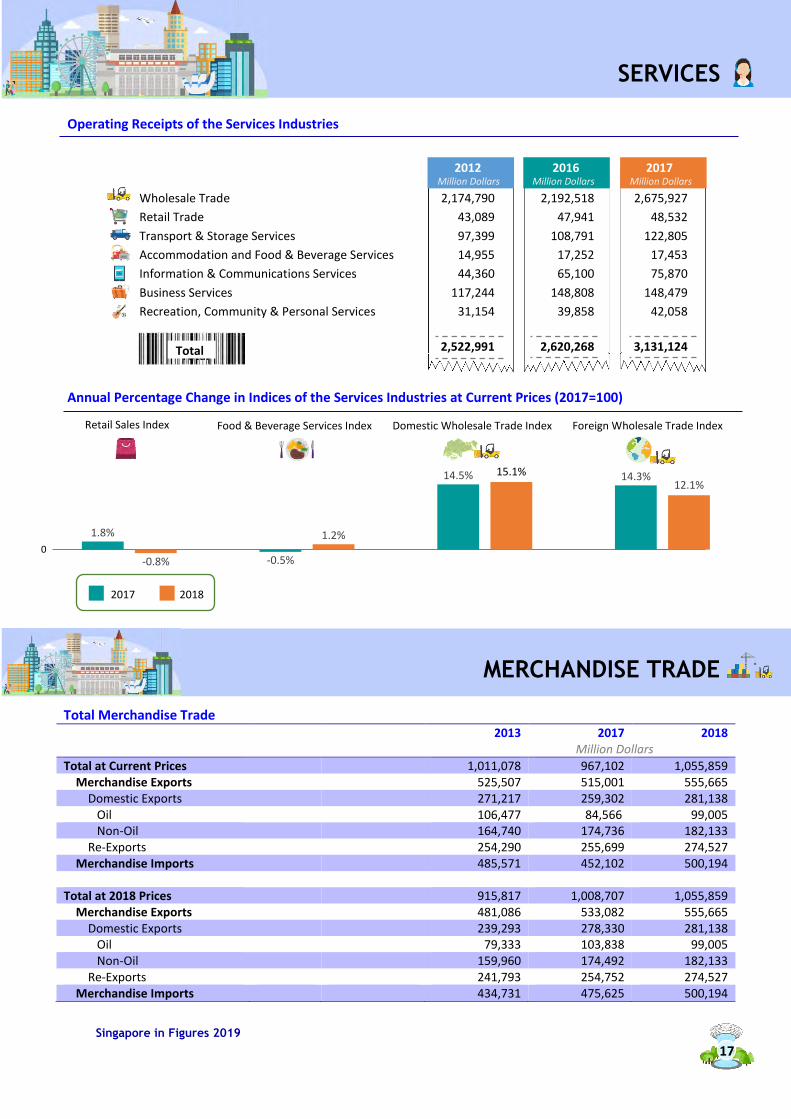
Total
Operating Receipts of the Services Industries
Annual Percentage Change in Indices of the Services Industries at Current Prices (2017=100)
Total Merchandise Trade 2013 2017 2018
Million Dollars
Total at Current Prices 1,011,078 967,102 1,055,859 Merchandise Exports 525,507 515,001 555,665 Domestic Exports 271,217 259,302 281,138
Oil 106,477 84,566 99,005 Non-Oil 164,740 174,736 182,133
Re-Exports 254,290 255,699 274,527 Merchandise Imports 485,571 452,102 500,194
Total at 2018 Prices 915,817 1,008,707 1,055,859 Merchandise Exports 481,086 533,082 555,665 Domestic Exports 239,293 278,330 281,138
Oil 79,333 103,838 99,005 Non-Oil 159,960 174,492 182,133
Re-Exports 241,793 254,752 274,527 Merchandise Imports 434,731 475,625 500,194
Wholesale Trade 2,174,790 2,192,518 2,675,927
Retail Trade 43,089 47,941 48,532
Transport & Storage Services 97,399 108,791 122,805
Accommodation and Food & Beverage Services 14,955 17,252 17,453
Information & Communications Services 44,360 65,100 75,870
Business Services 117,244 148,808 148,479
Recreation, Community & Personal Services 31,154 39,858 42,058
2,522,991 2,620,268 3,131,124
Retail Sales Index Food & Beverage Services Index
0
2016 2017 2012 Million Dollars Million Dollars Million Dollars
Total
2017 2018
SERVICES
MERCHANDISE TRADE
Domestic Wholesale Trade Index Foreign Wholesale Trade Index
17
7
1.8%
-0.5%
14.5% 14.3%
-0.8%
1.2%
12.1%15.1%
Singapore in Figures 2019
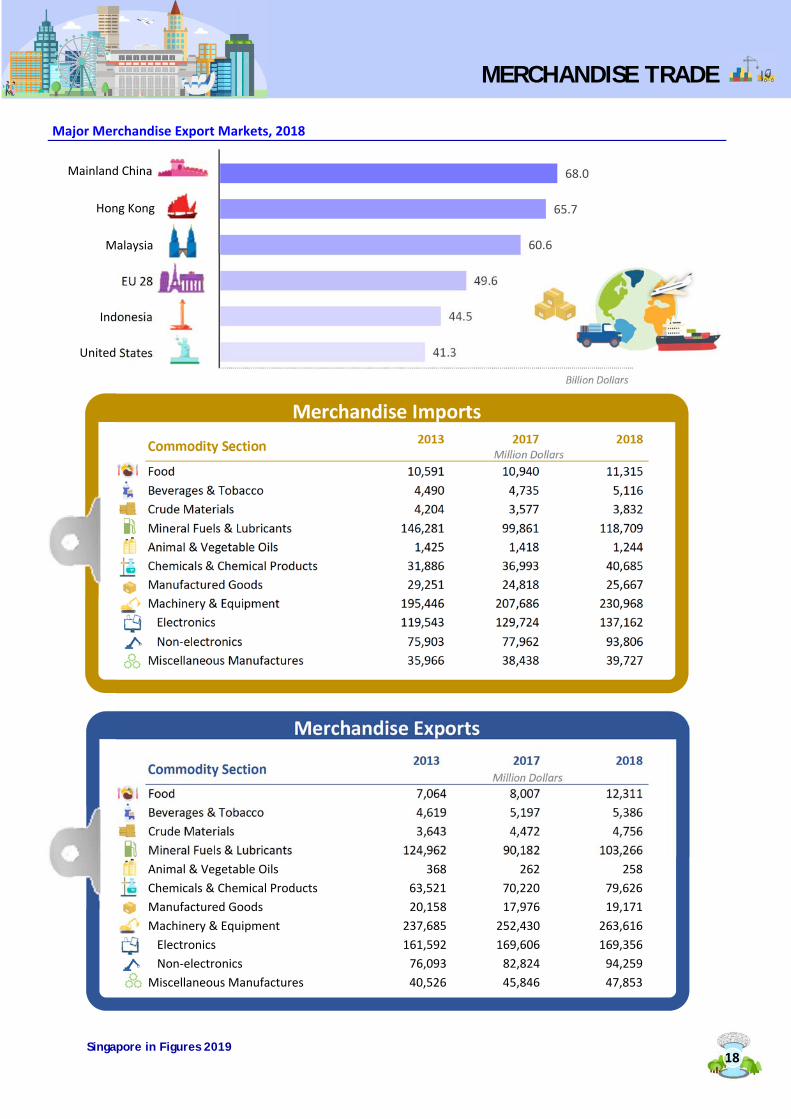
EU 28
Major Merchandise Export Markets, 2018
2013 2017 2018
Million Dollars
Food
10,591 10,940 11,315 Beverages & Tobacco
4,490 4,735 5,116
Crude Materials
4,204 3,577 3,832 Mineral Fuels & Lubricants
146,281 99,861 118,709
Animal & Vegetable Oils
1,425 1,418 1,244 Chemicals & Chemical Products 31,886 36,993 40,685 Manufactured Goods
29,251 24,818 25,667
Machinery & Equipment
195,446 207,686 230,968 Electronics
119,543 129,724 137,162
Non‐electronics
75,903 77,962 93,806 Miscellaneous Manufactures 35,966 38,438 39,727
2013
2017
2018
Million Dollars
Food
7,064 8,007 12,311 Beverages & Tobacco
4,619 5,197 5,386
Crude Materials
3,643 4,472 4,756 Mineral Fuels & Lubricants
124,962 90,182 103,266
Animal & Vegetable Oils
368 262 258 Chemicals & Chemical Products 63,521 70,220 79,626 Manufactured Goods
20,158 17,976 19,171
Machinery & Equipment
237,685 252,430 263,616 Electronics
161,592 169,606 169,356
Non‐electronics
76,093 82,824 94,259 Miscellaneous Manufactures 40,526 45,846 47,853
68.0
65.7
60.6
49.6
44.5
41.3
Mainland China
Hong Kong
Indonesia
United States
Billion Dollars
Malaysia
Merchandise Imports
Merchandise Exports
Commodity Section
MERCHANDISE TRADE
Commodity Section
18
Singapore in Figures 2019
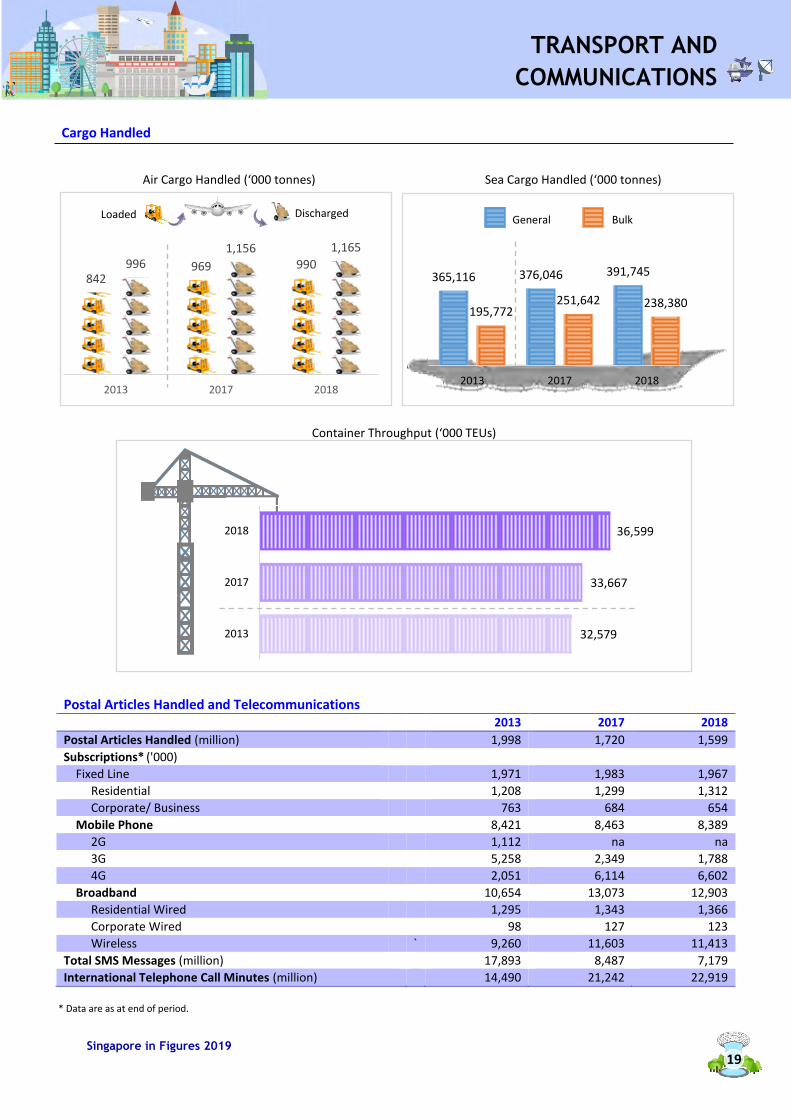
36,599
33,667
32,579
2018
2017
2013
Cargo Handled
Postal Articles Handled and Telecommunications
2013 2017 2018
Postal Articles Handled (million) 1,998 1,720 1,599
Subscriptions* ('000)
Fixed Line 1,971 1,983 1,967
Residential 1,208 1,299 1,312
Corporate/ Business 763 684 654
Mobile Phone 8,421 8,463 8,389
2G 1,112 na na
3G 5,258 2,349 1,788
4G 2,051 6,114 6,602
Broadband 10,654 13,073 12,903
Residential Wired 1,295 1,343 1,366
Corporate Wired 98 127 123
Wireless ` 9,260 11,603 11,413
Total SMS Messages (million) 17,893 8,487 7,179
International Telephone Call Minutes (million) 14,490 21,242 22,919
* Data are as at end of period.
842969 990996
1,156 1,165
2013 2017 2018
Air Cargo Handled (‘000 tonnes)
Loaded Discharged
Container Throughput (‘000 TEUs)
Sea Cargo Handled (‘000 tonnes)
General Bulk
TRANSPORT AND
COMMUNICATIONS
365,116 376,046 391,745
195,772251,642 238,380
2013 2017 2018
19
7
Singapore in Figures 2019
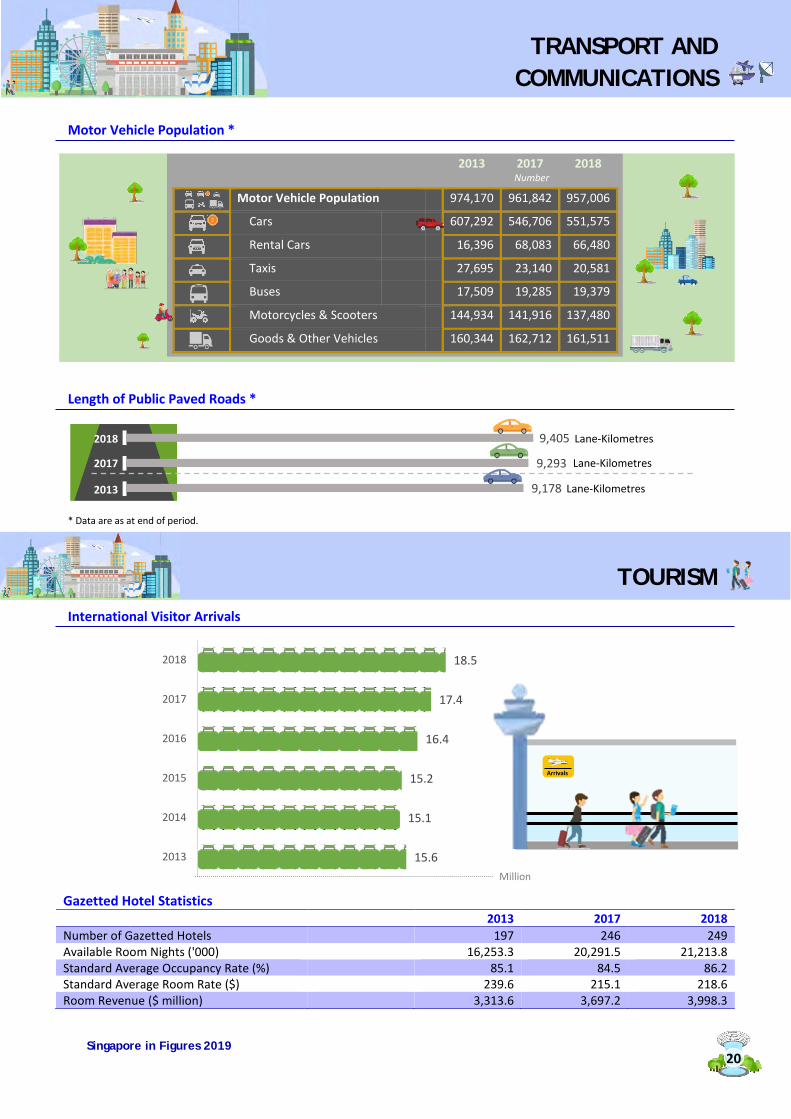
15.6
15.1
15.2
16.4
17.4
18.5
2013
2014
2015
2016
2017
2018
Motor Vehicle Population *
Length of Public Paved Roads *
;
* Data are as at end of period.
International Visitor Arrivals
2013 2017 2018 Number Motor Vehicle Population
974,170 961,842 957,006
Cars
607,292 546,706 551,575
Rental Cars
16,396 68,083 66,480
Taxis
27,695 23,140 20,581
Buses
17,509 19,285 19,379
Motorcycles & Scooters
144,934 141,916 137,480
Goods & Other Vehicles
160,344 162,712 161,511
Gazetted Hotel Statistics
2013 2017 2018 Number of Gazetted Hotels
197 246 249
Available Room Nights ('000)
16,253.3 20,291.5 21,213.8 Standard Average Occupancy Rate (%)
85.1 84.5 86.2
Standard Average Room Rate ($)
239.6 215.1 218.6 Room Revenue ($ million) 3,313.6 3,697.2 3,998.3
9,178
9,293
9,4052018
2017
2013 Lane-Kilometres
Lane-Kilometres
Million
Lane-Kilometres
TOURISM
TRANSPORT AND COMMUNICATIONS
20
Arrivals
Singapore in Figures 2019
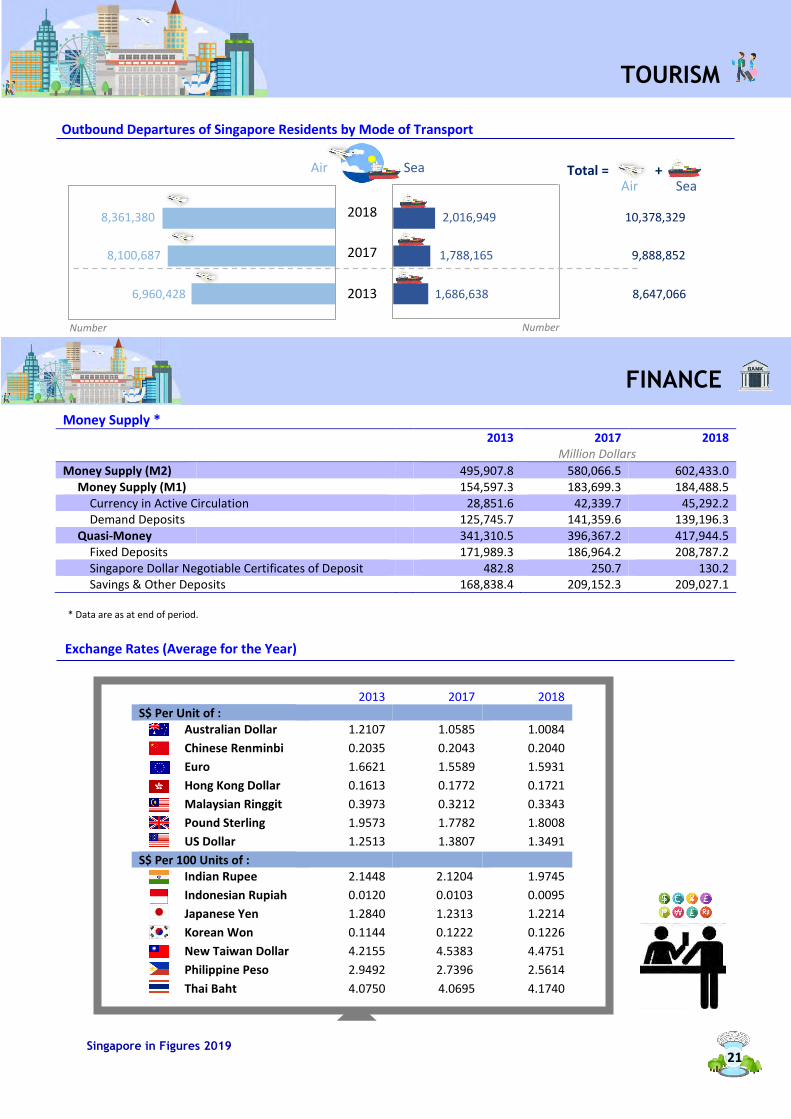
Outbound Departures of Singapore Residents by Mode of Transport
Money Supply *
2013 2017 2018 Million Dollars
Money Supply (M2) 495,907.8 580,066.5 602,433.0 Money Supply (M1) 154,597.3 183,699.3 184,488.5 Currency in Active Circulation 28,851.6 42,339.7 45,292.2 Demand Deposits 125,745.7 141,359.6 139,196.3 Quasi-Money 341,310.5 396,367.2 417,944.5 Fixed Deposits 171,989.3 186,964.2 208,787.2 Singapore Dollar Negotiable Certificates of Deposit 482.8 250.7 130.2 Savings & Other Deposits 168,838.4 209,152.3 209,027.1
* Data are as at end of period.
Exchange Rates (Average for the Year)
2013 2017 2018 S$ Per Unit of :
Australian Dollar 1.2107 1.0585 1.0084
Chinese Renminbi 0.2035 0.2043 0.2040
Euro 1.6621 1.5589 1.5931
Hong Kong Dollar 0.1613 0.1772 0.1721
Malaysian Ringgit 0.3973 0.3212 0.3343
Pound Sterling 1.9573 1.7782 1.8008
US Dollar 1.2513 1.3807 1.3491
S$ Per 100 Units of : Indian Rupee 2.1448 2.1204 1.9745
Indonesian Rupiah 0.0120 0.0103 0.0095
Japanese Yen 1.2840 1.2313 1.2214
Korean Won 0.1144 0.1222 0.1226
New Taiwan Dollar 4.2155 4.5383 4.4751
Philippine Peso 2.9492 2.7396 2.5614
Thai Baht 4.0750 4.0695 4.1740
2018
2017
2013
9,888,852
10,378,329
8,647,066
Total = +
Number
Air Sea
6,960,428
8,100,687
8,361,380
Number
Air Sea
TOURISM
FINANCE
21
1,788,165
2,016,949
1,686,638
Singapore in Figures 2019
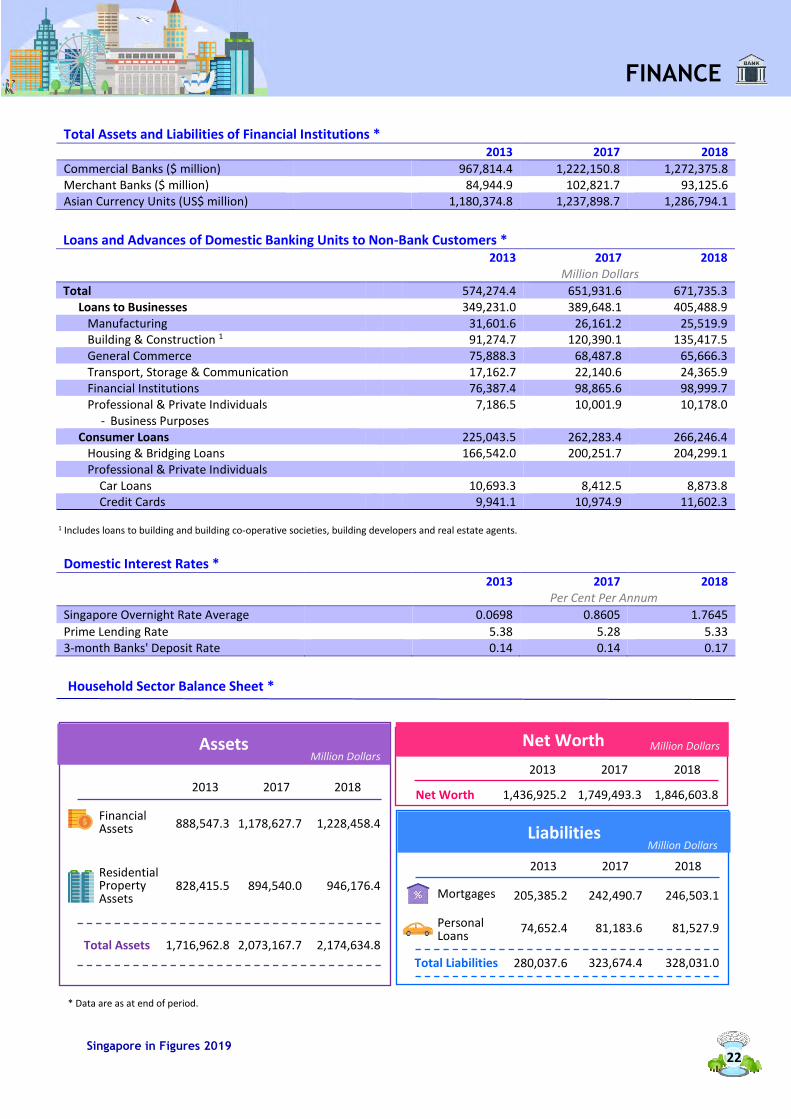
Total Assets and Liabilities of Financial Institutions * 2013 2017 2018
Commercial Banks ($ million) 967,814.4 1,222,150.8 1,272,375.8 Merchant Banks ($ million) 84,944.9 102,821.7 93,125.6 Asian Currency Units (US$ million) 1,180,374.8 1,237,898.7 1,286,794.1
1 Includes loans to building and building co-operative societies, building developers and real estate agents.
Domestic Interest Rates *
2013 2017 2018 Per Cent Per Annum
Singapore Overnight Rate Average 0.0698 0.8605 1.7645
Prime Lending Rate 5.38 5.28 5.33 3-month Banks' Deposit Rate 0.14 0.14 0.17
Household Sector Balance Sheet *
* Data are as at end of period.
Loans and Advances of Domestic Banking Units to Non-Bank Customers * 2013 2017 2018
Million Dollars
Total 574,274.4 651,931.6 671,735.3 Loans to Businesses 349,231.0 389,648.1 405,488.9 Manufacturing 31,601.6 26,161.2 25,519.9 Building & Construction 1 91,274.7 120,390.1 135,417.5 General Commerce 75,888.3 68,487.8 65,666.3 Transport, Storage & Communication 17,162.7 22,140.6 24,365.9 Financial Institutions 76,387.4 98,865.6 98,999.7 Professional & Private Individuals 7,186.5 10,001.9 10,178.0
- Business Purposes Consumer Loans 225,043.5 262,283.4 266,246.4 Housing & Bridging Loans 166,542.0 200,251.7 204,299.1 Professional & Private Individuals
Car Loans 10,693.3 8,412.5 8,873.8 Credit Cards 9,941.1 10,974.9 11,602.3
Assets
Financial Assets
Residential Property Assets
Million Dollars
Total Assets
2013 2017 2018
888,547.3 1,178,627.7 1,228,458.4
828,415.5 894,540.0 946,176.4
1,716,962.8 2,073,167.7 2,174,634.8
Liabilities Million Dollars
Mortgages
Personal Loans
Total Liabilities
2013 2017 2018
205,385.2 242,490.7 246,503.1
74,652.4 81,183.6 81,527.9
280,037.6 323,674.4 328,031.0
Net Worth Million Dollars
Net Worth 1,436,925.2 1,749,493.3 1,846,603.8
2013 2017 2018
FINANCE
22
Singapore in Figures 2019
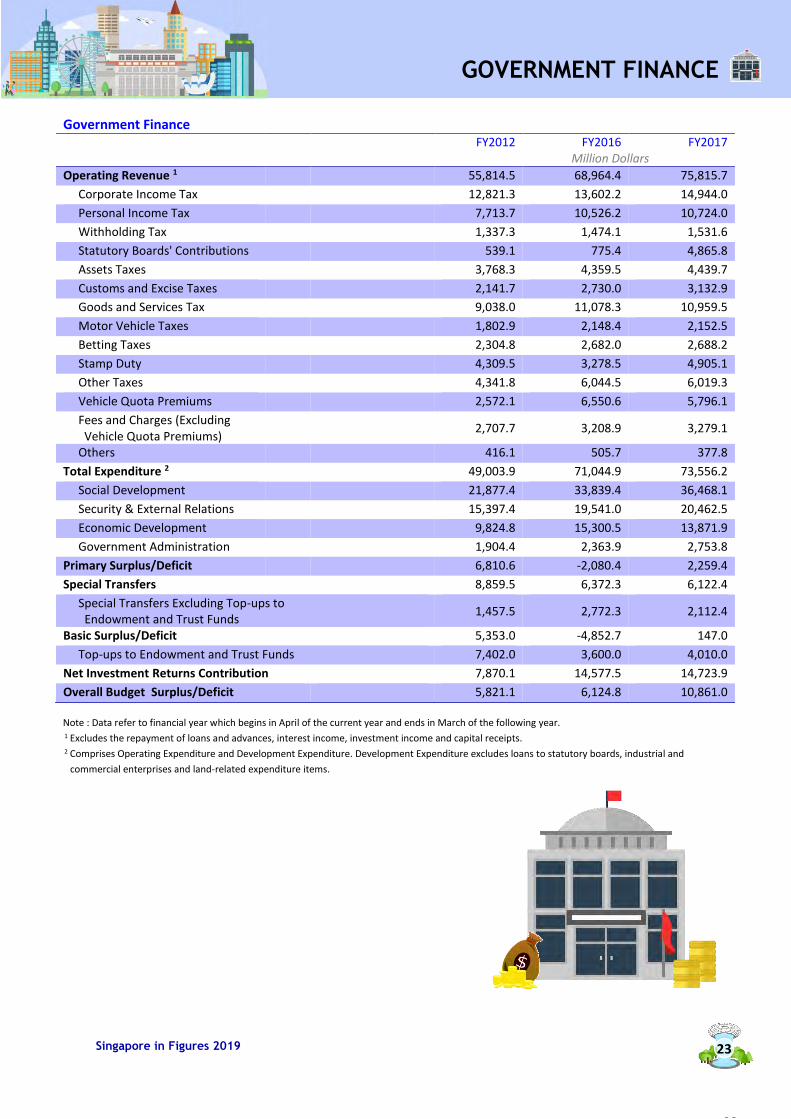
Note : Data refer to financial year which begins in April of the current year and ends in March of the following year. 1 Excludes the repayment of loans and advances, interest income, investment income and capital receipts. 2 Comprises Operating Expenditure and Development Expenditure. Development Expenditure excludes loans to statutory boards, industrial and
commercial enterprises and land-related expenditure items.
Government Finance FY2012 FY2016 FY2017
Million Dollars
Operating Revenue 1 55,814.5 68,964.4 75,815.7
Corporate Income Tax 12,821.3 13,602.2 14,944.0
Personal Income Tax 7,713.7 10,526.2 10,724.0
Withholding Tax 1,337.3 1,474.1 1,531.6
Statutory Boards' Contributions 539.1 775.4 4,865.8
Assets Taxes 3,768.3 4,359.5 4,439.7
Customs and Excise Taxes 2,141.7 2,730.0 3,132.9
Goods and Services Tax 9,038.0 11,078.3 10,959.5
Motor Vehicle Taxes 1,802.9 2,148.4 2,152.5
Betting Taxes 2,304.8 2,682.0 2,688.2
Stamp Duty 4,309.5 3,278.5 4,905.1
Other Taxes 4,341.8 6,044.5 6,019.3
Vehicle Quota Premiums 2,572.1 6,550.6 5,796.1
Fees and Charges (Excluding Vehicle Quota Premiums)
2,707.7 3,208.9 3,279.1
Others 416.1 505.7 377.8
Total Expenditure 2 49,003.9 71,044.9 73,556.2
Social Development 21,877.4 33,839.4 36,468.1
Security & External Relations 15,397.4 19,541.0 20,462.5
Economic Development 9,824.8 15,300.5 13,871.9
Government Administration 1,904.4 2,363.9 2,753.8
Primary Surplus/Deficit 6,810.6 -2,080.4 2,259.4
Special Transfers 8,859.5 6,372.3 6,122.4
Special Transfers Excluding Top-ups to Endowment and Trust Funds
1,457.5 2,772.3 2,112.4
Basic Surplus/Deficit 5,353.0 -4,852.7 147.0
Top-ups to Endowment and Trust Funds 7,402.0 3,600.0 4,010.0
Net Investment Returns Contribution 7,870.1 14,577.5 14,723.9
Overall Budget Surplus/Deficit 5,821.1 6,124.8 10,861.0
GOVERNMENT FINANCE
23
23
Singapore in Figures 2019
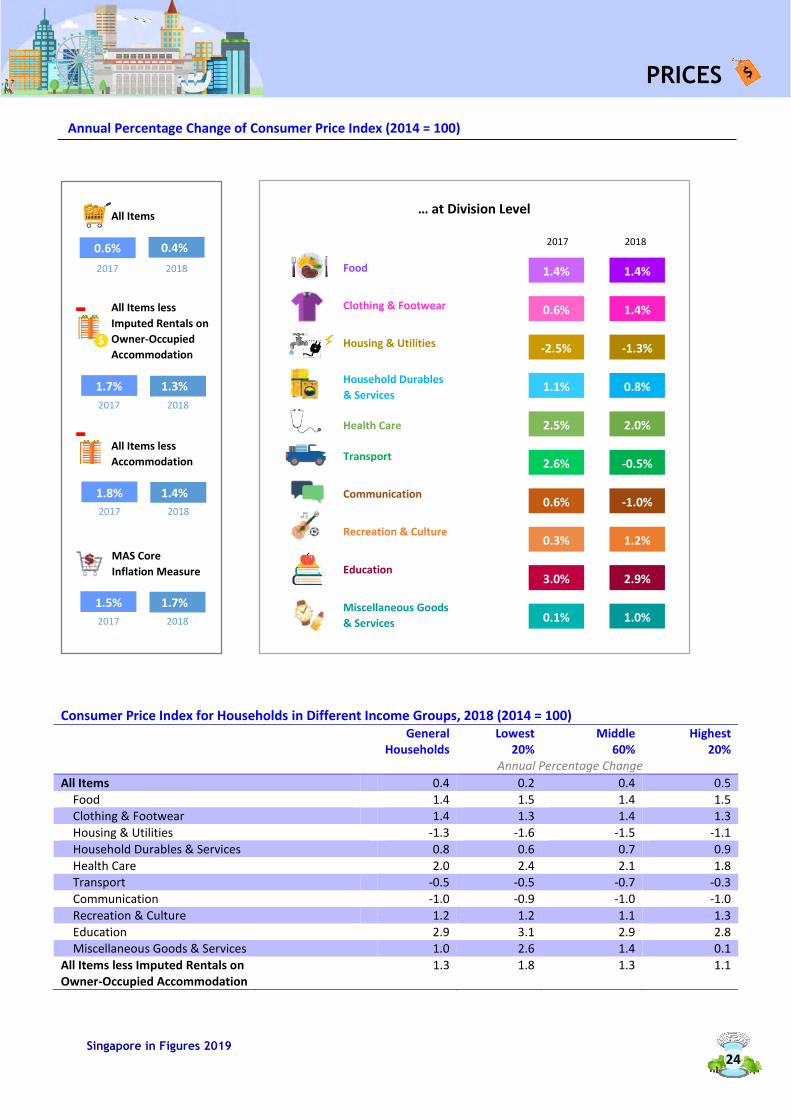
Annual Percentage Change of Consumer Price Index (2014 = 100)
Consumer Price Index for Households in Different Income Groups, 2018 (2014 = 100)
General Households
Lowest 20%
Middle 60%
Highest 20%
Annual Percentage Change
All Items 0.4 0.2 0.4 0.5
Food 1.4 1.5 1.4 1.5 Clothing & Footwear 1.4 1.3 1.4 1.3
Housing & Utilities -1.3 -1.6 -1.5 -1.1
Household Durables & Services 0.8 0.6 0.7 0.9
Health Care 2.0 2.4 2.1 1.8 Transport -0.5 -0.5 -0.7 -0.3
Communication -1.0 -0.9 -1.0 -1.0
Recreation & Culture 1.2 1.2 1.1 1.3
Education 2.9 3.1 2.9 2.8 Miscellaneous Goods & Services 1.0 2.6 1.4 0.1
All Items less Imputed Rentals on Owner-Occupied Accommodation
1.3 1.8 1.3 1.1
… at Division Level
Education
Recreation & Culture
Health Care
Food
Household Durables
& Services
Miscellaneous Goods
& Services
Clothing & Footwear
Communication
Transport
Housing & Utilities
All Items less
Accommodation
MAS Core
Inflation Measure
Measure
All Items
0.6%
2017 2018
1.7% 1.3%
2017 2018
1.8% 1.4%
2017 2018
1.5% 1.7%
All Items less
Imputed Rentals on
Owner-Occupied
Accommodation
2017 2018
0.4%
PRICES
24
2017
1.4%
0.6%
-2.5%
1.1%
2.5%
2.6%
0.6%
0.3%
3.0%
0.1%
2018
1.4%
1.4%
-1.3%
0.8%
2.0%
-0.5%
-1.0%
1.2%
2.9%
1.0%
-
-
Singapore in Figures 2019
Internet Subscription/ Access
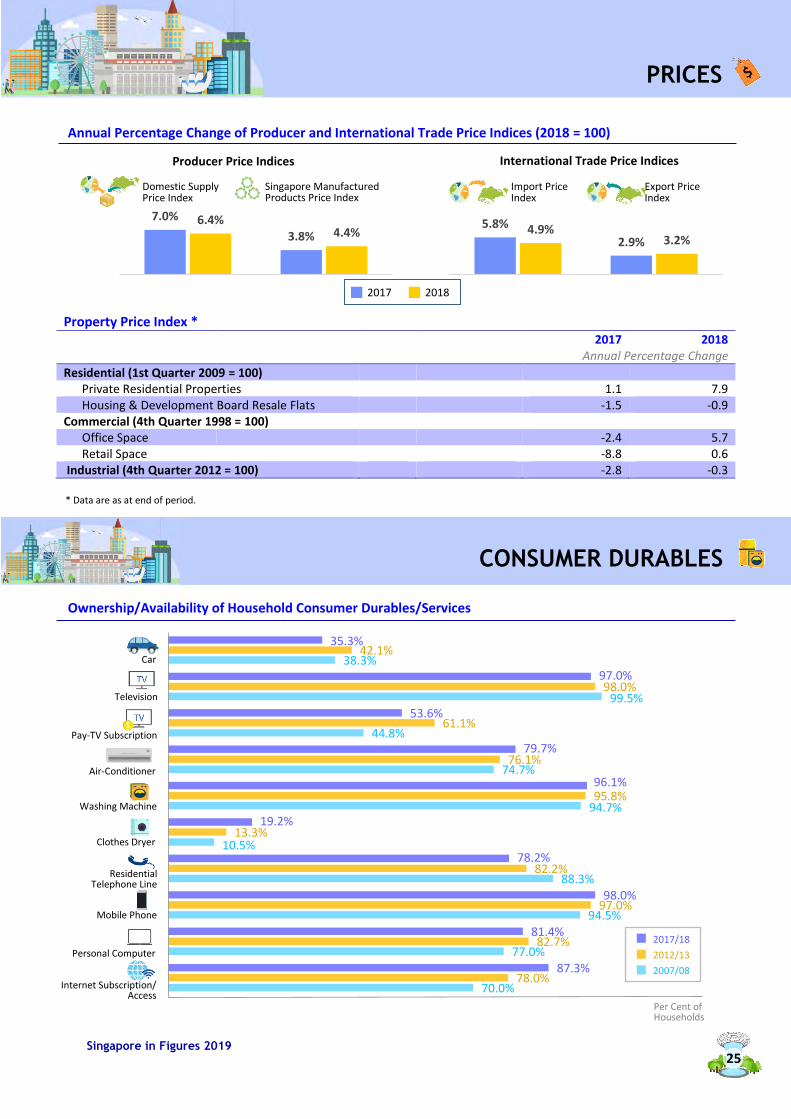
35.3%
97.0%
53.6%
79.7%
96.1%
19.2%
78.2%
98.0%
81.4%
87.3%
42.1%
98.0%
61.1%
76.1%
95.8%
13.3%
82.2%
97.0%
82.7%
78.0%
38.3%
99.5%
44.8%
74.7%
94.7%
10.5%
88.3%
94.5%
77.0%
70.0%
Annual Percentage Change of Producer and International Trade Price Indices (2018 = 100)
Property Price Index *
2017 2018 Annual Percentage Change
Residential (1st Quarter 2009 = 100)
Private Residential Properties
1.1 7.9 Housing & Development Board Resale Flats
-1.5 -0.9
Commercial (4th Quarter 1998 = 100)
Office Space
-2.4 5.7 Retail Space
-8.8 0.6
Industrial (4th Quarter 2012 = 100) -2.8 -0.3
* Data are as at end of period.
Ownership/Availability of Household Consumer Durables/Services
International Trade Price Indices
Export Price Index
Import Price Index
Domestic Supply Price Index
Singapore Manufactured Products Price Index
Producer Price Indices
2017 2018
Car
Pay-TV Subscription
Washing Machine
Air-Conditioner
Residential Telephone Line
Mobile Phone
Personal Computer
Per Cent of Households
PRICES
CONSUMER DURABLES
Television
7.0%
3.8%6.4%
4.4%5.8%
2.9%4.9%
3.2%
2017/18
2012/13
2007/08
25
Clothes Dryer
Singapore in Figures 2019
Total Males Females
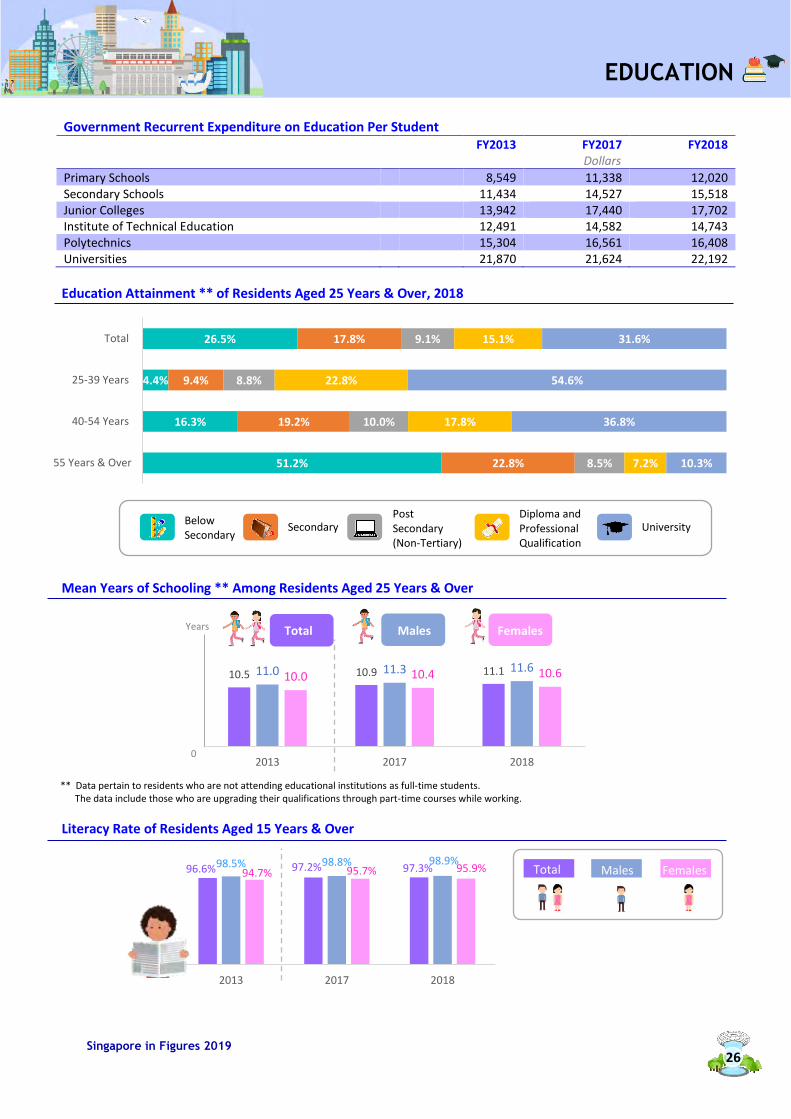
Government Recurrent Expenditure on Education Per Student FY2013 FY2017 FY2018
Dollars
Primary Schools 8,549 11,338 12,020 Secondary Schools 11,434 14,527 15,518 Junior Colleges 13,942 17,440 17,702 Institute of Technical Education 12,491 14,582 14,743 Polytechnics 15,304 16,561 16,408 Universities 21,870 21,624 22,192
Education Attainment ** of Residents Aged 25 Years & Over, 2018
Mean Years of Schooling ** Among Residents Aged 25 Years & Over
** Data pertain to residents who are not attending educational institutions as full-time students. The data include those who are upgrading their qualifications through part-time courses while working.
Literacy Rate of Residents Aged 15 Years & Over
26.5%
4.4%
16.3%
51.2%
17.8%
9.4%
19.2%
22.8%
9.1%
8.8%
10.0%
8.5%
15.1%
22.8%
17.8%
7.2%
31.6%
54.6%
36.8%
10.3%
Total
25-39 Years
40-54 Years
55 Years & Over
96.6% 97.2% 97.3%98.5% 98.8% 98.9%94.7% 95.7% 95.9%
2013 2017 2018
Years
10.5 10.9 11.111.0 11.3 11.610.0 10.4 10.6
2013 2017 2018
Below Secondary
Secondary Post Secondary (Non-Tertiary)
Diploma and Professional Qualification
University
0
Males Females Total
EDUCATION
26
Singapore in Figures 2019
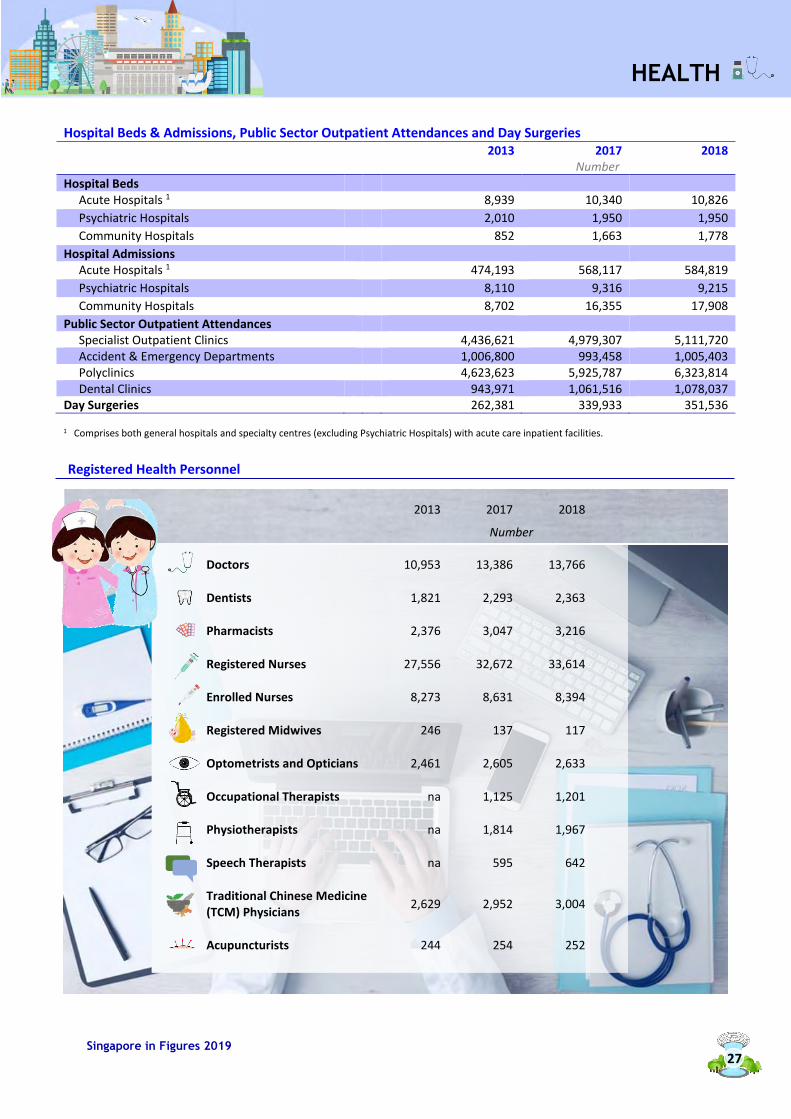
Hospital Beds & Admissions, Public Sector Outpatient Attendances and Day Surgeries 2013 2017 2018
Number
Hospital Beds Acute Hospitals 1 8,939 10,340 10,826
Psychiatric Hospitals 2,010 1,950 1,950
Community Hospitals 852 1,663 1,778
Hospital Admissions Acute Hospitals 1 474,193 568,117 584,819
Psychiatric Hospitals 8,110 9,316 9,215
Community Hospitals 8,702 16,355 17,908
Public Sector Outpatient Attendances Specialist Outpatient Clinics 4,436,621 4,979,307 5,111,720 Accident & Emergency Departments 1,006,800 993,458 1,005,403 Polyclinics 4,623,623 5,925,787 6,323,814 Dental Clinics 943,971 1,061,516 1,078,037 Day Surgeries 262,381 339,933 351,536
1 Comprises both general hospitals and specialty centres (excluding Psychiatric Hospitals) with acute care inpatient facilities.
Registered Health Personnel
2013 2017 2018
Number
Doctors 10,953 13,386 13,766
Dentists 1,821 2,293 2,363
Pharmacists 2,376 3,047 3,216
Registered Nurses 27,556 32,672 33,614
Enrolled Nurses 8,273 8,631 8,394
Registered Midwives 246 137 117
Optometrists and Opticians 2,461 2,605 2,633
Occupational Therapists na 1,125 1,201
Physiotherapists na 1,814 1,967
Speech Therapists na 595 642
Traditional Chinese Medicine (TCM) Physicians
2,629 2,952 3,004
Acupuncturists 244 254 252
HEALTH
27
Singapore in Figures 2019
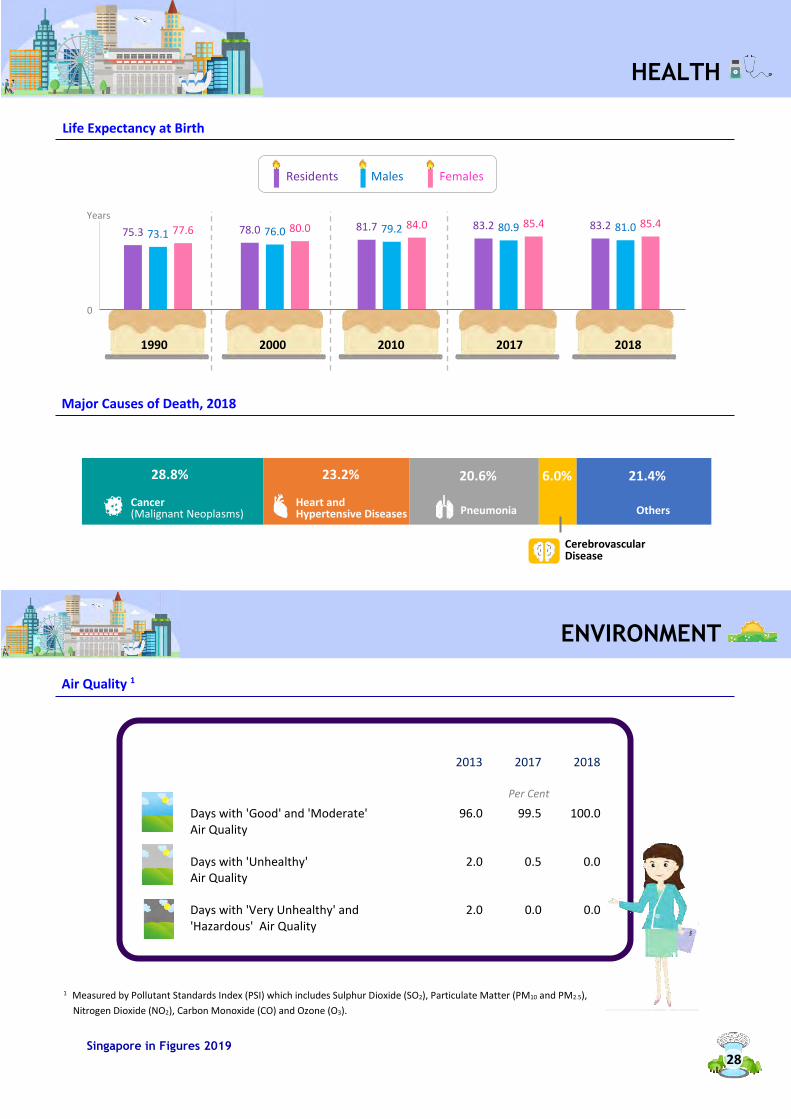
Life Expectancy at Birth
Major Causes of Death, 2018
Air Quality 1
1 Measured by Pollutant Standards Index (PSI) which includes Sulphur Dioxide (SO2), Particulate Matter (PM10 and PM2.5),
Nitrogen Dioxide (NO2), Carbon Monoxide (CO) and Ozone (O3).
2013 2017 2018
Per Cent
Days with 'Good' and 'Moderate' Air Quality
96.0 99.5 100.0
Days with 'Unhealthy' Air Quality
2.0 0.5 0.0
Days with 'Very Unhealthy' and 'Hazardous' Air Quality
2.0 0.0 0.0
28.8% 23.2% 20.6% 6.0% 21.4%
75.3 78.0 81.7 83.2 83.273.1 76.0 79.2 80.9 81.077.6 80.0 84.0 85.4 85.4
Years
0
1990 2000 2010 2017 2018
HEALTH
ENVIRONMENT
Residents Males Females
Cancer (Malignant Neoplasms)
Heart and Hypertensive Diseases Pneumonia Others
Cerebrovascular Disease
28
Singapore in Figures 2019
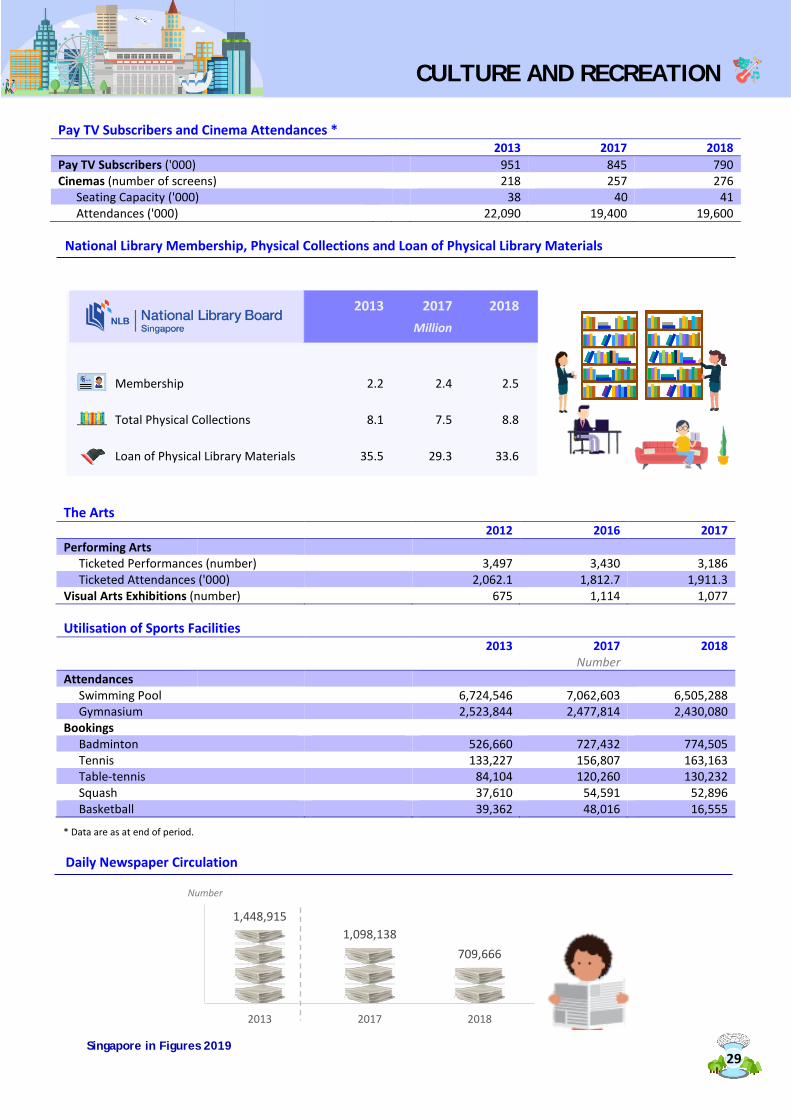
1,448,9151,098,138
709,666
2013 2017 2018
Pay TV Subscribers and Cinema Attendances * 2013 2017 2018
Pay TV Subscribers ('000) 951 845 790 Cinemas (number of screens) 218 257 276 Seating Capacity ('000) 38 40 41 Attendances ('000) 22,090 19,400 19,600
National Library Membership, Physical Collections and Loan of Physical Library Materials
The Arts 2012 2016 2017
Performing Arts Ticketed Performances (number) 3,497 3,430 3,186 Ticketed Attendances ('000) 2,062.1 1,812.7 1,911.3 Visual Arts Exhibitions (number) 675 1,114 1,077
Utilisation of Sports Facilities 2013 2017
Number 2018
Attendances Swimming Pool 6,724,546 7,062,603 6,505,288 Gymnasium 2,523,844 2,477,814 2,430,080 Bookings Badminton 526,660 727,432 774,505 Tennis 133,227 156,807 163,163 Table-tennis 84,104 120,260 130,232 Squash 37,610 54,591 52,896 Basketball 39,362 48,016 16,555
* Data are as at end of period.
Daily Newspaper Circulation
2013 2017 2018 Million
Membership 2.2 2.4 2.5
Total Physical Collections 8.1 7.5 8.8
Loan of Physical Library Materials 35.5 29.3 33.6
Number
CULTURE AND RECREATION
29
Singapore in Figures 2019
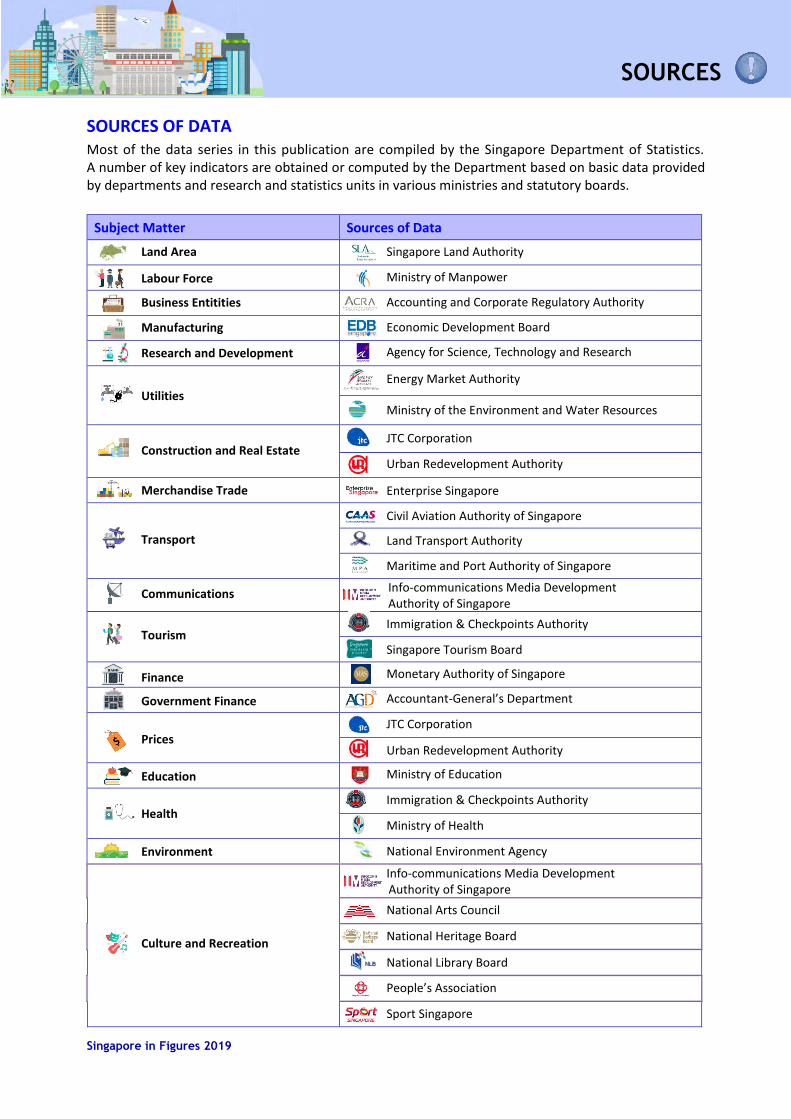
SOURCES OF DATA Most of the data series in this publication are compiled by the Singapore Department of Statistics. A number of key indicators are obtained or computed by the Department based on basic data provided by departments and research and statistics units in various ministries and statutory boards.
Subject Matter Sources of Data
Land Area Singapore Land Authority
Labour Force Ministry of Manpower
Business Entitities Accounting and Corporate Regulatory Authority
Manufacturing Economic Development Board
Research and Development Agency for Science, Technology and Research
Utilities
Energy Market Authority
Ministry of the Environment and Water Resources
Construction and Real Estate JTC Corporation
Urban Redevelopment Authority
Merchandise Trade Enterprise Singapore
Transport
Civil Aviation Authority of Singapore
Land Transport Authority
Maritime and Port Authority of Singapore
Communications Info-communications Media Development Authority of Singapore
Tourism Immigration & Checkpoints Authority
Singapore Tourism Board
Finance Monetary Authority of Singapore
Government Finance Accountant-General’s Department
Prices JTC Corporation
Urban Redevelopment Authority
Education Ministry of Education
Health Immigration & Checkpoints Authority
Ministry of Health
Environment National Environment Agency
Culture and Recreation
Info-communications Media Development Authority of Singapore
National Arts Council
National Heritage Board
National Library Board
People’s Association
Sport Singapore
SOURCES
Singapore in Figures 2019
Notes and Notation
Figures may not add up to the totals due to rounding. Some figures, particularly those for the most recent time periods, are provisional and may be subject to revision.
na not available - nil or negligible$ Singapore Dollars (unless otherwise stated)
Free Access to More Data
Explore Singapore’s economic and socio-demographic data trends with the SingStat Table Builder at www.singstat.gov.sg/tablebuilder.
Create customised data tables, export them in different file formats and download multiple tables at one go. APIs in JSON and CSV formats are available for ease of data retrieval. Customise the API response to your requirement with the Developer API.
Electronic Services
Download the SingStat Mobile App and have the latest key Singapore and ASEAN statistics on the go. Choose to receive notifications on updates of preferred indicators, download tables or share charts via social media, perform computation for quick analyses and bookmark indicators for quick access. More information is available at www.singstat.gov.sg/our-services-and-tools/singstat-mobile-app.
Subscribe to SingStat Express and receive email and SMS alerts (for local users) on the latest press releases of your choice. Details are available at www.singstat.gov.sg/whats-new/sign-up-for-alerts.
Really Simple Syndication (RSS) feeds on statistical news! More information is available
at www.singstat.gov.sg/whats-new/really-simple-syndication-rss.
Data