Embed Size (px)
Citation preview

ARTICLE
Skewed X Chromosome Inactivation andTrisomic Spontaneous Abortion: No Association
Dorothy Warburton,1,2,9,* Jennie Kline,3,4,7,9 Ann Kinney,4,6 Chih-yu Yu,1 Bruce Levin,5
and Stephen Brown8
Several studies suggest that highly skewed X chromosome inactivation (HSXI) is associated with recurrent spontaneous abortion. We
hypothesized that this association reflects an increased rate of trisomic conceptions due to anomalies on the X chromosome that
lead both to HSXI and to a diminished oocyte pool. We compared the distribution of X chromosome inactivation (XCI) skewing percent-
ages (range: 50%–100%) among women with spontaneous abortions in four karyotype groups—trisomy (n ¼ 154), chromosomally
normal male (n ¼ 43), chromosomally normal female (n ¼ 38), nontrisomic chromosomally abnormal (n ¼ 61)—to the distribution
for age-matched controls with chromosomally normal births (n ¼ 388). In secondary analyses, we subdivided the nontrisomic chromo-
somally abnormal group, divided trisomies by chromosome, and classified women by reproductive history. Our data support neither an
association of HSXI with all trisomies nor an association of HSXI with chromosomally normal male spontaneous abortions. We also find
no association between HSXI and recurrent abortion (n ¼ 45).
Introduction
X chromosome inactivation (XCI), the process by which
one of the two X chromosomes of a female embryo
undergoes transcriptional silencing, occurs early in
embryogenesis. This process occurs in all cells except the
female germ cell; both X chromosomes are active in the
oocyte. The inactive X chromosome undergoes histone de-
acetylation and demethylation, followed by DNA methyl-
ation, which is inherited by all descendant cells. In theory,
50% of cells will contain an active X chromosome of
maternal origin, 50% one of paternal origin. However,
because the number of progenitor cells for hematopoietic
stem cells is small (estimates are 8–16),1–4 highly skewed
XCI (HSXI) (usually defined as 90% or higher) may occur
by chance. The probability (based on a simple binomial
model) that a woman will, by chance alone, demonstrate
HSXI in a blood sample falls between 0.01% and 2.1%, de-
pending on the number of progenitor cells.
Rarely, familial skewing involves mutations in XIST or
other loci that affect initial XCI.5 A second source of
HSXI is initial inactivation that occurs in an unusually
small pool of cells. This phenomenon is thought to explain
the association between monozygotic twinning and man-
ifesting carriers of X-linked recessive mutations,6,7 as well
as the high rate of HSXI in fetuses with confined placental
mosaicism and trisomy rescue.8
Most often, HSXI is thought to result from selection in
a population of cells in which inactivation was initially
random;9 the degree of selection can vary among tissue
types.10–13 Several lines of evidence support this hypothesis:
(1) the proportion of cells with HSXI is greater in women of
reproductive age than in newborns1,10 and, among adults,
The Amer
greater after age 60 than during the reproductive years;13,14
(2) heterozygous carriers of X-linked diseases sometimes
exhibit preferential inactivation of the X chromosome
with the disease allele (e.g., Wengler et al.,15 Devriendt
et al.16); (3) HSXI is increased in women with structurally
abnormal X chromosomes (deletions or translocations)
in a manner that preserves the normal X chromosome (or
autosomal) dosage.17,18 Pegoraro et al.19 described a striking
example: a family with many apparently healthy women
with 100% skewing, ascertained through the presence of
manifesting carriers of an X-linked condition. The authors
identified an Xq microdeletion and inversion in all family
members with skewing.20 The only phenotypic conse-
quence identified was increased risk of miscarriage.
This family stimulated the hypothesis that HSXI might
be increased among women with recurrent spontaneous
abortion (RSA). Several subsequent reports confirmed the
prediction. Thus, early reports from Pittsburgh,21–23 British
Columbia,24,25 and Japan26 show odds ratios ranging from
1.83 to infinity26 (our computations) for HSXI (defined
as R 90%) in relation to RSA. Although the highest esti-
mates23,26 probably reflect confounding by maternal age,
most other estimates do not. All reports compare cases
with recurrent loss, variously defined, to controls; most
control groups comprise women with at least one birth
and no pregnancy loss. Inferences are limited, however,
by methodological concerns, such as inclusion of previ-
ously described cases in sequential reports and selection
of controls from a population different than the popula-
tion in which cases were identified.22–25,27 In series in
which controls derive from different sources and time
periods than cases, technical variables in the assay can con-
tribute to case-control differences. Six later reports,27–32
1Department of Genetics and Development, 2Department of Pediatrics, 3Gertrude H. Sergievsky Center, 4Department of Epidemiology, 5Department of
Biostatistics, 6Graduate School of Arts and Sciences, Columbia University, New York, NY 10032, USA; 7New York State Psychiatric Institute, New York,
NY 10032, USA; 8Department of Obstetrics, Gynecology and Reproductive Science, The University of Vermont, Burlington, VT 05401, USA9These authors contributed equally to this work
*Correspondence: [email protected]
DOI 10.1016/j.ajhg.2009.07.002. ª2009 by The American Society of Human Genetics. All rights reserved.
ican Journal of Human Genetics 85, 179–193, August 14, 2009 179

including one from the Pittsburgh team,27 which includes
cases described in earlier reports, provide inconsistent
results, with odds ratios ranging from 0.230 to 13.2.28
The literature as a whole is difficult to interpret, given
the probable publication bias for positive associations.
Most previous studies lack information on the karyotype
of the abortus. Women with recurrent abortions have an
increased risk of repeat chromosomally normal losses.
This observation, however, is most apparent in women
younger than 35 years. Among older women, because of
the strong association of age with trisomy, chromosomal
anomalies occur in at least 50% of losses, even among
women with two or more previous losses.33,34 Given that
maternal age at conception has been increasing over
time in the United States,35 we expect that, in many
settings, trisomies occur in a high proportion of losses to
recurrent aborters. For example, in our sample, the index
loss is trisomic in 44% of the 50 women with recurrent los-
ses (mean age 35.6 years). Thus, a phenomenon due to an
increased rate of trisomic conceptions could masquerade as
an effect seen in recurrent aborters.
Lanasa et al.23 argued that HSXI is likely to be a marker of
an X chromosome microdeletion or mutation that leads to
loss of male conceptions carrying the mutant X chromo-
some. However, their study had no information on the
karyotype of the losses. In current populations, karyotypi-
cally normal male conceptions constitute only 15%–20%
of spontaneous abortions.36,37 It is therefore unlikely that
losses of male conceptions could be responsible for the
strong associations with skewing reported in early studies.
For example, in order to double the rate of HSXI among all
spontaneous abortions, the frequency of HSXI would need
to be six-fold higher among normal male losses than
among all other pregnancies. This calculation makes the
assumptions that (1) HSXI occurs in 5% of women, (2)
15% of clinically recognized pregnancies abort spontane-
ously, (3) 20% of pregnancy losses have a normal male
karyotype, and (4) all chromosomally normal male losses
are due to an X chromosome abnormality (unlikely, but
the assumption most favorable to the hypothesis).
On the other hand, trisomies account for one-third to
one-half of all pregnancy losses. If a calculation similar to
the one above is used, the frequency of HSXI would need
to be 3.5-fold higher among women with trisomic losses
than among all other pregnancies in order to double the
rate of HSXI among spontaneous abortions. Our study
has the power to distinguish these effect sizes.
Oocyte maintenance in the ovary depends upon the
presence of two normal X chromosomes. In female germ
cells, both X chromosomes remain transcriptionally
active. The absence of all or part of an X chromosome is
associated with primary amenorrhea or premature ovarian
failure. Associations may reflect either fewer primordial
follicles or accelerated atresia. A likely explanation is that
at least several discrete genes must be expressed from
both X chromosomes to ensure normal germ cell and/or
follicle survival (reviewed by Simpson and Rajkovic38 and
180 The American Journal of Human Genetics 85, 179–193, August
by Laml et al.39). HSXI may thus be an indicator of X chro-
mosome mutations or chromosome abnormalities that
could lead to a decreased oocyte pool. Two studies40,41
support this idea, one study41 showing an association
between HSXI and premature ovarian failure.
We hypothesized that the maternal age association with
trisomy reflects an association with the size of the oocyte
pool, leading to increased trisomy risk among women
who have diminished pools for their chronologic age.42,43
If HSXI is associated with a smaller oocyte pool (see above),
the association of HSXI with repeat spontaneous abortions
could be due to an increase in the frequency of trisomic
conceptions. Preliminary data from British Columbia24,44
reported such an association. We tested the hypothesis in
a case-control study by examining whether HSXI is associ-
ated with trisomic spontaneous abortion. Secondarily, we
examined associations between HSXI and both chromoso-
mally normal male spontaneous abortion and recurrent
pregnancy loss.
Subjects and Methods
Details of selection of cases and controls, demographics, and
statistical methods are given in the Appendix. Fieldwork took
place from February 2003 to January 2007. The institutional
review boards at our university and the study hospital approved
the study. All subjects gave informed consent.
Selection of Cases and ControlsCase subjects were women aged 18 or older with singleton sponta-
neous abortions of developmental age< 18 wks, who gave permis-
sion for karyotyping of their products of conception. The speci-
mens were collected from the pathology laboratory of a large
suburban hospital in New Jersey, USA. Karyotype results were
obtained from 498/517 (96%) specimens in which culture was
attempted, by either chromosome analysis or FISH (see Appendix).
Of the 498 women, 354 (71%) completed the protocol, which
included two telephone interviews concerning demographics,
obstetric history, medical history, and common exposures and
a visit to the hospital for a blood draw and an updated interview.
Final analyses exclude 30 women (see Appendix). The analytical
sample consists of 169 women with aneuploid losses (referred to
as ‘‘trisomic’’ but also including four hypertriploids, one hyperte-
traploid, and six autosomal monosomies), 46 women with normal
male losses, 43 women with normal female losses, and 66 women
with nontrisomic chromosomally abnormal losses. For conve-
nience, throughout the rest of the paper we refer to women on
the basis of the karyotype of their abortus (‘‘trisomy cases’’ or ‘‘triso-
mies’’ rather than ‘‘women with trisomic spontaneous abortions’’).
For each case individual who completed the study, we selected
an age-matched control with a recent normal live birth in the
same hospital and with no known chromosomally abnormal
previous pregnancy. Of 678 women selected as controls, 491
(72%) completed the protocol. To ensure comparability of
measures for cases and controls, we excluded 64 controls whose
XCI skewing percentage was measured in an external laboratory.
The analytic sample thus includes 427 controls.
14, 2009

Follow-up of Women with XCI SkewingWe asked all women with XCI skewing percentage R 85% and
a subset of women with XCI 50% to<75%, matched for karyotype
group and date of first blood draw, to provide a second blood
sample for cytogenetic analysis and buccal swabs from both left
and right cheeks for measurement of the XCI skewing percentage
in this tissue. Of the 90 women who provided buccal swabs
(45 with blood XCI R 85%, 45 with blood XCI 50% to <75%),
86 had sufficient DNA to carry out the HUMARA assay. Three
women were homozygous on buccal smear analysis, and three
women were excluded because the karyotype of the abortus was
uncertain (46,XX without confirmation from FISH). Thus, the
buccal smear analyses comprise 80 women.
The XCI AssaySkewing of XCI was measured with the HUMARA assay, which
takes advantage of the differential methylation of a CpG site close
to a highly polymorphic CAG repeat in the first exon of the
X-linked androgen receptor (AR [MIM 3137000]) gene. Approxi-
mately 90% of women have distinguishable alleles. Sham diges-
tion by RsaI allows sizing of the two alleles after PCR; digestion
by RsaI plus HpaII allows distinction between the methylated
and the nonmethylated allele. We used a slight modification of
the method described in Hatakeyama et al.14 to assess the XCI
skewing percentage at the AR locus.
Among 751 samples analyzed, 91% were judged heterozygous at
the AR locus. Reliability of the assay (see Appendix) was measured
in a variety of ways, including comparisons with an external labo-
ratory and measurements over time within the study laboratory.
We used the intraclass correlation coefficient (ICC) because it
provides a more robust measure of reliability and agreement than
the Pearson product-moment correlation (r). The ICCs ranged
from a low of 0.80 (when we remade PCR products and used an
external laboratory) to a high of 0.96 (when the same PCR products
were run within 35 days in the study laboratory). Thus, our reli-
ability on the same sample ranges from substantial to excellent.
These ICCs exclude samples judged to be homozygous by one or
both laboratories. Among ten samples judged to be homozygous by
either laboratory, there was agreement on seven. All three disagree-
ments concerned questionable heterozygosity for alleles differing
Figure 1. X Chromosome InactivationSkewing Percentage among Controlswith Age-Adjusted Fitted Beta Curve
by only three base pairs. Because the XCI
skewing percentage may be underesti-
mated when alleles differ by only one
repeat, we repeated all categorical statistical
analyses, excluding the 93 (14%) samples
in which allele sizes differed by only one
repeat. Odds ratios were unchanged for
the first three significant digits.
Statistical AnalysesWe carried out two complementary anal-
yses to estimate associations of the XCI
skewing percentage with each karyotype
group—trisomy, chromosomally male,
chromosomally normal female, nontriso-
mic chromosomally normal—in compar-
ison to those of controls. In the first, we analyzed the folded XCI
skewing percentage as a categorical variable (50 to <60, 60 to <70,
70 to <80, 80 to <85, R 85). We defined highly skewed HSXI
as R 85% (6.1%of 684 heterozygotes),because the small proportion
(2.3%) of women with XCI R 90% would have limited statistical
power. We used conditional logistic regression45,46 to test the null
hypothesis that at any maternal age there is no difference in the
XCI skewing percentage between cases and controls. The analysis
was adjusted by stratification for age at blood draw in single years.
We also report the results of the primary analysis, using R 90% as
the upper boundary to facilitate comparison with other studies.
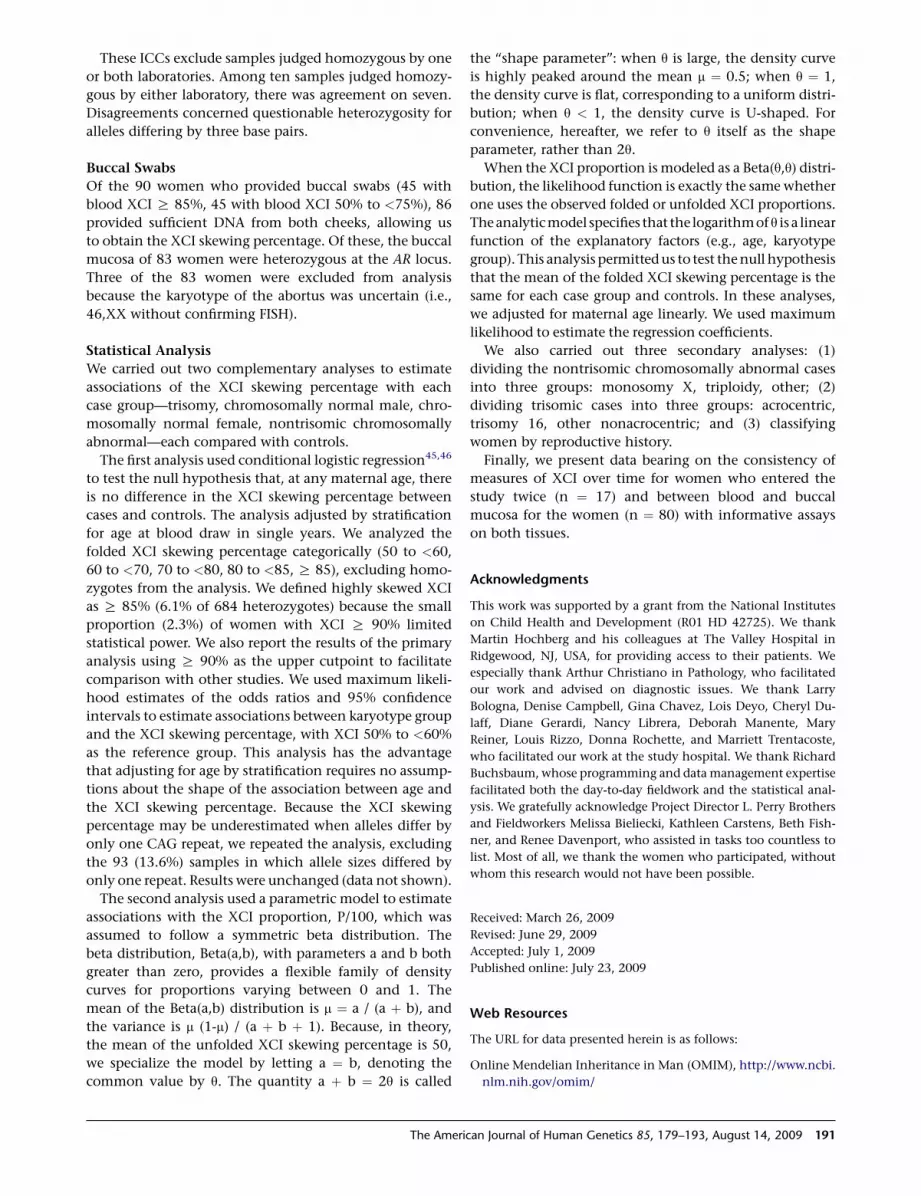
In the second analysis, we used a parametric model to estimate
associations with the folded XCI skewing percentage as a contin-
uous variable following a symmetric beta distribution. This anal-
ysis permitted us to test the null hypothesis that the mean of
the folded XCI skewing percentage is the same for each case group
and controls. We used maximum likelihood to estimate regression
coefficients. To aid interpretation, we report age-adjusted mean
folded XCI skewing percentages based on the parameters of the
regression model. Figure 1 uses data from controls to illustrate
that the folded beta distribution fits the observations well (coa-
lescing the two highest categories, chi-square goodness of fit ¼5.69, df ¼ 7, p ¼ 0.58).
We also carried out three secondary analyses: (1) dividing the
nontrisomic chromosomally abnormal types into three groups:
monosomy X, triploidy, other; (2) dividing trisomic groups into
three subgroups: acrocentric, trisomy 16, other nonacrocentric;
and (3) classifying women by reproductive history.
Finally, we present data bearing on the consistency of XCI
measurements (1) over time for the 17 women who entered the
study twice and (2) between blood and buccal mucosa for the
80 women with informative assays on both tissues.
Results
Primary Analysis: Four Karyotype Groups
Versus Controls
The proportion of women with XCI R 85% is 5.9% for
controls and 5.8% for trisomies, the primary case group
The American Journal of Human Genetics 85, 179–193, August 14, 2009 181

Table 1. Percentage of XCI Skewing among Live Birth Controls and among Spontaneous Abortion Cases Classified by Karyotype of theAbortus
XCI Skewing Percentage Distribution
Pregnancy Type Total NumberNumberHeterozygous 50 to <60 60 to <70 70 to <80 80 to <85 85þ
Controls
Live births 427 388 35.3 33.5 19.6 5.7 5.9
Case groups for primary analysis
Trisomy 169 154 32.5 27.3 24.0 10.4 5.8
Chromosomally normal male 46 43 41.9 20.9 23.3 11.6 2.3
Chromosomally normal female 43 38 50.0 23.7 15.8 7.9 2.6
Nontrisomic chromosomal abnormality 66 61 31.1 23.0 26.2 6.6 13.1
Case groups for secondary analysis dividing nontrisomic chromosomal abnormalities
Monosomy X 19 18 22.2 22.2 27.8 5.6 22.2
Triploid 30 28 35.7 21.4 28.6 3.6 10.7
Other nontrisomic chromosomal abnormality 17 15 33.3 26.7 20.0 13.3 6.7
Case groups for secondary analysis dividing trisomies
Acrocentric trisomy 78 70 30.0 32.9 24.3 10.0 2.9
Trisomy 16 41 38 50.0 26.3 10.5 7.9 5.3
Other nonacrocentric trisomy 38 34 20.6 17.6 38.2 8.8 14.7
(Table 1). The odds of XCI R 85% do not differ between
any of the case groups and the controls (Table 2).
Comparing trisomy cases and controls, the age-adjusted
odds ratio for XCI R 85% (versus 50% to <60%) is 1.2
(95% CI 0.5–2.8.). XCI R 90% occurs in 2.0% of heterozy-
gous trisomy cases and 2.3% of heterozygous controls; the
age-adjusted odds ratio is 1.3 (95% CI 0.3–5.3). For chro-
mosomally normal male cases, the age-adjusted odds ratio
for XCI R 85% is 0.3 (95% CI 0.04–2.5) (Table 2). There are
no chromosomally normal male cases with XCI R 90%.
The folded beta regression analysis shows no statistically
significant differences in the age-adjusted mean XCI skew-
ing percentage between these three case groups and
controls (Table 2).
Among women with nontrisomic chromosomally
abnormal spontaneous abortions, 13.1% showed XCI R
85%. The age-adjusted odds ratio for XCI in this group is
2.1 (95% CI 0.8–5.6). Analysis of the XCI skewing
percentage as a continuous variable indicates a statistically
significant increase in the XCI skewing percentage in this
case group as compared with controls (p ¼ 0.02) (Table 2).
Secondary Analyses of Karyotype Groups
Dividing Nontrisomic Chromosomally Abnormal Cases
The odds ratios relating XCI R 85% to monosomy X (n ¼18) and triploid (n ¼ 28) cases (each compared with
controls) were 4.0 and 2.0, respectively, neither differing
significantly from unity (Table 1). Analysis of the XCI
skewing percentage as a continuous variable shows
increased mean XCI skewing percentages for monosomy
182 The American Journal of Human Genetics 85, 179–193, August
X, triploid, and other chromosomally abnormal cases,
although only the increase with monosomy X was signifi-
cant (p¼ 0.03) (Table 3). The means of the three karyotype
groups included among other chromosomal abnormalities
are not significantly different from each other (p ¼ 0.51).
Trisomy Type
We repeated the analyses, classifying trisomy cases by
chromosome (acrocentric, trisomy 16, other nonacrocen-
tric). The XCI skewing percentage, whether defined cate-
gorically or continuously, was unrelated to acrocentric
trisomy and trisomy 16 cases. The odds ratio relating
XCI R 85% to other nonacrocentric trisomy cases (versus
controls) was 4.1 (95% CI 1.1–15.2) (Table 1). The age-
adjusted mean XCI skewing percentage was higher
for this case group than for controls (p ¼ 0.04) (Table 3).
The three trisomy groups did not differ from each other
(p ¼ 0.12).
Secondary Analyses Related to Reproductive History
Division of the sample on the basis of the outcome of the
index pregnancy and reproductive history shows no asso-
ciation between XCI skewing percentage and recurrent
abortion (Table 4). The odds ratio for XCI R 85% in recur-
rent aborters (defined as cases with 2þ spontaneous abor-
tions< 20 wks and at least two more losses than live births;
n ¼ 45) versus multiparae (defined as controls with no
spontaneous abortion < 20 wks and 2þ live births; n ¼169) was 0.8 (95% CI 0.2–4.0). The age-adjusted mean
XCI skewing percentage did not differ between women
with RSAs and multiparae. Twenty-six of the 45 recurrent
14, 2009

Table 2. Percentage of XCI Skewing among Spontaneous Abortions, Classified by Karyotype, and Controls: Unadjusted and Age-AdjustedOdds Ratios for Folded XCI Skewing Percentages and Mean Folded XCI Skewing Percentages
XCI Percentage Unadjusted OR Age-Adjusted ORa 95% CIAge-Adjusted Mean XCI SkewingPercentageb
Trisomy
50 to <60 1.0 1.0 NA
60 to <70 0.9 0.9 0.6–1.5
70 to <80 1.3 1.2 0.7–2.1
80 to <85 2.0 1.7 0.8–3.6
85þ 1.1 1.2 0.5–2.8
Mean 66.8
Chromosomally normal male
50 to <60 1.0 1.0 NA
60 to <70 0.5 0.5 0.2–1.1
70 to <80 1.0 0.9 0.4–2.1
80 to <85 1.7 1.5 0.5–4.8
85þ 0.3 0.3 0.04–2.5
Mean 65.4
Chromosomally normal female
50 to <60 1.0 1.0 NA
60 to <70 0.5 0.5 0.2–1.1
70 to <80 0.6 0.7 0.3–1.9
80 to <85 1.0 1.2 0.3–4.4
85þ 0.3 0.3 0.03–2.0
Mean 63.5
Nontrisomic chromosomal abnormality
50 to <60 1.0 1.0 NA
60 to <70 0.8 0.6 0.3–1.3
70 to <80 1.5 1.5 0.7–3.1
80 to <85 1.3 1.2 0.4–4.1
85þ 2.5 2.1 0.8–5.6
Mean 68.6c
Control
Live birth reference reference NA 65.5
NA denotes ‘‘not applicable.’’a Adjusted for age at blood draw (in single years) by stratification. The conditional logistic regression analysis treats as uninformative one trisomic and two non-trisomic chromosomally abnormal spontaneous abortions (i.e., there are no controls or other spontaneous abortions in the age stratum).b Adjusted linearly for age at blood draw. Obtained from a beta regression model for the XCI proportion (XCI percentage/100). The expected value of a foldedbeta random variable is I0.5(q,q þ 1), in which Ix(a,b) is the incomplete beta function from 0 to x and q is the (estimated) age-adjusted shape parameter.c p ¼ 0.02 for nontrisomic chromosomal abnormality compared with controls.
aborters had 3þ losses (including the index spontaneous
abortion); none had XCI R 85%.
Consistency over Time and between Tissues
For 17 women who entered the study for two pregnancies
and had blood drawn on both occasions, on average
286 days apart (range 147–836 days, median 198 days), the
The Amer
ICC for the XCI skewing percentage was 0.69; there was no
significantdifference betweenmean XCIskewingpercentage
for first and second study entrances. Skewing was in favor of
the same allele in 82% of repeat samples (Table 5).
For 80 women for whom we were able to measure the
XCI skewing percentage in both blood and buccal mucosa
(Figure 2), the ICC between the XCI skewing percentage in
ican Journal of Human Genetics 85, 179–193, August 14, 2009 183

Table 3. Percentage of XCI Skewing among Spontaneous Abortions, Dividing Nontrisomic Chromosomal Abnormality Cases, TrisomyCases, and Controls: Age-Adjusted Odds Ratio for Folded XCI Skewing Percentage R 85 and Mean XCI Skewing Percentage
Comparison NumberAge-Adjusted OR XCI 85%þ versus XCI50% to <60%a 95% CI
Age-Adjusted Mean XCI SkewingPercentageb
Nontrisomic chromosomal abnormalityc
Controls 388 reference NA 65.5
Monosomy X 18 4.0 0.9–18.4 70.7d
Triploidy 28 2.0 0.5–8.2 67.8
Other nontrisomic abnormality 15 0.8 0.1–7.5 66.9
Trisomye
Controls 388 reference NA 65.9
Acrocentric trisomy 70 0.6 0.1–2.7 65.9
Trisomy 16 38 0.6 0.1–3.0 65.0
Other nonacrocentric trisomy 34 4.1 1.1–15.2 69.6f
NA denotes ‘‘not applicable.’’a Adjusted for age at blood draw (in single years) by stratification. The age-adjusted odds ratios are obtained from a conditional logistic regression analysis thatincludes all categories of the XCI skewing percentage.b Adjusted linearly for age at blood draw (see footnote to Table 4).c The analysis includes trisomy, chromosomally normal male, and chromosomally normal female spontaneous abortions (not shown). The conditional logisticregression analysis treats as uninformative the following number of spontaneous abortions: one trisomy, one monosomy X, and one other nontrisomic chromo-somal abnormality (i.e., there are no controls or other pregnancy losses in the age stratum).d p ¼ 0.03 for monosomy X in comparison with controls. Mean XCI skewing percentages do not differ among monosomy X, triploidy, and other nontrisomicchromosomal abnormality (2 df, p ¼ 0.51).e The analysis included the three trisomy types and controls. The conditional logistic regression analysis treats as uninformative one acrocentric trisomy loss and 14controls (i.e., there are no controls or other pregnancy losses in the age stratum).f p ¼ 0.04 for other nonacrocentric trisomy in comparison with controls. Mean XCI skewing percentages do not differ among the trisomy types (2 df, p ¼ 0.12).
blood and in buccal mucosa of the left cheek was 0.41,
between blood and buccal mucosa of the right cheek was
0.39, and between buccal mucosa of the left and the right
cheek was 0.48. Of the 39 women with blood XCI R 85%,
XCI R 85% was detected in both buccal samples for three
184 The American Journal of Human Genetics 85, 179–193, August
women and in one buccal sample for five. Of the 41
women with blood XCI 50% to <75%, one showed
XCI R 85% in one buccal sample. The mean folded XCI
skewing percentage was lower in both left and right buccal
mucosa than in blood (p < 0.0001).
Table 4. Percentage of XCI Skewing among Groups Defined by Outcome of the Index Pregnancy: and Reproductive History
XCI Skewing Percentage Distribution
Group Total Number Number Heterozygous 50 to <60 60 to <70 70 to <80 80 to <85 85þ
Index LB: multipara, reference groupa 188 169 36.7 33.1 17.8 5.9 6.5
Index SA: recurrent aborterb 50 45 33.3 22.2 33.3 6.7 4.4
Index SA: sporadic aborter, 2þ lossesc 60 56 41.1 19.6 21.4 12.5 5.4
Index SA: sporadic aborter, 1 lossd 132 121 39.7 23.1 22.3 10.7 4.1
Index SA: nullipara, 1 losse 82 74 27.0 33.8 20.3 6.8 12.2
Index LB: sporadic aborter, 1 lossf 78 70 34.3 34.3 21.4 2.9 7.1
Index LB: primipara, 0 lossesg 141 129 32.6 34.1 21.7 7.0 4.7
Index LB: otherh 20 20 45.0 30.0 15.0 5.0 5.0
‘‘Loss’’ indicates spontaneous abortion before 20 wks gestational age, SA indicates spontaneous abortion before 18 wks developmental age, and LB denotes ‘‘livebirth.’’a Loss ¼ 0, live birth > 1.b Loss R 2, loss � live birth R 2.c Loss R 2, loss � live birth < 2.d Loss ¼ 1, live birth R 1.e Loss ¼ 1, live birth ¼ 0.f Loss ¼ 1, live birth R 1.g Loss ¼ 0, live birth ¼ 1.h Loss R 2 and loss � live birth R 2 (n ¼ 3) or loss R 2 and loss � live birth < 2 (n ¼ 17).
14, 2009

Table 5. Agreement of XCI Skewing Percentages and Direction of Skewing among Samples and Tissues
Skewing in Favor of Same Allele
Comparison Number ICCa All Samples Samples with HSXIb
Buccal tissue versus blood
Left buccal smear versus blood 80 0.41 56/80 (70%) 35/40 (88%)
Right buccal smear versus blood 80 0.39 59/80 (74%) 33/39 (85%)
Both left and right versus blood 80 NA 48/80 (60%) 31/39 (79%) c
Buccal smear
Left buccal smear versus right buccal smear 80 0.48 61/80 (76%) 8/9 (89%)
Blood samples
Same laboratory, same PCR products, run 2 to 35 days apart 70 0.96 69/70 (99%) 13/13 (100%)
Same laboratory, same PCR products, run 4 to 9 months apart 30 0.87 29/30 (97%) 10/10 (100%)
Different laboratories, different PCR products 19 0.80 19/19 (100%) 8/8 (100%)
Repeat blood samples 17 0.69 14/17 (82%) 1/1 (100%)
a ICC denotes ‘‘intraclass correlation coefficient.’’b Skewing R 85% in at least one sample.c Among 39 women with skewing R 85% in blood.
Karyotypes of Women with a Second Blood Draw
Of the 90 women who had a second blood draw, 89 had chro-
mosomally normal G-banded karyotypes at the 550 band
level, and one had a balanced translocation; in the latter
case, the abortus had an unbalanced translocation. Seven
women showed > 5% X aneuploidy (four with 20 cells
counted, threewith50cells counted).Xaneuploidywasunre-
lated to HSXI: it occurred in two of the 45 women with XCI R
85% and five of the 45 women with XCI 50% to <75%.
Discussion
Association between HSXI and Trisomic
Spontaneous Abortion
We hypothesized that an association between HSXI and
RSA, if real, reflects an association with trisomic concep-
The Amer
tion. Our proposed underlying mechanism was that abnor-
malities of the X chromosome are associated both with an
increased rate of oocyte atresia and with skewed XCI in
somatic cells as a result of selection. Several lines of
evidence support the idea that the increasing rate of
trisomy with increasing maternal age is related to the
decreased size of the oocyte pool,43 although tests of the
hypothesis yield conflicting results.37,47–49
Our data do not support our hypothesis, whether we
define HSXI as R 85% or R 90% or analyze the XCI skew-
ing percentage as a continuous variable. For XCI R 85% in
relation to trisomy, the age-adjusted odds ratio is 1.2 (95%
CI 0.5–2.8), indicating that with 95% confidence we can
rule out associations in excess of 2.8.
Our results contrast with two reports from British
Columbia. The first report24 shows a 2.8 (95% CI 1.3–6.0,
our computation) increase in the odds of XCI R 90%
Figure 2. Unfolded XCI Skewing Per-centage in Blood and Buccal Mucosa
ican Journal of Human Genetics 85, 179–193, August 14, 2009 185

among women with trisomic pregnancies compared with
controls. The case group comprised women with RSAs, at
least one of which was trisomic (n ¼ 39), women with a
trisomic spontaneous abortion but no RSA (n ¼ 11), and
women with a prenatal diagnosis of a mosaic trisomy of
maternal origin (n ¼ 53); the two control groups derive
from several sources. The second report44 adds 16 trisomic
cases, diagnosed prenatally or among losses of recurrent
aborters, and mothers of children with maternal unipa-
rental disomy for chromosome 15 (n ¼ 21). Results for
trisomy (but not uniparental disomy) are consistent with
the first report. Combining all trisomy cases, the authors
concluded that there is no shift in the distribution of
XCI skewing percentage and that associations are primarily
due to an excess of XCI R 95%.
Our primary observation—that XCI skewing percentage
is unrelated to trisomic pregnancy—is consistent with
another study in which we were able to test another part
of the hypothesis; namely, that HSXI is related to acceler-
ated aging of the ovary. We analyzed XCI in a sample of
women with recent pregnancies for whom we had
measured levels of follicle-stimulating hormone and
inhibin B, as well as the number of antral follicles, in one
menstrual cycle. We found no association between HSXI
and any of these measures of biologic aging of the ovary.50
Association between HSXI and Karyotypically Normal
Male Spontaneous Abortion
Our data also show no hint of an association of XCI R 85%
with karyotypically normal male spontaneous abortion
(age-adjusted OR 0.3; 95% CI 0.04–2.5); with 95% confi-
dence, we can rule out associations in excess of 2.5. An
association of abnormalities of the X chromosome with
both XCI skewing percentage and chromosomal lethality
may account for some cases of repeated male losses among
women with recurrent abortions, but it is unlikely that
such losses are common enough to produce detectable
associations between HSXI and recurrent abortion.
Association between HSXI and Trisomy Divided
by Chromosome Group
In the secondary analyses, we examined the relation of
HSXI to predefined (e.g., Kline et al.37) classes of trisomy
(Table 1 and Table 3). There is no association of XCI R
85% with acrocentric trisomy or trisomy 16, although
there is a significant association with nonacrocentric triso-
mies other than 16 (Table 3). Because these analyses were
exploratory, the association with nonacrocentric trisomies,
which is difficult to explain biologically, may be an artifact
of multiple tests. However, the British Columbia series44
showed no association of HSXI with trisomies 13–15 or
trisomy 16, but a positive association with other nonacro-
centric trisomies and trisomies 21 and 22. Trisomies of
different chromosomes vary in the patterns of increase
with maternal age and the frequency or location of recom-
bination sites,51 such that differences among chromo-
somal groups cannot be dismissed as implausible. None-
186 The American Journal of Human Genetics 85, 179–193, August
theless, in light of the exploratory nature of both sets of
analyses, observations related to specific classes of trisomy
require confirmation.
Association between HSXI and Nontrisomic
Chromosomally Abnormal Spontaneous Abortion
In the primary analysis, we detected an association of XCI
skewing percentage, defined continuously, with nontriso-
mic chromosomally abnormal loss (p ¼ 0.02). When we
divided this karyotype group, the mean XCI skewing
percentage was increased for monosomy X, triploid, and
other chromosomally abnormal cases, although only the
association with monosomy X was significant (p ¼ 0.03).
However, in light of the small number in each case group,
the post hoc nature of this test, the multiple statistical tests
performed, and biologic implausibility (each karyotype
group has a different mode of origin), we think it likely
that these observations represent a chance finding. We
report them to alert others who may have relevant data
with which to repeat the analysis.
Association between HSXI and Recurrent
Spontaneous Abortion
Our study was not designed to test the association of
HSXI with recurrent spontaneous abortion, but secondary
analyses show no association. XCI R 85% occurred in
4.4% of 45 recurrent aborters and 6.5% of 169 multiparae
with live births only; age-adjusted mean XCI skewing
percentages did not differ between the two groups. Recent
studies in this area have been interpreted to cast doubt on
a connection between HSXI and recurrent loss, mainly
because differences between cases and controls are not
statistically significant. Four studies27,29,31,32 show nonsig-
nificant odds ratios of 2–3 relating HSXI (defined as R
90%) to recurrent abortion, one28 shows a statistically
significant 13-fold odds ratio, and one30 shows a nonsignif-
icant inverse association. In summary, observations on
a possible association of HSXI with recurrent abortion are
inconclusive.
Strengths and Limitations
Our study has several strengths. First, we selected controls
from the same population as cases over the same time
period. Second, we measured the XCI skewing percentage
blind to case-control and karyotype status. These design
features eliminate the potential for bias in XCI measures
due to technical or temporal factors. Moreover, selective
participation is impossible given that XCI status was
unknown to the women. Third, our study is the first to
obtain karyotypes from a consecutive series of sponta-
neous abortions, providing greater generalizability than
studies that draw on occasional karyotypes of losses to
recurrent aborters. Fourth, the reliability of our assay
ranged from substantial (ICC ¼ 0.80), when we remade
the PCR products, to excellent (ICCs 0.87–0.96), when
we reused the same PCR products.
14, 2009

One potential limitation of our study is that for the cate-
gorical analysis we defined HSXI as R 85% rather than
as R 90%, which is the more common cutpoint. We chose
85% because the proportion (2.3%) of women with XCI R
90% limited statistical power. If the higher cutpoint iden-
tifies a group with a high proportion of X chromosome
abnormalities, our R 85% cutpoint might dilute an associ-
ation between skewed XCI and trisomy. On the other
hand, if X chromosome abnormalities shift the distribu-
tion of XCI skewing percentages toward higher ratios,
the continuous analysis is most appropriate to our research
question. Although the proportion with XCI R 90% is
lower in our control sample than in many early studies,
it agrees with observations from later studies (e.g., Amos-
Landgraf et al.,1 Hogge et al.,27 Bolduc et al.10). The wide
variation in the proportion with XCI R 90% reported
among controls in the literature could easily be due to
sampling variation in the studies with 100 women or fewer
or to technical issues related to the HUMARA assay.1,13
Biologic Significance of HSXI in Blood
A difficulty with all studies of the XCI skewing percentage
is how to interpret its biologic significance. An underlying
assumption of our hypothesis is that HSXI is a good indi-
cator of the presence of X chromosome abnormalities.
None of the women in our sample with HSXI had abnor-
malities visible with standard G-banded karyotypes. It is
not known, however, how often HSXI is an indicator of
gene mutations or copy number changes below the level
detectable with banded karyotypes. We are currently using
high-resolution microarray analysis to examine whether or
not HSXI is associated with copy number variation on the
X chromosome.
A second difficulty relates to whether a single measure of
the XCI skewing percentage (usually from a blood sample)
is a valid measure of the true skewing percentage in a
woman or, at a minimum, correctly identifies women
with HSXI. Apart from the reproducibility of the HUMARA
assay itself, which is good to excellent in our study, three
other observations bear on this issue: (1) The ICC for
measures of the XCI skewing percentage in blood samples
taken from the same women at different times is lower
than the ICC for repeat measurements on the same blood
sample (Table 5). (2) The ICC for measures in buccal tissue
versus blood is lower than the ICC for repeat measures in
blood samples taken at different times. (3) The ICC for
measures in left and right buccal smears is lower than the
ICC for repeat measures in blood samples taken at different
times.
Our data indicate that primary HSXI is rare: of 684
women with informative XCI skewing percentages, only
the three (0.4%) who showed HSXI (R85%) in all three
samples are candidates. Even in the absence of HSXI in
all tissues, however, samples taken from different tissues
or at different times show a tendency for skewing toward
the same allele, especially when HSXI is present in at
least one sample (Table 5). This observation is compatible
The Ameri
with the idea that HSXI is an indicator of genetic differ-
ences between the two X chromosomes that influence
selection toward inactivation of the same chromo-
some—an inference consistent with the observation
from studies of twin pairs,52–54 which also imply a large
genetic component.
Our observations suggest that it is naive to think that the
XCI skewing percentage in blood DNA measures a param-
eter that was set during fetal life and thus pertains to the
entire individual. On the contrary, it appears that most
women have differing degrees of XCI skewing in different
tissues and even within the same tissue at different times.
This observation suggests that when seeking to identify
associations between XCI skewing (usually HSXI) and
specific phenotypes, it is important to consider the possi-
bility that an XCI skewing measure in blood may not be
a reliable predictor of skewing in the tissues of interest.
Summary
We hypothesized that an association of HSXI with recur-
rent loss, if real, reflects an association with trisomic
conception. Hence, we tested associations with trisomic
losses irrespective of reproductive history. Our study does
not support this hypothesis, nor does it support the
hypothesis that the XCI skewing percentage is related to
chromosomally normal male loss or a history of recurrent
abortion.
Appendix: Detailed Subjects and Methods
Protocol
From February 25, 2003, to November 18, 2005, we identi-
fied women age 18 or older with singleton spontaneous
abortions (developmental age less than 18 wks) whose
products of conception were submitted to the Pathology
Department of a hospital in NJ, USA. We asked permission
to karyotype the abortus. If a woman’s abortus was success-
fully karyotyped, we asked her to (1) complete a short
telephone interview so that we could determine whether
or not she was eligible for hormone measures (e.g., not
taking a hormonal contraceptive) in addition to measures
of XCI; (2) complete a more extensive telephone interview
regarding demographic characteristics, obstetric and
medical histories, and common exposures; and (3) make
one visit to the hospital for a blood draw and a brief update
interview about recent exposures. Women who were
eligible for hormone measures provided samples timed to
their menstrual periods. The original study goals did not
include hormone measures; the samples have not been
analyzed and are not relevant to this paper.
For each case individual who completed the study, we
selected an age-matched control individual with a recent
chromosomallynormal livebirth R 1800 g, without a major
anatomic malformation. Eligible controls had no preg-
nancy loss after the index pregnancy and no known prior
chromosomally abnormal pregnancy. Candidates were
can Journal of Human Genetics 85, 179–193, August 14, 2009 187

women who delivered at the study hospital 6–12 months
before the date of selection. They were selected from a roster
of women who delivered between April 1, 2003, and May
31, 2006, and consented to be contacted about the research.
Hospital staff asked 6505 women for permission to list them
as candidates, and 5346 (82%) agreed.
Controls were matched to cases for projected age (56
months) at the blood draw. Our computerized selection
procedure was designed to alternate between selecting
a control who was younger and a control who was older
than the case. If a control did not complete the study, we
replaced her, in order to obtain a comparison group as
similar as possible in age to cases who completed the study.
Because we view all controls of the same age as inter-
changeable, we used this procedure to ensure compara-
bility in the age distributions, but we did not maintain
the matches in the analysis. Rather, we controlled for age
linearly or by stratification. If a case was eligible for
hormone measures but her control was not, we used the
same procedure to select and enroll a second control who
was eligible for hormone measures.
Control recruitment lagged behind case recruitment
because (1) we required that a case complete the protocol
before we selected her control (so that we could match
for age at blood draw) and (2) if a case was eligible for
hormone measures, we required that the first selected
control complete her intake interview so that we could
determine whether or not a second control was needed.
Control recruitment began on November 10, 2003. The
protocol for controls was identical to the protocol for cases.
The interviewer knew the outcome of the index preg-
nancy, but she did not know the karyotype of the sponta-
neous abortion (except in the < 4% of instances when
a participant revealed it). XCI was measured without
knowledge of any participant characteristics, including
the outcome of the index pregnancy.
We asked all women with an XCI skewing percentage R
85 (hereafter, XCI R 85%), as well as a subset of women
with XCI 50% to <75%, matched for karyotype group
and date of first blood draw, to provide a second blood
sample for cytogenetic studies and buccal swabs for
measurement of the XCI skewing percentage.
The study was approved by the institutional review boards
at our university and the study hospital. All participants
gave informed consent. Fieldwork ended in January 2007.
Women with Spontaneous Abortions
We identified 855 women with spontaneous abortions:
729 women were offered karyotype studies, and of those,
695 accepted the offer. The hospital pathology laboratory
selected fetal material, almost always chorionic villi, ob-
tained during suction curettage. Five hundred seventeen
had sufficient fetal tissue to set up in culture after dissec-
tion and enzymatic digestion and/or to save a portion of
the suspension for multiplex fluorescent in situ hybridiza-
tion (FISH). We attempted FISH with probes for chromo-
somes 13, 15, 16, 18, 21, 22, X, and Y for specimens in
188 The American Journal of Human Genetics 85, 179–193, August
which the cultured sample yielded a chromosomally
normal female karyotype (because of the possibility of
maternal cell growth) or did not yield a karyotype because
the culture did not grow or was contaminated. Because the
FISH probes that we used identify about 85% of abnormal-
ities in spontaneous abortions,36 we classified cases with
normal XX or XY complements by FISH only as normal
female or male. FISH on uncultured material was informa-
tive for 91 of 110 specimens karyotyped as 46, XX: normal
female in 59, normal male in 7, and abnormal in 25. FISH
was informative for 49 of 68 specimens in which the
culture failed: normal female in 15, normal male in 9,
and abnormal in 25. We karyotyped 498 (96%) specimens
by either chromosome analysis or FISH (Table 6).
Among the 498 women with karyotyped losses, 354
(71%) completed the protocol. The principal reasons for
not completing the protocol were refusal (60%) and with-
drawal (33%). Mean maternal age is similar for nonpartic-
ipants and participants. For the 70 nonparticipants who
completed the first interview, ethnicity and mean number
of prior pregnancies ending in live birth, spontaneous
abortion, and prior induced abortion are similar to those
of the 354 participants. Educational levels are significantly
higher among participants; the association persisted when
we adjusted for age, ethnicity, and obstetric history. Anal-
yses exclude 30 women (detailed in Table 6). The analytic
sample thus includes 324 women—169 with autosomal
aneuploid losses (referred to as ‘‘trisomic,’’ including four
hypertriploids, one hypertetraploid, and six autosomal
monosomies), 46 with chromosomally normal male losses,
43 with chromosomally normal female losses, and 66 with
nontrisomic chromosomally abnormal losses.
Live Birth Controls
Controls were sampled with replacement. In total, we
selected 892 controls, including 214 women who were
selected as second controls but were not invited to partici-
pate because they were ineligible for hormone measures.
Of the remaining 678 women, 491 (72%) completed the
protocol. The principal reasons for not completing the
protocol were refusal (54%), withdrawal (21%), or our
inability to locate the individuals (13%) (Table 6).
Mean maternal age is similar for the 491 participants and
the 140 women who declined to participate or withdrew.
The 47 other nonparticipants, principally women who no
longer resided at the address provided on the consent
form, were younger. Sixty-eight nonparticipants completed
the first interview. Ethnicity and mean number of prior
pregnancies ending in live birth, spontaneous abortion,
or induced abortion are similar for these 68 nonparticipants
and the 491 participants. Educational levels are signifi-
cantly higher among participants; the association persisted
when we adjusted for age, ethnicity, and obstetric history.
The analysis excludes data from 64 women, all controls,
whose XCI skewing percentage was measured in an
external laboratory (n ¼ 62) or not measured (n ¼ 2). The
analytic sample thus includes 427 controls. Among women
14, 2009

Table 6. Number of Women Identified or Selected Who Declinedthe Study, Were Ineligible, or Completed the Protocol
Protocol StatusSpontaneousAbortion Control
Identified or Selected
Total 855 678a
Specimen received at research laboratory 684 NA
Tissue culture set up and/or analysis by FISHb 517 NA
Karyotyped 498 NA
Moved, not located, did not speak English 11 47
Declined the study or withdrew 133 140
Completed the protocol
Total 354 491
Trisomyc 170 NA
Chromosomally normal maled 49 NA
Chromosomally normal femalee 48 NA
Nontrisomic chromosomal abnormality 74 NA
Unknown karyotypef 13 NA
Analytic exclusions
Total 30 64
Nontrisomic loss with prior trisomy 1 NA
Repeat entrance 17 NA
Unknown karyotypef 12 NA
XCI percentage not assessedg 2
XCI percentage measured by an externallaboratoryh
0 62
Analytic sample
Total 324 427i
Trisomy 169 NA
Chromosomally normal male 46 NA
Chromosomally normal female 43 NA
Nontrisomic chromosomal abnormality 66 NA
NA denotes ‘‘not applicable.’’a Excludes 214 women selected as second controls who were ineligible for thehormone component.b FISH denotes ‘‘fluorescent in situ hybridization.’’c Includes single, double, and triple autosomal trisomies, autosomal mono-somies, hypertriploids, and hypertetraploids.d Includes nine abortus specimens for which FISH analysis with probes for chro-mosomes 13, 15, 16, 18, 21, 22, X, and Y indicated a chromosomally normalmale, and the karyotype from culture was not obtained.e Includes abortus specimens for which FISH analysis with probes for chromo-somes 13, 15, 16, 18, 21, 22, X, and Y indicated a chromosomally normalfemale, and the karyotype from culture was either chromosomally normalfemale (n ¼ 37) or not obtained (n ¼ 11).f We classified the abortus karyotype as unknown if the karyotype from culturewas 46,XX but the sample was not analyzed by FISH with probes for chromo-somes 13, 15, 16, 18, 21, 22, X, and Y.g XCI denotes ‘‘X chromosome inactivation.’’h For blood samples drawn on or after June 15, 2006, the XCI percentage wasprovided by an external laboratory.i Includes 334 first controls and 93 second controls.
The Ameri
whose XCI assay was informative, the XCI skewing
percentage did not differ between first (n¼ 304) and second
(n ¼ 84) controls (p ¼ 0.41, Wilcoxon rank-sum test).
Comparison of Cases and Controls
As expected, trisomy case individuals are older than the
other case individuals and older than control individuals
(each of whom was matched to a case individual who
completed the protocol) (Table 7). Adjusting for age, the
mean number of pregnancies ending in live birth is higher
and the mean number of spontaneous abortions is lower
among controls than among cases. In addition, the four
case groups and controls differ in the mean number of
induced abortions, although no two-group comparison
was significant at a ¼ 0.05. The four case groups and
controls did not differ in education or ethnicity. The
proportion with informative XCI assays did not vary
among the pregnancy-outcome groups.
The XCI Assay
We used a Flexigene kit (QIAGEN) to prepare DNA from
peripheral blood samples that had been stored at �20�C.
We used the HUMARA assay, which takes advantage of
the differential methylation of a CpG site close to a highly
polymorphic (approximately 90% of women have distin-
guishable alleles) CAG repeat in the first exon of the
X-linked androgen receptor (AR) gene. We digested 1 mg
of DNA with 5 U of RsaI alone and another 1 mg with 5 U
of RsaI and 10 U of HpaII. After digestion, the DNA was de-
salted by passing it through a Performa DTR gel filtration
cartridge (Edge Biosystems). PCR was performed on 10 ng
of both digested samples with the use of primers ampli-
fying the CAG repeat on the AR gene. The methylated
CpG site of the inactive allele is not digested by HpaII,
leaving it available for amplification by a primer flanking
the repeat, whereas the CpG site of the active allele is di-
gested and does not amplify. The forward primer was
labeled with FAM for the single digest and with HEX for
the double digest. After PCR, a portion of the sample was
mixed with a labeled size marker and run on an ABI310
automated genetic sequencer (GeneScan Analysis soft-
ware, version 3.12) for detection of fluorescence. From
each batch of 10 to 12 samples, we tested two samples
for the completeness of the HpaII digestion by PCR ampli-
fication of the 50 region of the MIC2 gene, which is unme-
thylated on both X chromosomes and completely digested
by HpaII.
We used a slight modification of the method described in
Hatakeyama et al.14 to assess the XCI skewing percentage at
the AR locus. The XCI skewing ratio was determined by
comparing the ratio of allele peak heights in the HpaII di-
gested sample (d1 and d2, for smaller and larger PCR product
sizes, respectively) with the ratio in the sample digested by
RsaI alone (u1 and u2). The method corrects for differences
in amplification efficiency of the two alleles. The XCI skew-
ing ratio equals (d1/u1)/(d2/u2). We converted the ratio to an
XCI skewing percentage by computing proportion (P) as
can Journal of Human Genetics 85, 179–193, August 14, 2009 189

Table 7. Selected Characteristics of Women Who Completed the Protocol, Classified by the Outcome of the Index Pregnancy
Spontaneous Abortion
Selected Characteristics Control Trisomy Chr. Normal MaleChr. NormalFemale
Nontrisomic Chr.Abnormality
Number of women 427 169 46 43 66
Age at blood drawa 35.5 (4.6) 37.1 (4.6) 33.4 (5.5) 33.1 (4.2) 33.6 (4.2)
Gestation (days)b NA 64.8 (12.6) 68.9 (23.4) 64.7 (16.2) 67.1 (14.9)
Live birthsc 1.9 (0.9) 1.1 (1.2) 0.8 (1.2) 0.8 (0.8) 1.0 (0.8)
Spontaneous abortionsd 0.3 (0.6) 1.5 (0.9) 1.6 (1.3) 1.5 (1.0) 1.5 (0.9)
Induced abortionse 0.2 (0.7) 0.3 (0.7) 0.4 (0.6) 0.1 (0.4) 0.1 (0.3)
No college degreef 25.1 27.2 37.8 20.9 22.7
College degreeg 51.3 45.6 37.8 51.2 48.5
Postgraduate degreeh 23.6 27.2 24.4 27.9 28.8
White, non-Hispanici 87.4 85.2 82.6 79.1 84.8
Informative XCI percentagej 90.9 91.1 93.5 88.4 92.4
NA denotes ‘‘not applicable.’’a Data are given as mean (SD). Age varies significantly with the outcome of the index pregnancy (p < 0.0001). Because controls were matched to each womanwith a spontaneous abortion, they are significantly older than women with nontrisomic losses and significantly younger than women with trisomic losses. As ex-pected, women with trisomic losses are significantly older than women with nontrisomic losses.b Data are given as mean (SD). Mean gestation does not differ among the four spontaneous abortion groups (p ¼ 0.36).c Pregnancies at blood draw; data are given as mean (SD). Adjusted for age, the mean number of live births differs among the five groups (p < 0.0001).d Pregnancies at blood draw; data are given as mean (SD). Adjusted for age, the mean number of spontaneous abortions (< 20 wks gestation) differs among thefive groups (p < 0.0001).e Pregnancies at blood draw; data are given as mean (SD). Adjusted for age, the mean number of induced abortions differs among the five groups (p ¼ 0.003).f Excludes one woman with a chromosomally normal male loss and an unknown education level. Adjusted for age, education does not differ among the fivegroups (p ¼ 0.79).g Excludes one woman with a chromosomally normal male loss and an unknown education level. Adjusted for age, education does not differ among the fivegroups (p ¼ 0.79).h Excludes one woman with a chromosomally normal male loss and an unknown education level. Adjusted for age, education does not differ among the fivegroups (p ¼ 0.79).i Adjusted for age, ethnicity does not differ among the five groups (p ¼ 0.58).j Adjusted for age, the proportion informative for the XCI percentage (i.e., heterozygous at the AR locus) does not differ among the five groups (p ¼ 0.96).
P ¼ [(d1/u1)/{(d1/u1) þ (d2/u2)}] 3 100, which ranges from
0% to 100%. We refer to P as the unfolded XCI skewing
percentage. In most analyses we analyze the folded XCI
skewing percentage, 50 þ jP � 50j, which ranges from
50% to 100%. Among the 751 samples analyzed, we deter-
mined the XCI skewing ratio in the 684 (91.1%) that were
heterozygous at the AR locus.
Reliability of the XCI Assay
We carried out several reliability studies. We used the intra-
class correlation coefficient (ICC) because it provides a more
robust measure of reliability and agreement than does the
Pearson product-moment correlation coefficient (r).
The first study comprised samples collected early in the
study. We reassayed the PCR products from a stratified
random sample of 30 samples (ten with XCI R 85%, ten
with XCI 75% to <85%, ten with XCI 50% to <75%),
four times, twice in our laboratory, three months apart,
and twice in an external laboratory, two months apart.
The ICC among all five assays was 0.89; within our labora-
tory it was 0.87. Mean XCI skewing percentages differed
significantly between assays. Toward the end of the study,
we carried out three additional reliability studies: (1) We
conducted a reliability study to determine whether or not
190 The American Journal of Human Genetics 85, 179–193, August
to draw on assay results from an external laboratory for
samples (all from controls) collected late in the study.
Comparison of assay results with the use of the same
PCR products of 24 randomly selected controls with XCI
skewing percentages measured in both laboratories re-
vealed that the mean XCI skewing percentage was signifi-
cantly higher in our laboratory than in the external labora-
tory, despite excellent agreement (ICC ¼ 0.93) between
laboratories. Hence, analyses exclude samples assayed at
the external laboratory. (2) The most stringent reliability
study drew on a stratified random sample for which we
remade PCR preparations to compare our assays with assays
from the external laboratory. For 19 of 24 samples judged
heterozygous by both laboratories, the ICC was 0.80;
mean XCI skewing percentages did not differ between labo-
ratories. (3) Finally, during the latter half of the study, we re-
assayed the PCR products of 70 samples in consecutive
assays. The sample overrepresented specimens with high
XCI skewing percentages (17% with XCI R 85%). The
ICC was 0.96; XCI skewing percentages did not differ
between the first and second assays. In sum, reliability
ranged from a low of 0.80 (when we remade PCR products)
to a high of 0.96 (when the same PCR products were run
within 35 days of each other in the same laboratory).
14, 2009
These ICCs exclude samples judged homozygous by one
or both laboratories. Among ten samples judged homozy-
gous by either laboratory, there was agreement on seven.
Disagreements concerned questionable heterozygosity for
alleles differing by three base pairs.
Buccal Swabs
Of the 90 women who provided buccal swabs (45 with
blood XCI R 85%, 45 with blood XCI 50% to <75%), 86
provided sufficient DNA from both cheeks, allowing us
to obtain the XCI skewing percentage. Of these, the buccal
mucosa of 83 women were heterozygous at the AR locus.
Three of the 83 women were excluded from analysis
because the karyotype of the abortus was uncertain (i.e.,
46,XX without confirming FISH).
Statistical Analysis
We carried out two complementary analyses to estimate
associations of the XCI skewing percentage with each
case group—trisomy, chromosomally normal male, chro-
mosomally normal female, nontrisomic chromosomally
abnormal—each compared with controls.
The first analysis used conditional logistic regression45,46
to test the null hypothesis that, at any maternal age, there
is no difference in the XCI skewing percentage between
cases and controls. The analysis adjusted by stratification
for age at blood draw in single years. We analyzed the
folded XCI skewing percentage categorically (50 to <60,
60 to <70, 70 to <80, 80 to <85, R 85), excluding homo-
zygotes from the analysis. We defined highly skewed XCI
as R 85% (6.1% of 684 heterozygotes) because the small
proportion (2.3%) of women with XCI R 90% limited
statistical power. We also report the results of the primary
analysis using R 90% as the upper cutpoint to facilitate
comparison with other studies. We used maximum likeli-
hood estimates of the odds ratios and 95% confidence
intervals to estimate associations between karyotype group
and the XCI skewing percentage, with XCI 50% to <60%
as the reference group. This analysis has the advantage
that adjusting for age by stratification requires no assump-
tions about the shape of the association between age and
the XCI skewing percentage. Because the XCI skewing
percentage may be underestimated when alleles differ by
only one CAG repeat, we repeated the analysis, excluding
the 93 (13.6%) samples in which allele sizes differed by
only one repeat. Results were unchanged (data not shown).
The second analysis used a parametric model to estimate
associations with the XCI proportion, P/100, which was
assumed to follow a symmetric beta distribution. The
beta distribution, Beta(a,b), with parameters a and b both
greater than zero, provides a flexible family of density
curves for proportions varying between 0 and 1. The
mean of the Beta(a,b) distribution is m ¼ a / (a þ b), and
the variance is m (1-m) / (a þ b þ 1). Because, in theory,
the mean of the unfolded XCI skewing percentage is 50,
we specialize the model by letting a ¼ b, denoting the
common value by q. The quantity a þ b ¼ 2q is called
The Amer
the ‘‘shape parameter’’: when q is large, the density curve
is highly peaked around the mean m ¼ 0.5; when q ¼ 1,
the density curve is flat, corresponding to a uniform distri-
bution; when q < 1, the density curve is U-shaped. For
convenience, hereafter, we refer to q itself as the shape
parameter, rather than 2q.
When the XCI proportion is modeled as a Beta(q,q) distri-
bution, the likelihood function is exactly the same whether
one uses the observed folded or unfolded XCI proportions.
The analyticmodel specifies that the logarithmof q is a linear
function of the explanatory factors (e.g., age, karyotype
group). This analysis permitted us to test the null hypothesis
that the mean of the folded XCI skewing percentage is the
same for each case group and controls. In these analyses,
we adjusted for maternal age linearly. We used maximum
likelihood to estimate the regression coefficients.
We also carried out three secondary analyses: (1)
dividing the nontrisomic chromosomally abnormal cases
into three groups: monosomy X, triploidy, other; (2)
dividing trisomic cases into three groups: acrocentric,
trisomy 16, other nonacrocentric; and (3) classifying
women by reproductive history.
Finally, we present data bearing on the consistency of
measures of XCI over time for women who entered the
study twice (n ¼ 17) and between blood and buccal
mucosa for the women (n ¼ 80) with informative assays
on both tissues.
Acknowledgments
This work was supported by a grant from the National Institutes
on Child Health and Development (R01 HD 42725). We thank
Martin Hochberg and his colleagues at The Valley Hospital in
Ridgewood, NJ, USA, for providing access to their patients. We
especially thank Arthur Christiano in Pathology, who facilitated
our work and advised on diagnostic issues. We thank Larry
Bologna, Denise Campbell, Gina Chavez, Lois Deyo, Cheryl Du-
laff, Diane Gerardi, Nancy Librera, Deborah Manente, Mary
Reiner, Louis Rizzo, Donna Rochette, and Marriett Trentacoste,
who facilitated our work at the study hospital. We thank Richard
Buchsbaum, whose programming and data management expertise
facilitated both the day-to-day fieldwork and the statistical anal-
ysis. We gratefully acknowledge Project Director L. Perry Brothers
and Fieldworkers Melissa Bieliecki, Kathleen Carstens, Beth Fish-
ner, and Renee Davenport, who assisted in tasks too countless to
list. Most of all, we thank the women who participated, without
whom this research would not have been possible.
Received: March 26, 2009
Revised: June 29, 2009
Accepted: July 1, 2009
Published online: July 23, 2009
Web Resources
The URL for data presented herein is as follows:
Online Mendelian Inheritance in Man (OMIM), http://www.ncbi.
nlm.nih.gov/omim/
ican Journal of Human Genetics 85, 179–193, August 14, 2009 191

References
1. Amos-Landgraf, J.M., Cottle, A., Plenge, R.M., Friez, M.,
Schwartz, C.E., Longshore, J., and Willard, H.F. (2006). X chro-
mosome-inactivation patterns of 1,005 phenotypically unaf-
fected females. Am. J. Hum. Genet. 79, 493–499.
2. Fialkow, P.J. (1973). Primordial cell pool size and lineage rela-
tionships of five human cell types. Ann. Hum. Genet. 37,
39–48.
3. Puck, J.M., Stewart, C.C., and Nussbaum, R.L. (1992).
Maximum-likelihood analysis of human T-cell X chromosome
inactivation patterns: Normal women versus carriers of X-
linked severe combined immunodeficiency. Am. J. Hum.
Genet. 50, 742–748.
4. Tonon, L., Bergamaschi, G., Dellavecchia, C., Rosti, V., Lucotti,
C., Malabarba, L., Novella, A., Vercesi, E., Frassoni, F., and
Cazzola, M. (1998). Unbalanced X-chromosome inactivation
in haemopoietic cells from normal women. Br. J. Haematol.
102, 996–1003.
5. Plenge, R.M., Hendrich, B.D., Schwartz, C., Arena, J.F.,
Naumova, A., Sapienza, C., Winter, R.M., and Willard, H.F.
(1997). A promoter mutation in the XIST gene in two unre-
lated families with skewed X-chromosome inactivation. Nat.
Genet. 17, 353–356.
6. Redonnet-Vernhet, I., Ploos van Amstel, J.K., Jansen, R.P.,
Wevers, R.A., Salvayre, R., and Levade, T. (1996). Uneven X
inactivation in a female monozygotic twin pair with Fabry
disease and discordant expression of a novel mutation in the
alpha-galactosidase A gene. J. Med. Genet. 33, 682–688.
7. Schroder, W., Wulff, K., Wollina, K., and Herrmann, F.H.
(1997). Haemophilia B in female twins caused by a point
mutation in one factor IX gene and nonrandom inactivation
patterns of the X-chromosomes. Thromb. Haemost. 78,
1347–1351.
8. Lau, A.W., Brown, C.J., Penaherrera, M., Langlois, S., Kalousek,
D.K., and Robinson, W.P. (1997). Skewed X-chromosome inac-
tivation is common in fetuses or newborns associated with
confined placental mosaicism. Am. J. Hum. Genet. 61,
1353–1361.
9. Migeon, B.R. (1998). Non-random X chromosome inactiva-
tion in mammalian cells. Cytogenet. Cell Genet. 80, 142–148.
10. Bolduc, V., Chagnon, P., Provost, S., Dube, M.P., Belisle, C.,
Gingras, M., Mollica, L., and Busque, L. (2008). No evidence
that skewing of X chromosome inactivation patterns is trans-
mitted to offspring in humans. J. Clin. Invest. 118, 333–341.
11. Gale, R.E., Wheadon, H., Boulos, P., and Linch, D.C. (1994).
Tissue specificity of X-chromosome inactivation patterns.
Blood 83, 2899–2905.
12. Knudsen, G.P., Pedersen, J., Klingenberg, O., Lygren, I., and
Orstavik, K.H. (2007). Increased skewing of X chromosome
inactivation with age in both blood and buccal cells. Cytoge-
net. Genome Res. 116, 24–28.
13. Sharp, A., Robinson, D., and Jacobs, P. (2000). Age- and tissue-
specific variation of X chromosome inactivation ratios in
normal women. Hum. Genet. 107, 343–349.
14. Hatakeyama, C., Anderson, C.L., Beever, C.L., Penaherrera,
M.S., Brown, C.J., and Robinson, W.P. (2004). The dynamics
of X-inactivation skewing as women age. Clin. Genet. 66,
327–332.
15. Wengler, G.S., Parolini, O., Fiorini, M., Mella, P., Smith, H.,
Ugazio, A.G., and Notarangelo, L.D. (1997). A PCR-based
non-radioactive X-chromosome inactivation assay for genetic
192 The American Journal of Human Genetics 85, 179–193, August
counseling in X-linked primary immunodeficiencies. Life Sci.
61, 1405–1411.
16. Devriendt, K., Matthijs, G., Legius, E., Schollen, E., Blockmans,
D., van Geet, C., Degreef, H., Cassiman, J.J., and Fryns, J.P.
(1997). Skewed X-chromosome inactivation in female carriers
of dyskeratosis congenita. Am. J. Hum. Genet. 60, 581–587.
17. Brown, L.Y., Alonso, M.L., Yu, J., Warburton, D., and Brown, S.
(2001). Prenatal diagnosis of a familial Xq deletion in a female
fetus: A case report. Prenat. Diagn. 21, 27–30.
18. Schmidt, M., Du Sart, D., Kalitsis, P., Fraser, N., Leversha, M.,
Voullaire, L., Foster, D., Davies, J., Hills, L., Petrovic, V., et al.
(1991). X chromosome inactivation in fibroblasts of mentally
retarded female carriers of the fragile site Xq27.3: Application
of the probe M27 beta to evaluate X inactivation status. Am. J.
Med. Genet. 38, 411–415.
19. Pegoraro, E., Whitaker, J., Mowery-Rushton, P., Surti, U.,
Lanasa, M., and Hoffman, E.P. (1997). Familial skewed X inac-
tivation: A molecular trait associated with high spontaneous-
abortion rate maps to Xq28. Am. J. Hum. Genet. 61, 160–170.
20. Lanasa, M.C., and Hogge, W.A. (2000). X chromosome defects
as an etiology of recurrent spontaneous abortion. Semin.
Reprod. Med. 18, 97–103.
21. Lanasa, M.C., Hogge, W.A., and Hoffman, E. (1999). The X
chromosome and recurrent spontaneous abortion: The signif-
icance of transmanifesting carriers. Am. J. Hum. Genet. 64,
934–938.
22. Lanasa, M.C., Hogge, W.A., Kubik, C., Blancato, J., and
Hoffman, E.P. (1999). Highly skewed X-chromosome inactiva-
tion is associated with idiopathic recurrent spontaneous abor-
tion. Am. J. Hum. Genet. 65, 252–254.
23. Lanasa, M.C., Hogge, W.A., Kubik, C.J., Ness, R.B., Harger, J.,
Nagel, T., Prosen, T., Markovic, N., and Hoffman, E.P. (2001).
A novel X chromosome-linked genetic cause of recurrent
spontaneous abortion. Am. J. Obstet. Gynecol. 185, 563–568.
24. Beever, C.L., Stephenson, M.D., Penaherrera, M.S., Jiang, R.H.,
Kalousek, D.K., Hayden, M., Field, L., Brown, C.J., and Robin-
son, W.P. (2003). Skewed X-chromosome inactivation is asso-
ciated with trisomy in women ascertained on the basis of
recurrent spontaneous abortion or chromosomally abnormal
pregnancies. Am. J. Hum. Genet. 72, 399–407.
25. Sangha, K.K., Stephenson, M.D., Brown, C.J., and Robinson,
W.P. (1999). Extremely skewed X-chromosome inactivation
is increased in women with recurrent spontaneous abortion.
Am. J. Hum. Genet. 65, 913–917.
26. Uehara, S., Hashiyada, M., Sato, K., Sato, Y., Fujimori, K., and
Okamura, K. (2001). Preferential X-chromosome inactivation
in women with idiopathic recurrent pregnancy loss. Fertil.
Steril. 76, 908–914.
27. Hogge, W.A., Prosen, T.L., Lanasa, M.C., Huber, H.A., and
Reeves, M.F. (2007). Recurrent spontaneous abortion and
skewed X-inactivation: Is there an association? Am J Obstet
Gynecol 196, e381–e386, discussion e386–e388.
28. Bagislar, S., Ustuner, I., Cengiz, B., Soylemez, F., Akyerli, C.B.,
Ceylaner, S., Ceylaner, G., Acar, A., and Ozcelik, T. (2006).
Extremely skewed X-chromosome inactivation patterns in
women with recurrent spontaneous abortion. Aust. N. Z. J.
Obstet. Gynaecol. 46, 384–387.
29. Dasoula,A.,Kalantaridou,S.,Sotiriadis,A.,Pavlou,M.,Georgiou,
I., Paraskevaidis, E., Makrigiannakis, A., and Syrrou, M. (2008).
Skewed X-chromosome inactivation in Greek women with idio-
pathic recurrent miscarriage. Fetal Diagn. Ther. 23, 198–203.
14, 2009

30. Kim, J.W., Park, S.Y., Kim, Y.M., Kim, J.M., Han, J.Y., and Ryu,
H.M. (2004). X-chromosome inactivation patterns in Korean
women with idiopathic recurrent spontaneous abortion.
J. Korean Med. Sci. 19, 258–262.
31. Kuo, P.L., Huang, S.C., Chang, L.W., Lin, C.H., Tsai, W.H., and
Teng, Y.N. (2008). Association of extremely skewed X-chromo-
some inactivation with Taiwanese women presenting with
recurrent pregnancy loss. J. Formos. Med. Assoc. 107, 340–343.
32. Sullivan, A.E., Lewis, T., Stephenson, M., Odem, R., Schreiber,
J., Ober, C., and Branch, D.W. (2003). Pregnancy outcome in
recurrent miscarriage patients with skewed X chromosome
inactivation. Obstet. Gynecol. 101, 1236–1242.
33. Stephenson, M.D., Awartani, K.A., and Robinson, W.P. (2002).
Cytogenetic analysis of miscarriages from couples with
recurrent miscarriage: A case-control study. Hum. Reprod.
17, 446–451.
34. Warburton, D. (1987). Chromosomal causes of fetal death.
Clin. Obstet. Gynecol. 30, 268–277.
35. Matthews, M.S., and Hamilton, B.E. (2002). Mean age of
mother, 1970–2000. Natl. Vital Stat. Rep. 51, 1–13.
36. Jobanputra, V., Sobrino, A., Kinney, A., Kline, J., and Warbur-
ton, D. (2002). Multiplex interphase FISH as a screen for
common aneuploidies in spontaneous abortions. Hum. Re-
prod. 17, 1166–1170.
37. Kline, J., Kinney, A., Reuss, M.L., Kelly, A., Levin, B., Ferin, M.,
and Warburton, D. (2004). Trisomic pregnancy and the oocyte
pool. Hum. Reprod. 19, 1633–1643.
38. Simpson, J.L., and Rajkovic, A. (1999). Ovarian differentiation
and gonadal failure. Am. J. Med. Genet. 89, 186–200.
39. Laml, T., Preyer, O., Umek, W., Hengstschlager, M., and
Hanzal, H. (2002). Genetic disorders in premature ovarian
failure. Hum. Reprod. Update 8, 483–491.
40. Bretherick, K.L., Metzger, D.L., Chanoine, J.P., Panagiotopou-
los, C., Watson, S.K., Lam, W.L., Fluker, M.R., Brown, C.J., and
Robinson, W.P. (2007). Skewed X-chromosome inactivation is
associated with primary but not secondary ovarian failure.
Am. J. Med. Genet. A. 143A, 945–951.
41. Sato, K., Uehara, S., Hashiyada, M., Nabeshima, H., Suga-
wara, J., Terada, Y., Yaegashi, N., and Okamura, K. (2004).
Genetic significance of skewed X-chromosome inactivation
in premature ovarian failure. Am. J. Med. Genet. A. 130,
240–244.
The Amer
42. Kline, J., and Levin, B. (1992). Trisomy and age at menopause:
Predicted associations given a link with rate of oocyte atresia.
Paediatr. Perinat. Epidemiol. 6, 225–239.
43. Warburton, D. (2005). Biological aging and the etiology of
aneuploidy. Cytogenet. Genome Res. 111, 266–272.
44. Bretherick, K., Gair, J., and Robinson, W.P. (2005). The associ-
ation of skewed X chromosome inactivation with aneuploidy
in humans. Cytogenet. Genome Res. 111, 260–265.
45. Breslow, N.E., and Day, N.E. (1980). Statistical Methods in
Cancer Research, Volume I (Lyon: The Analysis of Case-
Control Studies. IARC Scientific Publications).
46. Fleiss, J., Levin, B., and Paik, M. (2003). Statistical Methods for
Rates and Proportions (New York: Wiley).
47. Freeman, S.B., Yang, Q., Allran, K., Taft, L.F., and Sherman, S.L.
(2000). Women with a reduced ovarian complement may
have an increased risk for a child with Down syndrome. Am.
J. Hum. Genet. 66, 1680–1683.
48. Kline, J., Kinney, A., Levin, B., and Warburton, D. (2000).
Trisomic pregnancy and earlier age at menopause. Am. J.
Hum. Genet. 67, 395–404.
49. van Montfrans, J.M., Dorland, M., Oosterhuis, G.J., van Vugt,
J.M., Rekers-Mombarg, L.T., and Lambalk, C.B. (1999). Increased
concentrations of follicle-stimulating hormone in mothers of
children with Down’s syndrome. Lancet 353, 1853–1854.
50. Kline, J.,Kinney,A.,Levin,B.,Kelly,A.,Chih-Yu, J., Brown,S., and
Warburton, D. (2006). X-chromosome inactivation and ovarian
age during the reproductive years. Fertil. Steril. 85, 1488–1495.
51. Hassold, T., Hall, H., and Hunt, P. (2007). The origin of human
aneuploidy: Where we have been, where we are going. Hum
Mol Genet 16 Spec No. 2, R203–R208.
52. Christensen, K., Kristiansen, M., Hagen-Larsen, H., Skytthe, A.,
Bathum, L., Jeune, B., Andersen-Ranberg, K., Vaupel, J.W., and
Orstavik, K.H. (2000). X-linked genetic factors regulate hema-
topoietic stem-cell kinetics in females. Blood 95, 2449–2451.
53. Kristiansen, M., Knudsen, G.P., Bathum, L., Naumova, A.K.,
Sorensen, T.I., Brix, T.H., Svendsen, A.J., Christensen, K.,
Kyvik, K.O., and Orstavik, K.H. (2005). Twin study of genetic
and aging effects on X chromosome inactivation. Eur. J. Hum.
Genet. 13, 599–606.
54. Vickers, M.A., McLeod, E., Spector, T.D., and Wilson, I.J.
(2001). Assessment of mechanism of acquired skewed X inac-
tivation by analysis of twins. Blood 97, 1274–1281.
ican Journal of Human Genetics 85, 179–193, August 14, 2009 193


