Embed Size (px)
Citation preview
Skokie School District 73½
Skokie, Illinois
Comprehensive Annual Financial Report
For the Fiscal Year Ended June, 2015
SKOKIE SCHOOL DISTRICT 73-1/2
SKOKIE, ILLINOIS
COMPREHENSIVE ANNUAL FINANCIAL REPORT
For the Fiscal Year Ended June 30, 2015
Prepared By:
Ms. Cynthia Cohen Business Manager
Department Issuing Report:
Business Office
SKOKIE SCHOOL DISTRICT 73-1/2
TABLE OF CONTENTS
FOR THE FISCAL YEAR ENDED JUNE 30, 2015
PAGE INTRODUCTORY SECTION Organization Chart i Officers and Officials ii Transmittal Letter iii-vii Association of School Business Officials International - Certificate of Excellence viii FINANCIAL SECTION Independent Auditor’s Report 1 Required Supplementary Information Management’s Discussion and Analysis 4 Basic Financial Statements Government-Wide Financial Statements Statement of Net Position 12 Statement of Activities 13 Fund Financial Statements Balance Sheet – Governmental Funds 14 Reconciliation of the Balance Sheet to the Statement of Net Position 15 Statement of Revenues, Expenditures, and Changes in Fund Balances – Governmental Funds 16 Reconciliation of the Statement of Revenues, Expenditures, and Changes in Fund Balances to the Statement of Activities 17 Statement of Fiduciary Assets and Liabilities – Agency Fund 18 Notes to Basic Financial Statements 19
SKOKIE SCHOOL DISTRICT 73-1/2
TABLE OF CONTENTS
FOR THE FISCAL YEAR ENDED JUNE 30, 2015
PAGE FINANCIAL SECTION (Continued) Required Supplementary Information Illinois Municipal Retirement Fund – Schedule of Changes in the Employer’s Net Pension Liability and Related Ratios 43 Illinois Municipal Retirement Fund – Schedule of Employer Contribution 44 Teachers’ Retirement System of the State of Illinois – Schedule of the Employer’s Proportionate Share of the Net Pension Liability 45 Teachers’ Retirement System of the State of Illinois – Schedule of Employer Contribution 46 Schedule of Revenues, Expenditures, and Changes in Fund Balances – Budget and Actual – General Fund 47 Schedule of Revenues, Expenditures, and Changes in Fund Balances – Budget and Actual – Special Revenue Fund – Operations and Maintenance Fund 52 Schedule of Revenues, Expenditures, and Changes in Fund Balances – Budget and Actual – Special Revenue Fund – Transportation Fund 53 Schedule of Revenues, Expenditures, and Changes in Fund Balances – Budget and Actual – Special Revenue Fund – Illinois Municipal Retirement/Social Security Fund 54 Schedule of Revenues, Expenditures, and Changes in Fund Balances – Budget and Actual – Special Revenue Fund – Tort Immunity and Judgment Fund 56 Notes to Required Supplementary Information 57 Supplementary Information Combining Balance Sheet – General Fund 58 Combining Schedule of Revenues, Expenditures, and Changes in Fund Balances - General Fund 59
SKOKIE SCHOOL DISTRICT 73-1/2
TABLE OF CONTENTS
FOR THE FISCAL YEAR ENDED JUNE 30, 2015
PAGE FINANCIAL SECTION (Continued) Supplementary Information (Continued) Schedule of Revenues, Expenditures, and Changes in Fund Balances – Budget and Actual – General Fund – Educational Fund 60 Schedule of Revenues, Expenditures, and Changes in Fund Balances - Budget and Actual – General Fund – Working Cash Fund 65 Schedule of Revenues, Expenditures, and Changes in Fund Balances – Budget and Actual – Debt Services Fund 66
Schedule of Revenues, Expenditures, and Changes in Fund Balances – Budget and Actual – Capital Projects Fund 67 Schedule of Revenues, Expenditures, and Changes in Fund Balances – Budget and Actual – Capital Projects Fund – Fire Prevention and Life Safety Fund 68
Schedule of Changes in Fiduciary Assets and Liabilities – Agency
Fund – Activity Funds 69 Computation of Operating Expense Per Pupil and Per Capita Tuition Charge 71 STATISTICAL SECTION Schedule of Changes in Net Position 72 Schedule of Changes in Fund Balances - Governmental Funds 74 Fund Balances - Governmental Funds 75 Property Tax Levies and Collections 76 Assessed Value and Estimated Actual Value of Taxable Property 77 Property Tax Rates - Direct and Overlapping Governments 78 Schedule of Principal Taxpayers in the District 79 Schedule of Legal Debt Margins 80
SKOKIE SCHOOL DISTRICT 73-1/2
TABLE OF CONTENTS
FOR THE FISCAL YEAR ENDED JUNE 30, 2015
PAGE STATISTICAL SECTION (Continued) Schedule of Legal Debt Margin Calculation 81 Schedule of Outstanding Debt by Type 82 Schedule of Net Bonded Debt 83 Computation of Direct and Overlapping Debt 84 Demographic and Economic Statistics 85 Principal Employers 86 School Building Information 87 Number of Employees by Type 88 Operating Indicators by Function 89 Operating Costs and Tuition Charges 90
ii
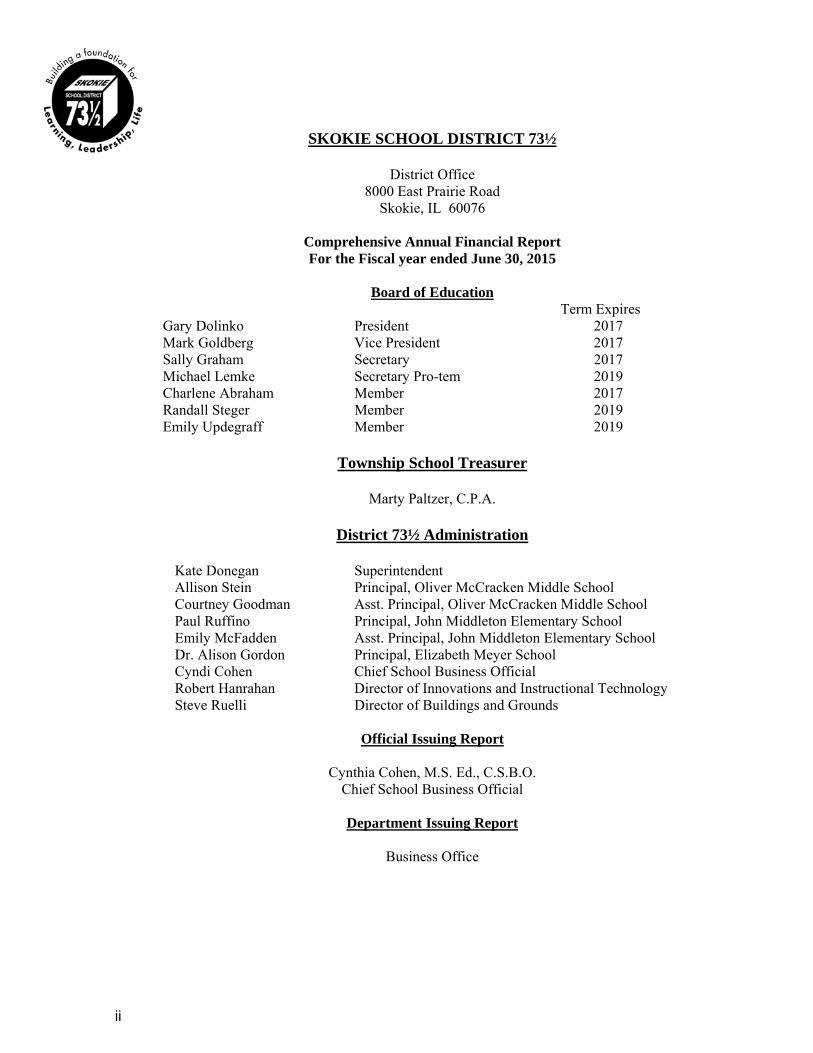
SKOKIE SCHOOL DISTRICT 73½
District Office 8000 East Prairie Road
Skokie, IL 60076
Comprehensive Annual Financial Report For the Fiscal year ended June 30, 2015
Board of Education
Term Expires Gary Dolinko President 2017
Mark Goldberg Vice President 2017 Sally Graham Secretary 2017
Michael Lemke Secretary Pro-tem 2019 Charlene Abraham Member 2017 Randall Steger Member 2019
Emily Updegraff Member 2019
Township School Treasurer
Marty Paltzer, C.P.A.
District 73½ Administration
Kate Donegan Superintendent Allison Stein Principal, Oliver McCracken Middle School Courtney Goodman Asst. Principal, Oliver McCracken Middle School Paul Ruffino Principal, John Middleton Elementary School Emily McFadden Asst. Principal, John Middleton Elementary School Dr. Alison Gordon Principal, Elizabeth Meyer School Cyndi Cohen Chief School Business Official Robert Hanrahan Director of Innovations and Instructional Technology Steve Ruelli Director of Buildings and Grounds
Official Issuing Report
Cynthia Cohen, M.S. Ed., C.S.B.O.
Chief School Business Official
Department Issuing Report
Business Office
iii
Skokie School District 73½
Oliver McCracken Middle School ● John Middleton Elementary School ● Elizabeth Meyer School
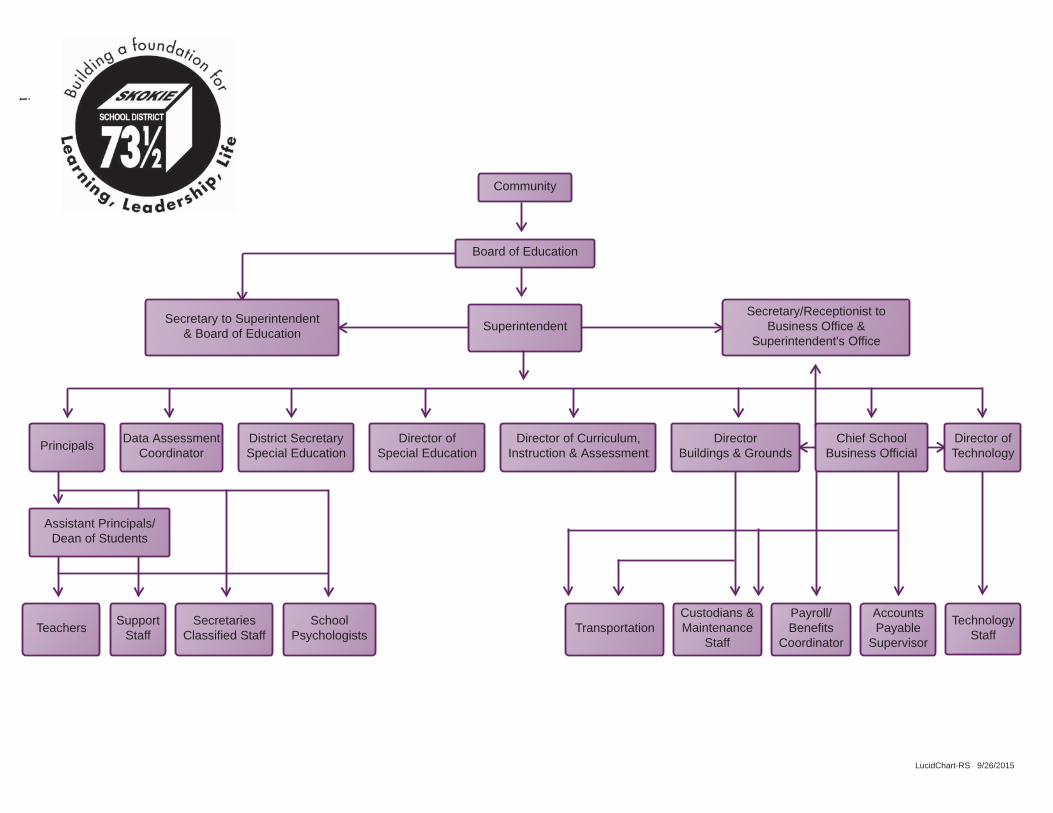
October 8, 2015 President and Members of the Board of Education Skokie School District 73½ 8000 East Prairie Road Skokie, Illinois 60076 The Comprehensive Annual Financial Report (CAFR) of Skokie School District 73½ (District) for the fiscal year ended June 30, 2015 is submitted herewith. This report was prepared by the District’s Business Office. Responsibility for both the accuracy of the data presented and the completeness and fairness of the presentation including all disclosure rests with the District. We believe the data as presented is accurate in all material aspects; that it is presented in a manner designed to fairly set forth the financial position and results of operations of the District as measured by the financial activity of its various funds; and that all disclosures necessary to enable the reader to gain the maximum understanding of the District’s financial affairs have been included. The CAFR is presented in three sections: introductory, financial, and statistical. The introductory section includes this transmittal letter, the District’s organizational chart, and a list of principal officials. The financial section includes the management’s discussion and analysis, basic financial statements including government-wide financial statements, governmental funds, and other supplemental information. Also included is the auditors’ report on the financial statements and schedules. The statistical section includes selected financial and demographic information, generally presented on a multiyear basis. Management’s discussion and analysis (MD&A) immediately follows the independent auditors’ report and provides a narrative introduction, overview, and analysis of the basic financial statements. The MD&A complements this letter of transmittal and should be read in conjunction with it. This report includes all funds of the District. For all the governmental fund-types, the District reports on a modified accrual basis of accounting, which is applied to the District’s budget and accounting records. The notes to the financial statements expand upon the modified accrual basis as well as the District’s accounting policies and procedures. All District funds are included in this report and have been audited by Eder, Casella & Co. PROFILE OF THE DISTRICT The District is an elementary (Pre-K-8) school district in Niles Township, Illinois, which operates as an independent single district. The governing body consists of a seven-member Board of Education and the three-member Niles Township Board of Trustees for Schools, who are all elected by the registered voters of Niles Township. The District’s boundaries are within the Village of Skokie. Based on the legislative authority codified in The School Code of Illinois, the Board of Education has the following powers:
a. Has the corporate power to sue and be sued in all counts, b. Has the power to levy and collect taxes and to issue bonds, c. Can contract for appointed administrators, teachers, and other personnel, as well as for goods and
services.
iv
Based on the legislative authority codified in The School Code of Illinois, the Township Trustee members have the following powers:
a. The corporate power to sue and be sued in all courts; b. The authority to hold title to all district property; c. The power to appoint the Township Treasurer who serves as legal guardian of all District funds.
District 73½ is home to approximately 1,100 pre-kindergarten through eighth grade students. Enrollment is projected to have minor fluctuations over the next five years. We have three schools: Elizabeth Meyer School (1994), John Middleton Elementary School (1955), and Oliver McCracken Middle School (1959). More than 60.3% of our students come from homes in which a language other than English is spoken – 47 languages in all. Our student population is more diverse economically, racially, ethnically, and linguistically than most schools in the surrounding suburbs. Fifteen percent of our students are limited in English language proficiency and receive service through the English Language Learners (ELL) program. The District also provides an Extended Learning Program, Early Childhood Program, band, choral music, performance arts, Spanish, experiential education, physical education, and after-school remedial and enrichment classes. The program of instruction in English is provided for students with limited English language proficiency. Students who are not proficient in English receive additional instruction by teachers who are specifically trained to teach English for second language learners. As mandated by State law, all students who come from a home where a language other than English is spoken are given an English language proficiency assessment. The District also partners with the Niles Township ELL Parent Center which provides adult English literacy programs, free family literacy classes, parenting classes, translation services, understanding of American public school system and networking with other parents. The Extended Learning Program for grades 4 through 8 provides opportunities for enrichment for qualified students. The philosophy of the Extended Learning Program is based on the principles that all students are to receive an education appropriate to their individual capabilities, interests and needs, and that students have learning opportunities that help develop their abilities to the highest level. Students identified for the program generally demonstrate the capacity for high performance beyond age/grade expectations; they are atypical learners who require specialized learning experiences beyond the regular curriculum. The District is a member of the Niles Township District for Special Education #807 (NTDSE), a nine-member cooperative providing services for children ages 3 through 21 in need of special education services in the areas of Developmental Delay, Mental Impairment, Learning Disability, and Emotional/Behavior Disorders. The District partners with the Skokie Public Library to insure that every student receives and utilizes a library card. ECONOMIC CONDITIONS AND FINANCIAL PLANNING Property taxes continue to be the District’s major revenue source. Skokie School District 73½ is currently in a strong financial position due to additional property tax revenue generated from the successful referendum which was approved overwhelmingly by the voters in March 2004.
v
Even though voters approved a tax rate increase, the District’s property tax revenues continue to be affected by the 1994 Property Tax Extension Limitation Act (Tax Cap), which limits the tax levy to 105% or the Consumer Price Index (CPI) increase (whichever is less) of the previous tax extension, excluding growth due to new construction. The CPI was 1.5% for the 2014 levy and .8% for the 2015 levy. District 73½, along with many other school districts, is experiencing an increasing number of property tax refund requests. The District continues to refund property tax collections for previous tax years’ Property Tax Appeal Board decisions, Circuit Court decisions, and tax rate objections. Taxpayers file property tax appeals either through the Property Tax Appeal Board (PTAB) or through the Circuit Court. Since 2008, these refunds total approximately $2,800,000. Five year financial projections are completed and updated throughout the year for the District. The District updates these projections in order to assist with the budgeting and planning process. It is the intent of the District to continue to spend conservatively, while seeking long-term solutions to the issues that have adversely affected the financial resources of our District.
The District has been awarded “Aa2” bond ratings by Moody’s, which is a strong bond rating. This is a direct result of the District’s internal control policies and procedures, budget oversight and fiscal management.
Salaries have been tied to the CPI-U because the largest portion of the District’s revenue, property taxes, is limited by the CPI-U. In 2014-15, the District was in the first year of a 3-year contract with the Teachers’ Association. In the 2015-16 school year, teachers will receive raises equal to 1.5% (the 2013 CPI-U), plus their “step” increases. In the 2016-17 school year, teachers will receive pay increases equal to the CPI-U for 2014 and their regular “step” increases on the salary schedule. The parties also agreed that the CPI-U increase will not be less than 1.25% nor greater than 1.75%. For the 2015-16 school year, Classified staff and Administrators will receive an overall 3.5% increase in salary, which is based on the CPI-U of 1.5%. Large capital projects for 2014-15 include painting of classrooms and hallways at McCracken, replacement of a chiller at Middleton and McCracken, replacement of glass entryways at McCracken and Middleton, and replacement of the roof at McCracken. Technology initiatives were expanded in 2014-15 and will continue through 2015-16. After the complete implementation of this initiative, every student in Grades 3 – 8 will be provided a Chromebook, and Pre-K through 2nd grade classrooms will have iPads available for student use. For additional information regarding the District’s financial position, please read the Managements’ Discussion and Analysis included in the CAFR. RELEVANT FINANCIAL POLICIES Beginning in October, budget planning begins. The proposed budget is available for public inspection and comment at least 30 days before the budget hearing. Within 30 days of adoption, the budget is filed with the Cook County Clerk’s office and filed electronically with the Illinois State Board of Education (ISBE). The Budget is also posted on the District’s website. The Board of Education may amend the budget by following the same procedure as provided for in the original adoption.
vi
Budgetary control is maintained at line-item levels and built into program and/or cost centers before being combined to form totals by fund. All actual activity compared to budget is reported to the Board of Education on a monthly basis. The District also maintains an encumbrance accounting system as one technique in accomplishing budgetary control. Encumbered amounts lapse at year-end. The District’s legal level of budgetary control (that is, the level at which expenditures cannot legally exceed the appropriated amount) is established at the individual fund level. The District maintains sound budgetary controls to ensure compliance with legal provisions embodied in the annual appropriated budget approved by the District’s Board of Education. The Board of Education maintains an established budget policy that requires unassigned reserves in the operating funds be maintained at a level equal to approximately 50% of the next year’s projected operating expense budget. The Certificate of Property Tax Levy is filed with the Cook County Clerk’s office by the last Tuesday in December. The District annually publishes a Statement of Affairs regarding its financial position by December 1st each year. The Township Treasurer invests up to 100% of available cash, timing investment maturities to actual cash needs. In addition, all checking accounts are of the interest-bearing type. Investments are maintained in Certificates of Deposit, Bank Repurchase Agreements, U.S. Treasury Obligations, and Commercial Paper. When deemed appropriate, Certificates of Deposits are collateralized beyond FDIC insurance limits. Investments in prime Commercial Paper are made well within the restrictions allowed by the Illinois School Code. The Treasurer maintains investment relationships with several major local and Chicago-based banks and commercial paper dealers. Investment strategies are structured to obtain the best yield for all invested funds, which may require rapid turnover of investment among several depositories. The Treasurer does not bid out its banking needs on an annual basis, but prefers to secure investment bids on a daily basis. Independent Audit State statutes require an annual audit of the books of accounts, financial records, and transactions of all funds of the District. The audit was performed by the independent certified public accounting firm of Eder, Casella & Co. Internal Controls The District is responsible for establishing and maintaining internal controls designed to ensure that the assets of the District are protected from loss, theft, or misuse and that adequate accounting data are compiled to allow for the preparation of financial statements in conformity with generally accepted accounting principles. The internal controls are designed to provide reasonable but not absolute assurance that: (1) the cost of a control should not exceed the benefits likely to be derived; and (2) the valuation of costs and benefits requires estimates and judgments by management. AWARDS AND ACKNOWLEGMENTS
Our music program is the best in the area, as evidenced by countless awards won over the past 20 years, including “Best Middle School Band” at the 2000, 2003, 2006, 2011, 2013 and 2015 Illinois Super State Band Contest in Champaign/Urbana, Illinois. In December of 2006 and 2013, the McCracken Symphonic Band was chosen as one of three middle school bands to perform at Midwest Clinic, an International Band and Orchestra Conference.
vii
,.. ~ ..
'>• .h' ,,, 'Co' ... !I, teadof~
The Early Childhood program at the Elizabeth Elementary School received the ExceleRate Illinois Gold Circle of Quality award. The Gold Circle of Quality recognizes programs which have demonstrated quality based on fifteen standards set by the State of Illinois. Gold Circle programs meet or exceed specific quality benchmarks on learning environment, instructional quality, and all program administrative standards; group size and staff/child ratios; staff qualifications; and professional development.
Certificate of Excellence and Achievement
The Association of School Business Officials (ASBO) awarded a Certificate of Excellence in Financial Reporting to Skokie School District 73 Y2 for its Comprehensive Annual Financial Report for fiscal years 2005, 2007, 2008, 2009, 2010, 2011, 2012, 2013 and 2014.
In order to be awarded this Certificate, the District must publish an easily readable and efficiently organized comprehensive annual financial report, whose contents conform to program standards. Such reports must satisfy both generally accepted accounting principles and applicable legal requirements.
Certificates of Excellence are valid for a period of one year only. We believe that our current report continues to conform to the Certificate requirements; and we are submitting this report to ASBO to determine its eligibility for another certificate.
Clo~·ing Comment
The purpose of the Comprehensive Annual Financial Report (CAFR) is to provide the Board of Education, the Niles Township Board of Trustees for Schools, the Township Treasurer, District administration, and other interested local citizens with a meaningful report of the District's financial condition as of June 30, 2015 .
Acknowledgments
The preparation of this report on a timely basis could not have been accomplished without the efficient and dedicated services of all members of the Business Office who assisted in the closing of the District' s financial records and the preparation of this report.
We wish to thank the members of the Board of Education-for their interest and support in planning and conducting the financial operations of the District in a responsible and progressive manner.
Res~ ctfully submitted,
~~ Cynthia Cohen Chief School Business Official
- vii -
viii
Association of School Business Officials International
The Certificate of Excellence in Financial Reporting Award
is presented to
Skokie School District 73.5
For Its Comprehensive Annual Financial Report (CAFR) For the Fiscal Year Ended June 30, 2014
The CAFR has been reviewed and met or exceeded
ASBO International’s Certificate of Excellence standards
Mark C. Pepera, MBA, RSBO, SFO John D. Musso, CAE, RSBA President Executive Director
Page 1
INDEPENDENT AUDITOR’S REPORT To the Board of Education Skokie School District No. 73-1/2 Skokie, Illinois We have audited the accompanying financial statements of the governmental activities, each major fund, and the aggregate remaining fund information of
SKOKIE SCHOOL DISTRICT NO. 73-1/2 as of and for the year ended June 30, 2015, and the related notes to the financial statements, which collectively comprise the District’s basic financial statements as listed in the table of contents. Management’s Responsibility for the Financial Statements Management is responsible for the preparation and fair presentation of these financial statements in accordance with accounting principles generally accepted in the United States of America; this includes the design, implementation, and maintenance of internal control relevant to the preparation and fair presentation of financial statements that are free from material misstatement, whether due to fraud or error. Auditor’s Responsibility Our responsibility is to express opinions on these financial statements based on our audit. We conducted our audit in accordance with auditing standards generally accepted in the United States of America and the standards applicable to financial audits contained in Government Auditing Standards, issued by the Comptroller General of the United States. Those standards require that we plan and perform the audit to obtain reasonable assurance about whether the financial statements are free from material misstatement. An audit involves performing procedures to obtain audit evidence about the amounts and disclosures in the financial statements. The procedures selected depend on the auditor’s judgment, including the assessment of the risks of material misstatement of the financial statements, whether due to fraud or error. In making those risk assessments, the auditor considers internal control relevant to the entity’s preparation and fair presentation of the financial statements in order to design audit procedures that are appropriate in the circumstances, but not for the purpose of expressing an opinion on the effectiveness of the entity’s internal control. Accordingly, we express no such opinion. An audit also includes evaluating the appropriateness of accounting policies used and the reasonableness of significant accounting estimates made by management, as well as evaluating the overall presentation of the financial statements. We believe that the audit evidence we have obtained is sufficient and appropriate to provide a basis for our audit opinions.
Page 2
Opinions In our opinion, the financial statements referred to above present fairly, in all material respects, the respective financial position of the governmental activities, each major fund, and the aggregate remaining fund information of Skokie School District No. 73-1/2, as of June 30, 2015, and the respective changes in financial position thereof for the year then ended in accordance with accounting principles generally accepted in the United States of America. Change in Accounting Principle As described in Note 17 to the financial statements, in 2015 the District adopted new accounting guidance, GASB Statement No. 68, Accounting and Financial Reporting for Pensions and GASB Statement No. 71, Pension Transition for Contributions Made Subsequent to the Measurement Date. Our opinion is not modified with respect to this matter. Other Matters Required Supplementary Information Accounting principles generally accepted in the United States of America require that the Management’s Discussion and Analysis, Schedule of Changes in the Employer’s Net Pension Liability and Related Ratios, Schedules of Employer Contribution, Schedule of the Employer’s Proportionate Share of the Net Pension Liability, and budgetary comparison information on pages 4 through 11 and 43 through 57 be presented to supplement the basic financial statements. Such information, although not a part of the basic financial statements, is required by the Governmental Accounting Standards Board, who considers it to be an essential part of financial reporting for placing the basic financial statements in an appropriate operational, economic, or historical context. We have applied certain limited procedures to the required supplementary information in accordance with auditing standards generally accepted in the United States of America, which consisted of inquiries of management about the methods of preparing the information and comparing the information for consistency with management’s responses to our inquiries, the basic financial statements, and other knowledge we obtained during our audit of the basic financial statements. We do not express an opinion or provide any assurance on the information because the limited procedures do not provide us with sufficient evidence to express an opinion or provide any assurance. Other Information Our audit was conducted for the purpose of forming opinions on the financial statements that collectively comprise Skokie School District No. 73-1/2’s basic financial statements. The introductory section, supplemental information and statistical section as listed in the table of contents are presented for purposes of additional analysis and are not a required part of the basic financial statements. The supplemental information is the responsibility of management and was derived from and relates directly to the underlying accounting and other records used to prepare the basic financial statements. Such information, except for the average daily attendance figure included in the computation of operating expense per pupil and per capita tuition charges, has been subjected to the auditing procedures applied in the audit of the basic financial statements and certain additional procedures, including comparing and reconciling such information directly to the underlying accounting and other records used to prepare the basic financial statements or to the basic financial statements themselves, and other additional procedures in accordance with auditing standards generally accepted in the United States of America. In our opinion, the supplemental information is fairly stated in all material respects in relation to the basic financial statements as a whole.
Page 3
The introductory and statistical sections have not been subjected to the auditing procedures applied in the audit of the basic financial statements and, accordingly, we do not express an opinion or provide any assurance on them. Other Reporting Required by Government Auditing Standards In accordance with Government Auditing Standards, we have also issued our report dated October 8, 2015, on our consideration of Skokie School District No. 73-1/2’s internal control over financial reporting and on our tests of its compliance with certain provisions of laws, regulations, contracts, and grant agreements and other matters. The purpose of that report is to describe the scope of our testing of internal control over financial reporting and compliance and the results of that testing, and not to provide an opinion on internal control over financial reporting or on compliance. That report is an integral part of an audit performed in accordance with Government Auditing Standards in considering Skokie School District No. 73-1/2’s internal control over financial reporting and compliance.
EDER, CASELLA & CO. Certified Public Accountants McHenry, Illinois October 8, 2015
REQUIRED SUPPLEMENTARY INFORMATION
Page 4
SKOKIE SCHOOL DISTRICT 73-1/2 MANAGEMENT’S DISCUSSION AND ANALYSIS
JUNE 30, 2015 As management of Skokie School District 73-1/2 (District), we offer readers of the District’s statements this narrative overview and analysis of the financial activities for the fiscal year ended June 30, 2015. FINANCIAL HIGHLIGHTS
The assets and deferred outflows of resources of the District exceeded its liabilities and deferred inflows of resources at June 30, 2015 by $34,514,996 (net position).
The District’s total net position increased by $1,902,214.
At June 30, 2015, the District reported combined ending fund balances of $28,103,900, an increase of $1,006,839 in comparison with the prior year. 71% of this fund balance is available for spending at the District’s discretion (unassigned fund balance - $20,062,153).
At June 30, 2015, the unassigned fund balance for the General Fund was $20,259,883, or 113% of total General Fund expenditures.
The District’s total long-term debt decreased by $1,085,000 (19%) during the year ended June 30, 2015. The key factor in this decrease was principal payments made on the debt.
OVERVIEW OF FINANCIAL STATEMENTS This discussion and analysis are intended to serve as an introduction to the District’s basic financial statements. The basic financial statements comprise three components:
Government-wide financial statements,
Fund financial statements, and
Notes to the financial statements This report also contains other supplementary information in addition to the basic financial statements themselves. Government-wide financial statements - The government-wide financial statements are designed to provide readers with a broad overview of the District’s finances, in a manner similar to a private-sector business. The Statement of Net Position presents information on all of the District’s assets and deferred outflows of resources, less its liabilities and deferred inflows of resources, with the difference reported as net position. Over time, increases or decreases in net position may serve as a useful indicator of whether the financial position of the District is improving or deteriorating. The Statement of Activities presents information showing how the District’s net position changed during the most recent fiscal year. All changes in net position are reported as soon as the underlying event giving rise to the change occurs, regardless of the timing of the related cash flows. Thus, revenues and expenses are reported in this statement for some items that will only result in cash flows in future fiscal periods (e.g., uncollected taxes).
Page 5
Both of the government-wide financial statements distinguish functions of the District that are principally supported by taxes and intergovernmental revenues (governmental activities). Governmental activities include instruction, support services, operations and maintenance, transportation, food services, and certain other activities and expenses such as payments to other districts and governmental units, and interest and fees. The government-wide financial statements can be found on pages 12 and 13 of this report. Fund financial statements - A fund is a grouping of related accounts that is used to maintain control over resources that have been segregated for specific activities or objectives. The District, like other state and local governments, uses fund accounting to ensure and demonstrate compliance with finance-related legal requirements. All of the funds of the District can be divided into two categories: governmental funds and fiduciary funds. Governmental Funds - Governmental funds are used to account for essentially the same functions reported as governmental activities in the government-wide financial statements. However, unlike the government-wide financial statements, governmental fund financial statements focus on near-term inflows and outflows of spendable resources, as well as on balances of spendable resources available at the end of the fiscal year. Such information may be useful in evaluating a government’s near-term financing requirements. Because the focus of governmental funds is narrower than that of the government-wide financial statements, it is useful to compare the information presented for governmental funds with similar information presented for governmental activities in the government-wide financial statements. By doing so, readers may better understand the long-term impact of the District’s near-term financing decisions. Both the governmental fund Balance Sheet and the governmental fund Statement of Revenues, Expenditures, and Changes in Fund Balances provide a reconciliation to facilitate this comparison between governmental funds and governmental activities. The District maintains eight individual governmental funds. Information is presented separately in the governmental fund Balance Sheet and in the governmental fund Statement of Revenues, Expenditures, and Changes in Fund Balances for the General, Operations and Maintenance, Debt Services, Transportation, Illinois Municipal Retirement/Social Security, Capital Projects, Tort Immunity and Judgment, and Fire Prevention and Life Safety Funds, all of which the District considers to be major funds. The District adopts an annual budget for each of the funds listed above. A budgetary comparison statement, which is required supplementary information, has been provided for the General Fund and each major special revenue fund to demonstrate compliance with this budget. The basic fund financial statements can be found on pages 14 through 17 and the required supplementary information can be found on pages 43 through 57 of this report. Fiduciary Funds - Fiduciary funds are used to account for assets held for others, such as student activity funds. Fiduciary funds are not reflected in the government-wide financial statements because the assets of these funds are not available to support the District’s operations. The basic fiduciary fund financial statement can be found on page 18 of this report.
Page 6
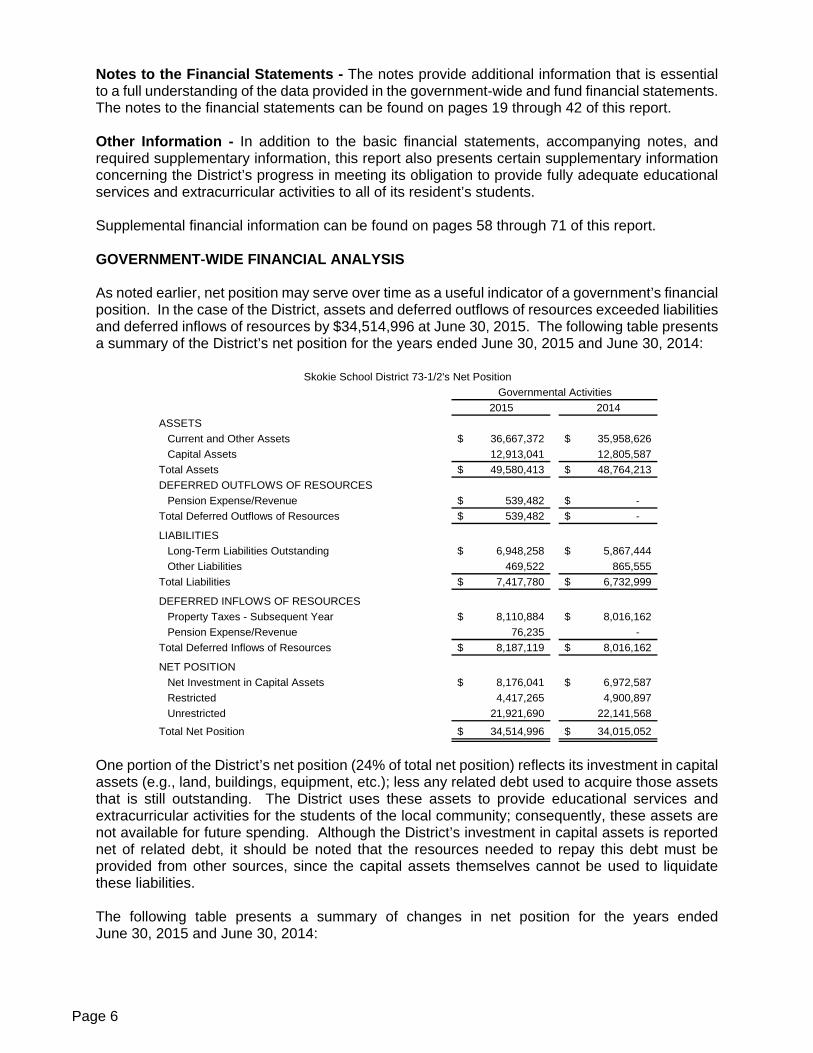
Notes to the Financial Statements - The notes provide additional information that is essential to a full understanding of the data provided in the government-wide and fund financial statements. The notes to the financial statements can be found on pages 19 through 42 of this report. Other Information - In addition to the basic financial statements, accompanying notes, and required supplementary information, this report also presents certain supplementary information concerning the District’s progress in meeting its obligation to provide fully adequate educational services and extracurricular activities to all of its resident’s students. Supplemental financial information can be found on pages 58 through 71 of this report. GOVERNMENT-WIDE FINANCIAL ANALYSIS As noted earlier, net position may serve over time as a useful indicator of a government’s financial position. In the case of the District, assets and deferred outflows of resources exceeded liabilities and deferred inflows of resources by $34,514,996 at June 30, 2015. The following table presents a summary of the District’s net position for the years ended June 30, 2015 and June 30, 2014:
2015 2014ASSETS
Current and Other Assets 36,667,372$ 35,958,626$ Capital Assets 12,913,041 12,805,587
Total Assets 49,580,413$ 48,764,213$ DEFERRED OUTFLOWS OF RESOURCES
Pension Expense/Revenue 539,482$ -$ Total Deferred Outflows of Resources 539,482$ -$
LIABILITIESLong-Term Liabilities Outstanding 6,948,258$ 5,867,444$ Other Liabilities 469,522 865,555
Total Liabilities 7,417,780$ 6,732,999$
DEFERRED INFLOWS OF RESOURCESProperty Taxes - Subsequent Year 8,110,884$ 8,016,162$ Pension Expense/Revenue 76,235 -
Total Deferred Inflows of Resources 8,187,119$ 8,016,162$
NET POSITIONNet Investment in Capital Assets 8,176,041$ 6,972,587$ Restricted 4,417,265 4,900,897 Unrestricted 21,921,690 22,141,568
Total Net Position 34,514,996$ 34,015,052$
Skokie School District 73-1/2's Net PositionGovernmental Activities
One portion of the District’s net position (24% of total net position) reflects its investment in capital assets (e.g., land, buildings, equipment, etc.); less any related debt used to acquire those assets that is still outstanding. The District uses these assets to provide educational services and extracurricular activities for the students of the local community; consequently, these assets are not available for future spending. Although the District’s investment in capital assets is reported net of related debt, it should be noted that the resources needed to repay this debt must be provided from other sources, since the capital assets themselves cannot be used to liquidate these liabilities. The following table presents a summary of changes in net position for the years ended June 30, 2015 and June 30, 2014:
Page 7
2015 2014Revenues
Program RevenuesCharges for Services 825,758$ 761,475$ Operating Grants and Contributions 4,990,153 3,844,841 Capital Grants and Contributions 72,496 51,486
General RevenuesProperty Taxes 15,628,757 15,466,113 Other Taxes 500,730 465,787 Grants and Contributions not Restricted to Specific Activities 687,713 685,840 Unrestricted Investment Earnings 883,685 148,912 Gain/(Loss) on Sale of Capital Assets (12,330) - Miscellaneous 11,830 7,578
Total Revenues 23,588,792$ 21,432,032$
ExpensesInstruction
Regular Programs 6,894,394$ 6,230,658$ Special Education Programs 1,417,899 1,333,101 Other Instructional Programs 1,042,886 936,748
Support ServicesPupils 1,044,849 963,203 Instructional Staff 699,224 497,319 General Administration 611,383 588,308 School Administration 1,338,941 1,320,968 Business 649,793 584,196 Facilities Acquisition and Construction 43,063 100,024 Operations and Maintenance 1,283,645 1,193,289 Transportation 657,717 649,918 Food Services 317,906 313,023 Central 557,997 473,083
Community Services 43,541 37,532 Payments to Other Districts and Governmental Units 1,103,776 967,507 Interest and Fees on Long-Term Debt 213,751 251,254 On-Behalf Retirement Contributions 3,765,813 2,672,987
Total Expenses 21,686,578$ 19,113,118$
Change in Net Position 1,902,214$ 2,318,914$ Net Position - Beginning of Fiscal Year 34,015,052 31,696,138 Net Assets Adjustment (1,402,270) -
Net Position - End of Fiscal Year 34,514,996$ 34,015,052$
Skokie School District 73-1/2's Change in Net PositionGovernmental Activities
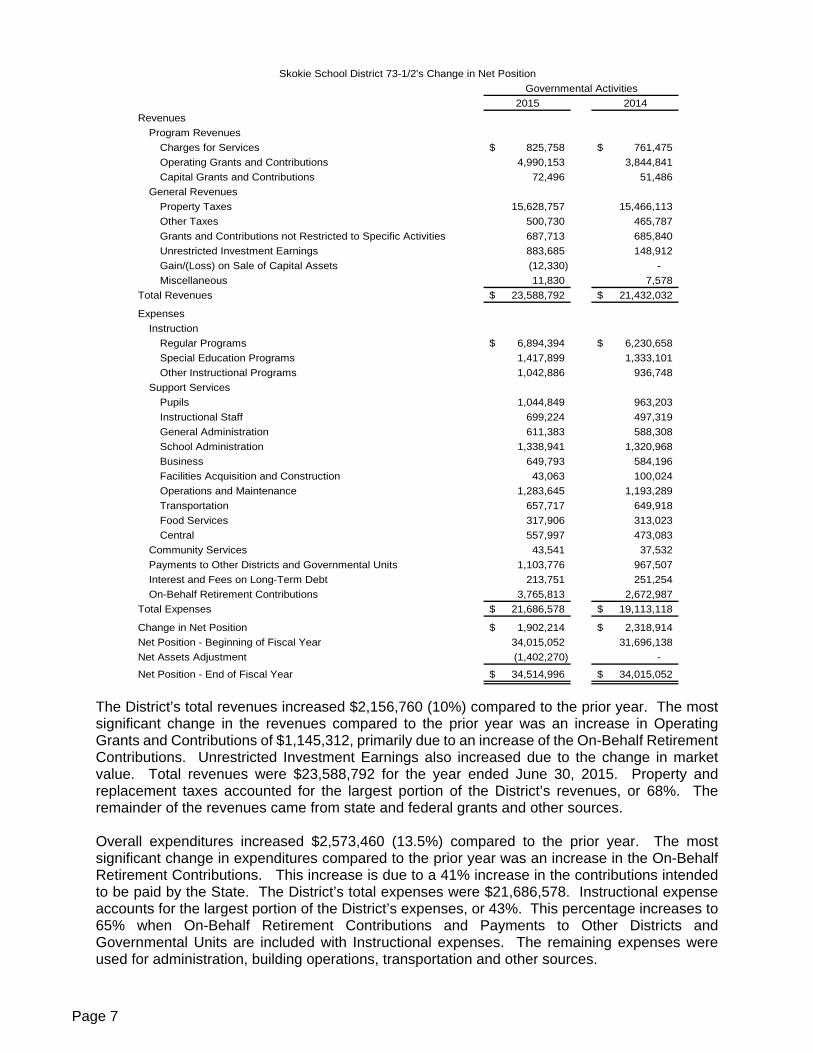
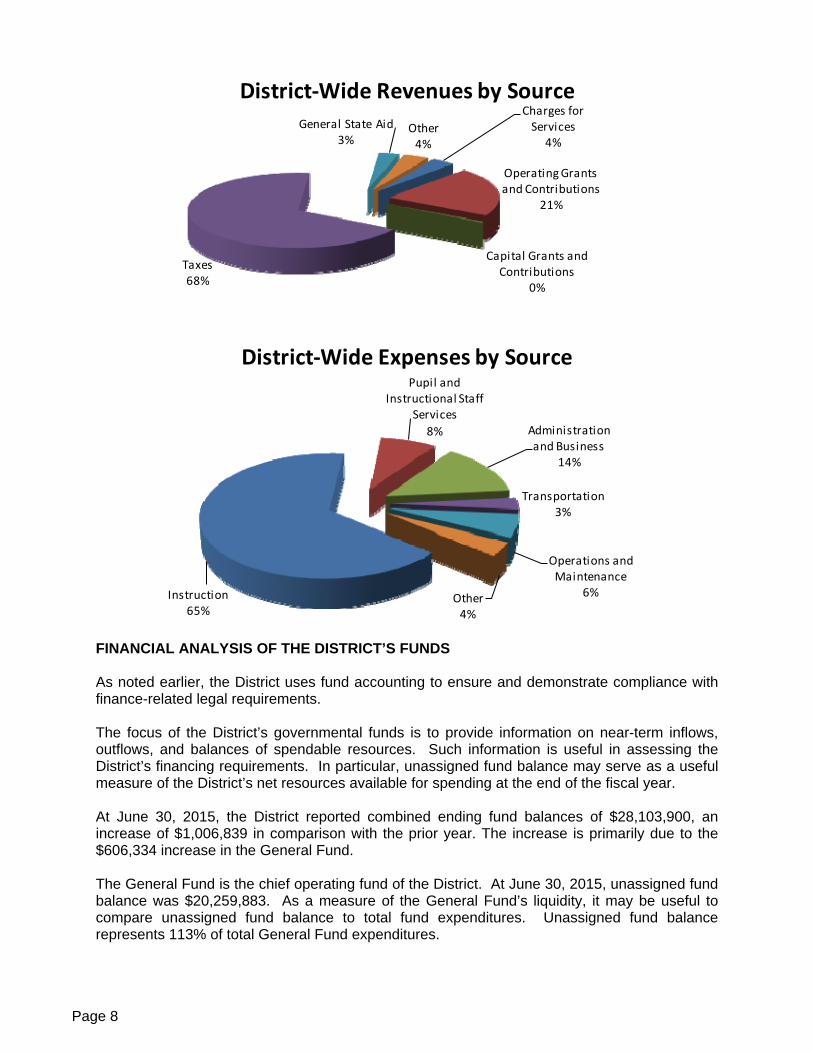
The District’s total revenues increased $2,156,760 (10%) compared to the prior year. The most significant change in the revenues compared to the prior year was an increase in Operating Grants and Contributions of $1,145,312, primarily due to an increase of the On-Behalf Retirement Contributions. Unrestricted Investment Earnings also increased due to the change in market value. Total revenues were $23,588,792 for the year ended June 30, 2015. Property and replacement taxes accounted for the largest portion of the District’s revenues, or 68%. The remainder of the revenues came from state and federal grants and other sources. Overall expenditures increased $2,573,460 (13.5%) compared to the prior year. The most significant change in expenditures compared to the prior year was an increase in the On-Behalf Retirement Contributions. This increase is due to a 41% increase in the contributions intended to be paid by the State. The District’s total expenses were $21,686,578. Instructional expense accounts for the largest portion of the District’s expenses, or 43%. This percentage increases to 65% when On-Behalf Retirement Contributions and Payments to Other Districts and Governmental Units are included with Instructional expenses. The remaining expenses were used for administration, building operations, transportation and other sources.
Page 8
Charges for Services
4%
Operating Grants and Contributions
21%
Capital Grants and Contributions
0%
Taxes68%
General State Aid3%
Other4%
District‐Wide Revenues by Source
Instruction65%
Pupil and Instructional Staff
Services
8% Administration and Business
14%
Transportation3%
Operations and Maintenance
6%Other4%
District‐Wide Expenses by Source
FINANCIAL ANALYSIS OF THE DISTRICT’S FUNDS As noted earlier, the District uses fund accounting to ensure and demonstrate compliance with finance-related legal requirements. The focus of the District’s governmental funds is to provide information on near-term inflows, outflows, and balances of spendable resources. Such information is useful in assessing the District’s financing requirements. In particular, unassigned fund balance may serve as a useful measure of the District’s net resources available for spending at the end of the fiscal year. At June 30, 2015, the District reported combined ending fund balances of $28,103,900, an increase of $1,006,839 in comparison with the prior year. The increase is primarily due to the $606,334 increase in the General Fund. The General Fund is the chief operating fund of the District. At June 30, 2015, unassigned fund balance was $20,259,883. As a measure of the General Fund’s liquidity, it may be useful to compare unassigned fund balance to total fund expenditures. Unassigned fund balance represents 113% of total General Fund expenditures.
Page 9
The Operations and Maintenance Fund’s fund balance increased $63,749 in comparison with the prior year. This increase is due to a smaller interfund transfer to Capital Projects Fund in fiscal year 2015 than in 2014. The Debt Services Fund’s fund balance increased by $87,616 in comparison with the prior year. This increase is due to an increase in property tax revenue as well as a decrease in the scheduled debt payments. The Transportation Fund’s fund balance decreased by $221,236 in comparison with the prior year. This decrease is due to a large interfund transfer to the General Fund in fiscal year 2015. The Illinois Municipal Retirement/Social Security Fund’s fund balance increased by $257,680 in comparison with the prior year. This increase is due to higher property tax revenue and less employee benefits expenses. The Capital Projects Fund’s fund balance decreased by $144,530 in comparison with the prior year. This decrease is due to a smaller interfund transfer from the Operations and Maintenance Fund. The Tort Immunity and Judgment Fund’s fund balance increased by $186,856 in comparison with the prior year. This increase is due to higher property tax revenue. The Fire Prevention and Life Safety Fund’s fund balance increased by $170,370 in comparison with the prior year. This increase is due to higher property tax revenue and an interfund transfer from the Operations and Maintenance Fund. GENERAL FUND BUDGETARY HIGHLIGHTS General Fund revenues and expenditures are a combination of the Educational Fund and the Working Cash Fund. Actual revenues exceeded budgeted revenue by $1,154,347. This was primarily attributable to higher than expected On-Behalf Payments. Actual expenditures exceeded budgeted expenditures by $564,713. This was primarily attributable to higher than expected On-Behalf Payments. CAPITAL ASSET AND DEBT ADMINISTRATION Capital assets – The District’s investment in capital assets as of June 30, 2015 amounts to $12,913,041 (net of accumulated depreciation). This investment in capital assets includes land, construction in progress, buildings, improvements other than buildings, equipment other than transportation, and transportation equipment. Some of the more significant capital asset events during the year ended June 30, 2015 were as follows:
Purchase of a John Deere tractor (skid steer) - $49,300
Glass entryway replacement project at Middleton and McCracken - $74,180
Chiller replacement at Middleton - $91,500
Painting project at McCracken - $52,735
Roof replacement project at McCracken and Middleton gym - $619,700
Page 10
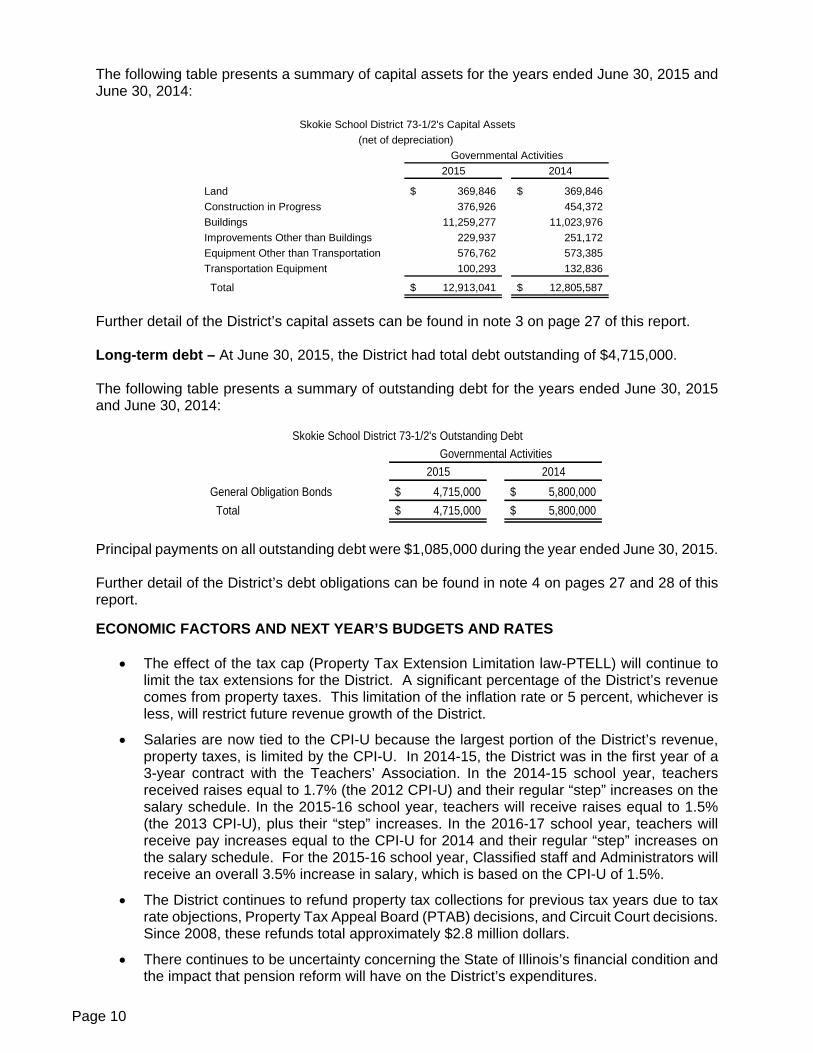
The following table presents a summary of capital assets for the years ended June 30, 2015 and June 30, 2014:
2015 2014
Land 369,846$ 369,846$ Construction in Progress 376,926 454,372 Buildings 11,259,277 11,023,976 Improvements Other than Buildings 229,937 251,172 Equipment Other than Transportation 576,762 573,385 Transportation Equipment 100,293 132,836
Total 12,913,041$ 12,805,587$
(net of depreciation)Governmental Activities
Skokie School District 73-1/2's Capital Assets
Further detail of the District’s capital assets can be found in note 3 on page 27 of this report. Long-term debt – At June 30, 2015, the District had total debt outstanding of $4,715,000. The following table presents a summary of outstanding debt for the years ended June 30, 2015 and June 30, 2014:
2015 2014General Obligation Bonds 4,715,000$ 5,800,000$ Total 4,715,000$ 5,800,000$
Governmental ActivitiesSkokie School District 73-1/2's Outstanding Debt
Principal payments on all outstanding debt were $1,085,000 during the year ended June 30, 2015. Further detail of the District’s debt obligations can be found in note 4 on pages 27 and 28 of this report. ECONOMIC FACTORS AND NEXT YEAR’S BUDGETS AND RATES
The effect of the tax cap (Property Tax Extension Limitation law-PTELL) will continue to limit the tax extensions for the District. A significant percentage of the District’s revenue comes from property taxes. This limitation of the inflation rate or 5 percent, whichever is less, will restrict future revenue growth of the District.
Salaries are now tied to the CPI-U because the largest portion of the District’s revenue, property taxes, is limited by the CPI-U. In 2014-15, the District was in the first year of a 3-year contract with the Teachers’ Association. In the 2014-15 school year, teachers received raises equal to 1.7% (the 2012 CPI-U) and their regular “step” increases on the salary schedule. In the 2015-16 school year, teachers will receive raises equal to 1.5% (the 2013 CPI-U), plus their “step” increases. In the 2016-17 school year, teachers will receive pay increases equal to the CPI-U for 2014 and their regular “step” increases on the salary schedule. For the 2015-16 school year, Classified staff and Administrators will receive an overall 3.5% increase in salary, which is based on the CPI-U of 1.5%.
The District continues to refund property tax collections for previous tax years due to tax rate objections, Property Tax Appeal Board (PTAB) decisions, and Circuit Court decisions. Since 2008, these refunds total approximately $2.8 million dollars.
There continues to be uncertainty concerning the State of Illinois’s financial condition and the impact that pension reform will have on the District’s expenditures.
Page 11
Health insurance costs have increased over recent years, and will continue to increase for the foreseeable future.
REQUESTS FOR INFORMATION This financial report is designed to provide citizens, taxpayers, parents, students, investors, and creditors with a general overview of the District’s finances and to demonstrate its accountability for the money it receives. If there are questions about this report or additional information is needed please contact the District at the following address:
Skokie School District 73-1/2 Business Office
8000 East Prairie Road Skokie, IL 60076
BASIC FINANCIAL STATEMENTS
Page 12The Notes to Basic Financial Statements are an integral part of this statement.
GovernmentalActivities
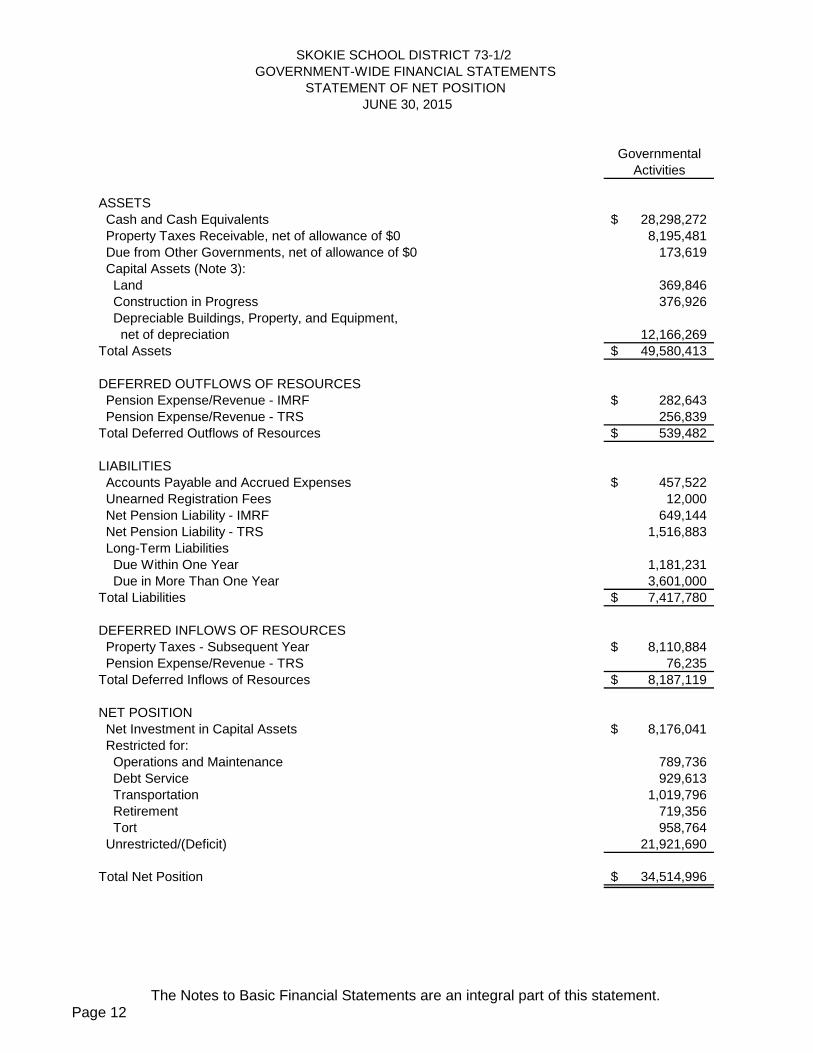
ASSETS Cash and Cash Equivalents 28,298,272$ Property Taxes Receivable, net of allowance of $0 8,195,481 Due from Other Governments, net of allowance of $0 173,619 Capital Assets (Note 3): Land 369,846 Construction in Progress 376,926 Depreciable Buildings, Property, and Equipment, net of depreciation 12,166,269Total Assets 49,580,413$
DEFERRED OUTFLOWS OF RESOURCES Pension Expense/Revenue - IMRF 282,643$ Pension Expense/Revenue - TRS 256,839Total Deferred Outflows of Resources 539,482$
LIABILITIES Accounts Payable and Accrued Expenses 457,522$ Unearned Registration Fees 12,000 Net Pension Liability - IMRF 649,144 Net Pension Liability - TRS 1,516,883 Long-Term Liabilities Due Within One Year 1,181,231 Due in More Than One Year 3,601,000Total Liabilities 7,417,780$
DEFERRED INFLOWS OF RESOURCES Property Taxes - Subsequent Year 8,110,884$ Pension Expense/Revenue - TRS 76,235Total Deferred Inflows of Resources 8,187,119$
NET POSITION Net Investment in Capital Assets 8,176,041$ Restricted for: Operations and Maintenance 789,736 Debt Service 929,613 Transportation 1,019,796 Retirement 719,356 Tort 958,764 Unrestricted/(Deficit) 21,921,690
Total Net Position 34,514,996$
JUNE 30, 2015
SKOKIE SCHOOL DISTRICT 73-1/2
STATEMENT OF NET POSITIONGOVERNMENT-WIDE FINANCIAL STATEMENTS
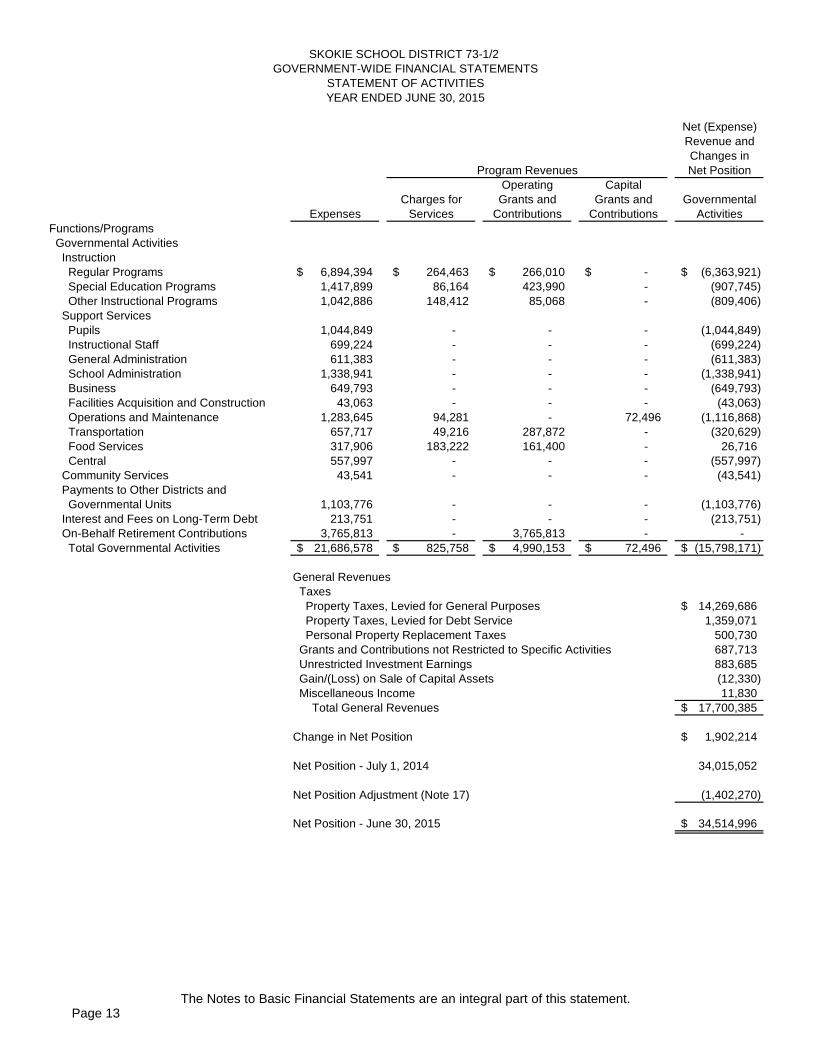
Page 13The Notes to Basic Financial Statements are an integral part of this statement.
Net (Expense)Revenue andChanges inNet Position
Operating CapitalCharges for Grants and Grants and Governmental
Expenses Services Contributions Contributions ActivitiesFunctions/Programs Governmental Activities Instruction Regular Programs 6,894,394$ 264,463$ 266,010$ -$ (6,363,921)$ Special Education Programs 1,417,899 86,164 423,990 - (907,745) Other Instructional Programs 1,042,886 148,412 85,068 - (809,406) Support Services Pupils 1,044,849 - - - (1,044,849) Instructional Staff 699,224 - - - (699,224) General Administration 611,383 - - - (611,383) School Administration 1,338,941 - - - (1,338,941) Business 649,793 - - - (649,793) Facilities Acquisition and Construction 43,063 - - - (43,063) Operations and Maintenance 1,283,645 94,281 - 72,496 (1,116,868) Transportation 657,717 49,216 287,872 - (320,629) Food Services 317,906 183,222 161,400 - 26,716 Central 557,997 - - - (557,997) Community Services 43,541 - - - (43,541) Payments to Other Districts and Governmental Units 1,103,776 - - - (1,103,776) Interest and Fees on Long-Term Debt 213,751 - - - (213,751) On-Behalf Retirement Contributions 3,765,813 - 3,765,813 - - Total Governmental Activities 21,686,578$ 825,758$ 4,990,153$ 72,496$ (15,798,171)$
General Revenues Taxes Property Taxes, Levied for General Purposes 14,269,686$ Property Taxes, Levied for Debt Service 1,359,071 Personal Property Replacement Taxes 500,730 Grants and Contributions not Restricted to Specific Activities 687,713 Unrestricted Investment Earnings 883,685 Gain/(Loss) on Sale of Capital Assets (12,330) Miscellaneous Income 11,830 Total General Revenues 17,700,385$
Change in Net Position 1,902,214$
Net Position - July 1, 2014 34,015,052
Net Position Adjustment (Note 17) (1,402,270)
Net Position - June 30, 2015 34,514,996$
SKOKIE SCHOOL DISTRICT 73-1/2 GOVERNMENT-WIDE FINANCIAL STATEMENTS
STATEMENT OF ACTIVITIESYEAR ENDED JUNE 30, 2015
Program Revenues
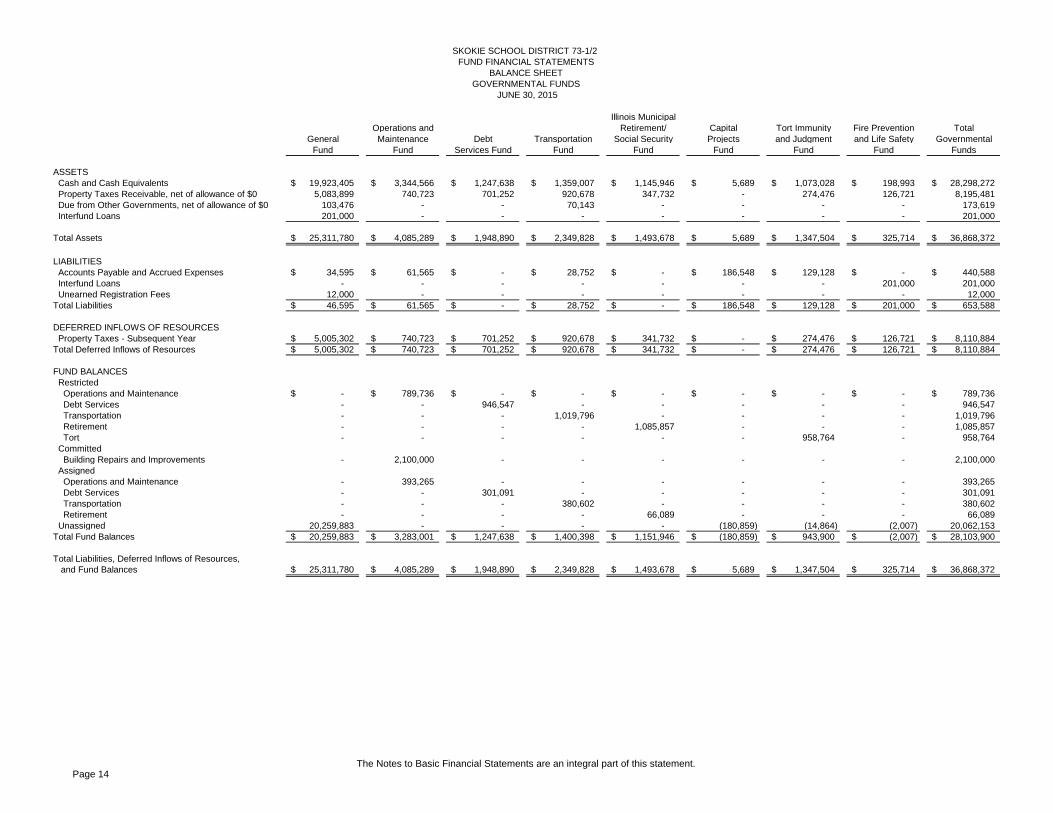
Page 14The Notes to Basic Financial Statements are an integral part of this statement.
Illinois MunicipalOperations and Retirement/ Capital Tort Immunity Fire Prevention Total
General Maintenance Debt Transportation Social Security Projects and Judgment and Life Safety GovernmentalFund Fund Services Fund Fund Fund Fund Fund Fund Funds
ASSETS Cash and Cash Equivalents 19,923,405$ 3,344,566$ 1,247,638$ 1,359,007$ 1,145,946$ 5,689$ 1,073,028$ 198,993$ 28,298,272$ Property Taxes Receivable, net of allowance of $0 5,083,899 740,723 701,252 920,678 347,732 - 274,476 126,721 8,195,481 Due from Other Governments, net of allowance of $0 103,476 - - 70,143 - - - - 173,619 Interfund Loans 201,000 - - - - - - - 201,000
Total Assets 25,311,780$ 4,085,289$ 1,948,890$ 2,349,828$ 1,493,678$ 5,689$ 1,347,504$ 325,714$ 36,868,372$
LIABILITIES Accounts Payable and Accrued Expenses 34,595$ 61,565$ -$ 28,752$ -$ 186,548$ 129,128$ -$ 440,588$ Interfund Loans - - - - - - - 201,000 201,000 Unearned Registration Fees 12,000 - - - - - - - 12,000 Total Liabilities 46,595$ 61,565$ -$ 28,752$ -$ 186,548$ 129,128$ 201,000$ 653,588$
DEFERRED INFLOWS OF RESOURCES Property Taxes - Subsequent Year 5,005,302$ 740,723$ 701,252$ 920,678$ 341,732$ -$ 274,476$ 126,721$ 8,110,884$ Total Deferred Inflows of Resources 5,005,302$ 740,723$ 701,252$ 920,678$ 341,732$ -$ 274,476$ 126,721$ 8,110,884$
FUND BALANCES Restricted Operations and Maintenance -$ 789,736$ -$ -$ -$ -$ -$ -$ 789,736$ Debt Services - - 946,547 - - - - - 946,547 Transportation - - - 1,019,796 - - - - 1,019,796 Retirement - - - - 1,085,857 - - - 1,085,857 Tort - - - - - - 958,764 - 958,764 Committed Building Repairs and Improvements - 2,100,000 - - - - - - 2,100,000 Assigned Operations and Maintenance - 393,265 - - - - - - 393,265 Debt Services - - 301,091 - - - - - 301,091 Transportation - - - 380,602 - - - - 380,602 Retirement - - - - 66,089 - - - 66,089 Unassigned 20,259,883 - - - - (180,859) (14,864) (2,007) 20,062,153Total Fund Balances 20,259,883$ 3,283,001$ 1,247,638$ 1,400,398$ 1,151,946$ (180,859)$ 943,900$ (2,007)$ 28,103,900$
Total Liabilities, Deferred Inflows of Resources, and Fund Balances 25,311,780$ 4,085,289$ 1,948,890$ 2,349,828$ 1,493,678$ 5,689$ 1,347,504$ 325,714$ 36,868,372$
SKOKIE SCHOOL DISTRICT 73-1/2 FUND FINANCIAL STATEMENTS
BALANCE SHEETGOVERNMENTAL FUNDS
JUNE 30, 2015
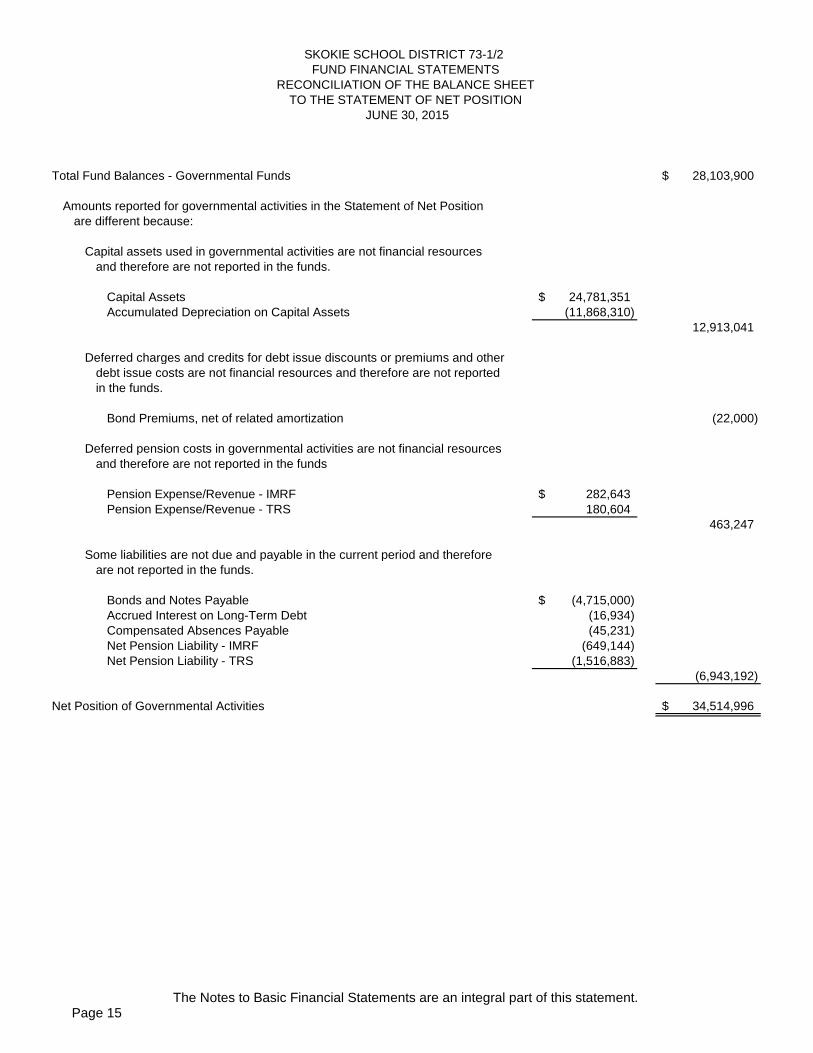
Page 15The Notes to Basic Financial Statements are an integral part of this statement.
Total Fund Balances - Governmental Funds 28,103,900$
Amounts reported for governmental activities in the Statement of Net Positionare different because:
Capital assets used in governmental activities are not financial resources
and therefore are not reported in the funds.
Capital Assets 24,781,351$ Accumulated Depreciation on Capital Assets (11,868,310)
12,913,041
Deferred charges and credits for debt issue discounts or premiums and otherdebt issue costs are not financial resources and therefore are not reportedin the funds.
Bond Premiums, net of related amortization (22,000)
Deferred pension costs in governmental activities are not financial resourcesand therefore are not reported in the funds
Pension Expense/Revenue - IMRF 282,643$ Pension Expense/Revenue - TRS 180,604
463,247
Some liabilities are not due and payable in the current period and thereforeare not reported in the funds.
Bonds and Notes Payable (4,715,000)$ Accrued Interest on Long-Term Debt (16,934) Compensated Absences Payable (45,231) Net Pension Liability - IMRF (649,144) Net Pension Liability - TRS (1,516,883)
(6,943,192)
Net Position of Governmental Activities 34,514,996$
SKOKIE SCHOOL DISTRICT 73-1/2 FUND FINANCIAL STATEMENTS
JUNE 30, 2015
RECONCILIATION OF THE BALANCE SHEETTO THE STATEMENT OF NET POSITION
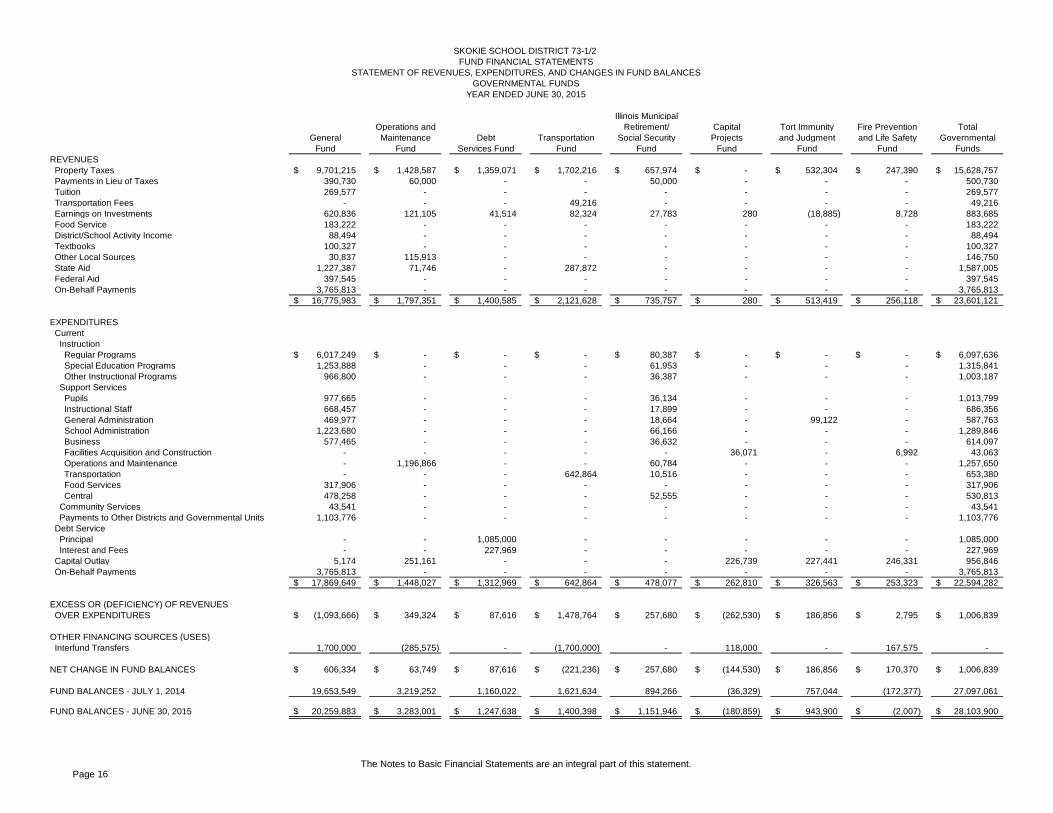
Page 16The Notes to Basic Financial Statements are an integral part of this statement.
Illinois MunicipalOperations and Retirement/ Capital Tort Immunity Fire Prevention Total
General Maintenance Debt Transportation Social Security Projects and Judgment and Life Safety GovernmentalFund Fund Services Fund Fund Fund Fund Fund Fund Funds
REVENUES Property Taxes 9,701,215$ 1,428,587$ 1,359,071$ 1,702,216$ 657,974$ -$ 532,304$ 247,390$ 15,628,757$ Payments in Lieu of Taxes 390,730 60,000 - - 50,000 - - - 500,730 Tuition 269,577 - - - - - - - 269,577 Transportation Fees - - - 49,216 - - - - 49,216 Earnings on Investments 620,836 121,105 41,514 82,324 27,783 280 (18,885) 8,728 883,685 Food Service 183,222 - - - - - - - 183,222 District/School Activity Income 88,494 - - - - - - - 88,494 Textbooks 100,327 - - - - - - - 100,327 Other Local Sources 30,837 115,913 - - - - - - 146,750 State Aid 1,227,387 71,746 - 287,872 - - - - 1,587,005 Federal Aid 397,545 - - - - - - - 397,545 On-Behalf Payments 3,765,813 - - - - - - - 3,765,813
16,775,983$ 1,797,351$ 1,400,585$ 2,121,628$ 735,757$ 280$ 513,419$ 256,118$ 23,601,121$
EXPENDITURES Current Instruction Regular Programs 6,017,249$ -$ -$ -$ 80,387$ -$ -$ -$ 6,097,636$ Special Education Programs 1,253,888 - - - 61,953 - - - 1,315,841 Other Instructional Programs 966,800 - - - 36,387 - - - 1,003,187 Support Services Pupils 977,665 - - - 36,134 - - - 1,013,799 Instructional Staff 668,457 - - - 17,899 - - - 686,356 General Administration 469,977 - - - 18,664 - 99,122 - 587,763 School Administration 1,223,680 - - - 66,166 - - - 1,289,846 Business 577,465 - - - 36,632 - - - 614,097 Facilities Acquisition and Construction - - - - - 36,071 - 6,992 43,063 Operations and Maintenance - 1,196,866 - - 60,784 - - - 1,257,650 Transportation - - - 642,864 10,516 - - - 653,380 Food Services 317,906 - - - - - - - 317,906 Central 478,258 - - - 52,555 - - - 530,813 Community Services 43,541 - - - - - - - 43,541 Payments to Other Districts and Governmental Units 1,103,776 - - - - - - - 1,103,776 Debt Service Principal - - 1,085,000 - - - - - 1,085,000 Interest and Fees - - 227,969 - - - - - 227,969 Capital Outlay 5,174 251,161 - - - 226,739 227,441 246,331 956,846 On-Behalf Payments 3,765,813 - - - - - - - 3,765,813
17,869,649$ 1,448,027$ 1,312,969$ 642,864$ 478,077$ 262,810$ 326,563$ 253,323$ 22,594,282$
EXCESS OR (DEFICIENCY) OF REVENUES OVER EXPENDITURES (1,093,666)$ 349,324$ 87,616$ 1,478,764$ 257,680$ (262,530)$ 186,856$ 2,795$ 1,006,839$
OTHER FINANCING SOURCES (USES) Interfund Transfers 1,700,000 (285,575) - (1,700,000) - 118,000 - 167,575 -
NET CHANGE IN FUND BALANCES 606,334$ 63,749$ 87,616$ (221,236)$ 257,680$ (144,530)$ 186,856$ 170,370$ 1,006,839$
FUND BALANCES - JULY 1, 2014 19,653,549 3,219,252 1,160,022 1,621,634 894,266 (36,329) 757,044 (172,377) 27,097,061
FUND BALANCES - JUNE 30, 2015 20,259,883$ 3,283,001$ 1,247,638$ 1,400,398$ 1,151,946$ (180,859)$ 943,900$ (2,007)$ 28,103,900$
SKOKIE SCHOOL DISTRICT 73-1/2 FUND FINANCIAL STATEMENTS
STATEMENT OF REVENUES, EXPENDITURES, AND CHANGES IN FUND BALANCESGOVERNMENTAL FUNDS
YEAR ENDED JUNE 30, 2015
Page 17The Notes to Basic Financial Statements are an integral part of this statement.
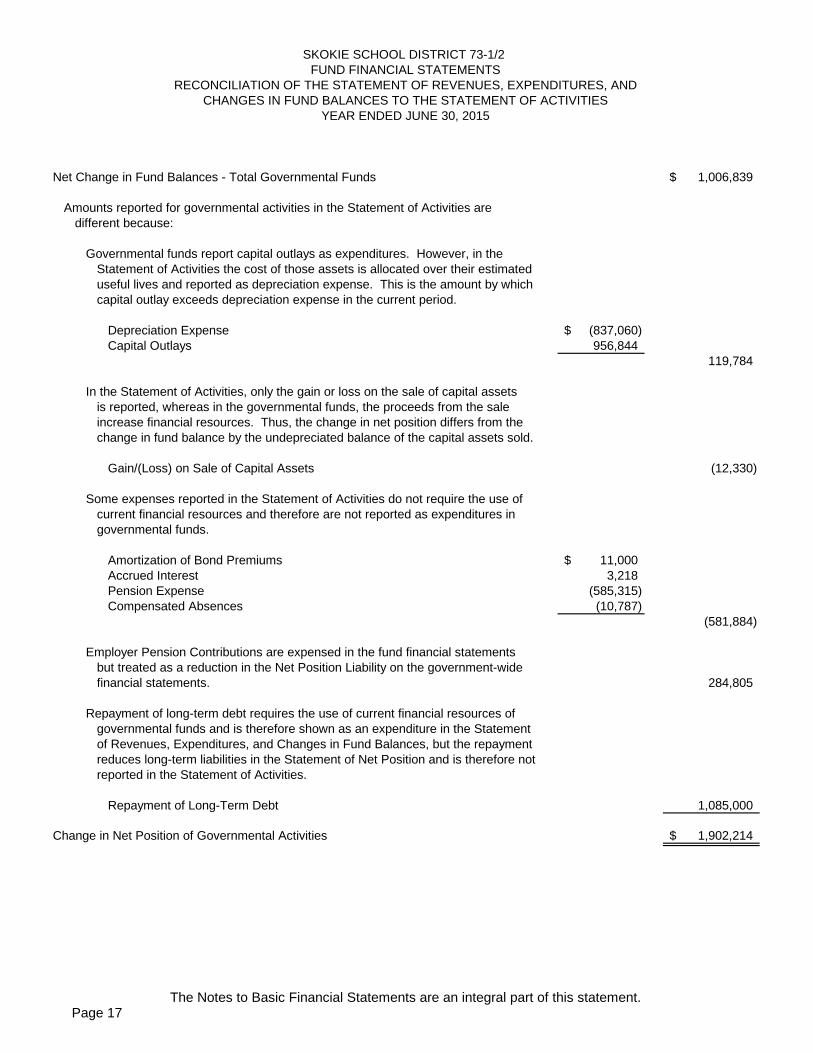
Net Change in Fund Balances - Total Governmental Funds 1,006,839$
Amounts reported for governmental activities in the Statement of Activities aredifferent because:
Governmental funds report capital outlays as expenditures. However, in the
Statement of Activities the cost of those assets is allocated over their estimateduseful lives and reported as depreciation expense. This is the amount by whichcapital outlay exceeds depreciation expense in the current period.
Depreciation Expense (837,060)$ Capital Outlays 956,844
119,784
In the Statement of Activities, only the gain or loss on the sale of capital assetsis reported, whereas in the governmental funds, the proceeds from the sale increase financial resources. Thus, the change in net position differs from the change in fund balance by the undepreciated balance of the capital assets sold.
Gain/(Loss) on Sale of Capital Assets (12,330)
Some expenses reported in the Statement of Activities do not require the use ofcurrent financial resources and therefore are not reported as expenditures ingovernmental funds.
Amortization of Bond Premiums 11,000$ Accrued Interest 3,218 Pension Expense (585,315) Compensated Absences (10,787)
(581,884)
Employer Pension Contributions are expensed in the fund financial statementsbut treated as a reduction in the Net Position Liability on the government-widefinancial statements. 284,805
Repayment of long-term debt requires the use of current financial resources of governmental funds and is therefore shown as an expenditure in the Statementof Revenues, Expenditures, and Changes in Fund Balances, but the repaymentreduces long-term liabilities in the Statement of Net Position and is therefore notreported in the Statement of Activities.
Repayment of Long-Term Debt 1,085,000
Change in Net Position of Governmental Activities 1,902,214$
YEAR ENDED JUNE 30, 2015CHANGES IN FUND BALANCES TO THE STATEMENT OF ACTIVITIES
SKOKIE SCHOOL DISTRICT 73-1/2 FUND FINANCIAL STATEMENTS
RECONCILIATION OF THE STATEMENT OF REVENUES, EXPENDITURES, AND
Page 18The Notes to Basic Financial Statements are an integral part of this statement.
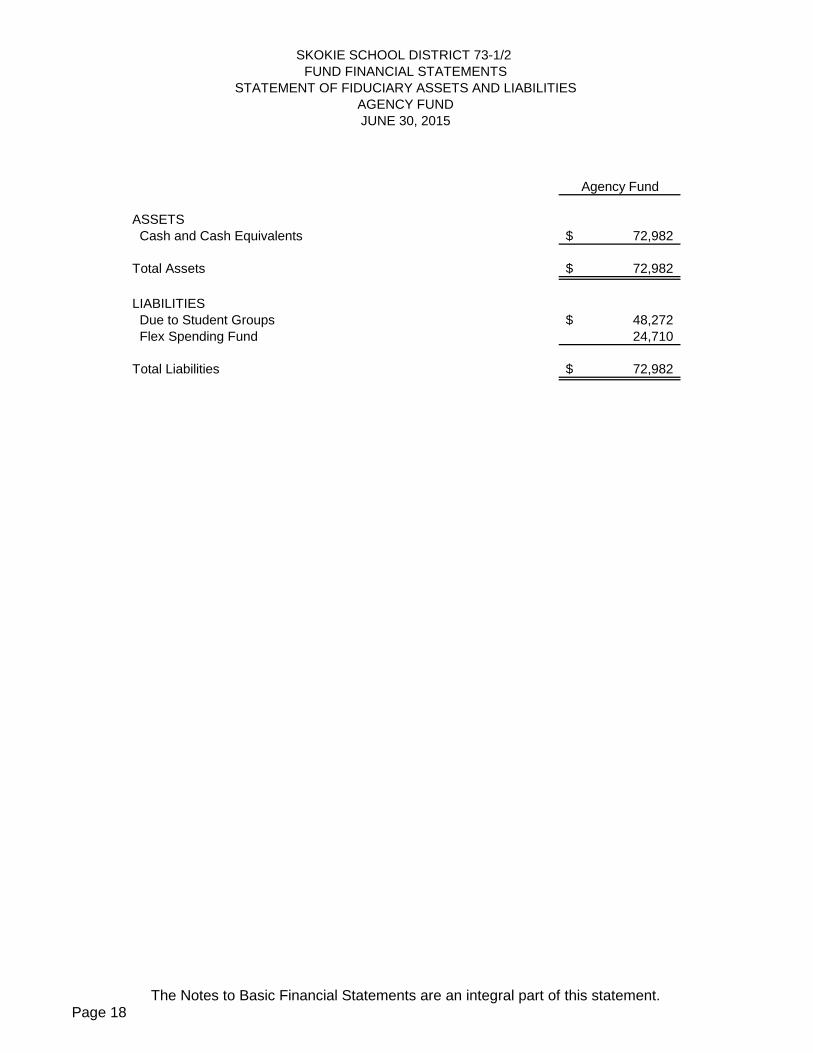
Agency Fund
ASSETS Cash and Cash Equivalents 72,982$
Total Assets 72,982$
LIABILITIES Due to Student Groups 48,272$ Flex Spending Fund 24,710
Total Liabilities 72,982$
JUNE 30, 2015
SKOKIE SCHOOL DISTRICT 73-1/2
STATEMENT OF FIDUCIARY ASSETS AND LIABILITIESFUND FINANCIAL STATEMENTS
AGENCY FUND
Page 19
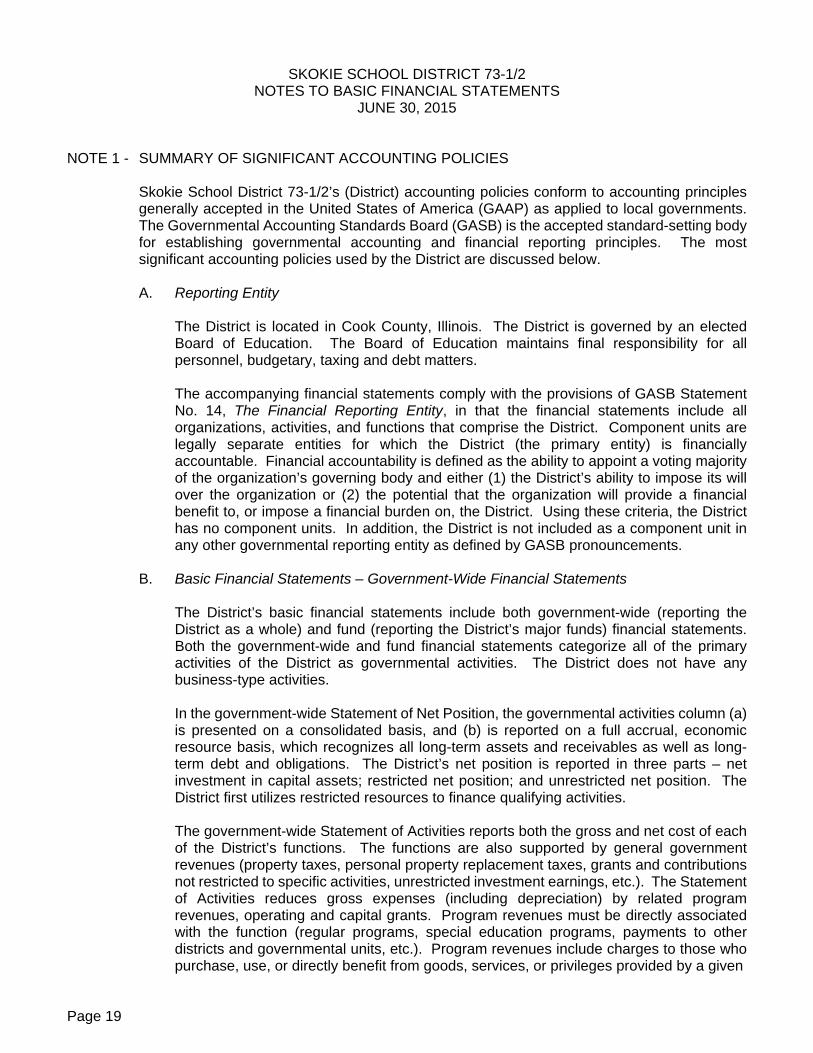
SKOKIE SCHOOL DISTRICT 73-1/2 NOTES TO BASIC FINANCIAL STATEMENTS
JUNE 30, 2015
NOTE 1 - SUMMARY OF SIGNIFICANT ACCOUNTING POLICIES
Skokie School District 73-1/2’s (District) accounting policies conform to accounting principles generally accepted in the United States of America (GAAP) as applied to local governments. The Governmental Accounting Standards Board (GASB) is the accepted standard-setting body for establishing governmental accounting and financial reporting principles. The most significant accounting policies used by the District are discussed below.
A. Reporting Entity
The District is located in Cook County, Illinois. The District is governed by an elected Board of Education. The Board of Education maintains final responsibility for all personnel, budgetary, taxing and debt matters. The accompanying financial statements comply with the provisions of GASB Statement No. 14, The Financial Reporting Entity, in that the financial statements include all organizations, activities, and functions that comprise the District. Component units are legally separate entities for which the District (the primary entity) is financially accountable. Financial accountability is defined as the ability to appoint a voting majority of the organization’s governing body and either (1) the District’s ability to impose its will over the organization or (2) the potential that the organization will provide a financial benefit to, or impose a financial burden on, the District. Using these criteria, the District has no component units. In addition, the District is not included as a component unit in any other governmental reporting entity as defined by GASB pronouncements.
B. Basic Financial Statements – Government-Wide Financial Statements
The District’s basic financial statements include both government-wide (reporting the District as a whole) and fund (reporting the District’s major funds) financial statements. Both the government-wide and fund financial statements categorize all of the primary activities of the District as governmental activities. The District does not have any business-type activities. In the government-wide Statement of Net Position, the governmental activities column (a) is presented on a consolidated basis, and (b) is reported on a full accrual, economic resource basis, which recognizes all long-term assets and receivables as well as long-term debt and obligations. The District’s net position is reported in three parts – net investment in capital assets; restricted net position; and unrestricted net position. The District first utilizes restricted resources to finance qualifying activities. The government-wide Statement of Activities reports both the gross and net cost of each of the District’s functions. The functions are also supported by general government revenues (property taxes, personal property replacement taxes, grants and contributions not restricted to specific activities, unrestricted investment earnings, etc.). The Statement of Activities reduces gross expenses (including depreciation) by related program revenues, operating and capital grants. Program revenues must be directly associated with the function (regular programs, special education programs, payments to other districts and governmental units, etc.). Program revenues include charges to those who purchase, use, or directly benefit from goods, services, or privileges provided by a given
NOTES TO FINANCIAL STATEMENTS (Continued)
Page 20
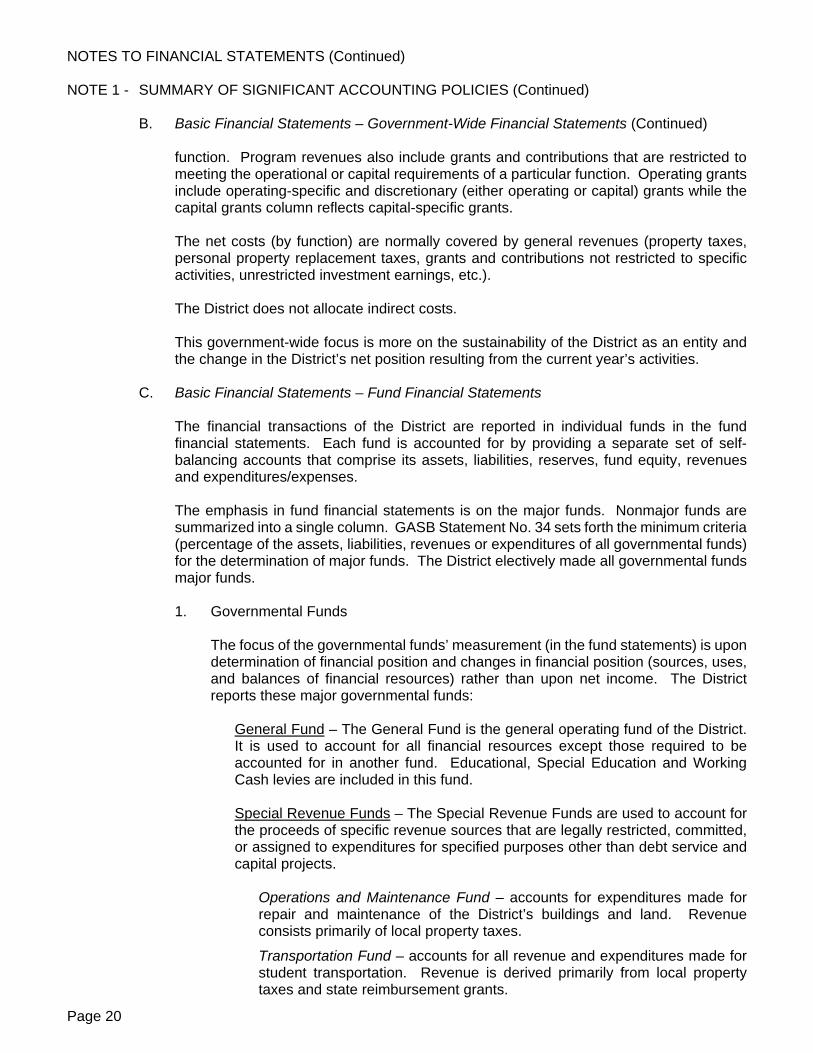
NOTE 1 - SUMMARY OF SIGNIFICANT ACCOUNTING POLICIES (Continued) B. Basic Financial Statements – Government-Wide Financial Statements (Continued)
function. Program revenues also include grants and contributions that are restricted to meeting the operational or capital requirements of a particular function. Operating grants include operating-specific and discretionary (either operating or capital) grants while the capital grants column reflects capital-specific grants. The net costs (by function) are normally covered by general revenues (property taxes, personal property replacement taxes, grants and contributions not restricted to specific activities, unrestricted investment earnings, etc.). The District does not allocate indirect costs. This government-wide focus is more on the sustainability of the District as an entity and the change in the District’s net position resulting from the current year’s activities.
C. Basic Financial Statements – Fund Financial Statements
The financial transactions of the District are reported in individual funds in the fund financial statements. Each fund is accounted for by providing a separate set of self-balancing accounts that comprise its assets, liabilities, reserves, fund equity, revenues and expenditures/expenses. The emphasis in fund financial statements is on the major funds. Nonmajor funds are summarized into a single column. GASB Statement No. 34 sets forth the minimum criteria (percentage of the assets, liabilities, revenues or expenditures of all governmental funds) for the determination of major funds. The District electively made all governmental funds major funds. 1. Governmental Funds
The focus of the governmental funds’ measurement (in the fund statements) is upon determination of financial position and changes in financial position (sources, uses, and balances of financial resources) rather than upon net income. The District reports these major governmental funds:
General Fund – The General Fund is the general operating fund of the District. It is used to account for all financial resources except those required to be accounted for in another fund. Educational, Special Education and Working Cash levies are included in this fund. Special Revenue Funds – The Special Revenue Funds are used to account for the proceeds of specific revenue sources that are legally restricted, committed, or assigned to expenditures for specified purposes other than debt service and capital projects.
Operations and Maintenance Fund – accounts for expenditures made for repair and maintenance of the District’s buildings and land. Revenue consists primarily of local property taxes.
Transportation Fund – accounts for all revenue and expenditures made for student transportation. Revenue is derived primarily from local property taxes and state reimbursement grants.
NOTES TO FINANCIAL STATEMENTS (Continued)
Page 21
NOTE 1 - SUMMARY OF SIGNIFICANT ACCOUNTING POLICIES (Continued) C. Basic Financial Statements – Fund Financial Statements (Continued)
1. Governmental Funds (Continued) Special Revenue Funds (Continued)
Municipal Retirement/Social Security Fund – accounts for the District’s portion of pension contributions to the Illinois Municipal Retirement Fund, payments to Medicare, and payments to the Social Security System for non-certified employees. Revenue to finance the contributions is derived primarily from local property taxes and personal property replacement taxes.
Tort Immunity and Judgment Fund – accounts for the District’s tort immunity or tort judgment purposes. Revenue is derived primarily from local property taxes.
Debt Services Fund – The Debt Services Fund is used to account for financial resources that are restricted, committed, or assigned to expenditures for the periodic payment of principal, interest and related fees on general long-term debt. Capital Projects Funds – The Capital Projects Funds are used to account for financial resources that are restricted, committed, or assigned to expenditures for the acquisition or construction of, and/or additions to, major capital facilities.
Capital Projects Fund – accounts for construction projects and renovations financed through bond proceeds or transfers from other funds.
Fire Prevention and Life Safety Fund – accounts for State-approved life safety projects financed through serial bond issues or local property taxes levied specifically for such purposes.
2. Fiduciary Funds
Fiduciary funds are used to report assets held in a trustee or agency capacity for others and therefore are not available to support District programs. The reporting focus is on net position and is reported using the accrual basis of accounting. The District’s fiduciary funds are presented in the fiduciary fund financial statements by type (agency). Since by definition these assets are being held for the benefit of a third party (student organizations) and cannot be used to address activities or obligations of the District, these funds are not incorporated into the government-wide statements. The following is a description of the fiduciary fund of the District:
Agency Funds – The Agency Funds (Student Activity Fund and Flex Spending Account) account for assets held by the District as an agent for the student organizations or employees. These funds are custodial in nature and do not involve the measurement of the results of operations. The amounts due to student organizations are equal to the assets.
NOTES TO FINANCIAL STATEMENTS (Continued)
Page 22
NOTE 1 - SUMMARY OF SIGNIFICANT ACCOUNTING POLICIES (Continued)
D. Basis of Accounting
Basis of accounting refers to the point at which revenues or expenditures/expenses are recognized in the accounts and reported in the financial statements. It relates to the timing of the measurements made regardless of the measurement focus applied. 1. Accrual
The governmental activities in the government-wide financial statements and the fiduciary fund financial statements are presented on the accrual basis of accounting. Property taxes are reported in the period for which levied. Other nonexchange revenues, including intergovernmental revenues and grants, are reported when all eligibility requirements have been met. Fees and charges and other exchange revenues are recognized when earned and expenses are recognized when incurred.
2. Modified Accrual
The governmental fund financial statements are presented on the modified accrual basis of accounting. Under the modified accrual basis of accounting, revenues are recorded when susceptible to accrual; i.e., both measurable and available. “Available” means collectible within the current period or within 60 days after year-end. Property tax revenues are recognized in the period for which levied provided they are also available. Intergovernmental revenues and grants are recognized when all eligibility requirements are met and the revenues are available. Expenditures are recognized when the related liability is incurred. Exceptions to this general rule include principal and interest on general obligation long-term debt and employee vacation and sick leave, which are recognized when due and payable.
E. Cash and Cash Equivalents and Investments
State statutes require the District to use the treasury services of the Township School Treasurer and authorize the District’s treasurer to invest in obligations of the U.S. Treasury, certain highly rated commercial paper, corporate bonds, repurchase agreements, and money market mutual funds registered under the Investment Company Act of 1940, with certain restrictions. Separate bank accounts are not maintained for all District funds. Instead, the funds maintain their cash balances in common accounts, with accounting records being maintained to show the portion of the common bank account balance attributable to each participating fund.
Occasionally certain of the funds participating in the common bank account will incur overdrafts (deficits) in the account. Such overdrafts in effect constitute cash borrowed from other District funds and are, therefore, interfund loans that have not been authorized by District Board action. No District fund had a cash overdraft at June 30, 2015. The District has defined cash and cash equivalents to include cash on hand, demand deposits, and short-term investments with original maturities of three months or less from the date of acquisition. Cash equivalents are accounted for at cost, which approximates market.
NOTES TO FINANCIAL STATEMENTS (Continued)
Page 23
NOTE 1 - SUMMARY OF SIGNIFICANT ACCOUNTING POLICIES (Continued)
E. Cash and Cash Equivalents and Investments (Continued) Investments are stated at fair value. Fair value is determined by quoted market prices. Gains or losses on the sale of investments are recognized as they are incurred. The District has adopted a formal written investment and cash management policy.
F. Receivables
All receivables are reported net of estimated uncollectible amounts.
G. Prepaid Items
Payments made to vendors for services that will benefit periods beyond the current fiscal year are recorded as prepaid items using the consumption method by recording an asset for the prepaid amount and reflecting the expenditure/expense in the year in which services are consumed.
H. Inventories
No inventory accounts are maintained to reflect the values of resale or supply items on hand. Instead, the costs of such items are charged to expense when purchased. The value of the District’s inventories is not deemed to be material.
I. Interfund Activity Interfund activity is reported either as loans, services provided, reimbursements or transfers. Loans are reported as interfund receivables and payables as appropriate and are subject to elimination upon consolidation. All other interfund transactions are treated as transfers. Transfers between governmental funds are netted as part of the reconciliation to the government-wide financial statements.
J. Capital Assets Capital assets purchased or acquired with an original cost of $1,500 or more are reported at historical cost or estimated historical cost. Contributed assets are reported at fair market value as of the date of donation. Additions, improvements and other capital outlays that significantly extend the useful life of an asset are capitalized. Other costs incurred for repairs and maintenance are expensed as incurred. Depreciation on all assets is provided on the straight-line half-year basis over the following estimated useful lives:
Buildings 15 - 50 yearsImprovements Other than Buildings 15 - 30 yearsEquipment Other than Transportation 5 - 20 yearsTransportation Equipment 8 years
K. Deferred Outflows and Inflows of Resources
In addition to assets and liabilities, the Balance Sheet and Statement of Net Position will sometimes report separate sections for deferred outflows of resources and deferred inflows of resources. Deferred outflows of resources represent a consumption of net position that applies to a future period and therefore will not be recognized as an outflow of resource until then. Deferred inflows of resources represent an acquisition of net position that applies to a future period and therefore will not be recognized as an inflow of resource until that time.
NOTES TO FINANCIAL STATEMENTS (Continued)
Page 24
NOTE 1 - SUMMARY OF SIGNIFICANT ACCOUNTING POLICIES (Continued)
L. Compensated Absences
The District accrues accumulated unpaid vacation when earned (or estimated to be earned) by the employee. Vacation benefits are granted to employees in varying amounts depending on tenure with the District and the employee’s contract. Future payments will be made from the same fund where the employee’s salary is recorded. Historically, the expenditures are recorded in the General Fund.
M. Long-Term Obligations In the government-wide financial statements, long-term debt and other long-term obligations are reported as liabilities in the Statement of Net Position. Bond premiums and discounts, as well as issuance costs, are deferred and amortized over the life of the bonds on a straight-line basis. Bonds payable are reported net of the applicable bond premium or discount. Bond issuance costs are reported as debt service expenditures.
In the fund financial statements, governmental funds recognize bond premiums and discounts, as well as bond issuance costs, during the current period. The face amount of debt issued is reported as other financing sources. Premiums received on debt issuances are reported as other financing sources while discounts on debt issuances are reported as other financing uses. Issuance costs, whether or not withheld from the actual debt proceeds received, are reported as debt service expenditures.
N. Government-Wide Net Position
Net position is divided into three components: Net Investment in Capital Assets – consists of capital assets (net of accumulated
depreciation) reduced by the outstanding balances of bonds, mortgages, notes, or other borrowings that are attributable to the acquisition, construction, or improvement of those assets.
Restricted Net Position – consists of net position that is restricted by the District’s creditors (for example, through debt covenants), by the state enabling legislation (through restrictions on shared revenues), by grantors (both federal and state), and by other contributors.
Unrestricted Net Position – the remaining net position is reported in this category.
O. Governmental Fund Balances
Governmental fund balances are divided between nonspendable and spendable. Nonspendable fund balances are balances that cannot be spent because they are not expected to be converted to cash or they are legally or contractually required to remain intact. The spendable fund balances are arranged in a hierarchy based on spending constraints. Restricted – Restricted fund balances are restricted when constraints are placed on
the use by either (a) external creditors, grantors, contributors, or laws or regulations of other governments or (b) law through constitutional provisions or enabling legislation.
NOTES TO FINANCIAL STATEMENTS (Continued)
Page 25
NOTE 1 - SUMMARY OF SIGNIFICANT ACCOUNTING POLICIES (Continued) O. Governmental Fund Balances (Continued)
Committed – Committed fund balances are amounts that can only be used for
specific purposes as a result of a resolution of the Board of Education. Committed amounts cannot be used for any other purpose unless the Board of Education removes those constraints by way of resolution. Committed fund balances differ from restricted balances because the constraints on their use do not come from outside parties, constitutional provisions, or enabling legislation. During fiscal year 2014, the Board of Education passed a resolution to commit $2,100,000 of the Operations and Maintenance Fund balance for building repairs and improvements included in the District’s Five Year Facility Plan. This amount is still committed as of June 30, 2015.
Assigned – Assigned fund balances are amounts that are constrained by the District’s intent to be used for specific purposes, but are neither restricted nor committed. Intent is expressed by an appointed body (e.g. a budget or finance committee) or official to which the Board of Education has delegated the authority to assign, modify or rescind amounts to be used for specific purposes. The District has delegated this authority to the Business Manager.
Assigned fund balances also include (a) all remaining amounts that are reported in governmental funds (other than the General Fund) that are not classified as nonspendable, restricted or committed, and (b) amounts in the General Fund that are intended to be used for a specific purpose. Specific amounts that are not restricted or committed in a special revenue, capital projects or debt services fund are assigned for purposes in accordance with the nature of their fund type. Assignment within the General Fund conveys that the intended use of those amounts is for a specific purpose that is narrower than the general purpose of the District itself. All remaining positive spendable amounts in governmental funds, other than the General Fund, that are neither restricted not committed are considered assigned. Assignments may take place after the end of the reporting period.
Unassigned – Unassigned fund balance is the residual classification for the General Fund. This classification represents the General Fund balance that has not been assigned to other funds, and that has not been restricted, committed, or assigned to specific purposes within the General Fund. Unassigned fund balance in the General Fund also includes amounts levied and/or borrowed for working cash. This classification is also used to represent negative fund balances in special revenue, debt services, and capital projects funds.
The District permits funds to be expended in the following order: Restricted, Committed, Assigned and Unassigned.
P. Property Tax Calendar and Revenues
Property taxes are levied each calendar year on all taxable real property located in the District on or before the last Tuesday in December. The 2014 tax levy was passed by the Board on October 14, 2014. The 2013 tax levy was passed by the Board on November 12, 2013. Property taxes attach as an enforceable lien on property as of January 1 of the calendar year they are for and are payable in two installments early in March and early in September of the following calendar year. The District receives significant distributions of tax receipts approximately one month after these dates.
NOTES TO FINANCIAL STATEMENTS (Continued)
Page 26
NOTE 1 - SUMMARY OF SIGNIFICANT ACCOUNTING POLICIES (Continued)
Q. Estimates The preparation of financial statements in conformity with generally accepted accounting principles requires management to make estimates and assumptions that affect the amounts reported in the financial statements and accompanying notes. Actual results may differ from those estimates.
NOTE 2 - DEPOSITS AND INVESTMENTS
As explained in Note 1, the Illinois Complied Statutes require the District to utilize the investment services of the Township School Treasurer (the Treasurer). As such, the Treasurer is the lawful custodian of these school funds. The Treasurer is appointed by the Township Treasurer’s Board of Trustees. The investment policies are established by the Treasurer, as prescribed by the Illinois Complied Statutes. The Treasurer is the direct recipient of property taxes, replacement taxes, and most state and federal aid, and disburses school funds upon lawful order to the school board. The Treasurer invests excess funds at his discretion, subject to the legal restrictions discussed below. District cash and investments (other than the student activity and petty cash funds) are part of a common pool for all the school districts and cooperatives within the township. The Treasurer maintains records that segregate the cash and investments balances by district or cooperative. Income from investments is distributed based upon the district’s percentage participation in the pool. Cash for all funds, including cash applicable to the Debt Services Fund and the Illinois Municipal Retirement/Social Security Fund, is not deemed available for purposes other than those for which these balances are intended. The Treasurer’s office operates as a nonrated, external investment pool. The fair value of the District’s investment in the Treasurer’s pool is determined by the District’s proportionate share of the fair value of the investments held by the Treasurer’s office. The weighted-average maturity of all pooled marketable investments held by the Treasurer was 3.89 years at June 30, 2015. The Treasurer also holds money-market type investments and deposits with financial institutions, including certificates of deposit. As of the same date, the fair value of all investments held by the Treasurer’s office was $385,425,799 and the fair value of the District’s cash and investments held by the Treasurer’s office approximated the carrying amount at June 30, 2015. Interest Rate Risk The District’s investment policy, which is the same as the Treasurer’s office, aims to ensure preservation of capital in the District’s overall portfolio. The highest return on investments is sought, consistent with the preservation of principal and prudent investment principles. The investment portfolio is required to provide sufficient liquidity to pay District obligations as they come due, considering maturity and investments, as appropriate to the nature, purpose and amount of funds. The District will also consider investments in local financial institutions, recognizing their contribution to the community’s economic development. At June 30, 2015, the carrying value of the District’s agency funds was $72,982, all of which was deposited with financial institutions and was fully insured or collateralized by securities held in the District's name.
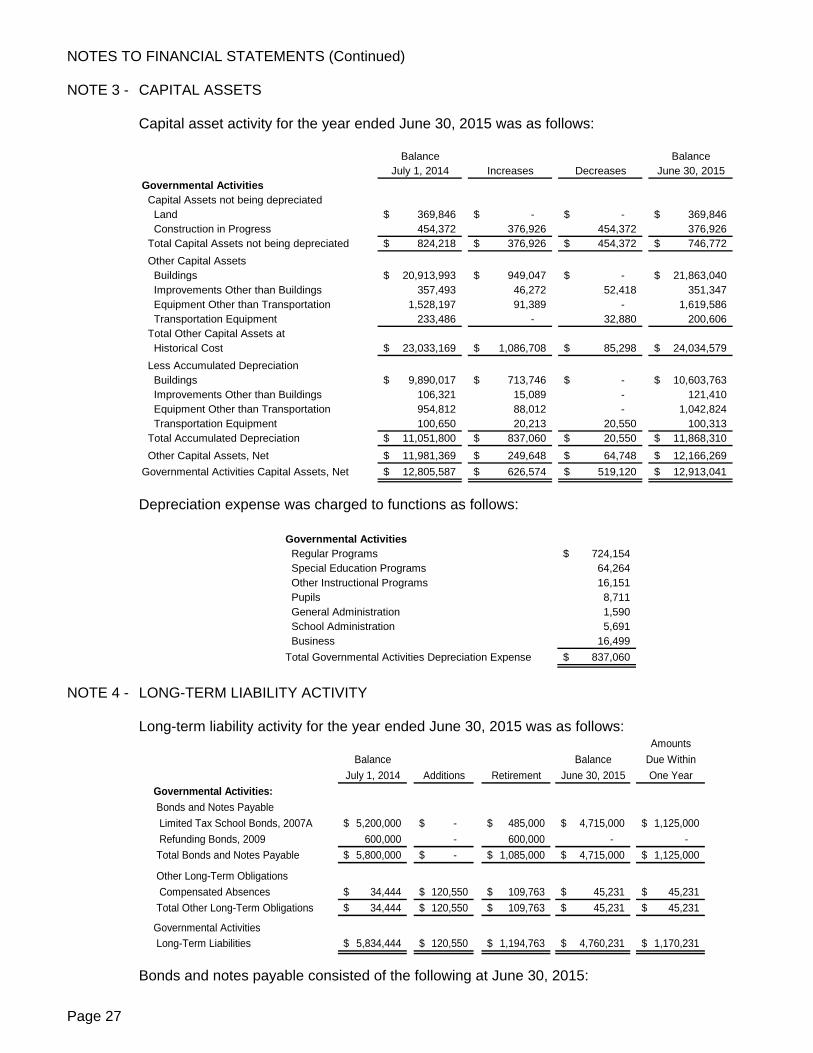
NOTES TO FINANCIAL STATEMENTS (Continued)
Page 27
NOTE 3 - CAPITAL ASSETS Capital asset activity for the year ended June 30, 2015 was as follows:
Balance BalanceJuly 1, 2014 Increases Decreases June 30, 2015
Governmental Activities Capital Assets not being depreciated Land 369,846$ -$ -$ 369,846$ Construction in Progress 454,372 376,926 454,372 376,926 Total Capital Assets not being depreciated 824,218$ 376,926$ 454,372$ 746,772$ Other Capital Assets Buildings 20,913,993$ 949,047$ -$ 21,863,040$ Improvements Other than Buildings 357,493 46,272 52,418 351,347 Equipment Other than Transportation 1,528,197 91,389 - 1,619,586 Transportation Equipment 233,486 - 32,880 200,606 Total Other Capital Assets at Historical Cost 23,033,169$ 1,086,708$ 85,298$ 24,034,579$ Less Accumulated Depreciation Buildings 9,890,017$ 713,746$ -$ 10,603,763$ Improvements Other than Buildings 106,321 15,089 - 121,410 Equipment Other than Transportation 954,812 88,012 - 1,042,824 Transportation Equipment 100,650 20,213 20,550 100,313 Total Accumulated Depreciation 11,051,800$ 837,060$ 20,550$ 11,868,310$ Other Capital Assets, Net 11,981,369$ 249,648$ 64,748$ 12,166,269$ Governmental Activities Capital Assets, Net 12,805,587$ 626,574$ 519,120$ 12,913,041$
Depreciation expense was charged to functions as follows:
Governmental Activities Regular Programs 724,154$ Special Education Programs 64,264 Other Instructional Programs 16,151 Pupils 8,711 General Administration 1,590 School Administration 5,691 Business 16,499Total Governmental Activities Depreciation Expense 837,060$
NOTE 4 - LONG-TERM LIABILITY ACTIVITY Long-term liability activity for the year ended June 30, 2015 was as follows:
AmountsBalance Balance Due Within
July 1, 2014 Additions Retirement June 30, 2015 One YearGovernmental Activities: Bonds and Notes Payable Limited Tax School Bonds, 2007A 5,200,000$ -$ 485,000$ 4,715,000$ 1,125,000$ Refunding Bonds, 2009 600,000 - 600,000 - - Total Bonds and Notes Payable 5,800,000$ -$ 1,085,000$ 4,715,000$ 1,125,000$
Other Long-Term Obligations Compensated Absences 34,444$ 120,550$ 109,763$ 45,231$ 45,231$ Total Other Long-Term Obligations 34,444$ 120,550$ 109,763$ 45,231$ 45,231$
Governmental Activities Long-Term Liabilities 5,834,444$ 120,550$ 1,194,763$ 4,760,231$ 1,170,231$
Bonds and notes payable consisted of the following at June 30, 2015:
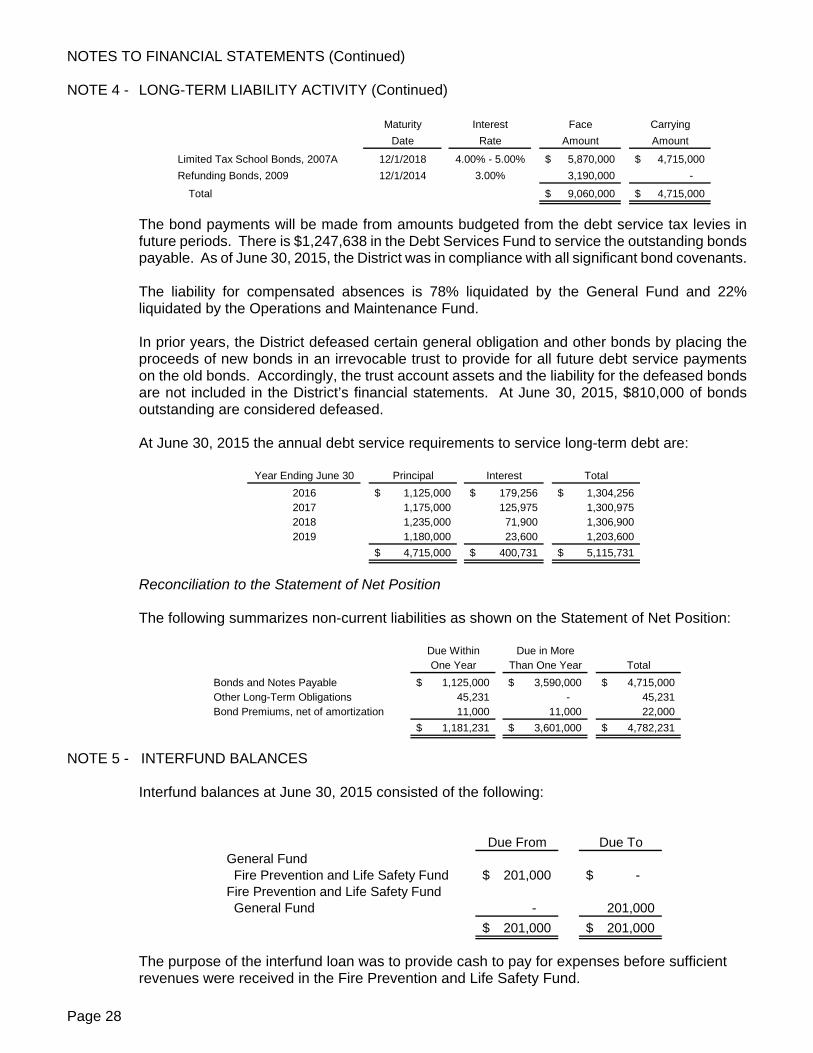
NOTES TO FINANCIAL STATEMENTS (Continued)
Page 28
NOTE 4 - LONG-TERM LIABILITY ACTIVITY (Continued)
Maturity Interest Face CarryingDate Rate Amount Amount
Limited Tax School Bonds, 2007A 12/1/2018 4.00% - 5.00% 5,870,000$ 4,715,000$ Refunding Bonds, 2009 12/1/2014 3.00% 3,190,000 -
Total 9,060,000$ 4,715,000$
The bond payments will be made from amounts budgeted from the debt service tax levies in future periods. There is $1,247,638 in the Debt Services Fund to service the outstanding bonds payable. As of June 30, 2015, the District was in compliance with all significant bond covenants. The liability for compensated absences is 78% liquidated by the General Fund and 22% liquidated by the Operations and Maintenance Fund. In prior years, the District defeased certain general obligation and other bonds by placing the proceeds of new bonds in an irrevocable trust to provide for all future debt service payments on the old bonds. Accordingly, the trust account assets and the liability for the defeased bonds are not included in the District’s financial statements. At June 30, 2015, $810,000 of bonds outstanding are considered defeased.
At June 30, 2015 the annual debt service requirements to service long-term debt are:
Year Ending June 30 Principal Interest Total2016 1,125,000$ 179,256$ 1,304,256$ 2017 1,175,000 125,975 1,300,975 2018 1,235,000 71,900 1,306,900 2019 1,180,000 23,600 1,203,600
4,715,000$ 400,731$ 5,115,731$
Reconciliation to the Statement of Net Position
The following summarizes non-current liabilities as shown on the Statement of Net Position:
Due Within Due in MoreOne Year Than One Year Total
Bonds and Notes Payable 1,125,000$ 3,590,000$ 4,715,000$ Other Long-Term Obligations 45,231 - 45,231 Bond Premiums, net of amortization 11,000 11,000 22,000
1,181,231$ 3,601,000$ 4,782,231$
NOTE 5 - INTERFUND BALANCES
Interfund balances at June 30, 2015 consisted of the following:
Due From Due ToGeneral Fund Fire Prevention and Life Safety Fund 201,000$ -$ Fire Prevention and Life Safety Fund General Fund - 201,000
201,000$ 201,000$
The purpose of the interfund loan was to provide cash to pay for expenses before sufficient revenues were received in the Fire Prevention and Life Safety Fund.
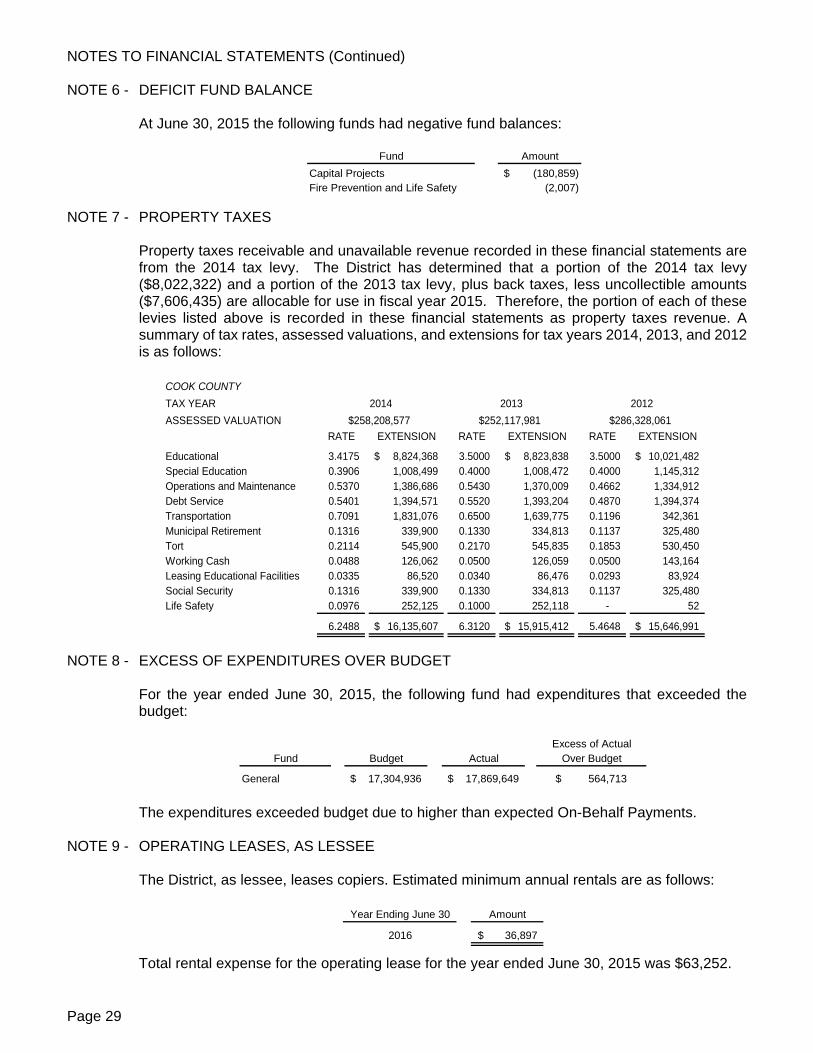
NOTES TO FINANCIAL STATEMENTS (Continued)
Page 29
NOTE 6 - DEFICIT FUND BALANCE At June 30, 2015 the following funds had negative fund balances:
Fund AmountCapital Projects (180,859)$ Fire Prevention and Life Safety (2,007)
NOTE 7 - PROPERTY TAXES
Property taxes receivable and unavailable revenue recorded in these financial statements are from the 2014 tax levy. The District has determined that a portion of the 2014 tax levy ($8,022,322) and a portion of the 2013 tax levy, plus back taxes, less uncollectible amounts ($7,606,435) are allocable for use in fiscal year 2015. Therefore, the portion of each of these levies listed above is recorded in these financial statements as property taxes revenue. A summary of tax rates, assessed valuations, and extensions for tax years 2014, 2013, and 2012 is as follows:
COOK COUNTY
TAX YEARASSESSED VALUATION
RATE EXTENSION RATE EXTENSION RATE EXTENSION
Educational 3.4175 8,824,368$ 3.5000 8,823,838$ 3.5000 10,021,482$ Special Education 0.3906 1,008,499 0.4000 1,008,472 0.4000 1,145,312 Operations and Maintenance 0.5370 1,386,686 0.5430 1,370,009 0.4662 1,334,912 Debt Service 0.5401 1,394,571 0.5520 1,393,204 0.4870 1,394,374 Transportation 0.7091 1,831,076 0.6500 1,639,775 0.1196 342,361 Municipal Retirement 0.1316 339,900 0.1330 334,813 0.1137 325,480 Tort 0.2114 545,900 0.2170 545,835 0.1853 530,450 Working Cash 0.0488 126,062 0.0500 126,059 0.0500 143,164 Leasing Educational Facilities 0.0335 86,520 0.0340 86,476 0.0293 83,924 Social Security 0.1316 339,900 0.1330 334,813 0.1137 325,480 Life Safety 0.0976 252,125 0.1000 252,118 - 52
6.2488 16,135,607$ 6.3120 15,915,412$ 5.4648 15,646,991$
2014 2013 2012$252,117,981 $286,328,061$258,208,577
NOTE 8 - EXCESS OF EXPENDITURES OVER BUDGET
For the year ended June 30, 2015, the following fund had expenditures that exceeded the budget:
Fund Budget Actual
General 17,304,936$ 17,869,649$ 564,713$
Excess of ActualOver Budget
The expenditures exceeded budget due to higher than expected On-Behalf Payments.
NOTE 9 - OPERATING LEASES, AS LESSEE
The District, as lessee, leases copiers. Estimated minimum annual rentals are as follows:
Year Ending June 30 Amount
2016 36,897$
Total rental expense for the operating lease for the year ended June 30, 2015 was $63,252.
NOTES TO FINANCIAL STATEMENTS (Continued)
Page 30
NOTE 10 - RETIREMENT FUND COMMITMENTS
A. Teachers’ Retirement System of the State of Illinois
General Information About the Pension Plan
o Plan Description The District participates in the Teachers’ Retirement System of the State of Illinois (TRS). TRS is a cost-sharing multiple-employer defined benefit pension plan that was created by the Illinois legislature for the benefit of Illinois public school teachers employed outside the city of Chicago. TRS members include all active non-annuitants who are employed by a TRS-covered employer to provide services for which teacher licensure is required. The Illinois Pension Code outlines the benefit provisions of TRS, and amendments to the plan can be made only by legislative action with the Governor’s approval. The TRS Board of Trustees is responsible for the System’s administration. TRS issues a publicly available financial report that can be obtained at http://trs.illinois.gov/pubs/cafr; by writing to TRS at 2815 W. Washington, PO Box 19253, Springfield, IL 62794; or by calling (888) 877-0890, option 2.
o Benefits Provided
TRS provides retirement, disability, and death benefits. Tier I members have TRS or reciprocal system service prior to January 1, 2011. Tier I members qualify for retirement benefits at age 62 with five years of service, at age 60 with ten years, or age 55 with 20 years. The benefit is determined by the average of the four highest years of creditable earnings within the last ten years of creditable service and the percentage of average salary to which the member is entitled. Most members retire under a formula that provides 2.2% of final average salary up to a maximum of 75% with 34 years of service. Disability and death benefits are also provided. Tier II members qualify for retirement benefits at age 67 with ten years of service, or a discounted annuity can be paid at age 62 with ten years of service. Creditable earnings for retirement purposes are capped and the final average salary is based on the highest consecutive eight years of creditable service rather than the last four. Disability provisions for Tier II are identical to those of Tier I. Death benefits are payable under a formula that is different from Tier I. Essentially all Tier I retirees receive an annual 3% increase in the current retirement benefit beginning January 1 following the attainment of age 61 or on January 1 following the member’s first anniversary in retirement, whichever is later. Tier II annual increases will be the lesser of 3% of the original benefit or ½% of the rate of inflation beginning January 1 following attainment of age 67 or on January 1 following the member’s first anniversary in retirement, whichever is later.
o Contributions The State of Illinois maintains the primary responsibility for funding TRS. The Illinois Pension Code, as amended by Public Act 88-0593 and subsequent acts, provides that for years 2010 through 2045 the minimum contribution to
NOTES TO FINANCIAL STATEMENTS (Continued)
Page 31
NOTE 10 - RETIREMENT FUND COMMITMENTS (Continued)
A. Teachers’ Retirement System of the State of Illinois (Continued)
General Information About the Pension Plan (Continued)
o Contributions (Continued) the System for each fiscal year shall be an amount determined to be sufficient to bring the total assets of the System up to 90% of the total actuarial liabilities of the System by the end of fiscal year 2045. Contributions from active members and TRS contributing employers are also required by the Illinois Pension Code. The contribution rates are specified in the pension code. The active member contribution rate for the year ended June 30, 2015 was 9.4% of creditable earnings. The member contribution, which may be paid on behalf of employees by the employer, is submitted to TRS by the employer.
On-Behalf Contributions to TRS
The State of Illinois makes employer pension contributions on behalf of the District. For the year ended June 30, 2015, State of Illinois contributions recognized by the District were based on the State’s proportionate share of the collective net pension liability associated with the District, and the District recognized revenue and expenditures of $3,683,693 in pension contributions from the State of Illinois.
2.2 Formula Contributions Employers contribute 0.58% of total creditable earnings for the 2.2 formula change. The contribution rate is specified by statute. Contributions for the year ended June 30, 2015 were $46,696, and are deferred because they were paid after the June 30, 2014 measurement date.
Federal and Special Trust Fund Contributions When TRS members are paid from federal and special trust funds administered by the employer, there is a statutory requirement for the employer to pay an employer pension contribution from those funds. Under a policy adopted by the TRS Board of Trustees that has been in effect since the fiscal year ended June 30, 2006, employer contributions for employees paid from federal and special trust funds will be the same as the State contribution rate to TRS. Public Act 98-0674 now requires the two rates to be the same. For the year ended June 30, 2015, the District pension contribution was 33.00% of salaries paid from federal and special trust funds. For the year ended June 30, 2015, salaries totaling $49,966 were paid from federal and special trust funds that required District contributions of $16,489. These contributions are deferred because they were paid after the June 30, 2014 measurement date.
Employer Retirement Cost Contributions Under GASB Statement No. 68, contributions that an employer is required to pay because of a TRS member retiring are categorized as specific liability payments. The employer is required to make a one-time contribution to TRS for members retiring under the Early
NOTES TO FINANCIAL STATEMENTS (Continued)
Page 32
NOTE 10 - RETIREMENT FUND COMMITMENTS (Continued)
A. Teachers’ Retirement System of the State of Illinois (Continued)
General Information About the Pension Plan (Continued)
o Contributions (Continued) Employer Retirement Cost Contributions (Continued)
Retirement Option (ERO). The payments vary depending on the member’s age and salary. The maximum employer ERO contribution under the current program is 146.5% and applies when the member is age 55 at retirement. For the year ended June 30, 2015, the District paid $0 to TRS for employer ERO contributions.
The employer is also required to make a one-time contribution to TRS for members granted salary increases over 6% if those salaries are used to calculate a retiree’s final average salary. A one-time contribution is also required for members granted sick leave days in excess of the normal annual allotment if those days are used as TRS service credit. For the year ended June 30, 2015, the District paid $0 to TRS for employer contributions due on salary increases in excess of 6% and $0 for sick leave days granted in excess of the normal annual allotment.
Pension Liabilities, Pension Expense, and Deferred Outflows of Resources
and Deferred Inflows of Resources Related to Pensions
At June 30, 2015, the District reported a liability for its proportionate share of the net pension liability (first amount shown below) that reflected a reduction for state pension support provided to the District. The State’s support and total are for disclosure purposes only. The amount recognized by the District as its proportionate share of the net pension liability, the related State support, and the total portion of the net pension liability that was associated with the District were as follows:
State's proportionate share of the net pension liability 45,754,124$ District's proportionate share of the net pension liability 1,516,883
Total Net Pension Liability 47,271,007$
The net pension liability was measured as of June 30, 2014, and the total pension liability used to calculate the net pension liability was determined by an actuarial valuation as of June 30, 2013 and rolled forward to June 30, 2014. The District’s proportion of the net pension liability was based on the District’s share of contributions to TRS for the measurement year ended June 30, 2014, relative to the projected contributions of all participating TRS employers and the State during that period. At June 30, 2014, the District’s proportion was 0.00249249%. The net pension liability as of the beginning of this first measurement period under GASB Statement No. 68 was measured as of June 30, 2013, and the total pension liability was based on the June 30, 2013 actuarial valuation without any roll-up. The District’s proportion of the net pension liability as of June 30, 2013 was based on the District’s share of contributions to TRS for the measurement year ended June 30, 2013, relative to the projected contributions of all participating TRS employers and the State during that period. At June 30, 2013, the District’s proportion was 0.00210994%.
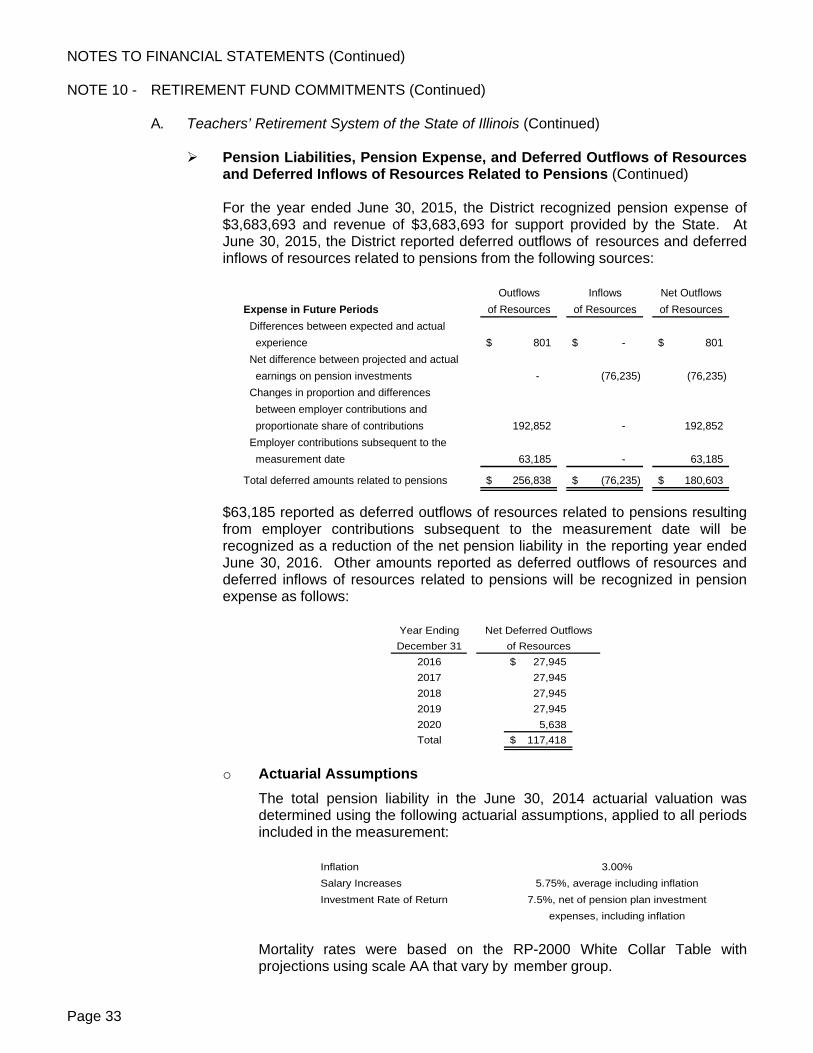
NOTES TO FINANCIAL STATEMENTS (Continued)
Page 33
NOTE 10 - RETIREMENT FUND COMMITMENTS (Continued)
A. Teachers’ Retirement System of the State of Illinois (Continued) Pension Liabilities, Pension Expense, and Deferred Outflows of Resources
and Deferred Inflows of Resources Related to Pensions (Continued)
For the year ended June 30, 2015, the District recognized pension expense of $3,683,693 and revenue of $3,683,693 for support provided by the State. At June 30, 2015, the District reported deferred outflows of resources and deferred inflows of resources related to pensions from the following sources:
Outflows Inflows Net OutflowsExpense in Future Periods of Resources of Resources of Resources Differences between expected and actual experience 801$ -$ 801$ Net difference between projected and actual earnings on pension investments - (76,235) (76,235) Changes in proportion and differences between employer contributions and proportionate share of contributions 192,852 - 192,852 Employer contributions subsequent to the measurement date 63,185 - 63,185
Total deferred amounts related to pensions 256,838$ (76,235)$ 180,603$
$63,185 reported as deferred outflows of resources related to pensions resulting from employer contributions subsequent to the measurement date will be recognized as a reduction of the net pension liability in the reporting year ended June 30, 2016. Other amounts reported as deferred outflows of resources and deferred inflows of resources related to pensions will be recognized in pension expense as follows:
Year EndingDecember 31
2016 27,945$ 2017 27,945 2018 27,945 2019 27,945 2020 5,638 Total 117,418$
of ResourcesNet Deferred Outflows
o Actuarial Assumptions
The total pension liability in the June 30, 2014 actuarial valuation was determined using the following actuarial assumptions, applied to all periods included in the measurement:
Inflation 3.00%Salary Increases 5.75%, average including inflationInvestment Rate of Return 7.5%, net of pension plan investment
expenses, including inflation
Mortality rates were based on the RP-2000 White Collar Table with projections using scale AA that vary by member group.
NOTES TO FINANCIAL STATEMENTS (Continued)
Page 34
NOTE 10 - RETIREMENT FUND COMMITMENTS (Continued)
A. Teachers’ Retirement System of the State of Illinois (Continued) Pension Liabilities, Pension Expense, and Deferred Outflows of Resources
and Deferred Inflows of Resources Related to Pensions (Continued)
o Actuarial Assumptions (Continued) For GASB disclosure purposes, the actuarial assumptions for the years ended June 30, 2014 and 2013 were assumed to be the same. However, for funding purposes, the actuarial valuations for those two years were different. The actuarial assumptions used in the June 30, 2014 valuation were based on updates to economic assumptions adopted in 2014 which lowered the investment return assumption from 8.0% to 7.5%. The salary increase and inflation assumptions were also lowered. The actuarial assumptions used in the June 30, 2013 valuation were based on the 2012 actuarial experience analysis and first adopted in the June 30, 2012 valuation. The investment return assumption was lowered from 8.5% to 8.0% and the salary increase and inflation assumptions were also lowered. Mortality assumptions were adjusted to anticipate continued improvement in mortality. The long-term expected rate of return on pension plan investments was determined using a building-block method in which best-estimate ranges of expected future real rates of return (expected returns, net of pension plan investment expense and inflation) are developed for each major asset class. These ranges are combined to produce the long-term expected rate of return by weighting the expected future real rates of return by the target asset allocation percentage and by adding expected inflation. The target allocation and best estimates of arithmetic real rates of return for each major asset class that were used by the actuary are summarized in the following table:
Target ProjectedAsset Class Allocation Return
U.S. Large Cap 18.00% 8.23%Global Equity Excluding U.S. 18.00% 8.58%Aggregate Bonds 16.00% 2.27%U.S. TIPS 2.00% 3.52%NCREIF 11.00% 5.81%Opportunistic Real Estate 4.00% 9.79%ARS 8.00% 3.27%Risk Parity 8.00% 5.57%Diversified Inflation Strategy 1.00% 3.96%Private Equity 14.00% 13.03%
100.00%
o Discount Rate
The discount rate used to measure the total pension liability was 7.50%. The projection of cash flows used to determine the discount rate assumed that employee contributions, employer contributions, and State contributions will be made at the current statutorily-required rates. Based on those assumptions, TRS’s fiduciary net position was projected to be available to make all projected future benefit payments of current active and inactive members and all benefit recipients. Tier I’s liability is partially-
NOTES TO FINANCIAL STATEMENTS (Continued)
Page 35
NOTE 10 - RETIREMENT FUND COMMITMENTS (Continued)
A. Teachers’ Retirement System of the State of Illinois (Continued) Pension Liabilities, Pension Expense, and Deferred Outflows of Resources
and Deferred Inflows of Resources Related to Pensions (Continued)
o Discount Rate
funded by Tier II members, as the Tier II member contribution is higher than the cost of Tier II benefits. Due to this subsidy, contributions from future members in excess of the service cost are also included in the determination of the discount rate. Therefore, the long-term expected rate of return on TRS investments was applied to all periods of projected benefit payments to determine the total pension liability.
o Sensitivity of the District’s Proportionate Share of the Net Pension
Liability to Changes in the Discount Rate The following presents the District’s proportionate share of the net pension liability calculated using the discount rate of 7.5%, as well as what the District’s proportionate share of the net pension liability would be if it were calculated using a discount rate that is 1-percentage-point lower (6.5%) or 1-percentage-point-higher (8.5%) than the current rate.
Current1% Decrease Discount Rate 1% Increase
6.50% 7.50% 8.50%Net Pension Liability 1,873,277$ 1,516,883$ 1,221,749$
o TRS Fiduciary Net Position
Detailed information about the TRS’s fiduciary net position as of June 30, 2014 is available in the separately issued TRS Comprehensive Annual Financial Report.
B. Illinois Municipal Retirement Fund
Plan Description The District’s defined benefit pension plan for Regular employees provides retirement and disability benefits, post retirement increases, and death benefits to plan members and beneficiaries. The District’s plan is managed by the Illinois Municipal Retirement Fund (IMRF), the administrator of a multi-employer public pension fund. Benefit provisions are established by statute and may only be changed by the General Assembly of the State of Illinois. IMRF issues a publicly available Comprehensive Annual Financial Report that includes financial statements, detailed information about the pension plan’s fiduciary net position and required supplementary information. That report may be obtained on-line at www.imrf.org.
Benefits Provided IMRF has three benefit plans. The vast majority of IMRF members participate in the Regular Plan (RP). The Sheriff’s Law Enforcement Personnel (SLEP) plan is for sheriffs, deputy sheriffs, and selected police chiefs. Counties could adopt the Elected County Official (ECO) plan for officials elected prior to August 8, 2011 (the ECO plan was closed to new participants after that date).
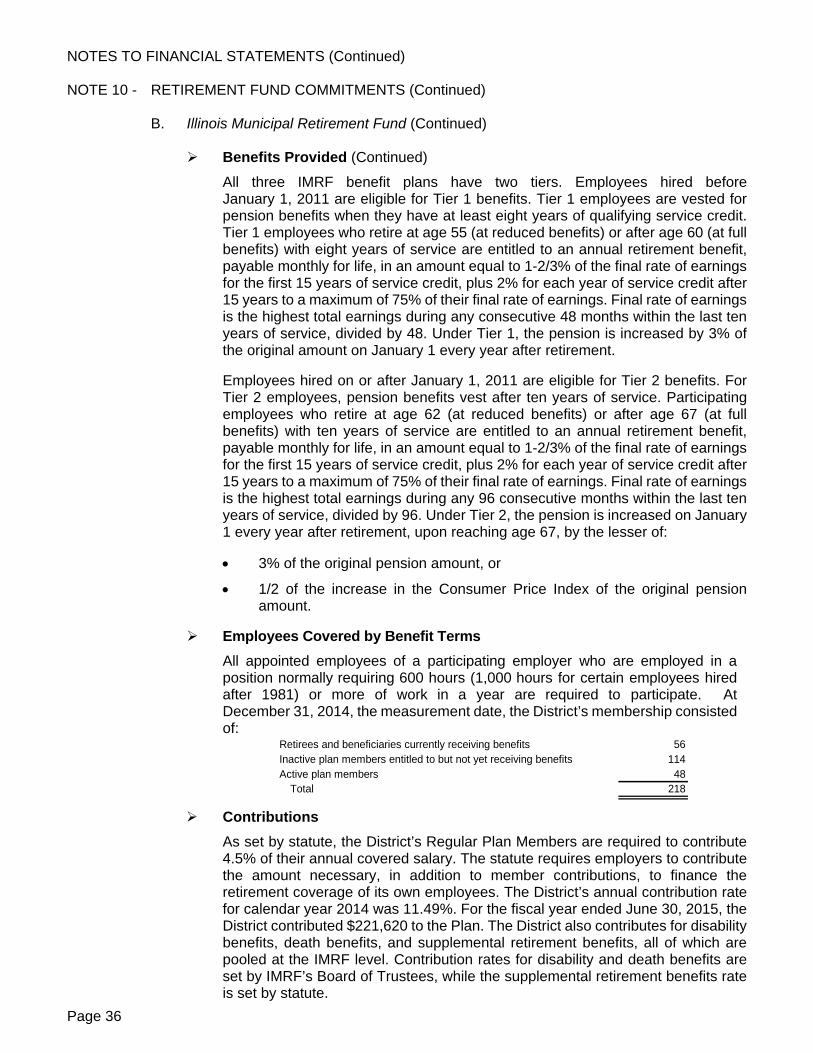
NOTES TO FINANCIAL STATEMENTS (Continued)
Page 36
NOTE 10 - RETIREMENT FUND COMMITMENTS (Continued) B. Illinois Municipal Retirement Fund (Continued)
Benefits Provided (Continued) All three IMRF benefit plans have two tiers. Employees hired before January 1, 2011 are eligible for Tier 1 benefits. Tier 1 employees are vested for pension benefits when they have at least eight years of qualifying service credit. Tier 1 employees who retire at age 55 (at reduced benefits) or after age 60 (at full benefits) with eight years of service are entitled to an annual retirement benefit, payable monthly for life, in an amount equal to 1-2/3% of the final rate of earnings for the first 15 years of service credit, plus 2% for each year of service credit after 15 years to a maximum of 75% of their final rate of earnings. Final rate of earnings is the highest total earnings during any consecutive 48 months within the last ten years of service, divided by 48. Under Tier 1, the pension is increased by 3% of the original amount on January 1 every year after retirement. Employees hired on or after January 1, 2011 are eligible for Tier 2 benefits. For Tier 2 employees, pension benefits vest after ten years of service. Participating employees who retire at age 62 (at reduced benefits) or after age 67 (at full benefits) with ten years of service are entitled to an annual retirement benefit, payable monthly for life, in an amount equal to 1-2/3% of the final rate of earnings for the first 15 years of service credit, plus 2% for each year of service credit after 15 years to a maximum of 75% of their final rate of earnings. Final rate of earnings is the highest total earnings during any 96 consecutive months within the last ten years of service, divided by 96. Under Tier 2, the pension is increased on January 1 every year after retirement, upon reaching age 67, by the lesser of:
3% of the original pension amount, or
1/2 of the increase in the Consumer Price Index of the original pension amount.
Employees Covered by Benefit Terms
All appointed employees of a participating employer who are employed in a position normally requiring 600 hours (1,000 hours for certain employees hired after 1981) or more of work in a year are required to participate. At December 31, 2014, the measurement date, the District’s membership consisted of:
Retirees and beneficiaries currently receiving benefits 56Inactive plan members entitled to but not yet receiving benefits 114Active plan members 48
Total 218
Contributions As set by statute, the District’s Regular Plan Members are required to contribute 4.5% of their annual covered salary. The statute requires employers to contribute the amount necessary, in addition to member contributions, to finance the retirement coverage of its own employees. The District’s annual contribution rate for calendar year 2014 was 11.49%. For the fiscal year ended June 30, 2015, the District contributed $221,620 to the Plan. The District also contributes for disability benefits, death benefits, and supplemental retirement benefits, all of which are pooled at the IMRF level. Contribution rates for disability and death benefits are set by IMRF’s Board of Trustees, while the supplemental retirement benefits rate is set by statute.
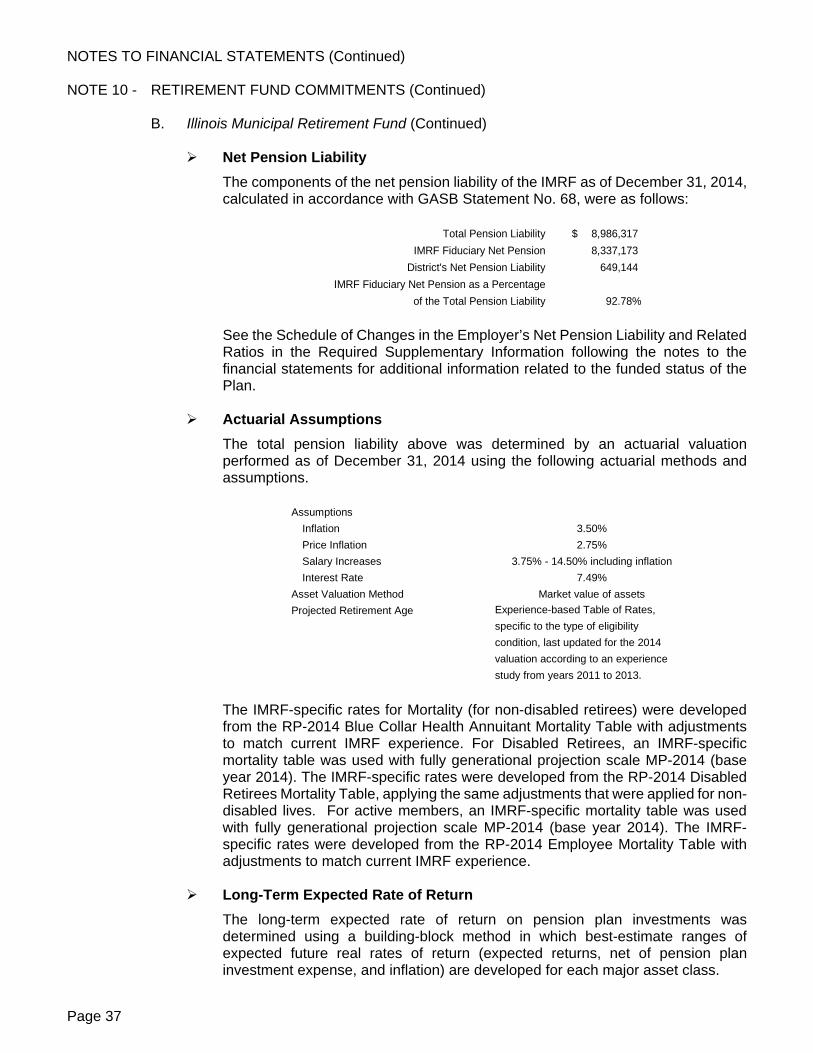
NOTES TO FINANCIAL STATEMENTS (Continued)
Page 37
NOTE 10 - RETIREMENT FUND COMMITMENTS (Continued) B. Illinois Municipal Retirement Fund (Continued)
Net Pension Liability The components of the net pension liability of the IMRF as of December 31, 2014, calculated in accordance with GASB Statement No. 68, were as follows:
8,986,317$ 8,337,173
649,144
92.78%
Total Pension LiabilityIMRF Fiduciary Net Pension
District's Net Pension LiabilityIMRF Fiduciary Net Pension as a Percentage
of the Total Pension Liability
See the Schedule of Changes in the Employer’s Net Pension Liability and Related Ratios in the Required Supplementary Information following the notes to the financial statements for additional information related to the funded status of the Plan.
Actuarial Assumptions
The total pension liability above was determined by an actuarial valuation performed as of December 31, 2014 using the following actuarial methods and assumptions.
AssumptionsInflation 3.50%Price Inflation 2.75%Salary Increases 3.75% - 14.50% including inflationInterest Rate 7.49%
Asset Valuation Method Market value of assetsProjected Retirement Age Experience-based Table of Rates,
specific to the type of eligibilitycondition, last updated for the 2014valuation according to an experiencestudy from years 2011 to 2013.
The IMRF-specific rates for Mortality (for non-disabled retirees) were developed from the RP-2014 Blue Collar Health Annuitant Mortality Table with adjustments to match current IMRF experience. For Disabled Retirees, an IMRF-specific mortality table was used with fully generational projection scale MP-2014 (base year 2014). The IMRF-specific rates were developed from the RP-2014 Disabled Retirees Mortality Table, applying the same adjustments that were applied for non-disabled lives. For active members, an IMRF-specific mortality table was used with fully generational projection scale MP-2014 (base year 2014). The IMRF-specific rates were developed from the RP-2014 Employee Mortality Table with adjustments to match current IMRF experience.
Long-Term Expected Rate of Return The long-term expected rate of return on pension plan investments was determined using a building-block method in which best-estimate ranges of expected future real rates of return (expected returns, net of pension plan investment expense, and inflation) are developed for each major asset class.
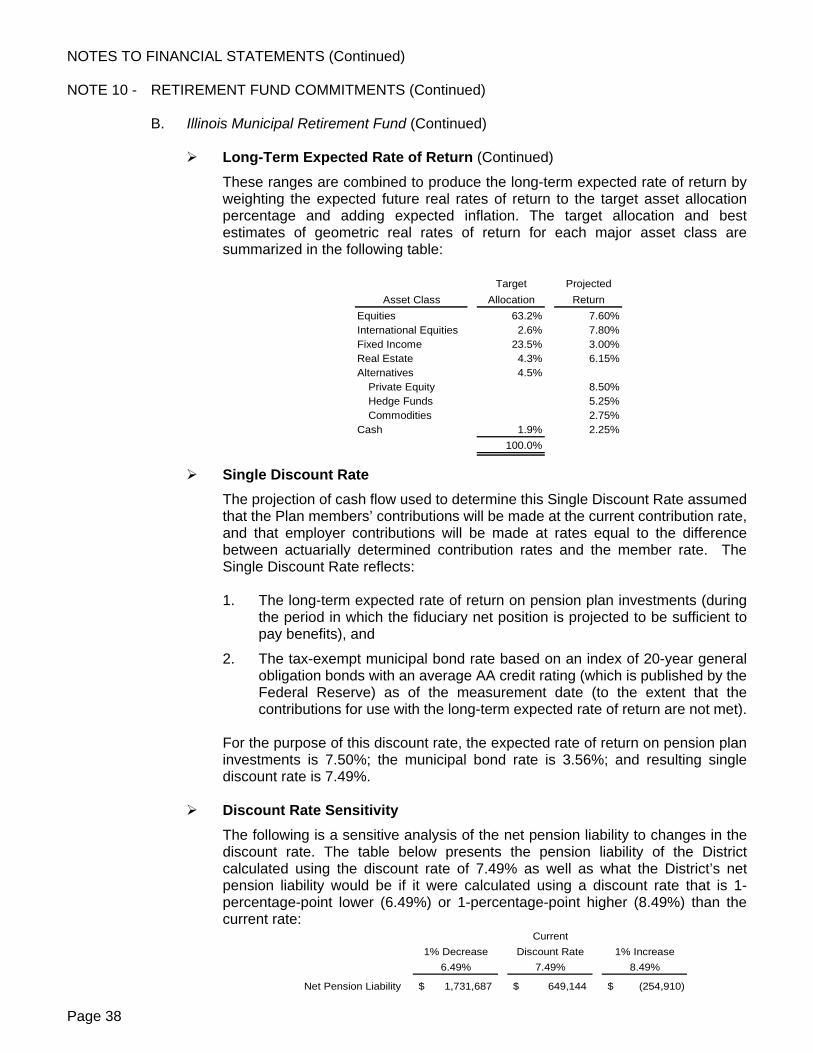
NOTES TO FINANCIAL STATEMENTS (Continued)
Page 38
NOTE 10 - RETIREMENT FUND COMMITMENTS (Continued) B. Illinois Municipal Retirement Fund (Continued)
Long-Term Expected Rate of Return (Continued) These ranges are combined to produce the long-term expected rate of return by weighting the expected future real rates of return to the target asset allocation percentage and adding expected inflation. The target allocation and best estimates of geometric real rates of return for each major asset class are summarized in the following table:
Target ProjectedAsset Class Allocation Return
Equities 63.2% 7.60%International Equities 2.6% 7.80%Fixed Income 23.5% 3.00%Real Estate 4.3% 6.15%Alternatives 4.5%
Private Equity 8.50%Hedge Funds 5.25%Commodities 2.75%
Cash 1.9% 2.25%100.0%
Single Discount Rate
The projection of cash flow used to determine this Single Discount Rate assumed that the Plan members’ contributions will be made at the current contribution rate, and that employer contributions will be made at rates equal to the difference between actuarially determined contribution rates and the member rate. The Single Discount Rate reflects:
1. The long-term expected rate of return on pension plan investments (during
the period in which the fiduciary net position is projected to be sufficient to pay benefits), and
2. The tax-exempt municipal bond rate based on an index of 20-year general obligation bonds with an average AA credit rating (which is published by the Federal Reserve) as of the measurement date (to the extent that the contributions for use with the long-term expected rate of return are not met).
For the purpose of this discount rate, the expected rate of return on pension plan investments is 7.50%; the municipal bond rate is 3.56%; and resulting single discount rate is 7.49%.
Discount Rate Sensitivity
The following is a sensitive analysis of the net pension liability to changes in the discount rate. The table below presents the pension liability of the District calculated using the discount rate of 7.49% as well as what the District’s net pension liability would be if it were calculated using a discount rate that is 1-percentage-point lower (6.49%) or 1-percentage-point higher (8.49%) than the current rate:
Current1% Decrease Discount Rate 1% Increase
6.49% 7.49% 8.49%
Net Pension Liability 1,731,687$ 649,144$ (254,910)$
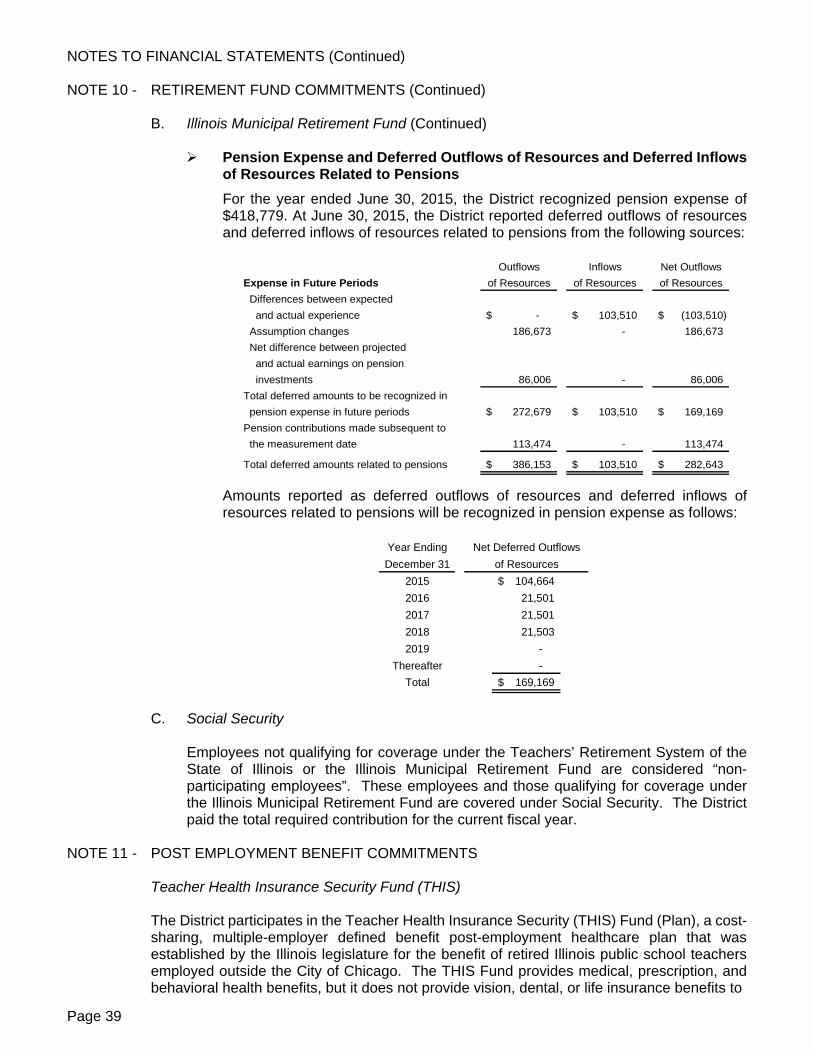
NOTES TO FINANCIAL STATEMENTS (Continued)
Page 39
NOTE 10 - RETIREMENT FUND COMMITMENTS (Continued) B. Illinois Municipal Retirement Fund (Continued)
Pension Expense and Deferred Outflows of Resources and Deferred Inflows of Resources Related to Pensions For the year ended June 30, 2015, the District recognized pension expense of $418,779. At June 30, 2015, the District reported deferred outflows of resources and deferred inflows of resources related to pensions from the following sources:
Outflows Inflows Net OutflowsExpense in Future Periods of Resources of Resources of Resources Differences between expected and actual experience -$ 103,510$ (103,510)$ Assumption changes 186,673 - 186,673 Net difference between projected and actual earnings on pension investments 86,006 - 86,006 Total deferred amounts to be recognized in pension expense in future periods 272,679$ 103,510$ 169,169$ Pension contributions made subsequent to the measurement date 113,474 - 113,474
Total deferred amounts related to pensions 386,153$ 103,510$ 282,643$
Amounts reported as deferred outflows of resources and deferred inflows of resources related to pensions will be recognized in pension expense as follows:
Year EndingDecember 31
2015 104,664$ 2016 21,501 2017 21,501 2018 21,503 2019 -
Thereafter - Total 169,169$
Net Deferred Outflowsof Resources
C. Social Security
Employees not qualifying for coverage under the Teachers’ Retirement System of the State of Illinois or the Illinois Municipal Retirement Fund are considered “non-participating employees”. These employees and those qualifying for coverage under the Illinois Municipal Retirement Fund are covered under Social Security. The District paid the total required contribution for the current fiscal year.
NOTE 11 - POST EMPLOYMENT BENEFIT COMMITMENTS Teacher Health Insurance Security Fund (THIS)
The District participates in the Teacher Health Insurance Security (THIS) Fund (Plan), a cost-sharing, multiple-employer defined benefit post-employment healthcare plan that was established by the Illinois legislature for the benefit of retired Illinois public school teachers employed outside the City of Chicago. The THIS Fund provides medical, prescription, and behavioral health benefits, but it does not provide vision, dental, or life insurance benefits to
NOTES TO FINANCIAL STATEMENTS (Continued)
Page 40
NOTE 11 - POST EMPLOYMENT BENEFIT COMMITMENTS (Continued) Teacher Health Insurance Security Fund (THIS) (Continued)
annuitants of the Teachers’ Retirement System (TRS). Annuitants not enrolled in Medicare may participate in the state-administered participating provider option plan or choose from several managed care options. Annuitants who are enrolled in Medicare Parts A and B may be eligible to enroll in Medicare Advantage plans.
The State Employees Group Insurance Act of 1971 (5 ILCS 375) outlines the benefit provisions of the THIS Fund and amendments to the Plan can be made only by legislative action with the Governor’s approval. Effective July 1, 2012, in accordance with Executive Order 12-01, the plan is administered by the Illinois Department of Central Management Services (CMS) with the cooperation of TRS. Section 6.6 of the State Employees Group Insurance Act of 1971 requires all active contributors to TRS who are not employees of the State make a contribution to the THIS Fund. The percentage of employer required contributions in the future will not exceed 105% of the percentage of salary actually required to be paid in the previous fiscal year.
On behalf contributions to THIS Fund
The State of Illinois makes employer retiree health insurance contributions on behalf of the District. State contributions are intended to match contributions to the THIS Fund from active members which were 1.02% of pay during the year ended June 30, 2015. State of Illinois contributions were $82,120, and the District recognized revenue and expenditures of this amount during the year.
Employer contributions to THIS Fund
The District also makes contributions to the THIS Fund. The District THIS Fund contribution was 0.76% during the year ended June 30, 2015. For the year ended June 30, 2015, the District paid $61,187 to the THIS Fund, which was 100% of the required contribution.
The publicly available financial report of the THIS Fund may be found on the website of the Illinois Auditor General: http://www.auditor.illionois.gov/audit-reports/ASC-list.asp. The current reports are listed under “Central Management Services.” Prior reports are available under “Healthcare and Family Services.”
NOTE 12 - INTERFUND TRANSFERS The following funds were transferred during the year ended June 30, 2015:
Transfer From Transfer To Amount
Operations and Maintenance Fund Capital Projects Fund 118,000$ Operations and Maintenance Fund Fire Prevention and Life Safety Fund 167,575 Transporation Fund General Fund 1,700,000
The transfers from the Operations and Maintenance Fund to the Capital Projects Fund and Fire Prevention and Life Safety Fund were made to transfer interest for future projects. The transfer from the Transportation Fund to the General Fund was made to cover general education expenditures.
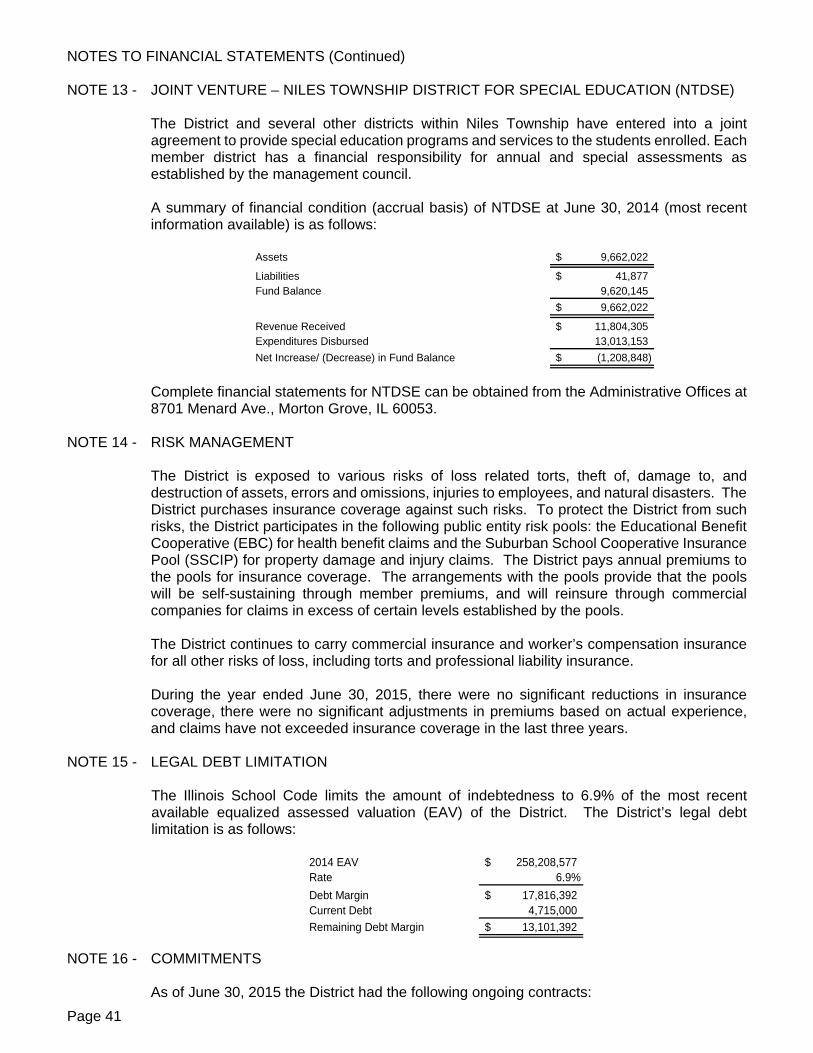
NOTES TO FINANCIAL STATEMENTS (Continued)
Page 41
NOTE 13 - JOINT VENTURE – NILES TOWNSHIP DISTRICT FOR SPECIAL EDUCATION (NTDSE)
The District and several other districts within Niles Township have entered into a joint agreement to provide special education programs and services to the students enrolled. Each member district has a financial responsibility for annual and special assessments as established by the management council.
A summary of financial condition (accrual basis) of NTDSE at June 30, 2014 (most recent information available) is as follows:
Assets 9,662,022$
Liabilities 41,877$ Fund Balance 9,620,145
9,662,022$
Revenue Received 11,804,305$ Expenditures Disbursed 13,013,153 Net Increase/ (Decrease) in Fund Balance (1,208,848)$
Complete financial statements for NTDSE can be obtained from the Administrative Offices at 8701 Menard Ave., Morton Grove, IL 60053.
NOTE 14 - RISK MANAGEMENT
The District is exposed to various risks of loss related torts, theft of, damage to, and destruction of assets, errors and omissions, injuries to employees, and natural disasters. The District purchases insurance coverage against such risks. To protect the District from such risks, the District participates in the following public entity risk pools: the Educational Benefit Cooperative (EBC) for health benefit claims and the Suburban School Cooperative Insurance Pool (SSCIP) for property damage and injury claims. The District pays annual premiums to the pools for insurance coverage. The arrangements with the pools provide that the pools will be self-sustaining through member premiums, and will reinsure through commercial companies for claims in excess of certain levels established by the pools. The District continues to carry commercial insurance and worker’s compensation insurance for all other risks of loss, including torts and professional liability insurance. During the year ended June 30, 2015, there were no significant reductions in insurance coverage, there were no significant adjustments in premiums based on actual experience, and claims have not exceeded insurance coverage in the last three years.
NOTE 15 - LEGAL DEBT LIMITATION
The Illinois School Code limits the amount of indebtedness to 6.9% of the most recent available equalized assessed valuation (EAV) of the District. The District’s legal debt limitation is as follows:
2014 EAV 258,208,577$ Rate 6.9%Debt Margin 17,816,392$ Current Debt 4,715,000 Remaining Debt Margin 13,101,392$
NOTE 16 - COMMITMENTS
As of June 30, 2015 the District had the following ongoing contracts:
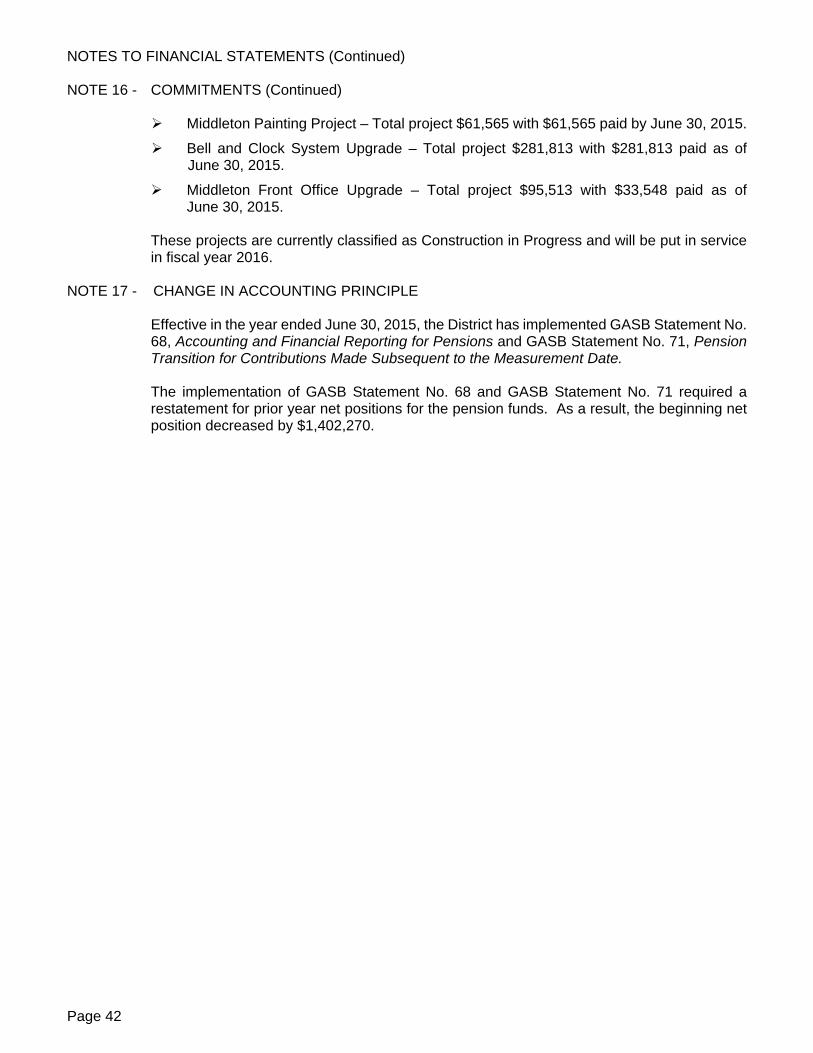
NOTES TO FINANCIAL STATEMENTS (Continued)
Page 42
NOTE 16 - COMMITMENTS (Continued)
Middleton Painting Project – Total project $61,565 with $61,565 paid by June 30, 2015.
Bell and Clock System Upgrade – Total project $281,813 with $281,813 paid as of June 30, 2015.
Middleton Front Office Upgrade – Total project $95,513 with $33,548 paid as of June 30, 2015.
These projects are currently classified as Construction in Progress and will be put in service in fiscal year 2016.
NOTE 17 - CHANGE IN ACCOUNTING PRINCIPLE Effective in the year ended June 30, 2015, the District has implemented GASB Statement No. 68, Accounting and Financial Reporting for Pensions and GASB Statement No. 71, Pension Transition for Contributions Made Subsequent to the Measurement Date. The implementation of GASB Statement No. 68 and GASB Statement No. 71 required a restatement for prior year net positions for the pension funds. As a result, the beginning net position decreased by $1,402,270.

REQUIRED SUPPLEMENTARY INFORMATION
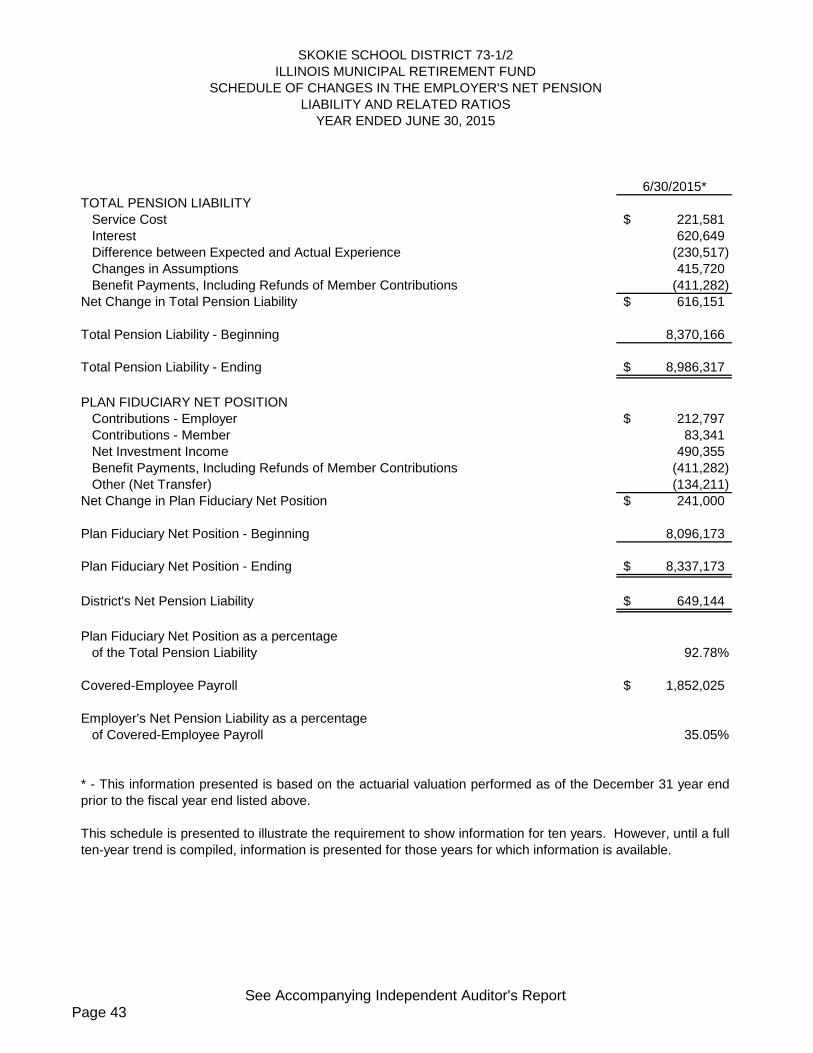
Page 43See Accompanying Independent Auditor's Report
6/30/2015*TOTAL PENSION LIABILITY
Service Cost 221,581$ Interest 620,649 Difference between Expected and Actual Experience (230,517) Changes in Assumptions 415,720 Benefit Payments, Including Refunds of Member Contributions (411,282)
Net Change in Total Pension Liability 616,151$
Total Pension Liability - Beginning 8,370,166
Total Pension Liability - Ending 8,986,317$
PLAN FIDUCIARY NET POSITIONContributions - Employer 212,797$ Contributions - Member 83,341 Net Investment Income 490,355 Benefit Payments, Including Refunds of Member Contributions (411,282) Other (Net Transfer) (134,211)
Net Change in Plan Fiduciary Net Position 241,000$
Plan Fiduciary Net Position - Beginning 8,096,173
Plan Fiduciary Net Position - Ending 8,337,173$
District's Net Pension Liability 649,144$
Plan Fiduciary Net Position as a percentage of the Total Pension Liability 92.78%
Covered-Employee Payroll 1,852,025$
Employer's Net Pension Liability as a percentageof Covered-Employee Payroll 35.05%
YEAR ENDED JUNE 30, 2015
SKOKIE SCHOOL DISTRICT 73-1/2
SCHEDULE OF CHANGES IN THE EMPLOYER'S NET PENSIONLIABILITY AND RELATED RATIOS
This schedule is presented to illustrate the requirement to show information for ten years. However, until a fullten-year trend is compiled, information is presented for those years for which information is available.
* - This information presented is based on the actuarial valuation performed as of the December 31 year endprior to the fiscal year end listed above.
ILLINOIS MUNICIPAL RETIREMENT FUND
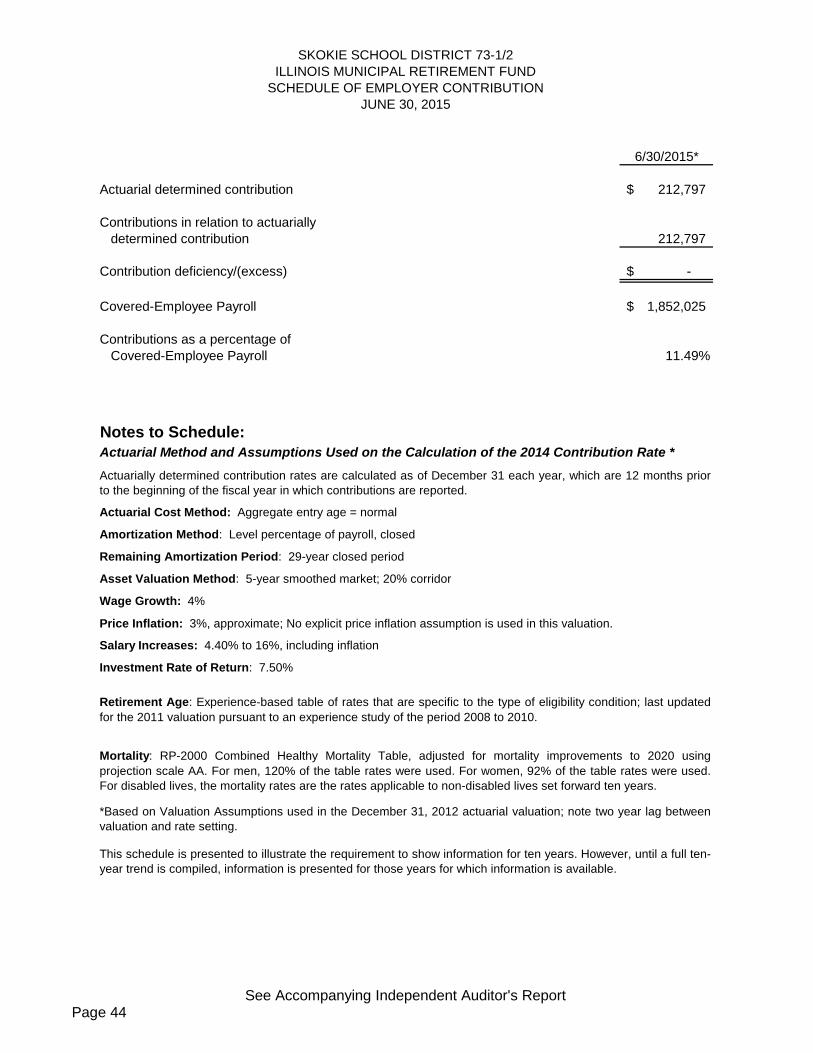
Page 44See Accompanying Independent Auditor's Report
6/30/2015*
Actuarial determined contribution 212,797$
Contributions in relation to actuariallydetermined contribution 212,797
Contribution deficiency/(excess) -$
Covered-Employee Payroll 1,852,025$
Contributions as a percentage ofCovered-Employee Payroll 11.49%
Notes to Schedule:Actuarial Method and Assumptions Used on the Calculation of the 2014 Contribution Rate *
Actuarial Cost Method: Aggregate entry age = normal
Amortization Method: Level percentage of payroll, closed
Remaining Amortization Period: 29-year closed period
Asset Valuation Method: 5-year smoothed market; 20% corridor
Wage Growth: 4%
Salary Increases: 4.40% to 16%, including inflation
Investment Rate of Return: 7.50%
Mortality: RP-2000 Combined Healthy Mortality Table, adjusted for mortality improvements to 2020 usingprojection scale AA. For men, 120% of the table rates were used. For women, 92% of the table rates were used.For disabled lives, the mortality rates are the rates applicable to non-disabled lives set forward ten years.
Actuarially determined contribution rates are calculated as of December 31 each year, which are 12 months priorto the beginning of the fiscal year in which contributions are reported.
*Based on Valuation Assumptions used in the December 31, 2012 actuarial valuation; note two year lag betweenvaluation and rate setting.
This schedule is presented to illustrate the requirement to show information for ten years. However, until a full ten-year trend is compiled, information is presented for those years for which information is available.
SKOKIE SCHOOL DISTRICT 73-1/2ILLINOIS MUNICIPAL RETIREMENT FUND
SCHEDULE OF EMPLOYER CONTRIBUTIONJUNE 30, 2015
Price Inflation: 3%, approximate; No explicit price inflation assumption is used in this valuation.
Retirement Age: Experience-based table of rates that are specific to the type of eligibility condition; last updatedfor the 2011 valuation pursuant to an experience study of the period 2008 to 2010.
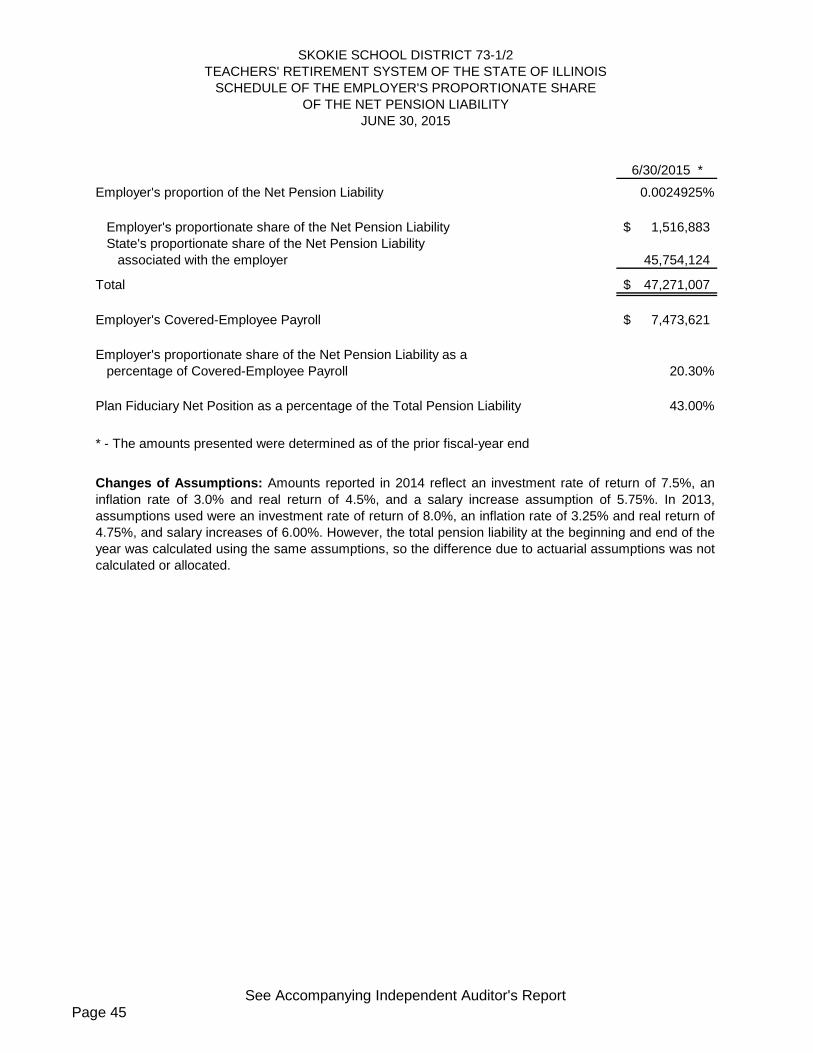
Page 45See Accompanying Independent Auditor's Report
6/30/2015 *
Employer's proportion of the Net Pension Liability 0.0024925%
Employer's proportionate share of the Net Pension Liability 1,516,883$ State's proportionate share of the Net Pension Liability
associated with the employer 45,754,124
Total 47,271,007$
Employer's Covered-Employee Payroll 7,473,621$
Employer's proportionate share of the Net Pension Liability as a percentage of Covered-Employee Payroll 20.30%
Plan Fiduciary Net Position as a percentage of the Total Pension Liability 43.00%
* - The amounts presented were determined as of the prior fiscal-year end
Changes of Assumptions: Amounts reported in 2014 reflect an investment rate of return of 7.5%, aninflation rate of 3.0% and real return of 4.5%, and a salary increase assumption of 5.75%. In 2013,assumptions used were an investment rate of return of 8.0%, an inflation rate of 3.25% and real return of4.75%, and salary increases of 6.00%. However, the total pension liability at the beginning and end of theyear was calculated using the same assumptions, so the difference due to actuarial assumptions was notcalculated or allocated.
SKOKIE SCHOOL DISTRICT 73-1/2TEACHERS' RETIREMENT SYSTEM OF THE STATE OF ILLINOIS
SCHEDULE OF THE EMPLOYER'S PROPORTIONATE SHARE
JUNE 30, 2015OF THE NET PENSION LIABILITY
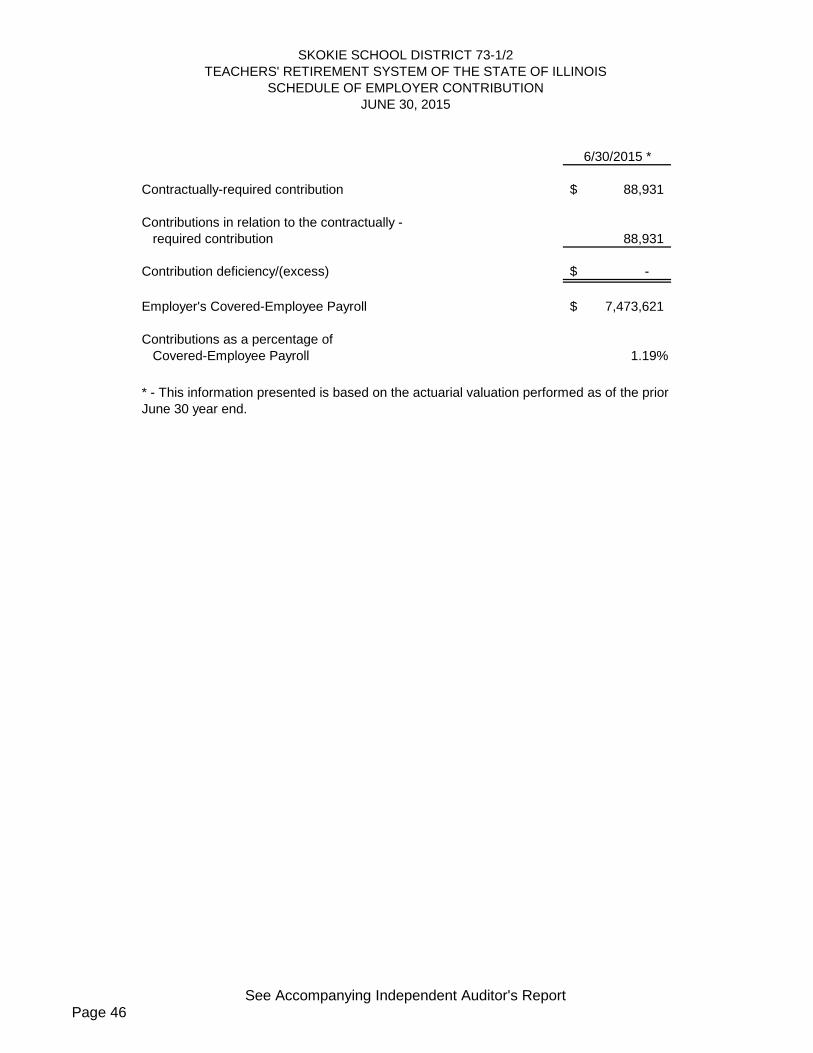
Page 46See Accompanying Independent Auditor's Report
6/30/2015 *
Contractually-required contribution 88,931$
Contributions in relation to the contractually -required contribution 88,931
Contribution deficiency/(excess) -$
Employer's Covered-Employee Payroll 7,473,621$
Contributions as a percentage ofCovered-Employee Payroll 1.19%
SKOKIE SCHOOL DISTRICT 73-1/2TEACHERS' RETIREMENT SYSTEM OF THE STATE OF ILLINOIS
SCHEDULE OF EMPLOYER CONTRIBUTIONJUNE 30, 2015
* - This information presented is based on the actuarial valuation performed as of the priorJune 30 year end.

Page 47See Accompanying Independent Auditor's Report
BudgetedAmountsOriginal Actual Variance from
and Final Amounts Final BudgetREVENUES Property Taxes 9,879,700$ 9,701,215$ (178,485)$ Payments in Lieu of Taxes 390,000 390,730 730 Tuition 170,000 269,577 99,577 Earnings on Investments 363,000 620,836 257,836 Food Service 187,500 183,222 (4,278) District/School Activity Income 55,400 88,494 33,094 Textbooks 100,000 100,327 327 Other Local Sources 28,500 30,837 2,337 State Aid General State Aid 650,000 687,713 37,713 Special Education 602,200 423,991 (178,209) Bilingual 46,000 57,968 11,968 State Free Lunch and Breakfast 3,000 1,337 (1,663) Early Childhood - Block Grant 56,000 55,628 (372) Other Restricted Revenue from State Sources 750 750 - Federal Aid Food Service 156,000 160,063 4,063 Title I 167,000 188,147 21,147 Emergency Immigrant Assistance 5,600 5,823 223 Title III - English Language Acquisition 19,388 21,277 1,889 Title II - Teacher Quality 21,198 22,235 1,037 On-Behalf Payments 2,720,400 3,765,813 1,045,413 Total Revenues 15,621,636$ 16,775,983$ 1,154,347$
EXPENDITURES Instruction Regular Programs Salaries 4,504,015$ 4,431,613$ 72,402$ Employee Benefits 679,000 621,763 57,237 Purchased Services 147,600 117,974 29,626 Supplies and Materials 351,650 292,282 59,368 Other Objects 4,000 3,423 577 Non-Capitalized Equipment 476,500 449,604 26,896
6,162,765$ 5,916,659$ 246,106$ Pre-K Programs Salaries 79,166$ 78,905$ 261$ Employee Benefits 20,800 19,721 1,079 Supplies and Materials 2,425 1,964 461
102,391$ 100,590$ 1,801$ Special Education Programs Salaries 965,051$ 963,217$ 1,834$ Employee Benefits 176,000 174,575 1,425 Purchased Services 1,500 1,397 103 Supplies and Materials 11,400 7,596 3,804
1,153,951$ 1,146,785$ 7,166$ Special Education Programs Pre-K Salaries 86,825$ 82,460$ 4,365$ Employee Benefits 25,150 24,531 619 Supplies and Materials 225 112 113
112,200$ 107,103$ 5,097$ Remedial and Supplemental Programs K-12 Salaries 160,013$ 174,682$ (14,669)$ Employee Benefits 83,065 72,502 10,563 Supplies and Materials 4,000 2,938 1,062
247,078$ 250,122$ (3,044)$ Interscholastic Programs Salaries 40,000$ 35,340$ 4,660$ Employee Benefits 750 422 328 Purchased Services 11,500 21,112 (9,612)
52,250$ 56,874$ (4,624)$
YEAR ENDED JUNE 30, 2015
SKOKIE SCHOOL DISTRICT 73-1/2 SCHEDULE OF REVENUES, EXPENDITURES, AND CHANGES
IN FUND BALANCES - BUDGET AND ACTUALGENERAL FUND
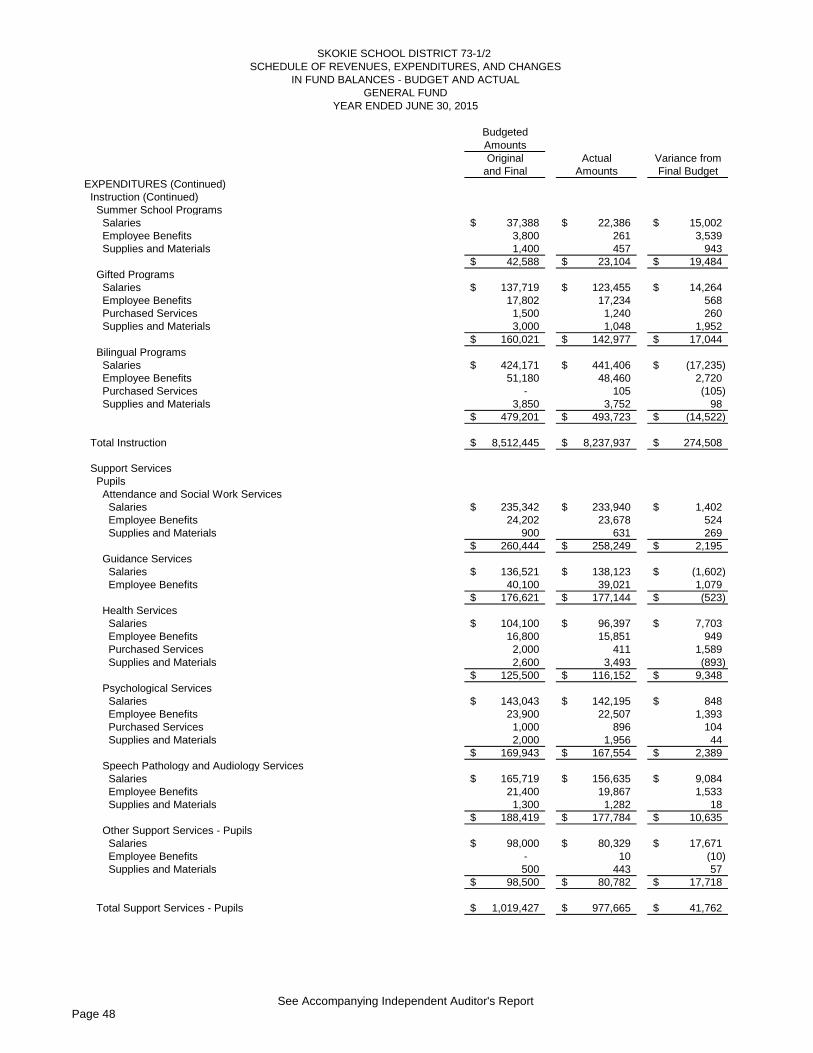
Page 48See Accompanying Independent Auditor's Report
BudgetedAmountsOriginal Actual Variance from
and Final Amounts Final Budget
YEAR ENDED JUNE 30, 2015
SKOKIE SCHOOL DISTRICT 73-1/2 SCHEDULE OF REVENUES, EXPENDITURES, AND CHANGES
IN FUND BALANCES - BUDGET AND ACTUALGENERAL FUND
EXPENDITURES (Continued) Instruction (Continued) Summer School Programs Salaries 37,388$ 22,386$ 15,002$ Employee Benefits 3,800 261 3,539 Supplies and Materials 1,400 457 943
42,588$ 23,104$ 19,484$ Gifted Programs Salaries 137,719$ 123,455$ 14,264$ Employee Benefits 17,802 17,234 568 Purchased Services 1,500 1,240 260 Supplies and Materials 3,000 1,048 1,952
160,021$ 142,977$ 17,044$ Bilingual Programs Salaries 424,171$ 441,406$ (17,235)$ Employee Benefits 51,180 48,460 2,720 Purchased Services - 105 (105) Supplies and Materials 3,850 3,752 98
479,201$ 493,723$ (14,522)$
Total Instruction 8,512,445$ 8,237,937$ 274,508$
Support Services Pupils Attendance and Social Work Services Salaries 235,342$ 233,940$ 1,402$ Employee Benefits 24,202 23,678 524 Supplies and Materials 900 631 269
260,444$ 258,249$ 2,195$ Guidance Services Salaries 136,521$ 138,123$ (1,602)$ Employee Benefits 40,100 39,021 1,079
176,621$ 177,144$ (523)$ Health Services Salaries 104,100$ 96,397$ 7,703$ Employee Benefits 16,800 15,851 949 Purchased Services 2,000 411 1,589 Supplies and Materials 2,600 3,493 (893)
125,500$ 116,152$ 9,348$ Psychological Services Salaries 143,043$ 142,195$ 848$ Employee Benefits 23,900 22,507 1,393 Purchased Services 1,000 896 104 Supplies and Materials 2,000 1,956 44
169,943$ 167,554$ 2,389$ Speech Pathology and Audiology Services Salaries 165,719$ 156,635$ 9,084$ Employee Benefits 21,400 19,867 1,533 Supplies and Materials 1,300 1,282 18
188,419$ 177,784$ 10,635$ Other Support Services - Pupils Salaries 98,000$ 80,329$ 17,671$ Employee Benefits - 10 (10) Supplies and Materials 500 443 57
98,500$ 80,782$ 17,718$
Total Support Services - Pupils 1,019,427$ 977,665$ 41,762$
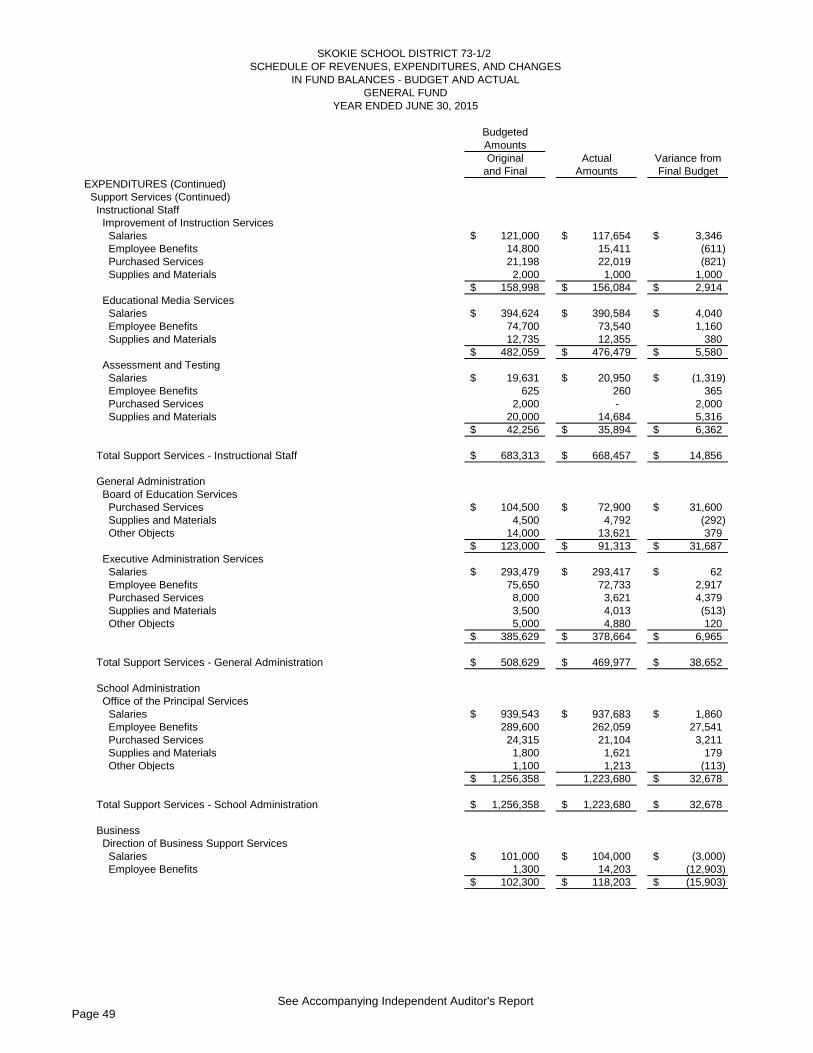
Page 49See Accompanying Independent Auditor's Report
BudgetedAmountsOriginal Actual Variance from
and Final Amounts Final Budget
YEAR ENDED JUNE 30, 2015
SKOKIE SCHOOL DISTRICT 73-1/2 SCHEDULE OF REVENUES, EXPENDITURES, AND CHANGES
IN FUND BALANCES - BUDGET AND ACTUALGENERAL FUND
EXPENDITURES (Continued) Support Services (Continued) Instructional Staff Improvement of Instruction Services Salaries 121,000$ 117,654$ 3,346$ Employee Benefits 14,800 15,411 (611) Purchased Services 21,198 22,019 (821) Supplies and Materials 2,000 1,000 1,000
158,998$ 156,084$ 2,914$ Educational Media Services Salaries 394,624$ 390,584$ 4,040$ Employee Benefits 74,700 73,540 1,160 Supplies and Materials 12,735 12,355 380
482,059$ 476,479$ 5,580$ Assessment and Testing Salaries 19,631$ 20,950$ (1,319)$ Employee Benefits 625 260 365 Purchased Services 2,000 - 2,000 Supplies and Materials 20,000 14,684 5,316
42,256$ 35,894$ 6,362$
Total Support Services - Instructional Staff 683,313$ 668,457$ 14,856$
General Administration Board of Education Services Purchased Services 104,500$ 72,900$ 31,600$ Supplies and Materials 4,500 4,792 (292) Other Objects 14,000 13,621 379
123,000$ 91,313$ 31,687$ Executive Administration Services Salaries 293,479$ 293,417$ 62$ Employee Benefits 75,650 72,733 2,917 Purchased Services 8,000 3,621 4,379 Supplies and Materials 3,500 4,013 (513) Other Objects 5,000 4,880 120
385,629$ 378,664$ 6,965$
Total Support Services - General Administration 508,629$ 469,977$ 38,652$
School Administration Office of the Principal Services Salaries 939,543$ 937,683$ 1,860$ Employee Benefits 289,600 262,059 27,541 Purchased Services 24,315 21,104 3,211 Supplies and Materials 1,800 1,621 179 Other Objects 1,100 1,213 (113)
1,256,358$ 1,223,680 32,678$
Total Support Services - School Administration 1,256,358$ 1,223,680$ 32,678$
Business Direction of Business Support Services Salaries 101,000$ 104,000$ (3,000)$ Employee Benefits 1,300 14,203 (12,903)
102,300$ 118,203$ (15,903)$
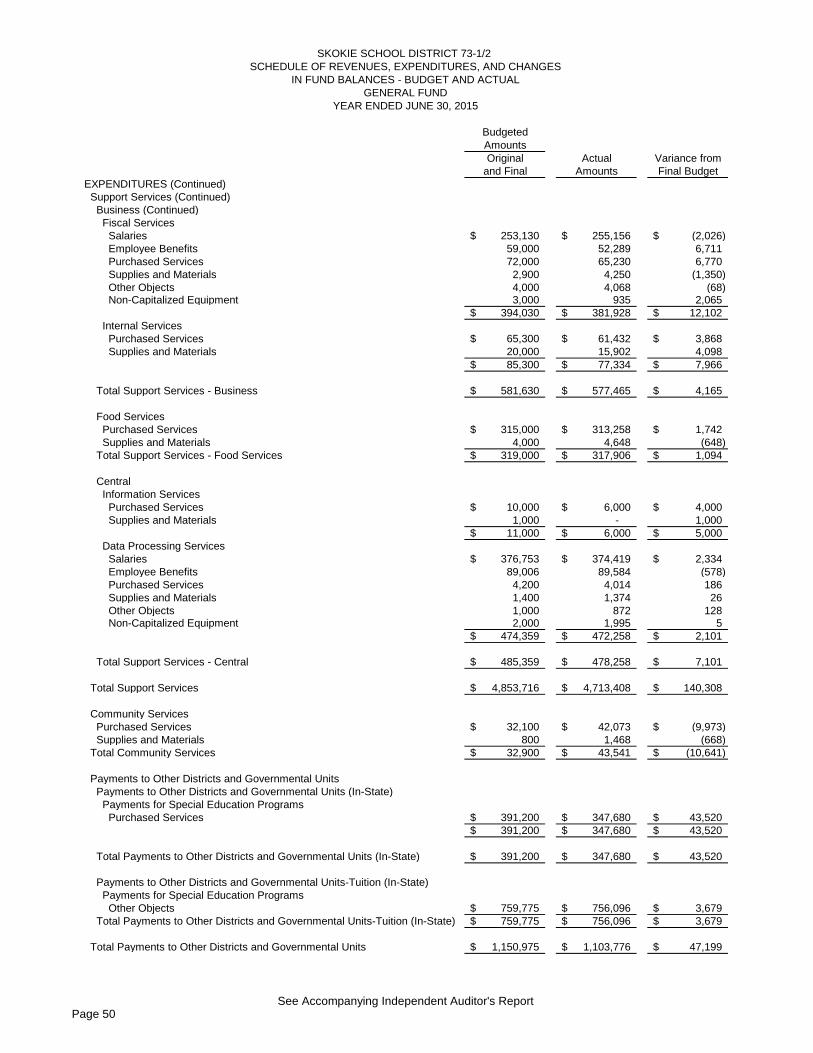
Page 50See Accompanying Independent Auditor's Report
BudgetedAmountsOriginal Actual Variance from
and Final Amounts Final Budget
YEAR ENDED JUNE 30, 2015
SKOKIE SCHOOL DISTRICT 73-1/2 SCHEDULE OF REVENUES, EXPENDITURES, AND CHANGES
IN FUND BALANCES - BUDGET AND ACTUALGENERAL FUND
EXPENDITURES (Continued) Support Services (Continued) Business (Continued) Fiscal Services Salaries 253,130$ 255,156$ (2,026)$ Employee Benefits 59,000 52,289 6,711 Purchased Services 72,000 65,230 6,770 Supplies and Materials 2,900 4,250 (1,350) Other Objects 4,000 4,068 (68) Non-Capitalized Equipment 3,000 935 2,065
394,030$ 381,928$ 12,102$ Internal Services Purchased Services 65,300$ 61,432$ 3,868$ Supplies and Materials 20,000 15,902 4,098
85,300$ 77,334$ 7,966$
Total Support Services - Business 581,630$ 577,465$ 4,165$
Food Services Purchased Services 315,000$ 313,258$ 1,742$ Supplies and Materials 4,000 4,648 (648) Total Support Services - Food Services 319,000$ 317,906$ 1,094$
Central Information Services Purchased Services 10,000$ 6,000$ 4,000$ Supplies and Materials 1,000 - 1,000
11,000$ 6,000$ 5,000$ Data Processing Services Salaries 376,753$ 374,419$ 2,334$ Employee Benefits 89,006 89,584 (578) Purchased Services 4,200 4,014 186 Supplies and Materials 1,400 1,374 26 Other Objects 1,000 872 128 Non-Capitalized Equipment 2,000 1,995 5
474,359$ 472,258$ 2,101$
Total Support Services - Central 485,359$ 478,258$ 7,101$
Total Support Services 4,853,716$ 4,713,408$ 140,308$
Community Services Purchased Services 32,100$ 42,073$ (9,973)$ Supplies and Materials 800 1,468 (668) Total Community Services 32,900$ 43,541$ (10,641)$
Payments to Other Districts and Governmental Units Payments to Other Districts and Governmental Units (In-State) Payments for Special Education Programs Purchased Services 391,200$ 347,680$ 43,520$
391,200$ 347,680$ 43,520$
Total Payments to Other Districts and Governmental Units (In-State) 391,200$ 347,680$ 43,520$
Payments to Other Districts and Governmental Units-Tuition (In-State) Payments for Special Education Programs Other Objects 759,775$ 756,096$ 3,679$ Total Payments to Other Districts and Governmental Units-Tuition (In-State) 759,775$ 756,096$ 3,679$
Total Payments to Other Districts and Governmental Units 1,150,975$ 1,103,776$ 47,199$
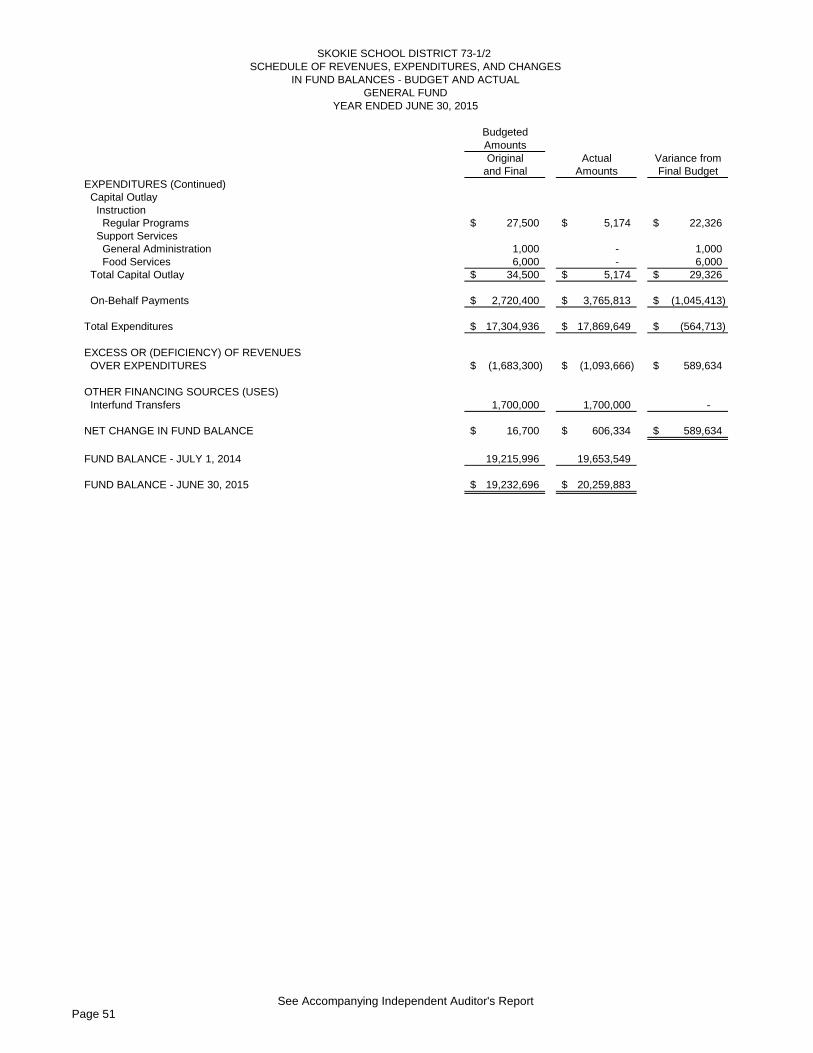
Page 51See Accompanying Independent Auditor's Report
BudgetedAmountsOriginal Actual Variance from
and Final Amounts Final Budget
YEAR ENDED JUNE 30, 2015
SKOKIE SCHOOL DISTRICT 73-1/2 SCHEDULE OF REVENUES, EXPENDITURES, AND CHANGES
IN FUND BALANCES - BUDGET AND ACTUALGENERAL FUND
EXPENDITURES (Continued) Capital Outlay Instruction Regular Programs 27,500$ 5,174$ 22,326$ Support Services General Administration 1,000 - 1,000 Food Services 6,000 - 6,000 Total Capital Outlay 34,500$ 5,174$ 29,326$
On-Behalf Payments 2,720,400$ 3,765,813$ (1,045,413)$
Total Expenditures 17,304,936$ 17,869,649$ (564,713)$
EXCESS OR (DEFICIENCY) OF REVENUES OVER EXPENDITURES (1,683,300)$ (1,093,666)$ 589,634$
OTHER FINANCING SOURCES (USES) Interfund Transfers 1,700,000 1,700,000 -
NET CHANGE IN FUND BALANCE 16,700$ 606,334$ 589,634$
FUND BALANCE - JULY 1, 2014 19,215,996 19,653,549
FUND BALANCE - JUNE 30, 2015 19,232,696$ 20,259,883$
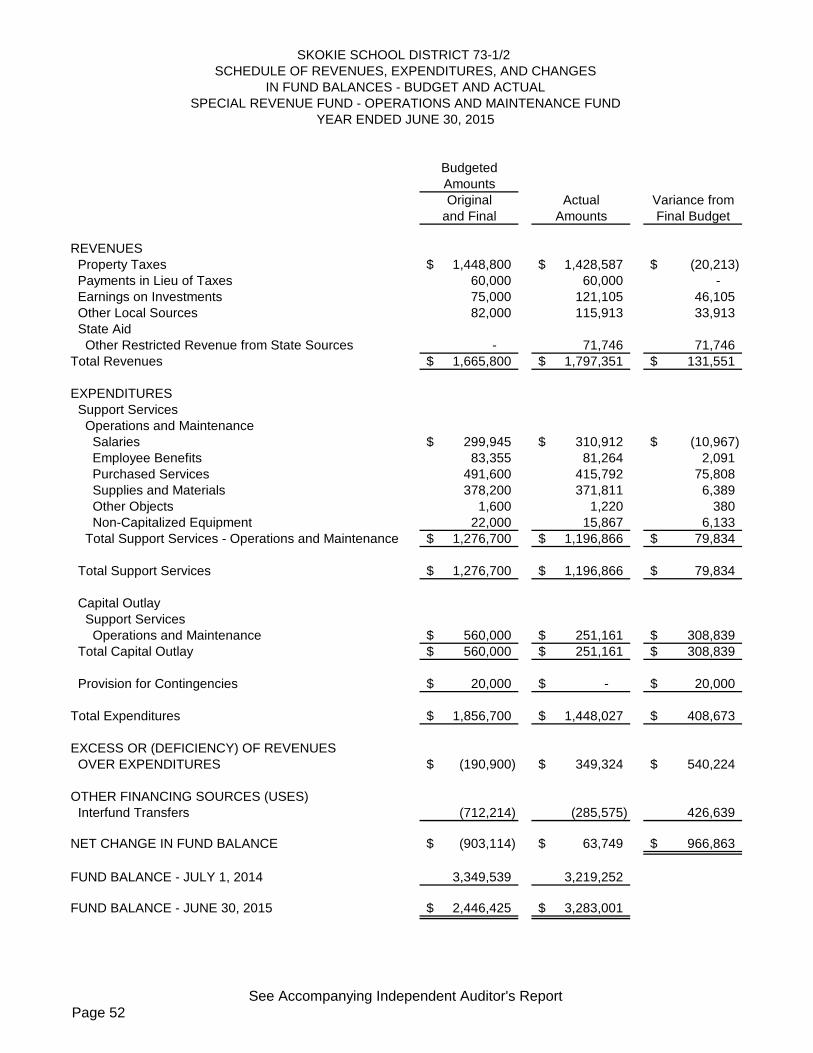
Page 52See Accompanying Independent Auditor's Report
BudgetedAmountsOriginal Actual Variance from
and Final Amounts Final Budget
REVENUES Property Taxes 1,448,800$ 1,428,587$ (20,213)$ Payments in Lieu of Taxes 60,000 60,000 - Earnings on Investments 75,000 121,105 46,105 Other Local Sources 82,000 115,913 33,913 State Aid Other Restricted Revenue from State Sources - 71,746 71,746 Total Revenues 1,665,800$ 1,797,351$ 131,551$
EXPENDITURES Support Services Operations and Maintenance Salaries 299,945$ 310,912$ (10,967)$ Employee Benefits 83,355 81,264 2,091 Purchased Services 491,600 415,792 75,808 Supplies and Materials 378,200 371,811 6,389 Other Objects 1,600 1,220 380 Non-Capitalized Equipment 22,000 15,867 6,133 Total Support Services - Operations and Maintenance 1,276,700$ 1,196,866$ 79,834$
Total Support Services 1,276,700$ 1,196,866$ 79,834$
Capital Outlay Support Services Operations and Maintenance 560,000$ 251,161$ 308,839$ Total Capital Outlay 560,000$ 251,161$ 308,839$
Provision for Contingencies 20,000$ -$ 20,000$
Total Expenditures 1,856,700$ 1,448,027$ 408,673$
EXCESS OR (DEFICIENCY) OF REVENUES OVER EXPENDITURES (190,900)$ 349,324$ 540,224$
OTHER FINANCING SOURCES (USES) Interfund Transfers (712,214) (285,575) 426,639
NET CHANGE IN FUND BALANCE (903,114)$ 63,749$ 966,863$
FUND BALANCE - JULY 1, 2014 3,349,539 3,219,252
FUND BALANCE - JUNE 30, 2015 2,446,425$ 3,283,001$
YEAR ENDED JUNE 30, 2015
SKOKIE SCHOOL DISTRICT 73-1/2 SCHEDULE OF REVENUES, EXPENDITURES, AND CHANGES
IN FUND BALANCES - BUDGET AND ACTUALSPECIAL REVENUE FUND - OPERATIONS AND MAINTENANCE FUND
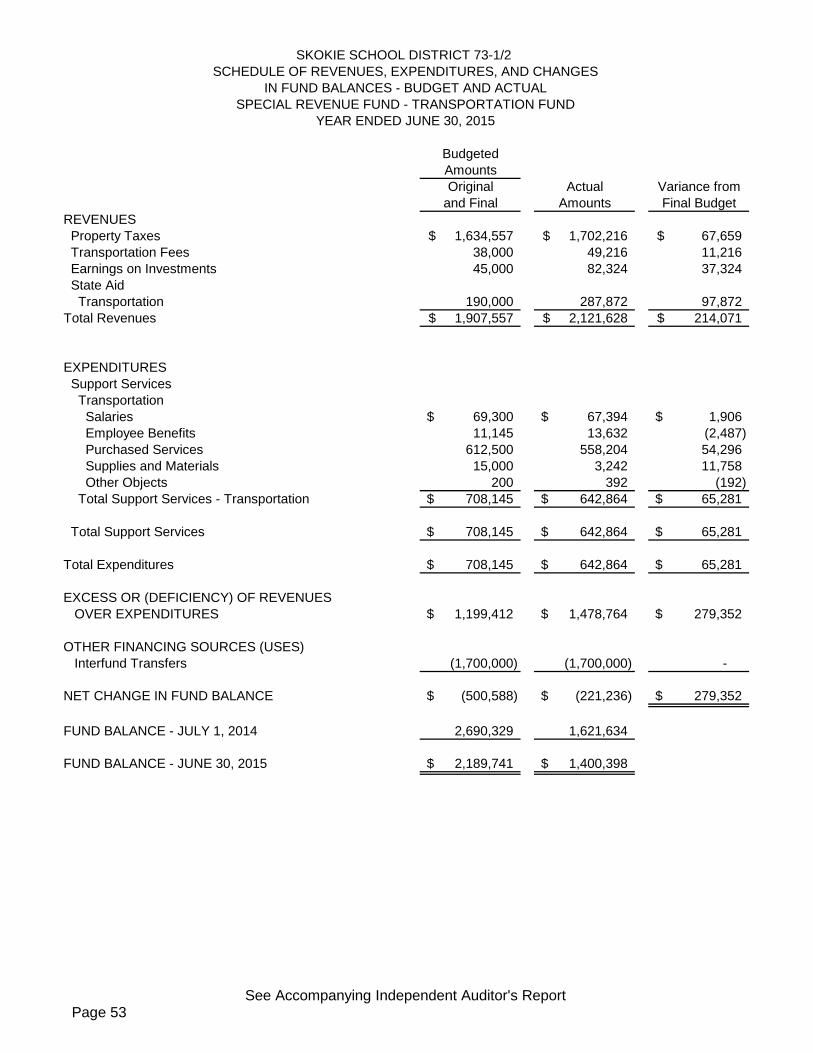
Page 53See Accompanying Independent Auditor's Report
BudgetedAmountsOriginal Actual Variance from
and Final Amounts Final BudgetREVENUES Property Taxes 1,634,557$ 1,702,216$ 67,659$ Transportation Fees 38,000 49,216 11,216 Earnings on Investments 45,000 82,324 37,324 State Aid Transportation 190,000 287,872 97,872 Total Revenues 1,907,557$ 2,121,628$ 214,071$
EXPENDITURES Support Services Transportation Salaries 69,300$ 67,394$ 1,906$ Employee Benefits 11,145 13,632 (2,487) Purchased Services 612,500 558,204 54,296 Supplies and Materials 15,000 3,242 11,758 Other Objects 200 392 (192) Total Support Services - Transportation 708,145$ 642,864$ 65,281$
Total Support Services 708,145$ 642,864$ 65,281$
Total Expenditures 708,145$ 642,864$ 65,281$
EXCESS OR (DEFICIENCY) OF REVENUES OVER EXPENDITURES 1,199,412$ 1,478,764$ 279,352$
OTHER FINANCING SOURCES (USES) Interfund Transfers (1,700,000) (1,700,000) -
NET CHANGE IN FUND BALANCE (500,588)$ (221,236)$ 279,352$
FUND BALANCE - JULY 1, 2014 2,690,329 1,621,634
FUND BALANCE - JUNE 30, 2015 2,189,741$ 1,400,398$
YEAR ENDED JUNE 30, 2015
SKOKIE SCHOOL DISTRICT 73-1/2 SCHEDULE OF REVENUES, EXPENDITURES, AND CHANGES
IN FUND BALANCES - BUDGET AND ACTUALSPECIAL REVENUE FUND - TRANSPORTATION FUND
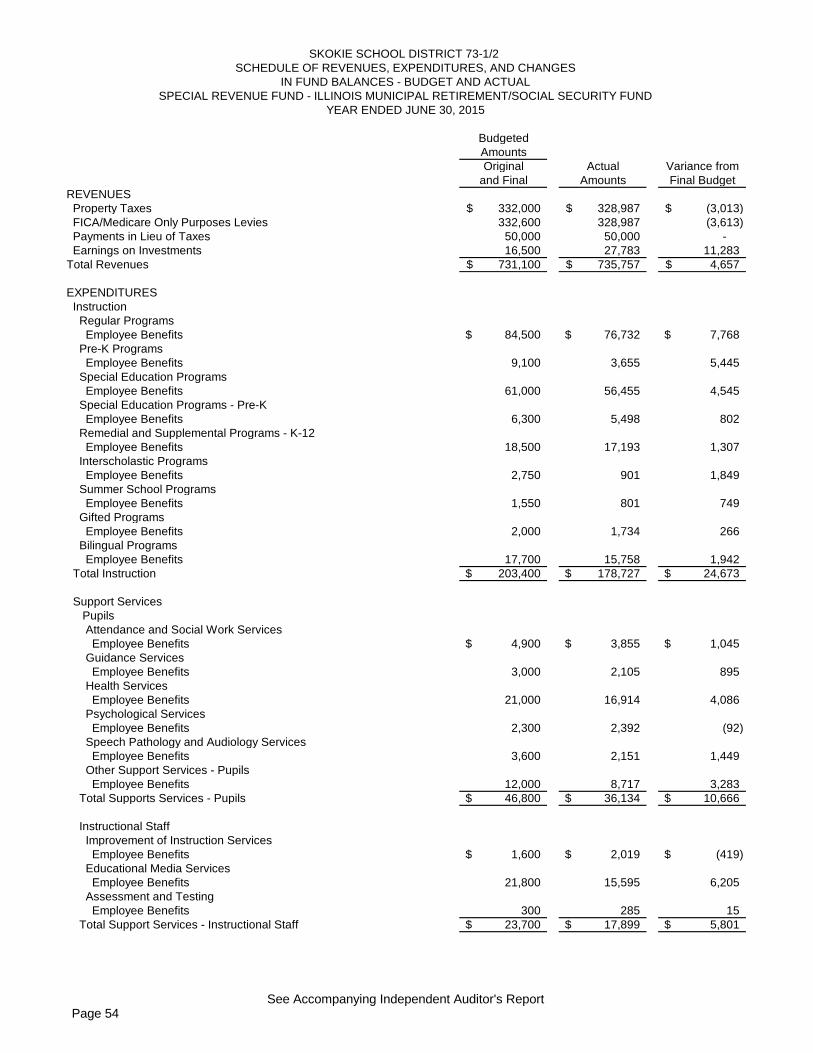
Page 54See Accompanying Independent Auditor's Report
BudgetedAmountsOriginal Actual Variance from
and Final Amounts Final BudgetREVENUES Property Taxes 332,000$ 328,987$ (3,013)$ FICA/Medicare Only Purposes Levies 332,600 328,987 (3,613) Payments in Lieu of Taxes 50,000 50,000 - Earnings on Investments 16,500 27,783 11,283 Total Revenues 731,100$ 735,757$ 4,657$
EXPENDITURES Instruction Regular Programs Employee Benefits 84,500$ 76,732$ 7,768$ Pre-K Programs Employee Benefits 9,100 3,655 5,445 Special Education Programs Employee Benefits 61,000 56,455 4,545 Special Education Programs - Pre-K Employee Benefits 6,300 5,498 802 Remedial and Supplemental Programs - K-12 Employee Benefits 18,500 17,193 1,307 Interscholastic Programs Employee Benefits 2,750 901 1,849 Summer School Programs Employee Benefits 1,550 801 749 Gifted Programs Employee Benefits 2,000 1,734 266 Bilingual Programs Employee Benefits 17,700 15,758 1,942 Total Instruction 203,400$ 178,727$ 24,673$
Support Services Pupils Attendance and Social Work Services Employee Benefits 4,900$ 3,855$ 1,045$ Guidance Services Employee Benefits 3,000 2,105 895 Health Services Employee Benefits 21,000 16,914 4,086 Psychological Services Employee Benefits 2,300 2,392 (92) Speech Pathology and Audiology Services Employee Benefits 3,600 2,151 1,449 Other Support Services - Pupils Employee Benefits 12,000 8,717 3,283 Total Supports Services - Pupils 46,800$ 36,134$ 10,666$
Instructional Staff Improvement of Instruction Services Employee Benefits 1,600$ 2,019$ (419)$ Educational Media Services Employee Benefits 21,800 15,595 6,205 Assessment and Testing Employee Benefits 300 285 15 Total Support Services - Instructional Staff 23,700$ 17,899$ 5,801$
YEAR ENDED JUNE 30, 2015
SKOKIE SCHOOL DISTRICT 73-1/2 SCHEDULE OF REVENUES, EXPENDITURES, AND CHANGES
IN FUND BALANCES - BUDGET AND ACTUALSPECIAL REVENUE FUND - ILLINOIS MUNICIPAL RETIREMENT/SOCIAL SECURITY FUND
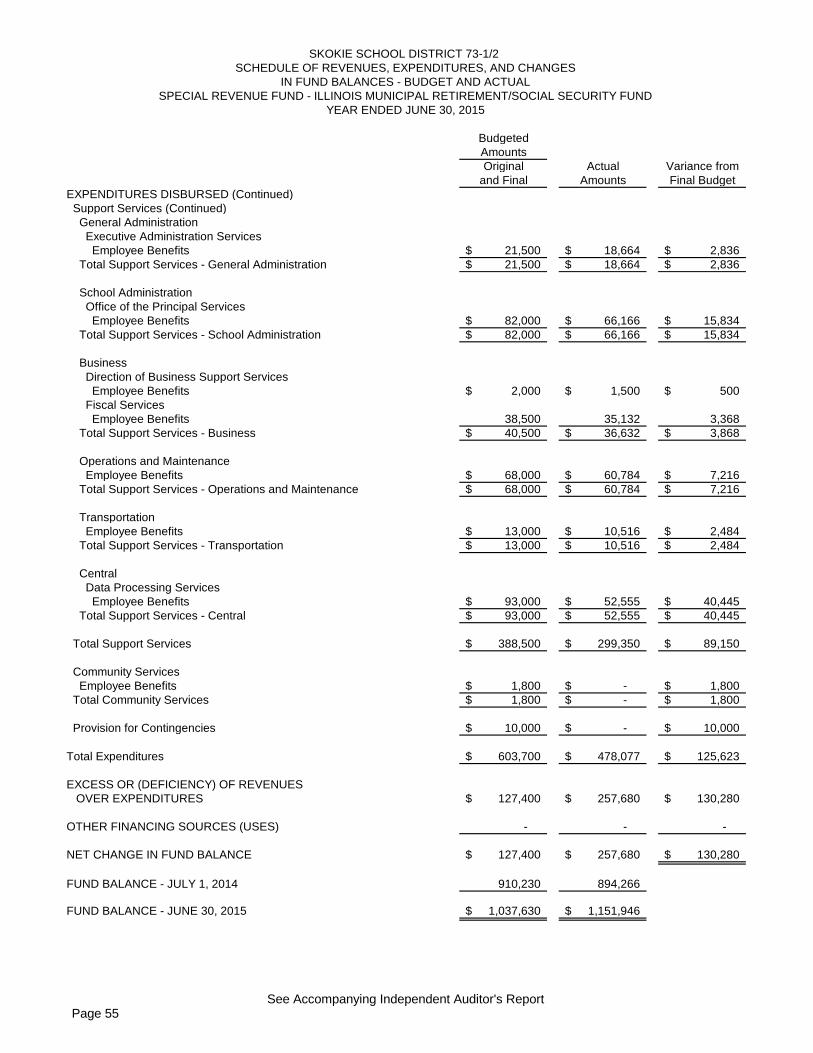
Page 55See Accompanying Independent Auditor's Report
BudgetedAmountsOriginal Actual Variance from
and Final Amounts Final Budget
YEAR ENDED JUNE 30, 2015
SKOKIE SCHOOL DISTRICT 73-1/2 SCHEDULE OF REVENUES, EXPENDITURES, AND CHANGES
IN FUND BALANCES - BUDGET AND ACTUALSPECIAL REVENUE FUND - ILLINOIS MUNICIPAL RETIREMENT/SOCIAL SECURITY FUND
EXPENDITURES DISBURSED (Continued) Support Services (Continued) General Administration Executive Administration Services Employee Benefits 21,500$ 18,664$ 2,836$ Total Support Services - General Administration 21,500$ 18,664$ 2,836$
School Administration Office of the Principal Services Employee Benefits 82,000$ 66,166$ 15,834$ Total Support Services - School Administration 82,000$ 66,166$ 15,834$
Business Direction of Business Support Services Employee Benefits 2,000$ 1,500$ 500$ Fiscal Services Employee Benefits 38,500 35,132 3,368 Total Support Services - Business 40,500$ 36,632$ 3,868$
Operations and Maintenance Employee Benefits 68,000$ 60,784$ 7,216$ Total Support Services - Operations and Maintenance 68,000$ 60,784$ 7,216$
Transportation Employee Benefits 13,000$ 10,516$ 2,484$ Total Support Services - Transportation 13,000$ 10,516$ 2,484$
Central Data Processing Services Employee Benefits 93,000$ 52,555$ 40,445$ Total Support Services - Central 93,000$ 52,555$ 40,445$
Total Support Services 388,500$ 299,350$ 89,150$
Community Services Employee Benefits 1,800$ -$ 1,800$ Total Community Services 1,800$ -$ 1,800$
Provision for Contingencies 10,000$ -$ 10,000$
Total Expenditures 603,700$ 478,077$ 125,623$
EXCESS OR (DEFICIENCY) OF REVENUES OVER EXPENDITURES 127,400$ 257,680$ 130,280$
OTHER FINANCING SOURCES (USES) - - -
NET CHANGE IN FUND BALANCE 127,400$ 257,680$ 130,280$
FUND BALANCE - JULY 1, 2014 910,230 894,266
FUND BALANCE - JUNE 30, 2015 1,037,630$ 1,151,946$
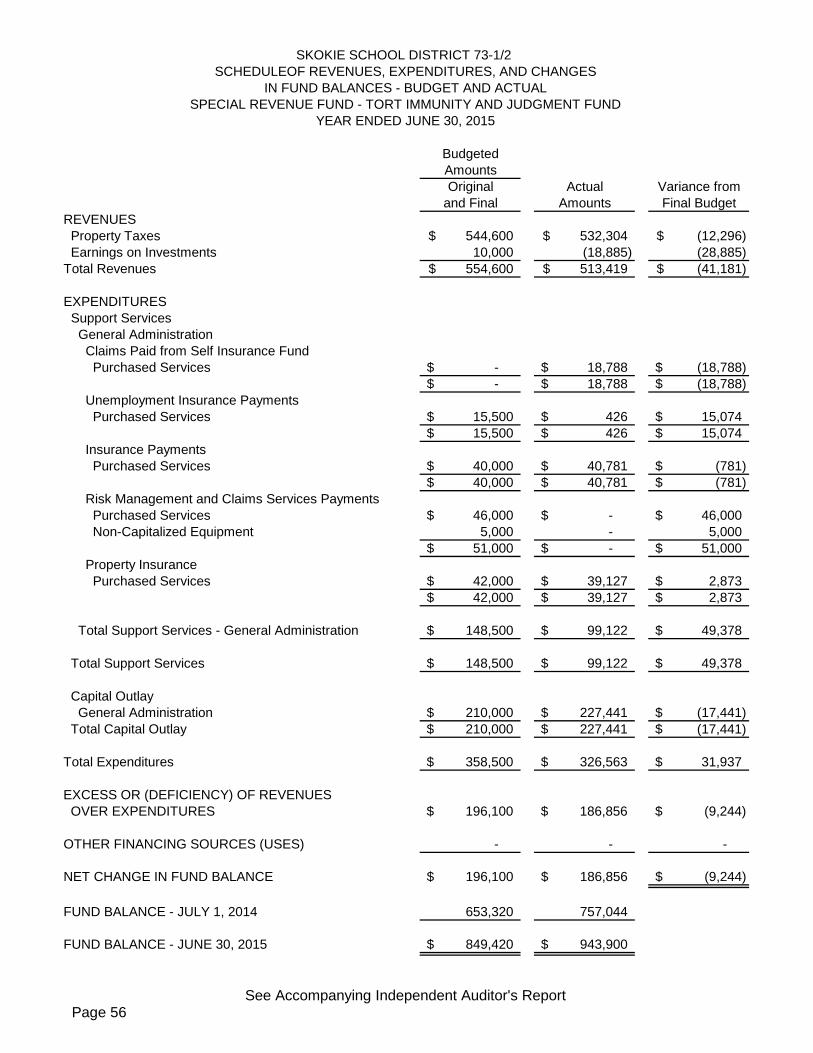
Page 56See Accompanying Independent Auditor's Report
BudgetedAmountsOriginal Actual Variance from
and Final Amounts Final BudgetREVENUES Property Taxes 544,600$ 532,304$ (12,296)$ Earnings on Investments 10,000 (18,885) (28,885) Total Revenues 554,600$ 513,419$ (41,181)$
EXPENDITURES Support Services General Administration Claims Paid from Self Insurance Fund Purchased Services -$ 18,788$ (18,788)$
-$ 18,788$ (18,788)$ Unemployment Insurance Payments Purchased Services 15,500$ 426$ 15,074$
15,500$ 426$ 15,074$ Insurance Payments Purchased Services 40,000$ 40,781$ (781)$
40,000$ 40,781$ (781)$ Risk Management and Claims Services Payments Purchased Services 46,000$ -$ 46,000$ Non-Capitalized Equipment 5,000 - 5,000
51,000$ -$ 51,000$ Property Insurance Purchased Services 42,000$ 39,127$ 2,873$
42,000$ 39,127$ 2,873$
Total Support Services - General Administration 148,500$ 99,122$ 49,378$
Total Support Services 148,500$ 99,122$ 49,378$
Capital Outlay General Administration 210,000$ 227,441$ (17,441)$ Total Capital Outlay 210,000$ 227,441$ (17,441)$
Total Expenditures 358,500$ 326,563$ 31,937$
EXCESS OR (DEFICIENCY) OF REVENUES OVER EXPENDITURES 196,100$ 186,856$ (9,244)$
OTHER FINANCING SOURCES (USES) - - -
NET CHANGE IN FUND BALANCE 196,100$ 186,856$ (9,244)$
FUND BALANCE - JULY 1, 2014 653,320 757,044
FUND BALANCE - JUNE 30, 2015 849,420$ 943,900$
YEAR ENDED JUNE 30, 2015
SKOKIE SCHOOL DISTRICT 73-1/2 SCHEDULEOF REVENUES, EXPENDITURES, AND CHANGES
IN FUND BALANCES - BUDGET AND ACTUALSPECIAL REVENUE FUND - TORT IMMUNITY AND JUDGMENT FUND
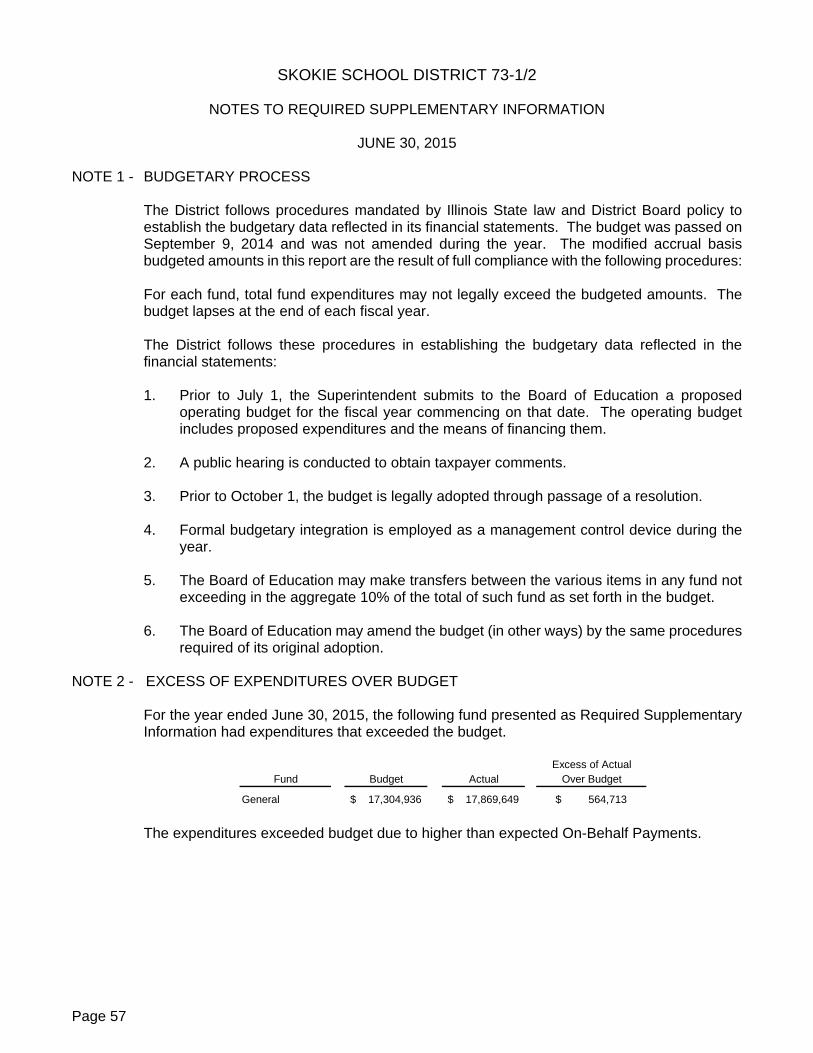
Page 57
SKOKIE SCHOOL DISTRICT 73-1/2
NOTES TO REQUIRED SUPPLEMENTARY INFORMATION
JUNE 30, 2015
NOTE 1 - BUDGETARY PROCESS
The District follows procedures mandated by Illinois State law and District Board policy to establish the budgetary data reflected in its financial statements. The budget was passed on September 9, 2014 and was not amended during the year. The modified accrual basis budgeted amounts in this report are the result of full compliance with the following procedures: For each fund, total fund expenditures may not legally exceed the budgeted amounts. The budget lapses at the end of each fiscal year. The District follows these procedures in establishing the budgetary data reflected in the financial statements:
1. Prior to July 1, the Superintendent submits to the Board of Education a proposed
operating budget for the fiscal year commencing on that date. The operating budget includes proposed expenditures and the means of financing them.
2. A public hearing is conducted to obtain taxpayer comments.
3. Prior to October 1, the budget is legally adopted through passage of a resolution.
4. Formal budgetary integration is employed as a management control device during the year.
5. The Board of Education may make transfers between the various items in any fund not
exceeding in the aggregate 10% of the total of such fund as set forth in the budget.
6. The Board of Education may amend the budget (in other ways) by the same procedures required of its original adoption.
NOTE 2 - EXCESS OF EXPENDITURES OVER BUDGET
For the year ended June 30, 2015, the following fund presented as Required Supplementary Information had expenditures that exceeded the budget.
Fund Budget Actual
General 17,304,936$ 17,869,649$ 564,713$
Excess of ActualOver Budget
The expenditures exceeded budget due to higher than expected On-Behalf Payments.
SUPPLEMENTARY INFORMATION
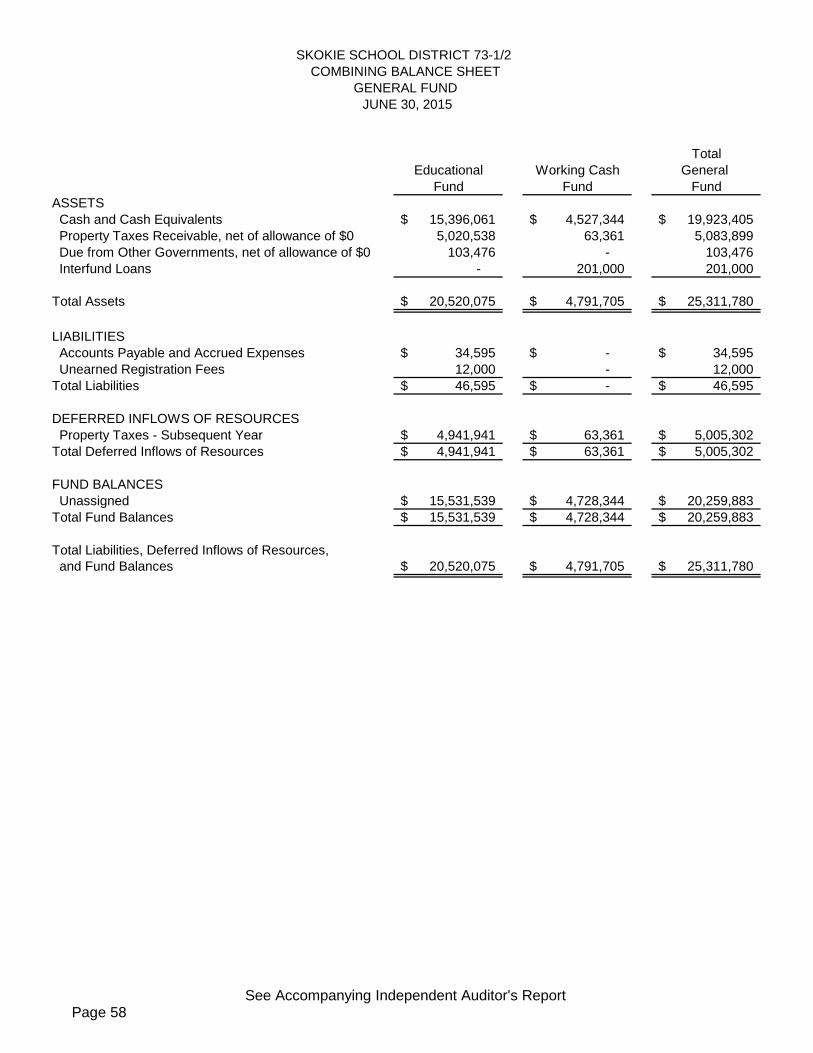
Page 58See Accompanying Independent Auditor's Report
TotalEducational Working Cash General
Fund Fund FundASSETS Cash and Cash Equivalents 15,396,061$ 4,527,344$ 19,923,405$ Property Taxes Receivable, net of allowance of $0 5,020,538 63,361 5,083,899 Due from Other Governments, net of allowance of $0 103,476 - 103,476 Interfund Loans - 201,000 201,000
Total Assets 20,520,075$ 4,791,705$ 25,311,780$
LIABILITIES Accounts Payable and Accrued Expenses 34,595$ -$ 34,595$ Unearned Registration Fees 12,000 - 12,000 Total Liabilities 46,595$ -$ 46,595$
DEFERRED INFLOWS OF RESOURCES Property Taxes - Subsequent Year 4,941,941$ 63,361$ 5,005,302$ Total Deferred Inflows of Resources 4,941,941$ 63,361$ 5,005,302$
FUND BALANCES Unassigned 15,531,539$ 4,728,344$ 20,259,883$ Total Fund Balances 15,531,539$ 4,728,344$ 20,259,883$
Total Liabilities, Deferred Inflows of Resources, and Fund Balances 20,520,075$ 4,791,705$ 25,311,780$
SKOKIE SCHOOL DISTRICT 73-1/2 COMBINING BALANCE SHEET
GENERAL FUND JUNE 30, 2015
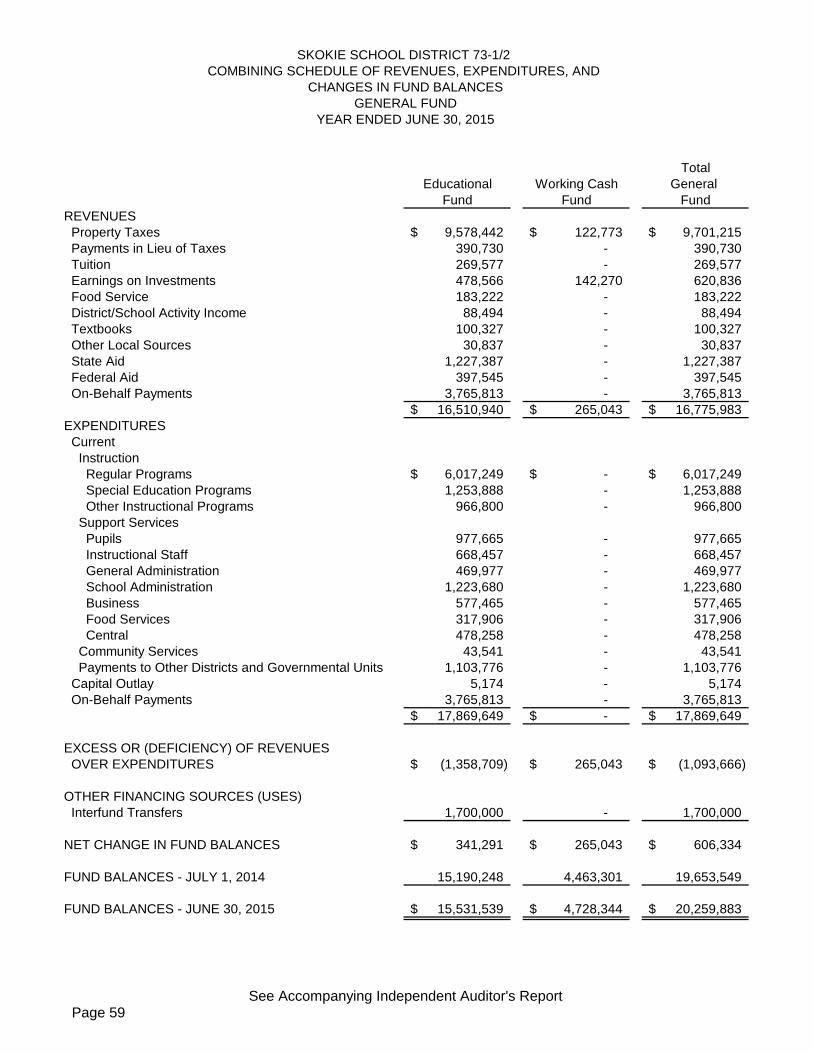
Page 59See Accompanying Independent Auditor's Report
TotalEducational Working Cash General
Fund Fund FundREVENUES Property Taxes 9,578,442$ 122,773$ 9,701,215$ Payments in Lieu of Taxes 390,730 - 390,730 Tuition 269,577 - 269,577 Earnings on Investments 478,566 142,270 620,836 Food Service 183,222 - 183,222 District/School Activity Income 88,494 - 88,494 Textbooks 100,327 - 100,327 Other Local Sources 30,837 - 30,837 State Aid 1,227,387 - 1,227,387 Federal Aid 397,545 - 397,545 On-Behalf Payments 3,765,813 - 3,765,813
16,510,940$ 265,043$ 16,775,983$ EXPENDITURES Current Instruction Regular Programs 6,017,249$ -$ 6,017,249$ Special Education Programs 1,253,888 - 1,253,888 Other Instructional Programs 966,800 - 966,800 Support Services Pupils 977,665 - 977,665 Instructional Staff 668,457 - 668,457 General Administration 469,977 - 469,977 School Administration 1,223,680 - 1,223,680 Business 577,465 - 577,465 Food Services 317,906 - 317,906 Central 478,258 - 478,258 Community Services 43,541 - 43,541 Payments to Other Districts and Governmental Units 1,103,776 - 1,103,776 Capital Outlay 5,174 - 5,174 On-Behalf Payments 3,765,813 - 3,765,813
17,869,649$ -$ 17,869,649$
EXCESS OR (DEFICIENCY) OF REVENUES OVER EXPENDITURES (1,358,709)$ 265,043$ (1,093,666)$
OTHER FINANCING SOURCES (USES) Interfund Transfers 1,700,000 - 1,700,000
NET CHANGE IN FUND BALANCES 341,291$ 265,043$ 606,334$
FUND BALANCES - JULY 1, 2014 15,190,248 4,463,301 19,653,549
FUND BALANCES - JUNE 30, 2015 15,531,539$ 4,728,344$ 20,259,883$
COMBINING SCHEDULE OF REVENUES, EXPENDITURES, AND SKOKIE SCHOOL DISTRICT 73-1/2
GENERAL FUNDCHANGES IN FUND BALANCES
YEAR ENDED JUNE 30, 2015
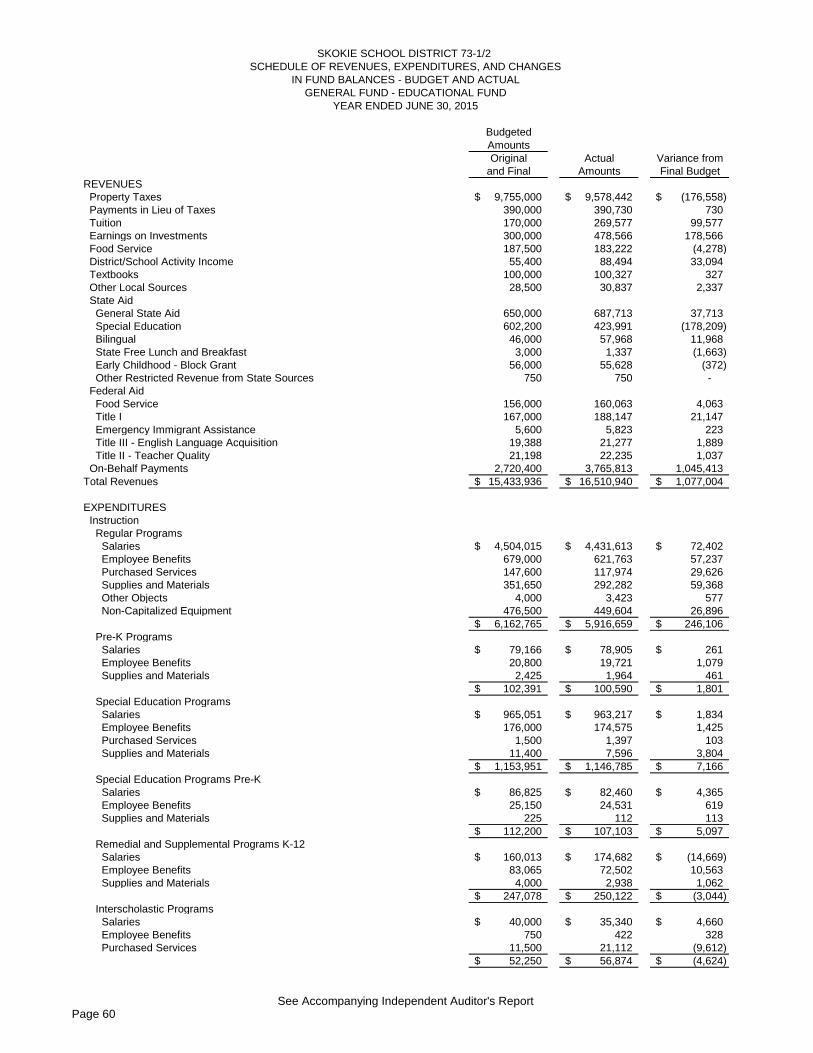
Page 60See Accompanying Independent Auditor's Report
BudgetedAmountsOriginal Actual Variance from
and Final Amounts Final BudgetREVENUES Property Taxes 9,755,000$ 9,578,442$ (176,558)$ Payments in Lieu of Taxes 390,000 390,730 730 Tuition 170,000 269,577 99,577 Earnings on Investments 300,000 478,566 178,566 Food Service 187,500 183,222 (4,278) District/School Activity Income 55,400 88,494 33,094 Textbooks 100,000 100,327 327 Other Local Sources 28,500 30,837 2,337 State Aid General State Aid 650,000 687,713 37,713 Special Education 602,200 423,991 (178,209) Bilingual 46,000 57,968 11,968 State Free Lunch and Breakfast 3,000 1,337 (1,663) Early Childhood - Block Grant 56,000 55,628 (372) Other Restricted Revenue from State Sources 750 750 - Federal Aid Food Service 156,000 160,063 4,063 Title I 167,000 188,147 21,147 Emergency Immigrant Assistance 5,600 5,823 223 Title III - English Language Acquisition 19,388 21,277 1,889 Title II - Teacher Quality 21,198 22,235 1,037 On-Behalf Payments 2,720,400 3,765,813 1,045,413 Total Revenues 15,433,936$ 16,510,940$ 1,077,004$
EXPENDITURES Instruction Regular Programs Salaries 4,504,015$ 4,431,613$ 72,402$ Employee Benefits 679,000 621,763 57,237 Purchased Services 147,600 117,974 29,626 Supplies and Materials 351,650 292,282 59,368 Other Objects 4,000 3,423 577 Non-Capitalized Equipment 476,500 449,604 26,896
6,162,765$ 5,916,659$ 246,106$ Pre-K Programs Salaries 79,166$ 78,905$ 261$ Employee Benefits 20,800 19,721 1,079 Supplies and Materials 2,425 1,964 461
102,391$ 100,590$ 1,801$ Special Education Programs Salaries 965,051$ 963,217$ 1,834$ Employee Benefits 176,000 174,575 1,425 Purchased Services 1,500 1,397 103 Supplies and Materials 11,400 7,596 3,804
1,153,951$ 1,146,785$ 7,166$ Special Education Programs Pre-K Salaries 86,825$ 82,460$ 4,365$ Employee Benefits 25,150 24,531 619 Supplies and Materials 225 112 113
112,200$ 107,103$ 5,097$ Remedial and Supplemental Programs K-12 Salaries 160,013$ 174,682$ (14,669)$ Employee Benefits 83,065 72,502 10,563 Supplies and Materials 4,000 2,938 1,062
247,078$ 250,122$ (3,044)$ Interscholastic Programs Salaries 40,000$ 35,340$ 4,660$ Employee Benefits 750 422 328 Purchased Services 11,500 21,112 (9,612)
52,250$ 56,874$ (4,624)$
YEAR ENDED JUNE 30, 2015
SKOKIE SCHOOL DISTRICT 73-1/2 SCHEDULE OF REVENUES, EXPENDITURES, AND CHANGES
IN FUND BALANCES - BUDGET AND ACTUALGENERAL FUND - EDUCATIONAL FUND
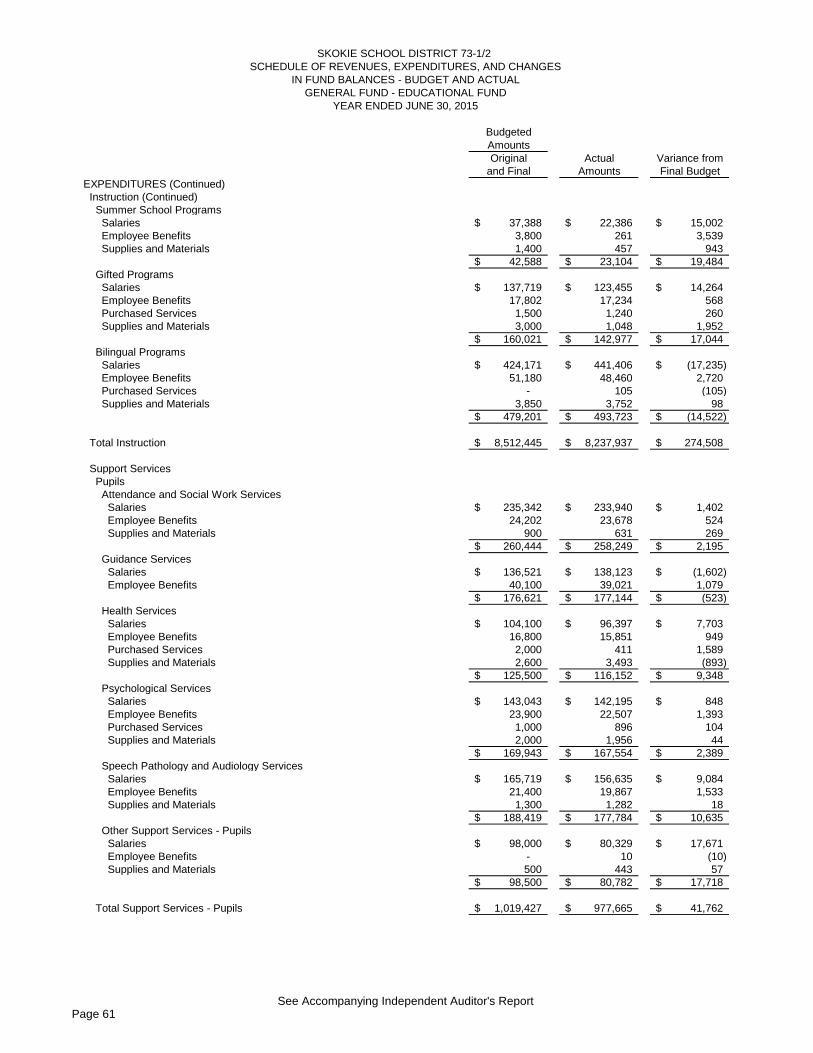
Page 61See Accompanying Independent Auditor's Report
BudgetedAmountsOriginal Actual Variance from
and Final Amounts Final Budget
YEAR ENDED JUNE 30, 2015
SKOKIE SCHOOL DISTRICT 73-1/2 SCHEDULE OF REVENUES, EXPENDITURES, AND CHANGES
IN FUND BALANCES - BUDGET AND ACTUALGENERAL FUND - EDUCATIONAL FUND
EXPENDITURES (Continued) Instruction (Continued) Summer School Programs Salaries 37,388$ 22,386$ 15,002$ Employee Benefits 3,800 261 3,539 Supplies and Materials 1,400 457 943
42,588$ 23,104$ 19,484$ Gifted Programs Salaries 137,719$ 123,455$ 14,264$ Employee Benefits 17,802 17,234 568 Purchased Services 1,500 1,240 260 Supplies and Materials 3,000 1,048 1,952
160,021$ 142,977$ 17,044$ Bilingual Programs Salaries 424,171$ 441,406$ (17,235)$ Employee Benefits 51,180 48,460 2,720 Purchased Services - 105 (105) Supplies and Materials 3,850 3,752 98
479,201$ 493,723$ (14,522)$
Total Instruction 8,512,445$ 8,237,937$ 274,508$
Support Services Pupils Attendance and Social Work Services Salaries 235,342$ 233,940$ 1,402$ Employee Benefits 24,202 23,678 524 Supplies and Materials 900 631 269
260,444$ 258,249$ 2,195$ Guidance Services Salaries 136,521$ 138,123$ (1,602)$ Employee Benefits 40,100 39,021 1,079
176,621$ 177,144$ (523)$ Health Services Salaries 104,100$ 96,397$ 7,703$ Employee Benefits 16,800 15,851 949 Purchased Services 2,000 411 1,589 Supplies and Materials 2,600 3,493 (893)
125,500$ 116,152$ 9,348$ Psychological Services Salaries 143,043$ 142,195$ 848$ Employee Benefits 23,900 22,507 1,393 Purchased Services 1,000 896 104 Supplies and Materials 2,000 1,956 44
169,943$ 167,554$ 2,389$ Speech Pathology and Audiology Services Salaries 165,719$ 156,635$ 9,084$ Employee Benefits 21,400 19,867 1,533 Supplies and Materials 1,300 1,282 18
188,419$ 177,784$ 10,635$ Other Support Services - Pupils Salaries 98,000$ 80,329$ 17,671$ Employee Benefits - 10 (10) Supplies and Materials 500 443 57
98,500$ 80,782$ 17,718$
Total Support Services - Pupils 1,019,427$ 977,665$ 41,762$

Page 62See Accompanying Independent Auditor's Report
BudgetedAmountsOriginal Actual Variance from
and Final Amounts Final Budget
YEAR ENDED JUNE 30, 2015
SKOKIE SCHOOL DISTRICT 73-1/2 SCHEDULE OF REVENUES, EXPENDITURES, AND CHANGES
IN FUND BALANCES - BUDGET AND ACTUALGENERAL FUND - EDUCATIONAL FUND
EXPENDITURES (Continued) Support Services (Continued) Instructional Staff Improvement of Instruction Services Salaries 121,000$ 117,654$ 3,346$ Employee Benefits 14,800 15,411 (611) Purchased Services 21,198 22,019 (821) Supplies and Materials 2,000 1,000 1,000
158,998$ 156,084$ 2,914$ Educational Media Services Salaries 394,624$ 390,584$ 4,040$ Employee Benefits 74,700 73,540 1,160 Supplies and Materials 12,735 12,355 380
482,059$ 476,479$ 5,580$ Assessment and Testing Salaries 19,631$ 20,950$ (1,319)$ Employee Benefits 625 260 365 Purchased Services 2,000 - 2,000 Supplies and Materials 20,000 14,684 5,316
42,256$ 35,894$ 6,362$
Total Support Services - Instructional Staff 683,313$ 668,457$ 14,856$
General Administration Board of Education Services Purchased Services 104,500$ 72,900$ 31,600$ Supplies and Materials 4,500 4,792 (292) Other Objects 14,000 13,621 379
123,000$ 91,313$ 31,687$ Executive Administration Services Salaries 293,479$ 293,417$ 62$ Employee Benefits 75,650 72,733 2,917 Purchased Services 8,000 3,621 4,379 Supplies and Materials 3,500 4,013 (513) Other Objects 5,000 4,880 120
385,629$ 378,664$ 6,965$
Total Support Services - General Administration 508,629$ 469,977$ 38,652$
School Administration Office of the Principal Services Salaries 939,543$ 937,683$ 1,860$ Employee Benefits 289,600 262,059 27,541 Purchased Services 24,315 21,104 3,211 Supplies and Materials 1,800 1,621 179 Other Objects 1,100 1,213 (113)
1,256,358$ 1,223,680$ 32,678$
Total Support Services - School Administration 1,256,358$ 1,223,680$ 32,678$
Business Direction of Business Support Services Salaries 101,000$ 104,000$ (3,000)$ Employee Benefits 1,300 14,203 (12,903)
102,300$ 118,203$ (15,903)$
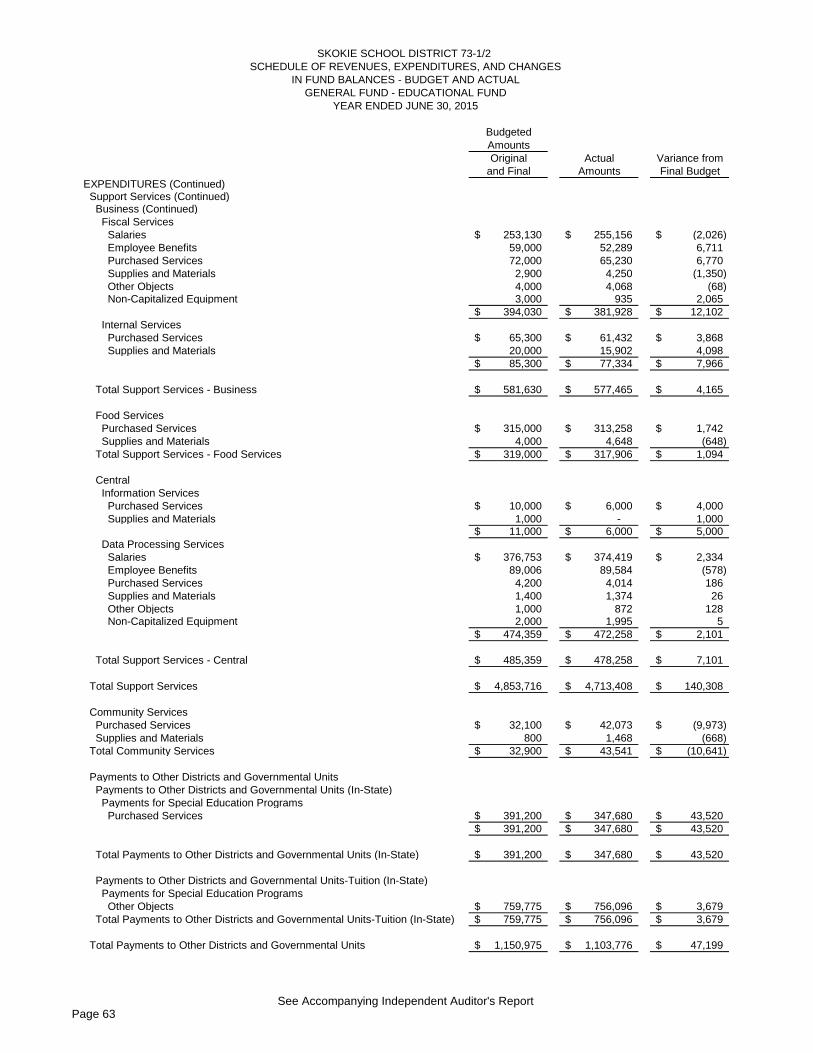
Page 63See Accompanying Independent Auditor's Report
BudgetedAmountsOriginal Actual Variance from
and Final Amounts Final Budget
YEAR ENDED JUNE 30, 2015
SKOKIE SCHOOL DISTRICT 73-1/2 SCHEDULE OF REVENUES, EXPENDITURES, AND CHANGES
IN FUND BALANCES - BUDGET AND ACTUALGENERAL FUND - EDUCATIONAL FUND
EXPENDITURES (Continued) Support Services (Continued) Business (Continued) Fiscal Services Salaries 253,130$ 255,156$ (2,026)$ Employee Benefits 59,000 52,289 6,711 Purchased Services 72,000 65,230 6,770 Supplies and Materials 2,900 4,250 (1,350) Other Objects 4,000 4,068 (68) Non-Capitalized Equipment 3,000 935 2,065
394,030$ 381,928$ 12,102$ Internal Services Purchased Services 65,300$ 61,432$ 3,868$ Supplies and Materials 20,000 15,902 4,098
85,300$ 77,334$ 7,966$
Total Support Services - Business 581,630$ 577,465$ 4,165$
Food Services Purchased Services 315,000$ 313,258$ 1,742$ Supplies and Materials 4,000 4,648 (648) Total Support Services - Food Services 319,000$ 317,906$ 1,094$
Central Information Services Purchased Services 10,000$ 6,000$ 4,000$ Supplies and Materials 1,000 - 1,000
11,000$ 6,000$ 5,000$ Data Processing Services Salaries 376,753$ 374,419$ 2,334$ Employee Benefits 89,006 89,584 (578) Purchased Services 4,200 4,014 186 Supplies and Materials 1,400 1,374 26 Other Objects 1,000 872 128 Non-Capitalized Equipment 2,000 1,995 5
474,359$ 472,258$ 2,101$
Total Support Services - Central 485,359$ 478,258$ 7,101$
Total Support Services 4,853,716$ 4,713,408$ 140,308$
Community Services Purchased Services 32,100$ 42,073$ (9,973)$ Supplies and Materials 800 1,468 (668) Total Community Services 32,900$ 43,541$ (10,641)$
Payments to Other Districts and Governmental Units Payments to Other Districts and Governmental Units (In-State) Payments for Special Education Programs Purchased Services 391,200$ 347,680$ 43,520$
391,200$ 347,680$ 43,520$
Total Payments to Other Districts and Governmental Units (In-State) 391,200$ 347,680$ 43,520$
Payments to Other Districts and Governmental Units-Tuition (In-State) Payments for Special Education Programs Other Objects 759,775$ 756,096$ 3,679$ Total Payments to Other Districts and Governmental Units-Tuition (In-State) 759,775$ 756,096$ 3,679$
Total Payments to Other Districts and Governmental Units 1,150,975$ 1,103,776$ 47,199$
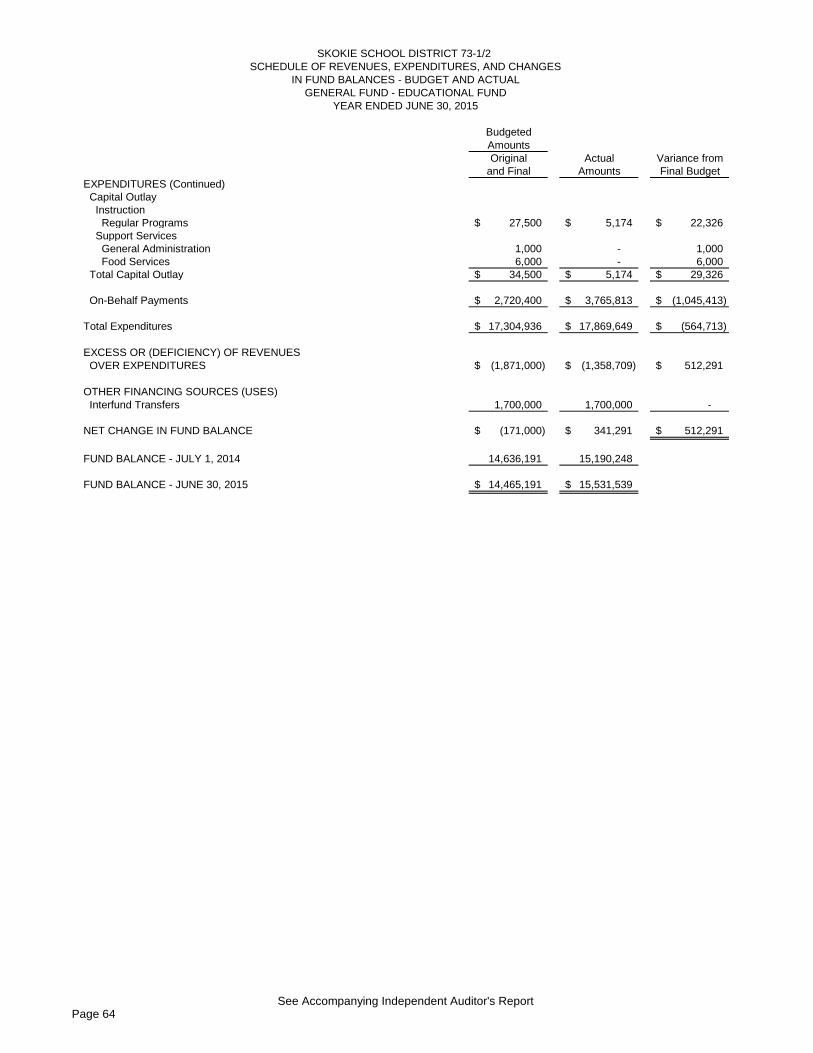
Page 64See Accompanying Independent Auditor's Report
BudgetedAmountsOriginal Actual Variance from
and Final Amounts Final Budget
YEAR ENDED JUNE 30, 2015
SKOKIE SCHOOL DISTRICT 73-1/2 SCHEDULE OF REVENUES, EXPENDITURES, AND CHANGES
IN FUND BALANCES - BUDGET AND ACTUALGENERAL FUND - EDUCATIONAL FUND
EXPENDITURES (Continued) Capital Outlay Instruction Regular Programs 27,500$ 5,174$ 22,326$ Support Services General Administration 1,000 - 1,000 Food Services 6,000 - 6,000 Total Capital Outlay 34,500$ 5,174$ 29,326$
On-Behalf Payments 2,720,400$ 3,765,813$ (1,045,413)$
Total Expenditures 17,304,936$ 17,869,649$ (564,713)$
EXCESS OR (DEFICIENCY) OF REVENUES OVER EXPENDITURES (1,871,000)$ (1,358,709)$ 512,291$
OTHER FINANCING SOURCES (USES) Interfund Transfers 1,700,000 1,700,000 -
NET CHANGE IN FUND BALANCE (171,000)$ 341,291$ 512,291$
FUND BALANCE - JULY 1, 2014 14,636,191 15,190,248
FUND BALANCE - JUNE 30, 2015 14,465,191$ 15,531,539$
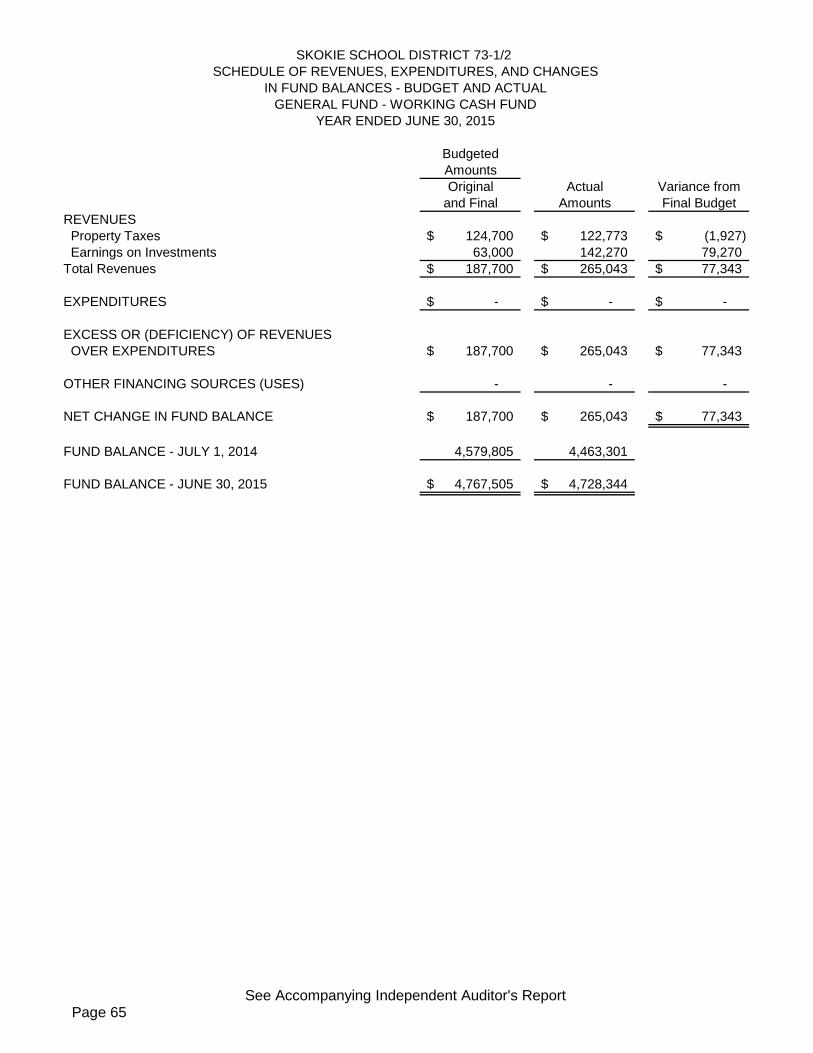
Page 65See Accompanying Independent Auditor's Report
BudgetedAmountsOriginal Actual Variance from
and Final Amounts Final BudgetREVENUES Property Taxes 124,700$ 122,773$ (1,927)$ Earnings on Investments 63,000 142,270 79,270 Total Revenues 187,700$ 265,043$ 77,343$
EXPENDITURES -$ -$ -$
EXCESS OR (DEFICIENCY) OF REVENUES OVER EXPENDITURES 187,700$ 265,043$ 77,343$
OTHER FINANCING SOURCES (USES) - - -
NET CHANGE IN FUND BALANCE 187,700$ 265,043$ 77,343$
FUND BALANCE - JULY 1, 2014 4,579,805 4,463,301
FUND BALANCE - JUNE 30, 2015 4,767,505$ 4,728,344$
YEAR ENDED JUNE 30, 2015
SKOKIE SCHOOL DISTRICT 73-1/2
IN FUND BALANCES - BUDGET AND ACTUALSCHEDULE OF REVENUES, EXPENDITURES, AND CHANGES
GENERAL FUND - WORKING CASH FUND
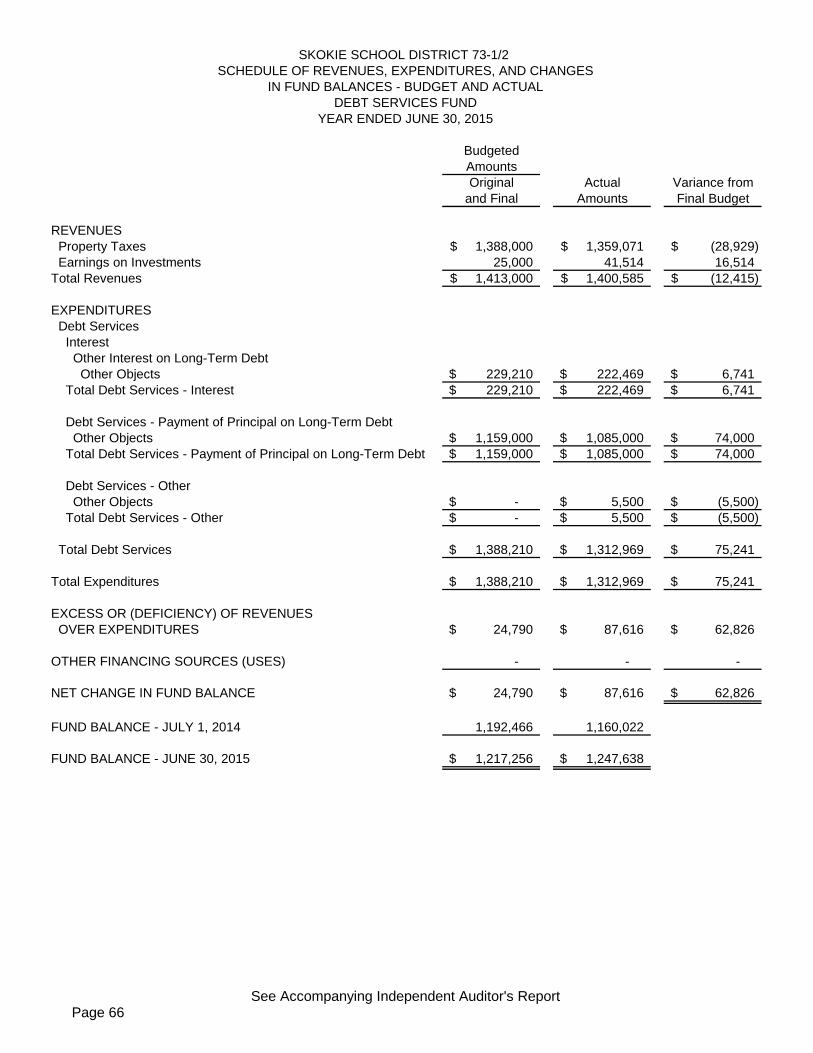
Page 66See Accompanying Independent Auditor's Report
BudgetedAmountsOriginal Actual Variance from
and Final Amounts Final Budget
REVENUES Property Taxes 1,388,000$ 1,359,071$ (28,929)$ Earnings on Investments 25,000 41,514 16,514 Total Revenues 1,413,000$ 1,400,585$ (12,415)$ EXPENDITURES Debt Services Interest Other Interest on Long-Term Debt Other Objects 229,210$ 222,469$ 6,741$ Total Debt Services - Interest 229,210$ 222,469$ 6,741$
Debt Services - Payment of Principal on Long-Term Debt Other Objects 1,159,000$ 1,085,000$ 74,000$ Total Debt Services - Payment of Principal on Long-Term Debt 1,159,000$ 1,085,000$ 74,000$
Debt Services - Other Other Objects -$ 5,500$ (5,500)$ Total Debt Services - Other -$ 5,500$ (5,500)$
Total Debt Services 1,388,210$ 1,312,969$ 75,241$
Total Expenditures 1,388,210$ 1,312,969$ 75,241$
EXCESS OR (DEFICIENCY) OF REVENUES OVER EXPENDITURES 24,790$ 87,616$ 62,826$
OTHER FINANCING SOURCES (USES) - - -
NET CHANGE IN FUND BALANCE 24,790$ 87,616$ 62,826$
FUND BALANCE - JULY 1, 2014 1,192,466 1,160,022
FUND BALANCE - JUNE 30, 2015 1,217,256$ 1,247,638$
YEAR ENDED JUNE 30, 2015
SKOKIE SCHOOL DISTRICT 73-1/2 SCHEDULE OF REVENUES, EXPENDITURES, AND CHANGES
IN FUND BALANCES - BUDGET AND ACTUALDEBT SERVICES FUND
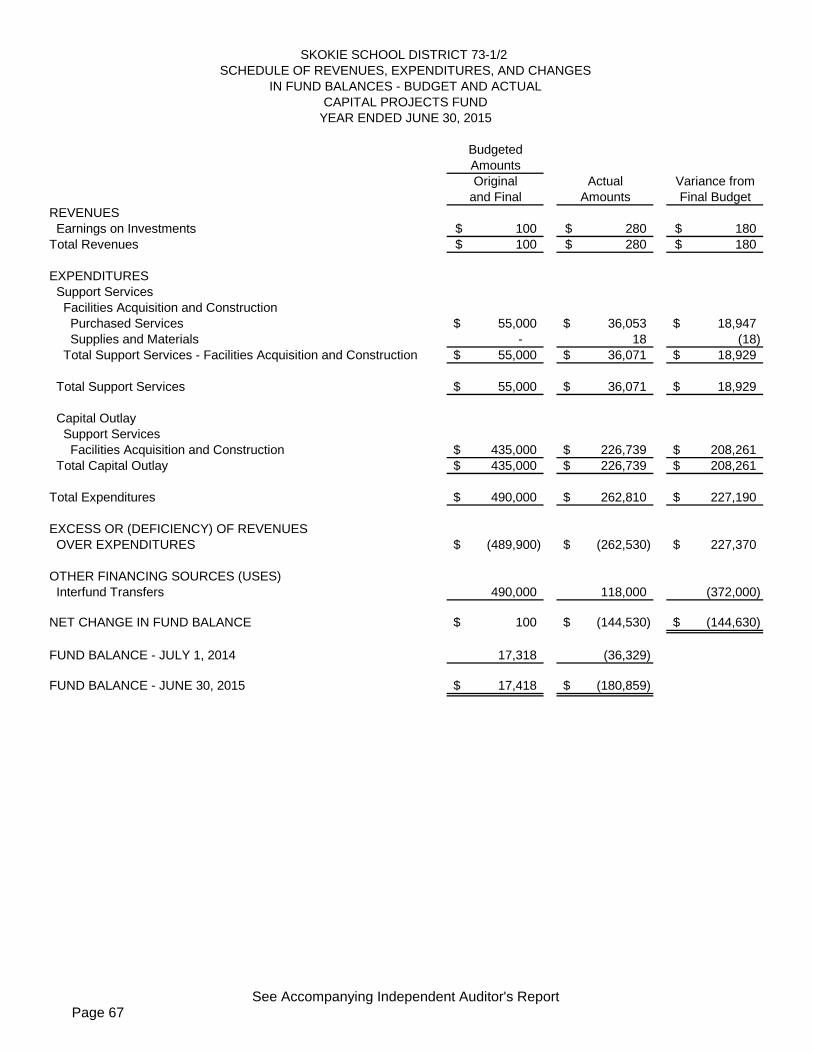
Page 67See Accompanying Independent Auditor's Report
BudgetedAmountsOriginal Actual Variance from
and Final Amounts Final BudgetREVENUES Earnings on Investments 100$ 280$ 180$ Total Revenues 100$ 280$ 180$
EXPENDITURES Support Services Facilities Acquisition and Construction Purchased Services 55,000$ 36,053$ 18,947$ Supplies and Materials - 18 (18) Total Support Services - Facilities Acquisition and Construction 55,000$ 36,071$ 18,929$
Total Support Services 55,000$ 36,071$ 18,929$
Capital Outlay Support Services Facilities Acquisition and Construction 435,000$ 226,739$ 208,261$ Total Capital Outlay 435,000$ 226,739$ 208,261$
Total Expenditures 490,000$ 262,810$ 227,190$
EXCESS OR (DEFICIENCY) OF REVENUES OVER EXPENDITURES (489,900)$ (262,530)$ 227,370$
OTHER FINANCING SOURCES (USES) Interfund Transfers 490,000 118,000 (372,000)
NET CHANGE IN FUND BALANCE 100$ (144,530)$ (144,630)$
FUND BALANCE - JULY 1, 2014 17,318 (36,329)
FUND BALANCE - JUNE 30, 2015 17,418$ (180,859)$
YEAR ENDED JUNE 30, 2015
SKOKIE SCHOOL DISTRICT 73-1/2 SCHEDULE OF REVENUES, EXPENDITURES, AND CHANGES
IN FUND BALANCES - BUDGET AND ACTUALCAPITAL PROJECTS FUND
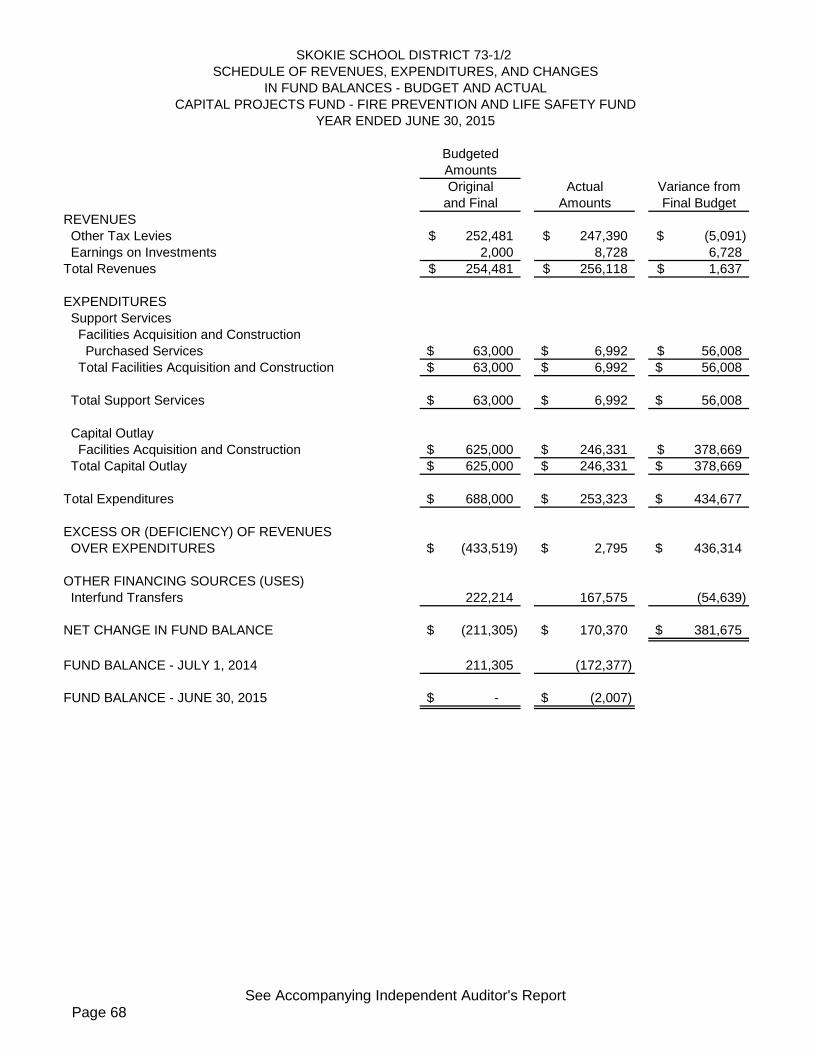
Page 68See Accompanying Independent Auditor's Report
BudgetedAmountsOriginal Actual Variance from
and Final Amounts Final BudgetREVENUES Other Tax Levies 252,481$ 247,390$ (5,091)$ Earnings on Investments 2,000 8,728 6,728 Total Revenues 254,481$ 256,118$ 1,637$
EXPENDITURES Support Services Facilities Acquisition and Construction Purchased Services 63,000$ 6,992$ 56,008$ Total Facilities Acquisition and Construction 63,000$ 6,992$ 56,008$
Total Support Services 63,000$ 6,992$ 56,008$
Capital Outlay Facilities Acquisition and Construction 625,000$ 246,331$ 378,669$ Total Capital Outlay 625,000$ 246,331$ 378,669$
Total Expenditures 688,000$ 253,323$ 434,677$
EXCESS OR (DEFICIENCY) OF REVENUES OVER EXPENDITURES (433,519)$ 2,795$ 436,314$
OTHER FINANCING SOURCES (USES) Interfund Transfers 222,214 167,575 (54,639)
NET CHANGE IN FUND BALANCE (211,305)$ 170,370$ 381,675$
FUND BALANCE - JULY 1, 2014 211,305 (172,377)
FUND BALANCE - JUNE 30, 2015 -$ (2,007)$
YEAR ENDED JUNE 30, 2015
SKOKIE SCHOOL DISTRICT 73-1/2 SCHEDULE OF REVENUES, EXPENDITURES, AND CHANGES
IN FUND BALANCES - BUDGET AND ACTUALCAPITAL PROJECTS FUND - FIRE PREVENTION AND LIFE SAFETY FUND
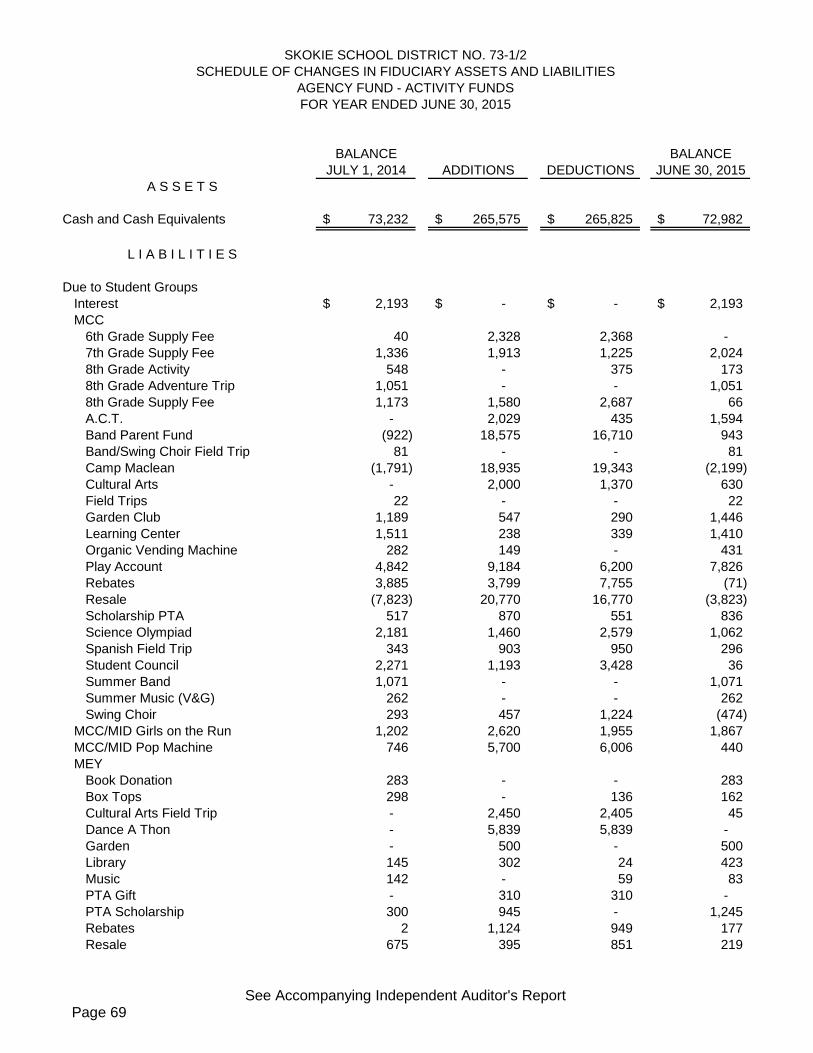
Page 69See Accompanying Independent Auditor's Report
BALANCE BALANCEJULY 1, 2014 ADDITIONS DEDUCTIONS JUNE 30, 2015
Cash and Cash Equivalents 73,232$ 265,575$ 265,825$ 72,982$
Due to Student GroupsInterest 2,193$ -$ -$ 2,193$ MCC
6th Grade Supply Fee 40 2,328 2,368 - 7th Grade Supply Fee 1,336 1,913 1,225 2,024 8th Grade Activity 548 - 375 173 8th Grade Adventure Trip 1,051 - - 1,051 8th Grade Supply Fee 1,173 1,580 2,687 66 A.C.T. - 2,029 435 1,594 Band Parent Fund (922) 18,575 16,710 943 Band/Swing Choir Field Trip 81 - - 81 Camp Maclean (1,791) 18,935 19,343 (2,199) Cultural Arts - 2,000 1,370 630 Field Trips 22 - - 22 Garden Club 1,189 547 290 1,446 Learning Center 1,511 238 339 1,410 Organic Vending Machine 282 149 - 431 Play Account 4,842 9,184 6,200 7,826 Rebates 3,885 3,799 7,755 (71) Resale (7,823) 20,770 16,770 (3,823) Scholarship PTA 517 870 551 836 Science Olympiad 2,181 1,460 2,579 1,062 Spanish Field Trip 343 903 950 296 Student Council 2,271 1,193 3,428 36 Summer Band 1,071 - - 1,071 Summer Music (V&G) 262 - - 262 Swing Choir 293 457 1,224 (474)
MCC/MID Girls on the Run 1,202 2,620 1,955 1,867 MCC/MID Pop Machine 746 5,700 6,006 440 MEY
Book Donation 283 - - 283 Box Tops 298 - 136 162 Cultural Arts Field Trip - 2,450 2,405 45 Dance A Thon - 5,839 5,839 - Garden - 500 - 500 Library 145 302 24 423 Music 142 - 59 83 PTA Gift - 310 310 - PTA Scholarship 300 945 - 1,245 Rebates 2 1,124 949 177 Resale 675 395 851 219
A S S E T S
L I A B I L I T I E S
SKOKIE SCHOOL DISTRICT NO. 73-1/2SCHEDULE OF CHANGES IN FIDUCIARY ASSETS AND LIABILITIES
AGENCY FUND - ACTIVITY FUNDSFOR YEAR ENDED JUNE 30, 2015
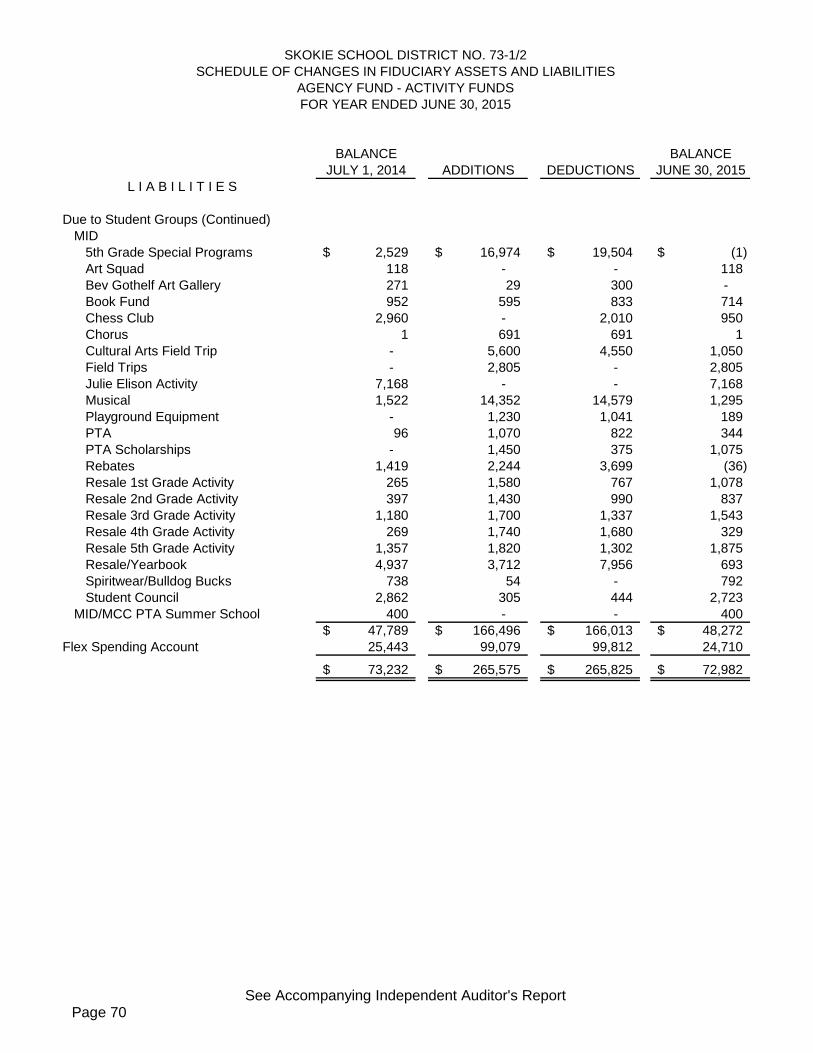
Page 70See Accompanying Independent Auditor's Report
BALANCE BALANCEJULY 1, 2014 ADDITIONS DEDUCTIONS JUNE 30, 2015
SKOKIE SCHOOL DISTRICT NO. 73-1/2SCHEDULE OF CHANGES IN FIDUCIARY ASSETS AND LIABILITIES
AGENCY FUND - ACTIVITY FUNDSFOR YEAR ENDED JUNE 30, 2015
Due to Student Groups (Continued)MID
5th Grade Special Programs 2,529$ 16,974$ 19,504$ (1)$ Art Squad 118 - - 118 Bev Gothelf Art Gallery 271 29 300 - Book Fund 952 595 833 714 Chess Club 2,960 - 2,010 950 Chorus 1 691 691 1 Cultural Arts Field Trip - 5,600 4,550 1,050 Field Trips - 2,805 - 2,805 Julie Elison Activity 7,168 - - 7,168 Musical 1,522 14,352 14,579 1,295 Playground Equipment - 1,230 1,041 189 PTA 96 1,070 822 344 PTA Scholarships - 1,450 375 1,075 Rebates 1,419 2,244 3,699 (36) Resale 1st Grade Activity 265 1,580 767 1,078 Resale 2nd Grade Activity 397 1,430 990 837 Resale 3rd Grade Activity 1,180 1,700 1,337 1,543 Resale 4th Grade Activity 269 1,740 1,680 329 Resale 5th Grade Activity 1,357 1,820 1,302 1,875 Resale/Yearbook 4,937 3,712 7,956 693 Spiritwear/Bulldog Bucks 738 54 - 792 Student Council 2,862 305 444 2,723
MID/MCC PTA Summer School 400 - - 400 47,789$ 166,496$ 166,013$ 48,272$
Flex Spending Account 25,443 99,079 99,812 24,710
73,232$ 265,575$ 265,825$ 72,982$
L I A B I L I T I E S
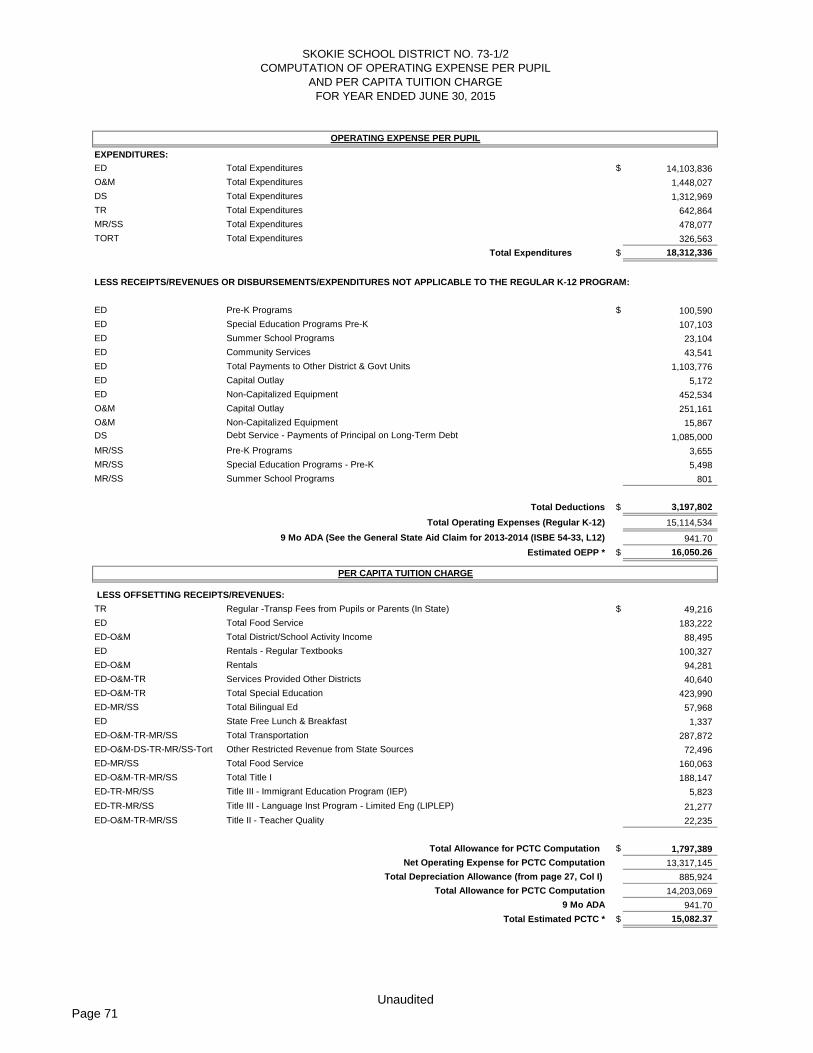
Page 71Unaudited
EXPENDITURES:ED Total Expenditures $ 14,103,836O&M Total Expenditures 1,448,027DS Total Expenditures 1,312,969TR Total Expenditures 642,864MR/SS Total Expenditures 478,077TORT Total Expenditures 326,563
Total Expenditures $ 18,312,336
LESS RECEIPTS/REVENUES OR DISBURSEMENTS/EXPENDITURES NOT APPLICABLE TO THE REGULAR K-12 PROGRAM:
ED Pre-K Programs $ 100,590ED Special Education Programs Pre-K 107,103ED Summer School Programs 23,104ED Community Services 43,541ED Total Payments to Other District & Govt Units 1,103,776ED Capital Outlay 5,172ED Non-Capitalized Equipment 452,534O&M Capital Outlay 251,161O&M Non-Capitalized Equipment 15,867DS Debt Service - Payments of Principal on Long-Term Debt 1,085,000MR/SS Pre-K Programs 3,655MR/SS Special Education Programs - Pre-K 5,498MR/SS Summer School Programs 801
Total Deductions $ 3,197,802Total Operating Expenses (Regular K-12) 15,114,534
9 Mo ADA (See the General State Aid Claim for 2013-2014 (ISBE 54-33, L12) 941.70Estimated OEPP * $ 16,050.26
LESS OFFSETTING RECEIPTS/REVENUES:TR Regular -Transp Fees from Pupils or Parents (In State) $ 49,216ED Total Food Service 183,222ED-O&M Total District/School Activity Income 88,495ED Rentals - Regular Textbooks 100,327ED-O&M Rentals 94,281ED-O&M-TR Services Provided Other Districts 40,640ED-O&M-TR Total Special Education 423,990ED-MR/SS Total Bilingual Ed 57,968ED State Free Lunch & Breakfast 1,337ED-O&M-TR-MR/SS Total Transportation 287,872ED-O&M-DS-TR-MR/SS-Tort Other Restricted Revenue from State Sources 72,496ED-MR/SS Total Food Service 160,063ED-O&M-TR-MR/SS Total Title I 188,147ED-TR-MR/SS Title III - Immigrant Education Program (IEP) 5,823ED-TR-MR/SS Title III - Language Inst Program - Limited Eng (LIPLEP) 21,277ED-O&M-TR-MR/SS Title II - Teacher Quality 22,235
Total Allowance for PCTC Computation $ 1,797,389Net Operating Expense for PCTC Computation 13,317,145
Total Depreciation Allowance (from page 27, Col I) 885,924Total Allowance for PCTC Computation 14,203,069
9 Mo ADA 941.70Total Estimated PCTC * $ 15,082.37
PER CAPITA TUITION CHARGE
SKOKIE SCHOOL DISTRICT NO. 73-1/2COMPUTATION OF OPERATING EXPENSE PER PUPIL
AND PER CAPITA TUITION CHARGEFOR YEAR ENDED JUNE 30, 2015
OPERATING EXPENSE PER PUPIL
STATISTICAL SECTION This part of the District’s comprehensive annual financial report presents detailed information as a context for understanding what the information in the financial statements, note disclosures, and required supplementary information says about the District’s overall financial health. Contents Page Financial Trends 72
These schedules contain trend information to help the reader understand how the District’s financial performance and well-being have changed over time.
Revenue Capacity 76
These schedules contain information to help the reader assess the District’s most significant local revenue source, the property tax.
Debt Capacity 80
These schedules present information to help the reader assess the affordability of the District’s current level of outstanding debt and the District’s ability to issue additional debt in the future.
Demographic and Economic Information 85
These schedules offer demographic and economic indicators to help the reader understand the environment within which the District’s financial activities take place.
Operating Information 87
These schedules contain information about the District’s service and resources to help the reader understand how the District’s financial information relates to the services the District provides and the activities it performs.
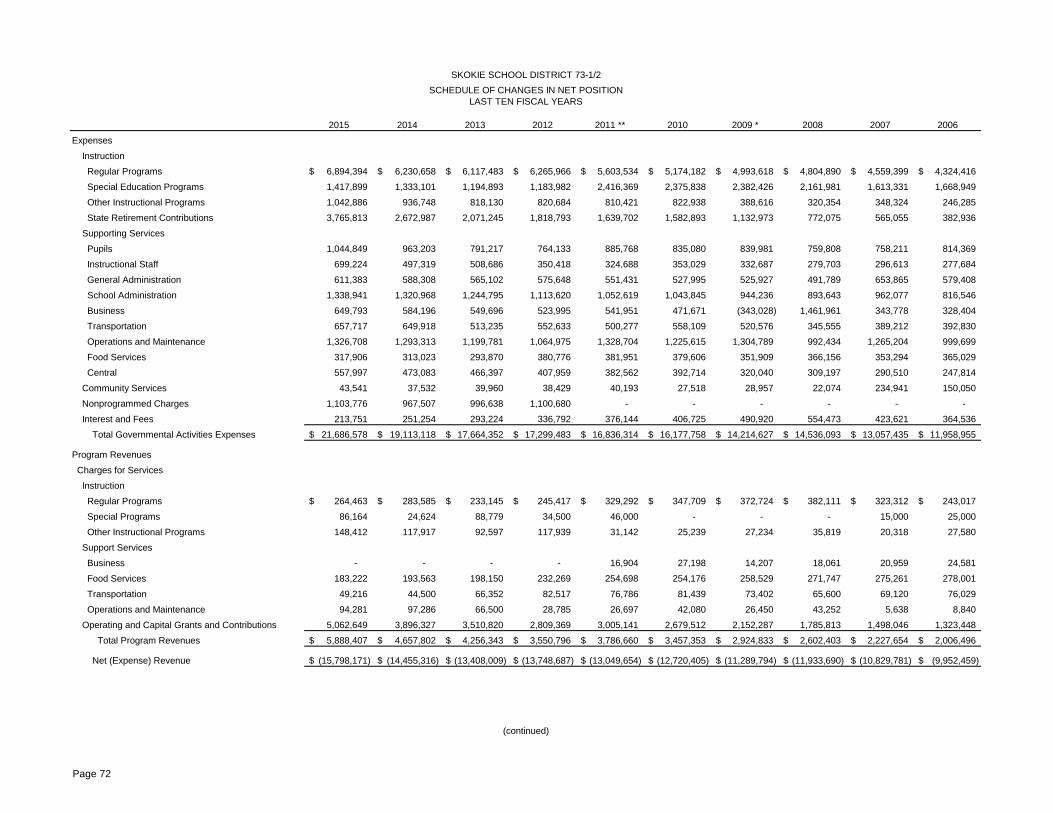
Page 72
2015 2014 2013 2012 2011 ** 2010 2009 * 2008 2007 2006
Expenses
Instruction
Regular Programs 6,894,394$ 6,230,658$ 6,117,483$ 6,265,966$ 5,603,534$ 5,174,182$ 4,993,618$ 4,804,890$ 4,559,399$ 4,324,416$
Special Education Programs 1,417,899 1,333,101 1,194,893 1,183,982 2,416,369 2,375,838 2,382,426 2,161,981 1,613,331 1,668,949
Other Instructional Programs 1,042,886 936,748 818,130 820,684 810,421 822,938 388,616 320,354 348,324 246,285
State Retirement Contributions 3,765,813 2,672,987 2,071,245 1,818,793 1,639,702 1,582,893 1,132,973 772,075 565,055 382,936
Supporting Services
Pupils 1,044,849 963,203 791,217 764,133 885,768 835,080 839,981 759,808 758,211 814,369
Instructional Staff 699,224 497,319 508,686 350,418 324,688 353,029 332,687 279,703 296,613 277,684
General Administration 611,383 588,308 565,102 575,648 551,431 527,995 525,927 491,789 653,865 579,408
School Administration 1,338,941 1,320,968 1,244,795 1,113,620 1,052,619 1,043,845 944,236 893,643 962,077 816,546
Business 649,793 584,196 549,696 523,995 541,951 471,671 (343,028) 1,461,961 343,778 328,404
Transportation 657,717 649,918 513,235 552,633 500,277 558,109 520,576 345,555 389,212 392,830
Operations and Maintenance 1,326,708 1,293,313 1,199,781 1,064,975 1,328,704 1,225,615 1,304,789 992,434 1,265,204 999,699
Food Services 317,906 313,023 293,870 380,776 381,951 379,606 351,909 366,156 353,294 365,029
Central 557,997 473,083 466,397 407,959 382,562 392,714 320,040 309,197 290,510 247,814
Community Services 43,541 37,532 39,960 38,429 40,193 27,518 28,957 22,074 234,941 150,050
Nonprogrammed Charges 1,103,776 967,507 996,638 1,100,680 - - - - - -
Interest and Fees 213,751 251,254 293,224 336,792 376,144 406,725 490,920 554,473 423,621 364,536
Total Governmental Activities Expenses 21,686,578$ 19,113,118$ 17,664,352$ 17,299,483$ 16,836,314$ 16,177,758$ 14,214,627$ 14,536,093$ 13,057,435$ 11,958,955$
Program Revenues
Charges for Services
Instruction
Regular Programs 264,463$ 283,585$ 233,145$ 245,417$ 329,292$ 347,709$ 372,724$ 382,111$ 323,312$ 243,017$
Special Programs 86,164 24,624 88,779 34,500 46,000 - - - 15,000 25,000
Other Instructional Programs 148,412 117,917 92,597 117,939 31,142 25,239 27,234 35,819 20,318 27,580
Support Services
Business - - - - 16,904 27,198 14,207 18,061 20,959 24,581
Food Services 183,222 193,563 198,150 232,269 254,698 254,176 258,529 271,747 275,261 278,001
Transportation 49,216 44,500 66,352 82,517 76,786 81,439 73,402 65,600 69,120 76,029
Operations and Maintenance 94,281 97,286 66,500 28,785 26,697 42,080 26,450 43,252 5,638 8,840
Operating and Capital Grants and Contributions 5,062,649 3,896,327 3,510,820 2,809,369 3,005,141 2,679,512 2,152,287 1,785,813 1,498,046 1,323,448
Total Program Revenues 5,888,407$ 4,657,802$ 4,256,343$ 3,550,796$ 3,786,660$ 3,457,353$ 2,924,833$ 2,602,403$ 2,227,654$ 2,006,496$
Net (Expense) Revenue (15,798,171)$ (14,455,316)$ (13,408,009)$ (13,748,687)$ (13,049,654)$ (12,720,405)$ (11,289,794)$ (11,933,690)$ (10,829,781)$ (9,952,459)$
(continued)
SKOKIE SCHOOL DISTRICT 73-1/2SCHEDULE OF CHANGES IN NET POSITION
LAST TEN FISCAL YEARS
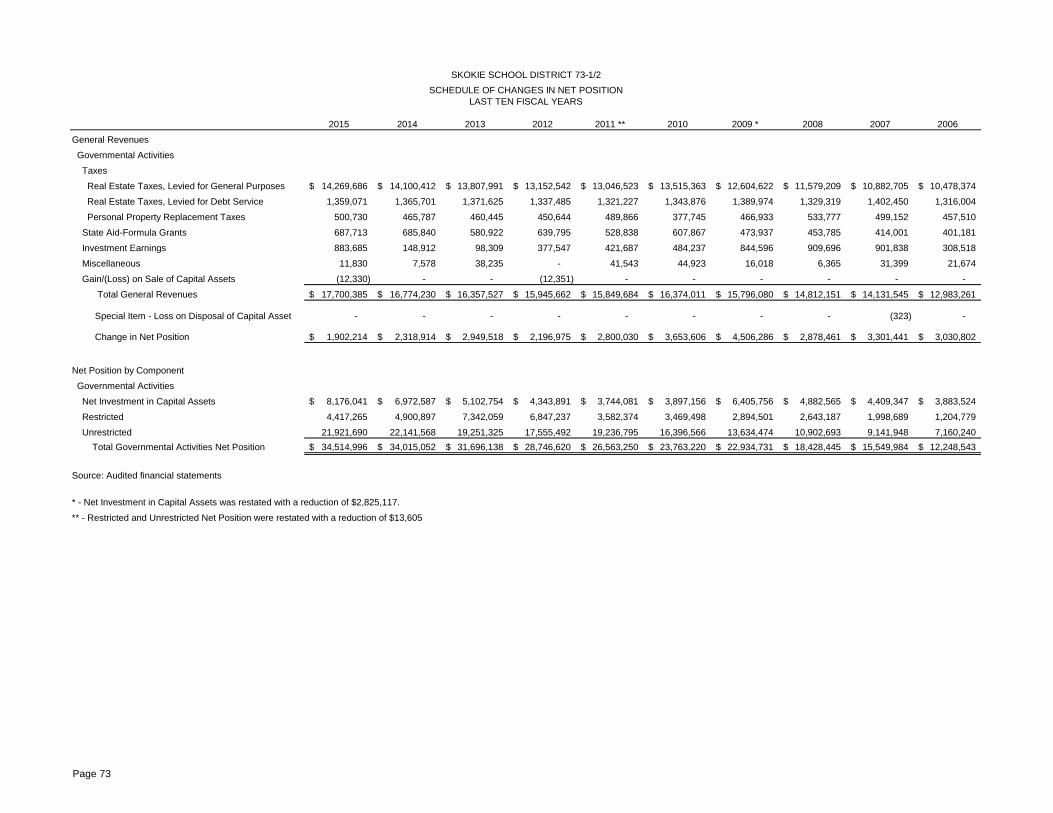
Page 73
2015 2014 2013 2012 2011 ** 2010 2009 * 2008 2007 2006
General Revenues
Governmental Activities
Taxes
Real Estate Taxes, Levied for General Purposes 14,269,686$ 14,100,412$ 13,807,991$ 13,152,542$ 13,046,523$ 13,515,363$ 12,604,622$ 11,579,209$ 10,882,705$ 10,478,374$
Real Estate Taxes, Levied for Debt Service 1,359,071 1,365,701 1,371,625 1,337,485 1,321,227 1,343,876 1,389,974 1,329,319 1,402,450 1,316,004
Personal Property Replacement Taxes 500,730 465,787 460,445 450,644 489,866 377,745 466,933 533,777 499,152 457,510
State Aid-Formula Grants 687,713 685,840 580,922 639,795 528,838 607,867 473,937 453,785 414,001 401,181
Investment Earnings 883,685 148,912 98,309 377,547 421,687 484,237 844,596 909,696 901,838 308,518
Miscellaneous 11,830 7,578 38,235 - 41,543 44,923 16,018 6,365 31,399 21,674
Gain/(Loss) on Sale of Capital Assets (12,330) - - (12,351) - - - - - -
Total General Revenues 17,700,385$ 16,774,230$ 16,357,527$ 15,945,662$ 15,849,684$ 16,374,011$ 15,796,080$ 14,812,151$ 14,131,545$ 12,983,261$
Special Item - Loss on Disposal of Capital Asset - - - - - - - - (323) -
Change in Net Position 1,902,214$ 2,318,914$ 2,949,518$ 2,196,975$ 2,800,030$ 3,653,606$ 4,506,286$ 2,878,461$ 3,301,441$ 3,030,802$
Net Position by Component
Governmental Activities
Net Investment in Capital Assets 8,176,041$ 6,972,587$ 5,102,754$ 4,343,891$ 3,744,081$ 3,897,156$ 6,405,756$ 4,882,565$ 4,409,347$ 3,883,524$
Restricted 4,417,265 4,900,897 7,342,059 6,847,237 3,582,374 3,469,498 2,894,501 2,643,187 1,998,689 1,204,779
Unrestricted 21,921,690 22,141,568 19,251,325 17,555,492 19,236,795 16,396,566 13,634,474 10,902,693 9,141,948 7,160,240 Total Governmental Activities Net Position 34,514,996$ 34,015,052$ 31,696,138$ 28,746,620$ 26,563,250$ 23,763,220$ 22,934,731$ 18,428,445$ 15,549,984$ 12,248,543$
Source: Audited financial statements
* - Net Investment in Capital Assets was restated with a reduction of $2,825,117.
** - Restricted and Unrestricted Net Position were restated with a reduction of $13,605
LAST TEN FISCAL YEARS
SKOKIE SCHOOL DISTRICT 73-1/2SCHEDULE OF CHANGES IN NET POSITION
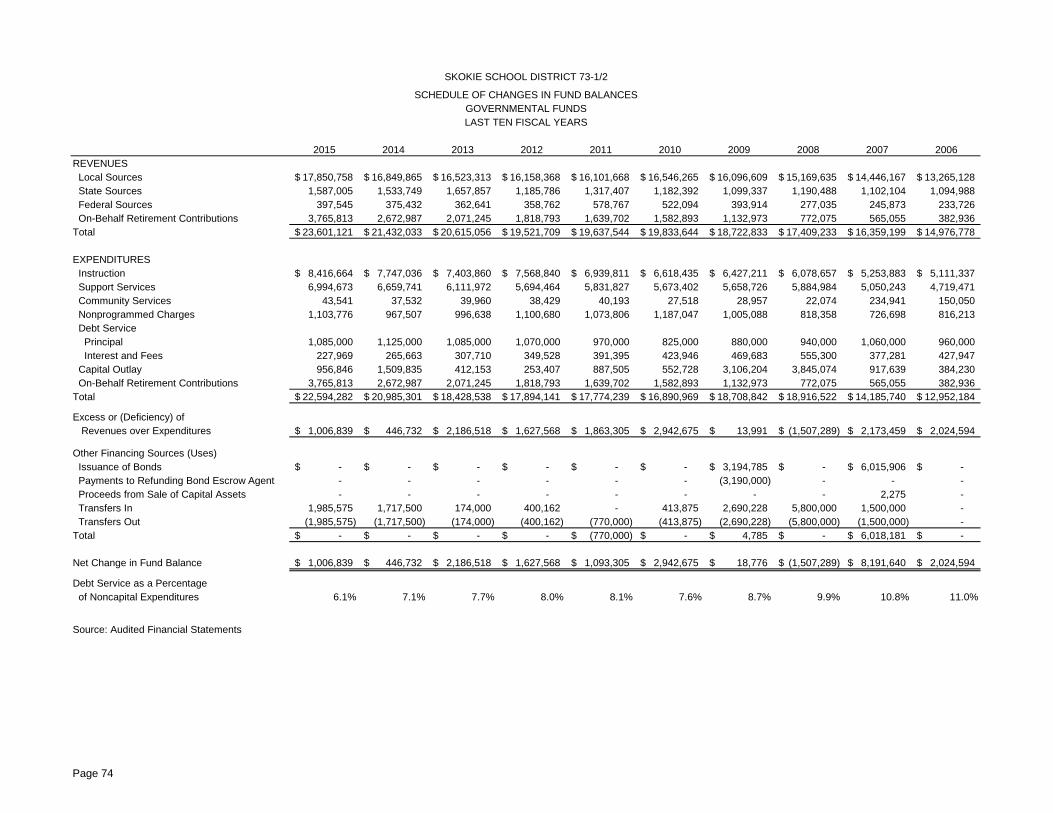
Page 74
2015 2014 2013 2012 2011 2010 2009 2008 2007 2006REVENUES Local Sources 17,850,758$ 16,849,865$ 16,523,313$ 16,158,368$ 16,101,668$ 16,546,265$ 16,096,609$ 15,169,635$ 14,446,167$ 13,265,128$ State Sources 1,587,005 1,533,749 1,657,857 1,185,786 1,317,407 1,182,392 1,099,337 1,190,488 1,102,104 1,094,988 Federal Sources 397,545 375,432 362,641 358,762 578,767 522,094 393,914 277,035 245,873 233,726 On-Behalf Retirement Contributions 3,765,813 2,672,987 2,071,245 1,818,793 1,639,702 1,582,893 1,132,973 772,075 565,055 382,936 Total 23,601,121$ 21,432,033$ 20,615,056$ 19,521,709$ 19,637,544$ 19,833,644$ 18,722,833$ 17,409,233$ 16,359,199$ 14,976,778$
EXPENDITURES Instruction 8,416,664$ 7,747,036$ 7,403,860$ 7,568,840$ 6,939,811$ 6,618,435$ 6,427,211$ 6,078,657$ 5,253,883$ 5,111,337$ Support Services 6,994,673 6,659,741 6,111,972 5,694,464 5,831,827 5,673,402 5,658,726 5,884,984 5,050,243 4,719,471 Community Services 43,541 37,532 39,960 38,429 40,193 27,518 28,957 22,074 234,941 150,050 Nonprogrammed Charges 1,103,776 967,507 996,638 1,100,680 1,073,806 1,187,047 1,005,088 818,358 726,698 816,213 Debt Service Principal 1,085,000 1,125,000 1,085,000 1,070,000 970,000 825,000 880,000 940,000 1,060,000 960,000 Interest and Fees 227,969 265,663 307,710 349,528 391,395 423,946 469,683 555,300 377,281 427,947 Capital Outlay 956,846 1,509,835 412,153 253,407 887,505 552,728 3,106,204 3,845,074 917,639 384,230 On-Behalf Retirement Contributions 3,765,813 2,672,987 2,071,245 1,818,793 1,639,702 1,582,893 1,132,973 772,075 565,055 382,936 Total 22,594,282$ 20,985,301$ 18,428,538$ 17,894,141$ 17,774,239$ 16,890,969$ 18,708,842$ 18,916,522$ 14,185,740$ 12,952,184$
Excess or (Deficiency) of Revenues over Expenditures 1,006,839$ 446,732$ 2,186,518$ 1,627,568$ 1,863,305$ 2,942,675$ 13,991$ (1,507,289)$ 2,173,459$ 2,024,594$
Other Financing Sources (Uses) Issuance of Bonds -$ -$ -$ -$ -$ -$ 3,194,785$ -$ 6,015,906$ -$ Payments to Refunding Bond Escrow Agent - - - - - - (3,190,000) - - - Proceeds from Sale of Capital Assets - - - - - - - - 2,275 - Transfers In 1,985,575 1,717,500 174,000 400,162 - 413,875 2,690,228 5,800,000 1,500,000 - Transfers Out (1,985,575) (1,717,500) (174,000) (400,162) (770,000) (413,875) (2,690,228) (5,800,000) (1,500,000) - Total -$ -$ -$ -$ (770,000)$ -$ 4,785$ -$ 6,018,181$ -$
Net Change in Fund Balance 1,006,839$ 446,732$ 2,186,518$ 1,627,568$ 1,093,305$ 2,942,675$ 18,776$ (1,507,289)$ 8,191,640$ 2,024,594$
Debt Service as a Percentage of Noncapital Expenditures 6.1% 7.1% 7.7% 8.0% 8.1% 7.6% 8.7% 9.9% 10.8% 11.0%
Source: Audited Financial Statements
SKOKIE SCHOOL DISTRICT 73-1/2
SCHEDULE OF CHANGES IN FUND BALANCES
LAST TEN FISCAL YEARSGOVERNMENTAL FUNDS
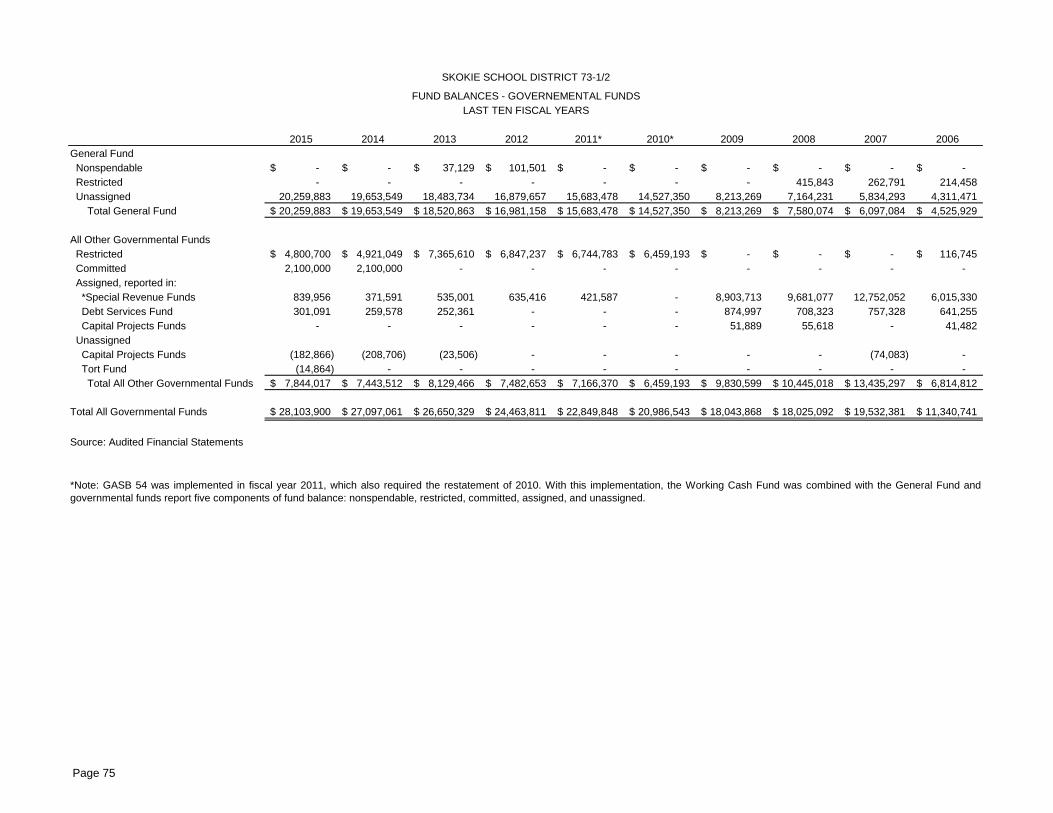
Page 75
2015 2014 2013 2012 2011* 2010* 2009 2008 2007 2006General Fund Nonspendable -$ -$ 37,129$ 101,501$ -$ -$ -$ -$ -$ -$ Restricted - - - - - - - 415,843 262,791 214,458 Unassigned 20,259,883 19,653,549 18,483,734 16,879,657 15,683,478 14,527,350 8,213,269 7,164,231 5,834,293 4,311,471 Total General Fund 20,259,883$ 19,653,549$ 18,520,863$ 16,981,158$ 15,683,478$ 14,527,350$ 8,213,269$ 7,580,074$ 6,097,084$ 4,525,929$
All Other Governmental Funds Restricted 4,800,700$ 4,921,049$ 7,365,610$ 6,847,237$ 6,744,783$ 6,459,193$ -$ -$ -$ 116,745$ Committed 2,100,000 2,100,000 - - - - - - - - Assigned, reported in: *Special Revenue Funds 839,956 371,591 535,001 635,416 421,587 - 8,903,713 9,681,077 12,752,052 6,015,330 Debt Services Fund 301,091 259,578 252,361 - - - 874,997 708,323 757,328 641,255 Capital Projects Funds - - - - - - 51,889 55,618 - 41,482 Unassigned Capital Projects Funds (182,866) (208,706) (23,506) - - - - - (74,083) - Tort Fund (14,864) - - - - - - - - - Total All Other Governmental Funds 7,844,017$ 7,443,512$ 8,129,466$ 7,482,653$ 7,166,370$ 6,459,193$ 9,830,599$ 10,445,018$ 13,435,297$ 6,814,812$
Total All Governmental Funds 28,103,900$ 27,097,061$ 26,650,329$ 24,463,811$ 22,849,848$ 20,986,543$ 18,043,868$ 18,025,092$ 19,532,381$ 11,340,741$
Source: Audited Financial Statements
SKOKIE SCHOOL DISTRICT 73-1/2
FUND BALANCES - GOVERNEMENTAL FUNDSLAST TEN FISCAL YEARS
*Note: GASB 54 was implemented in fiscal year 2011, which also required the restatement of 2010. With this implementation, the Working Cash Fund was combined with the General Fund andgovernmental funds report five components of fund balance: nonspendable, restricted, committed, assigned, and unassigned.
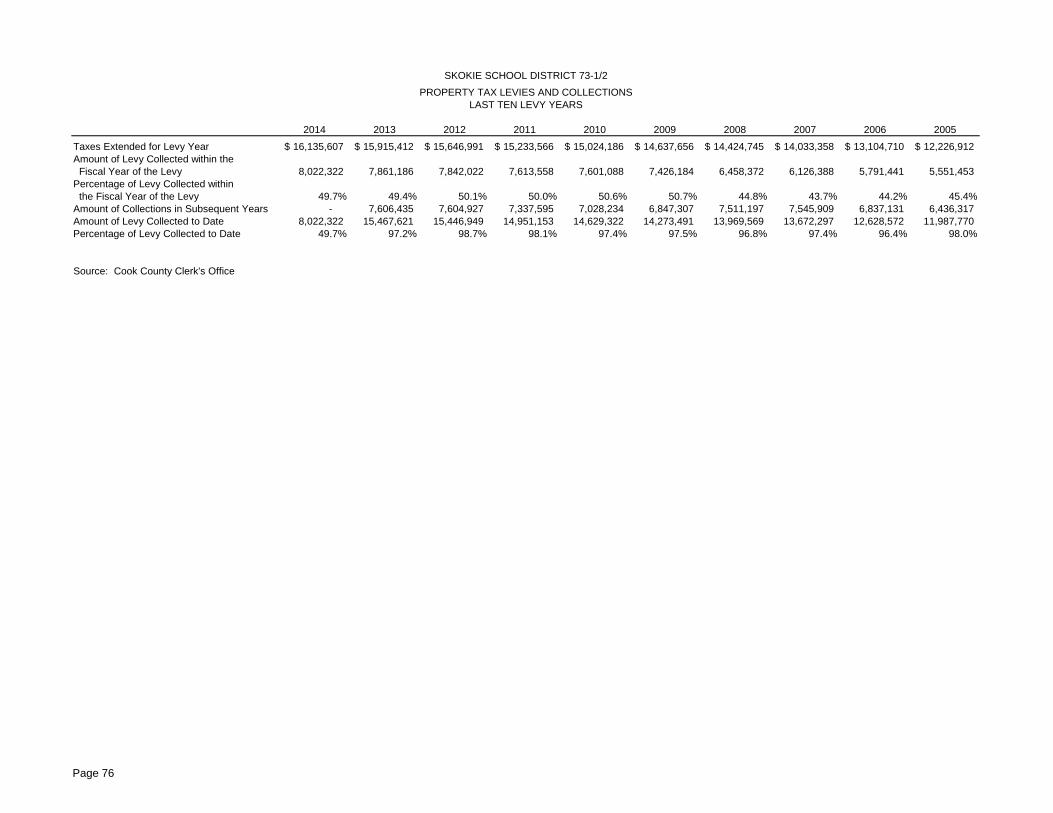
Page 76
2014 2013 2012 2011 2010 2009 2008 2007 2006 2005
Taxes Extended for Levy Year 16,135,607$ 15,915,412$ 15,646,991$ 15,233,566$ 15,024,186$ 14,637,656$ 14,424,745$ 14,033,358$ 13,104,710$ 12,226,912$ Amount of Levy Collected within the Fiscal Year of the Levy 8,022,322 7,861,186 7,842,022 7,613,558 7,601,088 7,426,184 6,458,372 6,126,388 5,791,441 5,551,453 Percentage of Levy Collected within the Fiscal Year of the Levy 49.7% 49.4% 50.1% 50.0% 50.6% 50.7% 44.8% 43.7% 44.2% 45.4%Amount of Collections in Subsequent Years - 7,606,435 7,604,927 7,337,595 7,028,234 6,847,307 7,511,197 7,545,909 6,837,131 6,436,317 Amount of Levy Collected to Date 8,022,322 15,467,621 15,446,949 14,951,153 14,629,322 14,273,491 13,969,569 13,672,297 12,628,572 11,987,770 Percentage of Levy Collected to Date 49.7% 97.2% 98.7% 98.1% 97.4% 97.5% 96.8% 97.4% 96.4% 98.0%
Source: Cook County Clerk's Office
SKOKIE SCHOOL DISTRICT 73-1/2
PROPERTY TAX LEVIES AND COLLECTIONSLAST TEN LEVY YEARS
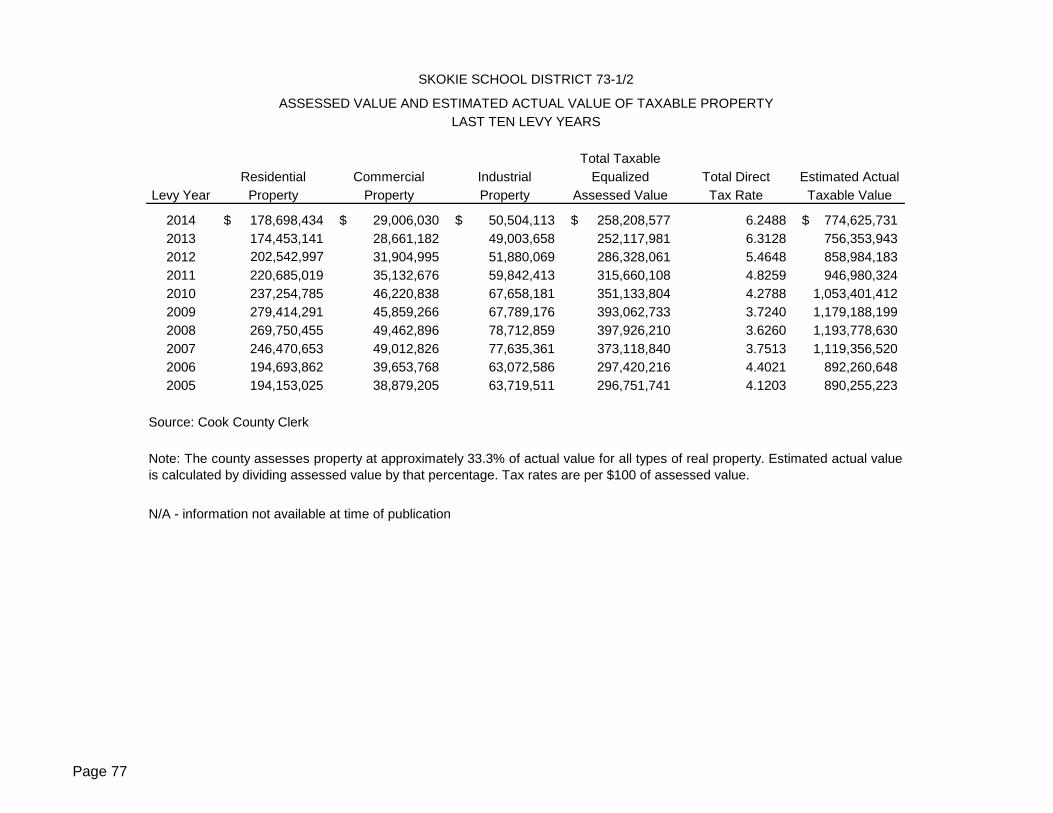
Page 77
Total TaxableResidential Commercial Industrial Equalized Total Direct Estimated Actual
Levy Year Property Property Property Assessed Value Tax Rate Taxable Value
2014 178,698,434$ 29,006,030$ 50,504,113$ 258,208,577$ 6.2488 774,625,731$ 2013 174,453,141 28,661,182 49,003,658 252,117,981 6.3128 756,353,943 2012 202,542,997 31,904,995 51,880,069 286,328,061 5.4648 858,984,183 2011 220,685,019 35,132,676 59,842,413 315,660,108 4.8259 946,980,324 2010 237,254,785 46,220,838 67,658,181 351,133,804 4.2788 1,053,401,412 2009 279,414,291 45,859,266 67,789,176 393,062,733 3.7240 1,179,188,199 2008 269,750,455 49,462,896 78,712,859 397,926,210 3.6260 1,193,778,630 2007 246,470,653 49,012,826 77,635,361 373,118,840 3.7513 1,119,356,520 2006 194,693,862 39,653,768 63,072,586 297,420,216 4.4021 892,260,648 2005 194,153,025 38,879,205 63,719,511 296,751,741 4.1203 890,255,223
Source: Cook County Clerk
N/A - information not available at time of publication
Note: The county assesses property at approximately 33.3% of actual value for all types of real property. Estimated actual valueis calculated by dividing assessed value by that percentage. Tax rates are per $100 of assessed value.
SKOKIE SCHOOL DISTRICT 73-1/2
ASSESSED VALUE AND ESTIMATED ACTUAL VALUE OF TAXABLE PROPERTYLAST TEN LEVY YEARS
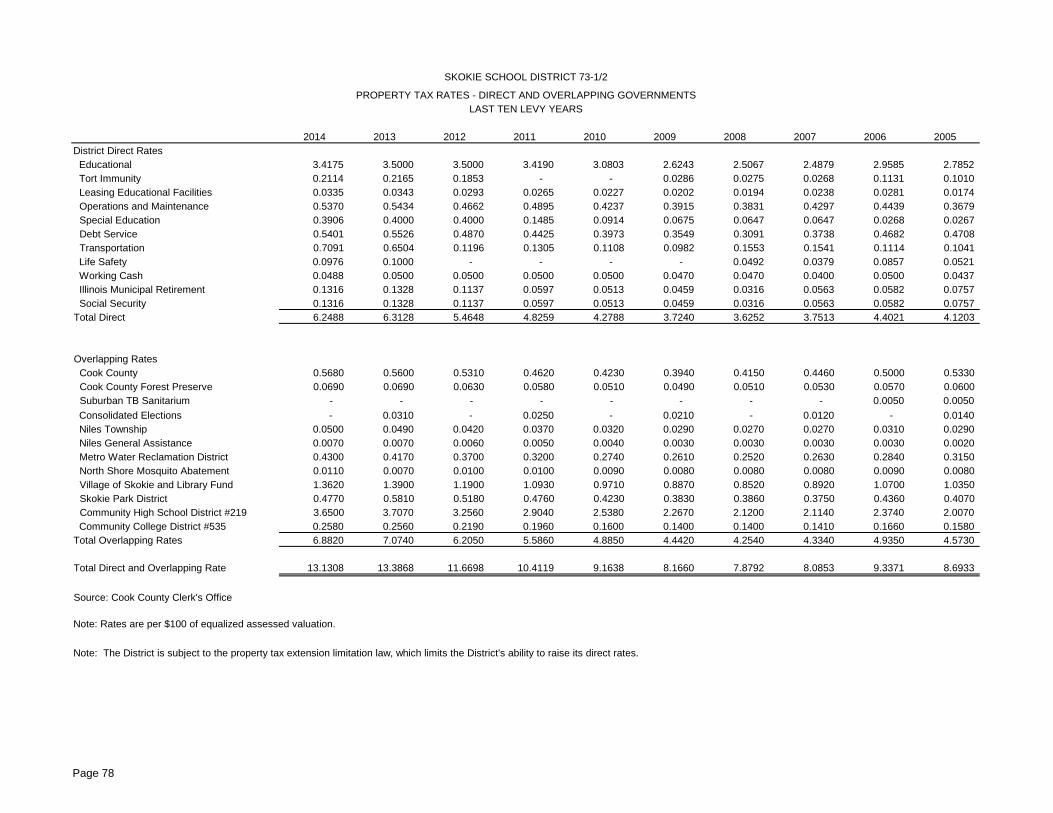
Page 78
2014 2013 2012 2011 2010 2009 2008 2007 2006 2005District Direct Rates Educational 3.4175 3.5000 3.5000 3.4190 3.0803 2.6243 2.5067 2.4879 2.9585 2.7852 Tort Immunity 0.2114 0.2165 0.1853 - - 0.0286 0.0275 0.0268 0.1131 0.1010 Leasing Educational Facilities 0.0335 0.0343 0.0293 0.0265 0.0227 0.0202 0.0194 0.0238 0.0281 0.0174 Operations and Maintenance 0.5370 0.5434 0.4662 0.4895 0.4237 0.3915 0.3831 0.4297 0.4439 0.3679 Special Education 0.3906 0.4000 0.4000 0.1485 0.0914 0.0675 0.0647 0.0647 0.0268 0.0267 Debt Service 0.5401 0.5526 0.4870 0.4425 0.3973 0.3549 0.3091 0.3738 0.4682 0.4708 Transportation 0.7091 0.6504 0.1196 0.1305 0.1108 0.0982 0.1553 0.1541 0.1114 0.1041 Life Safety 0.0976 0.1000 - - - - 0.0492 0.0379 0.0857 0.0521 Working Cash 0.0488 0.0500 0.0500 0.0500 0.0500 0.0470 0.0470 0.0400 0.0500 0.0437 Illinois Municipal Retirement 0.1316 0.1328 0.1137 0.0597 0.0513 0.0459 0.0316 0.0563 0.0582 0.0757 Social Security 0.1316 0.1328 0.1137 0.0597 0.0513 0.0459 0.0316 0.0563 0.0582 0.0757 Total Direct 6.2488 6.3128 5.4648 4.8259 4.2788 3.7240 3.6252 3.7513 4.4021 4.1203
Overlapping Rates Cook County 0.5680 0.5600 0.5310 0.4620 0.4230 0.3940 0.4150 0.4460 0.5000 0.5330 Cook County Forest Preserve 0.0690 0.0690 0.0630 0.0580 0.0510 0.0490 0.0510 0.0530 0.0570 0.0600 Suburban TB Sanitarium - - - - - - - - 0.0050 0.0050 Consolidated Elections - 0.0310 - 0.0250 - 0.0210 - 0.0120 - 0.0140 Niles Township 0.0500 0.0490 0.0420 0.0370 0.0320 0.0290 0.0270 0.0270 0.0310 0.0290 Niles General Assistance 0.0070 0.0070 0.0060 0.0050 0.0040 0.0030 0.0030 0.0030 0.0030 0.0020 Metro Water Reclamation District 0.4300 0.4170 0.3700 0.3200 0.2740 0.2610 0.2520 0.2630 0.2840 0.3150 North Shore Mosquito Abatement 0.0110 0.0070 0.0100 0.0100 0.0090 0.0080 0.0080 0.0080 0.0090 0.0080 Village of Skokie and Library Fund 1.3620 1.3900 1.1900 1.0930 0.9710 0.8870 0.8520 0.8920 1.0700 1.0350 Skokie Park District 0.4770 0.5810 0.5180 0.4760 0.4230 0.3830 0.3860 0.3750 0.4360 0.4070 Community High School District #219 3.6500 3.7070 3.2560 2.9040 2.5380 2.2670 2.1200 2.1140 2.3740 2.0070 Community College District #535 0.2580 0.2560 0.2190 0.1960 0.1600 0.1400 0.1400 0.1410 0.1660 0.1580 Total Overlapping Rates 6.8820 7.0740 6.2050 5.5860 4.8850 4.4420 4.2540 4.3340 4.9350 4.5730
Total Direct and Overlapping Rate 13.1308 13.3868 11.6698 10.4119 9.1638 8.1660 7.8792 8.0853 9.3371 8.6933
Source: Cook County Clerk's Office
Note: The District is subject to the property tax extension limitation law, which limits the District's ability to raise its direct rates.
Note: Rates are per $100 of equalized assessed valuation.
SKOKIE SCHOOL DISTRICT 73-1/2
PROPERTY TAX RATES - DIRECT AND OVERLAPPING GOVERNMENTSLAST TEN LEVY YEARS
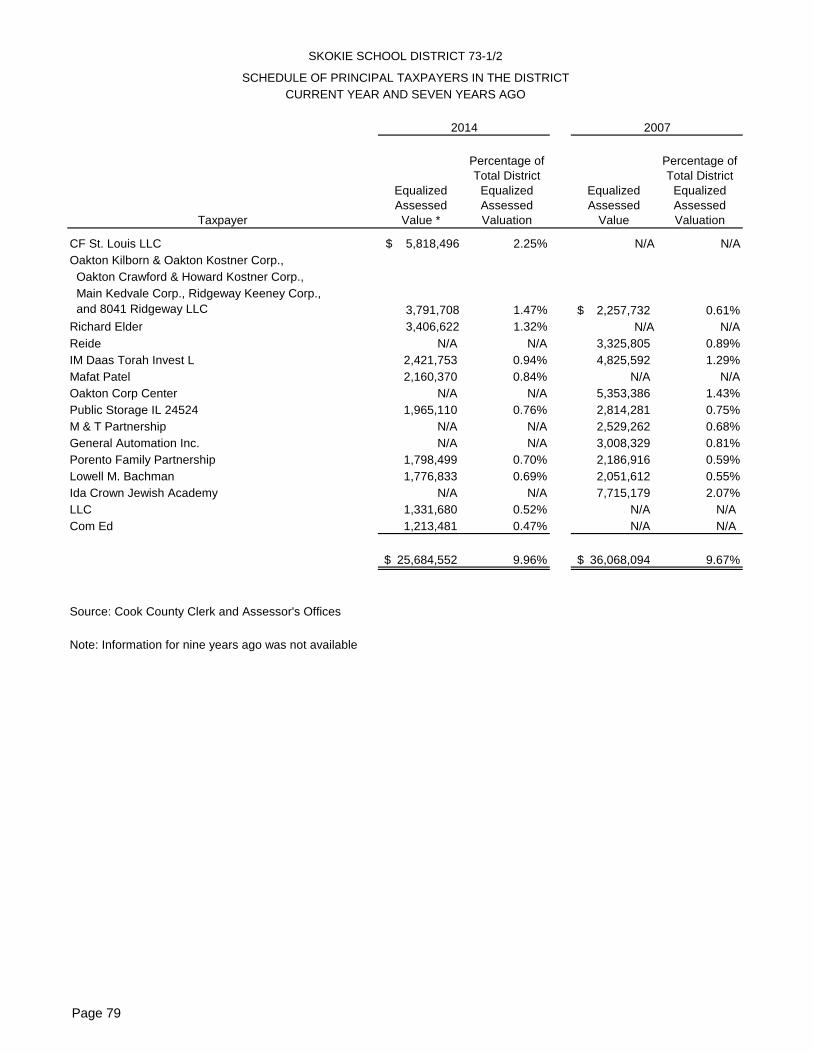
Page 79
Taxpayer
Equalized Assessed
Value *
Percentage of Total District
Equalized Assessed Valuation
Equalized Assessed
Value
Percentage of Total District
Equalized Assessed Valuation
CF St. Louis LLC $ 5,818,496 2.25% N/A N/AOakton Kilborn & Oakton Kostner Corp., Oakton Crawford & Howard Kostner Corp., Main Kedvale Corp., Ridgeway Keeney Corp., and 8041 Ridgeway LLC 3,791,708 1.47% 2,257,732$ 0.61%Richard Elder 3,406,622 1.32% N/A N/AReide N/A N/A 3,325,805 0.89%IM Daas Torah Invest L 2,421,753 0.94% 4,825,592 1.29%Mafat Patel 2,160,370 0.84% N/A N/AOakton Corp Center N/A N/A 5,353,386 1.43%Public Storage IL 24524 1,965,110 0.76% 2,814,281 0.75%M & T Partnership N/A N/A 2,529,262 0.68%General Automation Inc. N/A N/A 3,008,329 0.81%Porento Family Partnership 1,798,499 0.70% 2,186,916 0.59%Lowell M. Bachman 1,776,833 0.69% 2,051,612 0.55%Ida Crown Jewish Academy N/A N/A 7,715,179 2.07%LLC 1,331,680 0.52% N/A N/ACom Ed 1,213,481 0.47% N/A N/A
25,684,552$ 9.96% 36,068,094$ 9.67%
Source: Cook County Clerk and Assessor's Offices
Note: Information for nine years ago was not available
2014 2007
SKOKIE SCHOOL DISTRICT 73-1/2
SCHEDULE OF PRINCIPAL TAXPAYERS IN THE DISTRICTCURRENT YEAR AND SEVEN YEARS AGO
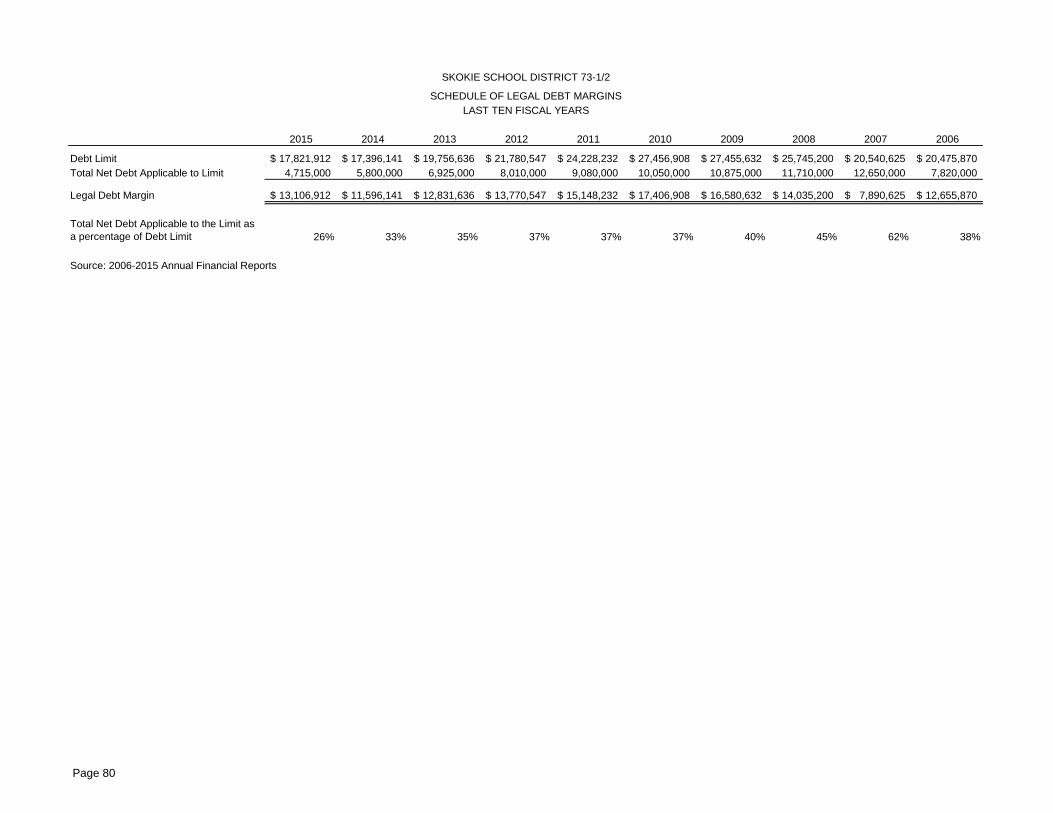
Page 80
2015 2014 2013 2012 2011 2010 2009 2008 2007 2006
Debt Limit 17,821,912$ 17,396,141$ 19,756,636$ 21,780,547$ 24,228,232$ 27,456,908$ 27,455,632$ 25,745,200$ 20,540,625$ 20,475,870$ Total Net Debt Applicable to Limit 4,715,000 5,800,000 6,925,000 8,010,000 9,080,000 10,050,000 10,875,000 11,710,000 12,650,000 7,820,000
Legal Debt Margin 13,106,912$ 11,596,141$ 12,831,636$ 13,770,547$ 15,148,232$ 17,406,908$ 16,580,632$ 14,035,200$ 7,890,625$ 12,655,870$
Total Net Debt Applicable to the Limit as a percentage of Debt Limit 26% 33% 35% 37% 37% 37% 40% 45% 62% 38%
Source: 2006-2015 Annual Financial Reports
SKOKIE SCHOOL DISTRICT 73-1/2
SCHEDULE OF LEGAL DEBT MARGINSLAST TEN FISCAL YEARS
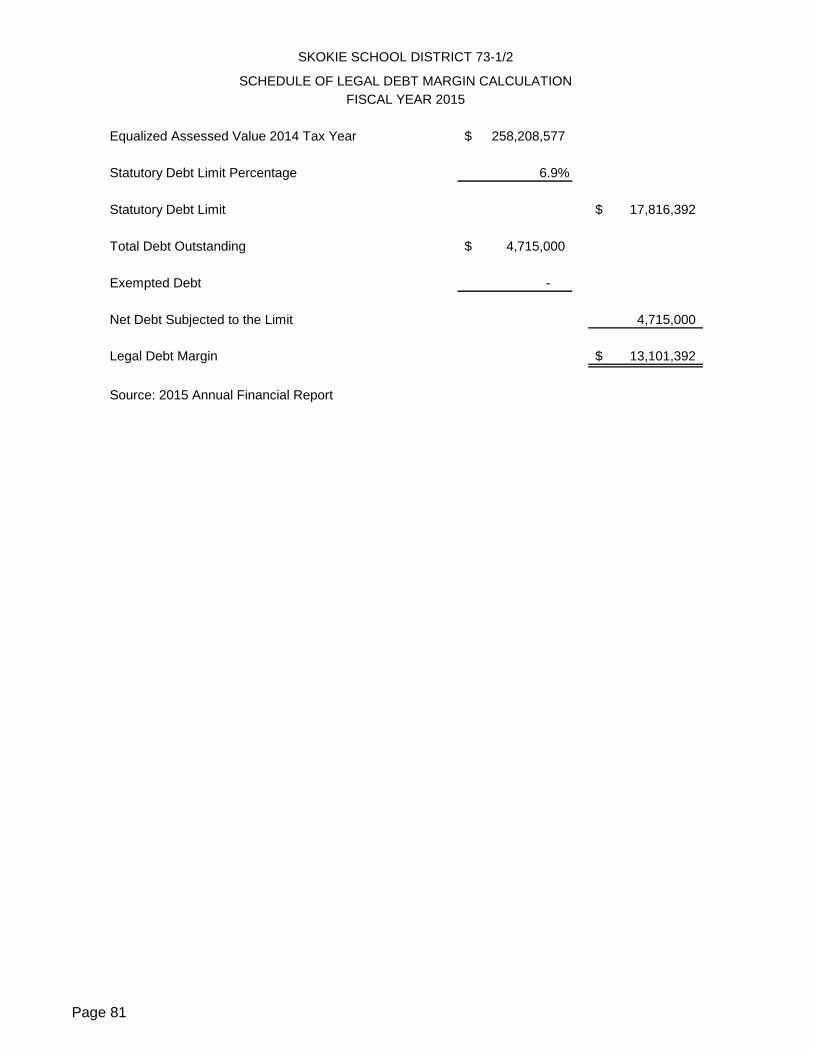
Page 81
Equalized Assessed Value 2014 Tax Year 258,208,577$
Statutory Debt Limit Percentage 6.9%
Statutory Debt Limit 17,816,392$
Total Debt Outstanding 4,715,000$
Exempted Debt -
Net Debt Subjected to the Limit 4,715,000
Legal Debt Margin 13,101,392$
Source: 2015 Annual Financial Report
SKOKIE SCHOOL DISTRICT 73-1/2
SCHEDULE OF LEGAL DEBT MARGIN CALCULATIONFISCAL YEAR 2015
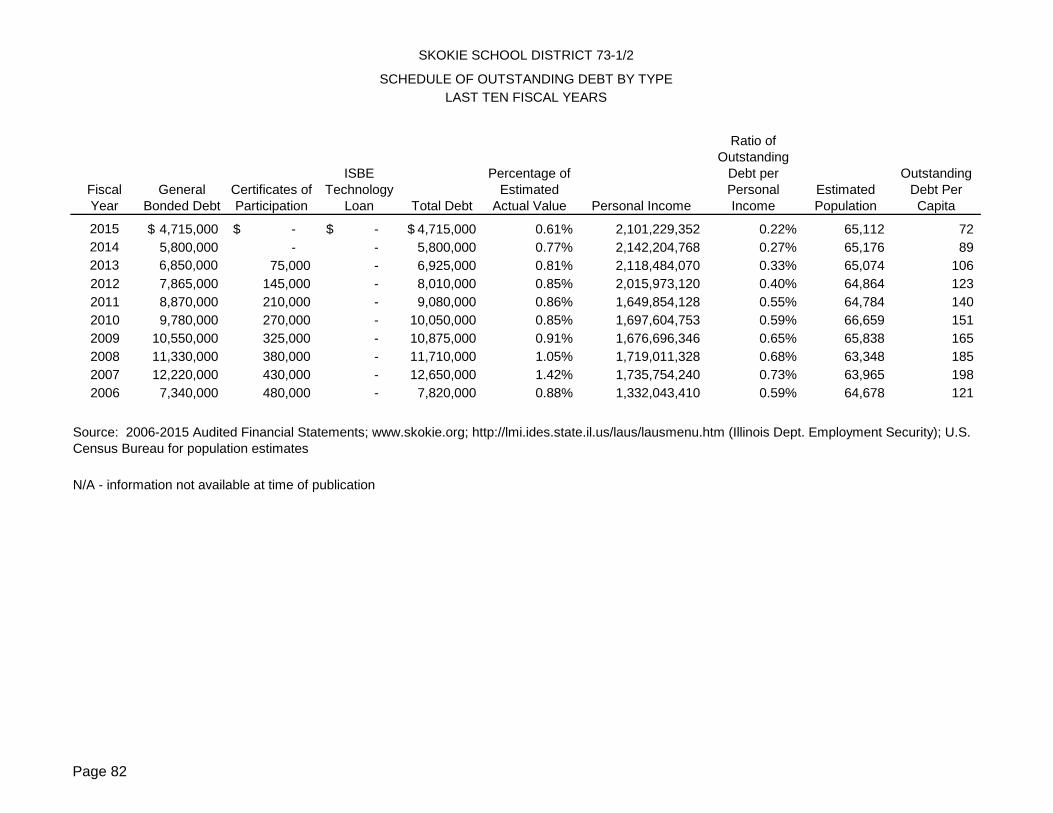
Page 82
Fiscal Year
General Bonded Debt
Certificates of Participation
ISBE Technology
Loan Total Debt
Percentage of Estimated
Actual Value Personal Income
Ratio of Outstanding
Debt per Personal Income
Estimated Population
Outstanding Debt Per Capita
2015 4,715,000$ -$ -$ 4,715,000$ 0.61% 2,101,229,352 0.22% 65,112 72 2014 5,800,000 - - 5,800,000 0.77% 2,142,204,768 0.27% 65,176 89 2013 6,850,000 75,000 - 6,925,000 0.81% 2,118,484,070 0.33% 65,074 106 2012 7,865,000 145,000 - 8,010,000 0.85% 2,015,973,120 0.40% 64,864 123 2011 8,870,000 210,000 - 9,080,000 0.86% 1,649,854,128 0.55% 64,784 140 2010 9,780,000 270,000 - 10,050,000 0.85% 1,697,604,753 0.59% 66,659 151 2009 10,550,000 325,000 - 10,875,000 0.91% 1,676,696,346 0.65% 65,838 165 2008 11,330,000 380,000 - 11,710,000 1.05% 1,719,011,328 0.68% 63,348 185 2007 12,220,000 430,000 - 12,650,000 1.42% 1,735,754,240 0.73% 63,965 198 2006 7,340,000 480,000 - 7,820,000 0.88% 1,332,043,410 0.59% 64,678 121
N/A - information not available at time of publication
SKOKIE SCHOOL DISTRICT 73-1/2
LAST TEN FISCAL YEARSSCHEDULE OF OUTSTANDING DEBT BY TYPE
Source: 2006-2015 Audited Financial Statements; www.skokie.org; http://lmi.ides.state.il.us/laus/lausmenu.htm (Illinois Dept. Employment Security); U.S. Census Bureau for population estimates
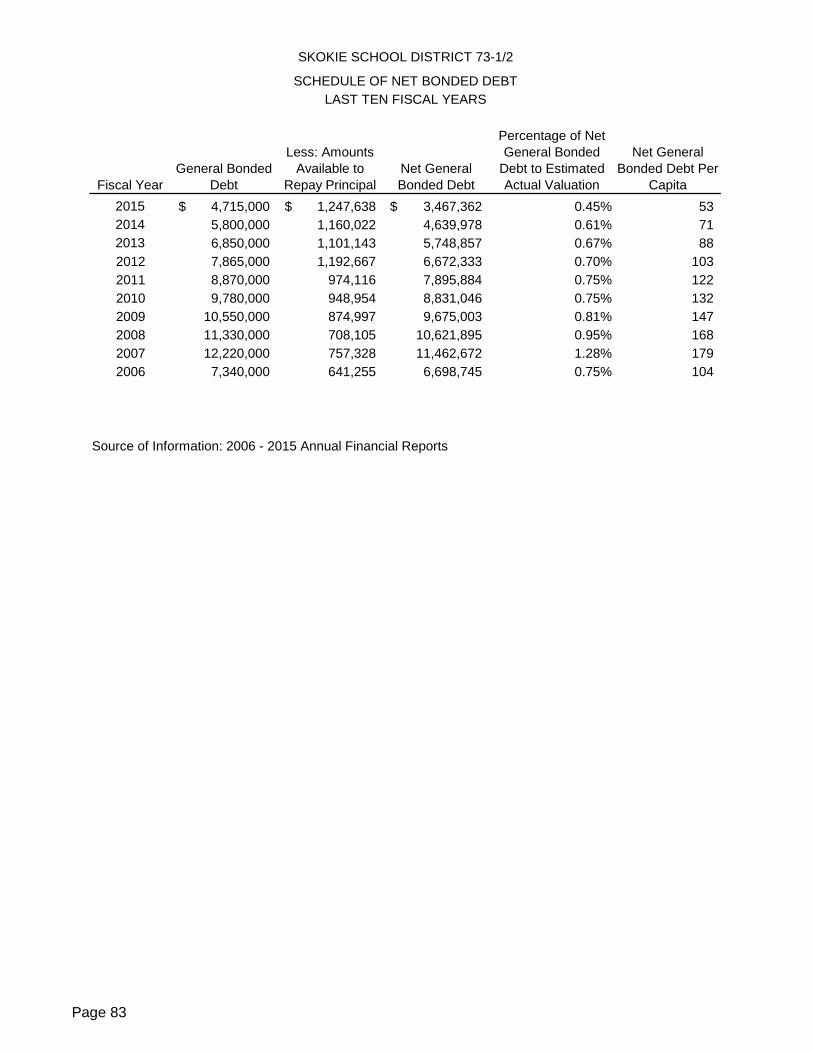
Page 83
Fiscal YearGeneral Bonded
Debt
Less: Amounts Available to
Repay PrincipalNet General Bonded Debt
Percentage of Net General Bonded
Debt to Estimated Actual Valuation
Net General Bonded Debt Per
Capita2015 4,715,000$ 1,247,638$ 3,467,362$ 0.45% 53 2014 5,800,000 1,160,022 4,639,978 0.61% 71 2013 6,850,000 1,101,143 5,748,857 0.67% 88 2012 7,865,000 1,192,667 6,672,333 0.70% 103 2011 8,870,000 974,116 7,895,884 0.75% 122 2010 9,780,000 948,954 8,831,046 0.75% 132 2009 10,550,000 874,997 9,675,003 0.81% 147 2008 11,330,000 708,105 10,621,895 0.95% 168 2007 12,220,000 757,328 11,462,672 1.28% 179 2006 7,340,000 641,255 6,698,745 0.75% 104
Source of Information: 2006 - 2015 Annual Financial Reports
SKOKIE SCHOOL DISTRICT 73-1/2
LAST TEN FISCAL YEARSSCHEDULE OF NET BONDED DEBT
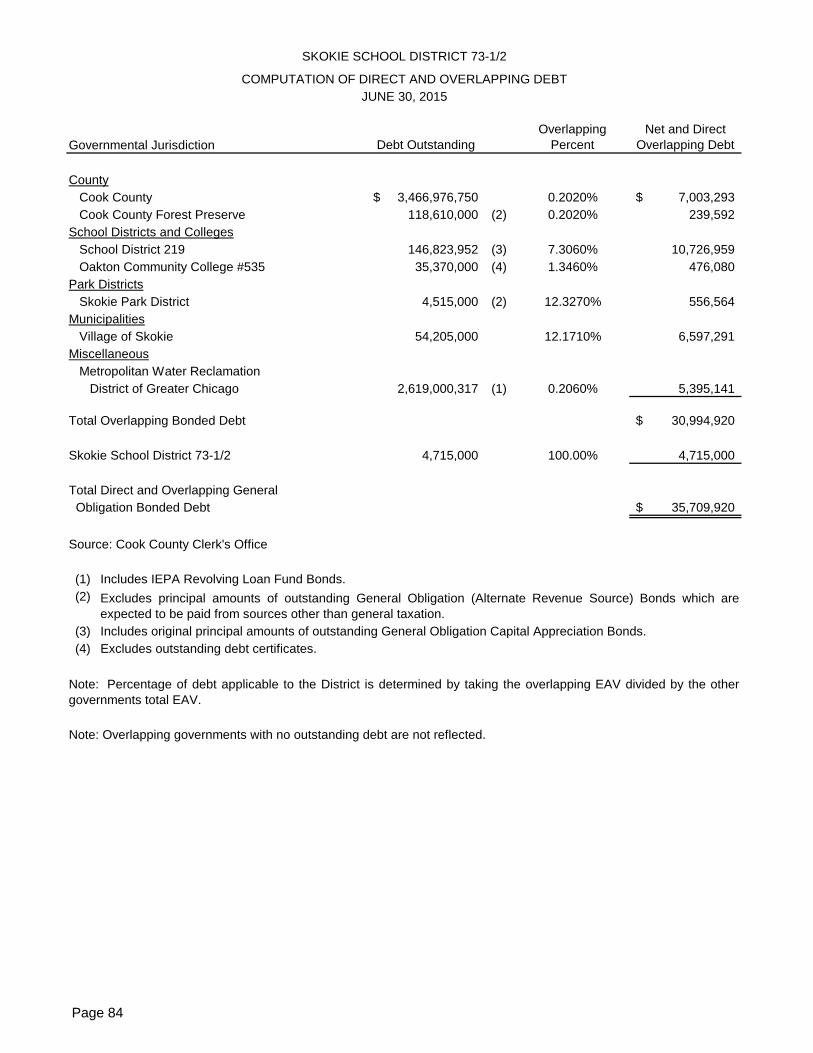
Page 84
Governmental Jurisdiction Debt OutstandingOverlapping
PercentNet and Direct
Overlapping Debt
County Cook County 3,466,976,750$ 0.2020% 7,003,293$ Cook County Forest Preserve 118,610,000 (2) 0.2020% 239,592 School Districts and Colleges School District 219 146,823,952 (3) 7.3060% 10,726,959 Oakton Community College #535 35,370,000 (4) 1.3460% 476,080 Park Districts Skokie Park District 4,515,000 (2) 12.3270% 556,564 Municipalities Village of Skokie 54,205,000 12.1710% 6,597,291 Miscellaneous Metropolitan Water Reclamation District of Greater Chicago 2,619,000,317 (1) 0.2060% 5,395,141
Total Overlapping Bonded Debt 30,994,920$
Skokie School District 73-1/2 4,715,000 100.00% 4,715,000
Total Direct and Overlapping General Obligation Bonded Debt 35,709,920$
Source: Cook County Clerk's Office
(1) Includes IEPA Revolving Loan Fund Bonds.(2)
(3) Includes original principal amounts of outstanding General Obligation Capital Appreciation Bonds.(4) Excludes outstanding debt certificates.
Note: Overlapping governments with no outstanding debt are not reflected.
JUNE 30, 2015
SKOKIE SCHOOL DISTRICT 73-1/2
COMPUTATION OF DIRECT AND OVERLAPPING DEBT
Excludes principal amounts of outstanding General Obligation (Alternate Revenue Source) Bonds which areexpected to be paid from sources other than general taxation.
Note: Percentage of debt applicable to the District is determined by taking the overlapping EAV divided by the othergovernments total EAV.
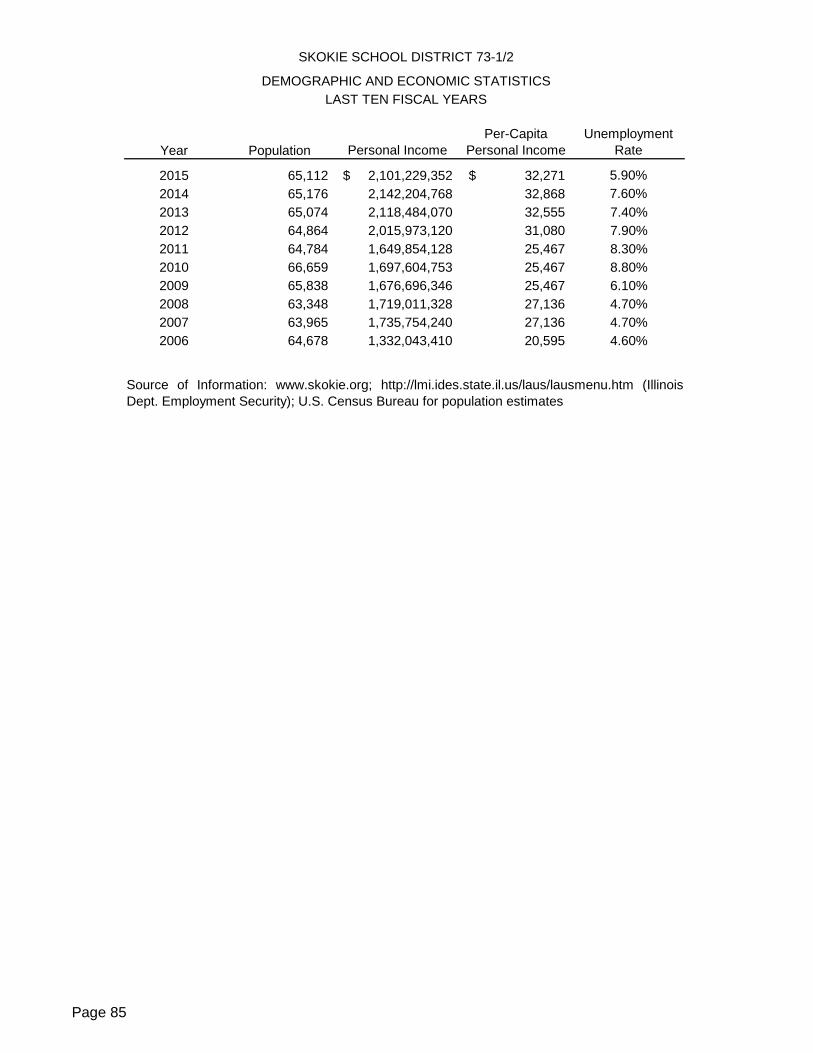
Page 85
Year Population Personal IncomePer-Capita
Personal IncomeUnemployment
Rate
2015 65,112 2,101,229,352$ 32,271$ 5.90%2014 65,176 2,142,204,768 32,868 7.60%2013 65,074 2,118,484,070 32,555 7.40%2012 64,864 2,015,973,120 31,080 7.90%2011 64,784 1,649,854,128 25,467 8.30%2010 66,659 1,697,604,753 25,467 8.80%2009 65,838 1,676,696,346 25,467 6.10%2008 63,348 1,719,011,328 27,136 4.70%2007 63,965 1,735,754,240 27,136 4.70%2006 64,678 1,332,043,410 20,595 4.60%
Source of Information: www.skokie.org; http://lmi.ides.state.il.us/laus/lausmenu.htm (IllinoisDept. Employment Security); U.S. Census Bureau for population estimates
SKOKIE SCHOOL DISTRICT 73-1/2
DEMOGRAPHIC AND ECONOMIC STATISTICSLAST TEN FISCAL YEARS
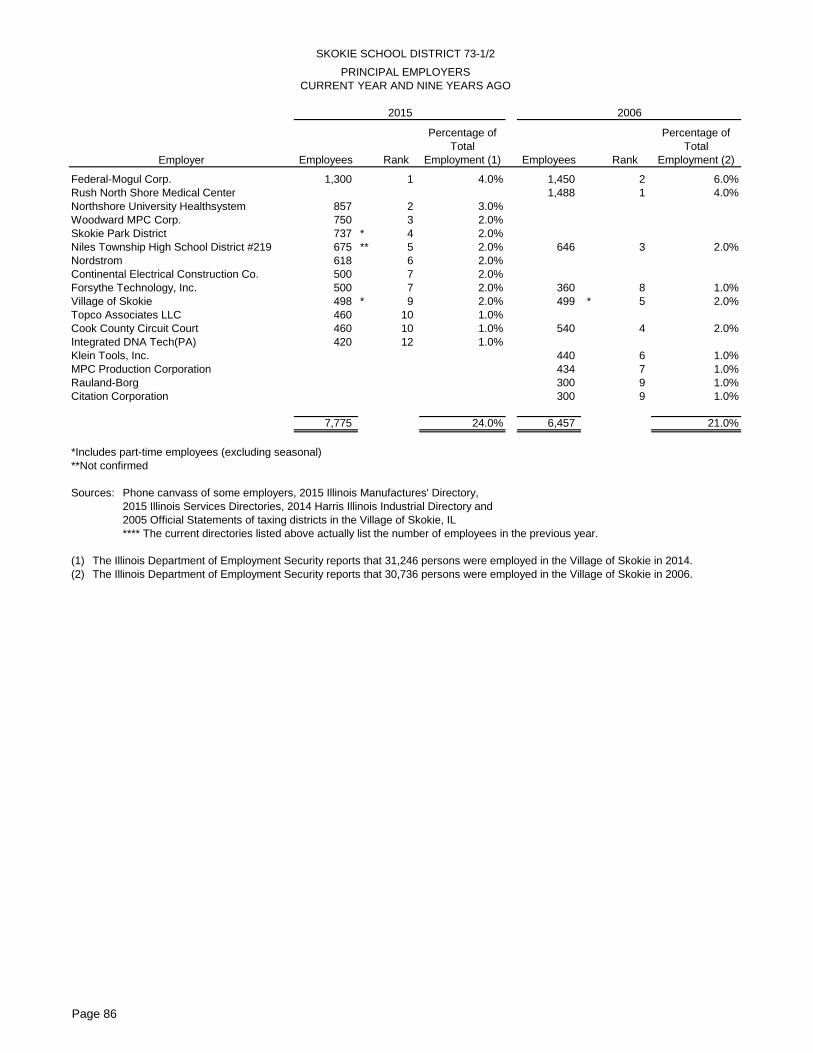
Page 86
Employees Rank
Percentage of Total
Employment (1) Employees Rank
Percentage of Total
Employment (2)
Federal-Mogul Corp. 1,300 1 4.0% 1,450 2 6.0%Rush North Shore Medical Center 1,488 1 4.0%Northshore University Healthsystem 857 2 3.0%Woodward MPC Corp. 750 3 2.0%Skokie Park District 737 * 4 2.0%Niles Township High School District #219 675 ** 5 2.0% 646 3 2.0%Nordstrom 618 6 2.0%Continental Electrical Construction Co. 500 7 2.0%Forsythe Technology, Inc. 500 7 2.0% 360 8 1.0%Village of Skokie 498 * 9 2.0% 499 * 5 2.0%Topco Associates LLC 460 10 1.0%Cook County Circuit Court 460 10 1.0% 540 4 2.0%Integrated DNA Tech(PA) 420 12 1.0%Klein Tools, Inc. 440 6 1.0%MPC Production Corporation 434 7 1.0%Rauland-Borg 300 9 1.0%Citation Corporation 300 9 1.0%
7,775 24.0% 6,457 21.0%
*Includes part-time employees (excluding seasonal)**Not confirmed
Sources: Phone canvass of some employers, 2015 Illinois Manufactures' Directory,2015 Illinois Services Directories, 2014 Harris Illinois Industrial Directory and 2005 Official Statements of taxing districts in the Village of Skokie, IL**** The current directories listed above actually list the number of employees in the previous year.
(1) The Illinois Department of Employment Security reports that 31,246 persons were employed in the Village of Skokie in 2014.(2) The Illinois Department of Employment Security reports that 30,736 persons were employed in the Village of Skokie in 2006.
Employer
2015 2006
SKOKIE SCHOOL DISTRICT 73-1/2
PRINCIPAL EMPLOYERSCURRENT YEAR AND NINE YEARS AGO
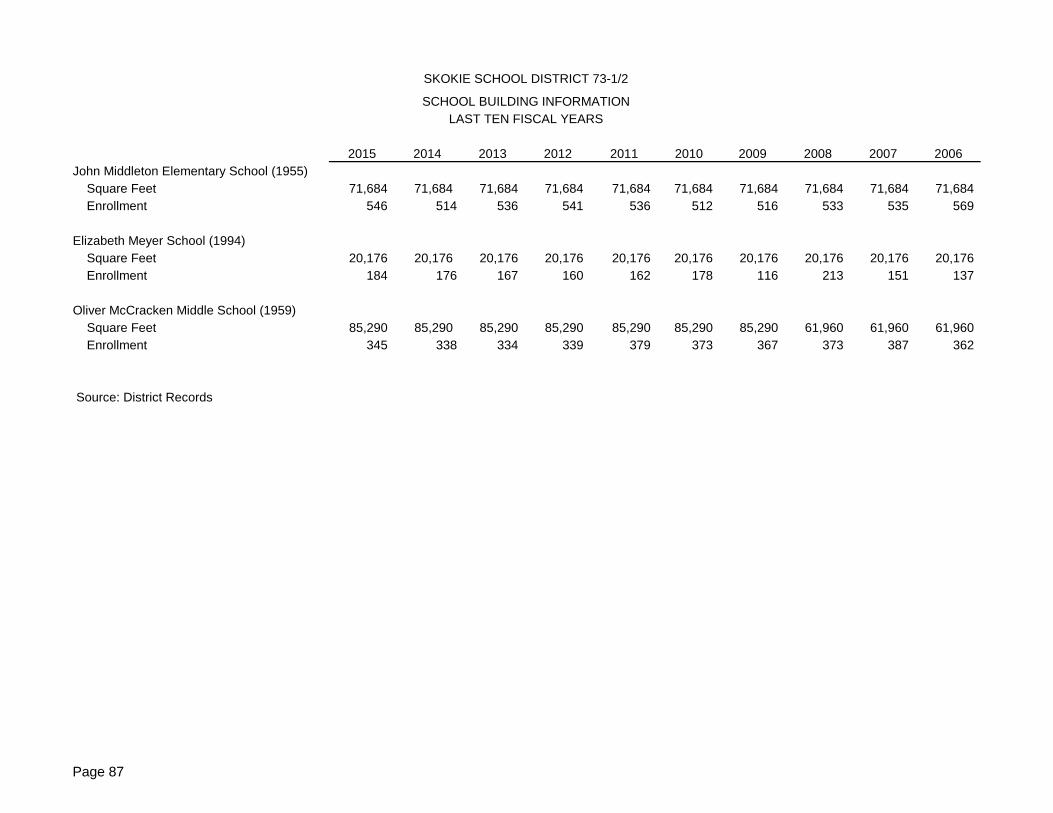
Page 87
2015 2014 2013 2012 2011 2010 2009 2008 2007 2006John Middleton Elementary School (1955) Square Feet 71,684 71,684 71,684 71,684 71,684 71,684 71,684 71,684 71,684 71,684 Enrollment 546 514 536 541 536 512 516 533 535 569
Elizabeth Meyer School (1994) Square Feet 20,176 20,176 20,176 20,176 20,176 20,176 20,176 20,176 20,176 20,176 Enrollment 184 176 167 160 162 178 116 213 151 137
Oliver McCracken Middle School (1959) Square Feet 85,290 85,290 85,290 85,290 85,290 85,290 85,290 61,960 61,960 61,960 Enrollment 345 338 334 339 379 373 367 373 387 362
Source: District Records
SKOKIE SCHOOL DISTRICT 73-1/2
SCHOOL BUILDING INFORMATIONLAST TEN FISCAL YEARS
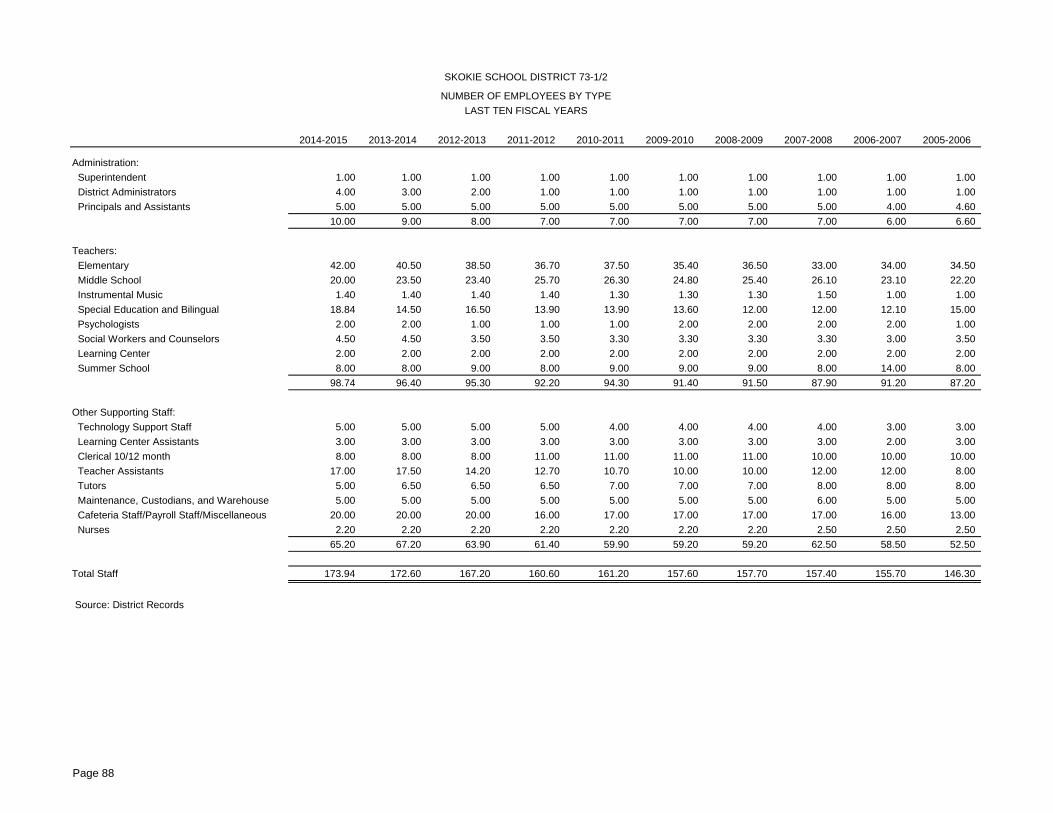
Page 88
2014-2015 2013-2014 2012-2013 2011-2012 2010-2011 2009-2010 2008-2009 2007-2008 2006-2007 2005-2006
Administration: Superintendent 1.00 1.00 1.00 1.00 1.00 1.00 1.00 1.00 1.00 1.00 District Administrators 4.00 3.00 2.00 1.00 1.00 1.00 1.00 1.00 1.00 1.00 Principals and Assistants 5.00 5.00 5.00 5.00 5.00 5.00 5.00 5.00 4.00 4.60
10.00 9.00 8.00 7.00 7.00 7.00 7.00 7.00 6.00 6.60
Teachers: Elementary 42.00 40.50 38.50 36.70 37.50 35.40 36.50 33.00 34.00 34.50 Middle School 20.00 23.50 23.40 25.70 26.30 24.80 25.40 26.10 23.10 22.20 Instrumental Music 1.40 1.40 1.40 1.40 1.30 1.30 1.30 1.50 1.00 1.00 Special Education and Bilingual 18.84 14.50 16.50 13.90 13.90 13.60 12.00 12.00 12.10 15.00 Psychologists 2.00 2.00 1.00 1.00 1.00 2.00 2.00 2.00 2.00 1.00 Social Workers and Counselors 4.50 4.50 3.50 3.50 3.30 3.30 3.30 3.30 3.00 3.50 Learning Center 2.00 2.00 2.00 2.00 2.00 2.00 2.00 2.00 2.00 2.00 Summer School 8.00 8.00 9.00 8.00 9.00 9.00 9.00 8.00 14.00 8.00
98.74 96.40 95.30 92.20 94.30 91.40 91.50 87.90 91.20 87.20
Other Supporting Staff: Technology Support Staff 5.00 5.00 5.00 5.00 4.00 4.00 4.00 4.00 3.00 3.00 Learning Center Assistants 3.00 3.00 3.00 3.00 3.00 3.00 3.00 3.00 2.00 3.00 Clerical 10/12 month 8.00 8.00 8.00 11.00 11.00 11.00 11.00 10.00 10.00 10.00 Teacher Assistants 17.00 17.50 14.20 12.70 10.70 10.00 10.00 12.00 12.00 8.00 Tutors 5.00 6.50 6.50 6.50 7.00 7.00 7.00 8.00 8.00 8.00 Maintenance, Custodians, and Warehouse 5.00 5.00 5.00 5.00 5.00 5.00 5.00 6.00 5.00 5.00 Cafeteria Staff/Payroll Staff/Miscellaneous 20.00 20.00 20.00 16.00 17.00 17.00 17.00 17.00 16.00 13.00 Nurses 2.20 2.20 2.20 2.20 2.20 2.20 2.20 2.50 2.50 2.50
65.20 67.20 63.90 61.40 59.90 59.20 59.20 62.50 58.50 52.50
Total Staff 173.94 172.60 167.20 160.60 161.20 157.60 157.70 157.40 155.70 146.30
Source: District Records
SKOKIE SCHOOL DISTRICT 73-1/2
NUMBER OF EMPLOYEES BY TYPELAST TEN FISCAL YEARS
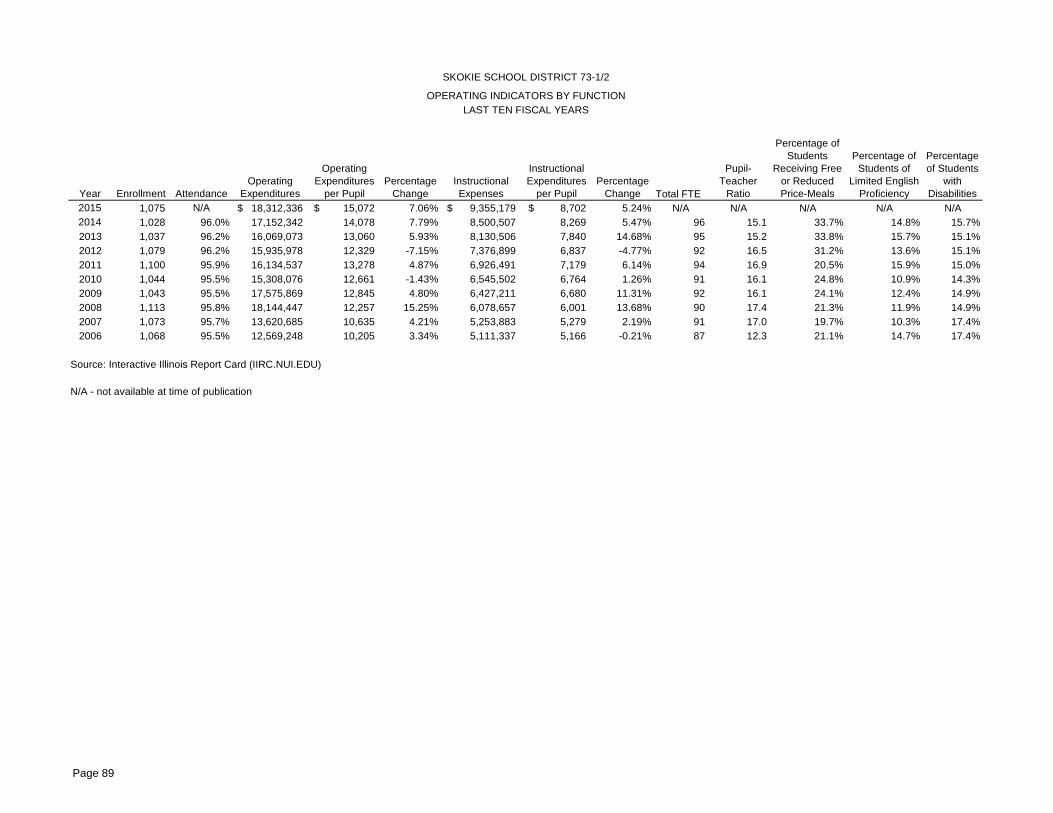
Page 89
Year Enrollment AttendanceOperating
Expenditures
Operating Expenditures
per PupilPercentage
ChangeInstructional Expenses
Instructional Expenditures
per PupilPercentage
Change Total FTE
Pupil-Teacher
Ratio
Percentage of Students
Receiving Free or Reduced Price-Meals
Percentage of Students of
Limited English Proficiency
Percentage of Students
with Disabilities
2015 1,075 N/A 18,312,336$ 15,072$ 7.06% 9,355,179$ 8,702$ 5.24% N/A N/A N/A N/A N/A2014 1,028 96.0% 17,152,342 14,078 7.79% 8,500,507 8,269 5.47% 96 15.1 33.7% 14.8% 15.7%2013 1,037 96.2% 16,069,073 13,060 5.93% 8,130,506 7,840 14.68% 95 15.2 33.8% 15.7% 15.1%2012 1,079 96.2% 15,935,978 12,329 -7.15% 7,376,899 6,837 -4.77% 92 16.5 31.2% 13.6% 15.1%2011 1,100 95.9% 16,134,537 13,278 4.87% 6,926,491 7,179 6.14% 94 16.9 20.5% 15.9% 15.0%2010 1,044 95.5% 15,308,076 12,661 -1.43% 6,545,502 6,764 1.26% 91 16.1 24.8% 10.9% 14.3%2009 1,043 95.5% 17,575,869 12,845 4.80% 6,427,211 6,680 11.31% 92 16.1 24.1% 12.4% 14.9%2008 1,113 95.8% 18,144,447 12,257 15.25% 6,078,657 6,001 13.68% 90 17.4 21.3% 11.9% 14.9%2007 1,073 95.7% 13,620,685 10,635 4.21% 5,253,883 5,279 2.19% 91 17.0 19.7% 10.3% 17.4%2006 1,068 95.5% 12,569,248 10,205 3.34% 5,111,337 5,166 -0.21% 87 12.3 21.1% 14.7% 17.4%
Source: Interactive Illinois Report Card (IIRC.NUI.EDU)
N/A - not available at time of publication
SKOKIE SCHOOL DISTRICT 73-1/2
LAST TEN FISCAL YEARSOPERATING INDICATORS BY FUNCTION
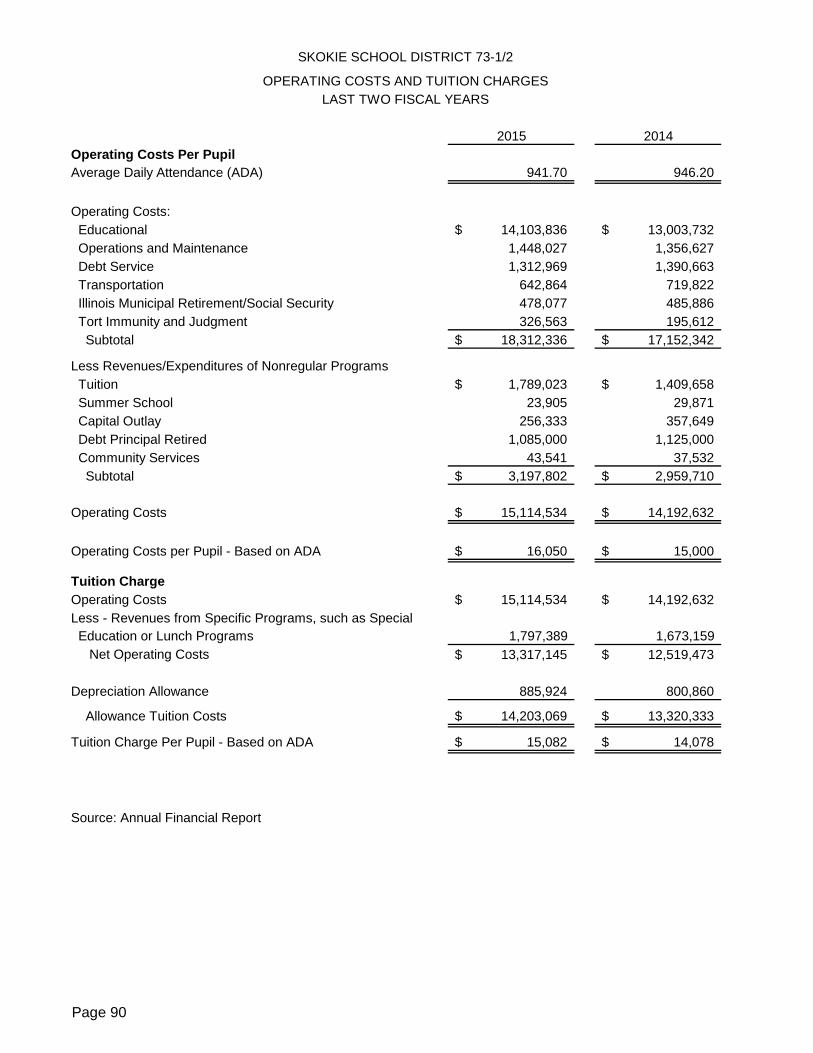
Page 90
2015 2014Operating Costs Per PupilAverage Daily Attendance (ADA) 941.70 946.20
Operating Costs: Educational 14,103,836$ 13,003,732$ Operations and Maintenance 1,448,027 1,356,627 Debt Service 1,312,969 1,390,663 Transportation 642,864 719,822 Illinois Municipal Retirement/Social Security 478,077 485,886 Tort Immunity and Judgment 326,563 195,612 Subtotal 18,312,336$ 17,152,342$
Less Revenues/Expenditures of Nonregular Programs Tuition 1,789,023$ 1,409,658$ Summer School 23,905 29,871 Capital Outlay 256,333 357,649 Debt Principal Retired 1,085,000 1,125,000 Community Services 43,541 37,532 Subtotal 3,197,802$ 2,959,710$
Operating Costs 15,114,534$ 14,192,632$
Operating Costs per Pupil - Based on ADA 16,050$ 15,000$
Tuition ChargeOperating Costs 15,114,534$ 14,192,632$ Less - Revenues from Specific Programs, such as Special Education or Lunch Programs 1,797,389 1,673,159 Net Operating Costs 13,317,145$ 12,519,473$
Depreciation Allowance 885,924 800,860
Allowance Tuition Costs 14,203,069$ 13,320,333$
Tuition Charge Per Pupil - Based on ADA 15,082$ 14,078$
Source: Annual Financial Report
SKOKIE SCHOOL DISTRICT 73-1/2
OPERATING COSTS AND TUITION CHARGESLAST TWO FISCAL YEARS


