Embed Size (px)
Citation preview
Evolution of Information, Communication and Computing Systems (EICCS)
https://publisher.uthm.edu.my/bookseries/index.php/eiccs
*Corresponding author: [email protected]
2020 UTHM Publisher. All rights reserved.
Smart Energy Meter Controller Application
Danial Md Nor1*, Jiha Mulhama Namazi1, Adila Firdaus Arbain2, and Ruzairi
Abdul Rahim2 1Faculty of Electrical and Electronic Engineering,
Universiti Tun Hussein Onn Malaysia, Parit Raja, 86400, MALAYSIA
2Faculty of Engineering,
Universiti Teknologi Malaysia, Johor Bahru, 81310, MALAYSIA
1. Introduction
Electricity is important in everyday life. Every house and building consume electricity. An electricity
meter is a tool that measures the energy consumed by a residence, business or an electrically powered
device. At the moment, majority of the residences in Malaysia for example use the old electro-
mechanical watt meters and the new electronic watt meter where the readings are not automated.
Normally, the consumer will pay the bill at the end of the month, they have to wait for the electricity bill
for every month. A staff from TNB will stopover each house to get the meter reading and give out the
bill to consumer.
Smart Energy Meter have improve our current energy meter reading system. By using this proposes
system, a user able to get an update immediately without having to wait at the end of the month. Many
innovations have been produced and used to measure electricity used. Currently, TNB facing a problem
which the cost for electricity higher after implemented the system [1]. This project might solve TNB
problem since this system propose a real time monitoring of electricity consume. It has become a trend
to integrate automatic systems via wireless applications over network. There is a need for a system that
can remotely monitor an electricity meter read by using a wireless system without a worker going to
the residence.
The technology used for this project is the Internet of Thing (IoT) where everything is connected.
This connection via the internet allows communication from wherever and whenever that includes
smartphone, tablets, and almost anything that have sensors for collect and exchanging data [2][3]. IoT
can be used by anyone which includes business entity, governments and consumers and until now IoT
have been used widely [4]. For this proposes project, we use IoT technology which to collect data from
sensor and send it to IoT platform so it can be monitor through any devices available.
Chapter 6: Smart Energy Meter Controller Application
Page | 47
2. Design of Smart Energy Meter Controller Application
Smart meter is pretty common in many developed countries. The Malaysian government is starting
to implement this system for consumers. The smart energy is implemented in Malacca because the state
government has an initiative of transforming Malacca into a green technology state [5]. TNB is the first
company in Malaysia that applies smart meter to consumers. Smart metering that was implemented by
TNB has only a few features which users can only monitor total energy usage per month [6]. For this
project, we try to improve on the existing smart meters. This prototype project is important because the
system can monitor and control each appliances electricity usage. The user can monitor and control
thus contributing to improvement in household. This project consists of a combination of software and
hardware parts. An Arduino Software (IDE) is used for developing and programming for Microcontroller.
The hardware part consists of Current sensors, Solid state relays, Analog multiplexer and NodeMCU
ESP8266 microcontroller. ThingSpeak are an IoT platform that used to send real time reading of energy
usage from the microcontroller.
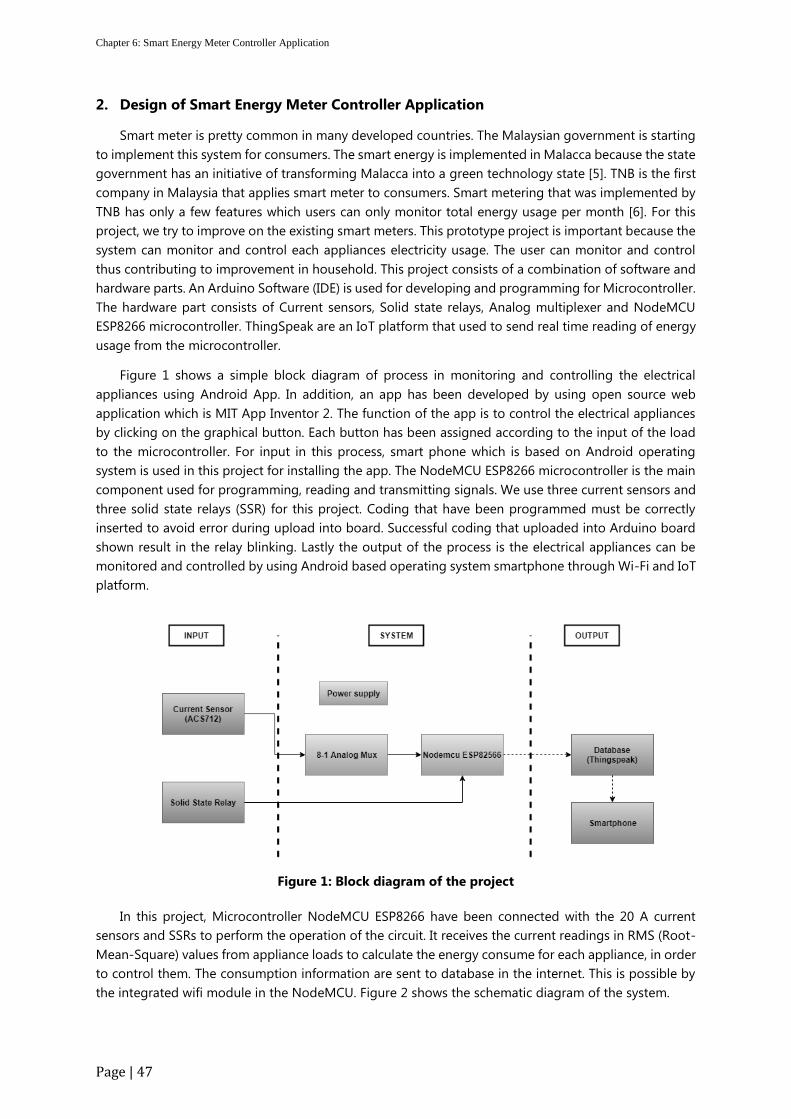
Figure 1 shows a simple block diagram of process in monitoring and controlling the electrical
appliances using Android App. In addition, an app has been developed by using open source web
application which is MIT App Inventor 2. The function of the app is to control the electrical appliances
by clicking on the graphical button. Each button has been assigned according to the input of the load
to the microcontroller. For input in this process, smart phone which is based on Android operating
system is used in this project for installing the app. The NodeMCU ESP8266 microcontroller is the main
component used for programming, reading and transmitting signals. We use three current sensors and
three solid state relays (SSR) for this project. Coding that have been programmed must be correctly
inserted to avoid error during upload into board. Successful coding that uploaded into Arduino board
shown result in the relay blinking. Lastly the output of the process is the electrical appliances can be
monitored and controlled by using Android based operating system smartphone through Wi-Fi and IoT
platform.
Figure 1: Block diagram of the project
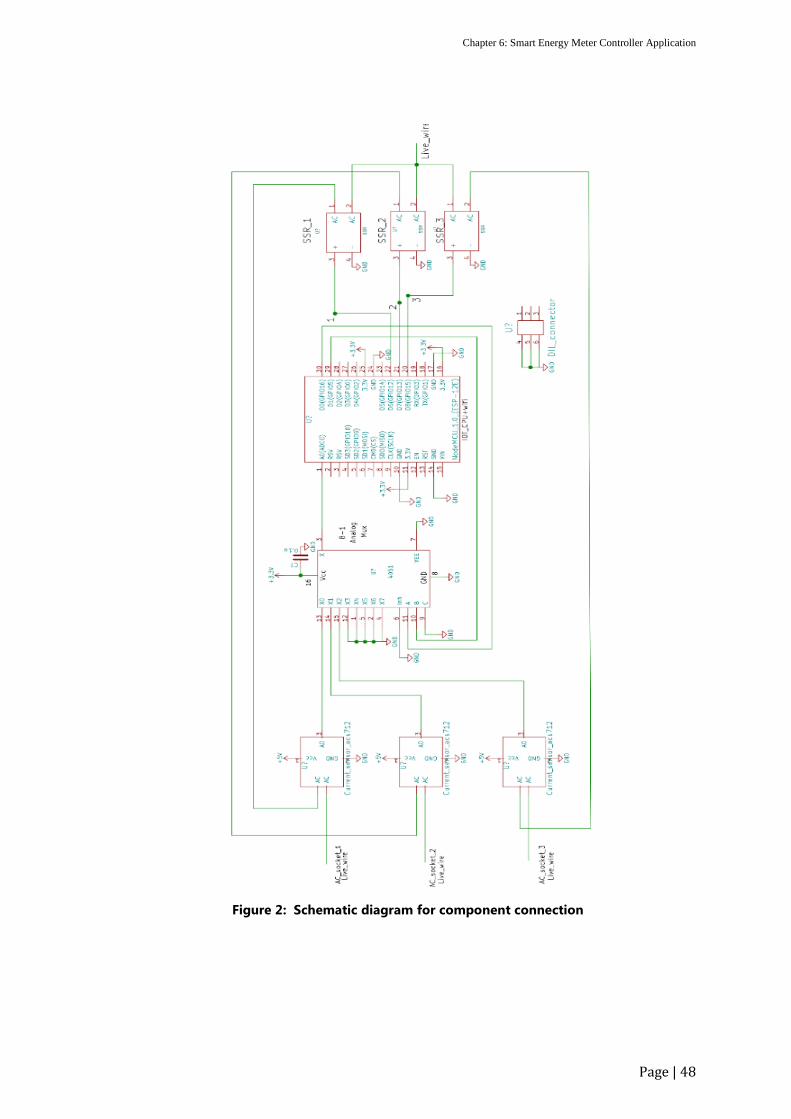
In this project, Microcontroller NodeMCU ESP8266 have been connected with the 20 A current
sensors and SSRs to perform the operation of the circuit. It receives the current readings in RMS (Root-
Mean-Square) values from appliance loads to calculate the energy consume for each appliance, in order
to control them. The consumption information are sent to database in the internet. This is possible by
the integrated wifi module in the NodeMCU. Figure 2 shows the schematic diagram of the system.
Chapter 6: Smart Energy Meter Controller Application
Page | 48
Figure 2: Schematic diagram for component connection
Chapter 6: Smart Energy Meter Controller Application
Page | 49
This project aims to monitor and control each load. For monitoring, we measure current using the
20A current sensors (ACS712) which is connected to the live AC wire from the socket, each current
sensor is connected to different load to measure different type of load. The sensors are connected to
the 8-input analog multiplexer 4051 because NodeMCU has only one analog input to the integrated
Analog-to-Digital converter (ADC). The appliances to be monitored are connected to a three-gang
electrical socket wired. The Neutral and Earth ground wires are connected in parallel to each socket
which are then connected directly to the wall AC plug [7][8]. The only exception is the Live wire which
goes into the socket unconnected, but directly connected to each pin of the three SSRs (Solid-State-
Relay). The other pin from each SSR is connected to one of each sensor AC pin.
There is only 1 analog input to the on-cip ADC which has a resolution of 10 bits. The ADC is of the
SAR (Successive Approximation Register) type. This 1-pin ADC input has multi-function capability used
for reading power supply voltage, RF calibration, and an external source which is the only one of interest
in this project. The input voltage range is from 0.0 to 1.0 V. However, from the schematic of the ADC
input in the NodeMCUv3, it is scaled so as to accept input values from 0.0 to 3.3 V. The exact values are
not important as it will be calibrated against a known current consumed as measured by a commercial
ammeter.
The sampling rate of the ADC is not given in the datasheet, we only have to make an educated
guess based on other SAR ADCs, roughly 10 ksps. In the book “Sound & Computing” pg-553 mentioned
the measured maximum ESP8266 ADC sampling rate to be 10.6 khz. The ESP8266 chip has one 32-bit
CPU which has to service the 802.11 software stack that requires attention every 50 ms. For an AC cycle
of 50 Hz or 20 ms, the sampling rate must be at least 100 Hz. Assuming sampling rate of at least 1 ksps
or 1 khz, the lowest and highest sample values can be easily obtained.
The next element is software development. For this, Arduino source codes need to be developed to
upload the code into the microcontroller. We use Arduino IDE software to develop the software for
Smart energy meter monitoring and control. This project is to develop a smart meter which can monitor
and control the electricity. The data collected from the microcontroller are sent to the ThingSpeak
database. The microcontroller connects to the database in the internet cloud through the integrated a
Wi-Fi connection.
The NodeMCU microcontroller with its I/O connection is now an IoT device which sends periodic
display of the calculated power consumption of appliance under test. We need a method to display a
message from the IoT to a client web browser once its IP address is discovered or automatically assigned
by the router. Then the energy calculations in the IoT device been added to the program for the end
result of this project, that is, to read the energy used by an appliance and display it to a web browser.
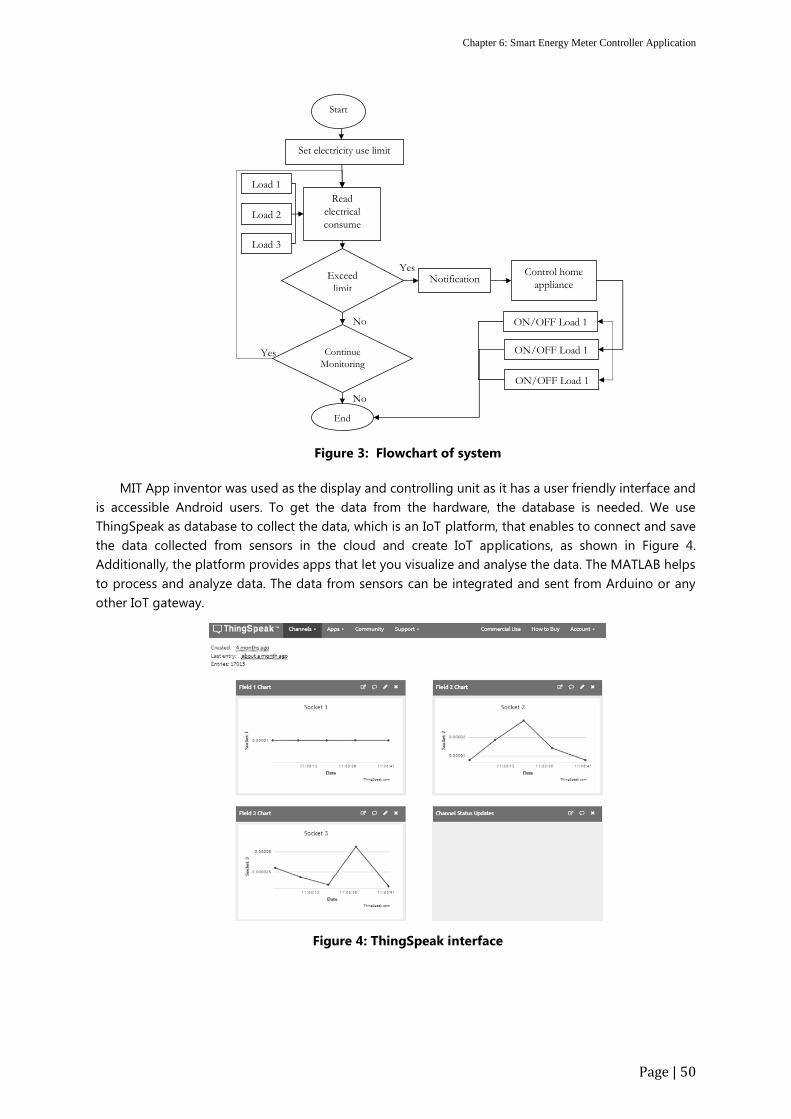
Thus, the overall system flow are shown in Figure 3.
Chapter 6: Smart Energy Meter Controller Application
Page | 50
Figure 3: Flowchart of system
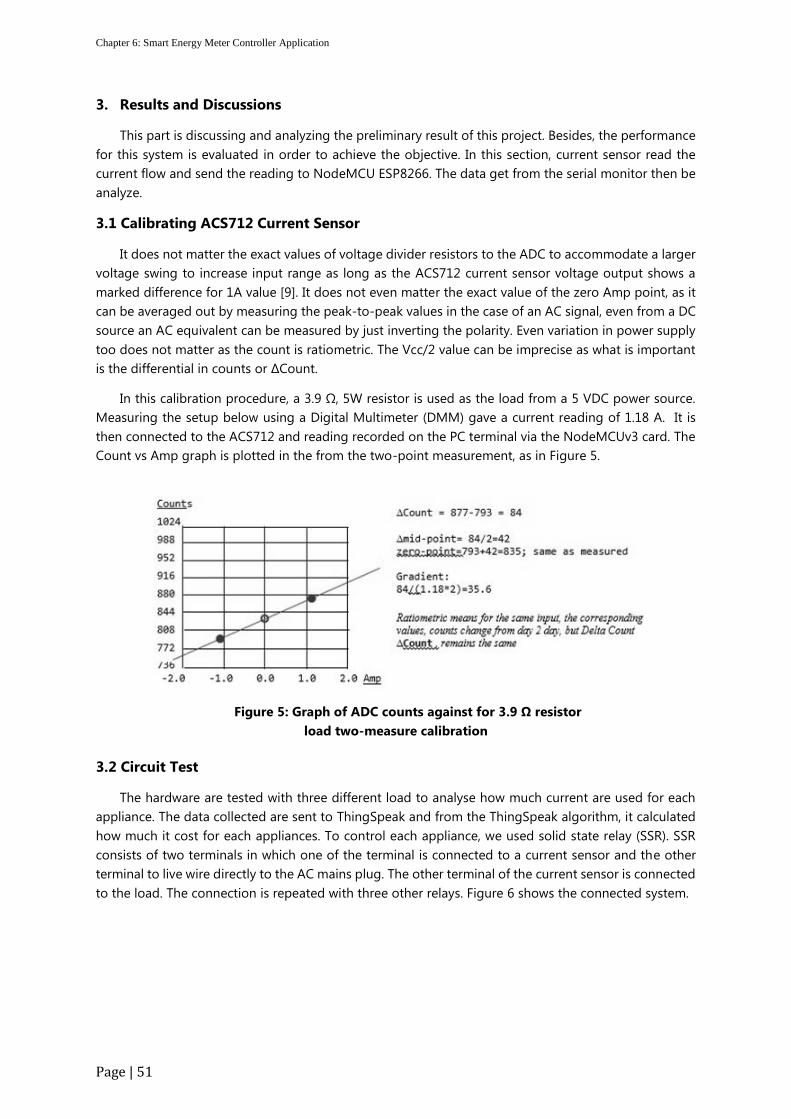
MIT App inventor was used as the display and controlling unit as it has a user friendly interface and
is accessible Android users. To get the data from the hardware, the database is needed. We use
ThingSpeak as database to collect the data, which is an IoT platform, that enables to connect and save
the data collected from sensors in the cloud and create IoT applications, as shown in Figure 4.
Additionally, the platform provides apps that let you visualize and analyse the data. The MATLAB helps
to process and analyze data. The data from sensors can be integrated and sent from Arduino or any
other IoT gateway.
Figure 4: ThingSpeak interface
Start
Set electricity use limit
Load 1
Load 2
Load 3
Read
electrical
consume
Exceed
limit
Yes
No
Notification Control home
appliance
Continue
Monitoring Yes
No
End
ON/OFF Load 1
ON/OFF Load 1
ON/OFF Load 1
Chapter 6: Smart Energy Meter Controller Application
Page | 51
3. Results and Discussions
This part is discussing and analyzing the preliminary result of this project. Besides, the performance
for this system is evaluated in order to achieve the objective. In this section, current sensor read the
current flow and send the reading to NodeMCU ESP8266. The data get from the serial monitor then be
analyze.
3.1 Calibrating ACS712 Current Sensor
It does not matter the exact values of voltage divider resistors to the ADC to accommodate a larger
voltage swing to increase input range as long as the ACS712 current sensor voltage output shows a
marked difference for 1A value [9]. It does not even matter the exact value of the zero Amp point, as it
can be averaged out by measuring the peak-to-peak values in the case of an AC signal, even from a DC
source an AC equivalent can be measured by just inverting the polarity. Even variation in power supply
too does not matter as the count is ratiometric. The Vcc/2 value can be imprecise as what is important
is the differential in counts or ∆Count.
In this calibration procedure, a 3.9 Ω, 5W resistor is used as the load from a 5 VDC power source.
Measuring the setup below using a Digital Multimeter (DMM) gave a current reading of 1.18 A. It is
then connected to the ACS712 and reading recorded on the PC terminal via the NodeMCUv3 card. The
Count vs Amp graph is plotted in the from the two-point measurement, as in Figure 5.
Figure 5: Graph of ADC counts against for 3.9 Ω resistor
load two-measure calibration
3.2 Circuit Test
The hardware are tested with three different load to analyse how much current are used for each
appliance. The data collected are sent to ThingSpeak and from the ThingSpeak algorithm, it calculated
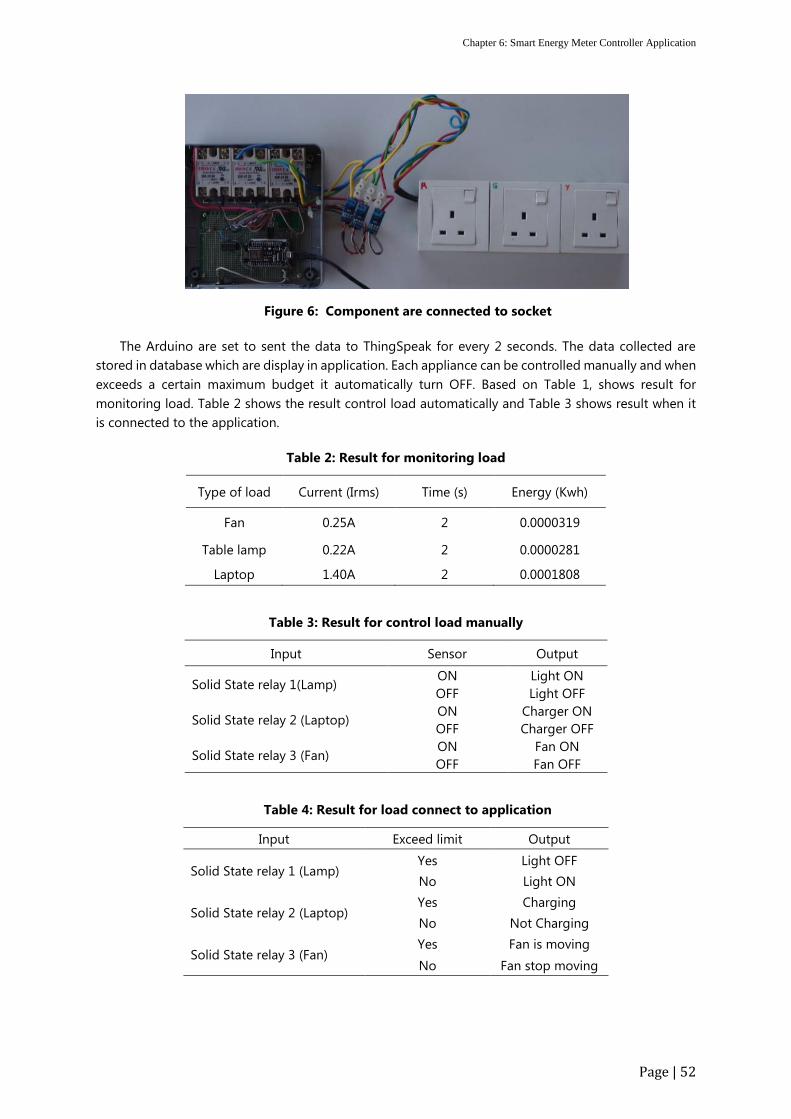
how much it cost for each appliances. To control each appliance, we used solid state relay (SSR). SSR
consists of two terminals in which one of the terminal is connected to a current sensor and the other
terminal to live wire directly to the AC mains plug. The other terminal of the current sensor is connected
to the load. The connection is repeated with three other relays. Figure 6 shows the connected system.
Chapter 6: Smart Energy Meter Controller Application
Page | 52
Figure 6: Component are connected to socket
The Arduino are set to sent the data to ThingSpeak for every 2 seconds. The data collected are
stored in database which are display in application. Each appliance can be controlled manually and when
exceeds a certain maximum budget it automatically turn OFF. Based on Table 1, shows result for
monitoring load. Table 2 shows the result control load automatically and Table 3 shows result when it
is connected to the application.
Table 2: Result for monitoring load
Type of load Current (Irms) Time (s) Energy (Kwh)
Fan 0.25A 2 0.0000319
Table lamp 0.22A 2 0.0000281
Laptop 1.40A 2 0.0001808
Table 3: Result for control load manually
Input Sensor Output
Solid State relay 1(Lamp) ON Light ON
OFF Light OFF
Solid State relay 2 (Laptop) ON Charger ON
OFF Charger OFF
Solid State relay 3 (Fan) ON Fan ON
OFF Fan OFF
Table 4: Result for load connect to application
Input Exceed limit Output
Solid State relay 1 (Lamp) Yes Light OFF
No Light ON
Solid State relay 2 (Laptop) Yes Charging
No Not Charging
Solid State relay 3 (Fan) Yes Fan is moving
No Fan stop moving
Chapter 6: Smart Energy Meter Controller Application
Page | 53
3.3 System Test
After successful socket and circuit testing, the hardware and software parts are combined to build
a smart energy meter control and monitor. To test this prototype, NodeMCU ESP8266 is connected to
a micro USB port for software development on a PC, pluggable to a breadboard with its 30-pin DIL
(Dual-In-Line) header, and can be powered via the same USB port and other power options. Next, use
the Serial Monitor to debug Arduino Software Sketches (programs) or to view data sent by a working
Sketch.
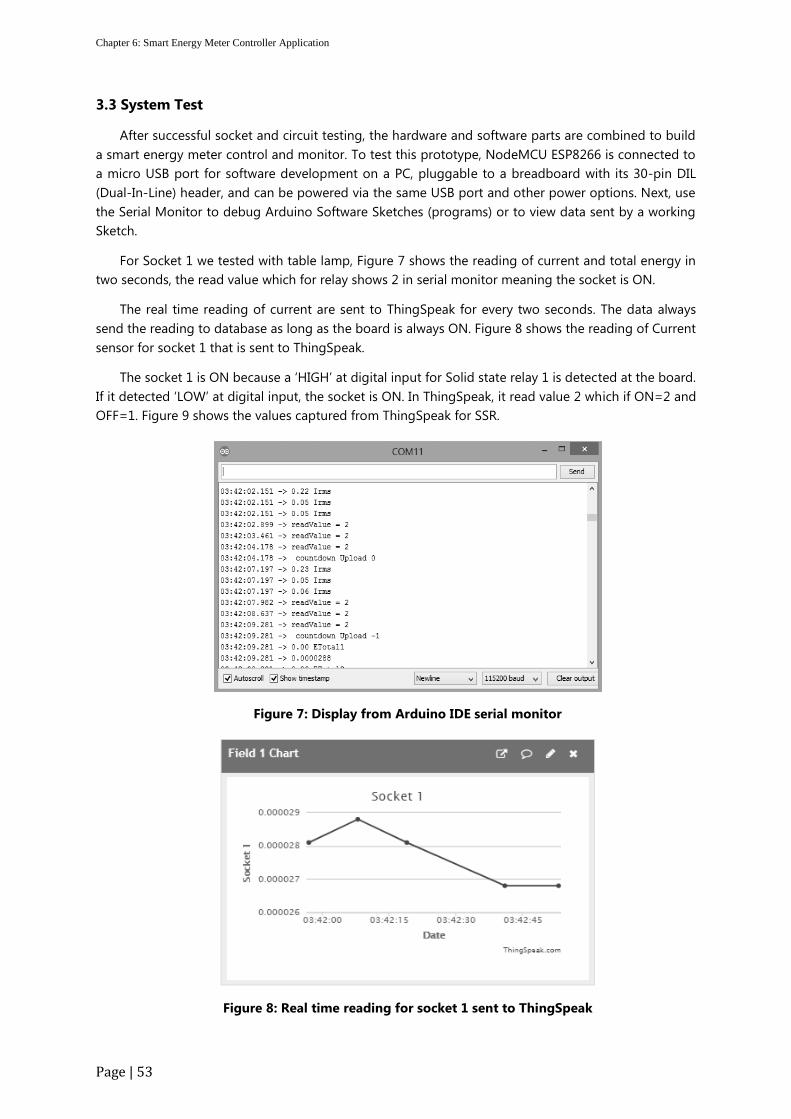
For Socket 1 we tested with table lamp, Figure 7 shows the reading of current and total energy in
two seconds, the read value which for relay shows 2 in serial monitor meaning the socket is ON.
The real time reading of current are sent to ThingSpeak for every two seconds. The data always
send the reading to database as long as the board is always ON. Figure 8 shows the reading of Current
sensor for socket 1 that is sent to ThingSpeak.
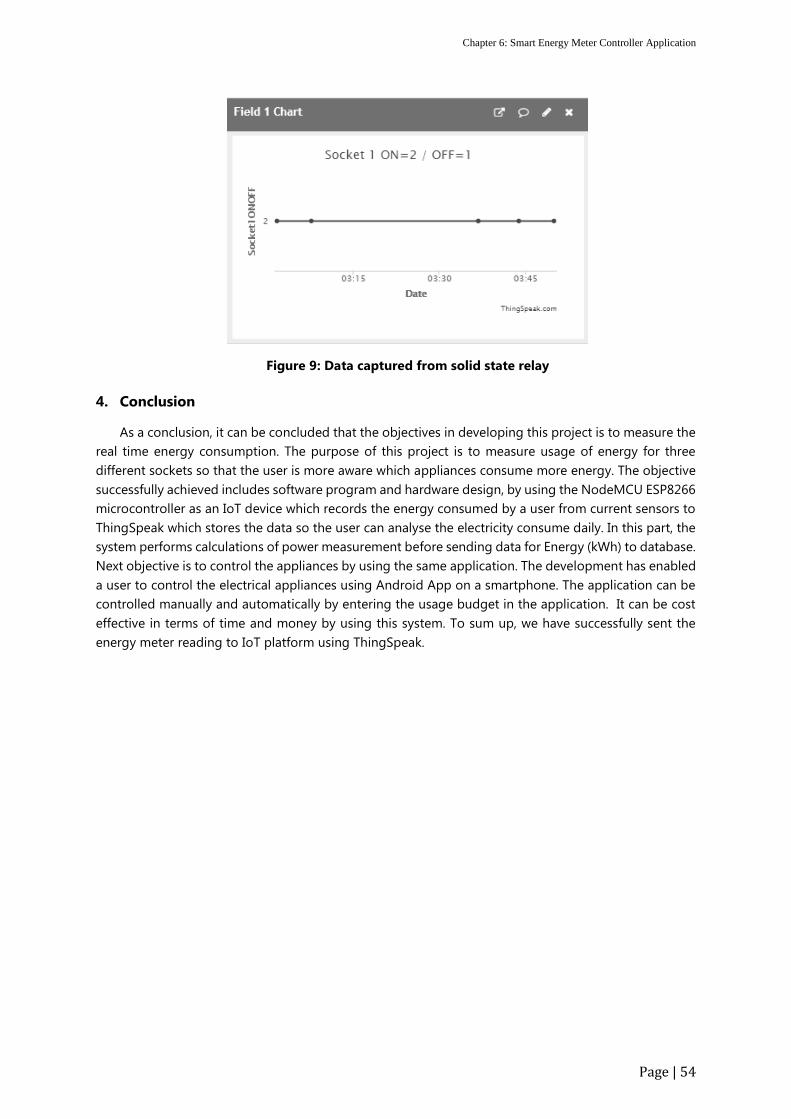
The socket 1 is ON because a ‘HIGH’ at digital input for Solid state relay 1 is detected at the board.
If it detected ‘LOW’ at digital input, the socket is ON. In ThingSpeak, it read value 2 which if ON=2 and
OFF=1. Figure 9 shows the values captured from ThingSpeak for SSR.
Figure 7: Display from Arduino IDE serial monitor
Figure 8: Real time reading for socket 1 sent to ThingSpeak
Chapter 6: Smart Energy Meter Controller Application
Page | 54
Figure 9: Data captured from solid state relay
4. Conclusion
As a conclusion, it can be concluded that the objectives in developing this project is to measure the
real time energy consumption. The purpose of this project is to measure usage of energy for three
different sockets so that the user is more aware which appliances consume more energy. The objective
successfully achieved includes software program and hardware design, by using the NodeMCU ESP8266
microcontroller as an IoT device which records the energy consumed by a user from current sensors to
ThingSpeak which stores the data so the user can analyse the electricity consume daily. In this part, the
system performs calculations of power measurement before sending data for Energy (kWh) to database.
Next objective is to control the appliances by using the same application. The development has enabled
a user to control the electrical appliances using Android App on a smartphone. The application can be
controlled manually and automatically by entering the usage budget in the application. It can be cost
effective in terms of time and money by using this system. To sum up, we have successfully sent the
energy meter reading to IoT platform using ThingSpeak.
Chapter 6: Smart Energy Meter Controller Application
Page | 55
References
[1] Shahidi, S. (2013). Design and implementation of Digital Energy Meter with data sending
capability using GSM network, ICAEE.
[2] Shih-Hsiung Lee, Chu-Sing Yang (2017). An intelligent power monitoring and analysis system for
distributed smart plugs sensor and networks. International Journal of Distributed Sensor
Networks Vol.13 (7).
[3] Amit Kumar Dwivedi, Shimi S.L (2015). Home automation and Energy Management using Android
App. (IJERT). ISSN : 2278-0181.Vol 4 Issue 12.
[4] Poornima S1, Supreeth H.S.G 2 (2016). Power Optimisation of the Devices using IoT with Android
Application. International Journal of Engineering Research & Technology (IJERT) Vol. 5 Issue 05.
[5] Suruhanjaya Tenaga (2014). Towards A World-Class Energy Sector Malaysia. Volume 3 2014
www.st.gov.my
[6] Tenaga Nasional (2018). Pricing and tariffs. Retrieved on 28 May 2019 from
https://www.tnb.com.my/residential/pricing-tariffs
[7] International Electrotechnical Commision (2019). World Plugs, plugs and socket. Retrieved on 28
May 2019 from https://www.iec.ch/worldplugs/typeG.htm
[8] Worldstandars (2018). Power plug and outlet Type G. Retrieved on 28 May 2019 from
https://www.worldstandards.eu/electricity/plugs-and-sockets/g/
[9] Eduardo Martinez (2012). A brief overview of allegro acs712 Current Sensor (part 1). Retrieved
on 28 May 2019 from http://embedded-lab.com/blog/a-brief-overview-of-allegro-acs712-
current-sensor-part-1/


