Embed Size (px)
Citation preview

SOCIAL CAPITAL ON FACEBOOK: BONDING OR
BRIDGING RELATIONSHIPS BETWEEN INDIVIDUALS?
A PRELIMINARY STUDY IN INDONESIA
THESIS
RESEARCH PROJECT
By
Mohit Kanayolal
(1301027132)
08THE
BINUS INTERNATIONAL
BINUS UNIVERSITY
JAKARTA
2013
i

SOCIAL CAPITAL ON FACEBOOK: BONDING OR
BRIDGING RELATIONSHIPS BETWEEN INDIVIDUALS?
A PRELIMINARY STUDY IN INDONESIA
THESIS
Proposed as a requirement for obtaining
Sarjana Degree at
Program Information Systems
Education Level Strata-1 (Sarjana/Bachelor)
By
Mohit Kanayolal 1301027132
BINUS INTERNATIONAL
BINUS UNIVERSITY
JAKARTA
ii

2013 SOCIAL CAPITAL ON FACEBOOK: BONDING OR BRIDGING RELATIONSHIPS BETWEEN INDIVIDUALS?
A PRELIMINARY STUDY IN INDONESIATHESIS
Prepared by:
Mohit Kanayolal
1301027132
Approved by:
Supervisor
Minsani Mariani, MBA
Lecturer code: L 1258
BINUS INTERNATIONAL
BINUS UNIVERSITY
JAKARTA
2013
iii

BINUS INTERNATIONALBINUS UNIVERSITY
Major: Information SystemSarjana Komputer Thesis
Semester Odd year 2013/2014
SOCIAL CAPITAL ON FACEBOOK: BONDING OR BRIDGING RELATIONSHIPS BETWEEN INDIVIDUALS?
A PRELIMINARY STUDY IN INDONESIA
Mohit Kanayolal 1301027132
AbstractObjectives
To find out whether an individual’s intensity of Facebook use play a role in affecting the individual’s perceived social capital and to see whether the individual’s psychological well-being play a role in affecting the type or level of social capital affected.
Method
The research is done quantitatively and the data collection method used is questionnaires. Specifically, the statistical analysis used on the data collected is frequencies, simple linear regression as well as correlation.
Results
The research showed that the intensity of an individual’s Facebook use affects both bridging and bonding social capital although statistically it shows that bridging social capital is more affected. The research also proved that psychological well-being of an individual play a role in affecting the type and level of social capital affected.
Conclusion
Intensity of Facebook use positively and significantly affects an individual’s perceived Bridging and Bonding Social Capital. Also, psychological factors such as life satisfaction and self-esteem used to measure the individual’s psychological well-being significantly affects the type and level of social capital affected through the use of Facebook.
Key Words
Social capital, Social capital on Facebook, Bridging social capital, Bonding Social Capital
iv

ACKNOWLEDGEMENT
Firstly, the author would like to say thank you for the blessings of Almighty God - Who
has given him the strength, believe, courage and power to complete this research.
The author would also like to express his utmost gratitude for several individuals who
have helped him through moral, technical, and all other forms of support to ensure the
completion of this thesis. These individuals consist of:
The author’s beloved parents, Mr. Madan Khiani & Mrs. Roshni Khiani, for
their constant support, love, prayer and motivation for finishing this research.
You both mean everything to me.
Author’s sister, Ekta Khiani for the support and assistance throughout the
process of writing this research.
Author’s girlfriend, Samriti Saluja for the constant motivation, love and
understanding.
Miss Minsani Mariani, for her guidance and supervision towards the completion
of this research
The members of the panel of judges, Ms Nathalia Devina Widjaja, MBusSys,
MPA as well as Mr. Mathias Dharmawirya, B.Eng (Hons), M.Sc., for the
valuable inputs and suggestions.
Author’s cousins/extended family and relatives for their never-ending support.
Author’s close friends; Dinesh Punjabi, Luv Khoobchandani, Aakash Jaswani,
Lakesh Buxani, Chirag Buxani, Priti Samtani, Vinita Mulani, Kirty Buxani,
Ravina Alimchandani, Manisha Ramchandani, Tanira Kukreja, Divya
v

Topandasani, Chirag Pridhnani, and Gita Sangtani for the companion, laughter
and valuable friendship.
Author’s teachers that have taught him a lot throughout high school.
Author’s high school friends for the memorable and crazy moments.
IS 2013 classmates for the friendship and incredible journey over the past 4
years.
All Binus International University lecturers who has taught and guided the
author at one point or another in the times of his study in Binus International.
Binus International Student Committee for the experience, laughter and amazing
journey together.
Binus International University staff including SAR, ISS, Security Personnel’s,
Student Service staff, Library Staff, Academic and Marketing department as
well as all other departments of Binus International.
Fellow respondents who has spared their time to completing the questions.
All other individual who has helped the author in any possible way.
Table of Contents
vi

CHAPTER I......................................................................................................................1
INTRODUCTION.............................................................................................................1
1.1 Background..............................................................................................................1
1.2 Problem Definition..................................................................................................5
1.3 Scope & Limitation..................................................................................................5
1.4 Aims & Benefits......................................................................................................6
1.5 Structures.................................................................................................................7
CHAPTER II...................................................................................................................11
THEORETICAL FOUNDATION..................................................................................11
2.1 Information Technology Theories.........................................................................11
2.1.1 Internet............................................................................................................11
2.1.1.1 Internet as Communication Tool..............................................................12
2.1.1.2 Effects of Internet on Social Capital........................................................13
2.1.2 Computer mediated Communication..............................................................14
2.1.2.1 Computer Mediated Communication on Social Capital...........................15
2.1.3 Social Networking Website............................................................................16
2.1.3.1 Social Networking Website as a Communication Tool...........................18
2.1.4 Facebook.........................................................................................................21
2.1.4.1 Facebook as a communication tool..........................................................23
2.1.4.2 Social Capital on Facebook......................................................................24
2.2 Social Capital Theories..........................................................................................27
2.2.1 Bonding & Bridging Social Capital................................................................27
2.3 Research Theories..................................................................................................29
2.3.1 Data Collection...............................................................................................29
2.3.1.1 Questionnaire............................................................................................29
2.3.2 Data Analysis..................................................................................................32
2.3.2.1 Frequencies...............................................................................................32
2.3.2.2 Reliability Test.........................................................................................33
2.3.2.3 Validity Test.............................................................................................33
2.3.2.4 Inferential Statistics..................................................................................34
2.3.2.4.1 Regression.................................................................................................34
vii

2.3.2.4.2 R-Square & ANOVA Analysis.............................................................36
CHAPTER III..................................................................................................................37
RESEARCH METHODOLOGY....................................................................................37
3.1 Research Objectives...............................................................................................37
3.2 Research Methodology..........................................................................................38
3.3 Research Question.................................................................................................41
3.3 Research Model & Hypothesis..............................................................................42
3.4 Scope.....................................................................................................................45
3.5 Data Collection......................................................................................................46
3.5.1 Questionnaire Design......................................................................................46
3.5.2 Sample Likert Scale Questions.......................................................................47
3.6 Sampling Design....................................................................................................47
3.7 Data Analysis.........................................................................................................48
3.7.1 Validity...........................................................................................................48
3.7.2 Reliability........................................................................................................48
3.7.3 Frequencies.....................................................................................................49
3.7.4 Regression......................................................................................................49
3.7.5 Correlation......................................................................................................49
CHAPTER IV.................................................................................................................50
RESULTS & ANALYSIS...............................................................................................50
4.1 Demographic Frequencies.....................................................................................51
4.1.1 Gender Frequency of Respondents.................................................................51
4.1.2 Age Frequency of Respondents......................................................................52
4.1.3 Last Education Frequency of Respondents.....................................................53
4.1.4 Current Occupation Frequency of Respondents.............................................54
4.1.5 Daily Internet Usage Frequency of Respondents............................................55
4.2 Reliability & Validity Test....................................................................................56
4.2.1 Reliability Test................................................................................................56
4.2.1.1 Intensity....................................................................................................56
4.2.1.2 Self Esteem...............................................................................................57
4.2.1.3 Life Satisfaction.......................................................................................57
viii

4.2.1.4 Bridging Social capital.............................................................................58
4.2.1.5 Bonding Social Capital.............................................................................59
4.2.2 Validity Test....................................................................................................60
4.2.2.1 Intensity........................................................................................................60
4.2.2.2 Self Esteem..................................................................................................60
4.2.2.3 Life Satisfaction...........................................................................................61
4.2.2.4 Bridging Social capital.................................................................................62
4.2.2.5 Bonding Social Capital................................................................................62
4.4 Hypothesis Testing................................................................................................63
4.4.1 Simple Linear Regression...............................................................................63
4.4.2 Moderated Regression Analysis......................................................................66
4.4.3 Correlations.....................................................................................................72
4.4.3.1 Correlation between Intensity and Bonding Social Capital.....................72
4.4.3.2 Correlation between Intensity and Bridging Social Capital.....................72
4.4.4 R2 (Coefficient of Determination) & ANOVA (Analysis of Variance) Analysis....................................................................................................................73
CHAPTER V...................................................................................................................80
DISCUSSION.................................................................................................................80
5.1 Discussion..............................................................................................................80
5.2 Additional Information..........................................................................................88
CHAPTER VI.................................................................................................................93
CONCLUSION & RECOMMENDATION....................................................................93
6.1 Conclusion.............................................................................................................93
6.2 Limitation..............................................................................................................95
6.3 Future Research Recommendations......................................................................96
Bibliography....................................................................................................................97
Appendix.......................................................................................................................101
Appendix 1 - Questionnaire.......................................................................................101
Appendix 2 - Journal.................................................................................................106
Appendix 3 – SPSS Results.......................................................................................146
DEMOGRAPHIC FREQUENCIES......................................................................146
ix

MEASURES OF FACEBOOK USAGE TO MEET NEW PEOPLE & CONNECT WITH EXISTING OFFLINE................................................................................151
VALIDITY TEST RESULT..................................................................................156
RELIABILITY TEST............................................................................................159
REGRESSION.......................................................................................................164
CORRELATION...................................................................................................170
Appendix 4 – CV.......................................................................................................171
x

List of Figures
Figure 1. 1 - List of Continents on Facebook....................................................................2
Figure 1. 2 - List of Countries on Facebook......................................................................3
Figure 1. 3 - Statistics of Facebook use in Indonesia........................................................4
Figure 1. 4 - List of Cities on Facebook............................................................................3
Figure 2. 1 - Facebook Homepage..................................................................................21
Figure 3. 1 - Model / Framework Used in Original Study..............................................39
Figure 3. 2 - Model / Framework used in this Research.................................................42
Figure 4. 1 - Gender Frequency of Respondents.............................................................51
Figure 4. 2 - Age Frequency of Respondents..................................................................52
Figure 4. 3 - Last Education Frequency of Respondents................................................53
Figure 4. 4 - Current Occupation Frequency of Respondents.........................................54
Figure 4. 5 - Daily Internet Usage Frequency of Respondents.......................................55
Figure 4. 6 - Submodel Hypothesis 1..............................................................................63
Figure 4. 7 - Submodel Hypothesis 2..............................................................................64
Figure 4. 8 - Submodel Hypothesis 3a............................................................................66
Figure 4. 9 - Submodel Hypothesis 3b............................................................................67
Figure 4. 10 - Submodel Hypothesis 4a..........................................................................69
Figure 4. 11 - Submodel Hypothesis 4b..........................................................................70
Figure 5. 1 - I have used Facebook to check out someone I met socially.......................88
Figure 5. 2 - I use Facebook to learn more about other people in my class / workplace 89
Figure 5. 3 - I use Facebook to learn more about other people living near me...............90
Figure 5. 4 - I use Facebook to keep in touch with my old friends.................................91
Figure 5. 5 - I use Facebook to meet new people............................................................92
xi

List of Tables
Table 4. 1 - Gender Frequency of Respondents..............................................................51
Table 4. 2 - Age Frequency of Respondents...................................................................52
Table 4. 3 - Last Education Frequency of Respondents..................................................53
Table 4. 4 - Current Occupation Frequency of Respondents..........................................54
Table 4. 5 - Daily Internet Usage Frequency of Respondents.........................................55
Table 4. 6 - Reliability Test (Case Processing Summary - Intensity).............................56
Table 4. 7 - Cronbach's Alpha (Intensity).......................................................................56
Table 4. 8 - Reliability Test (Case Processing Summary - Self-Esteem)........................57
Table 4. 9 - Cronbach's Alpha (Self-Esteem)..................................................................57
Table 4. 10 - Reliability Test (Case Processing Summary - Life Satisfaction)...............57
Table 4. 11 - Cronbach's Alpha (Life Satisfaction).........................................................58
Table 4. 12 - Reliability Test (Case Processing Summary - Bridging Social Capital). . .58
Table 4. 13 - Cronbach's Alpha (Bridging Social Capital).............................................58
Table 4. 14 - Reliability Test (Case Processing Summary - Bonding Social Capital)....59
Table 4. 15 - Cronbach's Alpha (Bonding Social Capital)..............................................59
Table 4. 16 - Validity Test (Intensity).............................................................................60
Table 4. 17 - Validity Test (Self-Esteem).......................................................................60
Table 4. 18 - Validity Test (Life Satisfaction)................................................................61
Table 4. 19 - Validity Test (Bridging Social Capital).....................................................62
Table 4. 20 - Validity Test (Bonding Social Capital)......................................................63
Table 4. 21- Hypothesis 1 Variables...............................................................................63
Table 4. 22 - Hypothesis 1 Regression............................................................................63
Table 4. 23 - Table 4. 22 - Hypothesis 1 Regression......................................................64
Table 4. 24 - Hypothesis 2 Regression............................................................................65
Table 4. 25- Hypothesis 3a Variables.............................................................................66
Table 4. 26 - Hypothesis 3a Regression..........................................................................66
Table 4. 27 - Hypothesis 3b Variables............................................................................67
Table 4. 28 - Hypothesis 3b Regression..........................................................................68
xii
Table 4. 29 - Hypothesis 4a Variables............................................................................69
Table 4. 30 - Hypothesis 4a Regression..........................................................................69
Table 4. 31 - Hypothesis 4b Variables............................................................................70
Table 4. 32 - Hypothesis 4b Regression..........................................................................71
Table 4. 33 - Hypothesis 1 Correlation...........................................................................72
Table 4. 34 - Hypothesis 2 Correlation...........................................................................72
Table 4. 35 - R-Square Analysis Hypothesis..................................................................74
Table 4. 36 - ANOVA Analysis Hypothesis 1................................................................74
Table 4. 37 - R-Square Analysis Hypothesis 2...............................................................75
Table 4. 38 - ANOVA Analysis Hypothesis 2................................................................75
Table 4. 39 - R-Square Analysis Hypothesis 3a..............................................................76
Table 4. 40 - ANOVA Analysis Hypothesis 2................................................................76
Table 4. 41 - R-Square Analysis Hypothesis 3b.............................................................77
Table 4. 42 - ANOVA Analysis Hypothesis 3b..............................................................77
Table 4. 43 - R-Square Analysis Hypothesis 4a..............................................................78
Table 4. 44 - ANOVA Analysis Hypothesis 4a..............................................................78
Table 4. 45 - R-Square Analysis Hypothesis 4b.............................................................79
Table 4. 46 - ANOVA Analysis Hypothesis 4b..............................................................79
Table 5. 1 - Summary of SPSS Analysis.........................................................................81
Table 5. 2 - Summary of Hypothesis Result 2................................................................82
Table 5. 3 - Summary of Hypothesis Result 3................................................................85
Table 5. 4 - I have used Facebook to check out someone I met socially........................88
Table 5. 5 - I use Facebook to learn more about other people in my class / workplace. 89
Table 5. 6 - I use Facebook to learn more about other people living near me................90
Table 5. 7 - I use Facebook to keep in touch with my old friends..................................91
Table 5. 8 - I use Facebook to meet new people.............................................................92
xiii

CHAPTER I
INTRODUCTION1.1 Background
Social networking sites have changed the way people communicate all around
the world. It has made it easier for people to maintain ongoing relationships with
friends, family, colleagues, etc. As well as create new relationships with people
in the same community or even a total stranger who lives half the world away.
Theoretically, Social network sites (SNSs) can be defined as “a web-based
services that allow individuals to (1) construct a public or semi-public profile
within a bounded system, (2) articulate a list of other users with whom they
share a connection, and (3) view and traverse their list of connections and those
made by others within the system” (Boyd & Ellison, Social Network Sites:
Definition, History, and Scholarship, 2007). Social networking sites or SNS has
been the way for people around the world to meet new people or get to know
more about people that they have met offline. The first SNS was launched in
1997 and currently there are hundreds of SNSs across the globe, supporting a
spectrum of practices, interests and users (Boyd & Ellison, Social Network
Sites: Definition, History, and Scholarship, 2007). From all the social
networking sites available, there are only a few that has attracted quite a number
of people around the world. There is one social networking site in particular that
1

has gained an enormous level of popularity over the past few years and is
currently used by over a hundred million users around the world, Facebook.
Facebook is a social networking website or service launched in February 2004.
It was owned and operated by Facebook, Inc. and was founded by Mark
Zuckerberg with his college roommates who were also Harvard
University students Eduardo Saverin, Andrew McCollum, Dustin
Moskovitz and Chris Hughes. The website initially only catered to Harvard
students which was agreed upon by the founders, but it was expanded to
gradually most universities in Canada and the United States, corporations, and by
September 2006, the website was open to everyone of age 13 and older with a
valid email address (Wikipedia Corporation, 2013).
Below is the latest statistics of the distribution of Facebook users provided by
Socialbakers.com:
Figure 1. 1 - List of Continents on Facebook
Source : http://www.socialbakers.com/countries/continents/
2

Figure 1. 2 - List of Countries on FacebookSource:http://www.socialbakers.com/facebook-statistics/?interval=last-
week#chart-intervals
From the statistics provided above, it is clear that Asia is at the top of the list of
‘Continents on Facebook’ with over 260 million users. This is a very big number
considering only 6.61% of Asia’s population uses Facebook. Also, as previously
stated, Indonesia is currently on 4th position in the list of countries with the
highest number of Facebook users.
Figure 1. 3 - List of Cities on FacebookSource: http://www.socialbakers.com/facebook-statistics/cities/
3

Jakarta is currently the city with the 2nd highest Facebook users in the world with
Bangkok on top of the list followed by London on the 3 rd position and Mumbai
and Seoul placed on the 4th and 5th position respectively.
Figure above shows that
even with just below 20% of
Indonesia’s population uses
Facebook; it is still able to
reach just a little over 47
million users.
Figure 1. 4 - Statistics of Facebook use in Indonesia
Source: http://www.checkfacebook.com/
With the facts, figures, and examples provided above; it is clear that Facebook
has affected the lives of a lot of people in Indonesia esp. Jakarta; as well as
people around the world in many different aspects. One of the biggest aspects
that have been affected by Facebook is how people maintain their social capital.
4

Social Capital is a broad term and can be defined in many ways which will be
further explained in the next chapter of this research. In short, social capital can
be defined as “the actual or potential resources which are linked to a durable
network of more or less institutionalized relationships of mutual acquaintance or
recognition” (Bourdieu, 1985). It is the benefit derived from one's position in a
social network, the number and character of the ties one maintains, and the
resources those ties themselves possess (Wellman & Wortley, 1990). There are
2 types of social capital; bonding and bridging which will also be further
explained later in this chapter as well in the next chapter.
1.2 Problem Definition
The primary objective of this research is to establish which type of social
capital, bonding or bridging, is this computer mediated communication (CMC)
through Facebook; is able to enhance or supplement. In other words this
research is conducted to find out what kind of social capital will an individual be
able to build through Facebook; will they be more able to bond their stronger
ties or bridge their weaker ties through this particular social networking
phenomenon; Facebook.
1.3 Scope & Limitation
In this research, the researcher will focus on the social capital aspect of
Facebook in Indonesia and how Facebook has affected the way people socialize.
5

This research will establish which type of social capital can be built through
Facebook.
As a unit of analysis, this research will only be targeted towards Facebook users
in Indonesia. Having said this, in order to conduct this research, information will
be gathered by giving out questionnaires which are carefully planned and
designed to Facebook users who reside in Indonesia. The data collected from
these questionnaires will be deeply analyzed in order to produce useful
information. The information produced from the analyzing process will enable
the researcher to draw a conclusion at the end of this research. The questionnaire
developed by the researcher will be given out to 200 Facebook users. The
researcher decided to only give out 200 questionnaires due to the limited time
available to conduct this study.
1.4 Aims & Benefits
The aims of writing this thesis are:
To aid future researchers in knowing which type of social capital relationship
(bonding or bridging) can be affected through Facebook.
To measure the impact of Facebook towards bonding and bridging social capital
relationships.
The benefits of writing this thesis are:
Provide useful data that will be useful for future reference regarding the impact
of Facebook towards an individual.
6

This research will benefit any other researcher who would like the knowledge
regarding this topic or even conduct further research due to the limitations of
this research.
This research will also benefit anyone who would like to maintain a healthy
social capital; using this research, they will know who they will be able to reach
and maintain stable relationship with through Facebook and who they have to
maintain face-to-face (F2F) relationship with.
This research might also be usable for people who would like to promote
themselves through Facebook; using this research they will be able to learn who
will respond positively to them and who won’t.
To complete my credits at Binus University and graduate. This research or thesis
is the last mandatory course I have to complete before being able to graduate
from Binus International University after 4 years of studying here.
1.5 Structures
Chapter 1 – Introduction
This chapter discusses the general idea of this thesis. This chapter covers:
The background of the research.
Problem definition.
The scope & Limitation.
Aim & benefits of this research.
The structure of the thesis.
7
Chapter 2 – Theoretical Foundation / Literature Review
This chapter will explain all the theories and frameworks or models which
are going to be used to support the design of solution for the problem.
The summarized version of the relevant theories will be
comprehensively presented. These supporting theories can be referenced
from the researches that have been conducted in the field of this research
or from textbook and a number of other sources.
Based on the relevant theories discussed in the previous section of this
chapter, a model or formula which presents the relationships between the
different variables will be developed. This model or formula will provide
a way to find the solution to the problem which was defined in the
previous chapter.
Chapter 3 – Research Methodology
In this chapter, the researcher will elaborate the focus of this research
further; this chapter will present:
Research Objective
o Presenting the research question(s)
o Hypotheses
o Research scope or boundaries
8

o Research design
o Data collection method
o Sampling plan
Data analysis method
Chapter 4 – Research Findings
This chapter will present the statistical analysis performed on the data
collected in order to extract valuable information and provide possible
solution to the research problem. This chapter will then discuss the
results of the findings as well as the information that can be extracted
from it. Tables and figures will be used by the researcher in order to
explain the research result.
Chapter 5 – Discussion
This chapter of the research will discuss the results obtained from the
statistical analysis which was conducted in the previous chapter of the
research.
Chapter 6 – Conclusion & Recommendation
This last chapter of the research contains the conclusion of the overall
result of the research where the most important findings are summarized
and explained.
9

The second section of this chapter will contain suggestion and
recommendation for future researchers who wants to do research on the
same or similar topic.
This chapter will also discuss the research questions which were able to
be answered through the study as well as the limitations of the current
study.
10

CHAPTER II
THEORETICAL FOUNDATION
2.1 Information Technology Theories
Here are some theories related to information technology that can be related to
the topic of this research.
2.1.1 Internet
The term internet which actually stands for inter-networking can be
defined as a global network that connects computers around the world
using a backbone network that supports interchange of vast amount of
data and information at high speed and covering long distances. The data
or information carried by the internet can be in various formats such as
e-mails, online chats or instant messages, file transfer or file sharing,
online gaming as well as hypertext documents. These data or
information which is interchanged through the internet uses one
standardized Internet Protocol Suite or usually recognized as TCP/IP.
According to Turban, Rainer & Potter (2003, p.201), the internet actually
began in the year 1969 as a network called ARPANET. When
ARPANET was first developed, its primary objective was to allow
researchers to exchange information and share computing resources
regardless of the location while at the same time creating a resilient wide
11

area network to improve communication for the military. During the
early stages of the ARPANET, very few people had access to it. Only the
military, defense contractors and universities doing research on military
and defense had access to it. By the 1980’s two more networks were
founded, they were Computer Science Network (CSNET) and BITNET.
The 3 networks mentioned above; ARPANET, CSNET & BITNET are
the foundation of the internet today.
2.1.1.1 Internet as Communication Tool
If we look at the characteristics of the internet, we are going to
find that the internet is, in many ways, similar to earlier media for
communication such as letter writing, telephone, telegraphs, etc.
“Certain capacities and uses of Internet communication uniquely
shape a user’s perceptions and interactions. These influences
extend beyond the interpersonal to the social and cultural;
outcomes of these communication processes have the potential to
shift sense- making practices at the cultural level. Essentially, the
Internet mediates– and in some ways moderates – interactions
and the possible outcomes of these interactions at the dyadic,
group, and cultural level” (MARKHAM, 2003)
12

2.1.1.2 Effects of Internet on Social Capital
There are a number of ways the internet affects social capital:
1. The internet transforms social capital – The internet has
created a cheap and convenient way of communicating with
people who share the same interest. The benefits that are
brought about by the internet may lead to a major
transformation from a local and group-based community to a
dispersed and interest-based community. This affect will
reduce the level of social contact and civic involvement
between people in a community.
2. The internet demolishes social capital – “The Internet through
its entertainment and information capabilities draws people
away from family and friends. Further, by facilitating global
communication and involvement, it reduces interest in the
local community and its politics” (Nie, Erbring, & D, 2002)
3. The internet supplements social capital – The internet may act
as an additional means of communication that people can use
to maintain existing social relationships as well as civic
engagements. The role of the internet is to provide an
additional electronic means of communication on top of face-
to-face and telephonic means of communication. The internet
13

also provides means for people to share their hobbies and
political interests. This suggests that the internet supplements
social contact and civic involvement by providing additional
means of communication which is termed as Computer
Mediated Communication or CMC (Wellman, Quan-Haase,
Witte, & Hampton, 2001)
2.1.2 Computer mediated Communication
John December from the University of Indiana (1996) defined Computer
Mediated Communication as “the process by which people create,
exchange, and perceive information using networked
telecommunications systems that facilitate encoding, transmitting, and
decoding messages” (December, Units of analysis for Internet
communication, 1996). The next year, he again defined CMC as
Computer-Mediated Communication is a process of human
communication via computers, involving people, situated in
particular contexts, engaging in processes to shape media for a variety
of purposes (December, The World Wide Web Unleashed 1997, 1997)
Computer mediated communication is; as the term suggests, a means to
communicate to other individuals from anywhere around the world using
computer as the media/medium of communication. During the early
stages of CMC, many researchers have mentioned that building
relationships with other individuals through CMC is quite impossible as
14

the media is not rich enough if compared to face-to-face communication
as it does not support intensive interactions as well as complex
informational and emotional content. In other words, CMC can only be
used for simple, straightforward types of communication (Daft, Lengel,
& Trevino, 1987). Other early CMC researchers also suggests that CMC
is not rich enough for people to build meaningful or intimate
relationships as all contextual and physical cues are filtered out (Kiesler,
J, & McGuire, 1984).
Today, after the vast growth of the internet, CMC has almost replaced all
other forms of communications. CMC is now rich enough that it may
even replace face-to-face or other conventional forms of communication.
“CMC is now an important resource for supplementing supportive
relationships, especially in cases where the people involved are
geographically separated from these traditional sources of social
support” (Wright & Webb, 2011).
2.1.2.1 Computer Mediated Communication on Social Capital
Using a simple definition, social capital can be defined as any kind of
resources that is brought about by interaction between 2 or more people.
On the other hand, computer mediated communication is now used by
people worldwide to interact with other individuals or socialize. There
are methods like online games and social networking websites which
people use to interact with a large number of people who share the same
15

interest; which in social capital are known as bridging. There are also
methods in CMC which are used to maintain close, emotional
relationships (for example instant messaging); this is also known as
bonding. These methods provided by CMC to maintain social capital
have created an illusion on their users that they are able to separate
themselves from the offline world while at the same time being able to
stay connected with other people. This has resulted in CMC users to
spend time engaging themselves in online social activities like posting
status updates or instant messaging under the illusion that these activities
provide the same value of social capital compared to offline social
capital (Ross, 2010).
2.1.3 Social Networking Website
As mentioned in the previous chapter, social networking website or SNS can be
defined as “a web-based services that allow individuals to (1) construct a public
or semi-public profile within a bounded system, (2) articulate a list of other
users with whom they share a connection, and (3) view and traverse their list of
connections and those made by others within the system” (Boyd & Ellison,
Social Network Sites: Definition, History, and Scholarship, 2007).
Social Networking Websites were introduced to the world in the year 1997 in
the form of Sixdegrees.com. Within a few years, there are numerous amount
social networking websites that were created attracting millions of people
worldwide to join and share their interest. Each social networking site has its
16

own culture, personality and uniqueness that attract more and more people to
sign up and conduct their social activities like sharing and discussing their
hobbies, interests, political views. Some social networking websites targets
diverse audiences while some websites choose to cater to people with a specific
gender, race, religion, political view, etc. The level of technology applied and
service offered also differs with each website with some providing mobile
connectivity tools, instant messaging tools, blogging tools and photo/video
sharing tools (Boyd & Ellison, Social Network Sites: Definition, History, and
Scholarship, 2007).
At first, social networking websites were not as big of a deal as it is today.
Today, social networking websites are a big deal and is a global phenomenon.
Social networking websites have gained popularity at a global scale and the
figures and statistics are not showing and decline in the level of SNS adoption
worldwide. Many people think that people use social network sites in order to
meet strangers from all over the world and communicating or ‘networking’ with
them online. Instead, what makes social network sites so unique is that they just
enable users to visualize their social networks. This visualization will then result
in creating connections that would not be made in any other way. In other
words, social network enables people who share some offline connection to
strengthen their “latent ties”. This concept of connecting people who are already
a part of a person’s extended network is the primary goal of most social network
sites (Boyd & Ellison, Social Network Sites: Definition, History, and
Scholarship, 2007).
17

2.1.3.1 Social Networking Website as a Communication Tool
Social networking sites such as Facebook, Twitter and MySpace have
now become not only a habit, but also part of people’s daily life as a way
to communicate with others. Social network sites have created a major
platform for people to maintain their offline relationships by
communicating with them online. This is also called ‘offline to online’
relationships. By doing this, people are building the online version of the
relationships they have in real life (Hans, 2009).
There are 3 ways by which people communicate through social
networking sites:
1. Directed communication with individual friends – This is where a
person communicates directly with their online friends using
facilities provided by the site for example posting on a friends
profile page, sending them a message, commenting on a friends
picture, instant messaging, photo tagging, video chat, etc. Each
social networking site creates unique mechanisms which people
use to communicate directly with a specific friend. A very good
example of such mechanism is the ‘Like’ button or the ‘Poke’
option in Facebook. All of these actions or mechanisms I have
mentioned above involve a person signaling another person
directly as a way to communicate with them. Directed
communication is designed to improve relationships between
18

individuals as well as enabling bonding and bridging of social
capital. The concept of direct communication involves one-on-
one messages which are believed to be rich and is able to
strengthen relationships. At the same time, the concept of
mutuality or interchange means there is a two way
communication which is able to provide each other with personal
information or at least some details of their daily life. The content
of this two way communication is the key to maintaining
relationships as well as making new ones (Burke, Kraut, &
Marlow, Social Capital on Facebook: Differentiating Uses and
Users, 2011).
2. Broadcasting - This is a situation where there is a one way
communication between the individual who is currently on the
social networking site and the public or in this case ‘online
friends’. This type of communication occurs when an individual
updates their profile with new information or updates their
‘status’ on Facebook or tweets about their day in Twitter.
Broadcasting can be considered an indirect way of
communicating. Although this method of communicating can be
considered less intimate or private, they might still be useful to
maintain current relationships and creating new ones. Information
extracted from one’s profile and an individual’s status updates
can reveal user’s similarities and can create conversational topics
19

(Burke, Kraut, & Marlow, Social Capital on Facebook:
Differentiating Uses and Users, 2011). Hancock and colleagues
found that college students who mined information from a
stranger’s Facebook profile were able to make that stranger like
them more, by casually referencing shared interests (Hancock,
Toma, & Fenner, 2008); (Burke, Kraut, & Marlow, Social Capital
on Facebook: Differentiating Uses and Users, 2011).
3. Passive Consumption of social news – This is quite similar to
broadcasting except this involves the person who simply reads
other people’s updates. This too is a one way communication
which can still be valuable to maintain current relationships as
well as create new ones.
20
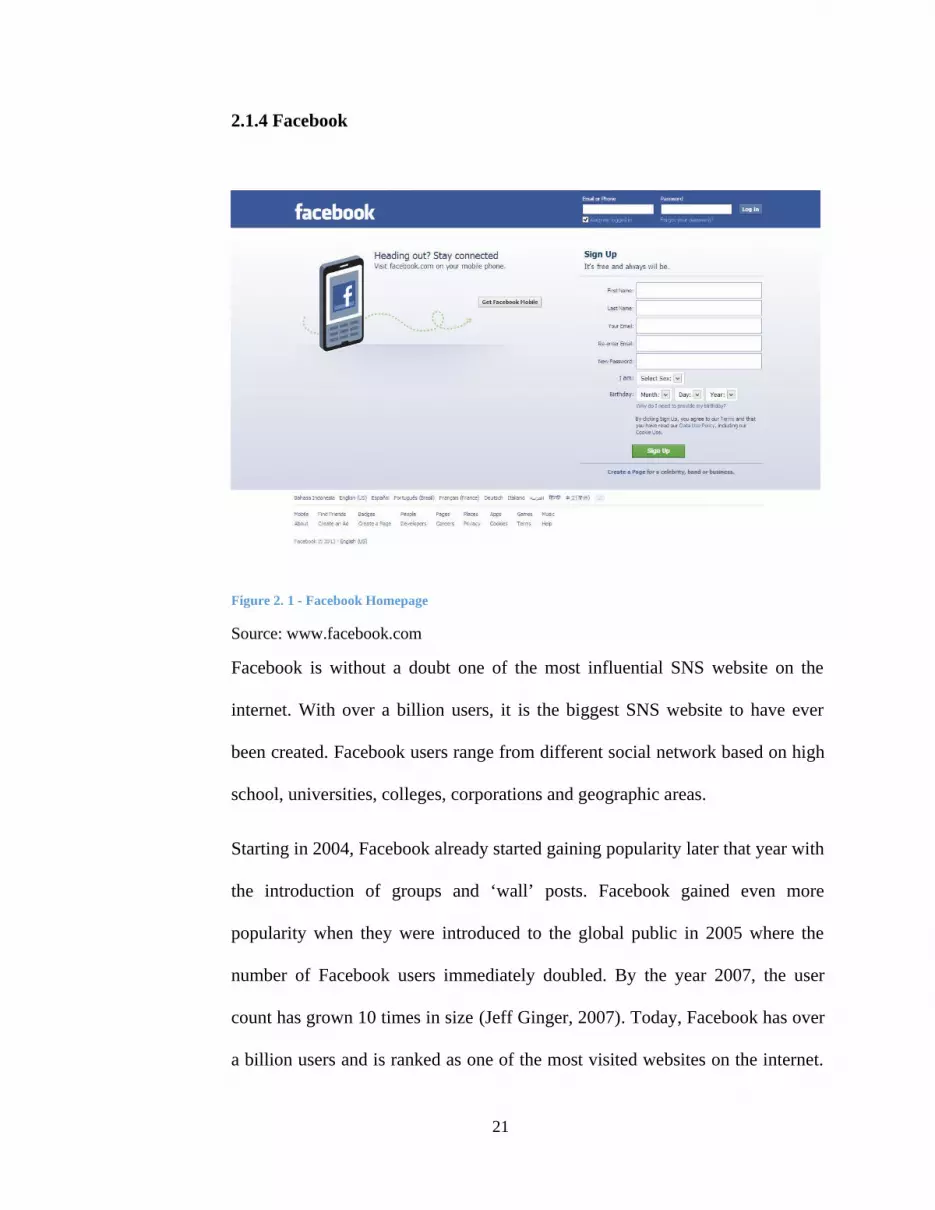
2.1.4 Facebook
Figure 2. 1 - Facebook Homepage
Source: www.facebook.com
Facebook is without a doubt one of the most influential SNS website on the
internet. With over a billion users, it is the biggest SNS website to have ever
been created. Facebook users range from different social network based on high
school, universities, colleges, corporations and geographic areas.
Starting in 2004, Facebook already started gaining popularity later that year with
the introduction of groups and ‘wall’ posts. Facebook gained even more
popularity when they were introduced to the global public in 2005 where the
number of Facebook users immediately doubled. By the year 2007, the user
count has grown 10 times in size (Jeff Ginger, 2007). Today, Facebook has over
a billion users and is ranked as one of the most visited websites on the internet.
21

Some sources claim that Facebook currently is the 3rd most visited websites in
the world based on page views and at the same time account for 1% of all time
spent on the internet (Abram, 2007) (Freiert, 2007) (Jeff Ginger, 2007). Out of
Facebook’s 1 billion active users, 60% log in daily and some even opens
Facebook multiple times a day. Research has shown that the average visitor
spends up to 3 hours of their time on Facebook each month (Arrington, 2005).
These visitors spend their time doing different activities on Facebook.
According to Online Education Database (2007), the most common activities
based on the amount of time spent are (in ascending order): joining and
browsing networks, search for groups and other members, joining or visiting
groups, browsing pictures, interacting with applications such as online games as
well as browsing user profiles. These users come from different age groups, with
the most common age group being ‘between 12 and 24’ as well as ‘35 and up’
(Andrew Lipsman, 2007)
Since its debut, Facebook has attracted millions upon millions of users and has
spread from its initial college users, to high school users, to professionals and
even large corporations. People have also come to rely on this social networking
site to assist in many other aspects other than socializing (Nicole, Andrew,
Justin, & Laura, 2010). For example, politicians promote their campaigns
through Facebook, amateur bands or artists tries to gain popularity by posting
their work in Facebook, a person’s Facebook profile can determine whether
he/she gets the job they applied for as many large corporations treats their
Facebook profile as their ‘Online resume’. Currently, Facebook has more than
22

one billion active users (Agence France-Presse, 2012) and around 600 million of
these users access their Facebook accounts daily through their mobile devices.
Indonesia is currently sitting in 4th place in the list of top 10 countries with the
most Facebook users with 47 million active accounts (Agence France-Presse,
2012).
2.1.4.1 Facebook as a communication tool
A survey conducted in the year 2009 by Prompt Communications
showed that Facebook is the most popular communication tool followed
by SMS and e-mail. This result is not surprising considering Facebook is
the most popular social network in the world (Sachoff, 2009). With over
1 billion users, Facebook can be used as a very resourceful
communication tool. Corporations for example, can use business pages
or groups to communicate externally while at the same time they can
make messaging or instant messaging or even the newly introduced
video chat as a tool to communicate internally with other staff members
or even managers or subordinates. High schools, colleges, universities
can use their pages to pass on important messages to students or
teachers/lecturers. Facebook can be used as a communication tool in a
million different ways. The fact that it is global makes it even more
useful in certain situations like a multinational company launching their
new product and gaining popularity through Facebook.
23

Facebook has become the first alternative to phone calls. When a person
is trying to pass on a message to another person, Facebook is the second
alternative after calling. The fact that Facebook came before SMS or
texting and e-mail is a major sign that Facebook’s reach is strong enough
to replace conventional texting as well as e-mail.
2.1.4.2 Social Capital on Facebook
Before Facebook, people use their ‘online profiles’ in social networking
sites such as Friendster or MySpace simply to get updated about the
people they are connected to in their ‘online profiles’. People barely
spend more than two hours a week to update their ‘online profiles’ and to
see what others have updated on their profiles. People maintain healthy
social capital by meeting with friends; family and colleagues while at the
same time meet new people at random situations. Then Facebook came
into the picture and changed everything. Facebook changed the concept
and definition of social networking site as a whole. Social networking
sites turned from just another pastime to part of a person’s daily life.
Online profiles turned from a mere virtual account to an online
representation of a person and his/her life. People started to care more
about their Facebook profiles or online profiles and socializing through
Facebook compared to maintaining healthy offline relationships.
Facebook has provided an alternative and easier way for people to
maintain their relationships or in this case ‘online relationship’. It is
easier and much more efficient because a person can communicate with
24

their ‘Friends’ on Facebook with a few simple clicks of a button and at
the same time opens up the possibility of communicating with friends,
family members or even a complete stranger who can be located
anywhere in the world with only a few simple steps. In other words,
anyone can now maintain their social capital through Facebook. Many
people are now primarily communicating with other people through
Facebook compared to the rather conventional ways such as face-to-face
or over the phone. This method of maintaining relationships and/or an
individual’s social capital through Facebook can be considered
unconventional and is ought to be accepted in different ways by different
groups of people. As mentioned earlier in this chapter, there are 2 types
of social capital which also concerns the different groups of people
affected by Facebook. “Researchers typically distinguish between two
forms of social capital: bonding social capital, which is derived from
one’s closest relationships and takes the form of emotional and tangible
support such as “big favors”; and bridging social capital, which is
associated with weaker ties and access to novel or non-redundant
information, such as job leads” (Putnam R. D., 2000).
Studies have been conducted by researchers all over the world to
measure the effect of social networking sites on social capital. Burke,
Marlow & Lento drew a conclusion that intensive Facebook usage is
somehow related to bonding social capital but at the same time there is
an uncertain relationship when it comes to bridging social capital. They
25

also stated that the level of loneliness of active Facebook users can be
reduced through bonding social capital (Burke, Marlow, & Lento, Social
network activity and social well-being, 2010).
In the year 2008, Steinfeld and few other researchers investigated the
relationship between Facebook use, level of psychological well-being
and bridging social capital. Through their research, they found that self-
esteem is a moderating factor between Facebook use and bridging social
capital. At the end of their research, they were able to conclude that
people with lower self-esteem were able to benefit more through
Facebook usage in terms of bridging social capital (Ertan, 2011).
Furthermore, in the year 2009 Valenzuela et al. discovered that there is a
positive association between intensity of Facebook use and life
satisfaction as well as social trust. It is pretty clear that life satisfaction
and social trust have a causal relationship but there is some uncertainty
regarding the direction of the relation itself. It was argued that people
who belong to trusted networks tend to have higher life satisfaction
while it was also suggested that people with a higher life satisfaction is
more able to build trusted network (Ertan, 2011). In addition;
Valkenburg, Peter & Schouten (2006) concluded from their research that
the use of social network sites may be an effective way of enhancing
self-esteem for young adolescents in order to improve their academic
performance (Valkenburg, Peter, & Schouten, 2006). This concept is
now well known as social network scholars. Besides improving
26

academic performance, a person’s improved social capital resulting from
the use of social networking site is essential for subjective well-being
and physical health (Helliwell & Putnam, 2004).
All the studies and researches mentioned above have proven that there is
a degree of social capital involved in Facebook as well as other social
networking sites along with the benefits.
2.2 Social Capital Theories
“The concept of social capital traces its roots to the work of Bourdieu (1986)
and Coleman (1988), with subsequent extension by Burt (1992), Putnam (1995),
and Lin (2001). Social capital can be considered as ‘the aggregate of the actual
or potential resources which are linked to possession of a durable network of
more or less institutionalized relationships of mutual acquaintance and
recognition’ (Bourdieu, 1986: 248). Social capital can be understood as a form
of capital, like financial or human capital, that is embedded in the relationships
between individuals, and can be measured at the individual or group level”
(Ellison, Steinfeld, & Lampe, 2011).
2.2.1 Bonding & Bridging Social Capital
Putnam (2000) delineated two basic forms of social capital: bonding and
bridging. Bonding social capital describes benefits from close personal
relationships, which might include emotional support, physical succor, or
other ‘large’ benefits (such as willingness to loan a substantial sum of
27

money). Bridging social capital, the benefits derived from casual
acquaintances and connections, can also lead to tangible outcomes such
as novel information from distant connections and broader world-views
(Putnam R. , 1995). Empirical research confirms the practical importance
of bridging social capital. In Granovetter’s (1973) work on ‘the strength
of weak ties’, weak ties in a social network were more likely to have
information not possessed by the individual or by the individual’s strong
ties (Granovetter, 1973). Similarly, Boase et al. (2006) found that those
with a wider range of occupations represented in their social circle were
more likely to get help doing things like changing jobs or finding health
information (Boase J, 2006) (Ellison, Steinfeld, & Lampe, 2011).
“There are several different forms of social capital. It can be a tie among
family members, with neighbors, ties from shared experience, cultural
norms, common purposes and pursuits. Social capital can have a group
base, a network base or an institutional base. An extended family
network, a clan, a tribe, a farmers’ group, community-based groups in a
traditional sense; and a book club, a youth club, NGOs, internet forums,
social networking sites, in the modern sense. Membership in a political
party or even citizenship of a state can qualify as a social capital.”
(Panth, 2010) Robert D Putnam stated in his book, Bowling
Alone classified social capital into two distinct types, which he termed as
bonding vs. bridging in social capital (Panth, 2010) (Putnam R. , 1995)
(Putnam R. D., 2000).
28

2.3 Research Theories
Below are the theories or methods that are going to be used in order to provide a
solution to the given problem.
2.3.1 Data Collection
Data collection can be considered the second step of the research process after
problem recognition. This data collection process can be done by giving out
questionnaires and/or conducting interviews. As this research will involve
giving out questionnaires, the theories related to data collection through
questionnaires will be explained in this next section.
2.3.1.1 Questionnaire
Questionnaire is one of the most commonly used data collection
methods. Questionnaire can be defined as a preset group of questions
which will be given out to specific/random respondents in order to
provide information needed to produce a solution.
Sekaran (2003 p.238) stated that there are several guidelines in order to
create good questionnaires:
Principles of wording – This highlights issues such as:
o Content & purpose – Only questions that have a clear
purpose and objective should be included in the
questionnaire. Unnecessary questions should be avoided.
The kind of questions included should follow the nature
of the variable (subjective or objective)
29

o Language & wording – The researcher must use the right
words and proper language that can be easily understood
by the respondents. The researcher must make sure that
the words/language used does not confuse the respondent
as it may lead to incorrect results.
o Type & form of questions – The type and form of each
question must be carefully decided by the researcher. The
different types/forms are:
Open-ended/close-ended questions – Open-ended
questions allow the respondents to answer in any
way they choose while close-ended questions only
allow the respondents to choose among a set of
answers given by the researcher.
Positively worded / negatively worded – Both
must be used to make sure respondents who are
not interested in completing the questionnaires
stay conscious.
There are also certain types of questions that must
be avoided:
Ambiguous Questions – Questions that are
hard to understand
Double-barreled questions – Questions
containing subparts with different answers
30

Recall-dependent questions – Question
where respondents must recall past
experiences
Leading questions – Questions that lead
the respondents to respond in a specific
manner
Loaded questions – Questions with
strongly disturbing phrases
Social desirability
Long questions with more than 20 words
o Sequence of questions – The researcher must make sure
the questions are in sequence so the respondents can
answer the questionnaire with ease from beginning to end.
The most common approach is called the funnel
approach. This is where the questions are sequenced from
general questions to more specific questions.
o Classification data (personal information) – Questions
that asks the respondent to input their personal
data/information such as age, gender, educational level,
marital status, income, etc. is usually put at the beginning
of the questionnaire. This information gathered is
important since it can explain/classify the respondent’s
characteristics.
31

o Measurement – The researcher must ensure that the data
collected are suitable for hypothesis testing. There are
several principles to be followed to make sure that the
questions and the data that will be collected are suitable.
These principles usually covers :
Various scaling techniques
Assessment of goodness of method(s) chosen
o General ‘getup’ – This is to make the overall appearance
of the questionnaire look more interesting and well-
organized to the respondents. This includes:
Introduction
Questions logically organized along with brief
instructions on how to answer the questions
Neatly aligned
Correct placement of demographic questions
Closing
2.3.2 Data Analysis
These are several methods of analysis which are going to be used in this study:
2.3.2.1 Frequencies
The objective of the author in using frequency distribution is to obtain a count
of the number of responses associated with different variables, usually one
variable at at time (N.K.Malhotra, 2012)
32

2.3.2.2 Reliability TestA good questionnaire’s reliability and validity has to be tested prior to
distribution so that the result which will be retrieved from the research
will be good.The tool that is used to test for reliability is Cronbach’s
Alpha, using the measure of internal consistency that the closer the alpha
is to 1, the more reliable the data is. Cronbach’s alpha reliability
coefficient normally ranges between 0 and 1. (Kanayolal, 2012)
The variables that will be tested using Cronbach’s Alpha are: Intensity,
Self-Esteem, Life Satisfaction, Bridging Social Capital & Bonding
Social Capital
A variable is said to be reliable when:
Result α 0,60 = Reliable
Result α < 0,60 = Not reliable
2.3.2.3 Validity Test
To know whether or not the indicators in the variable questions are valid
to be a measuring scale, the author has conducted a validity test by
observing the Corrected Item-Total Correlation.
Item Scale Mean if
Item Deleted
Scale Variance
if Item Deleted
Corrected Item-
Total
Correlation
Cronbach's
Alpha if Item
Deleted
Corrected item-total correlations are the correlations between
scores on each item and the total scale scores. If the scale is
33

internally consistent you would expect these correlations to be
reasonably strong.
Alpha-if-item-deleted statistics show that if we removed any one
item, alpha for the remaining three would be worse than alpha for all
four items. Therefore it is worth retaining all four. If the alpha-if-
item-deleted statistics showed that removing an item would lead to
an increase in alpha, then we would consider doing that in order to
improve the internal consistency of the scale.
The variables that will be tested using Corrected Item-Total
Correlation are: Intensity, Self-Esteem, Life Satisfaction, Bridging
Social Capital & Bonding Social Capital
Testing the validity of research criteria:
Result: rcount > r table = validity requirements met.
Result: rcount <r table = validity requirements not met.
2.3.2.4 Inferential Statistics
The main aim of inferential statistics is to answer the research
questions. In this research, Simple Linear Regression and Correlation
Analysis will be conducted in order to answer the research questions.
2.3.2.4.1 Regression
Regression analysis is used to know the effect of one variable
(independent variable) towards another variable (dependent
variable). In this part, the previously developed hypothesis will be
34

tested against the data that has been gathered through questionnaire
and SPSS will be used as the main processing tool.
There are 3 different types of variables involved here i.e. independent
variable, dependent variable and moderating variable.
Independent Variable is a variable that is selected or controlled
by the researcher, to determine its relationship to the observed
outcome of the research—also called explanatory, predictor, or
manipulated variable (National Service-Learning ClearingHouse,
2013).
Dependent Variable (DV): The variable being measured as an
outcome—also called outcome, response, criterion, or explained
variable (National Service-Learning ClearingHouse, 2013).
Moderator Variable: A variable that is related to the direction or
strength of the relationship between the independent and
dependent variables (Baron & Kenny, 1986)
A simple linear regression will be used on each independent variable against
the dependent variable with or without the moderating variable (depending
on the hypothesis being tested). The result of each regression will come in 3
different tables.
The Coefficientsa Table will show the results of the regression and present
the “t” value of the variables as well as the regression coefficient (β). An
35

explanation of the values in the table will be provided along with the
decision to accept or reject the hypothesis (Ha).
2.3.2.4.2 R-Square & ANOVA Analysis
The R-Square (R2) of each regression will show how much of the variance
in the independent variable is cause by the dependent variable. R2 tells how
much the regression line approximates the real data. The closer the R2 value
is to one (1), the more useful the equation is in making predictions.
ANOVA aims to know whether or not the model that was built fits in
predicting the dependent variable.
36

CHAPTER III
RESEARCH METHODOLOGY
In this chapter, the researcher will start by explaining the objectives of this research as
well as the research questions or problem. This will then be followed by the research
model or framework and the hypothesis used to provide a solution to the given problem.
The researcher will also discuss the scope of the research, the data collection method
used, questionnaire design and data analysis methods. The purpose of this chapter is to
make readers understand the whole concept of this research as well as the research
methods used.
3.1 Research Objectives
The objective of this research is to find out:
Whether intensity of Facebook use has an impact on a person’s social
capital.
What type of social capital is more affected by the intensity of Facebook use
i.e. Bridging or Bonding Social Capital?
Whether psychological factors of an individual play a role in which type of
social capital affected through the intensity of Facebook use.
Whether psychological factors of an individual play a role in the level of the
person’s social capital affected through the intensity of Facebook use.
37

3.2 Research Methodology
Research methodology can be defined as the methods used in obtaining as well as
analyzing the data. This research can be classified as a descriptive research as this
research will describe the effects of Facebook on an individual’s social capital and Does
Facebook help in bridging or bonding their social capital. On the other hand, this
research can also be categorized as hypothesis testing since this research will study
about the correlations between user’s intensity of Facebook use, self-esteem and life
satisfaction on the bridging and bonding of their social capital. The model and
hypothesis will be discussed later in this chapter and will ease the reader’s
understanding of the research.
The journal by which the researcher based this research on is “The Benefits of
Facebook “Friends”: Social Capital and College Students’ Use of Online Social
Network Sites” by Nicole B. Ellison, Charles Steinfeld and Cliff Lampe. The researcher
and the authors of the journal shares a quite similar objective which is to measure the
effects of Facebook on an individual’s social capital while at the same time taking into
account the individuals self-esteem and life satisfaction. The reason that made the
researcher choose this journal and this topic as a whole is because he would like to find
out if Facebook; the social networking site that has literally changed the way people
socialize and communicate, is able to maintain an individual’s social capital just by
using Facebook to communicate as well as to socialize.
Although the researcher and the authors of the journal have similar objectives and
purpose, there are also a few ways where the researcher would like to conduct his
38

research differently. To begin with, the researcher has decided to modify the model
used by the authors of the journal. Below is the original model and hypothesis used in
the journal:
Figure 3. 1 - Model / Framework Used in Original Study
H1 - Intensity of Facebook use will be positively associated with individuals’
perceived bonding social capital.
H2 - Intensity of Facebook use will be positively associated with individuals’
perceived bridging social capital.
H3a – The relationship between intensity of Facebook use and bonding social
capital will vary depending on the degree of a person’s satisfaction with life.
39

H3b - The relationship between intensity of Facebook use and bridging social
capital will vary depending on the degree of a person’s satisfaction with life.
H4a - The relationship between intensity of Facebook use and bonding social
capital will vary depending on the degree of a person’s self-esteem.
H4b - The relationship between intensity of Facebook use and bridging social
capital will vary depending on the degree of a person’s self-esteem.
H5 - Intensity of Facebook use will be positively associated with individuals’
perceived maintained social capital.
The researcher have decided to use the same variables used in the journal but have
decided to make a few changes to the model as well as the hypothesis. The researcher
have decided to omit the ‘Maintained Social Capital’ from the model as well as ‘H5 -
Intensity of Facebook use will be positively associated with individuals’ perceived
maintained social capital’ from the hypothesis. The reason of this omission is because
the researcher believes that there are only 2 core values of Social capital which are
bridging and bonding. Maintained social capital refers to those relationships, and the
benefits we derive from them, that we maintain despite having shifted geography,
interests or workplaces. In the case of Facebook, they may be the relationships we
forged in high school with people who went off to different colleges (Bigelow, 2007).
In other words, maintained social capital can be defined as how Facebook can help
users recover lost bridging social capital, which would be close friends and old
classmates who have fallen out of contact over time (Bainum, 2010).
40

From the description of maintained social capital provided above, the researcher have
decided to omit maintained social capital from the model and hypothesis as the concept
of maintained social capital is just an extension of bridging social capital. Instead, the
researcher used the two core values of social capital i.e. bonding and bridging social
capital.
The model and hypothesis used in this research will be shown and discussed later in this
chapter.
3.3 Research Question
This purpose of this research is to answer the following questions:
Research Question 1
Does the level of intensity of an Individual’s Facebook use affect his/her
perceived social capital?
Research Question 2
What type of an individual’s social capital (bridging or bonding) is
affected by using Facebook to communicate and socialize?
Research Question 3
Does the intensity of Facebook use have a positive impact on an
individual’s perceived bridging social capital?
Research Question 4
Does the intensity of Facebook us have a positive impact on an
individual’s perceived bonding social capital?
41

Research Question 5
Is an individual’s life satisfaction and self-esteem a factor in the level of
social capital (bridging or bonding) affected through the intensity of
his/her Facebook use?
3.3 Research Model & Hypothesis
Figure 3. 2 - Model / Framework used in this Research
H1 - Intensity of Facebook use will be positively associated with individuals’
perceived bonding social capital.
H2 - Intensity of Facebook use will be positively associated with individuals’
perceived bridging social capital.
H3a – The relationship between intensity of Facebook use and bonding social
capital will vary depending on the degree of a person’s satisfaction with life.
42

H3b - The relationship between intensity of Facebook use and bridging social
capital will vary depending on the degree of a person’s satisfaction with life.
H4a - The relationship between intensity of Facebook use and bonding social
capital will vary depending on the degree of a person’s self-esteem.
H4b - The relationship between intensity of Facebook use and bridging social
capital will vary depending on the degree of a person’s self-esteem.
H1 - Intensity of Facebook use will be positively associated with individuals’
perceived bridging social capital.
o According to previous studies done regarding social capital on the
internet especially in social networking sites, internet based-linkages is
important for the formation of weak ties which also serves as the basis of
bridging social capital as these kind of relationships can be supported
through the use of internet or social networking sites due to the search
capabilities and communication facilities provided (Resnick, 2001).
Social networking site is a very easy, efficient and cheap method to
maintain or even increase the weak ties that an individual could form
(Boyd & Donath, Public Displays of Connection, 2004). Based on the
previous studies conducted, I propose the first hypothesis.
H2 - Intensity of Facebook use will be positively associated with individuals’
perceived bonding social capital.
43

o There is quite an uncertainty when it comes to the relationship between
Facebook use and the increase in an individual’s bonding social capital.
Williams (2006) pointed out that there has been little research conducted
that clearly examines the effect of the Internet on bonding social capital
(Williams, 2006). Researchers have studied and proved that increase in
internet use will somehow diminish an individual’s social capital due to
the reduction in offline communication but at the same time there has
been not studies or researches done that sufficiently explores the gains
that one might benefit from it (Williams, 2006). Thus, this second
hypothesis is proposed to test the relationship between Facebook and
bonding social capital.
H3a – The relationship between intensity of Facebook use and bridging social
capital will vary depending on the degree of a person’s satisfaction with life.
H3b - The relationship between intensity of Facebook use and bridging social
capital will vary depending on the degree of a person’s self-esteem.
H4a - The relationship between intensity of Facebook use and bonding social
capital will vary depending on the degree of a person’s satisfaction with life.
H4b - The relationship between intensity of Facebook use and bonding social
capital will vary depending on the degree of a person’s self-esteem.
o The internet and social networking sites have proven to open up new
possibilities for people with low self-esteem and life satisfaction due to
very few offline ties (with friends or neighbors) (Bargh & McKenna,
44

2004). The Internet and social networking site can act as a computer-
mediated communication channel that they can use to lower the barriers
to interacting with other people and at the same time encouraging them
to expose themselves (Bargh, McKenna, & Fitzsimons, 2002). These 4
hypotheses above is proposed to find out whether the effect of Facebook
on social capital varies with varying levels of life satisfaction (Diener,
Suh, & Oishi, 1997) and self-esteem (Rosenberg, 1989) which are the
most well-known measures to validate an individual’s well-being.
3.4 Scope
The scope of this research can be considered quite large as there are millions of
Facebook users in Indonesia. As discussed in Chapter 1 of this research, Indonesia has
one of the highest numbers of Facebook users worldwide. Indonesia is currently 4 th in
the list with just a little shy of 50 million active Facebook users. On the other hand,
Jakarta has the 2nd highest number of active Facebook users compared to all the other
cities around the world with almost 12 million users.
The researcher is located in Jakarta which is the perfect location to conduct this research
even though the expected respondents of this research is people reside in Jakarta as well
as any other city in Indonesia as this is a nationwide study. The number of respondents
targeted by the researcher for this research is 150-200 people due to the time limitation
of this research. The researcher will give out questionnaires as a way to collect data for
this research. Further details regarding the questionnaire will be discussed in the next
section of this chapter.
45

3.5 Data Collection
The researcher chose Questionnaires as the data collection technique for this research.
The reason behind choosing questionnaires to collect data is because this method offers
many advantages over other techniques such as:
o Quick to collect information
o Information can be collected from multiple respondents / group of people
simultaneously
o Information gathered is in a standardized format
3.5.1 Questionnaire Design
The questionnaire itself was based on the replicated journal “The Benefits of
Facebook “Friends”: Social Capital and College Students’ Use of Online Social
Network Sites” by Nicole B. Ellison, Charles Steinfeld and Cliff Lampe. The
author designed the questionnaire with the help of the one available in the replicated
journal. The questionnaire consists of 2 parts, first part requiring respondents to fill
demographic data such as:
a. Gender
b. Age
c. Education
d. Occupation,etc
46

3.5.2 Sample Likert Scale Questions
The second part of the questionnaire will be of likert scale questions. The author chose to
use this type of measurement because it is the most widely used non-comparative rating
scale. The advantage provided by using likert scale is that it allows for a certain gradation of
opinion and even no opinion at all rather than a simple yes or no answer from the
respondent. Besides that, it is easy for the researcher to constructs and administer and it is
easy for the respondent to understand Invalid source specified.. The data can then be
analyzed with ease through the quantitative data which is obtained. The author decided to
use the6 scales likert scale and eliminate the ‘neutral’ in order to avoid ambigous answers
by respondents.
3.6 Sampling Design
In conducting the data collection through the use of questionnaires, the researcher
decided to use a random sample. The target population is going to come from anyone
who has a Facebook account and reside anywhere in Indonesia. As people of varying
age, gender, income, etc. uses Facebook; it is more suitable to use a random sampling
method for this research. A random sampling technique will enable the researcher to get
a diverse response. As the amount of sample is quite small for this research, a diverse
result is considered better. The sample is going to constitute mostly of the researchers
friends and family, Binus International Students, Binus International Staff members as
well as random respondents that the researcher is able to reach.
47

3.7 Data Analysis
The data will be analyzed using SPSS 14 using statistical tools involving reliability test, validity
test, and regression, frequencies and cross tabulation.
3.7.1 Validity
Validity test is one of the most important test that needs to be carried out by every
author before doing a research. The aim of doing validity test is so that valid
conclusions about the effect of the independent variables on the dependent variables as
well as valid generalizations from the specific experimental environment to a larger
population can be made by the author (N.K.Malhotra, 2012). They type of validity test
the author decides to use is Pearson correlation. Validity is obeserved by seeing the
level of coherence of one variable against another as well as their relativity to make
sure that the research questions matches up with the researcher’s expectations.
3.7.2 Reliability
Reliability test is another important test that will also be carried out by the author. The
aim of this test is to ensure that the research produces consistent results if repeated
measurements are made (N.K.Malhotra, 2012) The author decided to use coefficient
alpha or Cronbach's alpha method to determine the internal consistency or average
correlation of items in a survey tool to measure its reliability. Cronbach's alpha is “a
numerical coefficient of reliability which is calculated by averaging the coefficients that
result from all possible combination of split halve” (N.K.Malhotra, 2012). Alpha is
calculated based on the reliability of a test as compared to other tests which measures
the same idea of insterest and has exactly the same number of items. The closer the
Cronbach’s alpha value is to 1, the higher the internal consistency reliability but values
above 0.6 is already acceptable.
48
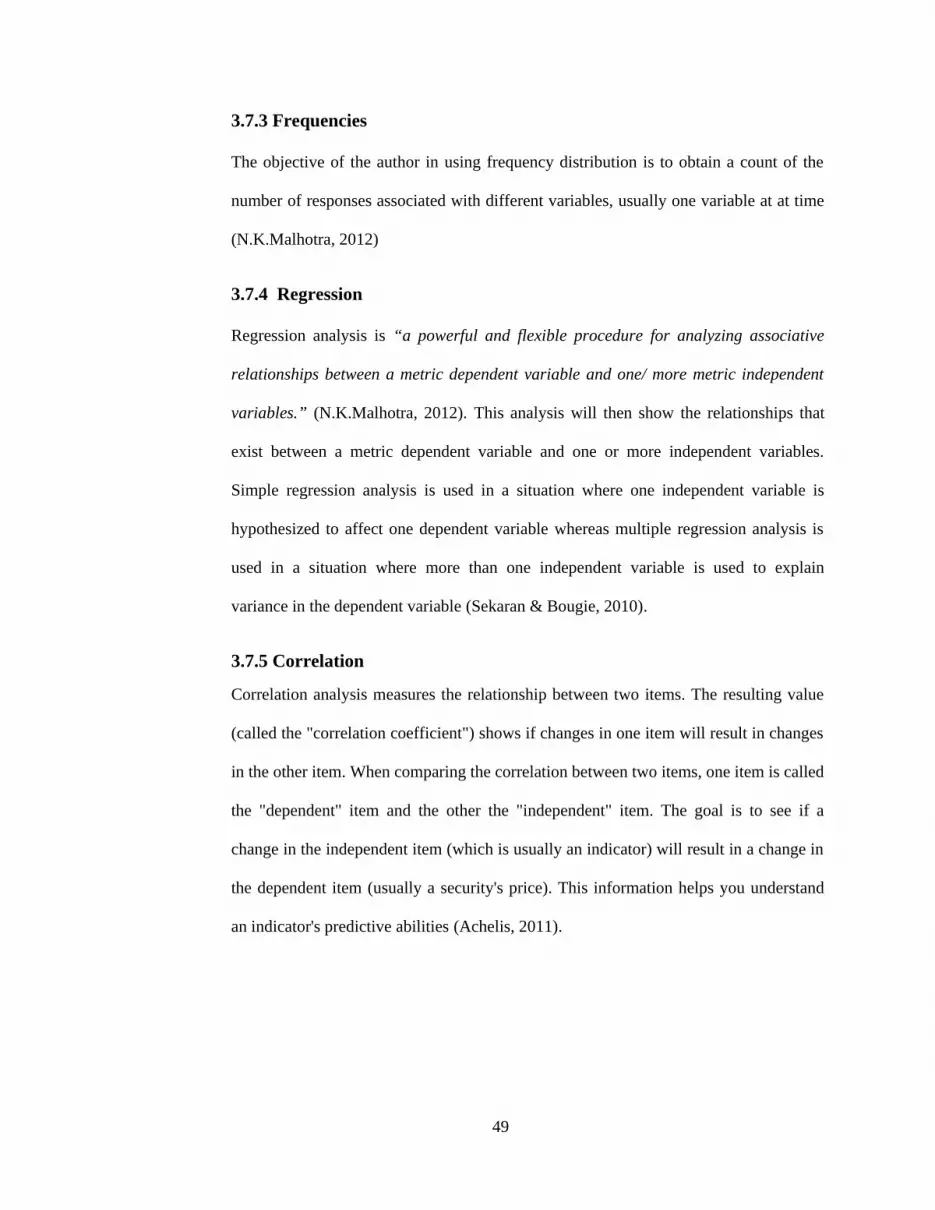
3.7.3 Frequencies
The objective of the author in using frequency distribution is to obtain a count of the
number of responses associated with different variables, usually one variable at at time
(N.K.Malhotra, 2012)
3.7.4 Regression
Regression analysis is “a powerful and flexible procedure for analyzing associative
relationships between a metric dependent variable and one/ more metric independent
variables.” (N.K.Malhotra, 2012). This analysis will then show the relationships that
exist between a metric dependent variable and one or more independent variables.
Simple regression analysis is used in a situation where one independent variable is
hypothesized to affect one dependent variable whereas multiple regression analysis is
used in a situation where more than one independent variable is used to explain
variance in the dependent variable (Sekaran & Bougie, 2010).
3.7.5 Correlation
Correlation analysis measures the relationship between two items. The resulting value
(called the "correlation coefficient") shows if changes in one item will result in changes
in the other item. When comparing the correlation between two items, one item is called
the "dependent" item and the other the "independent" item. The goal is to see if a
change in the independent item (which is usually an indicator) will result in a change in
the dependent item (usually a security's price). This information helps you understand
an indicator's predictive abilities (Achelis, 2011).
49

CHAPTER IV
RESULTS & ANALYSIS
This chapter of the research is dedicated to show the results of the data collection
conducted as well as analyzing the data and see all the information that can be extracted
from it. All the data that has been gathered will be thoroughly analyzed and explained in
this chapter of the research.
This chapter will be divided into 4 different parts. The first part will discuss the
demographics of the respondents. Although this research and the hypothesis involved in
the framework has little to do with demographics, the researcher would like to include
them in order to provide better understanding of the respondents reached throughout
this research as well as easing interpretations and improve overall accuracy of the data
gathered. The second part of this chapter will discuss the reliability test conducted on
each variable used in this research, followed by the third part which discusses the
validity test of each sub-variable under the variable. The fourth and last part of the
chapter discusses the significance of each hypothesis by using regressions and then
drawing conclusions using the result from the regression analysis.
The data collection process was conducted within a span of 2 weeks. The questionnaire
was conducted online using Google Docs and shared to possible respondents via
Facebook and E-Mail. A total of 212 respondents answered the questionnaire, in which
12 was considered invalid as they are incomplete. The researcher used a mass approach
in reaching his respondents in order to reach the needed quota of 200 respondents
within a quite limited time span.
50
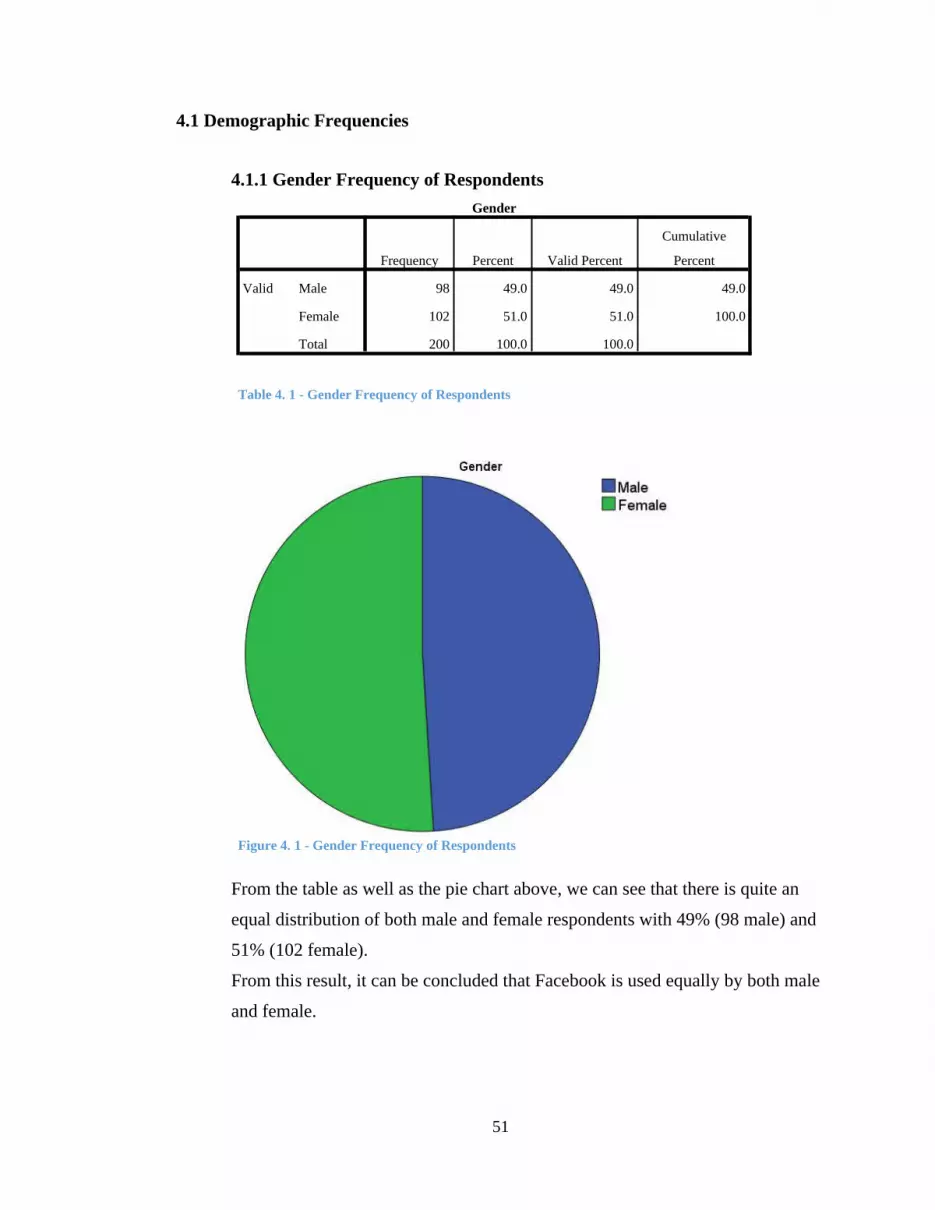
4.1 Demographic Frequencies
4.1.1 Gender Frequency of RespondentsGender
Frequency Percent Valid Percent
Cumulative
Percent
Valid Male 98 49.0 49.0 49.0
Female 102 51.0 51.0 100.0
Total 200 100.0 100.0
Table 4. 1 - Gender Frequency of Respondents
Figure 4. 1 - Gender Frequency of Respondents
From the table as well as the pie chart above, we can see that there is quite an
equal distribution of both male and female respondents with 49% (98 male) and
51% (102 female).
From this result, it can be concluded that Facebook is used equally by both male
and female.
51

4.1.2 Age Frequency of RespondentsAge
Frequency Percent Valid Percent
Cumulative
Percent
Valid <15 Yo 7 3.5 3.5 3.5
15-24 Yo 164 82.0 82.0 85.5
25-34 Yo 19 9.5 9.5 95.0
>34 Yo 10 5.0 5.0 100.0
Total 200 100.0 100.0
Table 4. 2 - Age Frequency of Respondents
Figure 4. 2 - Age Frequency of Respondents
The table and figure above shows the age proportion of this research i.e.- < 15 Years Old = 3.5% (7)- 15-24 Years Old = 82% (164)- 25-34 Years Old = 9.5% (19)- >34 Years Old = 5% (10)
52

4.1.3 Last Education Frequency of RespondentsLast Education
Frequency Percent Valid Percent
Cumulative
Percent
Valid High School 106 53.0 53.0 53.0
Diploma 5 2.5 2.5 55.5
Undergraduate 81 40.5 40.5 96.0
Midle Shcool 8 4.0 4.0 100.0
Total 200 100.0 100.0
Table 4. 3 - Last Education Frequency of Respondents
Figure 4. 3 - Last Education Frequency of Respondents
More than half of the respondents are high school graduates, covering 53%
(106) of the total respondents, followed by undergraduates with 40.5% (81). The
other two categories can be considered a minority as they only cover less than
10% of the number of respondents with 4% (8) of them being middle school
graduates and 2.5% (5) having a diploma.
53

4.1.4 Current Occupation Frequency of Respondents
Current Occupation
Frequency Percent Valid Percent
Cumulative
Percent
Valid Student 135 67.5 67.5 67.5
Employed 48 24.0 24.0 91.5
Entrepreneur 11 5.5 5.5 97.0
Unemployed 6 3.0 3.0 100.0
Total 200 100.0 100.0
Table 4. 4 - Current Occupation Frequency of Respondents
Figure 4. 4 - Current Occupation Frequency of Respondents
67.5% (135) of the respondents’ f this research is student, followed by 24% (48)
employed, 5.5% (11) entrepreneurs and 3% (6) unemployed or yet to find
employment.
54

4.1.5 Daily Internet Usage Frequency of Respondents
On average, how many hours do you spend on the Internet daily
Frequency Percent Valid Percent
Cumulative
Percent
Valid <1 Hour 7 3.5 3.5 3.5
1-2 Hours 39 19.5 19.5 23.0
2-3 Hours 45 22.5 22.5 45.5
>3 Hours 109 54.5 54.5 100.0
Total 200 100.0 100.0
Table 4. 5 - Daily Internet Usage Frequency of Respondents
Figure 4. 5 - Daily Internet Usage Frequency of Respondents
54.5% of the respondents are heavy internet users spending more than 3 hours
on the internet daily. 22.5% uses the internet in the range of 2-3 hours daily.
19.5% uses 1-2 hours of internet daily while only 3.5% uses less than an hour on
internet in a day.
55

4.2 Reliability & Validity Test
Before conducting any kind of analysis to reach a conclusion on whether to accept or
reject the hypothesis, the researcher will first conduct reliability and validity tests on the
construct being used in the survey which, in this case, would be the questionnaire.
Reliability will be measured using Cronbach’s Alpha; whereas validity will be
measured using corrected Item-Total Correlation.
4.2.1 Reliability Test
4.2.1.1 Intensity
Case Processing SummaryN %
Cases Valid 200 100.0
Excludeda 0 .0
Total 200 100.0
a. List wise deletion based on all variables in the procedure.
Table 4. 6 - Reliability Test (Case Processing Summary - Intensity)
Reliability StatisticsCronbach's
Alpha N of Items
.867 6Table 4. 7 - Cronbach's Alpha (Intensity)
The Cronbach Alpha is 0.867, which is higher than the
acceptable level of 0.6; hence it can be concluded that the
questions in this section are reliable enough to measure the
“Intensity” variable.
56

4.2.1.2 Self Esteem
Case Processing SummaryN %
Cases Valid 200 100.0
Excludeda 0 .0
Total 200 100.0
a. List wise deletion based on all variables in the procedure.
Table 4. 8 - Reliability Test (Case Processing Summary - Self-Esteem)
Reliability StatisticsCronbach's
Alpha N of Items
.790 7Table 4. 9 - Cronbach's Alpha (Self-Esteem)
The Cronbach Alpha is 0.790, which is higher than the acceptable
level of 0.6; hence it can be concluded that the questions in this
section are reliable enough to measure the “Self-Esteem”
variable.
4.2.1.3 Life Satisfaction
Case Processing SummaryN %
Cases Valid 200 100.0
Excludeda 0 .0
Total 200 100.0
a. List wise deletion based on all variables in the procedure.
Table 4. 10 - Reliability Test (Case Processing Summary - Life Satisfaction)
57

Reliability StatisticsCronbach's
Alpha N of Items
.859 5Table 4. 11 - Cronbach's Alpha (Life Satisfaction)
The Cronbach Alpha is 0.859, which is higher than the
acceptable level of 0.6; hence it can be concluded that the
questions in this section are reliable enough to measure the
“Life Satisfaction” variable.
4.2.1.4 Bridging Social capital
Case Processing SummaryN %
Cases Valid 200 100.0
Excludeda 0 .0
Total 200 100.0
a. List wise deletion based on all variables in the procedure.
Table 4. 12 - Reliability Test (Case Processing Summary - Bridging Social Capital)
Reliability StatisticsCronbach's
Alpha N of Items
.894 8Table 4. 13 - Cronbach's Alpha (Bridging Social Capital)
The Cronbach Alpha is 0.894, which is higher than the
acceptable level of 0.6; hence it can be concluded that the
questions in this section are reliable enough to measure the
“Bridging Social capital” variable.
58

4.2.1.5 Bonding Social Capital
Case Processing SummaryN %
Cases Valid 200 100.0
Excludeda 0 .0
Total 200 100.0
a. List wise deletion based on all variables in the procedure.
Table 4. 14 - Reliability Test (Case Processing Summary - Bonding Social Capital)
Reliability StatisticsCronbach's
Alpha N of Items.712 5
Table 4. 15 - Cronbach's Alpha (Bonding Social Capital)
The Cronbach Alpha is 0.712, which is higher than the
acceptable level of 0.6; hence it can be concluded that the
questions in this section are reliable enough to measure the
“Bonding Social Capital” variable.
59

4.2.2 Validity Test
In this study, the significance level of 5% is used and the number of samples (n)
100 with df = n-2 = 200-2 = 198 so r table value used is 0.139.
4.2.2.1 IntensityItem-Total Statistics
Scale Mean if
Item Deleted
Scale Variance if
Item Deleted
Corrected Item-
Total Correlation
Cronbach's
Alpha if Item
Deleted
Intensity1 13.9000 9.447 .824 .819
Intensity2 14.2500 10.168 .542 .866
Intensity3 13.9000 9.528 .729 .833
Intensity4 14.2900 9.232 .659 .847
Intensity5 14.1100 10.350 .576 .859
Intensity6 13.8500 9.354 .686 .841Table 4. 16 - Validity Test (Intensity)
From the table above it can be seen that the value of r or Corrected
Item-Total Correlation for each of the items is bigger when compared to
the r table value (0.139). From this, it can be concluded that all the
items or questions in the "Intensity" variable is already valid.
4.2.2.2 Self Esteem Item-Total Statistics
Scale Mean if
Item Deleted
Scale Variance
if Item Deleted
Corrected Item-
Total Correlation
Cronbach's
Alpha if Item
Deleted
Self-Esteem1 18.4700 7.074 .551 .758
Self-Esteem2 18.3950 7.074 .637 .746
Self-Esteem3 18.4800 7.527 .257 .820
Self-Esteem4 18.4900 7.136 .528 .762
Self-Esteem5 18.5100 7.025 .402 .790
Self-Esteem6 18.3600 6.694 .693 .732
Self-Esteem7 18.3850 6.308 .691 .727Table 4. 17 - Validity Test (Self-Esteem)
60

From the table above it can be seen that the value of r or Corrected Item-
Total Correlation for each of the items is bigger when compared to the r
table value (0.139). From this, it can be concluded that all the items or
questions in the "Self-Esteem" variable is already valid.
4.2.2.3 Life Satisfaction
Item-Total Statistics
Scale Mean if
Item Deleted
Scale Variance
if Item Deleted
Corrected Item-
Total Correlation
Cronbach's
Alpha if Item
Deleted
LifeSatisfaction1 11.5450 5.485 .618 .844
LifeSatisfaction2 11.6650 4.927 .684 .827
LifeSatisfaction3 11.5150 5.347 .762 .815
LifeSatisfaction4 11.6150 5.163 .679 .829
LifeSatisfaction5 11.9600 4.431 .693 .833Table 4. 18 - Validity Test (Life Satisfaction)
From the table above it can be seen that the value of r or Corrected Item-
Total Correlation for each of the items is bigger when compared to the r
table value (0.139). From this, it can be concluded that all the items or
questions in the "Life Satisfaction" variable is already valid.
61

4.2.2.4 Bridging Social capital
Table 4. 19 - Validity Test (Bridging Social Capital)
From the table above it can be seen that the value of r or Corrected
Item-Total Correlation for each of the items is bigger when compared to
the r table value (0.139). From this, it can be concluded that all the
items or questions in the "Bridging Social Capital" variable is already
valid.
4.2.2.5 Bonding Social Capital
62
Item-Total Statistics
Scale Mean if
Item Deleted
Scale Variance
if Item Deleted
Corrected Item-
Total Correlation
Cronbach's
Alpha if Item
Deleted
Bridging1 21.6900 10.798 .772 .871
Bridging2 21.6350 11.972 .558 .890
Bridging3 21.8250 11.271 .538 .895
Bridging4 21.5750 11.190 .697 .878
Bridging5 21.6300 10.707 .778 .870
Bridging6 21.7200 10.866 .773 .871
Bridging7 21.7950 10.847 .639 .885
Bridging8 21.5900 11.097 .663 .881

Table 4. 20 - Validity Test (Bonding Social Capital)
From the table above it can be seen that the value of r or Corrected Item-
Total Correlation for each of the first 4 items is bigger when compared to
the r table value (0.139). From this, it can be concluded that all the items
or questions other than Bonding5 in the "Bonding Social Capital"
variable is already valid.
4.4 Hypothesis Testing
4.4.1 Simple Linear Regression
H1 - Intensity of Facebook use will be positively associated with individuals’ perceived
bonding social capital.
63
Item-Total Statistics
Scale Mean if
Item Deleted
Scale Variance
if Item Deleted
Corrected Item-
Total Correlation
Cronbach's
Alpha if Item
Deleted
Bonding1 11.9750 3.683 .726 .558
Bonding2 12.3250 3.929 .467 .666
Bonding3 11.9900 3.698 .731 .557
Bonding4 12.0650 4.222 .566 .631
Bonding5 12.1650 5.304 .036 .836

Figure 4. 6 - Submodel Hypothesis 1
Variables Entered/Removedb
Model Variables Entered Variables Removed Method
dimension0
1 Intensitya . EnterTable 4. 21- Hypothesis 1 Variables
a. All requested variables entered.
b. Dependent Variable: Bonding Social Capital
Coefficientsa
Model Unstandardized Coefficients Standardized Coefficients
t Sig.B Std. Error Beta
1 (Constant) 2.202 .153 14.419 .000
Intensity .293 .053 .366 5.527 .000Table 4. 22 - Hypothesis 1 Regression
a. Dependent Variable: Bonding Social Capital
Regression equation for the above table is:
Bonding Social Capital = 2,202 + 0,293(Intensity)
Influence of Intensity variable on Bonding Social Capital.
From the above table, it is known that the ”t” value for Intensity variable is
5.527 at a significance level of 0.000 with a regression coefficient (β) of +0.293.
Because the significance value 0.000 < 0.05 ( = 5%) it can be concluded that
the intensity variable significantly and positively affects Bonding Social Capital.
In other words, the higher the Intensity variable, Bonding Social Capital variable
will also be higher. Thus, the first hypothesis (H1) which states that “Intensity
64

of Facebook use will be positively associated with individuals’ perceived
bonding social capital” is supported/accepted.
.
H2 - Intensity of Facebook use will be positively associated with individuals’ perceived
bridging social capital.
Figure 4. 7 - Submodel Hypothesis 2
Variables Entered/Removedb
Model Variables Entered Variables Removed Method
dimension0
1 Intensitya . Enter
Table 4. 23 - Table 4. 22 - Hypothesis 1 Regression
a. All requested variables entered.
b. Dependent Variable: Bridging Social Capital
Coefficientsa
Model
Unstandardized Coefficients
Standardized
Coefficients
t Sig.B Std. Error Beta
1 (Constant) 1.947 .133 14.636 .000
Intensity .409 .046 .532 8.849 .000Table 4. 24 - Hypothesis 2 Regression
a. Dependent Variable: Bridging Social Capital
Regression equation for the above table is:
Bridging Social Capital = 1,947 + 0,409(Intensity)
Influence of Intensity variable on Bridging Social Capital.
65
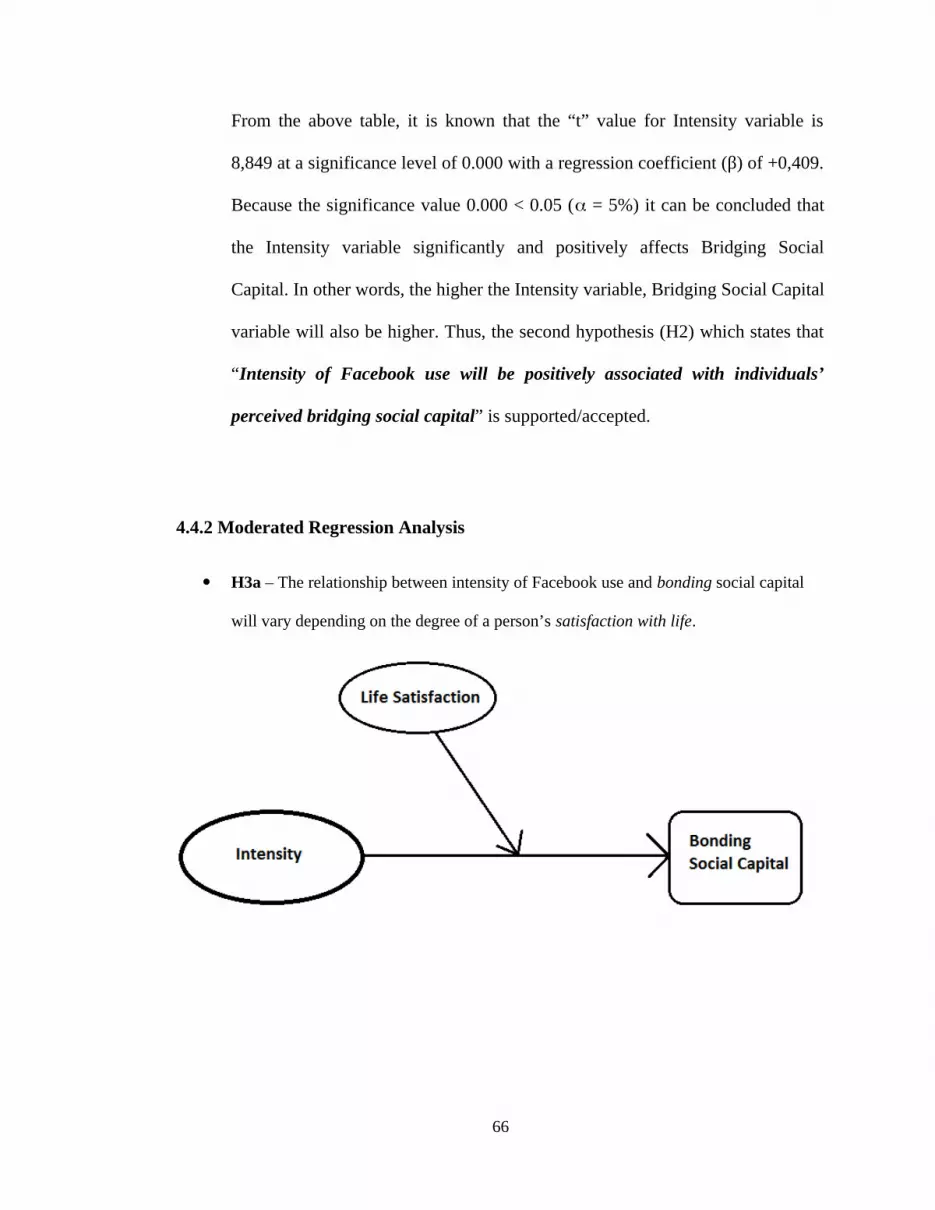
From the above table, it is known that the “t” value for Intensity variable is
8,849 at a significance level of 0.000 with a regression coefficient (β) of +0,409.
Because the significance value 0.000 < 0.05 ( = 5%) it can be concluded that
the Intensity variable significantly and positively affects Bridging Social
Capital. In other words, the higher the Intensity variable, Bridging Social Capital
variable will also be higher. Thus, the second hypothesis (H2) which states that
“Intensity of Facebook use will be positively associated with individuals’
perceived bridging social capital” is supported/accepted.
4.4.2 Moderated Regression Analysis
H3a – The relationship between intensity of Facebook use and bonding social capital
will vary depending on the degree of a person’s satisfaction with life.
66
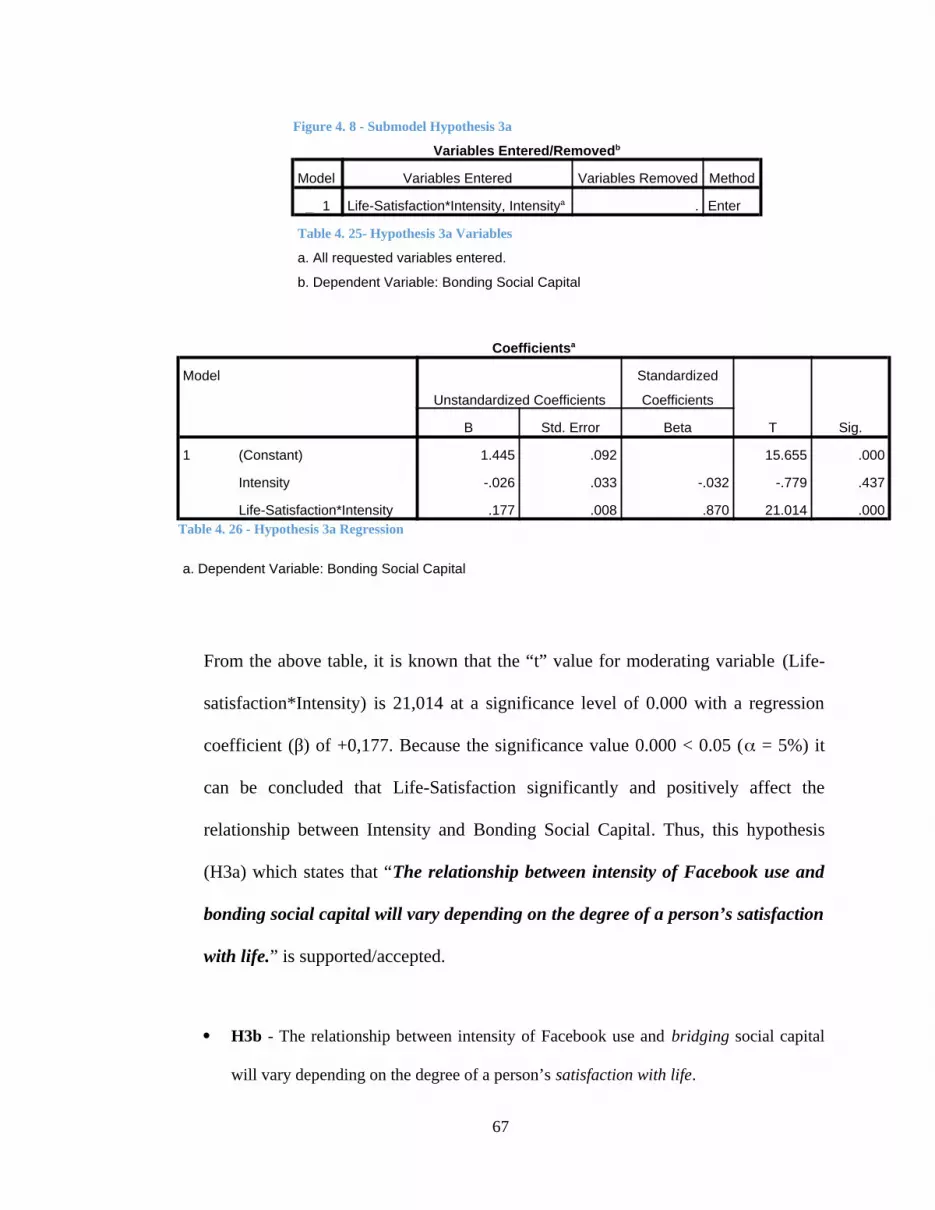
Figure 4. 8 - Submodel Hypothesis 3a
Variables Entered/Removedb
Model Variables Entered Variables Removed Method
dimension0
1 Life-Satisfaction*Intensity, Intensitya . Enter
Table 4. 25- Hypothesis 3a Variables
a. All requested variables entered.
b. Dependent Variable: Bonding Social Capital
From the above table, it is known that the “t” value for moderating variable (Life-
satisfaction*Intensity) is 21,014 at a significance level of 0.000 with a regression
coefficient (β) of +0,177. Because the significance value 0.000 < 0.05 ( = 5%) it
can be concluded that Life-Satisfaction significantly and positively affect the
relationship between Intensity and Bonding Social Capital. Thus, this hypothesis
(H3a) which states that “The relationship between intensity of Facebook use and
bonding social capital will vary depending on the degree of a person’s satisfaction
with life.” is supported/accepted.
H3b - The relationship between intensity of Facebook use and bridging social capital
will vary depending on the degree of a person’s satisfaction with life.
67
Coefficientsa
Model
Unstandardized Coefficients
Standardized
Coefficients
T Sig.B Std. Error Beta
1 (Constant) 1.445 .092 15.655 .000
Intensity -.026 .033 -.032 -.779 .437
Life-Satisfaction*Intensity .177 .008 .870 21.014 .000Table 4. 26 - Hypothesis 3a Regression
a. Dependent Variable: Bonding Social Capital

Figure 4. 9 - Submodel Hypothesis 3b
Variables Entered/Removedb
Model Variables Entered Variables Removed Method
dimension0
1 Life-Satisfaction*Intensity, Intensitya . Enter
Table 4. 27 - Hypothesis 3b Variables
a. All requested variables entered.
b. Dependent Variable: Bridging Social Capital
Coefficientsa
Model
Unstandardized Coefficients
Standardized
Coefficients
t Sig.B Std. Error Beta
1 (Constant) 1.482 .117 12.638 .000
Intensity .213 .042 .277 5.046 .000
Life-Satisfaction*Intensity .109 .011 .559 10.173 .000Table 4. 28 - Hypothesis 3b Regression
a. Dependent Variable: Bridging Social Capital
From the above table, it is known that the “t” value for moderating variable
(Life-satisfaction*Intensity) is 10,173 at a significance level of 0.000 with a
regression coefficient (β) of +0,109. Because the significance value 0.000 < 0.05
( = 5%) it can be concluded that Life-Satisfaction significantly and positively
affect the relationship between Intensity and Bridging Social Capital. Thus, this
68

hypothesis 3b (H3b) which states that “The relationship between intensity of
Facebook use and bridging social capital will vary depending on the degree of
a person’s satisfaction with life” was supported/accepted.
H4a - The relationship between intensity of Facebook use and bonding social capital
will vary depending on the degree of a person’s self-esteem.
Figure 4. 10 - Submodel Hypothesis 4a
69

Variables Entered/Removedb
Model Variables Entered Variables Removed Method
dimension0
1 Self-Esteem*Intensity, Intensitya . EnterTable 4. 29 - Hypothesis 4a Variables
a. All requested variables entered.
b. Dependent Variable: Bonding Social Capital
From the above table, it is known that the “t” value for moderating variable (Self-
Esteem*Intensity) is 8,746 at a significance level of 0.000 with a regression
coefficient (β) of +0,120. Because the significance value 0.000 < 0.05 ( = 5%) it
can be concluded that Self-Esteem significantly and positively affect the
relationship between Intensity and Bonding Social Capital. Thus, this hypothesis 4a
(H4a) which states that “The relationship between intensity of Facebook use and
bonding social capital will vary depending on the degree of a person’s self-
esteem” was supported/accepted.
H4b - The relationship between intensity of Facebook use and bridging social capital
will vary depending on the degree of a person’s self-esteem.
70
Coefficientsa
Model
Unstandardized Coefficients
Standardized
Coefficients
t Sig.B Std. Error Beta
1 (Constant) 1.761 .139 12.642 .000
Intensity .040 .054 .050 .752 .453
Self-Esteem*Intensity .120 .014 .585 8.746 .000Table 4. 30 - Hypothesis 4a Regression
a. Dependent Variable: Bonding Social Capital

Figure 4. 11 - Submodel Hypothesis 4b
Variables Entered/Removedb
Model Variables Entered Variables Removed Method
dimension0
1 Self-Esteem*Intensity, Intensitya . EnterTable 4. 31 - Hypothesis 4b Variables
a. All requested variables entered.
b. Dependent Variable: Bridging Social Capital
From the above table, it is known that the “t” value for moderating variable (Self-
Esteem*Intensity) is 20,398 at a significance level of 0.000 with a regression
coefficient (β) of +0,163. Because the significance value 0.000 < 0.05 ( = 5%) it
71
Coefficientsa
Model
Unstandardized Coefficients
Standardized
Coefficients
t Sig.B Std. Error Beta
1 (Constant) 1.350 .081 16.644 .000
Intensity .066 .031 .086 2.110 .036
Self-Esteem*Intensity .163 .008 .828 20.398 .000Table 4. 32 - Hypothesis 4b Regression
a. Dependent Variable: Bridging Social Capital

can be concluded that Self-Esteem significantly and positively affect the
relationship between Intensity and Bridging Social Capital. Thus, this hypothesis 4b
(H4b) which states that “The relationship between intensity of Facebook use and
bridging social capital will vary depending on the degree of a person’s self-
esteem” was supported/accepted.
4.4.3 Correlations
4.4.3.1 Correlation between Intensity and Bonding Social Capital
Correlations
Intensity
Bonding Social
Capital
Intensity Pearson Correlation 1 .366**
Sig. (2-tailed) .000
N 200 200
Bonding Social Capital Pearson Correlation .366** 1
Sig. (2-tailed) .000
N 200 200Table 4. 33 - Hypothesis 1 Correlation
**. Correlation is significant at the 0.01 level (2-tailed).
72

From the above table, it can be seen that the r value of the Pearson
Correlation obtained is 0.366 with a significance value of 0.000. Because the
significance value is less than 0.05, it can be concluded that there is a
positive and significant relationship between Intensity and Bonding Social
Capital.
4.4.3.2 Correlation between Intensity and Bridging Social Capital
Correlations
Intensity
Bridging Social
Capital
Intensity Pearson Correlation 1 .532**
Sig. (2-tailed) .000
N 200 200
Bridging Social Capital Pearson Correlation .532** 1
Sig. (2-tailed) .000
N 200 200Table 4. 34 - Hypothesis 2 Correlation
**. Correlation is significant at the 0.01 level (2-tailed).From the above table, it can be seen that the r value of the Pearson
Correlation obtained is 0,532 with a significance value of 0.000. Because the
significance value is less than 0.05, it can be concluded that there is a
positive and significant relationship between Intensity and Bridging Social
Capital.
4.4.4 R2 (Coefficient of Determination) & ANOVA (Analysis of Variance) Analysis
R2 or coefficient of determination is used to look at the contribution of the
independent variables towards the dependent variable. The higher the Adjusted
73

R Square, the better the regression model as it means that the independent
variable was able to explain the dependent variable.
ANOVA on the other hand, shows whether or not significant difference exist
between the variables tested. To indicate that significant statistical difference is
present, the significance level of a dependent variable must not exceed 0.05. The
significance level is located in the ANOVA table under the label “Sig”.
Hypothesis 1 Model Summary
ModelR R Square Adjusted R Square Std. Error of the Estimate
1 .366a .134 .129 .45993
Table 4. 35 - R-Square Analysis Hypothesis
74

Model Summary
ModelR R Square Adjusted R Square Std. Error of the Estimate
1 .366a .134 .129 .45993
From the table above, the impact of Intensity on Bonding Social Capital is shown
by the value of the coefficient of R Square is 0. 134, this means that the variation
in the variable Bonding Social Capital can be explained by the variable Intensity
by 13.4% The remaining 86.6% is the contribution of other independent variables
that are / are not included in this study. In other words, there are more factors
affecting Bonding Social Capital Intensity. But however, the variable Intensity is
good and is able to explain Bonding Social Capital, R2 value shows the model fit
that is the capability of the data in predicting the variable which in this case means
the data has an average prediction capability (13.4%).
ANOVAb
Model Sum of Squares df Mean Square F Sig.
1 Regression 6.461 1 6.461 30.543 .000a
Residual 41.884 198 .212
Total 48.345 199 Table 4. 36 - ANOVA Analysis Hypothesis 1 a. Predictors: (Constant), Intensity
a. Dependent Variable: Bonding Social CapitalThe author used F-test analysis to determine whether or not Intensity has an impact
on Bonding Social Capital. Upon calculation, the F-test value was found to be
30.543 with a probability (Sig.) of 0.000. This shows that there is a good
relationship between Intensity and Bonding Social Capital.
Hypothesis 2
75

Model Summary
Model
R R Square
Adjusted R
Square Std. Error of the Estimate
dimension0
1 .532a .283 .280 .40077Table 4. 37 - R-Square Analysis Hypothesis 2
a. Predictors: (Constant), Intensity
From the table above, the impact of Intensity on Bridging Social Capital is shown by
the value of the coefficient of R Square is 0. 283, this means that the variation in the
variable Bonding Social Capital can be explained by the variable Intensity by 28.3%
The remaining 71.7% is the contribution of other independent variables that are / are not
included in this study. In other words, there are more factors affecting Bridging Social
Capital Intensity. But however, the variable Intensity is good and is able to explain
Bridging Social Capital, R2 value shows the model fit that is the capability of the data in
predicting the variable which in this case means the data has a good prediction
capability (13.4%).
ANOVAb
Model Sum of Squares df Mean Square F Sig.
1 Regression 12.578 1 12.578 78.311 .000a
Residual 31.802 198 .161
Total 44.380 199Table 4. 38 - ANOVA Analysis Hypothesis 2
a. Predictors: (Constant), Intensity
b. Dependent Variable: Bridging Social Capital
The author used F-test analysis to determine whether or not Intensity has an impact on
Bridging Social Capital. Upon calculation, the F-test value was found to be 78.311 with
a probability (Sig.) of 0.000. This shows that there is a good relationship between
Intensity and Bridging Social Capital.
76

H3AModel Summary
Model R R Square Adjusted R Square Std. Error of the Estimate
dimension0
1 .856a .733 .730 .25610
Table 4. 39 - R-Square Analysis Hypothesis 3a
a. Predictors: (Constant), Life-Satisfaction*Intensity, Intensity
The Model Summary table shows that Intensity can explain 73.3% of variance in
Bonding Social Capital after introducing Life Satisfaction as the moderating
variable. The variable Intensity moderated with Life Satisfaction is quite good
and able to explain Bonding Social Capital; R2 value shows the model fit that is
the capability of the data in predicting the variable which in this case means the
data has a strong prediction capability (73.3%).
ANOVAb
Model
Sum of Squares df
Mean
Square F Sig.
1 Regression 35.424 2 17.712 270.054 .000a
Residual 12.921 197 .066
Total 48.345 199Table 4. 40 - ANOVA Analysis Hypothesis 2
a. Predictors: (Constant), Life-Satisfaction*Intensity, Intensity
b. Dependent Variable: Bonding Social Capital
From the table above, it can clearly be seen that the relationship between Intensity and
Bonding Social Capital is quite significant after being moderated by Life Satisfaction
variable. Upon calculation, the F-test value was found to be 270.054 with a probability
77

(Sig.) of 0.000. This shows that there is a good relationship between Intensity and
Bonding Social Capital moderated with Life Satisfaction.
H3B
Model Summary
Model R R Square Adjusted R Square Std. Error of the Estimate
dimension0
1 .728a .530 .525 .32532Table 4. 41 - R-Square Analysis Hypothesis 3b
a. Predictors: (Constant), Life-Satisfaction*Intensity, Intensity
The Model Summary table shows that Intensity can explain 53.0% of variance in
Bridging Social Capital after introducing Life Satisfaction as the moderating variable.
The variable Intensity moderated with Life Satisfaction is quite good and able to
explain Bridging Social Capital; R2 value shows the model fit that is the capability of
the data in predicting the variable which in this case means the data has a strong
prediction capability (53.0%).
ANOVAb
Model Sum of Squares df Mean Square F Sig.
1 Regression 23.531 2 11.765 111.168 .000a
Residual 20.849 197 .106
Total 44.380 199Table 4. 42 - ANOVA Analysis Hypothesis 3b
a. Predictors: (Constant), Life-Satisfaction*Intensity, Intensity
b. Dependent Variable: Bridging Social Capital
From the table above, it can clearly be seen that the relationship between Intensity and
Bridging Social Capital is quite significant after being moderated by Life Satisfaction
variable. Upon calculation, the F-test value was found to be 111.168 with a probability
78

(Sig.) of 0.000. This shows that there is a good relationship between Intensity and
Bonding Social Capital moderated with Life Satisfaction.
H4A
Model Summary
Model R R Square Adjusted R Square Std. Error of the Estimate
dimension0
1 .613a .376 .370 .39134Table 4. 43 - R-Square Analysis Hypothesis 4a
a. Predictors: (Constant), Self-Esteem*Intensity, Intensity
The Model Summary table shows that Intensity can explain 37.6% of variance in
Bonding Social Capital after introducing Self-Esteem as the moderating variable. The
variable Intensity moderated with Self-Esteem is quite good and able to explain
Bonding Social Capital; R2 value shows the model fit that is the capability of the data
in predicting the variable which in this case means the data has a good prediction
capability (37.6%).
ANOVAb
Model Sum of Squares df Mean Square F Sig.
1 Regression 18.174 2 9.087 59.336 .000a
Residual 30.170 197 .153
Total 48.345 199Table 4. 44 - ANOVA Analysis Hypothesis 4a
a. Predictors: (Constant), Self-Esteem*Intensity, Intensity
b. Dependent Variable: Bonding Social Capital
From the table above, it can clearly be seen that the relationship between Intensity and
Bonding Social Capital is quite significant after being moderated by Self-Esteem
79

variable. Upon calculation, the F-test value was found to be 59.336 with a probability
(Sig.) of 0.000. This shows that there is a good relationship between Intensity and
Bonding Social Capital moderated with Self-Esteem.
H4B
Model Summary
Model R R Square Adjusted R Square Std. Error of the Estimate
dimension0
1 .877a .770 .767 .22776Table 4. 45 - R-Square Analysis Hypothesis 4b
a. Predictors: (Constant), Self-Esteem*Intensity, Intensity
The Model Summary table shows that Intensity can explain 77.0% of variance in
Bridging Social Capital after introducing Self-Esteem as the moderating variable. The
variable Intensity moderated with Self-Esteem is quite good and able to explain
Bridging Social Capital; R2 value shows the model fit that is the capability of the data
in predicting the variable which in this case means the data has a strong prediction
capability (77.0%).
ANOVAb
Model Sum of Squares df Mean Square F Sig.
1 Regression 34.161 2 17.081 329.275 .000a
Residual 10.219 197 .052
Total 44.380 199Table 4. 46 - ANOVA Analysis Hypothesis 4b
a. Predictors: (Constant), Self-Esteem*Intensity, Intensity
b. Dependent Variable: Bridging Social Capital
From the table above, it can clearly be seen that the relationship between Intensity and
Bridging Social Capital is quite significant after being moderated by Self-Esteem
80

variable. Upon calculation, the F-test value was found to be 329.275 with a probability
(Sig.) of 0.000. This shows that there is a good relationship between Intensity and
Bonding Social Capital moderated with Self-Esteem.
CHAPTER V
DISCUSSION
This chapter will summarize and conclude the result of the result that has been
elaborated in the previous chapter. Besides concluding the study, the researcher will
also discuss whether or not the research objective(s) which was discussed in the first
chapter of this study is answered by the study that has been conducted.
5.1 Discussion
Table 5.1 below is based on the statistical analysis conducted on the study. The
table below consist of the hypothesis number (For example: H1, H2, H3a, etc.),
the variable(s) involved in that hypothesis, the moderating variables used in the
hypothesis, the R2 result, F value, Significance level (Sig.), Correlation analysis
result as well as the result of the hypothesis itself (Accepted or Rejected).
The table below will be further discussed by the researcher to describe the
results of the
81

Hypothesis Variable Moderator R2 F Sig. Correlatio
n
Result
H1Intensity
- Bonding
- .134 30.543 .000a
.366** Accepted
H2Intensity
- Bridging
- .283 78.311 .000a .532** Accepted
H3aIntensity
- Bonding
Life Satisfaction
.733270.05
4.000a - Accepted
H3bIntensity
- Bridging
Life Satisfaction
.530111.16
8.000a - Accepted
H4aIntensity
- Bonding
Self-Esteem
.376 59.336 .000a - Accepted
H4bIntensity
- Bridging
Self-Esteem
.770329.27
5.000a - Accepted
**. Correlation is significant at the 0.01 level (2-tailed).
Table 5. 1 - Summary of SPSS Analysis
As we can see from the table above, all 6 hypotheses involved in the model /
framework has been accepted. This means that the model is very good in
predicting and/or determining as well as answering the research questions stated
82

in the beginning of this study. At the same time, as all the hypotheses are
accepted; the only way to differentiate / determine the significance of each
relationship is by looking at the results or the values obtained from the statistical
analysis which has been summarized in the table above.
Hypothesi
s
Variable Moderator R2 F Sig. Correlation Result
H1Intensity
- Bonding
- .134 30.543 .000a
.366** Accepted
H2Intensity
- Bridging
- .283 78.311 .000a .532** Accepted
**. Correlation is significant at the 0.01 level (2-tailed).
Table 5. 2 - Summary of Hypothesis Result 2
Comparing the relationship between Intensity of Facebook use with Bonding
or Bridging can be seen from the R2 value, F value as well as the result of the
correlation analysis. The relationship between Intensity of Facebook use
with Bonding Social Capital obtained an R2 of 0.134 or 13.4%. This means
that Bonding Social Capital can only explain 13.4% of the variance in the
Intensity variable. On the other hand, Bridging Social Capital obtained an
R2 value of 0.283 or 28.3%. This means that Bridging Social Capital can
explain up to 28.3% of the variance in the Intensity variable. From this
alone, we can conclude that Bridging Social Capital is more interconnected
with the Intensity of Facebook use. Using the F value to determine which
83

relationship is more significant has led to the same conclusion that Intensity
of Facebook use has a more significant relationship with Bridging Social
Capital compared to Bonding Social Capital. Relationship between Intensity
of Facebook use and Bonding Social Capital obtained an F value of 30.543
while Bridging Social Capital obtained 78.311. Again, Bridging Social
Capital proved to have a much more significant relationship with Intensity of
Facebook use. Correlation Analysis was also conducted to compare the
correlation of Intensity of Facebook use with both dependent variables,
Bonding and Bridging Social Capital. Bonding Social Capital obtained 0.366
while Bridging Social Capital obtained 0.532 when correlated to Intensity of
Facebook use. This shows that Bridging Social Capital is more correlated to
Intensity of Facebook Use.
All the statistical analysis conducted have proven that the relationship
between Intensity of Facebook use with Bridging Social Capital is more
significant compared to Bonding Social Capital. This means that the
intensity of an individual’s Facebook usage will help an individual more in
bridging their social capital, or in other words; this study have proven that
the intensity of an individual’s Facebook use will affect these individual’s
weaker ties, creating stronger relationship with other social beings on
Facebook which is harder to come by for many individuals. Bridging Social
Capital is an important part of a person’s social capital; it exposes an
individual to diverse information which will keep an individual growing,
84

changing, as well as inventing themselves individually and socially.
Bridging social capital is also critical in building mutual respect, empathy
and understanding. Bridging Social Capital is a source of diversity and
provides real value for individual’s civic health (Cobb, 2011) (Burke, Kraut,
& Marlow, Social Capital on Facebook: Differentiating Uses and Users,
2011).
The results of the first and second hypothesis have been thoroughly
explained above. However, these two hypotheses does not include the
indices of psychological well-being i.e. self-esteem and satisfaction with life
which are an important part of this study. Apart from trying to find out the
type of social capital affected through the intensity of an individual’s
Facebook use, this study is also trying to discover whether an individual’s
psychological well-being affects or play a part in determining the type of
social capital affected through the intensity of Facebook use. “In the past
decade, a number of studies have explored how Internet use might be related
to psychological and social well-being with mixed results (e.g., Kraut et al.,
1998; Kraut et al., 2002; McKenna & Bargh, 2000; Nie, 2001; Shaw& Gant,
2002; Valkenburg & Peter, 2007)” (Steinfeld, Lampe, & Ellison, 2008).
Some results from the above examples have proven that intense internet use
is associated with loneliness, depression and stress. On the other hand, there
were also several results that has proven that internet have positive impacts
on psychological well-being as online interactions was able to mitigate any
85

loss of direct or offline communication with others due to the time spent
online (Steinfeld, Lampe, & Ellison, 2008).
There were also experiments that have shown that online engagements have
decreased perceived loneliness as well as depression while at the same time
increases social support and self-esteem. Another study has proven that
adolescents who are socially anxious have also found internet to be far more
valuable for intimate communication or relationship (Steinfeld, Lampe, &
Ellison, 2008).
As per this study, below are the statistical results we have gathered
Hypothesis Variable Moderator R2 F Sig. Correlatio
n
Result
H3aIntensity
- Bonding
Life Satisfaction
.733270.05
4.000a - Accepted
H3bIntensity
- Bridging
Life Satisfaction
.530111.16
8.000a - Accepted
H4aIntensity
- Bonding
Self-Esteem
.376 59.336 .000a - Accepted
H4bIntensity
- Bridging
Self-Esteem
.770329.27
5.000a - Accepted
Table 5. 3 - Summary of Hypothesis Result 3
86
This study have also proven that psychological well-being play a part in
determining what type of social capital affected through the use of social
media; in this case, Facebook. The results of this study which can be seen in
Table 5.3 have proven that psychological factors (self-esteem and life
satisfaction) significantly affect the relationship between Intensity of
Facebook use with Bonding as well as Bridging Social Capital.
From the table above (Table 5.3), we can see that the hypotheses are
accepted; this means that psychological factors such as self-esteem and life
satisfaction play a significant role in the overall model/framework.
According to the results obtained, Bonding Social Capital is more affected
by individual’s satisfaction with life compared to their self-esteem. This
conclusion was derived after seeing the R2 results obtained from the
statistical analysis previously conducted. The R2 obtained when putting Life
Satisfaction as a moderating factor between Intensity and Bonding social
capital was 0.73 or 73% while Self-Esteem was only able to obtain 0.376 or
37.6% when acting as a moderating factor between Intensity and Bonding
Social Capital. The conclusion that can be drawn from this result is that
people with high life satisfaction uses Facebook more to maintain stronger
ties with family and close friends compared to people with high self-esteem.
On the other hand, people with high self-esteem are able to affect Bridging
Social Capital more than people with high life satisfaction. With R2 value of
0.77 or 77%, it can be concluded that Self-Esteem plays a significant role in
affecting the relationship between Intensity of Facebook use and Bridging
87

Social Capital. Life satisfaction was only able to get 0.53 or 53% when used
as a moderating factor between Intensity of Facebook use and Bridging
Social Capital.
In conclusion people with higher life satisfaction tend to use Facebook more
to maintain their strong ties with close friends and family while people with
high self-esteem is confident enough to maintain and strengthen weaker ties
through Facebook.
Looking at the F value and significance level of both moderating variable
(self-esteem and life satisfaction), it is quite clear that both moderating
variable has a quite significant impact on the relationship between intensity
of Facebook use with both Bridging and Bonding Social Capital. Life
satisfaction as a moderating factor was able to obtain an F value of 270.054
and 111.168 against Bonding and Bridging Social Capital respectively. At a
significance level of .000a, both results mean that Life Satisfaction has quite
an impact on both the relationships (Intensity – Bonding and Intensity –
Bridging). Self-Esteem also made quite an impact on both the relationships
mentioned above by obtaining an F value of 59.336(Intensity – Bonding)
and 329.275 (Intensity – Bridging) at a significance value of .000a. Like the
previous analysis, this analysis also has a similar conclusion that both
moderating variables has quite an impact on the relationship between
Intensity of Facebook use and Bridging Social Capital as well as the
relationship between Intensity of Facebook use and Bonding Social Capital.
88

This study has successfully proven not only that psychological factor(s)
affect the type of Social Capital affected through use of Facebook, but it has
also proven that these psychological factors has a quite significant effect on
the relationship between intensity of Facebook use and Bridging or Bonding
Social Capital itself.
The same conclusion was brought about by Valkenburg et al. in the year
2006 as well as Kraut et al. in the year 2002 (Valkenburg, Peter, &
Schouten, 2006) (Kraut, Kiesler, Boneva, Cumming, Helgeson , &
Crawford, 2002).
5.2 Additional Information
Measures of Facebook usage to meet new people & connect with existing offline contacts:
[I have used Facebook to check out someone I met socially]
Frequency Percent Valid Percent Cumulative Percent
Valid Strongly Disagree 9 4.5 4.5 4.5
Disagree 19 9.5 9.5 14.0
Agree 132 66.0 66.0 80.0
Strongly Agree 40 20.0 20.0 100.0
Total 200 100.0 100.0
Table 5. 4- I have used Facebook to check out someone I met socially
89

Figure 5. 1 - I have used Facebook to check out someone I met socially
This measures the number of people (out of 200) who have used Facebook to check out
someone he/she have met socially. This can be considered a measure of bridging social
capital through Facebook as connecting with a person you just met socially means
trying to strengthen a ‘weak tie’ which is clearly considered bridging social capital.
Through the result above it is quite clear that there is quite a strong bridging social
capital potential through Facebook.
[I use Facebook to learn more about other people in my class / workplace]
Frequency Percent Valid Percent Cumulative Percent
Valid Strongly Disagree 4 2.0 2.0 2.0
Disagree 32 16.0 16.0 18.0
Agree 120 60.0 60.0 78.0
Strongly Agree 44 22.0 22.0 100.0
Total 200 100.0 100.0
Table 5. 5 - I use Facebook to learn more about other people in my class / workplace
90

Figure 5. 2 - I use Facebook to learn more about other people in my class / workplace
The result above is trying to show how many people have used Facebook to learn more
about people in his/her class/workplace. This can be considered a bonding social capital
scale as people in his/her class or workplace would mean that he/she already has an
established connection or tie with the person. Hence, the result above proves how many
people use Facebook to ‘bond’ with people in their class/workplace. In conclusion,
there is also a quite significant bonding social capital potential through Facebook.
[I use Facebook to learn more about other people living near me]
Frequency Percent Valid Percent Cumulative Percent
Valid Strongly Disagree 7 3.5 3.5 3.5
Disagree 52 26.0 26.0 29.5
Agree 113 56.5 56.5 86.0
Strongly Agree 28 14.0 14.0 100.0
Total 200 100.0 100.0
Table 5. 6 - I use Facebook to learn more about other people living near me
91

Figure 5. 3 - I use Facebook to learn more about other people living near me
The result above can be considered both a scale of bonding as well as bridging social
capital. “Using Facebook to learn more about people living near me” failed to specify if
the individual already know the person or the ‘person living near me’ individual is the
new owner of a house/apartment in the neighborhood. Hence, this scale can be
classified as a scale to measure both bonding and bridging social capital. The result of
the scale above shows that social capital has a high potential of getting affected through
Facebook.
[I use Facebook to keep in touch with my old friends]
Frequency Percent Valid Percent Cumulative Percent
Valid Strongly Disagree 2 1.0 1.0 1.0
Disagree 6 3.0 3.0 4.0
Agree 113 56.5 56.5 60.5
Strongly Agree 79 39.5 39.5 100.0
Total 200 100.0 100.0
Table 5. 7 - I use Facebook to keep in touch with my old friends
92

Figure 5. 4 - I use Facebook to keep in touch with my old friends
The scale above purely measures bonding social capital that occurs through Facebook.
The name of the scale itself which is, “I use Facebook to keep in touch with my old
friends” clearly shows that there is already an established strong bond between the
individuals involved. The result above shows that bonding social capital is quite strong
when it comes to keeping in touch with old friends through Facebook.
[I use Facebook to meet new people]
Frequency Percent Valid Percent Cumulative Percent
Valid Strongly Disagree 46 23.0 23.0 23.0
Disagree 83 41.5 41.5 64.5
Agree 54 27.0 27.0 91.5
Strongly Agree 17 8.5 8.5 100.0
Total 200 100.0 100.0
Table 5. 8 - I use Facebook to meet new people
93

Figure 5. 5 - I use Facebook to meet new people
Unlike the scale above, this scale is purely trying to measure bridging social capital that
occurs through Facebook. In terms of this scale, “meet new people” means that this can
be considered the purest kind of bridging social capital there is and the result shows that
there is quite a mixed response from the respondents. Nevertheless, this purest scale of
bridging of social capital was able to get 35.5%. This means that more than one-third of
the respondents use this purest kind of bridging social capital through Facebook which
is quite a significant result in the point of view of Bridging Social Capital through
Facebook.
CHAPTER VI
CONCLUSION & RECOMMENDATION
This chapter will summarize and conclude all the analysis, result and interpretations that
have been elaborated in the previous chapter of the research. The objective of this
94

chapter is to conclude the entire study and discuss the research questions that have been
answered as well as the objectives this research were able to reach. At the end of the
chapter, the researcher will also discuss the limitations of the current research and
provide future research recommendations.
6.1 Conclusion
This study titled “Social Capital on Facebook: Bonding or Bridging
Relationships between Individuals?” has reached; in one way or another, all the
objectives of the study mentioned in the beginning of this study.
All the analysis, results and interpretations discussed in the previous chapter as
well as the conclusions drawn above have been derived from this research. The
discussions of the results in the previous chapter were also able to answer all of
the research objectives as well as research questions mentioned in the beginning
(Chapter 1) of this research.
The research questions answered are as follows:
Research Question 1
Does the level of intensity of an Individual’s Facebook use affect his/her
perceived social capital? - YES
Research Question 2
95
What type of an individual’s social capital (bridging or bonding) is
affected by using Facebook to communicate and socialize? – BOTH
BRIDGING & BONDING SOCIAL CAPITAL AFFECTED.
BRIDGING SOCIAL CAPITAL MORE SIGNIFICANTLY
AFFECTED.
Research Question 3
Does the intensity of Facebook use have a positive impact on an
individual’s perceived bridging social capital? - YES
Research Question 4
Does the intensity of Facebook us have a positive impact on an
individual’s perceived bonding social capital? - YES
Research Question 5
Is an individual’s life satisfaction and self-esteem a factor in the level of
social capital (bridging or bonding) affected through the intensity of
his/her Facebook use? – YES
The objectives of this research which have been reached by this study are as
follows:
- This study has been able to prove that Intensity of Facebook use actually
affects an individual’s social capital. At the same time, this study has also been
able to prove that Bridging Social Capital is more significantly affected by
intensity of Facebook use compared to Bonding Social Capital.
96

In terms of an individual’s psychological well-being, this study have proven that
they do play a role in affecting not only the level of social capital affected
through the use of Facebook but this study have also proved that an individual’s
psychological well-being also affect the type of social capital affected.
6.2 Limitation
Due to the limited time and resources available for the researcher to conduct the
research, there are a few unavoidable limitations which the researcher would
like to discuss:
The researcher was only able to use questionnaires as the method of data
collection due to the limited resources available to the researcher.
The researcher was only able to get 200 respondents which are not quite
enough to prove the accuracy of this study.
The demographic results obtained from the sample(s) are not diverse
enough for comparison and hypothesis testing. The demographic results
shown in this research are just to inform the readers of the respondents’
demography.
Due to the researcher’s limited knowledge on data analysis, the
researcher could only conduct simple linear regression instead of
multiple linear regression which might have improved the results of the
data analysis and improve the research as a whole.
97

6.3 Future Research Recommendations
Here are a few recommendations the researcher would like to provide future
researchers who are conducting a research on this topic:
Try to wisely utilize the time provided in conducting the research to
collect more data and information available from different sources.
In order to improve data accuracy, future researchers can expand the
sample size
Try to collect data from diverse respondents in order to be able to use the
demographics for comparison and hypothesis testing.
Prior to conducting his/her research, future researchers should maximize
their knowledge on data analysis in order to be able to perform a much
needed multiple linear regression and/or other data analysis method to be
able to provide the best analytical result and extract all the information
possible from the data obtained throughout the data collection process.
Bibliography
Abram, C. (2007, February 23). The Facebook Blog. Retrieved March 22, 2013, from Have a taste...: http://blog.facebook.com/blog.php?post=2245132130
Achelis, S. B. (2011). CORRELATION ANALYSIS. Retrieved 24 2013, May, from Technical Analysis from A to Z: http://www.metastock.com/Customer/Resources/TAAZ/?c=3&p=44
98

Agence France-Presse. (2012, October 5). Facts and figures about Facebook. Retrieved March 14, 2013, from Inquirer Technology: http://technology.inquirer.net/18188/facts-and-figures-about-facebook-2
Andrew Lipsman. (2007, July 31). ComScore Inc. Retrieved March 22, 2013, from Social Networking Goes Global: http://www.comscore.com/Insights/Press_Releases/2007/07/Social_Networking_Goes_Global
Arrington, M. (2005, September 7). Techcrunch. Retrieved March 22, 2013, from 85% of College Students use Facebook: http://www.techcrunch.com/2005/09/07/85-of-college-students-use-facebook
Bainum, B. (2010, October 21). Bowdoin. Retrieved May 14, 2013, from Social Capital and Use of LinkedIn: http://learn.bowdoin.edu/courses/sociology-022-fall-2010-bbainum/2010/10/social-capital-and-use-of-linkedin/
Bargh, J. A., McKenna, K. Y., & Fitzsimons, G. M. (2002). Can you see the real me? Activation and expression of the "true self" on the Internet. Journal of Social Issues, 58(1), 33-48.
Bargh, J., & McKenna, K. (2004). The Internet and Social Life. Annual Review of Psychology, 55(1), 573-590.
Baron, R. M., & Kenny, D. A. (1986). The moderator-mediator variable distinction in social psychological research: Conceptual, strategic, and statistical considerations. Journal of Personality and Social Psychology, 5(6), 1173-1182.
Bigelow, M. (2007, October 28). Matt Bigelow – Digital Media Manager. Retrieved May 14, 2013, from Facebook and “maintained social capital” – a study at Michigan State University: http://www.matthewbigelow.com/2007/10/28/facebook-and-maintained-social-capital-a-study-at-michigan-state-university/
Boase J, H. J. (2006). The Strength of Internet Ties. Washington, DC: Pew Internet & American Life Project.
Bourdieu, P. (1985). Handbook of Theory and Research for the Sociology of. New York: Greenwood Press.
Boyd, D. M., & Donath, J. (2004). Public Displays of Connection. BT Technology Journal, 22(4), 71.
Boyd, D. M., & Ellison, N. B. (2007). Social Network Sites: Definition, History, and Scholarship. Journal of Computer-Mediated Communication, 2.
Burke, M., Kraut, R., & Marlow, C. (2011). Social Capital on Facebook: Differentiating Uses and Users. International Journal of Computer Science Issues, 2-4.
Burke, M., Marlow, C., & Lento, T. (2010). Social network activity and social well-being. New York, USA: ACM.
Cobb, J. (2011, May 20). Your Friends on Facebook: Building Social Capital. (J. Cobb, Ed.)
99

Daft, R. L., Lengel, R. H., & Trevino, L. K. (1987). Message Equivocality, Media Selection & Manager Performance: Implications for Information Systems. MIS Quarterly, 355-368.
December, J. (1996). Units of analysis for Internet communication. Journal of Computer-Mediated Communication / Journal of Communication, 1(4).
December, J. (1997). The World Wide Web Unleashed 1997. Indianapolis: Sams.net Publishing.
Diener, E., Suh, E., & Oishi, S. (1997). Recent findings on subjective well-being. Indian Journal of Clinical Psychology, 24(1), 25-41.
Ellison, N. B., Steinfeld, C., & Lampe, C. (2011). Connection Strategies: Social Capital Implications of Facebook-enabled Communication Practices. New Media & Society.
Ertan, A. (2011). THE DETERMINANTS OF SOCIAL CAPITAL ON FACEBOOK. SCIENCE AND TECHNOLOGY POLICIES RESEARCH CENTER, 1-3.
Freiert, M. (2007, September 14). Compete.com. Retrieved March 2013, 2013, from 14 Million people interacted with Facebook Applications in August: http://blog.compete.com/2007/09/14/facebook-activity-breakdown-application/
Granovetter, M. (1973). The strength of weak ties. American Journal of Sociology, 1360–1380.
Hancock, J., Toma, C., & Fenner, K. (2008). I know something you don't: the use of asymmetric personal information for interpersonal advantage. New York: ACM.
Hans, W. (2009). Does business page in Facebook give positive impact to businesses? E-Theses Binus University, 2-4.
Helliwell, J. F., & Putnam, R. D. (2004, September 29). The social context of well-being. Philosophical Transactions of the Royal Society, 359(1449), 1435-1446.
Jeff Ginger. (2007, Novermber). The Facebook Project, REVISION ONE. Retrieved March 22, 2013, from The Facebook Project Web site: THEFACEBOOKPROJECT.COM
Kanayolal, E. D. (2012). THE EFFECT OF SITE CHARACTERISTICS ON RELATIONSHIP QUALITY FACTORS AND E-WORD OF MOUTH IN ONLINE SHOPPING: AN OBSERVATION CONDUCTED IN JAKARTA. Thesis BINUS. Jakarta, DKI Jakarta, Indonesia: Binus International.
Kiesler, S., J, S., & McGuire, T. (1984). Social psychological aspects of computer mediated communications. American Psychologist, 1123-1134.
Kraut, R., Kiesler, S., Boneva, B., Cumming, J., Helgeson , V., & Crawford, A. (2002). Internet paradox revisited. Journal of Social Issues, 58, 49−74.
MARKHAM, A. N. (2003). Internet communication as a tool for qualitative research. Thousand Oaks, California: Sage.
N.K.Malhotra. (2012). Basic Marketing Research. Canada: Pearson.
National Service-Learning ClearingHouse. (2013). Defining Research Variables (Operationalization). Retrieved May 27, 2013, from National Service-Learning Clearinghouse - America's Most Comprehensive Service-Learning Resource:
100

http://www.servicelearning.org/service-learning-research-primer/defining-research-variables-operationalization
Nicole, Andrew, Justin, & Laura. (2010). Introduction. Facebook Usage and its Impact on Social Capital, 1.
Nie, N. H., Erbring, L., & D, S. H. (2002). Internet use, interpersonal relations and sociability: A time diary study. Blackwell: Oxford.
Panth, S. (2010, March 6). Bonding vs. Bridging. Retrieved June 9, 2013, from People, Space, Deliberation: http://blogs.worldbank.org/publicsphere/bonding-and-bridging
Putnam, R. (1995). Bowling alone: America’s declining social capital. Journal of Democracy 6, 65-78.
Putnam, R. D. (2000). Bowling Alone: The Collapse and Revival of American Community. New York: Simon & Schuster.
Resnick, P. (2001). Beyond Bowling Together: Sociotechnical Capital. (J.Carroll, Ed.) HCI in the New Millenium, 247-272.
Rosenberg, M. (1989). Society and the Adolescent Self-Image. Middletown: Wesleyan University Press.
Ross, C. (2010). All Forms of CMC are not Created Equally: Social Capital in Facebook, Instant Messaging and Online Gaming. Electronic Theses and Dissertations.
Sachoff, M. (2009, December 11). Webpronews.com. Retrieved March 23, 2013, from Survey Finds Facebook Most Popular Communication Tool: http://www.webpronews.com/survey-finds-facebook-most-popular-communication-tool-2009-12
Sekaran, U., & Bougie, R. (2010). Research Methods for Business (5 ed.). Great Britain: Wiley.
Steinfeld, C., Lampe, C., & Ellison, N. B. (2008, August 17). Social capital, self-esteem, and use of online social network sites: A longitudinal analysis. Journal of Applied Developmental Psychology, 29, 434-445.
Valkenburg, D. M., Peter, J., & Schouten, A. P. (2006, October 11). Friend Networking Sites and Their Relationship to Adolescents’ Well-Being and Social Self-Esteem. Cyberpschology&Behavior, 9(5).
Wellman, B., & Wortley, S. (1990). Different Strokes from Different Folks: Community Ties and Social Support. The American Journal of Sociology, 96(3), 558-588.
Wellman, B., Quan-Haase, A., Witte, J., & Hampton, K. (2001). Does the Internet increase, decrease, or supplement social capital? Social networks, participation, and community commitment. American Behavioral Scientist, 45(3), 437-456.
Wikipedia Corporation. (2013, March 12). History of Facebook. Retrieved March 13, 2013, from Wikipedia: http://en.wikipedia.org/wiki/History_of_Facebook
Williams, D. (2006). On and Off the 'net: Scales for Social Capital in an Online Era. Journal of Computer-Mediated Communications, 11(2), 11.
101
Wright, K. B., & Webb, L. M. (2011). Computer Mediated Communication in Personal Relationships. New York: Peter Lang Publishing.
Appendix
Appendix 1 - Questionnaire
Respected respondent, My Name is Mohit Kanayolal from Binus International University. I am currently doing my research in order to complete my undergraduate study. My research topic is “Social Capital on Facebook – Bridging or Bonding relationships between individuals. A preliminary study in Indonesia”. I need your participation by filling this questionnaire for my research. Thank you very much for your time and participation in filling out this questionnaire.
102

Are you a Facebook user?
A. Yes B. No
If your answer to the above question is “No”, thank you for your attention and participation.
If “Yes” please proceed by answering the following questions:
1. Sex?A. MaleB. Female
2. Age?
A. <15 B. 15-24
C. 25-34 D. >343. Last Education?
A. High School/SMA B. Diploma/D3C. Undergraduate/S1 D. Graduate/S2E. Other: ___________
4. Current Occupation?
A. Student B. EmployedC. Entrepreneur D. UnemployedE. Other: __________
5. Residence:A. JakartaB. Outside Jakarta, Please Specify: ____________
6. On average, how many hours do you spend on the Internet daily?
A. < 1 Hour B. 1 – 2 HoursC. 2 – 3 Hours D. > 3 Hours
7. On average, how many minutes per day have you spent on Facebook
A. Less than 10 B. 10 – 30C. 31 – 60 D. 1 – 2 HoursE. 2 -3 Hours F. > 3 Hours
8. How many Facebook “Friends” do you have at the moment?
A. < 10 B. 11 – 50
103

C. 51 – 100 D. 101 – 150E. 151 – 200 F. 201 – 250G. 251 – 300 H. 301 – 400I. > 400
Measures of Facebook Usage
Strongly Disagree
Disagree Agree
Strongly Agree
Facebook is part of my everyday activity
1 2 3 4
I am proud to tell people I’m on Facebook
1 2 3 4
Facebook has become part of my daily routine
1 2 3 4
I feel out of touch when I haven’t logged onto Facebook for a while
1 2 3 4
I feel I am part of the Facebook community
1 2 3 4
I would be sorry if Facebook shut down
1 2 3 4
Measures of Facebook Usage to Meet New People & Connect with Existing Offline Contacts
Strongly Disagree
Disagree Agree Strongly Agree
Off to OnlineI have used Facebook to check out someone I met socially
1 2 3 4
I use Facebook to learn more about other people in my class / workplace
1 2 3 4
I use Facebook to learn more about other people living near me
1 2 3 4
I use Facebook to keep in 1 2 3 4
104

touch with my old friendsOn to OfflineI use Facebook to meet new people
1 2 3 4
Measures for Psychological Well-Being
Strongly Disagree
Disagree Agree Strongly Agree
Self-Esteem ScaleI feel that I’m a person of worth, at least on an equal plane with others
1 2 3 4
I feel that I have a number of good qualities
1 2 3 4
All in all, I am inclined to feel that I am a failure
1 2 3 4
I am able to do things as well as most other people
1 2 3 4
I feel I do not have much to be proud of
1 2 3 4
I take a positive attitude toward myself
1 2 3 4
On the whole, I am satisfied with myself
1 2 3 4
Satisfaction with Life ScaleIn most ways, my university / work life is close to my ideal
1 2 3 4
The conditions of my university / work life are excellent
1 2 3 4
I am satisfied with my university / work life
1 2 3 4
So far I have gotten the important things I want (university & work life)
1 2 3 4
If I could live my university life/ work life over, I would change almost nothing
1 2 3 4
Social Capital Scale
105

Strongly Disagree
Disagree Agree
Strongly Agree
Bridging Social Capital ScaleI feel I am part of the community at work/university
1 2 3 4
I am interested in what goes on in my university/workplace
1 2 3 4
I would be willing to contribute to my university / workplace after graduation / outside of work hours
1 2 3 4
Interacting with different people in my university/workplace makes me want to try new things
1 2 3 4
Interacting with different people in my university/workplace makes me feel like a part of a larger community
1 2 3 4
I am willing to spend time to support general activities at work / university
1 2 3 4
I come into contact with new people all the time ( at work / in campus)
1 2 3 4
Interacting with people at work / university reminds me that everyone in the world is connected
1 2 3 4
Bonding Social Capital ScaleThere are several people at work / university I trust to solve my problems
1 2 3 4
If I needed any money for emergency purposes, I know someone at work / university I can turn to
1 2 3 4
There is someone at work / university I can turn to for advice about making important decisions
1 2 3 4
106

The people I interact with would be good job references for me
1 2 3 4
I do not know people at work / university well enough to get them to do anything important
1 2 3 4
Appendix 2 - Journal
The Benefits of Facebook "Friends:" Social Capital and College Students' Use of Online Social Network Sites
Nicole B. EllisonCharles Steinfield
Cliff Lampe
107

Department of Telecommunication, Information Studies, and Media Michigan State University
Abstract
This study examines the relationship between use of Facebook, a popular online social network
site, and the formation and maintenance of social capital. In addition to assessing bonding and
bridging social capital, we explore a dimension of social capital that assesses one's ability to
stay connected with members of a previously inhabited community, which we call maintained
social capital. Regression analyses conducted on results from a survey of undergraduate
students (N=286) suggest a strong association between use of Facebook and the three types of
social capital, with the strongest relationship being to bridging social capital. In addition,
Facebook usage was found to interact with measures of psychological well-being, suggesting
that it might provide greater benefits for users experiencing low self-esteem and low life
satisfaction.
Introduction
Social network sites (SNSs) such as such as Friendster, CyWorld, and MySpace allow
individuals to present themselves, articulate their social networks, and establish or
maintain connections with others. These sites can be oriented towards work-related
contexts (e.g., LinkedIn.com), romantic relationship initiation (the original goal of
Friendster.com), connecting those with shared interests such as music or politics (e.g.,
MySpace.com), or the college student population (the original incarnation of
Facebook.com). Participants may use the sites to interact with people they already know
offline or to meet new people. The online social network application analyzed in this
article, Facebook, enables its users to present themselves in an online profile,
accumulate "friends" who can post comments on each other's pages, and view each
other's profiles. Facebook members can also join virtual groups based on common
interests, see what classes they have in common, and learn each others' hobbies,
interests, musical tastes, and romantic relationship status through the profiles.
108

Facebook constitutes a rich site for researchers interested in the affordances of social
networks due to its heavy usage patterns and technological capacities that bridge online
and offline connections. We believe that Facebook represents an understudied offline to
online trend in that it originally primarily served a geographically-bound community
(the campus). When data were collected for this study, membership was restricted to
people with a specific host institution email address, further tying offline networks to
online membership. In this sense, the original incarnation of Facebook was similar to
the wired Toronto neighborhood studied by Hampton and Wellman (e.g., Hampton,
2002; Hampton & Wellman, 2003), who suggest that information technology may
enhance place-based community and facilitate the generation of social capital.1 Previous
research suggests that Facebook users engage in "searching" for people with whom they
have an offline connection more than they "browse" for complete strangers to meet
(Lampe, Ellison, & Steinfield, 2006).
Online SNSs support both the maintenance of existing social ties and the formation of
new connections. Much of the early research on online communities assumed that
individuals using these systems would be connecting with others outside their pre-
existing social group or location, liberating them to form communities around shared
interests, as opposed to shared geography (Wellman, Salaff, Dimitrova, Garton, Gulia,
& Haythornthwaite, 1996). A hallmark of this early research is the presumption that
when online and offline social networks overlapped, the directionality was online to
offline—online connections resulted in face-to-face meetings. For instance, Parks and
Floyd (1996) report that one-third of their respondents later met their online
correspondents face-to-face. As they write, "These findings imply that relationships that
begin on line rarely stay there" (n.p.).
Although this early work acknowledged the ways in which offline and online networks
bled into one another, the assumed online to offline directionality may not apply to
today's SNSs that are structured both to articulate existing connections and enable the
109

creation of new ones. However, because there is little empirical research that addresses
whether members use SNSs to maintain existing ties or to form new ones, the social
capital implications of these services are unknown.
An Overview of Facebook
Created in 2004, by 2007 Facebook was reported to have more than 21 million
registered members generating 1.6 billion page views each day (Needham & Company,
2007). The site is tightly integrated into the daily media practices of its users: The
typical user spends about 20 minutes a day on the site, and two-thirds of users log in at
least once a day (Cassidy, 2006; Needham & Company, 2007). Capitalizing on its
success among college students, Facebook launched a high school version in early
September 2005. In 2006, the company introduced communities for commercial
organizations; as of November 2006, almost 22,000 organizations had Facebook
directories (Smith, 2006). In 2006, Facebook was used at over 2,000 United States
colleges and was the seventh most popular site on the World Wide Web with respect to
total page views (Cassidy, 2006).
Much of the existing academic research on Facebook has focused on identity
presentation and privacy concerns (e.g., Gross & Acquisti, 2005; Stutzman, 2006).
Looking at the amount of information Facebook participants provide about themselves,
the relatively open nature of the information, and the lack of privacy controls enacted
by the users, Gross and Acquisti (2005) argue that users may be putting themselves at
risk both offline (e.g., stalking) and online (e.g., identify theft). Other recent Facebook
research examines student perceptions of instructor presence and self-disclosure (Hewitt
& Forte, 2006; Mazer, Murphy, & Simonds, 2007), temporal patterns of use (Golder,
Wilkinson, & Huberman, 2007), and the relationship between profile structure and
friendship articulation (Lampe, Ellison, & Steinfield, 2007).
110

In contrast to popular press coverage which has primarily focused on negative outcomes
of Facebook use stemming from users’ misconceptions about the nature of their online
audience, we are interested in situations in which the intended audience for the profile
(such as well-meaning peers and friends) and the actual audience are aligned. We use
Facebook as a research context in order to determine whether offline social capital can
be generated by online tools. The results of our study show that Facebook use among
college-age respondents was significantly associated with measures of social capital.
Literature Review
Social Capital: Online and Offline
Social capital broadly refers to the resources accumulated through the relationships
among people (Coleman, 1988). Social capital is an elastic term with a variety of
definitions in multiple fields (Adler & Kwon, 2002), conceived of as both a cause and
an effect (Resnick, 2001; Williams, 2006). Bourdieu and Wacquant (1992) define social
capital as "the sum of the resources, actual or virtual, that accrue to an individual or a
group by virtue of possessing a durable network of more or less institutionalized
relationships of mutual acquaintance and recognition" (p. 14). The resources from these
relationships can differ in form and function based on the relationships themselves.
Social capital has been linked to a variety of positive social outcomes, such as better
public health, lower crime rates, and more efficient financial markets (Adler & Kwon,
2002). According to several measures of social capital, this important resource has been
declining in the U.S. for the past several years (Putnam, 2000). When social capital
declines, a community experiences increased social disorder, reduced participation in
civic activities, and potentially more distrust among community members. Greater
social capital increases commitment to a community and the ability to mobilize
collective actions, among other benefits. Social capital may also be used for negative
111

purposes, but in general social capital is seen as a positive effect of interaction among
participants in a social network (Helliwell & Putnam, 2004).
For individuals, social capital allows a person to draw on resources from other members
of the networks to which he or she belongs. These resources can take the form of useful
information, personal relationships, or the capacity to organize groups (Paxton, 1999).
Access to individuals outside one's close circle provides access to non-redundant
information, resulting in benefits such as employment connections (Granovetter, 1973).
Moreover, social capital researchers have found that various forms of social capital,
including ties with friends and neighbors, are related to indices of psychological well-
being, such as self esteem and satisfaction with life (Bargh & McKenna, 2004;
Helliwell & Putnam, 2004).
Putnam (2000) distinguishes between bridging and bonding social capital. The former is
linked to what network researchers refer to as "weak ties," which are loose connections
between individuals who may provide useful information or new perspectives for one
another but typically not emotional support (Granovetter, 1982). Alternatively, bonding
social capital is found between individuals in tightly-knit, emotionally close
relationships, such as family and close friends. After briefly describing the extant
literature on these two forms of social capital and the Internet, we introduce an
additional dimension of social capital that speaks to the ability to maintain valuable
connections as one progresses through life changes. This concept, "maintained social
capital," permits us to explore whether online network tools enable individuals to keep
in touch with a social network after physically disconnecting from it.
Social Capital and the Internet
The Internet has been linked both to increases and decreases in social capital. Nie
(2001), for example, argued that Internet use detracts from face-to-face time with
others, which might diminish an individual's social capital. However, this perspective
112

has received strong criticism (Bargh & McKenna, 2004). Moreover, some researchers
have claimed that online interactions may supplement or replace in-person interactions,
mitigating any loss from time spent online (Wellman, Haase, Witte, & Hampton, 2001).
Indeed, studies of physical (e.g., geographical) communities supported by online
networks, such as the Netville community in Toronto or the Blacksburg Electronic
Village, have concluded that computer-mediated interactions have had positive effects
on community interaction, involvement, and social capital (Hampton & Wellman, 2003;
Kavanaugh, Carroll, Rosson, Zin, & Reese, 2005).
Recently, researchers have emphasized the importance of Internet-based linkages for the
formation of weak ties, which serve as the foundation of bridging social capital.
Because online relationships may be supported by technologies like distribution lists,
photo directories, and search capabilities (Resnick, 2001), it is possible that new forms
of social capital and relationship building will occur in online social network sites.
Bridging social capital might be augmented by such sites, which support loose social
ties, allowing users to create and maintain larger, diffuse networks of relationships from
which they could potentially draw resources (Donath & boyd, 2004; Resnick, 2001;
Wellman et al., 2001). Donath and boyd (2004) hypothesize that SNSs could greatly
increase the weak ties one could form and maintain, because the technology is well-
suited to maintaining such ties cheaply and easily.
Based on this prior work, we propose the following hypothesis:
H1: Intensity of Facebook use will be positively associated with
individuals' perceived bridging social capital.
In Putnam's (2000) view, bonding social capital reflects strong ties with family and
close friends, who might be in a position to provide emotional support or access to
scarce resources. Williams (2006) points out that little empirical work has explicitly
113

examined the effects of the Internet on bonding social capital, although some studies
have questioned whether the Internet supplements or supplants strong ties (see Bargh &
McKenna, 2004, for a review). It is clear that the Internet facilitates new connections, in
that it provides people with an alternative way to connect with others who share their
interests or relational goals (Ellison, Heino, & Gibbs, 2006; Horrigan, 2002; Parks &
Floyd, 1996). These new connections may result in an increase in social capital; for
instance, a 2006 Pew Internet survey reports that online users are more likely to have a
larger network of close ties than non-Internet users, and that Internet users are more
likely than non-users to receive help from core network members (Boase, Horrigan,
Wellman, & Rainie, 2006). However, it is unclear how social capital formation occurs
when online and offline connections are closely coupled, as with Facebook. Williams
(2006) argues that although researchers have examined potential losses of social capital
in offline communities due to increased Internet use, they have not adequately explored
online gains that might compensate for this. We thus propose a second hypothesis on
the relationship between Facebook use and close ties:
H2: Intensity of Facebook use will be positively associated with
individuals' perceived bonding social capital.
Online social network tools may be of particular utility for individuals who otherwise
have difficulties forming and maintaining both strong and weak ties. Some research has
shown, for example, that the Internet might help individuals with low psychological
well-being due to few ties to friends and neighbors (Bargh & McKenna, 2004). Some
forms of computer-mediated communication can lower barriers to interaction and
encourage more self-disclosure (Bargh, McKenna, & Fitzsimons, 2002; Tidwell &
Walther, 2002); hence, these tools may enable connections and interactions that would
not otherwise occur. For this reason, we explore whether the relationship between
Facebook use and social capital is different for individuals with varying degrees of self-
114

esteem (Rosenberg, 1989) and satisfaction with life (Diener, Suh, & Oishi, 1997; Pavot
& Diener, 1993), two well-known and validated measures of subjective well-being. This
leads to the two following pairs of hypotheses:
H3a: The relationship between intensity of Facebook use and bridging
social capital will vary depending on the degree of a person's self
esteem.
H3b: The relationship between intensity of Facebook use and bridging
social capital will vary depending on the degree of a person's
satisfaction with life.
H4a: The relationship between intensity of Facebook use and bonding
social capital will vary depending on the degree of a person's self
esteem.
H4b: The relationship between intensity of Facebook use and bonding
social capital will vary depending on the degree of a person's
satisfaction with life.
Maintained Social Capital and Life Changes
Social networks change over time as relationships are formed or abandoned.
Particularly significant changes in social networks may affect one's social capital, as
when a person moves from the geographic location in which their network was formed
and thus loses access to those social resources. Putnam (2000) argues that one of the
possible causes of decreased social capital in the U.S. is the increase in families moving
for job reasons; other research has explored the role of the Internet in these transitions
(Cummings, Lee, & Kraut, 2006; Wellman et al., 2001). Wellman et al. (2001), for
example, find that heavy Internet users rely on email to maintain long distance
115

relationships, rather than using it as a substitute for offline interactions with those living
nearby.
Some researchers have coined the term "friendsickness" to refer to the distress caused
by the loss of connection to old friends when a young person moves away to college
(Paul & Brier, 2001). Internet technologies feature prominently in a study of
communication technology use by this population by Cummings, Lee, and Kraut
(2006), who found that services like email and instant messaging help college students
remain close to their high school friends after they leave home for college. We therefore
introduce a measure focusing specifically on the maintenance of existing social capital
after this major life change experienced by college students, focusing on their ability to
leverage and maintain social connections from high school.
Young adults moving to college need to create new networks at college. However, they
often leave friends from high school with whom they may have established rich
networks; completely abandoning these high school networks would mean a loss of
social capital. Granovetter (1973, 1982) has suggested that weak ties provide more
benefit when the weak tie is not associated with stronger ties, as may be the case for
maintained high school relationships. To test the role of maintained high school
relationships as weak, bridging ties, we adapted questions about general bridging
relationships, such as those in Williams (2006), to be specific to maintained
relationships with high school acquaintances as opposed to close friends. We call this
concept "maintained social capital." In keeping with the thrust of our prior hypotheses
about the role of Facebook and bridging social capital, we propose the following:
H5: Intensity of Facebook use will be positively associated with
individuals' perceived maintained social capital.
Methods
116

A random sample of 800 Michigan State University (MSU) undergraduate students was
retrieved from the MSU registrar's office. All 800 students were sent an email invitation
from one of the authors, with a short description of the study, information about
confidentiality and incentives, and a link to the survey. Two reminder emails were sent
to those who had not responded. Participants were compensated with a $5 credit to their
on-campus spending accounts. The survey was hosted on Zoomerang
(http://www.zoomerang.com), an online survey hosting site, and was fielded in April
2006. Only undergraduate users were included in our sampling frame. A total of 286
students completed the online survey, yielding a response rate of 35.8% (see Table 1 for
sample demographics). Demographic information about non-responders was not
available; therefore we do not know whether a bias existed in regards to survey
participation. However, when we compare the demographics of our sample to
information we have about the MSU undergraduate population as a whole, our sample
appears to be representative with a few exceptions. Female, younger, in-state, and on-
campus students were slightly overrepresented in our sample.2
Mean or % (N)
S.D.
Gender
male 34% (98)
female 66% (188)
Age 20.1 1.64
Ethnicity
white 87% (247)
non-white 13% (36)
Income1 3.18 2.04
Year in school2 2.55 1.07
Home residence
117

in-state 91% (259)
out-of-state 09% (25)
Local residence
on campus 55% (157)
off campus 45% (127)
Member of fraternity/sorotity
08% (23) 1.01
Hours of Internet use per day3
2 hr, 56 min 1.52
Facebook members 94% (268)Table 1. Sample demographics (N=286)Notes: 1 represents household income; 1=under $20,000, 2=$20,000-$34,999, 3=$35,000-$49,999, 4=$50,000-$74,999, 5=$75,000 or more; 2 1=first year, 2=sophomore, 3=junior, 4=senior; 3 converted from ordinal scale using mid-point of response category (e.g., 1-2 hours=1 hour 30 minutes)
Measures
Our instrument included four broad types of measures, which are discussed in more
detail below. We collected information about demographic and other descriptive
variables, including gender, age, year in school, local vs. home residence, ethnicity, a
measure of Internet use adapted from LaRose, Lai, Lange, Love, and Wu (2005), and
whether respondents were Facebook members or not. (These items are reflected in
Table 1 above.) We also included Facebook usage measures, such as time spent using
Facebook and items designed to assess whether Facebook was used to meet new people
or to establish an online connection to pre-existing connections. Our instrument also
included measures of subjective well-being and as well as three social capital measures,
which served as our dependent variables.
118

Measures of Facebook Usage
Facebook Intensity
The Facebook intensity scale (Cronbach's alpha=.83) was created in order to obtain a
better measure of Facebook usage than frequency or duration indices. This measure
includes two self-reported assessments of Facebook behavior, designed to measure the
extent to which the participant was actively engaged in Facebook activities: the number
of Facebook "friends" and the amount of time spent on Facebook on a typical day. This
measure also includes a series of Likert-scale attitudinal questions designed to tap the
extent to which the participant was emotionally connected to Facebook and the extent to
which Facebook was integrated into her daily activities (see Table 2 for item wording
and descriptive statistics).
Individual Items and Scale Mean S.D.
Facebook intensity1, 2 (Cronbach's alpha=0.83)
-0.08 0.79
About how many total Facebook friends do you have at MSU or elsewhere? 0=10 or less, 1=11-50, 2=51-100, 3=101-150, 4=151-200, 5=201-250, 6=251-300, 7=301-400, 8=more than 400
4.39 2.12
In the past week, on average, approximately how many minutes per day have you spent on Facebook? 0=less than 10, 1=10-30, 2=31-60, 3=1-2 hours, 4=2-3 hours, 5=more than 3 hours
1.07 1.16
Facebook is part of my everyday activity 3.12 1.26
I am proud to tell people I'm on Facebook 3.24 0.89
Facebook has become part of my daily routine 2.96 1.32
I feel out of touch when I haven't logged onto Facebook 2.29 1.20
119

for a while
I feel I am part of the Facebook community 3.30 1.01
I would be sorry if Facebook shut down 3.45 1.14Table 2. Summary statistics for Facebook intensityNotes: 1 Individual items were first standardized before taking an average to create scale due to differing item scale ranges. 2 Unless provided, response categories ranged from 1=strongly disagree to 5=strongly agree.
Facebook Usage: Elements in Profile and Perceptions of Who Has Viewed Profiles
We asked respondents to indicate which of several salient aspects of the profile (such as
relationship status, high school, and mobile phone number) they included when
constructing their profile. The instrument asked respondents to indicate who they
thought had viewed their profile, such as high school friends, classmates, or family
members. These items offer insight into the degree to which respondents used Facebook
to maintain existing connections or meet new people.
Use of Facebook to Meet New People vs. Connect with Existing Offline Contacts
In order to further investigate whether usage was more motivated by prior offline
contacts or the potential to form new online contacts, we developed several items
reflecting each of these paths (see Table 3). In the former case, the items measured
whether respondents used Facebook to look up someone with whom they shared some
offline connection, such as a classmate or a friend (Cronbach's alpha=.70). In the latter
case, our instrument included several items that tapped the use of Facebook to make
new friends without any reference to an offline connection, but these did not correlate
highly, and our final analysis incorporated only a single item measure: using Facebook
to meet new people.
Individual Items and Scale1 Mean S.D.
Off to Online: I use Facebook to connect with offline 3.64 0.79
120

contacts(Cronbach's alpha=0.70)
I have used Facebook to check out someone I met socially
3.99 1.05
I use Facebook to learn more about other people in my classes
3.26 1.20
I use Facebook to learn more about other people living near me
2.86 1.22
I use Facebook to keep in touch with my old friends 4.42 0.86
On to Offline: I use Facebook to meet new people (single item measure)
1.97 1.03
Table 3. Summary statistics for Facebook use for prior contacts and meeting new peopleNote: 1 Individual items ranged from 1=strongly disagree to 5=strongly agree, scales constructed by taking mean of items.
Measures for Psychological Well-Being
Self-Esteem
Self-esteem was measured using seven items from the Rosenberg self-esteem scale
(Rosenberg, 1989). The answers to these questions were reported on a 5-point Likert
scale and exhibited high reliability (see Table 4).
Satisfaction with Life at MSU
The scale of satisfaction with life at MSU was adapted from the Satisfaction with Life
Scale (SWLS) (Diener, Suh, & Oishi, 1997; Pavot & Diener, 1993), a five-item
instrument designed to measure global cognitive judgments of one's life. We amended
each item slightly to refer specifically to the MSU context, on the assumption that
restricting participants was more appropriate given our hypotheses and more likely to
elicit accurate answers. The reliability test for this 5-point Likert scale showed a
relatively high reliability (see Table 4).
Individual Items and Scale1 Mean S.D.
Self Esteem Scale (Cronbach's alpha=0.87) 4.30 0.55
121

I feel that I'm a person of worth, at least on an equal plane with others
4.50 0.60
I feel that I have a number of good qualities 4.54 0.57
All in all, I am inclined to feel that I am a failure (reversed)
4.27 0.86
I am able to do things as well as most other people 4.29 0.63
I feel I do not have much to be proud of (reversed) 4.26 0.89
I take a positive attitude toward myself 4.17 0.75
On the whole, I am satisfied with myself 4.07 0.84
Satisfaction with MSU Life Scale (Cronbach's alpha=0.87)
3.55 0.74
In most ways my life at MSU is close to my ideal 3.42 0.96
The conditions of my life at MSU are excellent 3.54 0.91
I am satisfied with my life at MSU 3.85 0.84
So far I have gotten the important things I want at MSU 3.74 0.81
If I could live my time at MSU over, I would change almost nothing
3.18 1.05
Table 4. Summary statistics and factor analysis results for self-esteem and satisfaction with MSU life itemsNote: 1 Individual items ranged from 1=strongly disagree to 5=strongly agree, scales constructed by taking mean of items.
Measures of Social Capital
Our three measures of social capital—bridging, bonding, and maintained social capital
—were created by adapting existing scales, with wording changed to reflect the context
of the study, and creating new items designed to capture Internet-specific social capital
(Quan-Haase & Wellman, 2004). The full set of social capital items was factor analyzed
to ensure that the items reflected three distinct dimensions (see Table 5).
Factor Loadings1
Individual Items and Mea S.D Bridging Maintained Bonding
122

Scales2 n . Social Capital
Social Capital
Social Capital
Bridging Social Capital Scale (Cronbach's alpha=0.87)
3.81 0.53
I feel I am part of the MSU community
3.78 0.80
0.70 -0.24 0.13
I am interested in what goes on at MSU
3.98 0.64
0.73 -0.10 0.13
MSU is a good place to be 4.22 0.78
0.73 -0.12 0.18
I would be willing to contribute money to MSU after graduation
3.35 0.95
0.66 -0.04 0.13
Interacting with people at MSU makes me want to try new things
3.74 0.68
0.60 -0.04 0.15
Interacting with people at MSU makes me feel like a part of a larger community
3.81 0.68
0.72 -0.09 0.23
I am willing to spend time to support general MSU activities
3.70 0.77
0.76 -0.10 0.16
At MSU, I come into contact with new people all the time
4.05 0.69
0.54 -0.17 0.13
Interacting with people at MSU reminds me that everyone in the world is connected
3.65 0.88
0.60 -0.07 0.04
Bonding Social Capital Scale (Cronbach's alpha=0.75)
3.72 0.66
There are several people at MSU I trust to solve my problems
3.22 1.01
0.17 -0.07 0.60
If I needed an emergency loan of $100, I know someone at MSU I can turn
3.75 1.09
0.02 -0.18 0.76
123

to
There is someone at MSU I can turn to for advice about making very important decisions
3.98 0.85
0.27 -0.09 0.76
The people I interact with at MSU would be good job references for me
3.88 0.79
0.32 0.07 0.63
I do not know people at MSU well enough to get them to do anything important (reversed)
3.78 0.87
0.13 -0.23 0.61
Maintained Social Capital Scale (Cronbach's alpha=0.81)
3.77 0.67
I'd be able to find out about events in another town from a high school acquaintance living there
3.59 0.88
0.20 -0.58 0.05
If I needed to, I could ask a high school acquaintance to do a small favor for me
3.92 0.89
0.06 -0.86 0.18
I'd be able to stay with a high school acquaintance if traveling to a different city
3.85 0.94
-0.02 -0.85 0.15
I'd be able to find information about a job or internship from a high school acquaintance
3.58 0.89
0.11 -0.79 0.02
It would be easy to find people to invite to my high school reunion
3.90 0.88
0.29 -0.56 0.14
Table 5. Summary statistics and factor analysis results for social capital itemsNotes: 1 Principal components factor analysis with varimax rotation, explaining 53% of the variance.2 Individual items ranged from 1=strongly disagree to 5=strongly agree, scales constructed by taking mean of items.
Bridging Social Capital
124

This measure assessed the extent to which participants experienced bridging social
capital, which is believed to be better-suited for linking to external assets and for
information diffusion (Putnam, 2000). According to Williams (2006), "members of
weak-tie networks are thought to be outward looking and to include people from a
broad range of backgrounds. The social capital created by these networks generates
broader identities and generalized reciprocity" (n.p.). We therefore adapted five items
from Williams' (2006) bridging social capital subscale and created three additional
items intended to measure bridging social capital in the MSU context to create our
bridging social capital scale (Cronbach's alpha=.87). One item, "MSU is a good place to
be," was included because it loaded on the same factor and tapped into an outcome of
bridging social capital.
Bonding Social Capital
Bonding was assessed using five items from the bonding subscale of the Internet social
capital scales developed and validated by Williams (2006). Responses were reported on
a five-point Likert scale. These items were adapted to the MSU context (Cronbach's
alpha=.75).
Maintained Social Capital
This original scale was inspired by our pilot interviews,3 media coverage of Facebook,
and anecdotal evidence that suggested that keeping in touch with high school friends
was a primary use of Facebook. These items were adapted from traditional measures of
social capital which assess an individual's ability to mobilize support or action
(Cronbach's alpha=.81) but focus on the ability to get assistance from apreviously
inhabited community.
Findings
125

We first present some basic descriptive data to characterize Facebook users and uses
and provide insight into whether Facebook is used more to meet new people or to
maintain or strengthen relationships with offline connections. In a short period of time,
Facebook has garnered a very strong percentage of users on college campuses. In our
sample, 94% of the undergraduate students we surveyed were Facebook members. We
investigated whether members and non-members differed significantly along various
demographic characteristics, but we lacked confidence in these findings given the
extremely low number of non-Facebook users. The remainder of our analyses are based
only on data from Facebook members.
Facebook members report spending between 10 and 30 minutes on average using
Facebook each day and report having between 150 and 200 friends listed on their
profile (Table 2). From Table 3 we see that respondents also report significantly more
Facebook use involving people with whom they share an offline connection—either an
existing friend, a classmate, someone living near them, or someone they met socially
(mean=3.64)—than use involving meeting new people (mean=1.97) (t=26.14, p<.0001).
Further insight into Facebook usage patterns can be gleaned from Figures 1 and 2,
which show what elements respondents report including in their Facebook profile and
who they believe has seen their profiles, respectively. The fact that nearly all Facebook
users include their high school name in their profile (96%) suggests that maintaining
connections to former high school classmates is a strong motivation for using Facebook.
Not surprisingly, 97% report that high school friends had seen their profile. Ninety
percent or more also reported that other friends as well as people in their classes had
seen their profile, further suggesting an offline component to Facebook use.4
126

Figure 1. Self-reported elements in respondents' Facebook profiles
Figure 2. Perceived audience for respondents' Facebook profiles
127

As Figure 2 suggests, students view the primary audience for their profile to be people
with whom they share an offline connection. This is suggested as well by the responses
to items about how they use Facebook. Mean scores for the offline-to-online scale were
significantly higher than those for the single-item online-to-offline measure (p<.0001).
This suggests that students use Facebook primarily to maintain existing offline
relationships or to solidify what would otherwise be ephemeral, temporary
acquaintanceships. There was a slight tendency for newer students to use Facebook to
meet new people more than for juniors and seniors to do so (see Figure 3), but across all
four years in school, respondents reported greater use of Facebook for connecting with
existing offline contacts.
Figure 3. Offline-to-online vs. online-to-offline mean scores by year in school
In order to explore our research hypotheses regarding the relationship between
Facebook use and the various forms of social capital, we conducted regression analyses.
128

In each regression, we controlled for demographic, subjective well-being and Internet
use factors, in order to see if usage of Facebook accounted for variance in social capital
over and above these other independent variables.
To test Hypothesis 1, we first investigated the extent to which demographic factors,
psychological well-being measures, and general Internet use predicted the amount of
bridging social capital reported by students; the adjusted R2 for this model was .38. We
then entered the Facebook intensity variable, which raised the adjusted R2 to .43. An
additional pair of analyses further explored whether Facebook intensity interacted with
the self-esteem and satisfaction with MSU life scales (see Table 6). The key finding is
that, after first controlling for demographic factors, psychological well-being measures,
and general Internet use, the extent to which students used Facebook intensively still
contributed significantly (scaled beta5=.34, p<.0001), supporting Hypothesis 1.
Interestingly, general Internet use was not a significant predictor of bridging social
capital, suggesting that only certain kinds of uses of the Internet support the generation
and maintenance of bridging social capital. The significance of these variables did not
change when the interaction terms were added. We also explored whether gender and
year in school interacted with Facebook intensity, in order to see if gender or time at
MSU accounted for variation in the association between bridging social capital and
Facebook use. These interactions were not significant and are not included in the table.
Overall, our independent factors accounted for nearly half of the variance in bridging
social capital. The results suggest that Facebook is indeed implicated in students' efforts
to develop and maintain bridging social capital at college, although we cannot assess
causal direction. Few demographic factors matter, although white students are
somewhat more likely to have bridging social capital than non-white students (scaled
beta=.08, p<.05). Among the psychological measures, the extent of students' satisfaction
with life at MSU was strongly correlated with bridging social capital (scaled beta=.66,
p<.0001).
129
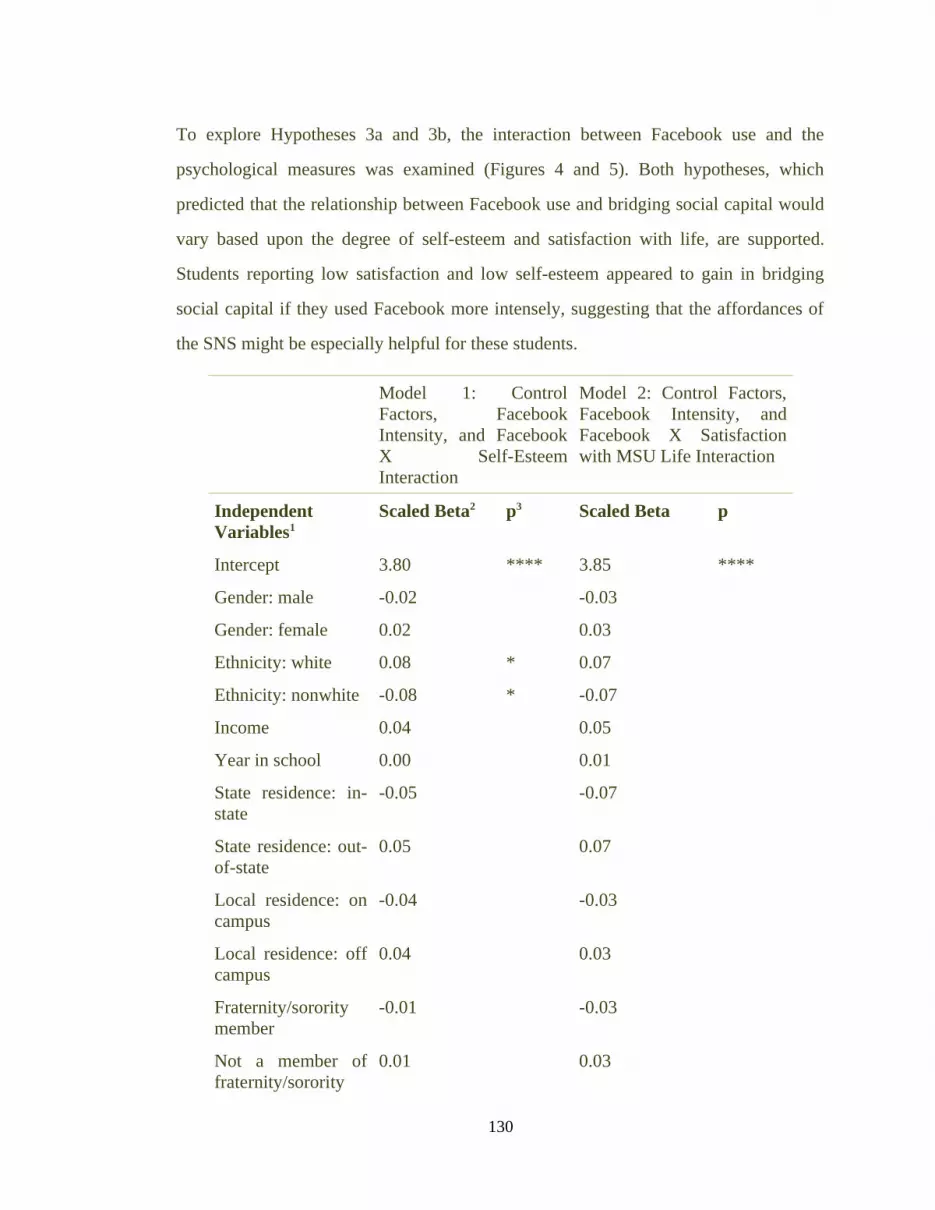
To explore Hypotheses 3a and 3b, the interaction between Facebook use and the
psychological measures was examined (Figures 4 and 5). Both hypotheses, which
predicted that the relationship between Facebook use and bridging social capital would
vary based upon the degree of self-esteem and satisfaction with life, are supported.
Students reporting low satisfaction and low self-esteem appeared to gain in bridging
social capital if they used Facebook more intensely, suggesting that the affordances of
the SNS might be especially helpful for these students.
Model 1: Control Factors, Facebook Intensity, and Facebook X Self-Esteem Interaction
Model 2: Control Factors, Facebook Intensity, and Facebook X Satisfaction with MSU Life Interaction
Independent Variables1
Scaled Beta2 p3 Scaled Beta p
Intercept 3.80 **** 3.85 ****
Gender: male -0.02 -0.03
Gender: female 0.02 0.03
Ethnicity: white 0.08 * 0.07
Ethnicity: nonwhite -0.08 * -0.07
Income 0.04 0.05
Year in school 0.00 0.01
State residence: in-state
-0.05 -0.07
State residence: out-of-state
0.05 0.07
Local residence: on campus
-0.04 -0.03
Local residence: off campus
0.04 0.03
Fraternity/sorority member
-0.01 -0.03
Not a member of fraternity/sorority
0.01 0.03
130

Hrs of Internet use per day
-0.03 -0.01
Self esteem 0.20 *** 0.22 ****
Satisfaction with MSU
0.66 **** 0.61 ****
Facebook (FB) intensity
0.34 **** 0.31 ****
Self-esteem by FB intensity4
-0.35 **
Satisfaction by FB intensity
-0.51 ***
N=269 F=18.83, **** Adj. R2=.44
F=19.92, **** Adj. R2=.46
Table 6. Regressions predicting the amount of bridging social capital from demographic, attitudinal, and Facebook variablesNotes: 1 Nominal factors expanded to all levels. 2 Continuous factors centered by mean, scaled by range/2. 3 * p<.05, ** p<.01, *** p<.001, **** p<.0001. 4 Only one interaction term was entered at a time in each regression.
Figure 4. Interaction of Facebook use intensity and satisfaction with MSU life on bridging social capital
131

Figure 5. Interaction of Facebook intensity and self-esteem on bridging social capital
As shown in Table 7, bonding social capital was also significantly predicted by the
intensity with which students used Facebook (scaled beta=.37, p<.001 in model 2).
Other factors that related to bonding social capital were ethnicity (being white, scaled
beta=.16, p<.01, model 2), year in school (scaled beta=.22, p<.01, model 2), living on
campus (scaled beta=.13, p<.01, model 2), self-esteem (scaled beta=.23, p<.01, model
2), and satisfaction with MSU life (scaled beta =.40, p<.001, model 2). General Internet
use was not a significant predictor of bonding social capital, and the interactions
between Facebook use and the two psychological measures were not significant. As in
the bridging social capital analysis, gender and year in school did not interact
significantly with Facebook use in predicting bonding social capital. The adjusted R2
for the control factors alone was .19; adding Facebook Intensity raised this statistic
to .22. Again, the same variables were significant when the interactions were added.
132

Overall, the included variables accounted for almost one quarter of the variance in
students' reported bonding social capital.
Model 1: Control Factors, Facebook Intensity, and Facebook X Self-Esteem Interaction
Model 2: Control Factors, Facebook Intensity, and Facebook X Satisfaction with MSU Life Interaction
Independent Variables1
Scaled Beta2 p3 Scaled Beta p
Intercept 3.73 **** 3.76 ****
Gender: male 0.07 0.06
Gender: female -0.07 -0.06
Ethnicity: white 0.17 ** 0.16 **
Ethnicity: nonwhite -0.17 ** -0.16 **
Income 0.07 0.07
Year in school 0.23 *** 0.23 ***
State residence: in-state
-0.09 -0.10
State residence: out-of-state
0.09 0.10
Local residence: on campus
0.13 ** 0.14 **
Local residence: off campus
-0.13 ** -0.14 **
Fraternity/sorority member
-0.07 -0.08
Not a member of fraternity/sorority
0.07 0.08
Hrs of Internet use per day
-0.01 0.01
Self esteem 0.22 ** 0.24 **
Satisfaction with MSU
0.40 *** 0.37 ***
Facebook (FB) intensity
0.37 **** 0.34 ***
133

Self-esteem by FB intensity4
-0.32
Satisfaction by FB intensity
-0.26
N=269 F=7.60, **** Adj. R2=.23
F=7.48, **** Adj. R2=.22
Table 7. Regressions predicting the amount of bonding social capital from demographic, attitudinal, and Facebook variablesNotes: 1 Nominal factors expanded to all levels. 2 Continuous factors centered by mean, scaled by range/2. 3 * p<.05, ** p<.01, *** p<.001, **** p<.0001. 4 Only one interaction term was entered at a time in each regression.
Finally, entering only our control factors accounted for 13% of the variance in
maintained social capital (Table 8). Adding Facebook intensity raised the R2 to .17 and
revealed the same strong connection to Facebook intensity (scaled beta=.36, p<.001),
even after controlling for the number of years at college (and thus, away from high
school) and general Internet use. Interestingly, general Internet use was also a
significant predictor of maintained social capital (scaled beta=.26, p<.05), suggesting
that other Internet applications are useful in this case. Ethnicity (being white, scaled
beta=.23, p<.001) and self-esteem (scaled beta=.30, p<.001) were the other significant
variables in this regression. None of the interactions were significant. Together, the
independent variables accounted for 16% to 17% of the variance in the maintained
social capital measure.
Model 1: Control Factors, Facebook Intensity, and Facebook X Self-Esteem Interaction
Model 2: Control Factors, Facebook Intensity, and Facebook X Satisfaction with MSU Life Interaction
Independent Variables1
Scaled Beta2 p3 Scaled Beta p
Intercept 3.57 **** 3.60 ****
Gender: male -0.02 -0.02
Gender: female 0.02 0.02
Ethnicity: white 0.23 *** 0.23 ***
134

Ethnicity: nonwhite -0.23 *** -0.23 ***
Income 0.08 0.08
Year in school -0.09 -0.08
State residence: in-state
0.06 0.05
State residence: out-of-state
-0.06 -0.05
Local residence: on campus
-0.06 -0.05
Local residence: off campus
0.06 0.05
Fraternity/sorority member
-0.02 -0.03
Not a member of fraternity/sorority
0.02 0.03
Hrs of Internet use per day
0.26 * 0.27 *
Self esteem 0.30 *** 0.31 ***
Satisfaction with MSU
-0.02 -0.04
Facebook (FB) intensity
0.37 **** 0.36 ***
Self-esteem by FB intensity4
-0.11
Satisfaction by FB intensity
-0.29
N=269 F=5.40, **** Adj. R2=.16
F=5.57, **** Adj. R2=.17
Table 8. Regressions predicting the amount of maintained social capital from demographic, attitudinal, and Facebook variablesNotes: 1 Nominal factors expanded to all levels. 2 Continuous factors centered by mean, scaled by range/2. 3 * p<.05, ** p<.01, *** p<.001, **** p<.0001. 4 Only one interaction term was entered at a time in each regression.
Discussion
135

Returning to our original research question, we can definitively state that there is a
positive relationship between certain kinds of Facebook use and the maintenance and
creation of social capital. Although we cannot say which precedes the other, Facebook
appears to play an important role in the process by which students form and maintain
social capital, with usage associated with all three kinds of social capital included in our
instrument.
Although representation of non-users is low in our sample, when we compare members
vs. nonmembers, we see no real difference in demographics, with the exception of class
year and age (which is strongly correlated with class year). This is most likely due to
the fact that Facebook is a relatively recent phenomenon, and we would expect senior
students to be less likely to join. The high penetration and lack of any systematic
difference between members and non-members suggests that Facebook has broad
appeal, does not exclude particular social groups, and has not had a noticeable effect on
participants' grades.
Our participants overwhelmingly used Facebook to keep in touch with old friends and
to maintain or intensify relationships characterized by some form of offline connection
such as dormitory proximity or a shared class. For many, Facebook provided a way to
keep in touch with high school friends and acquaintances. This was demonstrated
through the fact that the most commonly included information on users' profiles was
likely to be relevant for existing acquaintances trying to find them (e.g., their high
school) and that nearly all users felt that their high school friends had viewed their
profile, and through respondents' self-reported types of use (connecting with offline
contacts as opposed to meeting new people). This offline to online movement differs
from the patterns observed by early researchers examining computer-mediated
communication and virtual communities. Due to the structure of the site, which blocks
entry to those without a school email address and then places individuals into
136

communities based on that email address, Facebook serves a geographically-bound user
base.6
Our first dimension of social capital—bridging—assessed the extent to which
participants were integrated into the MSU community, their willingness to support the
community, and the extent to which these experiences broadened their social horizons
or worldview. Our findings suggest that certain kinds of Facebook use (articulated by
our Facebook intensity items) can help students accumulate and maintain bridging
social capital. This form of social capital—which is closely linked to the notion of
"weak ties"—seems well-suited to social software applications, as suggested by Donath
and boyd (2004), because it enables users to maintain such ties cheaply and easily.
Although more research is needed to understand the nature of this trend, we suspect that
Facebook serves to lower the barriers to participation so that students who might
otherwise shy away from initiating communication with or responding to others are
encouraged to do so through Facebook's affordances.
Participants' reports about who is viewing their profile provide insight into this
dynamic. As depicted in Figure 2, students report that the primary audiences for their
profiles are high school friends and people they know from an MSU context. This
implies that highly engaged users are using Facebook to crystallize relationships that
might otherwise remain ephemeral. Haythornthwaite (2005) discusses the implications
of media that "create latent tie connectivity among group members that provides the
technical means for activating weak ties" (p. 125). Latent ties are those social network
ties that are "technically possible but not activated socially" (p. 137). Facebook might
make it easier to convert latent ties into weak ties, in that the site provides personal
information about others, makes visible one's connections to a wide range of
individuals, and enables students to identify those who might be useful in some capacity
(such as the math major in a required calculus class), thus providing the motivation to
activate a latent tie. These weak ties may provide additional information and
137

opportunities, which are expressed as dimensions of bridging social capital that speak to
interaction with a wide range of people and the more tolerant perspective this might
encourage. Facebook seems well-suited to facilitate these experiences, in that detailed
profiles highlight both commonalities and differences among participants.
We also found an interaction between bridging social capital and subjective well-being
measures. For less intense Facebook users, students who reported low satisfaction with
MSU life also reported having much lower bridging social capital than those who used
Facebook more intensely. The same was true for self-esteem. Conversely, there was
little difference in bridging social capital among those who reported high satisfaction
with life at MSU and high self-esteem relative to Facebook use intensity. One
explanation consistent with these interaction effects is that Facebook use may be
helping to overcome barriers faced by students who have low satisfaction and low self-
esteem. Because bridging social capital provides benefits such as increased information
and opportunities, we suspect that participants who use Facebook in this way are able to
get more out of their college experience. The suggestion that Facebook use supports a
"poor get richer" hypothesis, as opposed to the "rich get richer" findings reported in
other contexts (Kraut, Kiesler, Boneva, Cummings, Helgeson, & Crawford, 2002), may
be of special interest to Internet researchers.
Bonding social capital was also predicted by high self-esteem, satisfaction with
university life, and intense Facebook use, although overall, the regression model
predicting bonding social capital accounted for less of the variation for this dependent
variable than for bridging social capital. However, Facebook appears to be much less
useful for maintaining or creating bonding social capital, as indicated by the fact that
the bonding model only accounted for 22% of the variance (versus 46% in the bridging
social capital models). We might expect Facebook usage to have less of an impact on
bonding than bridging social capital given the affordances of this service. It can lower
barriers to participation and therefore may encourage the formation of weak ties but not
138

necessarily create the close kinds of relationships that are associated with bonding
social capital. Yet the strong coefficient for Facebook intensity suggests that Facebook
use is important for bonding social capital as well. One explanation is that it may help
individuals to maintain pre-existing close relationships, just as it can be used as a low-
maintenance way to keep tabs on distant acquaintances. For instance, in our pilot
interviews, students discussed the "birthday" feature of Facebook, which prompted
them to send birthday greetings to friends with minimal effort.
Finally, Facebook intensity predicted increased levels of maintained social capital,
which assessed the extent to which participants could rely on high school acquaintances
to do small favors. For college students, many of whom have moved away for the first
time, the ability to stay in touch with these high school acquaintances may illustrate
most clearly the "strength of weak ties" outlined by Granovetter (1973, 1982). These
potentially useful connections may be valuable sources of new information and
resources. Additionally, the ability to stay in touch with these networks may offset
feelings of "friendsickness," the distress caused by the loss of old friends.
Limitations to this study include the fact that we examined only one community.
Because the college years are a unique developmental period in the life cycle and
because the MSU Facebook community is closely coupled with the geographically
bounded MSU community, we are not able to generalize these findings to other kinds of
communities or social network tools. It may be that the positive outcomes linked to
Facebook use discussed here are limited to this special case in which the offline
community is bounded spatially and to the unique nature of the undergraduate
experience. Future research could explore Facebook use in other contexts, such as
organizations and high schools. Because we used a one-time survey, we cannot
establish causality. Additionally, the extremely low incidence of non-members, non-
White, or international students in our sample hampered our ability to assess the effects
of Facebook membership on these groups. Finally, respondents may have misreported
139
behavioral or demographic information, as we used self-reported rather than direct
measures of Facebook use and other variables.
To address these concerns, future research should approach Facebook use and the
generation of social capital via multiple methodologies. Profile capture and analysis
would allow researchers to marry survey responses with direct behavioral measures.
Additionally, experimental interventions would support causal claims; these
interventions could be in the form of a survey, with pre- and post-test data collected
from the site itself. Collecting longitudinal data over a series of years, tracking
incoming first-year students and following them after they graduate, is also a necessary
next step.
Conclusions
Our empirical results contrast with the anecdotal evidence dominating the popular press.
Although there are clearly some image management problems experienced by students
as reported in the press, and the potential does exist for privacy abuses, our findings
demonstrate a robust connection between Facebook usage and indicators of social
capital, especially of the bridging type. Internet use alone did not predict social capital
accumulation, but intensive use of Facebook did.
The strong linkage between Facebook use and high school connections suggests how
SNSs help maintain relations as people move from one offline community to another. It
may facilitate the same when students graduate from college, with alumni keeping their
school email address and using Facebook to stay in touch with the college community.
Such connections could have strong payoffs in terms of jobs, internships, and other
opportunities. Colleges may want to explore ways to encourage this sort of usage.
Online social network sites may play a role different from that described in early
literature on virtual communities. Online interactions do not necessarily remove people
140
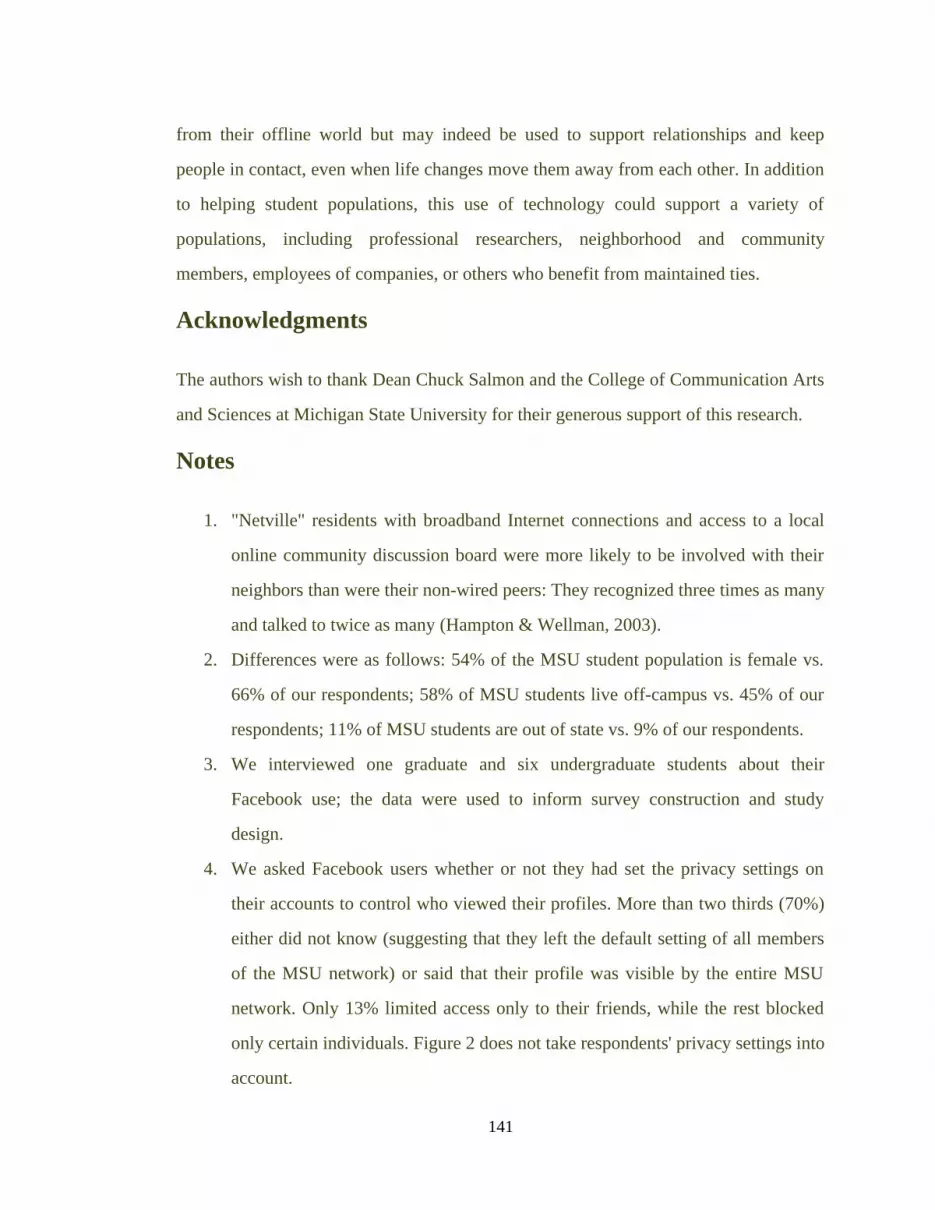
from their offline world but may indeed be used to support relationships and keep
people in contact, even when life changes move them away from each other. In addition
to helping student populations, this use of technology could support a variety of
populations, including professional researchers, neighborhood and community
members, employees of companies, or others who benefit from maintained ties.
Acknowledgments
The authors wish to thank Dean Chuck Salmon and the College of Communication Arts
and Sciences at Michigan State University for their generous support of this research.
Notes
1. "Netville" residents with broadband Internet connections and access to a local
online community discussion board were more likely to be involved with their
neighbors than were their non-wired peers: They recognized three times as many
and talked to twice as many (Hampton & Wellman, 2003).
2. Differences were as follows: 54% of the MSU student population is female vs.
66% of our respondents; 58% of MSU students live off-campus vs. 45% of our
respondents; 11% of MSU students are out of state vs. 9% of our respondents.
3. We interviewed one graduate and six undergraduate students about their
Facebook use; the data were used to inform survey construction and study
design.
4. We asked Facebook users whether or not they had set the privacy settings on
their accounts to control who viewed their profiles. More than two thirds (70%)
either did not know (suggesting that they left the default setting of all members
of the MSU network) or said that their profile was visible by the entire MSU
network. Only 13% limited access only to their friends, while the rest blocked
only certain individuals. Figure 2 does not take respondents' privacy settings into
account.
141

5. A scaled beta is similar to a standardized regression coefficient in that the
coefficients are adjusted so that they correspond to factors that are scaled to
have a mean of zero and range of two. This makes it easier to compare effect
sizes when factors have different scales.
6. In May of 2006, Facebook began establishing company sites and allowed
members to choose their networks. Nonetheless, college Facebook communities
remain defined by those who have a school email account.
References
Adler, P., & Kwon, S. (2002). Social capital: Prospects for a new concept. Academy of
Management Review, 27 (1), 17-40.
Bargh, J., & McKenna, K. (2004). The Internet and social life. Annual Review of
Psychology, 55 (1), 573-590.
Bargh, J. A., McKenna, K. Y., & Fitzsimons, G. M. (2002). Can you see the real me?
Activation and expression of the "true self" on the Internet. Journal of Social Issues,
58 (1), 33-48.
Boase, J., Horrigan, J. B., Wellman, B., & Rainie, L. (2006). The strength of Internet
ties. Pew Internet and American Life Project. Retrieved May 20, 2006
fromhttp://www.pewinternet.org/pdfs/PIP_Internet_ties.pdf
Bourdieu, P., & Wacquant, L. (1992). An Invitation to Reflexive Sociology. Chicago:
University of Chicago Press.
Cassidy, J. (2006, May 15). Me media. The New Yorker, 50-59.
Coleman, J. S. (1988). Social capital in the creation of human capital. American Journal
of Sociology, 94(Supplement), S95-S120.
142
Cummings, J., Lee, J., & Kraut, R. (2006). Communication technology and friendship
during the transition from high school to college. In R. E. Kraut, M. Brynin, & S.
Kiesler (Eds.). Computers, Phones, and the Internet: Domesticating Information
Technology (pp. 265-278). New York: Oxford University Press.
Diener, E., Suh, E., & Oishi, S. (1997). Recent findings on subjective well-
being. Indian Journal of Clinical Psychology, 24 (1), 25-41.
Donath, J., & boyd, d. (2004). Public displays of connection. BT Technology Journal,
22 (4), 71.
Ellison, N., Heino, R., & Gibbs, J. (2006). Managing impressions online: Self-
presentation processes in the online dating environment. Journal of Computer-Mediated
Communication, 11 (2), article 2. Retrieved June 30, 2007
from http://jcmc.indiana.edu/vol11/issue2/ellison.html
Golder, S. A., Wilkinson, D., & Huberman, B. A. (2007, June). Rhythms of social
interaction: Messaging within a massive online network. In C. Steinfield, B. Pentland,
M. Ackerman, & N. Contractor (Eds.),Communities and Technologies 2007:
Proceedings of the Third International Conference on Communities and
Technologies (pp. 41-66). London: Springer.
Granovetter, M. S. (1973). The strength of weak ties. American Journal of Sociology,
78 (6), 1360-1380.
Granovetter, M. S. (1982). The strength of weak ties: A network theory revisited. In P.
V. Mardsen & N. Lin (Eds.), Social Structure and Network Analysis (pp. 105-130).
Thousand Oaks, CA: Sage Publications.
Gross, R., & Acquisti, A. (2005, November). Information revelation and privacy in
online social networks. Paper presented at the WPES'05, Alexandria, Virginia.
143

Hampton, K. (2002). Place-based and IT mediated "community." Planning Theory and
Practice, 3 (2), 228-231.
Hampton, K., & Wellman, B. (2003). Neighboring in Netville: How the Internet
supports community and social capital in a wired suburb. City & Community, 2 (4),
277-311.
Haythornthwaite, C. (2005). Social networks and Internet connectivity
effects. Information, Communication, & Society, 8 (2), 125-147.
Helliwell, J. F., & Putnam, R. D. (2004). The social context of well-
being. Philosophical Transactions of the Royal Society, 359 (1449), 1435-1446.
Hewitt, A., & Forte, A. (2006, November). Crossing boundaries: Identity management
and student/faculty relationships on the Facebook. Paper presented at CSCW, Banff,
Alberta, Canada.
Horrigan, J. B. (2002). Online communities: Networks that nurture long-distance
relationships and local ties. Pew Internet and American Life Project. Retrieved June 26,
2007 fromhttp://www.pewinternet.org/pdfs/PIP_Communities_Report.pdf
Kavanaugh, A., Carroll, J. M., Rosson, M. B., Zin, T. T., & Reese, D. D. (2005).
Community networks: Where offline communities meet online. Journal of Computer-
Mediated Communication 10 (4), article 3. Retrieved June 26, 2007
from http://jcmc.indiana.edu/vol10/issue4/kavanaugh.html
Kraut, R., Kiesler, S., Boneva, B., Cummings, J., Helgeson, V., & Crawford, A. (2002).
Internet paradox revisited. Journal of Social Issues, 58 (1), 49-74.
144

Lampe, C., Ellison, N., & Steinfield, C., (2006). A Face(book) in the crowd: Social
searching vs. social browsing. Proceedings of the 2006 20th Anniversary Conference on
Computer Supported Cooperative Work (pp. 167-170). New York: ACM Press.
Lampe, C., Ellison, N., & Steinfield, C. (2007). A familiar Face(book): Profile elements
as signals in an online social network. Proceedings of the SIGCHI Conference on
Human Factors in Computing Systems(pp. 435-444). New York: ACM Press.
LaRose, R., Lai, Y.-J., Lange, R., Love, B., & Wu, Y. (2005). Sharing or piracy? An
exploration of downloading behavior. Journal of Computer-Mediated Communication,
11 (1), article 1. Retrieved May 14, 2006
from http://jcmc.indiana.edu/vol11/issue1/larose.html
May, M., & Kwong, K. H. (2007). YHOO: Yahoo! may regret not paying up for
Facebook. Retrieved May 10, 2007
from http://www.needhamco.com/Research/Documents/CPY25924.pdf
Mazer, J. P., Murphy, R. E., & Simonds, C. J. (2007). I'll see you on "Facebook:" The
effects of computer-mediated teacher self-disclosure on student motivation, affective
learning, and classroom climate. Communication Education, 56 (1), 1-17.
Nie, N. H. (2001). Sociability, interpersonal relations, and the Internet: Reconciling
conflicting findings.American Behavioral Scientist, 45 (3), 420-35.
Parks, M. R., & Floyd, K. (1996). Making friends in cyberspace. Journal of Computer-
Mediated Communication, 1 (4). Retrieved July 14, 2006
from http://jcmc.indiana.edu/vol1/issue4/parks.html
Paul, E., & Brier, S. (2001). Friendsickness in the transition to college: Precollege
predictors and college adjustment correlates. Journal of Counseling and Development,
79 (1), 77-89.
145

Pavot, W., & Diener, E. (1993). Review of the satisfaction with life
scale. Psychological Assessment, 5 (2), 164-172.
Paxton, P. (1999). Is social capital declining in the United States? A multiple indicator
assessment.American Journal of Sociology, 105 (1), 88-127.
Putnam, R. D. (2000). Bowling Alone. New York: Simon & Schuster.
Quan-Haase, A., & Wellman, B. (2004). How does the Internet affect social capital? In
M. Huysman & V. Wulf (Eds.), Social Capital and Information Technology (pp. 113-
135). Cambridge, MA: MIT Press.
Resnick, P. (2001). Beyond bowling together: Sociotechnical capital. In J. Carroll
(Ed.), HCI in the New Millennium (pp. 247-272). Boston, MA: Addison-Wesley.
Rosenberg, M. (1989). Society and the Adolescent Self-Image (Rev. ed.). Middletown,
CT: Wesleyan University Press.
Smith, J. (2006). Updated lists of all companies and regions on Facebook. Retrieved
May 9, 2007 fromhttp://www.insidefacebook.com/2006/11/15
Stutzman, F. (2006, April). An evaluation of identity-sharing behavior in social network
communities. Paper presented at the iDMAa and IMS Code Conference, Oxford, Ohio.
Tidwell, L. C., & Walther, J. B. (2002). Computer-mediated communication effects on
disclosure, impressions, and interpersonal evaluations: Getting to know one another a
bit at a time. Human Communication Research, 28 (3), 317-348.
Wellman, B., Haase, A. Q., Witte, J., & Hampton, K. (2001). Does the Internet increase,
decrease, or supplement social capital? Social networks, participation, and community
commitment. American Behavioral Scientist, 45 (3), 436.
146

Wellman, B., Salaff, J., Dimitrova, D., Garton, L., Gulia, M., & Haythornthwaite, C.
(1996). Computer networks as social networks: Collaborative work, telework, and
virtual community. Annual Review of Sociology, 22, 213-238.
Williams, D. (2006). On and off the 'net: Scales for social capital in an online
era. Journal of Computer-Mediated Communication, 11 (2), article 11. Retrieved
August 29, 2006 fromhttp://jcmc.indiana.edu/vol11/issue2/williams.html
About the Authors
Nicole Ellison is an assistant professor in the Department of Telecommunication,
Information Studies, and Media at Michigan State University. Her research explores
issues of self-presentation, relationship development, and identity in online
environments such as weblogs, online dating sites, and social network sites.
Address: 403 Communication Arts and Sciences, East Lansing, MI 48824, USA
Charles Steinfield is Professor and Chair of the Department of Telecommunication,
Information Studies, and Media at Michigan State University. His research interests
include the uses of online social networks, individual and organizational collaboration
via ICT, and e-commerce.
Address: 409 Communication Arts and Sciences Building, East Lansing, MI 48824,
USA
Cliff Lampe is an assistant professor in the Department of Telecommunication,
Information Studies, and Media at Michigan State University. His research interests
include the social practices and architecture of online communities, online rating
systems, social software, and user-generated content.
Address: 419 Communication Arts and Sciences Building, East Lansing, MI 48824,
USA
147

Appendix 3 – SPSS RESULTS
DEMOGRAPHIC FREQUENCIES
Gender
Frequency Percent Valid Percent
Cumulative
Percent
Valid Male 98 49.0 49.0 49.0
Female 102 51.0 51.0 100.0
Total 200 100.0 100.0
148

Age
Frequency Percent Valid Percent
Cumulative
Percent
Valid <15 Yo 7 3.5 3.5 3.5
15-24 Yo 164 82.0 82.0 85.5
25-34 Yo 19 9.5 9.5 95.0
>34 Yo 10 5.0 5.0 100.0
Total 200 100.0 100.0
149
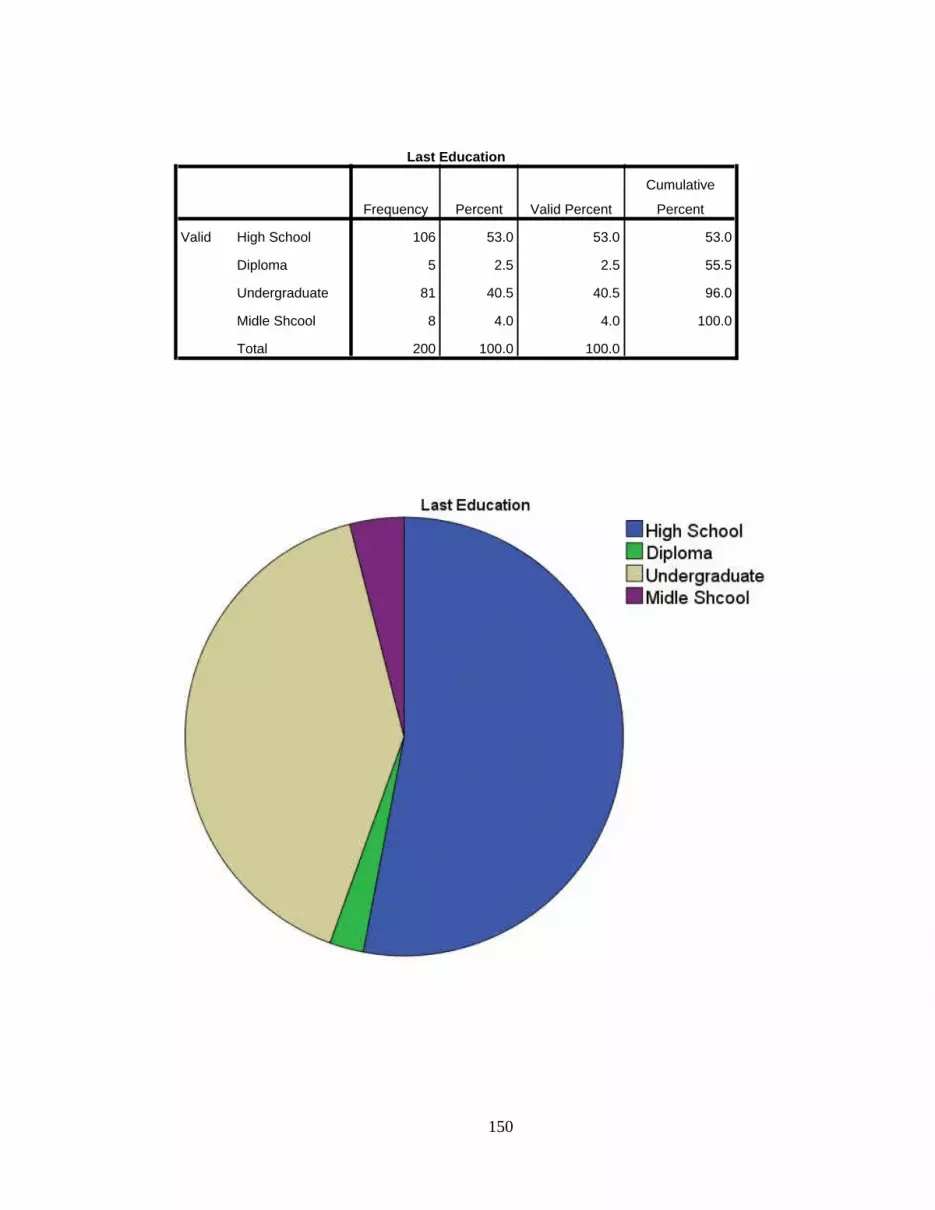
Last Education
Frequency Percent Valid Percent
Cumulative
Percent
Valid High School 106 53.0 53.0 53.0
Diploma 5 2.5 2.5 55.5
Undergraduate 81 40.5 40.5 96.0
Midle Shcool 8 4.0 4.0 100.0
Total 200 100.0 100.0
150

Current Occupation
Frequency Percent Valid Percent
Cumulative
Percent
Valid Student 135 67.5 67.5 67.5
Employed 48 24.0 24.0 91.5
Entrepreneur 11 5.5 5.5 97.0
Unemployed 6 3.0 3.0 100.0
Total 200 100.0 100.0
151

On average, how many hours do you spend on the Internet daily
Frequency Percent Valid Percent
Cumulative
Percent
Valid <1 Hour 7 3.5 3.5 3.5
1-2 Hours 39 19.5 19.5 23.0
2-3 Hours 45 22.5 22.5 45.5
>3 Hours 109 54.5 54.5 100.0
Total 200 100.0 100.0
152

MEASURES OF FACEBOOK USAGE TO MEET NEW PEOPLE & CONNECT WITH EXISTING OFFLINE
Statistics
Measures of
Facebook Usage
to Meet New
People &
Connect with
Existing Offline
Contacts [I have
used Facebook
to check out
someone I met
socially]
Measures of
Facebook Usage
to Meet New
People & Connect
with Existing
Offline Contacts [I
use Facebook to
learn more about
other people in my
class / workplace]
Measures of
Facebook Usage
to Meet New
People &
Connect with
Existing Offline
Contacts [I use
Facebook to
learn more about
other people
living near me]
Measures of
Usage to Meet
New People &
Connect with
Existing Offline
Contacts [I use
Facebook to
keep in touch
with my old
friends]
Measures of
Usage to Meet
New People &
Connect with
Existing Offline
Contacts [I use
Facebook to
meet new
people]
N Valid 200 200 200 200 200
Missing 0 0 0 0 0
Frequency Table
Measures of Facebook Usage to Meet New People & Connect with Existing Offline Contacts [I
have used Facebook to check out someone I met socially]
Frequency Percent Valid Percent Cumulative Percent
Valid Strongly Disagree 9 4.5 4.5 4.5
Disagree 19 9.5 9.5 14.0
Agree 132 66.0 66.0 80.0
Strongly Disagree 40 20.0 20.0 100.0
Total 200 100.0 100.0
153

Measures of Facebook Usage to Meet New People & Connect with Existing Offline Contacts [I use Facebook to learn more about other people in my class / workplace]
Frequency Percent Valid Percent Cumulative Percent
Valid Strongly Disagree 4 2.0 2.0 2.0
Disagree 32 16.0 16.0 18.0
Agree 120 60.0 60.0 78.0
Strongly Disagree 44 22.0 22.0 100.0
Total 200 100.0 100.0
Measures of Facebook Usage to Meet New People & Connect with Existing Offline Contacts [I use Facebook to learn more about other people living near me]
Frequency Percent Valid Percent Cumulative Percent
Valid Strongly Disagree 7 3.5 3.5 3.5
Disagree 52 26.0 26.0 29.5
Agree 113 56.5 56.5 86.0
Strongly Disagree 28 14.0 14.0 100.0
Total 200 100.0 100.0
Measures of Facebook Usage to Meet New People & Connect with Existing Offline Contacts [I use Facebook to keep in touch with my old friends]
Frequency Percent Valid Percent Cumulative Percent
Valid Strongly Disagree 2 1.0 1.0 1.0
Disagree 6 3.0 3.0 4.0
Agree 113 56.5 56.5 60.5
Strongly Disagree 79 39.5 39.5 100.0
Total 200 100.0 100.0
154

Measures of Facebook Usage to Meet New People & Connect with Existing Offline Contacts [I use
Facebook to meet new people]
Frequency Percent Valid Percent Cumulative Percent
Valid Strongly Disagree 46 23.0 23.0 23.0
Disagree 83 41.5 41.5 64.5
Agree 54 27.0 27.0 91.5
Strongly Disagree 17 8.5 8.5 100.0
Total 200 100.0 100.0
Pie Chart
155

156

157

VALIDITY TEST RESULT
IntensityItem-Total Statistics
Scale Mean if
Item Deleted
Scale Variance if
Item Deleted
Corrected Item-
Total Correlation
Cronbach's Alpha if
Item Deleted
Intensity1 13.9000 9.447 .824 .819
Intensity2 14.2500 10.168 .542 .866
Intensity3 13.9000 9.528 .729 .833
Intensity4 14.2900 9.232 .659 .847
Intensity5 14.1100 10.350 .576 .859
Intensity6 13.8500 9.354 .686 .841
Self Esteem
Item-Total Statistics
Scale Mean if
Item Deleted
Scale Variance
if Item Deleted
Corrected Item-
Total Correlation
Cronbach's
Alpha if Item
Deleted
Self-Esteem1 18.4700 7.074 .551 .758
Self-Esteem2 18.3950 7.074 .637 .746
Self-Esteem3 18.4800 7.527 .257 .820
Self-Esteem4 18.4900 7.136 .528 .762
Self-Esteem5 18.5100 7.025 .402 .790
Self-Esteem6 18.3600 6.694 .693 .732
Self-Esteem7 18.3850 6.308 .691 .727
158

Life Satisfaction
Item-Total Statistics
Scale Mean
if Item
Deleted
Scale
Variance if
Item Deleted
Corrected Item-
Total
Correlation
Cronbach's
Alpha if Item
Deleted
LifeSatisfaction1 11.5450 5.485 .618 .844
LifeSatisfaction2 11.6650 4.927 .684 .827
LifeSatisfaction3 11.5150 5.347 .762 .815
LifeSatisfaction4 11.6150 5.163 .679 .829
LifeSatisfaction5 11.9600 4.431 .693 .833
Bridging Social capital
159
Item-Total Statistics
Scale Mean if Item
Deleted
Scale Variance if
Item Deleted
Corrected Item-Total
Correlation
Cronbach's Alpha if
Item Deleted
Bridging1 21.6900 10.798 .772 .871
Bridging2 21.6350 11.972 .558 .890
Bridging3 21.8250 11.271 .538 .895
Bridging4 21.5750 11.190 .697 .878
Bridging5 21.6300 10.707 .778 .870
Bridging6 21.7200 10.866 .773 .871
Bridging7 21.7950 10.847 .639 .885
Bridging8 21.5900 11.097 .663 .881

Bonding Social Capital
RELIABILITY TEST
Reliability
Scale: ALL VARIABLES
160
Item-Total Statistics
Scale Mean if Item
Deleted
Scale Variance if
Item Deleted
Corrected Item-Total
Correlation
Cronbach's Alpha if
Item Deleted
Bonding1 11.9750 3.683 .726 .558
Bonding2 12.3250 3.929 .467 .666
Bonding3 11.9900 3.698 .731 .557
Bonding4 12.0650 4.222 .566 .631
Bonding5 12.1650 5.304 .036 .836
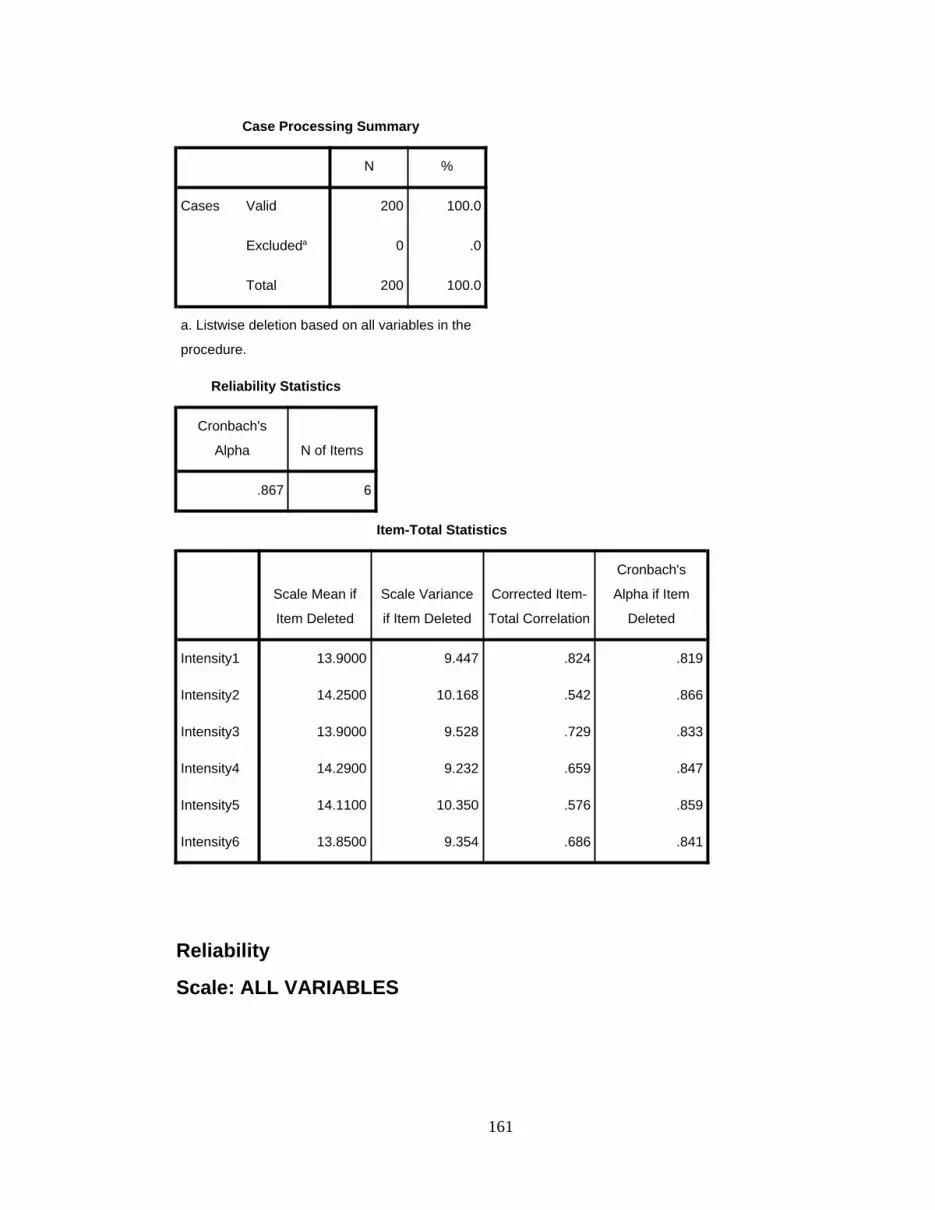
Case Processing Summary
N %
Cases Valid 200 100.0
Excludeda 0 .0
Total 200 100.0
a. Listwise deletion based on all variables in the
procedure.
Reliability Statistics
Cronbach's
Alpha N of Items
.867 6
Item-Total Statistics
Scale Mean if
Item Deleted
Scale Variance
if Item Deleted
Corrected Item-
Total Correlation
Cronbach's
Alpha if Item
Deleted
Intensity1 13.9000 9.447 .824 .819
Intensity2 14.2500 10.168 .542 .866
Intensity3 13.9000 9.528 .729 .833
Intensity4 14.2900 9.232 .659 .847
Intensity5 14.1100 10.350 .576 .859
Intensity6 13.8500 9.354 .686 .841
Reliability
Scale: ALL VARIABLES
161

Case Processing Summary
N %
Cases Valid 200 100.0
Excludeda 0 .0
Total 200 100.0
a. Listwise deletion based on all variables in the
procedure.
Reliability Statistics
Cronbach's
Alpha N of Items
.790 7
Item-Total Statistics
Scale Mean if
Item Deleted
Scale Variance
if Item Deleted
Corrected Item-
Total Correlation
Cronbach's
Alpha if Item
Deleted
Self-Esteem1 18.4700 7.074 .551 .758
Self-Esteem2 18.3950 7.074 .637 .746
Self-Esteem3 18.4800 7.527 .257 .820
Self-Esteem4 18.4900 7.136 .528 .762
Self-Esteem5 18.5100 7.025 .402 .790
Self-Esteem6 18.3600 6.694 .693 .732
Self-Esteem7 18.3850 6.308 .691 .727
Reliability
Scale: ALL VARIABLES
162

Case Processing Summary
N %
Cases Valid 200 100.0
Excludeda 0 .0
Total 200 100.0
a. Listwise deletion based on all variables in the
procedure.
Reliability Statistics
Cronbach's
Alpha N of Items
.859 5
Item-Total Statistics
Scale Mean if
Item Deleted
Scale Variance
if Item Deleted
Corrected Item-
Total Correlation
Cronbach's
Alpha if Item
Deleted
LifeSatisfaction1 11.5450 5.485 .618 .844
LifeSatisfaction2 11.6650 4.927 .684 .827
LifeSatisfaction3 11.5150 5.347 .762 .815
LifeSatisfaction4 11.6150 5.163 .679 .829
LifeSatisfaction5 11.9600 4.431 .693 .833
Reliability
Scale: ALL VARIABLES
163

Case Processing Summary
N %
Cases Valid 200 100.0
Excludeda 0 .0
Total 200 100.0
a. Listwise deletion based on all variables in the
procedure.
Reliability Statistics
Cronbach's
Alpha N of Items
.894 8
Item-Total Statistics
Scale Mean if
Item Deleted
Scale Variance
if Item Deleted
Corrected Item-
Total Correlation
Cronbach's
Alpha if Item
Deleted
Bridging1 21.6900 10.798 .772 .871
Bridging2 21.6350 11.972 .558 .890
Bridging3 21.8250 11.271 .538 .895
Bridging4 21.5750 11.190 .697 .878
Bridging5 21.6300 10.707 .778 .870
Bridging6 21.7200 10.866 .773 .871
Bridging7 21.7950 10.847 .639 .885
Bridging8 21.5900 11.097 .663 .881
Reliability
Scale: ALL VARIABLES
164

Case Processing Summary
N %
Cases Valid 200 100.0
Excludeda 0 .0
Total 200 100.0
a. Listwise deletion based on all variables in the
procedure.
Reliability Statistics
Cronbach's
Alpha N of Items
.712 5
Item-Total Statistics
Scale Mean if
Item Deleted
Scale Variance
if Item Deleted
Corrected Item-
Total Correlation
Cronbach's
Alpha if Item
Deleted
Bonding1 11.9750 3.683 .726 .558
Bonding2 12.3250 3.929 .467 .666
Bonding3 11.9900 3.698 .731 .557
Bonding4 12.0650 4.222 .566 .631
Bonding5 12.1650 5.304 .036 .836
165

REGRESSIONVariables Entered/Removedb
Model
Variables Entered
Variables
Removed Method
dimension0
1 Intensitya . Enter
a. All requested variables entered.
b. Dependent Variable: Bridging Social Capital
Model Summary
Model
R R Square
Adjusted R
Square Std. Error of the Estimate
dimension0
1 .532a .283 .280 .40077
a. Predictors: (Constant), Intensity
ANOVAb
Model Sum of
Squares df Mean Square F Sig.
1 Regression 12.578 1 12.578 78.311 .000a
Residual 31.802 198 .161
Total 44.380 199
a. Predictors: (Constant), Intensity
b. Dependent Variable: Bridging Social Capital
Coefficientsa
Model
Unstandardized Coefficients
Standardized
Coefficients
t Sig.B Std. Error Beta
1 (Constant) 1.947 .133 14.636 .000
Intensity .409 .046 .532 8.849 .000
166

Regression
Variables Entered/Removedb
Model Variables Entered Variables Removed Method
dimension0
1 Intensitya . Enter
a. All requested variables entered.
b. Dependent Variable: Bonding Social Capital
Model Summary
Model
R R Square
Adjusted
R Square
Std. Error of the
Estimate
dimension0
1 .366a .134 .129 .45993
a. Predictors: (Constant), Intensity
ANOVAb
Model Sum of
Squares df
Mean
Square F Sig.
1 Regression 6.461 1 6.461 30.543 .000a
Residual 41.884 198 .212
Total 48.345 199
a. Predictors: (Constant), Intensity
b. Dependent Variable: Bonding Social Capital
Coefficientsa
Model Unstandardized
Coefficients
Standardized
Coefficients
t Sig.B Std. Error Beta
1 (Constant) 2.202 .153 14.419 .000
Intensity .293 .053 .366 5.527 .000
Regression
167

Variables Entered/Removedb
Model Variables Entered Variables Removed Method
dimension0
1 Self-Esteem*Intensity, Intensitya . Enter
a. All requested variables entered.
b. Dependent Variable: Bridging Social Capital
Model Summary
Model R R Square Adjusted R Square Std. Error of the Estimate
dimension0
1 .877a .770 .767 .22776
a. Predictors: (Constant), Self-Esteem*Intensity, Intensity
ANOVAb
Model Sum of
Squares df Mean Square F Sig.
1 Regression 34.161 2 17.081 329.275 .000a
Residual 10.219 197 .052
Total 44.380 199
a. Predictors: (Constant), Self-Esteem*Intensity, Intensity
b. Dependent Variable: Bridging Social Capital
Coefficientsa
Model
Unstandardized Coefficients
Standardized
Coefficients
t Sig.B
Std.
Error Beta
1 (Constant) 1.350 .081 16.644 .000
Intensity .066 .031 .086 2.110 .036
Self-
Esteem*Intensity
.163 .008 .828 20.398 .000
168

Regression
Variables Entered/Removedb
Model Variables Entered Variables Removed Method
dimension0
1 Life-Satisfaction*Intensity, Intensitya . Enter
a. All requested variables entered.
b. Dependent Variable: Bridging Social Capital
Model Summary
Model
R R Square Adjusted R Square
Std. Error of the
Estimate
dimension0
1 .728a .530 .525 .32532
a. Predictors: (Constant), Life-Satisfaction*Intensity, Intensity
ANOVAb
Model
Sum of Squares df
Mean
Square F Sig.
1 Regression 23.531 2 11.765 111.168 .000a
Residual 20.849 197 .106
Total 44.380 199
a. Predictors: (Constant), Life-Satisfaction*Intensity, Intensity
b. Dependent Variable: Bridging Social Capital
Coefficientsa
Model Unstandardized
Coefficients
Standardized
Coefficients
t Sig.B
Std.
Error Beta
1 (Constant) 1.482 .117 12.638 .000
Intensity .213 .042 .277 5.046 .000
169

Variables Entered/Removedb
Model Variables Entered Variables Removed Method
dimension0
1 Life-Satisfaction*Intensity, Intensitya . Enter
a. All requested variables entered.
Life-
Satisfaction*Intensity
.109 .011 .559 10.173 .000
Regression
Variables Entered/Removedb
Model Variables Entered Variables Removed Method
dimension0
1 Self-Esteem*Intensity, Intensitya . Enter
a. All requested variables entered.
b. Dependent Variable: Bonding Social Capital
Model Summary
Model R R Square Adjusted R Square Std. Error of the Estimate
dimension0
1 .613a .376 .370 .39134
a. Predictors: (Constant), Self-Esteem*Intensity, Intensity
ANOVAb
Model Sum of Squares df Mean Square F Sig.
1 Regression 18.174 2 9.087 59.336 .000a
Residual 30.170 197 .153
Total 48.345 199
a. Predictors: (Constant), Self-Esteem*Intensity, Intensity
b. Dependent Variable: Bonding Social Capital
Coefficientsa
Model Unstandardized Coefficients Standardized
Coefficients
t Sig.
170

Variables Entered/Removedb
Model Variables Entered Variables Removed Method
dimension0
1 Self-Esteem*Intensity, Intensitya . Enter
a. All requested variables entered.
B Std. Error Beta
1 (Constant) 1.761 .139 12.642 .000
Intensity .040 .054 .050 .752 .453
Self-Esteem*Intensity .120 .014 .585 8.746 .000
a. Dependent Variable: Bonding Social Capital
Regression
Variables Entered/Removedb
Model Variables Entered Variables Removed Method
dimension0
1 Life-Satisfaction*Intensity, Intensitya . Enter
a. All requested variables entered.
b. Dependent Variable: Bonding Social Capital
Model Summary
Model
R R Square Adjusted R Square
Std. Error of the
Estimate
dimension0
1 .856a .733 .730 .25610
a. Predictors: (Constant), Life-Satisfaction*Intensity, Intensity
ANOVAb
Model
Sum of Squares df
Mean
Square F Sig.
1 Regression 35.424 2 17.712 270.054 .000a
Residual 12.921 197 .066
171

Variables Entered/Removedb
Model Variables Entered Variables Removed Method
dimension0
1 Life-Satisfaction*Intensity, Intensitya . Enter
a. All requested variables entered.
Total 48.345 199
a. Predictors: (Constant), Life-Satisfaction*Intensity, Intensity
b. Dependent Variable: Bonding Social Capital
Coefficientsa
Model Unstandardized
Coefficients
Standardized
Coefficients
t Sig.B
Std.
Error Beta
1 (Constant) 1.445 .092 15.655 .000
Intensity -.026 .033 -.032 -.779 .437
Life-
Satisfaction*Intensity
.177 .008 .870 21.014 .000
CORRELATION
172

Correlations
Intensity
Bridging Social
Capital
Intensity Pearson Correlation 1 .532**
Sig. (2-tailed) .000
N 200 200
Bridging Social Capital Pearson Correlation .532** 1
Sig. (2-tailed) .000
N 200 200
**. Correlation is significant at the 0.01 level (2-tailed).
Correlations
Intensity
Bonding Social
Capital
Intensity Pearson Correlation 1 .366**
Sig. (2-tailed) .000
N 200 200
Bonding Social Capital Pearson Correlation .366** 1
Sig. (2-tailed) .000
N 200 200
**. Correlation is significant at the 0.01 level (2-tailed).
Appendix 4 – CV
Curriculum Vitae
173
Personal Details
Name : Mohit KhianiSex : MalePlace / Date of Birth : Jakarta, February 2nd 1991Contact Address : Jln. Agung Permai 1 Block C6 No: 6, Sunter
Agung, North Jakarta, IndonesiaLand Phone : 021-64714382Mobile Phone : 08179812115E-mail Address : [email protected] ,
[email protected]. [email protected]
Educational Background
2004 – 2009: Mahatma Gandhi School (The Board of Secondary Education Indian Schools Indonesia)Matriculation -- GCE O LevelsHigher secondary -- GCE A Levels
Awards received:
Subject topper in Computing (Grade 12) – Secured 92% Average
Silver card for average > 80% (Grade 10)
174

Others: Excellent written and verbal skills in English and Bahasa
Indonesia. Possess excellent interpersonal communication skills. Honest Able to work under pressure
EXTRACURRICULAR ACTIVITIES
Member of the CAS (Care and Share) club.
Participated in Inter-house Soccer competition at Gandhi Memorial School and achieved 1st place (2009).
Participated in Inter-house Table Tennis Competition -1st place Singles (Grade 11 & 12).
Participated in Inter-house Table Tennis Competition- 1st place Doubles (Grade 10).
Participated in Mahatma Gandhi School’s fundraising events (2007-2009)
Participated in Binus International Charity Day 2009
Experience
PREFECT (Student Committee) of Mahatma Gandhi School ( 2007-2009)
175

Accounting & Computing (IT) tutor (2008-2009). Nominated as BEST LO (Liaison officer) in E.Com 2009 Member of the Event Division in E.Com 2010 Member of the Student Activity (SA) in Binus
International Student Committee (BISC) (2009-2010) Head of Research & Development (R&D) Division in
Binus International Student Committee (BISC) (2010-2011)
Member of Property Division in Binus International Leadership Training V (BILT V)
Stage Manager and Liaison Officer in Welcoming University of Virginia (UVA)
Liaison Officer in Binus International Job Expo 2009 Member of Public Relation and Promotion division in
International Photography Competition (IPC) 2010 Person In Charge (PIC) and Participant of Fundraising
Management Training Seminar Liaison Officer in D’Abc 2010 Member of Transportation, Accommodation and
Logistics For ASEAN Regional Youth Leaders Conference (RYLC) 2010
Head of Transportation, Accommodation and Logistics For ASEAN Regional Youth Leaders Conference (RYLC) 2011
Committee of Binus International Ping Pong Competition 2010 as a member of Property Division
176

Committee of Binus International Musicology –Music Competition held by Student Committee
Coordinator of Buddy Coordinators (CBC) of Welcoming Days 2010
Interests
Sports & Other activities Reading, learning new things, meeting new
people/socializing.
177


