Embed Size (px)
Citation preview

Report of the
Comptroller and Auditor General of India
for the year ended 31 March 2016
Government of Uttarakhand
Report No. 1 of the year 2017


i
Table of Contents
Description Reference to
Paragraph Page No.
Preface v
Overview vii
Chapter-I
Social, General and Economic Sectors (Non-PSUs)
Budget Profile 1.1.1 1
Application of resources of the State Government 1.1.2 1
Funds transferred directly to the State implementing agencies 1.1.3 2
Grants-in-Aid from Government of India 1.1.4 2
Planning and conduct of Audit 1.1.5 2
Significant audit observations and response of Government to Audit 1.1.6 3
Recoveries at the instance of Audit 1.1.7 3
Responsiveness of Government to Audit 1.1.8 3
Follow-up on Audit Reports 1.1.9 4
Status of placement of Separate Audit Reports of autonomous bodies in
the State Assembly 1.1.10 5
Year-wise details of reviews and paragraphs appeared in Audit Reports 1.1.11 5
PERFORMANCE AUDIT
ELEMENTRY EDUCATION DEPARTMENT
Right of Children to Free and Compulsory Education, Act 2009 1.2 6
HOME DEPARTMENT
Modernisation of the State Police Force 1.3 23
COMPLIANCE AUDIT
AYUSH DEPARTMENT
Follow-up on the Chief Controlling Officer based Performance Audit of
the AYUSH Department 1.4 33
COMMISSIONER, FOOD SAFTEY AND STANDARDS UTTARAHAND
Enforcement of Food Safety and Standards Act, 2006 in Uttarakhand 1.5 36
FOREST DEPARTMENT
Avoidable Expenditure due to commencement of works without
technical sanction 1.6 38
Prevention of forest fires 1.7 40
HIGHER EDUCATION DEPARTMENT
Setting up of Private Universities 1.8 46
HORTICULTURE DEPARTMENT
Horticulture Mission for North East and Himalayan States 1.9 50
LAND REVENUE DEPARTMENT
Recovery of Loans and Government Dues by District Collectors 1.10 56
MEDICAL, HEALTH & FAMILY WELFARE DEPARTMENT
Excess expenditure in procurement of medicines 1.11 59
108 Emergency Response Service 1.12 59

ii
Description Reference to
Paragraph Page No.
PUBLIC WORKS DEPARTMENT
Extra expenditure in work of road improvement 1.13 63
Extra expenditure due to excess use of bitumen 1.14 64
Disregard of Government instructions for conduct of survey before
preparation of estimates 1.15 65
SOCIAL WELFARE DEPARTMENT
Post Matric Scholarship to the students belonging to SC and OBC 1.16 66
TOURISM DEPARTMENT
Infrastructure Development for Tourist Destinations and Circuits 1.17 70
URBAN DEVELOPMENT DEPARTMENT
Setting up of Sewage Treatment Plants under Jawaharlal Nehru National
Urban Renewal Mission 1.18 74
WOMEN EMPOWERMENT AND CHILD DEVELOPMENT DEPARTMENT
Implementation of the Nirbhaya Scheme 1.19 79
Implementation of Beti Bachao Beti Padhao Scheme 1.20 81
Chapter-II
Revenue Sector
Trend of Revenue Receipts 2.1.1 85
Analysis of arrears of revenue 2.1.4 88
Arrears in assessments 2.1.5 88
Evasion of tax detected by the Commercial Tax Department 2.1.6 89
Refund cases 2.1.7 89
Response of the Departments towards audit 2.1.8 90
Analysis of the mechanism for dealing with the issues raised by Audit 2.1.9 92
Action taken on the recommendations accepted by the Departments/
Government 2.1.10 92
Audit Planning 2.1.11 93
Results of audit 2.1.12 93
Coverage of the Revenue Chapter 2.1.13 94
PERFORMANCE AUDIT
STAMP AND REGISTRATION DEPARTMENT
Levy and Collection of Stamp Duty and Registration Fee 2.2 95
COMPLIANCE AUDIT
COMMERCIAL TAX DEPARTMENT
Irregular tax rebate on false declaration forms 2.3 109
Irregular use of Form XI 2.4 110
Short levy of tax due to incorrect calculation 2.5 111
Chapter-III
Social and Economic Sectors (Public Sector Undertakings)
Introduction 3.1.1 113
Accountability framework 3.1.2 113
Statutory Audit 3.1.3 114
Role of Government and Legislature 3.1.4 114
Stake of State Government in the Public Sector Undertakings 3.1.5 115

iii
Description Reference to
Paragraph Page No.
Investment in State PSUs 3.1.6 115
Special support and returns during the year 3.1.7 117
Reconciliation with Finance Accounts 3.1.8 118
Arrears in finalisation of accounts 3.1.9 118
Placement of Separate Audit Reports 3.1.10 120
Impact of non-finalisation of accounts 3.1.11 120
Performance of PSUs as per their latest finalized accounts 3.1.12 120
Winding up of non-working PSUs 3.1.13 122
Accounts Comments 3.1.14 123
Response of the Government to Audit 3.1.15 124
Follow-up action on Audit Reports 3.1.16 124
Discussion of Audit Reports by Committee on Public Undertakings 3.1.17 125
Compliance to Reports of Committee on Public Undertakings 3.1.18 125
Recoveries at the instance of audit 3.1.19 125
Disinvestment, Restructuring and Privatisation of PSUs 3.1.20 126
Contents of Chapter-III (PSUs Chapter) 3.1.21 126
COMPLIANCE AUDIT
GARHWAL MANDAL VIKAS NIGAM LIMITED
Loss due to improper and prolonged storage of perishable fruits 3.2 127
UTTARAKHAND FOREST DEVELOPMENT CORPORATION
Audit of Revenue earning activities 3.3 128
Appendices
Appendix
No. Particulars
Page
No.
1.1.1 Position regarding receipt of ATNs on the paragraphs included in the ARs 135
3.1.1 Statement showing investments made by State Government in PSUs whose
accounts are in arrears 137
3.1.2
Summarised financial position and working results of Government
companies and Statutory Corporations as per their latest finalised financial
statements/accounts
138


v
PREFACE
This Report of the Comptroller and Auditor General of India for the year ended 31 March 2016
has been prepared for submission to the Governor of the State of Uttarakhand. This Report
contains three Chapters. Chapters I and II of this Report are placed before the State Legislature
under Article 151(2) of the Constitution of India while Chapter III is submitted to the State
Legislature under Section 19 (A) of the Comptroller and Auditor General’s (Duties, Powers and
Conditions of Service) Act, 1971.
Chapter I of this Report relates to audit of expenditure of the Social, General and
Economic Sectors (Non-PSUs) of the Government departments conducted under the
provisions of the Comptroller and Auditor General's (Duties, Powers and Conditions of Service)
Act, 1971. This Chapter contains significant results of performance audit and compliance audit
of departments / autonomous bodies of the Government of Uttarakhand for the year ended
31 March 2016.
Chapter II of this Report contains significant findings of audit of receipts and expenditure of
major revenue earning departments under the Revenue Sector conducted under the Comptroller
and Auditor General's (Duties, Powers and Conditions of Service) Act, 1971.
Chapter III of this Report relates to the audit of State Public Sector Undertakings in the Social
and Economic sectors. Audit of accounts of Government companies (including companies
deemed to be Government companies as per the Companies Act) is conducted by the
Comptroller and Auditor General under Section 619 of the Companies Act 1956 and Sections
139 and 143 of the Companies Act 2013 and audit of Statutory Corporations is conducted under
their respective legislations.
The instances mentioned in this Report are those which came to notice in the course of test audit
during the year 2015-16 as well as those which came to notice in earlier years but could not be
dealt with in previous Audit Reports. Instances relating to the period subsequent to 2015-16 but
pertaining to the year 2015-16 have also been included, wherever necessary.
The audit has been conducted in conformity with the Auditing Standards issued by the
Comptroller and Auditor General of India.


vii
OVERVIEW
This Report contains three performance audits viz. on (i) Right of Children to Free and
Compulsory Education (RTE), Act 2009, (ii) Modernisation of the State Police Force,
and (iii) Levy and Collection of Stamp Duty and Registration Fee and 22 compliance
audit paragraphs including one follow-up audit with financial implications
` 461.81 crore.
The total expenditure of the State increased from ` 15,539 crore to ` 27,386 crore during
2011-12 to 2015-16. The revenue expenditure of the State Government increased by
78 per cent from ` 12,975 crore in 2011-12 to ` 23,086 crore in 2015-16.
The revenue expenditure constituted 79 to 84 per cent of the total expenditure during the
years 2011-12 to 2015-16 whereas capital expenditure in the same period was 15 to
20 per cent. During this period, revenue expenditure increased at an annual average rate
of 15 per cent whereas revenue receipts grew at an annual average rate of 13 per cent
during 2011-12 to 2015-16.
The total revenue receipts of the State Government for the year 2015-16 were
` 21,234.43 crore as compared to ` 20,246.55 crore during the year 2014-15. Out of this,
50 per cent was raised through tax revenue (` 9,377.79 crore) and non-tax revenue
(` 1,219.66 crore). The balance 50 per cent was received from the Government of India
as State’s share of divisible Union taxes (` 5,333.19 crore) and Grants-in-aid
(` 5,303.79 crore). There was an increase in revenue receipts over the previous year by
` 987.88 crore.
As on 31 March 2016, there were 25 State PSUs and statutory corporations (including
four non-working PSUs) with an investment (capital and long term loans) of
` 8,768.75 crore. This total investment consisted of 63.32 per cent towards capital and
36.68 per cent in long-term loans. The equity has decreased from ` 259.91 crore in
2013-14 to ` 57.76 crore in 2015-16. The Government contributed ` 119.53 crore
towards equity, loans and Grants/Subsidies during 2015-16. Out of 21 working State
PSUs (social sector: 05, economic sector: 16) for which accounts for the latest years were
received up to September 2016, nine PSUs earned a profit of ` 349.25 crore and 12 PSUs
incurred a loss of ` 248.68 crore.
This Report is organized into three chapters. Chapter I deals with the social, general and
economic sector, Chapter II with the Revenue sector and Chapter III deals with the social
and economic sectors (Public Sector Undertaking). Some of the major audit findings are
summarized below.

Audit Report (Social, General, Revenue and Economic Sectors) for the year ended 31 March 2016
viii
CHAPTER-I
PERFORMANCE AUDIT
Right of Children to Free and Compulsory Education, Act 2009
The ‘Right of Children to Free and Compulsory Education, Act 2009’, popularly known
as the Right to Education Act (RTE Act), came into force on 1st April 2010 making
elementary education a fundamental right of all children in the age group of 6-14 years.
The RTE Act provides that every child in the age of 6 to 14 years shall have a right to
free and compulsory education in a neighbourhood school till completion of his/her
elementary education. Its provisions are implemented through the Sarva Shiksha Abhiyan
(SSA) whose framework has been revised to correspond to the provisions of the RTE Act
including the norms for opening new schools, the pupil teacher ratio and the required
infrastructure.
A performance review of the implementation of the Act brought out weaknesses in
planning and identification of beneficiary children including those belonging to weaker
sections/disadvantaged groups and delays in both release of funds and reimbursement to
schools that impaired their ability to continue education of children admitted under the
RTE Act as well as delay in completion of required infrastructure that further undermined
achievement of the objectives of the RTE Act. While there were 11,198 children enrolled
in Class-I during 2011-12 in unaided non-minority schools in the State, the retention rate
of these students was only 60 per cent at the end of fourth year as against 98 per cent of
students other than those belonging to the RTE quota admitted in the same class of the
same schools which was indicative of the reluctance or lack of efforts on the part of the
schools to retain children admitted under RTE Act thereby undermining one of its
primary objectives. Uneven pupil-teacher ratio and lack of due attention to children with
special needs coupled with delay in completion of required infrastructure and lack of
basic facilities particularly of boundary wall and playgrounds further undermined
achievement of the objectives of the RTE Act. Some of the significant findings are
elaborated below:
� The Uttarakhand Free and Compulsory Education Rules stipulate that local authorities
shall ascertain the number and details of children belonging to weaker
sections1/disadvantaged groups2 through a house-hold survey. Twenty five per cent of
seats of lowest class of the private schools are to be filled by these identified groups of
children. While a bal ganana (counting of children) was being carried out by the
Department, data with regard to children belonging to weaker sections and of other
1 Children whose parents’ annual income is ` 55,000 or less. 2 Children belonging to SC, ST, OBC (excluding creamy layer), orphan, physically handicapped,
affected with HIV, children dependent on widow or divorcee mother, whose annual income is less than ` 80,000.

Overview
ix
disadvantaged groups was not being collected and consequently, targets to cover the
children of such groups under RTE was not fixed.
[Paragraph 1.2.6.2]
� There was delay in reimbursement of expenses to schools that impaired their ability to
continue education of children admitted under the RTE Act as well as disbursement of
` 0.45 crore without verification of attendance and of ` 0.19 crore to ineligible
educational institutions besides instances of excess reimbursement and remitting funds
to schools instead of directly into bank accounts of the beneficiary children. In
addition, ` 7.07 crore was lying unutilized for two years.
[Paragraph 1.2.7.2]
� Implementation of the RTE Act in the State was affected by poor retention rate,
imbalanced pupil teacher ratio and below par learning level.
[Paragraphs 1.2.8.2, 1.2.8.4 & 1.2.8.5]
� There was delay in providing for required infrastructure with work of construction of
77 per cent of new schools, 27 per cent of additional class rooms/headmaster rooms
and 26 per cent of re-construction of schools remaining either incomplete or were yet
to even commence.
[Paragraph 1.2.8.9(a)]
� Institutional mechanisms for monitoring or grievance redressal like the State Advisory
Council, Grievance Redress Committees and child help lines were yet to be either
established or made fully operational.
[Paragraph 1.2.9]
Modernisation of the State Police Force
Government of India introduced the scheme for “Modernisation of Police Force” to
augment the operational efficiency of State Police forces to enable them to effectively
face the emerging challenges to internal security. A performance audit of implementation
of the scheme in the State of Uttarakhand brought out weaknesses in planning as well as
shortages of weapons, vehicles, equipment and manpower which affected the operational
activities of the Department. Long term planning to derive optimal benefits from the
scheme by identifying gaps in operational effectiveness and state of preparedness of the
State police was lacking due to non-implementation of the Strategic Plan. The pace of
investigations could not be quickened as the setting-up of two District Mobile Forensic
Units could not be achieved even after lapse of more than five years and only 35 out of
124 staff quarters and four out of eight non-residential buildings could be completed at a
cost of ` 4.43 crore and ` 1.38 crore respectively as on March 2016. There was lack of
monitoring and evaluation at both the Department and Government levels.
[Paragraph 1.3]

Audit Report (Social, General, Revenue and Economic Sectors) for the year ended 31 March 2016
x
COMPLIANCE AUDIT
Enforcement of Food Safety and Standards Act, 2006 in Uttarakhand
There was delay in issue of licenses in 42 per cent of the cases in the State as a whole.
Further, 94 per cent of the Food Business Operators (FBO) in the State had not been
inspected for quality of food supplied since August 2011. Due to lack of any targets, the
number of samples collected since 2011-12 was only six per cent, seven per cent and
six per cent of the total number of the FBOs registered/licensed in the State and in
Dehradun and Nainital respectively. Due to shortage of man-power, there was a
considerable delay in finalising of reports of collected samples as the average time taken
in testing and generating reports for samples is currently 125 days (2015-16) compared to
20 days taken in 2011-12.
[Paragraph 1.5]
Avoidable Expenditure due to commencement of works without technical
sanction
Award and commencement of work of construction of an office building by the Forest
Department without technical scrutiny and sanction as per codal provisions resulted in a
deficient estimate that led to avoidable expenditure of ` 2.95 crore due to cost escalation.
[Paragraph 1.6]
Prevention of forest fires
Despite the increasing incidence of forest fires in the State, adequate attention was not
placed on measures to prevent their occurrence. The Forest Department lacked sufficient
funds for preventing and controlling forest fires which translated into shortages of
essential fire-fighting equipment, vehicles, communications as well as manpower.
Shortages of equipment, accessories and vehicles required for fire-fighting in the fire
season ranged from 31 to 100 per cent while shortage of manpower ranged from 16 to
55 per cent in cadres of foresters and forest guards. Equipment when purchased was
received late in the forest divisions. Maintenance of records of occurrence of forest fires
and the response times achieved which are essential for both assessing the efficacy of the
systems in place as well as to plan future requirements was inadequate and both long
term and short term measures required for fire management were not taken.
[Paragraph 1.7]
Setting up of Private Universities
The Higher Education Department did not exercise due diligence to ensure compliance
with extant guidelines while issuing Letters of Intent to sponsoring bodies for
establishment of private universities. Full compliance with the guidelines was made by
only one out of 11 private universities in the State. Evaluation of proposals was not done
in the stipulated format and Government decisions relating to reservation for permanent

Overview
xi
residents of the State, scholarships for their students and free training for entrance
examinations were not incorporated in the Acts establishing the University of Petroleum
and Energy Studies and ICFAI University. The notification for establishment of Patanjali
University was accorded before establishment of the endowment fund.
[Paragraph 1.8]
Horticulture Mission for North East and Himalayan States
The State Mission Office of the Horticulture Department released ` 0.34 crore to a
Sansthan without the necessary approval of the State Level Executive Committee while
` 3.32 crore was irregularly disbursed for construction of poly houses and planting
material without adhering to the stipulated conditions of title to land and norms for grant
of assistance. Similarly, assistance of ` 0.91 crore was paid to beneficiaries for area
expansion of fruits and vegetables without adhering to the guidelines. The District
Horticulture Offices also provided irregular assistance of ` 0.35 crore for horticulture
mechanization and creation of water resources without either ensuring title to land of the
beneficiaries or verifying proof of expenditure incurred as required under the guidelines.
[Paragraph 1.9]
Recovery of Loans and Government Dues by District Collectors
The Land Revenue Department failed to maintain any database of recoveries of
outstanding loans and other government dues. Lack of a coordinated database at both
district and tehsil levels undermined recovery efforts with the pace of recovery averaging
only 24 per cent during the period 2013-14 to 2015-16. An amount of ` 1,095.44 crore
which was 76 per cent of the recoveries requested by departments/banks during the years
2013-14 to 2015-16 remained unrecovered. No database of Revenue Recovery
Certificates (RRCs) and action taken/ required was maintained in the selected districts
and no summarized data of recovery cases like year-wise, total pendency and recoveries
made, details of RRCs received from various departments and returned and service
charges deducted was available.
[Paragraph 1.10]
Excess expenditure in procurement of medicines
Violation of departmental instructions by the Chief Medical Superintendent Dehradun
Hospital and the Chief Medical Officer Dehradun in procurement of medicines resulted
in excess expenditure of ` 1.06 crore in the Medical, Health and Family Welfare
Department.
[Paragraph 1.11]
108 Emergency Response Service
In March 2008, the State Government entered into an agreement with a private operator
viz. GVK Emergency Management and Research Institute (EMRI) to operate an
Audit Report (Social, General, Revenue and Economic Sectors) for the year ended 31 March 2016
xii
Emergency Response Service. The private operator was selected without the proposal
being submitted to the Expenditure Finance Committee of the State Government as
stipulated in the General Financial Rules. The State Government stated that the selection
was done on the basis of terms and conditions of agreements executed between the
operator and other States. However, a comparison of the terms of service mentioned in
the Memorandum of Understanding (MoU) signed with Uttar Pradesh and Uttarakhand
brought out that parameters essential for delivery of the requisite quality of service such
as staffing norms, performance standards, reporting, monitoring, bank guarantees and
penalties were omitted from the MoU signed by the Uttarakhand Government with
EMRI. This undermined the ability of the Medical, Health & Family Welfare Department
to enforce the conditions of service and levy penalty or any other punitive measures for
deficiencies in the quality of service provided. There were, in fact, black outs in service,
providing services after prescribed response time and shortage of medical consumables
and equipment in ambulances detracted from the quality of emergency health care being
provided by the service.
Further, excess release of funds by the Medical, Health and Family Welfare Department
led to ` 18.85 crore lying unspent with the private operator GVK Emergency
Management and Research Institute (EMRI) at the end of March 2016. The Department
also did not recover operation cost of ` 6.34 crore from the operator.
[Paragraph 1.12]
Extra expenditure in work of road improvement
Calculation of cement concrete pavement work on square meter basis instead of cubic
meter as per extant guidelines in the work of improvement/strengthening of three
roads and excessive use of bituminous macadam for widening and strengthening of
New Tehri-Ghansali-Tilwara Motor road resulted in extra expenditure of ` 2.81 crore in
the Public Works Department.
[Paragraphs 1.13 and 1.14]
Disregard of Government instructions for conduct of survey before
preparation of estimates
Disregard of Government instructions by the Public Works Department to undertake a
survey before preparation of estimates relating to improvement of roads to enable plying
of Volvo buses on Dehradun-Mussoorie road resulted in non-completion of the project
despite an expenditure of ` 14.57 crore.
[Paragraph 1.15]
Post Matric Scholarship to the students belonging to SC and OBC
The Social Welfare Department was not able to ensure compliance with provisions of the
guidelines laid down for providing scholarships to the Scheduled Caste and Other

Overview
xiii
Backward Class students leading to instances of inadmissible payments and excess
payments totaling ` 3.18 crore. In addition, ` 5.21 crore was parked in bank accounts
instead of disbursing to eligible beneficiaries or being refunded to the treasury. System of
bar coding was not installed during 2014-15 in the on-line software developed by the
National Informatics Centre (NIC) Uttarakhand to filter out fake applications. Online
mapping of recognised courses and fee structure was not done by the recognised
institutions.
[Paragraph 1.16]
Infrastructure Development for Tourist Destinations and Circuits
Uttarakhand Tourism Development Board made an excess payment of centage charges of
` 0.41 crore to executing agencies and also diverted funds amounting to ` 3.20 crore
without obtaining permission of the Government of India and incurred a wasteful
expenditure of ` 0.60 crore on construction of tourist cottages. In addition, assets created
at a cost of ` 5.45 crore remained unutilized due to poor planning or inadequate
management. The Board neither finalized a formal agreement with the Garhwal Mandal
Vikas Nigam (GMVN) nor demanded its share of ` 0.33 crore of revenue of ` 1.10 crore
generated by GMVN from the operation of assets during December 2013 to May 2016.
[Paragraph 1.17]
Setting up of Sewage Treatment Plants under Jawaharlal Nehru National
Urban Renewal Mission
Out of 21 Sewage Treatment Plant projects undertaken under the Jawaharlal Nehru
National Urban Renewal Mission (JnNURM) of the Urban Development Department,
only six were completed in the selected cities/town of the State depriving the
beneficiaries of the intended benefits of the scheme. In the absence of sewer connections
to households, laying of sewer lines could not serve the intended purpose of treating
sewage and expenditure of ` 85.17 crore on laying of sewer lines remained idle. Interest
amounting to ` 0.77 crore had not been recovered on account of mobilization advance
paid to contactors against four agreements executed.
[Paragraph 1.18]
Implementation of the Nirbhaya Scheme
The State Government utilized only ` 0.23 crore out of total allocated fund of
` 1.02 crore in 2014-15 and 2015-16 resulting in poor operationalization of scheme.
Required infrastructure could not be put in place even after a lapse of more than two
years since the launch of the scheme by the Women Empowerment and Child
Development Department. Nirbhaya cells were properly functioning in the districts of
Nainital, Pauri and Udham Singh Nagar where these cells had registered and provided
legal and counselling related assistance in 99 cases till date. However in Uttarkashi, the
cell was functioning without the services of a woman advocate while in Tehri and

Audit Report (Social, General, Revenue and Economic Sectors) for the year ended 31 March 2016
xiv
Champawat districts, the cells were functioning with only a computer operator and an
anusevak.
[Paragraph 1.19]
Implementation of Beti Bachao Beti Padhao Scheme
The Women Empowerment and Child Development Department released only
` 0.20 crore to selected districts for implementation of the scheme out of received central
assistance of ` 0.77 crore of which, only ` 8.90 lakh (12 per cent) was utilized which
defeated the objective of checking the decline in child sex ratio (CSR) through mass
campaign, focused intervention and multi-sectoral action in the State. Convergence and
engagement activities could not be undertaken by the Department. Village Health,
Sanitation and Nutrition Committee-a sub-committee of the Gram Panchayat, which was
to be engaged for ground level implementation and monitoring of the scheme, had been
entrusted with no role in Pithoragarh. The committee was not even in existence in
Champawat.
[Paragraph 1.20]
CHAPTER-II
PERFORMANCE AUDIT
Performance Audit on "Levy and Collection of Stamp Duty and Registration Fee"
Levy of stamp duty, other than duties or fees collected by means of judicial stamps, is
included in the Concurrent List of the Seventh Schedule of the Constitution of India.
Stamp duty is a tax which is paid by the executor of an instrument either by using
impressed stamp paper or by affixing stamps of proper denominations as per the rates
specified in The Indian Stamp Act, 1899 (IS Act) and rules framed there under as
applicable in the State. Registration Fee is also to be paid in respect of those instruments
which are registered with the Registering Authority under The Indian Registration Act,
1908.
A performance audit of the Levy and Collection of Stamp Duty and Registration Fee for
the period 2011-16 brought out that the existing mechanism and procedure for levy and
collection of stamp duty and registration fee suffered from both systemic as well as
implementation deficiencies that resulted in non-levy or loss of revenue aggregating to
`128.35 crore. Some of the significant findings are as follows.
� Stamp and Registration department initiated Core Registration System project in 2003
for registration of documents electronically. However, 13 out of 49 Sub-Registrar
(SR) offices still remained to be computerized even after lapse of 13 years.
[Paragraph 2.2.8(a)]

Overview
xv
� Non/short levy of stamp duty and registration fees due to non-registration of
instruments which were compulsorily registerable resulted in non-levy of stamp duty
and registration fee of ` 108.25 crore.
[Paragraph 2.2.9]
� Under-valuation of properties while registering these documents resulted in short levy
of stamp duty of ` 17.20 crore.
[Paragraph 2.2.10]
� Misclassification of documents resulted in non/short levy of stamp duty and
registration fee amounting to ` 0.48 crore.
[Paragraph 2.2.11]
� Irregular adjustment of stamp duty paid at the time of agreement and incorrect
allowance of 50 per cent rebate on stamp duty on properties which were purchased on
auction resulted in short levy of stamp duty of ` 0.89 crore.
[Paragraph 2.2.12]
� Non/short stamping of documents on various counts such as acceptance of bank
guarantees by government offices, execution of lease deeds for period less than one
year, auctioning of properties mortgaged to banks without registration and reduction
of stamp duty in the case of non-eligible family members resulted in loss of revenue
of ` 1.16 crore.
[Paragraph 2.2.13]
COMPLIANCE AUDIT
False Form-C were used by a dealer for inter-State sales on concessional rate of tax
which resulted in short levy of tax ` 0.26 crore. In addition, penalty of ` 0.92 crore and
interest of ` 0.20 crore was also leviable by the Commercial Tax Department.
[Paragraph 2.3]
Irregular use of declaration Form XI for concessional rate of tax resulted in loss of
revenue of ` 5.18 lakh and penalty amounting to ` 0.18 crore to the Commercial Tax
Department.
[Paragraph 2.4]
Incorrect calculation of tax by the Assessing Authority resulted in short levy of tax of
` 0.13 crore by the Commercial Tax Department. In addition, interest of ` 9.77 lakh was
also leviable.
[Paragraph 2.5]

Audit Report (Social, General, Revenue and Economic Sectors) for the year ended 31 March 2016
xvi
CHAPTER-III
COMPLIANCE AUDIT
Loss due to improper and prolonged storage of perishable fruits
Unscientific and improper storage of apples procured under Market Intervention
Programme for extended periods resulted in the Garhwal Mandal Vikas Nigam Limited
having to sell them at base prices resulting in loss of ` 5.34 crore.
[Paragraph 3.2]
Audit of revenue earning activities
Production of timber and fire wood which was the main activity of the Uttarakhand
Forest Development Corporation (Corporation) was below the prescribed norms by
77.30 per cent and 41.11 per cent respectively resulting in loss of revenue of
` 29.31 crore. The Corporation could not ensure felling of allotted trees within the
prescribed time resulting in non-recovery of royalty amounting to ` 0.48 crore. Further,
extraction of river bed material beyond the permissible area by the Corporation attracted
a penalty of ` 2.85 crore while short deposit of composition money in lieu of value added
tax by the Corporation due to revision of rates resulted in avoidable payment of interest
of ` 0.21 crore.
[Paragraph 3.3]


1
Chapter-I
Social, General and Economic Sectors (Non-PSUs)
1.1 Introduction
1.1.1 Budget Profile
There are 60 Government departments and 44 autonomous bodies in the State. The
position of budget estimates and expenditure by the State Government during 2011-16 is
given in Table-1.1.1 below.
Table-1.1.1: Budget and Expenditure of the State Government during 2011-16 (`̀̀̀ in crore)
Particulars
2011-12 2012-13 2013-14 2014-15 2015-16
Budget
Estimates Expenditure
Budget
Estimates Expenditure
Budget
Estimates Expenditure
Budget
Estimates Expenditure
Budget
Estimates Expenditure
Revenue Expenditure
General Services 4,993.94 4,475.11 5,443.94 5,372.23 6,804.28 6,182.04 8,157.61 7402.28 8,910.83 8,409.98
Social Services 6,447.89 6,019.65 6,856.51 6,095.84 7,766.53 7,298.01 10,555.22 9,223.69 11,386.47 9,926.69
Economic Services 2,351.14 2,101.63 2,568.74 1,995.29 2,755.73 2,067.95 4,271.41 3,856.47 4,394.41 3,983.21
Grant-in-aid and
contributions 532.72 378.80 847.92 496.86 727.66 668.41 807.79 681.27 1,046.63 766.56
Total (1) 14,325.69 12,975.19 15,717.11 13,960.22 18,054.20 16,216.41 23,792.03 21,163.71 25,738.34 23,086.44
Capital expenditure
Capital Outlay 3,094.58 2,316.94 3,653.48 3,542.09 4,874.19 3,712.03 4,591.37 4,939.01 4,004.85 4,217.38
Loans and advances
disbursed 307.91 246.83 264.05 272.57 248.66 277.99 212.59 150.97 172.67 83.15
Repayment of Public
Debt 1,638.73 1,015.78 2,297.13 1,472.21 2,152.79 1,316.81 1,757.79 893.89 2,776.79 1,996.56
Contingency Fund 35.00 69.07 40.00 32.07 40.00 194.48 180.00 194.15 175.00 385.46
Public Accounts
disbursements 12,662.52 19,832.00 12,872.30 20,961.24 14,212.33 25,190.33 15,683.06 33,534.94 16,247.59 36,536.73
Closing Cash balance - 1,085.18 - 1,945.54 - 2,433.41 - 1,772.02 - 1,462.80
Total (2) 17,738.74 24,565.80 19,126.96 28,225.72 21,527.97 33,125.05 22,424.81 41,484.98 23,376.90 44,682.08
Grand Total (1+2) 32,064.43 37,540.99 34,844.07 42,185.94 39,582.17 49,341.46 46,216.84 62,648.69 49,115.24 67,768.52
Source: Annual Financial Statements and Finance Accounts.
1.1.2 Application of resources of the State Government
The total expenditure1 of the State increased from ` 15,539 crore to ` 27,386 crore during
2011-12 to 2015-16. The revenue expenditure of the State Government increased by
78 per cent from ` 12,975 crore in 2011-12 to ` 23,086 crore in 2015-16.
The revenue expenditure constituted 79 to 84 per cent of the total expenditure during the
year 2011-12 to 2015-16 whereas capital expenditure in the same period was 15 to
20 per cent. During this period, revenue expenditure increased at an annual average rate
of 15 per cent whereas revenue receipts grew at an annual average rate of 13 per cent
during 2011-12 to 2015-16.
1 Total expenditure includes revenue expenditure, capital expenditure, loans and advances.

Audit Report (Social, General, Revenue and Economic Sectors) for the year ended 31 March 2016
2
1.1.3 Funds transferred directly to the State implementing agencies
The Government of India (GoI) has transferred significant funds directly to the State
implementing agencies for implementation of various schemes/ programmes in the past
years. The system of direct transfers by GoI to implementing agencies has since been
dispensed with from 2014-15. However, out of total funds of ` 985.83 crore transferred
directly by GoI to implementing agencies, including Central implementing agencies, in
the State, an amount (funds routed outside State Budget - unaudited figures) of
` 72.84 crore (7.39 per cent) was released to the State implementing agencies.
1.1.4 Grants-in-Aid from Government of India
Grants-in-aid (GIA) received by the State from GoI during 2011-12 to 2015-16 are
depicted in Table-1.1.2 below.
Table-1.1.2: Trends in Grants-in-aid receipt from GoI (`̀̀̀ in crore)
Particulars 2011-12 2012-13 2013-14 2014-15 2015-16
Non-Plan grants 762 869 981 944 1,043
Grants for State Plan schemes 2,840 3,040 3,558 4,083 1,173
Grants for Central Plan schemes 10 8 13 99 609
Grants for Centrally Sponsored Plan schemes 462 540 523 1,879 2,479
Total 4,074 4,457 5,075 7,005 5,304
Percentage of increase/decrease over previous year 00 9 14 38 (-) 24
Percentage of Revenue Receipts 30 28 29 35 25
Grants-in-aid from GoI increased over the period 2011-12 to 2014-15. It however
decreased by ` 1,701 crore (24.28 per cent) during 2015-16 over the previous year due to
decrease in grants for the State Plan schemes by ` 2,910 crore (71.27 per cent). However,
grants for Centrally Sponsored Plan schemes, grants for Central Plan schemes and
Non-Plan grants during 2015-16 increased by ` 600 crore, ` 510 crore and ` 99 crore
respectively over the previous year.
1.1.5 Planning and conduct of Audit
The audit process starts with a risk assessment of various departments, autonomous
bodies, schemes/projects that includes assessing the criticality/complexity of their
activities, the level of delegated financial powers, internal controls and concerns of
stakeholders and previous audit findings as well as media reports. Based on this risk
assessment, the frequency and extent of audit are decided and an Annual Audit Plan is
formulated.
After completion of audit, Inspection Reports (IRs) containing audit findings are issued
to the heads of the audited entities with a request to furnish reply within one month.
Whenever replies are received, audit findings are either settled or further action for
compliance is advised. The important audit observations arising out of these IRs are
processed for inclusion in the Audit Reports which are submitted to the Governor of
Uttarakhand under Article 151 of the Constitution of India.

Chapter-I: Social, General and Economic Sectors (Non-PSUs)
3
During 2015-16, compliance audit of 371 drawing and disbursing officers of the State
and 17 units of autonomous bodies were conducted by the Office of the Accountant
General (Audit), Uttarakhand. Besides, two performance audits were also conducted.
1.1.6 Significant audit observations and response of Government to Audit
In the last few years, audit has reported on several significant deficiencies in the
implementation of various programmes/ activities as well as on the quality of internal
controls in selected departments which have negative impact on the success of programmes
and functioning of the departments. The focus was on auditing specific programmes/
schemes and to offer suitable recommendations to the Executive for taking corrective action
and improving service delivery to the citizens.
As per the Comptroller and Auditor General of India’s Regulations on Audit and
Account, 2007, the departments are required to send their responses to draft performance
audit reports/ draft paragraphs proposed for inclusion in the Comptroller and Auditor
General of India’s Audit Reports within six weeks. It was also brought to the attention of
the concerned Heads of Department that in view of likely inclusion of such paragraphs in
the Report of the Comptroller and Auditor General of India to be placed before the
Uttarakhand Legislature, it would be desirable to include their comments in the matter.
The draft reports and paragraphs proposed for inclusion in the Report were also
forwarded to the Additional Chief Secretaries / Principal Secretaries / Secretaries
concerned for seeking their replies. In Chapter-I of present Audit Report, two draft
performance audits2 and 26 draft paragraphs including one Follow-up Audit were
forwarded to the concerned administrative Secretaries. However, formal reply of the
Government has not been received in any case (December 2016).
1.1.7 Recoveries at the instance of Audit
Audit findings involving recoveries that came to notice in the course of test audit of accounts
of the departments of the State Government were referred to various departmental Drawing
and Disbursing Officers (DDOs) for confirmation and further necessary action under
intimation to audit. No audit findings involving recoveries came to the notice during
2015-16.
1.1.8 Responsiveness of Government to Audit
The Accountant General (Audit), Uttarakhand, conducts periodical inspection of
Government departments by test-check of transactions and verifies the maintenance of
important accounting and other records as per prescribed rules and procedures. These
inspections are followed by issue of Inspection Reports (IRs). The heads of offices and
next higher authorities are required to report their compliance to the Accountant General
(Audit) within one month of receipt of the IRs. Serious irregularities are also brought to
2 Right of Children to Free and Compulsory Education, Act 2009 (RTE) and Modernisation of State
Police Forces (MPF).

Audit Report (Social, General, Revenue and Economic Sectors) for the year ended 31 March 2016
4
the notice of the Heads of the Departments by the Office of the Accountant General
(Audit), Uttarakhand through a half yearly report on pending IRs sent to the Principal
Secretary/Secretary (Finance) of the State.
Based on the results of the test audit, 8,146 audit observations contained in 2,891 IRs
were outstanding as on 31st March 2016 details of which are given in Table-1.1.3 below.
Table-1.1.3: Outstanding Inspection Reports/Paragraphs
Sl. No. Name of Sector Inspections
Reports3
Paragraphs Amount involved
(`̀̀̀ in lakh)
1. Social Sector 1,682 5,288 7,19,182.98
2. General Sector 386 797 93,748.00
3. Economic Sector(Non-PSUs) 823 2,061 6,30,005.85
Total 2,891 8,146 14,42,936.83
During 2015-16, fourteen meetings of adhoc committee were held in which
54 paragraphs were settled. The departmental officers failed to take action on
observations contained in IRs within the prescribed time frame resulting in erosion of
accountability.
It is recommended that the Government may look into the matter to ensure prompt and
proper response to audit observations.
1.1.9 Follow-up on Audit Reports
1.1.9.1 Submission of suo-motu Action Taken Notes (ATNs)
According to the Rules of Procedure for Committee on Public Accounts, administrative
departments were to initiate suo motu action on all audit paragraphs including featuring
in the Comptroller and Auditor General’s Audit Reports regardless of whether these are
taken up for examination by the Public Accounts Committee or not. They were also to
furnish detailed notes, duly vetted by audit, indicating the remedial action taken or
proposed to be taken by them within three months of the presentation of the Audit
Reports to the State Legislature.
It was, however, noticed that out of 326 audit paragraphs featuring in the Civil Chapters
of Audit Reports from 2000-01 to 2013-14, suo-motu ATNs in respect of 95 audit
paragraphs involving 44 Departments had not been received (as detailed in
Appendix-1.1.1) upto 31 March 2016. The Audit Report for the year 2014-15 was placed
before the Legislative Assembly on 17th
November 2016 and the related action taken
explanatory notes are not due yet (December 2016).
1.1.9.2 Action taken on recommendations of the PAC
Action Taken Notes, duly vetted by the Accountant General (Audit), on the observations/
recommendations made by the PAC in respect of the audit paragraphs discussed by them
3 Outstanding Inspection Reports / Paragraphs have been taken from 2006-07.

Chapter-I: Social, General and Economic Sectors (Non-PSUs)
5
are to be furnished to these Committees within six months from the date of such
observations/ recommendations. Out of 326 Audit paragraphs featuring in the Civil
Chapters of Audit Reports for the years from 2000-01 to 2013-14, only 221 audit
paragraphs have been discussed by the PAC up to 31 March 2016. Recommendations in
respect of 124 Audit paragraphs have been made by the PAC. ATNs on the
recommendations of the Committees are pending from the State Government in respect
of six paragraphs.
1.1.10 Status of placement of Separate Audit Reports of autonomous bodies
in the State Assembly
Several autonomous bodies have been set up by the State Government. A large number of
these bodies are audited by the Comptroller and Auditor General of India for verification
of their transactions, operational activities and accounts, regulatory compliance audit,
review of internal management, financial control and review of systems and procedure.
The audit of accounts of one autonomous body (Uttarakhand Jal Sansthan) in the State
has been entrusted to the Comptroller and Auditor General of India. Separate Audit
Report (SAR) of Uttarakhand Jal Sansthan issued by Audit for the year 2013-14 is yet to
be placed before the State Legislature.
1.1.11 Year-wise details of reviews and paragraphs appeared in Audit
Reports
The year-wise details of performance audits and paragraphs that appeared in the Audit
Report for the last two years along with their money value are given in Table-1.1.4
below.
Table-1.1.4: Details regarding reviews and paragraphs appeared in Audit Report during 2013-15
Year
Performance Audit Paragraphs Replies received
Number Money value
(`̀̀̀ in crore) Number
Money value
(`̀̀̀ in crore)
Performance
Audit Paragraphs
2013-14 01 28.58 14 65.79 03 02
2014-15 03 371.70 12 135.00 03 10
Two performance audits4 and 17 audit paragraphs involving money value of
` 294.84 crore have been included in this Chapter. Replies, wherever received, have
been suitably incorporated at appropriate places.
4 Right of Children to Free and Compulsory Education, Act 2009 (RTE) and Modernisation of Police
Force (MPF).

Audit Report (Social, General, Revenue and Economic Sectors) for the year ended 31 March 2016
6
PERFORMANCE AUDIT
ELEMENTARY EDUCATION DEPARTMENT
1.2 Right of Children to Free and Compulsory Education, Act 2009
The ‘Right of Children to Free and Compulsory Education, Act 2009’ makes elementary
education a fundamental right of all children in the age group of 6-14 years.
A performance review of the implementation of the Act brought out weaknesses in
planning and identification of beneficiary children including those belonging to weaker
sections/disadvantaged groups and delays in both release of funds and reimbursement to
schools that impaired their ability to continue education of children admitted under the
RTE Act as well as delay in completion of required infrastructure that further undermined
achievement of the objectives of the RTE Act. Some of the significant findings were as
below:
Highlights
� The Uttarakhand Free and Compulsory Education Rules stipulate that local
authorities shall ascertain the number and details of children belonging to weaker
sections5/disadvantaged groups
6 through a house-hold survey. Twenty five per cent
of seats of lowest class of the private schools are to be filled by these identified
groups of children. While a Bal Ganana (counting of children) was being carried
out by the Department, data with regard to children belonging to weaker sections
and of other disadvantaged groups was not being collected and consequently,
targets to cover the children of such groups under RTE was not fixed.
[Paragraph 1.2.6.2]
� There was delay in reimbursement of expenses to schools that impaired their
ability to continue education of children admitted under the RTE Act as well as
disbursement of ` ` ` ` 0.45 crore without verification of attendance and of `̀̀̀ 0.19 crore
to ineligible educational institutions besides instances of excess reimbursement
and remitting funds to schools instead of directly into bank accounts of the
beneficiary children. In addition, ` ` ` ` 7.07 crore was lying unutilized for two years.
[Paragraph 1.2.7.2]
� Implementation of the RTE Act in the State was affected by poor retention rate,
imbalanced pupil teacher ratio, and below par learning level.
[Paragraphs 1.2.8.2, 1.2.8.4 & 1.2.8.5]
� There was delay in providing for required infrastructure with work of construction
of 77 per cent of new schools, 27 per cent of additional class rooms/headmaster
5 Children whose parents’ annual income is ` 55,000 or less. 6 Children belonging to SC, ST, OBC (excluding creamy layer), orphan, physically handicapped,
affected with HIV, children dependent on widow or divorcee mother, whose annual income is less than ` 80,000.

Chapter-I: Social, General and Economic Sectors (Non-PSUs)
7
rooms and 26 per cent of re-construction of schools remaining either incomplete
or were yet to even commence.
[Paragraphs 1.2.8.9(a)]
� Institutional mechanisms for monitoring or grievance redressal like the State
Advisory Council, Grievance Redress Committees and child help lines were yet to
be either established or made fully operational.
[Paragraph 1.2.9]
1.2.1 Introduction
The ‘Right of Children to Free and Compulsory Education, Act 2009’, popularly known
as the Right to Education Act (RTE Act), came into force on 1st April 2010 making
elementary education a fundamental right of all children in the age group of 6-14 years.
Subsequently, the State Government formulated (October 2011) the ‘Uttarakhand Free
and Compulsory Education Rules, 2011 (URTE Rules)’ for implementation of the RTE
Act in the State. The RTE Act provides that every child of the age of 6 to 14 years
shall have a right to free and compulsory education in a neighbourhood school till
completion of his/her elementary education. Its provisions are implemented through the
Sarva Shiksha Abhiyan (SSA) whose framework has been revised to correspond to the
provisions of the RTE Act including the norms for opening new schools, the pupil
teacher ratio and the required infrastructure.
1.2.2 Organisational Set up
The organisational set up of the Elementary Education Department which was the agency
implementing the RTE Act in the State is depicted in Chart-1.2.1 below.
Chart-1.2.1: Organisational set up for implementation of RTE
Secretary, Elementary Education
State Project Director, SSA
Addl. State Project Director, SSA
State Level Coordinator
District Project officer, SSA
District Coordinator
BEO/Dy. E.O.
Block Resource Centre/Cluster Resource Centre
Head Teacher/SMC
Director, Elementary Education
CEO/DEO(BASIC)

Audit Report (Social, General, Revenue and Economic Sectors) for the year ended 31 March 2016
8
1.2.3 Audit Objectives
The performance audit of implementation of the RTE Act in the State was carried out to
assess whether:
� planning for implementation of various components of the programme was being
done in an effective manner so as to cover all the eligible children in the targeted age
group;
� the funds allocated were being utilized in an economic and efficient manner; and
� the implementation was being monitored in a meaningful and effective manner.
1.2.4 Audit Scope and Methodology
The performance audit of was carried out during April 2016 to July 2016 and covered the
period from 2011 to 2016. Out of 13 districts in the State, three7 districts were selected
for audit. Four Blocks and 30 Schools (20 Government and 10 aided schools) in each
district were selected for audit.
Before commencing the performance audit, the audit objectives, criteria and scope were
discussed (May 2016) with the Secretary, Elementary Education, Uttarakhand in an entry
conference. Records were examined at the State Project Office (SPO), three Chief
Education Officers (CEOs), three District Project Officers, SSA (DPOs-SSA) /District
Education Officers- Basic Education (DEO Basic), 12 Block Education Officers
(BEOs)/Deputy Education Officers (Dy. EOs) of selected districts/blocks and 30 selected
schools of each selected districts. Related information was also gathered from the District
Institutes of Education and Training (DIET) of selected districts.
An exit conference was held with the Additional Chief Secretary, Elementary Education
and other concerned officers of the Department on 10th November 2016 and the views of
the Department have been suitably included at the appropriate places in the report.
1.2.5 Audit Criteria
The audit criteria used for assessing the implementation of scheme were derived from the
following sources:
� RTE Act, 2009;
� Rules laid down by the Government of India (GoI) for implementation of the RTE
Act, 2009;
� URTE Rules, 2011; and
� Annual Work Plans and Budgets prepared by the State Government.
7 Dehradun, Tehri and Udham Singh Nagar.

Chapter-I: Social, General and Economic Sectors (Non-PSUs)
9
Audit Findings
1.2.6 Planning
1.2.6.1 Delayed implementation of the RTE Act
The RTE Act had to be implemented from 01 April 2010. The SSA framework for
implementation of the Act provides that all the provisions of the Act except training of
untrained teachers were to be implemented within three years i.e. up to 31 March 2013.
The deadline for training of untrained teachers was five years i.e. up to 31 March 2015.
Audit noticed that implementation of the Act got delayed in the State by one year as the
Government was unable to formulate RTE related rules in time. Implementation
eventually commenced in the State from 1st April 2011. Due to delayed implementation
of the Act, vital components envisaged under the Act such as all-weather
school buildings, separate toilets for girls, drinking water facilities and the prescribed
pupil-teacher-ratio could not be fully implemented within the stipulated time frame
ending 31st March 2013.
1.2.6.2 Non-identification of children of weaker sections/disadvantaged
groups
As per the URTE Rules 2011, the local authority shall ascertain the number and details of
children belonging to weaker sections8/disadvantaged groups9 through a house-hold
survey. The RTE Act provides that 25 per cent seats of lowest class of the private schools
should be filled by these identified groups of children.
Test-check of records of the SPO and the three selected districts brought out that a
Bal Ganana (counting of children) was being carried out every year by the Department.
However, data with regard to children belonging to weaker sections and of other
disadvantaged groups such as orphans and children dependent upon widows or divorced
mothers was not being collected as part of the exercise during the period covered in audit.
As a result, targets to cover the children of such groups under RTE could not be fixed
thereby defeating the primary objective of the Act to provide free and compulsory
education to all the children belonging to these groups.
The Department assured (November 2016) that identification of children pertaining to
weaker sections would be carried out through a revised format of Bal Ganana from next
year.
1.2.6.3 Non-preparation of School Development Plan
The URTE Rules, 2011, provides that every School Management Committee (SMC) shall
prepare a School Development Plan (SDP) taking into account the number of additional
8 Children whose parents’ annual income is ` 55,000 or less. 9 Children belonging to SC, ST, OBC (excluding creamy layer), orphan, physically handicapped,
affected with HIV, children dependent on widow or divorcee mother, whose annual income is less than ` 80,000.

Audit Report (Social, General, Revenue and Economic Sectors) for the year ended 31 March 2016
10
teachers needed and the requirements of additional infrastructural facilities, equipment
and financial resources. The SDPs were to form the basis for preparing district and State
level plans that are submitted to the appropriate authority for release of grants.
Scrutiny of records of the selected DPOs and schools revealed that SDPs were not being
prepared by the concerned schools till 2014-15. The schools did prepare the SDPs during
the year 2015-16 but the same were not taken cognizance of at the district level while
formulating district level plans. Thus, the Annual Work Plan and Budget of the districts
were prepared without any inputs from the SDPs. As a result, actual requirements of the
schools for buildings, additional class-rooms, more teachers and for basic facilities like
clean drinking water, separate toilets for girls, playground and library could not find a
place in both the district and State level plans. This absence of any bottom up planning
led to a mismatch between actual requirements at the ground level and the resource
availability based on adhoc planning.
The Department stated (November 2016) that such SDPs were being prepared during the
current year and it would be ensured that these plans are taken into cognizance while
preparing the Annual Work Plan and Budget at the district level.
1.2.6.4 Lack of plan to ensure implementation of right to complete
elementary education
As per the RTE Act, children admitted to special category/unaided non-minority school
shall have the right to complete their elementary education.
Audit observed that there was no prior planning for securing re-admission of children
belonging to weaker sections/ disadvantaged groups who had passed class 5 from private
primary schools during the year 2015-16 to class 6 in unaided non-minority upper
primary schools (UPSs) during the year 2016-17. A meeting had been held (May 2016) in
the SPO’s office wherein it was decided that such children would be admitted in those
nearby unaided schools where seats were vacant under the 25 per cent quota. If seats
were not available in such schools, such children would be admitted to the nearby
Government Schools.
In the three test-checked districts, it was observed that neither any action regarding
re-admission of such children was taken by the concerned DPOs nor did they have any
information about re-admission of such children as per the decision taken by the SPO in
May 2016. As a result, 1,729 children10 in the selected districts and overall 5,439 children
at the State level were deprived of the opportunity to complete elementary education as
envisaged in the RTE Act.
The Department stated (November 2016) stated that a child tracking system was going to
be established very soon.
10 Dehradun-258, Tehri-186 and Udham Singh Nagar-1,285.

Chapter-I: Social, General and Economic Sectors (Non-PSUs)
11
1.2.7 Financial Management
1.2.7.1 Availability and utilization of Funds
SSA is the main vehicle for implementation of the RTE Act. The position of funds
released by the Central Government as well as the State Government and expenditure
incurred there against during 2011-16 is given in Table-1.2.1 below.
Table-1.2.1: Status of Budget and Expenditure under SSA at State level
(` in crore)
Year
Approved Budget Opening
Balance
Fund released Interest
and other
receipts
Total
Funds
available
Expenditure
Closing
Balance
Central
Share
State
Share Total GoI State
2011-12 370.65 199.58 570.23 192.88 208.92 116.67 44.07 562.54 348.62 213.92 2012-13 344.06 185.26 529.32 213.92 179.41 100.91 45.76 540.00 510.32 29.68 2013-14 233.53 125.75 359.28 29.68 220.44 113.81 52.05 415.98 354.44 61.54 2014-15 307.35 165.50 472.85 61.54 228.80 123.40 49.63 463.37 368.19 95.18 2015-16 523.56 58.17 581.73 95.18 225.88 86.69 4.49 412.24 389.57 22.67
Total 1,779.15 734.26 2,513.41 1,063.45 541.48 196.00 1,971.14
Source: State Project Office, SSA.
Audit observed the following:
� GoI released only ` 1,063.45 crore (60 per cent) against the approved budget of
` 1,779.15 crore during 2011-16. GoI did not intimate any reasons to the State
Government for this curtailment. This was one of the main reasons why 496 civil
works costing ` 28.34 crore sanctioned during 2011-16 were yet to be started. The
delay in the construction works adversely affected availability of basic amenities in
several schools as per the norms of the RTE Act.
� As per the SSA Financial Management and Procurement Rules, it is mandatory for
the State Government to release the agreed State share within 30 days of receipt of
the Central share. However, release of the State share was delayed by 22 days to
156 days during the period covered in audit. It was also observed that though the
Central share was being provided to the State Finance Department by GoI from
2014-15 with the direction to provide these funds to the SPO within 15 days, the
State Finance Department actually provided these funds to the SPO with delays
ranging from nine days to 52 days. The delay in release of funds to the SPO led to
various instances of delay in providing uniforms to the school children and late
payment of salary to the teachers.
� As per the SSA Framework of Implementation, reimbursement towards expenditure
incurred on admissions in 25 per cent seats in private unaided schools under the
RTE Act was to be supported by the GoI with effect from 1st April 2014. Funds
amounting to ` 84.45 crore were spent by the State Government towards
reimbursement to private unaided schools against 25 per cent admissions during the
period 2014-16. However, Central share amounting to ` 64.85 crore (65 per cent
and 90 per cent of expenditure during 2014-15 and 2015-16 respectively) had not
been released by the GoI as yet although the State Government had submitted
proposals for the same.

Audit Report (Social, General, Revenue and Economic Sectors) for the year ended 31 March 2016
12
The Department assured (November 2016) that timely release of funds to the SPO would
be ensured in future.
1.2.7.2 Reimbursement to unaided schools
Test-check of the reimbursement of expenses to schools and utilization of funds meant
for this purpose brought out the following:
(i) As per the URTE Rules 2011, the State Government will provide assistance11 to
children admitted in private schools under the RTE Act. The State Government
issued instructions for reimbursement of fees to unaided schools in two installments
i.e. in September and February of each academic year. Audit observed that the State
Government could not release the funds to the SPO as per the set time schedule. As a
result, funds to the districts could not be provided timely which led to delays ranging
from four months to 14 months in reimbursement of both fees to the unaided schools
as well as other expenses incurred by the children of poor and disadvantaged groups
on text books, uniforms. Further scrutiny also revealed that in Rudrapur block of
Udham Singh Nagar district, 20 time barred cheques amounting to ` 9.46 lakh for
reimbursement of fee of 27 schools and children assistance of 115 children
pertaining to the year 2012-13 were lying undisbursed. In Dehradun, children
assistance pertaining to 354 children admitted under 25 per cent quota of the RTE
Act during 2012-13 could not be paid whereas fee reimbursement of ` 0.19 crore
with regard to these children had been made to the concerned schools. Also, 52 time-
barred demand drafts amounting to ` 0.90 lakh for children assistance (2013-14)
of 52 children were also lying undisbursed as on June 2016. Due to delayed/
non-reimbursement of fees, schools had expressed their inability to continue the
education of children admitted under the RTE. This contributed to the declining
trend in the retention of such children as pointed out in paragraph 1.2.8.2.
(ii) As per the Government instructions (April 2012), assistance to children was to be
provided after verifying their attendance in the schools. Such verification had to be
done at the block level relying upon the attendance registers of the concerned
schools. Scrutiny of records of the DPOs of Dehradun and Tehri brought out that all
children admitted to unaided schools under RTE in Dehradun had recorded identical
attendance. This indicates that such attendance was not got verified from the
attendance records of the concerned unaided schools. In the Bhilangana block of
Tehri district, it was observed that reimbursement to children had been made on an
average rate of 191 days and 227 days during the year 2013-14 and 2014-15
respectively without verifying their actual attendance from the concerned schools.
As a result, payment of ` 0.13 crore to 731 children in Dehradun and ` 0.32 crore to
11 Text books: ` 150, Uniform: ` 400, and mid-day meal: ` 5.06 per day of attendance (2011-14) and
` 6.74 per day of attendance (2014-16).

Chapter-I: Social, General and Economic Sectors (Non-PSUs)
13
1,882 children in Tehri was made without any credible evidence that the children
had actually attended the schools for the days of attendance shown.
(iii) As per the directions issued by the Department (June 2012), assistance to children
had to be provided through their respective bank accounts. Scrutiny of records of the
selected blocks12 in Tehri and Udham Singh Nagar districts revealed that
reimbursement of ` 0.19 crore pertaining to children assistance for the period
2013-14 and ` 2.76 lakh for the year 2011-12 in these districts was provided to the
concerned schools through account payee cheques in favour of the schools instead of
providing the same to the children directly through their respective bank accounts. It
was also observed that the concerned officers in the blocks were unaware of the fact
whether the children were being actually reimbursed by the schools or not. The
concerned DPOs/Dy. EOs stated that due to non-availability of bank account
numbers of such children, funds pertaining to reimbursement of children assistance
were provided to the concerned schools instead. Audit observed that the Department
failed to ensure that funds intended for children were actually received by them. The
possibility of such funds being retained by the concerned schools in contravention of
the RTE Act cannot be ruled out.
(iv) The State Government had decided to reimburse actual school fees to the unaided
schools subject to a maximum limit of ` 1,383 per child per month. Scrutiny of
records of the DPOs of Dehradun and Udham Singh Nagar revealed that an excess
reimbursement of school fees of ` 4.75 lakh was made to 13 unaided schools during
the period 2011-16. Further, in Dehradun, there was double payment to schools and
children amounting to ` 1.19 lakh (` 0.66 lakh to 10 schools and ` 0.53 lakh to
34 children) during 2012-14.
(v) As per the RTE Act, madrasas, vedic pathshalas and educational institutions
primarily imparting religious instructions are not covered under the RTE Act.
Scrutiny of records of the DPO Udham Singh Nagar revealed that 14 Madrasas were
reimbursed an amount of ` 0.19 crore against the school fees of the children as well
as towards children assistance during 2011-14.
(vi) Funds for reimbursement under the RTE Act are being released by the SPO on the
basis of demands raised by the concerned DPOs. Audit scrutiny of records of the
DPO, Dehradun revealed that the closing balance of the previous year was intimated
short by ` 11.09 crore by the DPO while raising the demands for reimbursement for
the year 2014-15. Further, while raising the demands for the year 2015-16, closing
balance of 2014-15 was again intimated short by ` 7.07 crore after adjusting an
amount of ` 4.02 crore. As a result, funds amounting to ` 7.07 crore were lying
12 Chamba, Jakhanidhar and Narendra Nagar of Tehri district & Rudrapur of Udham Singh Nagar
district.
Audit Report (Social, General, Revenue and Economic Sectors) for the year ended 31 March 2016
14
unutilized since the last two years. This compromised the integrity of the financial
status being reported to both the State Government and the Central Government.
Thus, there was delay in reimbursement of expenses to schools that impaired their ability
to continue education of children admitted under the RTE Act as well as disbursement of
` 0.45 crore without verification of attendance and of ` 0.19 crore to ineligible
educational institutions besides instances of excess reimbursement and remitting funds to
schools instead of directly into bank accounts of the beneficiary children. In addition,
` 7.07 crore was lying unutilized for two years.
The Department assured (November 2016) corrective actions and enquiry for fixing
accountability.
1.2.8 Implementation of the Act
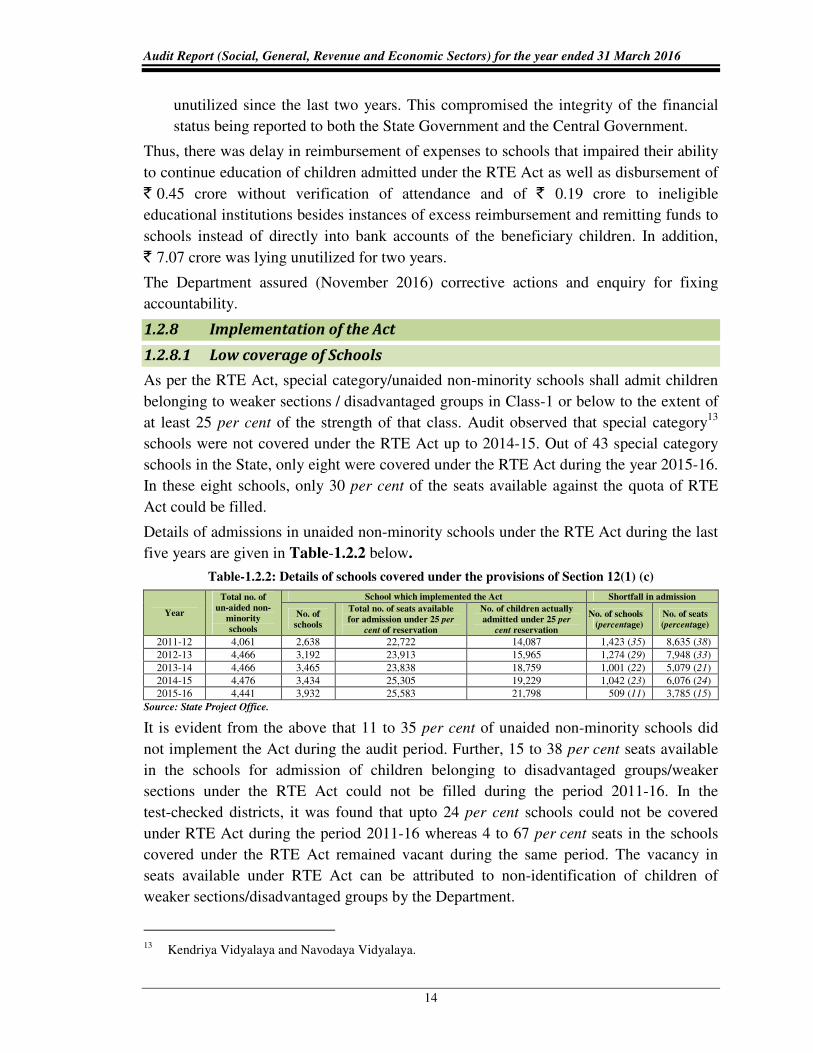
1.2.8.1 Low coverage of Schools
As per the RTE Act, special category/unaided non-minority schools shall admit children
belonging to weaker sections / disadvantaged groups in Class-1 or below to the extent of
at least 25 per cent of the strength of that class. Audit observed that special category13
schools were not covered under the RTE Act up to 2014-15. Out of 43 special category
schools in the State, only eight were covered under the RTE Act during the year 2015-16.
In these eight schools, only 30 per cent of the seats available against the quota of RTE
Act could be filled.
Details of admissions in unaided non-minority schools under the RTE Act during the last
five years are given in Table-1.2.2 below.
Table-1.2.2: Details of schools covered under the provisions of Section 12(1) (c)
Year
Total no. of
un-aided non-
minority
schools
School which implemented the Act Shortfall in admission
No. of
schools
Total no. of seats available
for admission under 25 per
cent of reservation
No. of children actually
admitted under 25 per
cent reservation
No. of schools
(percentage)
No. of seats
(percentage)
2011-12 4,061 2,638 22,722 14,087 1,423 (35) 8,635 (38) 2012-13 4,466 3,192 23,913 15,965 1,274 (29) 7,948 (33) 2013-14 4,466 3,465 23,838 18,759 1,001 (22) 5,079 (21) 2014-15 4,476 3,434 25,305 19,229 1,042 (23) 6,076 (24) 2015-16 4,441 3,932 25,583 21,798 509 (11) 3,785 (15)
Source: State Project Office.
It is evident from the above that 11 to 35 per cent of unaided non-minority schools did
not implement the Act during the audit period. Further, 15 to 38 per cent seats available
in the schools for admission of children belonging to disadvantaged groups/weaker
sections under the RTE Act could not be filled during the period 2011-16. In the
test-checked districts, it was found that upto 24 per cent schools could not be covered
under RTE Act during the period 2011-16 whereas 4 to 67 per cent seats in the schools
covered under the RTE Act remained vacant during the same period. The vacancy in
seats available under RTE Act can be attributed to non-identification of children of
weaker sections/disadvantaged groups by the Department.
13 Kendriya Vidyalaya and Navodaya Vidyalaya.

Chapter-I: Social, General and Economic Sectors (Non-PSUs)
15
The Department stated (November 2016) that instructions would be issued to the district
authorities and adequate publicity would be ensured for covering all the concerned
schools.
1.2.8.2 Retention of children admitted in unaided non-minority schools
The RTE Act stipulates that every child admitted under its provisions shall have a right to
complete free and compulsory elementary education till its completion.
Audit noticed that there were
11,198 children enrolled in Class-I
during 2011-12 in the unaided
non-minority schools in the State.
However, a number of these
students left schools each year
resulting in a retention rate of only
60 per cent at the end of fourth
year as shown in Chart-1.2.2. At
the same time, students other than
those belonging to the RTE quota
admitted in the same class of the
same schools had a robust
retention rate of 98 per cent. This
was indicative of the reluctance or
lack of efforts on the part of the
schools to retain children admitted under RTE due inter alia to delayed/
non-reimbursement of school fees to them.
The Department stated (November 2016) that instructions would be issued for releasing
the funds in a timely manner up to the school level and that DPOs would enquire into the
matter of decreasing retention trend of the children.
1.2.8.3 Schools operating without obtaining recognition certificate
As per the RTE Act, 2009, no school, other than a school established, owned or
controlled by the appropriate Government or the local authority, shall, after the
commencement of this Act, be established or function without obtaining a certificate of
recognition from such authority.
Scrutiny of records of the DEO Dehradun revealed that seven schools out of 981 private
schools were operating without the requisite recognition certificates. When the issue was
raised by audit with the Chief Education Officer, notices were issued by him to such
schools. In Udham Singh Nagar, 109 schools were running without the recognition
certificates in the year 2015-16. However, action against such schools was initiated only
in April 2016. It was also observed that admissions under the Act had been made in two

Audit Report (Social, General, Revenue and Economic Sectors) for the year ended 31 March 2016
16
unrecognized schools during 2013-16 and payment of ` 2.84 lakh was made to them as
school reimbursement/children assistance.
The Department stated (November 2016) that the matter would be looked into and
necessary action would be ensured against such schools.
1.2.8.4 Pupil-Teacher Ratio
The RTE Act envisages rational deployment of teachers to ensure Pupil Teacher Ratio
(PTR) for each school rather than just as an average for the State or District or Blocks
and that there should be no urban-rural imbalance in teachers’ posting. There should be at
least two teachers for primary school with overall PTR not more than 40:1. Similarly,
there should be at least three teachers for each upper primary school with overall PTR of
not more than 35:1. In addition, there should be a full time headmaster where the
enrolment is more than 150 and 100 in primary schools and upper primary schools
respectively.
Audit noticed that the overall PTR in the State was 16:1 and 28:1 in the primary and
upper primary levels respectively during the year 2015-16. However, rationalization of
teachers’ deployment was not as per the norms of the RTE Act in the test-checked
districts as depicted in Table-1.2.3 below.
Table-1.2.3: Position of PTR in selected districts
District Total number of
schools
Number of schools where
posting of teacher was below
the norms (percentage)
Number of schools where posting
of teacher was above the norms (percentage)
PSs UPSs PSs UPSs PSs UPSs Dehradun 950 270 196 (21) 96 (36) 138 (15) 54 (20) Tehri 1,476 367 61 (04) 59 (16) 143 (10) 171(47) Udham Singh Nagar 791 202 159 (20) 62 (31) 316 (40) 93 (46)
Source: DPOs of selected districts.
As evident from the above table, the deployment of teachers was uneven. While in
four per cent (Tehri) to 21 per cent (Dehradun) of primary schools, the deployment was
below the norm; in 10 per cent (Tehri) to 40 per cent (Udham Singh Nagar) of primary
schools, the deployment was above norm. Similar situation prevailed in case of upper
primary schools. Thus, the deployment of teachers varied widely even within a district
and needs rationalization. This fact was further substantiated during inspection of schools
where 46 out of 90 schools were found having teachers below the norms while in other
10 of them, teachers were over-deployed.
The Department assured (November 2016) that corrective measures would be taken
towards rationalization of the pupil-teacher-ratio.
1.2.8.5 Learning level assessment of children
As per the State Government instructions (January 2013), evaluation/assessment of
learning level of school children of Class I to VIII had to be done in two stages to ensure
that each child possesses the required learning level. The data with regard to learning

Chapter-I: Social, General and Economic Sectors (Non-PSUs)
17
level was to be uploaded to the web-portal. In the first stage, the evaluation of children
was done by teachers themselves while in the second stage, the students were to be
re-evaluated by the personnel of BRC/CRC/DIET/SCERT/SPO.
Scrutiny of records of the test-checked districts brought out that evaluation/assessment of
the learning level of the school children had not been carried out as required under the
Act. However, self-evaluation/assessment of learning level of school children was being
done by the teachers themselves under the Quality Monitoring Tool (QMT) programme.
Under QMT assessment, 75 per cent children were being shown under ‘A’ or ‘B’
category viz. ‘A’ graded students secured above 70 per cent marks and ‘B’ graded
students secured 30 per cent to 69 per cent marks. However, such data was never cross-
checked and analysed as required under the Government instructions of January 2013.
During physical inspection of the selected schools, learning level of 86 children of
Class-V in 16 primary level schools was got assessed by the concerned head teachers by
means of Mathematics and English test comprising the curriculum of Class-IV. It was
noticed that only 41 per cent children could solve two questions out of five questions and
the remaining children were not able to solve them. This indicates that the learning level
of children was not at par with the required levels.
The Department assured (November 2016) that efforts would be made to raise the
learning level of the children by making teachers more accountable for the progress
achieved by the students.
1.2.8.6 Functioning of School Management Committees
As per the RTE Act, every Government School shall constitute a School Management
Committee (SMC) consisting of elected representatives of the local authority, parents or
guardians of children and teachers. The SMCs were to monitor the working of the school,
prepare and recommend SDP, monitor the learning level of the children and organize
regular meetings with maximum participation of the members.
During physical inspection of selected schools, Audit observed the following:
� Regular SMC meetings did not take place as only 54 per cent meetings against the
required number were organized during 2011-16 in the selected schools;
� School Development Plans had not been prepared by SMCs during the period
2011-15; and
� Required support/assistance to the concerned schools was not provided by the SMCs.
The Department assured (November 2016) that corrective measures would be taken in
this regard.
1.2.8.7 Coverage of Children with Special Needs (CWSN)
As per SSA Framework for Implementation based on the RTE Act, every child with
special needs, irrespective of the kind, category and degree of disability, will be provided
Audit Report (Social, General, Revenue and Economic Sectors) for the year ended 31 March 2016
18
quality inclusive education. The programme inter alia provided for their placement in
regular schools and providing aids and appliances to those requiring assistive devices.
Scrutiny of records of the selected districts brought out the following:
� Identification of Children with Special Needs carried out during the audit period
varied drastically due to non-availability of expert staff as the number of CWSN
decreased 69 per cent and 52 per cent during the year 2015-16 as compared to the
year 2012-13 in Dehradun and Tehri respectively;
� In all the selected districts, an Individualised Educational Plan (IEP) for each CWSN
was not prepared during the period 2011-16;
� Audiometry test, vision test and surgery of 180, 270 and 59 CWSN respectively were
not carried out during the year 2014-15 despite the availability of funds; and
� Under-utilization of funds with regard to CWSN in Dehradun and Tehri ranged
between four to 43 per cent and between nine to 57 per cent respectively during the
period 2011-16.
The Department informed (November 2016) that implementation of this component
could not be carried out properly due to lack of resource persons.
1.2.8.8 Delayed distribution of Uniforms
The SSA Framework of Implementation of RTE provides that two sets of uniforms will
be provided to all girls, SC and ST children and BPL children under SSA. Procurement
of uniforms would be in decentralized mode at the school level.
Scrutiny of records of the test-checked DPOs and the selected schools revealed that funds
pertaining to distribution of school uniforms were not released to the schools in the
beginning of the school session during the period 2011-16. As a result, selected schools
provided school uniforms to the children with the delays up to seven months.
The Department attributed (November 2016) the delay in providing the school uniforms
to delayed release of funds by the GoI.
1.2.8.9 Infrastructure Facilities
1.2.8.9 (a) Status of construction works
Construction of school buildings and creation of other miscellaneous infrastructural
facilities14 is an important component for fulfilling obligations mandated in the RTE Act.
Test-check of records revealed that 2,971 construction works (new schools 83, additional
class room/headmaster room 2,264, re-construction of schools 624) costing
` 155.33 crore were sanctioned during 2011-16. The status of these works is depicted in
Chart-1.2.3 below.
14 Reconstruction of schools, Additional class rooms, toilets, boundary walls, Headmaster rooms.

Chapter-I: Social, General and Economic Sectors (Non-PSUs)
19
Chart-1.2.3: Status of construction works
Thus, work of construction of 77 per cent of new schools, 27 per cent of additional class
rooms/headmaster rooms and 26 per cent of re-construction of schools remained either
incomplete or were yet to even commence.
The Department stated (November 2016) that some of the sanctioned works remained
incomplete due to short release of funds by GoI during the period 2011-16 and
involvement of forest land in the other cases.
1.2.8.9 (b) Availability of basic amenities in schools
The RTE Act emphasizes upon the need to develop basic amenities to provide suitable
and clean environment. The details of non-availability of basic amenities in schools are
given in Table-1.2.4 below.
Table-1.2.4: Details of basic amenities not available in the schools
Basic Amenities Facilities not available in
the State
Facilities not available in the selected districts
Dehradun Tehri Udham Singh Nagar
Out of
12,535 PSs
(percentage)
Out of
2,796 UPSs
(percentage)
Out of
950 PSs
(percentage)
Out of
270 UPSs
(percentage)
Out of
1,476 PSs
(percentage)
Out of
366 UPSs
(percentage)
Out of
791 PSs
percentage)
Out of
202 UPSs
(percentage)
Drinking water 479 (04) 154(06) 15(02) 07 (03) 98 (07) 29(08) 13 (02) 01
Separate Toilet for Girls 418 (03) 77(03) 0 0 46 (03) 06(02) 50 (06) 11 (05)
Boundary wall 1,969(16) 443(16) 97 (10) 11 (04) 409(28) 131(36) 78 (10) 14 (07)
Kitchen shed 1,472(12) 453(16) 12 (01) 0 120(08) 15(04) 35 (04) 19 (09)
Play Ground 6,060(48) 1,447(52) 438 (46) 114 (42) 716(49) 183(50) 309 (39) 84 (42)
Source: SPO, Dehradun and DPOs of selected districts.
Thus, basic facilities such as clean drinking water, separate toilet for girls, boundary wall,
kitchen shed and playground are lacking in a considerable number of primary and upper
primary schools even after more than five years of the implementation of the Act.
0%
10%
20%
30%
40%
50%
60%
70%
80%
90%
100%
Construction ofNew Schools
ACR/Head MasterRoom
Reconstruction ofSchools
19(23%)
1,642(73%) 464 (74%) 12(14%)
256(11%) 82(13%)
52(63%)
366(16%) 78(13%)
Yet to Start
incomplete
Completed

Audit Report (Social, General, Revenue and Economic Sectors) for the year ended 31 March 2016
20
The Department assured (November 2016) taking corrective measures.
1.2.8.9 (c) Non-evaluation of Construction works
The SSA Framework for implementation of RTE stipulates that an independent
assessment of the technical quality of civil works should be carried out through
Third Party Evaluation (TPE) so that quality of civil works could be ensured.
Scrutiny of records revealed that the Department did not engage any agency to evaluate
technical quality of civil works during the period 2011-16. Moreover, funds amounting to
` 1.21 crore deducted @ 1.5 per cent of the cost of civil works for TPE were kept parked
in the bank account of the SPO during the period. As a result, technical quality of
2,125 civil works completed after incurring an expenditure of ` 95.64 crore during
2011-16 could not be evaluated by the Department. Non-evaluation impacted the quality
of construction works as illustrated by the instance of construction of an additional class
room being left incomplete in Government Primary School, PAC Camp, Rudrapur as the
work done up to lintel level was too weak to bear any further load.
The Department assured (November 2016) starting of evaluation of the construction
works soon.
1.2.9 Monitoring
1.2.9.1 Non-constitution of the State Advisory Council
In pursuance of the RTE Act, the State Government notified (December 2011) the
structure of the State Advisory Council. The function of the State Advisory Council was
to advise the State Government on effective implementation of the provisions of the RTE
Act. However, the State Advisory Council could not be constituted till date. As a result,
the implementation of the provisions of the RTE Act could not be reviewed at the apex
level and corrective actions, if any, could not be suggested to the State Government. This
deprived the State Government of an important feedback mechanism and affected overall
implementation of the Act in the State.
The Department stated (November 2016) that the Council would be constituted at the
earliest.
1.2.9.2 Non-constitution of grievance redress committee
In pursuance of the RTE Act, the State Government issued (November 2012) instructions
for settlement of grievances related with the rights of children under the Act. The
instructions required formation of the RTE Grievance Redress Committee at the
Block/District/Directorate levels. Out of the three test-checked districts, the Committee
was formed in Dehradun and Udham Singh Nagar districts in October 2015 and
September 2015 respectively. During the period 2012-16, 146 grievances/complaints
were received in the DPO Dehradun out of which only two complaints were settled and
the rest remained unsettled.

Chapter-I: Social, General and Economic Sectors (Non-PSUs)
21
The Department stated (November 2016) that the Committee would be constituted at the
earliest.
1.2.9.3 State Commission for the Protection of Child Rights
As per the RTE Act, the State Government had to constitute the State Commission for the
Protection of Child Rights (SCPCR) to examine and review the safeguards for rights
provided by or under this Act and recommend measures for their effective
implementation, inquire into complaints relating to child’s right to free and compulsory
education and take necessary steps as provided under the Act.
Audit noticed that SCPCR was constituted in Uttarakhand State in May 2011. During the
review period, 176 complaints were received out of which 39 complaints pertaining to the
period 2013-16 remained unsettled for more than three years as of April 2016. Further,
child helpline that were to be established in each block to enable a child/mother/father/
guardian to lodge complaints through SMS, letter, telephone, internet or help desk were
yet to be established. Hence, mechanisms designed to receive and redress complaints and
grievances were not in place.
The Department stated (November 2016) that directions regarding settling complaints in
timely manner and to establish the child help line would be issued.
1.2.10 Conclusion
Thus, plans for implementation of the Act were not under-pinned by data collected
through household surveys for identification of beneficiary children including those
belonging to weaker sections/disadvantaged groups and the school development plans as
well as the Annual Work Plans and Budget did not take into account inputs from the field
and district levels resulting in a mismatch between actual requirements and resource
allocations. Efficient implementation of the Act was further hindered by delays in release
of funds and reimbursement due to schools that impaired their ability to continue
education to children admitted under the RTE Act. An amount of ` 0.45 crore was
disbursed without verification of attendance and ` 0.19 crore was disbursed to ineligible
educational institutions. In addition, ` 7.07 crore was lying unutilized for two years
While there were 11,198 children enrolled in Class-I during 2011-12 in unaided
non-minority schools in the State, the retention rate of these students was only
60 per cent at the end of fourth year as against 98 per cent of students other than those
belonging to the RTE quota admitted in the same class of the same schools which was
indicative of the reluctance or lack of efforts on the part of the schools to retain children
admitted under RTE Act thereby undermining one of its primary objectives. Uneven
pupil-teacher ratio and lack of due attention to children with special needs coupled with
delay in completion of required infrastructure with work of construction of 77 per cent of
new schools, 27 per cent of additional class rooms/headmaster rooms and 26 per cent of
re-construction of schools remaining either incomplete or yet to even commence and lack

Audit Report (Social, General, Revenue and Economic Sectors) for the year ended 31 March 2016
22
of basic facilities particularly of boundary wall and playgrounds further undermined
achievement of the objectives of the RTE Act.
1.2.11 Recommendations
In light of the audit findings, the Government may:
� Strengthen the planning process by ensuring identification of beneficiary children
particularly those belonging to weaker sections/disadvantaged groups through
household surveys, preparation of school development plans and adopting a
bottom-up approach in preparing the Annual Work Plan and Budget on the basis of
the school development plans;
� Expedite transmission of funds both Central and State shares to the executing
agencies for achievement of targets while ensuring compliance with rules relating to
reimbursement of school fees;
� Initiate steps to improve the retention rate of children admitted in unaided
non-minority schools;
� Prioritise completion of ongoing and pending construction works keeping in view the
availability of resources; and
� Set up of the State Advisory Council, Grievance Redress Committees and child help
line.
The matter was referred to the Government in August 2016; its reply was awaited
(December2016).

Chapter-I: Social, General and Economic Sectors (Non-PSUs)
23
HOME DEPARTMENT
1.3 Modernisation of the State Police Force
The Government of India (GoI) introduced (1969) the scheme “Modernisation of Police
Force” (MPF) to augment the operational efficiency of the State Police forces in order to
enable them to effectively face the emerging challenges to internal security.
A performance audit of implementation of the scheme in the State of Uttarakhand
brought out weaknesses in planning as well as shortages of weapons, vehicles, equipment
and manpower which affected the operational activities of the Department. Some of the
significant findings are given below:
Highlights:
� Inordinate delays in submission and approval of Strategic and Annual Action
Plans resulted in idling of funds and delays in implementation of the Scheme.
[Paragraph 1.3.6]
� Only 35 out of 124 staff quarters and four out of eight non-residential buildings
were completed at a cost of `̀̀̀ 4.43 crore and `̀̀̀ 1.38 crore respectively as on March
2016.
[Paragraph 1.3.8.1]
� There was shortage of 366 operational vehicles. Such shortages were further
compounded due to non-availability of drivers for 438 (47 per cent) operational
vehicles.
[Paragraph 1.3.8.2]
� Training facilities were inadequate; shortage of weapons and communication
equipment affected the operational activities of the Department.
[Paragraphs 1.3.9, 1.3.12 and 1.3.13]
1.3.1 Introduction
It is the responsibility of the State Governments to modernize and adequately equip their
police forces for meeting challenges to law and order and internal security. In order to
assist the States in adequately equipping their police forces, the Government of India
(GoI) introduced (1969) the scheme for “Modernisation of Police Force” (MPF) to
augment the operational efficiency of the State Police forces. The scheme was revised in
2000-01 by GoI. The scheme aims to modernize police forces in terms of mobility
including purchase of bullet proof and mine proof vehicles, weaponry, communication
systems, training, and establishment of Forensic Science Laboratory/ Finger Printing
Bureau, equipment and buildings.
1.3.2 Organisational Set-up
The State Police Department is headed by the Director General of Police (DGP) who is
assisted by Additional Directors General of Police (ADGP), Inspectors General of Police
(IG), Deputy Inspectors General of Police (DIG), Director, Forensic Science Laboratory
(FSL) and Superintendents of Police in various districts and Commandants in field

Audit Report (Social, General, Revenue and Economic Sectors) for the year ended 31 March 2016
24
formations. The implementation of the scheme is overseen by a State Level Empowered
Committee (SLEC) headed by the Principal Secretary, Home Department, along with the
DGP and representatives from the Home Department and the Finance Department as
members.
1.3.3 Audit Objectives
The objectives of the performance audit were to evaluate whether:
� planning for implementation of various components of the scheme was efficient and
major thrust areas of the scheme were adequately covered;
� utilization of funds for implementation of the programme was efficient and effective;
� implementation of major objectives of the schemes were as per norms and targets
fixed;
� efforts to upgrade skills of the police force and increase their striking capabilities
commensurate with the stated objectives; and
� monitoring mechanism and internal control system were in place and were effective.
1.3.4 Audit Scope and Methodology
The implementation of the scheme relating to the period 2011-12 to 2015-16 was
reviewed during April 2016 to July 2016 by test-check of records of the IG
(Modernisation), IG (Intelligence), Director (FSL), IG (Home Guards), the
Superintendents of Police of five districts15, the Principal of the Police Training Centre
(Narendra Nagar) and the Commandant of 31st Vahini PAC. These were selected on the
basis of expenditure incurred by various units under the MPF Scheme budget during
2011-12 to 2015-16.
The audit objectives, criteria and scope of the performance audit were discussed with the
Principal Secretary, Home Department, in an entry conference held on 22nd April 2016.
The audit findings were discussed on 8th November 2016 with the Principal Secretary,
Home Department, in an exit conference and the views of the Department have been
suitably included at the appropriate places in the report.
1.3.5 Audit criteria
The criteria used to benchmark the implementation of the scheme were derived from the
following sources:
� Bureau of Police Research and Development (BPR&D) and Ministry of Home
Affairs (MHA) - GoI guidelines on the scheme and perspective plan;
� Annual Action Plans (AAPs) of the State approved by the MHA, release orders of
GoI/State Government;
� Uttarakhand Procurement Rules, 2008 and other related codal provisions; and
� Various other instructions issued from time to time by the GoI / State Government.
15 Haridwar, Udham Singh Nagar, Dehradun, Rudraprayag and Bageshwar.

Chapter-I: Social, General and Economic Sectors (Non-PSUs)
25
Audit Findings
1.3.6 Planning
A strategic plan for five years (2011-16) was to be prepared to identify and analyse the
gaps in various components under the MPF with reference to BPR&D norms so as to
arrive at the requirements of the State for modernisation of its Police force. The State
Government was required to frame its Annual Action Plans (AAPs) based on the
five-year Strategic Plan.
The Department prepared a Strategic Plan for the period 2011-16 which was however
never sent to GoI. It was also observed that this Strategic Plan was not taken into
consideration for the preparation of the Annual Action Plans (AAP). Instead, the
Department prepared the AAPs by simply aggregating the demands received from
various units/districts. Thus AAPs lacked any underlying long term vision. This
disconnect between the Strategic Plan and the Annual Action Plans resulted in lack of a
long term perspective in modernising the State Police.
Under the revised scheme (2000-01), the State Government was to submit an Annual
Action Plan (AAP) to the Ministry of Home Affairs (MHA), GoI, by 31st December each
year indicating specific projects to be implemented every year on priority basis. Scrutiny
of records revealed that there were delays ranging from five to 10 months in submission
of the Annual Action Plans to MHA by the State Government. The delay on part of the
State Government was further compounded by subsequent delay on the part of the MHA
in approving the AAPs. As a result, the State Government was left with insufficient time
to spend the allocated funds on modernisation projects within the financial year leading
to instances of under-utilisation or non-utilisation of allocated funds within the year of
their release.
The Department stated (November 2016) that the Strategic Plan would be taken into
consideration while preparing AAPs for ensuing years.
1.3.7 Fund Management
Funds earmarked under the MPF scheme were to supplement the resources of the State
for the modernization of the State Police. For the purposes of funding, the State of
Uttarakhand is categorised as Category ‘B’ under both ‘Non-Plan’ and ‘Plan’
components. The State is eligible for financial assistance on 60:40 basis with the Centre
contributing 60 per cent of the funds.
The State Police Headquarters (PHQ) received ` 46.54 crore under the MPF for the years
2011-16 as against projected requirement of ` 2,102.31 crore worked out in the Strategic
Plan. Out of the ` 46.54 crore received, PHQ utilized ` 43.72 crore leaving an unspent
(March 2016) balance of ` 2.82 crore as detailed Table-1.3.1 below.

Audit Report (Social, General, Revenue and Economic Sectors) for the year ended 31 March 2016
26
Table-1.3.1: Strategic Plan, Funds Released and Expenditure Incurred
(`̀̀̀ in crore)
Year Strategic
Plan
Approved
Plan
Actual
Release
Central Assistance State Share
Released Spent Released Spent Unspent
2011-12 27.58 14.00 7.62 5.75 5.75 1.87 1.57 0.30 2012-13 521.64 15.58 6.00 3.61 3.61 2.39 2.39 0.00 2013-14 518.62 16.11 16.96 12.89 12.89 4.07 3.75 0.32
2014-15 518.07 13.75 13.41 8.81 8.81 4.60 3.87 0.73
2015-16 516.40 6.24 2.55 0.42 0.42 2.13 0.66 1.47 Total 2,102.31 65.68 46.54 31.48 31.48 15.06 12.24 2.82
Source: Information provided by the Department.
The State Government was required to release the State share as soon as possible after the
release of the Central share. Audit analysis revealed delay in release of the State share
ranging between six to 48 months. Further, funds released by the GoI under Non-Plan
grant were also not being utilised by the Department within the financial year itself and
were either surrendered or parked in Public Ledger Accounts (PLAs) as brought out in
Table-1.3.2 below.
Table-1.3.2: Funds released by GoI under Non-Plan Grant
(`̀̀̀ in lakh)
Year Allotment
Utilised Year wise expenditure from PLA
Surrender Balance During
the year
Kept in
PLA 2012-13 2013-14 2014-15 2015-16
2011-12 357.15 228.94 128.21 - 25.20 66.60 6.41 30.00 2012-13 582.66 0.00 582.66 - 514.35 49.42 - 04.10 14.79 2013-14 522.41 519.49 2.92 - - - - - 2.92 2014-15 449.05 218.84 230.21 - - - 158.00 - 72.21 2015-16 200.00 52.60 - - - - - 147.40 -
Total 157.91 118.21
Source: Information provided by the Department.
1.3.8 Operational infrastructure
1.3.8.1 Buildings
Construction of well secured Police stations and residential quarters for police personnel
is one of the thrust areas of the scheme. The State Government accorded high priority to
this component and allotted ` 22.33 crore16 during 2011-12 to 2015-16 for the purpose
which was 48 per cent17
of the total released funds. The PWD (Public Works
Department) was one of the executing agencies for the civil works. The State
Government placed requisite funds with the PWD as per the approved AAPs.
There are 155 Police stations and 251 outposts in the State out of which only 130 police
stations and 146 outposts were operating from their own buildings whereas 25 police
stations and 105 outposts were operating from rented premises or from temporary
arrangements. Further, there were only 2,553 staff quarters (10.27 per cent) available for
24,863 police personnel and staff in the State.
16 For Non-residential buildings: ` 5.34 crore and for residential buildings: ` 16.99 crore. 17
` 22.33 crore allotted from 2011-12 to 2015-16 for construction works out of total ` 46.54 crore budget.

Chapter-I: Social, General and Economic Sectors (Non-PSUs)
27
Audit noticed that the Department was able to take up the construction of only 124 staff
quarters and eight non-residential buildings during 2011-16 under the scheme leaving a
huge gap in both residential and the non-residential buildings as of March 2016. Out of
these 124 staff quarters taken up, only 35 quarters18 were completed at a cost of
` 4.43 crore and four out of eight non-residential buildings19 were completed at a cost of
` 1.38 crore. As of March 2016, construction of 89 staff quarters and four
non-residential buildings remained incomplete even after incurring an expenditure of
` 16.52 crore. Further, out of these 89 staff quarters, construction of 12 quarters was yet
to be commenced/or was stopped due to non-finalisation of site, execution of additional
works beyond the approved plan and modifications to designs and drawings of the
building. While the above were broadly indicative of weaknesses in planning, execution
and design of works as well as of lack of synchronisation with available resources, there
were also instances of construction works being taken up without ascertaining a clear title
to the land at the proposed sites.
The Department stated (September 2016) that the construction of sufficient numbers of
residential quarters could not be carried out due to lack of budget. The reply is not
convincing as Annual Action Plans were never submitted for approval of GoI funds
received were not fully utilised on construction of residential buildings.
1.3.8.2 Deficiency in Mobility
As per BPRD norms, mobility (motor vehicles) deficiency should be ‘nil’ in a
well-equipped police force in order to achieve the prescribed reduction in response time
to crime. During 2011-16, 413 vehicles20 were purchased by the Department at a cost of
` 8.72 crore. Only 1,517 vehicles were available against the overall requirement of
2,178 vehicles as brought out in Table-1.3.3 below.
Table-1.3.3: The position and shortage of essential vehicles
Particulars Heavy Medium Light Motorcycle Total
Requirement as on 1 April 2011 as per BPRD norm (A) 246 205 590 614 1,655 Additional requirement for new PSs/OPs during 2011-12 to 2015-16 (B)
20 38 70 100 228
Condemned during 2011-12 to 2015-16 (C) 25 10 188 72 295 Gross Requirement as on 31
st March 2016 (D)=(A+B+C) 291 253 848 786 2,178
Available as on 1 April 2011 (E) 230 93 559 517 1,399 Net requirement as on 31
st March 2016 (F) = (D)-(E) 61 160 289 269 779
Purchased during 2011-16 (G) 7 108 166 132 413 Net shortage of vehicles as on 31
st March 2016 (F)-(G) 54 52 123 137 366
Vehicle available as on 31st March 2016 212 191 537 577 1,517
Source: Data provided by the Department.
18 13 staff quarters costing ` 1.66 crore were completed (March 2016) but were not handed over to the
Department due to some deficiencies found (July 2016). 19 02 non-residential building costing ` 0.11 crore were completed (March 2016) but were not handed
over to the Department due to some deficiencies found (July 2016). 20 Heavy vehicles: 7; Medium: 108; Light: 166; Motor cycles: 132.

Audit Report (Social, General, Revenue and Economic Sectors) for the year ended 31 March 2016
28
9
59
9
0
50
100
6 to 12 hours 12 to 24 hours more than 24hours
Chart -1.3.1: Response Time
Number of cases
It was further observed as follows:
� In test-checked districts, 32 per cent21 of the available vehicles had completed their
stipulated useful life22. The Department had not planned for their replacement;
� Only 502 regular drivers (53 per cent) were in position against availability of
940 vehicles (heavy: 212, medium: 191 and light: 537) as on 31 March 2016. The
Department stated (July 2016) that a proposal for creation and filling up of 235 posts
of drivers was pending for consideration of the State Government since October
2014; and
� The SPs of 12 districts were provided with 38 cranes worth ` 5.56 crore. In the
test-checked districts, two cranes23 valued at ` 0.41 crore had remained idle for more
than two years due to technical issues. Moreover, no driver was posted in six
districts24 to operate 13 cranes and only 16 drivers were available in other six districts
to operate 25 cranes available there.
The shortage of vehicles had an adverse impact
on the response time of the Police. While the
Department had not fixed any norm for
response time, such information was recorded
in the Crime Index Registers at the concerned
Police stations in the test checked Police
stations. The response time ranged from six
hours to 12 hours in nine cases, 12 hours to 24
hours in 59 cases and more than 24 hours in nine cases as depicted in the Chart-1.3.1.
Thus, in 25 per cent cases, response time was more than six hours.
1.3.9 Weaponry and equipment
Upgradation and sufficient supply of weaponry to the force was a very important aspect
of the MPF scheme. BPRD guidelines provide that the scale of weapons to be procured is
to be fixed by the State Government. The importance of adequate weaponry is
accentuated in a border State like Uttarakhand. Accordingly, the State Government
projected a requirement of ` 11.71 crore in the Strategic Plan to reduce the gaps in
weaponry.
Scrutiny of records of the PHQ and the Commandant, Central Ordinance Depot, Udham
Singh Nagar revealed the following:
(i) There were only 9,730 weapons available against requirement of 15,289 weapons in
the State (63.64 per cent);
21 102 vehicles completed their life span out of 318 vehicles. 22 Norms for light vehicle in hilly areas are 8 years or 1.25 lakh km & for Plain areas 10 years or
1.50 lakh km and in respect of Motor cycles either 48 thousand kms or five years whichever is earlier. 23 Haridwar (` 0.19 crore) and U.S Nagar (` 0.22 crore). 24 Chamoli, Tehri, Uttarkashi, U.S. Nagar, Almora, & Pithoragarh.

Chapter-I: Social, General and Economic Sectors (Non-PSUs)
29
(ii) Against requirement of 2,221 modern weapons, only 867 (39.04 per cent) were
available during the period 2011-16. Despite the gap, only ` 1.12 crore was spent
for procurement of weapons during 2011-16 which constituted 2.41 per cent of the
total budget allotted under MPF scheme during 2011-16
(iii) Only 347 bullet proof jackets and 298 helmets were available against requirement
of 918 bullet proof jackets (37.15 per cent) and 724 helmets (41.16 per cent).
(iv) Fifty bullet proof helmets worth ` 7.15 lakh, 75 bullet proof jackets worth
` 0.29 crore and 120 rain suits worth ` 1.80 lakh were purchased in March 2016 but
remained undistributed till July 2016 due to minor defects and delay in testing.
1.3.10 Strengthening of Forensic Science Laboratories
The scheme envisaged strengthening of the Forensic Science Laboratory (FSL) by
inducting modern equipment to reduce the delay in investigation of crime cases in the
State. Under the MPF scheme, the Department received ` 1.45 crore25 for purchase of
equipment for FSL against which only ` 0.59 crore (40.69 per cent) could be utilised.
The Department stated (September 2016) that the funds could not be utilised fully as the
tendered cost of equipment was higher than the amount available for the purpose. The
reply is not convincing as there was delay of three to four years in tendering
(February 2014).
GoI also released ` 4.08 crore26 grant-in-aid to the State Government for setting up of a
Regional Forensic Science Laboratory (RFSL) and two District Mobile Forensic units
(DMFU) at Almora and Srinagar under the scheme. Out of ` 4.08 crore, ` 3.01 crore had
been expended for the above works which included the purchasing of three crime scene
vehicles and staff vehicle. However, neither the RFSL nor the two DMFUs could be
established as yet as below:
� There was delay of over three and half years in according (September 2014)
administrative and financial approval as well as technical sanction of ` 1.94 crore for
the construction of RFSL at Rudrapur from the month of receiving the grant-in-aid.
The construction was completed in December 2016 but the building is yet to be
handed over by the executing agency (December 2016).
� In case of DMFU Almora, the DPR had been sent (September 2016) by the executing
agency27 to the Director General (Police) for approval and in case of DMFU Srinagar
the process to acquire the land was still on (November 2016) even after lapse of more
than five years.
25 In 2011-12: ` 0.54 crore, 2013 -14: ` 0.75 crore and 2014-15:` 0.16 crore. 26 First Installment- ` 1.65 crore in March 2011 and balance amount of ` 2.43 crore of first installment in
April 2011. 27 Uttarakhand Pey Jal Sansadhan Evam Vikas Nigam.

Audit Report (Social, General, Revenue and Economic Sectors) for the year ended 31 March 2016
30
Thus, the objective of setting-up the RFSL and DMFUs could not be achieved by the
Department even after lapse of more than five years due to unplanned approach of the
Department.
1.3.11 Delay in analysis of samples by the State Forensic Science Laboratory
In criminal investigations, the reports of FSL constitute an expert opinion and have legal
acceptance under Section 293 of the Criminal Procedure Code. Therefore, the quality of
crime investigation can be improved by strengthening the dimension of forensic science.
Details of pendency of cases are given in the Table-1.3.4 below.
Table-1.3.4: Year wise number of samples received and examined
Year OB No. of samples
CB Received Examined
2011-12 132 799 770 161 2012-13 161 1,202 1,115 248 2013-14 248 1,179 1,142 285 2014-15 285 1,322 1,132 475 2015-16 475 458 445 488
Out of 488 pending cases, 244 cases were pending for periods ranging between
1-3 months, 142 cases for 3-6 months, 64 cases for 6-12 months and 38 cases were
pending for a period more than one year as of 31 March 2016.
It was noticed that one of the reasons behind the high pendency of cases was that the FSL
Dehradun had only one scientist available for the study of samples and was also running
with huge shortages in other technical cadres as well. Details of shortages in various
cadres in the FSL are given in the Table-1.3.5 below.
Table-1.3.5: Details of shortage of staff in the FSL regarding various cadres
Post Sanctioned Strength Men in position Vacancy
Director 01 - 01
Joint Director 02 - 02 Deputy Director (Scientist) 05 01 04 Scientific Assistant 16 07 09 Senior Scientific assistant 18 - 18 Lab Assistant 18 08 10
Source: Information provided by the Department.
1.3.12 Training
Training assumes utmost importance in improving the striking capabilities and other
operational efficiencies of the police force and to prepare them to tackle law and order
situations in the State. Training schools are required for imparting both initial training to
police personnel as well as subsequent in-service courses. A total of 1,131 men and
130 women were trained in the Police Training College (PTC) Narendra Nagar and
228 women and 97 men in PTC of other States during the period 2011-12 to 2015-16.
Out of ` 0.86 crore provided by the MHA during 2011-16 for the procurement of training
aids and equipment, the Department utilised ` 0.76 crore28. Scrutiny however revealed
28 Office equipment like photocopy machine, computer, printer, fax machine, camera and projector.

Chapter-I: Social, General and Economic Sectors (Non-PSUs)
31
that the infrastructure at the PTC was still inadequate and training equipment insufficient
as below:
� PTC lacked infrastructure like swimming pool, assault/obstacle courses,
mountaineering class room / wall, audio-visual facilities and hill driving facilities.
The Department, as a result, had to bear an extra burden of ` 3.90 crore on training of
228 women and 97 men at PTC Moradabad (Uttar Pradesh) during the period
2011-2016;
� PTC did not have a firing range which is a fundamental part of the training;
� Only 5,000 litres of drinking water per day was being provided against requirement of
36,000 litres of drinking water per day. The remaining requirement was partially met
by way of temporary arrangement29;
� The training school lacked basic amenities like beds, chairs, hot water, library,
pharmacist which hampered imparting training to the apprentices; and
� Auditorium for lectures and Fax/Wi-Fi were not available in the campus.
Thus, the PTC was not fully equipped and geared for imparting requisite training to
police personnel which would have a bearing on their ability to deal effectively with law
and order situations in the field.
1.3.13 Project implementation of CCTNS
Crime and Criminal Tracking Network and Systems (CCTNS) aims at creating a
comprehensive and integrated system for enhancing the efficiency and effectiveness of
policing at all levels and especially at the Police Station level through adoption of
principles of e-Governance and creation of a nationwide networked infrastructure for
evolution of IT-enabled state-of-the-art tracking system.
Audit noticed that 125 out of 155 police stations were covered under CCTNS in the State.
Although most of the police stations were connected to share the crime and criminal data,
the facility of online registration of FIRs and online tracking of cases was still not
available to citizens due to lack of a citizens’ portal for use by the public. Further, only
seven out of 125 connected police stations were registering the FIRs offline due to
connectivity issues.
1.3.14 Manpower Resources
The sanctioned strength (SS) and person in position (PIP) of various categories of police
personnel during 2013-14 to 2015-16 for the State is indicated in Table-1.3.6 below.
Table-1.3.6: Year wise details of SS, PP and vacant post against various Groups
Year Group A Group B Group C Group D
SS PP Vacant SS PP Vacant SS PP Vacant SS PP Vacant
2013-14 71 60 11 166 102 64 24,359 22,160 2,199 1,567 1,449 118 2014-15 71 60 11 176 125 51 25,293 22,155 3,138 1,663 1,434 229 2015-16 72 60 12 185 118 67 25,615 23,319 2,296 1,667 1,366 301
Source: Information provided by the Department.
29 Tankers.
Audit Report (Social, General, Revenue and Economic Sectors) for the year ended 31 March 2016
32
Despite the shortages, Audit observed that specific planning and strategies to mitigate the
situation had not been factored in while projecting requirement of funds in the AAPs
forwarded to GoI. While an increase in strength of the police force may not reduce the
incidence of crimes as such, it would go a long way in creating a greater sense of security
and may have an impact on public order.
1.3.15 Monitoring mechanism
The State Level Empowered Committee (SLEC) was required to be convened once in
every quarter to monitor the preparation, submission of AAP and implementation of the
MPF. As per the minutes of meetings held, the SLEC met only once every year during
2011-16 for the finalisation of the AAP. It was further noticed that the evaluation of
implementation of the Scheme was not undertaken at any stage by the State Government
to assess its impact on the efficiency of the State police. Thus, there was lack of sufficient
monitoring and evaluation both at the Department and the Government levels.
1.3.16 Conclusion
Long term planning to derive optimal benefits from the scheme by identifying gaps in
operational effectiveness and state of preparedness of the State police was lacking due to
non-implementation of the Strategic Plan. Mobility of police force was adversely affected
due to shortage of both vehicles and drivers and pace of investigation could not be
quickened as the setting-up of Regional Forensic Science Laboratory and two District
Mobile Forensic Units could not be achieved even after lapse of more than five years.
Training facilities were inadequate and shortage of weapons and equipment affected the
operational activities of the Department.
1.3.17 Recommendations
In light of the audit findings, the Government may:
� Strengthen the planning process to ensure a realistic and time bound action plan for
progressive modernization of the State Police Force;
� Expedite construction of police stations and residential quarters for police personnel to
improve the satisfaction levels in a time bound manner by due coordination with the
executing agencies and effective monitoring of progress of works;
� Take measure to mitigate the deficiencies of weapons and equipment in order to
enable the Force to tackle the emerging law and order and internal security threats; and
� Strengthen mechanisms for monitoring of projects under various components of the
Scheme.
The matter was referred to the Government in September 2016; its reply was awaited
(December 2016).

Chapter-I: Social, General and Economic Sectors (Non-PSUs)
33
COMPLIANCE AUDIT
AYUSH DEPARTMENT
1.4 Follow-up on the Chief Controlling Officer based Performance Audit of
the AYUSH Department
1.4.1 Introduction
A performance audit on “Ayurveda, Yoga & Naturopathy, Unani, Siddha and
Homoeopathy (AYUSH)” covering the period 2006-07 to 2010-11 was included in the
Audit Report (Civil) for the year ended 31 March 2011. The Report was placed before
the State Legislative Assembly in December 2012. The audit findings have not been
taken up for discussion by the Public Accounts Committee as of September 2016.
1.4.2 Objective, scope and methodology of audit
A follow-up audit was conducted with the objective of assessing the implementation of recommendations made in the earlier Audit Report and other important audit findings. The follow-up audit was conducted from April to May 2016 through test-check of records of the offices of the Director, Ayurvedic and Unani Services, the Director, Homoeopathy, the Principal cum Superintendent, Rishikul Post Graduate Medical College and Hospital, Haridwar, the Superintendent, Government State Pharmacy, Haridwar and two out of four district level offices (Haridwar and Pauri) of Ayurveda and Homoeopathy audited earlier. The period covered in audit was from 2011-12 to 2015-16. The audit was conducted with reference to the four recommendations accepted by the Government in the exit conference (March 2012) against 27 observations included in the Audit Report 2011.
Audit Findings
1.4.3 Implementation of audit recommendations
The status of implementation of the four audit recommendations accepted by the Government has been arranged in the following three categories:
A Insignificant or No progress Audit findings made in earlier
Report
Recommendation
made
Current status as informed by
Department Audit findings/ comment
(i) Medicines were purchased for non-functional allopathic dispensaries of AYUSH wings (66 to 82 per cent) by the Department. (Para 4.1.9.2 of previous audit report).
Procurement of Medicines and Equipment should be need based and that too on the basis of demands sent by the district functionaries.
Medicines purchased amounting to ` 0.61 crore (` 0.36 crore in the year 2014-15 and issued centralized supply order worth ` 0.25 crore in the year 2015-16) for 180 AYUSH wings in the allopathic dispensaries. Out of these thirty-four per cent of the allopathic dispensaries remained non-functional during the period.
The recommendation is still relevant for implementation.
(ii) Medicines were distributed to
the districts on the basis of
number of Hospitals/
Dispensaries/AYUSH wings in
the district and not on the basis of
number of patients and
requirement of the respective
Hospitals/ Dispensaries/ AYUSH
Out of 88 hospitals in the two
test-checked districts, 45
hospitals (51 per cent) had less
than 6,000 patients per year
whereas 43 hospitals (49
per cent) had more than 6,000
patients per year. Irrespective of
the number of the patients, the
The recommendation has
been overlooked by the
Department as can be seen
from the equal distribution
of medicines in different
dispensaries with dissimilar
number of patients.

Audit Report (Social, General, Revenue and Economic Sectors) for the year ended 31 March 2016
34
wings. (Para 4.1.9.3 of previous
audit report)
Directorate and District
Ayurvedic Officers (DAOs)
distributed medicines equally to
all the hospitals / dispensaries.
The Department stated (November 2016) that instructions have been issued to the district
functionaries to distribute medicine to the dispensaries/hospitals after assessing number
of patients.
B Partial Implementation
Audit findings made in earlier
Report
Recommendation
made
Current status as informed
by Department
Audit findings/comment
(i) The unspent balance of central assistance and the interest earned on the unspent funds was neither refunded to GoI nor was adjusted against subsequent allotments. (Para- 4.1.7.2 of previous audit report).
To fully utilize central assistance obtained under operational schemes.
(A) Savings reduced to 11 per cent during 2011-16 as compared to 34 per cent during 2006-11.
(B) Interest amounting to ` 0.48 crore accrued on funds till March 2016 was lying idle in the bank account of Homeopathic Department. Similarly, the State Health Society (SHS) earned an interest of ` 1.22 crore during 2007-08 to 2015-16.
(A) While there were significant improvements on the issue, there remained gaps in planning and execution.
(B) The Department needs to refund or adjust the interest earned on GoI funds on regular basis.
(ii) The four dermatology centre buildings were renovated but were non-functional (October 2011) due to lack of furniture, equipment, medicines and staff (Para 4.1.7.4 of previous audit report).
Out of the six targeted dermatology clinics, four had been established. These clinics were made functional by deploying man power and providing medicines, equipment and furniture.
The Department could not ensure sufficient availability of space for establishment of remaining two dermatology clinics.
(iii) The five Reproductive and Child Healthcare (RCH) wing buildings were renovated but were non-functional due to non-availability of man-power, equipment and medicines. (Para
4.1.8.2 (B) of previous audit report).
Out of eight RCH wings, five had been established after incurring an expenditure of ` 0.67 crore. These wings were made functional (2013) by deploying man power, and providing medicines, equipment and furniture.
Three RCH wings could not be established due to inability of the Department to ensure availability of required space.
(iv) Integration of AYUSH at the level of Primary Health Centres (PHCs) and Community Health Centres (CHCs) was envisaged by the Department of AYUSH. Out of 116 PHCs and 23 CHCs targeted for renovation, funds for renovation of only six CHCs and 26 PHCs could be released (September 2011) despite availability of funds since December 2007. [Para 4.1.8.2 (A) of previous audit report]
Integration of AYUSH with the allopathic system of medicine and completion of civil works in this regard on priority.
Out of 116 PHCs and 23 CHCs targeted for renovation, only 34 PHCs and six CHCs were renovated (May 2014) to provide AYUSH facilities. The renovation work of rest of the CHCs & PHCs could not be executed as the Department of Health & Family Welfare failed to provide space for the same.
The scheme could not be implemented up to the required level due to Department’s failure to arrange for sufficient space.
(v) The Department of Ayurveda had initiated the construction of 57 buildings for hospitals and dispensaries during 2006-11. None of the buildings could be handed over to the Department by the civil work implementing agencies during the period 2006-11. (Para 4.1.8.6 of previous audit report).
Out of incomplete 57 building works (March 2011), 43 building works had been completed, six building works were in progress, six building works under process of handing over, construction of one building work was suspended due to land dispute and one constructed building was damaged due to disaster (April 2016).
The works are, to a large extent, complete. However, there was inordinate delay in the process.

Chapter-I: Social, General and Economic Sectors (Non-PSUs)
35
(vi) The construction and renovation of targeted eight hospitals was under progress. Procurement of equipment and furniture were made. All procured equipment were stored in the rooms and lying idle (October 2011) in the hospitals. (Para
4.1.9.1 of previous audit report).
Procurement of Medicines and Equipment should be need based and that too on the basis of demands sent by the district functionaries.
Out of the target of upgrading eight hospitals, construction/renovation works of the six hospitals had been completed and the facilities were functional (2013-2016). Handing over of one work (Badkot, Uttarkashi) and finishing work of one hospital (Majra, Dehradun) were in progress. Equipment were being used in all the eight Hospitals.
Equipment/furniture procured were being utilized in the hospitals, except in the case of Ayurvedic Hospitals at Badkot and Majra.
(vii) The attendance of students in Under Graduate courses in the test-checked semesters was far below the norms of Central Council for Indian Medicines (CCIM) (75 per cent of total lectures). (Para 4.1.11.3 of previous audit report).
Effective Internal Control Mechanisms to strengthen existing Acts and Rules.
The attendance of students in test-checked First and Second year Under Graduate courses (Batch 2013) was below the norms (First year: 13-65 per cent, Second year: 03-54 per cent).
However, the Campus Director, Rishikul stated that extra classes were being organized for the students. Further, students who attended 75 per cent extra classes were allowed to appear in the examinations.
The college, which was expected to develop high standards of teaching, training and research, failed in matching the prescribed norms.
C Full Implementation
Audit findings made in earlier
Report
Recommendation
made
Current status as informed by
Department Audit findings/ comments
(i) Funds received for strengthening enforcement machinery for AYUSH drugs remained unutilized and were kept in the current account of the Department till the date of audit (October 2011).(Para 4.1.7.3 of previous audit report)
To fully utilize central assistance obtained under operational schemes.
Out of ` 0.29 crore, an amount of ` 0.15 crore had been utilised by way of procurement of vehicles and computerization of the AYUSH/Drug Controller office. Remaining amount was surrendered to GoI in January 2012.
The Department fully utilized the funds provided by the GoI.
(ii) Contrary to Rule 154 (2) of Drugs & Cosmetic Rules, 1945, the licensing authority (Director, Ayurvedic and Unani Services) issued licenses to 18 pharmacies without the consultation of experts as the panel was not in existence at that time.(Para
4.1.11.1 of previous audit report)
Effective Internal Control Mechanisms to strengthen existing Acts and Rules.
During the period 2011-16, the licensing authority issued licenses to pharmacies in consultation with experts nominated by the State Government.
The Department has implemented the audit recommendation to the fullest.
(iii) In pursuance of the GoI notification (March 2003), the Directorate issued (July 2008) orders to all the DAOs to ensure that firms had obtained Good Manufacturing Practice (GMP) before renewal of their license. 32 licenses were renewed after the notification of GOI without issuance of GMP including 10 licenses issued after the Departmental Order (July 2008). (Para 4.1.11.2 of previous audit report).
No licenses were renewed without GMP Certificate during the period 2011-16. However, renewal of GMP certificate of 12 pharmacies was pending (pendency ranging from 03 to 09 months) for which notices had been issued by the licensing authority.
The Department has done the needful. However, renewal of GMP certificates of 12 pharmacies is required to be completed at the earliest.

Audit Report (Social, General, Revenue and Economic Sectors) for the year ended 31 March 2016
36
1.4.4 Conclusion
Of the total recommendations and observations made by the audit, the extent of
implementation of the accepted audit observations and recommendations by the
Government was 25 per cent recommendations fully implemented, 58 per cent partially
implemented and 17 per cent not implemented as on June 2016. While significant
progress had been made by the State Government in addressing some of the concerns
raised in audit, there remained instances of funds remaining unspent, equipment
remaining idle, and inability of the State Government in extending AYUSH facilities
which merited continuous attention.
The matter was referred to the Government in June 2016; its reply was awaited
(December 2016).
Commissioner, Food Safety and Standards, Uttarakhand
1.5 Enforcement of Food Safety and Standards Act, 2006 in Uttarakhand
There was delay in issue of licenses in 42 per cent of the cases in the State as a
whole. Further, 94 per cent of the Food Business Operators in the State had not
been inspected for quality of food supplied since August 2011.
1.5.1 Introduction
The Food Safety and Standards Act was enacted in August 2006 by Parliament for laying
down scientific standards for regulating the manufacture, storage, distribution, sale and
import of articles of food and to ensure availability of safe and wholesome food for
human consumption. Subsequent regulations in the form of Food Safety and Standards
(Licensing and Registration of Food Businesses) Regulations came into effect from
August 2011. The Act required establishment of a single reference point in the form of
Food Safety and Standards Authority of India (FSSAI) for all matters relating to food
safety and standards.
In Uttarakhand, the Commissioner, Food Safety and Standards, is responsible for overall
enforcement of the Act through Designated Officers (DOs) at the district level. The DOs
are assisted by Food Safety Officers (FSOs) in discharge of their duties.
1.5.2 Registration and Licensing of Food Business Operators
The Regulations lays down that all Food Business Operators (FBOs) will be registered or
licensed in accordance with the prescribed procedure. Every petty30 FBO is required to
register himself/herself with the registering authority viz. the concerned FSO and also
follow the basic hygiene and safety requirements provided in the Regulations. A valid
license is required for commencing any food business if the FBO does not fall under the
category of petty FBOs.
30 Food Business Operators with annual turnover upto ` 0.12 crore.

Chapter-I: Social, General and Economic Sectors (Non-PSUs)
37
There were 61,228 registered petty FBOs and 7,696 licensed FBOs in the State up to
March 2016. In the selected districts of Dehradun and Nainital, the number of registered
petty FBOs and licensed FBOs were 18,320 and 3,493 respectively.
1.5.3 Delay in issuing of Licenses
According to the Regulations, a license shall be issued by the concerned licensing
authority within a period of 60 days from the date of issue of an application ID number
which, in turn, is issued on receipt of a complete application including additional
information, if asked for.
Test-check of records of the Office of the Commissioner and of the DOs of Dehradun and
Nainital brought out delays in issuing of licenses to FBOs in the State as a whole as well
as in the two selected districts as depicted in Chart-1.5.1 below.
Chart-1.5.1: Delay in issue of licenses to FBOs
Source: data/information provided by the Commissioner Food Safety Uttarakhand.
As can be seen from the Chart-1.5.1, 42 per cent31
licenses were provided after the
prescribed time limit of 60 days in the State. At the same time, 61 per cent and
26 per cent licenses were provided after the prescribed time limit in Dehradun and
Nainital districts respectively.
The delay was attributed (July 2016) by the respective DOs to late submission of required
documents by FBOs. The reply is not tenable as there was delay averaging 38 days at the
level of DOs in issuing the licenses after receiving the applications from the FBOs.
31 [(156+385+2,672)/(156+385+2,672+4,483)]*100 per cent = 42 per cent.
4,483
968 764
2,672
1,034
254
385
307
15
156
149
2
0
1000
2000
3000
4000
5000
6000
7000
8000
9000
State Dehradun Nainital
above 180 days
91 to 180 days
61 to 90 days
Within time of 60 days

Audit Report (Social, General, Revenue and Economic Sectors) for the year ended 31 March 2016
38
1.5.4 Sampling of Food Articles
Sampling of food products is one of the important aspects of enforcement of the Food
Safety and Standards Act. Scrutiny of records revealed that no targets were fixed for
sampling the food items sold by the operating FBOs. Due to lack of any targets, the
number of samples collected since 2011-12 was only six per cent, seven per cent and
six per cent of the total number of the FBOs registered/licensed in the State and in
Dehradun and Nainital respectively. Thus, 94 per cent of FBOs operating in the State
have been out of the operating inspection process since the Regulations came into effect.
Sampling assumes even more significance in view of the fact that 14 per cent, 20 per cent
and 13 per cent of the samples collected in the whole State and in Dehradun and Nainital
respectively have failed. This raises serious concerns regarding food safety necessitating
greater checks through increased sampling of the FBOs.
1.5.5 Testing of Food Articles
The Food Safety Act provides for seizure of food items by food safety officers and
testing of them by food analysts for compliance of standards of food items with the
standards laid down by the Act. Therefore, laboratories and food analysts have a major
role to play in enforcement of the Food Safety Act.
Scrutiny of records of the Commissioner, Food Safety revealed that 28 posts32 had been
created in January 2013 by the Government for the State’s lone Food and Drug Testing
Laboratory at Rudrapur. However, only six junior analysts were working in the
laboratory at present. This had resulted in considerable delays in finalising of reports of
collected samples as the average time taken in testing and generating reports for samples
is currently 125 days (2015-16) compared to 20 days taken in 2011-12.
The matter was reported to the Government (August 2016). Their reply had not been
received (December 2016).
FOREST DEPARTMENT
1.6 Avoidable Expenditure due to commencement of works without technical
sanction.
Award and commencement of work of construction of an office building without
technical scrutiny and sanction as per codal provisions resulted in a deficient
estimate that led to avoidable expenditure of`̀̀̀ 2.95 crore due to cost escalation.
The Financial Hand Book Volume- VI stipulates that proposals for construction works
should be accorded administrative approval and financial sanction before commencement
of the works. The technical estimates are also to be examined and technical sanction is to
32 Government Analyst-01, Public Analyst-01, Micro-Biologist-01, Senior Analyst-07, Technologist-01,
Scientific Officer-02, Junior Analysts-12 and Scientific Assistant-03.

Chapter-I: Social, General and Economic Sectors (Non-PSUs)
39
be accorded before the technical designs are approved and implemented to ensure their
completeness and technical viability.
The State Government mooted (March 2011) construction of Van Bhawan to house all
the 18 offices of the Forest Department scattered at various places in Dehradun under one
roof. GoI allotted ` 15 crore for the construction of the building. The total cost of the
project was estimated at ` 12.90 crore33. The Government of Uttarakhand accorded
administrative and financial sanction (March 2011) to the estimates and released the total
amount (March 2011 to March 2012) to the Additional Chief Conservator of Forests. The
executing agency i.e. Uttarakhand Pey Jal Nigam (UPJN) started the construction in
March 2012 which was slated to be completed by March 2014. However, no technical
sanction was obtained for the works before commencement.
Scrutiny of records of the Divisional Forest Officer (DFO) Dehradun revealed the
following:
(i) The detailed estimate was deficient as it was submitted without structural design and
without including many essential works like rain water harvesting, fire alarm system,
fire-fighting system, water proofing of basement, expansion joint treatment,
networking and communication although these were required for such
non-residential category-I building.
(ii) The State Planning Commission, in a technical examination (April 2013), found
many defects in the construction works like drawing/design of the work being
erroneous leading to inflation in cost, inferior concrete requiring higher cement
consumption being used, rates being exaggerated, low strength mild steel being used
which reduced the strength of the work and the contractor being unduly benefitted.
The report of the State Planning Commission put the excess cost to be borne on
account of these faults at ` 1.70 crore.
(iii) A meeting was held in September 2013 between the Chief Conservator of Forests
(CCF) and General Manager of UPJN in which the CCF asked the executing agency
to submit a revised estimate including all the works which were required for the
building. The revised estimate was ultimately approved (March 2015) by the
Department at a total cost of ` 19.58 crore which, besides cost of additional items
proposed, included ` 2.95 crore in the form of escalation in the cost of labour and
material and the date of completion was revised to March 2016. Such cost escalation
could have easily been avoided had all these necessary items whose exclusion was
known to the Executing Agency as well as the Department been included in the first
estimate itself.
Thus, due to deficiencies of the estimate, the State Government had to bear cost
escalation of ` 2.95 crore as well as delay in the completion of the project that could have
33 The residual grant of ` 2.10 crore was proposed to be utilized by the Department on additional works.

Audit Report (Social, General, Revenue and Economic Sectors) for the year ended 31 March 2016
40
been avoided had the technical estimates been properly scrutinised and approved as
envisaged in the codal provisions before commencement of works.
The matter was referred to the Government (June 2016). The reply had not been received
(December 2016).
1.7 Prevention of forest fires
The Department lacked sufficient funds for preventing and controlling forest
fires which translated into shortages of essential fire-fighting equipment,
vehicles, communications as well as manpower. Shortages of equipment,
accessories and vehicles required for fire-fighting in the fire season ranged
from 31 to 100 per cent while shortage of manpower ranged from 16 to
55 per cent in cadres of foresters and forest guards. Equipment when
purchased was received late in the forest divisions. Maintenance of records of
occurrence of forest fires and the response times achieved which are essential
for both assessing the efficacy of the systems in place as well as to plan future
requirements was inadequate and both long term and short term measures
required for fire management were not taken.
1.7.1 Introduction
The National Forests Policy, 1988, aims at bringing 33 per cent of the country’s
geographical area under forests or tree cover. The geographical area of Uttarakhand is
53,483 sq kms out of which forest cover comprises 37,999.60 sq kms34 i.e. 71 per cent of
the total area.
Forest fires in Uttarakhand have been a usual feature since long. However, the incidence
of forest fires has increased in the slopes of the sub-Himalayan region in the past few
years. A compliance audit focusing on activities of the Forest Department for prevention
of forest fires in the State was conducted between July 2016 and August 2016. For this
purpose, records of four Divisional Forest Offices35 (DFOs) out of a total of 35 DFOs
were scrutinized for the period from 2013-14 to 2015-16. Information was also gathered
from the Principal Chief Conservator of Forest (PCCF), Dehradun and the Chief
Conservator of Forest (CCF) Vigilance, Haldwani.
1.7.2 Incidents of fire
The number of incidents of forest fire and the area affected due to such incidents reported
during the period 2013 to 2016 is depicted in Table-1.7.1 below: Table-1.7.1: Details of incidents, area affected in state and selected divisions
Year
Uttarakhand State Selected Divisions
Incidents Area Affected
(in hect.) Incidents
Area Affected (in
hect.) 2013 245 384.05 52 114.85 2014 515 930.33 143 263.70 2015 412 701.61 46 95.50 2016 2,074 4,433.75 352 854.45 Total 3,246 6,449.74 593 1,328.50
34 Source: Uttarakhand Forest Statistics 2014-15, Forest Department, Uttarakhand. 35 Bageshwar, Almora, Rudraprayag and Uttarkashi.

Chapter-I: Social, General and Economic Sectors (Non-PSUs)
41
There has been an increase in the number of incidents of fire reported and the area
affected except during the year 2015. The year 2016 witnessed an alarming five-fold
increase in the incidents of fire and six-fold increase in the area affected over the
previous year in the State. The increase in the test-checked divisions was seven-fold
increase in terms of number of fire incidents and eight-fold increase in the area affected
over previous year. The incidents of fire and area affected were 77 and 120 per cent
respectively over the combined incidents of the previous three years in the State and
46 and 80 per cent respectively in the test-checked divisions.
1.7.3 Management of Forest Fires
Managing forest fires require elaborate planning, sufficient financing, undertaking
pre-emptive measures and intensive monitoring by the Department particularly at the
grassroots level. Participation of the community is also critical for effective fire
management efforts. However, audit found that the departmental efforts were deficient in
achieving the intended targets of controlling forest fire as detailed in subsequent
paragraphs.
1.7.3.1 Availability of funds
Government of India provides 90 per cent funds for proposals approved under the
Centrally Sponsored Scheme of "Intensification of Forest Management Scheme" (IFMS).
In addition, under the State Sector, Forest Fire Protection Scheme (FFPS) is operated for
the purpose. The status of budget demand and allotment in the test-checked divisions
under these schemes is provided in Table-1.7.2 below.
Table-1.7.2: Details of budget demand in the test-checked divisions under IFMS and FFPS during the years 2013-16
(` ` ` ` in lakh)
Year
Budget
demand
under
IFMS
Budget
allotted
under
IFMS
Expenditure
incurred
Percentage
of reduction
against
demanded
budget
Budget
estimates
under
FFPS
Budget
allotted
under
FFPS
Expenditure
incurred
Percentage
of reduction
against
demanded
budget
2013-14 80.64 59.27 59.27 26.50 142.99 85.11 85.11 40.48
2014-15 124.66 27.38 27.38 78.04 146.24 97.85 97.85 33.09
2015-16 102.40 38.53 38.53 62.37 178.13 74.60 74.60 58.12
Source: Information collected from the test-checked divisions.
There was a huge gap between the budget demands forecasted and the budget allotments.
The reduction against the demanded budget provisions ranged between 26 and
78 per cent under the IFMS and between 33 and 58 per cent under the FFPS. It is evident
that due importance was not being placed combating forest fires despite the increase in
the number of such occurrences.
1.7.3.2 Fire Management Plan
The District Fire Management Plan lays down the strategy for fire management,
resources available, logistics and establishment of communication systems. Audit
observed the following:

Audit Report (Social, General, Revenue and Economic Sectors) for the year ended 31 March 2016
42
(a) The fire plan of Almora division for the years 2014, 2015 and 2016 specified a
proforma for depicting the incidents of fires giving all the details. The forest ranges
were however not reporting in the prescribed format; and
(b) None of the various long term measures proposed in Bageshwar division for
prevention and control of fires had been carried out during 2013 to 2016.
These instances revealed that the Divisions had adopted a less than serious approach
towards implementation of fire plan. As a result, preparation of fire management plans
has become mere formality and not a direction for execution.
1.7.3.3 Mock Drills
To enhance the capabilities of forest staff to deal with forest fires, the Union Ministry of
Environment & Forests had directed in October 2005 that each forest division should
prepare an action plan and conduct a full scale mock drill each year and forward a report
of observed strength and weaknesses of the plan to the District and State Crisis Groups
respectively. Audit found that no such mock drills were conducted in the test-checked
divisions. Thus, the objectives of knowing the strengths and weaknesses of the action
plans remained unattended.
1.7.3.4 Purchase and distribution of fire fighting equipment
It is desirable that before the onset of fire season36, fire fighting equipment is made
available in each range. Scrutiny of records of purchase and distribution of equipment in
three out of four test-checked divisions revealed that equipment was purchased37 either
during or after the expiry of the season. In case of Uttarkashi division, equipment
purchased in April 2016 was not distributed to the respective ranges till August 2016.
It was also noticed that 32 fire kits were received in the Uttarkashi division in January
2013 but the same were distributed to the ranges in August 2013 i.e. with a delay of
seven months. During this period there were 26 incidents of fire which affected
42.35 hectares of forest.
Uttarkashi division stated (August 2016) that the purchases were made on the basis of the
availability of funds and the directions of the higher authority and distributed to the
ranges. However, the necessary entries were not made in the stock registers. The reply is
not tenable as no evidence was provided to audit as to when these items were distributed
to the respective ranges. Further, appropriate reasons were not furnished for late
distribution of fire kits which were received in January 2013 by the division. DFOs of
Bageshwar and Rudraprayag divisions stated that purchases were delayed due to late
receipt of budget.
36 Beginning from 15th of February to 15th of June. 37 Equipment purchased by Bageshwar division: 05/2016, Rudraprayag division from 23.04.2016 to
27.06.2016, Uttarkashi division from 27.04.2016 to 03.05.2016.

Chapter-I: Social, General and Economic Sectors (Non-PSUs)
43
1.7.3.5 Non-providing of modern fire fighting equipment and inadequate
availability of equipment and accessories
The State Government had directed (January 2014) the department to use modern light
weight fire fighting equipment prepared by the Forest Research Institute Dehradun such
as search light, head light (LED), fire proof jacket, dress, tools and other modern
equipment.
Records of test-checked divisions revealed that even after a lapse of two and half years,
the Department was unable to provide the said fire fighting equipment despite the fact
that there was a huge shortage38 of essential equipment and accessories in the selected
divisions. It was also observed that in Almora division, even essential equipment and
accessories such as water bottles, torch/ search light, fire kit bag, shoes, helmet, fire
uniform and fire apron were not available.
1.7.3.6 Shortage of means to provide mobility to crews and equipment
Response time taken to address an emergent situation of fire has a bearing on controlling
the fire incident. To enable a short response time, mobility of the response team has to be
ensured. Vehicles are required to transport crew from the crew station to the spots of fire
or up to the nearest motorable destination along with equipment.
Audit could not arrive at any quantification of delays in response time as the registers
maintained at the Master Crew Stations did not show the time at which a report of a fire
incident was received. Further, records of the test-checked divisions revealed shortage of
vehicles ranging from 33 to 100 per cent that would clearly have an adverse impact on
controlling of the fires as depicted in Table-1.7.3 below.
Table-1.7.3: Details of requirement, availability and shortage of vehicles
Division Requirement of Vehicles for Fire
Season
Availability of
Vehicles
Shortage
(per cent)
Bageshwar 29 - 29(100) Almora 17 05 12(71) Rudraprayag 18 01 17(94) Uttarkashi 09 06 03(33)
1.7.3.7 Shortcomings in the communication system
Prompt communication of information about incidents of fire is the key to quick response
and control of fires before they spread. There are crew stations and a master crew station
at the range level and a master control room at the division level.
It was noticed that these stations in the two test-checked divisions39 were facing acute
shortage ranging from 66 to 70 per cent of communication equipment such as walkie
talkie and wireless handsets. As a result, the Department did not have a sound
38 Bageshwar: 59 per cent, Almora: 81 per cent, Rudraprayag: 43 per cent and Uttarkashi: 31 per cent. 39 Bageshwar, Rudraprayag.

Audit Report (Social, General, Revenue and Economic Sectors) for the year ended 31 March 2016
44
communication network. Thus, timely sharing and transmission of information regarding
incidents of fires could not be achieved as discussed in the succeeding paragraph.
1.7.3.8 Recording/reporting of fire incidents
Recording of fire incidents is essential for the purpose of maintaining a proper
database of fire incidents and for future planning. However, the system of recording/
reporting40 fire incidents was found lacking as can be seen from the Table-1.7.4 below.
Table-1.7.4: Details of incidents and area affected received from CCF Office and selected divisions
Name of divisions
No. of Incidents during 2016 Area affected (In Hectare) during 2016
As per information
received from CCF
office
As per information
provided by the
divisions
As per information
received from CCF
office
As per information
provided by the
division
Bageshwar 59 55 213.35 220.10
Almora 115 116 297.85 299.35
Rudraprayag 72 73 147.20 148.20
Uttarkashi 92 108 157.85 186.80
Total 338 352 816.25 854.45
Difference 14 38.20
From the above table, it is evident that there was inconsistency in the records of fire
incidents between the divisional records and the information received from CCF office.
Audit observed the following:
� In 2016, out of 73 incidents of fire which occurred in the ranges of Rudraprayag
division, 71 incidents were not found recorded in register maintained at master
control room. However, detailed reports of incidents of fire were transmitted to the
CCF Haldwani on the basis of detailed reports41 received from the ranges.
� Records pertaining to Master Control Room of Bageshwar and Almora revealed that
incidents of fire of a particular date were recorded on the succeeding date and in some
cases after three to four days after the occurrence of the incidents and subsequently
transmitted to the concerned office.
� Fourteen out of 15 and 71 incidents of fire for the year 2015 and 2016 respectively
were not found recorded in the register maintained at the Master Control Room
register of Uttarkashi division.
All the Divisions attributed the delays in recording to the lack of proper communication
facilities. Audit observed that the system of recording of fire incidents at the range and
divisional levels needs necessary revamp if it is to serve the intended purpose.
1.7.4 Availability of manpower
Manpower management is an essential tool for the functioning and achievement of the
laid down objectives of a department. In fire fighting in a forest, the forester is the team
40 The daily report regarding the fire incidents is to be transmitted by 1:00 p.m. to the respective CF in
the prescribed format (Directions regarding the prevention of forest fire). 41 Area affected and location of the incidents.

Chapter-I: Social, General and Economic Sectors (Non-PSUs)
45
leader with forest guards and fire watchers as members of the crew. The availability of
manpower mainly engaged in fire fighting is depicted in Table-1.7.5 below:
Table-1.7.5: Status of Men-in Position (MIP) against Sanctioned Strength (SS) in selected Division
Division Post SS MIP Shortage (in percentage)
Bageshwar Forester 62 48 14 (23) Forest Guard 68 57 11 (16)
Almora Forester 109 72 37 (34) Forest Guard 130 59 71 (55)
Rudraprayag Forester 20 38 18 (Excess) Forest Guard 70 44 26 (37)
Uttarkashi Forester 83 54 29 (35) Forest Guard 147 105 42 (29)
Source: Department of Forest.
There was a shortage ranging from 23 to 35 per cent of foresters in the three sampled
divisions and from 16 to 55 per cent of forest guards in all these divisions whereas
18 foresters were posted in excess of the sanctioned strength in Rudraprayag division.
Besides, fire watchers, the temporary daily labourers engaged for keeping watch on the
incidents of fire and helping in the efforts of extinguishing fire, were short by 20 per cent
to 86 per cent in the test-checked divisions. No specific training was provided to this
staff for preventing and tackling forest fires.
Thus, the fire-fighting capabilities were severely constrained by both shortages of key
personnel as well as lack of training to personnel that were available.
1.7.5 Measures for managing fires
1.7.5.1 Creation of fire lines
Fire lines42 not only control the fire from spreading beyond a certain area but also provide
speedy transportation of manpower to the fire spot to address the emergent problem of
fire besides ensuring safety of the fire crew and general public.
Scrutiny of records of sampled divisions revealed that no new fire lines had been created
during 2013-14 to 2015-16. Information sought from the PCCF office regarding the
provision of budget for the divisions revealed that there was no provision of budget for
creation of fire lines during the year 2013-14 to 2015-16 in Uttarakhand. However,
existing fire lines were being maintained as part of regular maintenance.
1.7.5.2 Construction of Catchments/water storage structures and
maintenance of Natural Water Resources
Natural water resources are essential for maintaining the balance of soil moisture which
prevents drying up of forest which creates conditions conducive to outbreaks of fire.
Test-check of records of three43 out of four selected divisions revealed that no budget had
been provided for construction of catchments / water storage structures during the years
42 Fire lines are gaps in the vegetation of a forest. They break the continuum of the forest floor
combustible material and could be of natural origin like rivers, lakes and manmade structures like roads, canals, stone walls in addition to fire lines themselves.
43 Bageshwar, Almora and Uttarkashi.

Audit Report (Social, General, Revenue and Economic Sectors) for the year ended 31 March 2016
46
2013-14 to 2015-16. Further, these divisions44 had 223, 275 and 143 natural water
sources45. However, no maintenance of these sources was carried out by the divisions
during the period 2013-14 to 2015-16. Even 12 dried up water sources in Almora
division earmarked for treatment in the fire protection plan of 2014 were not rejuvenated.
However, in Uttarkashi division, out of 12 dried up water sources, seven had been
rejuvenated during 2014-15.
Drying up of natural water resources, not rejuvenating the same and their
non-maintenance had an adverse impact on the health of the forest in general and in
prevention of fire in particular. This coupled with exceptionally dry summer in
2016 contributed significantly to high incidence of forest fires in the State.
1.7.5.3 Controlled burning
Controlled burning46 regulates fire in forest areas by removal of litter on the forest floor
and also of other combustible material. It was noticed that there was no budgetary
support for this activity during 2013-14 to 2015-16. It was this litter, particularly of pine
trees, that contributed maximum to incidence of forest fires.
Conclusion
Thus, despite the increasing incidence of forest fires in the State, adequate attention was
not placed on measures to prevent their occurrence. Poor budgetary support translated
into shortages of essential fire-fighting equipment, vehicles, communications as well as
manpower. Maintenance of records of occurrence of forest fires and the response times
achieved which are essential for both assessing the efficacy of the systems in place as
well as to plan future requirements was inadequate and both long term and short term
measures required for fire management were not taken. All these factors compounded
the increase in number and intensity of incidents of forest fires.
The audit findings were reported to the Government (July 2016); its reply was awaited
(December 2016).
Higher Education Department
1.8 Setting up of Private Universities
The Department did not exercise due diligence to ensure compliance with
extant guidelines while issuing Letters of Intent to sponsoring bodies for
establishment of private universities. Full compliance with the guidelines was
made by only one out of 11 private universities in the State. Evaluation of
proposals was not done in the stipulated format and Government decisions as
to reservations in admissions were not incorporated in the relevant statutes
and rules of the universities.
44 Bageshwar, Almora and Uttarkashi. 45 These are springs from where water flows out of earth. 46 Controlled burning is an established forestry management tool that is employed to manage forests.

Chapter-I: Social, General and Economic Sectors (Non-PSUs)
47
1.8.1 Introduction
The objective of establishing private universities is to develop and promote higher
education in the fields of engineering, medical, management, architecture,
communications, environment and other disciplines. The State Government is required to
put in place a suitable regulatory mechanism to facilitate the setting up of such
universities in the State and their subsequent operation as per the guidelines of the
University Grants Commission (UGC). The State Government promulgated its guidelines
for the purpose in March 2011. Till date, 11 private universities have been established in
the State.
An audit of the functioning of the institutional mechanisms and procedures put in place
by the State Government for facilitating setting up of private universities was conducted
during June 2016 to July 2016 by test-check of the records of the Higher Education
Department pertaining to setting up of seven47 of the total 11 private universities
functioning in the State.
After receiving the proposal for establishment of a private university from the sponsoring
body, a three member Committee comprising representatives of Higher Education
Department and Finance Department and the Director of Higher Education evaluates the
proposals and then submits them before a twelve member High Level Committee (HLC)
which functions under chairmanship of the Chief Secretary as a single window platform
for approving such proposals. Thereafter, the State Government issues a Letter of Intent
(LoI) to the sponsoring body. The LoI contains conditions which are to be fulfilled by the
sponsoring bodies for establishing private universities. After receiving the compliance
report to the LoI, the HLC further examines the same, and on being satisfied, it sends its
report to the State Government. Once the verification of the compliance report is
received, a separate Act for incorporating the Private University is passed in the State
Legislature
1.8.2 Non-evaluation of pre-conditions for issue of Letter of Intent
Scrutiny of the records of the Department of Higher Education revealed the following
with respect to issue of LoI to the sponsoring bodies:
� LoI was issued after full compliance of the guidelines (2011) only in case of one
University48. In case of remaining 10 private universities, the Department did not
evaluate whether the pre-conditions of LoI had been met or not. The result of such a
procedural lapse can be seen in the Acts of the University of Petroleum and Energy
Studies, the ICFAI University and the Patanjali University which were enacted
47 Institute of Chartered Financial Analysts of India (ICFAI) University, University of Petroleum and
Energy Studies, Patanjali University, Uttaranchal University, DIT University, Swami Rama Himalayan University and Motherhood University.
48 The Motherhood University.

Audit Report (Social, General, Revenue and Economic Sectors) for the year ended 31 March 2016
48
without the sponsoring bodies even having requisite land which was an essential
pre-condition.
� Minimum required standards were not followed by the ICFAI University in respect of
physical infrastructural, administrative and teaching staff.
� In case of Dehradun Institute of Technology (DIT) University, the UGC had observed
(February 2015) insufficient number of faculty, inadequate faculty and cadre ratio as
well as insufficient land for development of outdoor sports facility and residential
accommodation. There was no evidence to indicate whether the university had
rectified the lacunae pointed out by the UGC nor of any follow-up of UGC report by
the Department.
� Mandatory provisions of the UGC (Establishment of and Maintenance of Standard in
Private Universities) Regulations, 2003 relating to fulfillment of minimum criteria in
terms of programmes, faculty, infrastructural facilities, financial viability, etc.,
conforming of the programmes of study leading to a degree and/or a post-graduate
degree/diploma to the relevant regulations/norms of the UGC or the concerned
statutory body and the admission procedure and fixation of fees were not incorporated
in the Act of University of Petroleum and Energy Studies.
1.8.3 Non-evaluation of the proposals in prescribed format
The State Government had developed two proforma for evaluating the proposals. Marks
are allotted on the basis of information/data in the relevant proforma. At least 50 per cent
marks were to be obtained by each university proposal before the HLC could recommend
the same for establishment of the university.
Scrutiny revealed that none of the proposals of private universities were examined in
accordance with the proforma prescribed in the guidelines. In absence of any
documentation, audit could not ascertain whether these private universities had fulfilled
the required essentialities for the establishment of a private university or not.
The Department stated (August 2016) that proposals could not be scrutinised in the
prescribed formats due to lack of time during Assembly Sessions. It was added that
proposals were now being submitted before the High Level Committee on the basis of
marks which were provided in the prescribed formats by the Evaluating Committee.
1.8.4 Non- approval of statutes and rules
The Acts establishing private universities provide that the first Statutes and Rules made
by the Board of Governors shall be submitted to the State Government for its approval
which may, within three months for Statutes and two months for Rules, accord its
approval with or without modification(s).
Audit found that in case of four private universities viz. Patanjali University, Uttaranchal
University, DIT University and Motherhood University, the statutes and rules were yet to
be approved by the State Government whereas these universities had submitted the
Statutes and Rules on 7th November 2011, 3rd May 2013, 14th October 2013 and

Chapter-I: Social, General and Economic Sectors (Non-PSUs)
49
20th January 2016 respectively. The records of the Department did not indicate whether
the Government had ensured that the private universities had commenced accepting
admissions and conducting classes in approved courses only after the concerned statutes
and rules were approved.
1.8.5 Non-incorporation of Government Decisions in Statutes of the
University
Scrutiny of records of selected private universities revealed that the Department did not
ensure incorporation of the directions of the State Cabinet in the Acts of the universities
as below:
� The Government decided (June 2003) to provide for 10 per cent reservation to
permanent residents of the State in each course, scholarships for their students and
admission to at least 50 to 60 12th passed students from different districts of the State
in the University of Petroleum and Energy Studies. These provisions were not
incorporated in the Act of the University.
� The Government decided (June 2003) that there should be 25 per cent reservation for
the permanent residents of the State as well as free training programme for entrance
examination in ICFAI University. However, this provision was not incorporated in
the concerned Act.
� The notification for establishment of Patanjali University was accorded (April 2006)
before establishment (December 2006) of the endowment fund. This was in violation
of the guidelines through which the University was established. There was no
evidence on record to show that the Department had evaluated the recommendations
of the State Cabinet before deciding upon their exclusion from the respective Acts of
Establishment.
1.8.6 Non-investment of income from endowment fund
The Acts of Establishment of ICFAI and Patanjali University provide that the university
shall establish a permanent endowment fund and 75 per cent of income received from the
fund shall be used for the purposes of development works of the university and remaining
25 per cent shall be reinvested into the permanent endowment fund. ICFAI and Patanjali
University had pledged Fixed Deposit Receipts (FDRs) in the name of Government of
Uttarakhand amounting to ` 1 crore for 10 years and ` 3.01 crore for five years
respectively.
Scrutiny of records revealed that ` 0.53 crore (ICFAI: ` 0.19 crore and University of
Patanjali: ` 0.34 crore) being 25 per cent of income received from the permanent
endowment funds were not reinvested. Further, the Department had not monitored
whether the income generated from the investment of the endowment fund were being
utilized for the purpose of development works of the universities.

Audit Report (Social, General, Revenue and Economic Sectors) for the year ended 31 March 2016
50
1.8.7 Non-monitoring of follow-up action on undertakings by sponsoring
bodies
The Acts49establishing Universities stipulated the following:
� Forty per cent seats of all the courses should be reserved for the permanent residents
of the State.
� All the students, who are permanent residents of the State, are to be provided a
concession of 26 per cent in their tuition fees.
� All the posts of Group ‘C’ and ‘D’ are to be compulsorily filled up only with the
permanent residents of the State.
However, there was no follow-up action by the Department to ensure whether these as
well as other conditions related with minimum requirements of infrastructure were
fulfilled by the private universities who had made commitment in this regard.
The matter was referred to the Government (August 2016). Their reply had not been
received (December 2016).
HORTICULTURE DEPARTMENT
1.9 Horticulture Mission for North East and Himalayan States
The State Mission Office(SMO) released `̀̀̀ 0.34 crore to a Sansthan without the
necessary approval of the State Level Executive Committee while `̀̀̀ 3.32 crore
was irregularly disbursed for construction of poly houses and planting
material without adhering to the stipulated conditions of title to land and
norms for grant of assistance. Similarly, assistance of `̀̀̀ 0.91 crore was paid to
beneficiaries for area expansion of fruits and vegetables without adhering to
the guidelines. The District Horticulture Offices (DHOs) also provided irregular
assistance of `̀̀̀ 0.35 crore for horticulture mechanization and creation of water
resources without either ensuring title to land of the beneficiaries or verifying
proof of expenditure incurred as required under the guidelines.
1.9.1 Introduction
The Horticulture Mission for North East and Himalayan States (HMNEH) is being
implemented in the State since 2003-04 as a centrally sponsored scheme for the holistic
development of the horticulture sector. In 2014-15, the Government of India approved a
Mission for Integrated Development of Horticulture (MIDH) subsuming HMNEH and
other horticulture sector schemes.
Audit test-checked records of the schemes implemented under the Mission during April
2013 to March 2016 in five out of 14 implementing units [13 District Horticulture Offices
(DHOs) & one Horticulture Specialist] along with the records of the State Mission Office
49 Motherhood University Act 2014, The DIT University Act 2012, Uttaranchal University Act 2012 and
Himalayan University Act 2012.
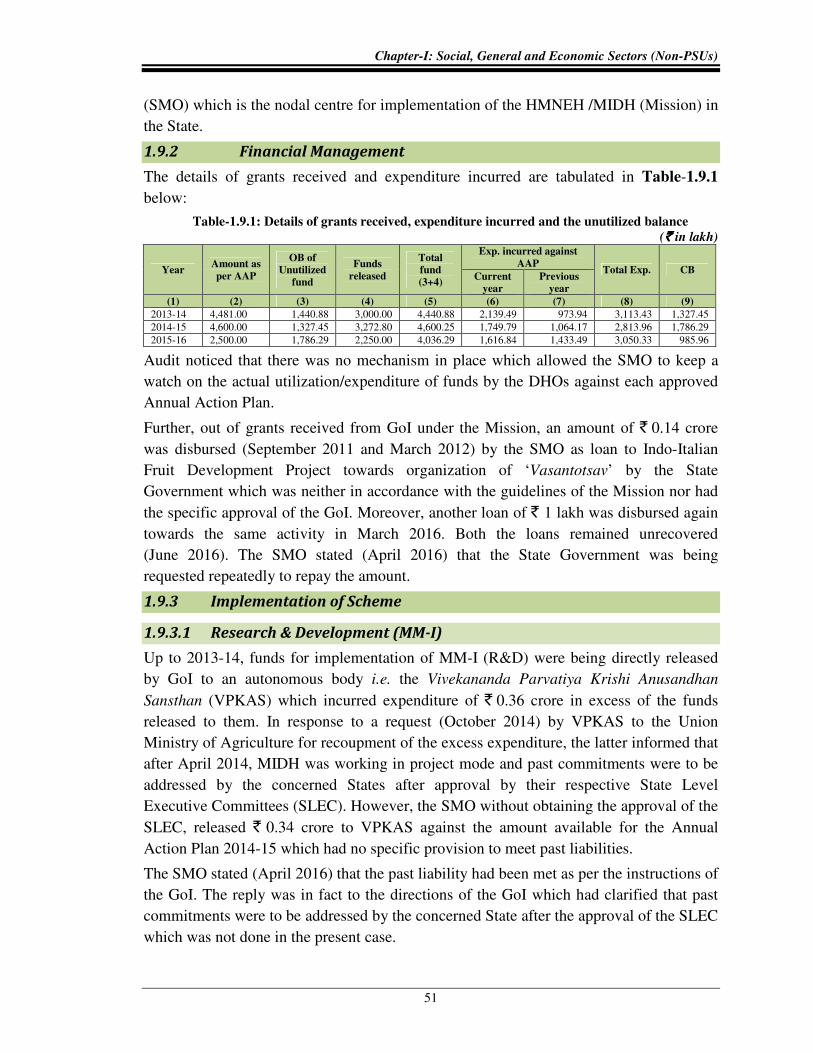
Chapter-I: Social, General and Economic Sectors (Non-PSUs)
51
(SMO) which is the nodal centre for implementation of the HMNEH /MIDH (Mission) in
the State.
1.9.2 Financial Management
The details of grants received and expenditure incurred are tabulated in Table-1.9.1
below:
Table-1.9.1: Details of grants received, expenditure incurred and the unutilized balance
(`̀̀̀ in lakh)
Year Amount as
per AAP
OB of
Unutilized
fund
Funds
released
Total
fund
(3+4)
Exp. incurred against
AAP Total Exp. CB
Current
year
Previous
year
(1) (2) (3) (4) (5) (6) (7) (8) (9)
2013-14 4,481.00 1,440.88 3,000.00 4,440.88 2,139.49 973.94 3,113.43 1,327.45 2014-15 4,600.00 1,327.45 3,272.80 4,600.25 1,749.79 1,064.17 2,813.96 1,786.29 2015-16 2,500.00 1,786.29 2,250.00 4,036.29 1,616.84 1,433.49 3,050.33 985.96
Audit noticed that there was no mechanism in place which allowed the SMO to keep a
watch on the actual utilization/expenditure of funds by the DHOs against each approved
Annual Action Plan.
Further, out of grants received from GoI under the Mission, an amount of ` 0.14 crore
was disbursed (September 2011 and March 2012) by the SMO as loan to Indo-Italian
Fruit Development Project towards organization of ‘Vasantotsav’ by the State
Government which was neither in accordance with the guidelines of the Mission nor had
the specific approval of the GoI. Moreover, another loan of ` 1 lakh was disbursed again
towards the same activity in March 2016. Both the loans remained unrecovered
(June 2016). The SMO stated (April 2016) that the State Government was being
requested repeatedly to repay the amount.
1.9.3 Implementation of Scheme
1.9.3.1 Research & Development (MM-I)
Up to 2013-14, funds for implementation of MM-I (R&D) were being directly released
by GoI to an autonomous body i.e. the Vivekananda Parvatiya Krishi Anusandhan
Sansthan (VPKAS) which incurred expenditure of ` 0.36 crore in excess of the funds
released to them. In response to a request (October 2014) by VPKAS to the Union
Ministry of Agriculture for recoupment of the excess expenditure, the latter informed that
after April 2014, MIDH was working in project mode and past commitments were to be
addressed by the concerned States after approval by their respective State Level
Executive Committees (SLEC). However, the SMO without obtaining the approval of the
SLEC, released ` 0.34 crore to VPKAS against the amount available for the Annual
Action Plan 2014-15 which had no specific provision to meet past liabilities.
The SMO stated (April 2016) that the past liability had been met as per the instructions of
the GoI. The reply was in fact to the directions of the GoI which had clarified that past
commitments were to be addressed by the concerned State after the approval of the SLEC
which was not done in the present case.

Audit Report (Social, General, Revenue and Economic Sectors) for the year ended 31 March 2016
52
1.9.3.2 Production & Productivity Improvement (MM-II)
Protected cultivation
1.9.3.2 (a) Inadmissible payments for fabrication of Poly Houses
For installation of Green House Structure (Poly house), a tripartite agreement was to be
entered into amongst the beneficiary, the firm engaged for construction of poly house and
the DHO to ensure that the firm provided (i) warranty for free maintenance for one year
from the date of installation and (ii) technical training to the beneficiaries for the
operation, maintenance and production of horticultural crops. The assistance on poly
houses was to be provided @ 50 per cent of the total cost to persons having title to the
land. Audit scrutiny brought out the following:
(a) No tripartite agreement was entered into in any of the DHOs. In the absence of a
tripartite agreement, the DHOs did not ensure compliance with the above mentioned
conditions for operation of the poly houses.
(b) During the years 2013-14 to 2015-16, an amount of ` 0.94 crore50 was disbursed for
the construction of poly houses to 15 persons who did not have any farm land in their
name.
(c) During 2013-14 to 2015-16, seven farmers in DHO Dehradun and 20 farmers in DHO
Haridwar submitted bills of ` 0.33 crore and ` 2.68 crore respectively raised by the
firms for construction of poly houses without any proof of actual payment made by
them to the firms. The DHOs also did not insist on proof of actual payment made
against those bills in the form of receipts issued by the firms before disbursing the
assistance. As such, the payment of ` 1.44 crore (beneficiary share: ` 0.16 crore in
Dehradun and ` 1.28 crore in Haridwar) by beneficiaries could not be verified in
audit.
(d) The SMO registered 14 firms in January 2015 for construction of poly houses as per
the technical specifications set by the National Committee on Plasti-culture
Applications in Agriculture and Horticulture (NCPAH). The farmers (beneficiaries)
were free to choose from any of the registered firms. During 2015-16, subsidies
amounting to ` 0.37 crore51 were paid to 13 beneficiaries for the construction of poly
houses by firms which were not registered with the SMO. Further, none of the poly
houses installed were tested either by the departmental authorities or by the firms
involved to ensure compliance with the prescribed quality standards.
Thus, not only was there no tripartite agreement to hold the firms accountable for the
poly houses being installed, an amount of ` 2.75 crore was irregularly paid to persons
without title to any farm land and for firms that were not registered with the SMO.
Further, the department also failed to ensure quality of the poly houses constructed.
50 DHOs: Dehradun ` 0.23 crore, Haridwar- ` 0.61 crore, US Nagar ` 0.05 crore and Nainital
` 0.05 crore. 51 DHOs- Dehradun:` 0.36 crore and Haridwar:` 0.01 crore.

Chapter-I: Social, General and Economic Sectors (Non-PSUs)
53
1.9.3.2 (b) Irregular payments for planting material in poly houses
One-time assistance of 50 per cent towards cost of planting materials and cultivation in
poly houses was to be provided to such beneficiaries who constructed poly houses under
the scheme. Scrutiny of the records revealed the following:
i. DHO, Haridwar provided assistance of ` 0.30 crore to 11 beneficiaries towards cost of
planting material and cultivation in poly houses constructed under schemes other than
the HMNEH.
ii. DHO Dehradun gave assistance at the rate of 100 per cent against bills of ` 0.11 crore
submitted by three beneficiaries towards purchase of planting material and inputs
instead of restricting the same to 50 per cent of the total as per the prescribed norms.
Further, bills of ` 11.21 lakh submitted by the beneficiaries included bills of
` 3.51 lakh not issued in their names and were thus not eligible for assistance under
the scheme. This violation of the guidelines resulted in irregular assistance of
` 7.36 lakh52.
iii. DHOs Dehradun and Nainital provided excess assistance of ` 6.79 lakh towards the
cultivation of Lilium to six beneficiaries at rate of ` 700 per sqm against the prescribed
cost norm of ` 426 per sqm.
iv. DHOs, Dehradun and Haridwar provided an assistance of ` 0.13 crore to five
beneficiaries for the second or the third time towards cost of planting material and
cultivation of flowers/vegetables whereas such assistance had to be provided only
once.
Thus, non-adherence to the HMNEH guidelines resulted in irregular assistance of
` 0.57 crore in the test-checked DHOs to beneficiaries.
1.9.3.3 Establishment of new gardens
1.9.3.3 (a) Area expansion of fruits and vegetables
Mission guidelines permit assistance only towards the cost of (a) planting material
(b) Integrated Nutrient Management (INM) and (c) Integrated Pest Management (IPM)
for the establishment of new gardens. Audit found the following:
i. DHOs, Dehradun and Haridwar provided assistance of ` 0.52 crore for Canvas / PVC
pipe (for irrigation) to beneficiaries of "fruit" area expansion and assistance of
` 0.39 crore for mulching sheet and sprayer to the beneficiaries of "vegetable" area
expansion which was not admissible as per norms. DHOs stated (April 2016) that
canvas pipe and sprayer had been given on demand received from the beneficiaries.
The reply is not acceptable as the assistance provided was not covered by the Mission
guidelines.
52
` 7.36 lakh = ` 11.21 lakh – ` 3.85lakh, ` 3.85lakh = {50% of (` 11.21 - ` 3.51 lakh)}.

Audit Report (Social, General, Revenue and Economic Sectors) for the year ended 31 March 2016
54
ii. The above financial assistance was extended by the DHO in the form of direct
payment to the firms53 from whom the beneficiaries had purchased these items. The
bills of firms submitted by the beneficiaries included an amount of ` 6.04 lakh as
VAT though the firms either did not have valid registration {with Commercial Tax
Department (CTD)} or the validity of registration had already been cancelled by the
CTD. On this being pointed out, the DHOs stated (April 2016) that a notice would be
issued to the firms for deposit ` 6.04 lakh of VAT. The reply is not tenable because it
was incumbent upon the DHOs to verify whether the firms had a valid registration at
the time of the transaction.
1.9.3.3 (b) Area expansion of flower
As per norms54, a total 4.05 lakh55 of gladioli56 bulbs valuing ` 0.15 crore had to be
provided for an area of 15 hectares and an amount of ` 3.94 lakh (beneficiary share) had
to be recovered from the beneficiaries towards their share of cost.
It was observed that DHO Haridwar provided the Government share
i.e. ` 75,000 * 15= ` 11.25 lakh (3,00,000 bulbs @ ` 3.75 per bulb) but did not ensure or
obtain any document as evidence of purchase of 1.05 lakh57 (beneficiary share) of
gladioli bulbs valued at ` 3.94 lakh by the beneficiaries. Thus, possibility of
non-purchase of their share by the beneficiaries and consequently under achievement of
the crop productivity cannot be ruled out.
1.9.3.4 Horticulture Mechanization
As per the departmental instructions, a beneficiary must own at least one hectare area
under a horticulture crop to avail assistance for the purchase of tractor and such subsidy
is to be disbursed to the beneficiaries on the production of original purchase invoices,
physical verification by the mobile teams and submission of photographs of the
equipment along with beneficiary. Test-check of records revealed the following:
i. Assistance of ` 0.14 crore for the purchase of tractors was disbursed by the DHOs
Dehradun and Haridwar to 15 beneficiaries who either did not have any land or
possessed less than one hectare agriculture land. Similar instances of grant of
assistance for power sprayers aggregating ` 1.01 lakh to landless farmers in DHOs
Dehradun and Tehri were also observed.
53 Sai Enterprises (TIN-05000960640) and Konark Enterprises (TIN-05000902998). 54 27,000 gladiolus bulb of ` 1.01 lakh (@ ` 3.75 per bulb) had to be provided per hectare. Out of
` 1.01 lakh, ` 0.75 lakh would be the Government share and ` 0.26250 lakh had to be recovered from the beneficiaries.
55 27,000 * 15 (hectare) = 4,05,000. 56 A flower plant. 57 ` 0.26250 lakh * 15 = ` 3,93,750, ` 3,93,750/` 3.75 (cost of 1 bulb) = 1,05,000 (No. of bulb).

Chapter-I: Social, General and Economic Sectors (Non-PSUs)
55
ii. Against the prescribed norms58, an excess subsidy to the extent of ` 5.58 lakh was
disbursed by the DHO, Dehradun and Udham Singh Nagar to 28 beneficiaries for the
procurement of tractor/power tiller. On being pointed out, DHO Udham Singh Nagar
recovered (June 2016) the assistance of ` 2.87 lakh paid in excess of norms.
iii. Assistance of ` 7.05 lakh was provided to 18 beneficiaries for the purchase of
tractor/power tiller/equipment without compliance with departmental instructions
relating to submission of relevant documentation as proof of purchase and assistance
being granted on more than one occasion.
1.9.3.5 Creation of water resources
Mission guidelines provide for assistance of ` 1.03 lakh (up to 2013-14) / ` 0.75 lakh
(2014-15 onwards) for construction of tube wells. As per departmental instructions, the
beneficiary must have ownership of one hectare agricultural land to avail this assistance.
Scrutiny of records of the DHOs Dehradun and Haridwar revealed that an assistance of
` 8.15 lakh was extended to nine beneficiaries for the construction of tube wells who had
no land, furnished manipulated Khatauni of land or were possessing less than one hectare
land. In respect of above cases, all DHOs stated that the cases would be examined.
1.9.4 Monitoring and Evaluation
A Technical Support Group (TSG59) was to be formed in the SMO as well as in every
district for monitoring the activities of the Mission. Audit observed that a computer
operator and a coordinator were the only members of TSG at the SMO level whereas at
the district level, computer operators were appointed as TSGs instead of the prescribed
composition. The TSGs thus remained ineffective.
In the absence of a well-drawn up inspection schedule, the SMO and DHOs were not able
to closely monitor the implementation of HMNEH Schemes through field inspections.
No data was available about the increase in the production or productivity attributable to
the Mission activities. The projects/schemes remained largely uninspected and the
scheme impact remained un-assessed.
The audit findings were referred to the Government (July 2016). The reply had not been
received (December 2016).
58
For Tractor- Assistance of ` one lakh (maximum limit) had been paid against the admissible amount of 35 per cent of cost or ` one lakh whichever is less. For Power tiller – Against the norm of ` 50,000 for power tiller below 8 BHP, assistance amounting to ` 60,000 to ` 75,000 were paid to the beneficiaries for purchase of tiller below 8 BHP.
59 As per guidelines, TSG was required for project formulation, appraisal and concurrent monitoring and comprised of State Horticulture Consultant, Horticulture Assistant, Programmer, Field Consultant and Data Entry Operator at SMO Level and District Horticulture Consultant and Field Consultant at district level.

Audit Report (Social, General, Revenue and Economic Sectors) for the year ended 31 March 2016
56
LAND REVENUE DEPARTMENT
1.10 Recovery of Loans and Government Dues by District Collectors
The District Collectors’ offices failed to maintain any database of recoveries of
outstanding loans and other government dues. Lack of a coordinated database
at both district and tehsil levels undermined recovery efforts with the pace of
recovery averaging only 24 per cent during the period 2013-14 to 2015-16. An
amount of `̀̀̀ 1,095.44 crore which was 76 per cent of the recoveries requested by
departments/banks during the years 2013-14 to 2015-16 remained
unrecovered.
1.10.1 Introduction
The Uttar Pradesh Public Moneys (Recovery of Dues) Act, 1972, as applicable in the
State of Uttarakhand, provides measures for speedy recovery of certain classes of dues
like unpaid bank loans and government dues. The Act empowers the authorized
competent authority in different departments to seek intervention of the concerned
District Collector in effecting recoveries of outstanding dues and loans by mentioning the
relevant details in the form of a Revenue Recovery Certificate (RRC). The District
Collector can then recover such dues under the provisions of the U.P. Collection Manual
and Land Revenue Act as if these were arrears of Land Revenue.
An audit of recovery of loans and Government dues by the District Collectors during the
period 2013-14 to 2015-16 was conducted during April 2016 to May 2016 by test-check
of records of the District Collectors of Haridwar and Udham Singh Nagar.
1.10.2 Lack of Database of RRCs
The Uttar Pradesh Collection Manual requires the District Collector to maintain
information/database of Revenue Recovery Certificates (RRCs) including that which is
presented periodically to higher authorities. Scrutiny of records of the test-checked
District Collectors revealed the following-
� No database of RRCs and action taken / required was maintained in the selected
districts;
� No summarized data of recovery cases like year-wise, total pendency and recoveries
made, details of RRCs received from various departments and returned and service
charges deducted was available;
� Copies of RRCs received were not kept at either the Collector or the Tehsil levels;
and Records of recovery cases were not updated to reflect the periodical changes.
Absence of such databases prevented the District Collectors from exercising proper
controls over and monitoring of recovery of outstanding loans and Government dues.
Existence of properly maintained databases at the Collectorates would have increased the
effectiveness of the recovery process.

Chapter-I: Social, General and Economic Sectors (Non-PSUs)
57
In the absence of databases, audit attempted to assess performance of the selected offices
by compiling data of four major categories60 of outstanding dues from the Revenue
Recovery Register. Audit findings based on this compilation are discussed in the
succeeding paragraphs.
1.10.3 Settlement of Cases
Proper and timely recovery of the outstanding dues from defaulters directly affects the
finances of any Government. However, audit found that there was a huge pendency of
cases in the test-checked districts. Slow pace of settlement of cases has been depicted in
Table-1.10.1 below.
Table-1.10.1: Settlement of RRCs against total cases forwarded during the years 2013-14 to 2015-16
Sl.
No.
Department to which
outstanding dues are
related
2013-14 2014-15 2015-16
No. of
cases Settled cases
No. of
cases Settled cases
No. of
cases Settled cases
1. Jal Sansthan 1,849 483 1,658 463 288 27 2. Electricity Distribution
Division 1,482 263 1,882 192 989 106
3. Commercial Tax 3,375 1,434 5,467 2,775 5,469 1,415 4. Banks 1,561 373 1,226 208 2,785 175
Total 8,267 2,553 (31%) 10,233 3,638 (36%) 9,531 1,723 (18%)
Source: Data collected and compiled from the records of the selected Collectors.
As brought out above, out of 8,267, 10,233 and 9,531 cases forwarded for recovery to the
selected Collectors’ offices during 2013-14 to 2015-16, only 2,553, 3,638 and
1,723 cases respectively were settled. Thus, the rate of settlement of cases during the
audit period remained at only 31, 36 and 18 per cent respectively. In rest of the cases, no
recovery could be effected.
1.10.4 Rate of Recovery
Data compiled by audit from the records of the test-checked District Collectors revealed
that recovery of bank loans and other dues of Government was very poor. The result of
analysis is depicted in Table-1.10.2 below.
Table-1.10.2: Recovery of bank loans and other dues of Government during the years 2013-16 (`̀̀̀ in lakh)
Year Department to which recoveries are related Amount to be
recovered
Recovered
(in per cent)
Balance
(in per cent)
2013-14
Jal Sansthan 354.44 67.17 (19) 287.27 (81) Electricity Distribution Division 1,498.97 168.28 (11) 1,330.69 (89) Commercial Tax 14,525.64 4,231.19 (29) 10,294.45 (71) Banks 3,044.39 558.78 (18) 2,485.61 (82)
2014-15
Jal Sansthan 248.80 53.17 (21) 195.63 (79) Electricity Distribution Division 2,461.99 143.96 (6) 2,318.03 (94) Commercial Tax 32,180.92 12,239.47 (38) 19,941.45 (62) Banks 2,735.74 319.22 (12) 2,416.52 (88)
2015-16
Jal Sansthan 45.49 2.54 (6) 42.95 (94) Electricity Distribution Division 813.66 90.60 (11) 723.06 (89) Commercial Tax 82,069.27 16,659.70 (20) 65,409.57 (80) Banks 4,536.95 438.40 (10) 4,098.55 (90)
Total 1,44,516.26 34,972.48 (24) 1,09,543.78 (76)
Source: Data collected and compiled from the records of the selected Collectors.
60 Recoveries of Commercial Tax Department, Banks, Electricity Distribution Divisions and Jal
Sansthan.

Audit Report (Social, General, Revenue and Economic Sectors) for the year ended 31 March 2016
58
Thus, the rate of recovery of pertaining to four major categories of recoverable dues in
the two test-checked districts of Haridwar and Udham Singh Nagar ranged from 11 to
29 per cent, six to 38 per cent and six to 20 per cent during 2013-14, 2014-15 and
2015-16 respectively. On an average, the Department was able to recover only
24 per cent of the total outstanding dues during the audit period.
Out of the total amount of ` 1,445.16 crore involved in default cases forwarded to the
District Collectors for recovery, the recovered amount was ` 349.72 crore. The District
Collector, Haridwar attributed non-recovery to factors like disbursement of loans to
ineligible persons, lack of guarantors, and lack of sufficient assets with the debtors.
1.10.5 Mismatch of Datasets at District and Tehsil levels
As per the procedure laid down in the Uttar Pradesh Land Revenue Act as applicable in
Uttarakhand, the RRC received from competent authority is first entered in the Revenue
Recovery Register maintained in the Collector’s office. Thereafter, the RRC is forwarded
to the concerned Tehsil office. The Tehsildar is required to enter immediately, the RRC
in his Revenue Recovery Register and thereafter issue and serve the demand notice upon
the defaulter.
Audit attempted to reconcile the data available with the Collectors’ offices with that
available with two Tehsils61
in each of the two test-checked districts and found that these
datasets did not match with each other. The mismatch has been worked out in
Table-1.10.3 below.
Table-1.10.3: Number of recovery cases in two tehsils and amount due during the years 2013-16
(All amounts in lakh `̀̀̀)
Year Data as per Collectors’ office records Data as per Tehsils’ office records Mismatch of Data
Cases Amount Cases Amount Cases Amount
2013-14 4,322 16,301 6,936 14,635 2,614 1,666
2014-15 7,417 25,879 6,913 22,813 504 3,066 2015-16 6,707 70,033 5,687 37,297 1,020 32,736
Source: Data compiled by audit from registers of the Collectors’ and Tehsildars’ office.
The wide discrepancies between the data sets available at the district level and at the
Tehsil level highlighted indifferent approach of the district and the Tehsil administrations
towards recovering outstanding government dues and bank loans. This also underscores
the need for preparing a centralised database which is shareable between the Collectorate
and the Tehsil with provisions for regular updating and reconciliation.
The audit findings were referred to the Government (July 2016). The reply had not been
received (December 2016).
61 Haridwar and Roorkee Tehsils in Haridwar district and Rudrapur and Kashipur Tehsils in Udham
Singh Nagar district.

Chapter-I: Social, General and Economic Sectors (Non-PSUs)
59
MEDICAL, HEALTH & FAMILY WELFARE DEPARTMENT
1.11 Excess expenditure in procurement of medicines
Violation of departmental instructions in procurement of medicines resulted in
excess expenditure of`̀̀̀ 1.06 crore.
Instructions issued (June 2002) by the Department of Medical, Health and Family
Welfare stipulated that Chief Medical Officers (CMOs), Chief Medical Superintendents
(CMSs) and Medical Superintendents (MSs) were authorized to make local procurements
of medicines at the rate of printed retail price minus 23 per cent62
(16 per cent from
2013-14). These instructions were based on provisions of para 19 of Drugs (Prices
Control) Order, 1995.
Audit scrutiny of the records of Doon Hospital and CMO Dehradun revealed that
medicines worth ` 7.80 crore (` 7.47 crore by the CMS and ` 0.33 crore by the CMO)
were procured locally during 2012-13 to 2014-15. Out of this amount, medicines worth
` 7.155 crore, ` 0.42 lakh and ` 0.26 crore were procured at the rate of printed retail
price minus five per cent, 20 per cent and zero per cent respectively. This resulted in an
excess expenditure of ` 1.06 crore.
The matter was reported to the Government (March 2016). The reply had not been
received (December 2016).
1.12 108 Emergency Response Service
An amount of `̀̀̀ 18.85 crore was lying unspent with the private operator at the
end of March 2016 due to excess release of funds by the Department. The
Department also did not recover operation cost of `̀̀̀ 6.34 crore from the
operator. Black outs in service, providing services after prescribed response
time and shortage of medical consumables and equipment in ambulances
detracted from the quality of emergency health care being provided by the
service.
1.12.1 Introduction
The 108 Emergency Response Service (ERS) providing integrated medical, police and
fire emergency services was launched in Uttarakhand in May 2008. The service is being
provided in the Public Private Partnership (PPP) mode. The Department of Medical,
Health and Family Welfare (MH&FW) is the public authority and GVK Emergency
Management and Research Institute (EMRI) is the private operator.
As per the agreement (March 2008), EMRI was to operate equipped ambulances63 with
trained para-medical staff to provide 24x7 emergency response services free of cost. Any
62 Retailers margin: 16 per cent; and Excise Duty: seven per cent. 63 Needle and Syringe Destroyer, Portable Air Ways Care System, Nebulization Apparatus, Defibrillator,
Cardiac Monitor, Manual B.P. Operator.
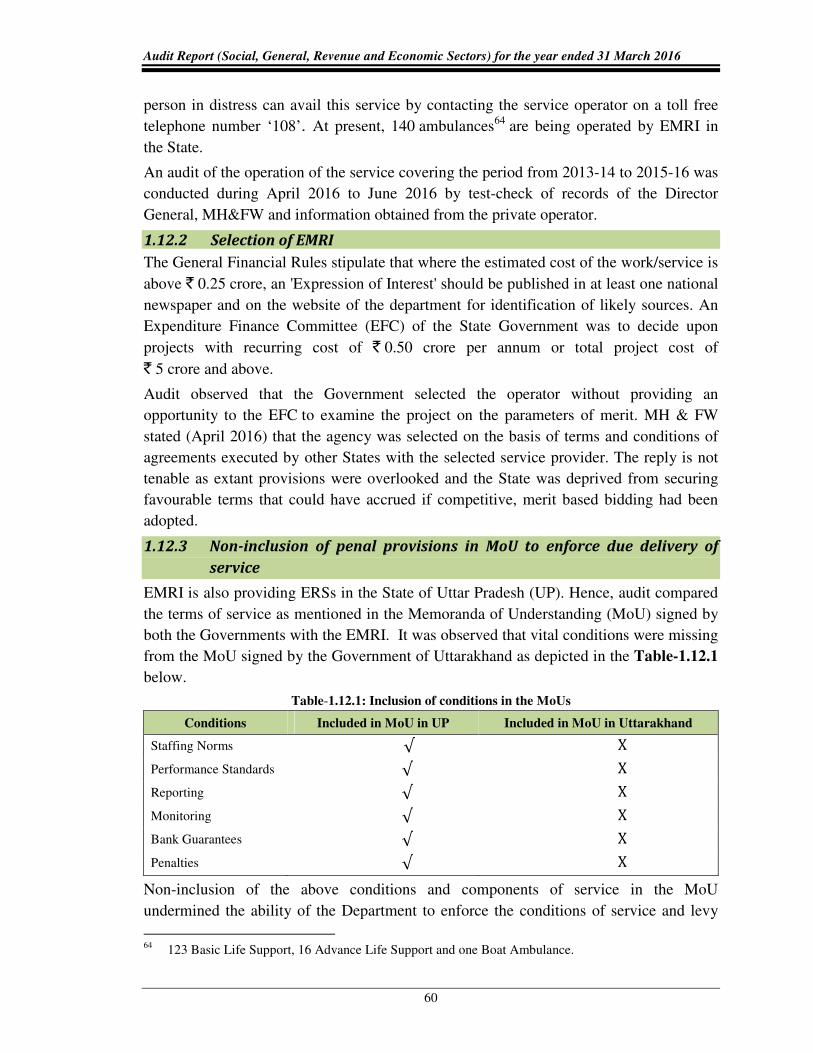
Audit Report (Social, General, Revenue and Economic Sectors) for the year ended 31 March 2016
60
person in distress can avail this service by contacting the service operator on a toll free
telephone number ‘108’. At present, 140 ambulances64 are being operated by EMRI in
the State.
An audit of the operation of the service covering the period from 2013-14 to 2015-16 was
conducted during April 2016 to June 2016 by test-check of records of the Director
General, MH&FW and information obtained from the private operator.
1.12.2 Selection of EMRI
The General Financial Rules stipulate that where the estimated cost of the work/service is
above ` 0.25 crore, an 'Expression of Interest' should be published in at least one national
newspaper and on the website of the department for identification of likely sources. An
Expenditure Finance Committee (EFC) of the State Government was to decide upon
projects with recurring cost of ` 0.50 crore per annum or total project cost of
` 5 crore and above.
Audit observed that the Government selected the operator without providing an
opportunity to the EFC to examine the project on the parameters of merit. MH & FW
stated (April 2016) that the agency was selected on the basis of terms and conditions of
agreements executed by other States with the selected service provider. The reply is not
tenable as extant provisions were overlooked and the State was deprived from securing
favourable terms that could have accrued if competitive, merit based bidding had been
adopted.
1.12.3 Non-inclusion of penal provisions in MoU to enforce due delivery of
service
EMRI is also providing ERSs in the State of Uttar Pradesh (UP). Hence, audit compared
the terms of service as mentioned in the Memoranda of Understanding (MoU) signed by
both the Governments with the EMRI. It was observed that vital conditions were missing
from the MoU signed by the Government of Uttarakhand as depicted in the Table-1.12.1
below.
Table-1.12.1: Inclusion of conditions in the MoUs
Conditions Included in MoU in UP Included in MoU in Uttarakhand
Staffing Norms √ X
Performance Standards √ X
Reporting √ X
Monitoring √ X
Bank Guarantees √ X
Penalties √ X
Non-inclusion of the above conditions and components of service in the MoU
undermined the ability of the Department to enforce the conditions of service and levy
64 123 Basic Life Support, 16 Advance Life Support and one Boat Ambulance.

Chapter-I: Social, General and Economic Sectors (Non-PSUs)
61
penalty or any other punitive measures for delayed response time and blackouts in service
during various phases of the audit period. Further, the Department did not ensure the
security and availability of assets worth ` 16.84 crore handed over to the EMRI as
neither the clause for safeguards of Government assets was kept in the MoU nor was any
physical verification of the assets done by the Department since inception of the service.
1.12.4 Financial Management
1.12.4.1 Excess release of funds
As per the MoU, the Department was to provide funds as grants-in-aid for capital and
operational expenditure. Funds towards operational expenditure were to be released in
advance before commencement of the quarter and reimbursements towards expenses
were to be done at actual cost.
Audit found that ` 172.86 crore were made available by the State Government to EMRI
during 2008-09 to 2015-16 against which an amount of ` 154.01 crore was spent by it.
The funds were released to the operator despite availability of sufficient funds with the
EMRI in the form of unspent balances carried forward from the previous year. As a
result, amounts ranging from 120 per cent to 384 per cent in excess of the required
average quarterly expenditure of previous year were available with EMRI in the first
quarter of the respective years. Further, an amount of ` 18.85 crore was lying unspent
with the operator at the end of March 2016. Such parking of funds with the private
operator did not conform to the standards of prudent expenditure of public money.
MH&FW stated (June 2016) that the balance amount would be adjusted in the financial
year 2016-17.
1.12.4.2 Non-Recovery of Operational Cost
As per the MoU, the operator was to bear five per cent of annual operational expenses of
the ERSs. Scrutiny of records revealed that the operational expenses of the EMRI during
the period 2008-09 to 2015-16 was ` 136.60 crore against which EMRI was to bear
` 6.83 crore being five per cent of annual operational cost. Audit found that the operator
had borne only ` 0.49 crore (2008-09) of the operational expenses thereby leaving an
amount of ` 6.34 crore unadjusted till June 2016.
MH&FW stated (June 2016) that decision to bear the hundred per cent operational costs
was taken by the Government (July 2009) and the MoU would be modified accordingly.
Audit noted that though the decision to modify the MoU was taken in 2009, the
amendment is yet to be carried out even after a lapse of seven years. This creates doubt as
to the rationale for the proposed change as it only results in benefitting the agency at the
cost of public exchequer.
1.12.4.3 Procurement of Medical Consumables on higher rates
The Department decided (July 2009) that procurement of medical consumables would be
made by EMRI as per the Uttarakhand Procurement Rules, 2008. A comparative study of

Audit Report (Social, General, Revenue and Economic Sectors) for the year ended 31 March 2016
62
rates of seven medical consumables65 procured by both the Department and the EMRI
revealed that these medical consumables were procured (2015-16) by EMRI at higher
rates ranging from 21.86 per cent to 133.86 per cent compared to that paid by the
Department which resulted in financial loss of ` 0.45 lakh to the Government.
MH&FW replied (June 2016) that EMRI is being instructed to procure the medical
consumables at departmental rates.
1.12.5 Operation of Emergency Response Service
1.12.5.1 Delayed response time
As per the MoU, EMRI was to respond to emergency calls and reach the required spot
within 35 minutes in rural areas and within 25 minutes in urban areas. Audit observed
that a total of 12,83,821 emergency calls were received since inception of the service out
of which 2,76,78966 (21.56 per cent) calls were attended beyond the prescribed response
time. Failure to respond within stipulated time posed risks to the distressed persons and
was a cause of concern.
1.12.5.2 Non-functioning of Ambulances
As per the MoU, EMRI was to ensure Emergency Response Service 24x7. However,
audit found that on an average, 87 ambulances for seven days (2011-12), five ambulances
for five days (2013-14), seven ambulances for five days (2014-15) and 14 ambulances for
51 days (2015-16) remained non-functional. As a result, 1,181 emergency calls could not
be attended to during 2013-14 to 2015-16.
1.12.5.3 Physical verification of Ambulances
As per the list of medical consumables provided by the Department, a total of
119 medical consumables were required to be kept in the ambulances. As per the
National Ambulance Code, 45 types of medical equipment were to be kept in the
ambulances.
Physical verification of eight ambulances67 by audit revealed that there was a shortfall of
6.72 per cent to 41.17 per cent in medical consumables and 25.55 per cent to
44.44 per cent in medical equipment available in the ambulances. Such shortfall impairs
the ability of the service to render emergency life-saving care to the distressed persons
availing the service.
MH&FW stated (June 2016) that the EMRI would be instructed to ensure availability of
prescribed medical consumables and equipment. Audit did not come across any records
related to periodic verifications of ambulances by the medical authorities, or any
65 Cord Clamp, Aspirin Tablets, Micropore tape, Normal Saline 500 ML, Ringers Lactate 500 ML,
Sterilized Gloves and Suction Catheter. 66 1,55,339 (Urban) and 1,21,450 (Rural). 67 Dehradun (02 Ambulances), Pauri (03 Ambulances) and Chamoli (03 Ambulances).

Chapter-I: Social, General and Economic Sectors (Non-PSUs)
63
follow-up reports of such verifications that could highlight department’s efforts in
ensuring that the ambulances met minimum standards of preparedness.
1.12.5.4 Non-construction of Ambulance Stations/Shelters
As per the MoU, the Department was to provide ambulance shelters to protect the
ambulances from vagaries of nature and to accommodate the driver and Emergency
Medical Technician (EMT) so that the ambulance could move immediately on receiving
emergency calls. Audit observed that only 28 shelters were constructed against
139 vehicles. As a result, 111 ambulances were parked in open and the drivers and EMTs
were not residing on the site where the ambulances were being parked. This could be a
major factor behind delayed response time.
The audit findings were referred to the Government (July 2016). The reply had not been
received (December 2016).
PUBLIC WORKS DEPARTMENT
1.13 Extra expenditure in work of road improvement
Calculation of cement concrete pavement work on square meter basis instead
of cubic metre as per extant guidelines resulted in extra expenditure of
`̀̀̀ 2.02 crore.
The Standard Data Book of the Ministry of Road Transport and Highways (MORTH) for
Road and bridge works published by the Indian Road Congress (IRC) and followed by
the Public Works Department of Uttarakhand provides that the unit of Cement Concrete
Pavement work should be measured in cubic metre (cum).
Government accorded (February 2009) administrative approval and financial sanction of
` 41.24 crore for work of improvement / strengthening of three roads68 under Package
No-14. Technical sanction of the work was granted (February 2009) by the Project
Director, ADB, PWD, Dehradun for ` 41.24 crore. As per the Detail Project Report
(DPR), the work of Cement Concrete (CC) Pavement was provisioned in cubic metre
@ ` 4,810 per cum. Test-check of records of the Executive Engineer (EE), Construction
Division (CD), Asian Development Bank (ADB), PWD, Dehradun, revealed that the
tender rate for the item of CC work was invited in square metre (sqm) (@ ` 2,000
per sqm) which was against the provisions of IRC/MORTH. As a result, the division had
to pay an extra amount of ` 2.02 crore69 for the executed quantity of 15,785.45 sqm
i.e. equivalent to 2,367.82 cum70. Had the division got executed this item of work in cum
as per norms of MORTH/IRC, an extra expenditure of ` 2.02 crore could have been
avoided.
68
1-Ruhalki - Sahadevpur M R 2-Pirankaliyar-Mujahidpur-Sattiwala M R 3-Raysi-Shahpur M R. 69 ` 2.02 crore = [(15,785.45 sqm*` 2,000 = ` 3,15,70,900) – (2,367.82 cum* ` 4,810=` 1,13,89,214)=
` 2,01,81,686)]. 70 Equivalent Quantity in cum =15,785.45 sqm x 0.15 metre (thickness of CC Pavement) = 2,367.82 cum.

Audit Report (Social, General, Revenue and Economic Sectors) for the year ended 31 March 2016
64
The EE stated (August 2105) that due to this item being tendered and awarded in the unit
of sqm, the payment to the contractor for the work executed was made only after ensuring
that thickness of the pavement was 15 cm as per the approved drawing. The reply is not
acceptable as the payments to the measurement of three dimensional works should be
done in cubic metre as laid down in the Standard Data Book of the MORTH.
The matter was referred to the Government (April 2016). The reply had not been received
(December 2016).
1.14 Extra expenditure due to excess use of bitumen
Extra expenditure of `̀̀̀ 0.79 crore due to excessive use of Bituminous Macadam.
Government accorded (February 2009) administrative approval and financial sanction of
` 50.19 crore for widening and strengthening of two parts i.e. km 15 to km 61.020 and
km 61.022 to km 98.812 of New Tehri-Ghansali-Tilwara Motor road under funding from
the Asian Development Bank (ADB). The scope of work consisted of widening of road
by 0.70 metre and strengthening of existing part of road by Bituminous Macadam (BM)
and Semi-Dense Bituminous Concrete (SDBC). The technical sanction for the work was
granted (March 2009) by the Project Director (PMU) Dehradun for the same amount71.
The Department entered into an agreement (March 2010) with a firm for an amount of
` 25.49 crore to execute the works related to the first part of the road (km 15 to km
61.020). This part of the work was completed in December 2013 after incurring an
expenditure of ` 26.57 crore.
Audit scrutiny of the records of the Executive Engineer (EE), Construction Division
(ADB) Public Works Department, New Tehri, revealed that the DPR envisaged that
bituminous works, primer coat72, BM (50 mm) and SDBC (25 mm) were to be executed
in 3.85 metre width over the entire road length. An additional quantity (20 per cent) of
BM had also been provisioned for Profile Corrective Course (PCC) as per requirement.
Audit found that executed quantity of BM was in excess of requirement in comparison to
the area covered by tack coat in the constructed length of road as detailed in Table-1.14.1
given below.
Table-1.14.1: Details of excess laying of Bituminous Macadam
Sl.
No. Particulars Calculation Quantity
1. Quantity of BM executed as per final bill 10,101.376 cum
2. Quantity of BM as per area covered by tack coat
1,50,553.389 Sqm x 0.050 m = 7,527.67 cum 9,033.20 cum
3. Add 20 per cent for PCC 7,527.67 x 20% = 1,505.53 cum 4. Excess Quantity of BM 10,101.376 cum – 9,033.20 cum 1,068.17 cum 5. Excess expenditure 1,06,8.17 cum x @ `̀̀̀ 7,387.50 per cum `̀̀̀ 78,91,105.87
71 ` 29.85 crore for first part of the road (km 15 to km 61.020) and ` 20.34 crore for the second part
(km 61.022 to km 98.812). 72 In widened portion only.

Chapter-I: Social, General and Economic Sectors (Non-PSUs)
65
The quantities of BM work executed (10,101.376 cum) are not in consonance with the
area covered by tack coat. Considering the area covered by the tack coats, the quantities
for BM should have been 9,033.20 cum including 20 per cent additional provision for
PCC. Apart from 20 per cent additional provision and execution of BM for PCC, the
Department had also incurred an expenditure of ` 1.21 crore over routine maintenance73
work during the course of construction.
The EE stated (August 2015) that the variation in the quantity was due to filling of pot
holes, depressions, undulations and existence of curves and hair pin bends. The reply was
not acceptable as the excess quantity pointed out by audit is after allowing 20 per cent
additional provision for PCC and is based on the area covered by the tack coat which
includes curves also. Thus use of 1,068.17 cum excess quantity of BM costing
` 0.79 crore was unjustified.
The matter was reported to the Government (July 2016).The reply had not been received
(December 2016).
1.15 Disregard of Government instructions for conduct of survey before
preparation of estimates
Disregard of Government instructions to undertake a survey before preparation
of estimates relating to improvement of roads to enable plying of Volvo buses
resulted in non-completion of the project despite an expenditure of
`̀̀̀ 14.57 crore.
With a view to exploiting opportunities of tourism by plying Volvo buses on Dehradun-
Mussoorie road, the State Government accorded (February 2013) administrative and
financial approval for upgrading the road by widening of turns and identified chainages at
a cost of ` 10.81 crore. The Chief Engineer (CE) accorded (April 2013) technical
sanction of the same amount subject to the condition that the Superintending Engineer
inspect the geometries of the road before commencing the work. The division entered
into an agreement (May 2013) for an amount of ` 10.32 crore with a contractor for
executing the work.
Scrutiny of records (June 2016) of the Executive Engineer (EE), Provincial Division,
Public Works Department, Dehradun, revealed that a survey was to be conducted by the
Department by carrying out a joint physical verification of road with the Officers of the
Uttarakhand Transport Corporation (UTC) and the Regional Transport Office before
preparation of estimates. However, no such survey was conducted and the Department
submitted an estimate proposing widening of nine hair pin bends and some blind turns.
73 Routine maintenance work includes filling of pot holes, depression, undulation and patch repair on
existing black top.
Audit Report (Social, General, Revenue and Economic Sectors) for the year ended 31 March 2016
66
Audit further noticed that only eight74 of the 17 contracted items of the work could be
executed by the contractor as the Department asked the contractor to enhance the width
of the proposed turns and bends upto four metres. However, since execution of the
quantities increased and the sanctioned cost not being sufficient, the contract was
finalized (February 2015) by paying ` 10.78 crore to the contractor.
Meanwhile, a new estimate for ` 37.90 crore was submitted (September 2014) to the
Government for the same work. This estimate was kept in abeyance and the Government
sanctioned (March 2015) an abridged estimate for ` 4.85 crore to finish the incomplete
works. The division started (April 2015) the remaining unfinished works by allotting
them to four contractors which were completed in October 2015. In the interregnum, a
trial run (August 2015) of Volvo bus in the presence of the officers of the Division and
the Uttarakhand Transport Corporation was conducted and it was observed that the road
was still not safe for plying of the buses and it required widening on 34 more chainages
for safe operation. Hence, disregard of instructions of the Government to conduct joint
inspection before preparation of estimates resulted in non-achievement of intended
objective even after incurring the expenditure of ` 14.57 crore.
The EE stated (June 2016) that quantities taken in the first estimate were less than
required and that the revised estimate of ` 37.90 crore fulfilled all the requirements of
plying Volvo buses on the road. It was added that the estimate would be further revised to
` 44.72 crore to accommodate changes in the schedule of rates. The reply is not tenable
as the first estimate was not prepared by taking into consideration instructions of the
Government as well as the CE. Had the instructions been complied with at the time of
preparation of estimate, the objective would have been achieved in stipulated time and
cost escalation avoided.
The matter was reported to the Government (August 2016).The reply had not been
received (December 2016).
SOCIAL WELFARE DEPARTMENT
1.16 Post Matric Scholarship to the students belonging to SC and OBC
The Department was not able to ensure compliance with provisions of the
guidelines laid down for providing scholarships to the Scheduled Caste and
Other Backward Class students leading to instances of inadmissible payments
and excess payments totaling `̀̀̀ 3.18 crore. In addition, `̀̀̀ 5.21 crore was parked
in bank accounts instead of disbursing to eligible beneficiaries or being
refunded to the treasury.
74 Hill side cutting, Excavation in Foundation, Cement plum masonry, Random rubble stone masonry,
Random rubble masonry dry, H P stone filling, HYSD bar reinforcement, RCC in superstructure.

Chapter-I: Social, General and Economic Sectors (Non-PSUs)
67
1.16.1 Introduction
Government of India (GoI) started the scheme of Post Matric Scholarship (PMS) for the
students belonging to Scheduled Castes (SC) in 1977-78 and for the students belonging to
Other Backward Classes (OBC) in 1998-99. The objective of the schemes is to provide
financial assistance to eligible students of SC/OBC categories studying in post
matriculate or post secondary stage to enable them to complete their education. These
100 per cent centrally sponsored schemes are being implemented in the State through the
Social Welfare Department.
An audit of the implementation of the above schemes during the period 2013-14 to
2015-16 was conducted during April 2016 to June 2016 by test-check of the records of
the Director, Social Welfare Department and the District Social Welfare Officers
(DSWOs) of Dehradun, Haridwar and Udham Singh Nagar.
1.16.2 Providing Scholarships
Scholarships are awarded to eligible75 students in accordance with the procedures laid
down by the State Government. Applications are submitted to the heads of the
institutions by the candidates. After verifying all the details viz. caste, income, class,
enrolled through paid or free seat and pass certificate of previous year, the heads of the
institutions forward the applications to the DSWO of the concerned district who is the
competent authority to sanction the scholarships. The scholarship which mainly includes
reimbursement of tuition fees as well as all other non-refundable compulsory fees
charged by educational institutions and maintenance allowance is to be paid into the bank
accounts of the beneficiaries after the details of beneficiaries have been verified by the
concerned Assistant Social Welfare Officer (ASWOs).
Audit observed the following:
(a) Government issued guidelines in October 2013 and July 2011 which do not provide
reimbursement of examination fee as part of post-matric scholarships for SCs and
OBCs respectively. Test-check of records of the DSWO, Haridwar and Udham Singh
Nagar revealed that an amount of ` 0.53 crore was paid (DSWO Haridwar:
` 52.58 lakh during 2014-15 and DSWO Udham Singh Nagar: ` 0.29 lakh during
2013-14) into the bank accounts of two institutions to reimburse the examination fees
of 1,033 students.
(b) GoI guidelines on post-matric scholarships for SC students stipulates that compulsory
non-refundable fees can be fully reimbursed as per the fee structure approved by the
Fee Structure Committee constituted by the State Government. Test-check of records
of DSWO Dehradun and Udham Singh Nagar revealed that ` 1.38 crore was paid as
scholarship to 154 students of Post Graduate Diploma in Management (PGDM)
course (DSWO Dehradun: ` 0.59 crore for 74 students during 2013-2015 and DSWO
75 SC and OBC students whose parents’/guardians’ income does not exceed ` 2.50 lakh and ` one lakh
per year respectively are eligible for scholarship benefits.

Audit Report (Social, General, Revenue and Economic Sectors) for the year ended 31 March 2016
68
Udham Singh Nagar: ` 0.79 crore for 80 students during 2014-15) of five institutes
despite the fact that fee structure for these institutes had not been approved by the
competent authority.
(c) Fee Structure Committee of the State Government decided (July 2010) that
institutions may charge additional tuition fee of ` 12,000/- per student if they
implement 6th Pay Commission’s recommendations in respect of their employees.
For charging the enhanced tuition fee, the institutions had to provide a list of the
benefitted employees to the Technical University/Government of Uttarakhand, along
with their pay slips countersigned by a Chartered Accountant. Audit scrutiny of
records of all the sampled DSWOs revealed that ` 0.92 crore76 was paid in the form
of enhanced fee of ` 12,000/-in respect of 764 students admitted to three institutions
for different courses. The enhanced fee claimed by the institutions was reimbursed
by the Department without confirming whether the recommendations of the 6th Pay
Commission had been implemented by them.
(d) Scholarship includes payment of maintenance allowance for hostellers and day
scholars. The rates of maintenance allowance have been fixed by the GoI. Test-check
of records of DSWO Haridwar and Dehradun revealed that maintenance allowance of
` 0.32 crore was paid to the students through scholarships at rates higher than
permissible during 2013-14 and 2014-15.
(e) Test-check of records of DSWO, Udham Singh Nagar revealed that an amount of
` 29.99 lakh was paid (November 2014) to an institute in respect of 74 students
whereas it had claimed only ` 27.60 lakh. This resulted in excess payment of
` 2.39 lakh. Audit further found that an amount of ` 2.30 lakh was paid during
2014-15 to the 298 students as maintenance allowance which too was more than the
demands made by the concerned institutes.
(f) As per GoI guidelines, only those SC and OBC students whose parents/guardians
income does not exceed ` 2.50 lakh and ` 1 lakh per year respectively are eligible for
scholarship benefits. Scrutiny of records of DSWO, Haridwar revealed that four OBC
students of B.Tech. Course whose parents’ annual incomes were ` 1.20 lakh each
were paid (2013-14) scholarship amounting to ` 2.62 lakh (` 65,500 for each
student). Also, scholarship of ` 0.54 lakh was paid by DSWO Udham Singh Nagar
to three students (two OBC and one SC) whose parents’ annual incomes were
` 1.50 lakh, ` 1.92 lakh and ` 2.64 lakh respectively.
Thus, funds totaling ` 3.18 crore was disbursed in contravention of the stipulated rules
and guidelines.
76 DSWO Haridwar: ` 0.84 crore during 2013-14, DSWO Dehradun: ` 0.06 crore during 2013-14, and
DSWO Udham Singh Nagar: ` 0.02 crore during 2014-15.

Chapter-I: Social, General and Economic Sectors (Non-PSUs)
69
1.16.3 Parking of funds
As per the Financial Hand Book Vol. V, no money should be withdrawn from Treasury
unless it is required for immediate disbursement.
Audit scrutiny of records of the selected DSWOs revealed that an amount of
` 5.21 crore77 related to post matric scholarships meant for SC and OBC students for the
years 2013-14 to 2015-16 was currently kept in bank account of the DSWOs. It was also
observed that 53,38578 students remained deprived of the due scholarship despite such
availability and parking of funds.
On this being pointed, the concerned DSWOs stated that the amount had accumulated by
way of receipt of the undisbursed amount of scholarships from different institutions. The
reply is not tenable as the amount should have been utilized for benefitting other eligible
students and any balance surrendered at the end of the financial year.
1.16.4 Inadequacies in Information Technology Application
The State Government implemented (July 2014) an online scholarship system for
registration, verification, selection, sanction and disbursement of scholarships to
beneficiaries through an IT application. For this purpose, the software was developed by
the National Informatics Centre (NIC) Uttarakhand.
An audit of the software system deployed by the Department revealed the following
discrepancies:
(a) System of bar coding was not installed during 2014-15 in the online software to filter
out fake applications. This made the system susceptible to registration of multiple
applications by beneficiaries in the system. The department stated that the bar coding
has been installed in the system from 2015-16. However, audit found double
payment of ` 0.13 crore to 43 beneficiaries during the year in Haridwar. The incident
illustrates that the bar coding was not proving to be adequate in filtering out fake
applications.
(b) Online mapping of recognised courses and fee structure was not done by the
recognised institutions. This resulted in payment of scholarship to the beneficiaries
without approval of the fee structure as pointed out in paragraph 1.16.2 (b).
(c) Online application numbers of the beneficiaries were found in variable length
ranging from eight to 11 digits whereas the field of application registration number
in the online database of all the beneficiaries should be uniform.
(d) No documentation of IT system at all the stages was kept to track the changes that
took place in the system.
(e) No monthly reviews were conducted by the Directorate as well as by the IT Cell.
77 Haridwar ` 1.58 crore, Dehradun ` 1.84 crore and ` 1.79 crore in US Nagar. 78 Haridwar: 17,376, Dehradun: 15, 837 and US Nagar: 20,172.

Audit Report (Social, General, Revenue and Economic Sectors) for the year ended 31 March 2016
70
The matter was reported to Government (July 2016). The reply had not been received
(December 2016).
Tourism Department
1.17 Infrastructure Development for Tourist Destinations and Circuits
Uttarakhand Tourism Development Board made an excess payment of centage
charges of `̀̀̀ 0.41 crore to executing agencies and also diverted funds
amounting to `̀̀̀ 3.20 crore without obtaining permission of the Government of
India and incurred a wasteful expenditure of `̀̀̀ 0.60 crore on construction of
tourist cottages. In addition, assets created at a cost of `̀̀̀ 5.45 crore remained
unutilized due to poor planning or inadequate management.
1.17.1 Introduction
Tourism is a priority sector in the State on account of its significant contribution to the
State’s economy. Direct or indirect participation by multiple stakeholders in tourism
generates economic activity and benefits the local community. There are 301 tourist spots
spread across 13 districts of the State. A total of 7.30 crore tourists including 3.25 lakh
foreigners visited the State during 2013-15.
The State Government established the Uttarakhand Tourism Development Board
(UTDB) in November 2001 by passing an Act79 to popularise the State as a premium
tourist destination and preferred choice of travellers by providing suitable tourist
infrastructure. An audit of the UTDB was carried out during April 2016 to June 2016
covering the period from 2013-14 to 2015-16 to ascertain whether appropriate strategies
were developed to realize the objectives of developing the State as a preferred tourist
destination and whether tourism development projects were effectively implemented and
managed during the period.
1.17.2 Planning
Planning is an essential process to develop strategies and schedule tasks to accomplish
the objectives of the policy which requires framing well thought out action plans with
proper linkages to each objective.
1.17.2.1 Non-preparation of plan
As per the UDTB Act, one of the functions of the UTDB is formulation of strategies for
development of tourism and preparation of plans for development of tourism related
infrastructure. Audit scrutiny revealed that Annual Action Plans were not prepared by the
UTDB since 2014-15. Further, in the absence of any overall strategic plan identifying and
prioritizing actions to be undertaken to promote tourism in the State, no benchmarks
could be established to measure whether the activities undertaken by the UTDB for the
years 2010-16 effectively met the requirements of the stated objectives of the policy.
79 UTDB Act 2001, hereinafter referred to as the Act.
Chapter-I: Social, General and Economic Sectors (Non-PSUs)
71
1.17.3 Financial Management
During 2011-16, the UTDB received ` 143.04 crore from the Government of India (GoI)
for execution of projects against which ` 133.58 crore were spent on the activities related
to development of infrastructure and for providing basic amenities. It was noticed that an
interest of ` 3.58 crore80 (31st March 2016) was earned on the unutilized central funds.
However, contrary to the terms of the financial sanction81, this interest was neither
surrendered nor was approval of GoI sought for its adjustment / transfer.
Further, as per the Act, UTDB was required to prepare every year an annual statement of
accounts after closure of the accounts. However, the accounts had not been prepared
since inception of the Board in 2001 which is a serious breach of financial discipline and
poses a control risk as discrepancies/errors and irregularities, if any, may go unnoticed.
UTDB stated (June 2016) that annual accounts would be prepared in future.
1.17.3.1 Excess payment of centage charges82
Government Order of May 2008 states that the rate of centage charges (CC) for payment
to the executing agency will be reduced by two per cent if the executing agency is not
involved in the preparation of the Detailed Project Report (DPR) of the project and the
DPR is instead got prepared by the department through a third party.
Test-check of records of five projects83 revealed that the UTDB engaged a third Party in
March 2011 for preparing DPRs for these projects but paid CC to the executing
agencies84 at the normal rate without reducing the same by two per cent. As a result, the
UTDB made an excess payment of ` 0.41 crore to the executing agencies in violation of
the Government Order.
UTDB stated (June 2016) that the excess payment made would be recovered from the
executing agencies.
1.17.4 Implementation and execution of projects
1.17.4.1 Delay in development of tourist destinations and circuits
Various tourism projects were approved by GoI and funds released through Central
Financial Assistance (CFA). The CFA stipulations require commencement of work
within six months of the receipt of the grant and completion of work within 24 months
80 As per Bank Statement. 81 As per financial sanctions of GoI, funds received under CFA should not be kept unutilized for more
than six months otherwise the same are to be surrendered with interest or a formal approval should be taken to transfer / adjust the amount against other CFA projects.
82 These are funds to cover fees for the preparation of plans and estimate for works as well as to cover per centage charges for establishment and tools and plants as fixed at quinquennial intervals.
83 Development of Eco-tourism at Chilla, Kodiyala, Lansdowne, Panchprayag and Abott Mount at Lohaghat under 13th Finance Commission and CSS.
84 Garhwal Mandal Vikas Nigam and Uttarakhand Peyjal Nigam.

Audit Report (Social, General, Revenue and Economic Sectors) for the year ended 31 March 2016
72
failing which the State has to refund the unspent balance unless otherwise permitted by
GoI for extension/diversion of funds to other CFA projects.
Out of 41 projects approved by GoI, work in five projects could not be started due to
non-availability of land and only nine projects were completed. The remaining projects,
which were already more than 24 months old, were at different stages of completion with
physical progress ranging between 20 to 85 per cent.
Against the approved 41 projects, the records of 20 projects (11 circuit development
projects and nine destination development projects) sanctioned at a cost of ` 169.69 crore
were test-checked in audit. An amount of ` 92.15 crore were utilised against the released
amount of ` 108.54 crore on these projects during the period 2011 and 2016. Audit
observed the following:
(a) GoI accorded (September 2013) financial sanction of ` 32.26 crore for five projects85.
Of this, ` 6.45 crore was released (September 2013) as the first installment subject to the
condition that the State Government would not keep the amount unutilized for more than
six months. The proposals submitted to GoI by UTDB for obtaining sanction under these
projects indicated that land required for execution of these projects was available. Audit
observed that the work on these five projects/destinations could not be started due to the
failure of the UTDB to ensure availability of land. It was further noticed that the UTDB,
without obtaining permission of GoI, suo motu decided (July 2015) to divert funds
amounting to ` 3.20 crore received in respect of two projects viz. (i) Ramnagar-Kosi
Tourism circuit and (ii) Day safari Adventure and Eco-tourism circuit to the
Kausani-Someshwar Tea Estate Eco-tourism circuit on which an amount of ` 1.76 crore
had so far been spent (June 2016). Out of the balance funds (` 3.25 crore) released for
remaining three projects, an amount of ` 8 lakh was spent on preparation of DPR for
Development of Duggada-Sendikhal-Vatanvasa Eco-tourism Circuit which became
wasteful as GoI had discontinued the scheme. It was then decided to send
(April 2016) a fresh proposal to GoI for diverting the funds to other schemes.
The decision of GoI was pending.
(b) GoI accorded (July 2011) a financial sanction of ` 6.90 crore for Haripura-
Nanaksagar-Lohaghat-Naukuchiatal–Mayawati-Kathgodam Tourist circuit. Out of this
amount, ` 5.52 crore were released (July 2011) as the first installment. The scheduled
date for completion of the circuit was 24 months from the date of sanction. The project
was completed at cost of ` 5.91 crore. Audit observed that one of the components under
this circuit related to construction of six Swiss cottages in the premises of Tourist Rest
House (Parichay) at Naukuchiatal at a cost of ` 0.60 crore. The work was completed
85 Development of River Rafting centre and Eco-tourism, Uttarkashi (` 4.99 crore), 2. Ramnagar-Kosi
Tourism Circuit (` 7.99 crore), 3. Development of Heliport, Multi-purpose Hall and wayside amenities (` 3.29 crore), 4. Development of Duggada-Sendikhal-Vatanvasa Eco-tourism Circuit (` 8 crore) and 5. Development of Day Safari Adventure and tourism Circuit, Ramnagar (` 7.99 crore).

Chapter-I: Social, General and Economic Sectors (Non-PSUs)
73
(April 2013) within the sanctioned cost and the payment was also released to the
executing agency. However, the executing agency did not hand over the completed
cottages to the UTDB till date for reasons not available on records. The cottages, which
were primarily tented accommodations, subsequently got damaged with the passage of
time. On the directions (May 2015) of the Secretary (Tourism), the Managing Director
Kumaun Mandal Vikas Nigam (KMVN) investigated the matter and found that quality of
constructed cottages was not satisfactory and that they were unfit for tourists. During the
joint86 site visit, it was confirmed that all the cottages had been damaged and had lost
their utility. The fact was also endorsed (May 2016) by the Deputy Director/ Tourism
(Nainital). Thus, expenditure of ` 0.60 crore incurred on the construction of the cottages
was rendered wasteful.
Thus, ` 6.45 crore released by GoI for projects could not be completed due to
non-availability of land though the State Government had explicitly stated in their
proposal sent to GoI that the required land was available. A portion of the funds were
also subsequently diverted for other projects without approval of GoI. In addition,
expenditure of ` 0.60 crore on construction of tourist cottages turned out to be wasteful.
1.17.4.2 Asset Management
Examination of records revealed that assets created under two projects at a cost of
` 5.45 crore as detailed in Table-1.17.1 below either remained unutilised due to lack of
planning and adequate management or the expected revenue from their utilization was yet
to be realized.
Table-1.17.1: Details of assets created under two projects
Details of facility created Reasons for non-utilization and present position
A. Bhowali-Mukteshwar-Bhimtal-Harishtal-Haldwani Wellness circuit project
Creation of Kumaun Visitor, Cultural and Craft village at Bhowali by constructing five Eco-huts along with
Amphitheatre, Car parking and Modern Toilet
Sanctioned / actual cost of construction ` 1.15 crore
Date of commissioning December 2013
GoI sanctioned (March 2011) Bhowali-Mukteshwar-Bhimtal-Harishtal-Haldwani Wellness circuit project for ` 8 crore. In this circuit, a destination with the nomenclature of Kumaun Visitor, Cultural and Craft village at Bhowali was proposed (February 2011) to be developed at a cost of ` 1.15 crore by constructing five Eco-huts along with Amphitheatre, Car parking and Modern Toilet. The executing agency developed the destination within the sanctioned cost and the same was commissioned on 31st December 2013.
A joint inspection of site (May 2016) by the Audit team along with the officers of Tourism / KMVN found that Eco-huts were lying unutilized since their commissioning due to non-availability of an approach road.
KMVN stated (May 2016) that the motor road was in existence till completion of the project but the same had been acquired by the High Court for use in its UJJALA, residential premises. However, it was observed that the Temporary Division, Public Works Department, Bhowali (Nainital), which was executing the construction work of UJJALA residential premises had started the work of wire fencing in May 2009 which was completed by it in June 2011. Despite knowing the fact of fencing work of UJJALA premises, UTDB , initiated (February 2012) the construction work of eco-huts at a cost of ` 1.15 crore without ensuring availability of motor road Thus, due to non-availability of approach road, the project remained unutilized for the last three years since its commissioning (December 2013).
86 The team comprised of officials of Tourism Department/KMVN and members of field audit team.

Audit Report (Social, General, Revenue and Economic Sectors) for the year ended 31 March 2016
74
Details of facility created Reasons for non-utilization and present position
B Development of Floating Marina with Budget Accommodation at Ghansali in district Tehri
Non-utilisation of Floating Marina at Ghansali, Tehri
Sanctioned / actual cost of construction ` 5.00 crore / ` 4.30 crore
Date of completion May 2015
The executing agency Uttar Pradesh Rajkiya Nirman Nigam Ltd, Dehradun after completion of the Floating Marina approached (May 2015) the UTDB for handing over the same but the latter did not make any efforts to take over the same till date (June 2016).
UTDB stated (June 2016) that efforts were being made to run the project through Public Private Partnership mode.
1.17.4.3 Non-realization of revenue from Eco huts put to use
UTDB decided (December 2013) to hand over eco huts87 created under Eco-Tourism
project at Lansdowne at a cost of ` 4.96 crore to the Garhwal Mandal Vikas Nigam
(GMVN), the implementing agency, on the condition that the latter would pay
30 per cent of the revenue generated through operation of assets to the UTDB. It was also
decided to enter into a formal agreement with the GMVN to this effect.
Audit scrutiny revealed that the UTDB neither finalized a formal agreement with the
GMVN nor demanded its share of ` 0.33 crore (30 per cent) in the revenue of
` 1.10 crore generated by the GMVN from the operation of assets during December
2013 to May 2016.
UTDB stated (June 2016) that the reminder was being sent to the GMVN for entering
into agreement and remitting their share of revenue.
The audit findings were referred to the Government (July 2016). The reply had not been
received (December 2016).
URBAN DEVELOPMENT DEPARTMENT
1.18 Setting up of Sewage Treatment Plants under Jawaharlal Nehru
National Urban Renewal Mission
Out of 21 STP projects undertaken under Jawaharlal Nehru National Urban
Renewal Mission (JnNURM), only six were completed in the selected cities/town
of the State depriving the beneficiaries of the intended benefits of the scheme.
In the absence of sewer connections to households, laying of sewer lines could
not serve the purpose of treating sewage and expenditure of `̀̀̀ 85.17 crore on
laying of sewer lines remained idle.
1.18.1 Introduction
The Jawaharlal Nehru National Urban Renewal Mission (JnNURM) was launched in
December 2005 by the Government of India (GoI) for providing universal access to civic
amenities to the urban population, creation of new sewerage system and renewal of
existing ones. In Uttarakhand, Dehradun and Nainital were selected as Mission cities and
87 Eco-huts with one bed room (05 Nos.) and Eco-huts with two bed rooms (04 Nos.).

Chapter-I: Social, General and Economic Sectors (Non-PSUs)
75
one small / medium town, Mussoorie, were covered88 under JnNURM for setting up of
Sewage Treatment Plants (STPs). Uttarakhand Pey Jal Nigam (UPJN) is the agency
responsible for implementing STP component of JnNURM.
1.18.2 Financial Management
1.18.2.1 Overall financial position
Under the Mission, 80 per cent funds were to be provided by GoI as Central assistance.
The remaining 20 per cent of the funds were to be shared in equal ratio by the State and
the concerned Urban Local Bodies (ULBs) / Parastatal Agencies (PA). Audit observed
that the State Government, in addition to its own share, had also borne the share of
ULBs / PA.
The financial position of the projects up to March 2016 in selected cities/ town is detailed
in Table-1.18.1 below.
Table-1.18.1: Financial position of the projects in selected cities/town (`̀̀̀ in crore)
Audit observed the following:
(a) The amount sanctioned for sewerage project was released to CD Mussoorie in full.
However, in violation of the sanction order, an amount of ` 5.10 crore90 sanctioned for
project in Mussoorie was diverted (August and November 2013) for use in Dehradun and
Haridwar and not reimbursed to CD Mussoorie despite projects in the town remaining
incomplete due to paucity of funds.
(b) As per JnNURM guidelines, the State Government was required to implement some
reforms like transfer of subjects of urban planning, regulation of land use, water supply
and fire services to ULBs and execute a Memorandum of Agreement (MoA) with the GoI
in this regard. Despite making commitment about the same in the MoA, the reforms were
not adopted leading to short release of Central assistance of ` 12.51 crore91 in respect of
Dehradun and Nainital for sewerage projects. The projects were still lying incomplete
(June 2016).
88 Dehradun: One project in 2008-09 and one project in 2009-10, Nainital: One project in 2008-09, and
Mussoorie: One project in 2008-09. 89 The sanctioned outlay as central assistance for Dehradun by GoI was ` 90 crore and additional cost
incurred in the execution of the projects was borne by the State Government. 90 Project Manager, Construction and Maintenance Unit (Ganga), UPJN, Haridwar ` five crore and
Executive Engineer, Construction Division, UPJN, Purodi, Dehradun ` 10 lakh. 91 Sanctioned Central Assistance for Dehradun and Nainital minus released Central Assistance for
Dehradun and Nainital.
Name of Cities
Sanctioned Amount Released Amount
Expenditure
(in percentage) Central
Assistance
(80 per cent)
State
/ULB/PA
share
(20 per cent)
Total Central
Assistance
State
Share Total
Dehradun89 90.00 27.48 117.48 79.07 32.00 111.07 113.45 (102) Nainital 15.70 3.90 19.60 14.12 3.92 18.04 17.98 (99.67) Mussoorie 49.39 12.34 61.73 49.39 12.34 61.73 56.05 (90.80) Grand Total 155.09 43.72 198.81 142.58 48.26 190.84 187.48 (98.23)

Audit Report (Social, General, Revenue and Economic Sectors) for the year ended 31 March 2016
76
1.18.2.2 Utilization and blockade of GoI Receipts
As per instructions issued (March 2013) by GoI, interest earned on central assistance
under JnNURM should be credited to the relevant head (0049 Interest receipt - 01 Interest
from State Government - 800 Miscellaneous Interest Receipts) of the Consolidated Fund
of India. Audit observed that interest amounting to ` 3.43 crore92 accrued on the funds
made available to executing agencies up to March 2016. Out of this amount, ` 6.14 lakh
were credited to the Treasury of the State Government and ` 3.19 crore had been utilized
on the projects in violation of the instructions of GoI. The balance amount of ` 0.18 crore
of interest was lying with the Department.
1.18.3 Execution of works of STPs
1.18.3.1 Delay in completion of STPs
Twenty one STPs were approved for the construction by GoI for cities of Dehradun,
Mussoorie and Nainital during the year 2008-10. These were to be completed latest by
August 2012. The details of STPs approved as well as the work undertaken in respect of
the approved works in each of the three cities/towns are provided in Table-1.18.2 below.
Table-1.18.2: Details of STPs in selected cities/ town
(`̀̀̀ in crore)
Thus, out of 21 approved STPs, only six were completed and just five of them were
functional as on date. Five STPs were under construction while remaining STPs were
either removed from the scope of work or their construction was yet to commence due to
delays caused by involvement of forest land, escalation in approved cost and change in
the design and scope of work. Further, the functional STPs could not be put to optimum
use as these were connected to the old sewer lines. The newly constructed sewer lines
were not connected with the households as yet as the same had not been handed over by
92 Dehradun: ` 0.55 crore, Nainital: ` 0.17 crore, Mussoorie: ` 1.78 crore and Managing Director of
UPJN: ` 0.93 crore.
City/
Town STP
Approved
cost
Tendered cost
(excess against
approved cost in %)
Financial
Progress Status
Dehradun
Indira nagar 5.20 7.50 (44) 4.37 Under construction
Jakhan 1.46 3.54 (142) 2.94
Vijay Colony 0.94 2.98 (217) 2.59 Completed and functional
Salawala 1.25 3.29 (163) 2.89 Completed and functional Mothorowala 18.00 21.60 (20) 21.16 Completed and functional
Nainital
Hari Nagar-1 0.40 1.54 (285) 1.50 Completed and functional Krishnapur 0.80 2.40 (200) 2.15 Hari nagar -2 0.40 Call of tender withheld due to paucity of funds caused by excess in
cost of two STPs. Narayan Nagar 0.66 ATI 0.80 Removed from the scope of work due to site falling in catchment area
of Naini lake. Ramsey 0.80
Mussoorie
STP wise cost was not sanctioned by GoI. Instead, 10 STPs were approved at a cost of ` 14.45 crore. Four STPs (Bhatta Fall, Landhour North, Landhour South, and Kulri) were undertaken for construction (total cost `̀̀̀ 8.33 crore) out of which only one had been completed (Bhatta Fall) but it remained non-functional due to opposition by local people.

Chapter-I: Social, General and Economic Sectors (Non-PSUs)
77
the UPJN to the Uttarakhand Jal Sansthan which was the agency responsible for
operating and maintaining them.
1.18.3.2 Acceptance of tenders beyond sanctioned cost
As per the recommendations of the Central Public Health and Environmental Engineering
Organisation (CPHEEO), no cost escalation in approved projects was admissible. In
case, there was any cost escalation due to any reason, the same was to be met by the State
Government.
Audit observed that the tenders were accepted at rates which were higher to the extent of
20 to 285 per cent in Dehradun and Nainital in comparison to their approved costs. The
escalation in cost was borne by diverting savings from other components93 of the project.
However, such diversions were not sufficient for completing the projects. This ultimately
led to stoppage of work in case of several STPs in Nainital and Mussoorie.
1.18.4 Lack of synchronization in laying of sewer lines and construction of
STPs
A comparison of completion rate of STPs and laying of approved length of sewer lines
revealed that completion rate of STPs did not match with the laying of sewer lines.
Besides, the physical progress of STPs was lagging far behind the financial progress of
STPs as depicted in Chart-1.18.1 below.
Chart-1.18.1: Physical progress of projects against expenditure incurred
Out of the 21 sanctioned STPs, six were completed and only five STPs94 of them are
functional as on date. On the other hand, 177.67 km of sewer lines have been laid against
the target of laying 168.58 km. Most of the sewer lines that had been laid as well as
expenditure incurred on them have remained idle as they have not been connected to a
functional STP. Majority of the STPs were either incomplete or yet to start functioning
93 Land acquisition: Dehradun ` 5.34 crore, Mussoorie `0.20 crore; Contingency: Dehradun ` 2.24 crore,
Nainital `0.12 crore, Mussoorie ` 8.18 lakh; Unspent amount of unconstructed STPs and other appurtenant works: Nainital ` 2.66 crore, Mussoorie ` 0.71crore.
94 Dehradun: STP Mothrowala, STP Salawala and STP Vijay Colony; Nainital: STP Hari Nagar-I, and STP Krishnapur.

Audit Report (Social, General, Revenue and Economic Sectors) for the year ended 31 March 2016
78
due to reasons such as involvement of forest land, financial constraints, and change in the
scope and design of work by the divisions. The objective of treating sewage can be fully
achieved only when the proposed STPs are constructed, become operational and user
connections are granted to the households of the area where sewer lines have been laid.
Audit observed the following:
(a) The twin activities of laying of sewer lines and setting up and operationalising the
STPs were not synchronized in the test-checked divisions. Thus, on one hand, sewer lines
already laid are lying idle and prone to damage while on the other, 16 out of 21 STPs
have not become operational due to financial, functional or design issues. This disjointed
approach towards project management has resulted in blocking of funds totalling
` 85.1795 crore in the form of expenditure incurred on laying of sewer lines not
connected with the STPs. This deprived targeted population of intended benefits and also
added to environmental concerns on account of untreated waste being allowed to flow
into streams and rivers.
(b) Scrutiny of records of Executive Engineer (EE), Construction Division, Mussoorie
revealed that the Department was not in a position to utilize the only completed STP of
the town at Bhatta Fall due to a dispute with local public on discharge of the treated
effluent in Galogi Gadera which is a source of drinking water supply. A separate
estimate amounting to ` 4.57 crore has been prepared (2014-15) in order to divert the
effluent to another location. The STP was currently idle. Audit observed that the work
was executed without conducting any feasibility study on discharge of effluents. If such a
study had been undertaken and alternate location of discharge of treated effluent
identified, extra burden of ` 4.57 crore on State Government could have been minimized
or altogether avoided.
The EE, Construction Division, Mussoorie, stated (June 2016) that advanced technology
was adopted in the said STP keeping in view that the treated water was to be discharged
in the said gadera. The reply of the EE is not tenable as Central Public Health and
Environmental Engineering Organisation’s (CPHEEO’s) Sewage Manual stipulates that
the treated water can be used for only non-potable96 application. Thus, such an
eventuality should have been foreseen at the planning stage itself.
1.18.5 Payment of Interest free Mobilization advance
According to the Uttarakhand Procurement Rules 2008, advances to contractors are
prohibited and payment should be made only against the work actually done. However,
mobilization advances may be permitted only with the sanction of the Government and
this shall be subject to payment of interest till the amount is deducted or adjusted.
Audit observed that an amount ` 8.09 crore (Dehradun: ` 7.09 crore, Mussoorie:
` 1.00 crore) had been paid (2010-12) to contactors as interest free mobilization advance
95 Dehradun: ` 35.80 crore; Mussoorie: ` 46.23 crore and Nainital: ` 3.14 crore. 96 Other than drinkable application.

Chapter-I: Social, General and Economic Sectors (Non-PSUs)
79
against four agreements executed. Out of these amounts, ` 6.17 crore and ` 0.72 crore
had been recovered by the end of March 2016 in Dehradun and Mussoorie respectively.
However, providing mobilization advances without interest resulted in loss to the tune of
` 0.77 crore97 at five per cent rate of interest.
EEs of Dehradun and Mussoorie stated (June 2016) that interest was not charged on the
said advances because the Uttarakhand Procurement Rules, 2008 were duly adopted by
the UPJN in October 2010 and the agreements were signed before that date. The reply is
not acceptable as Uttarakhand Procurement Rules 2008 makes it clear that the Rules had
come into force on 01 May 2008 and were equally applicable on UPJN being an entity
lying under the administrative control of the State Government.
1.18.6 Improper Disposal of Sludge and Use of treated effluent
STP Mothorowala in Dehradun was completed (February 2016) after incurring an
expenditure of ` 21.16 crore. Audit scrutiny revealed that user connections were not
provided to households from the newly laid sewer lines in 40.57 kms length. However,
the STP was connected to old sewer lines which provided only five mld sewage
compared to 20 mld capacity of the STP. Thus, the STP was working below its installed
capacity.
Audit also observed that the final extract of sludge was being dumped in an open area and
the treated effluent was flowing in to a Nala (ultimately merging with Rispana River)
where it was again getting polluted. This treated water could have been fruitfully used for
secondary purposes like providing irrigation facilities, as required under
recommendations of CPHEEO.
Picture No 1: Sludge dumped in open area at Mothorowala Picture No 2:Disposal of treated effluent in Nalla at Mothorowala
The audit findings were referred to the Government (July 2016). The reply had not been
received (December 2016).
WOMEN EMPOWERMENT AND CHILD DEVELOPMENT DEPARTMENT
1.19 Implementation of the Nirbhaya Scheme
The State Government utilized only `̀̀̀ 0.23 crore out of total allocated fund of
`̀̀̀ 1.02 crore in 2014-15 and 2015-16 resulting in poor operationalization of
scheme. Required infrastructure could not be put in place even after a lapse of
more than two years since the launch of the scheme.
97 Mussoorie: ` 0.16 crore and Dehradun: ` 0.61 crore.

Audit Report (Social, General, Revenue and Economic Sectors) for the year ended 31 March 2016
80
1.19.1 Introduction
Government of India (GoI) set up the Nirbhaya Fund (February 2013) for providing
support to projects being executed for women’s safety and security. The scheme was
launched in Uttarakhand in October 2013. The scheme is aimed at checking gender
offence / violence like rape, sexual harassment, sexual assaults at work place and
domestic violence against women and provides quick and effective measures to be
undertaken by various departments like Police and district administration. The State
Government is required to select projects for funding under the Nirbhaya scheme.
Sixty per cent of the cost of such projects is met by GoI while the rest is borne by the
State Government.
No allocations under the Nirbhaya Fund were however made to the State Government by
GoI. The State Government made allocations of ` 0.24 crore and ` 0.78 crore in 2014-15
and 2015-16 respectively for establishment of Nirbhaya Cells in each district. To
implement the scheme, the women cells were to be constituted in each districts of the
State.
The State Government covered four98 districts (January 2014) in the first phase of the
implementation of the Scheme and issued further orders (October 2015) to implement the
scheme in rest of the nine districts99 due to increase in the number of cases of violence/
offence against women in the State. However, out of these remaining nine districts, the
women cells were yet to be constituted in two districts100. In one district,101 although the
cell was constituted, no personnel were deployed for the cell. The implementation of the
scheme in Uttarakhand was limited to only providing legal assistance and counselling to
the women victims and no specific proposals for women security and safety with regard
to specific sectors like road transport, police, power were submitted to GoI for approval.
To assess the implementation of the scheme during the period 2013-14 to 2015-16, an
audit was conducted from May 2016 to June 2016 by test-check of records of the
Director, Integrated Child Development Scheme (ICDS) and the District Programme
Officers (DPOs) of Pithoragarh and Champawat districts.
1.19.2 Establishment of State level Criminal Accident, Assistance and
Rehabilitation Board
For the effective implementation of the Scheme, a State Level Criminal Accident,
Assistance and Rehabilitation Board was to be established under the chairmanship of the
Principal Secretary, Women Empowerment and Child Development. The Board was
required to review the functioning of the District Boards established under the scheme,
98 Pauri, Tehri, Udham Singh Nagar and Nainital. 99 Pithoragarh, Champawat, Dehradun, Haridwar, Almora, Bageshwar, Uttarkashi, Rudraprayag and
Chamoli. 100 Chamoli and Haridwar. 101 Rudraprayag.

Chapter-I: Social, General and Economic Sectors (Non-PSUs)
81
review the assistance provided to the victims and ensure restorative justice to rape
victims.
Audit found that though the said Board had been constituted (October 2013) in the State,
it was not functioning as per its mandate and had met only two times (December 2014
and May 2016). The main role of the Board was to supervise the working of the
sub-ordinate boards at the district level. However, no documentary proof of any such
monitoring undertaken by the Board was provided to audit by the department.
1.19.3 Establishment of the Nirbhaya Cell
Under the Scheme, a cell was to be set up at each DPO office in the districts for helping
the victims by ensuring rapid and effective action against the violence meted out to them.
The cell was to comprise a women advocate having expertise in criminal cases, a
counsellor for assisting and counselling the victim, and supporting clerical staff. All the
personnel were to be hired on payment of fixed honorarium.
Scrutiny of records of the Director ICDS revealed that Nirbhaya cells were properly
functioning in the districts of Nainital, Pauri and Udham Singh Nagar where these cells
had registered and provided legal and counselling related assistance in 99 cases till date.
However in Uttarkashi, the cell was functioning without the services of a woman
advocate while in Tehri and Champawat districts, the cells were functioning with only a
computer operator and an anusevak. The experience of Nainital, Pauri and Udham Singh
Nagar shows that the women victims of violence could be assisted to a great extent if the
cell was formed and manned with proper man power.
The Director, ICDS stated that the process of appointment of personnel for setting up and
operationalizing Nirbhaya Cell was in process.
1.19.4 Poor utilization of Scheme funds
Audit scrutiny of the records of Director ICDS revealed that out of ` 0.24 crore and
` 0.78 crore allocated in 2014-15 and 2015-16, only ` 6.46 lakh (27 per cent) and
` 16.42 lakh (21 per cent) had been utilized during 2014-15 and 2015-16 respectively.
The under-utilization can be attributed to the poor operationalization of the scheme as
pointed out in paragraph 1.19.3.
The audit findings were referred to the Government (July 2016). The reply had not been
received (December 2016).
1.20 Implementation of Beti Bachao Beti Padhao Scheme
Only `̀̀̀ 0.20 crore was released to selected districts for implementation of the
scheme out of received central assistance of `̀̀̀ 0.77 crore, of which, only
`̀̀̀ 8.90 lakh (12 per cent) were utilized which defeated the objective of checking
the decline in the child sex ratio through mass campaign, focused intervention
and multi-sectoral action in the State.

Audit Report (Social, General, Revenue and Economic Sectors) for the year ended 31 March 2016
82
Activities at District Level
•Promote early registration of pregnancy at Health Centers.
•Train Aanganwadi Workers/Accredited Social Health Activists to generate awareness on the CSR issue.
•Sensitization of women and young married couple on the issue of declining CSR and value of girl child.
•Community mobilization through celebration of birth of girl child.
Activities at Panchayat Level
•Convening of special gram sabha meetings to discuss the impact of imbalance in sex ratio. •Constitution of Mahila Sabha for spreading awareness among women. •Monitoring of Anganwaadi centres. •Reporting of cases of sex determination and female foeticide to the police.
1.20.1 Introduction
The Government of India (GoI) launched (January 2015) the Beti Bachao Beti Padhao
(BBBP) Scheme to address the issue of girl education in 100 gender critical districts in
India. In Uttarakhand, the scheme was initially implemented in the districts of
Champawat and Pithoragarh. The scheme was further extended (February 2016) to cover
Dehradun, Haridwar and Chamoli districts of the State. The ‘State Resource Centre for
Women’ in the Department of Women Empowerment and Child Development has been
designated as the nodal agency in the State for implementation of the scheme.
An audit for assessing the implementation of the scheme in the state during the period
from 2014-15 to 2015-16 was conducted during May 2016 to June 2016 by test-check of
the records of the Director Integrated Child Development Scheme (ICDS) and the District
Programme Officers (DPOs) of Pithoragarh and Champawat.
1.20.2 Status of Child Sex Ratio
The scheme is focussed at checking the decline in Child Sex Ratio (CSR) through
improving the Sex Ratio at Birth (SRB). In order to achieve the targeted goals in respect of
CSR / SRB, necessary steps in the shape of modalities and implementation activities, as
depicted in the boxes, were required to be initiated at both the District and Panchayat level.
Targets for improving SRB are fixed for each targeted district by GoI bi-annually. The
position of the SRB in the test-checked districts is shown in the Table-1.20.1 below.
Table-1.20.1: Status of Sex Ratio at Birth
CSR as per 2011
census
CSR National
Average as per
2011 Census
CSR State
Average as per
2011 Census
Target/achievement of SRB
2014-15 2015-16
Target Ach. Target Ach.
Champawat 873 918 890
895 887 905 958 Pithoragarh 816 908 880 918 901
Source: Scheme Guidelines of BBBP/Information provided by Director General, Medical, Health and Family
Welfare.
Details of the targets of SRB vis-à-vis the achievement of the selected districts during
2014-15 and 2015-16 revealed that while Champawat had performed well in achieving

Chapter-I: Social, General and Economic Sectors (Non-PSUs)
83
the set target, performance of Pithoragarh was lacking. Audit observed that many
activities like promotion of early registration of pregnancy at health centers, generating
awareness on the CSR issue, sensitization of women and young married couple on the
issue of declining CSR and value of girl child, community mobilization through
celebration of birth of girl child could not be undertaken in the test checked districts. In
Champawat, audit could not verify the claims of the Department of over achieving the
target rate in absence of data from any third party sources102.
1.20.3 Financial Position
The scheme is 100 per cent centrally sponsored by the Government of India. GoI
released ` 0.21 crore (February 2015) and ` 0.56 crore (August 2015) to the State
Government for implementation of the scheme in Pithoragarh and Champawat. Further,
amount of ` 0.16 crore was released in March 2015 for setting up of ‘Village
Convergence and Facilitation Services’ (VCFS) centres in both the districts for linking
women with various schemes of both the Central and State Governments including
Beti Bachao Beti Padhao.
Scrutiny of records of the Director ICDS revealed that the Department released an
amount of ` 10.10 lakh to Champawat and Pithoragarh each (October 2015 and March
2016) out of the above mentioned amount. Audit found that only ` 8.90 lakh had been
spent till date under the scheme (DPO Pithoragarh: ` 3.90 lakh, DPO Champawat:
` 0.30 lakh and Director: ` 4.70 lakh) in minor activities of publicity, training and
capacity building, and awareness campaigns. This expenditure constituted only
12 per cent of the Central assistance under the scheme. Moreover, no funds were spent
on setting up the VCFS centres which could help link women with the scheme.
1.20.4 Setting up of structures responsible for implementation of the scheme
The scheme guidelines stipulate putting in place a formal structure in the form of a State
Task Force (STF), a District Task Force (DTF) and a Block Task Force (BTF) to oversee
implementation of the scheme. Main functions of these task forces can be seen in the
following diagram:
102 Annual Survey Report of GoI.
State Task Force
•Inter-sectoral coordination, monitoring and formulation of State policy for girl children.
District Task Force
•Develop District Action Plan, implementation of multi-sectoral action and review the implementation of pre-conception and pre-natal diagnostics techniques (PC & PNDT) Act.
Block Task Force
•Implementation, monitoring and supervision of block action plan at the block level.

Audit Report (Social, General, Revenue and Economic Sectors) for the year ended 31 March 2016
84
Scrutiny of records of the Director ICDS revealed that STF had not been set up till date.
Hence, the activities such as inter-sectoral coordination, monitoring, and formulation of
the State policy for girl child could not be undertaken.
Audit also observed that though DTFs had come into existence in both the districts of
Pithoragarh (February 2015) and Champawat (August 2015), they could not meet
regularly as required. Against the requirement of meeting 17 and 11 times respectively
(once a month), the DTFs of these districts could meet only four and three times
respectively till June 2016. Agenda of these meetings was to review proper
implementation of PC & PNDT Act in the districts. In spite of these meetings, ground
level performance in form of activities of publicity and awareness generation, review of
implementation of PC & PNDT Act, counseling of newly married couples and pregnant
and lactating mothers and facilitating positive environment for education of girl children
was negligible. In district Champawat, BTFs were established in three blocks but in the
absence of regular monitoring, their objectives were not achieved. BTFs could not be
established in Pithoragarh.
1.20.5 Engagement with other stake holders
The scheme guidelines provide for convergence of activities with other line departments
and engagement with various other stake holders for effective implementation of the
scheme. These departments and stake holders included Medical Department, Education
Department and local Non-Government Organizations (NGOs).
Audit found that such convergence and engagement activities could not be undertaken by
the Department. Further, Village Health, Sanitation and Nutrition Committee - a
sub-committee of the Gram Panchayat, which was to be engaged for ground level
implementation and monitoring of the scheme, had been entrusted with no role in
Pithoragarh. The committee was not even in existence in Champawat.
Thus, implementation of the scheme in the State was deficient with little financial support
to identified districts, lack of co-ordination and monitoring at the State level, and
inadequate implementation activities at the ground level.
The audit findings were referred to the Government (July 2016). The reply had not been
received (December 2016).


85
CHAPTER-II
Revenue Sector
2.1 Introduction
2.1.1 Trend of revenue receipts
Tax and non-tax revenue raised by the Government of Uttarakhand during the year
2015-16, the State’s share of net proceeds of divisible Union taxes and duties assigned to
the State and Grants-in-aid received from the Government of India during the year and
the corresponding figures for the preceding four years are mentioned in Table-2.1.1
below.
Table-2.1.1: Trend of Revenue Receipts
(` ` ` ` in crore)
Sl. No. Particulars 2011-12 2012-13 2013-14 2014-15 2015-16
1. Revenue raised by the State Government
• Tax revenue 5,615.62 6,414.25 7,355.34 8,338.47 9,377.79
• Non-tax revenue 1,136.13 1,602.88 1,316.54 1,110.44 1,219.66
Total 6,751.75 8,017.13 8,671.88 9,448.91 10,597.45
2. Receipts from the Government of India
• Share of net proceeds of divisible Union taxes and duties1
2,866.04 3,272.88 3,573.38 3,792.30 5,333.19
• Grants-in-aid 4,073.45 4,457.21 5,075.27 7,005.34 5,303.79
Total 6,939.49 7,730.09 8,648.65 10,797.64 10,636.98
3. Total revenue receipts of the State
Government (1 and 2) 13,691.24 1 5,747.22 17,320.53 20,246.55 21,234.43
4. Percentage of 1 to 3 49 51 50 47 50 Source: Finance Accounts.
During the year 2015-16, revenue raised by the State Government (` 10,597.45 crore)
was 50 per cent of the total revenue receipts. The balance 50 per cent (` 10,636.98 crore)
of the receipts during 2015-16 were from the Government of India as the share of net
proceeds of divisible Union taxes and duties and Grants-in-aid.
2.1.2 The details of tax revenue raised during the period 2011-12 to 2015-16 are given
in Table-2.1.2 below.
1 Note: For details, please see Statement No.14: Detailed accounts of revenue by Minor Heads in the
Finance Accounts (Vol.-II) of Government of Uttarakhand for the year 2015-16. Figures under the “share of net proceeds assigned to States” under the Major Heads-0020-Corporation Tax, 0021-Taxes on Income and Expenditure, 0032 - Taxes on Wealth, 0037 - Customs, 0038-Union Excise Duties and 0044-Service Taxes booked in the Finance Accounts under ‘A-Tax Revenue’ have been excluded from the revenue raised by the State Government and included in the ‘State share of divisible Union Taxes’ in the above table.

Audit Report (Social, General, Revenue and Economic Sectors) for the year ended 31 March 2016
86
Table-2.1.2: Details of Tax Revenue Raised
(` in crore)
Sl.
No. Head of revenue
2011-12 2012-13 2013-14 2014-15 2015-16
Percentage of increase
(+) or decrease (-) in
actual of
BE Actual BE Actual BE Actual BE Actual BE Actual
2015-16
over BE of
2015-16
2015-16
over
actual of
2014-15
1. Taxes on sales and trade 3,187.60 3,643.51 4,088.10 4,289.41 4,847.22 4,902.91 5,459.01 5,464.84 6,209.81 6,105.43 (-) 1.68 (+) 11.72
2. State excise 727.67 843.65 942.15 1,117.92 1,149.25 1,269.29 1,345.40 1,486.66 1,799.33 1,735.39 (-) 3.55 (+) 16.73
3. Stamps Duty and
Registration Fees 483.85 524.05 573.95 648.40 640.40 686.71 708.79 714.06 777.22 870.67 (+) 12.02 (+) 21.93
4. Motor Vehicles Tax 249.53 334.69 275.00 304.29 320.00 368.83 360.00 393.70 435.00 470.87 (+) 8.25 (+) 19.60
5. Taxes and duties on
electricity 75.00 229.02 60.00 2.71 100.00 64.66 100.00 192.65 175.00 114.76 (-) 34.42 (-) 40.43
6. Land revenue 13.48 10.18 8.55 10.59 8.15 21.65 9.05 39.26 17.12 27.88 (+) 62.85 (-) 28.99
7.
Other taxes and Duties
on Commodities and
Services
10.60 16.52 17.50 23.13 24.41 23.47 25.01 25.26 27.01 28.37 (+) 5.04 (+) 28.74
8. Others 12.00 14.00 15.00 17.80 22.00 17.82 16.00 22.04 23.00 24.42 (+) 6.17 (+) 10.80
Total 4,759.73 5,615.62 5,980.25 6,414.25 7,111.43 7,355.34 8,023.26 8,338.47 9,463.49 9,377.79 (-) 0.91 (+) 12.51
Source: Finance Account.
The State’s own tax revenue increased by 67 per cent from ` 5,615.62 crore in 2011-12
to ` 9,377.79 crore in 2015-16. It increased by 12.46 per cent from 2014-15 to 2015-16.
The revenue from Taxes on Sales and Trade not only comprised a major share of tax
revenue (65 per cent) but also registered an increase of 11.72 per cent over the previous
year. The State Excise was another major contributor to the State’s own tax revenue.
The respective Departments reported the following reasons for variations:
Taxes on sales and trade: The increase in the revenue receipts was due to regular rise in
inflation in the State resulting in increase in the cost of commodities over the previous
year.
Taxes on Vehicles: The increase in revenue receipts was due to revision of one-time tax.
Stamp and Registration Fees: The increase in revenue receipts over previous year was
due to increase in circle rate of lands and increase in the registration fees from
` 10,000 to ` 25,000.
State Excise: The increase in revenue receipts was due to revenue realization in
accordance with the provisions of the State Excise Policy for the year 2015-16.
Other departments have not furnished any reason for variation (December 2016).
2.1.3 The details of non-tax revenue raised during the period 2011-12 to
2015-16 are indicated in Table-2.1.3 below.

Chapter-II: Revenue Sector
87
Table -2.1.3: Details of non-tax revenue raised (` in crore)
Sl.
No. Head of revenue
2011-12 2012-13 2013-14 2014-15 2015-16
Percentage of increase
(+) or decrease (-) in
actual
BE Actual BE Actual BE Actual BE Actual BE Actual
2015-16
over BE
of 2015-16
2015-16
over
Actual of
2014-15
1. Power 235.00 41.24 84.00 150.04 122.55 121.11 122.55 45.01 143.00 168.57 (+) 17.88 (+) 274.52
2. Interest receipts 52.01 50.62 35.00 114.76 44.83 51.12 33.10 108.17 51.00 89.22 (+) 74.94 (-) 17.52
3. Forestry and wild life 286.83 234.26 296.71 238.20 309.34 362.70 342.06 351.24 415.86 357.47 (-) 14.04 (+) 1.77
4. Public works 17.27 17.85 16.16 18.13 9.15 15.51 19.11 28.29 24.92 13.96 (-) 43.98 (-) 50.65
5. Miscellaneous general
services 14.00 37.57 11.00 25.85 3.55 48.74 21.00 8.26 24.00 (-)5.50 (-) 122.92 (-) 166.59
6. Other administrative
services 12.21 70.15 11.82 38.72 3.73 32.38 19.13 33.50 32.90 43.19 (+) 31.28 (+) 28.93
7. Police 9.00 11.41 10.11 10.98 11.21 13.39 11.47 16.51 16.01 11.18 (-) 30.17 (-) 32.28
8. Medical and Public
Health 17.93 23.20 23.16 30.00 22.10 44.04 24.52 37.78 37.95 76.86 (+) 102.53 (+) 103.44
9. Co-operation 1.02 2.93 2.21 1.38 2.23 9.78 2.01 1.17 2.50 2.26 (-) 9.60 (+) 93.16
10. Major and Medium
Irrigation 3.31 8.07 2.37 7.65 2.42 6.75 2.42 9.22 5.75 7.92 (+) 37.74 (-) 14.10
11.
Non Ferrous Mining
and Metallurgical
industries
110.01 112.58 131.00 109.85 151.00 249.99 301.00 223.72 501.00 272.65 (-) 45.58 (+) 21.87
12. Other Non-tax receipts 888.52 526.25 584.63 857.32 534.15 361.03 909.09 247.57 813.17 176.38 (-) 78.31 (-) 28.76
Total 1,647.11 1,136.13 1,208.17 1,602.88 1,216.26 1,316.54 1,807.46 1,110.44 2,068.06 1,219.66 (-) 41.02 (+) 8.86
Source: Finance Accounts.
Non-tax revenue showed an increasing trend during the period 2011-12 to 2012-13.
However, thereafter it showed a decreasing trend from 2013-14 to 2014-15 and again
increased in the year 2015-16. During the year 2014-15, it decreased by ` 206.10 crore
(15.65 per cent) against the previous year’s decrease of ` 286.34 crore (17.86 per cent)
and in the year of 2015-16, it increased by ` 109.22 crore (9.84 per cent) over the
previous year.
The respective Departments reported the following reasons for variations:
Medical and Public Health: The increase was mainly due to more receipts under
'Other Receipts'.
Co-operation: The main reason for increase of revenue receipts over the previous year
was due to the huge amount deposited as audit fees by co-operatives/institutions.
Power: The increase was mainly due to more receipts under 'Other Receipts'.
Public Work: The decrease was mainly due to fewer receipts under 'Other Receipts'.
Miscellaneous General Services: The decrease was mainly due to increase under
“Deduct Refund”.
Other departments have not furnished any reason for variation (December 2016).
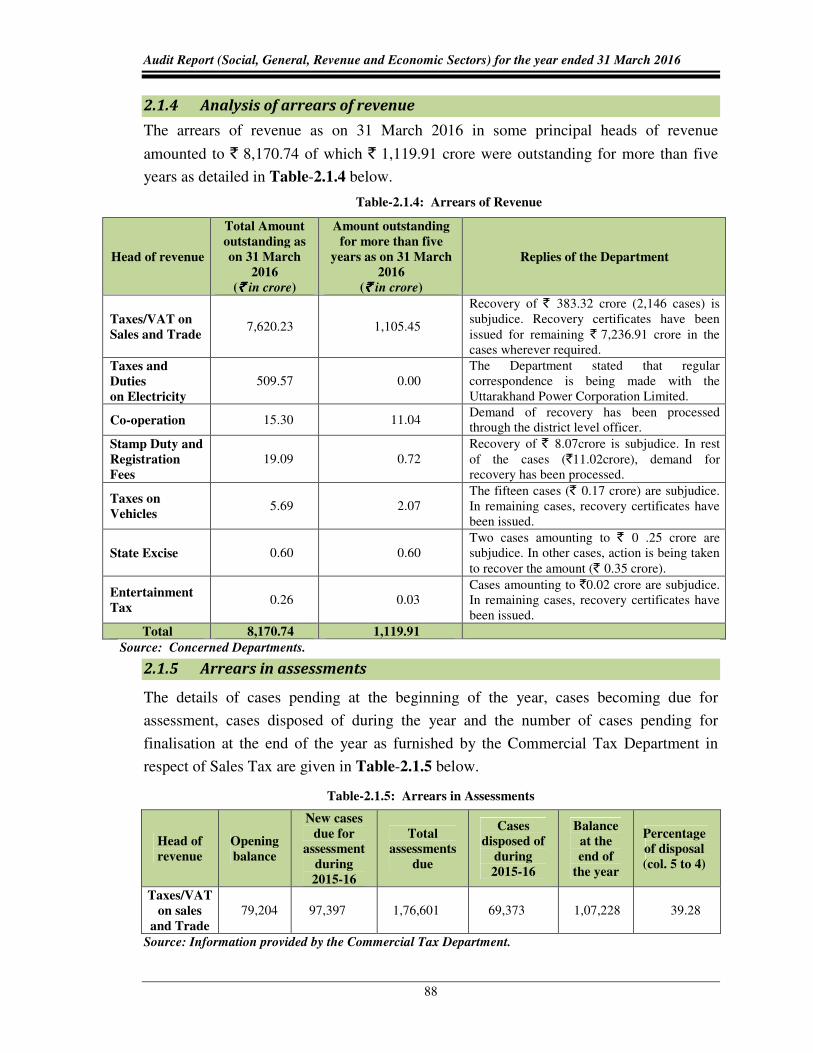
Audit Report (Social, General, Revenue and Economic Sectors) for the year ended 31 March 2016
88
2.1.4 Analysis of arrears of revenue
The arrears of revenue as on 31 March 2016 in some principal heads of revenue
amounted to ` 8,170.74 of which ` 1,119.91 crore were outstanding for more than five
years as detailed in Table-2.1.4 below.
Table-2.1.4: Arrears of Revenue
Head of revenue
Total Amount
outstanding as
on 31 March
2016
(` ` ` ` in crore)
Amount outstanding
for more than five
years as on 31 March
2016
(` ` ` ` in crore)
Replies of the Department
Taxes/VAT on
Sales and Trade 7,620.23 1,105.45
Recovery of ` 383.32 crore (2,146 cases) is subjudice. Recovery certificates have been issued for remaining ` 7,236.91 crore in the cases wherever required.
Taxes and
Duties
on Electricity
509.57 0.00 The Department stated that regular correspondence is being made with the Uttarakhand Power Corporation Limited.
Co-operation 15.30 11.04 Demand of recovery has been processed through the district level officer.
Stamp Duty and
Registration
Fees
19.09 0.72 Recovery of ` 8.07crore is subjudice. In rest of the cases (`11.02crore), demand for recovery has been processed.
Taxes on
Vehicles 5.69 2.07
The fifteen cases (` 0.17 crore) are subjudice. In remaining cases, recovery certificates have been issued.
State Excise 0.60 0.60 Two cases amounting to ` 0 .25 crore are subjudice. In other cases, action is being taken to recover the amount (` 0.35 crore).
Entertainment
Tax 0.26 0.03
Cases amounting to `0.02 crore are subjudice. In remaining cases, recovery certificates have been issued.
Total 8,170.74 1,119.91
Source: Concerned Departments.
2.1.5 Arrears in assessments
The details of cases pending at the beginning of the year, cases becoming due for
assessment, cases disposed of during the year and the number of cases pending for
finalisation at the end of the year as furnished by the Commercial Tax Department in
respect of Sales Tax are given in Table-2.1.5 below.
Table-2.1.5: Arrears in Assessments
Head of
revenue Opening
balance
New cases
due for
assessment
during
2015-16
Total
assessments
due
Cases
disposed of
during
2015-16
Balance
at the
end of
the year
Percentage
of disposal
(col. 5 to 4)
Taxes/VAT
on sales
and Trade
79,204 97,397 1,76,601 69,373 1,07,228 39.28
Source: Information provided by the Commercial Tax Department.

Chapter-II: Revenue Sector
89
With the number of new cases exceeding the number of cases disposed of during the
year, the Department needs to intensify its efforts for early disposal of assessment cases
to prevent accumulation of cases.
2.1.6 Evasion of tax detected by the Commercial Tax Department
The details of cases of evasion of tax detected by the Commercial Tax Department, cases
finalised and the demands for additional tax raised in 2015-16 as reported by the
Department are given in Table-2.1.6 below.
Table-2.1.6: Evasion of Tax (` ` ` ` in crore)
Head of
revenue
Cases
pending
as on 31
March
2015
Cases
detected
during
2015-16
Total
Number of cases in
which assessment/
investigation completed
and additional demand
with penalty raised
Number of
cases
pending for
finalization
as on 31
March
2016
Number
of cases
Amount of
demand
Taxes/VAT on
sales and
Trade
195 1,263 1,458 1,115 152.17 343
Entertainment
Tax 140 181 321 199 0.08 122
The amount of recovery made against the demands raised was not intimated by the
Department (December 2016).
2.1.7 Refund cases
The number of refund cases pending at the beginning of the year 2015-16, claims
received during the year, refunds allowed during the year and the cases pending at the
close of the year 2015-16, as reported by the Commercial Tax Department, are given in
Table-2.1.7 below.
Table-2.1.7: Details of Refund Cases (` ` ` ` in crore)
Particulars Sales tax / VAT
No. of cases Amount
Claims outstanding at the beginning of the
year 682 22.92
Claims received during the year 7,790 62.17
Refunds made during the year 7,735 61.73
Balance outstanding at the end of year 737 23.36 Source: Departmental figure.

Audit Report (Social, General, Revenue and Economic Sectors) for the year ended 31 March 2016
90
Section 36 (3) of Uttarakhand VAT Act, 2005, provides for payment of simple rate of
interest of nine per cent per annum if the refund is made after two month. To avoid
interest liability, it is recommended that the State Government ensures disposal of refund
claims in time.
2.1.8 Response of the Departments towards audit
The Accountant General (Audit), Uttarakhand, conducts periodical inspection of
Government departments to test-check the transactions and verify the maintenance of
important accounts and other records as prescribed in the applicable rules and procedures.
These inspections are followed up with Inspection Reports (IRs) incorporating
irregularities detected during the inspection and not settled on the spot which are issued
to the Heads of the Offices inspected with copies to the next higher authorities for taking
prompt corrective action. The Heads of the Offices are required to promptly comply with
the observations contained in the IRs, rectify the defects and omissions and report
compliance through initial reply to the Accountant General within four weeks from the
date of receipts of the IRs. Serious irregularities are reported to the Heads of the
Department and the Government.
Of Inspection Reports issued upto June 2016, there were 2,150 paragraphs involving
` 264.99 crore relating to 977 IRs that remained outstanding at the end of June 2016 as
mentioned in Table-2.1.8 below along with the corresponding figures for the preceding
two years.
Table-2.1.8: Details of Pending Inspection Reports
Details of IRs June 2014 June 2015 June 2016
Number of IRs pending for settlement 891 922 977
Number of outstanding audit paragraphs 1,944 1,985 2,150
Amount of revenue involved (`̀̀̀ in crore) 173.54 188.66 264.99
2.1.8.1 The department-wise details of IRs and outstanding audit observations as on
30 June 2016 and the amounts involved are mentioned in Table-2.1.9 below.
Table-2.1.9: Department-wise Details of Inspection Reports
Name of the
Department Nature of receipts
Numbers of
outstanding IRs
Numbers of
outstanding audit
observations
Money value
involved
(`in crore)
Finance
Taxes on Sales, Trade and luxury tax
486 1,290 145.34
Entertainment 10 15 0.09 Excise State Excise 76 125 89.71 Transport Taxes on motor vehicles 103 251 17.76 Stamp and
Registration
Stamp and registration fees 302 469 12.09
Total 977 2,150 264.99
This large pendency of the IRs due to non-receipt of the replies is indicative of the fact
that the Heads of Offices and the Departments did not initiate necessary action to rectify

Chapter-II: Revenue Sector
91
the defects, omissions and irregularities pointed out in the IRs by the Accountant
General.
The Government may consider putting in place an effective system for ensuring prompt
and appropriate responses to the outstanding audit observations.
2.1.8.2 Departmental audit committee meetings
The Government sets up audit committees to monitor and expedite the progress of the
settlement of the IRs and of the paragraphs in the IRs. During the year 2015-16, only one
departmental audit committee meeting relating to entertainment tax was held where nine
paragraphs involving an amount of ` 10 lakh were settled.
In view of the large number of pending IRs and audit paragraphs, the Government may
consider instructing all departments to regularly hold meetings of the audit committees,
in consultation with the Accountant General, to expedite their settlement.
2.1.8.3 Response of the Departments/Government to the draft audit paragraphs
The draft audit paragraphs proposed for inclusion in the Report of the Comptroller and
Auditor General of India are forwarded by the Accountant General to the Principal
Secretaries/ Secretaries of the concerned Departments drawing their attention to the audit
findings and requesting them to send their response within six weeks.
One2 Performance Audit and six draft paragraphs were sent to the Principal Secretaries/
Secretaries of the respective Departments between February 2016 and September 2016.
Government's reply to the performance audit and two draft paragraphs have been
received and suitably incorporated in the report.
2.1.8.4 Follow up on the Audit Reports-summarized position
The Public Accounts Committee (PAC) notified in December 2002 that after the
presentation of the Report of the Comptroller and Auditor General of India in the
Legislative Assembly, the Departments shall initiate action on the audit paragraphs and
the action taken notes thereon should be submitted by the Government within three
months of tabling of the Report for consideration of the Committee. Inspite of these
provisions, the action taken notes on audit paragraphs of the Reports were being delayed
inordinately. Twenty seven paragraphs included in the Audit Reports for the years
2009-10 to 2014-15 were placed before the State Legislative Assembly between 2010 and
2016. The action taken notes from the concerned departments on these paragraphs were
received late with an average delay of 30 months in respect of each of these Audit
2 Performance Audit on “Levy and Collection of Stamp Duty and Registration Fee”.

Audit Report (Social, General, Revenue and Economic Sectors) for the year ended 31 March 2016
92
Reports. Action taken notes in respect of nine paragraphs from four departments had not
been received relating to the Audit Reports for the year ended 31 March 2015 so far
(December 2016). The Audit Report for the year 2014-15 was placed before the
Legislative Assembly on 17 November 2016 and action taken explanatory notes are not
due yet (December 2016).
The PAC discussed five selected paragraphs pertaining to the Audit Reports for the years
from 2008 to 2013. However, ATNs have not been received in respect of one
recommendation of the PAC relating to the performance audit of ‘Computerisation in the
Motor Vehicles Department’ included in the Report for the year 2010-11.
2.1.9 Analysis of the mechanism for dealing with the issues raised by Audit
To analyze the system of addressing issues highlighted in the Inspection Reports/ Audit
Reports by the Government, the action taken on the paragraphs included in the Audit
Reports of the last five years for Commercial Tax Department was evaluated and
included in this Audit Report.
The summarised position of Inspection Reports relating to the Commercial Tax
Department issued during the last five years, paragraphs included in these reports, and
their status as on 31 March 2016 are tabulated in Table-2.1.10 below.
Table-2.1.10: Position of Inspection Reports
(` in crore)
Year
Opening Balance Addition during the year Clearance during the year Closing balance
IRs Para-
graphs
Money
value IRs
Para-
graphs
Money
value IRs
Para-
graphs
Money
value IRs
Para-
graphs
Money
value
2011-12 360 877 138.68 54 192 8.56 12 46 65.94 402 1,023 81.30
2012-13 402 1,023 81.30 37 151 23.79 27 78 11.20 412 1,096 93.89
2013-14 412 1,096 93.89 35 140 21.26 36 156 10.38 411 1,080 104.77
2014-15 411 1,080 104.77 44 135 8.83 17 100 13.12 438 1,115 100.48
2015-16 438 1,115 100.48 46 199 42.23 06 59 2.06 478 1,255 140.65
The Government arranges ad-hoc Committee meetings between the Department and the
Accountant’s General office to settle the old paragraphs. As against 360 IRs with
877 outstanding paragraphs at the beginning of 2011-12, the number of outstanding IRs
rose to 478 with 1,255 paragraphs at the end of 2015-16 while only 439 paragraphs were
cleared during the period 2011-12 to 2015-16.
2.1.10 Action taken on the recommendations accepted by the Departments /
Government
Performance audits conducted by the Accountant General are forwarded to the concerned
Department/Government for their information with a request to furnish their replies.

Chapter-II: Revenue Sector
93
These are also discussed in an exit conference and the Department's/ Government's views
are included while finalizing the performance audits for the Audit Reports.
Four performance audits on Commercial Tax Department, one on Transport Department
and one on Minor Minerals featured in the last six years’ Audit Reports. A total of
35 recommendations had been made to the Government for consideration in light of the
audit findings. The details of ATNs on the recommendations are given in Table-2.1.11
below.
Table-2.1.11: Action Taken on Recommendations accepted by Government
Year of Audit
Report Name of PA
Number of
Recommendation Status
2008-09
Taxation on Transactions in the course of Inter-State Trade or commerce under Central Sales Tax Act, 1956 (PA)
05 ATN received on 19.09.2013. Pending for discussion
2009-10 Transition from Sales Tax to VAT (PA)
08 ATN received on 07.08.2014. Pending for discussion
2010-11 Cross Verification of Declaration Forms in Inter State Trade and Commerce (PA)
08 ATN received on 30.10.2013. Pending for discussion
2011-12 Administration of VAT (PA) 07 ATN not received
2013-14 Levy and collection of Taxes on Motor Vehicles Tax
03 ATN not received
Receipt of Minor Minerals 02
2014-15 Pendency of cases in the Revenue Department
02 ATN not received
2.1.11 Audit Planning
During the year 2015-16, there were 227 auditable units of which 113 units were planned
for audit and 111 units were audited.
Besides the compliance audit mentioned above, one performance audit on “Levy and
Collection of Stamp Duty and Registration Fee” was also taken up to examine the
efficiency of administration of Stamp Duty and Registration Fee by the Inspector General
(Registration).
2.1.12 Results of audit
Position of local audit conducted during the year
Test-check of the records of 111 units of the Department of Commercial Tax, State
Excise, Motor Vehicles, Stamp and Registration and Entertainment Tax conducted during
the year 2015-16 revealed under assessment/short levy / loss of revenue and other
irregularities involving ` 234.10 crore in 266 paragraphs as categorized in Table-2.1.12
below.

Audit Report (Social, General, Revenue and Economic Sectors) for the year ended 31 March 2016
94
Table-2.1.12: Category-wise Audit observations
Sl.
No. Categories No. of paras
Amount
(`̀̀̀ in crore)
Sales Tax / Value Added Tax
1. Irregular allowance of exemption 8 4.24
2. Irregular allowance of concessional rate of tax 87 11.71
3. Other irregularities 104 26.28
Total 199 42.23
Motor Vehicle Tax
1. Miscellaneous irregularities 24 1.23
Total 24 1.23
Stamp Duty and Registration Fee and State Excise, Entertainment & luxury tax
1. Short levy of stamp duty and registration fee due to
consideration of incorrect category of locality 20 0. 63
2. Other irregularities 22 61.66
3. Performance Audit titled “Levy and Collection of Stamp Duty
and Registration Fee” 01 128.35
Total 43 190.64
Grand Total 266 234.10
During the course of the year, the concerned departments accepted under-assessment and
other deficiencies of ` 170.61 crore involved in 57 cases which were pointed out in audit
during 2015-16. The Departments collected ` 0.77 crore relating to 60 paragraphs during
2015-16. Out of this, ` 0.03 crore in 11 paragraphs pertained to the audit findings of the
current year and the rest pertained to the previous years.
2.1.13 Coverage of the Revenue Chapter
The Revenue Chapter contains one performance audit3 and three paragraphs involving
financial effect of ` 128.79 crore. The Departments have accepted audit observations
amounting to ` 123.88 crore out of which ` 0.35 crore have been recovered.
3 Levy and Collection of Stamp Duty and Registration Fee.

Chapter-II: Revenue Sector
95
PERFORMANCE AUDIT
STAMP AND REGISTRATION DEPARTMENT
2.2 Levy and Collection of Stamp Duty and Registration Fee
A performance audit of the Levy and Collection of Stamp Duty and Registration Fee for
the period 2011-16 brought out that the existing mechanism and procedure for levy and
collection of stamp duty and registration fee suffered from both systemic as well as
implementation deficiencies that resulted in non-levy or loss of revenue aggregating to
` 128.35 crore. Some of the significant findings are as follows.
� Stamp and Registration department initiated Core Registration System project in
2003 for registration of documents electronically. However, 13 out of 49 SR offices
still remained to be computerized even after lapse of 13 years.
[Paragraph 2.2.8(a)]
� Non/short levy of stamp duty and registration fees due to non-registration of
instruments which were compulsorily registerable resulted in non-levy of stamp
duty and registration fee of `̀̀̀ 108.25 crore.
[Paragraph 2.2.9]
� Under-valuation of properties while registering these documents resulted in short
levy of stamp duty of ` ` ` ` 17.20 crore.
[Paragraph 2.2.10]
� Misclassification of documents resulted in non/short levy of stamp duty and
registration fee amounting to ` ` ` ` 0.48 crore.
[Paragraph 2.2.11]
� Irregular adjustment of stamp duty paid at the time of agreement and incorrect
allowance of 50 per cent rebate on stamp duty on properties which were purchased
on auction resulted in short levy of stamp duty of ` ` ` ` 0.89 crore.
[Paragraph 2.2.12]
� Non/short stamping of documents on various counts such as acceptance of bank
guarantees by government offices, execution of lease deeds for the period less than
one year, auctioning of properties mortgaged to banks without registration and
reduction of stamp duty in the case of non-eligible family members resulted in loss
of revenue of `̀̀̀ 1.16 crore.
[Paragraph 2.2.13]
2.2.1 Introduction
Levy of stamp duty, other than duties or fees collected by means of judicial stamps, is
included in the Concurrent List of the Seventh Schedule of the Constitution of India.
Therefore, Stamp Duty is governed by the legislations of both the Government of India
(GoI) as well as the State Government. Stamp duty is a tax which is paid by the executor

Audit Report (Social, General, Revenue and Economic Sectors) for the year ended 31 March 2016
96
of an instrument4 either by using impressed stamp paper or by affixing stamps of proper
denominations as per the rates specified in Schedules I, I-A and I-B of ‘The Indian Stamp
Act, 1899’ (IS Act) and the rules framed there under as applicable in the State. Every
person, in charge of a public office, before whom any such chargeable instrument is
produced, has a duty to impound the instrument and refer the matter to the District
Collector, if he is of the opinion that it is not duly stamped. Besides, Registration Fee is
also to be paid in respect of those instruments which are registered with the Registering
Authority under ‘The Indian Registration Act, 1908’.
In Uttarakhand, the Finance Department is responsible for the levy and collection of
Stamp Duty and Registration Fee in the State through the Office of the Inspector General
(Registration).
2.2.2 Organizational setup
The organizational set up of the Department is given in Chart-2.2.1 below.
Chart-2.2.1: Organizational set up of the Department
2.2.3 Audit Objectives
The performance audit was taken up with a view to ascertaining whether:
� the levy and collection of Stamp Duty and Registration Fees was in accordance with
the provisions of the Acts and Rules applicable;
� a suitable internal control mechanism existed in the Department for ensuring
compliance with laws, regulations and policies; and
� information technology resources employed for the purpose of registration of
instruments ensured error free registration with no loss of revenue.
4 Instrument includes every document and record by which any right or liability is, or purports to be,
created; transferred; limited; extended; extinguished or recorded.

Chapter-II: Revenue Sector
97
2.2.4 Scope of audit and methodology
The performance audit covering the period of 2011-12 to 2015-16 was conducted
(April 2016 to August 2016) through test-check of records of the offices of
30 Sub-Registrars (28 Sub-Registrars5 located in seven districts6 from amongst the
13 districts in the State and two Sub Registrars (SR) of Pithoragarh and Didihat selected
on the recommendations of the department during Entry Conference). An Entry
Conference was held on 18th April 2016 with the Secretary Finance and other
departmental officers wherein the audit objectives and the scope of audit were discussed.
An Exit Conference was held on 29 November 2016 where the audit findings were
discussed. The response of the Government has been suitably included in the Report.
2.2.5 Audit Criteria
The audit criteria were derived from the following sources:
� Indian Stamp Act (IS Act) 1899;
� Indian Registration Act (IR Act) 1908;
� The Uttar Pradesh Stamp (Valuation of Property) Rules, 1997 (as applicable in
Uttarakhand); and
� Other relevant Acts, Rules, and Government orders as applicable in the territory of
the State. [
2.2.6 Trend of Receipts
Receipts from Stamp Duty and Registration Fees are the third largest source of revenue
for the State Government after Commercial Tax and State Excise. The budget estimates
and actual receipts under the Head 0030-Stamps and Registration Fees-Receipts from
Non-Judicial Stamps are depicted in Chart-2.2.2 below.
5 SR-I, II,III & IV Dehradun, SR-I&II Vikasnagar, SR Rishikesh, SR-I&II Haridwar, SR-I,II and III
Roorkee, SR Laksar, SR Rudraprayag, SR Ukhimath, SR Kashipur, SR Jaspur, SR Bazpur, SR Rudrapur, SR Kichha, SR Sitarganj, SR Nainital, SR-I and II Haldwani, SR Ramnagar, SR Dhari, SR Tehri and SR Pauri.
6 Dehradun, Haridwar, Rudraprayag, Udham Singh Nagar, Pauri, Tehri and Nainital.
483.85 573.95 640.40
708.79 777.22
524.05 648.40 686.71 714.06
870.67
0
200
400
600
800
1000
2011-12 2012-2013 2013-2014 2014-2015 2015-2016
Chart-2.2.2: Budget Estimate and Actual Receipts
Budget Estimates Actual Receipts Linear (Budget Estimates)
(`(`(`(` in crore)
Audit Report (Social, General, Revenue and Economic Sectors) for the year ended 31 March 2016
98
The receipt from Stamp Duty and Registration Fees rose from ` 524.05 crore in 2011-12
to ` 870.67 crore at the end of 2015-16. During this period, the actual revenue collection
out-performed the targets set for every year and recorded a sizeable growth of 66 per cent
in revenue collection during the period of performance audit.
Audit Findings
Systemic Deficiencies
2.2.7 Non-compliance of provisions of Acts, Rules and instructions
(i) Section 154 (4) (3) (b) of the UP Zamindari Abolition and Land Reforms Act, 1950
(as applicable in Uttarakhand), provides that a non-tenure holder, who has purchased land
under Sections 154 (4) (2) (e), 154 (4) (2) (f) and 154 (4) (3) of the Act, shall put the land
to specified use within a period of two years or further such period as may be allowed by
the Government. If he fails to do so, such transfer shall be void and the matter will be
referred to the Collector for this purpose. Scrutiny of records of two SRs7 revealed that in
three8 cases, 0.28 hectares industrial land was purchased (2006) and the same was not put
to use within the prescribed period of two years. The land was further sold (2015) after
eight years of original purchase. However, the transfer deeds did not have any reference
whether permission had been granted for holding the land for period exceeding two years
or not. However, the SRs failed to refer the cases to the Collector for further action.
(ii) Section 145 of the Uttarakhand (Uttar Pradesh) Zamindari Abolishment and Land
Reform Act, 1950, provides that a copy of declaration certificate under Sections 143 (use
of agriculture land for industrial or residential purpose) and 144 (use of
non-agriculture land for agriculture purpose) shall be sent to the concerned SRs by the
Assistant Collector in charge of the Sub Division. The SR should register it without any
fee and declaration certificate should be sent to the Assistant Collector. Audit observed in
the selected SR offices that the declaration certificates were not being sent to SR offices
under the above provisions. Therefore, the SRs had not registered these certificates which
could help them in calculating proper Stamp Duty on the properties situated nearby by
dividing them on the lines of non-agriculture or agriculture properties on the basis of such
declaration certificates.
(iii) Section 89 of the IR Act makes it mandatory for some officers9 to send copies of
certain orders, certificates and instruments to registering officers to file in their records.
Scrutiny of records of the selected SRs revealed that copies of sale certificate of
7 SR-II, Roorkee, SR-I, Vikasnagar. 8 Book No./Jild No./Deed No./Date of registration: 01/307/538/04.02.15, 01/306/521/04.02.15 &
01/3667/3769/16.06.15. 9 Officers approving loans under Land Improvement Loans Act, 1883, every court issuing certificate of
sales of immovable property, every officer approving loans under Agriculturist Loans Act, 1884 and every revenue officer granting a certificate of sale to the purchaser.

Chapter-II: Revenue Sector
99
immovable properties under the Code of Civil Procedure and copy of sale certificate of
properties auctioned by revenue officers were not being submitted to the SR offices. This
defeated the very objective of detecting loss of revenue of stamp duty and registration fee
on these instruments.
(iv) Instructions of the Inspector General of Registration (Letter no. 26/IGR/complaint -
21/2010 dated 08.04.2010) made mandatory, the submission of approved copy of maps in
ammonia print for executing sale deeds of buildings situated in urban areas so that
evasion of stamp duty could be detected. SRs had to ensure that copies of maps certified
by the competent authorities have been attached with the sale deed of buildings. Scrutiny
of records of the selected SRs revealed that the approved map (in ammonia print) was not
being attached in sale deeds of buildings situated in urban areas as required under the
above instructions.
Thus, non-adherence to the extant provisions of the Acts and the rules and instructions
issued thereunder by the revenue authorities undermined the objective of these provisions
of detecting and preventing leakage of government revenue.
The Government instructed (November 2016) the revenue officers to ascertain the factual
position and asked the IG Registration to issue necessary guidelines in this regard.
2.2.8 Implementation of Core Registration System
Stamp and Registration Department initiated Core Registration System (CRS) project in
2003 for electronic registration of documents. It is an intranet based module aimed at
removing the flaws inherent in the manual maintenance of registration records, making
the registration process easier and improving maintenance of registration records as well
as access to registration records.
(a) Partial Coverage
During the examination of CRS and e-registration, it was noticed that the use of software
for electronic valuation purpose was not in vogue. The computerization of registration
system was still limited to instruments currently being registered and the legacy data has
not been digitized. As a result, a large number of old registries were being distributed
manually defeating the basic objective of the scheme of providing online information to
the public.
Further, 13 of the total of 49 SR offices still remained to be computerized. Manual
registration process is going on in these offices because of non-availability of state wide
area network (SWAN) or Internet connectivity.
The Government assured (November 2016) that the remaining offices would be
computerized by December 2016.

Audit Report (Social, General, Revenue and Economic Sectors) for the year ended 31 March 2016
100
(b) Inadequacies of the software
The following deficiencies were noticed in the CRS:
� There was no provision to link the previous registries of a property in the application
software.
� The software did not have mandatory provision to capture the e-stamp code number
in public data entry form. Consequently, database did not contain e-stamps’ code
details which could enable instant locking of the e-stamp. It was noticed in SR Jaspur
that delay in locking of e-stamps ranged between four and 38 days.
� There was no mechanism to show the details of e-stamps pending for locking process.
Absence of a simultaneous locking mechanism makes the system highly vulnerable to
the possibility of misuse of the e-stamps.
� Stamp Duty for lease deeds and declaration of trust is being calculated manually.
There is no provision for computerizing this feature in the existing software.
� The software was not able to apply proper rates for the purpose of calculating stamp
duty on transfer of lease deeds, bonds, power of attorney, exchange of property,
mortgage deeds without possession, partition deeds, gift deeds and transfer of
property to co-owners of family relationship.
� Proper evaluation of agriculture land, commercial constructions, exchange of
property and industrial properties could not be accomplished by using the software.
� Rebate of 50 per cent in stamp duty on consideration price in excess of the valuation
of property as per circle rate was abolished from 14 September 2015. However, the
option to avail this rebate was still available in the software package as on the date of
audit (July 2016).
� In mortgage deed for agriculture purpose, there is no provision in the software for
calculating stamp duty @ 0.5 per cent or maximum ` 10,000 in excess of ` 5 lakh.
However, stamp duty is being depicted as zero in every case whereas the stamp duty
is exempt only up to ` 5 lakh.
The Government informed (November 2016) that some of the observed shortcomings in
the software had already been corrected and the remaining ones would be removed by
December 2016.
(c) Access controls
During the audit of selected SRs, it was noticed that administrative work was being done
by officials below the rank of Sub Registrar. This was indicative of weak organizational
controls and could have repercussions with regard to confidentiality of data. Though the
software had in-built features for user authentication through access passwords but
control procedures like restriction on number of unsuccessful login attempts, routine
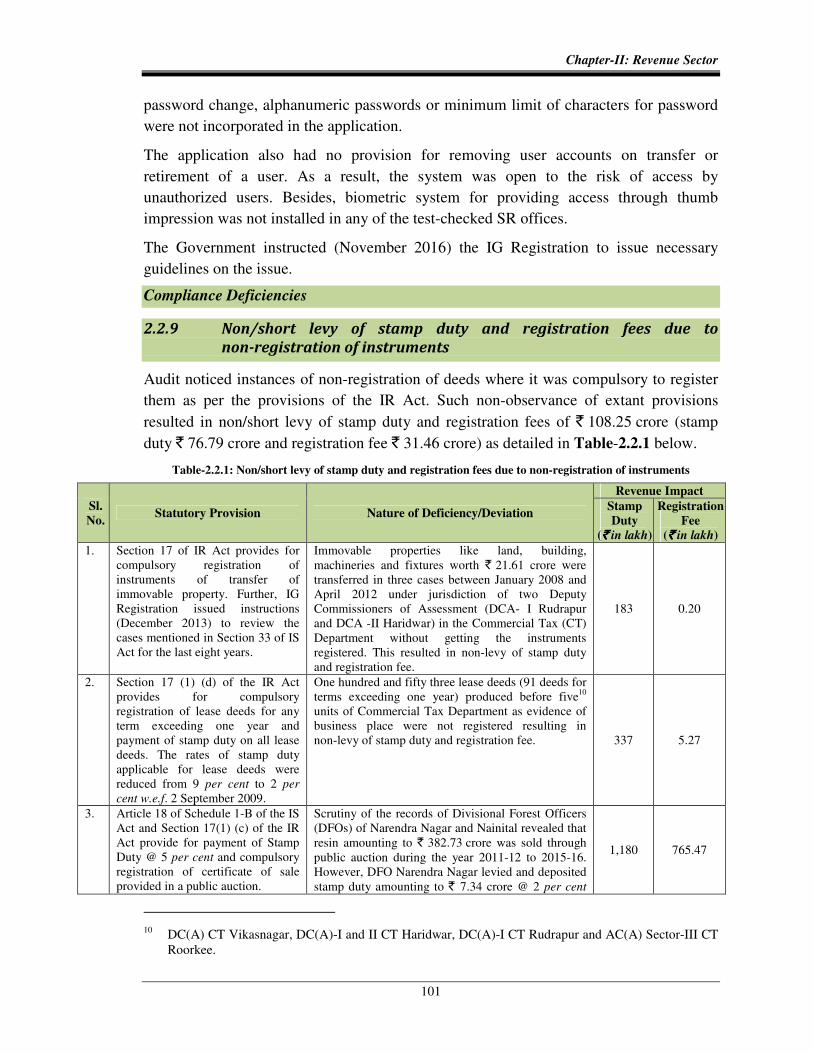
Chapter-II: Revenue Sector
101
password change, alphanumeric passwords or minimum limit of characters for password
were not incorporated in the application.
The application also had no provision for removing user accounts on transfer or
retirement of a user. As a result, the system was open to the risk of access by
unauthorized users. Besides, biometric system for providing access through thumb
impression was not installed in any of the test-checked SR offices.
The Government instructed (November 2016) the IG Registration to issue necessary
guidelines on the issue.
Compliance Deficiencies
2.2.9 Non/short levy of stamp duty and registration fees due to
non-registration of instruments
Audit noticed instances of non-registration of deeds where it was compulsory to register
them as per the provisions of the IR Act. Such non-observance of extant provisions
resulted in non/short levy of stamp duty and registration fees of ` 108.25 crore (stamp
duty ` 76.79 crore and registration fee ` 31.46 crore) as detailed in Table-2.2.1 below.
Table-2.2.1: Non/short levy of stamp duty and registration fees due to non-registration of instruments
Sl.
No. Statutory Provision Nature of Deficiency/Deviation
Revenue Impact
Stamp
Duty
(`̀̀̀ in lakh)
Registration
Fee
(`̀̀̀ in lakh)
1. Section 17 of IR Act provides for compulsory registration of instruments of transfer of immovable property. Further, IG Registration issued instructions (December 2013) to review the cases mentioned in Section 33 of IS Act for the last eight years.
Immovable properties like land, building, machineries and fixtures worth ` 21.61 crore were transferred in three cases between January 2008 and April 2012 under jurisdiction of two Deputy Commissioners of Assessment (DCA- I Rudrapur and DCA -II Haridwar) in the Commercial Tax (CT) Department without getting the instruments registered. This resulted in non-levy of stamp duty and registration fee.
183 0.20
2. Section 17 (1) (d) of the IR Act provides for compulsory registration of lease deeds for any term exceeding one year and payment of stamp duty on all lease deeds. The rates of stamp duty applicable for lease deeds were reduced from 9 per cent to 2 per
cent w.e.f. 2 September 2009.
One hundred and fifty three lease deeds (91 deeds for terms exceeding one year) produced before five10 units of Commercial Tax Department as evidence of business place were not registered resulting in non-levy of stamp duty and registration fee. 337 5.27
3. Article 18 of Schedule 1-B of the IS Act and Section 17(1) (c) of the IR Act provide for payment of Stamp Duty @ 5 per cent and compulsory registration of certificate of sale provided in a public auction.
Scrutiny of the records of Divisional Forest Officers (DFOs) of Narendra Nagar and Nainital revealed that resin amounting to ` 382.73 crore was sold through public auction during the year 2011-12 to 2015-16. However, DFO Narendra Nagar levied and deposited stamp duty amounting to ` 7.34 crore @ 2 per cent
1,180 765.47
10 DC(A) CT Vikasnagar, DC(A)-I and II CT Haridwar, DC(A)-I CT Rudrapur and AC(A) Sector-III CT
Roorkee.

Audit Report (Social, General, Revenue and Economic Sectors) for the year ended 31 March 2016
102
Stamp Duty & Registration Fees is to be levied and collected by the Forest Department and the same is required to be deposited in the Treasury.
on sale of resin amounting to ` 367.03 crore only and stamp duty and registration fee on sale of resin amounting to ` 15.70 crore was not charged despite the fact that stamp duty @ 5 per cent and registration fee @ 2 per cent were leviable on the same. This resulted in short levy of stamp duty and registration fee.
4. Timber amounting to ` 1,186.07 crore was sold by the Uttarakhand Forest Development Corporation through public auction during the years 2011-12 to 2014-15 without levying stamp duty and registration fees while stamp duty @ 5 per cent and registration fee @ 2 per cent were leviable on the same. This resulted in non-levy of stamp duty and registration fee.
5,930 2,372.15
5. Article 35 (a- i &ii) of Schedule 1B of the IS Act and Section 17 (1) (d) of IR Act provides for payment of Stamp Duty on lease for a term not exceeding one year and on those for a term exceeding one year but not exceeding five years and registration of these deeds.
Nine sub-leases11 were executed between the Garhwal Mandal Vikas Nigam (GMVN)/ Kumaon Mandal Vikas Nigam (KMVN) and the lessees. Applicable stamp duty and registration fee on these instruments were not charged.
19 0.30
6. Article 35 of Schedule 1B of the IS Act and Section 17 (1) (d) of IR Act provides for payment of stamp duty on leases for terms exceeding one year and up to 30 years and compulsory registration of such leases.
Forty five leases were executed by six12 organizations during April 2011 to March 2016 on which stamp duty of ` 0.31crore was leviable against which ` 0.08 lakh was levied. These leases were also not registered in the offices of the concerned SRs despite the fact that the said documents were compulsorily registerable.
30.47 2.55
7. Total 7,679.47 3,145.94
The Government accepted (November 2016) the audit observations and assured that
necessary instructions in this regard will be circulated.
2.2.10 Short levy of stamp duty due to undervaluation of properties
Stamp duty is levied on value of the consideration of such conveyance or the market
value of the immovable property whichever is greater. Audit noticed that under-valuation
of a variety of immovable properties resulted in short levy of stamp duty of ` 17.20 crore
as detailed in Table-2.2.2 below.
Table-2.2.2: Short levy of stamp duty due to undervaluation of properties
Sl.
No. Statutory Provision or Policy Involved Nature of Deficiency/Deviation
Short Levy
(`̀̀̀ in crore)
1. Article 23 of Schedule 1B of the IS Act and circle rates issued by the District Magistrates (DMs) provides for payment of stamp duty on
One hundred and ninety seven properties transferred through instruments executed before 27 Sub Registrars were registered
5.03
11 Term not exceeding one year: GMVN-04, KMVN-02; Term exceeding one year but not exceeding
five years: GMVN- 02, KMVN-01. 12 GMVN: 12, Uttarakhand Transport Corporation: 08, Mussoorie Dehradun Development Authority:
01,Nagar Nigam Haldwani: 02, Tourism Department Dehradun: 02: and District Mining Officer Dehradun: 20.

Chapter-II: Revenue Sector
103
value of the consideration of a conveyance or the market value of the immovable property, whichever is higher.
on the consideration amount instead of value of the properties based on circle rates. This resulted in short levy of stamp duty.
2. Najul Policy, 2009 stipulates that stamp duty would be determined on the basis of the estimated value which would not be less than the circle rates effective on the date of application for change of Najul land into free hold.
Fifteen Najul properties under jurisdiction of three13 SRs were under-valued for the purpose of free hold due to non-application of circle rates applicable on the date of application. This under-valuation of property resulted in short levy of stamp duty.
0.57
3. Under the provisions of Article 35 (a- i &ii) of Schedule 1B of IS Act, stamp duty on lease for a term not exceeding one year and on those for a term exceeding one year but not exceeding five years is chargeable @ two per cent. In the case of mining lease, stamp duty is payable on consideration value of dead rent or royalty whichever is higher.
Mining policy, 2013 stipulates that the lease amount is required to be increased @ 25 per
cent annually.
In 16 cases, the lease amount had not been increased @ 25 per cent annually by 5 SRs, two District Mining Officers and the Garhwal Mandal Vikas Nigam. This affected the amount of consideration value for the purpose of levying stamp duty resulting in short levy of stamp duty.
0.38
4. Provisions of Article 35 (c )(ii) of Schedule I-B of the IS Act stipulates that stamp duty on lease for a term exceeding 30 years is chargeable @ five per cent of the market value. Circle rates issued by DMs made it clear that the value declared by the Government authorities, including State Industrial Development Corporation of Uttarakhand Ltd. (SIDCUL) would be accepted as market value but such value should not be less than the rates which were determined by them and effective on the date of such execution.
In four SRs, SIDCUL granted lease in 27 cases for the period of 90 years. However, valuation of property leased was less than the rate of premium effective on the date of execution of such lease by SIDCUL. Stamp duty of ` 10.31 crore only was levied against the leviable stamp duty ` 21.48 crore. This resulted in short levy of stamp duty.
11.17
5. Article 35 of Schedule 1B of the IS Act stipulates that when a lessee undertakes to pay recurring charges such as Government revenue, the landlord’s share of cesses or the owner’s share of municipal rates or taxes, which by law, is recoverable from the lessor, the amount so agreed to be paid by the lessee shall be deemed to be part of the rent and would be chargeable for the purpose of Stamp Duty.
In nine lease deeds under five14 SRs, it was mentioned that the service tax would be paid by the lessee. Thus, service tax was to be deemed to be part of the rent and Stamp Duty was payable on whole amount of rent including service tax. However, audit found that service tax was not taken into consideration for the purpose of stamp duty resulting in its short levy.
0.05
6. Total 17.20
The Government instructed (November 2016) the departmental authorities to take necessary corrective measure and refer the cases where necessary to the concerned District Magistrates.
13 SR Ramnagar, SR-I & II Haldwani. 14 SR Pithoragarh: 01 case (01/900/491 dt. 18.06.14); SR-I Haldwani: 05 cases (01/2186/2926 dt.
15.03.15, 01/2234/4589 dt. 23.07.15, 01/2305/7257 dt. 09.11.15, 01/2039/5573 dt. 27.08.14 and 01/2039/5572 dt. 27.08.14); SR Rudrapur: 01 case (01/45/1131 dt. 16.04.15), SR-II Roorkee: 01 case (01/1854/4580 dt. 22.05.13) and SR Bajpur: 01 case (01/2192/6654 dt. 19.09.15).

Audit Report (Social, General, Revenue and Economic Sectors) for the year ended 31 March 2016
104
2.2.11 Non/short levy of stamp duty and registration fee due to
misclassification of documents
Any instrument can be charged with correct rate of stamp duty only if it is classified as
per the provisions of the IS Act and the IR Act. Scrutiny of records of selected SRs
revealed that the Government had lost revenue of ` 0.48 crore (Stamp Duty: ` 0.46 crore
and Registration Fee: ` 0.02 crore) due to improper classification of the instruments and
application of incorrect rates as detailed in Table-2.2.3 below.
Table-2.2.3: Non/short levy of stamp duty and registration fee due to misclassification of documents
Sl.
No. Statutory Provision Nature of Deficiency/Deviation
Revenue Impact
(`̀̀̀ in lakh)
Stamp
Duty
Registration
Fee
1. Article 48(e) of Schedule 1-B of the IS Act stipulates that when an attorney is given for consideration and authorizing the attorney to sell any immovable property and chargeable during conferring of the power of attorney as on conveyance under Article 23 (a) of the Schedule 1-B.
In seven cases under five SRs, the properties were sold on the basis of Power of Attorneys and consideration was received by the attorney holder. Hence, stamp duty chargeable at the prescribed rate of five per cent whereas the stamp duty and registration fee was paid @ ` 50/` 100 in each case. This resulted in short levy of stamp duty and Registration Fee.
21.42 0.67
2. Article 34-A of Schedule 1-B of the IS Act stipulates that correcting a purely clerical error in an instrument will be chargeable by Stamp Duty of ` 10.
Eleven instruments under six SRs involving change of description of property were classified as correction instruments. However, the provision will not be applicable in these cases as there were changes in description of properties adjoining property details and area which should have been charged for stamp duty treating them as new instruments. This resulted in short levy of stamp duty and registration fee.
6.72 1.09
3. Article 55 of Schedule 1-B of the IS Act stipulates that any instrument of release, by which a person renounces a claim upon another person or against any specified property, shall be chargeable by Stamp Duty not exceeding ` 210. However, a releaser can neither vest his title on another person through release nor should such release increase extent of title of another title holder.
Four release deeds were registered under two SRs, involving increase in extent of title of another title holder. Hence, the deeds did not fall under the category of releases and should actually have been charged like a transfer deed for the purpose of levy of Stamp Duty and Registration Fee. This resulted in short levy of stamp duty and registration fee.
12.71 0.098
4. Article 5 (b-2) of Schedule 1-B of IS Act stipulates that a construction developed by a person other than the owner or lessee of such land and having a stipulation that such construction would be held or sold jointly or severally by that other person and the owner or lessee, would be chargeable @ six per cent of value of the consideration equal to the amount or value of the land.
A lessee, under jurisdiction of SR Ramnagar, constructed a resort on a land leased by him in February 2011 for 30 years. The lease was cancelled (September 2014) with no dues pending on any party. Subsequently, the property was sold (November 2014) and the earlier lessee was involved in the sale deed as a seller (middle party – Madhya Paksha) and he received ` 2.80 crore in lieu of the constructions undertaken by him on the land.
5.28 0.00

Chapter-II: Revenue Sector
105
Thus, the lessee who become Madhya
Pakshain this sale was actually a developer and hence was liable to pay stamp duty on the value of land of ` 0.88 crore.
5. Total 46.13 1.86
The Government instructed (November 2016) the Inspector General Registration to look into the cases and take appropriate steps.
2.2.12 Irregular adjustment/rebate of stamp duty
The Indian Stamp Act allows for adjustment of stamp duty earlier paid and rebate on it
under certain conditions. However, such concessions were allowed by the Department
despite relevant conditions not being fulfilled by parties leading to loss of revenue by
way of forgoing stamp duty of ` 0.89 crore as detailed in Table-2.2.4 below.
Table-2.2.4: Irregular adjustment/rebate of stamp duty
Sl.
No. Statutory Provision and Notification Nature of Deficiency/Deviation
Revenue
Impact
(`̀̀̀ in lakh)
1 Article 5 (b-1) of Schedule 1-B of the IS Act stipulates that when conveyance in pursuance of an earlier agreement is executed, the duty already paid shall be adjusted towards the total duty payable on the conveyance.
It was observed that the Stamp Duty paid at the time of the agreement for sale was adjusted at the time of registration of sale deeds in 41 such cases by 15 SRs where the instruments differed in both the subject matter and the parties involved. Hence, incorrect adjustment of stamp duty resulted in revenue loss.
74.42
2 As per Government's notification of 25 April 2008, a rebate of 50 per cent on stamp duty payable would be allowed on the consideration value, exceeding market value of the property.
Article 18 of Schedule 1-B of the IS Act stipulates that a property by virtue of being secured by sale certificate in public auction is to be charged, for the purpose of Stamp Duty, at the rate of five per cent of purchase money.
In two cases, SR-II, Haridwar allowed registration of properties on payment of stamp duty of ` 0.27 crore by allowing rebate of 50 per cent, which was not allowable as the property was purchased in public auction on which stamp duty at the rate of five per cent was chargeable. The irregular rebate allowed resulted in short realisation of stamp duty of ` 0.15 crore.
14.55
3. Total 88.97
The Government instructed (November 2016) the Inspector General Registration to examine the cases for appropriate action.
2.2.13 Non/short stamping of documents
The Indian Stamps Act requires proper stamping of every document. Audit noticed that
documents which were required to be charged for specific amounts of stamp duty were
non/short stamped leading to loss of revenue amounting ` 1.16 crore as given in
Table-2.2.5 below.
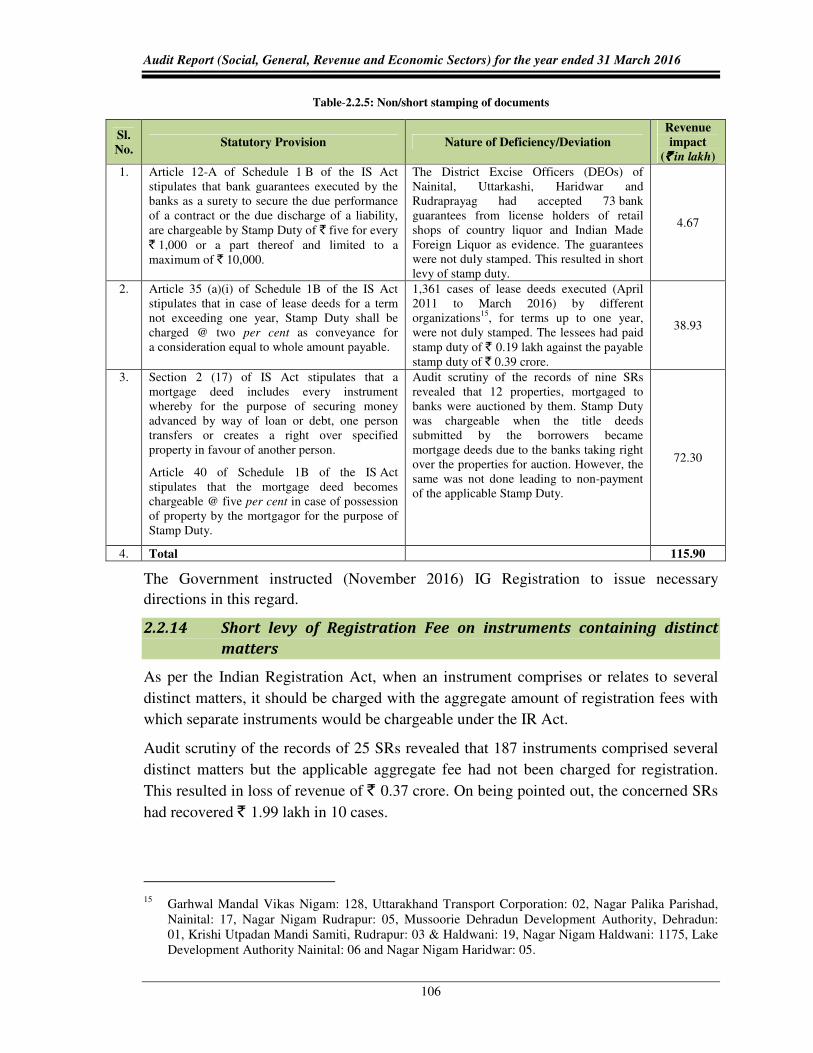
Audit Report (Social, General, Revenue and Economic Sectors) for the year ended 31 March 2016
106
Table-2.2.5: Non/short stamping of documents
Sl.
No. Statutory Provision Nature of Deficiency/Deviation
Revenue
impact
(`̀̀̀ in lakh)
1. Article 12-A of Schedule 1 B of the IS Act stipulates that bank guarantees executed by the banks as a surety to secure the due performance of a contract or the due discharge of a liability, are chargeable by Stamp Duty of ` five for every ` 1,000 or a part thereof and limited to a maximum of ` 10,000.
The District Excise Officers (DEOs) of Nainital, Uttarkashi, Haridwar and Rudraprayag had accepted 73 bank guarantees from license holders of retail shops of country liquor and Indian Made Foreign Liquor as evidence. The guarantees were not duly stamped. This resulted in short levy of stamp duty.
4.67
2. Article 35 (a)(i) of Schedule 1B of the IS Act stipulates that in case of lease deeds for a term not exceeding one year, Stamp Duty shall be charged @ two per cent as conveyance for a consideration equal to whole amount payable.
1,361 cases of lease deeds executed (April 2011 to March 2016) by different organizations15, for terms up to one year, were not duly stamped. The lessees had paid stamp duty of ` 0.19 lakh against the payable stamp duty of ` 0.39 crore.
38.93
3. Section 2 (17) of IS Act stipulates that a mortgage deed includes every instrument whereby for the purpose of securing money advanced by way of loan or debt, one person transfers or creates a right over specified property in favour of another person.
Article 40 of Schedule 1B of the IS Act stipulates that the mortgage deed becomes chargeable @ five per cent in case of possession of property by the mortgagor for the purpose of Stamp Duty.
Audit scrutiny of the records of nine SRs revealed that 12 properties, mortgaged to banks were auctioned by them. Stamp Duty was chargeable when the title deeds submitted by the borrowers became mortgage deeds due to the banks taking right over the properties for auction. However, the same was not done leading to non-payment of the applicable Stamp Duty.
72.30
4. Total 115.90
The Government instructed (November 2016) IG Registration to issue necessary
directions in this regard.
2.2.14 Short levy of Registration Fee on instruments containing distinct
matters
As per the Indian Registration Act, when an instrument comprises or relates to several
distinct matters, it should be charged with the aggregate amount of registration fees with
which separate instruments would be chargeable under the IR Act.
Audit scrutiny of the records of 25 SRs revealed that 187 instruments comprised several
distinct matters but the applicable aggregate fee had not been charged for registration.
This resulted in loss of revenue of ` 0.37 crore. On being pointed out, the concerned SRs
had recovered ` 1.99 lakh in 10 cases.
15 Garhwal Mandal Vikas Nigam: 128, Uttarakhand Transport Corporation: 02, Nagar Palika Parishad,
Nainital: 17, Nagar Nigam Rudrapur: 05, Mussoorie Dehradun Development Authority, Dehradun: 01, Krishi Utpadan Mandi Samiti, Rudrapur: 03 & Haldwani: 19, Nagar Nigam Haldwani: 1175, Lake Development Authority Nainital: 06 and Nagar Nigam Haridwar: 05.

Chapter-II: Revenue Sector
107
The Government instructed (November 2016) the IG Registration to issue guidelines for
collecting registration fees in the distinct matters.
2.2.15 Monitoring and Internal Control
Proper internal controls assist in economic, efficient and effective management of
revenues by preventing any loss or leakage of revenue. Audit observed the following:
(a) Internal audit is an effective measure of such internal controls. Audit observed that no
internal audit system was implemented and operational in the Department which could
point out the discrepancies and lacunae of the process employed in levying and collecting
Stamp Duty and Registration Fee.
(b) The Registration Manual stipulates that each SR office should be inspected twice a
year by the Assistant Inspectors General (AIsG) who are responsible for ensuring proper
compliance of provisions of all the acts and rules in every SR office. During scrutiny of
the records of AIsG of Dehradun, Haridwar, Rudrapur and Haldwani, it was found that
there was 80 per cent shortfall in inspections by the AIGs during 2011-12 to 2015-16.
Only 59 inspections were carried out against the required number of 300 by the said
AIGs in the period.
(c) As per Rule 327 of the Uttar Pradesh Stamp Rules, 1942, as applicable in
Uttarakhand, AIsG shall make periodical inspections every year of the stamp work of all
the civil courts and offices, all the revenue courts and offices, all the offices of municipal
and district boards and other local bodies, the work of stamp vendors, stamp accounts of
treasuries and sub-treasuries, all other Government offices of all descriptions and all the
registration offices of the State. Scrutiny of the records of the offices of four AIsG16
revealed that not even a single office was inspected by AIsG during 2011-16.
(d) As per Government instructions17, targets of 5, 10 and 25 spot verifications every
month were decided for being conducted by District Magistrates (DMs), Additional
District Magistrates (ADMs) and AIsG respectively. In Dehradun District, only 12 spot
verifications were carried out by the officers during July 2012 to March 2016 against the
required number of 1,80018 and in the remaining four districts, against the targeted
7,200 spot verifications, no spot verification was conducted. The utility of spot
verifications can be gauged from the fact that 12 spot verification conducted by ADM
(Revenue and Finance) Dehradun in the year 2015-16 resulted in detection of loss of
stamp duty to the tune of ` 0.20 crore. Thus, there was huge potential for mitigating the
risk of under-valuing stamp duty through spot verification.
16 AIG Dehradun, Haridwar, Udham Singh Nagar and Nainital. 17 No. 380/XXVII(9)/2012/stamp-34/2012dated 29.06.2012. 18 480 (Total spot verification 40 per month x 12) x 3.75 (3 years and 9 months i.e. from date of Govt.
instructions (29.06.2012): say 1st July 2012 to 31st March 2016) for each district.

Audit Report (Social, General, Revenue and Economic Sectors) for the year ended 31 March 2016
108
2.2.16 Conclusion
Thus, the existing mechanism and procedure for levy and collection of stamp duty and
registration fee suffered from both systemic as well as implementation deficiencies that
resulted in non-levy or loss of revenue aggregating to ` 127.46 crore (stamp duty:
` 95.61 crore and registration fee: ` 31.85 crore) due to non-registration of instruments,
under-valuation of properties, misclassification of documents, irregular adjustment/rebate
of stamp duty, non/short stamping of documents and short levy of registration fees on
instruments containing distinct matters. Further, concessions/ rebate in stamp duty
amounting to ` 0.89 crore were allowed by the Department despite pre-requisite
conditions not having been fulfilled by the parties. The Core Registration System had yet
to be implemented across all SR offices and the software itself suffered from a number of
deficiencies that were to be rectified if it was to serve the intended purpose. Internal
controls were weak and required strengthening to improve monitoring and effective
control to minimize losses of revenue.
2.2.17 Recommendations
In light of the audit findings, it is recommended that the Government:
i. Ensure strict compliance of and adherence to the provisions of the IS and the IR
Acts and rules/notifications issued thereunder for levy of stamp duty and
registration of instruments;
ii. Extend coverage of the Core Registration System and e-registration facility in all
the SR offices and removal of the systemic deficiencies highlighted in audit; and
iii. Strengthen internal control and internal audit mechanisms for greater coverage
and effectiveness to plug leakages of revenue.

Chapter-II: Revenue Sector
109
COMPLIANCE AUDIT
COMMERCIAL TAX DEPARTMENT
2.3 Irregular tax rebate on false declaration forms
False Form-C were used by a dealer for inter-State sales on concessional rate of
tax which resulted in short levy of tax `̀̀̀ 0.26 crore. In addition, penalty of
`̀̀̀ 0.92 crore and interest of `̀̀̀ 0.20 crore was also leviable.
Section-8 (4) of the Central Sales Tax Act, 1956, stipulates that inter-State sales to
registered dealers are taxable at concessional rate when such sales are supported by
declaration in Form C. If a dealer issues or furnishes a false certificate or declaration, he
shall be liable to penalty of a sum not exceeding forty per cent of the value of the goods
involved or three times the tax leviable on such goods, whichever is higher, under
Section-58 (1) (xxix) of the Uttarakhand VAT Act, 2005. Further, Section-34(4) of the
Act ibid also provides that tax admittedly payable shall be deposited within the time
prescribed failing which simple interest at the rate of 15 per cent per annum shall become
due and be payable on the unpaid amount with effect from the date immediately
following the last date prescribed till the date of payment of such amount.
Scrutiny of records of the Deputy Commissioner (Assessment)-II, Commercial Tax,
Haridwar, revealed that a dealer had claimed concessional rate of tax on Form 'C' during
the year 2009-10 which was allowed by the assessing authority (July 2014). On cross
verification of the Form-C (from the issuing authority of the respective State)19, it was
found that these four statutory Form-C20 amounting to ` 2.29 crore had not been issued to
the dealer by the concerned State. Further, the registration of the purchasing dealer was
also cancelled w.e.f. 07 May 2007. However, the selling dealer of Uttarakhand had
availed tax concession21 amounting to ` 0.26 crore on these forms for the assessment
year 2009-10. Moreover, the use of false certificates also render the dealer liable to pay a
penalty of ` 0.92 crore22 along with accrued interest on the unpaid amount of tax till the
date of payment of such amount as per the above mentioned provisions of the
Uttarakhand VAT Act, 2005.
On being pointed out, the Government stated (July 2016) that the case was re-assessed
(July 2015) by the Department and a demand of tax was created @ 12.5 per cent
amounting to ` 0.29 crore which was paid by the dealer (May 2016). They however
added that this case does not attract penalty under Section-58 (1) (xxix) because penalty
19 Office of the Value Added Tax Officer, Department of Trade and Taxes, New Delhi. 20 No.16P / 532551 (`47, 47,618), No.16P / 412541 (`48,68,575), No.16P / 412542 (`59, 89,085) and
No.16P / 302142 (`73,24,884). 21 At the rate of 11.5 per cent out of total 12.5 per cent payable rate of VAT. 22 ` 2,29,28,162 x 40 per cent = ` 91,71,265 (as per Section 58 of UK VAT Act, 2005).

Audit Report (Social, General, Revenue and Economic Sectors) for the year ended 31 March 2016
110
is imposed when tax ceases to be leviable due to use of false or wrong declaration or
certificate. In this case, a tax of one per cent had been levied on the dealer.
The reply of the Government is not tenable as the above cited case is related to furnishing
of false Form-C. Further, concessional rate of tax is levied only when the form is found
correct. In the instant case, the dealer had used false Form-C to claim concessional tax
on inter-state trade. Thus, the Department should levy a penalty of ` 0.92 crore. In
addition, interest of ` 0.20 crore23 was also leviable on the dealer due to late deposit of
the tax.
2.4 Irregular use of Form XI
Irregular use of Form XI resulted in loss of revenue of `̀̀̀ 5.18 lakh and penalty
amounting to `̀̀̀ 0.18 crore.
Rule 23(1) of the Uttarakhand VAT Rules, 2005, stipulates that where a dealer holding a
recognition certificate purchases any goods referred to in clause (a) of sub-section (7) of
Section 4 for use as capital goods and raw material for the purpose of manufacture of any
goods, he shall, if he wishes to avail of the concession referred to therein, furnish to the
selling dealer, a declaration in Form XI (hereinafter called a "Declaration Form").
Further, Section 58(1) (XXIX) of the Uttarakhand, VAT, Act 2005 provides that if any
dealer issues or furnishes a false or a wrong form of declaration or certificate by reason of
which a tax on sale or purchase ceases to be leviable under this Act, such dealer shall
pay, by way of penalty, a sum not exceeding 40 per cent of the value of goods involved
or three times of tax leviable on such goods under any of the provisions of this Act,
whichever is higher. Section 63 of the Act further stipulates that notwithstanding
anything to the contrary contained elsewhere in this Act and without prejudice to Section
58, a person who issues a false or wrong certificate or declaration prescribed under any
provision of this Act or the Rules framed there under to another person by reason of
which a tax leviable under this Act on the transaction of purchase/ sale made to or by
such other person ceases to be leviable or becomes leviable at a concessional rate, shall
be liable to pay on such transaction an amount which would have been payable as tax on
such transaction had such certificate or declaration not been issued.
Scrutiny of records of the Deputy Commissioner-I, (Assessment) Commercial Tax,
Roorkee revealed that recognition certificate (RK-47) of the purchaser24 was effective
from 01 May 2010. The tax assessment and details of Form XI issued for the year
2010-11 revealed that the purchaser has purchased goods on 08 April 2010 valued at
` 45,00,240 from a seller i.e. even before getting the requisite recognition certificate, and
also issued (on 10 June 2010) Form XI to avail concessional rate of tax on the said
purchase. As the purchaser was not authorised to issue Form XI for the purchase prior to
23 ` 0.20 crore [Interest (01.10.2009 to 31.04.2016 = 79 months) = ` 20.08 lakh x 15 x 79 / 12 x 100]. 24 TIN No-05006360606; Dated: 27.05.2006.

Chapter-II: Revenue Sector
111
the effective date of the recognition certificate i.e. 01 May 2010, tax amounting to
` 5.18 lakh25 and penalty of ` 0.18 crore26 was leviable.
The Government stated (December 2016) that the assessing officer had re-assessed the
case and levied tax with interest and penalty (August 2016).
2.5 Short levy of tax due to incorrect calculation
Incorrect calculation of tax by the Assessing Authority resulted in short levy of
tax of `̀̀̀ 0.13 crore. In addition, interest of `̀̀̀ 9.77 lakh was also leviable.
The Assessing Authority is responsible for correct assessment and levy of amount of tax
due on the dealers. Section 4 (2) (b) (i) (b) and 4 (2) (b) (i) (d) of the Uttarakhand Value
Added Tax Act 2005 and subsequent notification (March 2010) provide that tax on
classified and unclassified goods shall be leviable @ 4.5 per cent and 13.5 per cent
respectively w.e.f. 1st March 2010. Further Section 34(4) of the Act provides that the tax
admittedly payable shall be deposited within the time prescribed failing which simple
interest at the rate of 15 per cent per annum shall become due and be payable on the
unpaid amount with effect from the date immediately following the last date of payment
of such amount.
Test-check of records of Deputy Commissioner (A)-I, Haridwar (April 2015) revealed
that there was a short levy of tax due to wrong calculation by the Assessing Authority
(AA) in two cases.
In one case the dealer27 sold composite aluminium panels worth ` 0.82 crore during the
year 2010-11. The assessing authority while finalizing the assessment (May 2014) levied
a tax of ` 36,850 @ 4.5 per cent against the leviable tax of ` 3.68 lakh. This resulted in
short levy of tax of ` 3.32 lakh. Similarly, in another case28, the same assessing authority
while finalizing the assessment (March 2015) for the year 2011-12 incorrectly levied tax
of ` 6.03 lakh @ 13.5 per cent on the sale of electrical steel of ` 1.38 crore against the
leviable tax of ` 0.19 crore. This resulted in short levy of tax of ` 0.13 crore.
Thus, incorrect wrong calculation of tax by the assessing authority resulted in short levy
of tax amounting to ` 0.16 crore in two cases.
On being pointed out, the Department reassessed (January 2016, December 2015) both
the cases and additional demand of ` 0.19 crore was created of which full amount of tax
` 3.31 lakh and interest of ` 2.80 lakh has been recovered in one case and notice for
recovery in second case was issued in May 2016; which is still recoverable.
The matter was referred to the Government (May 2015 and May 2016); its reply was
awaited (December 2016).
25 At the differential rate of (13.5-2) i.e. 11.5 per cent of ` 45, 00,240 = ` 5, 17,527. 26 ` 45, 00,240*13.5 per cent *3=` 18, 22,597. 27 Dealers’ TIN No. 05001891622. 28 Dealers’ TIN No. 05010931925, Dated: 19.04.2011.


113
Chapter-III
Public Sector Undertakings (Social and Economic Sectors)
3.1 Functioning of State Public Sector Undertakings
3.1.1 Introduction
State Public Sector Undertakings (PSUs) consist of State Government companies and
statutory corporations. State PSUs are established to carry out activities of a commercial
nature and occupy an important place in the State’s economy. As on 31 March 2016,
there were 21 working PSUs. Of these, no company was listed on the stock exchange.
During the year 2015-16, no PSU was either incorporated or closed down. Details of the
State PSUs in Uttarakhand as on 31 March 2016 are given in Table-3.1.1 below.
Table-3.1.1: Total number of PSUs as on 31 March 2016
Type of PSUs Working PSUs Non-working PSUs1 Total
Government Companies 18 042 22
Statutory Corporations 033 - 03
Total 21 04 25
The working PSUs registered a turnover of ` 7,173.33 crore (Appendix-3.1.2) as per their
latest finalised accounts as of 30 September 2016. This turnover was equal to
3.90 per cent of the State Gross Domestic Product for 2015-16. The working PSUs
earned an aggregate profit of ` 100.57 crore as per their latest finalised accounts as of 30
September 2016. They had employed 21,050 employees (Appendix-3.1.2) as at the end
of March 2016.
As on 31 March 2016, there were four non-working PSUs with an investment of
` 0.38 crore.
3.1.2 Accountability framework
The audit of Government companies is governed by Sections 139 and 143 of the
Companies Act, 2013(Act). According to Section 2 (45) of the Act, a Government
company means any company in which not less than fifty one per cent of the paid up
share capital is held by Central Government or by any State Government or governments
or partly by the Central Government and partly by one or more State Governments and
1 Non-working PSUs are those which have ceased to carry on their operations. 2 Kumtron Limited, Uttar Pradesh Hill Phones Limited, Uttar Pradesh Hill Quartz Limited and UPAI
Limited (under liquidation since 31 March 1991). 3 Uttarakhand Parivahan Nigam, Uttarakhand Forest Development Corporation and Uttarakhand Pey Jal
Sansadhan Vikas Evam Nirman Nigam.

Audit Report (Social, General, Revenue and Economic Sectors) for the year ended 31 March 2016
114
includes a company which is a subsidiary company of such a Government company.
Further, as per sub-Section 7 of Section 143 of the Act, in case of any company covered
under sub-Section (5) or sub-Section (7) of Section 139, the Comptroller and Auditor
General of India (CAG) may cause an audit to be conducted of the accounts of such
Company and Section 19A of the Comptroller and Auditor General’s (Duties, Powers
and Conditions of Service) Act, 1971 shall apply to such audit. The audit of the financial
statements of a Company in respect of the financial years that commenced on or after
31 March 2014 shall be governed by the provisions of the Companies Act, 2013.
3.1.3 Statutory Audit
The financial statements of Government companies (as defined in Section 2 (45) of the
Companies Act, 2013) are audited by statutory auditors who are appointed by the CAG
under Section 139 (5) or (7) of the Act. The statutory auditors shall submit a copy of the
Audit Report to the CAG which, among other things, includes the directions issued by the
CAG, the action taken thereon and its impact on the accounts. The financial statements
are subject to supplementary audit by CAG within sixty days from the date of receipt of
the Audit Report under Section 143 (6) of the Act.
Audit of statutory corporations is governed by their respective legislations. Out of the
three statutory corporations, CAG is the sole auditor for the Uttarakhand Parivahan
Nigam and the Uttarakhand Forest Development Corporation. In respect of Uttarakhand
Peyjal Sansadhan Vikas Evam Nirman Nigam, the audit was entrusted to the CAG
initially from 2003-04 to 2008-09 and then extended upto 2018-19 under Section 20(1) of
the Comptroller and Auditor General's (Duties, Powers and Conditions of Service) Act,
1971.
3.1.4 Role of Government and Legislature
The State Government exercises control over the affairs of these PSUs through its
administrative departments. The Chief Executive and Directors to the Board are
appointed by the Government.
The State Legislature monitors the accounting and utilisation of Government investment
in the PSUs. For this purpose, the Annual Reports together with the Statutory Auditors’
Reports and the comments of the CAG, in respect of State Government companies and
Separate Audit Reports in case of statutory corporations, are to be placed before the State
Legislature under Section 394 of the Act or as stipulated in the respective Acts. The
Audit Reports of CAG are submitted to the Government under section 19A of the CAG’s
(Duties, Powers and Conditions of Service) Act, 1971.

Chapter-III: Social and Economic Sectors (PSUs)
115
3.1.5 Stake of State Government in the Public Sector Undertakings
The State Government has substantial financial stake in these PSUs which is mainly of
three types:
� Share Capital and Loans- In addition to Share Capital Contribution, State
Government also provides financial assistance by way of loans to the PSUs from
time to time.
� Special Financial Support- State Government provides budgetary support by way
of grants and subsidies to the PSUs as and when required.
� Guarantees- State Government guarantees the repayment of loans with interest
availed by the PSUs from financial institutions.
3.1.6 Investment in State PSUs
As on 31 March 2016, the investment (capital and long-term loans) in 25 PSUs was
` 8,768.75 crore as given in Table-3.1.2 below.
Table-3.1.2: Total investment in PSUs (`̀̀̀ in crore)
Type of PSUs
Government Companies Statutory Corporations
Grand
Total Capital
Long
Term
Loans
Total Capital
Long
Term
Loans
Total
Working PSUs 2,883.52 3,136.83 6,020.35 2,668.25 79.77 2,748.02 8,768.37
Non-working PSUs 0.38 - 0.38 - - - 0.38
Total 2,883.90 3,136.83 6,020.73 2,668.25 79.77 2,748.02 8,768.75
As on 31 March 2016, 99.99 per cent of the total investment in State PSUs was in
working PSUs and the remaining 0.01 per cent in non-working PSUs. This total
investment consisted of 63.32 per cent towards capital and 36.68 per cent in long-term
loans. The investment has grown by 30.46 per cent from ` 6,721.16 crore in 2011-12 to
` 8,768.75 crore in 2015-16 as shown in the Graph-3.1.1 below.
Graph-3.1.1: Total investment (Capital and Long Term Loans) in PSUs
0
1000
2000
3000
4000
5000
6000
2011-12 2012-13 2013-14 2014-15 2015-16
3,8
38
.04
4,3
52
.25
4,6
36
.78
5,1
52
.78
5,5
52
.15
2,8
83
.02
2,7
02
2,9
29
.57
3,2
45
.73
3,2
16
.6
Capital Long term Loan

Audit Report (Social, General, Revenue and Economic Sectors) for the year ended 31 March 2016
116
3.1.6.1 The sector wise summary of investments in the State PSUs as on 31 March
2016 is given in Table-3.1.3 below.
Table-3.1.3:Sector-wise investment in PSUs
Name of Sector Government companies
Statutory
corporations Total no.
of PSUs
Total
Investment
Working Non-Working Working (`̀̀̀ in crore)
Power 3 - - 3 5,489.71
Manufacturing 6 3 - 9 312.55
Finance 3 - - 3 25.58
Miscellaneous 1 - 1 2 1.00
Service 2 - 1 3 280.76
Infrastructure 2 - 1 3 2,644.25
Agriculture & Allied 1 1 - 2 14.90
Total 18 4 3 25 8,768.75
The investment in four significant sectors and percentage thereof at the end of
31 March 2012 and 31 March 2016 are indicated in Graph-3.1.2 below.
Graph-3.1.2: Sector wise investment in PSUs
Though during 2015-16, the highest investment was in the power sector i.e.
` 5,489.71 crore (31.57 per cent), the thrust of investment was also in infrastructure and
manufacturing sectors which has seen its share rising from ` 2,073.99 crore in 2011-12 to
` 2,644.25 crore (27.50 per cent) in 2015-16 and from ` 130.37 crore in 2011-12 to
` 312.55 crore (139.74 per cent) in 2015-16 respectively. However, the investment in
service sector decreased from ` 309.06 crore to ` 280.76 crore (9.16 per cent) from
2011-12 to 2015-16 due to repayment of loan by the companies/ corporation.
4,172.31
5,489.71
2,073.99
2,644.25
130.37
312.55 309.06
280.76 -100.00200.00500.00800.00
1,100.001,400.001,700.002,000.002,300.002,600.002,900.003,200.003,500.003,800.004,100.004,400.004,700.005,000.005,300.005,600.005,900.00
2011-12 2015-16
Power Infrastructure Manufacturing Service
( `̀̀̀ i
n c
rore
)

Chapter-III: Social and Economic Sectors (PSUs)
117
3.1.7 Special support and returns during the year
The State Government provides financial support to PSUs in various forms through its
annual budget. The summarized details of budgetary outgo toward equity, loans, grants/
subsidies, loans written off and interest waived in respect of State PSUs are given in
Table-3.1.4 below for three years ending 31 March 2016.
Table-3.1.4: Details regarding budgetary support to PSUs
(` in crore)
Sl.
No.
Particulars 2013-14 2014-15 2015-16
No. of PSUs Amount No. of PSUs Amount No. of PSUs Amount
1. Equity Capital outgo from budget 4 259.91 4 171.96 4 57.76
2. Loans given from budget 6 190.07 5 374.43 3 17.35
3. Grants/Subsidy from budget 4 69.71 3 32.60 4 44.42
4. Total Outgo (1+2+3) 84 519.69 74 578.99 64 119.53
5. Waiver of loans and interest - - - - - -
6. Guarantees issued 1 1.54 2 57.87 4 509.52
7. Guarantee Commitment 4 906.66 4 1,471.97 4 852.55
Source: Information provided by the PSUs/Companies.
The details regarding budgetary outgo towards equity, loans and grants/ subsidies for the
past five years are given in the Graph-3.1.3 below.
Graph-3.1.3: Budgetary outgo towards Equity, Loans and Grants/Subsidies
The budgetary outgo of the State Government towards equity, loans and grants/subsidies
had shown a fluctuating trend with ` 578.25 crore in 2011-12 to ` 119.53 crore in
2015-16.
4 Represent actual number of company/corporation which received budgetary support in the form of
equity/loans/subsidy during the respective year.
578.25
796.14
519.69 578.99
119.53
100.00
200.00
300.00
400.00
500.00
600.00
700.00
800.00
900.00
1,000.00
20
11-1
2
20
12-1
3
20
13-1
4
20
14-1
5
20
15-1
6
Budgetary outgo towards Equity, Loans and Grants/Subsidies
(` i
n c
rore
)

Audit Report (Social, General, Revenue and Economic Sectors) for the year ended 31 March 2016
118
The amount of guarantee commitment as on 31 March 2014 was ` 906.66 crore
(four PSUs) which increased to ` 1,471.97 crore (four PSUs) in 31 March 2015 due to
the guarantee given by the State Government on the R-APDRP loan to the Uttarakhand
Power Corporation Limited and then decreased to ` 852.55 crore in 2015-16. During the
current year, loans aggregating ` 509.52 crore of four5 PSUs were guaranteed by the
State Government.
In order to enable PSUs to obtain financial assistance from banks and financial
institutions, the State government provides guarantee and charges guarantee fee from
zero per cent6to one per cent. Only one PSU, namely Uttarakhand Jal Vidhyut Nigam
Limited paid guarantee fee to the tune of ` 5.54 crore during 2015-16.
3.1.8 Reconciliation with Finance Accounts
The figures in respect of equity, loans and guarantees outstanding as per the records of
State PSUs should agree with the figures appearing in the Finance Accounts of the State.
In case the figures do not agree, the concerned PSUs and the Finance Department
should carry out reconciliation of the differences. The position in this regard as at
31 March 2016 is given in Table-3.1.5 below.
Table-3.1.5: Equity, loans, guarantees outstanding as per the Finance Accounts vis-à-vis
records of PSUs
(` in crore)
Outstanding in
respect of
Amount as per Finance
Accounts
Amount as per
records of PSUs Difference
Equity 2,914.41 3,096.94 182.53
Loans 487.60 700.57 212.97
Guarantees 819.43 852.55 33.12
There was a mismatch between figures furnished by the State PSUs and those depicted in
the Finance Accounts. Reasons for the difference were not furnished by the PSUs though
the concerned PSUs and the Finance Department were requested (October 2016) to take
necessary action to reconcile the differences.
3.1.9 Arrears in finalisation of accounts
3.1.9.1 The financial statements for every financial year are required to be finalised by
the companies within six months from the end of the relevant financial year i.e. by
September end in accordance with Section 96 (1) of the Companies Act, 2013. Failure to
do so may attract penal provisions under Section 99 of the Act. In case of statutory
5 Uttarakhand Power Corporation Limited (` 11.64 crore), Power Transmission Corporation of
Uttarakhand Limited (` 6.64 crore), Uttarakhand Jal Vidhyut Nigam Ltd (` 488.60 crore) and Uttarakhand Bahudeshia Vitta Evam Vikas Nigam Limited (` 2.64 crore).
6 Guarantee fee for Uttarakhand Bahudeshia Vitta Evam Vikas Nigam Limited is zero percent.

Chapter-III: Social and Economic Sectors (PSUs)
119
corporations, their accounts are finalised, audited and presented to the State Legislature
as per the provisions of their respective Acts.
The details of progress made by working PSUs in finalisation of accounts as of
30 September 2016 are given in Table-3.1.6 below.
Table-3.1.6: Position relating to finalisation of accounts of working PSUs
Sl.
No. Particulars 2011-12 2012-13 2013-14 2014-15 2015-16
1. Number of Working PSUs/Other Companies
20 20 21 21 21
2. Number of accounts finalised during the year
15 10 23 16 16
3. Number of accounts in arrears 140 150 148 153 158
4. Number of Working PSUs with arrears in accounts
20 20 20 20 18
5. Extent of arrears (numbers in years) 1 to 25 years 1 to 26 years 1 to 27 years 1 to 28 years 1 to 29 years
The administrative departments have the responsibility of overseeing the activities of
these entities and to ensure that the accounts are finalised and adopted by these PSUs
within the stipulated period. The concerned departments were regularly updated on the
status of the arrears. In addition, the Accountant General also took up the matter with the
Chief Secretary and the Secretary (Finance), Government of Uttarakhand, in May 2016
and July 2016 for liquidating the arrears of accounts. However, no significant
improvement has been noticed. As a result, the net worth of these PSUs could not be
assessed in audit.
3.1.9.2 The State Government had invested ` 113.56 crore in three PSUs for which
accounts have not been finalised as detailed in Appendix-3.1.1. In the absence of
finalisation of accounts and their audit, it could not be ensured whether the investments
and expenditure incurred have been properly accounted for and whether the purpose for
which the amount was invested had been achieved or not. Thus, Government’s
investment in such PSUs has remained outside the oversight of the State Legislature.
3.1.9.3 As on 30 September 2016, there were also arrears in finalisation of accounts by
non-working PSUs as depicted in Table-3.1.7 below.
Table-3.1.7: Position relating to arrears of accounts in respect of non-working PSUs
Name of non-working companies Period for which accounts
were in arrears
No. of years for which
accounts were in arrears
UPAI Limited Since 1989-90 27
Kumtron limited Since 1990-91 26
Uttar Pradesh Hill Phones Limited Since Formation (1987-88) 29
Uttar Pradesh Hill Quartz Limited Since Formation (1989-90) 27

Audit Report (Social, General, Revenue and Economic Sectors) for the year ended 31 March 2016
120
Out of the four non-working PSUs, one PSU i.e. UPAI Limited was in the process of
liquidation since 31 March 1991 and the remaining three non-working PSUs7 had arrears
of accounts from 26 to 29 years.
In respect of statutory corporations, the Uttarakhand Pey Jal Sansadhan Vikas Evam
Nirman Nigam and the Uttarakhand Parivahan Nigam have finalised its accounts upto
2013-14 and 2014-15 respectively. The accounts of the remaining statutory corporation,
namely, the Uttarakhand Forest Development Corporation have been finalised upto
2010-11.
3.1.10 Placement of Separate Audit Reports
The status of placement of Separate Audit Reports (SARs) issued by the CAG (up to
30 September 2016) on the accounts of statutory corporations in the State Legislature is
given in Table-3.1.8 below:
Table-3.1.8: Status of placement of SARs in Legislature
Sl.
No.
Name of statutory
corporation
Year up to which
SARs placed in
Legislature
Year for which SARs not placed in Legislature
Year of SAR Date of issue to the
Government/Present
Status
1. Uttarakhand Parivahan
Nigam 2008-09 2010-11 to 2014-15 not yet placed
2. Uttarakhand Pey Jal
Sansadhan Vikas Evam
Nirman Nigam
2013-14 - -
3. Uttarakhand Forest
Development Corporation 2008-09 2009-10 to 2010-11
Issued to Government in May 2015
Though the concerned administrative departments were informed in (May and July 2016)
of the arrears in finalisation of accounts, no remedial measures were taken. As a result,
the net worth of these PSUs could not be assessed in audit.
3.1.11 Impact of non-finalisation of accounts
Delay in finalisation of accounts raises the risk of fraud and leakage of public money
apart from violation of the provisions of the relevant statutes. In view of the arrears of
accounts, the actual contribution of the PSUs to the State Gross Domestic Product for the
year 2015-16 could not be ascertained.
3.1.12 Performance of PSUs as per their latest finalized accounts
3.1.12.1 The financial position and working results of working Government companies
and statutory corporations are detailed in Appendix-3.1.2. The ratio of PSU turnover to
State GDP shows the extent of PSUs activities in the State’s economy. The details of
7 Kumtron limited, Uttar Pradesh Hill Phones Limited and Uttar Pradesh Hill Quartz Limited.

Chapter-III: Social and Economic Sectors (PSUs)
121
working PSUs turnover and State GDP for a period of five years ending 31 March 2016
is given in Table-3.1.9 below.
Table-3.1.9: Details of working PSUs turnover vis-à-visState GDP
(`̀̀̀ in crore)
Particulars 2011-12 2012-13 2013-14 2014-15 2015-16
Turnover8 3,258.60 4,042.00 5,103.24 5,741.42 7,173.33
State GDP9 1,15,523 1,31,835 1,49,817 1,61,985 1,84,091
Percentage of Turnover to State GDP 2.82 3.07 3.41 3.54 3.90
During the last five years, the turnover of working PSUs increased from ` 3,258.60 crore
in 2011-12 to ` 7,173.33 crore in 2015-16 and its percentage to the State GDP also
increased from 2.82 per cent in 2011-12 to 3.90 per cent in 2015-16.
3.1.12.2 Overall profits earned and losses incurred by working State PSUs during
2011-12 to 2015-16 are given in Graph-3.1.4 below.
Graph-3.1.4: Profit/ (-) Loss of working PSUs
(Figures in brackets show the number of working PSUs in respective years)
During the year 2015-16, out of 21 working PSUs, nine PSUs earned a profit of
` 349.25 crore and 12 PSUs incurred a loss of ` 248.68 crore. The major contributors to
profit were Uttarakhand Jal Vidyut Nigam Limited (` 181.82 crore), State Industrial
Development Corporation of Uttarakhand Limited (` 50.88 crore), and Power
Transmission Corporation of Uttarakhand Limited (` 69.34 crore). The losses were
incurred by Uttarakhand Power Corporation Limited (` 95.63 crore), Doiwala Sugar
Company Limited (` 49.88 crore), and Uttarakhand Parivahan Nigam (` 34.94 crore).
8 Turnover as per the latest finalised accounts as of 30 September 2016. 9 GDP figures taken from the Report on State Finance for the year ended March 2016.
-700
-600
-500
-400
-300
-200
-100
0
100
200
300
400
2011-12 2012-13 2013-14 2014-15 2015-16
Overall Profit (Loss) earned (incurred) during the year
100.57
(21)
(-) 562.75
(20)
(-) 234.25
(20)
(-) 42.45
(21)
283.09
(21)

Audit Report (Social, General, Revenue and Economic Sectors) for the year ended 31 March 2016
122
3.1.12.3 Some other key parameters of PSUs are given in Table-3.1.10 below.
Table-3.1.10: Key Parameters of State PSUs
(`̀̀̀ in crore)
Particulars 2011-12 2012-13 2013-14 2014-15 2015-16
Return on Capital Employed (per cent) (-)3.56 0.59 (-) 6.31 8.74 5.74
Debt 2,883.12 2,702.00 2,929.57 3,245.73 3,216.60
Turnover10 3,258.60 4,042.00 5,103.24 5,741.42 7,173.33
Debt/ Turnover Ratio 0.88:1 0.67:1 0.57:1 0.57:1 0.45:1
Interest Payments 288.64 276.93 281.65 358.33 391.13
Accumulated Profits/losses (-)1,905.97 (-)2,081.42 (-)2,034.59 (-)1,883.90 (-)1,948.47
(Above figures pertain to all PSUs except for turnover which is for working PSUs).
The Debt-Turnover Ratio decreased from 0.88:1 in 2011-12 to 0.45:1 in 2015-16 which
impacted its profits. Consequently, accumulated losses increased by 3.43 per cent over
the previous year 2014-15.
3.1.12.4 The State Government had not formulated any dividend policy under which
PSUs would be required to pay a minimum return on the paid up share capital contributed
by the State government. During the year 2015-16, no dividend was declared by any of
the PSUs.
3.1.13 Winding up of non-working PSUs
3.1.13.1 There were four non-working PSUs/ companies as on 31 March 2016. Of
these, one PSU, namely, UPAI Limited commenced liquidation process on 31 March
1991. The number of non-working PSUs/ companies at the end of each year during past
five years has remained at four. The non-working PSUs are neither contributing to the
State’s economy nor meeting their intended objectives.
3.1.13.2 The stages of closure in respect of non-working PSUs are given in
Table-3.1.11 below.
Table-3.1.11: Closure of non working PSUs
Sl.
No.
Particulars Companies Statutory
Corporations
Total
1. Total No. of non-working PSUs 04 - 04 2. Of (1) above, the No. under - - - (a) liquidation by Court (liquidator appointed) 01 - 01 (b) Voluntary winding up (liquidator appointed) - - -
(c) Closure, i.e. closing orders/ instructions issued but liquidation process not yet started.
03 - 03
10 Turnover of working PSUs as per the latest finalised accounts as of 30 September 2016.

Chapter-III: Social and Economic Sectors (PSUs)
123
During the year 2015-16, no company/corporation was finally wound up. The only
company i.e. UPAI Limited which had taken the route of winding up by Court order is
under liquidation for more than 25 years. The Government may take a decision regarding
commencement of liquidation process in respect of other three non-working PSUs.
3.1.14 Accounts Comments
Eleven working companies forwarded sixteen audited accounts to the Accountant
General during the year 2015-16. Of these, 15 accounts of 10 companies were selected
for supplementary audit. The details of aggregate money value of comments of CAG and
statutory auditors are given in Table-3.1.12 below.
Table-3.1.12: Impact of audit comments on working Companies
(`̀̀̀ in crore)
Sl.
No. Particulars
2013-14 2014-15 2015-16
No. of
accounts Amount
No. of
accounts Amount
No. of
accounts Amount
1. Decrease in profit 5 28.07 5 22.94 7 34.73
2. Increase in loss 2 16.96 2 0.76 5 192.62
3. Total: Increase in
Loss 7 45.03 7 23.70 12 227.35
4. Non-disclosure of
material facts 1 180.16 2 72.39 1 0.31
5. Errors of
classification 1 4.37 3 290.27 10 172.29
As a result of the accounts comments, there would be an overall increase in the loss in
12 PSUs by ` 227.35 crore during the year 2015-16.
During the year, the statutory auditors had given qualified certificates for 13 accounts and
adverse certificates for three accounts11. CAG gave qualified reports containing
comments for 15 accounts during supplementary audit and Non Review Certificate was
issued in respect of one company12.The compliance of the companies with the accounting
standards remained poor as there were 18 instances of non-compliance in eight accounts
during the year.
Similarly, only one working statutory corporation viz. the Uttarakhand Parivahan Nigam,
forwarded their two accounts for 2013-14 and 2014-15 to the Accountant General
between October 2015 and September 2016. These accounts pertained to sole audit by
CAG which was completed. The details of aggregate money value of comments of CAG
and statutory auditors are given in Table-3.1.13 below.
11 State Infrastructure and Industrial Development Corporation of Uttarakhand Limited (2011-12 &
2012-13) and Garhwal Mandal Vikas Nigam Limited (2005-06). 12 Uttarakhand Seeds and Tarai Development Corporation Limited (accounts for the year 2014-15).

Audit Report (Social, General, Revenue and Economic Sectors) for the year ended 31 March 2016
124
Table-3.1.13: Impact of audit comments on Statutory Corporations
Sl.
No. Particulars
2013-14 2014-15 2015-16
No. of
accounts
Amount
(`̀̀̀ in crore)
No. of
accounts
Amount
(`̀̀̀ in crore)
No. of
accounts
Amount
(`̀̀̀ in crore)
1. Decrease in profit - - 2 49.49 -
2. Increase in loss 1 25.07 6 87.40
2
12.66
3. Non-disclosure of material facts
- - - - 11.73
4. Errors of classification
- - 2 0.88
The impact of comments on ‘increase in loss’ escalated from ` 25.07 crore in 2013-14 to
` 136.89 crore in 2014-15 which was decreased to ` 12.66 crore in 2015-16.
3.1.15 Response of the Government to Audit
Paragraphs pertaining to the PSUs
For the Report of the Comptroller and Auditor General of India for the year ended
31 March 2016, four compliance audit paragraphs were issued to the Additional Chief
Secretaries/Principal Secretaries of the respective Departments with a request to furnish
replies within six weeks. However, replies in respect of the audit paragraphs were
awaited from the State Government (December 2016).
3.1.16 Follow up action on Audit Reports
The Reports of the Comptroller and Auditor General of India (CAG) represents the
culmination of the process of statutory audit. It is, therefore, necessary that they elicit
appropriate and timely response from the Executive. All administrative departments are
to submit replies/explanatory notes to paragraphs/reviews included in the Audit Reports
of the CAG within a period of three months of their presentation to the Legislature in the
prescribed format without waiting for any questionnaire from the Committee on Public
Undertakings (COPU). The status of receipt of explanatory notes is given in
Table-3.1.14 below.
Table-3.1.14: Explanatory notes not received as on 31December 2016
Year of the
Audit Report
(Commercial
/PSU)
Date of
placement of
Audit Report in
the State
Legislature
Total Performance audits (PAs)
and Paragraphs in the Audit
Report
Number of PAs/ Paragraphs for
which explanatory notes were not
received
PAs Paragraphs PAs Paragraphs
2010-11 December 2012 01 04 01 04
2011-12 September 2013 01 02 01 02
2012-13 November 2014 01 02 01 02
2013-14 November 2015 - 06 - 06
2014-15 November 2016 - 06 - 06
Total 03 20 03 20

Chapter-III: Social and Economic Sectors (PSUs)
125
None of the explanatory notes to the above paragraphs/ performance audits relating to
three departments were received (December 2016).
3.1.17 Discussion of Audit Reports by Committee on Public Undertakings
The status as on 31 December 2016 of performance audits and paragraphs that appeared
in Audit Reports (PSUs) and were discussed by the Committee on Public Undertakings
(COPU) is depicted in Table-3.1.15 below.
Table-3.1.15: Performance audits/Paragraphs appeared in Audit Reports vis-à-vis discussed as on
31 December 2016
3.1.18 Compliance to Reports of Committee on Public Undertakings
Action Taken Notes (ATN) to 17 paragraphs pertaining to six Reports of COPU
presented to the State Legislature between March 2010 and March 2016 had not been
received (December 2016) as given in Table-3.1.16 below.
Table-3.1.16: Compliance to COPU Reports
Year in which
the COPU
meeting held
No. of
meeting
held
Total number of
COPU Reports
Total no. of
recommendations
in COPU Report
No. of recommendations
where ATNs not received
2014-15 05 02 07
Neither recommendations
nor ATNs were received.
2015-16 06 02 08
2016-17 01 02 02
Total 12 06 17
It is recommended that the Government ensures: (a) sending of replies to inspection
reports/ draft paragraphs/ performance audits and ATNs on the recommendations of
COPU as per the prescribed time schedule and (b) revamping of the system of responding
to audit observations to ensure timely response.
3.1.19 Recoveries at the instance of audit
Audit findings involving recoveries that came to notice in the course of test audit of
accounts of the PSUs were referred to the PSUs/State Government through Audit
Inspections Reports for further investigation. In case of recovery, the same was required
to be intimated to audit. As a result, recoveries of ` 16.19 crore were made by the PSUs
during the year 2015-16 at the instance of audit as mentioned below:
Period of Audit
Report
Number of reviews/ paragraphs
Appeared in Audit Report Paras discussed
Pas Paragraphs PAs Paragraphs
2010-11 1 4 1 2
2011-12 1 2 1 -
2012-13 1 2 1 1
2013-14 - 6 - -
2014-15 - 6 - -
Total 3 20 3 3

Audit Report (Social, General, Revenue and Economic Sectors) for the year ended 31 March 2016
126
(a) Audit pointed out recoveries of ` 0.44 crore13 on account of short charging of penalty,
non-realization of cheques and non-levy of low power factor surcharges to the
management of Uttarakhand Power Corporation Limited (UPCL) during 2015-16 which
were admitted and recovered by them.
(b) During the course of audit in 2015-16, recoveries of ` 15.75 crore on account of
non-claiming incentive on achieving the desired availability of Alternative Current
system for the period from April 2009 to March 2016 were pointed out to the
management of Power Transmission Corporation of Uttarakhand Limited (PTCUL)
which was recovered (July 2016) by PTCUL.
3.1.20 Disinvestment, Restructuring and Privatisation of PSUs
During the year 2015-16, there was no case of privatization of Government companies
and statutory corporations. The State Government has not prepared any policy on
disinvestment of Government equity invested in the State PSUs.
3.1.21 Contents of Chapter-III (PSUs Chapter)
This PSUs Chapter contains two paragraphs including one thematic paragraph with
financial implication of ` 38.19 crore.
13 ` 7.49 lakh pertaining to short charging of penalty by Electricity Store Division, Dehradun,
` 0.16 crore pertaining to realization of un-cashed cheques and ` 0.20 crore pertaining to non- levy of low power factor surcharges by the Electricity Distribution Division (Rural), Dehradun of UPCL during 2015-16.

Chapter-III: Social and Economic Sectors (PSUs)
127
COMPLIANCE AUDIT
Garhwal Mandal Vikas Nigam Limited
3.2 Loss due to improper and prolonged storage of perishable fruits
Unscientific and improper storage of apples procured under Market
Intervention Programme for extended periods resulted in the Nigam having to
sell them at base prices resulting in loss of `̀̀̀ 5.34 crore.
The Government of Uttarakhand (GOU) decided (06 August 2013) to procure apples
from farmers in the June 2013 disaster affected areas of the State under its Market
Intervention Progamme (MIP) through the Garhwal Mandal Vikas Nigam Limited
(Nigam). The Nigam was to procure the apples and get them processed through the
processing units of the Horticulture Department. In the eventuality where the apples
could not be processed fully through these units, Nigam was to undertake appropriate
measures for timely sale to avoid any abnormal wastage. The minimum support price for
the procurement of apples was fixed by the State Government at ` 3,000 per quintal. The
Nigam was to be paid handling charges at the rate of 25 per cent of the procurement
price.
Audit scrutiny of records of the Nigam in March 2015 revealed that it had procured
16,015.44 quintals of apples at a cost of ` 4.80 crore under the above programme from
the disaster affected farmers during the third/fourth week of August 2013. However, the
Nigam had neither made arrangements for proper storage14 of apples nor arranged for
their timely sale15though it was a perishable food item. Audit observed the following:
� Although the base price was fixed as ` 3,000 per quintal, maximum bid was received
for only ` 1,400 per quintal in third week of September 2013 because the bidders
refused to accept the base price inter alia on the ground that the apples had been
purchased since 26 August 2013 and had been stored in heaps as a result of which
the possibility of damage and loss of quality was quite high. Consequently, the
contract for sale of apples could be finalized by the Nigam on 21 September 2013
only at the base price of ` 1,400 per quintal. As the apples had already started
rotting, the contractor lifted only 4,637.50 quintals of good apples at ` 0.65 crore.
Subsequently, after another three weeks, Nigam constituted a committee in October
2013 to dispose of the remaining apples. The Committee stated in its report dated
27 October 2013 that around 75 to 80 per cent apples had been damaged due to
14 Apples were stored in small rooms of health deptt., farmers houses, schools, hotels, etc of the area. 15 GMVN invited tenders for sale of apples only on 17 September 2013 i.e. after more than three weeks
of the commencement of procurement process and that too after the intimation of Regional Manager, Uttarkashi (13 September 2013) that apples had started rotting.

Audit Report (Social, General, Revenue and Economic Sectors) for the year ended 31 March 2016
128
storage of apples for more than two months and recommended their immediate
disposal to avoid further losses and also to prevent spread of diseases in and around
the storage area.
� The Nigam finally disposed of the remaining 11,377.94 quintals of apples at
` 0.60 lakh in November 2013.
Thus, unscientific and improper storage of apples for extended periods resulted in the
Nigam having to sell them at base prices resulting in loss of ` 5.34 crore16.
The Nigam stated (March 2015) that the State Government had entrusted the work of
procurement of apples to them without providing sufficient time for proper
implementation of the programme. As a result, it was forced to sell apples at a lower price
as the Corporation was not in a position to retain the procured apples for long. The reply
is not tenable as apples were a perishable commodity and the Nigam should have ensured
proper action for their storage and expeditious sale particularly when it was aware of the
lack of proper storage facilities and the fact that apples were a perishable commodity.
The matter was reported to the Government (May 2016); their reply was awaited
(December 2016).
UTTARAKHAND FOREST DEVELOPMENT CORPORATION
3.3 Audit of revenue earning activities
Production of timber and fire wood which was the main activity of the
Corporation was below the prescribed norms by 77.30 per cent and 41.11
per cent respectively resulting in loss of revenue by `̀̀̀ 29.31 crore. The
Corporation could not ensure felling of allotted trees within the prescribed
time resulting in non-recovery of royalty amounting to `̀̀̀ 0.48 crore. Further,
extraction of river bed material beyond the permissible area by the
Corporation attracted a penalty of `̀̀̀ 2.85 crore while, short deposit of
composition money in lieu of value added tax by the Corporation due to
revision of rates resulted in avoidable payment of interest of `̀̀̀ 0.21 crore.
3.3.1 Introduction
The Uttarakhand Forest Development Corporation (Corporation) was established in
April 2001 under the Uttar Pradesh Forest Corporation (Uttaranchal Amended) Act, 2001
(Act), for preservation, development of forests and scientific exploitation of forest
produce within the State. The audit of the accounts of the Corporation was entrusted to
the CAG of India vide Government of Uttarakhand Gazette notification dated
16 ` 4.80 crore cost of apples, plus ` 1.20 crore handling charges less by ` 0.66 crore receipts from sale.

Chapter-III: Social and Economic Sectors (PSUs)
129
8th June 2012. The main revenue earning activities of the Corporation comprise logging
(felling / disposal of trees), mining (extraction of minor minerals from rivers in forest
land), eco-tourism and sale of medicinal herbs-jari buti.
The activity wise breakup of the turnover of the Corporation in 2012-13 to 2015-16 is
given in the Table-3.3.1 below.
Table-3.3.1: Activity-wise turnover
(` ` ` ` in lakh)
Sl. No Activity 2012-13 2013-14 2014-15 2015-16 Total
1 Logging 31,446.36 31,544.57 31,263.18 42,101.12 1,36,355.23
2 Mining of Minor Minerals 8,191.63 27,646.28 18,308.02 20,897.48 75,043.41
3 Jari-Buti 274.91 200.58 368.28 636.19 1,479.96
4 Eco-Tourism 5.82 3.74 0.63 3.07 13.26
Total 39,918.72 59,395.17 49,940.11 63,637.86 2,12,891.86
Source: Compiled information was provided by the Management.
An audit was conducted between January 2016 and May 2016 covering the period from
2012-13 to 2015-16 to assess the revenue earning activities and effectiveness of its
logging and mining activities which contributed 99 per cent of the total revenue of the
Corporation.
3.3.2 Logging Activities
The Work and Progress Report of the Corporation stipulates that work of disposal of
actually felling and disposal of trees allotted by the Forest Department should be
completed within the logging year (from October to September) in order to avoid decay
of logs and timely recovery of royalty paid by the Corporation from the ultimate buyers.
3.3.2.1 Non-recovery of royalty due to delay in felling of lot of trees
The Corporation pays royalty to the Forest Department at rates determined by the State
government for each lot of trees for different species every year irrespective of the actual
felling of trees. As per the Works and Progress Manual of the Nigam, lots of trees were
to be inspected within 15 days of allotment for any mismatch and if there is any dispute
regarding the allotted lot of trees, they should not be taken over from the Forest
Department.
Audit of records of Pithoragarh, Karnprayag and Pauri divisions revealed that felling of
trees in 68 lots (Pithoragarh-14, Karnprayag- 46 and Pauri-08) allotted to the Corporation
during 2008-09 to 2014-15 did not commence till 31 March 2016. Thus, royalty of
` 0.48 crore paid on these lot of trees by the Corporation in the respective years to the
Forest Department could not be recovered. The royalty was to be recovered from the
ultimate buyers only after felling down and selling out of allotted lots of trees by the
Corporation.

Audit Report (Social, General, Revenue and Economic Sectors) for the year ended 31 March 2016
130
The Management stated (February 2016) that work was pending due to disputes viz.
change in alignment of road by PWD, trees damaged by PWD, dispute with Forest
Department and the area of logging being remote. The reply was not tenable as these
issues should have been addressed before the lots were accepted.
3.3.2.2 Production of Timber
To monitor the production of ‘round timber’17, the Corporation has prescribed a proforma
Report which requires details of the top, mid and bottom girth of the logs which are
essential to establish the timber available and extracted from a tree. Further, timber with
diameter less than 30 cms and small branches which are invariably produced along with
round timber are to be treated as firewood.
(a) Short Production of Round Timber
Out of total 849 lots in seven divisions18, audit found that against the required production
of 88,809 cum of round timber (based on norms19 prescribed by the Corporation) in
389 test-checked lots, the actual production of round timber was only 68,650 cum
(77.30 per cent) i.e. less by 20,161 cum worth ` 29.18 crore20. Further, instead of filling
of complete proforma, only details of mid girth (excluding top and bottom girth) were
being filled in by the test-checked divisions for assessing tree-wise production. The
failure of an important check point thus compromised control over round timber
production with potential revenue losses of ` 29.18 crore on short production of round
timber of 20,161 cum.
It was further observed that as per the rules followed by the Corporation, logs were to be
made up to a minimum mid-girth of 30 cms (21 cms in case of Sagaun). Test-check of
1,530 cases (relating to trees of Sheesham, Sagaun, Khair and other species) across seven
divisions in Kotdwar and Ramnagar regions revealed that in 1,411 cases (92 per cent),
logs were made with mid-girth between 40 cms to 78 cms. No logs were made with
mid-girth in the range between 30 cms to 40 cms. This indicates that logs which could
have a mid-girth between 30 cms and 40 cms were not accounted for resulting in
potential timber being converted into firewood with resultant loss of revenue.
The Management stated (July 2016) that details were not being filled in by the respective
divisions as the existing orders were to work out the volume of the timber on the basis of
mid-girth only and it might also be possible that the lots test-checked by the audit did not
have logs of mid girth less than 40 cms. The reply is not tenable given the fact that logs
between 30 cms to 40 cms mid-girth were not accounted for in 92 per cent of the
17 Round timber comprises of timber with diameter more than 30 cm exception being sagaun having
diameter of 21cms and more. 18 Pauri, Karnprayag, Central & West Haldwani, Kaladhungi East & West and Ramnagar East divisions. 19 78.6 per cent of the allotted quantity. 20 Worked out at the average selling price of ` 14,474 per cum during 2012-13 to 2015-16.

Chapter-III: Social and Economic Sectors (PSUs)
131
test-checked cases and no revised orders for filling up of the proforma Report had been
issued by the Management.
(b) Short production of Fire wood
As per the norms, the production of firewood21 from the lots of Eucalyptus22 in forest
area was fixed at 10-15 per cent of the allotted lots. Test-check of records of seven
divisions23 disclosed that the production of firewood during the period 2012-13 to
2014-15 was less (41.11 per cent) than the minimum norm fixed by the Corporation by
2,198.5775 cum worth ` 0.13 crore.
Management justified (July 2016) the short production of firewood on the plea that
production of round timber was more than the normal production during the same period.
It added that the timber of diameter less than 15 cms was generally left for the use of
villagers.
The reply was not tenable as no records were available to indicate that the volume of
timber of girth less than 15 cms was left in the forest for the use of villagers by the
Corporation. Further, if production of round timber was more than normal, production of
firewood should also be correspondingly more. This fact was reinforced in case of
Haridwar division where production of round timber was more than normal production
by 102 to 321 per cent and correspondingly production of firewood was also above the
norms by 33 to 248 per cent.
3.3.3 Mining activities related to collection of river bed material
3.3.3.1 Penalty for mining beyond permissible area
Government of India (GoI) had granted permission to the Corporation for collection of
River Bed Material (RBM) in Uttarakhand rivers subject to the fulfillment of the
specified conditions regarding permissible area and depth of mining.
Scrutiny of records of the Gola River for the year 2013-14 revealed that the Corporation
had extracted the RBM beyond the permissible area 1,497 hectares of river bed as well as
below the prescribed depth of three metres at the centre of the river gradually reducing
till it reaches boundary which was in violation of the permission granted by the GoI.
Consequently, the Forest Department imposed (July 2014) a penalty of ` 2.28 crore24 on
21 Firewood comprises timber with diameter less than 15 cm and small branches which are invariably
produced along with round timber. 22 Eucalyptus is a diverse genus/ species of trees. 23 Tanakpur, Kashipur, Ramnagar (East), Haldwani (East), (Central) and (West) and Kaladhungi (West)
divisions. 24 Penalty of ` 1.14 crore- (@ ` 90/- per cubic metre) and an additional amount of ` 1.14 crore towards
compensatory afforestation.

Audit Report (Social, General, Revenue and Economic Sectors) for the year ended 31 March 2016
132
the Corporation for mining outside of the permissible area from Sheesh Mahal to Gora
Parav in the Haldwani Division and also for mining more than the permissible depth of
three meters at the centre of River in Haldwani and Lalkuan Divisions.
Similarly, in respect of Dabka River, the Forest Department imposed (March 2014) a
penalty of ` 0.58 crore25 on the Corporation for mining of 32,355 cubic metres outside
the permissible area during 2013-14.
The Management stated in July 2016 that there was some mismatch between the data of
the joint inspection report and the penalty imposed by the Forest Department. The
demand had been contested by the Corporation. In respect of Gola River, the
Management added that the penalty demanded was not being included by the Forest
Department in the list of dues recoverable by them from the Corporation. The reply is
not tenable as the imposed penalty has not been waived off by the Forest Department.
3.3.4 Avoidable payment of Interest on composition money
Audit scrutiny of records of Ramnagar region of the Corporation revealed that the
Corporation deposited composition money in lieu of VAT for the period of November
2013 to May 2014 at the pre-revised rates of November 2012 instead of revised rates of
August 2013. This resulted in short deposit of composition money by ` 2.35 crore26
which was deposited by the Corporation along with an interest of ` 0.21 crore
(September 2014). Had the Corporation deposited the composition money at revised
rates, it would not have to incur avoidable expenditure of ` 0.21 crore.
The Management stated (May 2016) that the Corporation had requested the Assistant
Commissioner (Commercial tax) to furnish a copy of the orders of August 2013.
However, the Commercial Tax Department provided a copy of orders of November 2012.
Hence, composition money was paid at the pre- revised rates. The reply is not tenable as
tax rates declared in August 2013 were known to the Corporation since its Haldwani
Region had deposited the composition money at the revised rates.
Conclusion
Production of timber and fire wood which was the main activity of the Corporation was
below the prescribed norms by 77.30 per cent and 41.11 per cent respectively resulting in
loss of revenue by ` 29.31 crore. The Corporation could not ensure felling of allotted
trees within the prescribed time resulting in non-recovery of royalty amounting to
` 0.48 crore. Further, extraction of river bed material beyond the permissible area by the
25 32,355 cubic metres X (@ 90/- per cubic metre = ` 29,11,950 /-penalty plus an additional amount of
` 29,11,950/- for compensatory afforestation. 26 For the Period November 2013 to March 2014, ` 3.04 crore less ` 1.14 crore = ` 1.90 crore
Add: For the period April 2014 to May 2014, ` 0.72 crore less ` 0.27 crore = ` 0.45 crore.

Chapter-III: Social and Economic Sectors (PSUs)
133
Corporation attracted a penalty of ` 2.85 crore with short deposit of composition money
in lieu of value added tax by the Corporation due to revision of rates resulted in avoidable
payment of interest of ` 0.21 crore.
The audit findings were referred to the Government (August 2016); their reply was
awaited (December 2016).


135
Appendix-1.1.1
(Reference: Paragraph 1.1.9.1; Page 4)
Position regarding receipt of ATNs on the paragraphs included in the ARs
Audit Reports Year Department (s)
ATNs
pending as
of 31st
March 2016
Date of
presentatio
n in the
State
Legislature
Due date
for receipt
of ATNs
Civil/Social, General and Economic Sectors
(Non-PSUs) 2000-01
Medical Health & Family Welfare 01
23.06.2003 22.09.2003 Agriculture 01 Irrigation Department 01 Environment Department 01 Finance Department 01
2002-03 Transport 01
12.01.2005 11.04.2005 Irrigation 01 Financial & Social Welfare 01
2003-04 Irrigation 01
05.10.2005 04.01.2006 Panchayati Raj 01 Transport 02
2004-05 Medical Health & Family Welfare 01
19.04.2006 18.07.2006 Transport 01 P.W.D 01
2005-06
Medical Deptt 01
27.06.2007 26.09.2007 Food & Civil Supplies 01 Sports & Youth Welfare 01 Rural Development 01
2006-07
Pay Jal Deptt 01
07.03.2008 06.06.2008 Transport 01 Information Department 02 Civil Aviation Department 01
2007-08 Urban Development 01
13.07.2009 12.10.2009 Technical Education 01 Information & Public Relations 01
2008-09
Stamps & Registration 01
22.09.2010 21.12.2010
Commercial Tax Department 01 Uttarakhand Pay Jal Nigam 02 Transport Department 01 Revenue Department 01 Rural Engineering Services 01 P.P.P 01 Rural development Department 01
2009-10
Commercial Tax Department 01
29.03.2011 28.06.2011 Tourism 01 Rural Development Department 01 U.K Peyjal Nigam 02
2010-11
P.W.D 03
11.12.2012 10.03.2013 U.K Peyjal Nigam 01 Police Dept. 01 Animal Husbandry 01 AYUSH 01
2011-12
Election Department 01
18.09.2013 17.12.2013
Department Of Labour 01 Women Empowerment & Child Development
01
Social Welfare Department 02 Department of Sports 01 Department Of Higher Education 01

Audit Report (Social, General, Revenue and Economic Sectors) for the year ended 31 March 2016
136
P.W.D 02 Horticulture Department 01 Commercial Tax Department 01 Rural development Department 01
2012-13
Medical Health & Family Welfare Department
02
27.11.2014 26.02.2015
Department Of Irrigation 01 Home Department 01 Medical Education Department 02 Commercial Tax Department 02 P.W.D 01 Technical Education Department 01 Sports & Youth Welfare Department 01 Stamp & Registration Department 01 Rural development Department 02 Peyjal Department 01
2013-14
Drinking Water And Sanitation Department 01
03.11.2015 02.02.2016
Dairy Development Department 01 Forest Department 01 Higher Education Department 01 Medical Education Department 01 Home Department 01 Medical, Health & Family Welfare Department
02
PWD 01 Chief Minister's Office 01 Peyjal Department 01 Sericulture Department 01
Social Welfare And Education Department 01 Urban Development Department 01 Uttarakhand Renewal Energy Development Agency
01
Commercial Tax Department 03 Stamp And Registration Department 01 Transport Department 01
Geology And Mining Department 01 Total 95
State Finances
2000-01 Finance and Misc. Departments All Chapters 23.06.2003 22.09.2003 2001-02 Finance and Misc. Departments All Chapters 19.07.2004 18.10.2004 2002-03 Finance and Misc. Departments All Chapters 12.01.2005 11.04.2005 2003-04 Finance and Misc. Departments All Chapters 05.10.2005 04.01.2006 2004-05 Finance and Misc. Departments All Chapters 19.04.2006 18.07.2006 2005-06 Finance and Misc. Departments All Chapters 27.06.2007 26.09.2007 2006-07 Finance and Misc. Departments All Chapters 07.03.2008 06.06.2008 2007-08 Finance and Misc. Departments All Chapters 13.07.2009 12.10.2009 2008-09 Finance and Misc. Departments All Chapters 22.09.2010 21.12.2010 2009-10 Finance and Misc. Departments All Chapters 29.03.2011 28.06.2011 2010-11 Finance and Misc. Departments All Chapters 11.12.2012 10.03.2013 2011-12 Finance and Misc. Departments All Chapters 18.09.2013 17.12.2013
Nainital District 2011-12 Miscellaneous Departments All Chapters 18.09.2013 17.12.2013 2012-13 Miscellaneous Departments All Chapters 27.11.2014 26.02.2015

Appendices
137
Appendix 3.1.1
(Reference: Paragraph 3.1.9.2; Page 119)
Statement showing investments made by State Government in PSUs
whose accounts are in arrears
(Figures in columns 4 & 6 to 8 are `̀̀̀ in crore)
Sl.
No.
Name of the Public Sector
Undertaking
Year up to
which accounts
finalised
Paid up
capital
Period of
accounts
pending
finalisation
Investment made by State
Government during the year of
which accounts are in arrears
Equity Loans Grants
(1) (2) (3) (4) (5) (6) (7) (8)
A Working Government Companies
Uttarakhand Seed & Tarai Development Corporation Ltd.
2014-15 4.08 2015-16 - - -
Garhwal Anusuchit Janjati Vikas Nigam Limited (Subsidiary of Garhwal Mandal Vikas Nigam Limited)
1993-94 0.50 1994-95 - - -
Kumaon Anusuchit Janjati Vikas Nigam Limited (Subsidiary of Kumaon Mandal Vikas Nigam Limited)
1986-87 0.50 1987-88 - - -
Uttarakhand Bahudeshia Vitta Evam Vikas Nigam Limited
2005-06 8.23 2006-07 0.40 - 4.16
State Industrial Development Corporation of Uttarakhand Limited
2012-13 28.50 2013-14 - 100.00 -
Uttarakhand State Infrastructure Development Corporation Limited
2013-14 4.00 2014-15 - - -
Trans cables Limited (Subsidiary of Kumaon Mandal Vikas Nigam limited)
1999-2000 1.63 2000-01 - - -
Uttar Pradesh Digitals Limited (Subsidiary of Kumaun Mandal Vikas Nigam Limited)
1996-97 0.35 1997-98 - - -
Uttar Pradesh Hill Electronics Corporation Limited
1997-98 8.95 1998-99 - - -
Kichha Sugar Company Limited 2013-14 17.99 2014-15
8.00 -
Doiwala Sugar Company Limited 2014-15 6.00 2015-16 - - -
Uttarakhand Project Development and Construction Corporation Limited
2011-12 0.05 2012-13 - - -
Kumaon Mandal Vikas Nigam Limited 2005-06 13.42 2006-07 - - -
Garhwal Mandal Vikas Nigam Limited 2005-06 5.76 2006-07 - - -
Uttarakhand Purva Sainik Kalyan Udham Limited
2012-13 0.05 2013-14 - - -
Total A (Working Government
Companies) - - - 0.40 108.00 4.16
B Working Statutory corporations
Uttarakhand Pey Jal Sansadhan Vikas Evam Nirman Nigam
2013-14 2,083.7
8 2014-15 - - -
Uttarakhand Parivahan Nigam 2014-15 79.74 2015-16 - 1.00 -
Uttarakhand Forest Development Corporation
2010-11 - 2011-12 - - -
Total B (Working Statutory
Corporations) - - - 0.00 1.00 0.00
Grand Total (A + B) - - - 0.40 109.00 4.16

Audit Report (Social, General, Revenue and Economic Sectors) for the year ended 31 March 2016
138
Appendix 3.1.2
(Reference: Paragraph 3.1.1 & 3.1.12.1; Pages 113 and 120) Summarised financial position and working results of Government companies and Statutory Corporations as per their latest finalised financial statements/accounts
(Figures in columns (5)) to 12 are `̀̀̀ in crore)
Sl. No. Sector / name of the Company Period of
accounts
Year in
which
accounts
finalized
Paid-up
capital
Loans
outstanding
at the end
of year
Accumulated
profit(+)/
loss(-)
Turnover
Net profit
(+)/ loss
(-)
Net
impact of
Audit
comments
Capital
employed
Return on
capital
employed
Percentage of
return on
capital
employed
Manpower
(1) (2) (3) (4) (5) (6) (7) (8) (9) (10) (11) (12) (13) (14)
A. WORKING GOVERNMENT COMPANIES
AGRICULTURE AND ALLIED
1. Uttarakhand Seed & Tarai Development Corporation Ltd. 2014-15 2016-17 4.08 8.42 6.68 103.03 (-) 4.16
Non review
30.97 (-) 1.77 (-) 5.71% 328
Sector Wise Total - - 4.08 8.42 6.68 103.03 (-)4.16 - 30.97 (-) 1.77 (-) 5.71% 328
FINANCE
2. Garhwal Anusuchit Janjati Vikas Nigam Limited (Subsidiary of Garhwal Mandal Vikas Nigam Limited)
1993-94 2012-13 0.50 2.85 (-) 0.63 0.54 0.07 (-)0.39 1.09 0.10 9.17% 01
3. Kumaon Anusuchit Janjati Vikas Nigam Limited (Subsidiary of Kumaon Mandal Vikas Nigam Limited)
1986-87 2002-03 0.50 - (-) 0.04 0.10 (-) 0.02 - 0.46 (-) 0.02 - -
4. Uttarakhand Bahudeshia Vitta Evam Vikas Nigam Limited
2005-06 2015-16 8.23 - (-) 0.11 0.87 0.46 (-)0.04 50.37 0.47 0.93% 73
Sector Wise Total 9.23 2.85 (-) 0.78 1.51 0.51 (-) 0.43 51.92 0.55 1.05 74
INFRASTRUCTURE
5. State Industrial Development Corporation of Uttarakhand Limited 2012-13 2015-16 28.50 100.00 315.29 29.87 50.88 (-)0.02 419.59 51.37 12.24% 20
6. Uttarakhand State Infrastructure Development Corporation Limited
2013-14 2015-16 4.00 5.00 (-) 1.12 27.59 3.00 (-)0.49 7.92 3.01 38% 89
Sector Wise Total 32.50 105.00 314.17 57.46 53.88 (-)0.51 427.51 54.38 12.72% 109
MANUFECTURE
7. Trans cables Limited (Subsidiary of Kumaon Mandal Vikas Nigam limited)
1999-2000 2002-03 1.63 2.75 (-) 5.80 2.80 (-) 0.84 - 2.90 (-) 0.84 - -
8. Uttar Pradesh Digitals Limited (Subsidiary of Kumaun Mandal Vikas Nigam Limited)
1996-97 1997-98 0.35 -
(-) 6.95 0.29 (-) 1.19 - 0.35 (-) 1.19 - -
9. Uttar Pradesh Hill Electronics Corporation Limited
1997-98 2011-12 8.95 - (-) 1.17 1.61 (-) 0.31 - 4.99 (-) 0.31 - 16
10. Doiwala Sugar Company Limited 2014-15 2016-17 6.00 143.18 (-) 249.14 98.54 (-) 49.88 (-)0.75 (-) 69.73 (-) 28.23 - 594 11. Kichha Sugar Company Limited 2013-14 2015-16 17.99 130.42 (-)136.95 90.01 (-)34.95 (-)0.65 (-) 73.11 (-)13.94 - 547
12. Uttarakhand Project Development and Construction Corporation Limited
2011-12 2014-15 0.05 - 0.01 0.07 0.01 - 0.05 0.01 20% -
Sector wise total - - 34.97 276.35 (-)400.02 193.32 (-)87.16 (-)1.40 (-) 134.60 (-)44.50 - 1,157

Appendices
139
Sl. No. Sector / name of the Company Period of
accounts
Year in
which
accounts
finalized
Paid-up
capital
Loans
outstanding
at the end
of year
Accumulated
profit(+)/
loss(-)
Turnover
Net profit
(+)/ loss
(-)
Net impact
of Audit
comments
Capital
employed
Return on
capital
employed
Percentage of
return on
capital
employed
Manpower
(1) (2) (3) (4) (5) (6) (7) (8) (9) (10) (11) (12) (13) (14)
POWER
13. Uttarakhand Power Corporation Limited 2015-16 2016-17 1,086.90 1,022.82 (-) 2,050.72 4,667.68 (-) 95.63 (-)172.89 1,187.32 80.24 6.75% 3,573
14. Uttarakhand Jal Vidhyut Nigam Limited 2015-16 2016-17 1,084.89 1,191.24 441.30 767.65 181.82 (-)33.11 3,110.94 288.07 9.25% 2,571
15. Power Transmission Corporation of Uttarakhand Limited
2015-16 2016-17 421.05 510.88 66.91 309.83 69.34 (-)0.71 1,104.58 120.90 10.94% 799
Sector Wise Total - - 2,592.84 2,724.94 (-) 1,542.51 5,745.16 155.53 (-) 206.71 5,402.84 489.21 9.05% 6,943
SERVICE
16. Kumaon Mandal Vikas Nigam Limited 2005-06 2016-17 13.42 - (-)0.67 100.49 (-)1.51 (-)1.31 14.21 (-)0.37 - 1,004
17. Garhwal Mandal Vikas Nigam Limited 2005-06 2015-16 5.76 19.27 4.97 128.07 (-)1.38 (-)6.12 12.63 0.18 1.42% 1,600
Sector Wise Total - - 19.18 19.27 4.30 228.56 (-)2.89 (-)7.43 26.84 (-)0.19 - 2,604
MISCELLANEOUS
18. Uttarakhand Purva Sainik Kalyan Udham Limited 2012-13 2016-17 0.05 - 3.59 156.92 6.81 (-)0.18 35.95 6.81 18% -
Sector Wise Total - - 0.05 - 3.59 156.92 6.81 (-)0.18 35.95 6.81 18% -
Total A (All sector wise working Government
companies) - - 2,692.85 3,136.83 (-) 1,614.57 6,485.96 122.52 (-)216.66 5,841.43 504.49 8.64% 11,215
B. Statutory corporations
INFRASTRUCTURE
1. Uttarakhand Pey Jal Sansadhan Vikas Evam Nirman Nigam 2013-14 2013-14 2,050.06 77.10 (-) 145.97 67.91 (-) 23.87 (-)36.91 2,132.92 (-)15.31 - 2,728
Sector Wise Total 2,050.06 77.10 (-) 145.97 67.91 (-) 23.87 (-)36.91 2,132.92 (-)15.31 - 2,728
SERVICE
2. Uttarakhand Parivahan Nigam 2014-15 2015-16 79.74 2.67 (-)415.66 309.12 (-)34.94 (-)1.78 357.46 (-)34.34 - 4,104
Sector Wise Total 79.74 2.67 (-)415.66 309.12 (-)34.94 (-)1.78 357.46 (-)34.34 - 4,104
MISCELLANEOUS
3. Uttarakhand Forest Development Corporation 2010-11 2014-15 - - 227.80 310.34 36.86 (-)20.64 227.80 36.86 16% 3,003
Sector Wise Total - - - - 227.80 310.34 36.86 (-)20.64 227.80 36.86 16% 3,003
Total B (All sector wise working statutory
corporations) - - 2,129.80 79.77 (-)333.83 687.37 (-)21.95 (-)59.33 2,718.18 (-)12.79 (-) 0.47% 9,835
Grand Total (A+B) - - 4,822.65 3,216.60 (-)1,948.40 7,173.33 100.57 (-)275.99 8,559.61 491.70 5.74% 21,050

Audit Report (Social, General, Revenue and Economic Sectors) for the year ended 31 March 2016
140
Sl. No. Sector / name of the Company Period of
accounts
Year in
which
accounts
finalised
Paid-up
capital
Loans
outstanding
at the end of
year
Accumulated
profit(+)/
loss(-)
Turnover
Net profit
(+)/ loss
(-)
Net
impact of
Audit
comments
Capital
employed
Return on
capital
employed
Percentage of
return on
capital
employed
Manpower
(1) (2) (3) (4) (5) (6) (7) (8) (9) (10) (11) (12) (13) (14)
C. Non working Government companies
AGRICULTURE & ALLIED
1. UPAI Limited1 - - 0.17 - (-) 0.05 - - - 0.10 (-)0.01 - -
Sector Wise Total - - 0.17 - (-) 0.05 - - - 0.10 (-)0.01 - -
MANUFACTURE
2. Kumtron Limited (Subsidiary of Uttar Pradesh Hill Electronics Corporation Limited)
1989-90 1990-91 0.18 - (-) 0.02 (-) 0.02 0.12 (-)0.02 - -
3. Uttar Pradesh Hill Phones Limited (Subsidiary of Uttar Pradesh Hill Electronics Corporation Limited)
- - - - - - - - - - - -
4. Uttar Pradesh Hill Quartz Limited (Subsidiary of Uttar Pradesh Hill Electronics Corporation limited)
- - - - -- - - - - - - -
Sector Wise Total - - 0.18 - (-) 0.02 - (-) 0.02 - 0.12 (-)0.02 - -
Total C (All sector wise non working
Government companies) - - 0.35 - (-)0.07 (-)0.02 0.22 (-)0.03
Grand Total (A+B+C) - - 4,823.00 3,216.60 (-)1,948.47 7,173.33 100.55 (-)275.99 8,559.83 491.67 5.74% 21,050
@ Capital employed represents Shareholders fund and long term borrowings
1 Company under liquidation since 31.03.1991.