Embed Size (px)
Citation preview

RESEARCH ARTICLE
Social Media Fingerprints of UnemploymentAlejandro Llorente1,2, Manuel Garcia-Herranz3, Manuel Cebrian4,5, Esteban Moro1,2*
1 Instituto de Ingeniería del Conocimiento, Universidad Autónoma de Madrid, Madrid 28049, Spain,2Departamento de Matemáticas & GISC, Universidad Carlos III de Madrid, Leganés 28911, Spain,3UNICEF Innovation Unit, New York, NY 10017, USA, 4 Department of Computer Science and Engineering,University of California at San Diego, La Jolla, CA 92093, USA, 5 National Information and CommunicationsTechnology Australia, Melbourne, Victoria 3003, Australia
AbstractRecent widespread adoption of electronic and pervasive technologies has enabled the
study of human behavior at an unprecedented level, uncovering universal patterns underly-
ing human activity, mobility, and interpersonal communication. In the present work, we in-
vestigate whether deviations from these universal patterns may reveal information about
the socio-economical status of geographical regions. We quantify the extent to which devia-
tions in diurnal rhythm, mobility patterns, and communication styles across regions relate to
their unemployment incidence. For this we examine a country-scale publicly articulated so-
cial media dataset, where we quantify individual behavioral features from over 19 million
geo-located messages distributed among more than 340 different Spanish economic re-
gions, inferred by computing communities of cohesive mobility fluxes. We find that regions
exhibiting more diverse mobility fluxes, earlier diurnal rhythms, and more correct grammati-
cal styles display lower unemployment rates. As a result, we provide a simple model able to
produce accurate, easily interpretable reconstruction of regional unemployment incidence
from their social-media digital fingerprints alone. Our results show that cost-effective eco-
nomical indicators can be built based on publicly-available social media datasets.
IntroductionHuman behavior is closely intertwined with socioeconomical status, as many of our daily rou-tines are driven by activities related to maintain, to improve, or afforded by such status [1–3].From our movements around the city, to our daily schedules, to the communication with oth-ers, humans perform different actions along the day that reflect and impact their economicalsituation. The distribution of different individual behaviors across neighborhoods, municipali-ties, or cities impacts the economical development of those geographical areas, and in turn tothat of the whole country [4–9]. Detecting patterns and quantifying relevant metrics to unveilthe complex relationship between geography and collective behavior is thus of paramount im-portance for understanding the economical heart-beat of cities, and the structure of inter-citynetworks, and thus to economic planning, educational policy, urban planning, transportationdesign, and other large-scale societal problems [10–14].
PLOSONE | DOI:10.1371/journal.pone.0128692 May 28, 2015 1 / 13
a11111
OPEN ACCESS
Citation: Llorente A, Garcia-Herranz M, Cebrian M,Moro E (2015) Social Media Fingerprints ofUnemployment. PLoS ONE 10(5): e0128692.doi:10.1371/journal.pone.0128692
Academic Editor: Yamir Moreno, University ofZaragoza, SPAIN
Received: February 26, 2015
Accepted: April 29, 2015
Published: May 28, 2015
Copyright: © 2015 Llorente et al. This is an openaccess article distributed under the terms of theCreative Commons Attribution License, which permitsunrestricted use, distribution, and reproduction in anymedium, provided the original author and source arecredited.
Data Availability Statement: All relevant data arepublicly available. Documentation on how to querythe Twitter API can be found here: https://dev.twitter.com/overview/documentation. The aggregated datato construct the models is available from http://figshare.com/articles/Socia_fingerprints_of_unemployment/1316641.
Funding: Partial funding came from the SpanishMinistry of Economy and Competitiveness throughgrant FIS2013-47532-C3-3-P, the AustralianGovernment, and the Australian Research Council.The funders had no role in study design, datacollection and analysis, decision to publish, orpreparation of the manuscript.

Much knowledge about how mobility, social communication and education affect the eco-nomical development of cities has been being obtained through complex and costly surveys,with an update rate ranging from fortnights (unemployment) to decades (census) [15–17]. Atthe same time, the recent availability of vast and rich datasets of individual digital fingerprintshas increased the scale and granularity at which we can measure these behavioral features, re-duced the cost and update rate of these measurements, and provided new opportunities tocombine them with more traditional socio-economical surveys [14, 18–22].
In this work we provide a proof of concept for the use of social media individual digital fin-gerprints to infer city-level behavioral measures, and then uncover their relationship with so-cioeconomic output. We present a comprehensive study of the different behavioral traces thatcan be extracted from social media: (i) technology adoption from (social media) user demo-graphics, (ii) mobility patterns from geo-located messages, (iii) communication patterns fromexchanged messages, and (iv) content analysis from the published messages. To this end, weuse a country-scale publicly articulated social media dataset in Spain, where we infer behavioralpatterns from almost 146 million geo-located messages. We match this dataset with the granu-lar unemployment at the level of municipality, measured at the peak of the Spanish financialcrisis (2012–2013). We consider unemployment to be the most important signal for the socio-economic status of a region, since the effects of the crisis have had a very large impact in termsof unemployment in the country (around 9.2% in 2005, more than 26% in 2013).
Our extensive investigation of this large variety of traces in a large social mediadataset allows us not only to build an accurate model of unemployment impact across geo-graphical areas, but also to compare globally previously reported metrics in diverse works anddatasets, as well as asses their relevance and uniqueness to understand economical develop-ment [14, 19–21, 23–28]. As we will show, technology adoption, mobility, diurnal activity, andcommunication style metrics carry a different weight in explaining unemployment in differentgeographical areas. Our goal is not to state causality between unemployment and the extractedmetrics but to uncover the relationship emerging when we observe the economical metrics ofcities and the social behavior at the same time.
Results
Social media dataset and functional partition of citiesTwitter is a microblogging online application where users can express their opinions, sharecontent and receive information from other users in text messages of 140 characters long, com-monly known as tweets. Users can interact with other users by mentioning them or retweeting(share someone’s tweet with your followers) their content. Some of these tweets contain infor-mation about the geographical location where the user was located when the tweet was pub-lished; we refer to them as geo-located tweets.
To perform our analysis, we consider 19.6 million geo-located Twitter messages (tweets),collected through the public API provided by Twitter from continental Spain, ranging from29th November 2012 to 30th June 2013. Tweets were posted by (properly anonymized) 0.57Million unique users and geo-positioned in 7683 different municipalities. We observed a largecorrelation (Pearson’s coefficient ρ = 0.951[0.949, 0.953]) between the number of geoposi-tioned tweets per municipality and the municipality’s population. On average we find around50 tweets per month and per 1000 persons in each municipality.
Despite this high level of social media activity within municipalities, we find their official ad-ministrative areas not suitable to study socio-economical activity: administrative boundariesbetween municipalities reflect political and historical decisions, while economical trade and ac-tivity often happens across those boundaries. The result is that municipalities in Spain are
Social Media Fingerprints of Unemployment
PLOS ONE | DOI:10.1371/journal.pone.0128692 May 28, 2015 2 / 13
Competing Interests: The authors have declaredthat no competing interests exist.

artificially diverse, ranging from a municipality with only 7 inhabitants to other with popula-tion 3.2 million. Although there exists natural aggregations of municipalities in provinces (re-gions) or statistical/metropolitan areas (NUTS areas), we have used our own procedure todetect economical areas. In particular, we have used user daily trips between pairs of munici-palities as a measure of the economic relatedness between said municipalities. We say thatthere is a daily trip between municipality i and j if a user has tweeted in place i and j consecu-tively within the same day. In our dataset we find 1.9 million trips by 0.22 million users. Withthose trips we construct the daily mobility flux network Tij between municipalities as the num-ber of trips between place i and j (see Fig 1B). Remarkably, the statistical properties of trips andof the mobility matrix Tij coincide with those of other mobility datasets (see Section B in S1File): for example, trip distance r and elapsed time δt are power-law distributed with exponentsP(r)* r−1.67 and P(δt)* δt−0.67, very similar to those found in the literature [9, 24]. And themobility fluxes Tij are well described by the Gravity Law (R2 = 0.80) [29]
Tij ’ Tgravij ¼ Pai
i Pajj
dbij
ð1Þ
where Pi and Pj are the populations of municipalities i and j and dij is the distance betweenthem. Similarly, the exponents in Eq (1) are very similar to those reported in other works αi ’αj = 0.48 and β’ 1.05 [24, 30]. These results suggest that detected mobility from geo-locatedtweets is a good proxy of human mobility within and between municipalities [31].
We use the network of daily fluxes between municipalities Tij to detect the geographicalcommunities of economical activity. To this end we employ standard partition techniques ofthe mobility network Tij using graph community finding algorithms. This technique has beenapplied extensively, specially with mobile phone data, to unveil the effective maps of countriesbased on mobility and/or social interactions of people [32–34]. In our case, we have used theInfomap algorithm [35] and found 340 different communities within Spain. For further detailsabout the comparison among different state-of-art community detection algorithms executedon the inter-city graph, see Section C in S1 File. The average number of municipalities per com-munity is 21, and the largest community contains 142 municipalities. The communities de-tected have very interesting features (see Section C in S1 File): (i) they are cohesivegeographically (see Fig 1), (ii) they are statistically robust against randomly removal of trips inour database (Table B in S1 File), and (iii) modularity of the partition is very high (0.76, seeTable C in S1 File). Finally, (iv) the partition found has some overlap (77% of Normalized Mu-tual Information, NMI, see [36]) with coarser administrative boundaries like provinces (re-gions) (see Section C in S1 File for details). But interestingly, it shows a larger overlap (83% ofNMI) with comarcas (counties), areas in Spain that reflect geographical and economical rela-tions between municipalities. This result shows that the mobility detected from geo-locatedtweets and the communities obtained are a good description of economical areas. In the rest ofthe paper, we restrict our analysis to the geographical areas defined by the Infomap detectedcommunities (see Fig 1). For statistical reasons, we discard communities which are not formedby at least 5 municipalities. Despite this sampling, 96% of the total country population is con-sidered in our analysis. Our results in the rest of the paper also hold for municipalities, countiesor provinces (though with lower statistical power) and communities detected by other commu-nity-finding algorithms (see Section I in S1 File).
Social media behavioral fingerprintsThe goal of this work is to quantify how and what behavioral features can be extracted from so-cial media and then related back to the to the economical level of cities. To this end, we define
Social Media Fingerprints of Unemployment
PLOS ONE | DOI:10.1371/journal.pone.0128692 May 28, 2015 3 / 13

Fig 1. A) Map of the mobility fluxes Tij between municipalities based on Twitter inferred trips (white). Infomap communities detected on the network Tij arecolored under the mobility fluxes (blue colors). B) Mobility fluxes Tij between municipalities i and j are constructed by aggregating the number of trips betweenthem. C) Correspondence between the observed fluxes Tij and the fitted gravity model fluxes. Dashed line is the Tij ¼ Tgrav
ij while the (blue) solid line is anconditional average of Tgrav
ij for values of Tij. Maps were created using the maptools and sp packages in the R environment.
doi:10.1371/journal.pone.0128692.g001
Social Media Fingerprints of Unemployment
PLOS ONE | DOI:10.1371/journal.pone.0128692 May 28, 2015 4 / 13

four groups of measures that have been widely explored in other fields like economy or socialsciences. These four types measures rely on the identification of the place where users live. In-stead of using information in the user profile, we analyze the places where the user has tweetedand we set as hometown of the user the municipality where he/she has tweeted with the highestfrequency, a method usually employed in mobile phone and social media [11, 24]. To this endwe select those users with more than 5 geo-located tweets in our period and which have tweetedat least 40% of their tweets in a given municipality, which we will consider their hometown.After this filtering we end up with 0.32 million users and we can then define the twitter popula-tion πi in area i as the number of users with their hometown within area i. We obtain a veryhigh correlation between πi and population of the cities Pi in the national census ρ = 0.977[0.976, 0.978] which provides an indirect validation of our approach with the present data.However not all demographic groups are equally represented in the our twitter database. Asshown in Section D in S1 File, Twitter user demographics in Spain obtained from surveys [37]show that age groups above 44 years old are under-represented. Thus our results would mainlydescribe the socio-economical status of people below 44 years old. Employment analysis isthen performed in different age groups: unemployment for people below 25 years old, between25 and 44 years old and older than 44 years old. Finally, we have chosen the unemployment re-ported officially at the end of our observation time window (June 2013), but our results are notaffected by the month selected, see Section G in S1 File.
For every considered region, we investigate the officially reported unemployment for differ-ent age groups and a number of metrics related to social media activity. Some of those metricsare already reported in the literature, but some others are introduced in this work. Specificallywe consider:
• Social media technology adoption: we can use twitter penetration rate τi = πi/Pi in each area ias a proxy of technology adoption. Recent works have shown that indeed there is a correla-tion between country GDP and twitter penetration: specifically, it was found that a positivecorrelation between τi and GDP at the country level [24]. However, in our data we find theopposite correlation (see Fig 2), namely, that the larger the penetration rate the bigger the un-employment is, which suggest that the impact of technology adoption at country scale is dif-ferent of what happens within an (industrialized) country where technology to access socialmedia is commoditized.
• Social media activity: regions with very different economical situations should exhibit differ-ent patterns of activity during the day. Since working, leisure, family, shopping, etc. activitieshappen at different times of the day, we might observe different daily patterns in regionswith different socio-economical status. For example, we hypothesize that communities withlow levels of unemployment will tend to have higher activity levels at the beginning of a typi-cal weekday. This is indeed what we find: Fig 3A shows the hourly fraction of tweets duringworkdays of two communities with very different rate of unemployment. As we can observe,both profiles are quite different and, in the case of low unemployment, we find a strong peakof activity between 8 and 11am (morning), and lower periods of activity during the after-noons and nights. We encode this finding in νmrng,i, νaftn,i, and νngt,i the total fraction oftweets happening in geographical area i between 8am and 10am, 3pm and 5pm, and 12amand 3am respectively. Fig 2 shows a strong negative correlation between νmrng,i and the un-employment for the communities in our database and positive correlation with νaftn,i, andνngt,i.
• Social media content: some works have observed a correlation between the frequency ofwords related to work conditions [21] or Google searches [22, 23] to unemployment or
Social Media Fingerprints of Unemployment
PLOS ONE | DOI:10.1371/journal.pone.0128692 May 28, 2015 5 / 13

economical situation of countries. In our case we also find that there is a moderate positivecorrelation between the fraction of tweets μimentioning job or unemployment terms and theobserved unemployment, while the correlation is negative for the number mentions to em-ployment or the economy. However, we have tried a different approach by measuring the rela-tion between the way of writing and the educational level [38]. To this end, we build a list of618 misspelled Spanish expressions and extract the tweets of the dataset containing at leastone of these words (see Section F in S1 File for further details about how these expressionswere collected). We only consider tweets in Spanish, detected with a N-grams based algo-rithm. Then, we only consider misspellings that cannot be justified as abbreviations. Finally,
Fig 2. A) Correlation coefficient of all the extracted Twitter metrics grouped by technology adoption (black) geographical diversity (orange), social diversity(light blue), temporal activity (green) and content analysis (dark blue). Error bars correspond to 95% confidence intervals of the correlation coefficient. Grayarea correspond the statistical significance thresholds. Panels B, C, D and E show the values of 4 selected variables in each geographical community againstits percentage of unemployment. Size of the points is proportional to the population in each geographical community. Solid lines correspond to linear fits tothe data.
doi:10.1371/journal.pone.0128692.g002
Social Media Fingerprints of Unemployment
PLOS ONE | DOI:10.1371/journal.pone.0128692 May 28, 2015 6 / 13
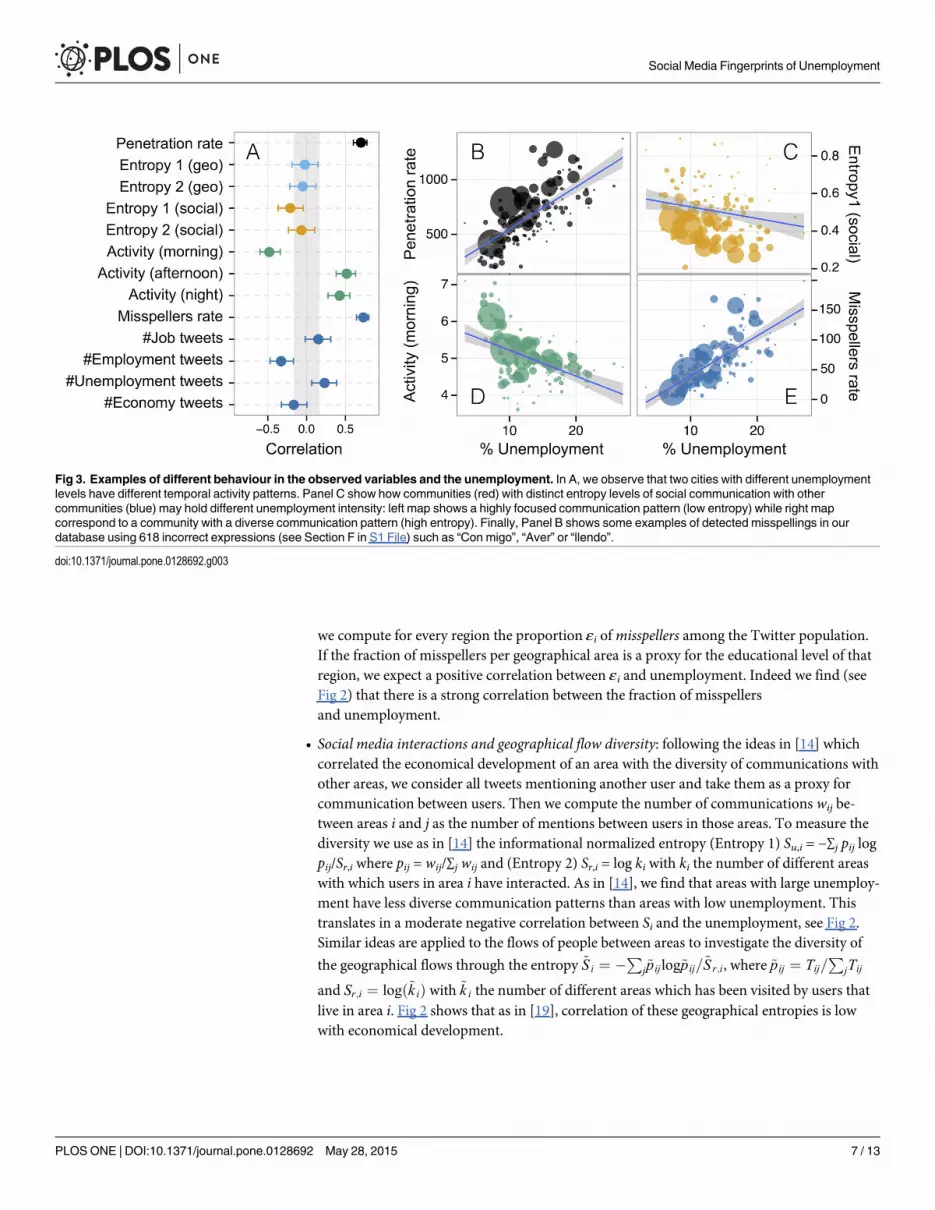
we compute for every region the proportion εi ofmisspellers among the Twitter population.If the fraction of misspellers per geographical area is a proxy for the educational level of thatregion, we expect a positive correlation between εi and unemployment. Indeed we find (seeFig 2) that there is a strong correlation between the fraction of misspellersand unemployment.
• Social media interactions and geographical flow diversity: following the ideas in [14] whichcorrelated the economical development of an area with the diversity of communications withother areas, we consider all tweets mentioning another user and take them as a proxy forcommunication between users. Then we compute the number of communications wij be-tween areas i and j as the number of mentions between users in those areas. To measure thediversity we use as in [14] the informational normalized entropy (Entropy 1) Su,i = −∑j pij logpij/Sr,i where pij = wij/∑j wij and (Entropy 2) Sr,i = log ki with ki the number of different areaswith which users in area i have interacted. As in [14], we find that areas with large unemploy-ment have less diverse communication patterns than areas with low unemployment. Thistranslates in a moderate negative correlation between Si and the unemployment, see Fig 2.Similar ideas are applied to the flows of people between areas to investigate the diversity of
the geographical flows through the entropy ~Si ¼ �Pj~pijlog~pij=~Sr;i, where ~pij ¼ Tij=
PjTij
and Sr;i ¼ logð~k iÞ with ~k i the number of different areas which has been visited by users thatlive in area i. Fig 2 shows that as in [19], correlation of these geographical entropies is lowwith economical development.
Fig 3. Examples of different behaviour in the observed variables and the unemployment. In A, we observe that two cities with different unemploymentlevels have different temporal activity patterns. Panel C show how communities (red) with distinct entropy levels of social communication with othercommunities (blue) may hold different unemployment intensity: left map shows a highly focused communication pattern (low entropy) while right mapcorrespond to a community with a diverse communication pattern (high entropy). Finally, Panel B shows some examples of detected misspellings in ourdatabase using 618 incorrect expressions (see Section F in S1 File) such as “Con migo”, “Aver” or “llendo”.
doi:10.1371/journal.pone.0128692.g003
Social Media Fingerprints of Unemployment
PLOS ONE | DOI:10.1371/journal.pone.0128692 May 28, 2015 7 / 13
Normalization of variables is discussed in Section E in S1 File. We have also studied the corre-lation between the variables considered. As expected, variables in each group show moderatecorrelations between them. However the inspection of the correlation matrix and a PrincipalComponent Analysis of the variables considered, show that there is information (as percentageof variance in the data) in each of the groups of variables, see Section E in S1 File. Because ofthese two facts we restrict our analysis to the variables within each group with the highest cor-relation with the unemployment, namely the penetration rate τi, the social and mobility diver-
sity variables Su,i and ~Su;i, the morning activity νmrng,i, the fraction of misspellers εi and fraction
of employment-related tweets μemp,i.
Explanatory power of social media in unemploymentThe four previous groups of variables are fingerprints of human behavior reflected on the Twit-ter usage habits. As we observed in Fig 2, all of them exhibit statistically strong correlationswith unemployment. The question we address in this section is whether those variables sufficeto explain the observed unemployment (their explanatory power) and also determine the mostimportant ones among themselves (which give more explanatory power than others). Notethat we are not stating a causality arrow between the measures built in the previous section andthe unemployment rate but only exploring whether they can be used as alternative indicatorswith a real translation in the economy.
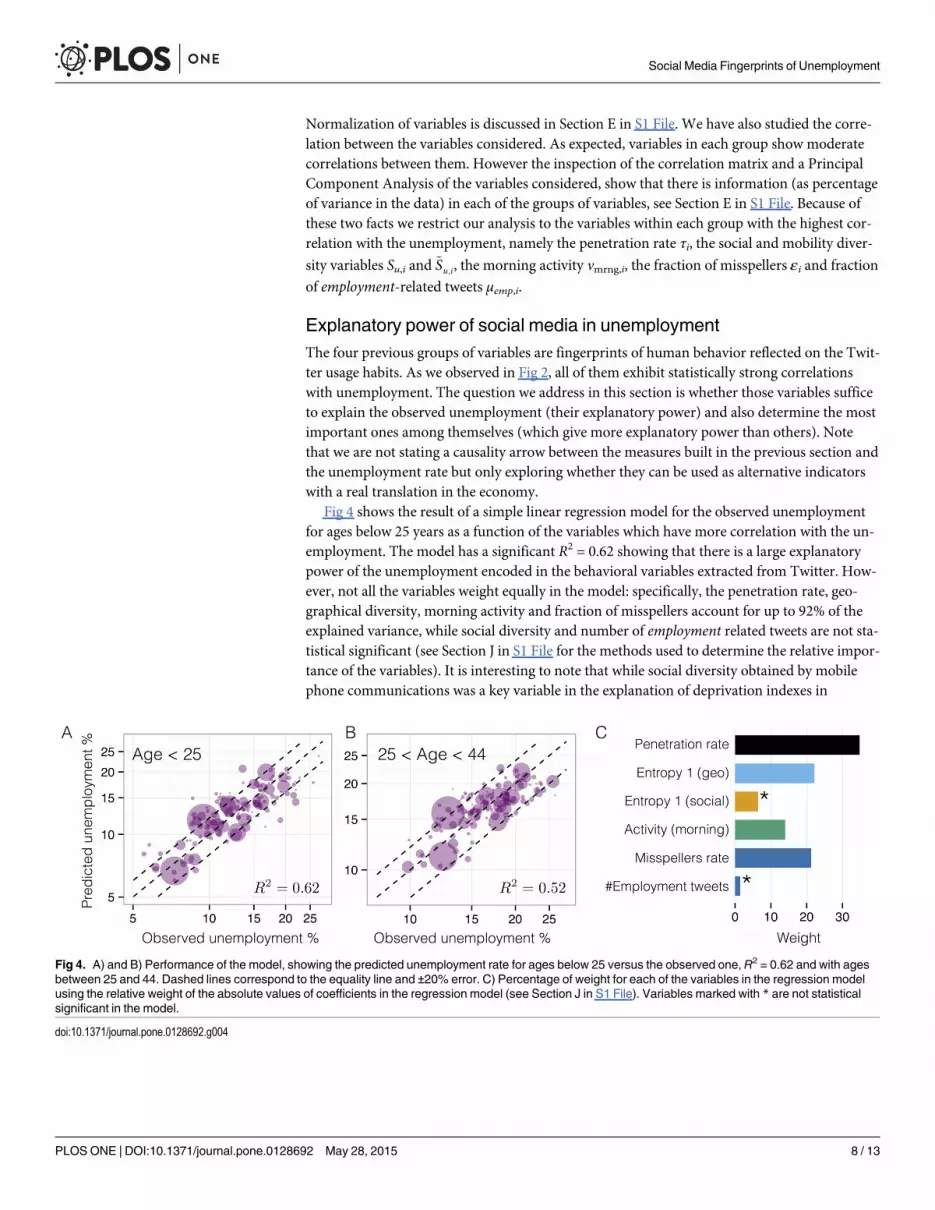
Fig 4 shows the result of a simple linear regression model for the observed unemploymentfor ages below 25 years as a function of the variables which have more correlation with the un-employment. The model has a significant R2 = 0.62 showing that there is a large explanatorypower of the unemployment encoded in the behavioral variables extracted from Twitter. How-ever, not all the variables weight equally in the model: specifically, the penetration rate, geo-graphical diversity, morning activity and fraction of misspellers account for up to 92% of theexplained variance, while social diversity and number of employment related tweets are not sta-tistical significant (see Section J in S1 File for the methods used to determine the relative impor-tance of the variables). It is interesting to note that while social diversity obtained by mobilephone communications was a key variable in the explanation of deprivation indexes in
Fig 4. A) and B) Performance of the model, showing the predicted unemployment rate for ages below 25 versus the observed one, R2 = 0.62 and with agesbetween 25 and 44. Dashed lines correspond to the equality line and ±20% error. C) Percentage of weight for each of the variables in the regression modelusing the relative weight of the absolute values of coefficients in the regression model (see Section J in S1 File). Variables marked with * are not statisticalsignificant in the model.
doi:10.1371/journal.pone.0128692.g004
Social Media Fingerprints of Unemployment
PLOS ONE | DOI:10.1371/journal.pone.0128692 May 28, 2015 8 / 13

[14, 19], the communication diversity of twitter users seem to have a minor role in the explana-tion of heterogeneity of unemployment in Spain.
Similar explanatory power is found for other age groups: R2 = 0.44 for all ages and R2 = 0.52for ages between 25 and 44 years. However, the model degrades for ages above 44 years (R2 =0.26) proving that our variables mainly described the behavior of the most represented agegroups in Twitter, namely those below 44 years old. On the other hand, since our Twitter vari-ables seem to describe better behavior of young people, we have investigated whether Twitterconstructed variables have similar explanatory value (in terms of R2) than simple census demo-graphic variables for young people. As we can see in Section H in S1 File if we include theyoung population rate in our model we get a minor improvement R2 = 0.65; on the other handa model based only on young population rate gives R2 = 0.24. This semi-partial analysis showsthat Twitter variables do indeed posses a genuine explanatory power away from their simpledemographic representation. Finally, our model have the largest explanatory power for de-tected communities, but large R2 are also found for other detected communities (R2 = 0.61)and other geographical areas like counties (R2 = 0.54) and provinces (R2 = 0.65), see Section Iin S1 File.
DiscussionThis work serves as a proof of concept for how a wide range of behavioral features linked to so-cioeconomic behavior can be inferred from the digital traces that are left by publicly-availablesocial media. In particular, we demonstrate that behavioral features related to unemploymentcan be recovered from the digital exhaust left by the microblogging network Twitter. First ofall, Twitter geolocalized traces, together with off-the-shelve community detection algorithms,render an optimal partition of a country for economical activity, showing the remarkablepower of social media to understand and unveil economical behavior at a country-scale. Thisinsight is likely to apply to other administrative definitions in other countries, specially whenconsidering large cities with an inherent dynamical nature and evolution of mobility fluxes,and cities composed of small satellite cities with arbitrary agglomerations or division amongthem (e.g. London, NYC, Singapore). This result is unsurprising: it should be natural to recom-pute city clusters/communities of activity based on their real time mobility, which may varyconsiderably faster than the update rates of mobility and travel surveys [32–34].
Our main result demonstrates that several key indicators, different penetration rates amongregions, fingerprints of the temporal patterns of activity, content lexical correctness and geo-social connectivities among regions, can be extracted from social media, and then used to inferunemployment levels. These findings shed light in two directions: first, on how individuals’ ex-tensive use of their social channels allow us to characterize cities based on their activity in ameaningful fashion and, secondly, on how this information can be used to build economic in-dicators that are directly related to the economy. Regarding the latter, our work is importantfor understanding how country-scale analysis of Social Media should consider the demograph-ic but also the economical difference between users. As we have shown, users in areas withlarge unemployment have different mobility, different social interactions, and different dailyactivity than those in low unemployment areas. This intertwined relationship between user be-havior and employment should be considered not only in economical analysis derived from so-cial media, but also in other applications like marketing, communication, socialmobilization, etc.
It is particularly remarkable that Twitter data can provide these accurate results. Twitter is,among the many currently popular social networking platforms, perhaps the noisiest, sparsest,more ‘sabotaged’medium: very few users send out messages at a regular rate, most of the users
Social Media Fingerprints of Unemployment
PLOS ONE | DOI:10.1371/journal.pone.0128692 May 28, 2015 9 / 13

do not have geolocated information, the social relationships (followers/followers) contains a lotof unused/unimportant links, it is plagued by spam-bots, and last but not least, we have no wayto identify the motive/goal/functionality of mobility fluxes we are able to extract. These limita-tions are not particular to our sample, but general to the sample Twitter data being employedin the computational social science community. Despite all these caveats, we are able to showthat even some simple filtering techniques together with basic statistical regressions yields pre-dictive power about a variable as important as unemployment. Other social media platformssuch as Facebook, Google+, Sina Weibo, Instagram, Orkut, or Flicker with more granular andconsistent individual data are likely to provide similar or better results by themselves, or incombination. Further improvements can be obtained by the use of more sophisticated statisti-cal machine learning techniques, some of them even tailored to the peculiarities of social mediadata. Our work serves to illustrate the tremendous potential of these new digital datasets to im-prove the understanding of society’s functioning at the finer scales of granularity.
The usefulness of our approach must be considered against the cost and update rate of per-forming detailed surveys of mobility, social structure, and economic performance. Our data-base is publicly articulated, which means that our analysis could be replicated easily in othercountries, other time periods and with different scopes. Naturally, survey results provide moreaccurate results, but they also consume considerably higher financial and human resources,employing hundreds of people and taking months, even years to complete and be released—they are so costly that countries going through economic recession have considered discontinu-ing them, or altering their update rate in recent times. A particularly problematic aspect ofthese surveys is that they are “out-of-sync” i.e. census may be up to date, whereas those sameindividuals’ travel surveys may not be, and therefore drawing inferences between both may beparticularly difficult. This is a particularly challenging problem that the immediateness of socialmedia can help ameliorate.
A few questions remain open for further investigation. How can traditional surveys and so-cial media digital traces be best combined to maximize their predictive ability? Can socialmedia provide a reliable leading indicator to unemployment, and in general, economic surveys?How much reliable lead is it possible, if at all? As we have found, Twitter penetration and edu-cational levels are found to be correlated with unemployment, but this levels are unlikely tochange rapidly to describe or anticipate changes in the economy or unemployment. However,other indicators like daily activity, social interactions and geographical mobility are more con-nected with our daily activity and perhaps they have more predicting power to show and/or an-ticipate sudden changes in employment. The relationship between unemployment andindividual and group behavior may help contextualize the multiple factors affecting the socio-economic well-being of a region: while penetration, content, daily activity and mobility diversi-ty seem to be highly correlated to unemployment in Spain, different weights for each group oftraces might be expected in other countries [14]. Finally, digital traces could serve as an alterna-tive (some times the only one available) to the lack of surveys in poor or remote areas [20, 28].Another interesting avenue of research involves the use of social media to detect mismatchesbetween the real (hidden, underground) economy and the officially reported [39].
Most importantly, the immediacy of social media may also allow governments to bettermeasure and understand the effect of policies, social changes, natural or man-made disasters inthe economical status of cities in almost real-time [18, 40]. Our results can also be framed with-in the emerging phenomenon of the shift of the digital divide [41], which shows that the cur-rent gap in online presence in developed countries is not due to digital access, but to thesocio-economical situation of individuals. These new avenues for research provide great
Social Media Fingerprints of Unemployment
PLOS ONE | DOI:10.1371/journal.pone.0128692 May 28, 2015 10 / 13
opportunities at the intersection of the economic, social, and computational sciences that origi-nate from these new widespread inexpensive datasets.
Supporting InformationS1 File. This file contains Figures A-I, Tables A-F and Sections A-I.(PDF)
AcknowledgmentsWe would like to thank Kristina Lerman, Lada Adamic, James Fowler, Daniel Villatoro, and Ri-cardo Herranz for stimulating discussions, and Yuri Kryvasheyeu and Thomas Bochynek fortheir critical reading of the manuscript. This work was partially supported by Spanish Ministryof Economy and Competitiveness Grant FIS2013-47532-C3-3-P (to A. L., M. G. H. and E. M.).Manuel Cebrian is funded by the Australian Government as represented by the Department ofBroadband, Communications and Digital Economy and the Australian Research Councilthrough the ICT Centre of Excellence program.
Author ContributionsConceived and designed the experiments: AL MGHMC EM. Performed the experiments: ALMGHMC EM. Analyzed the data: AL MGHMC EM. Contributed reagents/materials/analysistools: AL MGHMC EM. Wrote the paper: AL MGHMC EM.
References1. Becker GS. The economic approach to human behavior. University of Chicago Press; 1976.
2. Granovetter M. (1985) Economic action and social structure: the problem of embeddedness. Americanjournal of sociology 91: 481–510. doi: 10.1086/228311
3. Camerer CF, Loewenstein G, Rabin M. Advances in behavioral economics. Princeton UniversityPress; 2011.
4. Glaeser EL, Kallal HD, Scheinkman JA, Shleifer A. (1991) Growth in cities, (National Bureau of Eco-nomic Research), Technical report.
5. Bettencourt LM, Lobo J, Helbing D, Kühnert C, West GB. (2007) Growth, innovation, scaling, and thepace of life in cities. Proc. Natl. Acad. Sci. 104: 7301–7306. doi: 10.1073/pnas.0610172104 PMID:17438298
6. Batty M. (2008) The size, scale, and shape of cities. Science 319: 769–771. doi: 10.1126/science.1151419 PMID: 18258906
7. Milgram S. The experience of living in cities. Science 167: 1461–1468. doi: 10.1126/science.167.3924.1461 PMID: 5415278
8. PanW, Ghoshal G, Krumme C, Cebrian M, Pentland A. (2013) Urban characteristics attributable todensity-driven tie formation. Nat. Commun. 4: 1961. doi: 10.1038/ncomms2961 PMID: 23736887
9. Gonzalez MC, Hidalgo CA, Barabasi AL. (2008) Understanding individual humanmobility patterns. Na-ture 453: 779–782. doi: 10.1038/nature06958 PMID: 18528393
10. Calabrese F, Diao M, Lorenzo GD, Ferreira J, Ratti C. (2013) Understanding individual mobility patternsfrom urban sensing data: A mobile phone trace example. Transport. Res. C-Emer. 26: 301–313. doi:10.1016/j.trc.2012.09.009
11. Cheng Z, Caverlee J, Lee K, Sui DZ. (2011) Exploring Millions of Footprints in Location Sharing Ser-vices. In ICWSM 2011 Cholera, pp. 81–88.
12. Cho E, Myers SA, Leskovec J. (2011) Friendship and mobility: user movement in location-based socialnetworks. In Proceedings of the 17th ACM SIGKDD international conference on Knowledge discoveryand data mining, ACM, pp. 1082–1090
Social Media Fingerprints of Unemployment
PLOS ONE | DOI:10.1371/journal.pone.0128692 May 28, 2015 11 / 13

13. Sun L, Jin JG, Axhausen KW, Lee DH, Cebrian M. (2014) Quantifying long-term evolution of intra-urban spatial interactions. Preprint. Available: arXiv:1407.0145. Accessed 1 Nov 2014.
14. Eagle N, Macy M, Claxton R. (2010) Network diversity and economic development. Science 328:1029–1031. doi: 10.1126/science.1186605 PMID: 20489022
15. Henrich J, Boyd R, Bowles S, Camerer C, Fehr E, Gintis H, et al. (2001) In search of homo economicus:behavioral experiments in 15 small-scale societies. Am. Econ. Rev. 91: 73–78. doi: 10.1257/aer.91.2.73
16. Krieger N, Williams DR, Moss NE. (1997) Measuring social class in us public health research: con-cepts, methodologies, and guidelines. Annu. Rev. Publ. Health 18: 341–378. pmid: 9143723 doi: 10.1146/annurev.publhealth.18.1.341
17. Groves R. M., Fowler F. J. Jr, Couper M. P., Lepkowski J. M., Singer E., & Tourangeau R. (2011) Sur-vey methodology. ( Vol. 561). JohnWiley & Sons.
18. Lazer D, Pentland A, Adamic L, Aral S, Barabasi AL, Brewer D, et al. (2009) Life in the network: thecoming age of computational social science. Science 323: 721–723. doi: 10.1126/science.1167742PMID: 19197046
19. Smith C, Quercia D, Capra L. (2013) Finger on the pulse: identifying deprivation using transit flow analy-sis. In Proceedings of the 2013 conference on Computer supported cooperative work, ACM, pp. 683–692.
20. Soto V, Frias-Martinez V, Virseda J, Frias-Martinez E. (2011) Prediction of socioeconomic levels usingcell phone records In User Modeling, Adaption and Personalization, Springer Berlin Heidelberg, pp.377–388. (Springer Berlin Heidelberg)
21. Antenucci D, Cafarella, M Levenstein, MC, Ré C, Shapiro MD. (2014) Using social media to measurelabor market flows. Working paper. Available at http://www.nber.org/papers/w20010. Accessed 1 Nov2014
22. Preis T, Moat HS, Stanley HE, Bishop SR. (2012) Quantifying the advantage of looking forward. Sci.Rep. 2: 350. doi: 10.1038/srep00350 PMID: 22482034
23. Baker S, & Fradkin A (2013) The Impact of Unemployment Insurance on Job Search: Evidence fromGoogle Search Data. Preprint. Available at SSRN 2251548. Accessed 1 Nov 2014.
24. Hawelka B, Sitko I, Beinat E, Sobolevsky S, Kazakopoulos P, Ratti C. (2013) Geo-located twitter as theproxy for global mobility patterns. Preprint. Available at arXiv:1311.0680. Accessed 1 Nov 2014.
25. Lathia N, Quercia D, Crowcroft J. (2012) The hidden image of the city: sensing community well-beingfrom urban mobility. In Pervasive computing, Springer, pp. 91–98.
26. Frias-Martinez V, Virseda J, Frias-Martinez E. (2010) Socio-economic levels and humanmobility. inQual Meets Quant Workshop-QMQ.
27. Gutierrez T, Krings G, Blondel VD. (2013) Evaluating socio-economic state of a country analyzing air-time credit and mobile phone datasets. Preprint. Available at arXiv:1309.4496. Accessed 1 Nov 2014.
28. Smith, C, Mashhadi, A, Capra, L. (2013) Ubiquitous sensing for mapping poverty in developing coun-tries. Paper submitted to the Orange D4D Challenge.
29. Erlander S Stewart NF. (1990) The gravity model in transportation analysis: theory and extensions.Vsp. Vol. 3.
30. Simini F, González MC, Maritan A, Barabási AL. (2012) A universal model for mobility and migrationpatterns. Nature 484: 96–100. doi: 10.1038/nature10856 PMID: 22367540
31. Lenormand M, Picornell M, Cantú-Ros OG, Tugores A, Louail T, Herranz R, et al. (2014) Cross-check-ing different sources of mobility information. Preprint. Available at arXiv:1404.0333. Accessed 1 Nov2014.
32. Barthélemy M. (2011) Spatial networks. Phys. Rep. 499: 1–101. doi: 10.1016/j.physrep.2010.11.002
33. Expert P, Evans TS, Blondel VD, & Lambiotte R. (2011) Uncovering space-independent communitiesin spatial networks. Proc. Natl. Acad. Sci. 108: 7663–7668. doi: 10.1073/pnas.1018962108 PMID:21518910
34. Sobolevsky S, Szell M, Campari R, Couronné T, Smoreda Z, & Ratti C (2013) Delineating geographicalregions with networks of human interactions in an extensive set of countries. PloS One 8: e81707. doi:10.1371/journal.pone.0081707 PMID: 24367490
35. Rosvall M & Bergstrom CT. (2008) Maps of random walks on complex networks reveal communitystructure. Proc. Natl. Acad. Sci. 105: 1118–1123. doi: 10.1073/pnas.0706851105 PMID: 18216267
36. Danon L, Diaz-Guilera A, Duch J, & Arenas A. (2005) Comparing community structure identification. J.Stat. Mech. Theor. Exp. P09008.
37. ADigital. (2013) Uso de twitter en España 2012. Online. Available at: http://www.slideshare.net/adigitalorg/adigital-estudiousotwitterenespaa2012def. Accessed 1 Nov 2014.
Social Media Fingerprints of Unemployment
PLOS ONE | DOI:10.1371/journal.pone.0128692 May 28, 2015 12 / 13

38. Davenport JR & DeLine R. (2014) The readability of tweets and their geographic correlation with educa-tion. Preprint. Available at arXiv:1401.6058. Accessed 1 Nov 2014
39. Schneider F, Buehn A, & Montenegro CE. (2011) Shadow economies all over the world: New estimatesfor 162 countries from 1999 to 2007. In Scheider F, editor. Handbook on the shadow economy. pp. 9–77.
40. Rutherford A, Cebrian M, Dsouza S, Moro E, Pentland A, & Rahwan I (2013) Limits of social mobiliza-tion. Proc. Natl. Acad. Sci. 110: 6281–6286. doi: 10.1073/pnas.1216338110 PMID: 23576719
41. van Deursen AJ, & Van Dijk JA (2014) The digital divide shifts to differences in usage. NewMedia andSociety 16.3: 507–526. doi: 10.1177/1461444813487959
Social Media Fingerprints of Unemployment
PLOS ONE | DOI:10.1371/journal.pone.0128692 May 28, 2015 13 / 13


